Greers Ferry, AR Map & Demographics
Greers Ferry Map
Greers Ferry Overview
$31,687
PER CAPITA INCOME
$57,417
AVG FAMILY INCOME
$54,315
AVG HOUSEHOLD INCOME
28.5%
WAGE / INCOME GAP [ % ]
71.5¢/ $1
WAGE / INCOME GAP [ $ ]
0.48
INEQUALITY / GINI INDEX
905
TOTAL POPULATION
428
MALE POPULATION
477
FEMALE POPULATION
89.73
MALES / 100 FEMALES
111.45
FEMALES / 100 MALES
54.5
MEDIAN AGE
2.6
AVG FAMILY SIZE
2.2
AVG HOUSEHOLD SIZE
359
LABOR FORCE [ PEOPLE ]
48.4%
PERCENT IN LABOR FORCE
2.2%
UNEMPLOYMENT RATE
Greers Ferry Area Codes
Income in Greers Ferry
Income Overview in Greers Ferry
Per Capita Income in Greers Ferry is $31,687, while median incomes of families and households are $57,417 and $54,315 respectively.
| Characteristic | Number | Measure |
| Per Capita Income | 905 | $31,687 |
| Median Family Income | 293 | $57,417 |
| Mean Family Income | 293 | $85,625 |
| Median Household Income | 411 | $54,315 |
| Mean Household Income | 411 | $69,802 |
| Income Deficit | 293 | $0 |
| Wage / Income Gap (%) | 905 | 28.53% |
| Wage / Income Gap ($) | 905 | 71.47¢ per $1 |
| Gini / Inequality Index | 905 | 0.48 |
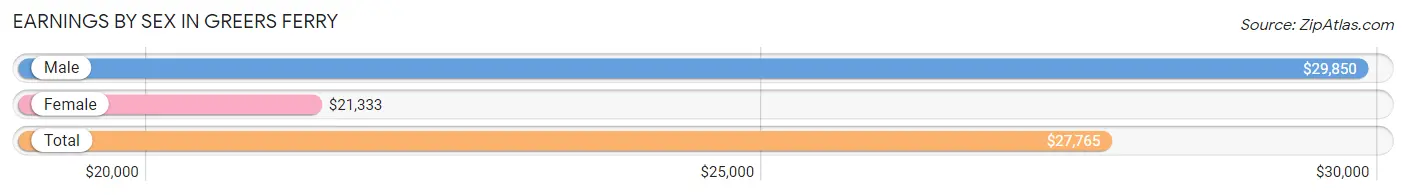
Earnings by Sex in Greers Ferry
Average Earnings in Greers Ferry are $27,765, $29,850 for men and $21,333 for women, a difference of 28.5%.
| Sex | Number | Average Earnings |
| Male | 197 (49.9%) | $29,850 |
| Female | 198 (50.1%) | $21,333 |
| Total | 395 (100.0%) | $27,765 |
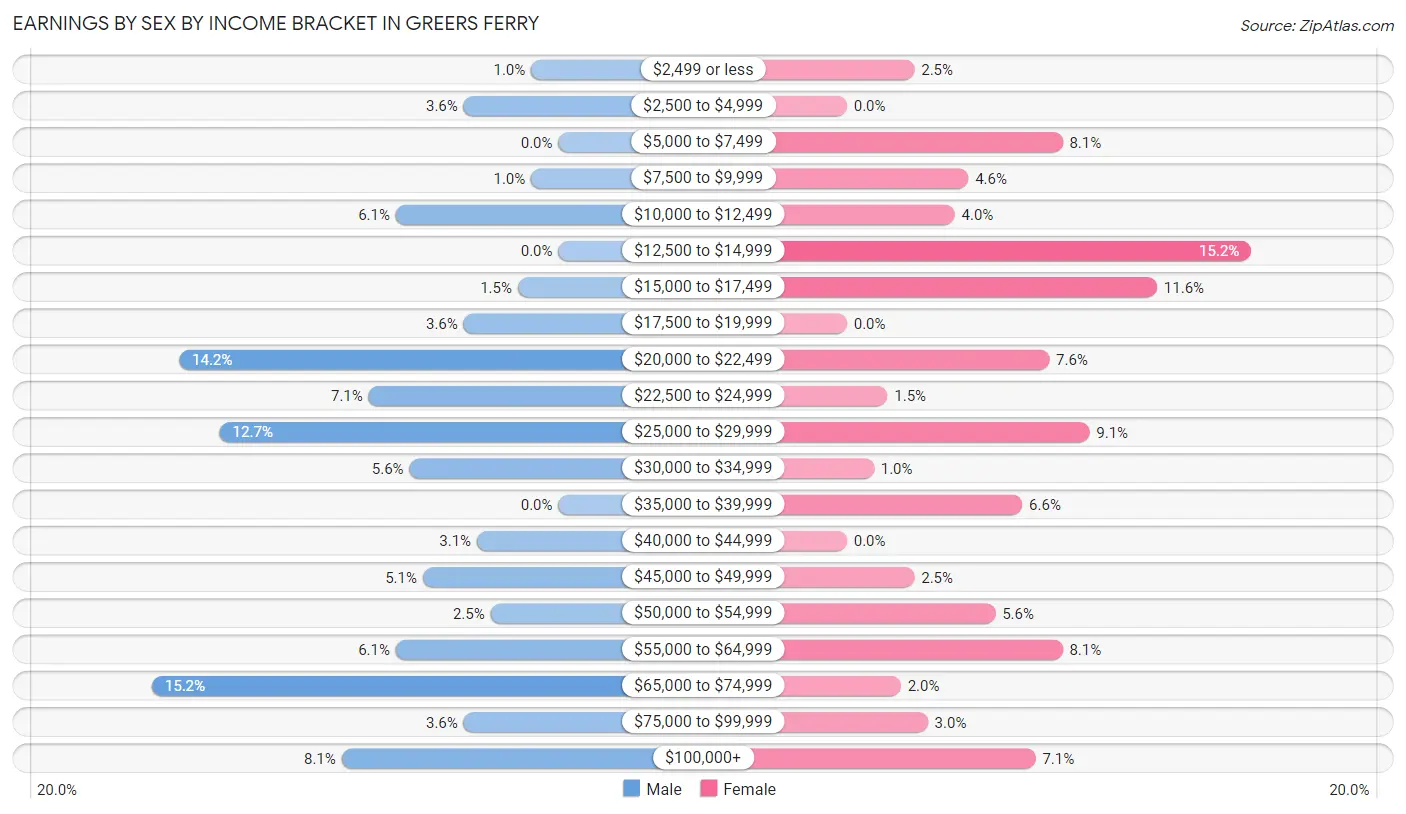
Earnings by Sex by Income Bracket in Greers Ferry
The most common earnings brackets in Greers Ferry are $65,000 to $74,999 for men (30 | 15.2%) and $12,500 to $14,999 for women (30 | 15.1%).
| Income | Male | Female |
| $2,499 or less | 2 (1.0%) | 5 (2.5%) |
| $2,500 to $4,999 | 7 (3.5%) | 0 (0.0%) |
| $5,000 to $7,499 | 0 (0.0%) | 16 (8.1%) |
| $7,500 to $9,999 | 2 (1.0%) | 9 (4.5%) |
| $10,000 to $12,499 | 12 (6.1%) | 8 (4.0%) |
| $12,500 to $14,999 | 0 (0.0%) | 30 (15.1%) |
| $15,000 to $17,499 | 3 (1.5%) | 23 (11.6%) |
| $17,500 to $19,999 | 7 (3.5%) | 0 (0.0%) |
| $20,000 to $22,499 | 28 (14.2%) | 15 (7.6%) |
| $22,500 to $24,999 | 14 (7.1%) | 3 (1.5%) |
| $25,000 to $29,999 | 25 (12.7%) | 18 (9.1%) |
| $30,000 to $34,999 | 11 (5.6%) | 2 (1.0%) |
| $35,000 to $39,999 | 0 (0.0%) | 13 (6.6%) |
| $40,000 to $44,999 | 6 (3.0%) | 0 (0.0%) |
| $45,000 to $49,999 | 10 (5.1%) | 5 (2.5%) |
| $50,000 to $54,999 | 5 (2.5%) | 11 (5.6%) |
| $55,000 to $64,999 | 12 (6.1%) | 16 (8.1%) |
| $65,000 to $74,999 | 30 (15.2%) | 4 (2.0%) |
| $75,000 to $99,999 | 7 (3.5%) | 6 (3.0%) |
| $100,000+ | 16 (8.1%) | 14 (7.1%) |
| Total | 197 (100.0%) | 198 (100.0%) |
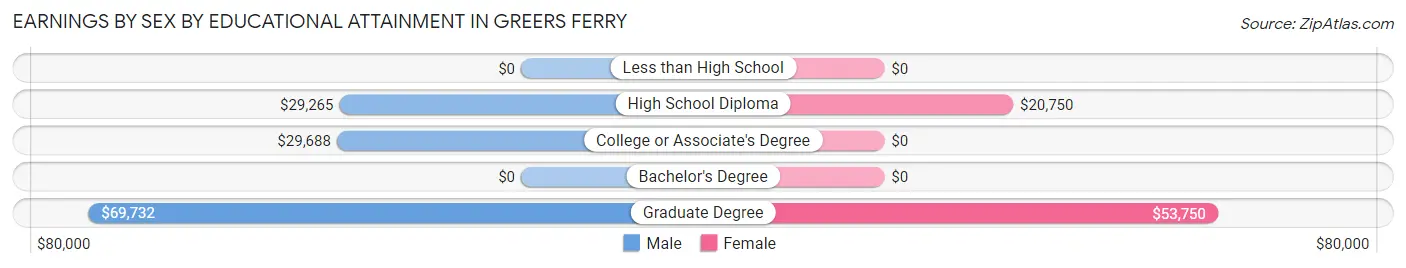
Earnings by Sex by Educational Attainment in Greers Ferry
Average earnings in Greers Ferry are $30,938 for men and $22,250 for women, a difference of 28.1%. Men with an educational attainment of graduate degree enjoy the highest average annual earnings of $69,732, while those with high school diploma education earn the least with $29,265. Women with an educational attainment of graduate degree earn the most with the average annual earnings of $53,750, while those with high school diploma education have the smallest earnings of $20,750.
| Educational Attainment | Male Income | Female Income |
| Less than High School | - | - |
| High School Diploma | $29,265 | $20,750 |
| College or Associate's Degree | $29,688 | $0 |
| Bachelor's Degree | - | - |
| Graduate Degree | $69,732 | $53,750 |
| Total | $30,938 | $22,250 |
Family Income in Greers Ferry
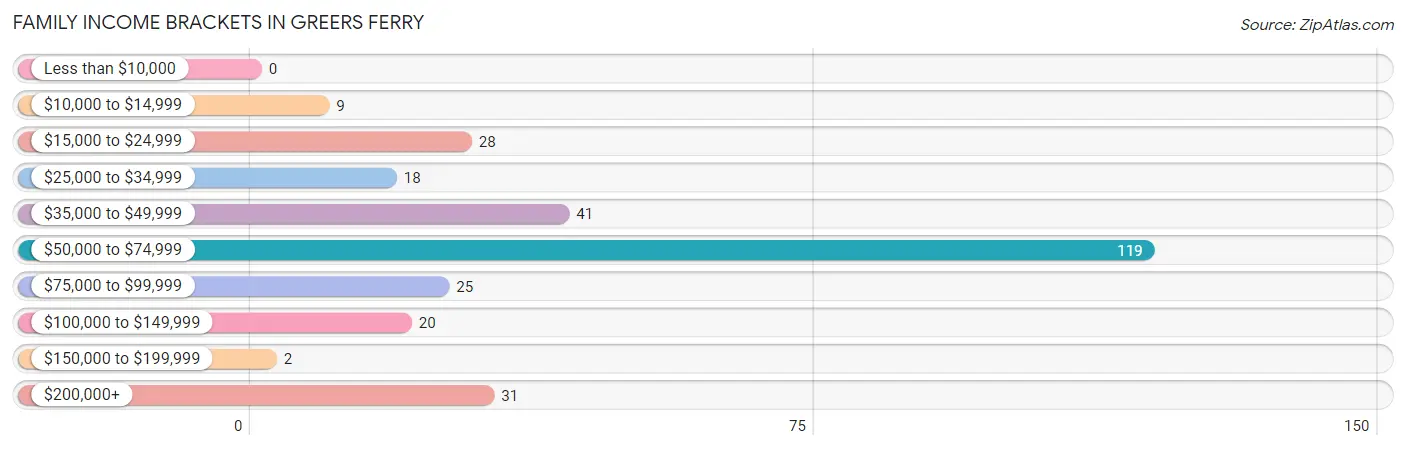
Family Income Brackets in Greers Ferry
According to the Greers Ferry family income data, there are 119 families falling into the $50,000 to $74,999 income range, which is the most common income bracket and makes up 40.6% of all families.
| Income Bracket | # Families | % Families |
| Less than $10,000 | 0 | 0.0% |
| $10,000 to $14,999 | 9 | 3.1% |
| $15,000 to $24,999 | 28 | 9.6% |
| $25,000 to $34,999 | 18 | 6.1% |
| $35,000 to $49,999 | 41 | 14.0% |
| $50,000 to $74,999 | 119 | 40.6% |
| $75,000 to $99,999 | 25 | 8.5% |
| $100,000 to $149,999 | 20 | 6.8% |
| $150,000 to $199,999 | 2 | 0.7% |
| $200,000+ | 31 | 10.6% |
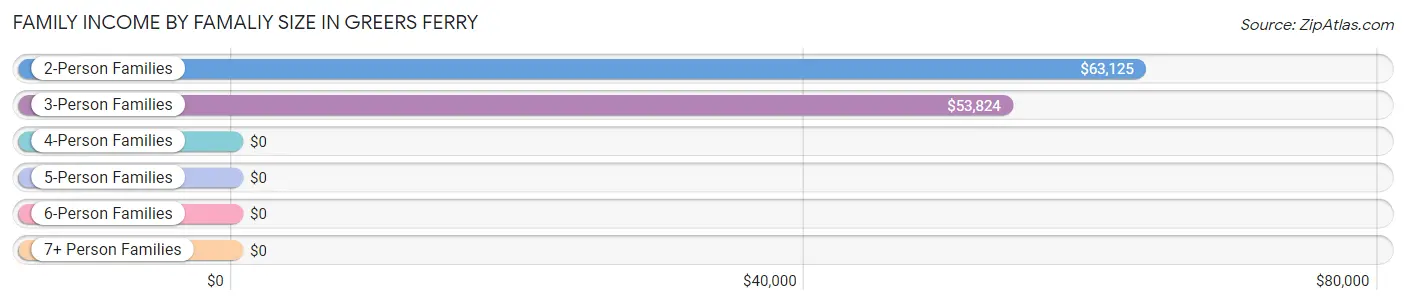
Family Income by Famaliy Size in Greers Ferry
2-person families (192 | 65.5%) account for the highest median family income in Greers Ferry with $63,125 per family, while 2-person families (192 | 65.5%) have the highest median income of $31,562 per family member.
| Income Bracket | # Families | Median Income |
| 2-Person Families | 192 (65.5%) | $63,125 |
| 3-Person Families | 50 (17.1%) | $53,824 |
| 4-Person Families | 20 (6.8%) | $0 |
| 5-Person Families | 18 (6.1%) | $0 |
| 6-Person Families | 8 (2.7%) | $0 |
| 7+ Person Families | 5 (1.7%) | $0 |
| Total | 293 (100.0%) | $57,417 |
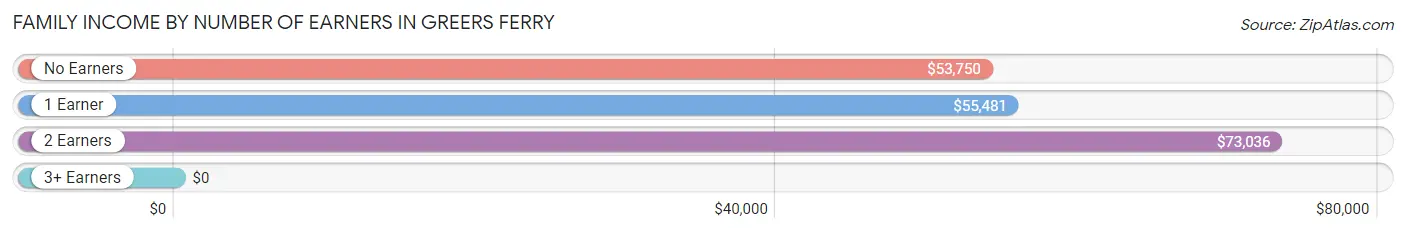
Family Income by Number of Earners in Greers Ferry
| Number of Earners | # Families | Median Income |
| No Earners | 61 (20.8%) | $53,750 |
| 1 Earner | 129 (44.0%) | $55,481 |
| 2 Earners | 94 (32.1%) | $73,036 |
| 3+ Earners | 9 (3.1%) | $0 |
| Total | 293 (100.0%) | $57,417 |
Household Income in Greers Ferry
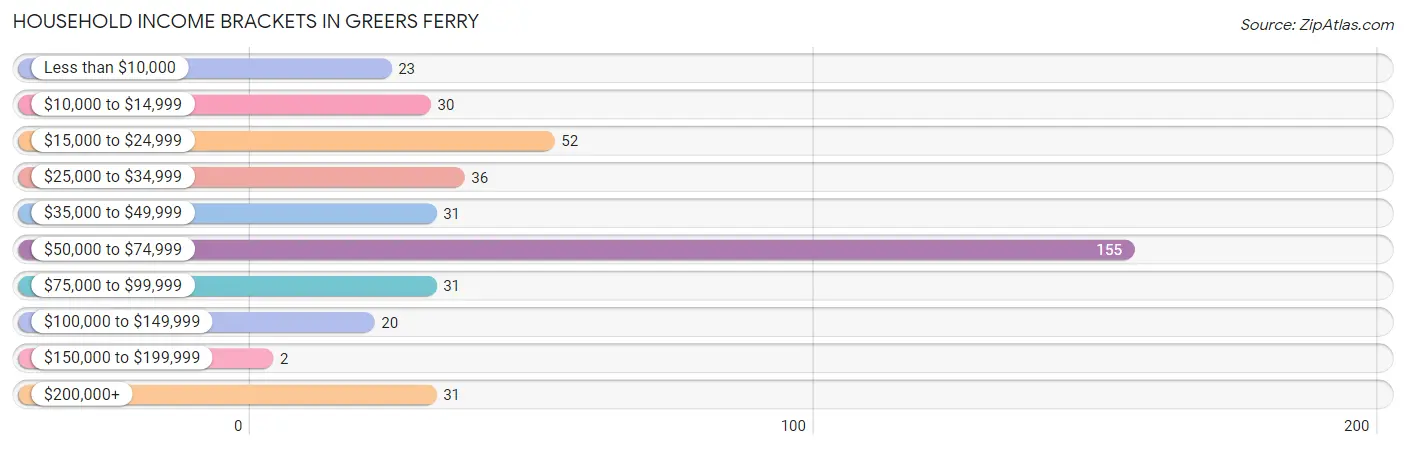
Household Income Brackets in Greers Ferry
With 155 households falling in the category, the $50,000 to $74,999 income range is the most frequent in Greers Ferry, accounting for 37.7% of all households. In contrast, only 2 households (0.5%) fall into the $150,000 to $199,999 income bracket, making it the least populous group.
| Income Bracket | # Households | % Households |
| Less than $10,000 | 23 | 5.6% |
| $10,000 to $14,999 | 30 | 7.3% |
| $15,000 to $24,999 | 52 | 12.7% |
| $25,000 to $34,999 | 36 | 8.8% |
| $35,000 to $49,999 | 31 | 7.5% |
| $50,000 to $74,999 | 155 | 37.7% |
| $75,000 to $99,999 | 31 | 7.5% |
| $100,000 to $149,999 | 20 | 4.9% |
| $150,000 to $199,999 | 2 | 0.5% |
| $200,000+ | 31 | 7.5% |
Household Income by Householder Age in Greers Ferry
The median household income in Greers Ferry is $54,315, with the highest median household income of $56,250 found in the 45 to 64 years age bracket for the primary householder. A total of 147 households (35.8%) fall into this category. Meanwhile, the 15 to 24 years age bracket for the primary householder has the lowest median household income of $0, with 2 households (0.5%) in this group.
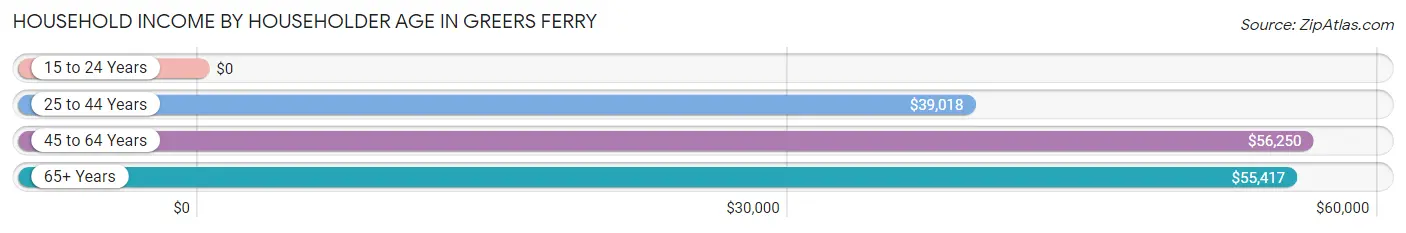
| Income Bracket | # Households | Median Income |
| 15 to 24 Years | 2 (0.5%) | $0 |
| 25 to 44 Years | 109 (26.5%) | $39,018 |
| 45 to 64 Years | 147 (35.8%) | $56,250 |
| 65+ Years | 153 (37.2%) | $55,417 |
| Total | 411 (100.0%) | $54,315 |
Poverty in Greers Ferry
Income Below Poverty by Sex and Age in Greers Ferry
With 18.9% poverty level for males and 22.6% for females among the residents of Greers Ferry, 18 to 24 year old males and 25 to 34 year old females are the most vulnerable to poverty, with 2 males (100.0%) and 31 females (70.5%) in their respective age groups living below the poverty level.
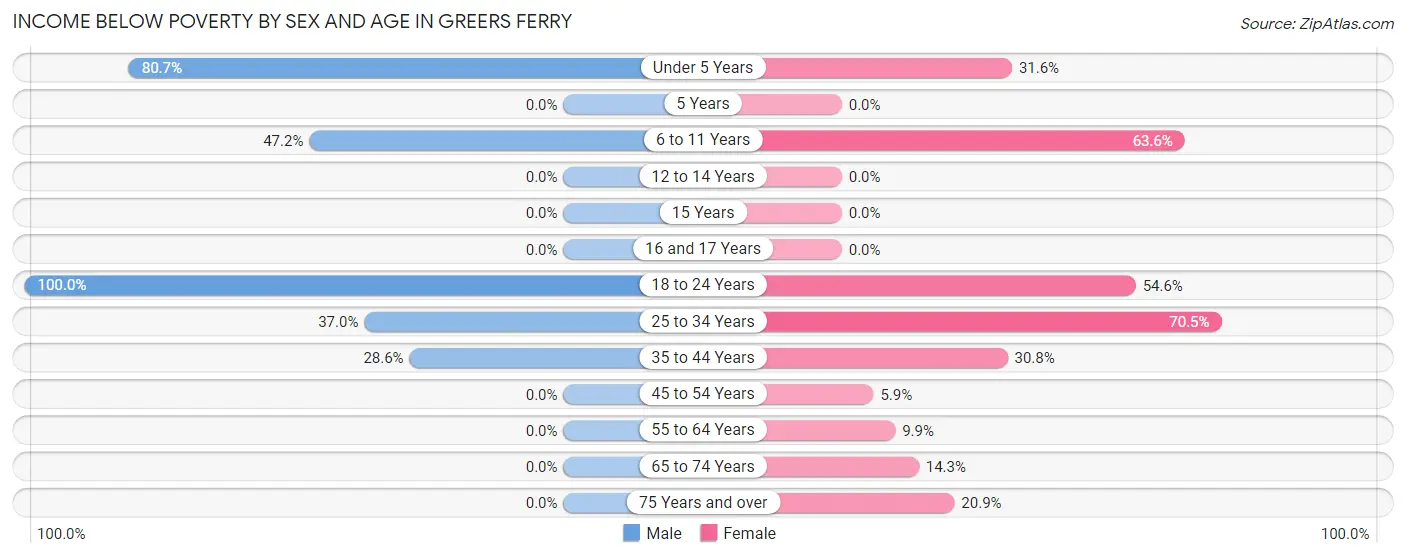
| Age Bracket | Male | Female |
| Under 5 Years | 25 (80.6%) | 6 (31.6%) |
| 5 Years | 0 (0.0%) | 0 (0.0%) |
| 6 to 11 Years | 25 (47.2%) | 14 (63.6%) |
| 12 to 14 Years | 0 (0.0%) | 0 (0.0%) |
| 15 Years | 0 (0.0%) | 0 (0.0%) |
| 16 and 17 Years | 0 (0.0%) | 0 (0.0%) |
| 18 to 24 Years | 2 (100.0%) | 6 (54.5%) |
| 25 to 34 Years | 17 (37.0%) | 31 (70.5%) |
| 35 to 44 Years | 12 (28.6%) | 12 (30.8%) |
| 45 to 54 Years | 0 (0.0%) | 4 (5.9%) |
| 55 to 64 Years | 0 (0.0%) | 11 (9.9%) |
| 65 to 74 Years | 0 (0.0%) | 10 (14.3%) |
| 75 Years and over | 0 (0.0%) | 14 (20.9%) |
| Total | 81 (18.9%) | 108 (22.6%) |
Income Above Poverty by Sex and Age in Greers Ferry
According to the poverty statistics in Greers Ferry, males aged 5 years and females aged 12 to 14 years are the age groups that are most secure financially, with 100.0% of males and 100.0% of females in these age groups living above the poverty line.
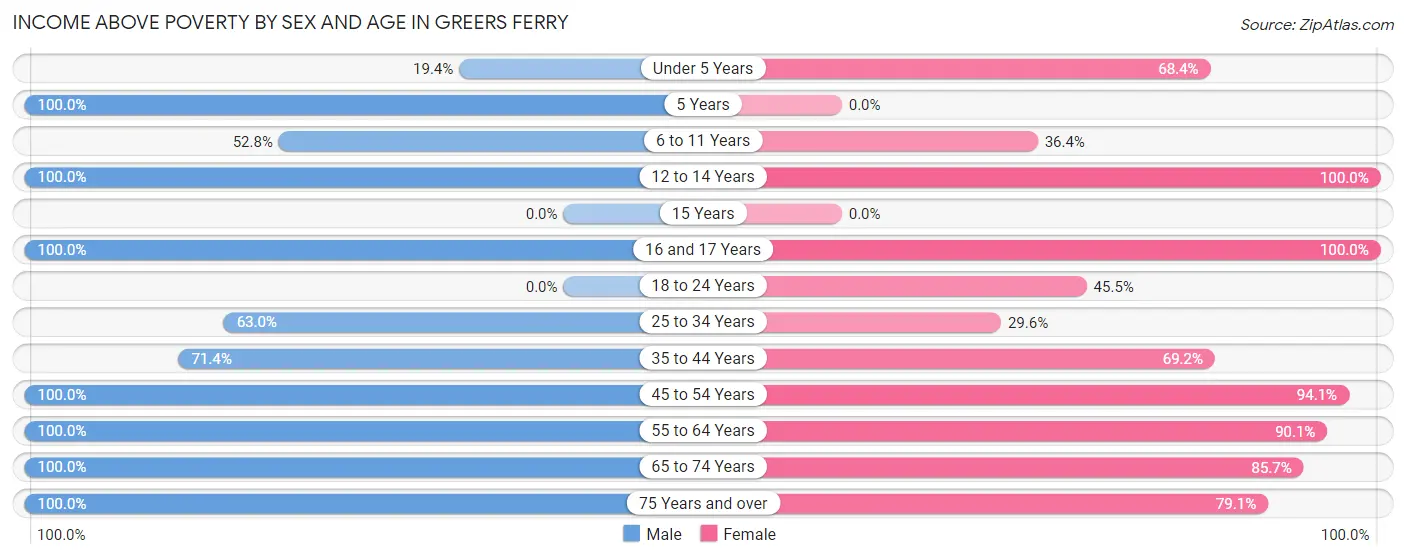
| Age Bracket | Male | Female |
| Under 5 Years | 6 (19.4%) | 13 (68.4%) |
| 5 Years | 3 (100.0%) | 0 (0.0%) |
| 6 to 11 Years | 28 (52.8%) | 8 (36.4%) |
| 12 to 14 Years | 25 (100.0%) | 11 (100.0%) |
| 15 Years | 0 (0.0%) | 0 (0.0%) |
| 16 and 17 Years | 7 (100.0%) | 15 (100.0%) |
| 18 to 24 Years | 0 (0.0%) | 5 (45.5%) |
| 25 to 34 Years | 29 (63.0%) | 13 (29.5%) |
| 35 to 44 Years | 30 (71.4%) | 27 (69.2%) |
| 45 to 54 Years | 35 (100.0%) | 64 (94.1%) |
| 55 to 64 Years | 60 (100.0%) | 100 (90.1%) |
| 65 to 74 Years | 79 (100.0%) | 60 (85.7%) |
| 75 Years and over | 45 (100.0%) | 53 (79.1%) |
| Total | 347 (81.1%) | 369 (77.4%) |
Income Below Poverty Among Married-Couple Families in Greers Ferry
The poverty statistics for married-couple families in Greers Ferry show that 6.4% or 15 of the total 233 families live below the poverty line. Families with 3 or 4 children have the highest poverty rate of 41.9%, comprising of 13 families. On the other hand, families with no children have the lowest poverty rate of 0.0%, which includes 0 families.
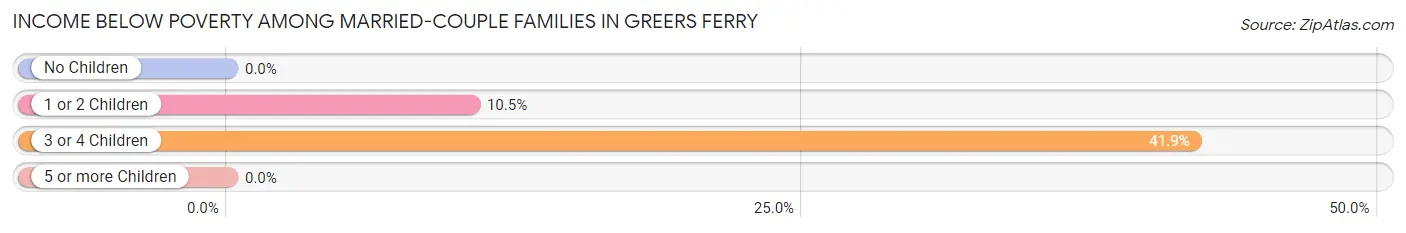
| Children | Above Poverty | Below Poverty |
| No Children | 183 (100.0%) | 0 (0.0%) |
| 1 or 2 Children | 17 (89.5%) | 2 (10.5%) |
| 3 or 4 Children | 18 (58.1%) | 13 (41.9%) |
| 5 or more Children | 0 (0.0%) | 0 (0.0%) |
| Total | 218 (93.6%) | 15 (6.4%) |
Income Below Poverty Among Single-Parent Households in Greers Ferry
According to the poverty data in Greers Ferry, 54.5% or 12 single-father households and 36.8% or 14 single-mother households are living below the poverty line. Among single-father households, those with 1 or 2 children have the highest poverty rate, with 12 households (54.5%) experiencing poverty. Likewise, among single-mother households, those with 3 or 4 children have the highest poverty rate, with 9 households (100.0%) falling below the poverty line.
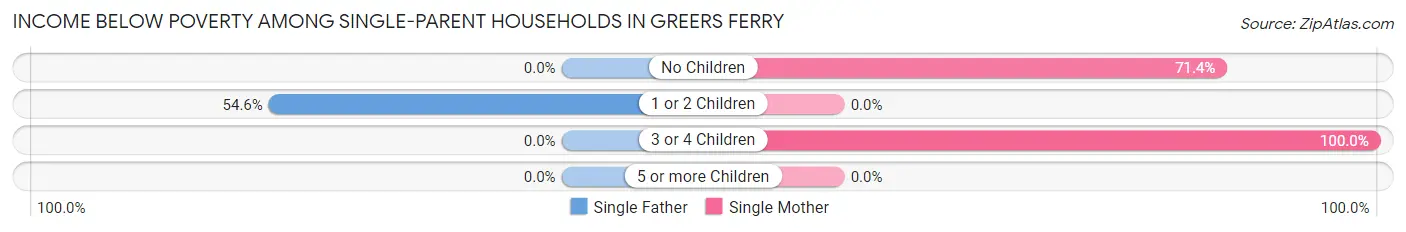
| Children | Single Father | Single Mother |
| No Children | 0 (0.0%) | 5 (71.4%) |
| 1 or 2 Children | 12 (54.5%) | 0 (0.0%) |
| 3 or 4 Children | 0 (0.0%) | 9 (100.0%) |
| 5 or more Children | 0 (0.0%) | 0 (0.0%) |
| Total | 12 (54.5%) | 14 (36.8%) |
Income Below Poverty Among Married-Couple vs Single-Parent Households in Greers Ferry
The poverty data for Greers Ferry shows that 15 of the married-couple family households (6.4%) and 26 of the single-parent households (43.3%) are living below the poverty level. Within the married-couple family households, those with 3 or 4 children have the highest poverty rate, with 13 households (41.9%) falling below the poverty line. Among the single-parent households, those with 3 or 4 children have the highest poverty rate, with 9 household (100.0%) living below poverty.
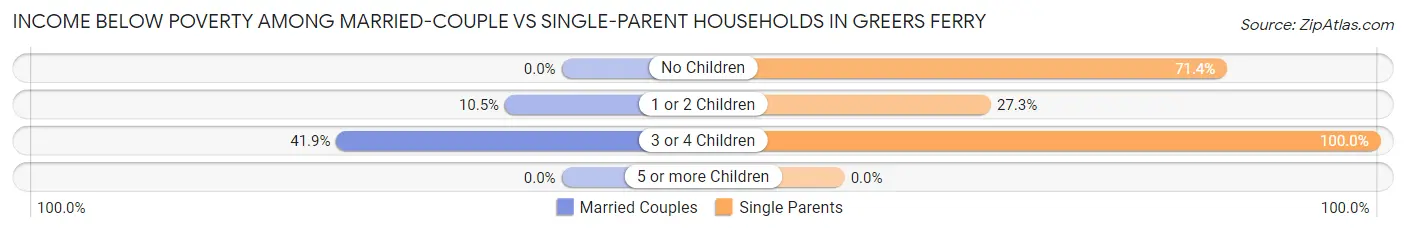
| Children | Married-Couple Families | Single-Parent Households |
| No Children | 0 (0.0%) | 5 (71.4%) |
| 1 or 2 Children | 2 (10.5%) | 12 (27.3%) |
| 3 or 4 Children | 13 (41.9%) | 9 (100.0%) |
| 5 or more Children | 0 (0.0%) | 0 (0.0%) |
| Total | 15 (6.4%) | 26 (43.3%) |
Race in Greers Ferry
The most populous races in Greers Ferry are White / Caucasian (841 | 92.9%), Two or more Races (61 | 6.7%), and Hispanic or Latino (52 | 5.8%).
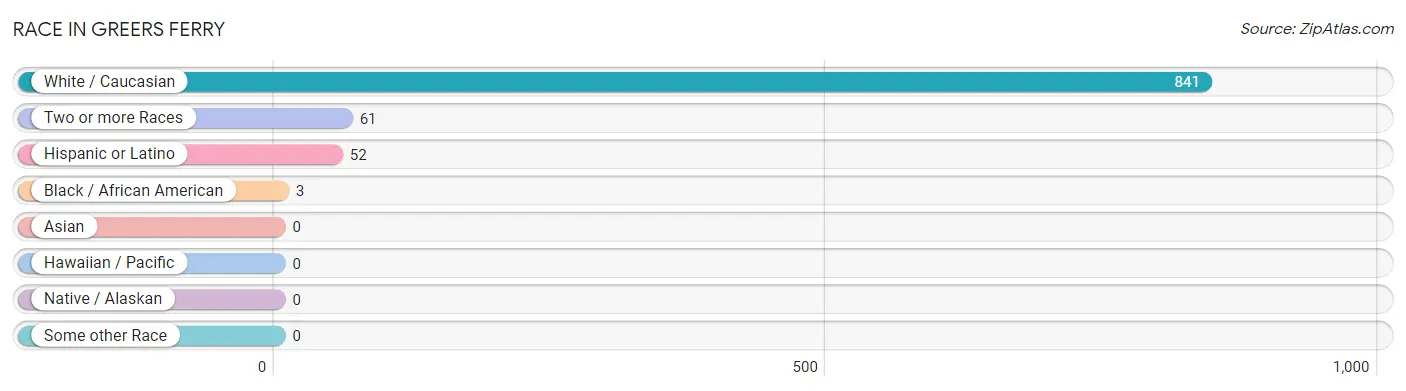
| Race | # Population | % Population |
| Asian | 0 | 0.0% |
| Black / African American | 3 | 0.3% |
| Hawaiian / Pacific | 0 | 0.0% |
| Hispanic or Latino | 52 | 5.8% |
| Native / Alaskan | 0 | 0.0% |
| White / Caucasian | 841 | 92.9% |
| Two or more Races | 61 | 6.7% |
| Some other Race | 0 | 0.0% |
| Total | 905 | 100.0% |
Ancestry in Greers Ferry
The most populous ancestries reported in Greers Ferry are English (106 | 11.7%), American (99 | 10.9%), German (78 | 8.6%), Irish (70 | 7.7%), and Puerto Rican (52 | 5.8%), together accounting for 44.7% of all Greers Ferry residents.
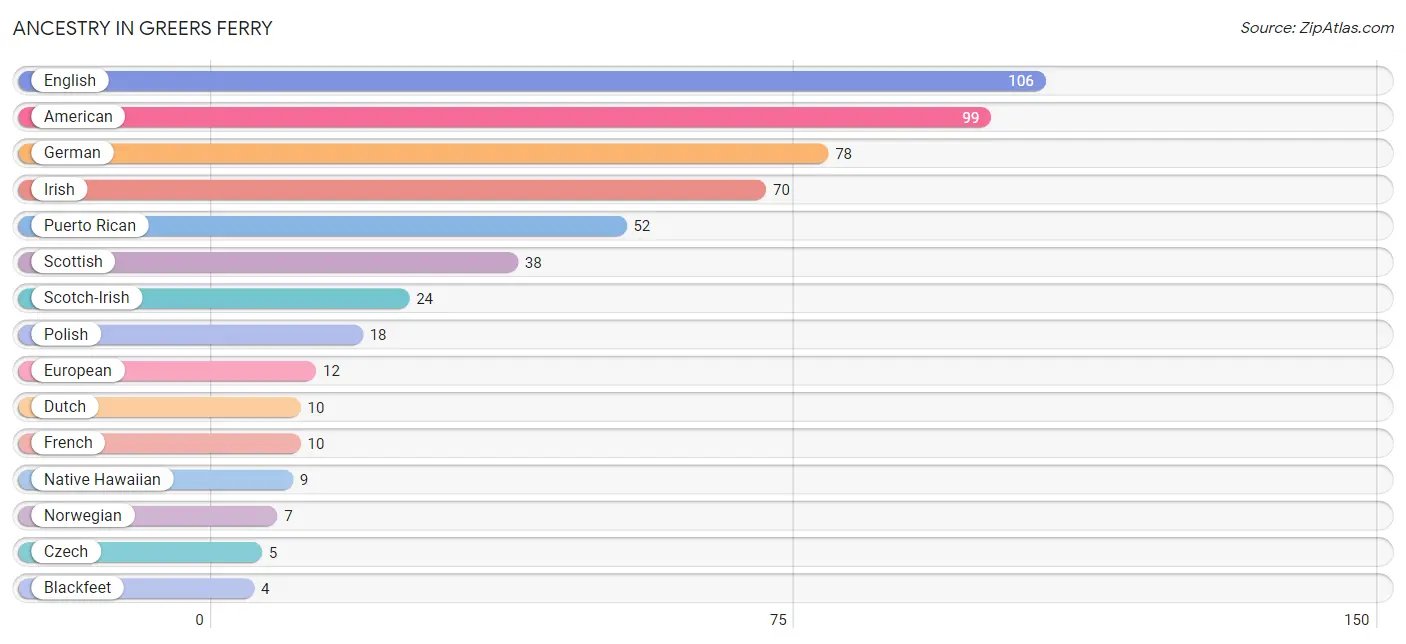
| Ancestry | # Population | % Population |
| American | 99 | 10.9% |
| Blackfeet | 4 | 0.4% |
| British | 3 | 0.3% |
| Cajun | 2 | 0.2% |
| Czech | 5 | 0.5% |
| Danish | 2 | 0.2% |
| Dutch | 10 | 1.1% |
| English | 106 | 11.7% |
| European | 12 | 1.3% |
| French | 10 | 1.1% |
| German | 78 | 8.6% |
| Irish | 70 | 7.7% |
| Italian | 3 | 0.3% |
| Native Hawaiian | 9 | 1.0% |
| Northern European | 3 | 0.3% |
| Norwegian | 7 | 0.8% |
| Polish | 18 | 2.0% |
| Puerto Rican | 52 | 5.8% |
| Scandinavian | 1 | 0.1% |
| Scotch-Irish | 24 | 2.6% |
| Scottish | 38 | 4.2% |
| Swedish | 3 | 0.3% |
| Ukrainian | 2 | 0.2% |
| Welsh | 2 | 0.2% | View All 24 Rows |
Immigrants in Greers Ferry
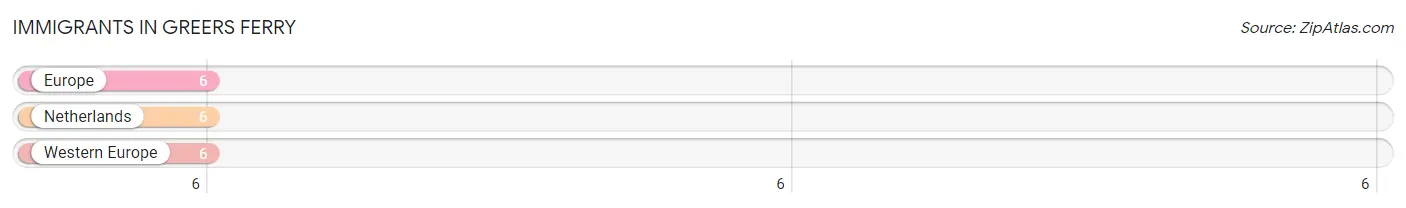
The most numerous immigrant groups reported in Greers Ferry came from Europe (6 | 0.7%), Netherlands (6 | 0.7%), and Western Europe (6 | 0.7%), together accounting for 2.0% of all Greers Ferry residents.
| Immigration Origin | # Population | % Population |
| Europe | 6 | 0.7% |
| Netherlands | 6 | 0.7% |
| Western Europe | 6 | 0.7% | View All 3 Rows |
Sex and Age in Greers Ferry
Sex and Age in Greers Ferry
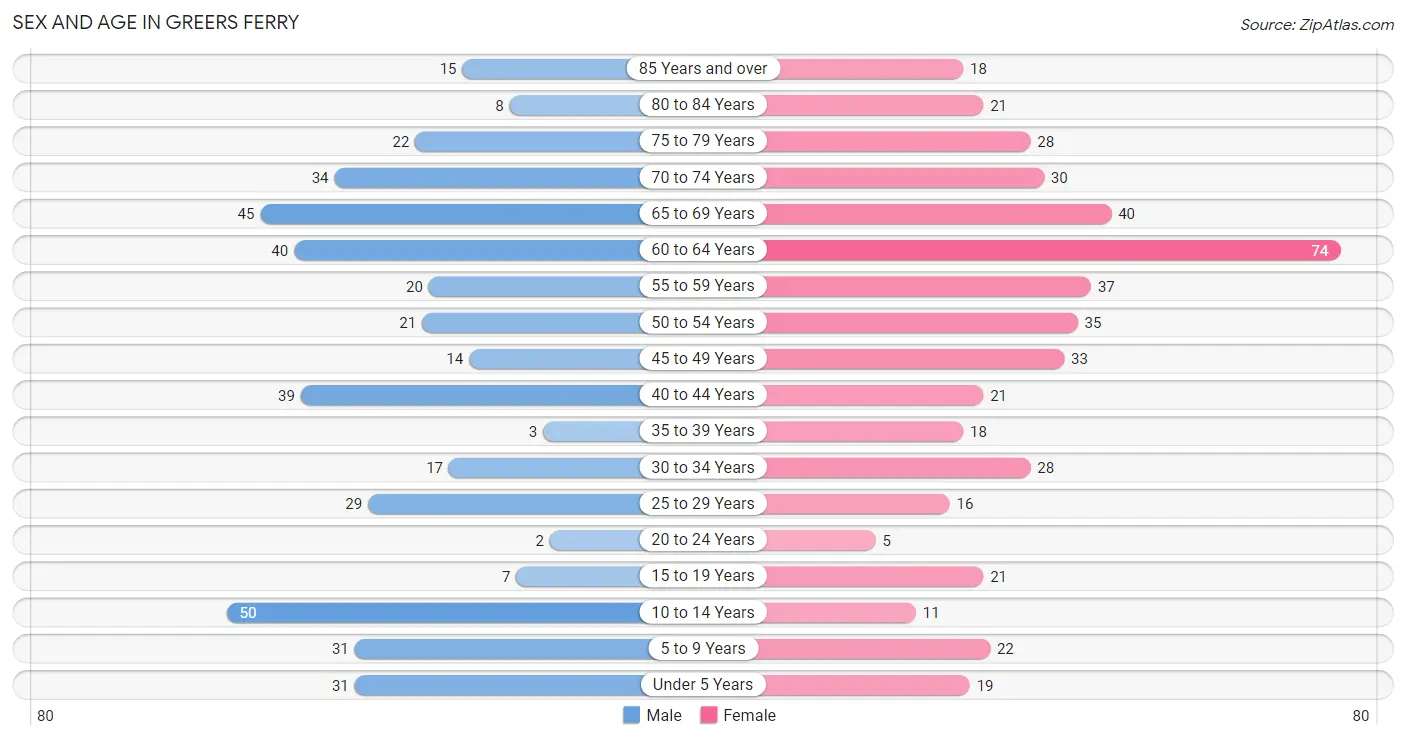
The most populous age groups in Greers Ferry are 10 to 14 Years (50 | 11.7%) for men and 60 to 64 Years (74 | 15.5%) for women.
| Age Bracket | Male | Female |
| Under 5 Years | 31 (7.2%) | 19 (4.0%) |
| 5 to 9 Years | 31 (7.2%) | 22 (4.6%) |
| 10 to 14 Years | 50 (11.7%) | 11 (2.3%) |
| 15 to 19 Years | 7 (1.6%) | 21 (4.4%) |
| 20 to 24 Years | 2 (0.5%) | 5 (1.1%) |
| 25 to 29 Years | 29 (6.8%) | 16 (3.4%) |
| 30 to 34 Years | 17 (4.0%) | 28 (5.9%) |
| 35 to 39 Years | 3 (0.7%) | 18 (3.8%) |
| 40 to 44 Years | 39 (9.1%) | 21 (4.4%) |
| 45 to 49 Years | 14 (3.3%) | 33 (6.9%) |
| 50 to 54 Years | 21 (4.9%) | 35 (7.3%) |
| 55 to 59 Years | 20 (4.7%) | 37 (7.8%) |
| 60 to 64 Years | 40 (9.3%) | 74 (15.5%) |
| 65 to 69 Years | 45 (10.5%) | 40 (8.4%) |
| 70 to 74 Years | 34 (7.9%) | 30 (6.3%) |
| 75 to 79 Years | 22 (5.1%) | 28 (5.9%) |
| 80 to 84 Years | 8 (1.9%) | 21 (4.4%) |
| 85 Years and over | 15 (3.5%) | 18 (3.8%) |
| Total | 428 (100.0%) | 477 (100.0%) |
Families and Households in Greers Ferry
Median Family Size in Greers Ferry
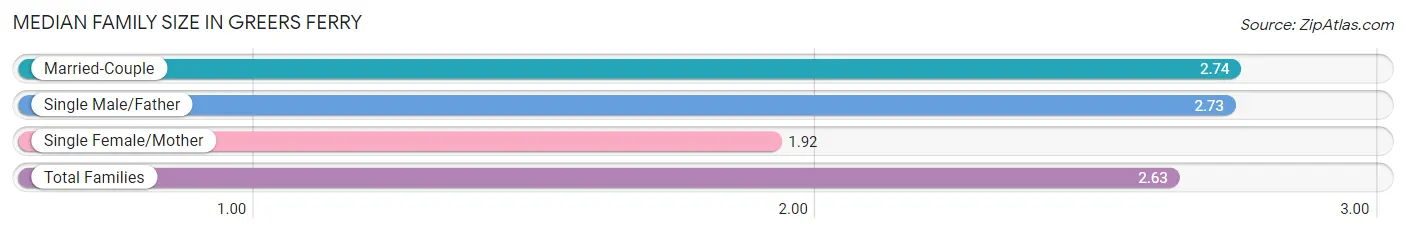
The median family size in Greers Ferry is 2.63 persons per family, with married-couple families (233 | 79.5%) accounting for the largest median family size of 2.74 persons per family. On the other hand, single female/mother families (38 | 13.0%) represent the smallest median family size with 1.92 persons per family.
| Family Type | # Families | Family Size |
| Married-Couple | 233 (79.5%) | 2.74 |
| Single Male/Father | 22 (7.5%) | 2.73 |
| Single Female/Mother | 38 (13.0%) | 1.92 |
| Total Families | 293 (100.0%) | 2.63 |
Median Household Size in Greers Ferry
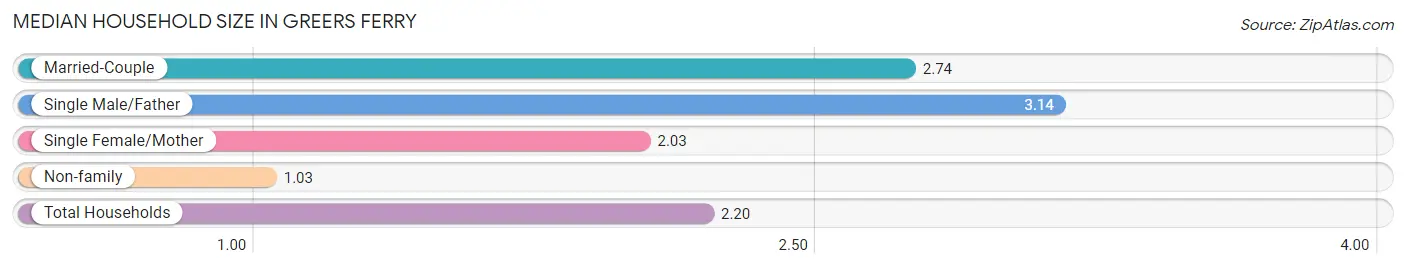
The median household size in Greers Ferry is 2.20 persons per household, with single male/father households (22 | 5.3%) accounting for the largest median household size of 3.14 persons per household. non-family households (118 | 28.7%) represent the smallest median household size with 1.03 persons per household.
| Household Type | # Households | Household Size |
| Married-Couple | 233 (56.7%) | 2.74 |
| Single Male/Father | 22 (5.3%) | 3.14 |
| Single Female/Mother | 38 (9.2%) | 2.03 |
| Non-family | 118 (28.7%) | 1.03 |
| Total Households | 411 (100.0%) | 2.20 |
Household Size by Marriage Status in Greers Ferry
Out of a total of 411 households in Greers Ferry, 293 (71.3%) are family households, while 118 (28.7%) are nonfamily households. The most numerous type of family households are 2-person households, comprising 186, and the most common type of nonfamily households are 1-person households, comprising 115.
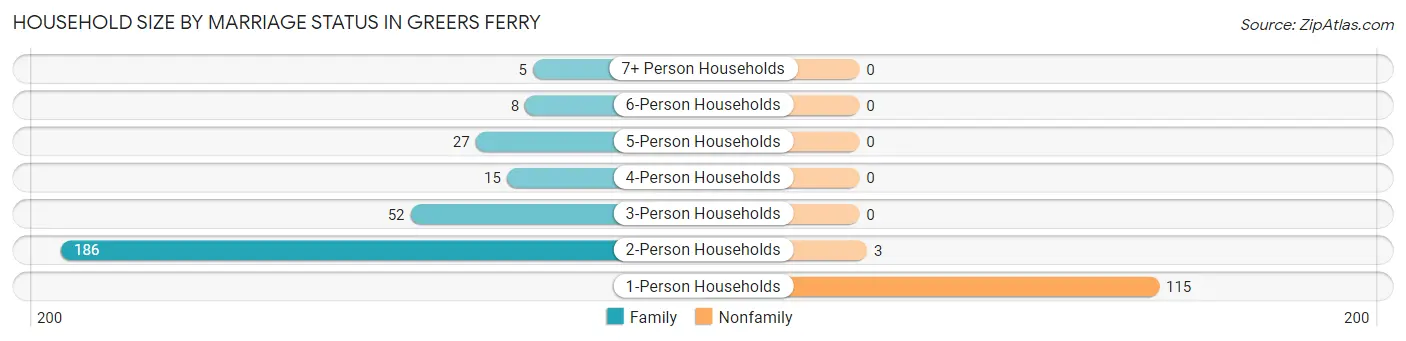
| Household Size | Family Households | Nonfamily Households |
| 1-Person Households | - | 115 (28.0%) |
| 2-Person Households | 186 (45.3%) | 3 (0.7%) |
| 3-Person Households | 52 (12.7%) | 0 (0.0%) |
| 4-Person Households | 15 (3.6%) | 0 (0.0%) |
| 5-Person Households | 27 (6.6%) | 0 (0.0%) |
| 6-Person Households | 8 (1.9%) | 0 (0.0%) |
| 7+ Person Households | 5 (1.2%) | 0 (0.0%) |
| Total | 293 (71.3%) | 118 (28.7%) |
Female Fertility in Greers Ferry
Fertility by Age in Greers Ferry
Average fertility rate in Greers Ferry is 96.0 births per 1,000 women. Women in the age bracket of 20 to 34 years have the highest fertility rate with 286.0 births per 1,000 women. Women in the age bracket of 20 to 34 years acount for 100.0% of all women with births.
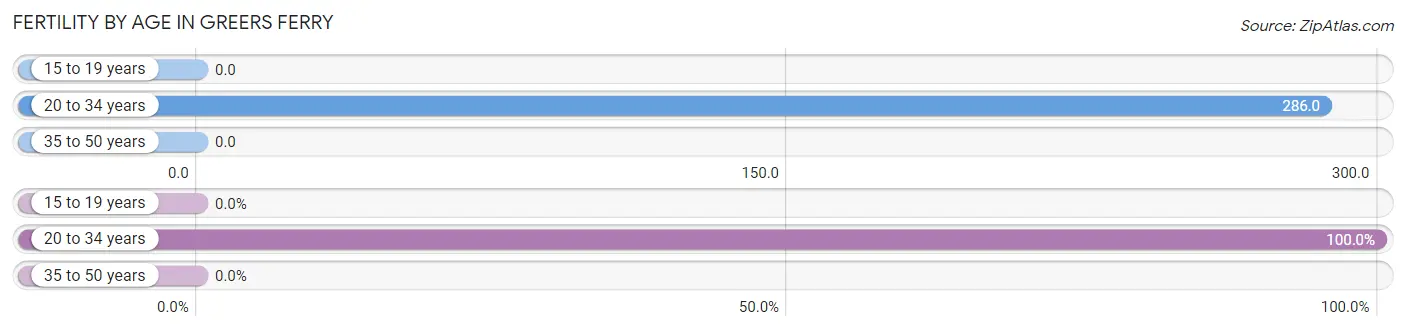
| Age Bracket | Women with Births | Births / 1,000 Women |
| 15 to 19 years | 0 (0.0%) | 0.0 |
| 20 to 34 years | 14 (100.0%) | 286.0 |
| 35 to 50 years | 0 (0.0%) | 0.0 |
| Total | 14 (100.0%) | 96.0 |
Fertility by Age by Marriage Status in Greers Ferry
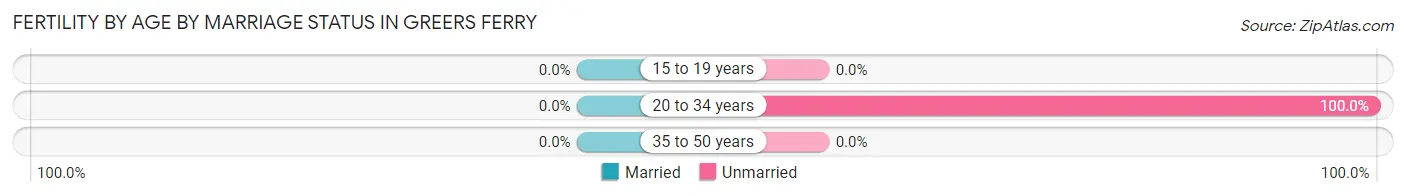
| Age Bracket | Married | Unmarried |
| 15 to 19 years | 0 (0.0%) | 0 (0.0%) |
| 20 to 34 years | 0 (0.0%) | 14 (100.0%) |
| 35 to 50 years | 0 (0.0%) | 0 (0.0%) |
| Total | 0 (0.0%) | 14 (100.0%) |
Fertility by Education in Greers Ferry
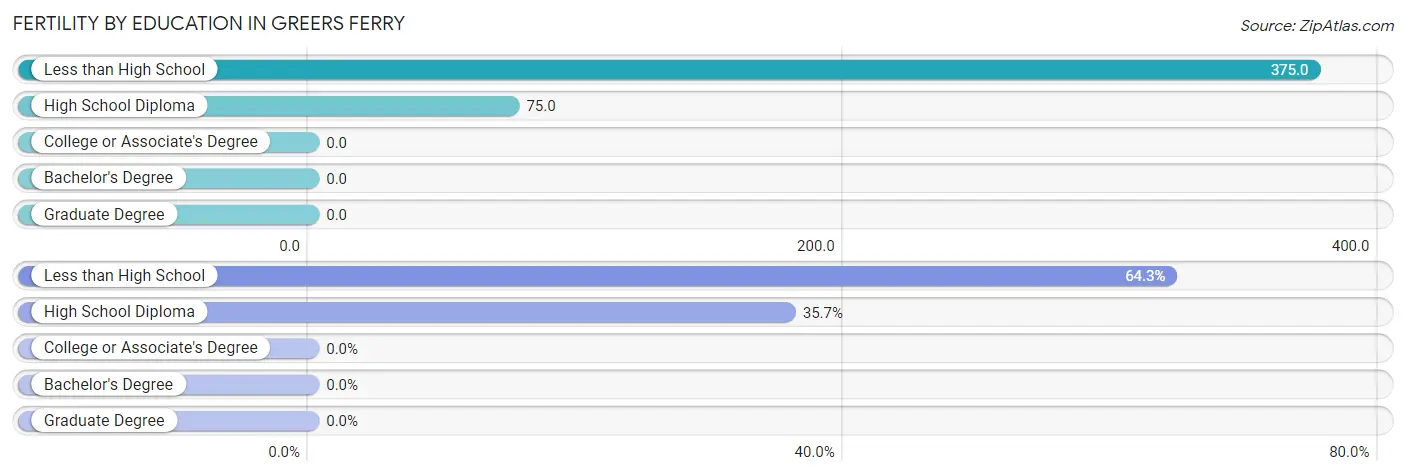
| Educational Attainment | Women with Births | Births / 1,000 Women |
| Less than High School | 9 (64.3%) | 375.0 |
| High School Diploma | 5 (35.7%) | 75.0 |
| College or Associate's Degree | 0 (0.0%) | 0.0 |
| Bachelor's Degree | 0 (0.0%) | 0.0 |
| Graduate Degree | 0 (0.0%) | 0.0 |
| Total | 14 (100.0%) | 96.0 |
Fertility by Education by Marriage Status in Greers Ferry
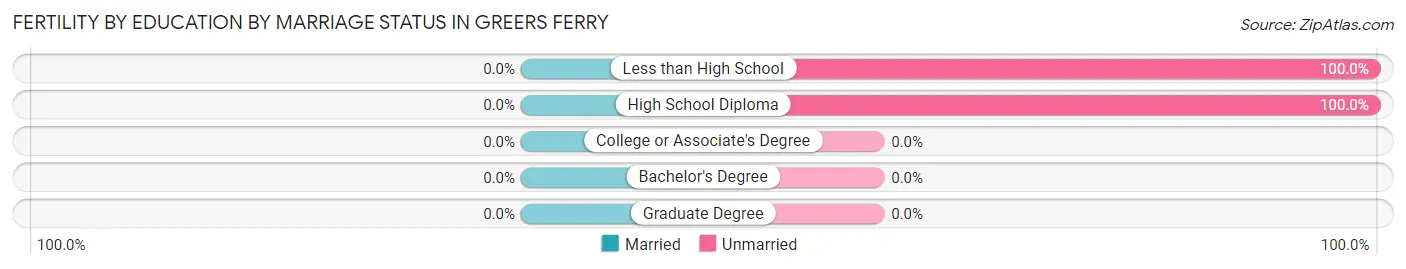
| Educational Attainment | Married | Unmarried |
| Less than High School | 0 (0.0%) | 9 (100.0%) |
| High School Diploma | 0 (0.0%) | 5 (100.0%) |
| College or Associate's Degree | 0 (0.0%) | 0 (0.0%) |
| Bachelor's Degree | 0 (0.0%) | 0 (0.0%) |
| Graduate Degree | 0 (0.0%) | 0 (0.0%) |
| Total | 0 (0.0%) | 14 (100.0%) |
Employment Characteristics in Greers Ferry
Employment by Class of Employer in Greers Ferry
Among the 335 employed individuals in Greers Ferry, private company employees (169 | 50.4%), self-employed (incorporated) (54 | 16.1%), and self-employed (not incorporated) (46 | 13.7%) make up the most common classes of employment.
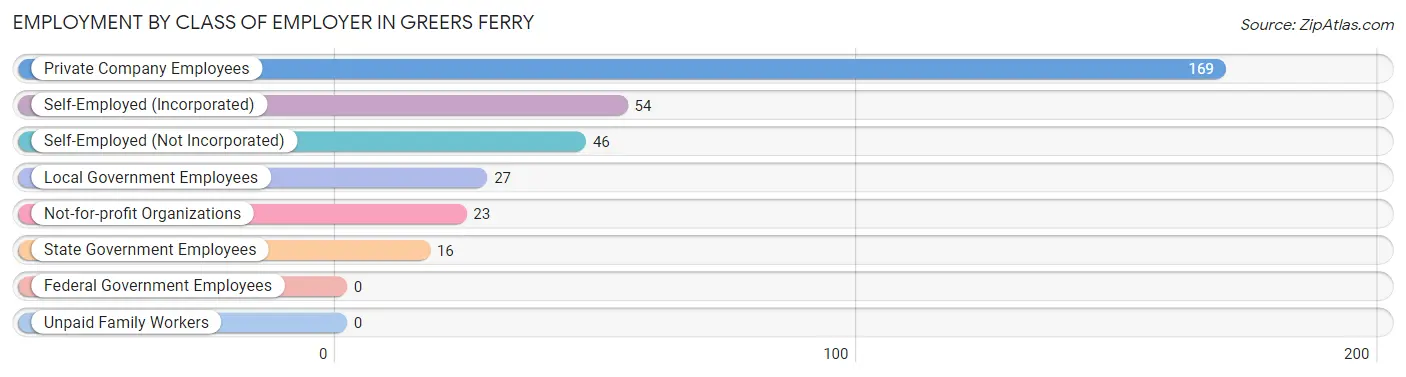
| Employer Class | # Employees | % Employees |
| Private Company Employees | 169 | 50.4% |
| Self-Employed (Incorporated) | 54 | 16.1% |
| Self-Employed (Not Incorporated) | 46 | 13.7% |
| Not-for-profit Organizations | 23 | 6.9% |
| Local Government Employees | 27 | 8.1% |
| State Government Employees | 16 | 4.8% |
| Federal Government Employees | 0 | 0.0% |
| Unpaid Family Workers | 0 | 0.0% |
| Total | 335 | 100.0% |
Employment Status by Age in Greers Ferry
According to the labor force statistics for Greers Ferry, out of the total population over 16 years of age (741), 48.4% or 359 individuals are in the labor force, with 2.2% or 8 of them unemployed. The age group with the highest labor force participation rate is 20 to 24 years, with 100.0% or 7 individuals in the labor force. Within the labor force, the 75 years and over age range has the highest percentage of unemployed individuals, with 57.1% or 8 of them being unemployed.
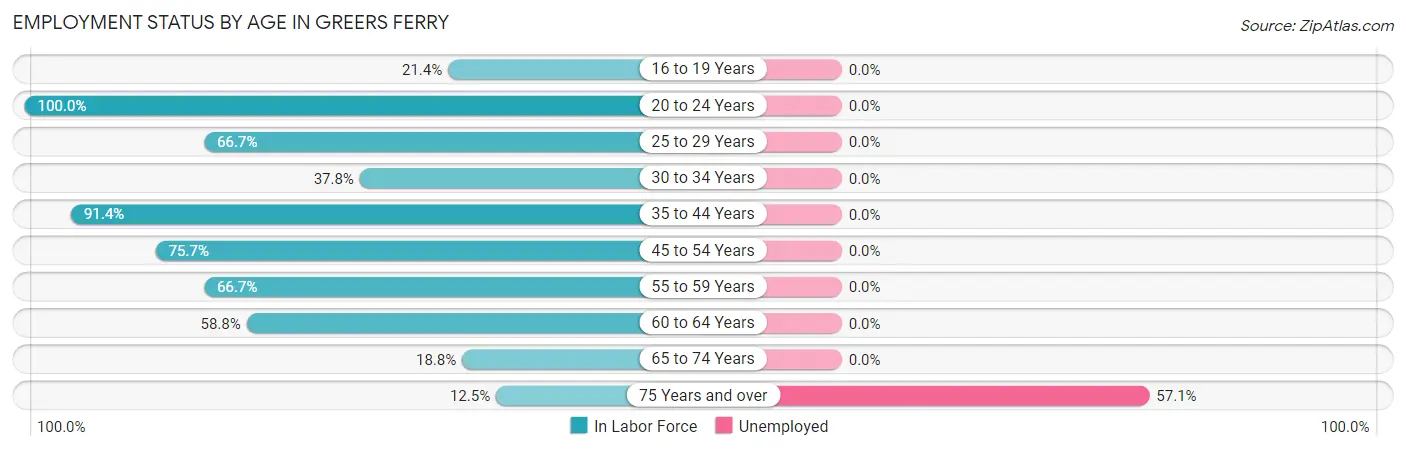
| Age Bracket | In Labor Force | Unemployed |
| 16 to 19 Years | 6 (21.4%) | 0 (0.0%) |
| 20 to 24 Years | 7 (100.0%) | 0 (0.0%) |
| 25 to 29 Years | 30 (66.7%) | 0 (0.0%) |
| 30 to 34 Years | 17 (37.8%) | 0 (0.0%) |
| 35 to 44 Years | 74 (91.4%) | 0 (0.0%) |
| 45 to 54 Years | 78 (75.7%) | 0 (0.0%) |
| 55 to 59 Years | 38 (66.7%) | 0 (0.0%) |
| 60 to 64 Years | 67 (58.8%) | 0 (0.0%) |
| 65 to 74 Years | 28 (18.8%) | 0 (0.0%) |
| 75 Years and over | 14 (12.5%) | 8 (57.1%) |
| Total | 359 (48.4%) | 8 (2.2%) |
Employment Status by Educational Attainment in Greers Ferry
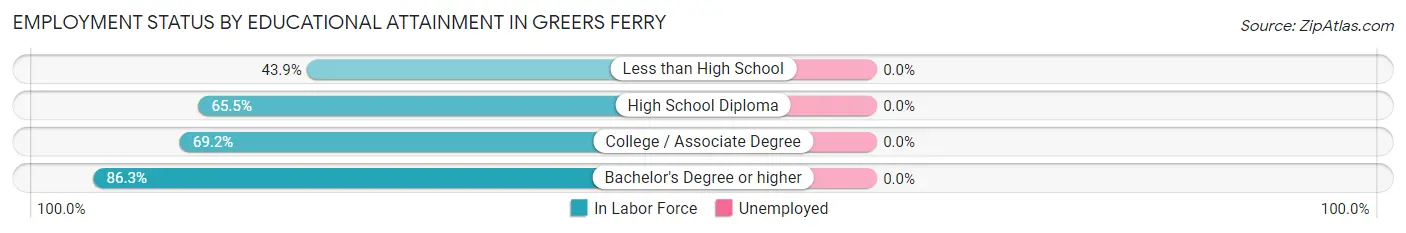
| Educational Attainment | In Labor Force | Unemployed |
| Less than High School | 18 (43.9%) | 0 (0.0%) |
| High School Diploma | 127 (65.5%) | 0 (0.0%) |
| College / Associate Degree | 90 (69.2%) | 0 (0.0%) |
| Bachelor's Degree or higher | 69 (86.3%) | 0 (0.0%) |
| Total | 304 (68.3%) | 0 (0.0%) |
Employment Occupations by Sex in Greers Ferry
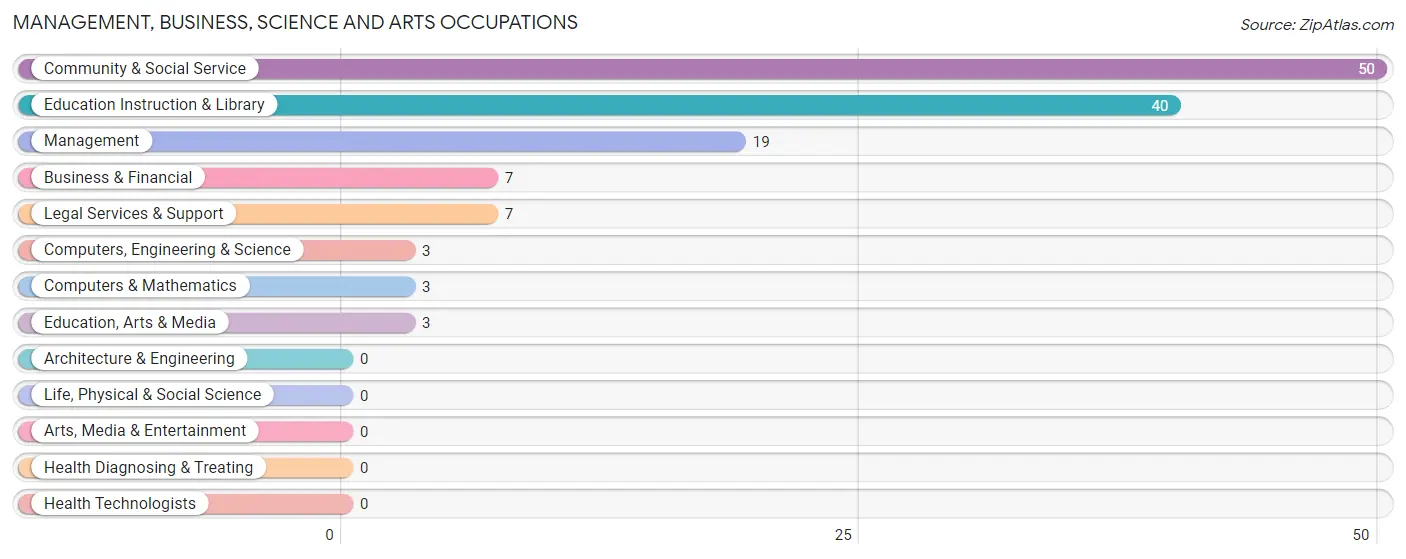
Management, Business, Science and Arts Occupations
The most common Management, Business, Science and Arts occupations in Greers Ferry are Community & Social Service (50 | 14.2%), Education Instruction & Library (40 | 11.4%), Management (19 | 5.4%), Business & Financial (7 | 2.0%), and Legal Services & Support (7 | 2.0%).
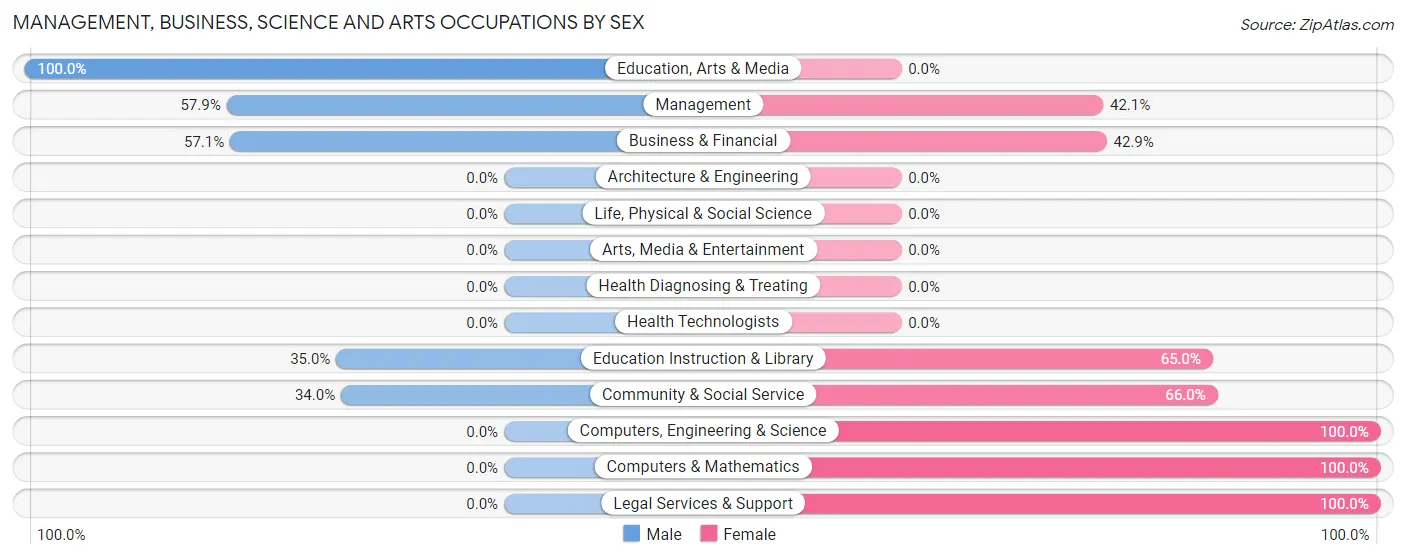
Management, Business, Science and Arts Occupations by Sex
Within the Management, Business, Science and Arts occupations in Greers Ferry, the most male-oriented occupations are Education, Arts & Media (100.0%), Management (57.9%), and Business & Financial (57.1%), while the most female-oriented occupations are Computers, Engineering & Science (100.0%), Computers & Mathematics (100.0%), and Legal Services & Support (100.0%).
| Occupation | Male | Female |
| Management | 11 (57.9%) | 8 (42.1%) |
| Business & Financial | 4 (57.1%) | 3 (42.9%) |
| Computers, Engineering & Science | 0 (0.0%) | 3 (100.0%) |
| Computers & Mathematics | 0 (0.0%) | 3 (100.0%) |
| Architecture & Engineering | 0 (0.0%) | 0 (0.0%) |
| Life, Physical & Social Science | 0 (0.0%) | 0 (0.0%) |
| Community & Social Service | 17 (34.0%) | 33 (66.0%) |
| Education, Arts & Media | 3 (100.0%) | 0 (0.0%) |
| Legal Services & Support | 0 (0.0%) | 7 (100.0%) |
| Education Instruction & Library | 14 (35.0%) | 26 (65.0%) |
| Arts, Media & Entertainment | 0 (0.0%) | 0 (0.0%) |
| Health Diagnosing & Treating | 0 (0.0%) | 0 (0.0%) |
| Health Technologists | 0 (0.0%) | 0 (0.0%) |
| Total (Category) | 32 (40.5%) | 47 (59.5%) |
| Total (Overall) | 170 (48.4%) | 181 (51.6%) |
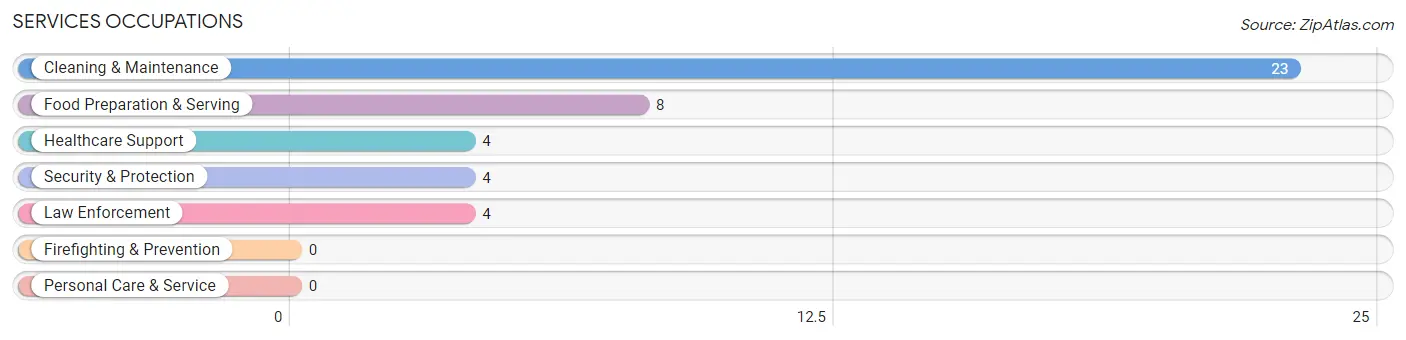
Services Occupations
The most common Services occupations in Greers Ferry are Cleaning & Maintenance (23 | 6.6%), Food Preparation & Serving (8 | 2.3%), Healthcare Support (4 | 1.1%), Security & Protection (4 | 1.1%), and Law Enforcement (4 | 1.1%).
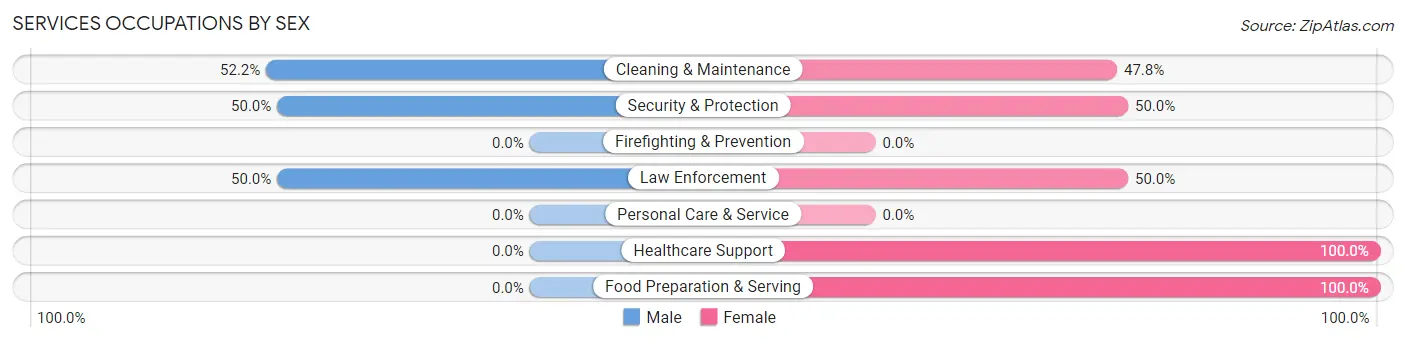
Services Occupations by Sex
Within the Services occupations in Greers Ferry, the most male-oriented occupations are Cleaning & Maintenance (52.2%), Security & Protection (50.0%), and Law Enforcement (50.0%), while the most female-oriented occupations are Healthcare Support (100.0%), Food Preparation & Serving (100.0%), and Security & Protection (50.0%).
| Occupation | Male | Female |
| Healthcare Support | 0 (0.0%) | 4 (100.0%) |
| Security & Protection | 2 (50.0%) | 2 (50.0%) |
| Firefighting & Prevention | 0 (0.0%) | 0 (0.0%) |
| Law Enforcement | 2 (50.0%) | 2 (50.0%) |
| Food Preparation & Serving | 0 (0.0%) | 8 (100.0%) |
| Cleaning & Maintenance | 12 (52.2%) | 11 (47.8%) |
| Personal Care & Service | 0 (0.0%) | 0 (0.0%) |
| Total (Category) | 14 (35.9%) | 25 (64.1%) |
| Total (Overall) | 170 (48.4%) | 181 (51.6%) |
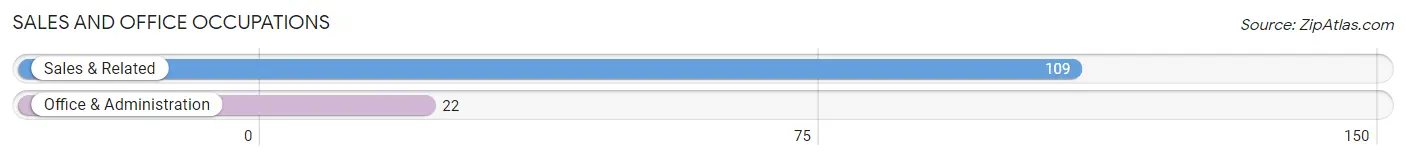
Sales and Office Occupations
The most common Sales and Office occupations in Greers Ferry are Sales & Related (109 | 31.0%), and Office & Administration (22 | 6.3%).
Sales and Office Occupations by Sex
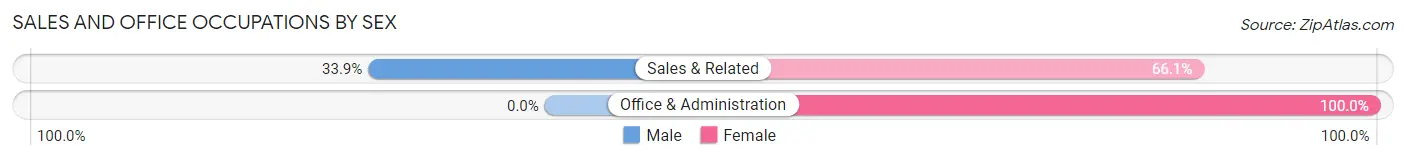
| Occupation | Male | Female |
| Sales & Related | 37 (33.9%) | 72 (66.1%) |
| Office & Administration | 0 (0.0%) | 22 (100.0%) |
| Total (Category) | 37 (28.2%) | 94 (71.8%) |
| Total (Overall) | 170 (48.4%) | 181 (51.6%) |
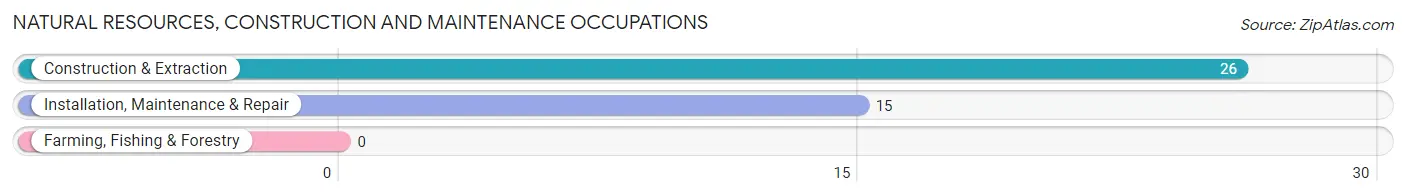
Natural Resources, Construction and Maintenance Occupations
The most common Natural Resources, Construction and Maintenance occupations in Greers Ferry are Construction & Extraction (26 | 7.4%), and Installation, Maintenance & Repair (15 | 4.3%).
Natural Resources, Construction and Maintenance Occupations by Sex
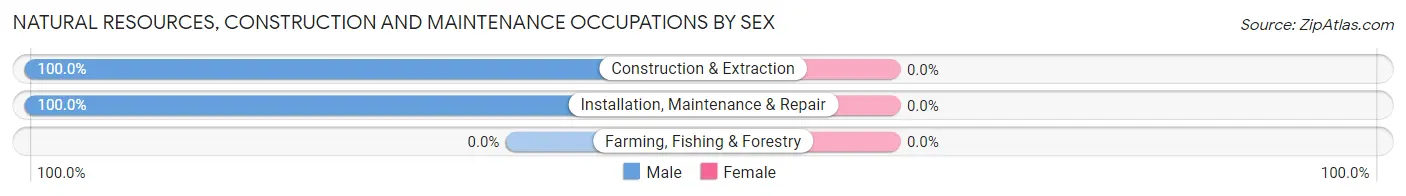
| Occupation | Male | Female |
| Farming, Fishing & Forestry | 0 (0.0%) | 0 (0.0%) |
| Construction & Extraction | 26 (100.0%) | 0 (0.0%) |
| Installation, Maintenance & Repair | 15 (100.0%) | 0 (0.0%) |
| Total (Category) | 41 (100.0%) | 0 (0.0%) |
| Total (Overall) | 170 (48.4%) | 181 (51.6%) |
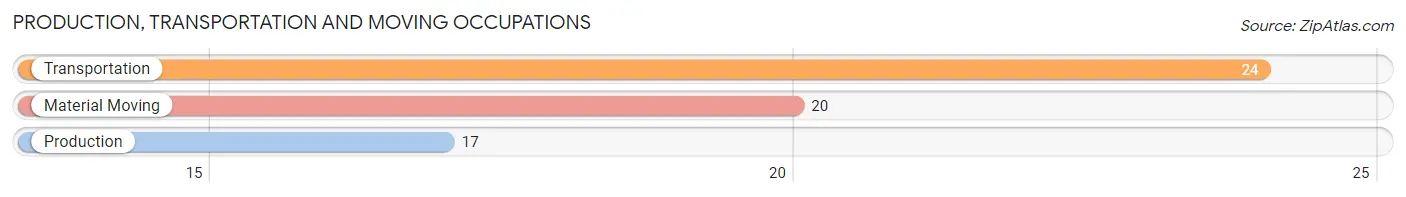
Production, Transportation and Moving Occupations
The most common Production, Transportation and Moving occupations in Greers Ferry are Transportation (24 | 6.8%), Material Moving (20 | 5.7%), and Production (17 | 4.8%).
Production, Transportation and Moving Occupations by Sex
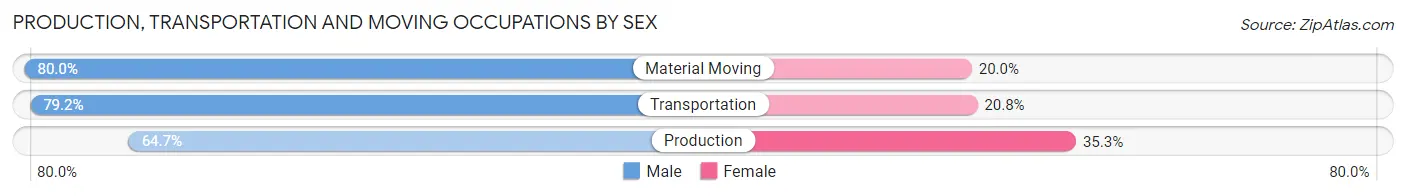
| Occupation | Male | Female |
| Production | 11 (64.7%) | 6 (35.3%) |
| Transportation | 19 (79.2%) | 5 (20.8%) |
| Material Moving | 16 (80.0%) | 4 (20.0%) |
| Total (Category) | 46 (75.4%) | 15 (24.6%) |
| Total (Overall) | 170 (48.4%) | 181 (51.6%) |
Employment Industries by Sex in Greers Ferry
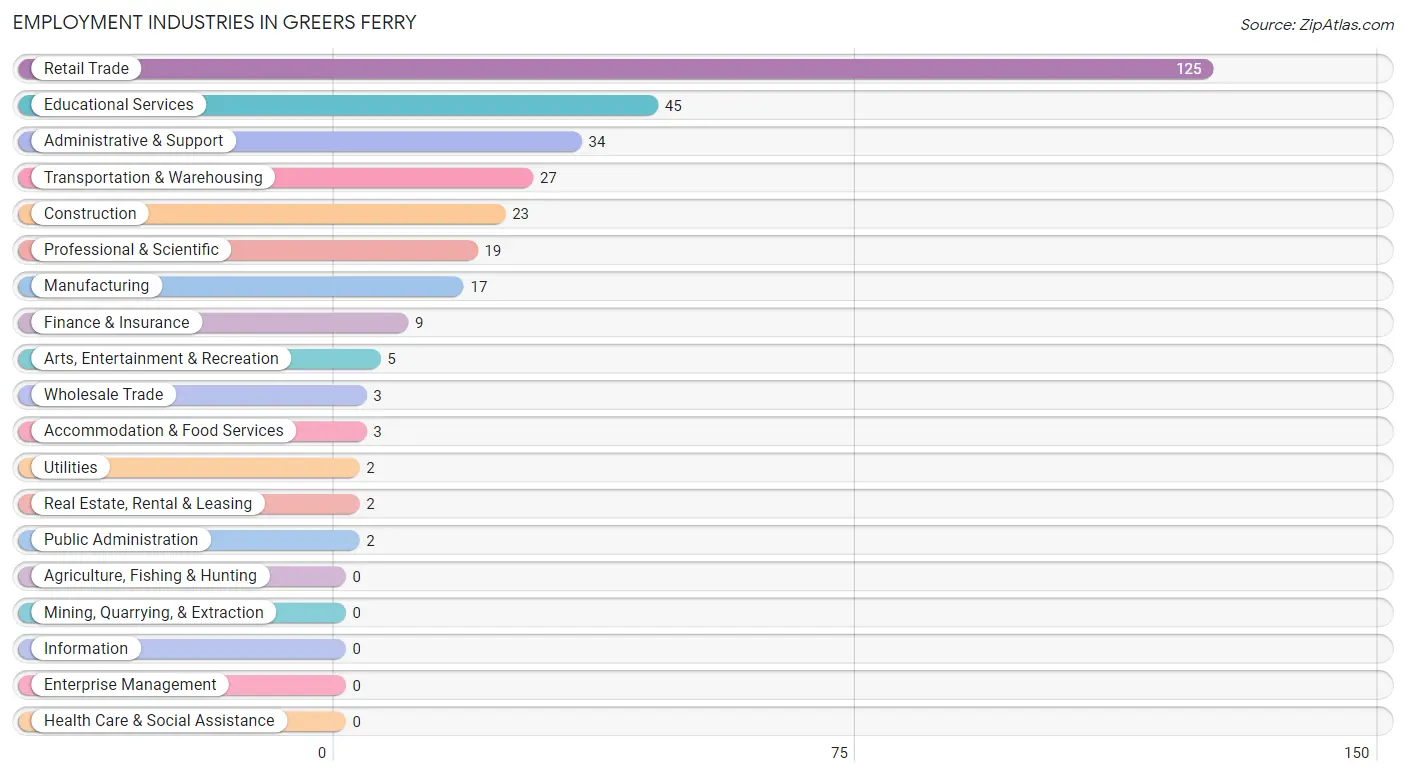
Employment Industries in Greers Ferry
The major employment industries in Greers Ferry include Retail Trade (125 | 35.6%), Educational Services (45 | 12.8%), Administrative & Support (34 | 9.7%), Transportation & Warehousing (27 | 7.7%), and Construction (23 | 6.6%).
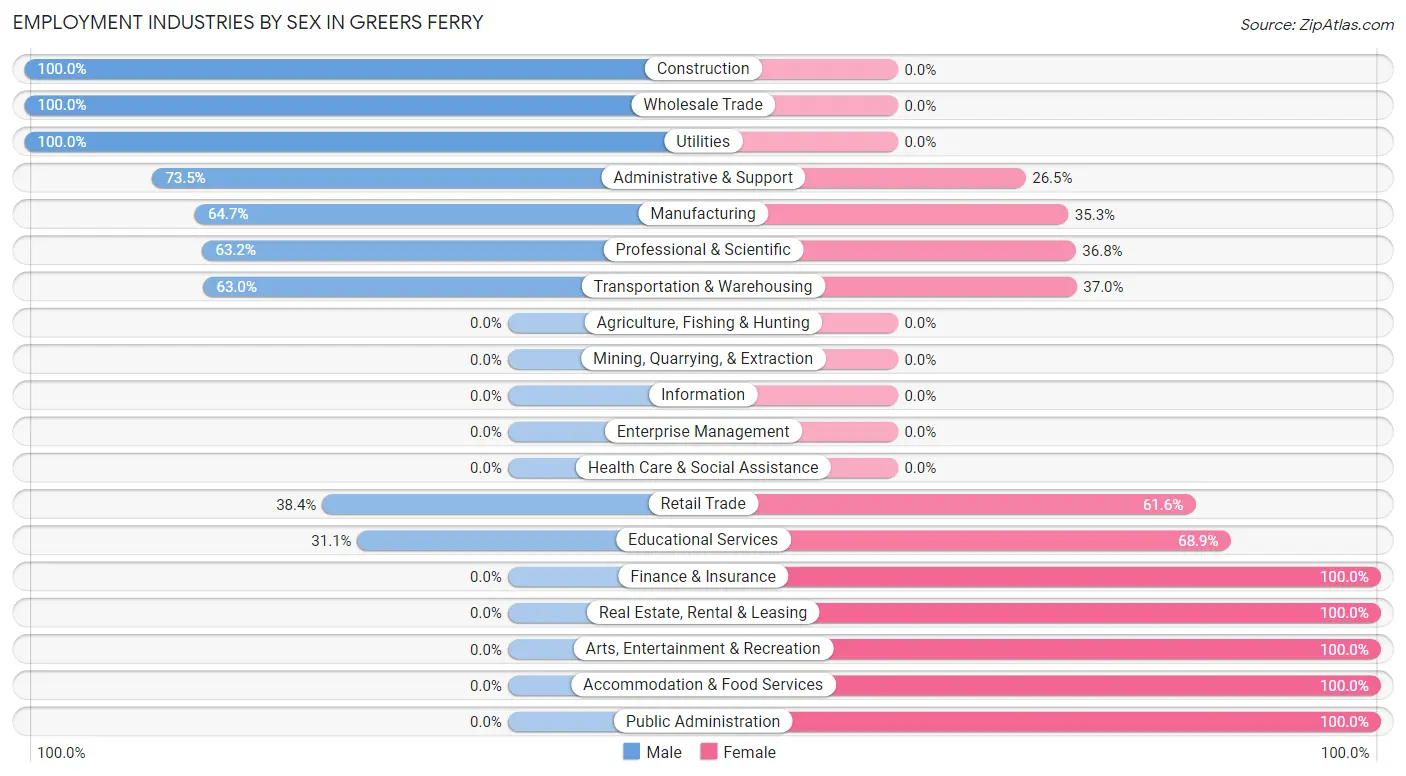
Employment Industries by Sex in Greers Ferry
The Greers Ferry industries that see more men than women are Construction (100.0%), Wholesale Trade (100.0%), and Utilities (100.0%), whereas the industries that tend to have a higher number of women are Finance & Insurance (100.0%), Real Estate, Rental & Leasing (100.0%), and Arts, Entertainment & Recreation (100.0%).
| Industry | Male | Female |
| Agriculture, Fishing & Hunting | 0 (0.0%) | 0 (0.0%) |
| Mining, Quarrying, & Extraction | 0 (0.0%) | 0 (0.0%) |
| Construction | 23 (100.0%) | 0 (0.0%) |
| Manufacturing | 11 (64.7%) | 6 (35.3%) |
| Wholesale Trade | 3 (100.0%) | 0 (0.0%) |
| Retail Trade | 48 (38.4%) | 77 (61.6%) |
| Transportation & Warehousing | 17 (63.0%) | 10 (37.0%) |
| Utilities | 2 (100.0%) | 0 (0.0%) |
| Information | 0 (0.0%) | 0 (0.0%) |
| Finance & Insurance | 0 (0.0%) | 9 (100.0%) |
| Real Estate, Rental & Leasing | 0 (0.0%) | 2 (100.0%) |
| Professional & Scientific | 12 (63.2%) | 7 (36.8%) |
| Enterprise Management | 0 (0.0%) | 0 (0.0%) |
| Administrative & Support | 25 (73.5%) | 9 (26.5%) |
| Educational Services | 14 (31.1%) | 31 (68.9%) |
| Health Care & Social Assistance | 0 (0.0%) | 0 (0.0%) |
| Arts, Entertainment & Recreation | 0 (0.0%) | 5 (100.0%) |
| Accommodation & Food Services | 0 (0.0%) | 3 (100.0%) |
| Public Administration | 0 (0.0%) | 2 (100.0%) |
| Total | 170 (48.4%) | 181 (51.6%) |
Education in Greers Ferry
School Enrollment in Greers Ferry
The most common levels of schooling among the 147 students in Greers Ferry are elementary school (48 | 32.7%), middle school (31 | 21.1%), and high school (22 | 15.0%).
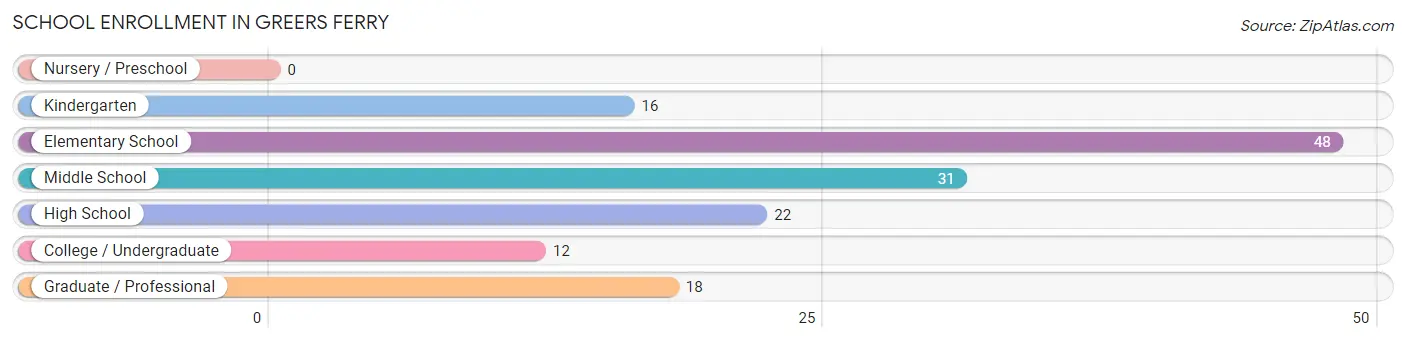
| School Level | # Students | % Students |
| Nursery / Preschool | 0 | 0.0% |
| Kindergarten | 16 | 10.9% |
| Elementary School | 48 | 32.7% |
| Middle School | 31 | 21.1% |
| High School | 22 | 15.0% |
| College / Undergraduate | 12 | 8.2% |
| Graduate / Professional | 18 | 12.2% |
| Total | 147 | 100.0% |
School Enrollment by Age by Funding Source in Greers Ferry
Out of a total of 147 students who are enrolled in schools in Greers Ferry, 15 (10.2%) attend a private institution, while the remaining 132 (89.8%) are enrolled in public schools. The age group of 15 to 17 year olds has the highest likelihood of being enrolled in private schools, with 4 (18.2% in the age bracket) enrolled. Conversely, the age group of 5 to 9 year old has the lowest likelihood of being enrolled in a private school, with 47 (94.0% in the age bracket) attending a public institution.
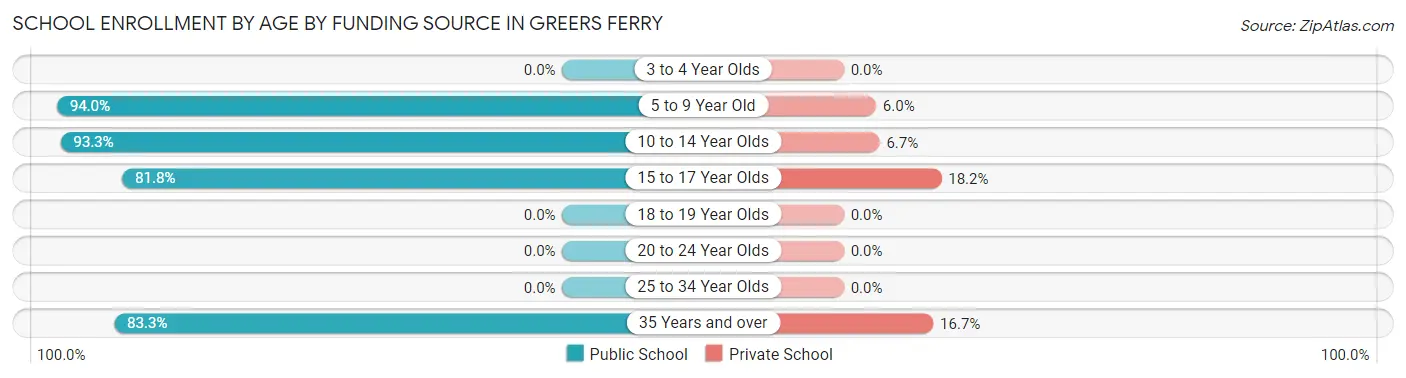
| Age Bracket | Public School | Private School |
| 3 to 4 Year Olds | 0 (0.0%) | 0 (0.0%) |
| 5 to 9 Year Old | 47 (94.0%) | 3 (6.0%) |
| 10 to 14 Year Olds | 42 (93.3%) | 3 (6.7%) |
| 15 to 17 Year Olds | 18 (81.8%) | 4 (18.2%) |
| 18 to 19 Year Olds | 0 (0.0%) | 0 (0.0%) |
| 20 to 24 Year Olds | 0 (0.0%) | 0 (0.0%) |
| 25 to 34 Year Olds | 0 (0.0%) | 0 (0.0%) |
| 35 Years and over | 25 (83.3%) | 5 (16.7%) |
| Total | 132 (89.8%) | 15 (10.2%) |
Educational Attainment by Field of Study in Greers Ferry
Education (49 | 32.7%), computers & mathematics (17 | 11.3%), business (14 | 9.3%), liberal arts & history (14 | 9.3%), and physical & health sciences (13 | 8.7%) are the most common fields of study among 150 individuals in Greers Ferry who have obtained a bachelor's degree or higher.
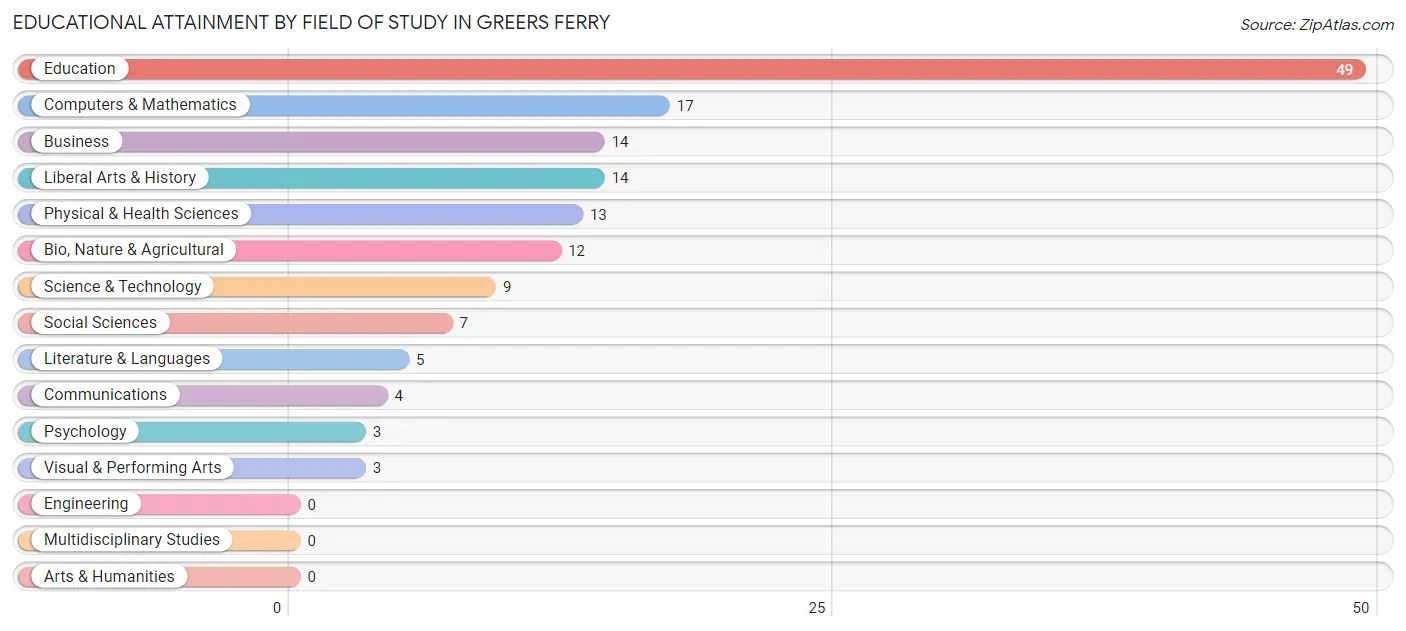
| Field of Study | # Graduates | % Graduates |
| Computers & Mathematics | 17 | 11.3% |
| Bio, Nature & Agricultural | 12 | 8.0% |
| Physical & Health Sciences | 13 | 8.7% |
| Psychology | 3 | 2.0% |
| Social Sciences | 7 | 4.7% |
| Engineering | 0 | 0.0% |
| Multidisciplinary Studies | 0 | 0.0% |
| Science & Technology | 9 | 6.0% |
| Business | 14 | 9.3% |
| Education | 49 | 32.7% |
| Literature & Languages | 5 | 3.3% |
| Liberal Arts & History | 14 | 9.3% |
| Visual & Performing Arts | 3 | 2.0% |
| Communications | 4 | 2.7% |
| Arts & Humanities | 0 | 0.0% |
| Total | 150 | 100.0% |
Transportation & Commute in Greers Ferry
Vehicle Availability by Sex in Greers Ferry
The most prevalent vehicle ownership categories in Greers Ferry are males with 3 vehicles (48, accounting for 28.2%) and females with 3 vehicles (64, making up 29.1%).
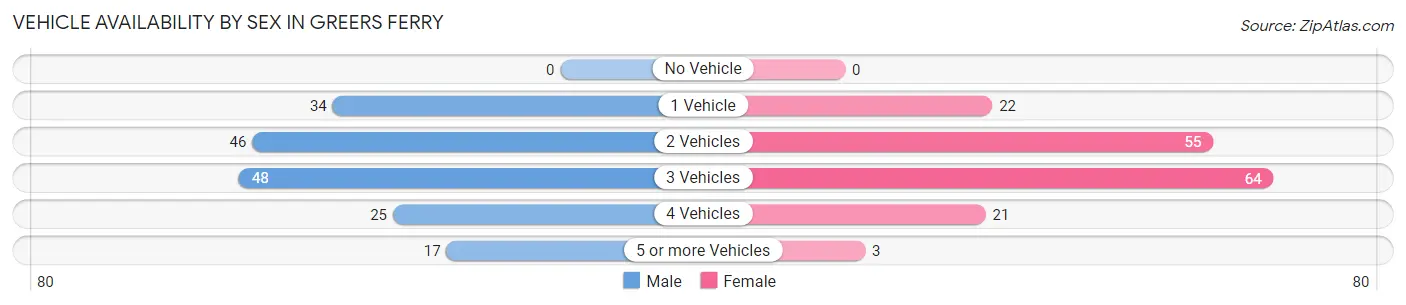
| Vehicles Available | Male | Female |
| No Vehicle | 0 (0.0%) | 0 (0.0%) |
| 1 Vehicle | 34 (20.0%) | 22 (13.3%) |
| 2 Vehicles | 46 (27.1%) | 55 (33.3%) |
| 3 Vehicles | 48 (28.2%) | 64 (38.8%) |
| 4 Vehicles | 25 (14.7%) | 21 (12.7%) |
| 5 or more Vehicles | 17 (10.0%) | 3 (1.8%) |
| Total | 170 (100.0%) | 165 (100.0%) |
Commute Time in Greers Ferry
The most frequently occuring commute durations in Greers Ferry are 5 to 9 minutes (106 commuters, 39.3%), 30 to 34 minutes (37 commuters, 13.7%), and 10 to 14 minutes (35 commuters, 13.0%).
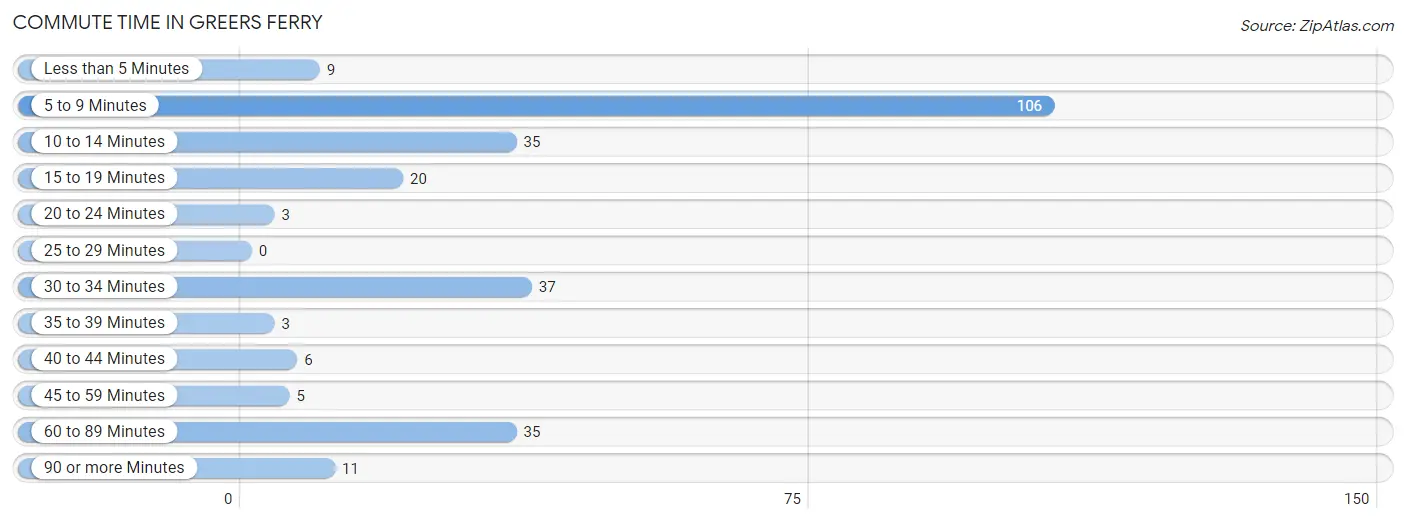
| Commute Time | # Commuters | % Commuters |
| Less than 5 Minutes | 9 | 3.3% |
| 5 to 9 Minutes | 106 | 39.3% |
| 10 to 14 Minutes | 35 | 13.0% |
| 15 to 19 Minutes | 20 | 7.4% |
| 20 to 24 Minutes | 3 | 1.1% |
| 25 to 29 Minutes | 0 | 0.0% |
| 30 to 34 Minutes | 37 | 13.7% |
| 35 to 39 Minutes | 3 | 1.1% |
| 40 to 44 Minutes | 6 | 2.2% |
| 45 to 59 Minutes | 5 | 1.8% |
| 60 to 89 Minutes | 35 | 13.0% |
| 90 or more Minutes | 11 | 4.1% |
Commute Time by Sex in Greers Ferry
The most common commute times in Greers Ferry are 5 to 9 minutes (45 commuters, 34.1%) for males and 5 to 9 minutes (61 commuters, 44.2%) for females.
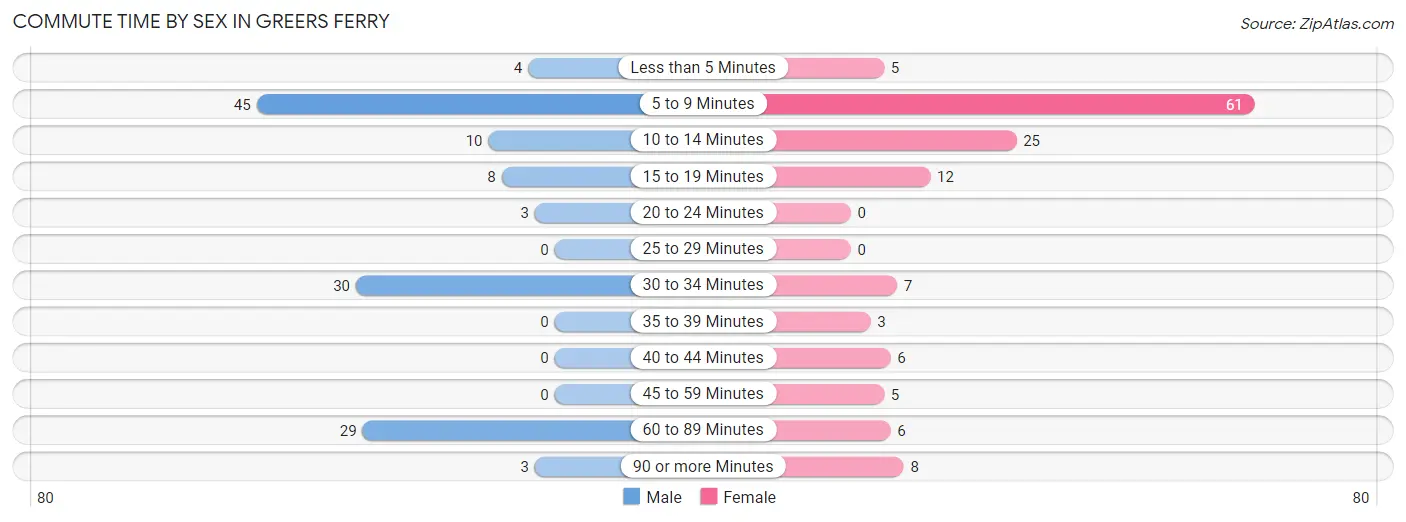
| Commute Time | Male | Female |
| Less than 5 Minutes | 4 (3.0%) | 5 (3.6%) |
| 5 to 9 Minutes | 45 (34.1%) | 61 (44.2%) |
| 10 to 14 Minutes | 10 (7.6%) | 25 (18.1%) |
| 15 to 19 Minutes | 8 (6.1%) | 12 (8.7%) |
| 20 to 24 Minutes | 3 (2.3%) | 0 (0.0%) |
| 25 to 29 Minutes | 0 (0.0%) | 0 (0.0%) |
| 30 to 34 Minutes | 30 (22.7%) | 7 (5.1%) |
| 35 to 39 Minutes | 0 (0.0%) | 3 (2.2%) |
| 40 to 44 Minutes | 0 (0.0%) | 6 (4.3%) |
| 45 to 59 Minutes | 0 (0.0%) | 5 (3.6%) |
| 60 to 89 Minutes | 29 (22.0%) | 6 (4.3%) |
| 90 or more Minutes | 3 (2.3%) | 8 (5.8%) |
Time of Departure to Work by Sex in Greers Ferry
The most frequent times of departure to work in Greers Ferry are 6:30 AM to 6:59 AM (28, 21.2%) for males and 8:00 AM to 8:29 AM (42, 30.4%) for females.
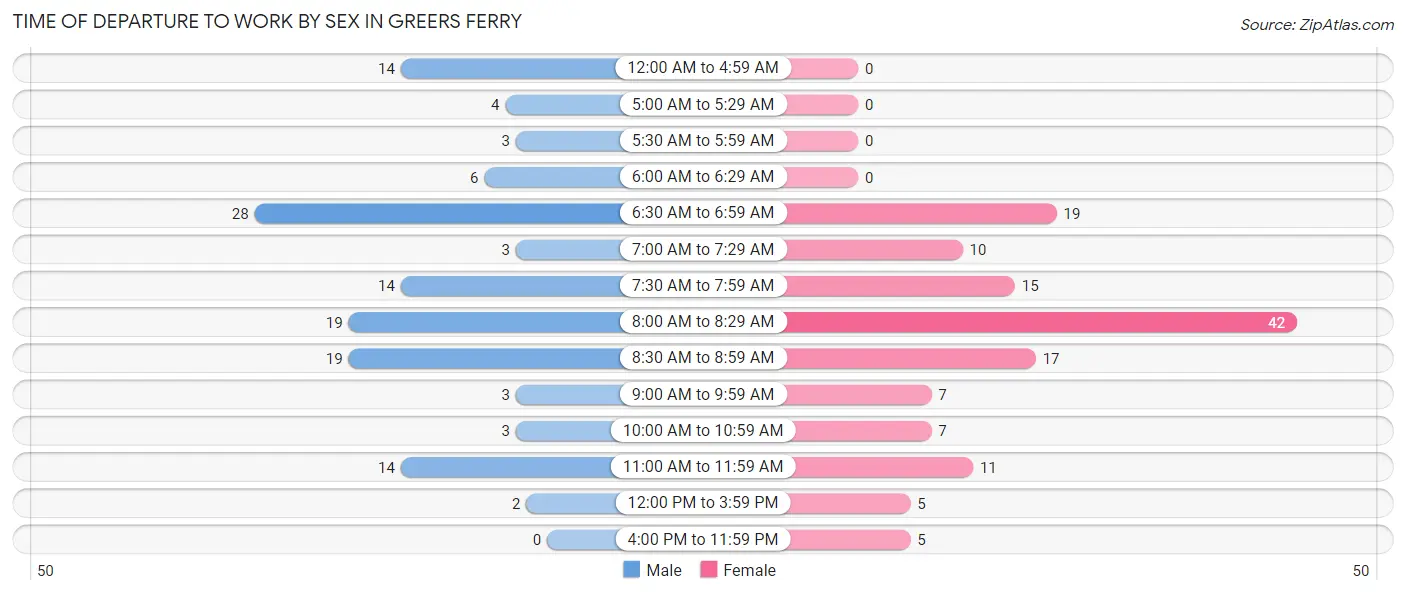
| Time of Departure | Male | Female |
| 12:00 AM to 4:59 AM | 14 (10.6%) | 0 (0.0%) |
| 5:00 AM to 5:29 AM | 4 (3.0%) | 0 (0.0%) |
| 5:30 AM to 5:59 AM | 3 (2.3%) | 0 (0.0%) |
| 6:00 AM to 6:29 AM | 6 (4.5%) | 0 (0.0%) |
| 6:30 AM to 6:59 AM | 28 (21.2%) | 19 (13.8%) |
| 7:00 AM to 7:29 AM | 3 (2.3%) | 10 (7.2%) |
| 7:30 AM to 7:59 AM | 14 (10.6%) | 15 (10.9%) |
| 8:00 AM to 8:29 AM | 19 (14.4%) | 42 (30.4%) |
| 8:30 AM to 8:59 AM | 19 (14.4%) | 17 (12.3%) |
| 9:00 AM to 9:59 AM | 3 (2.3%) | 7 (5.1%) |
| 10:00 AM to 10:59 AM | 3 (2.3%) | 7 (5.1%) |
| 11:00 AM to 11:59 AM | 14 (10.6%) | 11 (8.0%) |
| 12:00 PM to 3:59 PM | 2 (1.5%) | 5 (3.6%) |
| 4:00 PM to 11:59 PM | 0 (0.0%) | 5 (3.6%) |
| Total | 132 (100.0%) | 138 (100.0%) |
Housing Occupancy in Greers Ferry
Occupancy by Ownership in Greers Ferry
Of the total 411 dwellings in Greers Ferry, owner-occupied units account for 290 (70.6%), while renter-occupied units make up 121 (29.4%).
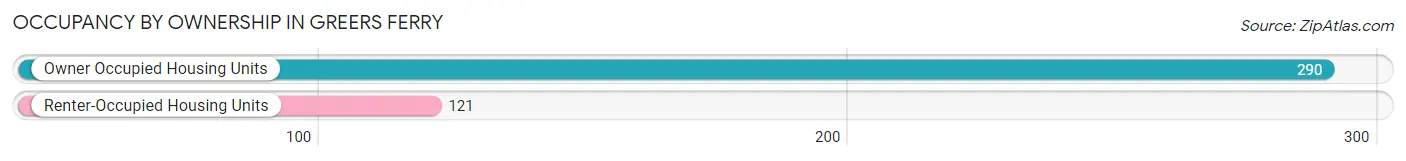
| Occupancy | # Housing Units | % Housing Units |
| Owner Occupied Housing Units | 290 | 70.6% |
| Renter-Occupied Housing Units | 121 | 29.4% |
| Total Occupied Housing Units | 411 | 100.0% |
Occupancy by Household Size in Greers Ferry
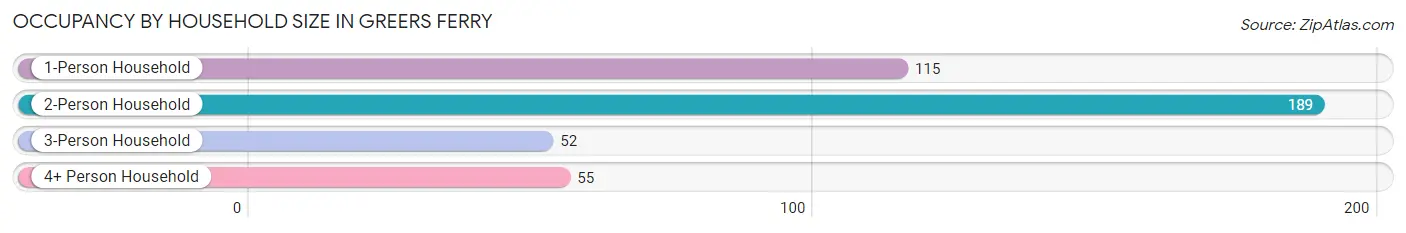
| Household Size | # Housing Units | % Housing Units |
| 1-Person Household | 115 | 28.0% |
| 2-Person Household | 189 | 46.0% |
| 3-Person Household | 52 | 12.7% |
| 4+ Person Household | 55 | 13.4% |
| Total Housing Units | 411 | 100.0% |
Occupancy by Ownership by Household Size in Greers Ferry
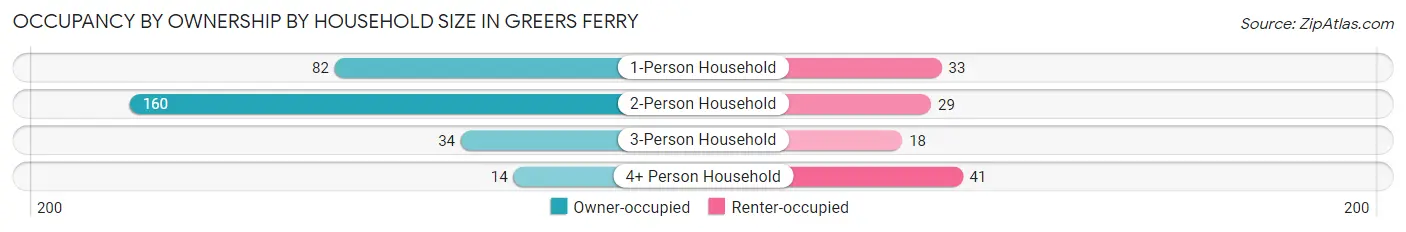
| Household Size | Owner-occupied | Renter-occupied |
| 1-Person Household | 82 (71.3%) | 33 (28.7%) |
| 2-Person Household | 160 (84.7%) | 29 (15.3%) |
| 3-Person Household | 34 (65.4%) | 18 (34.6%) |
| 4+ Person Household | 14 (25.5%) | 41 (74.6%) |
| Total Housing Units | 290 (70.6%) | 121 (29.4%) |
Occupancy by Educational Attainment in Greers Ferry
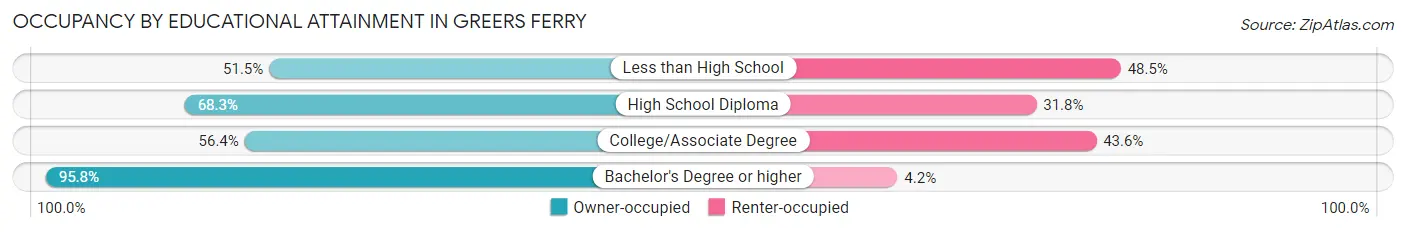
| Household Size | Owner-occupied | Renter-occupied |
| Less than High School | 17 (51.5%) | 16 (48.5%) |
| High School Diploma | 129 (68.2%) | 60 (31.8%) |
| College/Associate Degree | 53 (56.4%) | 41 (43.6%) |
| Bachelor's Degree or higher | 91 (95.8%) | 4 (4.2%) |
Occupancy by Age of Householder in Greers Ferry
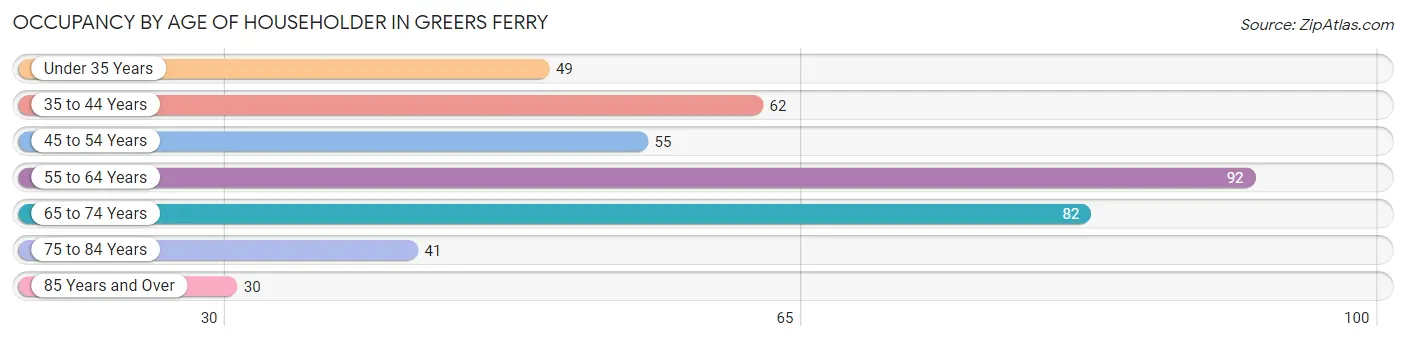
| Age Bracket | # Households | % Households |
| Under 35 Years | 49 | 11.9% |
| 35 to 44 Years | 62 | 15.1% |
| 45 to 54 Years | 55 | 13.4% |
| 55 to 64 Years | 92 | 22.4% |
| 65 to 74 Years | 82 | 20.0% |
| 75 to 84 Years | 41 | 10.0% |
| 85 Years and Over | 30 | 7.3% |
| Total | 411 | 100.0% |
Housing Finances in Greers Ferry
Median Income by Occupancy in Greers Ferry
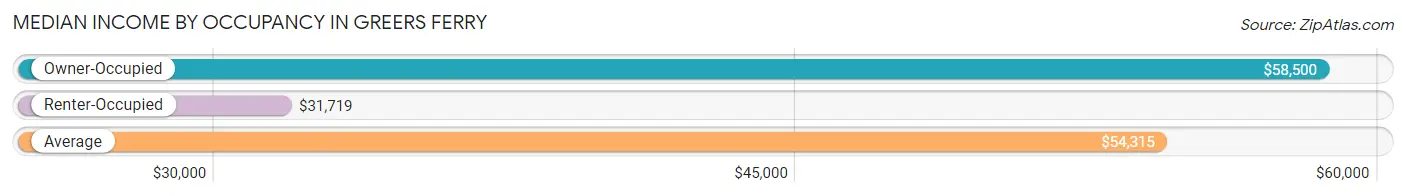
| Occupancy Type | # Households | Median Income |
| Owner-Occupied | 290 (70.6%) | $58,500 |
| Renter-Occupied | 121 (29.4%) | $31,719 |
| Average | 411 (100.0%) | $54,315 |
Occupancy by Householder Income Bracket in Greers Ferry
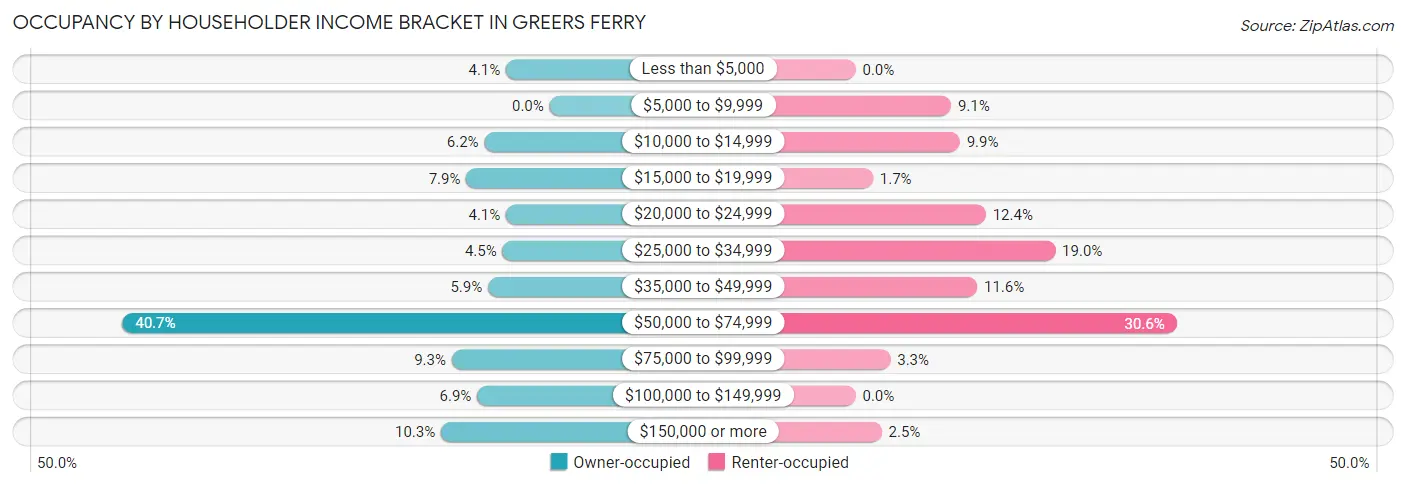
| Income Bracket | Owner-occupied | Renter-occupied |
| Less than $5,000 | 12 (4.1%) | 0 (0.0%) |
| $5,000 to $9,999 | 0 (0.0%) | 11 (9.1%) |
| $10,000 to $14,999 | 18 (6.2%) | 12 (9.9%) |
| $15,000 to $19,999 | 23 (7.9%) | 2 (1.7%) |
| $20,000 to $24,999 | 12 (4.1%) | 15 (12.4%) |
| $25,000 to $34,999 | 13 (4.5%) | 23 (19.0%) |
| $35,000 to $49,999 | 17 (5.9%) | 14 (11.6%) |
| $50,000 to $74,999 | 118 (40.7%) | 37 (30.6%) |
| $75,000 to $99,999 | 27 (9.3%) | 4 (3.3%) |
| $100,000 to $149,999 | 20 (6.9%) | 0 (0.0%) |
| $150,000 or more | 30 (10.3%) | 3 (2.5%) |
| Total | 290 (100.0%) | 121 (100.0%) |
Monthly Housing Cost Tiers in Greers Ferry
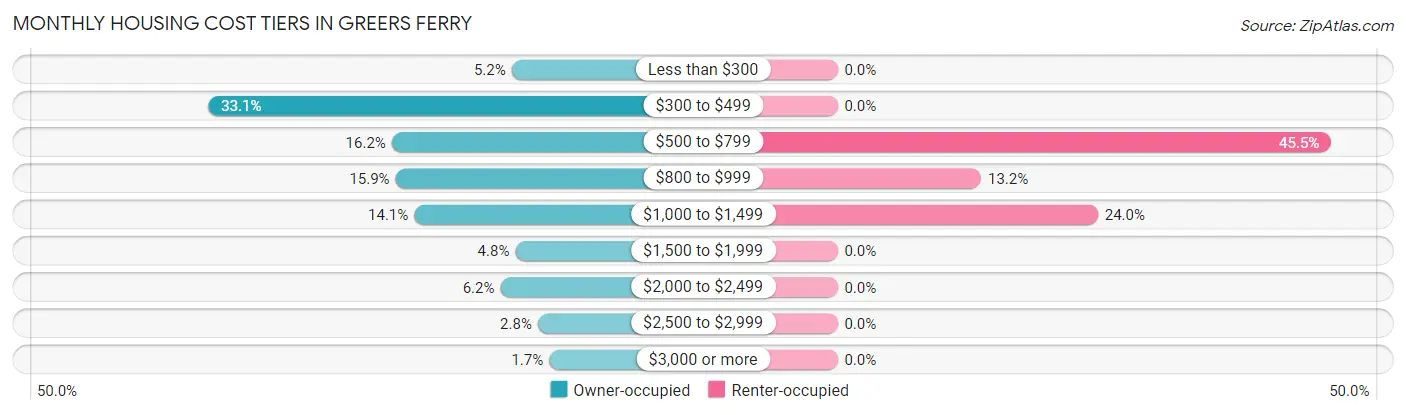
| Monthly Cost | Owner-occupied | Renter-occupied |
| Less than $300 | 15 (5.2%) | 0 (0.0%) |
| $300 to $499 | 96 (33.1%) | 0 (0.0%) |
| $500 to $799 | 47 (16.2%) | 55 (45.5%) |
| $800 to $999 | 46 (15.9%) | 16 (13.2%) |
| $1,000 to $1,499 | 41 (14.1%) | 29 (24.0%) |
| $1,500 to $1,999 | 14 (4.8%) | 0 (0.0%) |
| $2,000 to $2,499 | 18 (6.2%) | 0 (0.0%) |
| $2,500 to $2,999 | 8 (2.8%) | 0 (0.0%) |
| $3,000 or more | 5 (1.7%) | 0 (0.0%) |
| Total | 290 (100.0%) | 121 (100.0%) |
Physical Housing Characteristics in Greers Ferry
Housing Structures in Greers Ferry
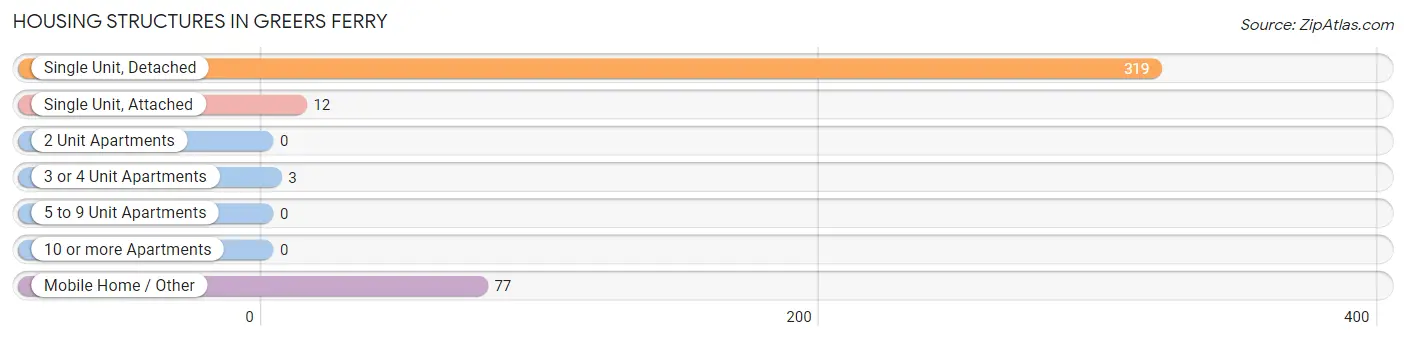
| Structure Type | # Housing Units | % Housing Units |
| Single Unit, Detached | 319 | 77.6% |
| Single Unit, Attached | 12 | 2.9% |
| 2 Unit Apartments | 0 | 0.0% |
| 3 or 4 Unit Apartments | 3 | 0.7% |
| 5 to 9 Unit Apartments | 0 | 0.0% |
| 10 or more Apartments | 0 | 0.0% |
| Mobile Home / Other | 77 | 18.7% |
| Total | 411 | 100.0% |
Housing Structures by Occupancy in Greers Ferry
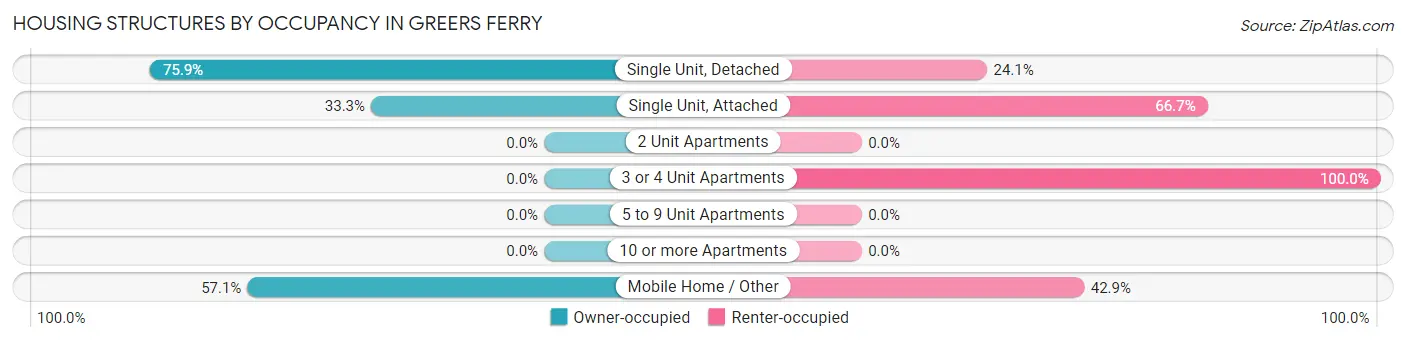
| Structure Type | Owner-occupied | Renter-occupied |
| Single Unit, Detached | 242 (75.9%) | 77 (24.1%) |
| Single Unit, Attached | 4 (33.3%) | 8 (66.7%) |
| 2 Unit Apartments | 0 (0.0%) | 0 (0.0%) |
| 3 or 4 Unit Apartments | 0 (0.0%) | 3 (100.0%) |
| 5 to 9 Unit Apartments | 0 (0.0%) | 0 (0.0%) |
| 10 or more Apartments | 0 (0.0%) | 0 (0.0%) |
| Mobile Home / Other | 44 (57.1%) | 33 (42.9%) |
| Total | 290 (70.6%) | 121 (29.4%) |
Housing Structures by Number of Rooms in Greers Ferry
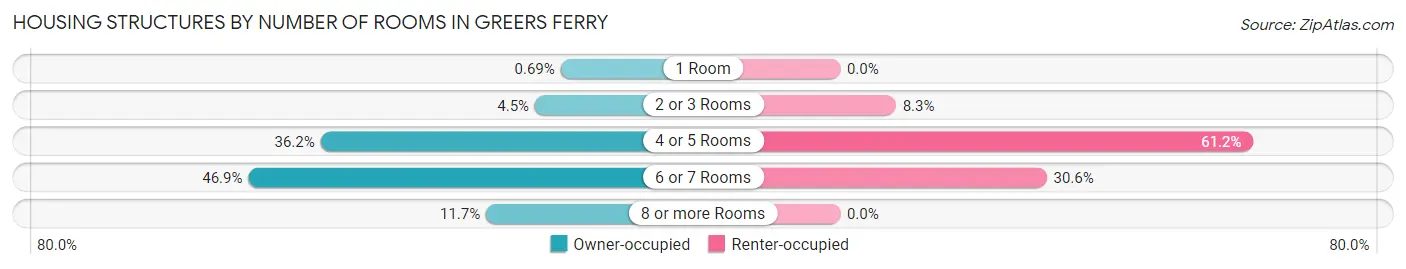
| Number of Rooms | Owner-occupied | Renter-occupied |
| 1 Room | 2 (0.7%) | 0 (0.0%) |
| 2 or 3 Rooms | 13 (4.5%) | 10 (8.3%) |
| 4 or 5 Rooms | 105 (36.2%) | 74 (61.2%) |
| 6 or 7 Rooms | 136 (46.9%) | 37 (30.6%) |
| 8 or more Rooms | 34 (11.7%) | 0 (0.0%) |
| Total | 290 (100.0%) | 121 (100.0%) |
Housing Structure by Heating Type in Greers Ferry
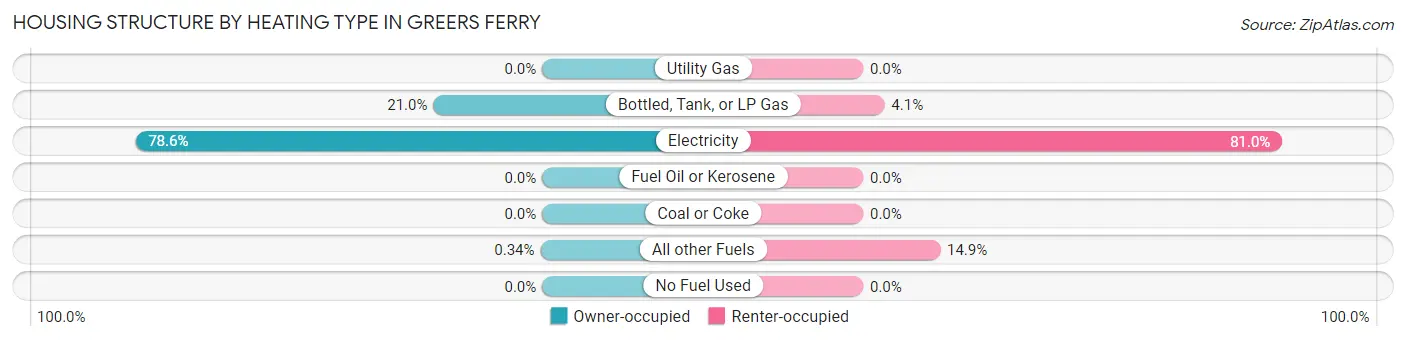
| Heating Type | Owner-occupied | Renter-occupied |
| Utility Gas | 0 (0.0%) | 0 (0.0%) |
| Bottled, Tank, or LP Gas | 61 (21.0%) | 5 (4.1%) |
| Electricity | 228 (78.6%) | 98 (81.0%) |
| Fuel Oil or Kerosene | 0 (0.0%) | 0 (0.0%) |
| Coal or Coke | 0 (0.0%) | 0 (0.0%) |
| All other Fuels | 1 (0.3%) | 18 (14.9%) |
| No Fuel Used | 0 (0.0%) | 0 (0.0%) |
| Total | 290 (100.0%) | 121 (100.0%) |
Household Vehicle Usage in Greers Ferry
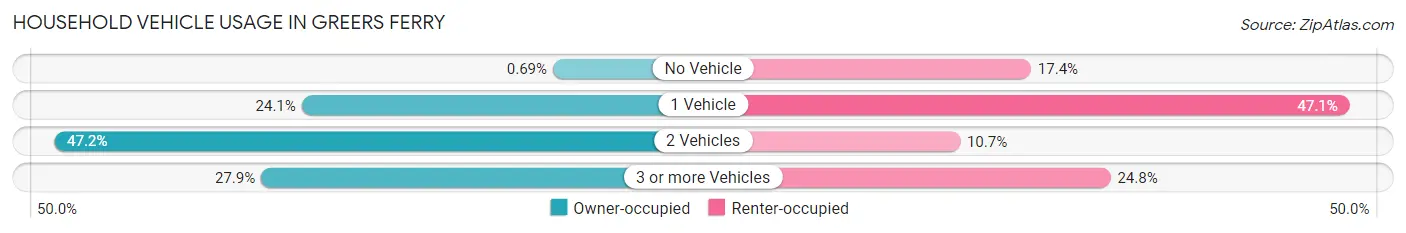
| Vehicles per Household | Owner-occupied | Renter-occupied |
| No Vehicle | 2 (0.7%) | 21 (17.4%) |
| 1 Vehicle | 70 (24.1%) | 57 (47.1%) |
| 2 Vehicles | 137 (47.2%) | 13 (10.7%) |
| 3 or more Vehicles | 81 (27.9%) | 30 (24.8%) |
| Total | 290 (100.0%) | 121 (100.0%) |
Real Estate & Mortgages in Greers Ferry
Real Estate and Mortgage Overview in Greers Ferry
| Characteristic | Without Mortgage | With Mortgage |
| Housing Units | 157 | 133 |
| Median Property Value | $167,700 | $189,100 |
| Median Household Income | $54,485 | $16 |
| Monthly Housing Costs | $443 | $5 |
| Real Estate Taxes | $986 | $28 |
Property Value by Mortgage Status in Greers Ferry
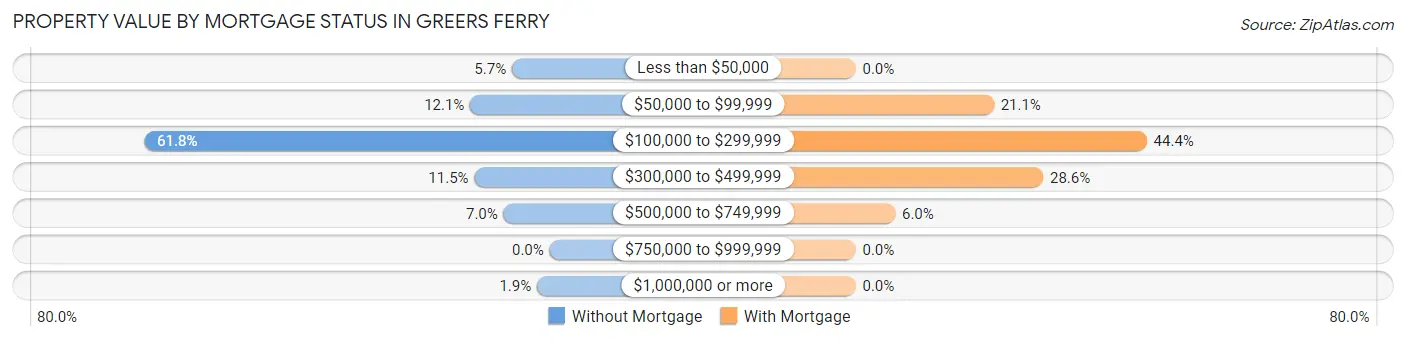
| Property Value | Without Mortgage | With Mortgage |
| Less than $50,000 | 9 (5.7%) | 0 (0.0%) |
| $50,000 to $99,999 | 19 (12.1%) | 28 (21.0%) |
| $100,000 to $299,999 | 97 (61.8%) | 59 (44.4%) |
| $300,000 to $499,999 | 18 (11.5%) | 38 (28.6%) |
| $500,000 to $749,999 | 11 (7.0%) | 8 (6.0%) |
| $750,000 to $999,999 | 0 (0.0%) | 0 (0.0%) |
| $1,000,000 or more | 3 (1.9%) | 0 (0.0%) |
| Total | 157 (100.0%) | 133 (100.0%) |
Household Income by Mortgage Status in Greers Ferry
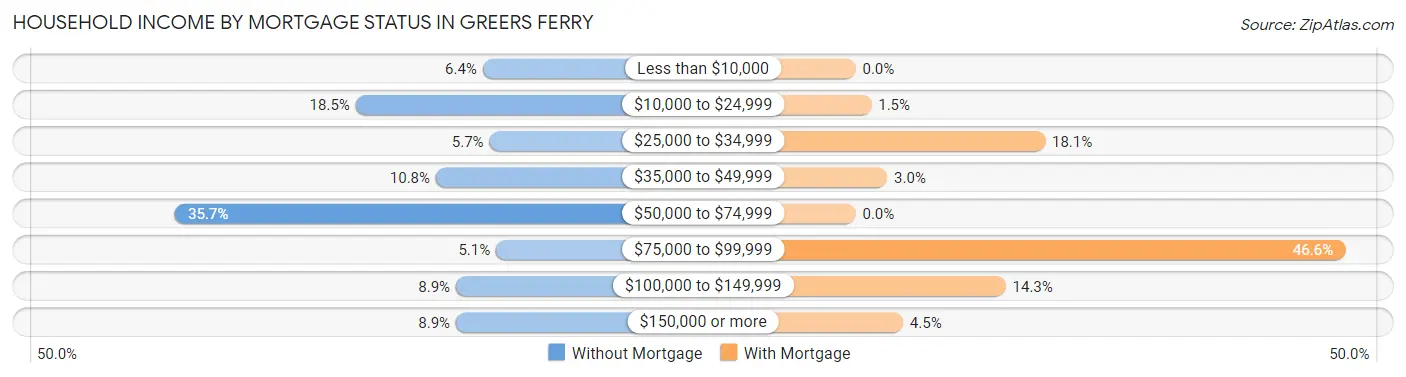
| Household Income | Without Mortgage | With Mortgage |
| Less than $10,000 | 10 (6.4%) | 0 (0.0%) |
| $10,000 to $24,999 | 29 (18.5%) | 2 (1.5%) |
| $25,000 to $34,999 | 9 (5.7%) | 24 (18.0%) |
| $35,000 to $49,999 | 17 (10.8%) | 4 (3.0%) |
| $50,000 to $74,999 | 56 (35.7%) | 0 (0.0%) |
| $75,000 to $99,999 | 8 (5.1%) | 62 (46.6%) |
| $100,000 to $149,999 | 14 (8.9%) | 19 (14.3%) |
| $150,000 or more | 14 (8.9%) | 6 (4.5%) |
| Total | 157 (100.0%) | 133 (100.0%) |
Property Value to Household Income Ratio in Greers Ferry
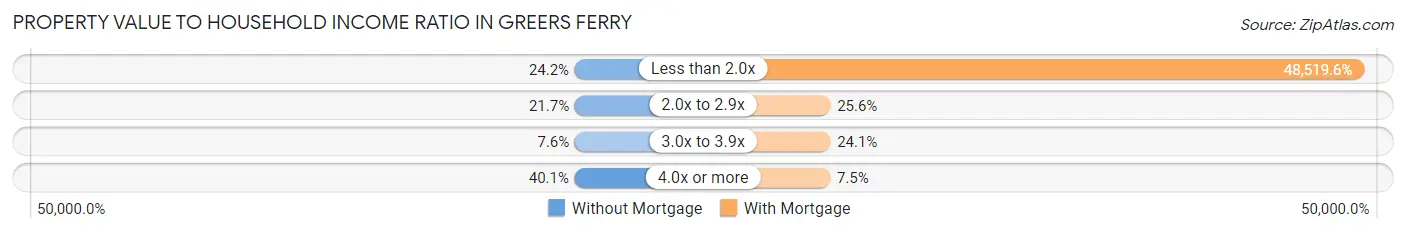
| Value-to-Income Ratio | Without Mortgage | With Mortgage |
| Less than 2.0x | 38 (24.2%) | 64,531 (48,519.5%) |
| 2.0x to 2.9x | 34 (21.7%) | 34 (25.6%) |
| 3.0x to 3.9x | 12 (7.6%) | 32 (24.1%) |
| 4.0x or more | 63 (40.1%) | 10 (7.5%) |
| Total | 157 (100.0%) | 133 (100.0%) |
Real Estate Taxes by Mortgage Status in Greers Ferry
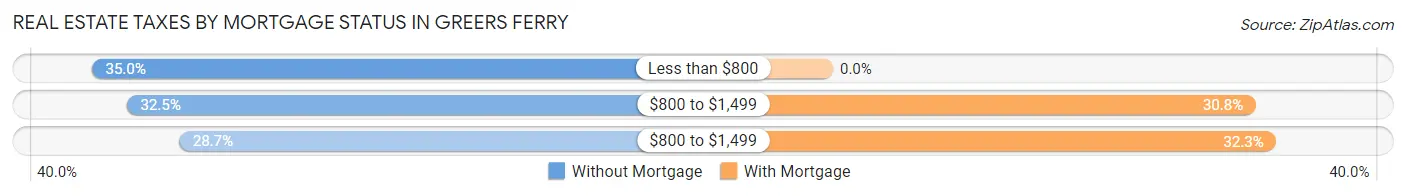
| Property Taxes | Without Mortgage | With Mortgage |
| Less than $800 | 55 (35.0%) | 0 (0.0%) |
| $800 to $1,499 | 51 (32.5%) | 41 (30.8%) |
| $800 to $1,499 | 45 (28.7%) | 43 (32.3%) |
| Total | 157 (100.0%) | 133 (100.0%) |
Health & Disability in Greers Ferry
Health Insurance Coverage by Age in Greers Ferry
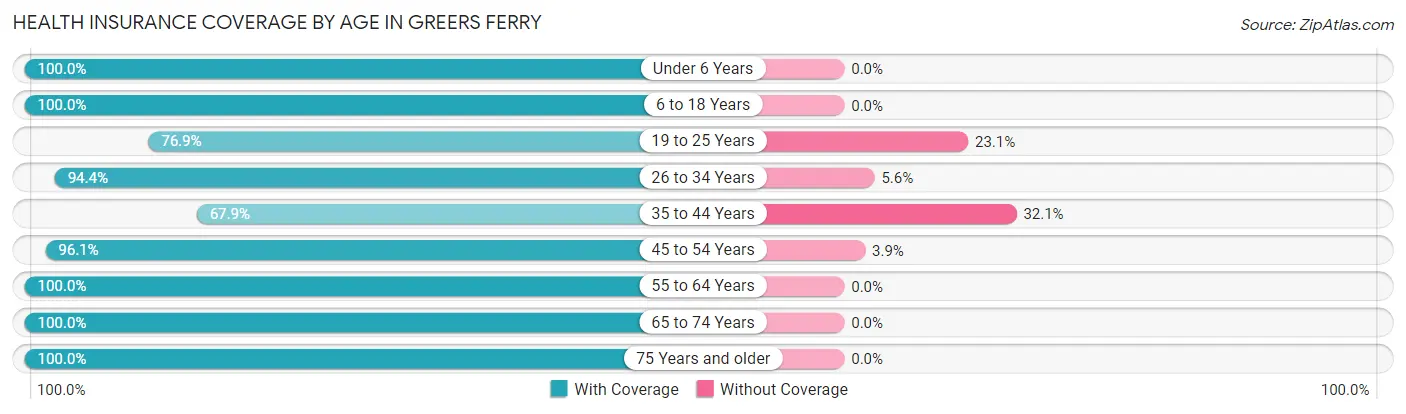
| Age Bracket | With Coverage | Without Coverage |
| Under 6 Years | 53 (100.0%) | 0 (0.0%) |
| 6 to 18 Years | 139 (100.0%) | 0 (0.0%) |
| 19 to 25 Years | 20 (76.9%) | 6 (23.1%) |
| 26 to 34 Years | 67 (94.4%) | 4 (5.6%) |
| 35 to 44 Years | 55 (67.9%) | 26 (32.1%) |
| 45 to 54 Years | 99 (96.1%) | 4 (3.9%) |
| 55 to 64 Years | 171 (100.0%) | 0 (0.0%) |
| 65 to 74 Years | 149 (100.0%) | 0 (0.0%) |
| 75 Years and older | 112 (100.0%) | 0 (0.0%) |
| Total | 865 (95.6%) | 40 (4.4%) |
Health Insurance Coverage by Citizenship Status in Greers Ferry
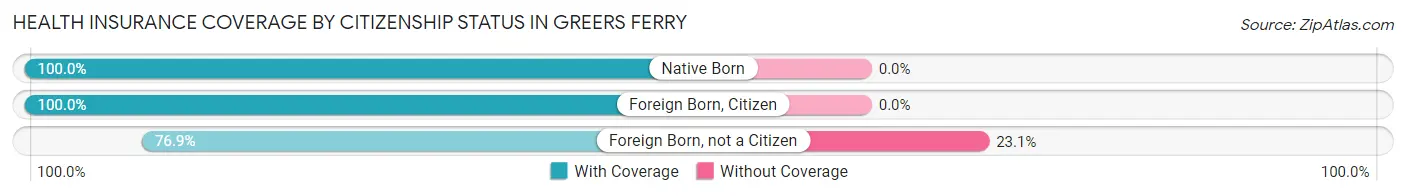
| Citizenship Status | With Coverage | Without Coverage |
| Native Born | 53 (100.0%) | 0 (0.0%) |
| Foreign Born, Citizen | 139 (100.0%) | 0 (0.0%) |
| Foreign Born, not a Citizen | 20 (76.9%) | 6 (23.1%) |
Health Insurance Coverage by Household Income in Greers Ferry
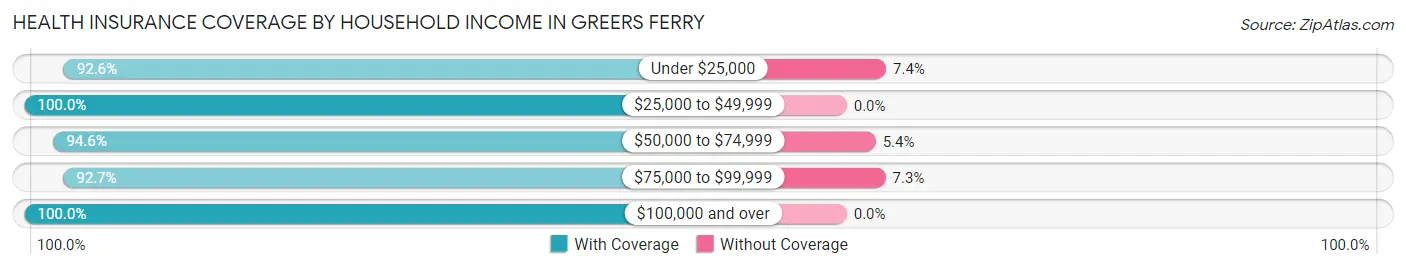
| Household Income | With Coverage | Without Coverage |
| Under $25,000 | 151 (92.6%) | 12 (7.4%) |
| $25,000 to $49,999 | 149 (100.0%) | 0 (0.0%) |
| $50,000 to $74,999 | 349 (94.6%) | 20 (5.4%) |
| $75,000 to $99,999 | 102 (92.7%) | 8 (7.3%) |
| $100,000 and over | 114 (100.0%) | 0 (0.0%) |
Public vs Private Health Insurance Coverage by Age in Greers Ferry
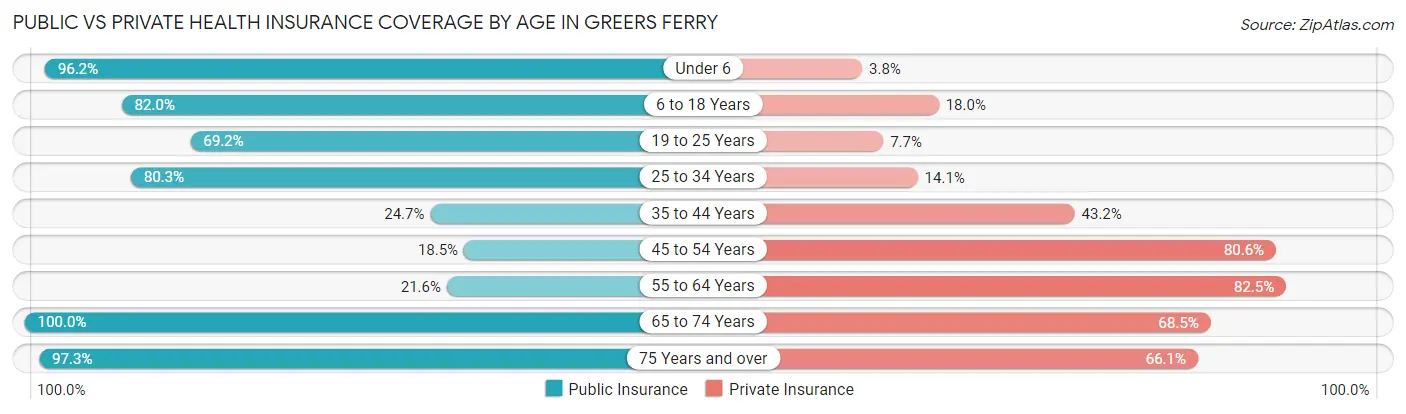
| Age Bracket | Public Insurance | Private Insurance |
| Under 6 | 51 (96.2%) | 2 (3.8%) |
| 6 to 18 Years | 114 (82.0%) | 25 (18.0%) |
| 19 to 25 Years | 18 (69.2%) | 2 (7.7%) |
| 25 to 34 Years | 57 (80.3%) | 10 (14.1%) |
| 35 to 44 Years | 20 (24.7%) | 35 (43.2%) |
| 45 to 54 Years | 19 (18.4%) | 83 (80.6%) |
| 55 to 64 Years | 37 (21.6%) | 141 (82.5%) |
| 65 to 74 Years | 149 (100.0%) | 102 (68.5%) |
| 75 Years and over | 109 (97.3%) | 74 (66.1%) |
| Total | 574 (63.4%) | 474 (52.4%) |
Disability Status by Sex by Age in Greers Ferry
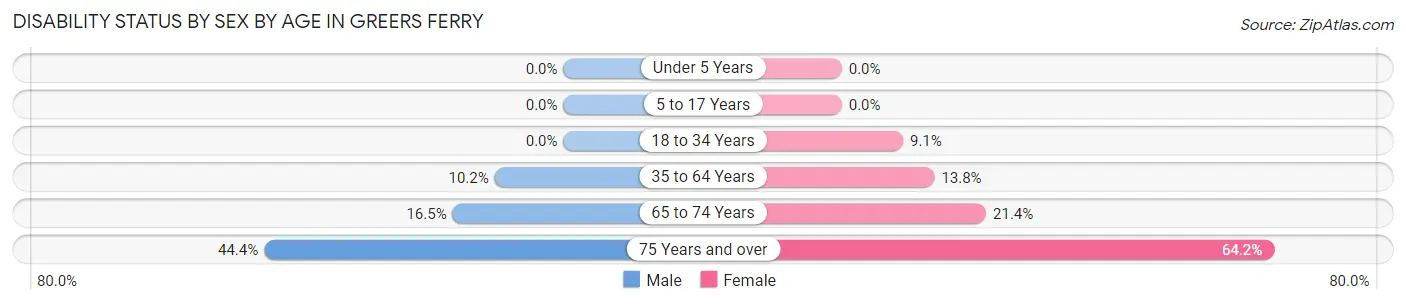
| Age Bracket | Male | Female |
| Under 5 Years | 0 (0.0%) | 0 (0.0%) |
| 5 to 17 Years | 0 (0.0%) | 0 (0.0%) |
| 18 to 34 Years | 0 (0.0%) | 5 (9.1%) |
| 35 to 64 Years | 14 (10.2%) | 30 (13.8%) |
| 65 to 74 Years | 13 (16.5%) | 15 (21.4%) |
| 75 Years and over | 20 (44.4%) | 43 (64.2%) |
Disability Class by Sex by Age in Greers Ferry
Disability Class: Hearing Difficulty
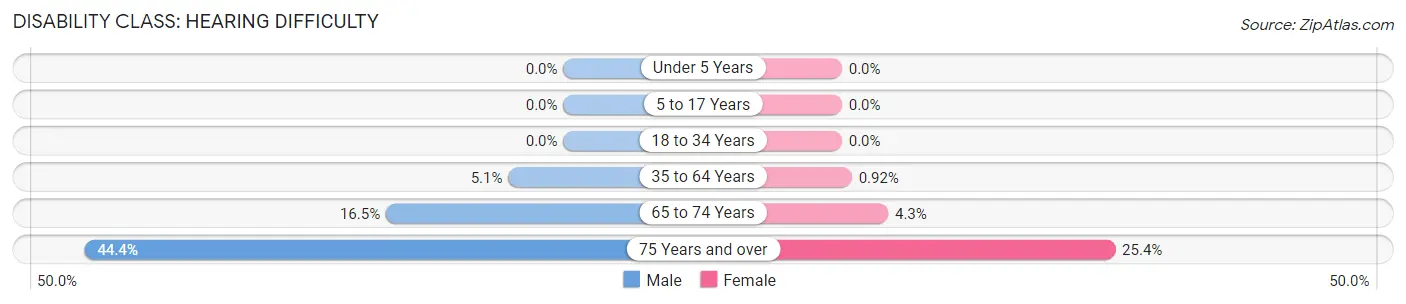
| Age Bracket | Male | Female |
| Under 5 Years | 0 (0.0%) | 0 (0.0%) |
| 5 to 17 Years | 0 (0.0%) | 0 (0.0%) |
| 18 to 34 Years | 0 (0.0%) | 0 (0.0%) |
| 35 to 64 Years | 7 (5.1%) | 2 (0.9%) |
| 65 to 74 Years | 13 (16.5%) | 3 (4.3%) |
| 75 Years and over | 20 (44.4%) | 17 (25.4%) |
Disability Class: Vision Difficulty
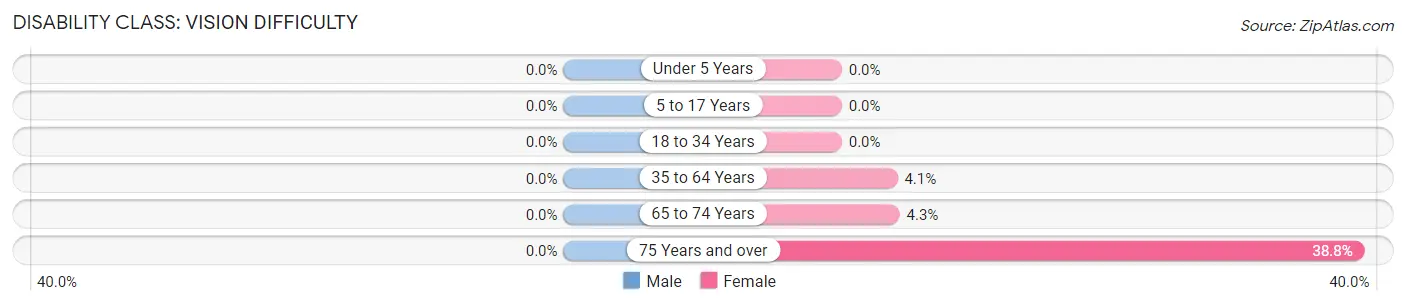
| Age Bracket | Male | Female |
| Under 5 Years | 0 (0.0%) | 0 (0.0%) |
| 5 to 17 Years | 0 (0.0%) | 0 (0.0%) |
| 18 to 34 Years | 0 (0.0%) | 0 (0.0%) |
| 35 to 64 Years | 0 (0.0%) | 9 (4.1%) |
| 65 to 74 Years | 0 (0.0%) | 3 (4.3%) |
| 75 Years and over | 0 (0.0%) | 26 (38.8%) |
Disability Class: Cognitive Difficulty
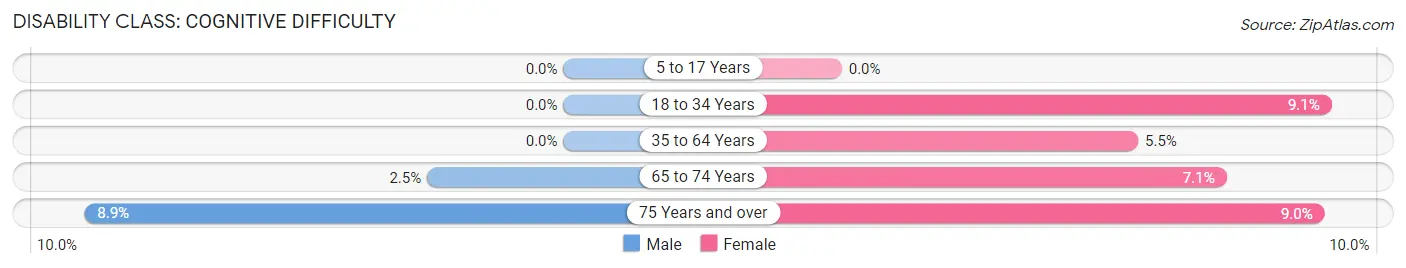
| Age Bracket | Male | Female |
| 5 to 17 Years | 0 (0.0%) | 0 (0.0%) |
| 18 to 34 Years | 0 (0.0%) | 5 (9.1%) |
| 35 to 64 Years | 0 (0.0%) | 12 (5.5%) |
| 65 to 74 Years | 2 (2.5%) | 5 (7.1%) |
| 75 Years and over | 4 (8.9%) | 6 (9.0%) |
Disability Class: Ambulatory Difficulty
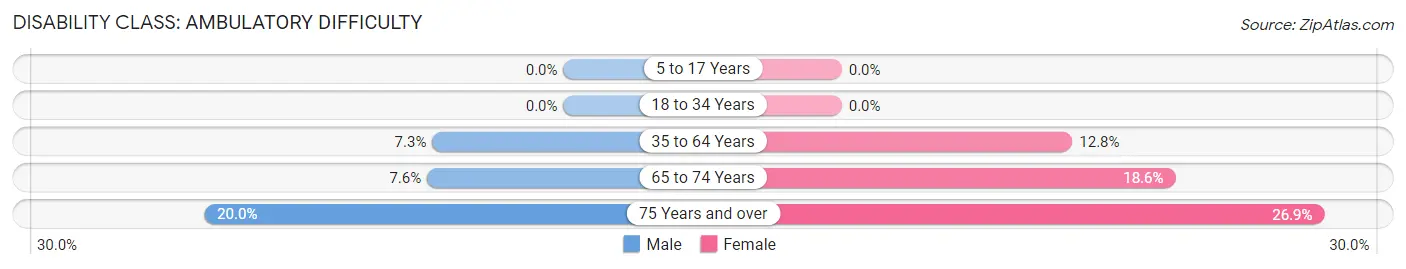
| Age Bracket | Male | Female |
| 5 to 17 Years | 0 (0.0%) | 0 (0.0%) |
| 18 to 34 Years | 0 (0.0%) | 0 (0.0%) |
| 35 to 64 Years | 10 (7.3%) | 28 (12.8%) |
| 65 to 74 Years | 6 (7.6%) | 13 (18.6%) |
| 75 Years and over | 9 (20.0%) | 18 (26.9%) |
Disability Class: Self-Care Difficulty
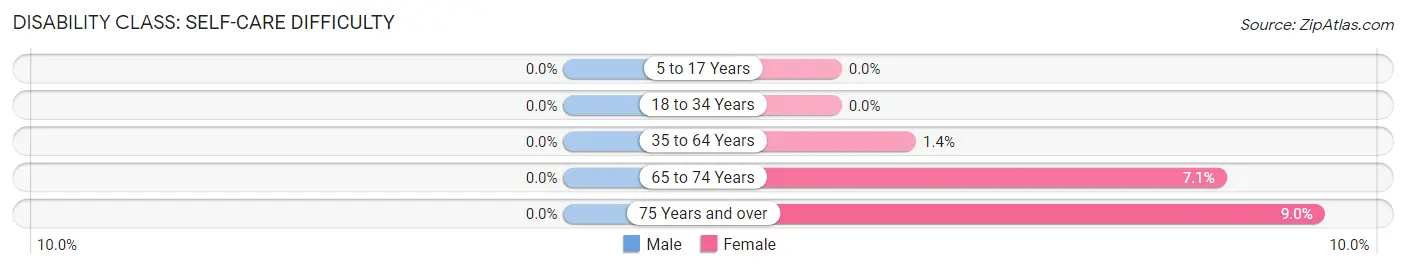
| Age Bracket | Male | Female |
| 5 to 17 Years | 0 (0.0%) | 0 (0.0%) |
| 18 to 34 Years | 0 (0.0%) | 0 (0.0%) |
| 35 to 64 Years | 0 (0.0%) | 3 (1.4%) |
| 65 to 74 Years | 0 (0.0%) | 5 (7.1%) |
| 75 Years and over | 0 (0.0%) | 6 (9.0%) |
Technology Access in Greers Ferry
Computing Device Access in Greers Ferry
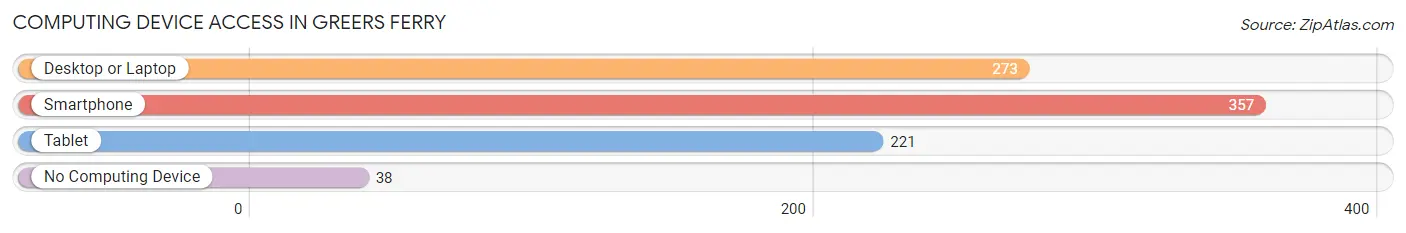
| Device Type | # Households | % Households |
| Desktop or Laptop | 273 | 66.4% |
| Smartphone | 357 | 86.9% |
| Tablet | 221 | 53.8% |
| No Computing Device | 38 | 9.2% |
| Total | 411 | 100.0% |
Internet Access in Greers Ferry
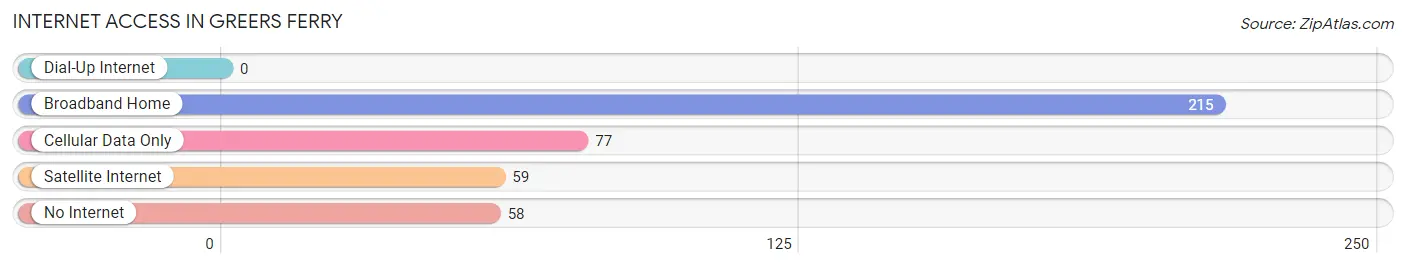
| Internet Type | # Households | % Households |
| Dial-Up Internet | 0 | 0.0% |
| Broadband Home | 215 | 52.3% |
| Cellular Data Only | 77 | 18.7% |
| Satellite Internet | 59 | 14.4% |
| No Internet | 58 | 14.1% |
| Total | 411 | 100.0% |
Greers Ferry Summary
Greers Ferry is a small town located in Cleburne County, Arkansas. It is situated on the shore of Greers Ferry Lake, a reservoir created by the U.S. Army Corps of Engineers in the 1960s. The town is named after John Greer, an early settler who established a ferry service across the Little Red River in the early 1800s. The population of Greers Ferry was 1,072 at the 2010 census.
History
The area around Greers Ferry was first settled by Native Americans, including the Osage, Caddo, and Quapaw tribes. The first European settlers arrived in the area in the early 1800s. John Greer established a ferry service across the Little Red River in 1812, and the town of Greers Ferry was established in 1837.
The town was a popular stop on the Butterfield Overland Mail route, which ran from St. Louis to San Francisco. The town was also a major stop on the Little Rock and Fort Smith Railroad, which was completed in 1876.
Geography
Greers Ferry is located in the Ozark Mountains of north-central Arkansas. It is situated on the shore of Greers Ferry Lake, a reservoir created by the U.S. Army Corps of Engineers in the 1960s. The lake covers over 30,000 acres and is a popular destination for fishing, boating, and other recreational activities.
The town is located at the intersection of Arkansas Highway 16 and Arkansas Highway 25. It is about 40 miles north of Little Rock and about 60 miles south of Fayetteville.
Economy
The economy of Greers Ferry is largely based on tourism and recreation. The town is a popular destination for fishing, boating, and other outdoor activities. The lake is also home to several marinas, campgrounds, and resorts.
The town is also home to several small businesses, including restaurants, shops, and other services. The town is also home to a branch of the University of Arkansas Community College of Batesville.
Demographics
As of the 2010 census, the population of Greers Ferry was 1,072. The racial makeup of the town was 97.2% White, 0.7% African American, 0.3% Native American, 0.2% Asian, 0.1% Pacific Islander, 0.3% from other races, and 1.2% from two or more races. Hispanic or Latino of any race were 1.2% of the population.
The median income for a household in Greers Ferry was $37,500, and the median income for a family was $45,000. The per capita income for the town was $19,000. About 11.2% of families and 14.2% of the population were below the poverty line, including 18.2% of those under age 18 and 8.3% of those age 65 or over.
Common Questions
What is Per Capita Income in Greers Ferry?
Per Capita income in Greers Ferry is $31,687.
What is the Median Family Income in Greers Ferry?
Median Family Income in Greers Ferry is $57,417.
What is the Median Household income in Greers Ferry?
Median Household Income in Greers Ferry is $54,315.
What is Income or Wage Gap in Greers Ferry?
Income or Wage Gap in Greers Ferry is 28.5%.
Women in Greers Ferry earn 71.5 cents for every dollar earned by a man.
What is Inequality or Gini Index in Greers Ferry?
Inequality or Gini Index in Greers Ferry is 0.48.
What is the Total Population of Greers Ferry?
Total Population of Greers Ferry is 905.
What is the Total Male Population of Greers Ferry?
Total Male Population of Greers Ferry is 428.
What is the Total Female Population of Greers Ferry?
Total Female Population of Greers Ferry is 477.
What is the Ratio of Males per 100 Females in Greers Ferry?
There are 89.73 Males per 100 Females in Greers Ferry.
What is the Ratio of Females per 100 Males in Greers Ferry?
There are 111.45 Females per 100 Males in Greers Ferry.
What is the Median Population Age in Greers Ferry?
Median Population Age in Greers Ferry is 54.5 Years.
What is the Average Family Size in Greers Ferry
Average Family Size in Greers Ferry is 2.6 People.
What is the Average Household Size in Greers Ferry
Average Household Size in Greers Ferry is 2.2 People.
How Large is the Labor Force in Greers Ferry?
There are 359 People in the Labor Forcein in Greers Ferry.
What is the Percentage of People in the Labor Force in Greers Ferry?
48.4% of People are in the Labor Force in Greers Ferry.
What is the Unemployment Rate in Greers Ferry?
Unemployment Rate in Greers Ferry is 2.2%.