Greenbrier, AR Map & Demographics
Greenbrier Map
Greenbrier Overview
$25,802
PER CAPITA INCOME
$64,863
AVG FAMILY INCOME
$57,234
AVG HOUSEHOLD INCOME
11.8%
WAGE / INCOME GAP [ % ]
88.2¢/ $1
WAGE / INCOME GAP [ $ ]
0.39
INEQUALITY / GINI INDEX
5,755
TOTAL POPULATION
2,802
MALE POPULATION
2,953
FEMALE POPULATION
94.89
MALES / 100 FEMALES
105.39
FEMALES / 100 MALES
32.5
MEDIAN AGE
3.0
AVG FAMILY SIZE
2.6
AVG HOUSEHOLD SIZE
2,618
LABOR FORCE [ PEOPLE ]
61.3%
PERCENT IN LABOR FORCE
1.8%
UNEMPLOYMENT RATE
Greenbrier Zip Codes
Greenbrier Area Codes
Income in Greenbrier
Income Overview in Greenbrier
Per Capita Income in Greenbrier is $25,802, while median incomes of families and households are $64,863 and $57,234 respectively.
| Characteristic | Number | Measure |
| Per Capita Income | 5,755 | $25,802 |
| Median Family Income | 1,695 | $64,863 |
| Mean Family Income | 1,695 | $78,204 |
| Median Household Income | 2,205 | $57,234 |
| Mean Household Income | 2,205 | $66,635 |
| Income Deficit | 1,695 | $0 |
| Wage / Income Gap (%) | 5,755 | 11.78% |
| Wage / Income Gap ($) | 5,755 | 88.22¢ per $1 |
| Gini / Inequality Index | 5,755 | 0.39 |
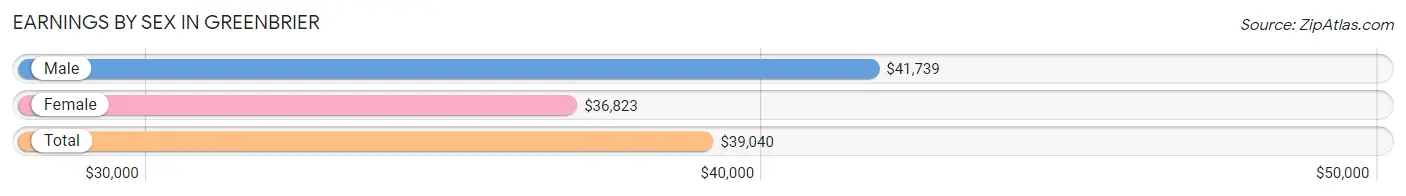
Earnings by Sex in Greenbrier
Average Earnings in Greenbrier are $39,040, $41,739 for men and $36,823 for women, a difference of 11.8%.
| Sex | Number | Average Earnings |
| Male | 1,508 (55.3%) | $41,739 |
| Female | 1,219 (44.7%) | $36,823 |
| Total | 2,727 (100.0%) | $39,040 |
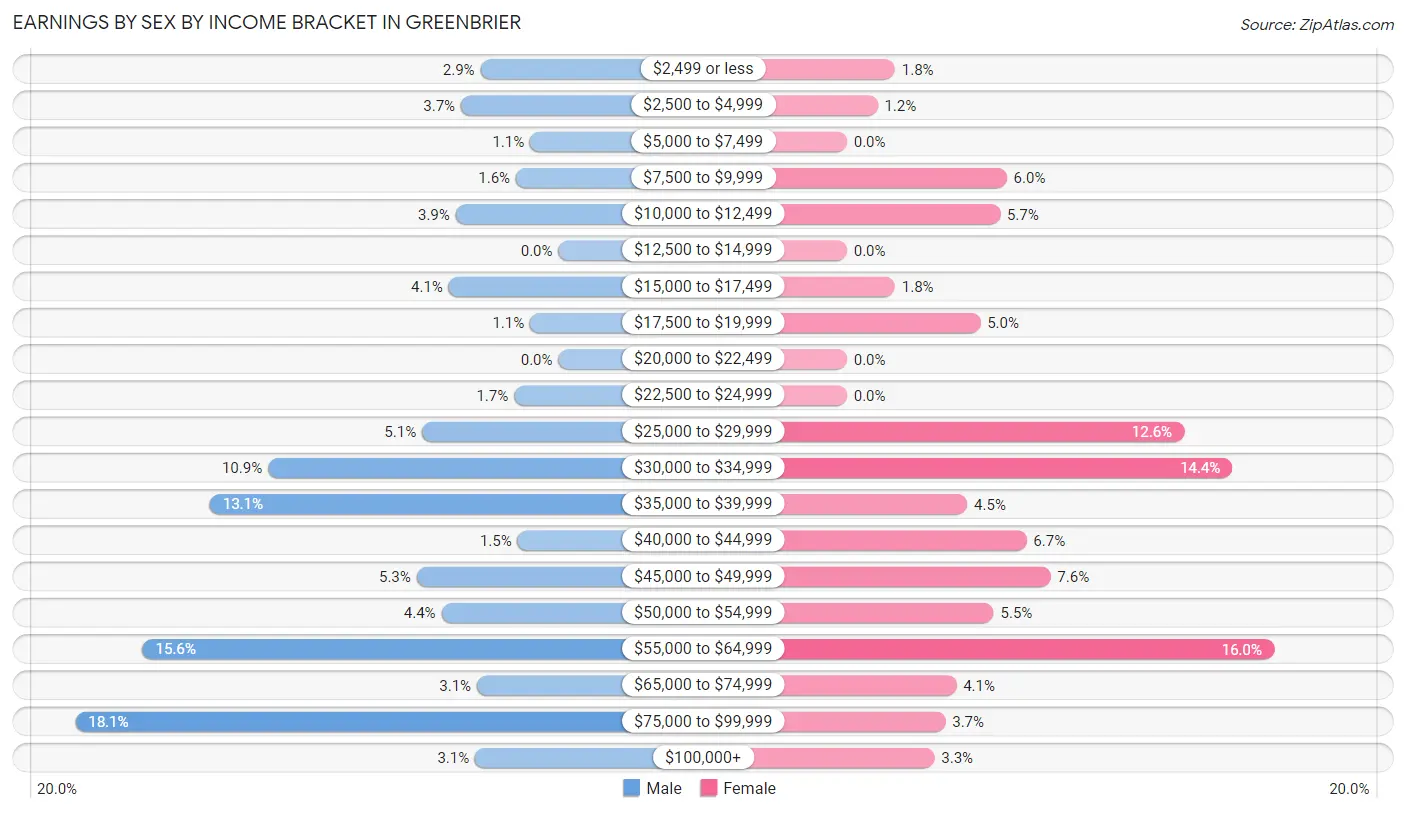
Earnings by Sex by Income Bracket in Greenbrier
The most common earnings brackets in Greenbrier are $75,000 to $99,999 for men (273 | 18.1%) and $55,000 to $64,999 for women (195 | 16.0%).
| Income | Male | Female |
| $2,499 or less | 44 (2.9%) | 22 (1.8%) |
| $2,500 to $4,999 | 55 (3.6%) | 14 (1.1%) |
| $5,000 to $7,499 | 16 (1.1%) | 0 (0.0%) |
| $7,500 to $9,999 | 24 (1.6%) | 73 (6.0%) |
| $10,000 to $12,499 | 58 (3.8%) | 70 (5.7%) |
| $12,500 to $14,999 | 0 (0.0%) | 0 (0.0%) |
| $15,000 to $17,499 | 62 (4.1%) | 22 (1.8%) |
| $17,500 to $19,999 | 16 (1.1%) | 61 (5.0%) |
| $20,000 to $22,499 | 0 (0.0%) | 0 (0.0%) |
| $22,500 to $24,999 | 25 (1.7%) | 0 (0.0%) |
| $25,000 to $29,999 | 77 (5.1%) | 154 (12.6%) |
| $30,000 to $34,999 | 164 (10.9%) | 176 (14.4%) |
| $35,000 to $39,999 | 197 (13.1%) | 55 (4.5%) |
| $40,000 to $44,999 | 23 (1.5%) | 82 (6.7%) |
| $45,000 to $49,999 | 80 (5.3%) | 93 (7.6%) |
| $50,000 to $54,999 | 66 (4.4%) | 67 (5.5%) |
| $55,000 to $64,999 | 235 (15.6%) | 195 (16.0%) |
| $65,000 to $74,999 | 46 (3.0%) | 50 (4.1%) |
| $75,000 to $99,999 | 273 (18.1%) | 45 (3.7%) |
| $100,000+ | 47 (3.1%) | 40 (3.3%) |
| Total | 1,508 (100.0%) | 1,219 (100.0%) |
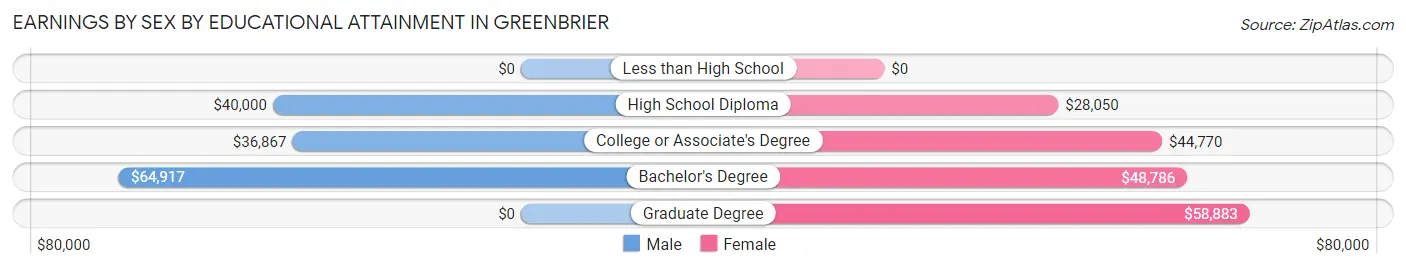
Earnings by Sex by Educational Attainment in Greenbrier
Average earnings in Greenbrier are $45,952 for men and $43,187 for women, a difference of 6.0%. Men with an educational attainment of bachelor's degree enjoy the highest average annual earnings of $64,917, while those with college or associate's degree education earn the least with $36,867. Women with an educational attainment of graduate degree earn the most with the average annual earnings of $58,883, while those with high school diploma education have the smallest earnings of $28,050.
| Educational Attainment | Male Income | Female Income |
| Less than High School | - | - |
| High School Diploma | $40,000 | $28,050 |
| College or Associate's Degree | $36,867 | $44,770 |
| Bachelor's Degree | $64,917 | $48,786 |
| Graduate Degree | - | - |
| Total | $45,952 | $43,187 |
Family Income in Greenbrier
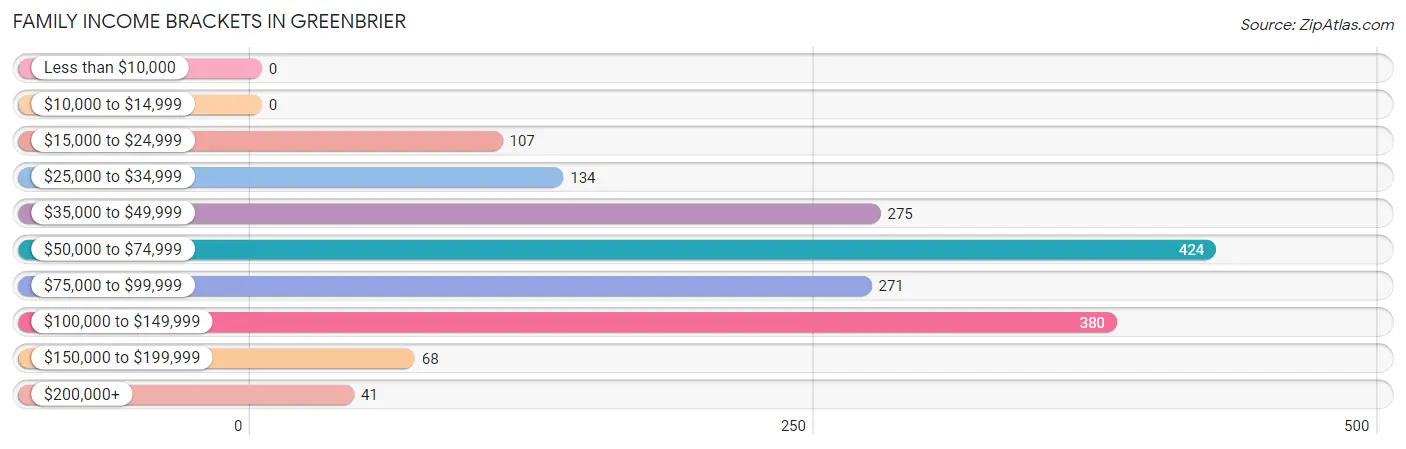
Family Income Brackets in Greenbrier
According to the Greenbrier family income data, there are 424 families falling into the $50,000 to $74,999 income range, which is the most common income bracket and makes up 25.0% of all families.
| Income Bracket | # Families | % Families |
| Less than $10,000 | 0 | 0.0% |
| $10,000 to $14,999 | 0 | 0.0% |
| $15,000 to $24,999 | 107 | 6.3% |
| $25,000 to $34,999 | 134 | 7.9% |
| $35,000 to $49,999 | 275 | 16.2% |
| $50,000 to $74,999 | 424 | 25.0% |
| $75,000 to $99,999 | 271 | 16.0% |
| $100,000 to $149,999 | 380 | 22.4% |
| $150,000 to $199,999 | 68 | 4.0% |
| $200,000+ | 41 | 2.4% |
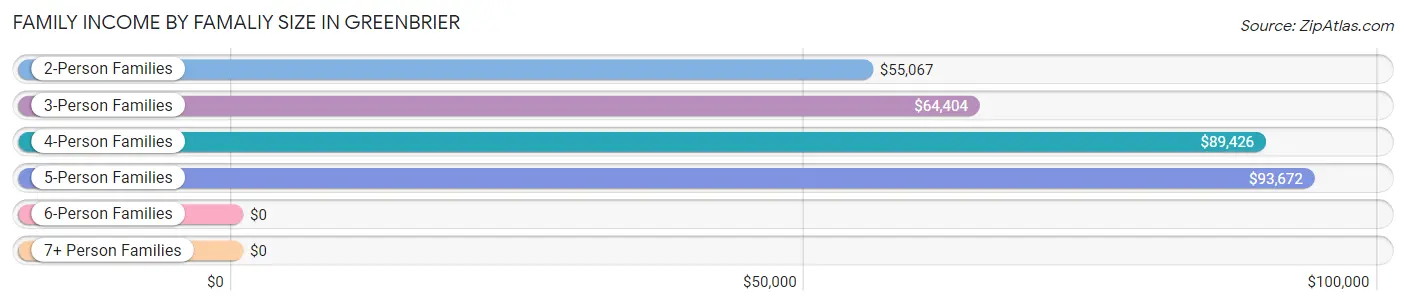
Family Income by Famaliy Size in Greenbrier
5-person families (57 | 3.4%) account for the highest median family income in Greenbrier with $93,672 per family, while 2-person families (594 | 35.0%) have the highest median income of $27,534 per family member.
| Income Bracket | # Families | Median Income |
| 2-Person Families | 594 (35.0%) | $55,067 |
| 3-Person Families | 493 (29.1%) | $64,404 |
| 4-Person Families | 505 (29.8%) | $89,426 |
| 5-Person Families | 57 (3.4%) | $93,672 |
| 6-Person Families | 34 (2.0%) | $0 |
| 7+ Person Families | 12 (0.7%) | $0 |
| Total | 1,695 (100.0%) | $64,863 |
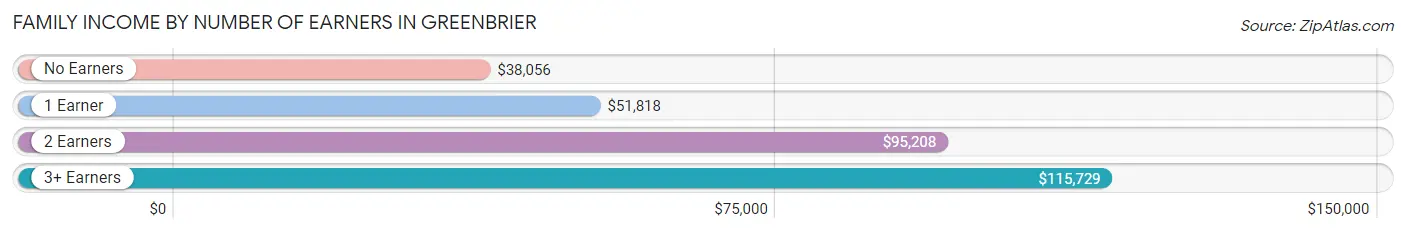
Family Income by Number of Earners in Greenbrier
The median family income in Greenbrier is $64,863, with families comprising 3+ earners (129) having the highest median family income of $115,729, while families with no earners (270) have the lowest median family income of $38,056, accounting for 7.6% and 15.9% of families, respectively.
| Number of Earners | # Families | Median Income |
| No Earners | 270 (15.9%) | $38,056 |
| 1 Earner | 420 (24.8%) | $51,818 |
| 2 Earners | 876 (51.7%) | $95,208 |
| 3+ Earners | 129 (7.6%) | $115,729 |
| Total | 1,695 (100.0%) | $64,863 |
Household Income in Greenbrier
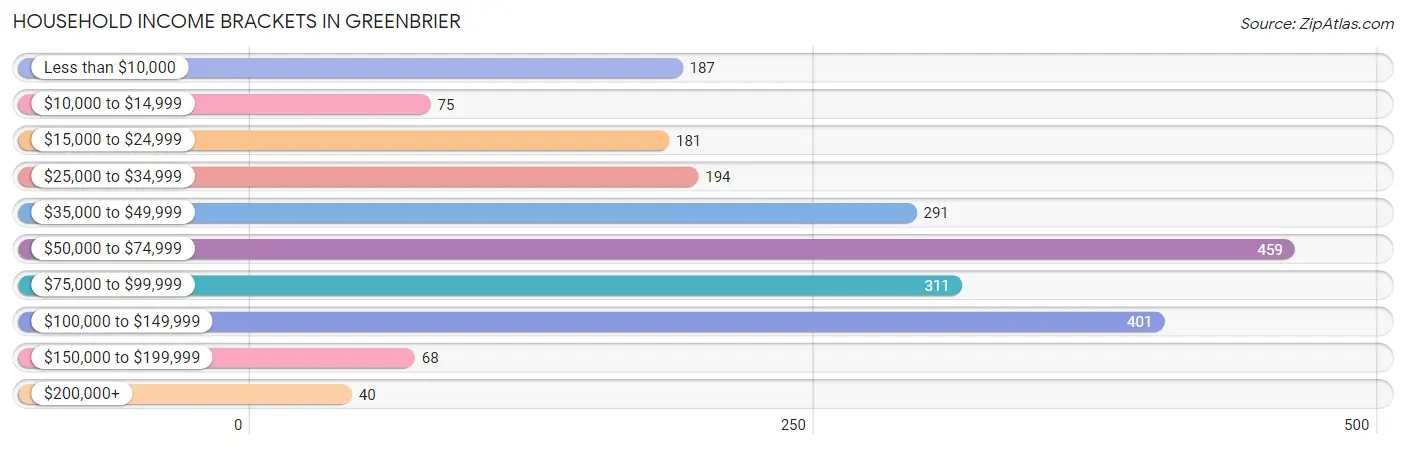
Household Income Brackets in Greenbrier
With 459 households falling in the category, the $50,000 to $74,999 income range is the most frequent in Greenbrier, accounting for 20.8% of all households. In contrast, only 40 households (1.8%) fall into the $200,000+ income bracket, making it the least populous group.
| Income Bracket | # Households | % Households |
| Less than $10,000 | 187 | 8.5% |
| $10,000 to $14,999 | 75 | 3.4% |
| $15,000 to $24,999 | 181 | 8.2% |
| $25,000 to $34,999 | 194 | 8.8% |
| $35,000 to $49,999 | 291 | 13.2% |
| $50,000 to $74,999 | 459 | 20.8% |
| $75,000 to $99,999 | 311 | 14.1% |
| $100,000 to $149,999 | 401 | 18.2% |
| $150,000 to $199,999 | 68 | 3.1% |
| $200,000+ | 40 | 1.8% |
Household Income by Householder Age in Greenbrier
The median household income in Greenbrier is $57,234, with the highest median household income of $84,665 found in the 25 to 44 years age bracket for the primary householder. A total of 955 households (43.3%) fall into this category. Meanwhile, the 65+ years age bracket for the primary householder has the lowest median household income of $24,688, with 650 households (29.5%) in this group.
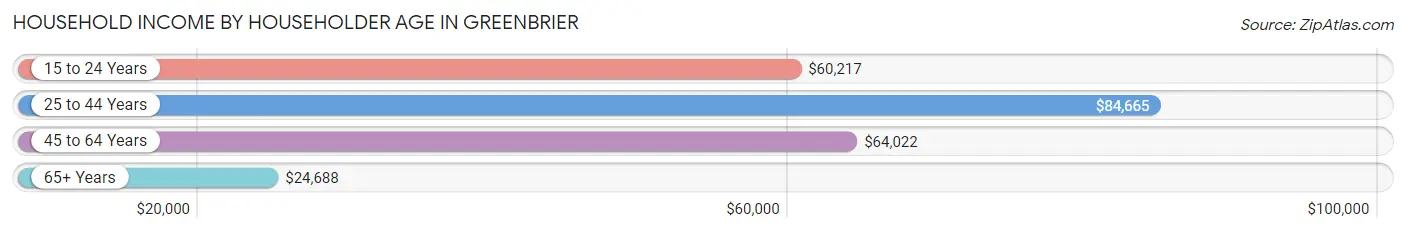
| Income Bracket | # Households | Median Income |
| 15 to 24 Years | 58 (2.6%) | $60,217 |
| 25 to 44 Years | 955 (43.3%) | $84,665 |
| 45 to 64 Years | 542 (24.6%) | $64,022 |
| 65+ Years | 650 (29.5%) | $24,688 |
| Total | 2,205 (100.0%) | $57,234 |
Poverty in Greenbrier
Income Below Poverty by Sex and Age in Greenbrier
With 9.3% poverty level for males and 13.5% for females among the residents of Greenbrier, under 5 year old males and 6 to 11 year old females are the most vulnerable to poverty, with 132 males (40.5%) and 95 females (65.1%) in their respective age groups living below the poverty level.
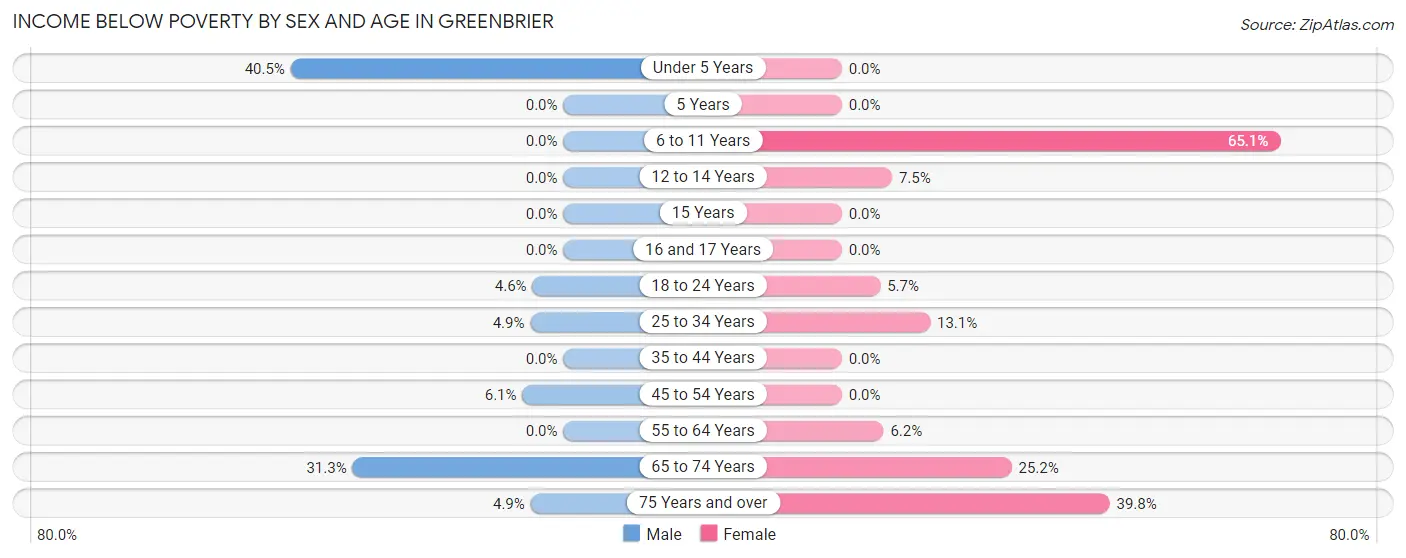
| Age Bracket | Male | Female |
| Under 5 Years | 132 (40.5%) | 0 (0.0%) |
| 5 Years | 0 (0.0%) | 0 (0.0%) |
| 6 to 11 Years | 0 (0.0%) | 95 (65.1%) |
| 12 to 14 Years | 0 (0.0%) | 14 (7.4%) |
| 15 Years | 0 (0.0%) | 0 (0.0%) |
| 16 and 17 Years | 0 (0.0%) | 0 (0.0%) |
| 18 to 24 Years | 9 (4.6%) | 9 (5.7%) |
| 25 to 34 Years | 33 (4.9%) | 77 (13.1%) |
| 35 to 44 Years | 0 (0.0%) | 0 (0.0%) |
| 45 to 54 Years | 17 (6.1%) | 0 (0.0%) |
| 55 to 64 Years | 0 (0.0%) | 12 (6.2%) |
| 65 to 74 Years | 62 (31.3%) | 89 (25.2%) |
| 75 Years and over | 7 (4.9%) | 101 (39.8%) |
| Total | 260 (9.3%) | 397 (13.5%) |
Income Above Poverty by Sex and Age in Greenbrier
According to the poverty statistics in Greenbrier, males aged 5 years and females aged under 5 years are the age groups that are most secure financially, with 100.0% of males and 100.0% of females in these age groups living above the poverty line.
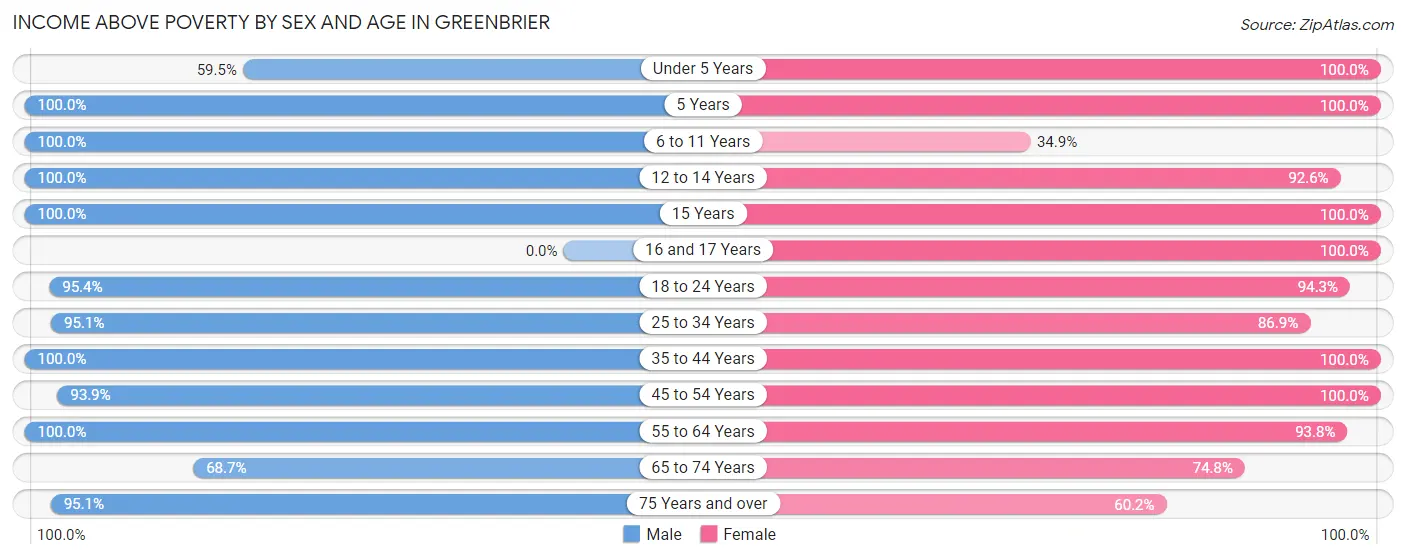
| Age Bracket | Male | Female |
| Under 5 Years | 194 (59.5%) | 268 (100.0%) |
| 5 Years | 42 (100.0%) | 32 (100.0%) |
| 6 to 11 Years | 301 (100.0%) | 51 (34.9%) |
| 12 to 14 Years | 141 (100.0%) | 174 (92.5%) |
| 15 Years | 24 (100.0%) | 17 (100.0%) |
| 16 and 17 Years | 0 (0.0%) | 112 (100.0%) |
| 18 to 24 Years | 187 (95.4%) | 149 (94.3%) |
| 25 to 34 Years | 639 (95.1%) | 511 (86.9%) |
| 35 to 44 Years | 238 (100.0%) | 325 (100.0%) |
| 45 to 54 Years | 262 (93.9%) | 304 (100.0%) |
| 55 to 64 Years | 241 (100.0%) | 182 (93.8%) |
| 65 to 74 Years | 136 (68.7%) | 264 (74.8%) |
| 75 Years and over | 137 (95.1%) | 153 (60.2%) |
| Total | 2,542 (90.7%) | 2,542 (86.5%) |
Income Below Poverty Among Married-Couple Families in Greenbrier
The poverty statistics for married-couple families in Greenbrier show that 2.2% or 29 of the total 1,300 families live below the poverty line. Families with 1 or 2 children have the highest poverty rate of 4.5%, comprising of 29 families. On the other hand, families with no children have the lowest poverty rate of 0.0%, which includes 0 families.
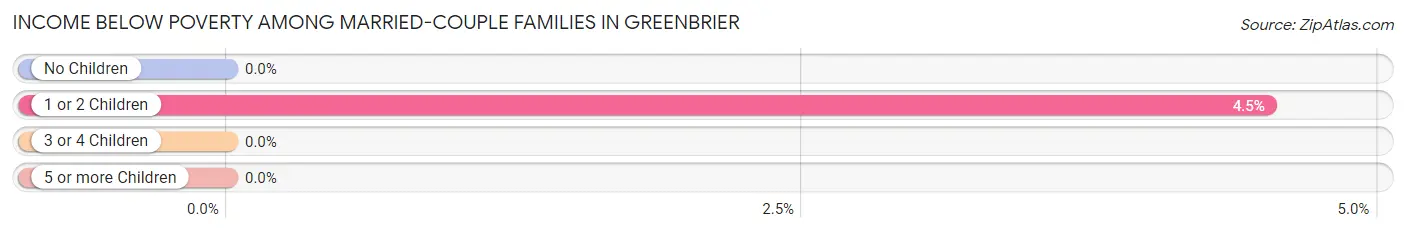
| Children | Above Poverty | Below Poverty |
| No Children | 568 (100.0%) | 0 (0.0%) |
| 1 or 2 Children | 613 (95.5%) | 29 (4.5%) |
| 3 or 4 Children | 78 (100.0%) | 0 (0.0%) |
| 5 or more Children | 12 (100.0%) | 0 (0.0%) |
| Total | 1,271 (97.8%) | 29 (2.2%) |
Income Below Poverty Among Single-Parent Households in Greenbrier
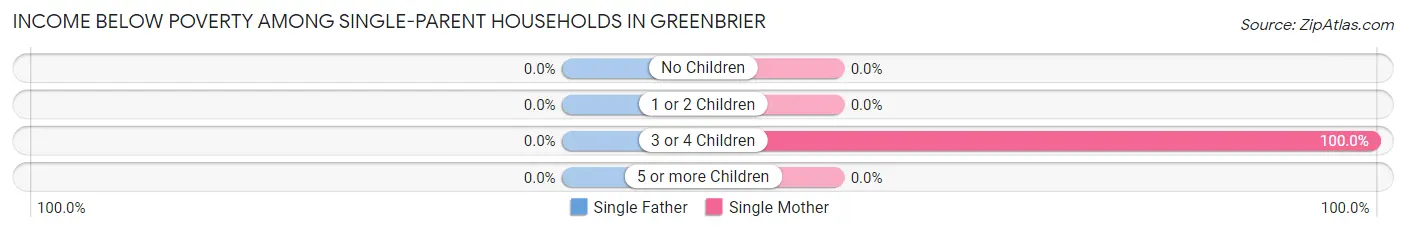
| Children | Single Father | Single Mother |
| No Children | 0 (0.0%) | 0 (0.0%) |
| 1 or 2 Children | 0 (0.0%) | 0 (0.0%) |
| 3 or 4 Children | 0 (0.0%) | 61 (100.0%) |
| 5 or more Children | 0 (0.0%) | 0 (0.0%) |
| Total | 0 (0.0%) | 61 (22.4%) |
Income Below Poverty Among Married-Couple vs Single-Parent Households in Greenbrier
The poverty data for Greenbrier shows that 29 of the married-couple family households (2.2%) and 61 of the single-parent households (15.4%) are living below the poverty level. Within the married-couple family households, those with 1 or 2 children have the highest poverty rate, with 29 households (4.5%) falling below the poverty line. Among the single-parent households, those with 3 or 4 children have the highest poverty rate, with 61 household (100.0%) living below poverty.
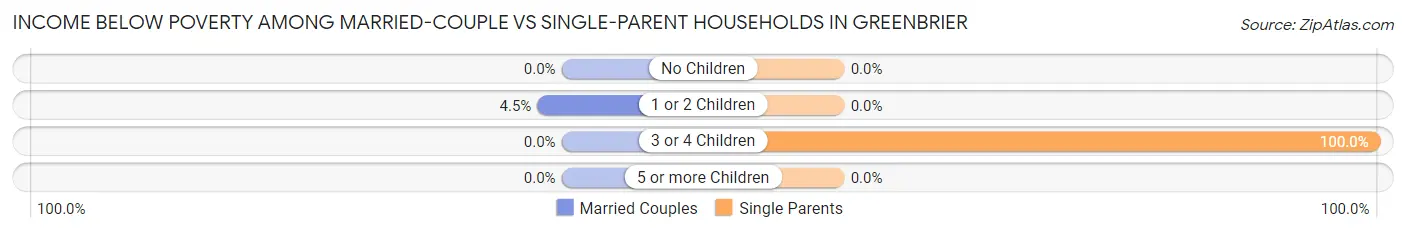
| Children | Married-Couple Families | Single-Parent Households |
| No Children | 0 (0.0%) | 0 (0.0%) |
| 1 or 2 Children | 29 (4.5%) | 0 (0.0%) |
| 3 or 4 Children | 0 (0.0%) | 61 (100.0%) |
| 5 or more Children | 0 (0.0%) | 0 (0.0%) |
| Total | 29 (2.2%) | 61 (15.4%) |
Race in Greenbrier
The most populous races in Greenbrier are White / Caucasian (5,533 | 96.1%), Hispanic or Latino (518 | 9.0%), and Some other Race (112 | 1.9%).
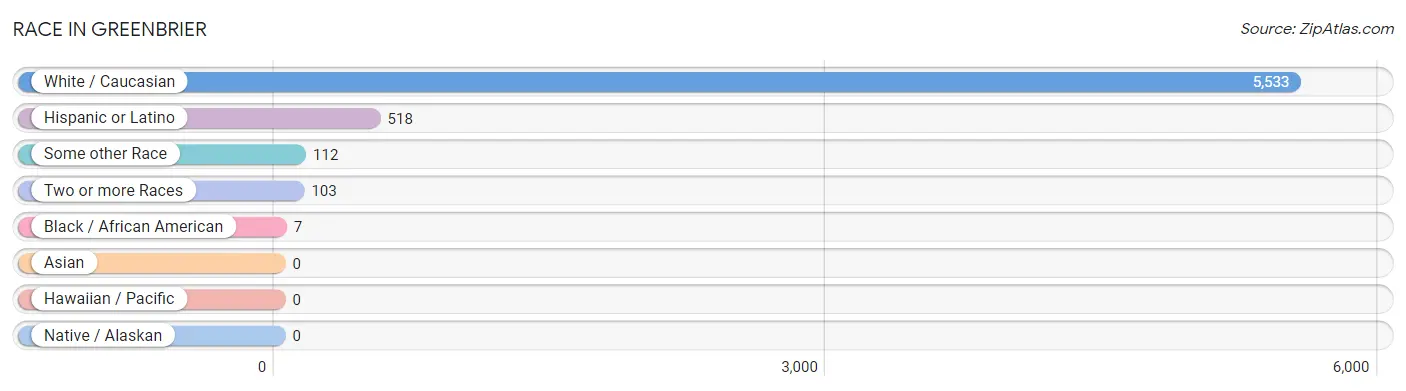
| Race | # Population | % Population |
| Asian | 0 | 0.0% |
| Black / African American | 7 | 0.1% |
| Hawaiian / Pacific | 0 | 0.0% |
| Hispanic or Latino | 518 | 9.0% |
| Native / Alaskan | 0 | 0.0% |
| White / Caucasian | 5,533 | 96.1% |
| Two or more Races | 103 | 1.8% |
| Some other Race | 112 | 1.9% |
| Total | 5,755 | 100.0% |
Ancestry in Greenbrier
The most populous ancestries reported in Greenbrier are German (461 | 8.0%), Mexican (432 | 7.5%), Irish (366 | 6.4%), American (286 | 5.0%), and English (275 | 4.8%), together accounting for 31.6% of all Greenbrier residents.
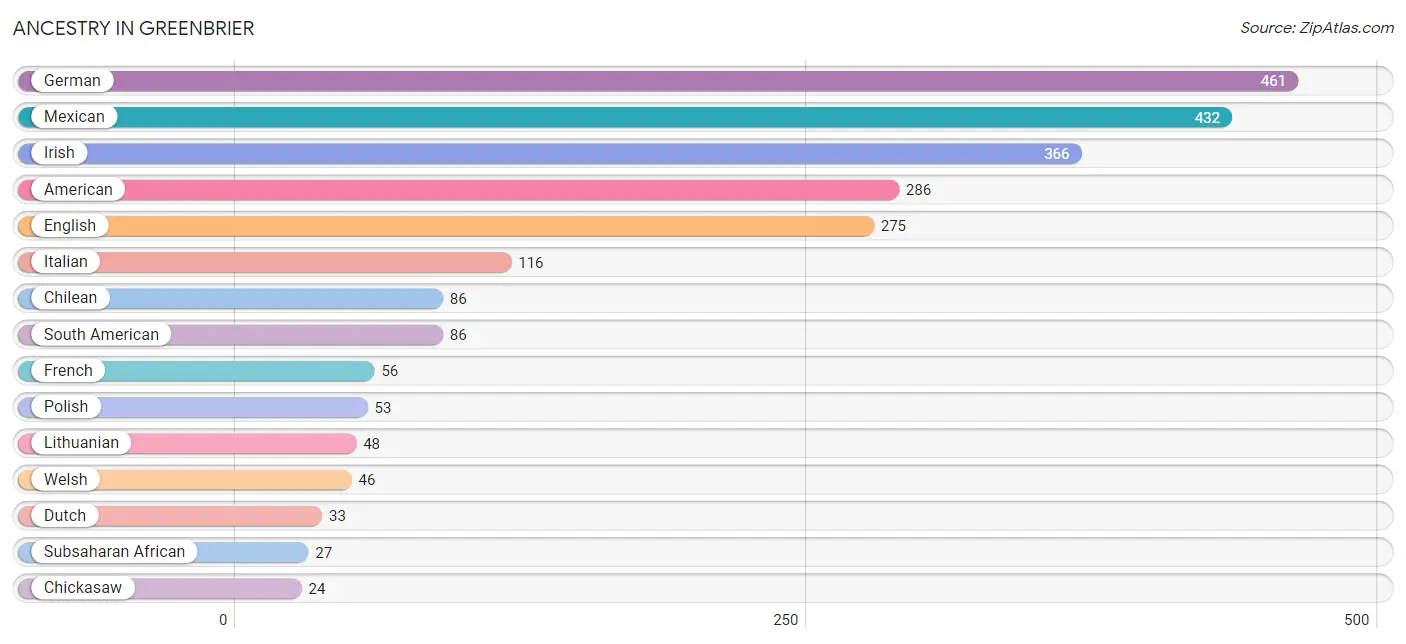
| Ancestry | # Population | % Population |
| African | 11 | 0.2% |
| American | 286 | 5.0% |
| Cajun | 20 | 0.4% |
| Cherokee | 8 | 0.1% |
| Chickasaw | 24 | 0.4% |
| Chilean | 86 | 1.5% |
| Dutch | 33 | 0.6% |
| English | 275 | 4.8% |
| European | 18 | 0.3% |
| French | 56 | 1.0% |
| German | 461 | 8.0% |
| Irish | 366 | 6.4% |
| Italian | 116 | 2.0% |
| Lithuanian | 48 | 0.8% |
| Mexican | 432 | 7.5% |
| Polish | 53 | 0.9% |
| Scotch-Irish | 22 | 0.4% |
| Scottish | 21 | 0.4% |
| South American | 86 | 1.5% |
| Subsaharan African | 27 | 0.5% |
| Welsh | 46 | 0.8% | View All 21 Rows |
Immigrants in Greenbrier
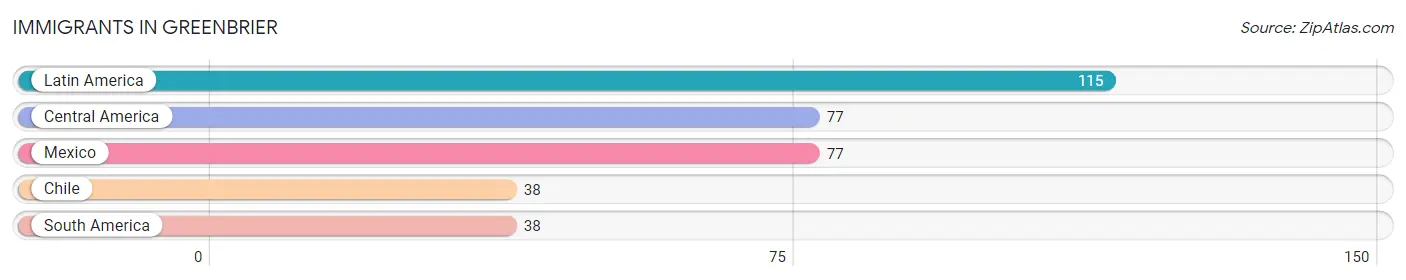
The most numerous immigrant groups reported in Greenbrier came from Latin America (115 | 2.0%), Central America (77 | 1.3%), Mexico (77 | 1.3%), Chile (38 | 0.7%), and South America (38 | 0.7%), together accounting for 6.0% of all Greenbrier residents.
| Immigration Origin | # Population | % Population |
| Central America | 77 | 1.3% |
| Chile | 38 | 0.7% |
| Latin America | 115 | 2.0% |
| Mexico | 77 | 1.3% |
| South America | 38 | 0.7% | View All 5 Rows |
Sex and Age in Greenbrier
Sex and Age in Greenbrier
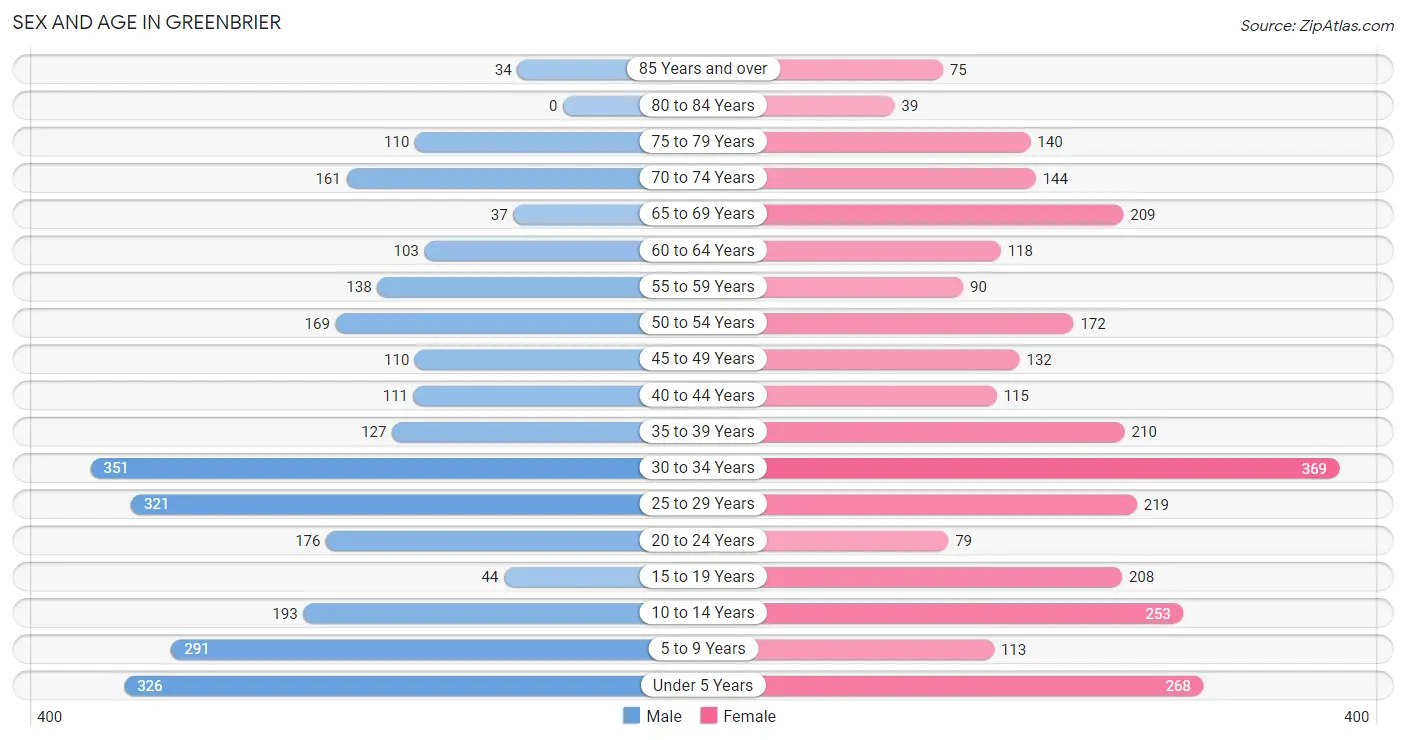
The most populous age groups in Greenbrier are 30 to 34 Years (351 | 12.5%) for men and 30 to 34 Years (369 | 12.5%) for women.
| Age Bracket | Male | Female |
| Under 5 Years | 326 (11.6%) | 268 (9.1%) |
| 5 to 9 Years | 291 (10.4%) | 113 (3.8%) |
| 10 to 14 Years | 193 (6.9%) | 253 (8.6%) |
| 15 to 19 Years | 44 (1.6%) | 208 (7.0%) |
| 20 to 24 Years | 176 (6.3%) | 79 (2.7%) |
| 25 to 29 Years | 321 (11.5%) | 219 (7.4%) |
| 30 to 34 Years | 351 (12.5%) | 369 (12.5%) |
| 35 to 39 Years | 127 (4.5%) | 210 (7.1%) |
| 40 to 44 Years | 111 (4.0%) | 115 (3.9%) |
| 45 to 49 Years | 110 (3.9%) | 132 (4.5%) |
| 50 to 54 Years | 169 (6.0%) | 172 (5.8%) |
| 55 to 59 Years | 138 (4.9%) | 90 (3.0%) |
| 60 to 64 Years | 103 (3.7%) | 118 (4.0%) |
| 65 to 69 Years | 37 (1.3%) | 209 (7.1%) |
| 70 to 74 Years | 161 (5.8%) | 144 (4.9%) |
| 75 to 79 Years | 110 (3.9%) | 140 (4.7%) |
| 80 to 84 Years | 0 (0.0%) | 39 (1.3%) |
| 85 Years and over | 34 (1.2%) | 75 (2.5%) |
| Total | 2,802 (100.0%) | 2,953 (100.0%) |
Families and Households in Greenbrier
Median Family Size in Greenbrier
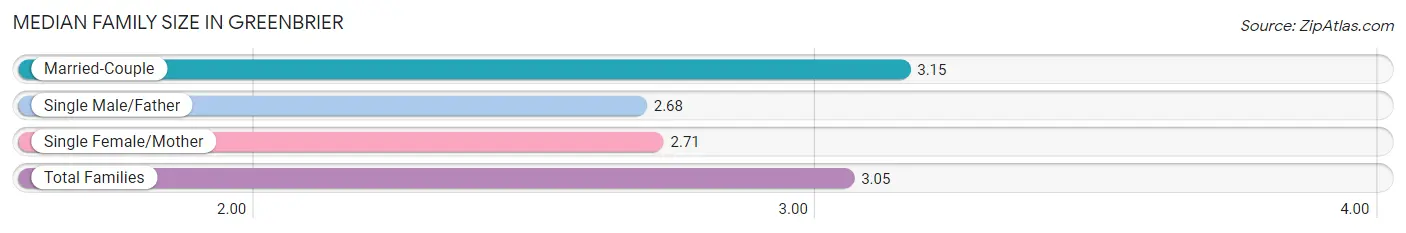
The median family size in Greenbrier is 3.05 persons per family, with married-couple families (1,300 | 76.7%) accounting for the largest median family size of 3.15 persons per family. On the other hand, single male/father families (123 | 7.3%) represent the smallest median family size with 2.68 persons per family.
| Family Type | # Families | Family Size |
| Married-Couple | 1,300 (76.7%) | 3.15 |
| Single Male/Father | 123 (7.3%) | 2.68 |
| Single Female/Mother | 272 (16.1%) | 2.71 |
| Total Families | 1,695 (100.0%) | 3.05 |
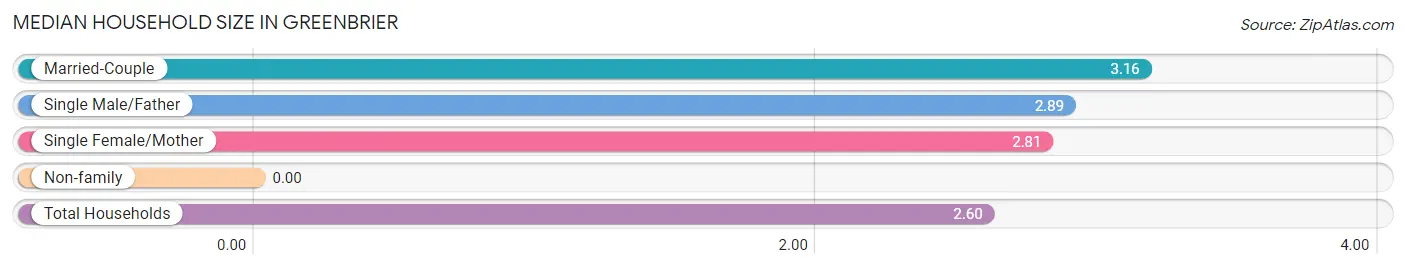
Median Household Size in Greenbrier
| Household Type | # Households | Household Size |
| Married-Couple | 1,300 (59.0%) | 3.16 |
| Single Male/Father | 123 (5.6%) | 2.89 |
| Single Female/Mother | 272 (12.3%) | 2.81 |
| Non-family | 510 (23.1%) | - |
| Total Households | 2,205 (100.0%) | 2.60 |
Household Size by Marriage Status in Greenbrier
Out of a total of 2,205 households in Greenbrier, 1,695 (76.9%) are family households, while 510 (23.1%) are nonfamily households. The most numerous type of family households are 2-person households, comprising 583, and the most common type of nonfamily households are 1-person households, comprising 510.
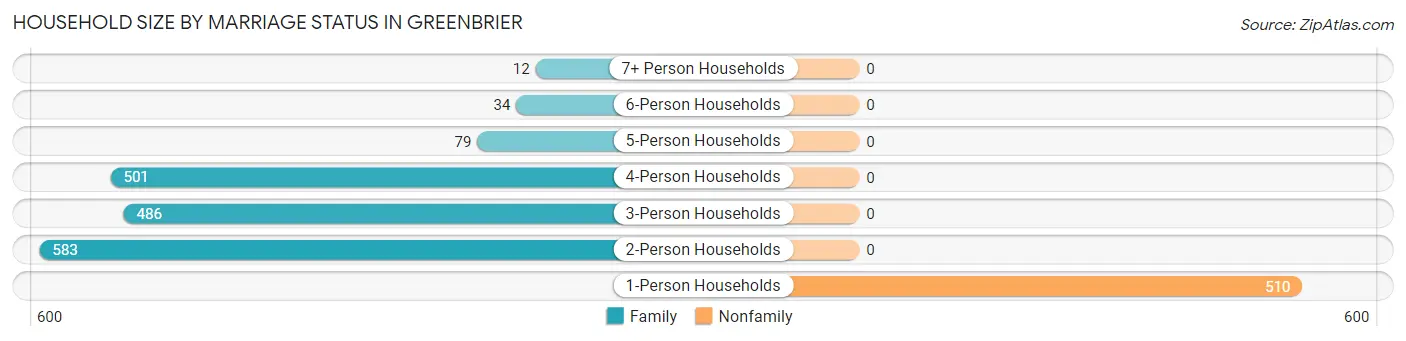
| Household Size | Family Households | Nonfamily Households |
| 1-Person Households | - | 510 (23.1%) |
| 2-Person Households | 583 (26.4%) | 0 (0.0%) |
| 3-Person Households | 486 (22.0%) | 0 (0.0%) |
| 4-Person Households | 501 (22.7%) | 0 (0.0%) |
| 5-Person Households | 79 (3.6%) | 0 (0.0%) |
| 6-Person Households | 34 (1.5%) | 0 (0.0%) |
| 7+ Person Households | 12 (0.5%) | 0 (0.0%) |
| Total | 1,695 (76.9%) | 510 (23.1%) |
Female Fertility in Greenbrier
Fertility by Age in Greenbrier
Average fertility rate in Greenbrier is 82.0 births per 1,000 women. Women in the age bracket of 20 to 34 years have the highest fertility rate with 135.0 births per 1,000 women. Women in the age bracket of 20 to 34 years acount for 81.1% of all women with births.
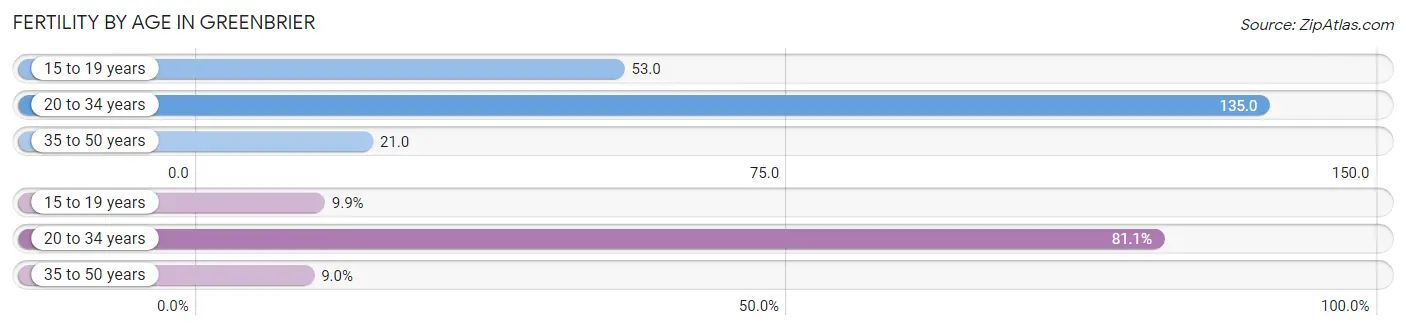
| Age Bracket | Women with Births | Births / 1,000 Women |
| 15 to 19 years | 11 (9.9%) | 53.0 |
| 20 to 34 years | 90 (81.1%) | 135.0 |
| 35 to 50 years | 10 (9.0%) | 21.0 |
| Total | 111 (100.0%) | 82.0 |
Fertility by Age by Marriage Status in Greenbrier
45.0% of women with births (111) in Greenbrier are married. The highest percentage of unmarried women with births falls into 20 to 34 years age bracket with 67.8% of them unmarried at the time of birth, while the lowest percentage of unmarried women with births belong to 15 to 19 years age bracket with 0.0% of them unmarried.
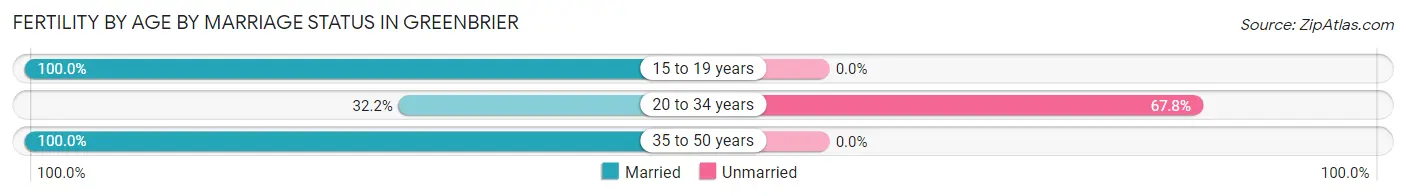
| Age Bracket | Married | Unmarried |
| 15 to 19 years | 11 (100.0%) | 0 (0.0%) |
| 20 to 34 years | 29 (32.2%) | 61 (67.8%) |
| 35 to 50 years | 10 (100.0%) | 0 (0.0%) |
| Total | 50 (45.1%) | 61 (54.9%) |
Fertility by Education in Greenbrier
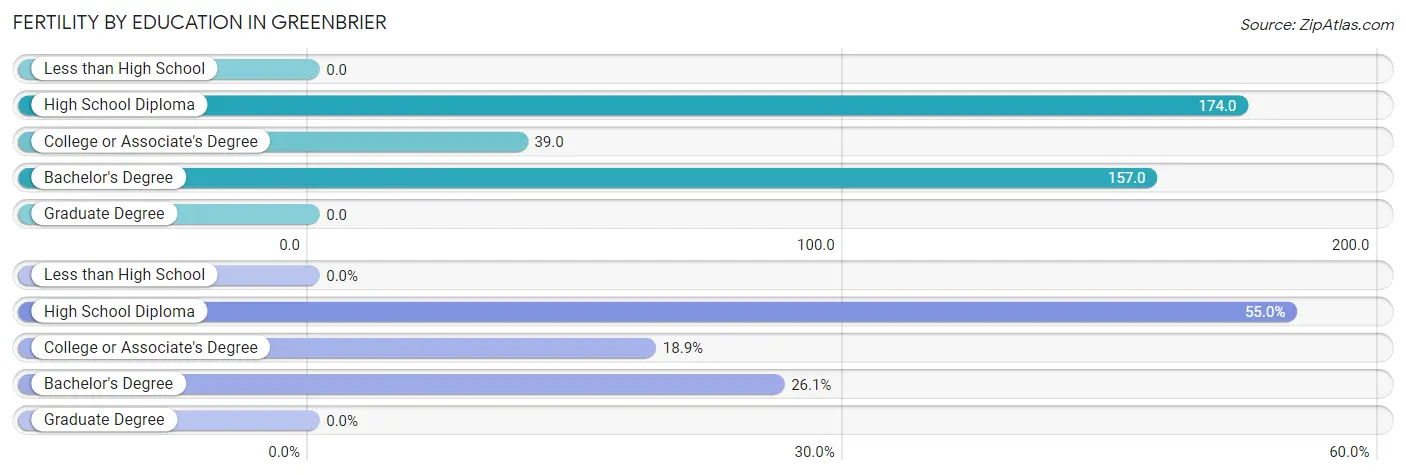
| Educational Attainment | Women with Births | Births / 1,000 Women |
| Less than High School | 0 (0.0%) | 0.0 |
| High School Diploma | 61 (54.9%) | 174.0 |
| College or Associate's Degree | 21 (18.9%) | 39.0 |
| Bachelor's Degree | 29 (26.1%) | 157.0 |
| Graduate Degree | 0 (0.0%) | 0.0 |
| Total | 111 (100.0%) | 82.0 |
Fertility by Education by Marriage Status in Greenbrier
54.9% of women with births in Greenbrier are unmarried. Women with the educational attainment of college or associate's degree are most likely to be married with 100.0% of them married at childbirth, while women with the educational attainment of high school diploma are least likely to be married with 100.0% of them unmarried at childbirth.
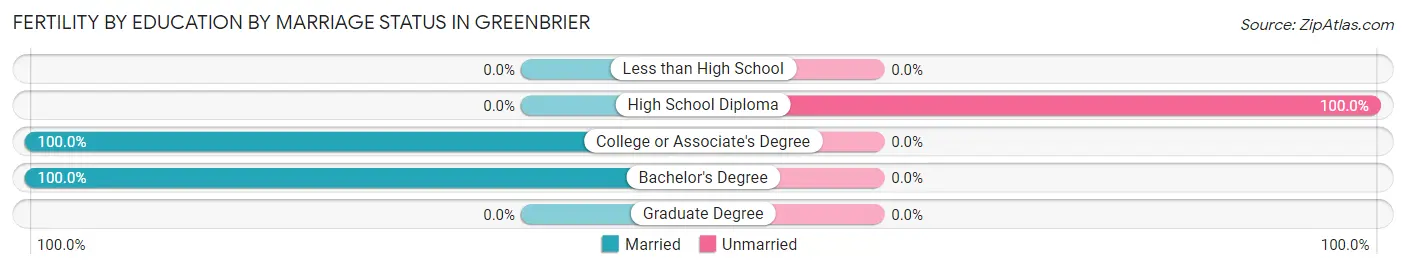
| Educational Attainment | Married | Unmarried |
| Less than High School | 0 (0.0%) | 0 (0.0%) |
| High School Diploma | 0 (0.0%) | 61 (100.0%) |
| College or Associate's Degree | 21 (100.0%) | 0 (0.0%) |
| Bachelor's Degree | 29 (100.0%) | 0 (0.0%) |
| Graduate Degree | 0 (0.0%) | 0 (0.0%) |
| Total | 50 (45.1%) | 61 (54.9%) |
Employment Characteristics in Greenbrier
Employment by Class of Employer in Greenbrier
Among the 2,522 employed individuals in Greenbrier, private company employees (1,611 | 63.9%), local government employees (179 | 7.1%), and self-employed (not incorporated) (166 | 6.6%) make up the most common classes of employment.
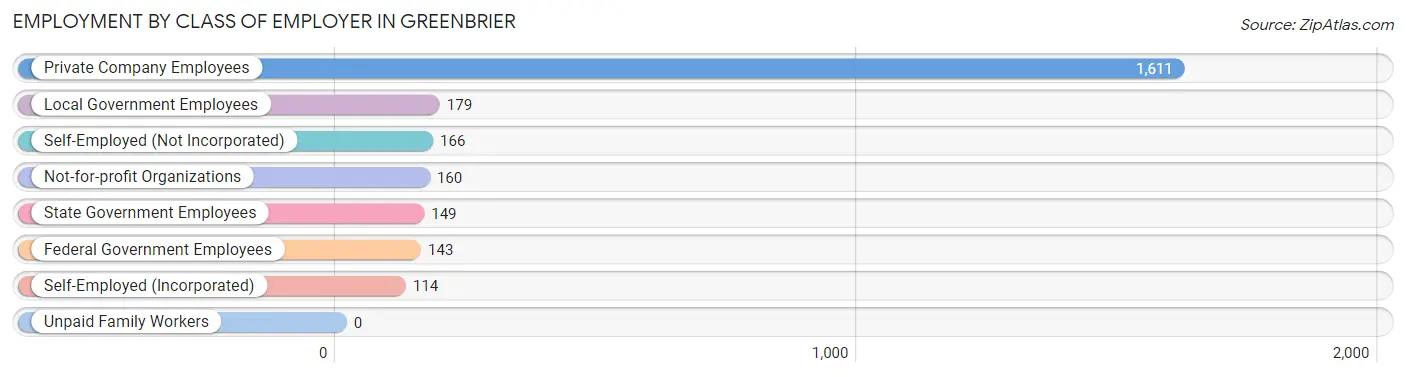
| Employer Class | # Employees | % Employees |
| Private Company Employees | 1,611 | 63.9% |
| Self-Employed (Incorporated) | 114 | 4.5% |
| Self-Employed (Not Incorporated) | 166 | 6.6% |
| Not-for-profit Organizations | 160 | 6.3% |
| Local Government Employees | 179 | 7.1% |
| State Government Employees | 149 | 5.9% |
| Federal Government Employees | 143 | 5.7% |
| Unpaid Family Workers | 0 | 0.0% |
| Total | 2,522 | 100.0% |
Employment Status by Age in Greenbrier
According to the labor force statistics for Greenbrier, out of the total population over 16 years of age (4,270), 61.3% or 2,618 individuals are in the labor force, with 1.8% or 47 of them unemployed. The age group with the highest labor force participation rate is 35 to 44 years, with 93.3% or 525 individuals in the labor force. Within the labor force, the 20 to 24 years age range has the highest percentage of unemployed individuals, with 15.7% or 32 of them being unemployed.
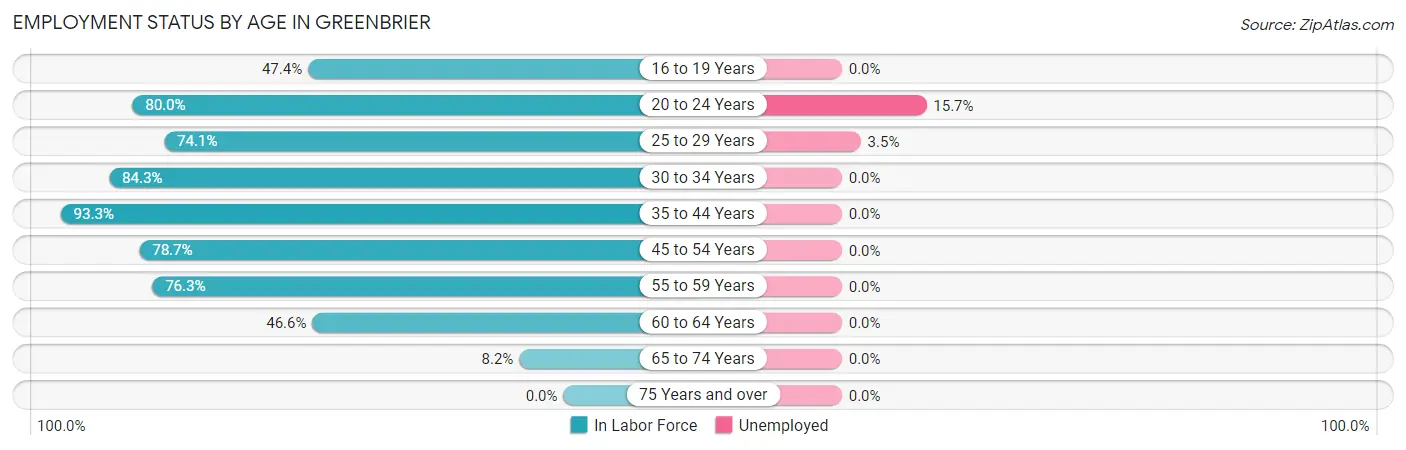
| Age Bracket | In Labor Force | Unemployed |
| 16 to 19 Years | 100 (47.4%) | 0 (0.0%) |
| 20 to 24 Years | 204 (80.0%) | 32 (15.7%) |
| 25 to 29 Years | 400 (74.1%) | 14 (3.5%) |
| 30 to 34 Years | 607 (84.3%) | 0 (0.0%) |
| 35 to 44 Years | 525 (93.3%) | 0 (0.0%) |
| 45 to 54 Years | 459 (78.7%) | 0 (0.0%) |
| 55 to 59 Years | 174 (76.3%) | 0 (0.0%) |
| 60 to 64 Years | 103 (46.6%) | 0 (0.0%) |
| 65 to 74 Years | 45 (8.2%) | 0 (0.0%) |
| 75 Years and over | 0 (0.0%) | 0 (0.0%) |
| Total | 2,618 (61.3%) | 47 (1.8%) |
Employment Status by Educational Attainment in Greenbrier
According to labor force statistics for Greenbrier, 79.4% of individuals (2,267) out of the total population between 25 and 64 years of age (2,855) are in the labor force, with 0.7% or 16 of them being unemployed. The group with the highest labor force participation rate are those with the educational attainment of college / associate degree, with 83.7% or 940 individuals in the labor force. Within the labor force, individuals with high school diploma education have the highest percentage of unemployment, with 1.8% or 14 of them being unemployed.
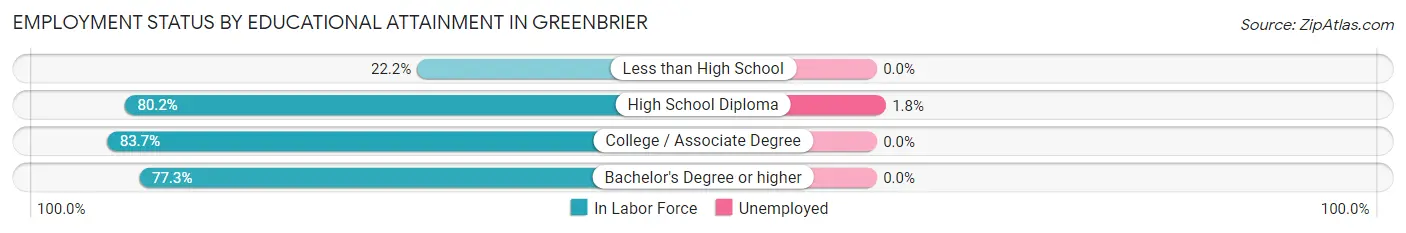
| Educational Attainment | In Labor Force | Unemployed |
| Less than High School | 16 (22.2%) | 0 (0.0%) |
| High School Diploma | 800 (80.2%) | 18 (1.8%) |
| College / Associate Degree | 940 (83.7%) | 0 (0.0%) |
| Bachelor's Degree or higher | 512 (77.3%) | 0 (0.0%) |
| Total | 2,267 (79.4%) | 20 (0.7%) |
Employment Occupations by Sex in Greenbrier
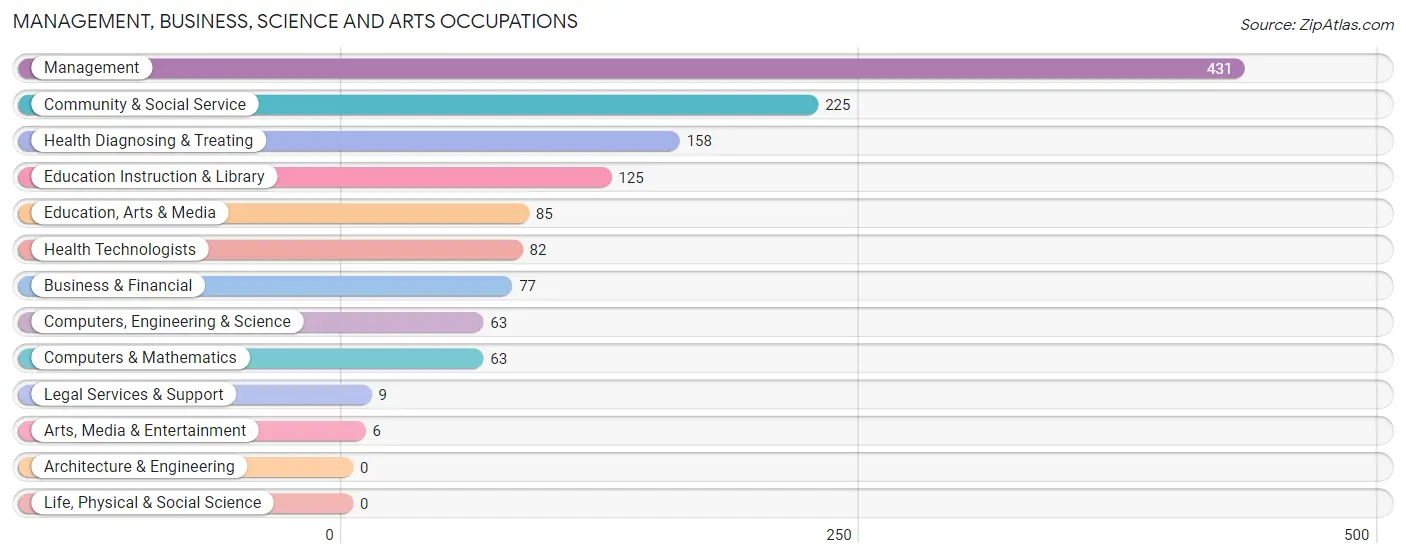
Management, Business, Science and Arts Occupations
The most common Management, Business, Science and Arts occupations in Greenbrier are Management (431 | 17.6%), Community & Social Service (225 | 9.2%), Health Diagnosing & Treating (158 | 6.5%), Education Instruction & Library (125 | 5.1%), and Education, Arts & Media (85 | 3.5%).
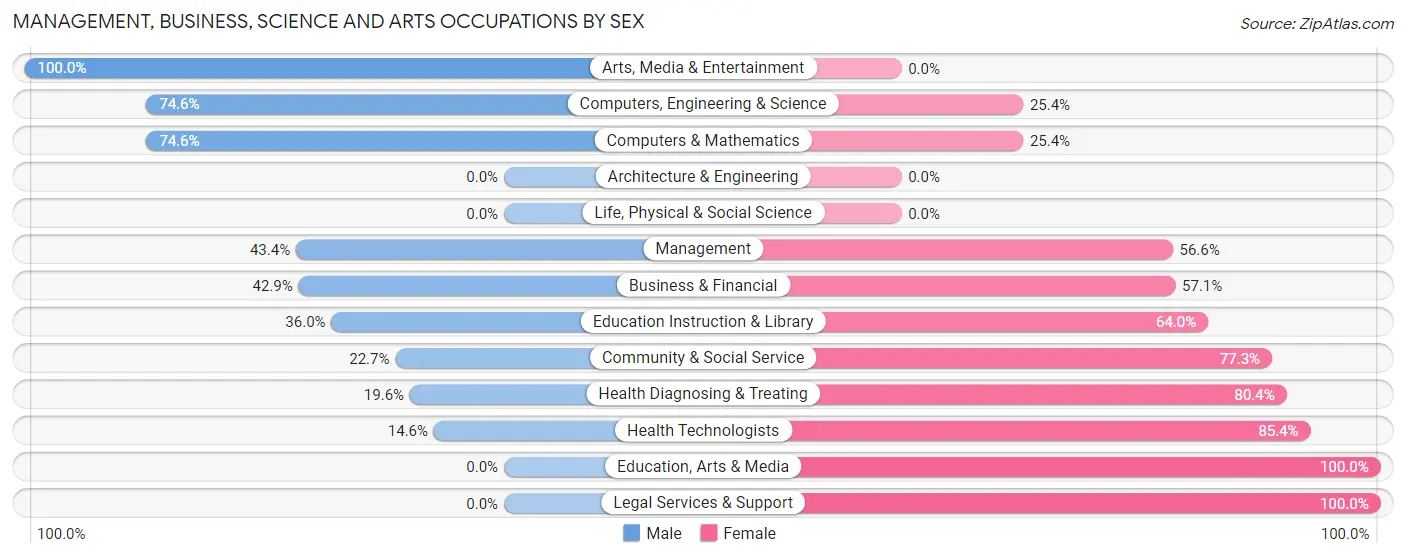
Management, Business, Science and Arts Occupations by Sex
Within the Management, Business, Science and Arts occupations in Greenbrier, the most male-oriented occupations are Arts, Media & Entertainment (100.0%), Computers, Engineering & Science (74.6%), and Computers & Mathematics (74.6%), while the most female-oriented occupations are Education, Arts & Media (100.0%), Legal Services & Support (100.0%), and Health Technologists (85.4%).
| Occupation | Male | Female |
| Management | 187 (43.4%) | 244 (56.6%) |
| Business & Financial | 33 (42.9%) | 44 (57.1%) |
| Computers, Engineering & Science | 47 (74.6%) | 16 (25.4%) |
| Computers & Mathematics | 47 (74.6%) | 16 (25.4%) |
| Architecture & Engineering | 0 (0.0%) | 0 (0.0%) |
| Life, Physical & Social Science | 0 (0.0%) | 0 (0.0%) |
| Community & Social Service | 51 (22.7%) | 174 (77.3%) |
| Education, Arts & Media | 0 (0.0%) | 85 (100.0%) |
| Legal Services & Support | 0 (0.0%) | 9 (100.0%) |
| Education Instruction & Library | 45 (36.0%) | 80 (64.0%) |
| Arts, Media & Entertainment | 6 (100.0%) | 0 (0.0%) |
| Health Diagnosing & Treating | 31 (19.6%) | 127 (80.4%) |
| Health Technologists | 12 (14.6%) | 70 (85.4%) |
| Total (Category) | 349 (36.6%) | 605 (63.4%) |
| Total (Overall) | 1,335 (54.6%) | 1,111 (45.4%) |
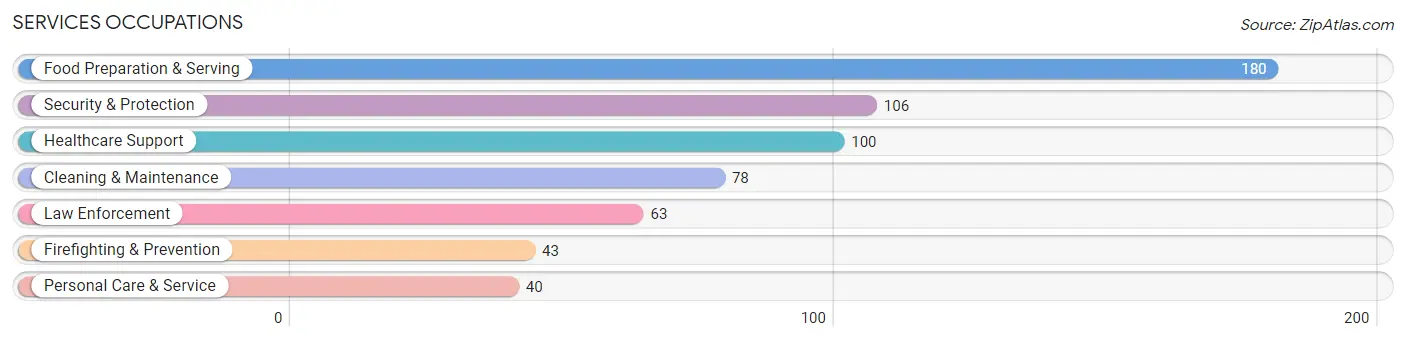
Services Occupations
The most common Services occupations in Greenbrier are Food Preparation & Serving (180 | 7.4%), Security & Protection (106 | 4.3%), Healthcare Support (100 | 4.1%), Cleaning & Maintenance (78 | 3.2%), and Law Enforcement (63 | 2.6%).
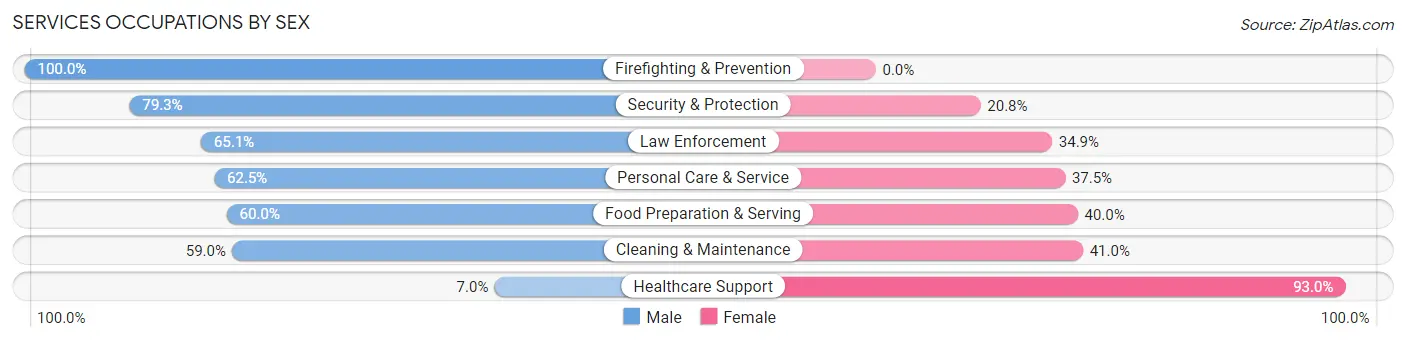
Services Occupations by Sex
Within the Services occupations in Greenbrier, the most male-oriented occupations are Firefighting & Prevention (100.0%), Security & Protection (79.2%), and Law Enforcement (65.1%), while the most female-oriented occupations are Healthcare Support (93.0%), Cleaning & Maintenance (41.0%), and Food Preparation & Serving (40.0%).
| Occupation | Male | Female |
| Healthcare Support | 7 (7.0%) | 93 (93.0%) |
| Security & Protection | 84 (79.2%) | 22 (20.7%) |
| Firefighting & Prevention | 43 (100.0%) | 0 (0.0%) |
| Law Enforcement | 41 (65.1%) | 22 (34.9%) |
| Food Preparation & Serving | 108 (60.0%) | 72 (40.0%) |
| Cleaning & Maintenance | 46 (59.0%) | 32 (41.0%) |
| Personal Care & Service | 25 (62.5%) | 15 (37.5%) |
| Total (Category) | 270 (53.6%) | 234 (46.4%) |
| Total (Overall) | 1,335 (54.6%) | 1,111 (45.4%) |
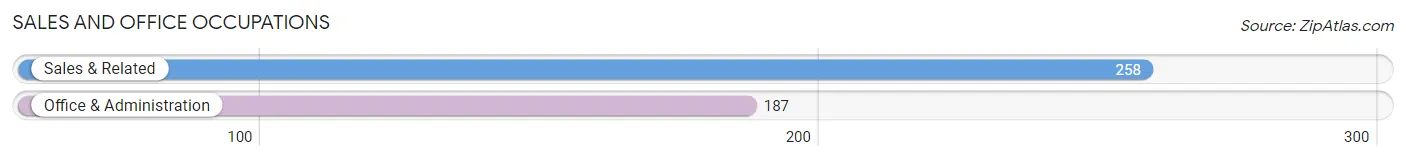
Sales and Office Occupations
The most common Sales and Office occupations in Greenbrier are Sales & Related (258 | 10.5%), and Office & Administration (187 | 7.6%).
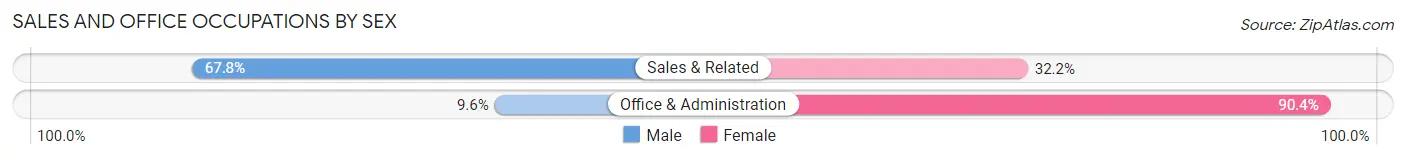
Sales and Office Occupations by Sex
| Occupation | Male | Female |
| Sales & Related | 175 (67.8%) | 83 (32.2%) |
| Office & Administration | 18 (9.6%) | 169 (90.4%) |
| Total (Category) | 193 (43.4%) | 252 (56.6%) |
| Total (Overall) | 1,335 (54.6%) | 1,111 (45.4%) |
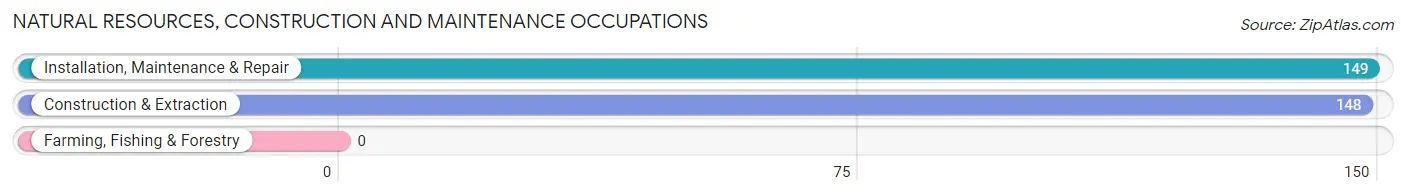
Natural Resources, Construction and Maintenance Occupations
The most common Natural Resources, Construction and Maintenance occupations in Greenbrier are Installation, Maintenance & Repair (149 | 6.1%), and Construction & Extraction (148 | 6.0%).
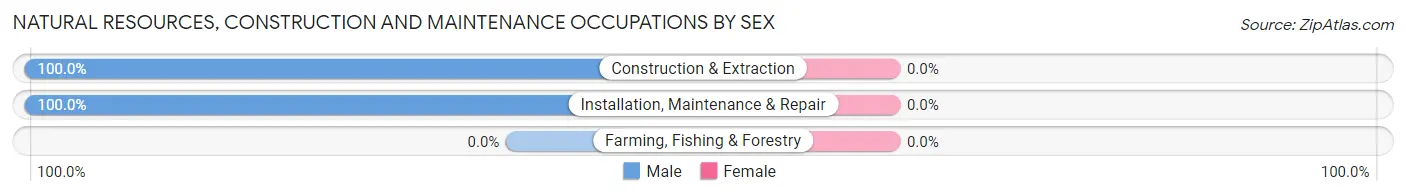
Natural Resources, Construction and Maintenance Occupations by Sex
| Occupation | Male | Female |
| Farming, Fishing & Forestry | 0 (0.0%) | 0 (0.0%) |
| Construction & Extraction | 148 (100.0%) | 0 (0.0%) |
| Installation, Maintenance & Repair | 149 (100.0%) | 0 (0.0%) |
| Total (Category) | 297 (100.0%) | 0 (0.0%) |
| Total (Overall) | 1,335 (54.6%) | 1,111 (45.4%) |
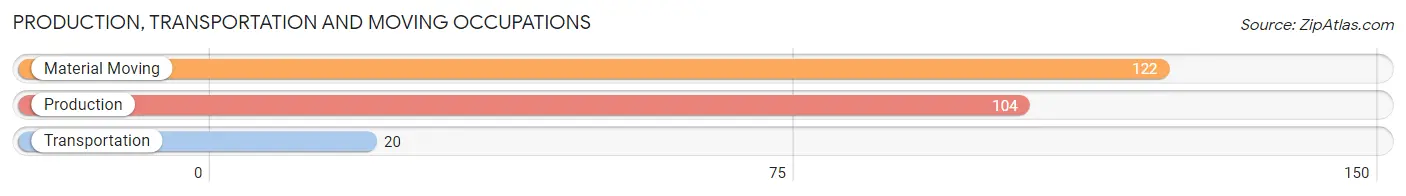
Production, Transportation and Moving Occupations
The most common Production, Transportation and Moving occupations in Greenbrier are Material Moving (122 | 5.0%), Production (104 | 4.3%), and Transportation (20 | 0.8%).
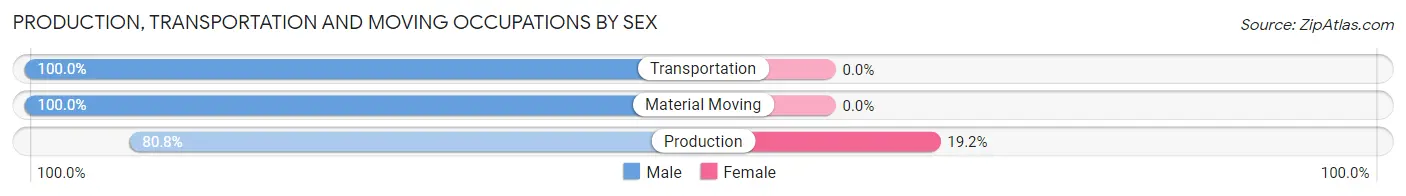
Production, Transportation and Moving Occupations by Sex
| Occupation | Male | Female |
| Production | 84 (80.8%) | 20 (19.2%) |
| Transportation | 20 (100.0%) | 0 (0.0%) |
| Material Moving | 122 (100.0%) | 0 (0.0%) |
| Total (Category) | 226 (91.9%) | 20 (8.1%) |
| Total (Overall) | 1,335 (54.6%) | 1,111 (45.4%) |
Employment Industries by Sex in Greenbrier
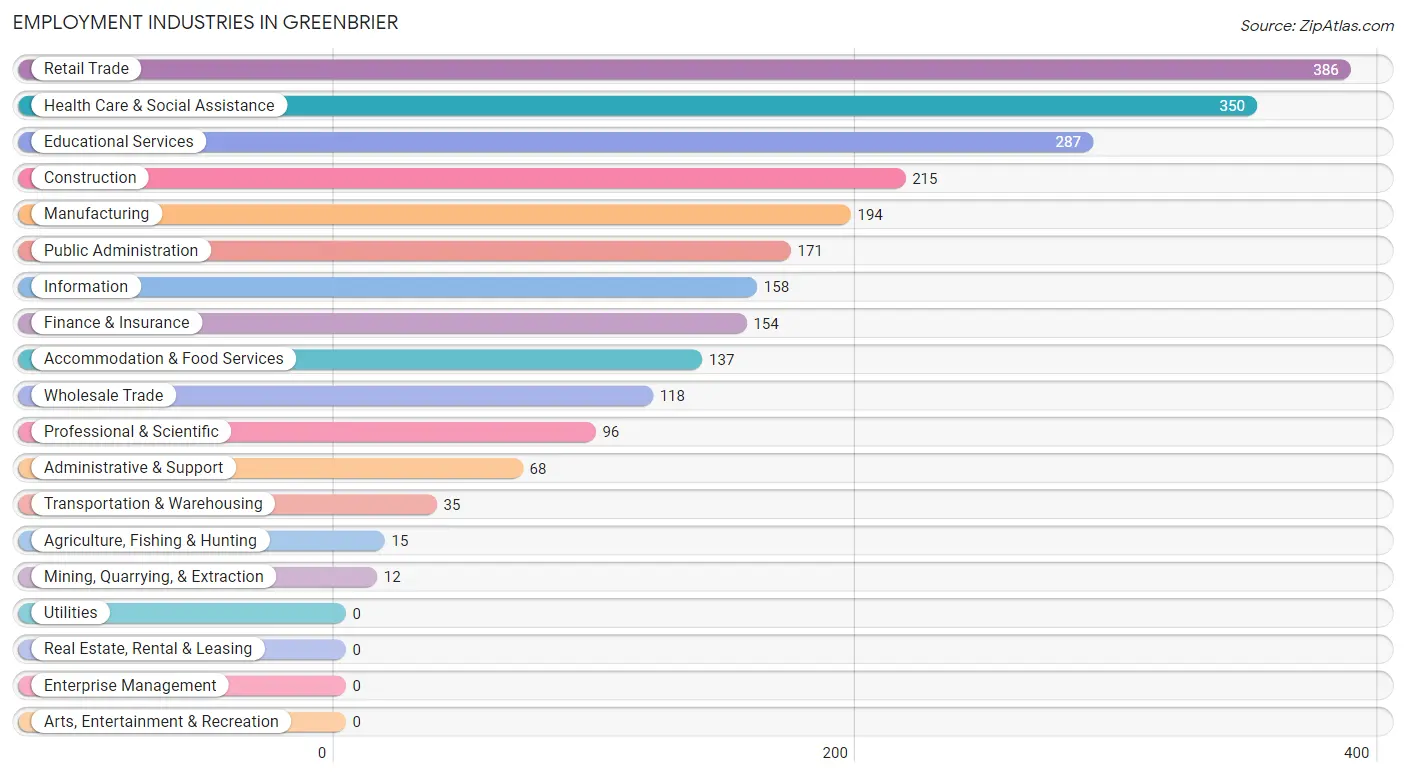
Employment Industries in Greenbrier
The major employment industries in Greenbrier include Retail Trade (386 | 15.8%), Health Care & Social Assistance (350 | 14.3%), Educational Services (287 | 11.7%), Construction (215 | 8.8%), and Manufacturing (194 | 7.9%).
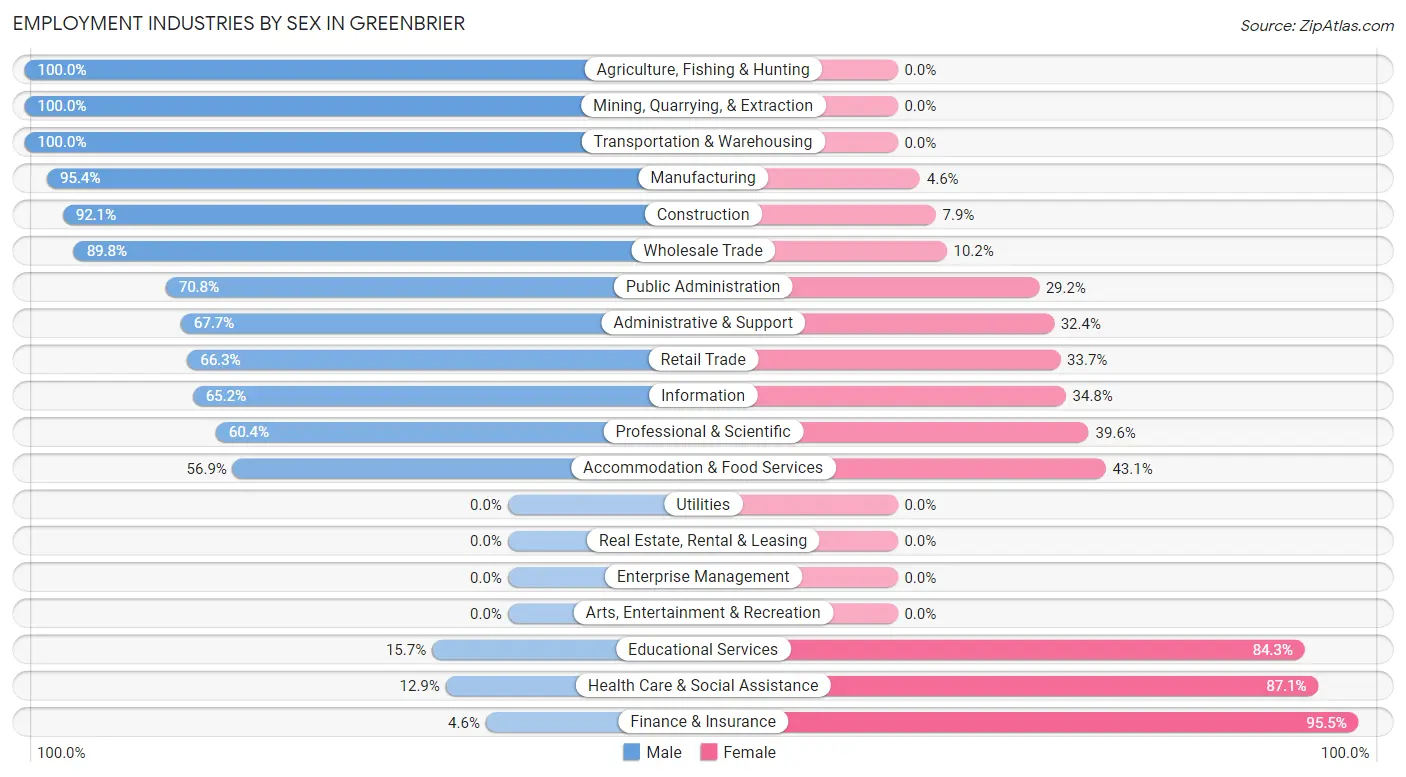
Employment Industries by Sex in Greenbrier
The Greenbrier industries that see more men than women are Agriculture, Fishing & Hunting (100.0%), Mining, Quarrying, & Extraction (100.0%), and Transportation & Warehousing (100.0%), whereas the industries that tend to have a higher number of women are Finance & Insurance (95.5%), Health Care & Social Assistance (87.1%), and Educational Services (84.3%).
| Industry | Male | Female |
| Agriculture, Fishing & Hunting | 15 (100.0%) | 0 (0.0%) |
| Mining, Quarrying, & Extraction | 12 (100.0%) | 0 (0.0%) |
| Construction | 198 (92.1%) | 17 (7.9%) |
| Manufacturing | 185 (95.4%) | 9 (4.6%) |
| Wholesale Trade | 106 (89.8%) | 12 (10.2%) |
| Retail Trade | 256 (66.3%) | 130 (33.7%) |
| Transportation & Warehousing | 35 (100.0%) | 0 (0.0%) |
| Utilities | 0 (0.0%) | 0 (0.0%) |
| Information | 103 (65.2%) | 55 (34.8%) |
| Finance & Insurance | 7 (4.5%) | 147 (95.5%) |
| Real Estate, Rental & Leasing | 0 (0.0%) | 0 (0.0%) |
| Professional & Scientific | 58 (60.4%) | 38 (39.6%) |
| Enterprise Management | 0 (0.0%) | 0 (0.0%) |
| Administrative & Support | 46 (67.6%) | 22 (32.4%) |
| Educational Services | 45 (15.7%) | 242 (84.3%) |
| Health Care & Social Assistance | 45 (12.9%) | 305 (87.1%) |
| Arts, Entertainment & Recreation | 0 (0.0%) | 0 (0.0%) |
| Accommodation & Food Services | 78 (56.9%) | 59 (43.1%) |
| Public Administration | 121 (70.8%) | 50 (29.2%) |
| Total | 1,335 (54.6%) | 1,111 (45.4%) |
Education in Greenbrier
School Enrollment in Greenbrier
The most common levels of schooling among the 1,450 students in Greenbrier are middle school (374 | 25.8%), elementary school (344 | 23.7%), and college / undergraduate (253 | 17.4%).
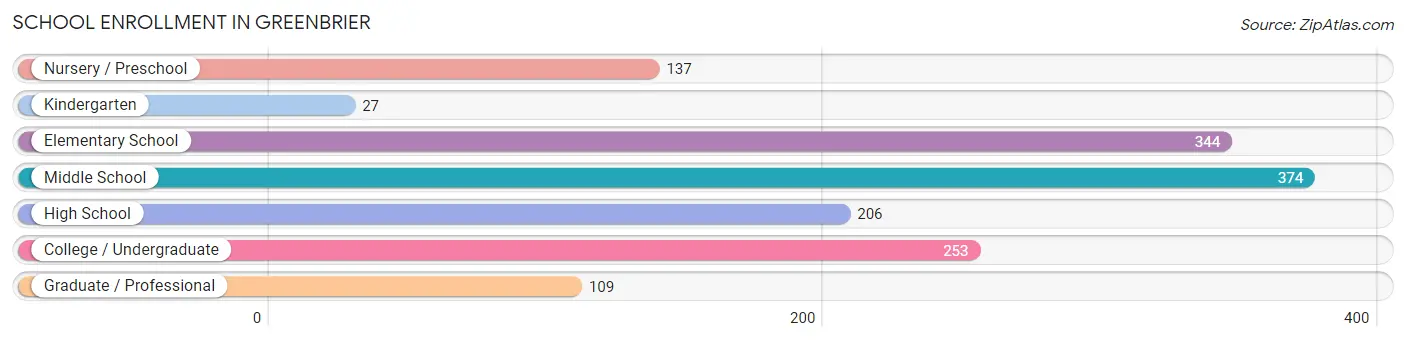
| School Level | # Students | % Students |
| Nursery / Preschool | 137 | 9.5% |
| Kindergarten | 27 | 1.9% |
| Elementary School | 344 | 23.7% |
| Middle School | 374 | 25.8% |
| High School | 206 | 14.2% |
| College / Undergraduate | 253 | 17.4% |
| Graduate / Professional | 109 | 7.5% |
| Total | 1,450 | 100.0% |
School Enrollment by Age by Funding Source in Greenbrier
Out of a total of 1,450 students who are enrolled in schools in Greenbrier, 106 (7.3%) attend a private institution, while the remaining 1,344 (92.7%) are enrolled in public schools. The age group of 3 to 4 year olds has the highest likelihood of being enrolled in private schools, with 53 (57.0% in the age bracket) enrolled. Conversely, the age group of 15 to 17 year olds has the lowest likelihood of being enrolled in a private school, with 153 (100.0% in the age bracket) attending a public institution.
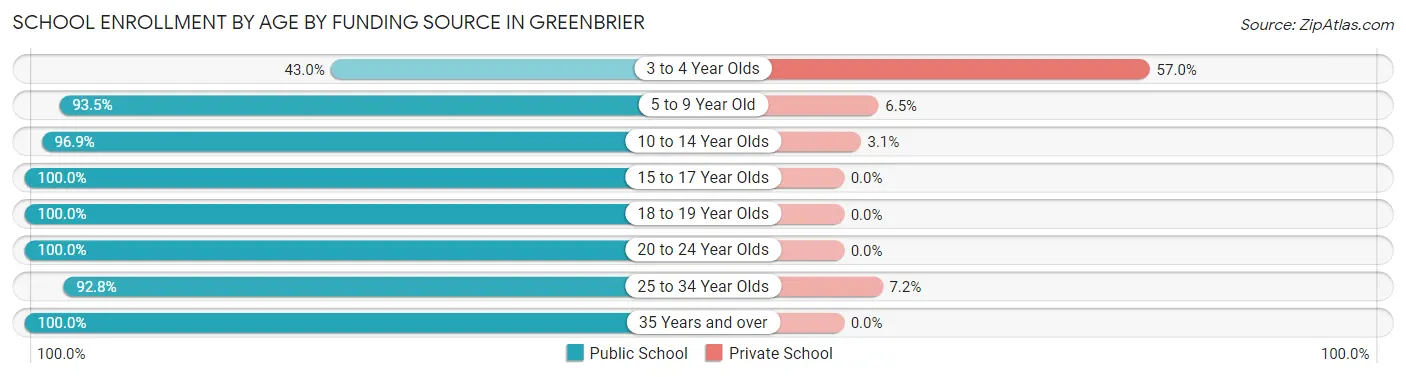
| Age Bracket | Public School | Private School |
| 3 to 4 Year Olds | 40 (43.0%) | 53 (57.0%) |
| 5 to 9 Year Old | 362 (93.5%) | 25 (6.5%) |
| 10 to 14 Year Olds | 432 (96.9%) | 14 (3.1%) |
| 15 to 17 Year Olds | 153 (100.0%) | 0 (0.0%) |
| 18 to 19 Year Olds | 27 (100.0%) | 0 (0.0%) |
| 20 to 24 Year Olds | 66 (100.0%) | 0 (0.0%) |
| 25 to 34 Year Olds | 180 (92.8%) | 14 (7.2%) |
| 35 Years and over | 84 (100.0%) | 0 (0.0%) |
| Total | 1,344 (92.7%) | 106 (7.3%) |
Educational Attainment by Field of Study in Greenbrier
Business (169 | 21.1%), education (118 | 14.8%), science & technology (107 | 13.4%), psychology (105 | 13.1%), and liberal arts & history (58 | 7.3%) are the most common fields of study among 799 individuals in Greenbrier who have obtained a bachelor's degree or higher.
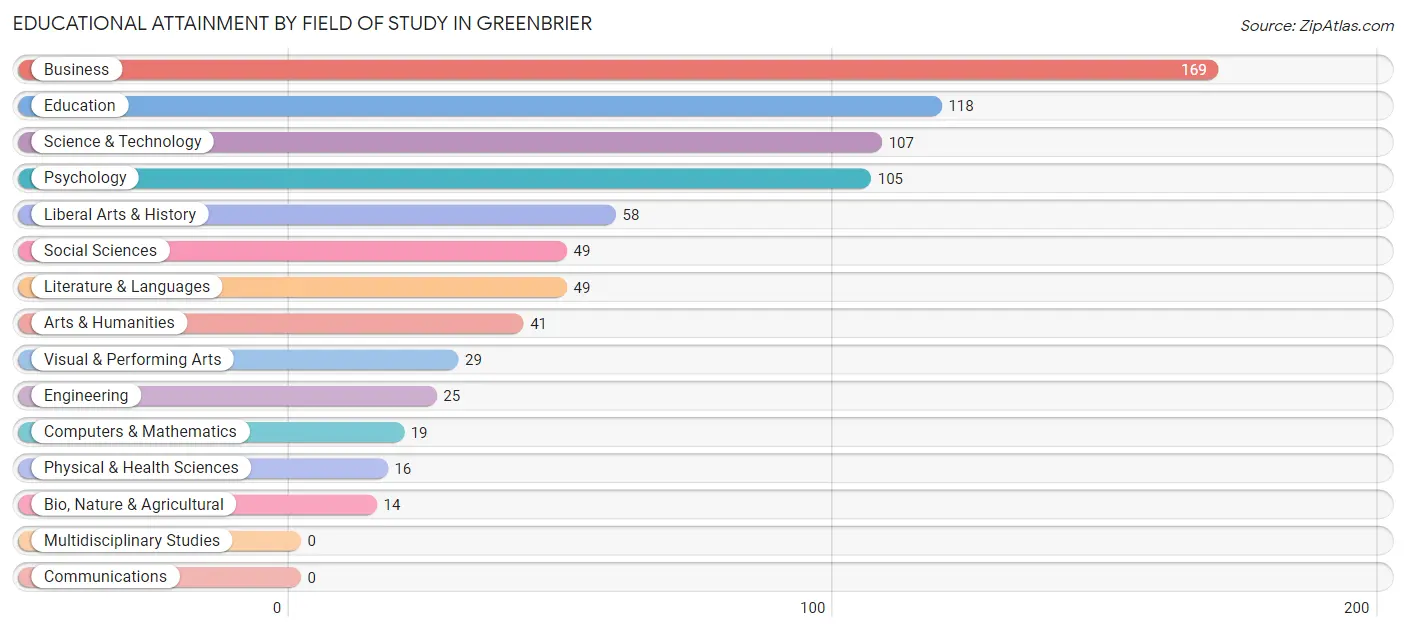
| Field of Study | # Graduates | % Graduates |
| Computers & Mathematics | 19 | 2.4% |
| Bio, Nature & Agricultural | 14 | 1.8% |
| Physical & Health Sciences | 16 | 2.0% |
| Psychology | 105 | 13.1% |
| Social Sciences | 49 | 6.1% |
| Engineering | 25 | 3.1% |
| Multidisciplinary Studies | 0 | 0.0% |
| Science & Technology | 107 | 13.4% |
| Business | 169 | 21.1% |
| Education | 118 | 14.8% |
| Literature & Languages | 49 | 6.1% |
| Liberal Arts & History | 58 | 7.3% |
| Visual & Performing Arts | 29 | 3.6% |
| Communications | 0 | 0.0% |
| Arts & Humanities | 41 | 5.1% |
| Total | 799 | 100.0% |
Transportation & Commute in Greenbrier
Vehicle Availability by Sex in Greenbrier
The most prevalent vehicle ownership categories in Greenbrier are males with 2 vehicles (811, accounting for 57.5%) and females with 2 vehicles (595, making up 73.0%).
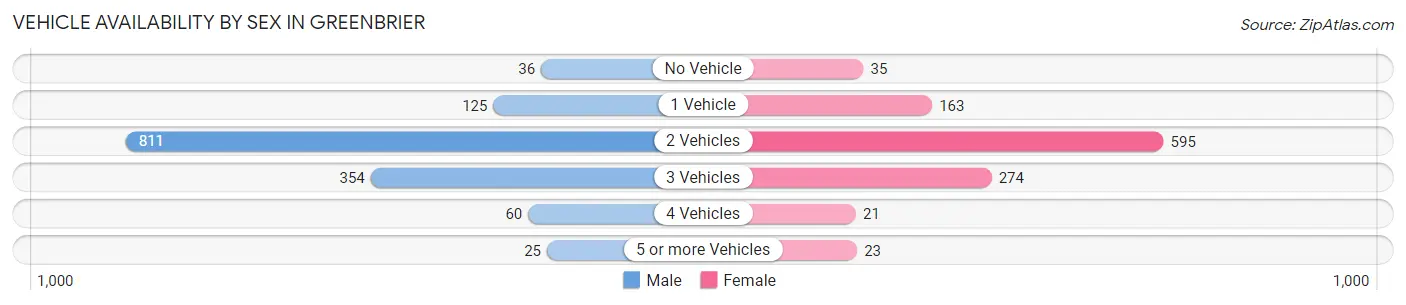
| Vehicles Available | Male | Female |
| No Vehicle | 36 (2.5%) | 35 (3.2%) |
| 1 Vehicle | 125 (8.9%) | 163 (14.7%) |
| 2 Vehicles | 811 (57.5%) | 595 (53.6%) |
| 3 Vehicles | 354 (25.1%) | 274 (24.7%) |
| 4 Vehicles | 60 (4.3%) | 21 (1.9%) |
| 5 or more Vehicles | 25 (1.8%) | 23 (2.1%) |
| Total | 1,411 (100.0%) | 1,111 (100.0%) |
Commute Time in Greenbrier
The most frequently occuring commute durations in Greenbrier are 15 to 19 minutes (402 commuters, 16.8%), 45 to 59 minutes (338 commuters, 14.1%), and 30 to 34 minutes (331 commuters, 13.8%).
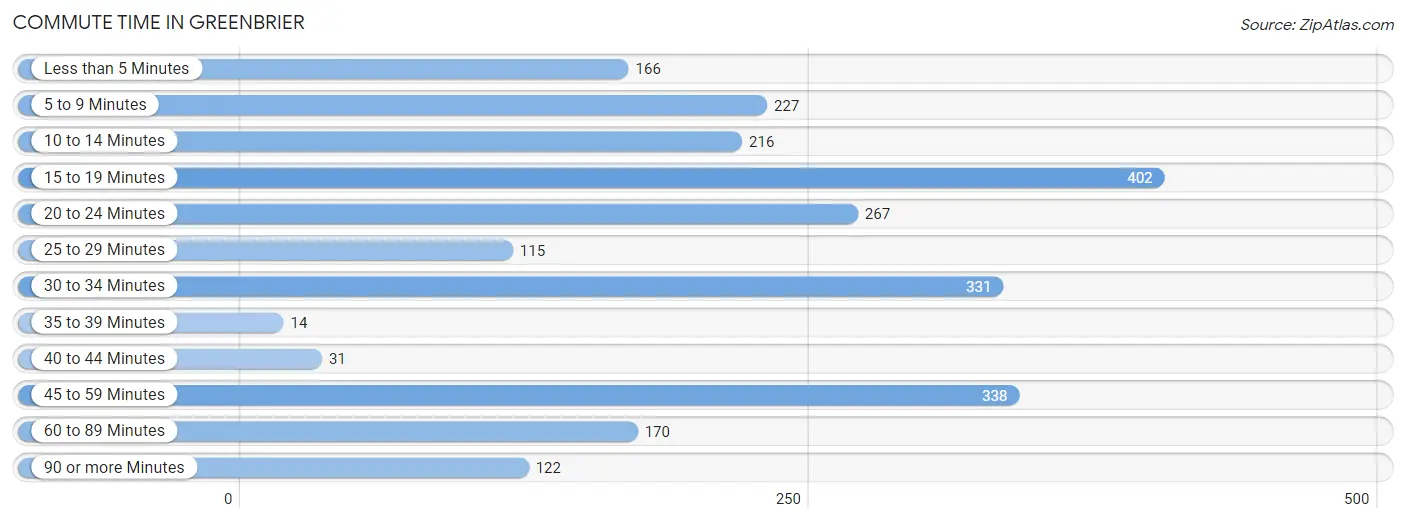
| Commute Time | # Commuters | % Commuters |
| Less than 5 Minutes | 166 | 6.9% |
| 5 to 9 Minutes | 227 | 9.5% |
| 10 to 14 Minutes | 216 | 9.0% |
| 15 to 19 Minutes | 402 | 16.8% |
| 20 to 24 Minutes | 267 | 11.1% |
| 25 to 29 Minutes | 115 | 4.8% |
| 30 to 34 Minutes | 331 | 13.8% |
| 35 to 39 Minutes | 14 | 0.6% |
| 40 to 44 Minutes | 31 | 1.3% |
| 45 to 59 Minutes | 338 | 14.1% |
| 60 to 89 Minutes | 170 | 7.1% |
| 90 or more Minutes | 122 | 5.1% |
Commute Time by Sex in Greenbrier
The most common commute times in Greenbrier are 45 to 59 minutes (304 commuters, 23.0%) for males and 15 to 19 minutes (225 commuters, 20.8%) for females.
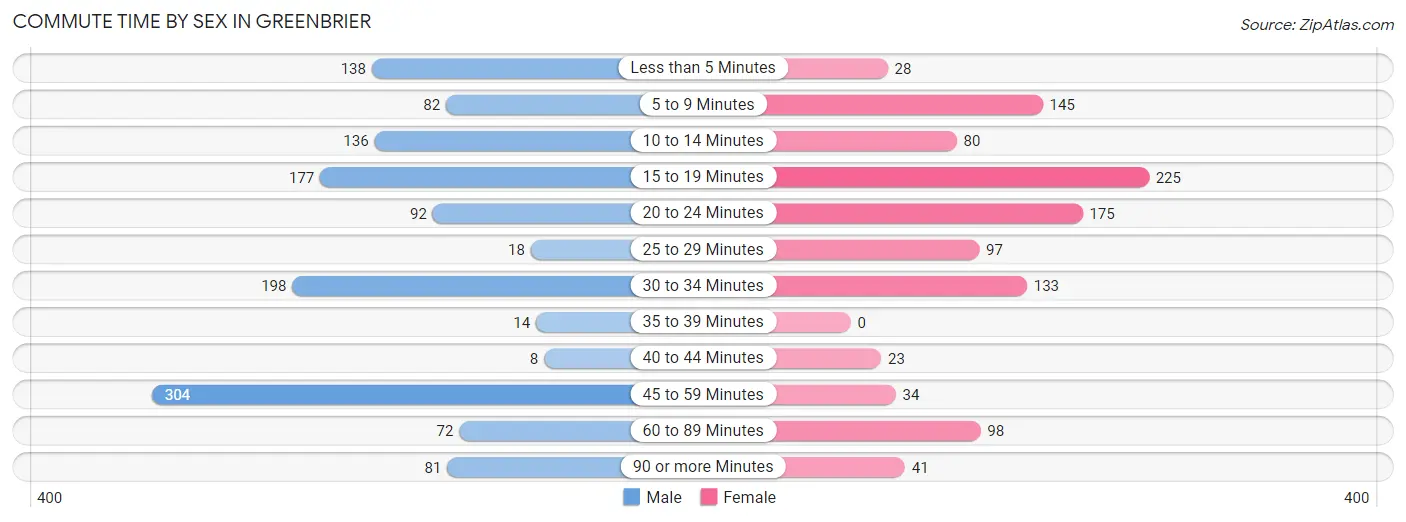
| Commute Time | Male | Female |
| Less than 5 Minutes | 138 (10.4%) | 28 (2.6%) |
| 5 to 9 Minutes | 82 (6.2%) | 145 (13.4%) |
| 10 to 14 Minutes | 136 (10.3%) | 80 (7.4%) |
| 15 to 19 Minutes | 177 (13.4%) | 225 (20.8%) |
| 20 to 24 Minutes | 92 (7.0%) | 175 (16.2%) |
| 25 to 29 Minutes | 18 (1.4%) | 97 (9.0%) |
| 30 to 34 Minutes | 198 (15.0%) | 133 (12.3%) |
| 35 to 39 Minutes | 14 (1.1%) | 0 (0.0%) |
| 40 to 44 Minutes | 8 (0.6%) | 23 (2.1%) |
| 45 to 59 Minutes | 304 (23.0%) | 34 (3.2%) |
| 60 to 89 Minutes | 72 (5.4%) | 98 (9.1%) |
| 90 or more Minutes | 81 (6.1%) | 41 (3.8%) |
Time of Departure to Work by Sex in Greenbrier
The most frequent times of departure to work in Greenbrier are 12:00 AM to 4:59 AM (294, 22.3%) for males and 7:00 AM to 7:29 AM (296, 27.4%) for females.
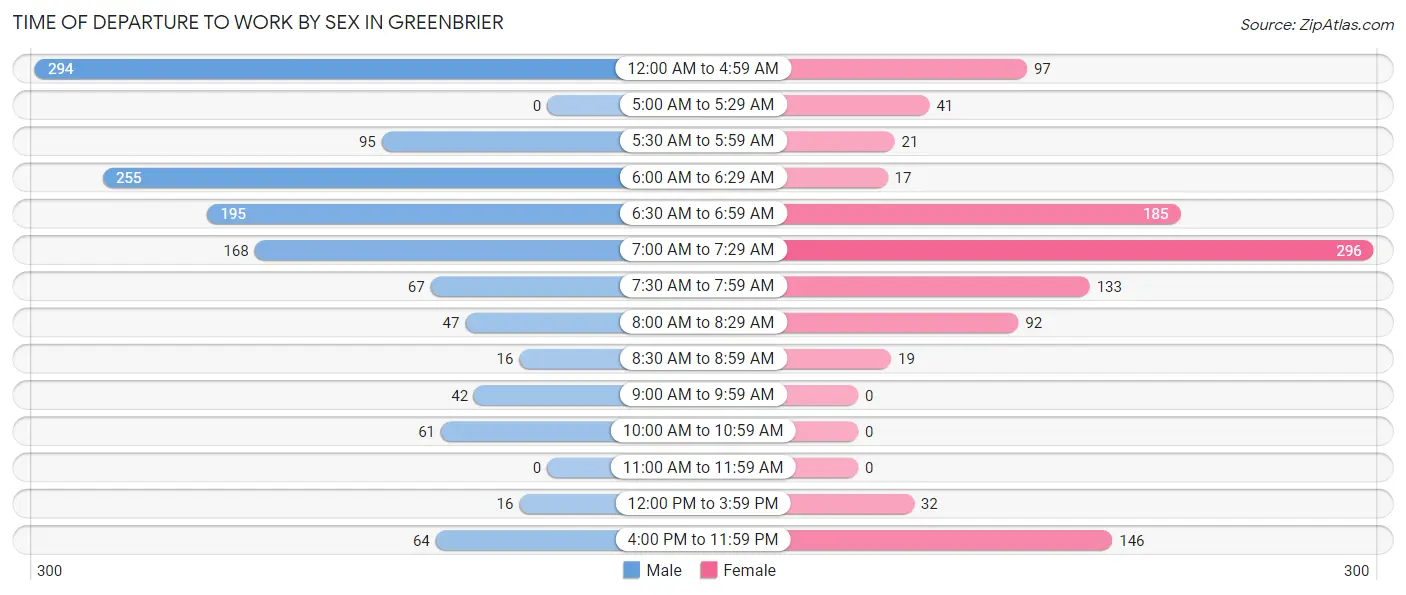
| Time of Departure | Male | Female |
| 12:00 AM to 4:59 AM | 294 (22.3%) | 97 (9.0%) |
| 5:00 AM to 5:29 AM | 0 (0.0%) | 41 (3.8%) |
| 5:30 AM to 5:59 AM | 95 (7.2%) | 21 (1.9%) |
| 6:00 AM to 6:29 AM | 255 (19.3%) | 17 (1.6%) |
| 6:30 AM to 6:59 AM | 195 (14.8%) | 185 (17.2%) |
| 7:00 AM to 7:29 AM | 168 (12.7%) | 296 (27.4%) |
| 7:30 AM to 7:59 AM | 67 (5.1%) | 133 (12.3%) |
| 8:00 AM to 8:29 AM | 47 (3.6%) | 92 (8.5%) |
| 8:30 AM to 8:59 AM | 16 (1.2%) | 19 (1.8%) |
| 9:00 AM to 9:59 AM | 42 (3.2%) | 0 (0.0%) |
| 10:00 AM to 10:59 AM | 61 (4.6%) | 0 (0.0%) |
| 11:00 AM to 11:59 AM | 0 (0.0%) | 0 (0.0%) |
| 12:00 PM to 3:59 PM | 16 (1.2%) | 32 (3.0%) |
| 4:00 PM to 11:59 PM | 64 (4.9%) | 146 (13.5%) |
| Total | 1,320 (100.0%) | 1,079 (100.0%) |
Housing Occupancy in Greenbrier
Occupancy by Ownership in Greenbrier
Of the total 2,205 dwellings in Greenbrier, owner-occupied units account for 1,685 (76.4%), while renter-occupied units make up 520 (23.6%).
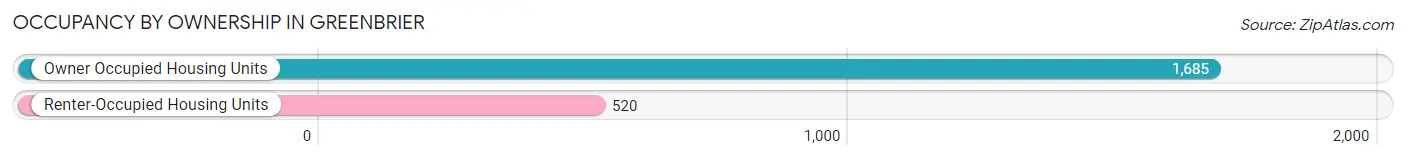
| Occupancy | # Housing Units | % Housing Units |
| Owner Occupied Housing Units | 1,685 | 76.4% |
| Renter-Occupied Housing Units | 520 | 23.6% |
| Total Occupied Housing Units | 2,205 | 100.0% |
Occupancy by Household Size in Greenbrier
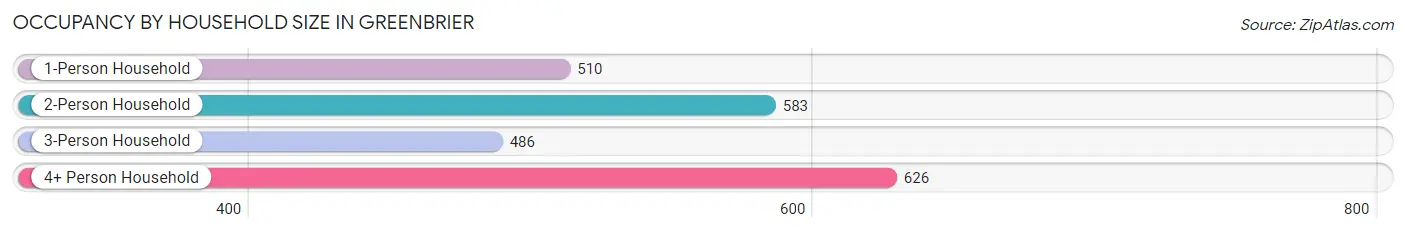
| Household Size | # Housing Units | % Housing Units |
| 1-Person Household | 510 | 23.1% |
| 2-Person Household | 583 | 26.4% |
| 3-Person Household | 486 | 22.0% |
| 4+ Person Household | 626 | 28.4% |
| Total Housing Units | 2,205 | 100.0% |
Occupancy by Ownership by Household Size in Greenbrier
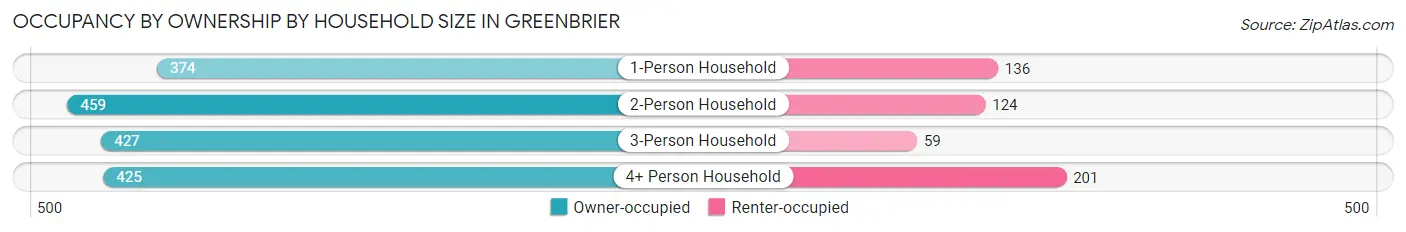
| Household Size | Owner-occupied | Renter-occupied |
| 1-Person Household | 374 (73.3%) | 136 (26.7%) |
| 2-Person Household | 459 (78.7%) | 124 (21.3%) |
| 3-Person Household | 427 (87.9%) | 59 (12.1%) |
| 4+ Person Household | 425 (67.9%) | 201 (32.1%) |
| Total Housing Units | 1,685 (76.4%) | 520 (23.6%) |
Occupancy by Educational Attainment in Greenbrier
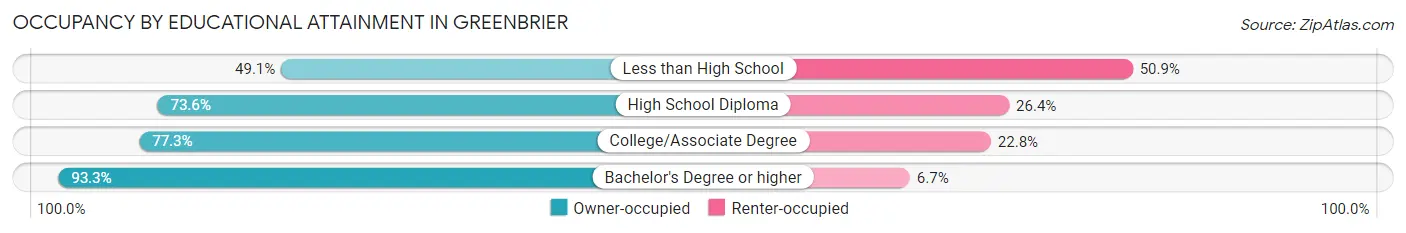
| Household Size | Owner-occupied | Renter-occupied |
| Less than High School | 57 (49.1%) | 59 (50.9%) |
| High School Diploma | 687 (73.6%) | 246 (26.4%) |
| College/Associate Degree | 662 (77.2%) | 195 (22.8%) |
| Bachelor's Degree or higher | 279 (93.3%) | 20 (6.7%) |
Occupancy by Age of Householder in Greenbrier
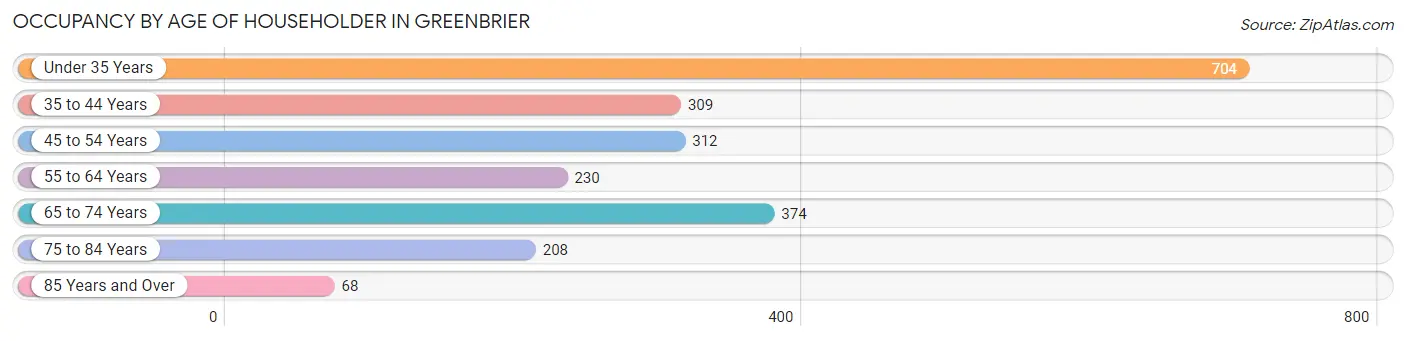
| Age Bracket | # Households | % Households |
| Under 35 Years | 704 | 31.9% |
| 35 to 44 Years | 309 | 14.0% |
| 45 to 54 Years | 312 | 14.1% |
| 55 to 64 Years | 230 | 10.4% |
| 65 to 74 Years | 374 | 17.0% |
| 75 to 84 Years | 208 | 9.4% |
| 85 Years and Over | 68 | 3.1% |
| Total | 2,205 | 100.0% |
Housing Finances in Greenbrier
Median Income by Occupancy in Greenbrier
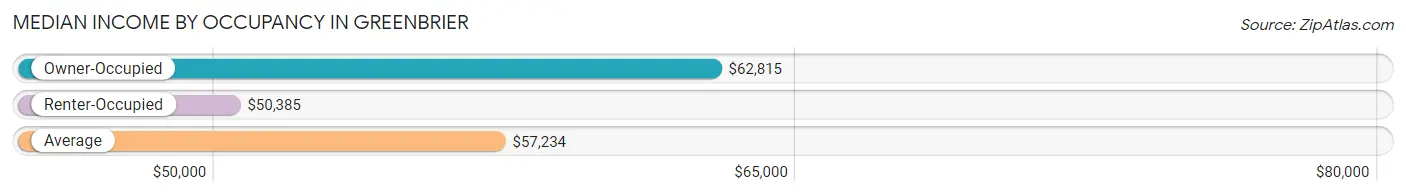
| Occupancy Type | # Households | Median Income |
| Owner-Occupied | 1,685 (76.4%) | $62,815 |
| Renter-Occupied | 520 (23.6%) | $50,385 |
| Average | 2,205 (100.0%) | $57,234 |
Occupancy by Householder Income Bracket in Greenbrier
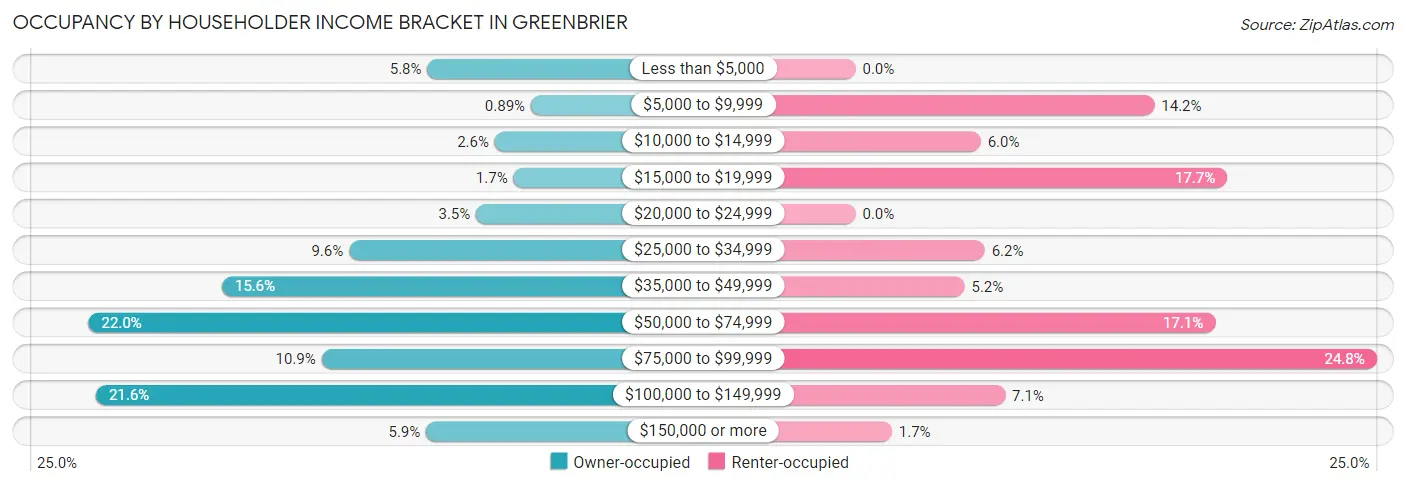
| Income Bracket | Owner-occupied | Renter-occupied |
| Less than $5,000 | 98 (5.8%) | 0 (0.0%) |
| $5,000 to $9,999 | 15 (0.9%) | 74 (14.2%) |
| $10,000 to $14,999 | 44 (2.6%) | 31 (6.0%) |
| $15,000 to $19,999 | 29 (1.7%) | 92 (17.7%) |
| $20,000 to $24,999 | 59 (3.5%) | 0 (0.0%) |
| $25,000 to $34,999 | 161 (9.6%) | 32 (6.1%) |
| $35,000 to $49,999 | 263 (15.6%) | 27 (5.2%) |
| $50,000 to $74,999 | 370 (22.0%) | 89 (17.1%) |
| $75,000 to $99,999 | 183 (10.9%) | 129 (24.8%) |
| $100,000 to $149,999 | 364 (21.6%) | 37 (7.1%) |
| $150,000 or more | 99 (5.9%) | 9 (1.7%) |
| Total | 1,685 (100.0%) | 520 (100.0%) |
Monthly Housing Cost Tiers in Greenbrier
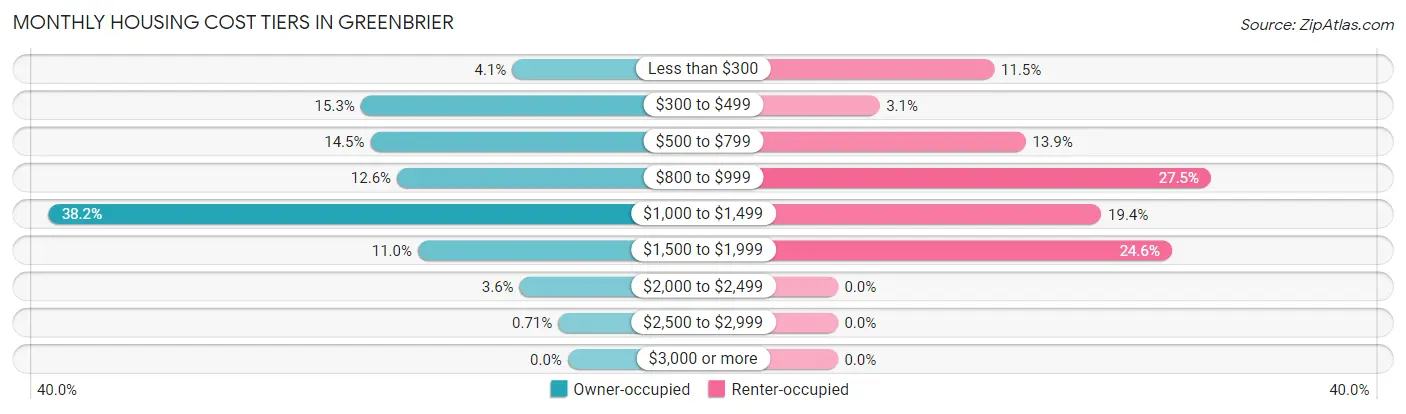
| Monthly Cost | Owner-occupied | Renter-occupied |
| Less than $300 | 69 (4.1%) | 60 (11.5%) |
| $300 to $499 | 257 (15.2%) | 16 (3.1%) |
| $500 to $799 | 245 (14.5%) | 72 (13.9%) |
| $800 to $999 | 212 (12.6%) | 143 (27.5%) |
| $1,000 to $1,499 | 644 (38.2%) | 101 (19.4%) |
| $1,500 to $1,999 | 186 (11.0%) | 128 (24.6%) |
| $2,000 to $2,499 | 60 (3.6%) | 0 (0.0%) |
| $2,500 to $2,999 | 12 (0.7%) | 0 (0.0%) |
| $3,000 or more | 0 (0.0%) | 0 (0.0%) |
| Total | 1,685 (100.0%) | 520 (100.0%) |
Physical Housing Characteristics in Greenbrier
Housing Structures in Greenbrier
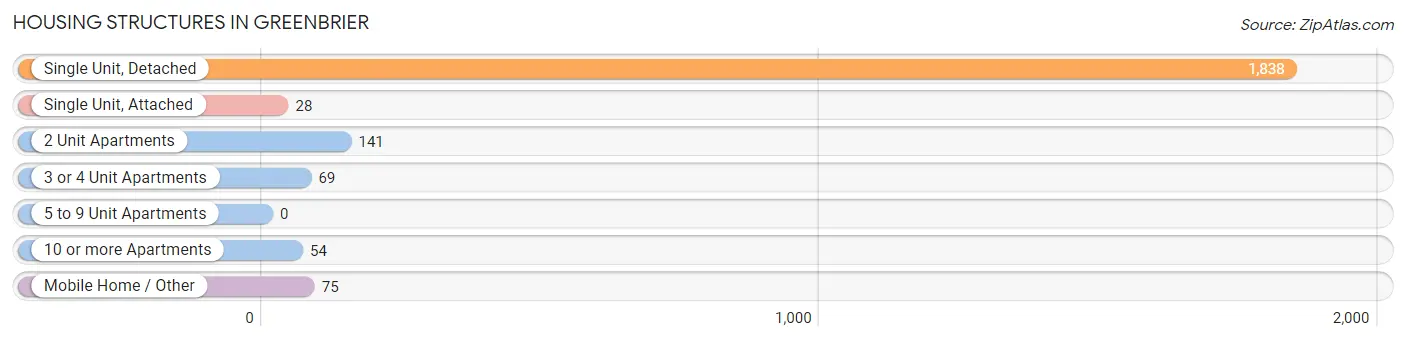
| Structure Type | # Housing Units | % Housing Units |
| Single Unit, Detached | 1,838 | 83.4% |
| Single Unit, Attached | 28 | 1.3% |
| 2 Unit Apartments | 141 | 6.4% |
| 3 or 4 Unit Apartments | 69 | 3.1% |
| 5 to 9 Unit Apartments | 0 | 0.0% |
| 10 or more Apartments | 54 | 2.5% |
| Mobile Home / Other | 75 | 3.4% |
| Total | 2,205 | 100.0% |
Housing Structures by Occupancy in Greenbrier
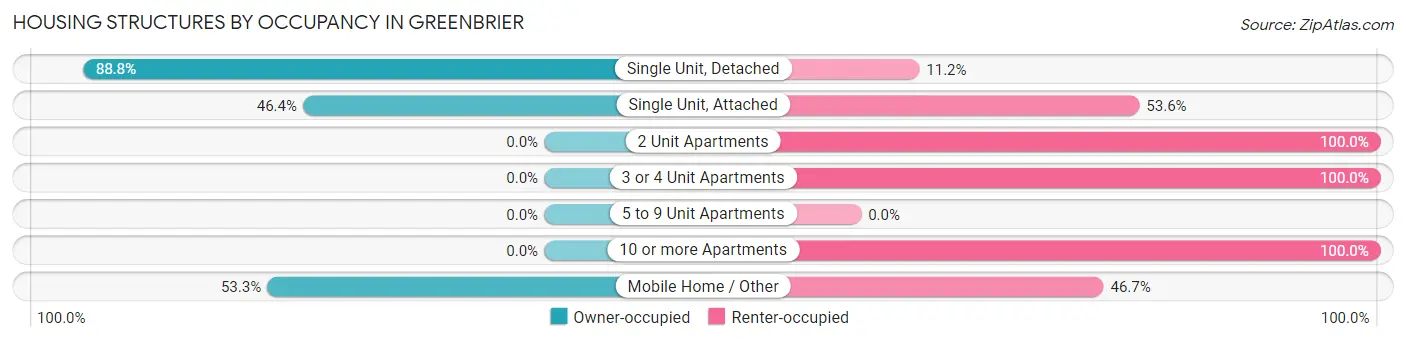
| Structure Type | Owner-occupied | Renter-occupied |
| Single Unit, Detached | 1,632 (88.8%) | 206 (11.2%) |
| Single Unit, Attached | 13 (46.4%) | 15 (53.6%) |
| 2 Unit Apartments | 0 (0.0%) | 141 (100.0%) |
| 3 or 4 Unit Apartments | 0 (0.0%) | 69 (100.0%) |
| 5 to 9 Unit Apartments | 0 (0.0%) | 0 (0.0%) |
| 10 or more Apartments | 0 (0.0%) | 54 (100.0%) |
| Mobile Home / Other | 40 (53.3%) | 35 (46.7%) |
| Total | 1,685 (76.4%) | 520 (23.6%) |
Housing Structures by Number of Rooms in Greenbrier
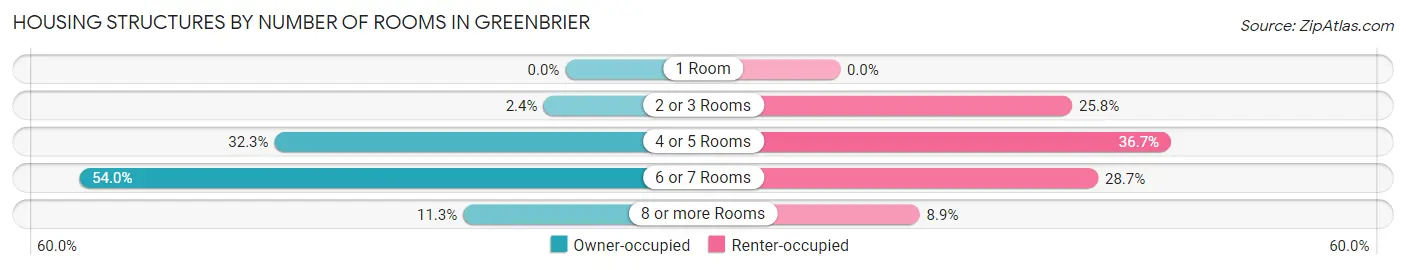
| Number of Rooms | Owner-occupied | Renter-occupied |
| 1 Room | 0 (0.0%) | 0 (0.0%) |
| 2 or 3 Rooms | 41 (2.4%) | 134 (25.8%) |
| 4 or 5 Rooms | 544 (32.3%) | 191 (36.7%) |
| 6 or 7 Rooms | 909 (53.9%) | 149 (28.6%) |
| 8 or more Rooms | 191 (11.3%) | 46 (8.8%) |
| Total | 1,685 (100.0%) | 520 (100.0%) |
Housing Structure by Heating Type in Greenbrier
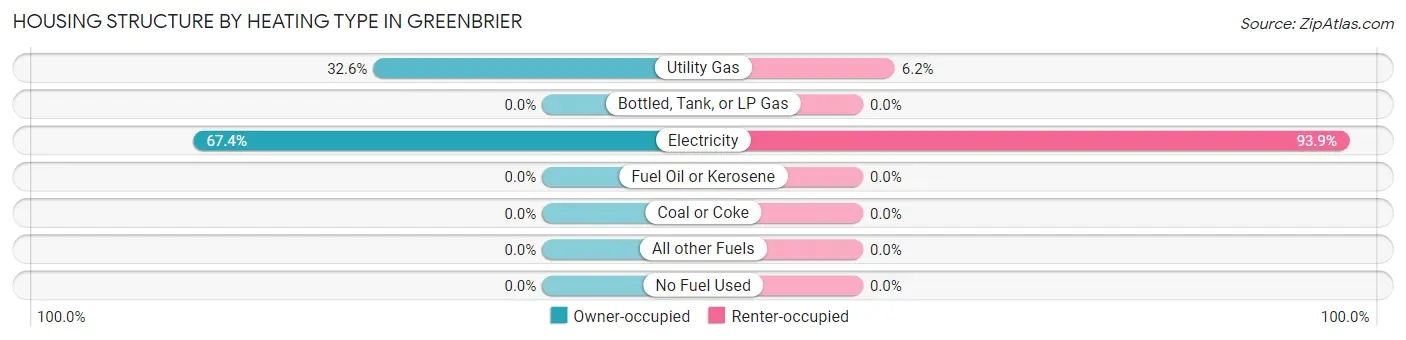
| Heating Type | Owner-occupied | Renter-occupied |
| Utility Gas | 550 (32.6%) | 32 (6.1%) |
| Bottled, Tank, or LP Gas | 0 (0.0%) | 0 (0.0%) |
| Electricity | 1,135 (67.4%) | 488 (93.9%) |
| Fuel Oil or Kerosene | 0 (0.0%) | 0 (0.0%) |
| Coal or Coke | 0 (0.0%) | 0 (0.0%) |
| All other Fuels | 0 (0.0%) | 0 (0.0%) |
| No Fuel Used | 0 (0.0%) | 0 (0.0%) |
| Total | 1,685 (100.0%) | 520 (100.0%) |
Household Vehicle Usage in Greenbrier
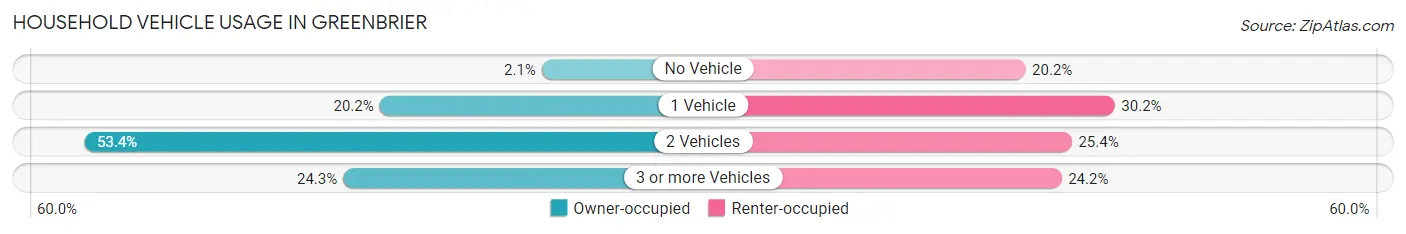
| Vehicles per Household | Owner-occupied | Renter-occupied |
| No Vehicle | 35 (2.1%) | 105 (20.2%) |
| 1 Vehicle | 341 (20.2%) | 157 (30.2%) |
| 2 Vehicles | 899 (53.3%) | 132 (25.4%) |
| 3 or more Vehicles | 410 (24.3%) | 126 (24.2%) |
| Total | 1,685 (100.0%) | 520 (100.0%) |
Real Estate & Mortgages in Greenbrier
Real Estate and Mortgage Overview in Greenbrier
| Characteristic | Without Mortgage | With Mortgage |
| Housing Units | 428 | 1,257 |
| Median Property Value | $149,000 | $174,100 |
| Median Household Income | $55,833 | $99 |
| Monthly Housing Costs | $369 | $0 |
| Real Estate Taxes | $751 | $81 |
Property Value by Mortgage Status in Greenbrier
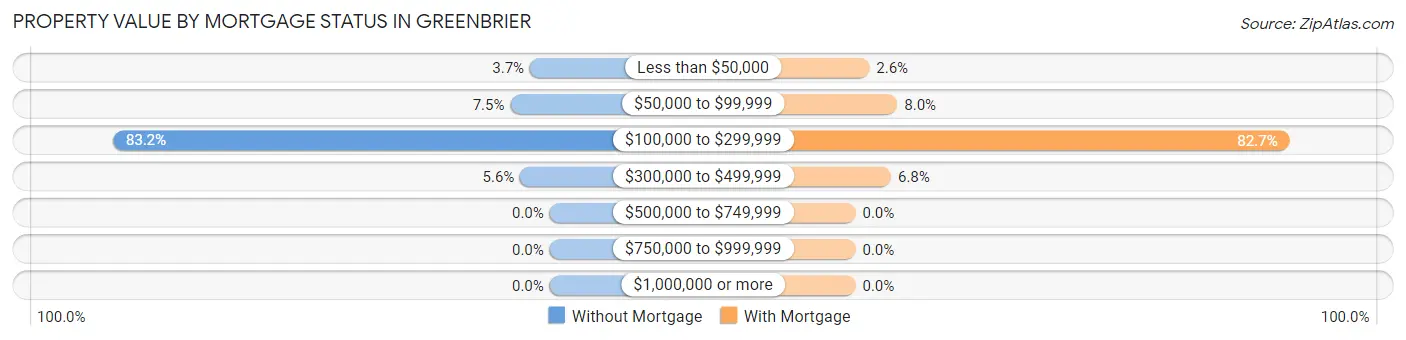
| Property Value | Without Mortgage | With Mortgage |
| Less than $50,000 | 16 (3.7%) | 33 (2.6%) |
| $50,000 to $99,999 | 32 (7.5%) | 100 (8.0%) |
| $100,000 to $299,999 | 356 (83.2%) | 1,039 (82.7%) |
| $300,000 to $499,999 | 24 (5.6%) | 85 (6.8%) |
| $500,000 to $749,999 | 0 (0.0%) | 0 (0.0%) |
| $750,000 to $999,999 | 0 (0.0%) | 0 (0.0%) |
| $1,000,000 or more | 0 (0.0%) | 0 (0.0%) |
| Total | 428 (100.0%) | 1,257 (100.0%) |
Household Income by Mortgage Status in Greenbrier
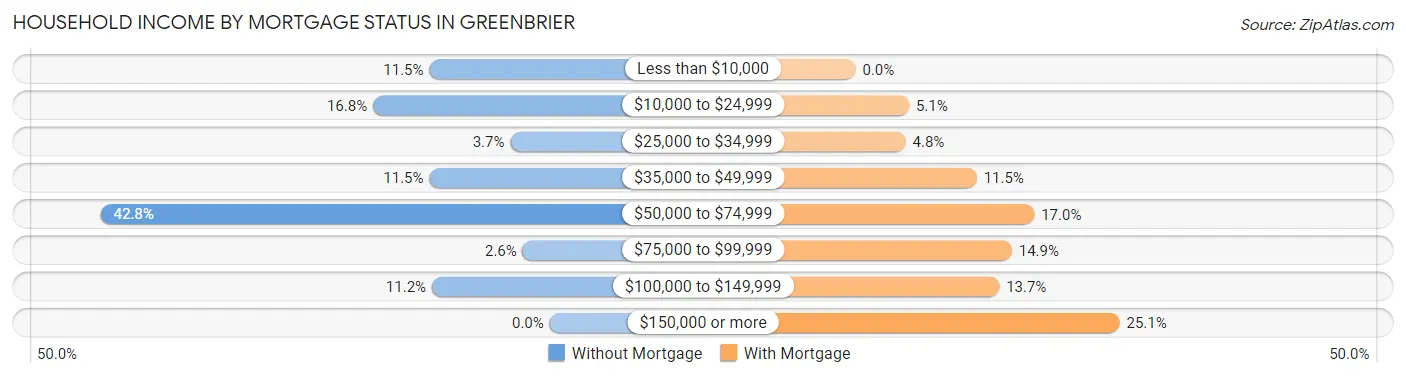
| Household Income | Without Mortgage | With Mortgage |
| Less than $10,000 | 49 (11.5%) | 0 (0.0%) |
| $10,000 to $24,999 | 72 (16.8%) | 64 (5.1%) |
| $25,000 to $34,999 | 16 (3.7%) | 60 (4.8%) |
| $35,000 to $49,999 | 49 (11.5%) | 145 (11.5%) |
| $50,000 to $74,999 | 183 (42.8%) | 214 (17.0%) |
| $75,000 to $99,999 | 11 (2.6%) | 187 (14.9%) |
| $100,000 to $149,999 | 48 (11.2%) | 172 (13.7%) |
| $150,000 or more | 0 (0.0%) | 316 (25.1%) |
| Total | 428 (100.0%) | 1,257 (100.0%) |
Property Value to Household Income Ratio in Greenbrier
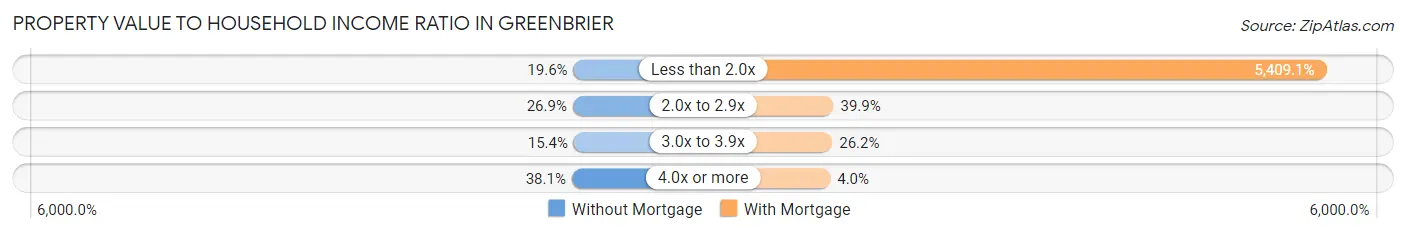
| Value-to-Income Ratio | Without Mortgage | With Mortgage |
| Less than 2.0x | 84 (19.6%) | 67,992 (5,409.1%) |
| 2.0x to 2.9x | 115 (26.9%) | 502 (39.9%) |
| 3.0x to 3.9x | 66 (15.4%) | 329 (26.2%) |
| 4.0x or more | 163 (38.1%) | 50 (4.0%) |
| Total | 428 (100.0%) | 1,257 (100.0%) |
Real Estate Taxes by Mortgage Status in Greenbrier
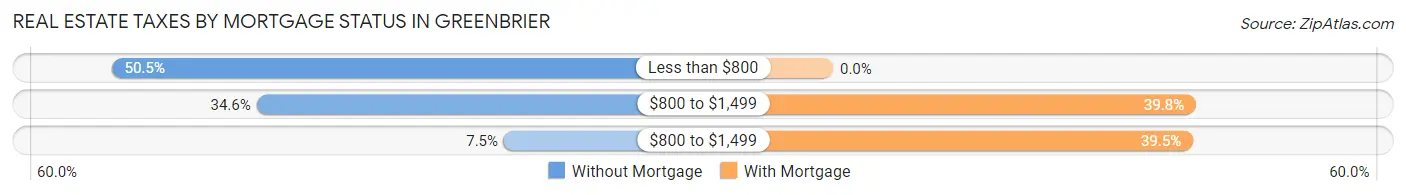
| Property Taxes | Without Mortgage | With Mortgage |
| Less than $800 | 216 (50.5%) | 0 (0.0%) |
| $800 to $1,499 | 148 (34.6%) | 500 (39.8%) |
| $800 to $1,499 | 32 (7.5%) | 496 (39.5%) |
| Total | 428 (100.0%) | 1,257 (100.0%) |
Health & Disability in Greenbrier
Health Insurance Coverage by Age in Greenbrier
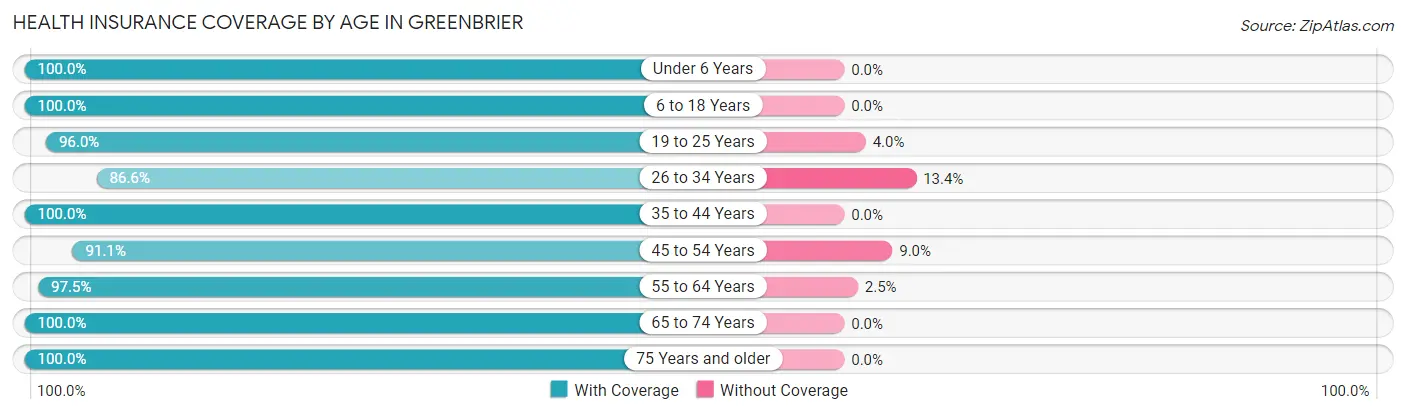
| Age Bracket | With Coverage | Without Coverage |
| Under 6 Years | 668 (100.0%) | 0 (0.0%) |
| 6 to 18 Years | 999 (100.0%) | 0 (0.0%) |
| 19 to 25 Years | 337 (96.0%) | 14 (4.0%) |
| 26 to 34 Years | 1,033 (86.6%) | 160 (13.4%) |
| 35 to 44 Years | 563 (100.0%) | 0 (0.0%) |
| 45 to 54 Years | 417 (91.0%) | 41 (8.9%) |
| 55 to 64 Years | 424 (97.5%) | 11 (2.5%) |
| 65 to 74 Years | 551 (100.0%) | 0 (0.0%) |
| 75 Years and older | 398 (100.0%) | 0 (0.0%) |
| Total | 5,390 (96.0%) | 226 (4.0%) |
Health Insurance Coverage by Citizenship Status in Greenbrier
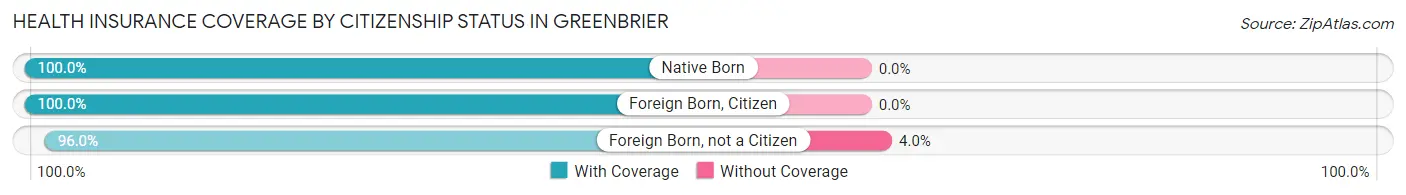
| Citizenship Status | With Coverage | Without Coverage |
| Native Born | 668 (100.0%) | 0 (0.0%) |
| Foreign Born, Citizen | 999 (100.0%) | 0 (0.0%) |
| Foreign Born, not a Citizen | 337 (96.0%) | 14 (4.0%) |
Health Insurance Coverage by Household Income in Greenbrier
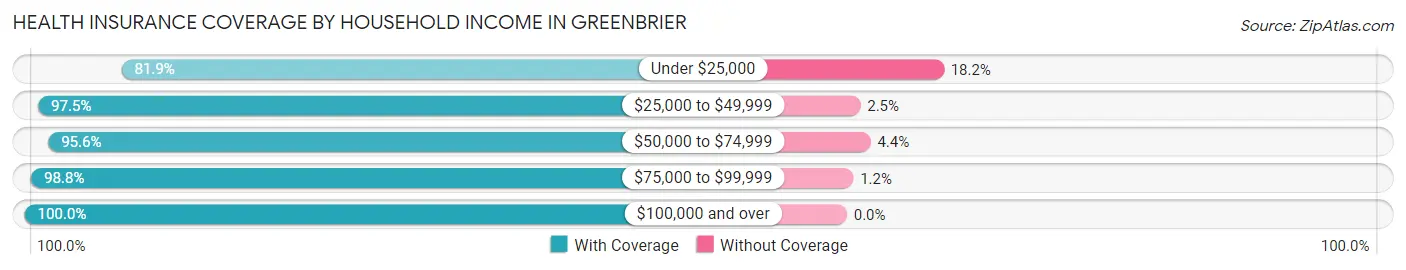
| Household Income | With Coverage | Without Coverage |
| Under $25,000 | 609 (81.9%) | 135 (18.1%) |
| $25,000 to $49,999 | 964 (97.5%) | 25 (2.5%) |
| $50,000 to $74,999 | 1,165 (95.6%) | 54 (4.4%) |
| $75,000 to $99,999 | 981 (98.8%) | 12 (1.2%) |
| $100,000 and over | 1,671 (100.0%) | 0 (0.0%) |
Public vs Private Health Insurance Coverage by Age in Greenbrier
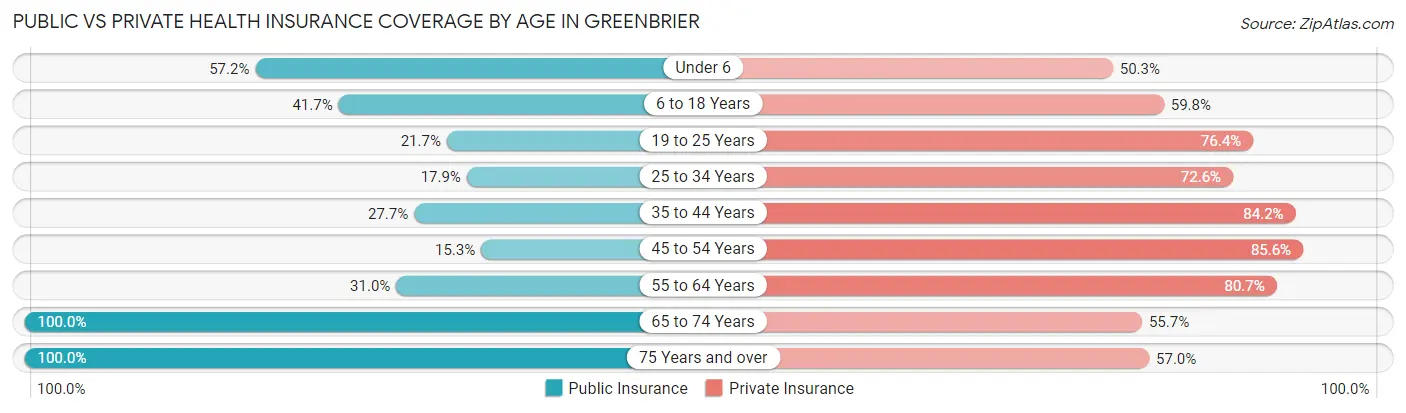
| Age Bracket | Public Insurance | Private Insurance |
| Under 6 | 382 (57.2%) | 336 (50.3%) |
| 6 to 18 Years | 417 (41.7%) | 597 (59.8%) |
| 19 to 25 Years | 76 (21.6%) | 268 (76.3%) |
| 25 to 34 Years | 214 (17.9%) | 866 (72.6%) |
| 35 to 44 Years | 156 (27.7%) | 474 (84.2%) |
| 45 to 54 Years | 70 (15.3%) | 392 (85.6%) |
| 55 to 64 Years | 135 (31.0%) | 351 (80.7%) |
| 65 to 74 Years | 551 (100.0%) | 307 (55.7%) |
| 75 Years and over | 398 (100.0%) | 227 (57.0%) |
| Total | 2,399 (42.7%) | 3,818 (68.0%) |
Disability Status by Sex by Age in Greenbrier
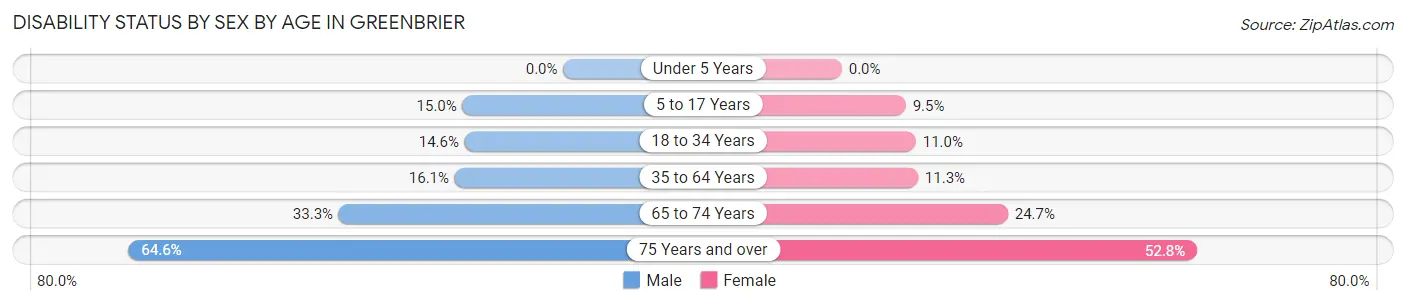
| Age Bracket | Male | Female |
| Under 5 Years | 0 (0.0%) | 0 (0.0%) |
| 5 to 17 Years | 76 (15.0%) | 47 (9.5%) |
| 18 to 34 Years | 127 (14.6%) | 82 (11.0%) |
| 35 to 64 Years | 102 (16.1%) | 93 (11.3%) |
| 65 to 74 Years | 66 (33.3%) | 87 (24.6%) |
| 75 Years and over | 93 (64.6%) | 134 (52.8%) |
Disability Class by Sex by Age in Greenbrier
Disability Class: Hearing Difficulty
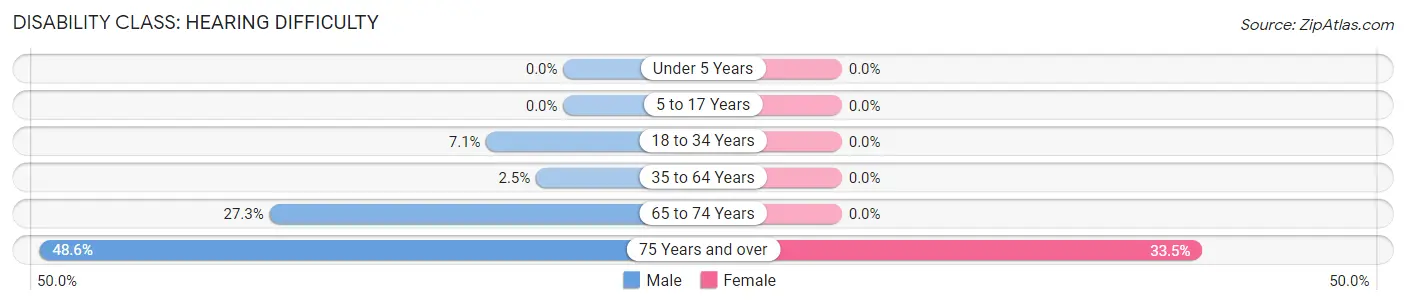
| Age Bracket | Male | Female |
| Under 5 Years | 0 (0.0%) | 0 (0.0%) |
| 5 to 17 Years | 0 (0.0%) | 0 (0.0%) |
| 18 to 34 Years | 62 (7.1%) | 0 (0.0%) |
| 35 to 64 Years | 16 (2.5%) | 0 (0.0%) |
| 65 to 74 Years | 54 (27.3%) | 0 (0.0%) |
| 75 Years and over | 70 (48.6%) | 85 (33.5%) |
Disability Class: Vision Difficulty
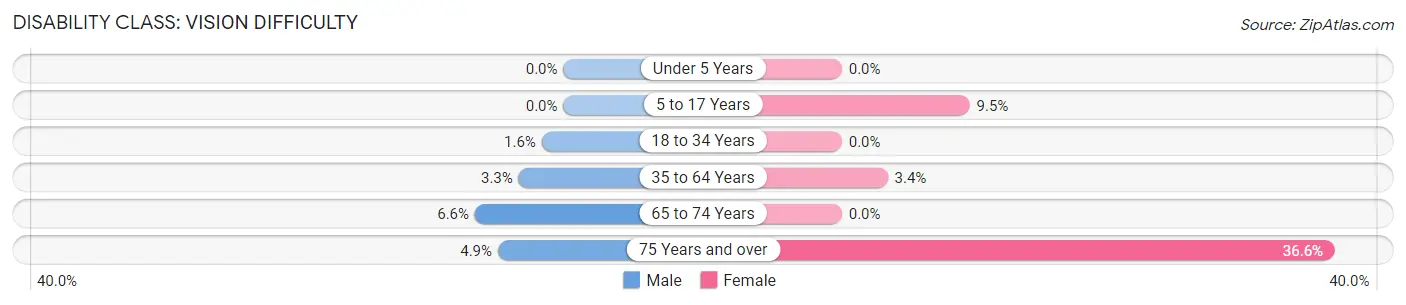
| Age Bracket | Male | Female |
| Under 5 Years | 0 (0.0%) | 0 (0.0%) |
| 5 to 17 Years | 0 (0.0%) | 47 (9.5%) |
| 18 to 34 Years | 14 (1.6%) | 0 (0.0%) |
| 35 to 64 Years | 21 (3.3%) | 28 (3.4%) |
| 65 to 74 Years | 13 (6.6%) | 0 (0.0%) |
| 75 Years and over | 7 (4.9%) | 93 (36.6%) |
Disability Class: Cognitive Difficulty
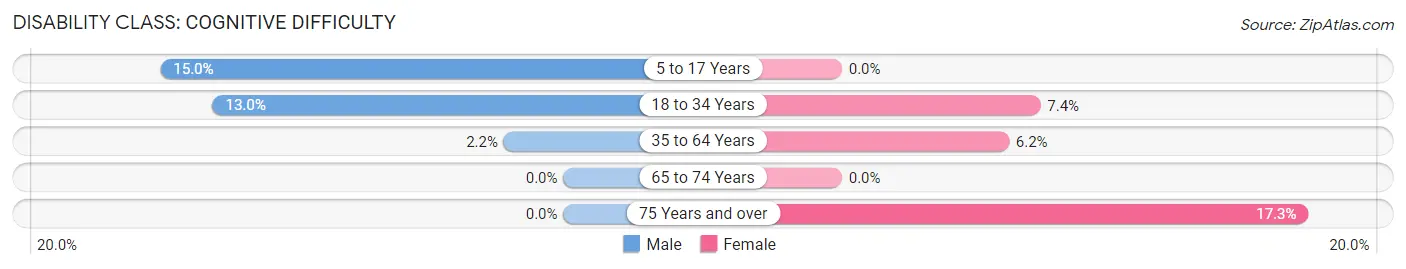
| Age Bracket | Male | Female |
| 5 to 17 Years | 76 (15.0%) | 0 (0.0%) |
| 18 to 34 Years | 113 (13.0%) | 55 (7.4%) |
| 35 to 64 Years | 14 (2.2%) | 51 (6.2%) |
| 65 to 74 Years | 0 (0.0%) | 0 (0.0%) |
| 75 Years and over | 0 (0.0%) | 44 (17.3%) |
Disability Class: Ambulatory Difficulty
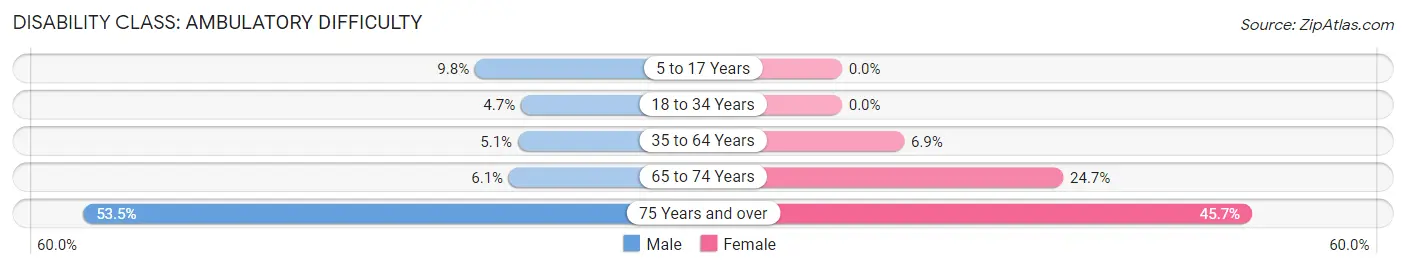
| Age Bracket | Male | Female |
| 5 to 17 Years | 50 (9.8%) | 0 (0.0%) |
| 18 to 34 Years | 41 (4.7%) | 0 (0.0%) |
| 35 to 64 Years | 32 (5.1%) | 57 (6.9%) |
| 65 to 74 Years | 12 (6.1%) | 87 (24.6%) |
| 75 Years and over | 77 (53.5%) | 116 (45.7%) |
Disability Class: Self-Care Difficulty
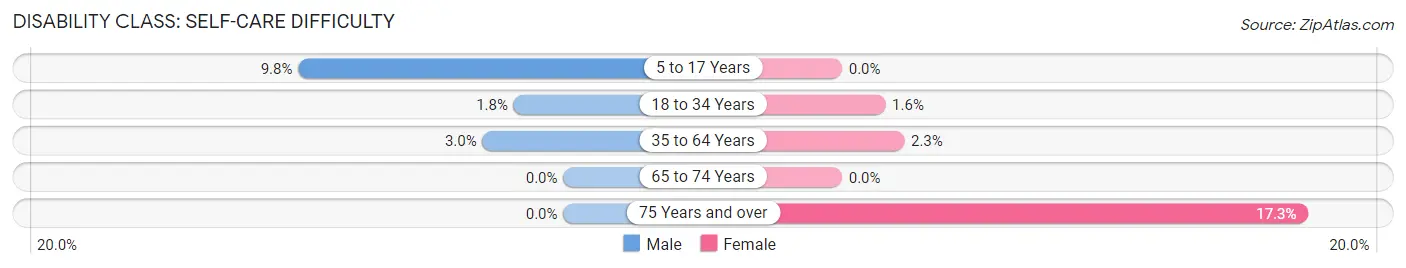
| Age Bracket | Male | Female |
| 5 to 17 Years | 50 (9.8%) | 0 (0.0%) |
| 18 to 34 Years | 16 (1.8%) | 12 (1.6%) |
| 35 to 64 Years | 19 (3.0%) | 19 (2.3%) |
| 65 to 74 Years | 0 (0.0%) | 0 (0.0%) |
| 75 Years and over | 0 (0.0%) | 44 (17.3%) |
Technology Access in Greenbrier
Computing Device Access in Greenbrier
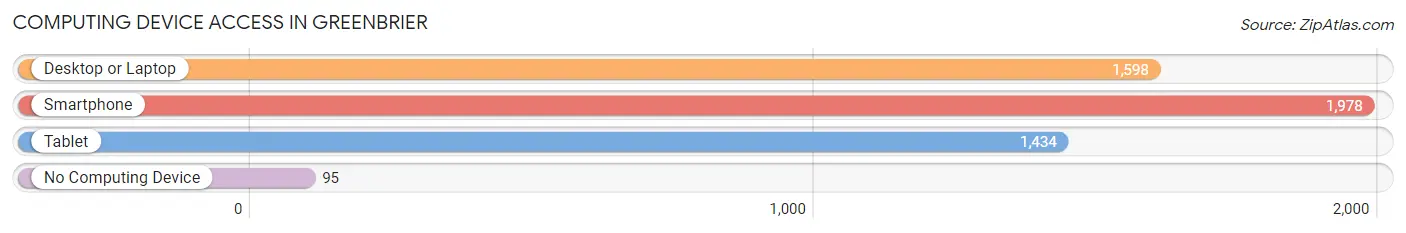
| Device Type | # Households | % Households |
| Desktop or Laptop | 1,598 | 72.5% |
| Smartphone | 1,978 | 89.7% |
| Tablet | 1,434 | 65.0% |
| No Computing Device | 95 | 4.3% |
| Total | 2,205 | 100.0% |
Internet Access in Greenbrier
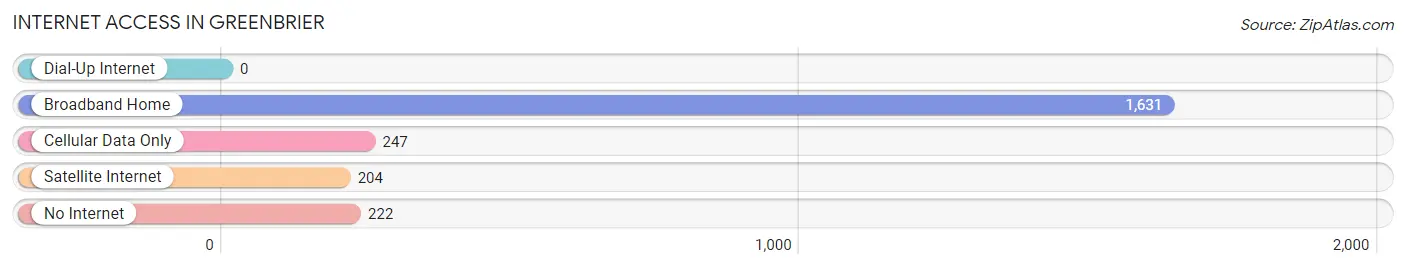
| Internet Type | # Households | % Households |
| Dial-Up Internet | 0 | 0.0% |
| Broadband Home | 1,631 | 74.0% |
| Cellular Data Only | 247 | 11.2% |
| Satellite Internet | 204 | 9.2% |
| No Internet | 222 | 10.1% |
| Total | 2,205 | 100.0% |
Greenbrier Summary
Greenbrier, Arkansas is a small city located in Faulkner County, Arkansas. It is situated in the foothills of the Ozark Mountains, about 25 miles north of Little Rock. The city has a population of approximately 4,000 people and is part of the Little Rock-North Little Rock-Conway Metropolitan Statistical Area.
History
Greenbrier was founded in 1873 by a group of settlers from Kentucky and Tennessee. The town was named after the Greenbrier River, which runs through the area. The first post office was established in 1875 and the town was incorporated in 1883.
Greenbrier was a small farming community until the 1950s, when the population began to grow due to the influx of people from other parts of the state. The city experienced a period of growth in the 1960s and 1970s, when several new businesses were established.
Geography
Greenbrier is located in the foothills of the Ozark Mountains, about 25 miles north of Little Rock. The city is situated on the banks of the Greenbrier River, which runs through the area. The city has a total area of 4.2 square miles, all of which is land.
The climate in Greenbrier is humid subtropical, with hot, humid summers and mild winters. The average annual temperature is 63 degrees Fahrenheit, with an average high of 87 degrees in the summer and an average low of 39 degrees in the winter.
Economy
Greenbrier’s economy is largely based on agriculture and manufacturing. The city is home to several large poultry processing plants, as well as a number of smaller businesses. The city also has a thriving tourism industry, with many visitors coming to the area to enjoy the natural beauty of the Ozark Mountains.
Demographics
As of the 2010 census, Greenbrier had a population of 4,062 people. The racial makeup of the city was 94.3% White, 1.2% African American, 0.4% Native American, 0.7% Asian, 0.1% Pacific Islander, 1.2% from other races, and 2.1% from two or more races. Hispanic or Latino of any race were 3.2% of the population.
The median income for a household in Greenbrier was $37,917, and the median income for a family was $45,938. The per capita income for the city was $19,945. About 11.2% of families and 14.2% of the population were below the poverty line, including 19.2% of those under age 18 and 8.2% of those age 65 or over.
Greenbrier is a small city with a rich history and a bright future. The city has a diverse economy and a growing population, making it an attractive place to live and work. With its close proximity to Little Rock and the natural beauty of the Ozark Mountains, Greenbrier is an ideal place to call home.
Common Questions
What is Per Capita Income in Greenbrier?
Per Capita income in Greenbrier is $25,802.
What is the Median Family Income in Greenbrier?
Median Family Income in Greenbrier is $64,863.
What is the Median Household income in Greenbrier?
Median Household Income in Greenbrier is $57,234.
What is Income or Wage Gap in Greenbrier?
Income or Wage Gap in Greenbrier is 11.8%.
Women in Greenbrier earn 88.2 cents for every dollar earned by a man.
What is Inequality or Gini Index in Greenbrier?
Inequality or Gini Index in Greenbrier is 0.39.
What is the Total Population of Greenbrier?
Total Population of Greenbrier is 5,755.
What is the Total Male Population of Greenbrier?
Total Male Population of Greenbrier is 2,802.
What is the Total Female Population of Greenbrier?
Total Female Population of Greenbrier is 2,953.
What is the Ratio of Males per 100 Females in Greenbrier?
There are 94.89 Males per 100 Females in Greenbrier.
What is the Ratio of Females per 100 Males in Greenbrier?
There are 105.39 Females per 100 Males in Greenbrier.
What is the Median Population Age in Greenbrier?
Median Population Age in Greenbrier is 32.5 Years.
What is the Average Family Size in Greenbrier
Average Family Size in Greenbrier is 3.0 People.
What is the Average Household Size in Greenbrier
Average Household Size in Greenbrier is 2.6 People.
How Large is the Labor Force in Greenbrier?
There are 2,618 People in the Labor Forcein in Greenbrier.
What is the Percentage of People in the Labor Force in Greenbrier?
61.3% of People are in the Labor Force in Greenbrier.
What is the Unemployment Rate in Greenbrier?
Unemployment Rate in Greenbrier is 1.8%.