Fouke, AR Map & Demographics
Fouke Map
Fouke Overview
$14,851
PER CAPITA INCOME
$50,750
AVG FAMILY INCOME
$33,393
AVG HOUSEHOLD INCOME
52.7%
WAGE / INCOME GAP [ % ]
47.3¢/ $1
WAGE / INCOME GAP [ $ ]
0.38
INEQUALITY / GINI INDEX
728
TOTAL POPULATION
325
MALE POPULATION
403
FEMALE POPULATION
80.65
MALES / 100 FEMALES
124.00
FEMALES / 100 MALES
23.9
MEDIAN AGE
5.2
AVG FAMILY SIZE
3.1
AVG HOUSEHOLD SIZE
270
LABOR FORCE [ PEOPLE ]
59.7%
PERCENT IN LABOR FORCE
7.4%
UNEMPLOYMENT RATE
Fouke Zip Codes
Fouke Area Codes
Income in Fouke
Income Overview in Fouke
Per Capita Income in Fouke is $14,851, while median incomes of families and households are $50,750 and $33,393 respectively.
| Characteristic | Number | Measure |
| Per Capita Income | 728 | $14,851 |
| Median Family Income | 108 | $50,750 |
| Mean Family Income | 108 | $57,730 |
| Median Household Income | 231 | $33,393 |
| Mean Household Income | 231 | $44,680 |
| Income Deficit | 108 | $0 |
| Wage / Income Gap (%) | 728 | 52.71% |
| Wage / Income Gap ($) | 728 | 47.29¢ per $1 |
| Gini / Inequality Index | 728 | 0.38 |
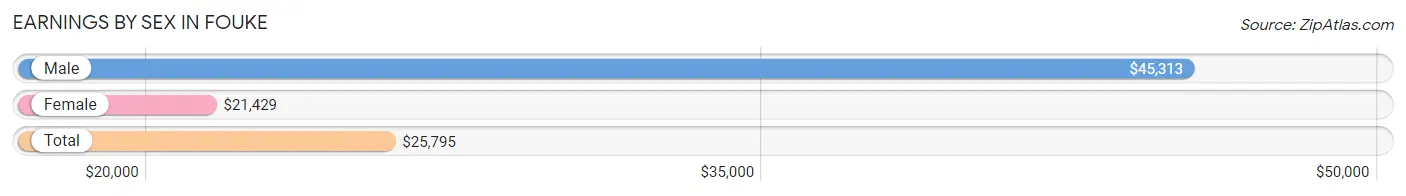
Earnings by Sex in Fouke
Average Earnings in Fouke are $25,795, $45,313 for men and $21,429 for women, a difference of 52.7%.
| Sex | Number | Average Earnings |
| Male | 125 (46.8%) | $45,313 |
| Female | 142 (53.2%) | $21,429 |
| Total | 267 (100.0%) | $25,795 |
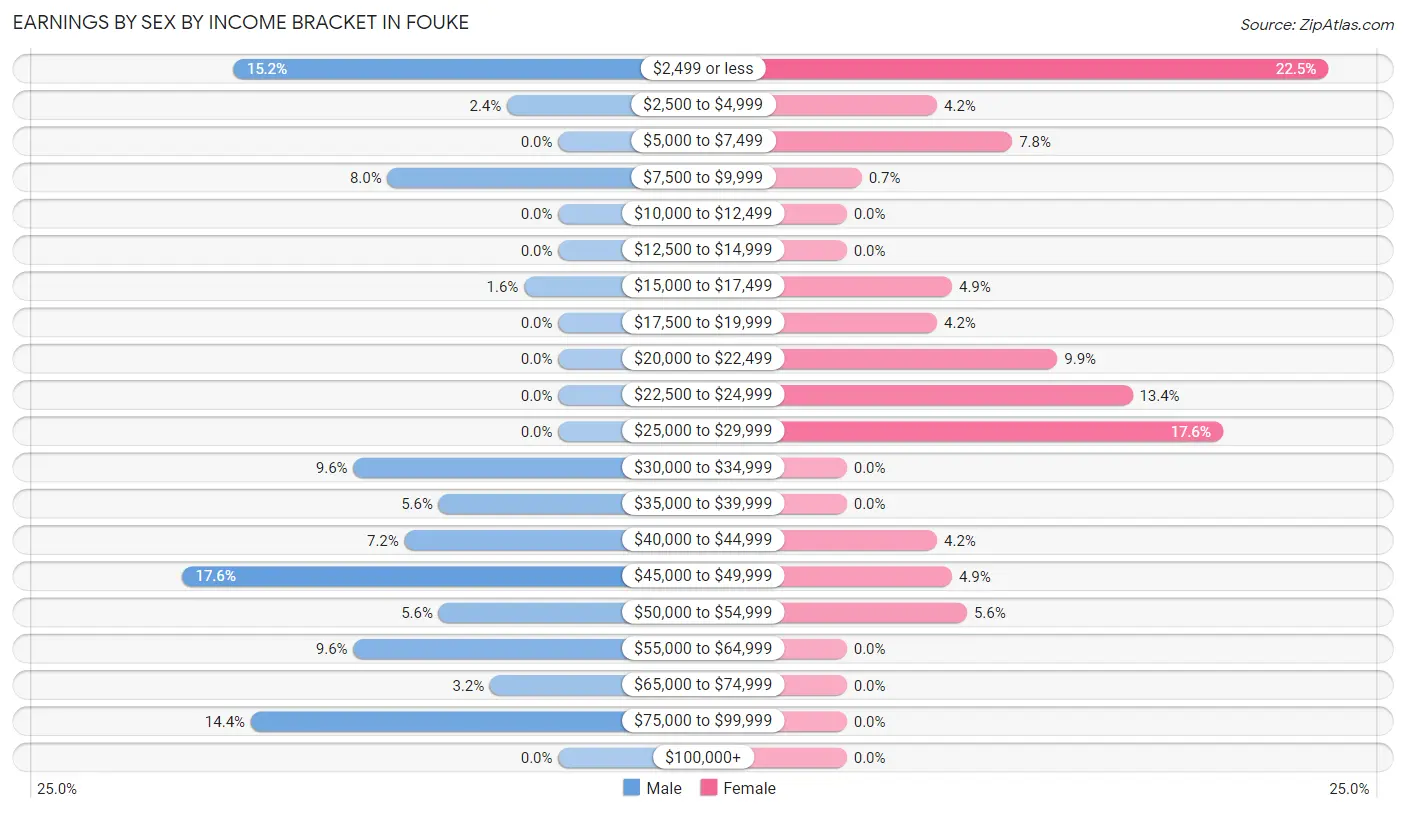
Earnings by Sex by Income Bracket in Fouke
The most common earnings brackets in Fouke are $45,000 to $49,999 for men (22 | 17.6%) and $2,499 or less for women (32 | 22.5%).
| Income | Male | Female |
| $2,499 or less | 19 (15.2%) | 32 (22.5%) |
| $2,500 to $4,999 | 3 (2.4%) | 6 (4.2%) |
| $5,000 to $7,499 | 0 (0.0%) | 11 (7.7%) |
| $7,500 to $9,999 | 10 (8.0%) | 1 (0.7%) |
| $10,000 to $12,499 | 0 (0.0%) | 0 (0.0%) |
| $12,500 to $14,999 | 0 (0.0%) | 0 (0.0%) |
| $15,000 to $17,499 | 2 (1.6%) | 7 (4.9%) |
| $17,500 to $19,999 | 0 (0.0%) | 6 (4.2%) |
| $20,000 to $22,499 | 0 (0.0%) | 14 (9.9%) |
| $22,500 to $24,999 | 0 (0.0%) | 19 (13.4%) |
| $25,000 to $29,999 | 0 (0.0%) | 25 (17.6%) |
| $30,000 to $34,999 | 12 (9.6%) | 0 (0.0%) |
| $35,000 to $39,999 | 7 (5.6%) | 0 (0.0%) |
| $40,000 to $44,999 | 9 (7.2%) | 6 (4.2%) |
| $45,000 to $49,999 | 22 (17.6%) | 7 (4.9%) |
| $50,000 to $54,999 | 7 (5.6%) | 8 (5.6%) |
| $55,000 to $64,999 | 12 (9.6%) | 0 (0.0%) |
| $65,000 to $74,999 | 4 (3.2%) | 0 (0.0%) |
| $75,000 to $99,999 | 18 (14.4%) | 0 (0.0%) |
| $100,000+ | 0 (0.0%) | 0 (0.0%) |
| Total | 125 (100.0%) | 142 (100.0%) |
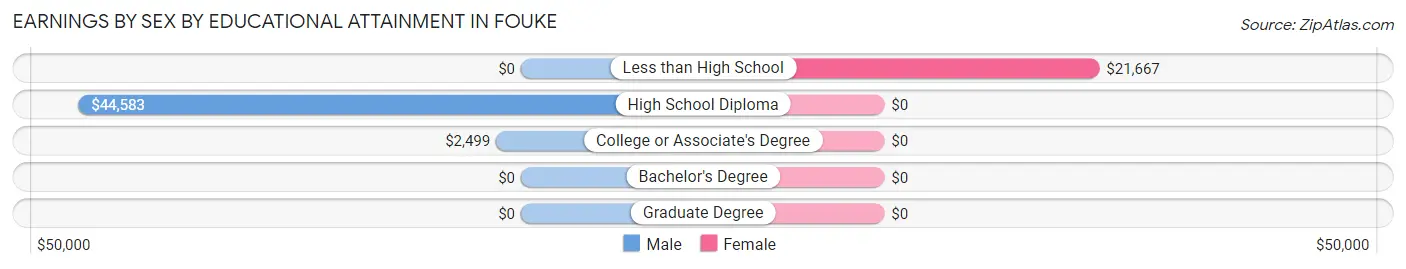
Earnings by Sex by Educational Attainment in Fouke
Average earnings in Fouke are $44,444 for men and $20,000 for women, a difference of 55.0%. Men with an educational attainment of high school diploma enjoy the highest average annual earnings of $44,583, while those with college or associate's degree education earn the least with $2,499. Women with an educational attainment of less than high school earn the most with the average annual earnings of $21,667, while those with less than high school education have the smallest earnings of $21,667.
| Educational Attainment | Male Income | Female Income |
| Less than High School | - | - |
| High School Diploma | $44,583 | $0 |
| College or Associate's Degree | $2,499 | $0 |
| Bachelor's Degree | - | - |
| Graduate Degree | - | - |
| Total | $44,444 | $20,000 |
Family Income in Fouke
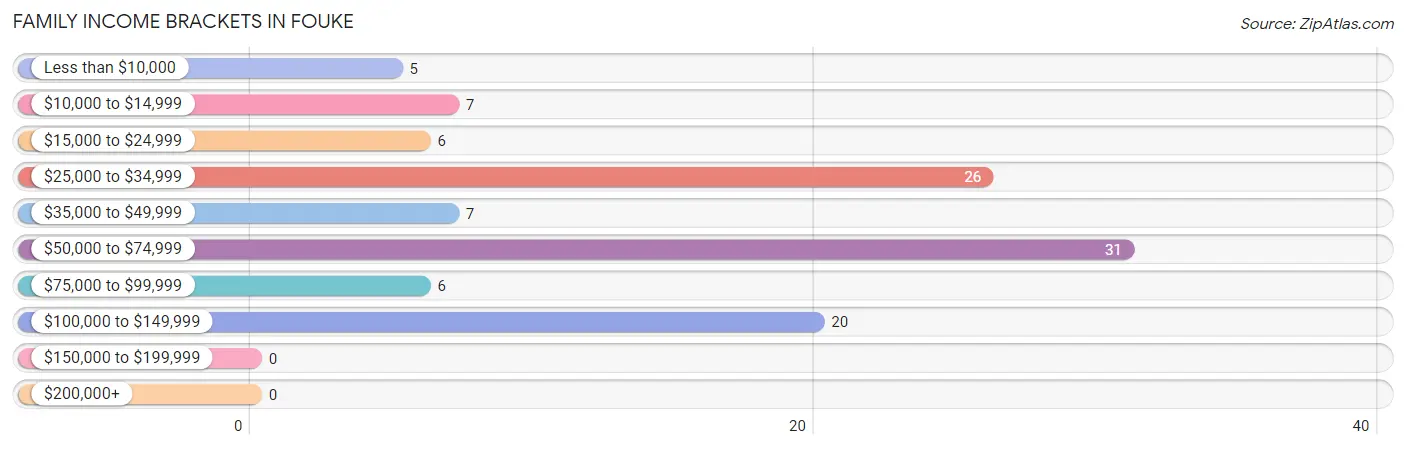
Family Income Brackets in Fouke
According to the Fouke family income data, there are 31 families falling into the $50,000 to $74,999 income range, which is the most common income bracket and makes up 28.7% of all families.
| Income Bracket | # Families | % Families |
| Less than $10,000 | 5 | 4.6% |
| $10,000 to $14,999 | 7 | 6.5% |
| $15,000 to $24,999 | 6 | 5.6% |
| $25,000 to $34,999 | 26 | 24.1% |
| $35,000 to $49,999 | 7 | 6.5% |
| $50,000 to $74,999 | 31 | 28.7% |
| $75,000 to $99,999 | 6 | 5.6% |
| $100,000 to $149,999 | 20 | 18.5% |
| $150,000 to $199,999 | 0 | 0.0% |
| $200,000+ | 0 | 0.0% |
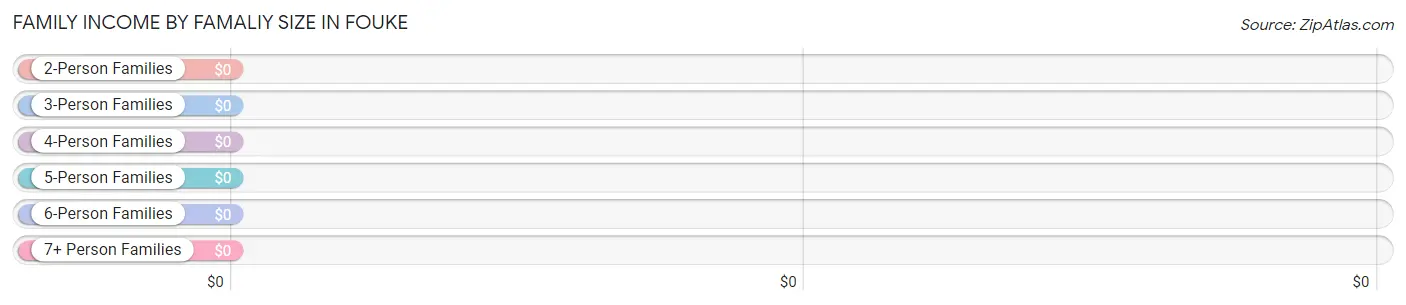
Family Income by Famaliy Size in Fouke
| Income Bracket | # Families | Median Income |
| 2-Person Families | 34 (31.5%) | $0 |
| 3-Person Families | 28 (25.9%) | $0 |
| 4-Person Families | 24 (22.2%) | $0 |
| 5-Person Families | 9 (8.3%) | $0 |
| 6-Person Families | 10 (9.3%) | $0 |
| 7+ Person Families | 3 (2.8%) | $0 |
| Total | 108 (100.0%) | $50,750 |
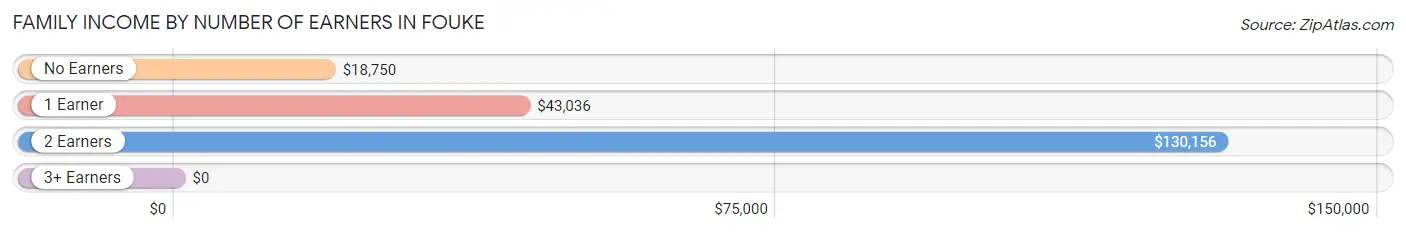
Family Income by Number of Earners in Fouke
| Number of Earners | # Families | Median Income |
| No Earners | 12 (11.1%) | $18,750 |
| 1 Earner | 59 (54.6%) | $43,036 |
| 2 Earners | 31 (28.7%) | $130,156 |
| 3+ Earners | 6 (5.6%) | $0 |
| Total | 108 (100.0%) | $50,750 |
Household Income in Fouke
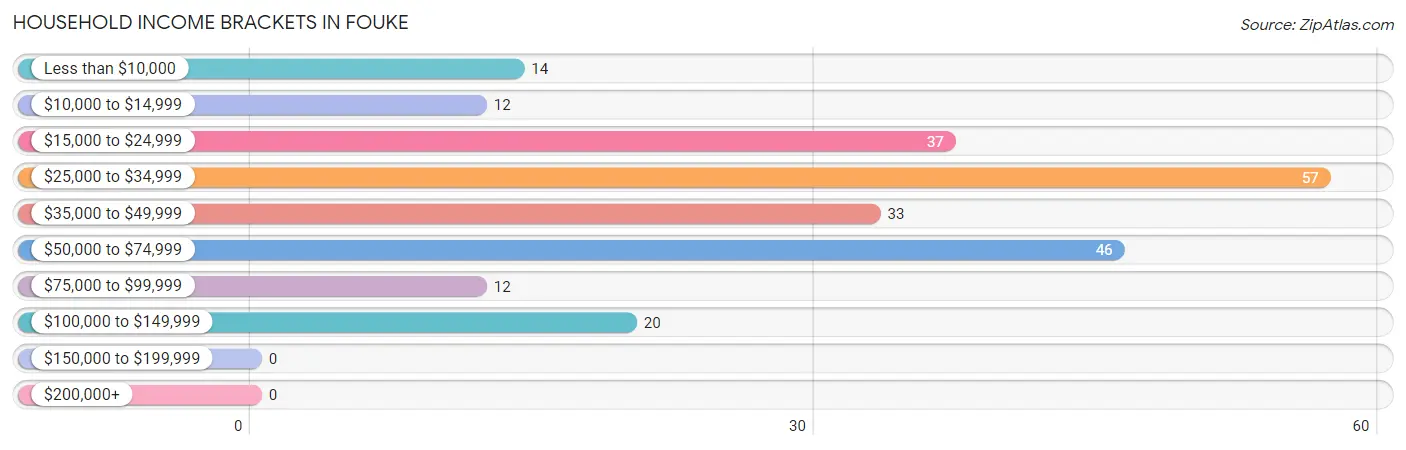
Household Income Brackets in Fouke
With 57 households falling in the category, the $25,000 to $34,999 income range is the most frequent in Fouke, accounting for 24.7% of all households.
| Income Bracket | # Households | % Households |
| Less than $10,000 | 14 | 6.1% |
| $10,000 to $14,999 | 12 | 5.2% |
| $15,000 to $24,999 | 37 | 16.0% |
| $25,000 to $34,999 | 57 | 24.7% |
| $35,000 to $49,999 | 33 | 14.3% |
| $50,000 to $74,999 | 46 | 19.9% |
| $75,000 to $99,999 | 12 | 5.2% |
| $100,000 to $149,999 | 20 | 8.7% |
| $150,000 to $199,999 | 0 | 0.0% |
| $200,000+ | 0 | 0.0% |
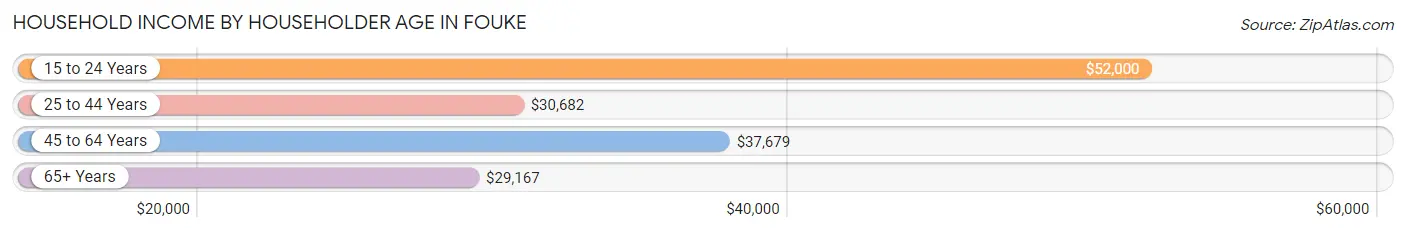
Household Income by Householder Age in Fouke
The median household income in Fouke is $33,393, with the highest median household income of $52,000 found in the 15 to 24 years age bracket for the primary householder. A total of 44 households (19.1%) fall into this category. Meanwhile, the 65+ years age bracket for the primary householder has the lowest median household income of $29,167, with 36 households (15.6%) in this group.
| Income Bracket | # Households | Median Income |
| 15 to 24 Years | 44 (19.1%) | $52,000 |
| 25 to 44 Years | 56 (24.2%) | $30,682 |
| 45 to 64 Years | 95 (41.1%) | $37,679 |
| 65+ Years | 36 (15.6%) | $29,167 |
| Total | 231 (100.0%) | $33,393 |
Poverty in Fouke
Income Below Poverty by Sex and Age in Fouke
With 32.0% poverty level for males and 38.5% for females among the residents of Fouke, under 5 year old males and 16 and 17 year old females are the most vulnerable to poverty, with 42 males (100.0%) and 1 females (100.0%) in their respective age groups living below the poverty level.
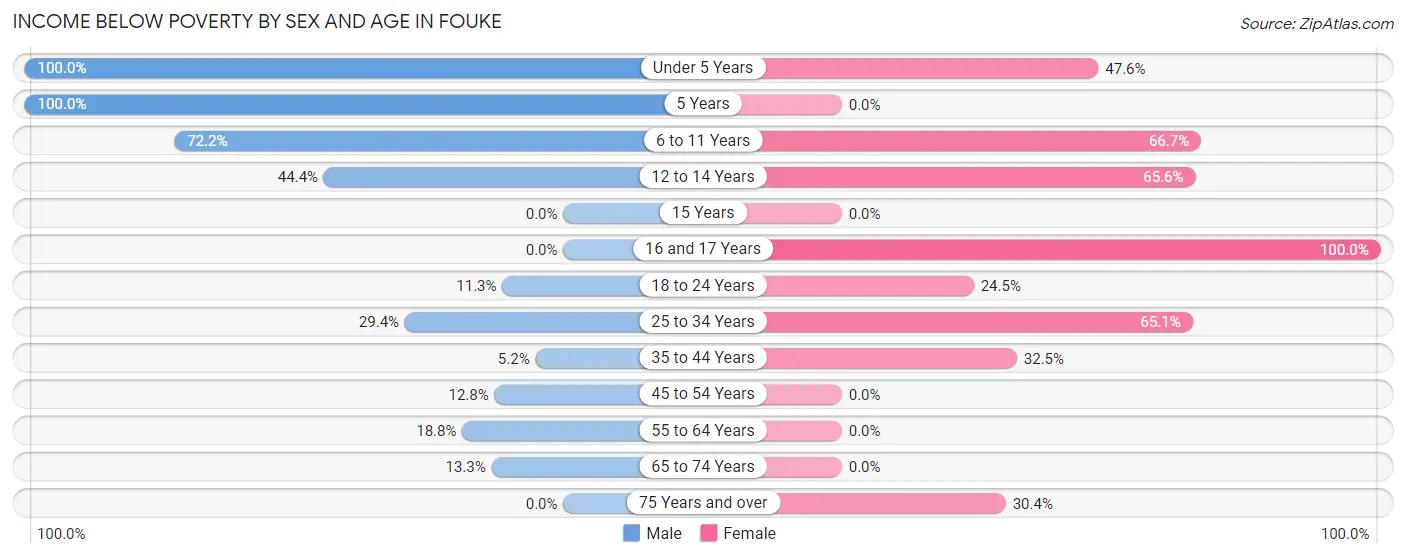
| Age Bracket | Male | Female |
| Under 5 Years | 42 (100.0%) | 20 (47.6%) |
| 5 Years | 13 (100.0%) | 0 (0.0%) |
| 6 to 11 Years | 13 (72.2%) | 32 (66.7%) |
| 12 to 14 Years | 8 (44.4%) | 42 (65.6%) |
| 15 Years | 0 (0.0%) | 0 (0.0%) |
| 16 and 17 Years | 0 (0.0%) | 1 (100.0%) |
| 18 to 24 Years | 6 (11.3%) | 12 (24.5%) |
| 25 to 34 Years | 5 (29.4%) | 28 (65.1%) |
| 35 to 44 Years | 3 (5.2%) | 13 (32.5%) |
| 45 to 54 Years | 6 (12.8%) | 0 (0.0%) |
| 55 to 64 Years | 6 (18.8%) | 0 (0.0%) |
| 65 to 74 Years | 2 (13.3%) | 0 (0.0%) |
| 75 Years and over | 0 (0.0%) | 7 (30.4%) |
| Total | 104 (32.0%) | 155 (38.5%) |
Income Above Poverty by Sex and Age in Fouke
According to the poverty statistics in Fouke, males aged 15 years and females aged 5 years are the age groups that are most secure financially, with 100.0% of males and 100.0% of females in these age groups living above the poverty line.
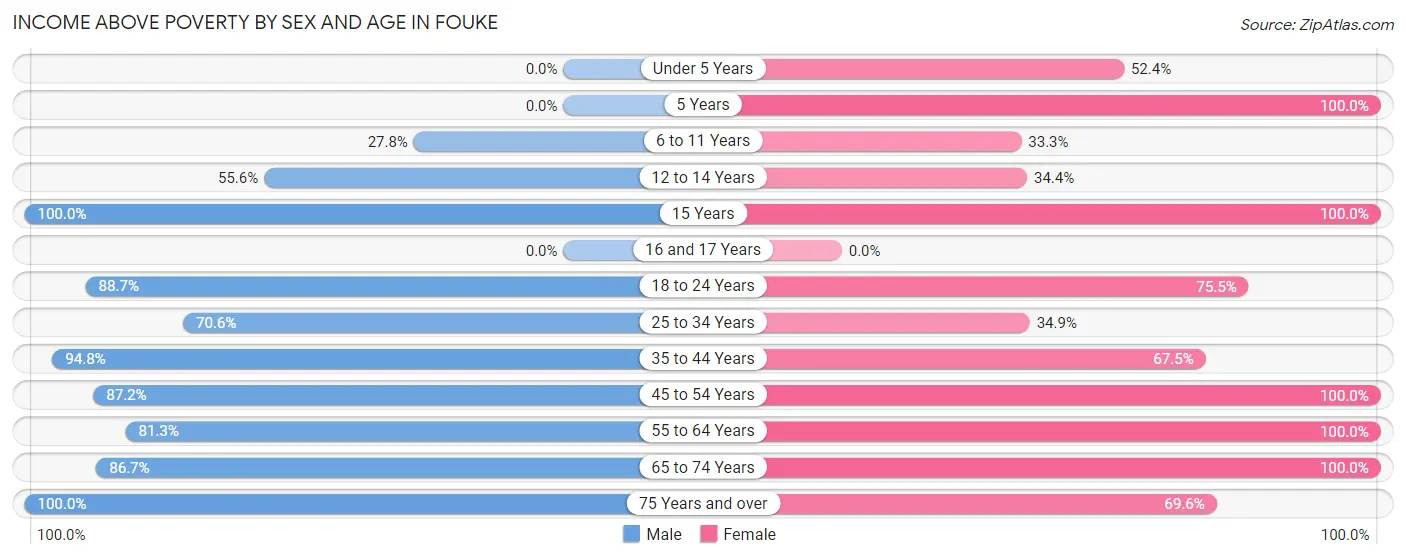
| Age Bracket | Male | Female |
| Under 5 Years | 0 (0.0%) | 22 (52.4%) |
| 5 Years | 0 (0.0%) | 17 (100.0%) |
| 6 to 11 Years | 5 (27.8%) | 16 (33.3%) |
| 12 to 14 Years | 10 (55.6%) | 22 (34.4%) |
| 15 Years | 6 (100.0%) | 8 (100.0%) |
| 16 and 17 Years | 0 (0.0%) | 0 (0.0%) |
| 18 to 24 Years | 47 (88.7%) | 37 (75.5%) |
| 25 to 34 Years | 12 (70.6%) | 15 (34.9%) |
| 35 to 44 Years | 55 (94.8%) | 27 (67.5%) |
| 45 to 54 Years | 41 (87.2%) | 13 (100.0%) |
| 55 to 64 Years | 26 (81.2%) | 43 (100.0%) |
| 65 to 74 Years | 13 (86.7%) | 12 (100.0%) |
| 75 Years and over | 6 (100.0%) | 16 (69.6%) |
| Total | 221 (68.0%) | 248 (61.5%) |
Income Below Poverty Among Married-Couple Families in Fouke
The poverty statistics for married-couple families in Fouke show that 6.3% or 5 of the total 79 families live below the poverty line. Families with 5 or more children have the highest poverty rate of 100.0%, comprising of 3 families. On the other hand, families with no children have the lowest poverty rate of 0.0%, which includes 0 families.
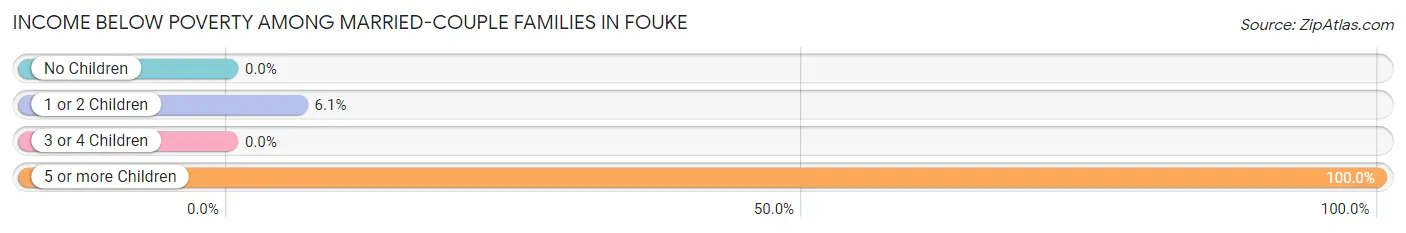
| Children | Above Poverty | Below Poverty |
| No Children | 38 (100.0%) | 0 (0.0%) |
| 1 or 2 Children | 31 (93.9%) | 2 (6.1%) |
| 3 or 4 Children | 5 (100.0%) | 0 (0.0%) |
| 5 or more Children | 0 (0.0%) | 3 (100.0%) |
| Total | 74 (93.7%) | 5 (6.3%) |
Income Below Poverty Among Single-Parent Households in Fouke
According to the poverty data in Fouke, 50.0% or 2 single-father households and 48.0% or 12 single-mother households are living below the poverty line. Among single-father households, those with 3 or 4 children have the highest poverty rate, with 2 households (100.0%) experiencing poverty. Likewise, among single-mother households, those with 5 or more children have the highest poverty rate, with 5 households (100.0%) falling below the poverty line.
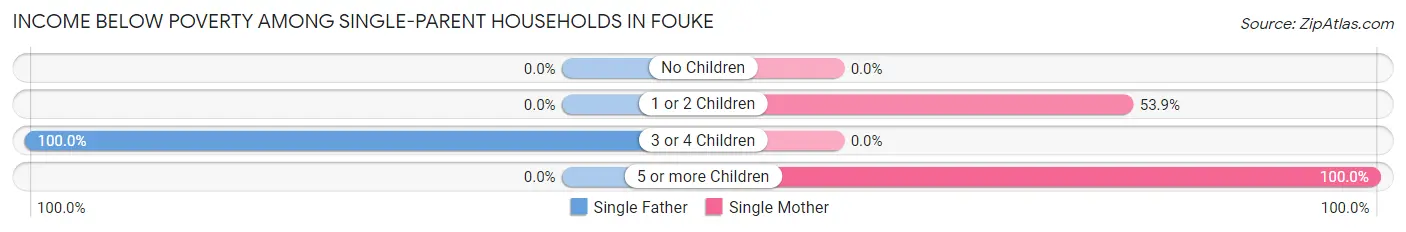
| Children | Single Father | Single Mother |
| No Children | 0 (0.0%) | 0 (0.0%) |
| 1 or 2 Children | 0 (0.0%) | 7 (53.8%) |
| 3 or 4 Children | 2 (100.0%) | 0 (0.0%) |
| 5 or more Children | 0 (0.0%) | 5 (100.0%) |
| Total | 2 (50.0%) | 12 (48.0%) |
Income Below Poverty Among Married-Couple vs Single-Parent Households in Fouke
The poverty data for Fouke shows that 5 of the married-couple family households (6.3%) and 14 of the single-parent households (48.3%) are living below the poverty level. Within the married-couple family households, those with 5 or more children have the highest poverty rate, with 3 households (100.0%) falling below the poverty line. Among the single-parent households, those with 3 or 4 children have the highest poverty rate, with 2 household (100.0%) living below poverty.
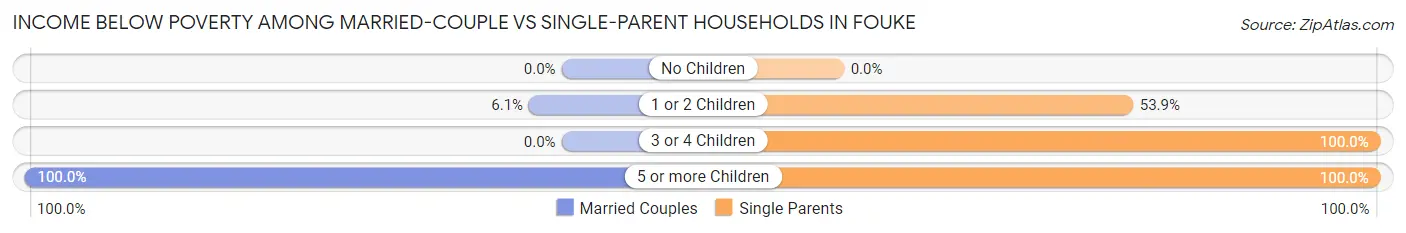
| Children | Married-Couple Families | Single-Parent Households |
| No Children | 0 (0.0%) | 0 (0.0%) |
| 1 or 2 Children | 2 (6.1%) | 7 (53.8%) |
| 3 or 4 Children | 0 (0.0%) | 2 (100.0%) |
| 5 or more Children | 3 (100.0%) | 5 (100.0%) |
| Total | 5 (6.3%) | 14 (48.3%) |
Race in Fouke
The most populous races in Fouke are White / Caucasian (575 | 79.0%), Native / Alaskan (112 | 15.4%), and Black / African American (20 | 2.8%).
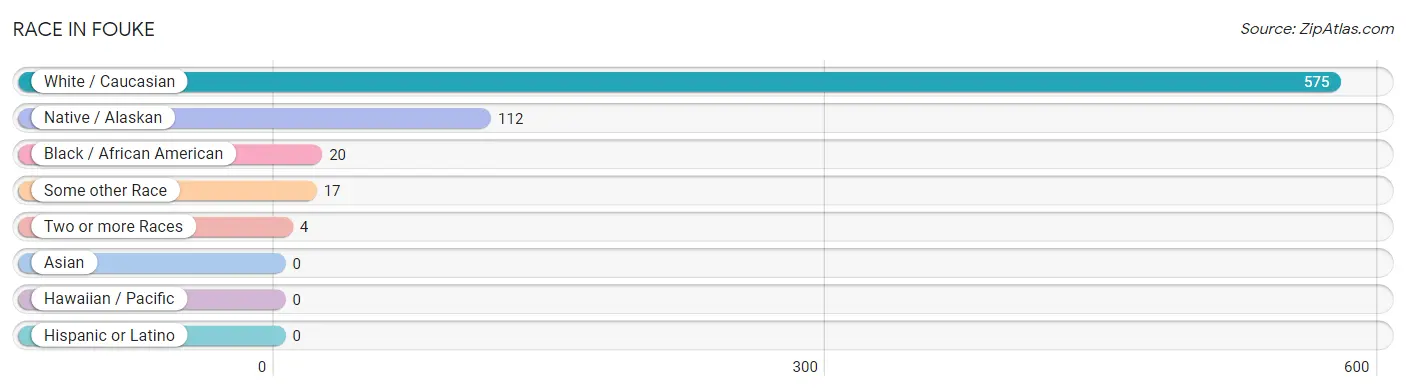
| Race | # Population | % Population |
| Asian | 0 | 0.0% |
| Black / African American | 20 | 2.8% |
| Hawaiian / Pacific | 0 | 0.0% |
| Hispanic or Latino | 0 | 0.0% |
| Native / Alaskan | 112 | 15.4% |
| White / Caucasian | 575 | 79.0% |
| Two or more Races | 4 | 0.5% |
| Some other Race | 17 | 2.3% |
| Total | 728 | 100.0% |
Ancestry in Fouke
The most populous ancestries reported in Fouke are American (138 | 19.0%), German (118 | 16.2%), Choctaw (112 | 15.4%), Irish (89 | 12.2%), and English (78 | 10.7%), together accounting for 73.5% of all Fouke residents.
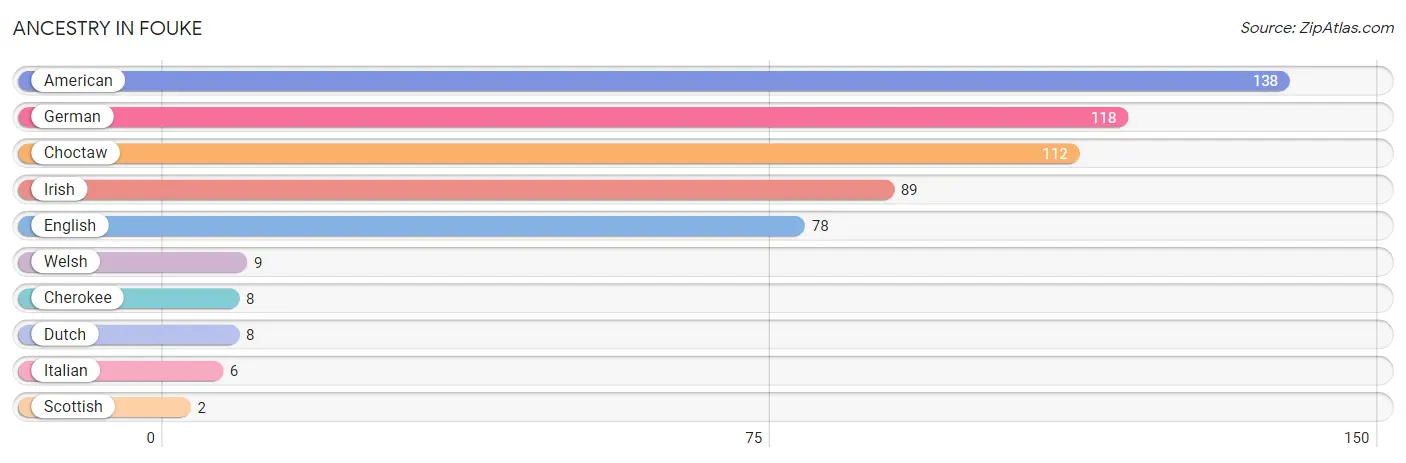
| Ancestry | # Population | % Population |
| American | 138 | 19.0% |
| Cherokee | 8 | 1.1% |
| Choctaw | 112 | 15.4% |
| Dutch | 8 | 1.1% |
| English | 78 | 10.7% |
| German | 118 | 16.2% |
| Irish | 89 | 12.2% |
| Italian | 6 | 0.8% |
| Scottish | 2 | 0.3% |
| Welsh | 9 | 1.2% | View All 10 Rows |
Immigrants in Fouke

| Immigration Origin | # Population | % Population | View All 0 Rows |
Sex and Age in Fouke
Sex and Age in Fouke
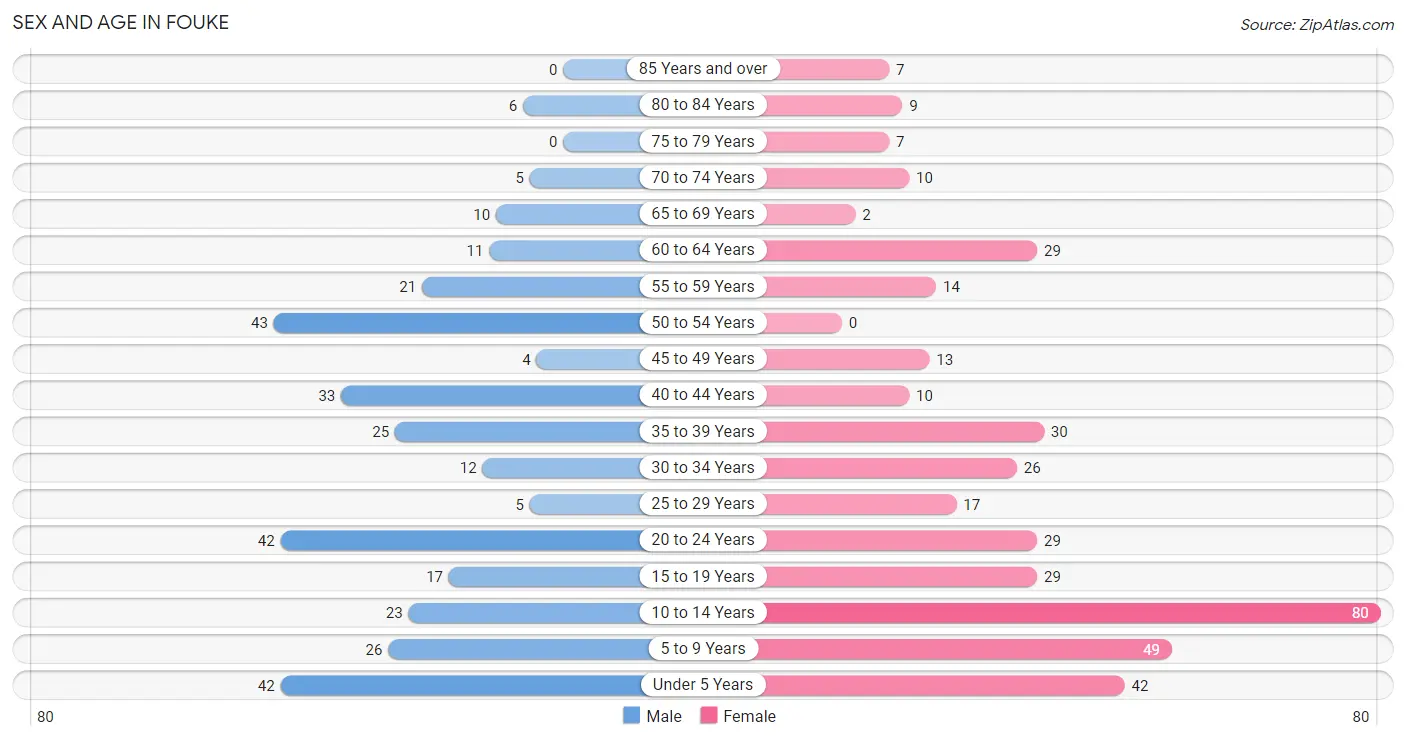
The most populous age groups in Fouke are 50 to 54 Years (43 | 13.2%) for men and 10 to 14 Years (80 | 19.9%) for women.
| Age Bracket | Male | Female |
| Under 5 Years | 42 (12.9%) | 42 (10.4%) |
| 5 to 9 Years | 26 (8.0%) | 49 (12.2%) |
| 10 to 14 Years | 23 (7.1%) | 80 (19.9%) |
| 15 to 19 Years | 17 (5.2%) | 29 (7.2%) |
| 20 to 24 Years | 42 (12.9%) | 29 (7.2%) |
| 25 to 29 Years | 5 (1.5%) | 17 (4.2%) |
| 30 to 34 Years | 12 (3.7%) | 26 (6.5%) |
| 35 to 39 Years | 25 (7.7%) | 30 (7.4%) |
| 40 to 44 Years | 33 (10.2%) | 10 (2.5%) |
| 45 to 49 Years | 4 (1.2%) | 13 (3.2%) |
| 50 to 54 Years | 43 (13.2%) | 0 (0.0%) |
| 55 to 59 Years | 21 (6.5%) | 14 (3.5%) |
| 60 to 64 Years | 11 (3.4%) | 29 (7.2%) |
| 65 to 69 Years | 10 (3.1%) | 2 (0.5%) |
| 70 to 74 Years | 5 (1.5%) | 10 (2.5%) |
| 75 to 79 Years | 0 (0.0%) | 7 (1.7%) |
| 80 to 84 Years | 6 (1.8%) | 9 (2.2%) |
| 85 Years and over | 0 (0.0%) | 7 (1.7%) |
| Total | 325 (100.0%) | 403 (100.0%) |
Families and Households in Fouke
Median Family Size in Fouke
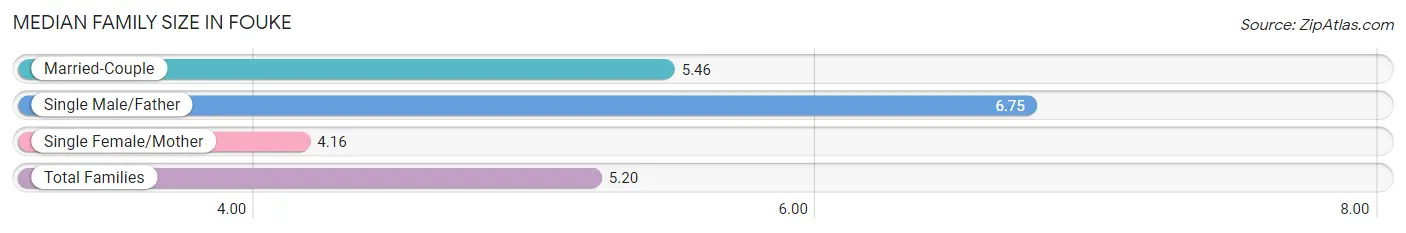
The median family size in Fouke is 5.20 persons per family, with single male/father families (4 | 3.7%) accounting for the largest median family size of 6.75 persons per family. On the other hand, single female/mother families (25 | 23.2%) represent the smallest median family size with 4.16 persons per family.
| Family Type | # Families | Family Size |
| Married-Couple | 79 (73.2%) | 5.46 |
| Single Male/Father | 4 (3.7%) | 6.75 |
| Single Female/Mother | 25 (23.2%) | 4.16 |
| Total Families | 108 (100.0%) | 5.20 |
Median Household Size in Fouke
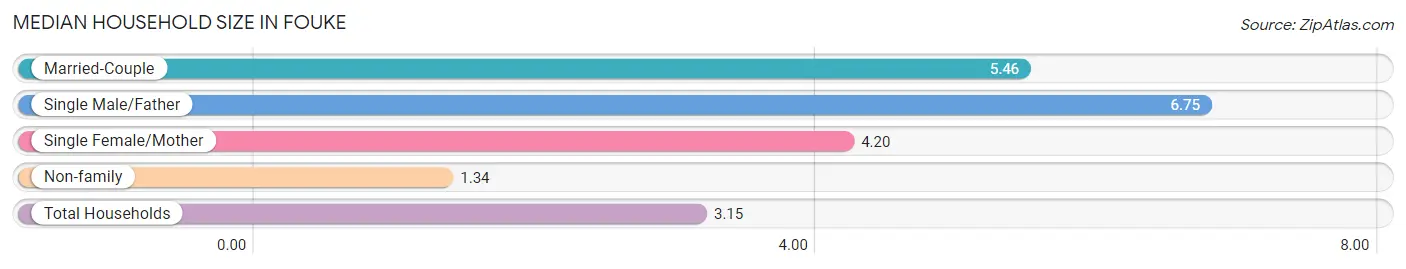
The median household size in Fouke is 3.15 persons per household, with single male/father households (4 | 1.7%) accounting for the largest median household size of 6.75 persons per household. non-family households (123 | 53.2%) represent the smallest median household size with 1.34 persons per household.
| Household Type | # Households | Household Size |
| Married-Couple | 79 (34.2%) | 5.46 |
| Single Male/Father | 4 (1.7%) | 6.75 |
| Single Female/Mother | 25 (10.8%) | 4.20 |
| Non-family | 123 (53.2%) | 1.34 |
| Total Households | 231 (100.0%) | 3.15 |
Household Size by Marriage Status in Fouke
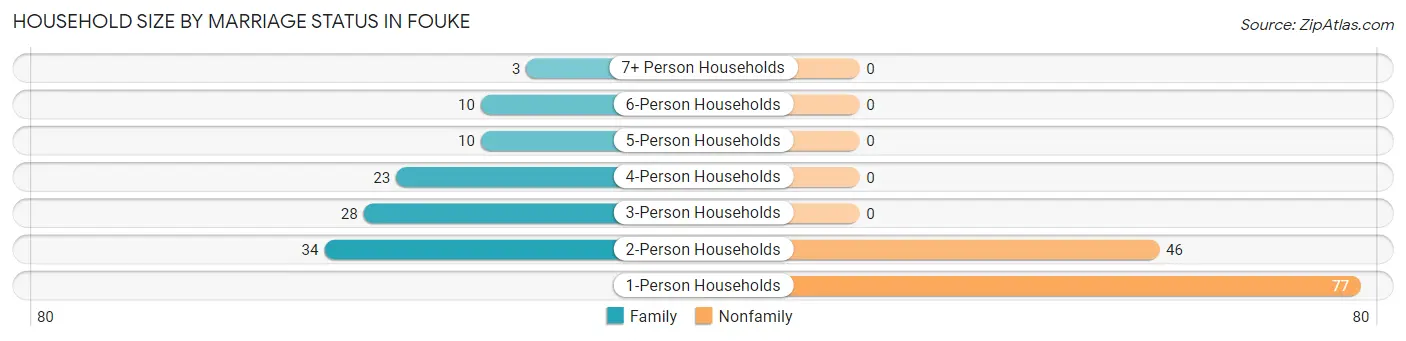
Out of a total of 231 households in Fouke, 108 (46.8%) are family households, while 123 (53.2%) are nonfamily households. The most numerous type of family households are 2-person households, comprising 34, and the most common type of nonfamily households are 1-person households, comprising 77.
| Household Size | Family Households | Nonfamily Households |
| 1-Person Households | - | 77 (33.3%) |
| 2-Person Households | 34 (14.7%) | 46 (19.9%) |
| 3-Person Households | 28 (12.1%) | 0 (0.0%) |
| 4-Person Households | 23 (10.0%) | 0 (0.0%) |
| 5-Person Households | 10 (4.3%) | 0 (0.0%) |
| 6-Person Households | 10 (4.3%) | 0 (0.0%) |
| 7+ Person Households | 3 (1.3%) | 0 (0.0%) |
| Total | 108 (46.8%) | 123 (53.2%) |
Female Fertility in Fouke
Fertility by Age in Fouke
Average fertility rate in Fouke is 123.0 births per 1,000 women. Women in the age bracket of 20 to 34 years have the highest fertility rate with 264.0 births per 1,000 women. Women in the age bracket of 20 to 34 years acount for 100.0% of all women with births.
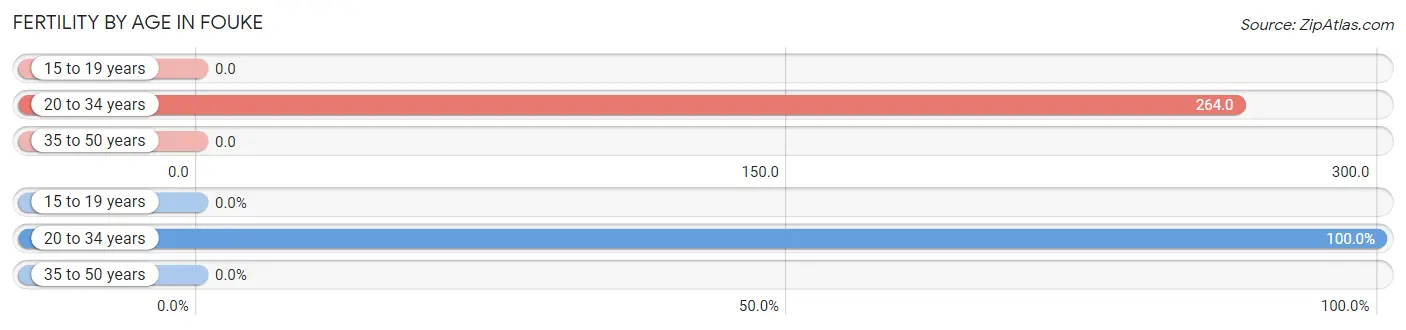
| Age Bracket | Women with Births | Births / 1,000 Women |
| 15 to 19 years | 0 (0.0%) | 0.0 |
| 20 to 34 years | 19 (100.0%) | 264.0 |
| 35 to 50 years | 0 (0.0%) | 0.0 |
| Total | 19 (100.0%) | 123.0 |
Fertility by Age by Marriage Status in Fouke
73.7% of women with births (19) in Fouke are married. The highest percentage of unmarried women with births falls into 20 to 34 years age bracket with 26.3% of them unmarried at the time of birth, while the lowest percentage of unmarried women with births belong to 20 to 34 years age bracket with 26.3% of them unmarried.
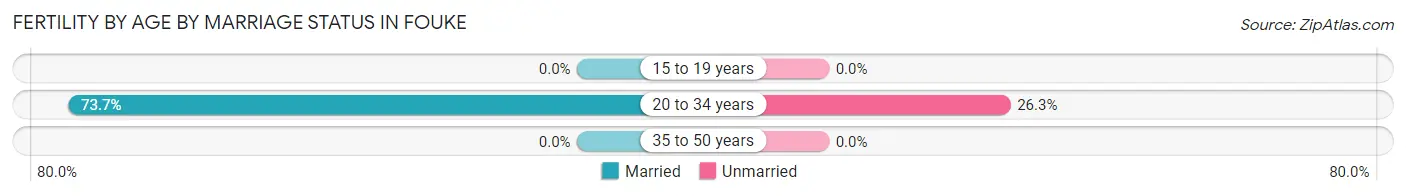
| Age Bracket | Married | Unmarried |
| 15 to 19 years | 0 (0.0%) | 0 (0.0%) |
| 20 to 34 years | 14 (73.7%) | 5 (26.3%) |
| 35 to 50 years | 0 (0.0%) | 0 (0.0%) |
| Total | 14 (73.7%) | 5 (26.3%) |
Fertility by Education in Fouke
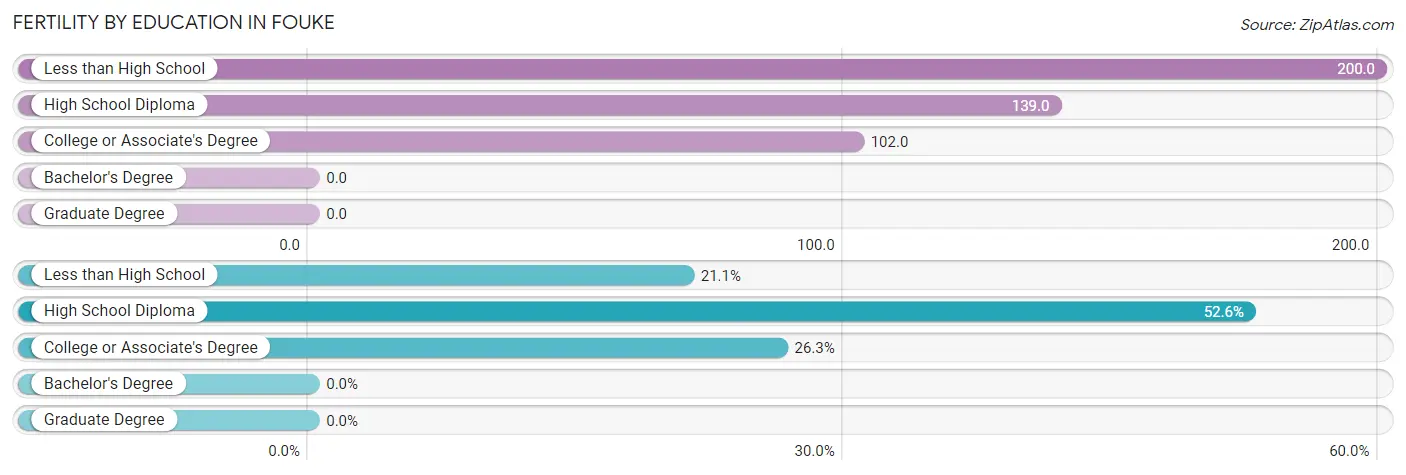
| Educational Attainment | Women with Births | Births / 1,000 Women |
| Less than High School | 4 (21.0%) | 200.0 |
| High School Diploma | 10 (52.6%) | 139.0 |
| College or Associate's Degree | 5 (26.3%) | 102.0 |
| Bachelor's Degree | 0 (0.0%) | 0.0 |
| Graduate Degree | 0 (0.0%) | 0.0 |
| Total | 19 (100.0%) | 123.0 |
Fertility by Education by Marriage Status in Fouke
26.3% of women with births in Fouke are unmarried. Women with the educational attainment of less than high school are most likely to be married with 100.0% of them married at childbirth, while women with the educational attainment of college or associate's degree are least likely to be married with 100.0% of them unmarried at childbirth.
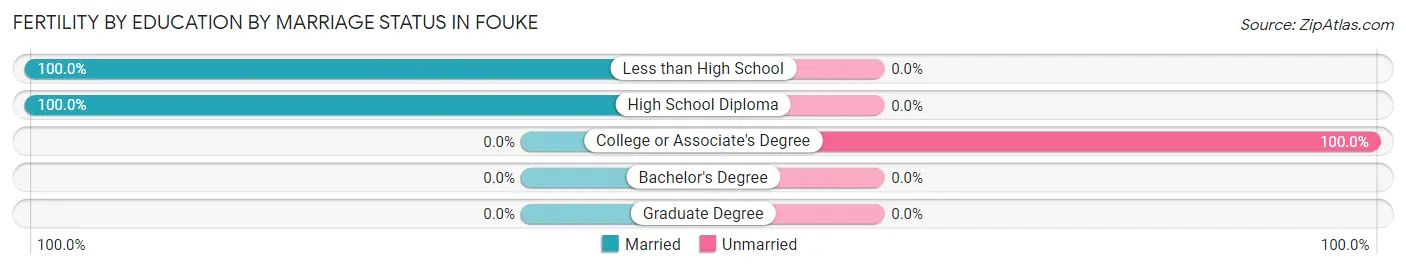
| Educational Attainment | Married | Unmarried |
| Less than High School | 4 (100.0%) | 0 (0.0%) |
| High School Diploma | 10 (100.0%) | 0 (0.0%) |
| College or Associate's Degree | 0 (0.0%) | 5 (100.0%) |
| Bachelor's Degree | 0 (0.0%) | 0 (0.0%) |
| Graduate Degree | 0 (0.0%) | 0 (0.0%) |
| Total | 14 (73.7%) | 5 (26.3%) |
Employment Characteristics in Fouke
Employment by Class of Employer in Fouke
Among the 217 employed individuals in Fouke, private company employees (145 | 66.8%), self-employed (not incorporated) (27 | 12.4%), and not-for-profit organizations (20 | 9.2%) make up the most common classes of employment.
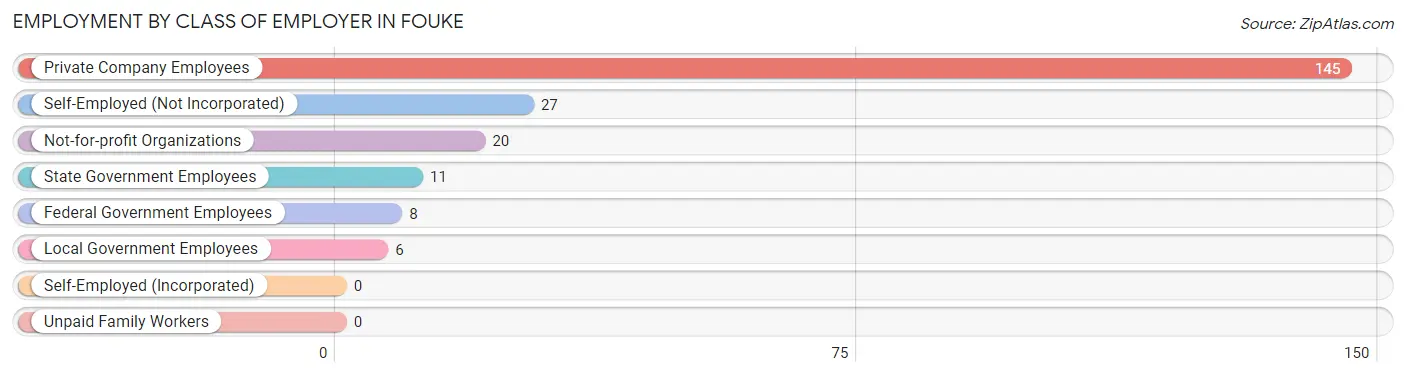
| Employer Class | # Employees | % Employees |
| Private Company Employees | 145 | 66.8% |
| Self-Employed (Incorporated) | 0 | 0.0% |
| Self-Employed (Not Incorporated) | 27 | 12.4% |
| Not-for-profit Organizations | 20 | 9.2% |
| Local Government Employees | 6 | 2.8% |
| State Government Employees | 11 | 5.1% |
| Federal Government Employees | 8 | 3.7% |
| Unpaid Family Workers | 0 | 0.0% |
| Total | 217 | 100.0% |
Employment Status by Age in Fouke
According to the labor force statistics for Fouke, out of the total population over 16 years of age (452), 59.7% or 270 individuals are in the labor force, with 7.4% or 20 of them unemployed. The age group with the highest labor force participation rate is 16 to 19 years, with 96.9% or 31 individuals in the labor force. Within the labor force, the 20 to 24 years age range has the highest percentage of unemployed individuals, with 13.3% or 8 of them being unemployed.
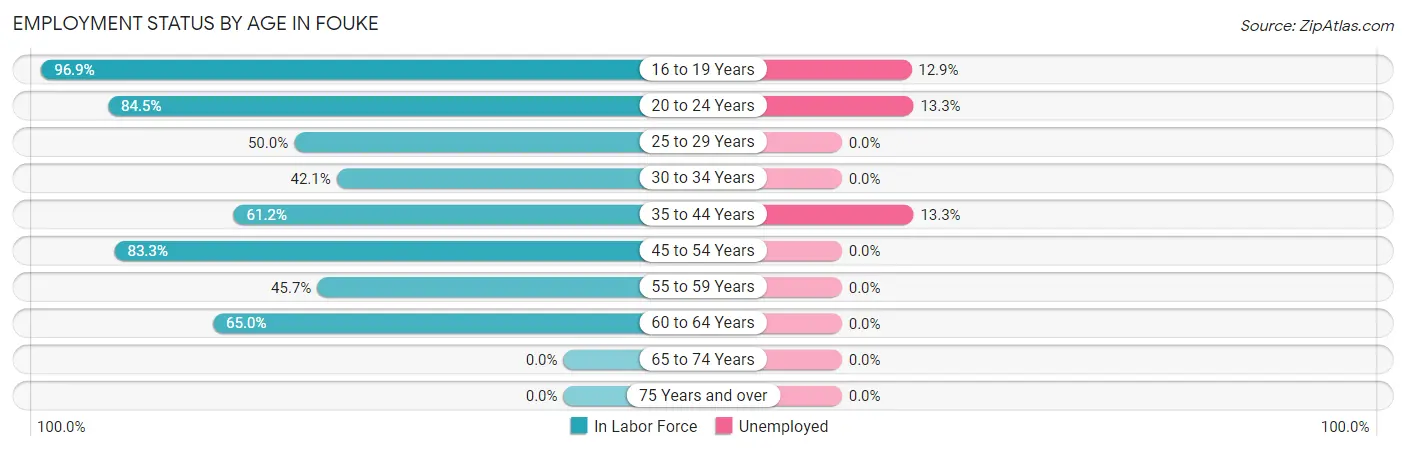
| Age Bracket | In Labor Force | Unemployed |
| 16 to 19 Years | 31 (96.9%) | 4 (12.9%) |
| 20 to 24 Years | 60 (84.5%) | 8 (13.3%) |
| 25 to 29 Years | 11 (50.0%) | 0 (0.0%) |
| 30 to 34 Years | 16 (42.1%) | 0 (0.0%) |
| 35 to 44 Years | 60 (61.2%) | 8 (13.3%) |
| 45 to 54 Years | 50 (83.3%) | 0 (0.0%) |
| 55 to 59 Years | 16 (45.7%) | 0 (0.0%) |
| 60 to 64 Years | 26 (65.0%) | 0 (0.0%) |
| 65 to 74 Years | 0 (0.0%) | 0 (0.0%) |
| 75 Years and over | 0 (0.0%) | 0 (0.0%) |
| Total | 270 (59.7%) | 20 (7.4%) |
Employment Status by Educational Attainment in Fouke
According to labor force statistics for Fouke, 61.1% of individuals (179) out of the total population between 25 and 64 years of age (293) are in the labor force, with 4.5% or 8 of them being unemployed. The group with the highest labor force participation rate are those with the educational attainment of bachelor's degree or higher, with 77.8% or 21 individuals in the labor force. Within the labor force, individuals with high school diploma education have the highest percentage of unemployment, with 15.1% or 8 of them being unemployed.
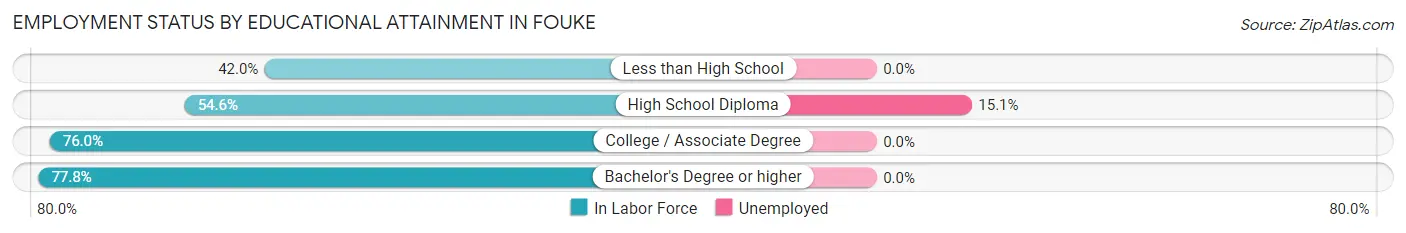
| Educational Attainment | In Labor Force | Unemployed |
| Less than High School | 29 (42.0%) | 0 (0.0%) |
| High School Diploma | 53 (54.6%) | 15 (15.1%) |
| College / Associate Degree | 76 (76.0%) | 0 (0.0%) |
| Bachelor's Degree or higher | 21 (77.8%) | 0 (0.0%) |
| Total | 179 (61.1%) | 13 (4.5%) |
Employment Occupations by Sex in Fouke
Management, Business, Science and Arts Occupations
The most common Management, Business, Science and Arts occupations in Fouke are Community & Social Service (20 | 8.0%), Management (14 | 5.6%), Education Instruction & Library (13 | 5.2%), Computers, Engineering & Science (7 | 2.8%), and Life, Physical & Social Science (7 | 2.8%).
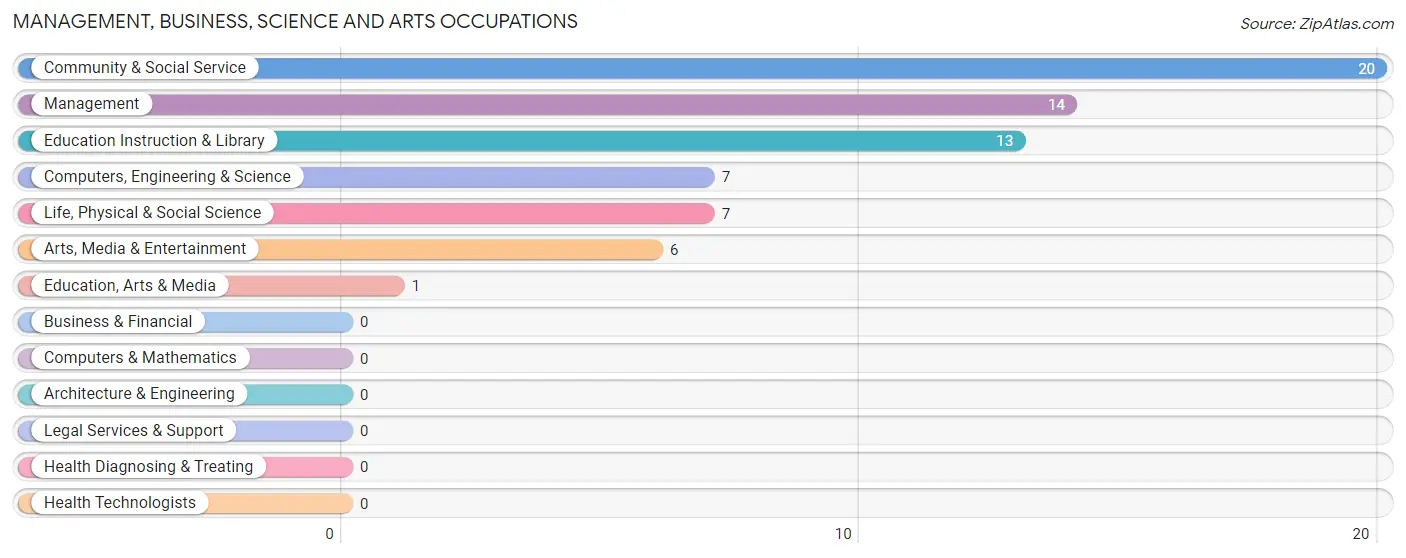
Management, Business, Science and Arts Occupations by Sex
Within the Management, Business, Science and Arts occupations in Fouke, the most male-oriented occupations are Management (100.0%), Education, Arts & Media (100.0%), and Arts, Media & Entertainment (100.0%), while the most female-oriented occupations are Computers, Engineering & Science (100.0%), Life, Physical & Social Science (100.0%), and Education Instruction & Library (100.0%).
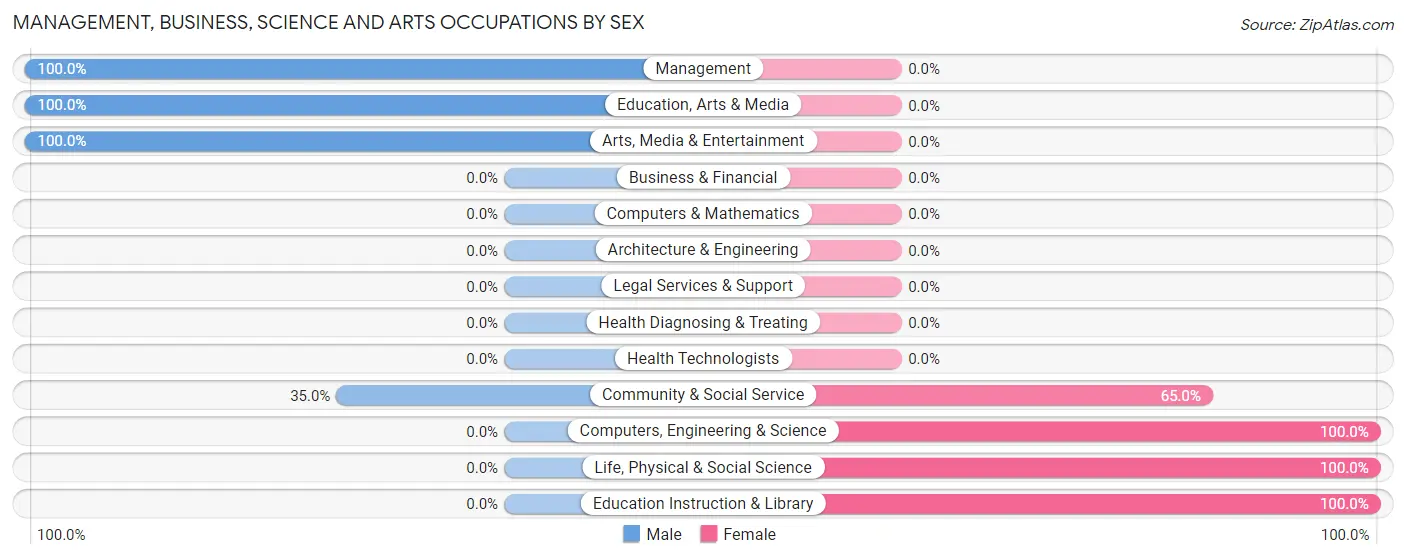
| Occupation | Male | Female |
| Management | 14 (100.0%) | 0 (0.0%) |
| Business & Financial | 0 (0.0%) | 0 (0.0%) |
| Computers, Engineering & Science | 0 (0.0%) | 7 (100.0%) |
| Computers & Mathematics | 0 (0.0%) | 0 (0.0%) |
| Architecture & Engineering | 0 (0.0%) | 0 (0.0%) |
| Life, Physical & Social Science | 0 (0.0%) | 7 (100.0%) |
| Community & Social Service | 7 (35.0%) | 13 (65.0%) |
| Education, Arts & Media | 1 (100.0%) | 0 (0.0%) |
| Legal Services & Support | 0 (0.0%) | 0 (0.0%) |
| Education Instruction & Library | 0 (0.0%) | 13 (100.0%) |
| Arts, Media & Entertainment | 6 (100.0%) | 0 (0.0%) |
| Health Diagnosing & Treating | 0 (0.0%) | 0 (0.0%) |
| Health Technologists | 0 (0.0%) | 0 (0.0%) |
| Total (Category) | 21 (51.2%) | 20 (48.8%) |
| Total (Overall) | 115 (46.0%) | 135 (54.0%) |
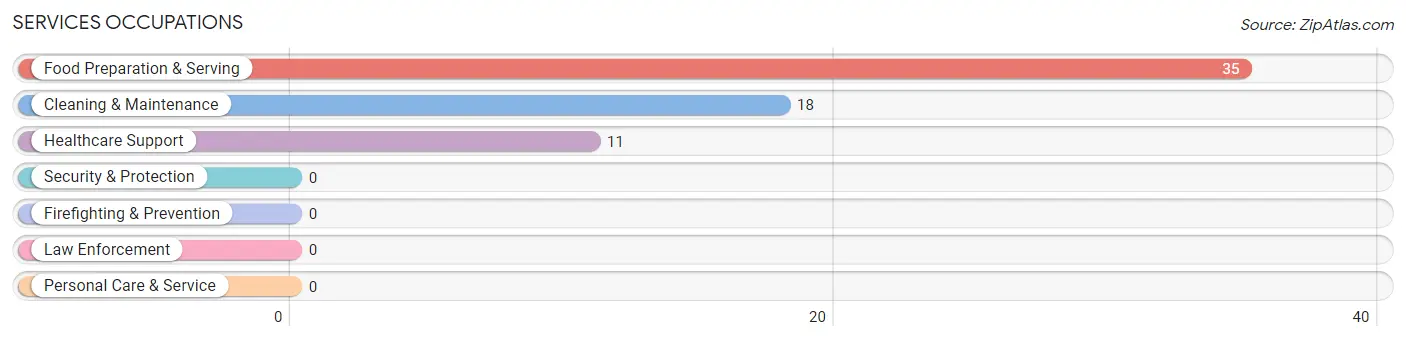
Services Occupations
The most common Services occupations in Fouke are Food Preparation & Serving (35 | 14.0%), Cleaning & Maintenance (18 | 7.2%), and Healthcare Support (11 | 4.4%).
Services Occupations by Sex
Within the Services occupations in Fouke, the most male-oriented occupations are Cleaning & Maintenance (22.2%), and Food Preparation & Serving (11.4%), while the most female-oriented occupations are Healthcare Support (100.0%), Food Preparation & Serving (88.6%), and Cleaning & Maintenance (77.8%).
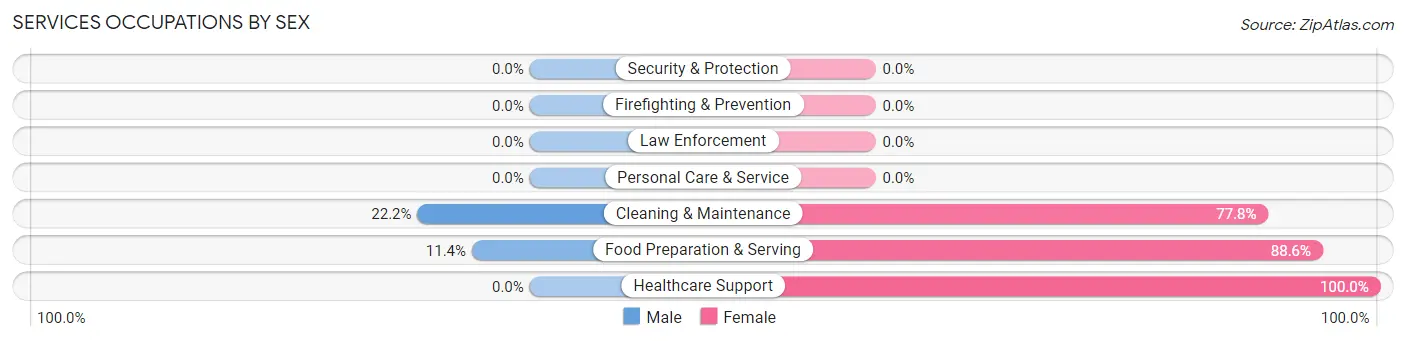
| Occupation | Male | Female |
| Healthcare Support | 0 (0.0%) | 11 (100.0%) |
| Security & Protection | 0 (0.0%) | 0 (0.0%) |
| Firefighting & Prevention | 0 (0.0%) | 0 (0.0%) |
| Law Enforcement | 0 (0.0%) | 0 (0.0%) |
| Food Preparation & Serving | 4 (11.4%) | 31 (88.6%) |
| Cleaning & Maintenance | 4 (22.2%) | 14 (77.8%) |
| Personal Care & Service | 0 (0.0%) | 0 (0.0%) |
| Total (Category) | 8 (12.5%) | 56 (87.5%) |
| Total (Overall) | 115 (46.0%) | 135 (54.0%) |
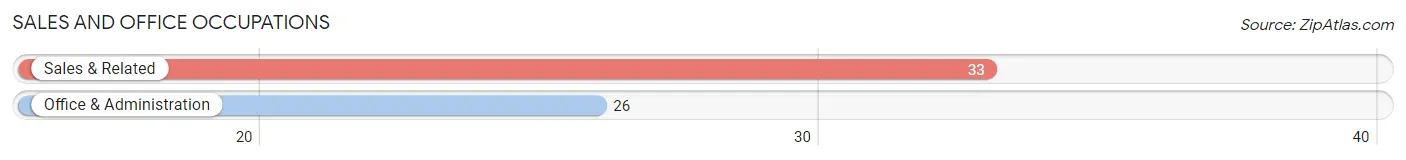
Sales and Office Occupations
The most common Sales and Office occupations in Fouke are Sales & Related (33 | 13.2%), and Office & Administration (26 | 10.4%).
Sales and Office Occupations by Sex
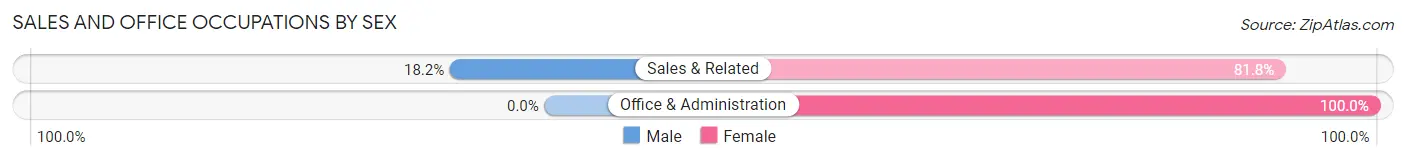
| Occupation | Male | Female |
| Sales & Related | 6 (18.2%) | 27 (81.8%) |
| Office & Administration | 0 (0.0%) | 26 (100.0%) |
| Total (Category) | 6 (10.2%) | 53 (89.8%) |
| Total (Overall) | 115 (46.0%) | 135 (54.0%) |
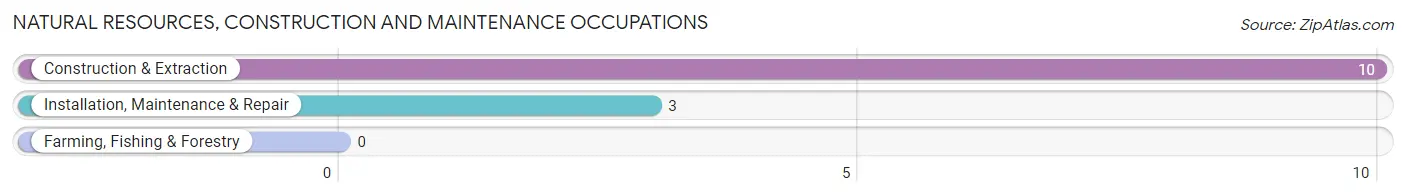
Natural Resources, Construction and Maintenance Occupations
The most common Natural Resources, Construction and Maintenance occupations in Fouke are Construction & Extraction (10 | 4.0%), and Installation, Maintenance & Repair (3 | 1.2%).
Natural Resources, Construction and Maintenance Occupations by Sex
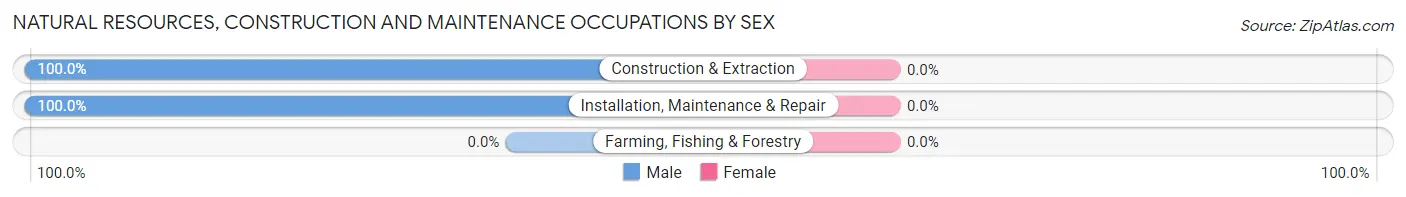
| Occupation | Male | Female |
| Farming, Fishing & Forestry | 0 (0.0%) | 0 (0.0%) |
| Construction & Extraction | 10 (100.0%) | 0 (0.0%) |
| Installation, Maintenance & Repair | 3 (100.0%) | 0 (0.0%) |
| Total (Category) | 13 (100.0%) | 0 (0.0%) |
| Total (Overall) | 115 (46.0%) | 135 (54.0%) |
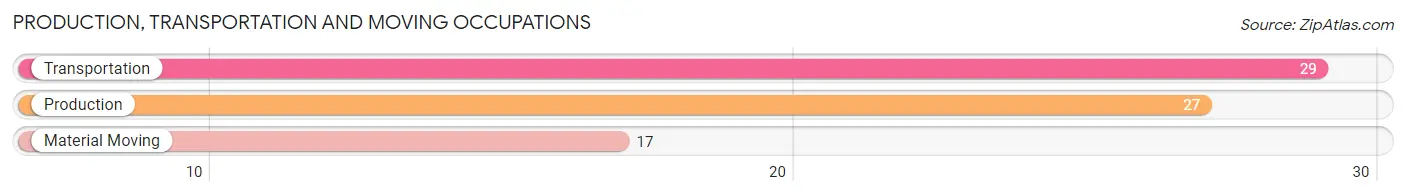
Production, Transportation and Moving Occupations
The most common Production, Transportation and Moving occupations in Fouke are Transportation (29 | 11.6%), Production (27 | 10.8%), and Material Moving (17 | 6.8%).
Production, Transportation and Moving Occupations by Sex
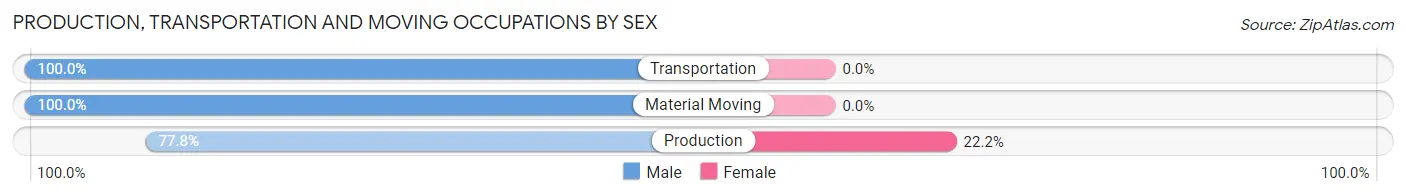
| Occupation | Male | Female |
| Production | 21 (77.8%) | 6 (22.2%) |
| Transportation | 29 (100.0%) | 0 (0.0%) |
| Material Moving | 17 (100.0%) | 0 (0.0%) |
| Total (Category) | 67 (91.8%) | 6 (8.2%) |
| Total (Overall) | 115 (46.0%) | 135 (54.0%) |
Employment Industries by Sex in Fouke
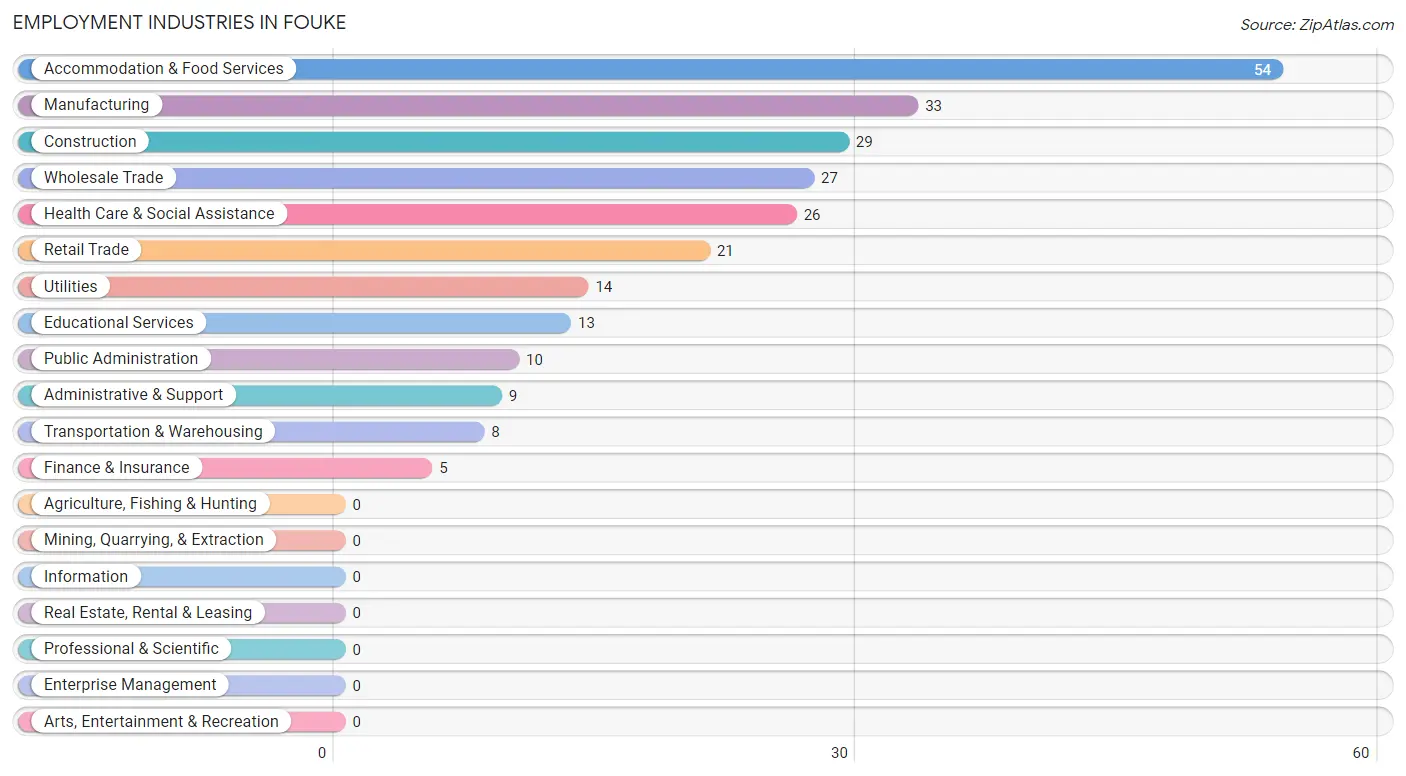
Employment Industries in Fouke
The major employment industries in Fouke include Accommodation & Food Services (54 | 21.6%), Manufacturing (33 | 13.2%), Construction (29 | 11.6%), Wholesale Trade (27 | 10.8%), and Health Care & Social Assistance (26 | 10.4%).
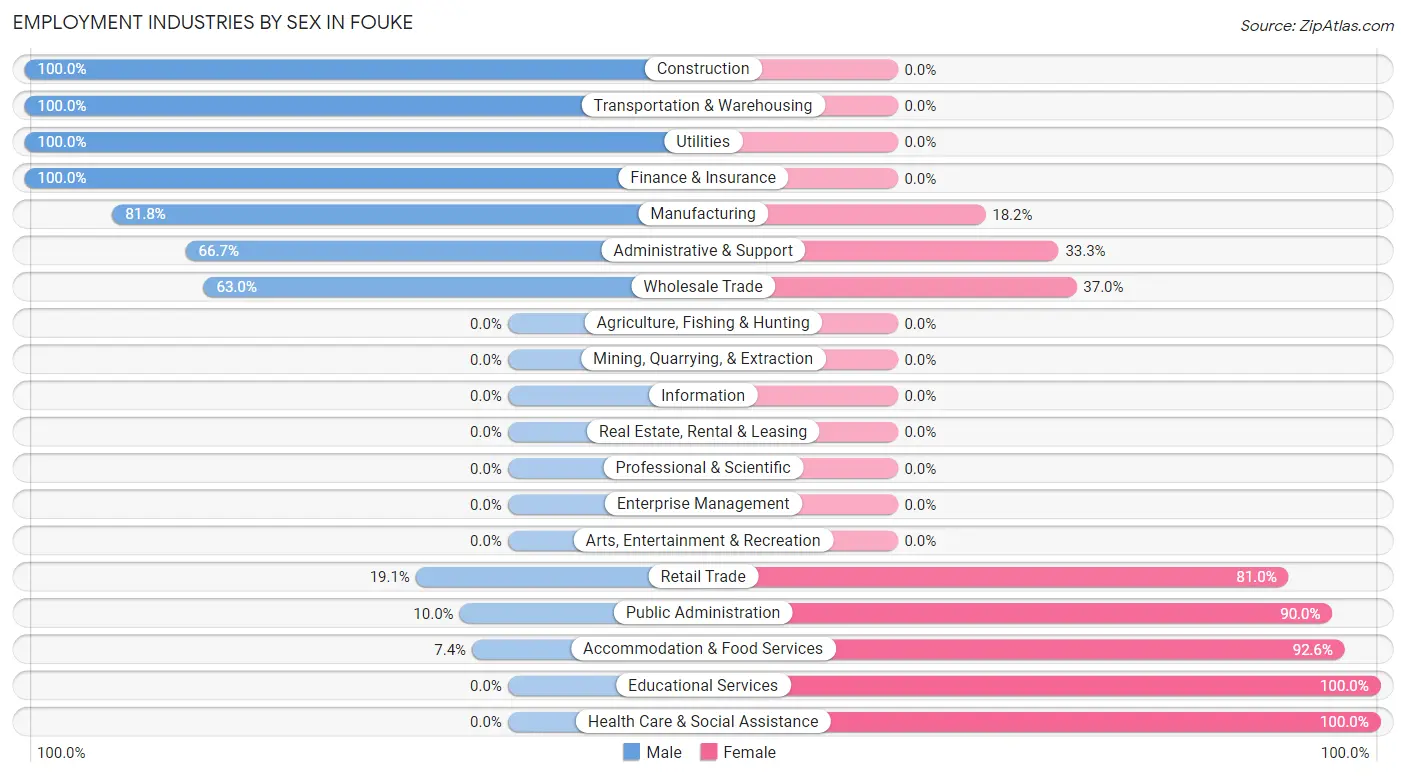
Employment Industries by Sex in Fouke
The Fouke industries that see more men than women are Construction (100.0%), Transportation & Warehousing (100.0%), and Utilities (100.0%), whereas the industries that tend to have a higher number of women are Educational Services (100.0%), Health Care & Social Assistance (100.0%), and Accommodation & Food Services (92.6%).
| Industry | Male | Female |
| Agriculture, Fishing & Hunting | 0 (0.0%) | 0 (0.0%) |
| Mining, Quarrying, & Extraction | 0 (0.0%) | 0 (0.0%) |
| Construction | 29 (100.0%) | 0 (0.0%) |
| Manufacturing | 27 (81.8%) | 6 (18.2%) |
| Wholesale Trade | 17 (63.0%) | 10 (37.0%) |
| Retail Trade | 4 (19.1%) | 17 (80.9%) |
| Transportation & Warehousing | 8 (100.0%) | 0 (0.0%) |
| Utilities | 14 (100.0%) | 0 (0.0%) |
| Information | 0 (0.0%) | 0 (0.0%) |
| Finance & Insurance | 5 (100.0%) | 0 (0.0%) |
| Real Estate, Rental & Leasing | 0 (0.0%) | 0 (0.0%) |
| Professional & Scientific | 0 (0.0%) | 0 (0.0%) |
| Enterprise Management | 0 (0.0%) | 0 (0.0%) |
| Administrative & Support | 6 (66.7%) | 3 (33.3%) |
| Educational Services | 0 (0.0%) | 13 (100.0%) |
| Health Care & Social Assistance | 0 (0.0%) | 26 (100.0%) |
| Arts, Entertainment & Recreation | 0 (0.0%) | 0 (0.0%) |
| Accommodation & Food Services | 4 (7.4%) | 50 (92.6%) |
| Public Administration | 1 (10.0%) | 9 (90.0%) |
| Total | 115 (46.0%) | 135 (54.0%) |
Education in Fouke
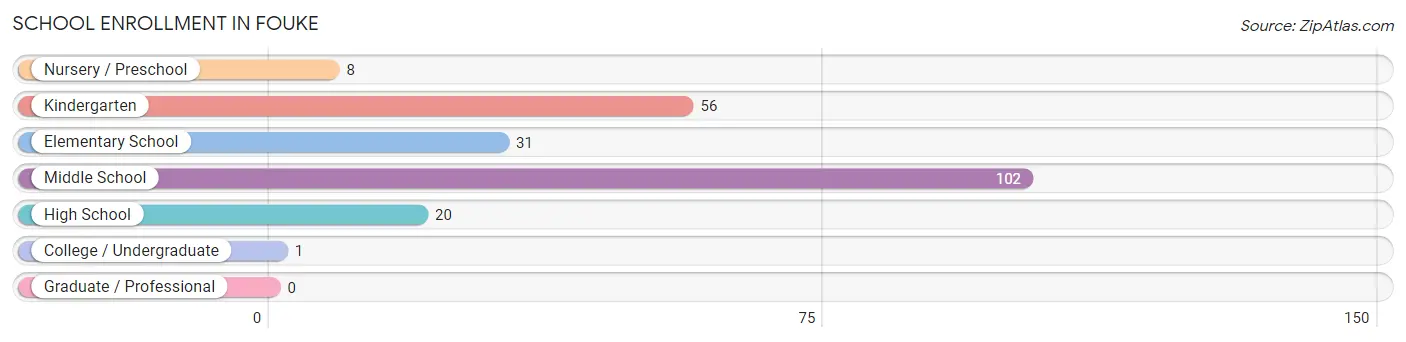
School Enrollment in Fouke
The most common levels of schooling among the 218 students in Fouke are middle school (102 | 46.8%), kindergarten (56 | 25.7%), and elementary school (31 | 14.2%).
| School Level | # Students | % Students |
| Nursery / Preschool | 8 | 3.7% |
| Kindergarten | 56 | 25.7% |
| Elementary School | 31 | 14.2% |
| Middle School | 102 | 46.8% |
| High School | 20 | 9.2% |
| College / Undergraduate | 1 | 0.5% |
| Graduate / Professional | 0 | 0.0% |
| Total | 218 | 100.0% |
School Enrollment by Age by Funding Source in Fouke
Out of a total of 218 students who are enrolled in schools in Fouke, 47 (21.6%) attend a private institution, while the remaining 171 (78.4%) are enrolled in public schools. The age group of 10 to 14 year olds has the highest likelihood of being enrolled in private schools, with 30 (29.1% in the age bracket) enrolled. Conversely, the age group of 3 to 4 year olds has the lowest likelihood of being enrolled in a private school, with 20 (100.0% in the age bracket) attending a public institution.
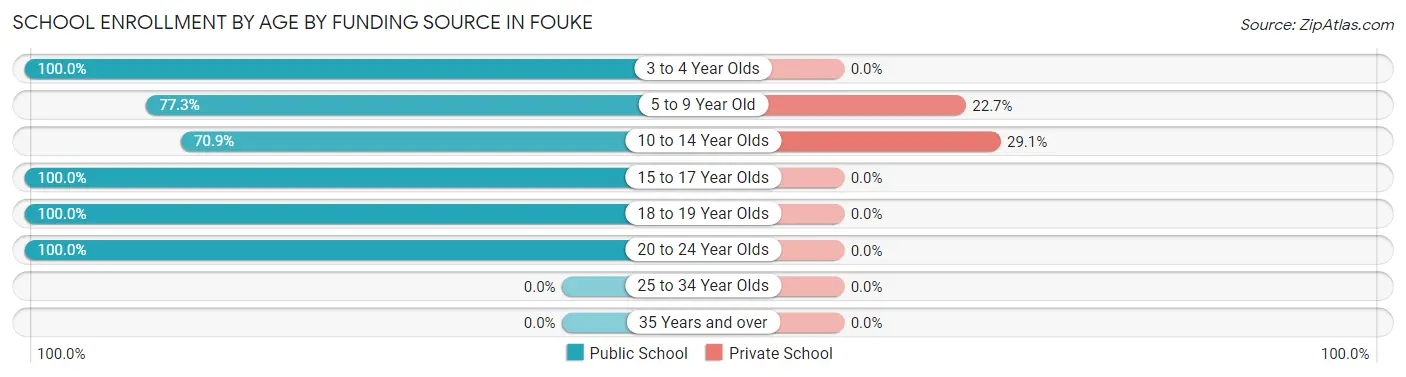
| Age Bracket | Public School | Private School |
| 3 to 4 Year Olds | 20 (100.0%) | 0 (0.0%) |
| 5 to 9 Year Old | 58 (77.3%) | 17 (22.7%) |
| 10 to 14 Year Olds | 73 (70.9%) | 30 (29.1%) |
| 15 to 17 Year Olds | 15 (100.0%) | 0 (0.0%) |
| 18 to 19 Year Olds | 4 (100.0%) | 0 (0.0%) |
| 20 to 24 Year Olds | 1 (100.0%) | 0 (0.0%) |
| 25 to 34 Year Olds | 0 (0.0%) | 0 (0.0%) |
| 35 Years and over | 0 (0.0%) | 0 (0.0%) |
| Total | 171 (78.4%) | 47 (21.6%) |
Educational Attainment by Field of Study in Fouke
Liberal arts & history (12 | 37.5%), social sciences (7 | 21.9%), science & technology (6 | 18.8%), education (5 | 15.6%), and communications (2 | 6.2%) are the most common fields of study among 32 individuals in Fouke who have obtained a bachelor's degree or higher.
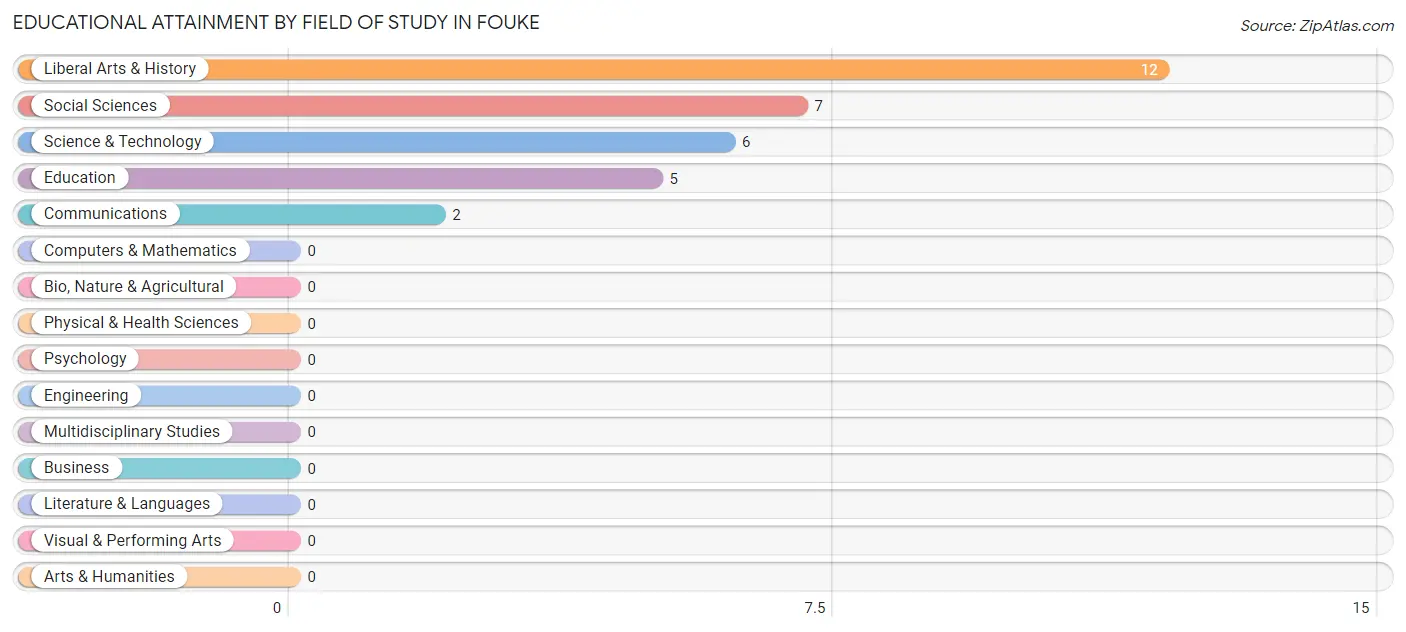
| Field of Study | # Graduates | % Graduates |
| Computers & Mathematics | 0 | 0.0% |
| Bio, Nature & Agricultural | 0 | 0.0% |
| Physical & Health Sciences | 0 | 0.0% |
| Psychology | 0 | 0.0% |
| Social Sciences | 7 | 21.9% |
| Engineering | 0 | 0.0% |
| Multidisciplinary Studies | 0 | 0.0% |
| Science & Technology | 6 | 18.8% |
| Business | 0 | 0.0% |
| Education | 5 | 15.6% |
| Literature & Languages | 0 | 0.0% |
| Liberal Arts & History | 12 | 37.5% |
| Visual & Performing Arts | 0 | 0.0% |
| Communications | 2 | 6.2% |
| Arts & Humanities | 0 | 0.0% |
| Total | 32 | 100.0% |
Transportation & Commute in Fouke
Vehicle Availability by Sex in Fouke
The most prevalent vehicle ownership categories in Fouke are males with 3 vehicles (36, accounting for 36.7%) and females with 3 vehicles (40, making up 30.2%).
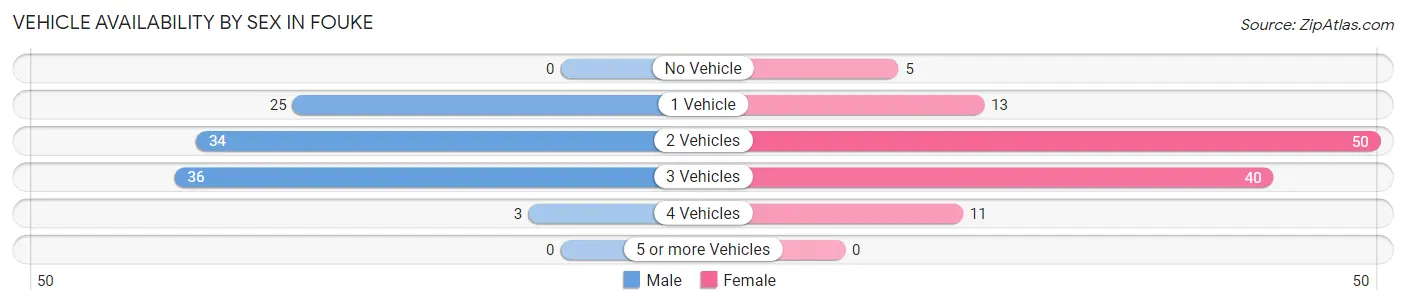
| Vehicles Available | Male | Female |
| No Vehicle | 0 (0.0%) | 5 (4.2%) |
| 1 Vehicle | 25 (25.5%) | 13 (10.9%) |
| 2 Vehicles | 34 (34.7%) | 50 (42.0%) |
| 3 Vehicles | 36 (36.7%) | 40 (33.6%) |
| 4 Vehicles | 3 (3.1%) | 11 (9.2%) |
| 5 or more Vehicles | 0 (0.0%) | 0 (0.0%) |
| Total | 98 (100.0%) | 119 (100.0%) |
Commute Time in Fouke
The most frequently occuring commute durations in Fouke are 15 to 19 minutes (46 commuters, 22.2%), 30 to 34 minutes (43 commuters, 20.8%), and 20 to 24 minutes (41 commuters, 19.8%).
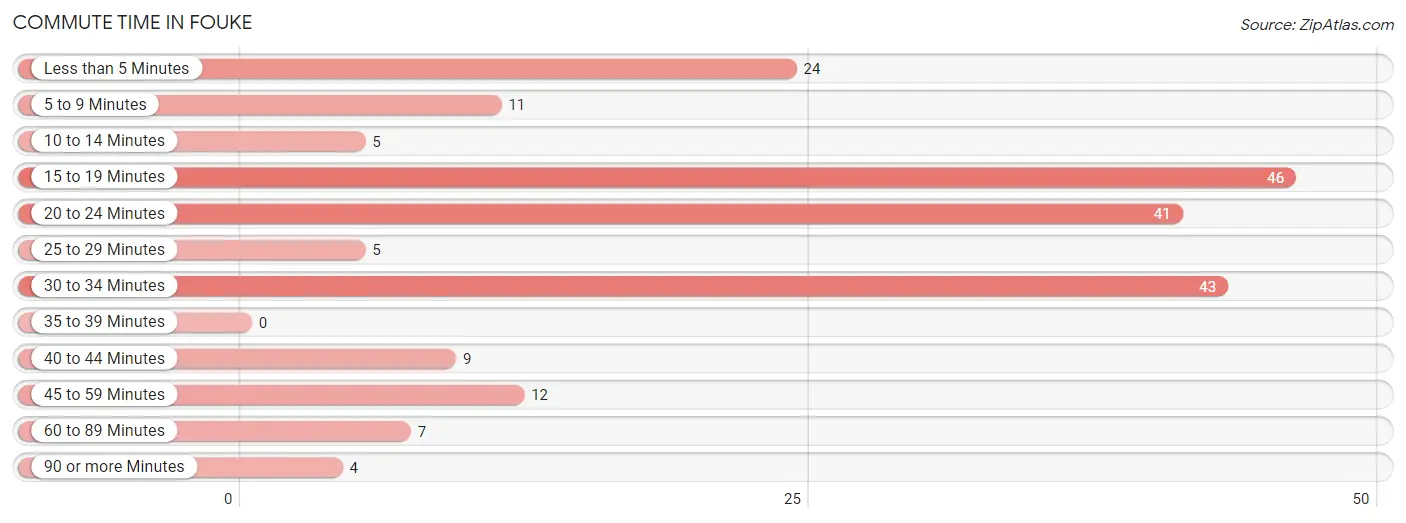
| Commute Time | # Commuters | % Commuters |
| Less than 5 Minutes | 24 | 11.6% |
| 5 to 9 Minutes | 11 | 5.3% |
| 10 to 14 Minutes | 5 | 2.4% |
| 15 to 19 Minutes | 46 | 22.2% |
| 20 to 24 Minutes | 41 | 19.8% |
| 25 to 29 Minutes | 5 | 2.4% |
| 30 to 34 Minutes | 43 | 20.8% |
| 35 to 39 Minutes | 0 | 0.0% |
| 40 to 44 Minutes | 9 | 4.3% |
| 45 to 59 Minutes | 12 | 5.8% |
| 60 to 89 Minutes | 7 | 3.4% |
| 90 or more Minutes | 4 | 1.9% |
Commute Time by Sex in Fouke
The most common commute times in Fouke are 15 to 19 minutes (29 commuters, 29.6%) for males and 20 to 24 minutes (40 commuters, 36.7%) for females.
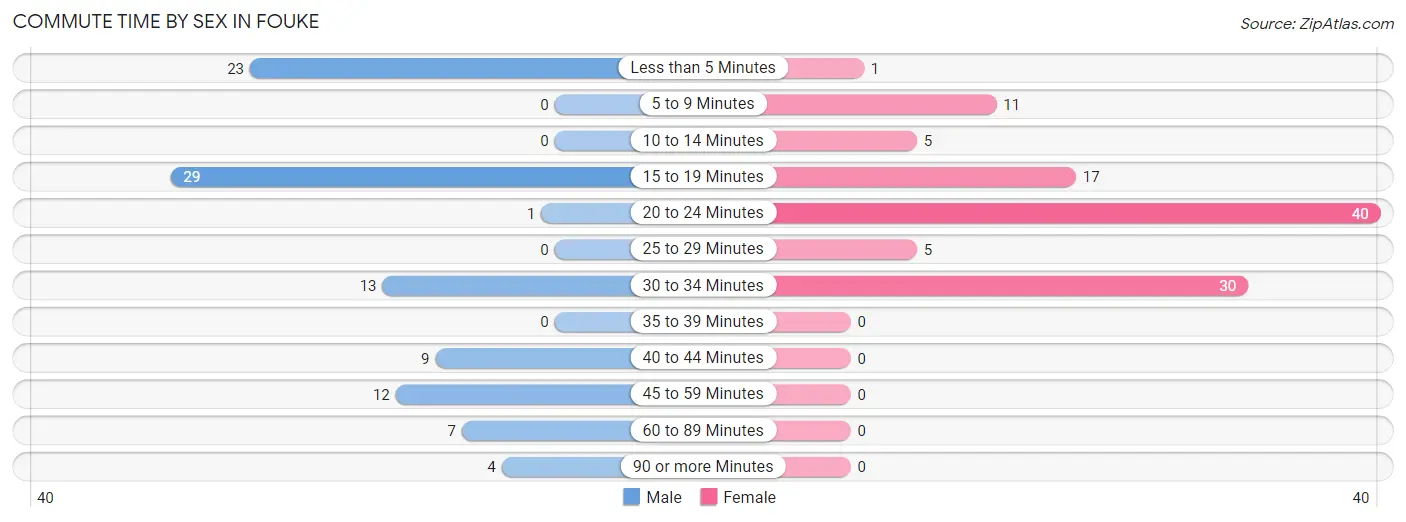
| Commute Time | Male | Female |
| Less than 5 Minutes | 23 (23.5%) | 1 (0.9%) |
| 5 to 9 Minutes | 0 (0.0%) | 11 (10.1%) |
| 10 to 14 Minutes | 0 (0.0%) | 5 (4.6%) |
| 15 to 19 Minutes | 29 (29.6%) | 17 (15.6%) |
| 20 to 24 Minutes | 1 (1.0%) | 40 (36.7%) |
| 25 to 29 Minutes | 0 (0.0%) | 5 (4.6%) |
| 30 to 34 Minutes | 13 (13.3%) | 30 (27.5%) |
| 35 to 39 Minutes | 0 (0.0%) | 0 (0.0%) |
| 40 to 44 Minutes | 9 (9.2%) | 0 (0.0%) |
| 45 to 59 Minutes | 12 (12.2%) | 0 (0.0%) |
| 60 to 89 Minutes | 7 (7.1%) | 0 (0.0%) |
| 90 or more Minutes | 4 (4.1%) | 0 (0.0%) |
Time of Departure to Work by Sex in Fouke
The most frequent times of departure to work in Fouke are 6:00 AM to 6:29 AM (34, 34.7%) for males and 7:30 AM to 7:59 AM (24, 22.0%) for females.
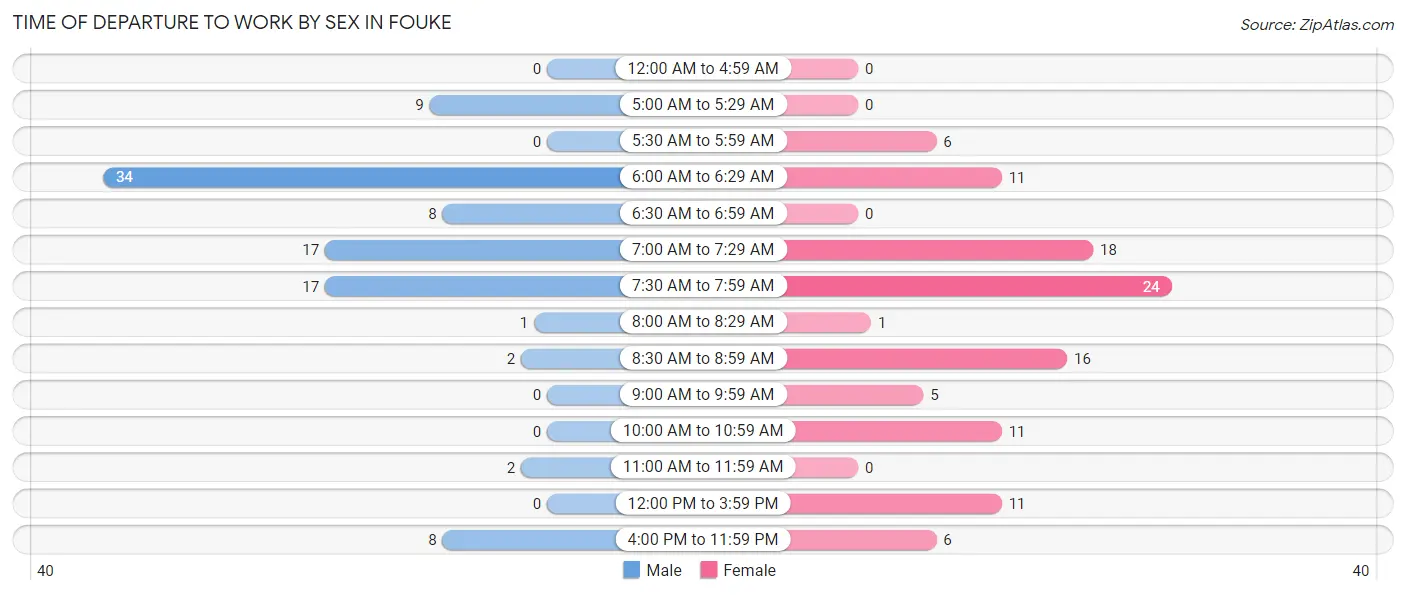
| Time of Departure | Male | Female |
| 12:00 AM to 4:59 AM | 0 (0.0%) | 0 (0.0%) |
| 5:00 AM to 5:29 AM | 9 (9.2%) | 0 (0.0%) |
| 5:30 AM to 5:59 AM | 0 (0.0%) | 6 (5.5%) |
| 6:00 AM to 6:29 AM | 34 (34.7%) | 11 (10.1%) |
| 6:30 AM to 6:59 AM | 8 (8.2%) | 0 (0.0%) |
| 7:00 AM to 7:29 AM | 17 (17.3%) | 18 (16.5%) |
| 7:30 AM to 7:59 AM | 17 (17.3%) | 24 (22.0%) |
| 8:00 AM to 8:29 AM | 1 (1.0%) | 1 (0.9%) |
| 8:30 AM to 8:59 AM | 2 (2.0%) | 16 (14.7%) |
| 9:00 AM to 9:59 AM | 0 (0.0%) | 5 (4.6%) |
| 10:00 AM to 10:59 AM | 0 (0.0%) | 11 (10.1%) |
| 11:00 AM to 11:59 AM | 2 (2.0%) | 0 (0.0%) |
| 12:00 PM to 3:59 PM | 0 (0.0%) | 11 (10.1%) |
| 4:00 PM to 11:59 PM | 8 (8.2%) | 6 (5.5%) |
| Total | 98 (100.0%) | 109 (100.0%) |
Housing Occupancy in Fouke
Occupancy by Ownership in Fouke
Of the total 231 dwellings in Fouke, owner-occupied units account for 131 (56.7%), while renter-occupied units make up 100 (43.3%).
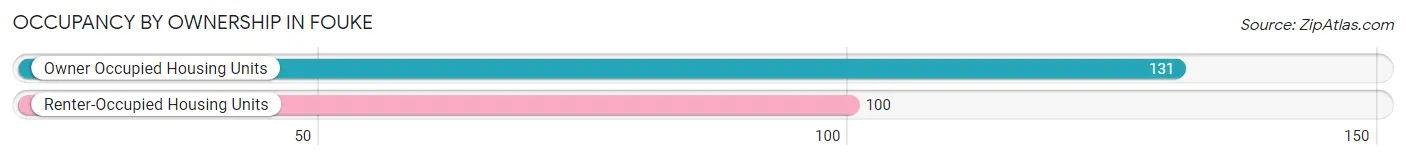
| Occupancy | # Housing Units | % Housing Units |
| Owner Occupied Housing Units | 131 | 56.7% |
| Renter-Occupied Housing Units | 100 | 43.3% |
| Total Occupied Housing Units | 231 | 100.0% |
Occupancy by Household Size in Fouke
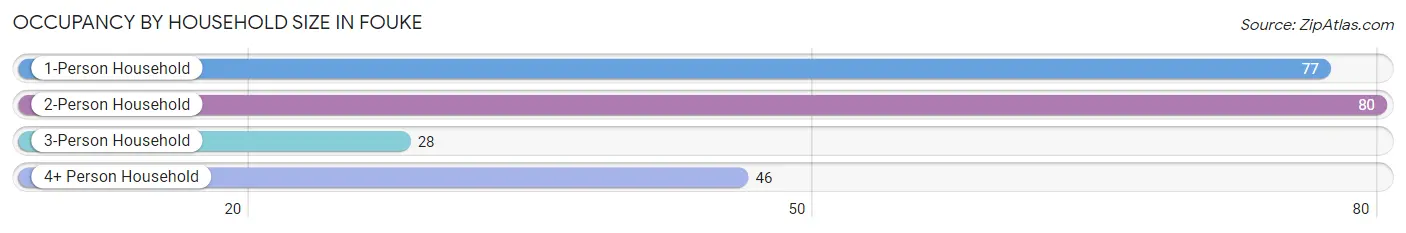
| Household Size | # Housing Units | % Housing Units |
| 1-Person Household | 77 | 33.3% |
| 2-Person Household | 80 | 34.6% |
| 3-Person Household | 28 | 12.1% |
| 4+ Person Household | 46 | 19.9% |
| Total Housing Units | 231 | 100.0% |
Occupancy by Ownership by Household Size in Fouke
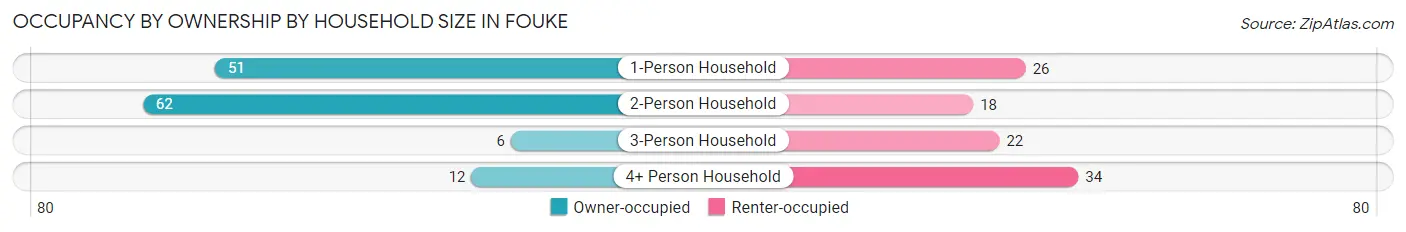
| Household Size | Owner-occupied | Renter-occupied |
| 1-Person Household | 51 (66.2%) | 26 (33.8%) |
| 2-Person Household | 62 (77.5%) | 18 (22.5%) |
| 3-Person Household | 6 (21.4%) | 22 (78.6%) |
| 4+ Person Household | 12 (26.1%) | 34 (73.9%) |
| Total Housing Units | 131 (56.7%) | 100 (43.3%) |
Occupancy by Educational Attainment in Fouke
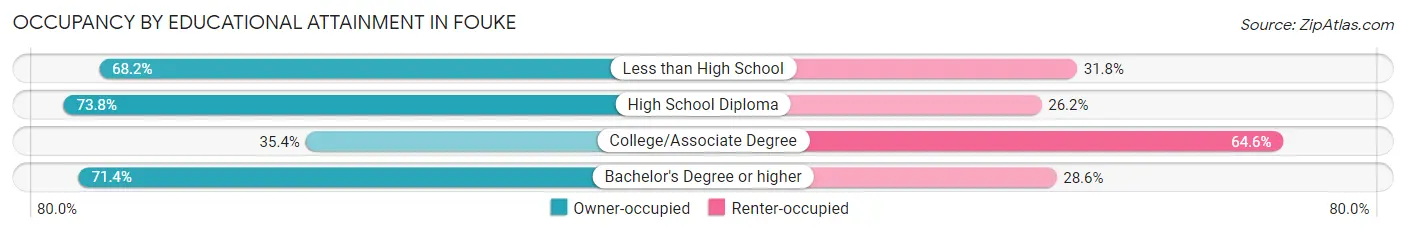
| Household Size | Owner-occupied | Renter-occupied |
| Less than High School | 30 (68.2%) | 14 (31.8%) |
| High School Diploma | 62 (73.8%) | 22 (26.2%) |
| College/Associate Degree | 34 (35.4%) | 62 (64.6%) |
| Bachelor's Degree or higher | 5 (71.4%) | 2 (28.6%) |
Occupancy by Age of Householder in Fouke
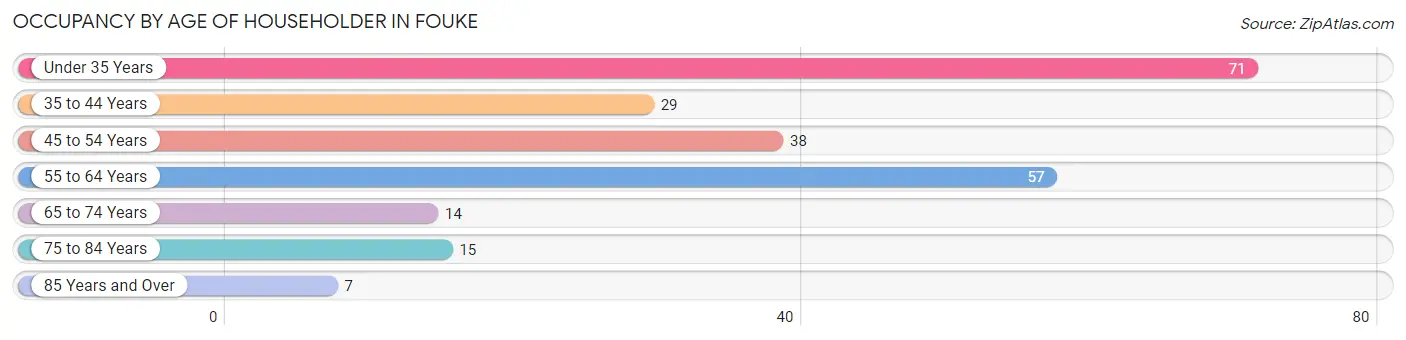
| Age Bracket | # Households | % Households |
| Under 35 Years | 71 | 30.7% |
| 35 to 44 Years | 29 | 12.6% |
| 45 to 54 Years | 38 | 16.5% |
| 55 to 64 Years | 57 | 24.7% |
| 65 to 74 Years | 14 | 6.1% |
| 75 to 84 Years | 15 | 6.5% |
| 85 Years and Over | 7 | 3.0% |
| Total | 231 | 100.0% |
Housing Finances in Fouke
Median Income by Occupancy in Fouke
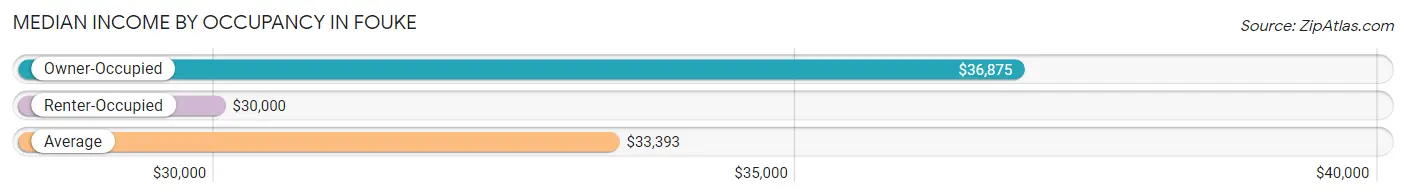
| Occupancy Type | # Households | Median Income |
| Owner-Occupied | 131 (56.7%) | $36,875 |
| Renter-Occupied | 100 (43.3%) | $30,000 |
| Average | 231 (100.0%) | $33,393 |
Occupancy by Householder Income Bracket in Fouke
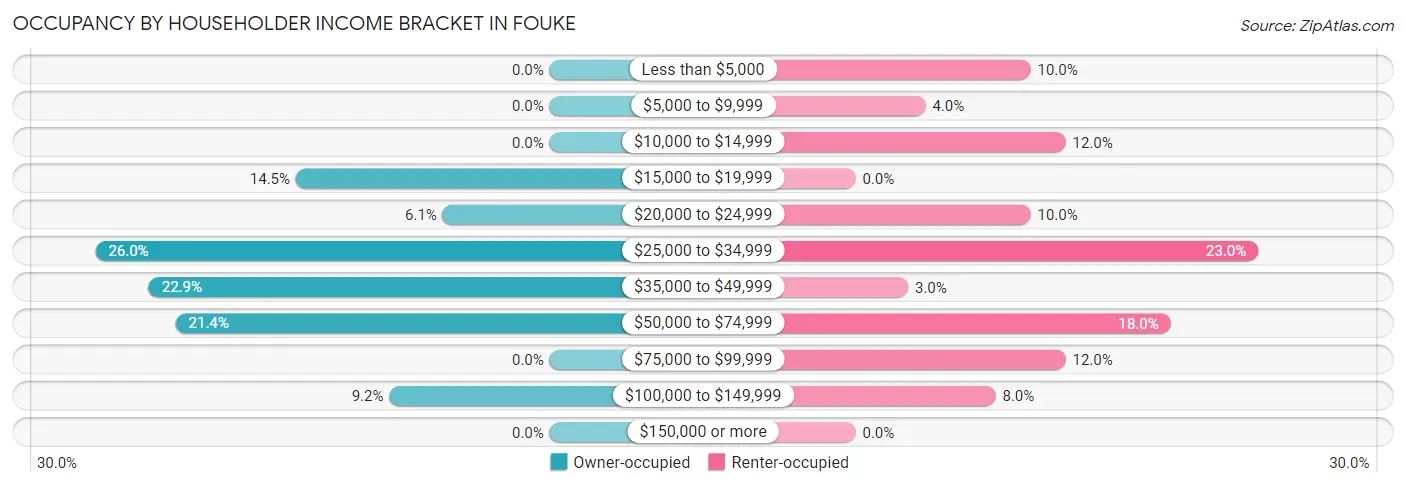
| Income Bracket | Owner-occupied | Renter-occupied |
| Less than $5,000 | 0 (0.0%) | 10 (10.0%) |
| $5,000 to $9,999 | 0 (0.0%) | 4 (4.0%) |
| $10,000 to $14,999 | 0 (0.0%) | 12 (12.0%) |
| $15,000 to $19,999 | 19 (14.5%) | 0 (0.0%) |
| $20,000 to $24,999 | 8 (6.1%) | 10 (10.0%) |
| $25,000 to $34,999 | 34 (26.0%) | 23 (23.0%) |
| $35,000 to $49,999 | 30 (22.9%) | 3 (3.0%) |
| $50,000 to $74,999 | 28 (21.4%) | 18 (18.0%) |
| $75,000 to $99,999 | 0 (0.0%) | 12 (12.0%) |
| $100,000 to $149,999 | 12 (9.2%) | 8 (8.0%) |
| $150,000 or more | 0 (0.0%) | 0 (0.0%) |
| Total | 131 (100.0%) | 100 (100.0%) |
Monthly Housing Cost Tiers in Fouke
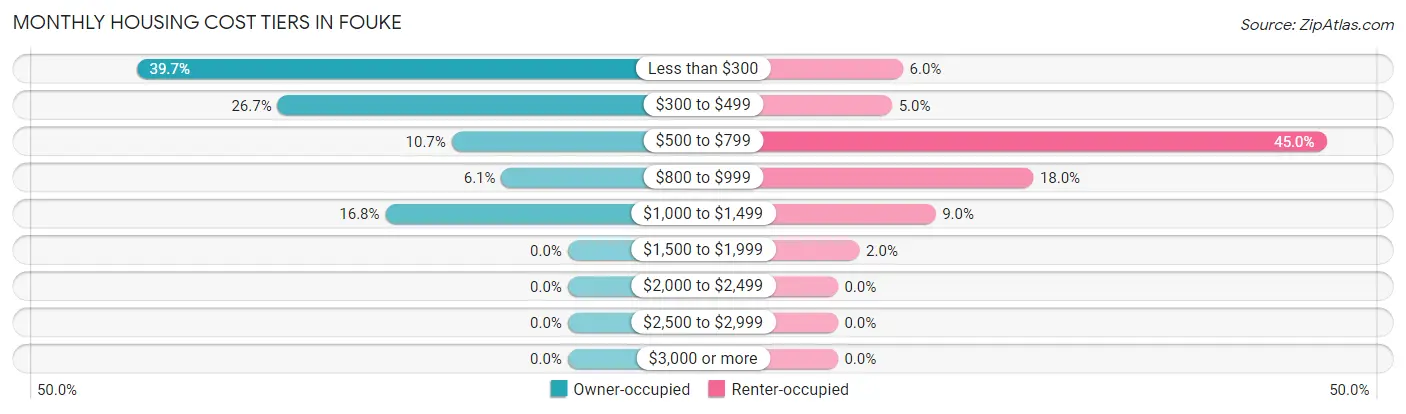
| Monthly Cost | Owner-occupied | Renter-occupied |
| Less than $300 | 52 (39.7%) | 6 (6.0%) |
| $300 to $499 | 35 (26.7%) | 5 (5.0%) |
| $500 to $799 | 14 (10.7%) | 45 (45.0%) |
| $800 to $999 | 8 (6.1%) | 18 (18.0%) |
| $1,000 to $1,499 | 22 (16.8%) | 9 (9.0%) |
| $1,500 to $1,999 | 0 (0.0%) | 2 (2.0%) |
| $2,000 to $2,499 | 0 (0.0%) | 0 (0.0%) |
| $2,500 to $2,999 | 0 (0.0%) | 0 (0.0%) |
| $3,000 or more | 0 (0.0%) | 0 (0.0%) |
| Total | 131 (100.0%) | 100 (100.0%) |
Physical Housing Characteristics in Fouke
Housing Structures in Fouke
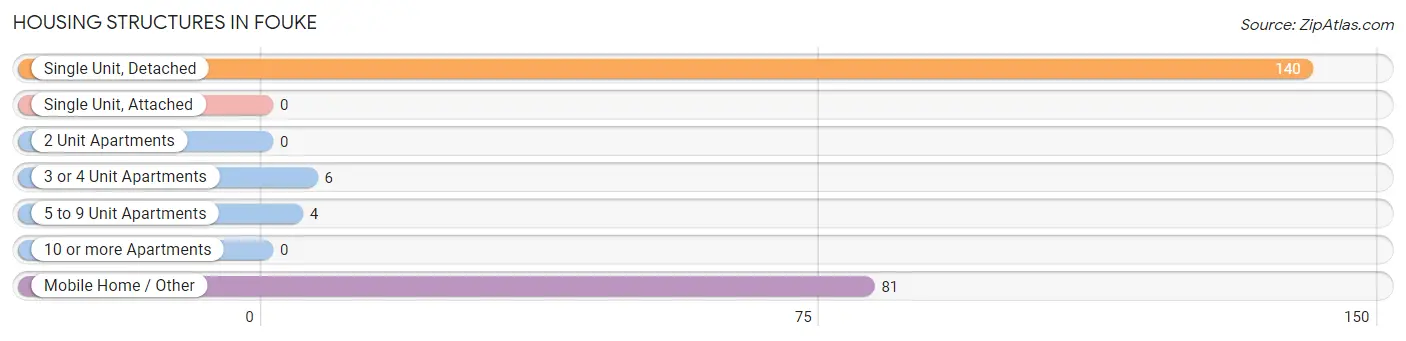
| Structure Type | # Housing Units | % Housing Units |
| Single Unit, Detached | 140 | 60.6% |
| Single Unit, Attached | 0 | 0.0% |
| 2 Unit Apartments | 0 | 0.0% |
| 3 or 4 Unit Apartments | 6 | 2.6% |
| 5 to 9 Unit Apartments | 4 | 1.7% |
| 10 or more Apartments | 0 | 0.0% |
| Mobile Home / Other | 81 | 35.1% |
| Total | 231 | 100.0% |
Housing Structures by Occupancy in Fouke
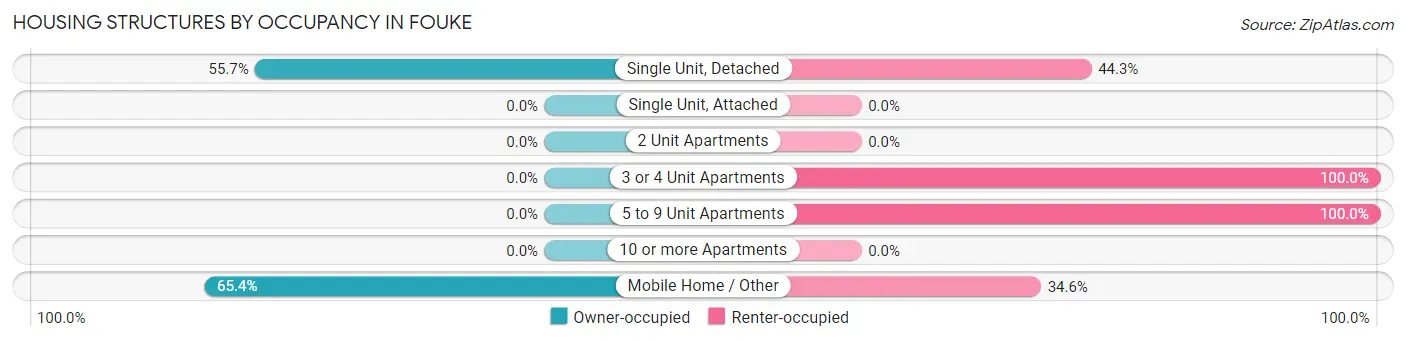
| Structure Type | Owner-occupied | Renter-occupied |
| Single Unit, Detached | 78 (55.7%) | 62 (44.3%) |
| Single Unit, Attached | 0 (0.0%) | 0 (0.0%) |
| 2 Unit Apartments | 0 (0.0%) | 0 (0.0%) |
| 3 or 4 Unit Apartments | 0 (0.0%) | 6 (100.0%) |
| 5 to 9 Unit Apartments | 0 (0.0%) | 4 (100.0%) |
| 10 or more Apartments | 0 (0.0%) | 0 (0.0%) |
| Mobile Home / Other | 53 (65.4%) | 28 (34.6%) |
| Total | 131 (56.7%) | 100 (43.3%) |
Housing Structures by Number of Rooms in Fouke
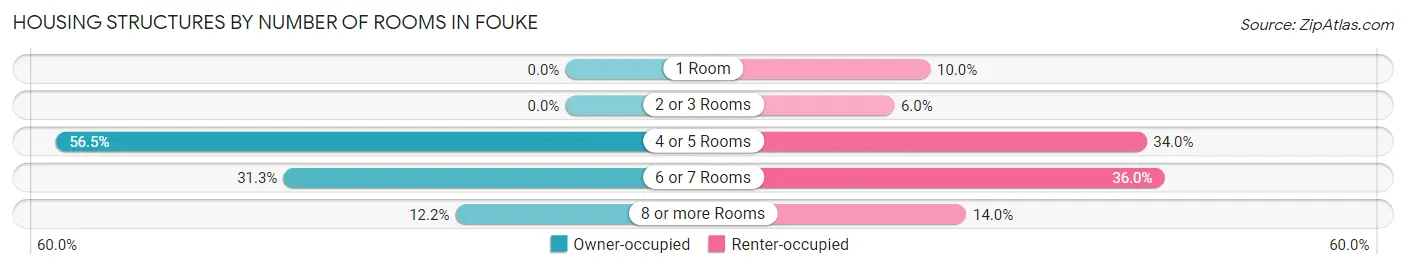
| Number of Rooms | Owner-occupied | Renter-occupied |
| 1 Room | 0 (0.0%) | 10 (10.0%) |
| 2 or 3 Rooms | 0 (0.0%) | 6 (6.0%) |
| 4 or 5 Rooms | 74 (56.5%) | 34 (34.0%) |
| 6 or 7 Rooms | 41 (31.3%) | 36 (36.0%) |
| 8 or more Rooms | 16 (12.2%) | 14 (14.0%) |
| Total | 131 (100.0%) | 100 (100.0%) |
Housing Structure by Heating Type in Fouke
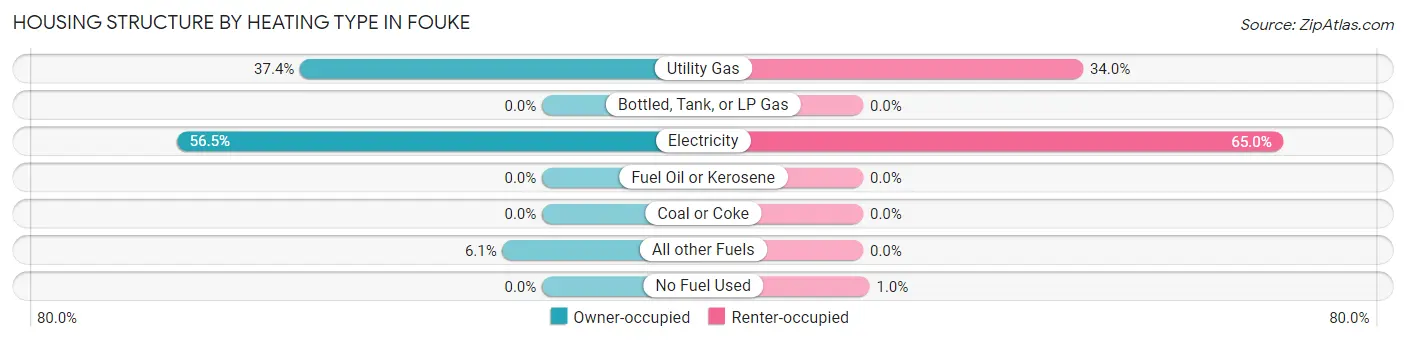
| Heating Type | Owner-occupied | Renter-occupied |
| Utility Gas | 49 (37.4%) | 34 (34.0%) |
| Bottled, Tank, or LP Gas | 0 (0.0%) | 0 (0.0%) |
| Electricity | 74 (56.5%) | 65 (65.0%) |
| Fuel Oil or Kerosene | 0 (0.0%) | 0 (0.0%) |
| Coal or Coke | 0 (0.0%) | 0 (0.0%) |
| All other Fuels | 8 (6.1%) | 0 (0.0%) |
| No Fuel Used | 0 (0.0%) | 1 (1.0%) |
| Total | 131 (100.0%) | 100 (100.0%) |
Household Vehicle Usage in Fouke
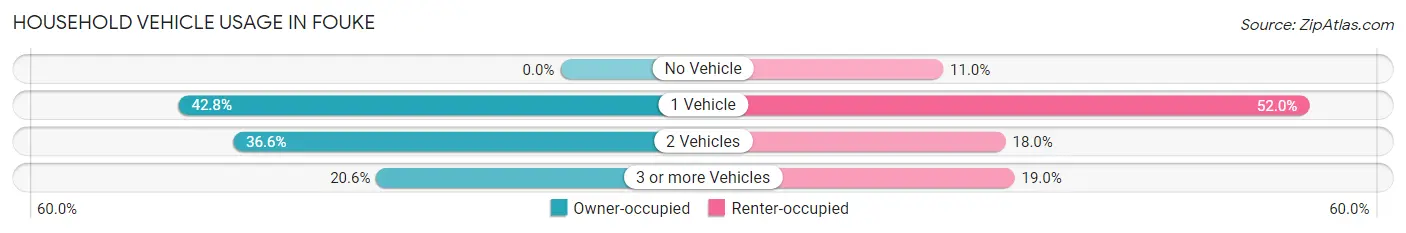
| Vehicles per Household | Owner-occupied | Renter-occupied |
| No Vehicle | 0 (0.0%) | 11 (11.0%) |
| 1 Vehicle | 56 (42.7%) | 52 (52.0%) |
| 2 Vehicles | 48 (36.6%) | 18 (18.0%) |
| 3 or more Vehicles | 27 (20.6%) | 19 (19.0%) |
| Total | 131 (100.0%) | 100 (100.0%) |
Real Estate & Mortgages in Fouke
Real Estate and Mortgage Overview in Fouke
| Characteristic | Without Mortgage | With Mortgage |
| Housing Units | 95 | 36 |
| Median Property Value | - | - |
| Median Household Income | $31,953 | $0 |
| Monthly Housing Costs | $255 | $0 |
| Real Estate Taxes | $263 | $0 |
Property Value by Mortgage Status in Fouke
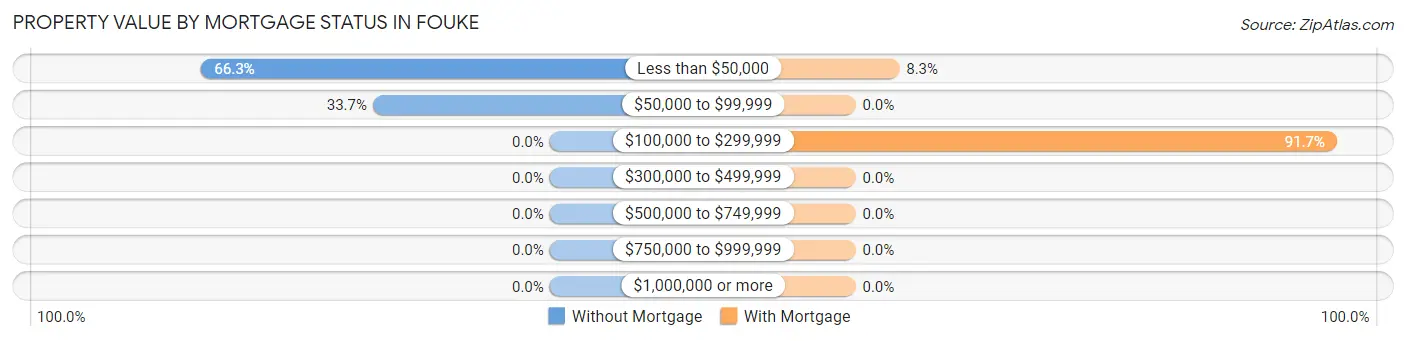
| Property Value | Without Mortgage | With Mortgage |
| Less than $50,000 | 63 (66.3%) | 3 (8.3%) |
| $50,000 to $99,999 | 32 (33.7%) | 0 (0.0%) |
| $100,000 to $299,999 | 0 (0.0%) | 33 (91.7%) |
| $300,000 to $499,999 | 0 (0.0%) | 0 (0.0%) |
| $500,000 to $749,999 | 0 (0.0%) | 0 (0.0%) |
| $750,000 to $999,999 | 0 (0.0%) | 0 (0.0%) |
| $1,000,000 or more | 0 (0.0%) | 0 (0.0%) |
| Total | 95 (100.0%) | 36 (100.0%) |
Household Income by Mortgage Status in Fouke
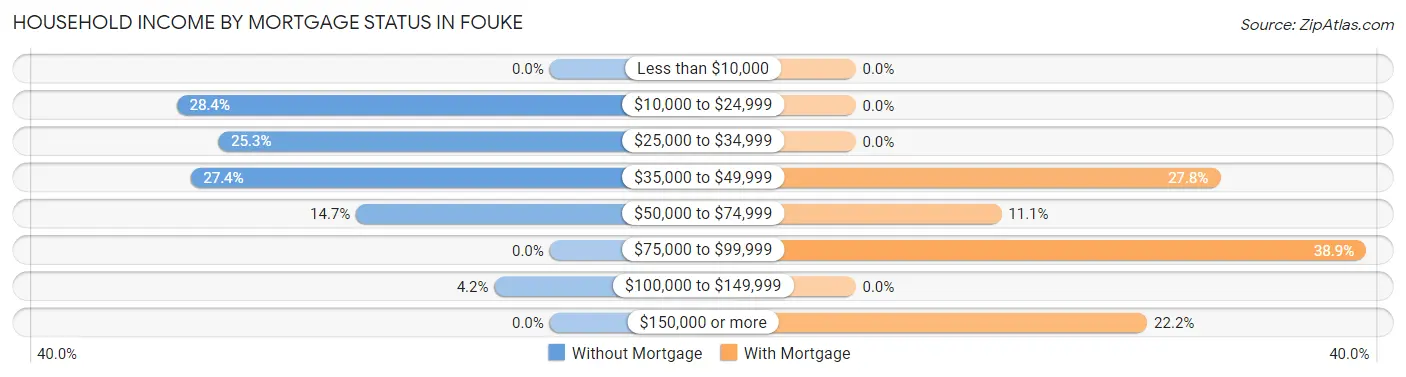
| Household Income | Without Mortgage | With Mortgage |
| Less than $10,000 | 0 (0.0%) | 0 (0.0%) |
| $10,000 to $24,999 | 27 (28.4%) | 0 (0.0%) |
| $25,000 to $34,999 | 24 (25.3%) | 0 (0.0%) |
| $35,000 to $49,999 | 26 (27.4%) | 10 (27.8%) |
| $50,000 to $74,999 | 14 (14.7%) | 4 (11.1%) |
| $75,000 to $99,999 | 0 (0.0%) | 14 (38.9%) |
| $100,000 to $149,999 | 4 (4.2%) | 0 (0.0%) |
| $150,000 or more | 0 (0.0%) | 8 (22.2%) |
| Total | 95 (100.0%) | 36 (100.0%) |
Property Value to Household Income Ratio in Fouke
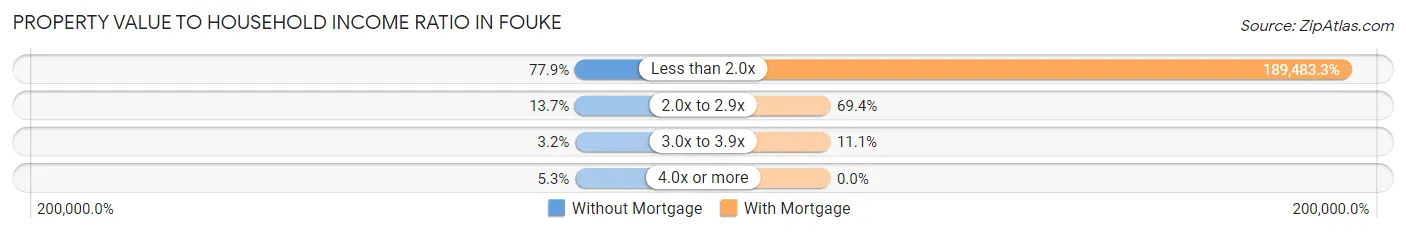
| Value-to-Income Ratio | Without Mortgage | With Mortgage |
| Less than 2.0x | 74 (77.9%) | 68,214 (189,483.3%) |
| 2.0x to 2.9x | 13 (13.7%) | 25 (69.4%) |
| 3.0x to 3.9x | 3 (3.2%) | 4 (11.1%) |
| 4.0x or more | 5 (5.3%) | 0 (0.0%) |
| Total | 95 (100.0%) | 36 (100.0%) |
Real Estate Taxes by Mortgage Status in Fouke
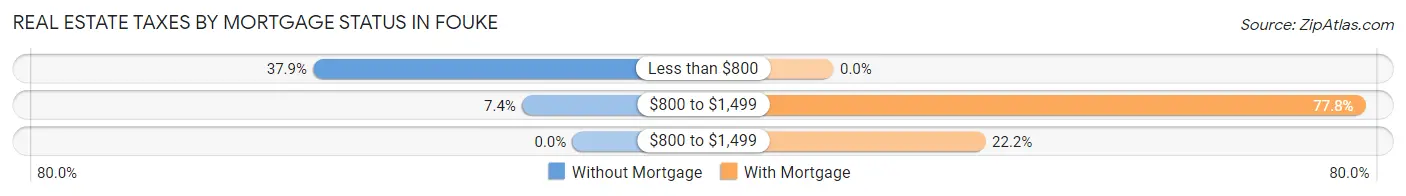
| Property Taxes | Without Mortgage | With Mortgage |
| Less than $800 | 36 (37.9%) | 0 (0.0%) |
| $800 to $1,499 | 7 (7.4%) | 28 (77.8%) |
| $800 to $1,499 | 0 (0.0%) | 8 (22.2%) |
| Total | 95 (100.0%) | 36 (100.0%) |
Health & Disability in Fouke
Health Insurance Coverage by Age in Fouke
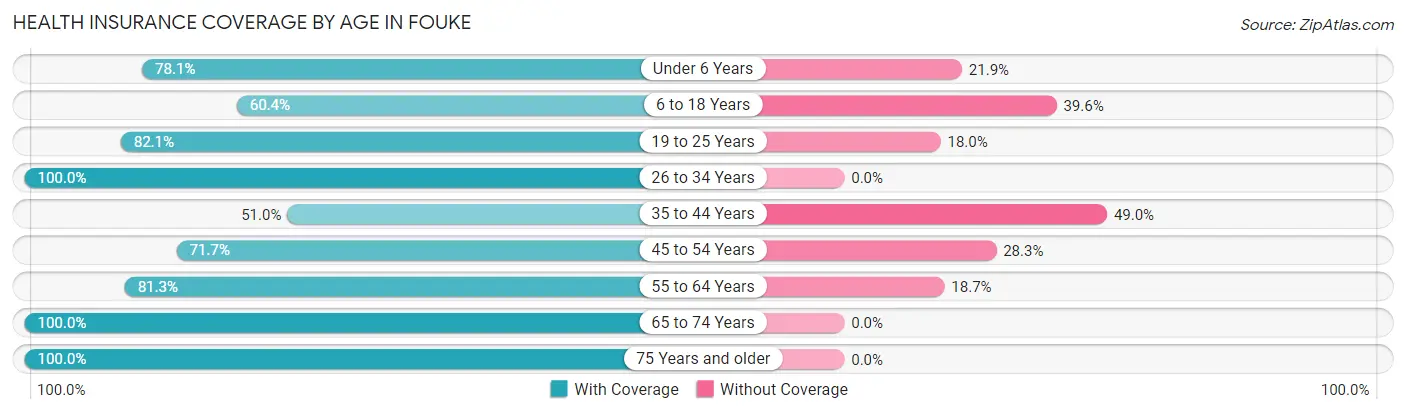
| Age Bracket | With Coverage | Without Coverage |
| Under 6 Years | 89 (78.1%) | 25 (21.9%) |
| 6 to 18 Years | 113 (60.4%) | 74 (39.6%) |
| 19 to 25 Years | 64 (82.1%) | 14 (17.9%) |
| 26 to 34 Years | 60 (100.0%) | 0 (0.0%) |
| 35 to 44 Years | 50 (51.0%) | 48 (49.0%) |
| 45 to 54 Years | 43 (71.7%) | 17 (28.3%) |
| 55 to 64 Years | 61 (81.3%) | 14 (18.7%) |
| 65 to 74 Years | 27 (100.0%) | 0 (0.0%) |
| 75 Years and older | 29 (100.0%) | 0 (0.0%) |
| Total | 536 (73.6%) | 192 (26.4%) |
Health Insurance Coverage by Citizenship Status in Fouke
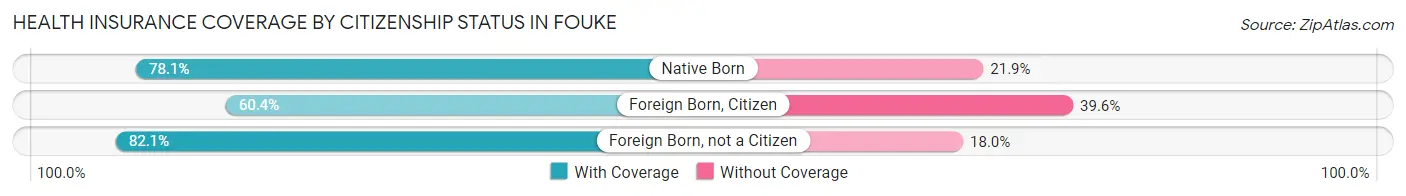
| Citizenship Status | With Coverage | Without Coverage |
| Native Born | 89 (78.1%) | 25 (21.9%) |
| Foreign Born, Citizen | 113 (60.4%) | 74 (39.6%) |
| Foreign Born, not a Citizen | 64 (82.1%) | 14 (17.9%) |
Health Insurance Coverage by Household Income in Fouke
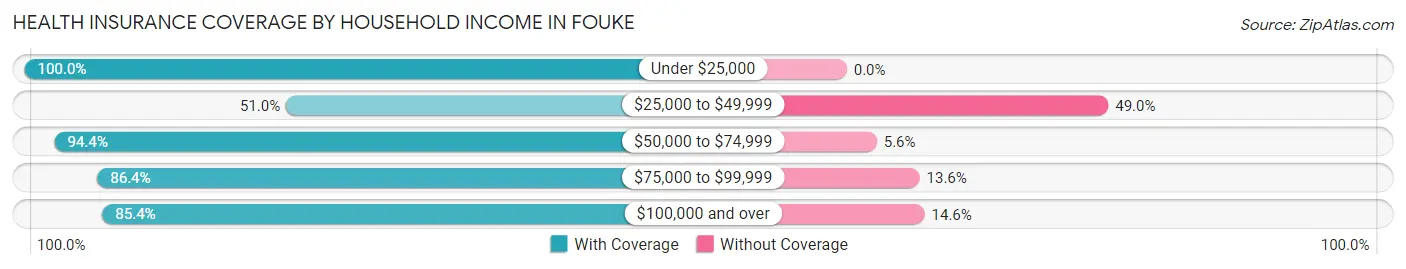
| Household Income | With Coverage | Without Coverage |
| Under $25,000 | 129 (100.0%) | 0 (0.0%) |
| $25,000 to $49,999 | 177 (51.0%) | 170 (49.0%) |
| $50,000 to $74,999 | 151 (94.4%) | 9 (5.6%) |
| $75,000 to $99,999 | 38 (86.4%) | 6 (13.6%) |
| $100,000 and over | 41 (85.4%) | 7 (14.6%) |
Public vs Private Health Insurance Coverage by Age in Fouke
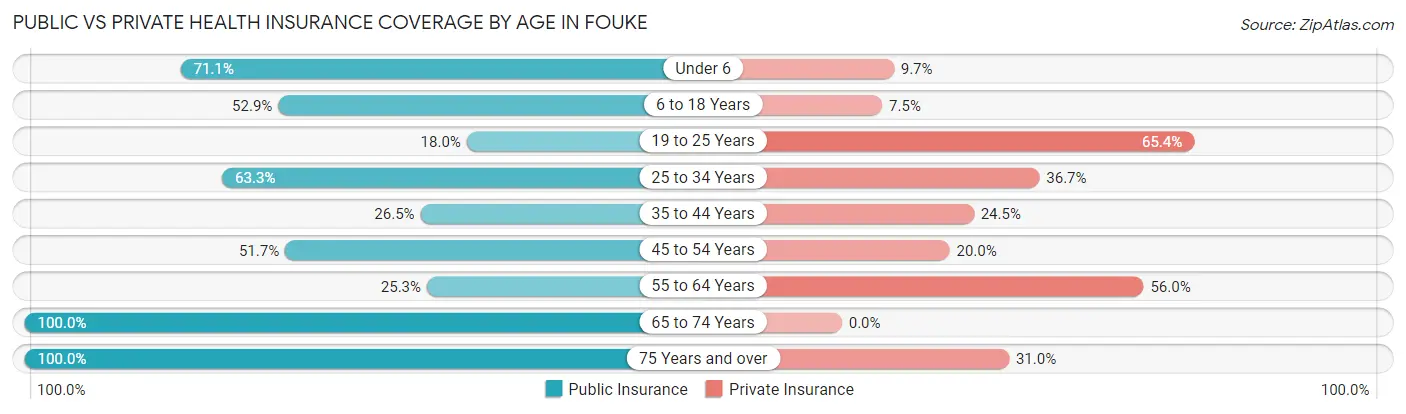
| Age Bracket | Public Insurance | Private Insurance |
| Under 6 | 81 (71.1%) | 11 (9.7%) |
| 6 to 18 Years | 99 (52.9%) | 14 (7.5%) |
| 19 to 25 Years | 14 (17.9%) | 51 (65.4%) |
| 25 to 34 Years | 38 (63.3%) | 22 (36.7%) |
| 35 to 44 Years | 26 (26.5%) | 24 (24.5%) |
| 45 to 54 Years | 31 (51.7%) | 12 (20.0%) |
| 55 to 64 Years | 19 (25.3%) | 42 (56.0%) |
| 65 to 74 Years | 27 (100.0%) | 0 (0.0%) |
| 75 Years and over | 29 (100.0%) | 9 (31.0%) |
| Total | 364 (50.0%) | 185 (25.4%) |
Disability Status by Sex by Age in Fouke
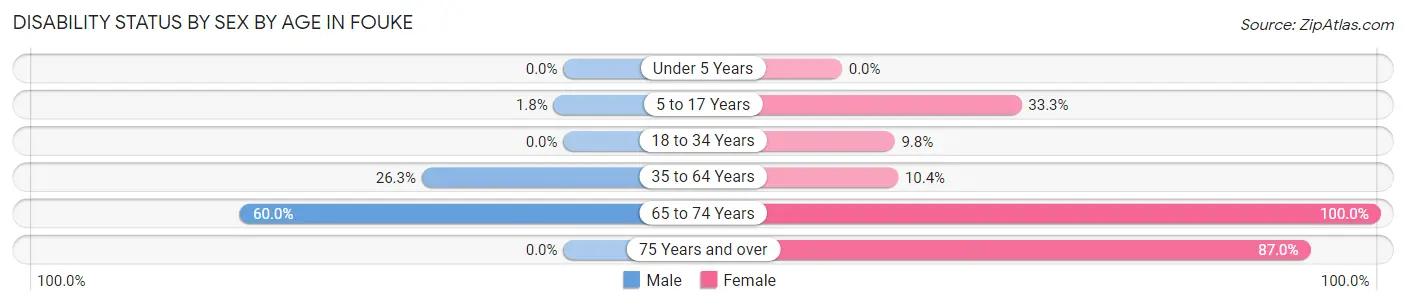
| Age Bracket | Male | Female |
| Under 5 Years | 0 (0.0%) | 0 (0.0%) |
| 5 to 17 Years | 1 (1.8%) | 46 (33.3%) |
| 18 to 34 Years | 0 (0.0%) | 9 (9.8%) |
| 35 to 64 Years | 36 (26.3%) | 10 (10.4%) |
| 65 to 74 Years | 9 (60.0%) | 12 (100.0%) |
| 75 Years and over | 0 (0.0%) | 20 (87.0%) |
Disability Class by Sex by Age in Fouke
Disability Class: Hearing Difficulty
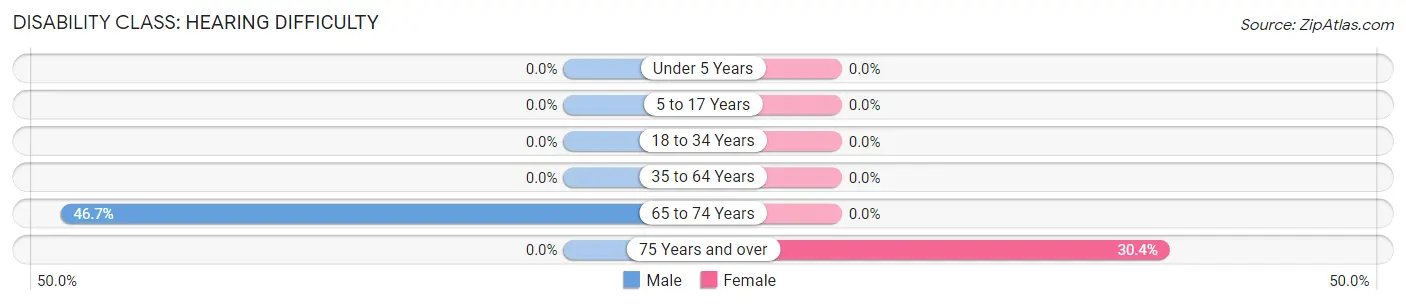
| Age Bracket | Male | Female |
| Under 5 Years | 0 (0.0%) | 0 (0.0%) |
| 5 to 17 Years | 0 (0.0%) | 0 (0.0%) |
| 18 to 34 Years | 0 (0.0%) | 0 (0.0%) |
| 35 to 64 Years | 0 (0.0%) | 0 (0.0%) |
| 65 to 74 Years | 7 (46.7%) | 0 (0.0%) |
| 75 Years and over | 0 (0.0%) | 7 (30.4%) |
Disability Class: Vision Difficulty
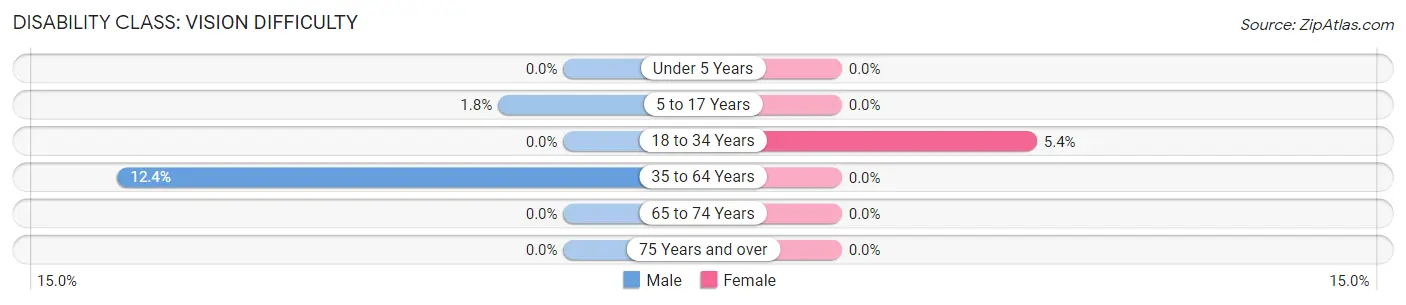
| Age Bracket | Male | Female |
| Under 5 Years | 0 (0.0%) | 0 (0.0%) |
| 5 to 17 Years | 1 (1.8%) | 0 (0.0%) |
| 18 to 34 Years | 0 (0.0%) | 5 (5.4%) |
| 35 to 64 Years | 17 (12.4%) | 0 (0.0%) |
| 65 to 74 Years | 0 (0.0%) | 0 (0.0%) |
| 75 Years and over | 0 (0.0%) | 0 (0.0%) |
Disability Class: Cognitive Difficulty
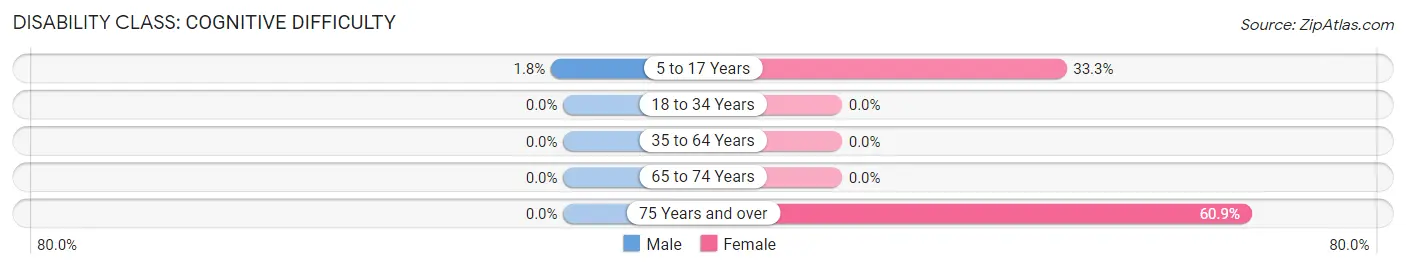
| Age Bracket | Male | Female |
| 5 to 17 Years | 1 (1.8%) | 46 (33.3%) |
| 18 to 34 Years | 0 (0.0%) | 0 (0.0%) |
| 35 to 64 Years | 0 (0.0%) | 0 (0.0%) |
| 65 to 74 Years | 0 (0.0%) | 0 (0.0%) |
| 75 Years and over | 0 (0.0%) | 14 (60.9%) |
Disability Class: Ambulatory Difficulty
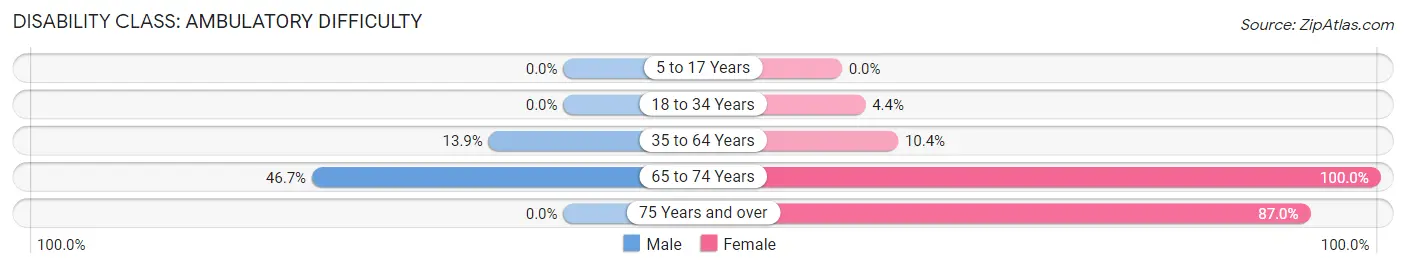
| Age Bracket | Male | Female |
| 5 to 17 Years | 0 (0.0%) | 0 (0.0%) |
| 18 to 34 Years | 0 (0.0%) | 4 (4.3%) |
| 35 to 64 Years | 19 (13.9%) | 10 (10.4%) |
| 65 to 74 Years | 7 (46.7%) | 12 (100.0%) |
| 75 Years and over | 0 (0.0%) | 20 (87.0%) |
Disability Class: Self-Care Difficulty
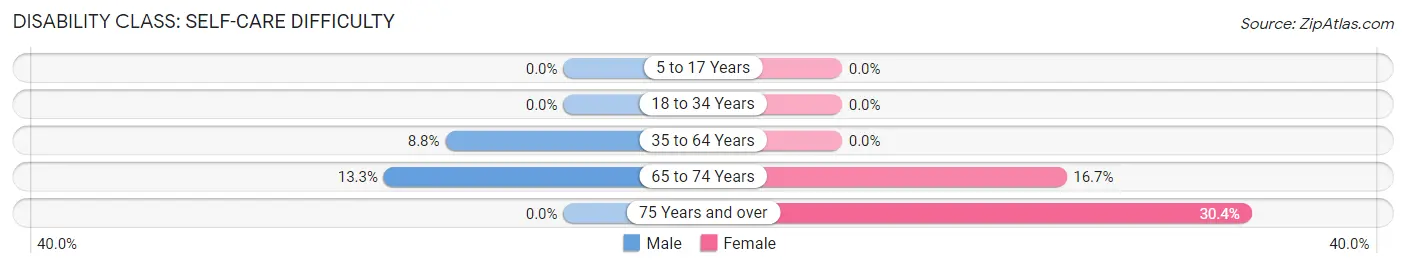
| Age Bracket | Male | Female |
| 5 to 17 Years | 0 (0.0%) | 0 (0.0%) |
| 18 to 34 Years | 0 (0.0%) | 0 (0.0%) |
| 35 to 64 Years | 12 (8.8%) | 0 (0.0%) |
| 65 to 74 Years | 2 (13.3%) | 2 (16.7%) |
| 75 Years and over | 0 (0.0%) | 7 (30.4%) |
Technology Access in Fouke
Computing Device Access in Fouke
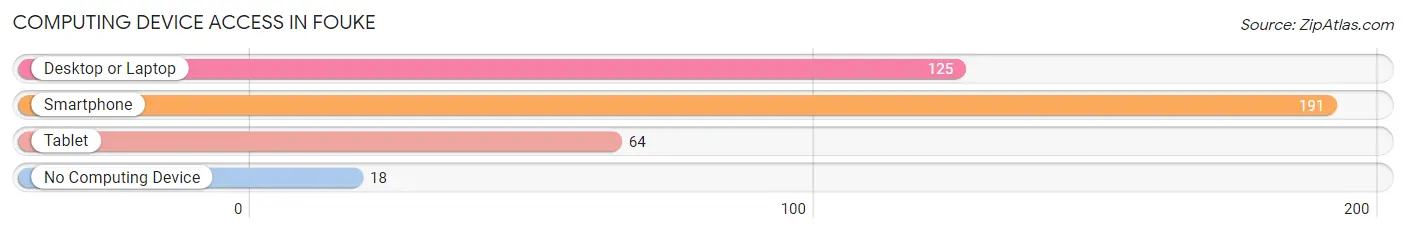
| Device Type | # Households | % Households |
| Desktop or Laptop | 125 | 54.1% |
| Smartphone | 191 | 82.7% |
| Tablet | 64 | 27.7% |
| No Computing Device | 18 | 7.8% |
| Total | 231 | 100.0% |
Internet Access in Fouke
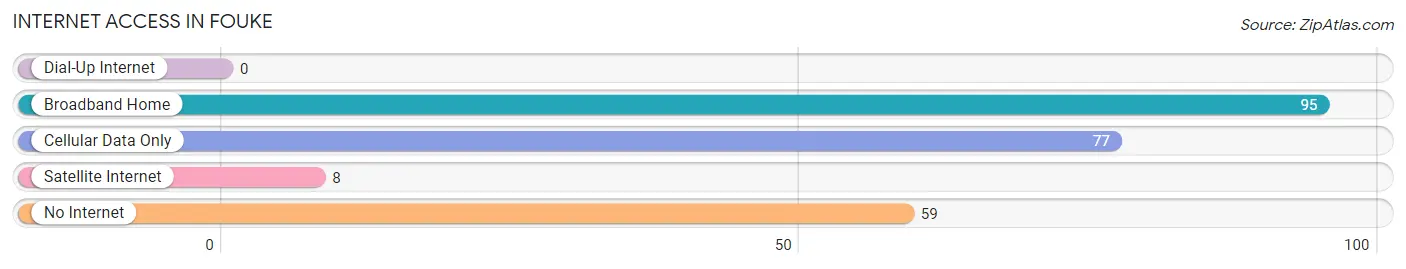
| Internet Type | # Households | % Households |
| Dial-Up Internet | 0 | 0.0% |
| Broadband Home | 95 | 41.1% |
| Cellular Data Only | 77 | 33.3% |
| Satellite Internet | 8 | 3.5% |
| No Internet | 59 | 25.5% |
| Total | 231 | 100.0% |
Fouke Summary
Fouke, Arkansas is a small town located in Miller County, Arkansas. It is situated on the banks of the Sulphur River, approximately 10 miles south of Texarkana. The town was founded in 1883 and has a population of 1,200 people as of the 2010 census.
Geography
Fouke is located in the southwestern corner of Miller County, Arkansas. It is situated on the banks of the Sulphur River, approximately 10 miles south of Texarkana. The town is located in the Piney Woods region of Arkansas, which is characterized by rolling hills and dense forests. The climate in Fouke is humid subtropical, with hot summers and mild winters.
Economy
Fouke’s economy is largely based on agriculture and timber production. The town is home to several small businesses, including a grocery store, a hardware store, and a few restaurants. The town also has a small manufacturing sector, which produces furniture and other wood products.
Demographics
As of the 2010 census, Fouke had a population of 1,200 people. The racial makeup of the town was 95.3% White, 0.8% African American, 0.3% Native American, 0.2% Asian, and 3.4% from other races. The median household income was $30,000, and the median family income was $35,000.
History
Fouke was founded in 1883 by a group of settlers from Texas. The town was named after a local creek, which was named after a French explorer who had visited the area in the 1700s. The town quickly grew, and by the early 1900s, it had become a thriving agricultural and timber center.
In the 1950s, the town was the site of a famous Bigfoot sighting, which was later immortalized in the 1972 film The Legend of Boggy Creek. The film was a box office success and helped to put Fouke on the map.
Today, Fouke is a small, rural town with a population of 1,200 people. It is a quiet, peaceful place, and it is a great place to raise a family. The town is home to several small businesses, and it is a popular destination for outdoor enthusiasts.
Common Questions
What is Per Capita Income in Fouke?
Per Capita income in Fouke is $14,851.
What is the Median Family Income in Fouke?
Median Family Income in Fouke is $50,750.
What is the Median Household income in Fouke?
Median Household Income in Fouke is $33,393.
What is Income or Wage Gap in Fouke?
Income or Wage Gap in Fouke is 52.7%.
Women in Fouke earn 47.3 cents for every dollar earned by a man.
What is Inequality or Gini Index in Fouke?
Inequality or Gini Index in Fouke is 0.38.
What is the Total Population of Fouke?
Total Population of Fouke is 728.
What is the Total Male Population of Fouke?
Total Male Population of Fouke is 325.
What is the Total Female Population of Fouke?
Total Female Population of Fouke is 403.
What is the Ratio of Males per 100 Females in Fouke?
There are 80.65 Males per 100 Females in Fouke.
What is the Ratio of Females per 100 Males in Fouke?
There are 124.00 Females per 100 Males in Fouke.
What is the Median Population Age in Fouke?
Median Population Age in Fouke is 23.9 Years.
What is the Average Family Size in Fouke
Average Family Size in Fouke is 5.2 People.
What is the Average Household Size in Fouke
Average Household Size in Fouke is 3.1 People.
How Large is the Labor Force in Fouke?
There are 270 People in the Labor Forcein in Fouke.
What is the Percentage of People in the Labor Force in Fouke?
59.7% of People are in the Labor Force in Fouke.
What is the Unemployment Rate in Fouke?
Unemployment Rate in Fouke is 7.4%.