Enola, AR Map & Demographics
Enola Map
Enola Overview
$22,642
PER CAPITA INCOME
$56,806
AVG FAMILY INCOME
$50,461
AVG HOUSEHOLD INCOME
36.2%
WAGE / INCOME GAP [ % ]
63.8¢/ $1
WAGE / INCOME GAP [ $ ]
0.39
INEQUALITY / GINI INDEX
614
TOTAL POPULATION
299
MALE POPULATION
315
FEMALE POPULATION
94.92
MALES / 100 FEMALES
105.35
FEMALES / 100 MALES
29.8
MEDIAN AGE
3.7
AVG FAMILY SIZE
2.8
AVG HOUSEHOLD SIZE
289
LABOR FORCE [ PEOPLE ]
61.5%
PERCENT IN LABOR FORCE
0.3%
UNEMPLOYMENT RATE
Enola Zip Codes
Enola Area Codes
Income in Enola
Income Overview in Enola
Per Capita Income in Enola is $22,642, while median incomes of families and households are $56,806 and $50,461 respectively.
| Characteristic | Number | Measure |
| Per Capita Income | 614 | $22,642 |
| Median Family Income | 139 | $56,806 |
| Mean Family Income | 139 | $69,999 |
| Median Household Income | 219 | $50,461 |
| Mean Household Income | 219 | $63,364 |
| Income Deficit | 139 | $0 |
| Wage / Income Gap (%) | 614 | 36.18% |
| Wage / Income Gap ($) | 614 | 63.82¢ per $1 |
| Gini / Inequality Index | 614 | 0.39 |
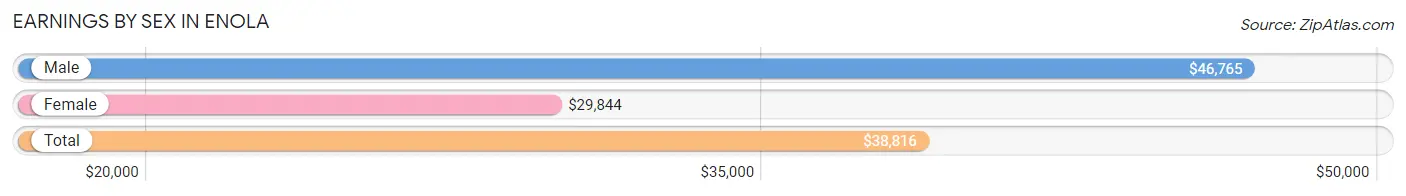
Earnings by Sex in Enola
Average Earnings in Enola are $38,816, $46,765 for men and $29,844 for women, a difference of 36.2%.
| Sex | Number | Average Earnings |
| Male | 108 (37.2%) | $46,765 |
| Female | 182 (62.8%) | $29,844 |
| Total | 290 (100.0%) | $38,816 |
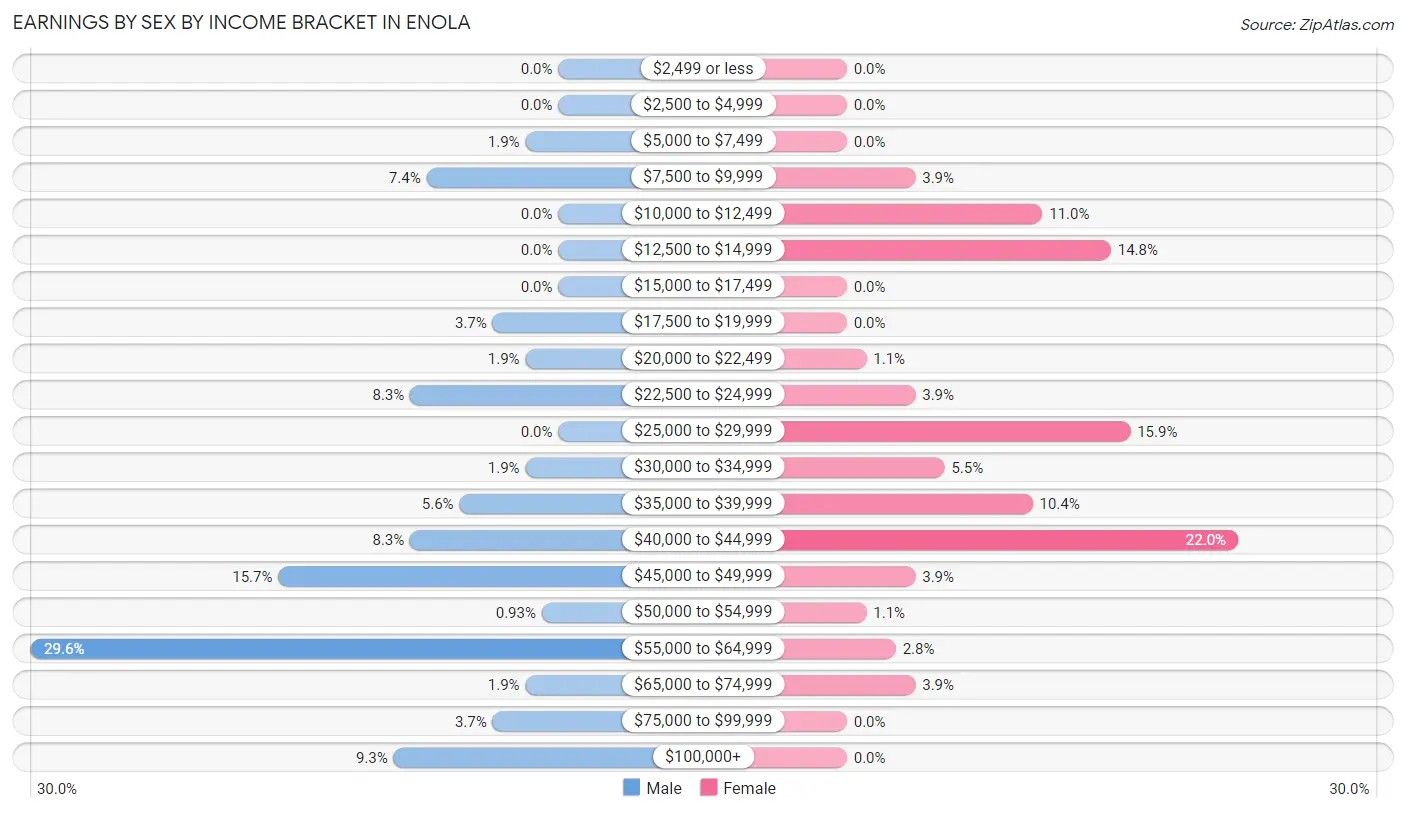
Earnings by Sex by Income Bracket in Enola
The most common earnings brackets in Enola are $55,000 to $64,999 for men (32 | 29.6%) and $40,000 to $44,999 for women (40 | 22.0%).
| Income | Male | Female |
| $2,499 or less | 0 (0.0%) | 0 (0.0%) |
| $2,500 to $4,999 | 0 (0.0%) | 0 (0.0%) |
| $5,000 to $7,499 | 2 (1.8%) | 0 (0.0%) |
| $7,500 to $9,999 | 8 (7.4%) | 7 (3.8%) |
| $10,000 to $12,499 | 0 (0.0%) | 20 (11.0%) |
| $12,500 to $14,999 | 0 (0.0%) | 27 (14.8%) |
| $15,000 to $17,499 | 0 (0.0%) | 0 (0.0%) |
| $17,500 to $19,999 | 4 (3.7%) | 0 (0.0%) |
| $20,000 to $22,499 | 2 (1.8%) | 2 (1.1%) |
| $22,500 to $24,999 | 9 (8.3%) | 7 (3.8%) |
| $25,000 to $29,999 | 0 (0.0%) | 29 (15.9%) |
| $30,000 to $34,999 | 2 (1.8%) | 10 (5.5%) |
| $35,000 to $39,999 | 6 (5.6%) | 19 (10.4%) |
| $40,000 to $44,999 | 9 (8.3%) | 40 (22.0%) |
| $45,000 to $49,999 | 17 (15.7%) | 7 (3.8%) |
| $50,000 to $54,999 | 1 (0.9%) | 2 (1.1%) |
| $55,000 to $64,999 | 32 (29.6%) | 5 (2.8%) |
| $65,000 to $74,999 | 2 (1.8%) | 7 (3.8%) |
| $75,000 to $99,999 | 4 (3.7%) | 0 (0.0%) |
| $100,000+ | 10 (9.3%) | 0 (0.0%) |
| Total | 108 (100.0%) | 182 (100.0%) |
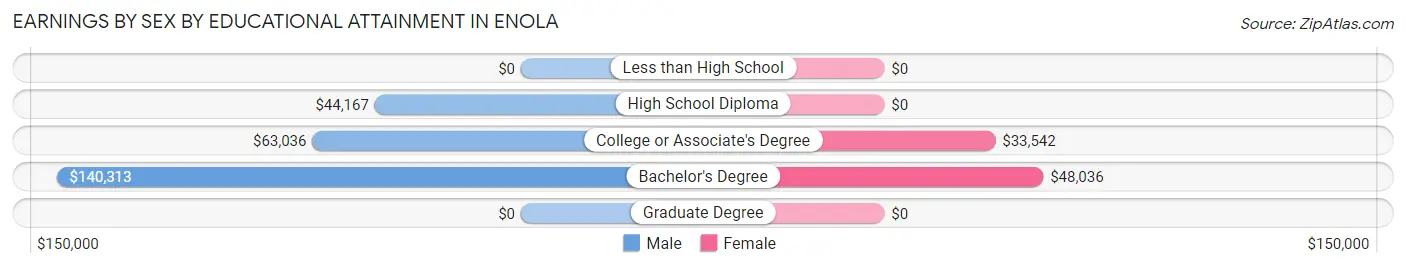
Earnings by Sex by Educational Attainment in Enola
Average earnings in Enola are $47,353 for men and $38,947 for women, a difference of 17.7%. Men with an educational attainment of bachelor's degree enjoy the highest average annual earnings of $140,313, while those with high school diploma education earn the least with $44,167. Women with an educational attainment of bachelor's degree earn the most with the average annual earnings of $48,036, while those with college or associate's degree education have the smallest earnings of $33,542.
| Educational Attainment | Male Income | Female Income |
| Less than High School | - | - |
| High School Diploma | $44,167 | $0 |
| College or Associate's Degree | $63,036 | $33,542 |
| Bachelor's Degree | $140,313 | $48,036 |
| Graduate Degree | - | - |
| Total | $47,353 | $38,947 |
Family Income in Enola
Family Income Brackets in Enola
According to the Enola family income data, there are 42 families falling into the $50,000 to $74,999 income range, which is the most common income bracket and makes up 30.2% of all families.
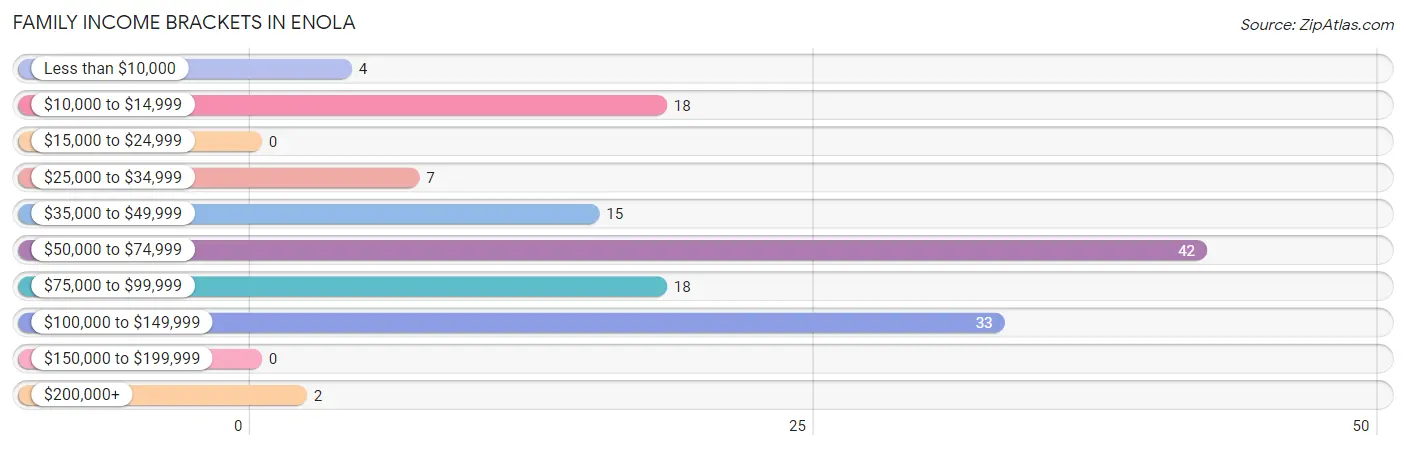
| Income Bracket | # Families | % Families |
| Less than $10,000 | 4 | 2.9% |
| $10,000 to $14,999 | 18 | 12.9% |
| $15,000 to $24,999 | 0 | 0.0% |
| $25,000 to $34,999 | 7 | 5.0% |
| $35,000 to $49,999 | 15 | 10.8% |
| $50,000 to $74,999 | 42 | 30.2% |
| $75,000 to $99,999 | 18 | 12.9% |
| $100,000 to $149,999 | 33 | 23.7% |
| $150,000 to $199,999 | 0 | 0.0% |
| $200,000+ | 2 | 1.4% |
Family Income by Famaliy Size in Enola
2-person families (37 | 26.6%) account for the highest median family income in Enola with $71,705 per family, while 2-person families (37 | 26.6%) have the highest median income of $35,852 per family member.
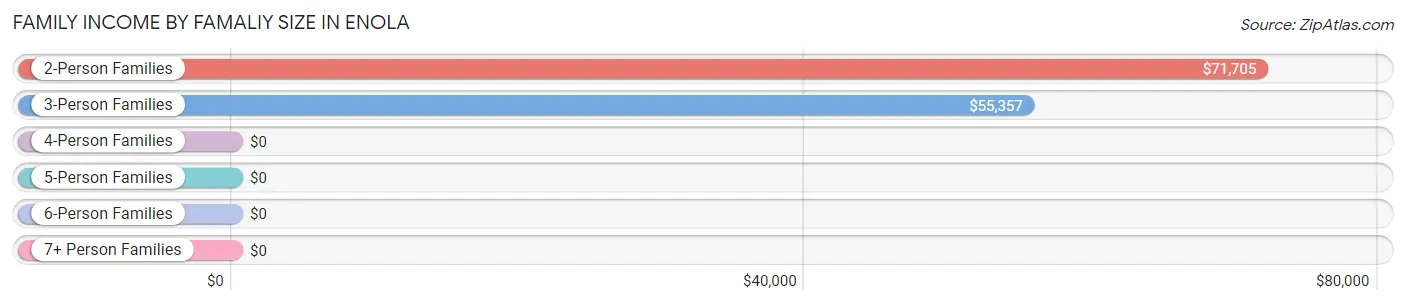
| Income Bracket | # Families | Median Income |
| 2-Person Families | 37 (26.6%) | $71,705 |
| 3-Person Families | 18 (13.0%) | $55,357 |
| 4-Person Families | 47 (33.8%) | $0 |
| 5-Person Families | 30 (21.6%) | $0 |
| 6-Person Families | 0 (0.0%) | $0 |
| 7+ Person Families | 7 (5.0%) | $0 |
| Total | 139 (100.0%) | $56,806 |
Family Income by Number of Earners in Enola
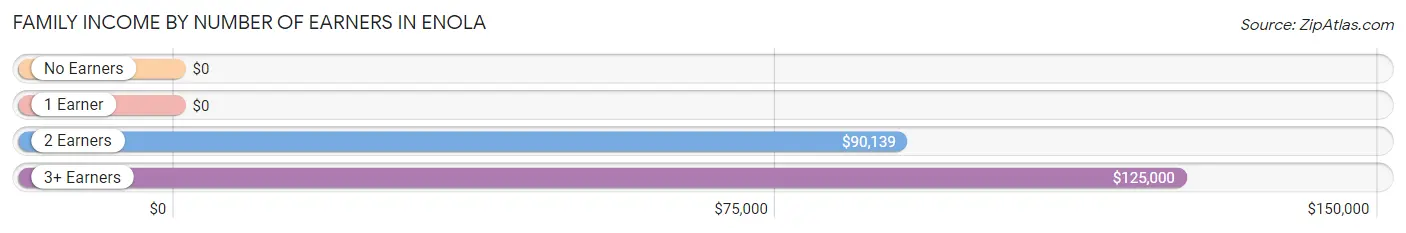
| Number of Earners | # Families | Median Income |
| No Earners | 10 (7.2%) | $0 |
| 1 Earner | 51 (36.7%) | $0 |
| 2 Earners | 62 (44.6%) | $90,139 |
| 3+ Earners | 16 (11.5%) | $125,000 |
| Total | 139 (100.0%) | $56,806 |
Household Income in Enola
Household Income Brackets in Enola
With 50 households falling in the category, the $50,000 to $74,999 income range is the most frequent in Enola, accounting for 22.8% of all households.
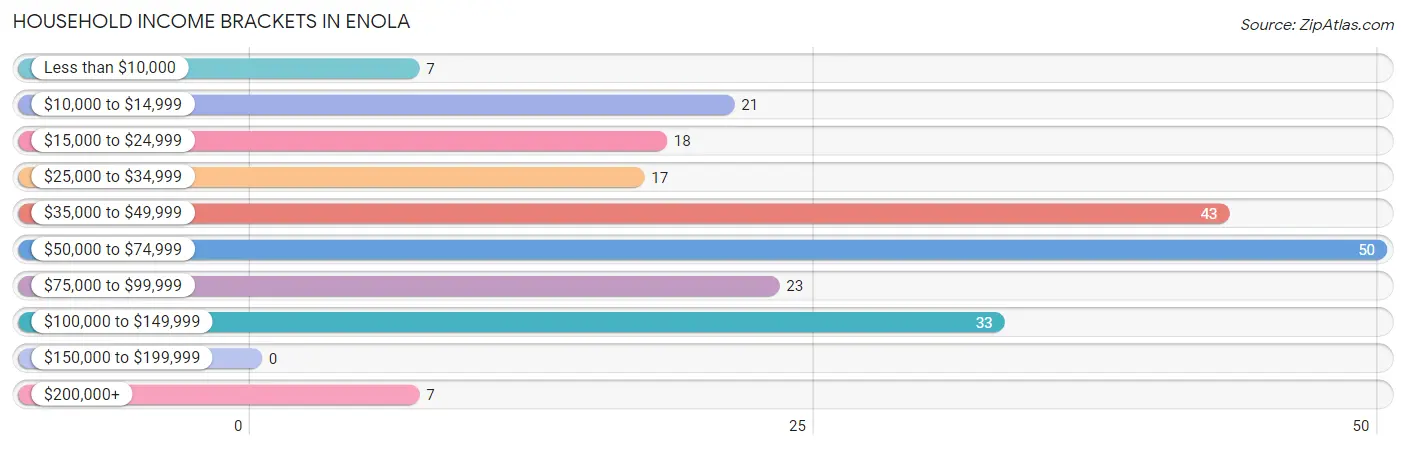
| Income Bracket | # Households | % Households |
| Less than $10,000 | 7 | 3.2% |
| $10,000 to $14,999 | 21 | 9.6% |
| $15,000 to $24,999 | 18 | 8.2% |
| $25,000 to $34,999 | 17 | 7.8% |
| $35,000 to $49,999 | 43 | 19.6% |
| $50,000 to $74,999 | 50 | 22.8% |
| $75,000 to $99,999 | 23 | 10.5% |
| $100,000 to $149,999 | 33 | 15.1% |
| $150,000 to $199,999 | 0 | 0.0% |
| $200,000+ | 7 | 3.2% |
Household Income by Householder Age in Enola
The median household income in Enola is $50,461, with the highest median household income of $101,250 found in the 45 to 64 years age bracket for the primary householder. A total of 32 households (14.6%) fall into this category. Meanwhile, the 15 to 24 years age bracket for the primary householder has the lowest median household income of $0, with 7 households (3.2%) in this group.
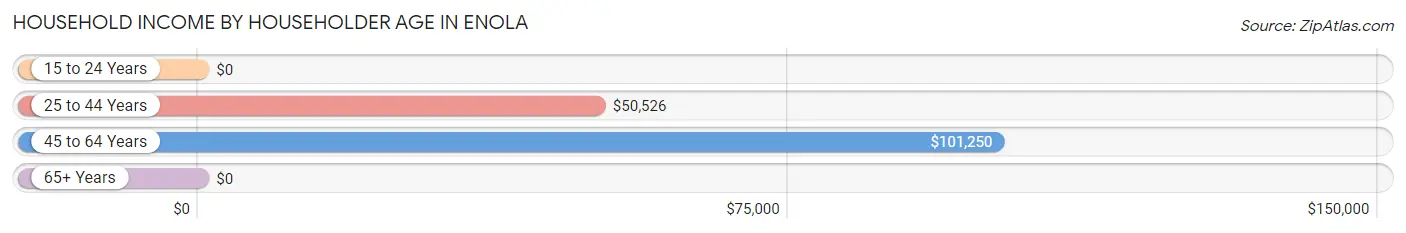
| Income Bracket | # Households | Median Income |
| 15 to 24 Years | 7 (3.2%) | $0 |
| 25 to 44 Years | 136 (62.1%) | $50,526 |
| 45 to 64 Years | 32 (14.6%) | $101,250 |
| 65+ Years | 44 (20.1%) | $0 |
| Total | 219 (100.0%) | $50,461 |
Poverty in Enola
Income Below Poverty by Sex and Age in Enola
With 11.7% poverty level for males and 20.3% for females among the residents of Enola, 12 to 14 year old males and 16 and 17 year old females are the most vulnerable to poverty, with 17 males (70.8%) and 21 females (36.8%) in their respective age groups living below the poverty level.
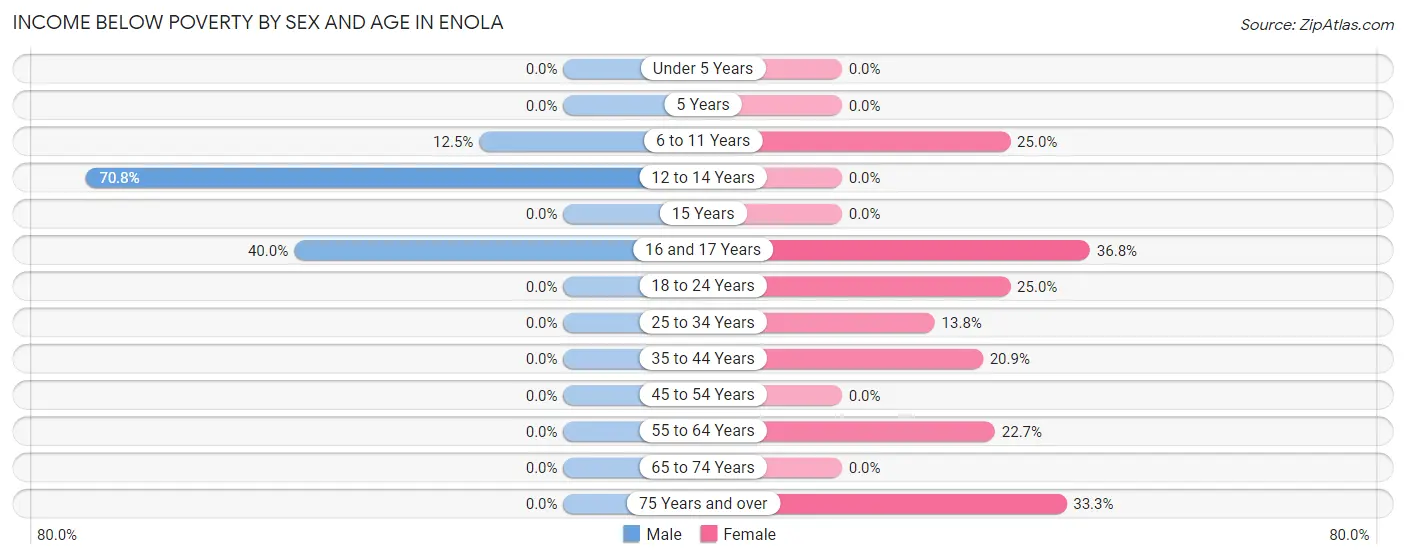
| Age Bracket | Male | Female |
| Under 5 Years | 0 (0.0%) | 0 (0.0%) |
| 5 Years | 0 (0.0%) | 0 (0.0%) |
| 6 to 11 Years | 4 (12.5%) | 4 (25.0%) |
| 12 to 14 Years | 17 (70.8%) | 0 (0.0%) |
| 15 Years | 0 (0.0%) | 0 (0.0%) |
| 16 and 17 Years | 14 (40.0%) | 21 (36.8%) |
| 18 to 24 Years | 0 (0.0%) | 7 (25.0%) |
| 25 to 34 Years | 0 (0.0%) | 4 (13.8%) |
| 35 to 44 Years | 0 (0.0%) | 18 (20.9%) |
| 45 to 54 Years | 0 (0.0%) | 0 (0.0%) |
| 55 to 64 Years | 0 (0.0%) | 5 (22.7%) |
| 65 to 74 Years | 0 (0.0%) | 0 (0.0%) |
| 75 Years and over | 0 (0.0%) | 5 (33.3%) |
| Total | 35 (11.7%) | 64 (20.3%) |
Income Above Poverty by Sex and Age in Enola
According to the poverty statistics in Enola, males aged under 5 years and females aged under 5 years are the age groups that are most secure financially, with 100.0% of males and 100.0% of females in these age groups living above the poverty line.
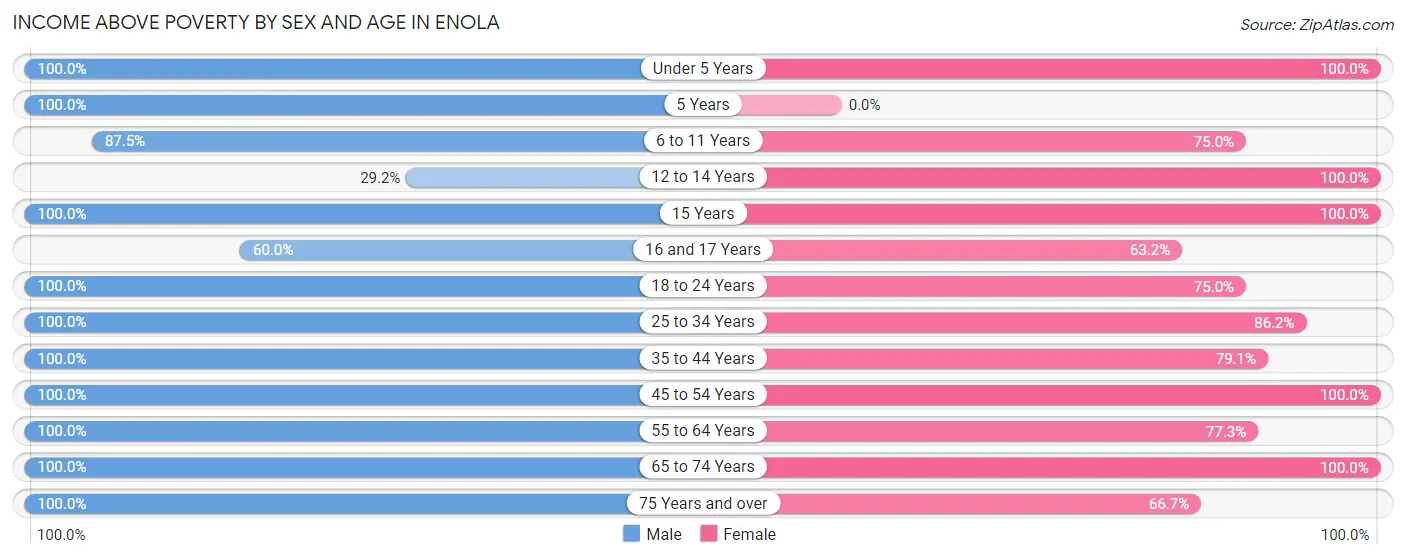
| Age Bracket | Male | Female |
| Under 5 Years | 23 (100.0%) | 5 (100.0%) |
| 5 Years | 6 (100.0%) | 0 (0.0%) |
| 6 to 11 Years | 28 (87.5%) | 12 (75.0%) |
| 12 to 14 Years | 7 (29.2%) | 12 (100.0%) |
| 15 Years | 4 (100.0%) | 22 (100.0%) |
| 16 and 17 Years | 21 (60.0%) | 36 (63.2%) |
| 18 to 24 Years | 24 (100.0%) | 21 (75.0%) |
| 25 to 34 Years | 35 (100.0%) | 25 (86.2%) |
| 35 to 44 Years | 45 (100.0%) | 68 (79.1%) |
| 45 to 54 Years | 23 (100.0%) | 16 (100.0%) |
| 55 to 64 Years | 21 (100.0%) | 17 (77.3%) |
| 65 to 74 Years | 16 (100.0%) | 7 (100.0%) |
| 75 Years and over | 11 (100.0%) | 10 (66.7%) |
| Total | 264 (88.3%) | 251 (79.7%) |
Income Below Poverty Among Married-Couple Families in Enola
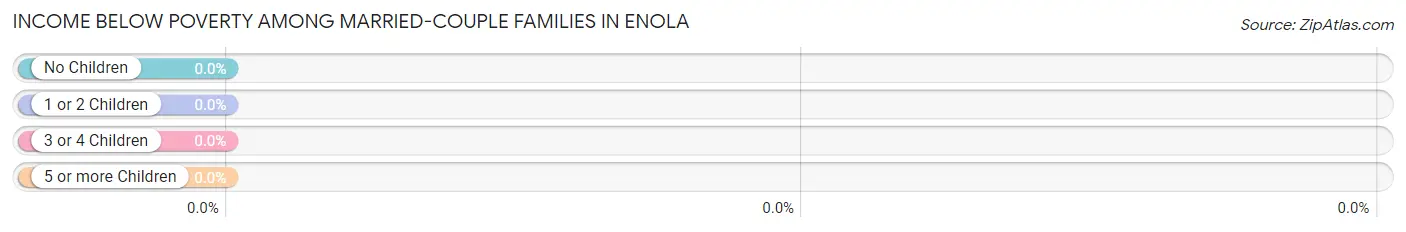
| Children | Above Poverty | Below Poverty |
| No Children | 34 (100.0%) | 0 (0.0%) |
| 1 or 2 Children | 53 (100.0%) | 0 (0.0%) |
| 3 or 4 Children | 5 (100.0%) | 0 (0.0%) |
| 5 or more Children | 7 (100.0%) | 0 (0.0%) |
| Total | 99 (100.0%) | 0 (0.0%) |
Income Below Poverty Among Single-Parent Households in Enola
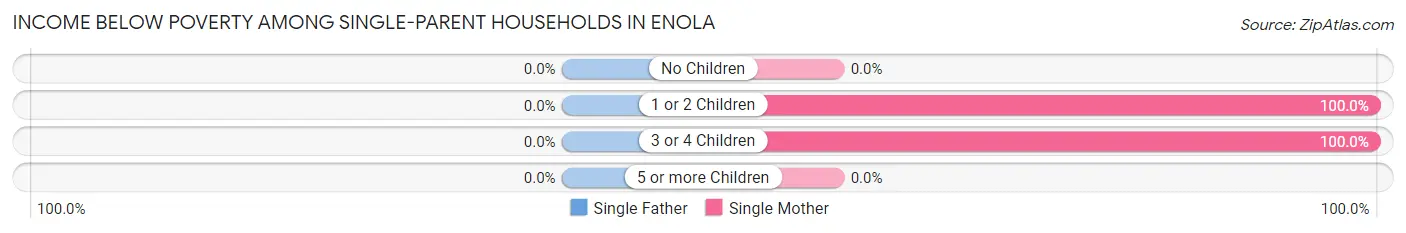
| Children | Single Father | Single Mother |
| No Children | 0 (0.0%) | 0 (0.0%) |
| 1 or 2 Children | 0 (0.0%) | 4 (100.0%) |
| 3 or 4 Children | 0 (0.0%) | 18 (100.0%) |
| 5 or more Children | 0 (0.0%) | 0 (0.0%) |
| Total | 0 (0.0%) | 22 (100.0%) |
Income Below Poverty Among Married-Couple vs Single-Parent Households in Enola
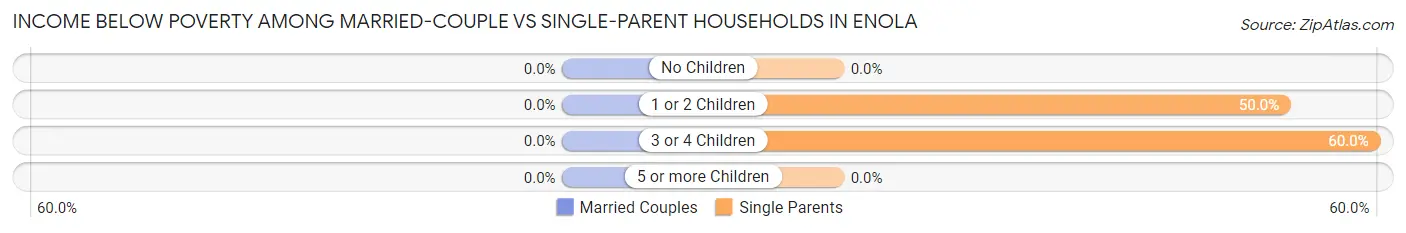
| Children | Married-Couple Families | Single-Parent Households |
| No Children | 0 (0.0%) | 0 (0.0%) |
| 1 or 2 Children | 0 (0.0%) | 4 (50.0%) |
| 3 or 4 Children | 0 (0.0%) | 18 (60.0%) |
| 5 or more Children | 0 (0.0%) | 0 (0.0%) |
| Total | 0 (0.0%) | 22 (55.0%) |
Race in Enola
The most populous races in Enola are White / Caucasian (611 | 99.5%), Hispanic or Latino (5 | 0.8%), and Two or more Races (3 | 0.5%).
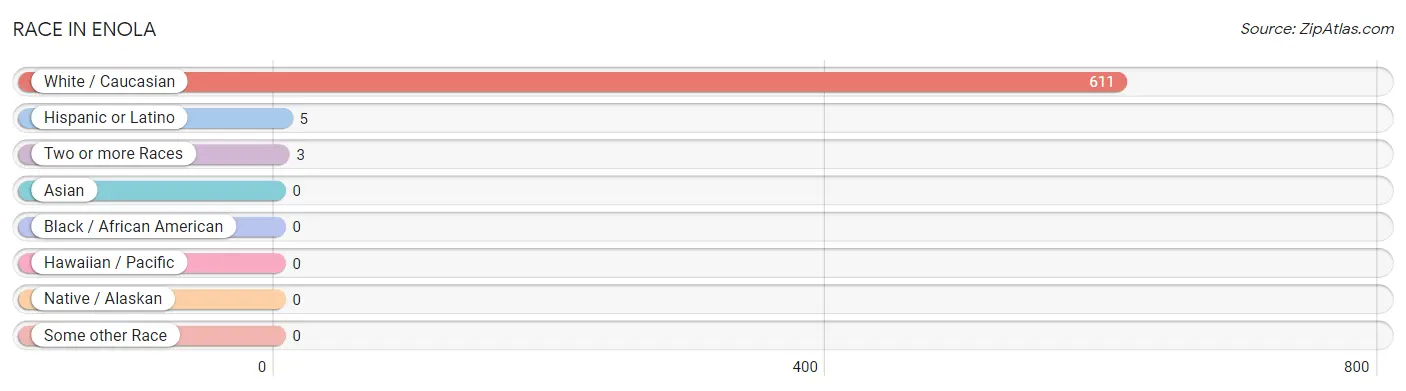
| Race | # Population | % Population |
| Asian | 0 | 0.0% |
| Black / African American | 0 | 0.0% |
| Hawaiian / Pacific | 0 | 0.0% |
| Hispanic or Latino | 5 | 0.8% |
| Native / Alaskan | 0 | 0.0% |
| White / Caucasian | 611 | 99.5% |
| Two or more Races | 3 | 0.5% |
| Some other Race | 0 | 0.0% |
| Total | 614 | 100.0% |
Ancestry in Enola
The most populous ancestries reported in Enola are French (29 | 4.7%), Irish (29 | 4.7%), English (16 | 2.6%), Polish (11 | 1.8%), and American (9 | 1.5%), together accounting for 15.3% of all Enola residents.
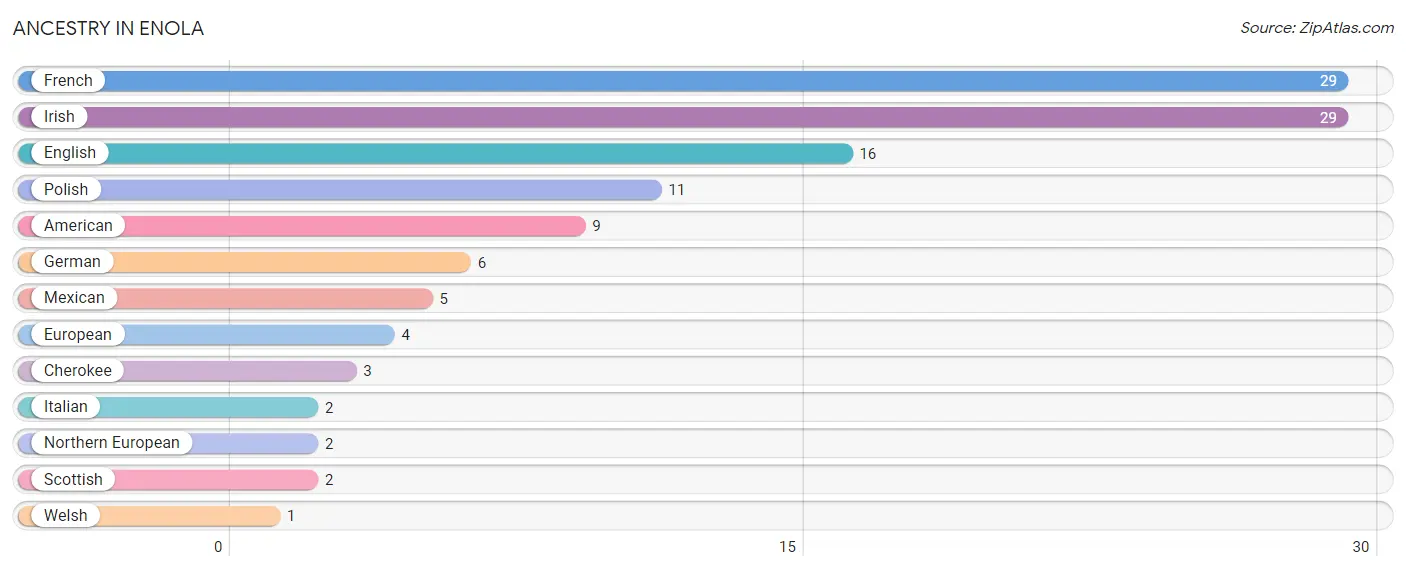
| Ancestry | # Population | % Population |
| American | 9 | 1.5% |
| Cherokee | 3 | 0.5% |
| English | 16 | 2.6% |
| European | 4 | 0.6% |
| French | 29 | 4.7% |
| German | 6 | 1.0% |
| Irish | 29 | 4.7% |
| Italian | 2 | 0.3% |
| Mexican | 5 | 0.8% |
| Northern European | 2 | 0.3% |
| Polish | 11 | 1.8% |
| Scottish | 2 | 0.3% |
| Welsh | 1 | 0.2% | View All 13 Rows |
Immigrants in Enola

| Immigration Origin | # Population | % Population | View All 0 Rows |
Sex and Age in Enola
Sex and Age in Enola
The most populous age groups in Enola are 10 to 14 Years (41 | 13.7%) for men and 15 to 19 Years (79 | 25.1%) for women.
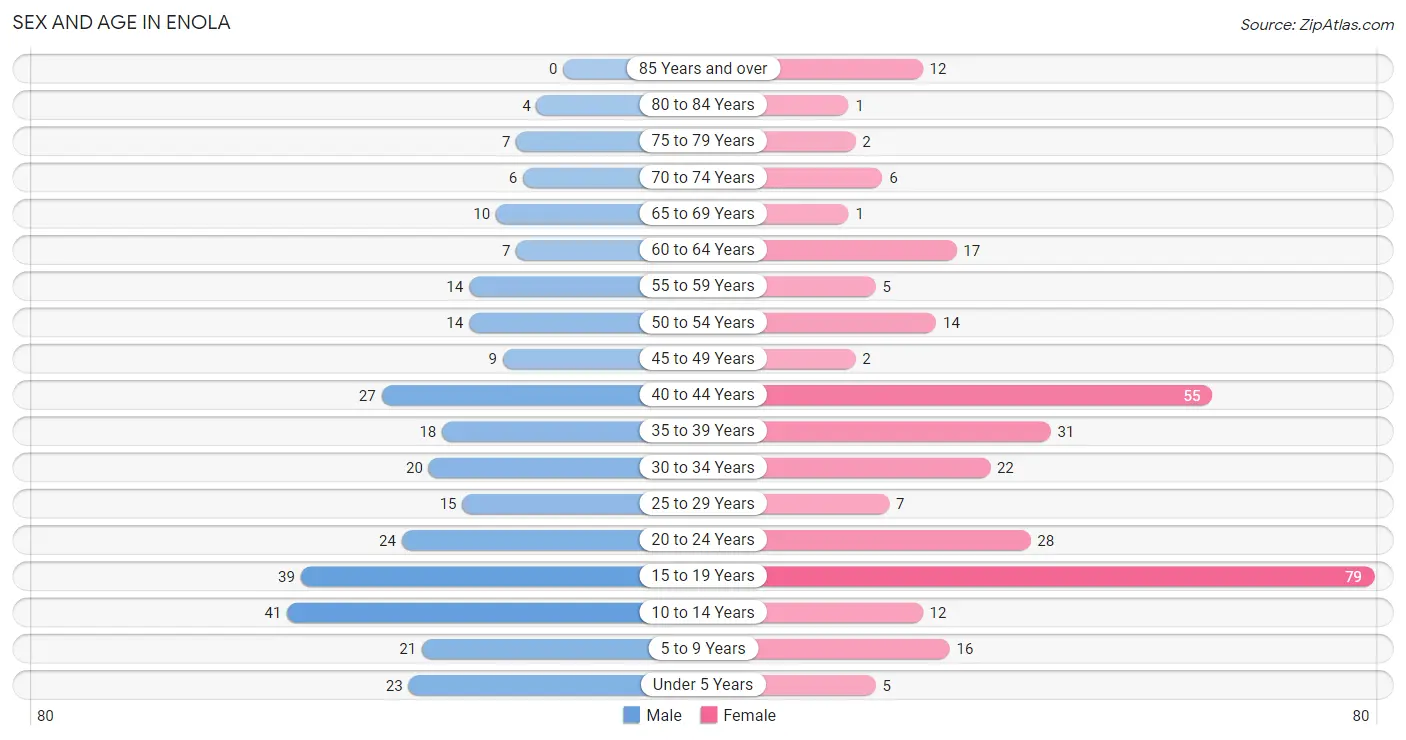
| Age Bracket | Male | Female |
| Under 5 Years | 23 (7.7%) | 5 (1.6%) |
| 5 to 9 Years | 21 (7.0%) | 16 (5.1%) |
| 10 to 14 Years | 41 (13.7%) | 12 (3.8%) |
| 15 to 19 Years | 39 (13.0%) | 79 (25.1%) |
| 20 to 24 Years | 24 (8.0%) | 28 (8.9%) |
| 25 to 29 Years | 15 (5.0%) | 7 (2.2%) |
| 30 to 34 Years | 20 (6.7%) | 22 (7.0%) |
| 35 to 39 Years | 18 (6.0%) | 31 (9.8%) |
| 40 to 44 Years | 27 (9.0%) | 55 (17.5%) |
| 45 to 49 Years | 9 (3.0%) | 2 (0.6%) |
| 50 to 54 Years | 14 (4.7%) | 14 (4.4%) |
| 55 to 59 Years | 14 (4.7%) | 5 (1.6%) |
| 60 to 64 Years | 7 (2.3%) | 17 (5.4%) |
| 65 to 69 Years | 10 (3.3%) | 1 (0.3%) |
| 70 to 74 Years | 6 (2.0%) | 6 (1.9%) |
| 75 to 79 Years | 7 (2.3%) | 2 (0.6%) |
| 80 to 84 Years | 4 (1.3%) | 1 (0.3%) |
| 85 Years and over | 0 (0.0%) | 12 (3.8%) |
| Total | 299 (100.0%) | 315 (100.0%) |
Families and Households in Enola
Median Family Size in Enola
The median family size in Enola is 3.68 persons per family, with married-couple families (99 | 71.2%) accounting for the largest median family size of 3.79 persons per family. On the other hand, single male/father families (18 | 13.0%) represent the smallest median family size with 3.06 persons per family.
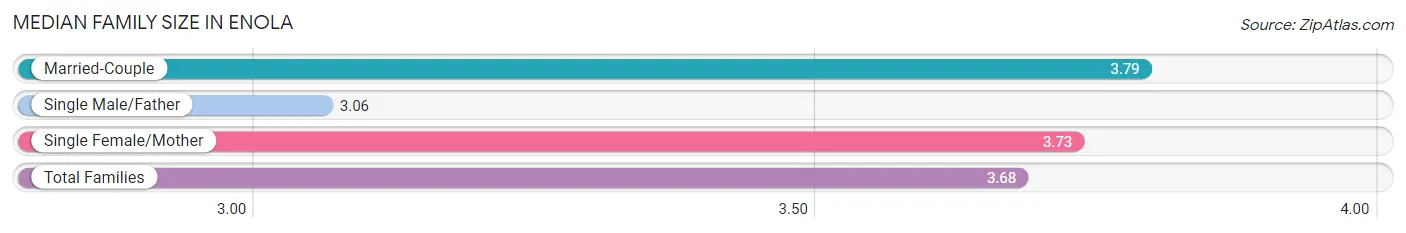
| Family Type | # Families | Family Size |
| Married-Couple | 99 (71.2%) | 3.79 |
| Single Male/Father | 18 (13.0%) | 3.06 |
| Single Female/Mother | 22 (15.8%) | 3.73 |
| Total Families | 139 (100.0%) | 3.68 |
Median Household Size in Enola
The median household size in Enola is 2.80 persons per household, with single female/mother households (22 | 10.1%) accounting for the largest median household size of 3.91 persons per household. non-family households (80 | 36.5%) represent the smallest median household size with 1.23 persons per household.
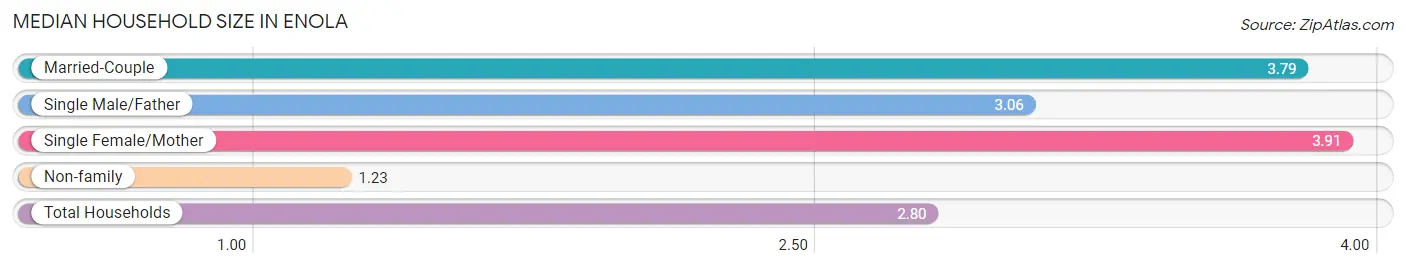
| Household Type | # Households | Household Size |
| Married-Couple | 99 (45.2%) | 3.79 |
| Single Male/Father | 18 (8.2%) | 3.06 |
| Single Female/Mother | 22 (10.1%) | 3.91 |
| Non-family | 80 (36.5%) | 1.23 |
| Total Households | 219 (100.0%) | 2.80 |
Household Size by Marriage Status in Enola
Out of a total of 219 households in Enola, 139 (63.5%) are family households, while 80 (36.5%) are nonfamily households. The most numerous type of family households are 4-person households, comprising 51, and the most common type of nonfamily households are 1-person households, comprising 66.
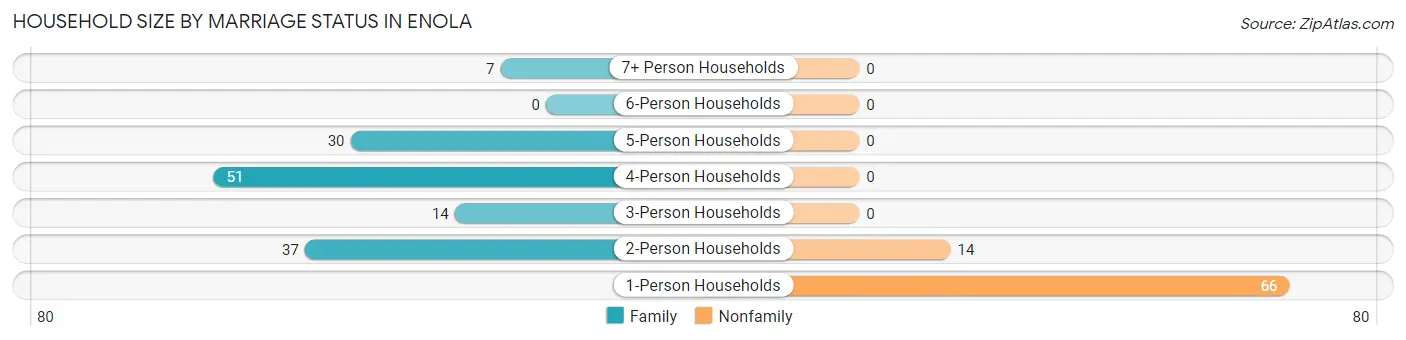
| Household Size | Family Households | Nonfamily Households |
| 1-Person Households | - | 66 (30.1%) |
| 2-Person Households | 37 (16.9%) | 14 (6.4%) |
| 3-Person Households | 14 (6.4%) | 0 (0.0%) |
| 4-Person Households | 51 (23.3%) | 0 (0.0%) |
| 5-Person Households | 30 (13.7%) | 0 (0.0%) |
| 6-Person Households | 0 (0.0%) | 0 (0.0%) |
| 7+ Person Households | 7 (3.2%) | 0 (0.0%) |
| Total | 139 (63.5%) | 80 (36.5%) |
Female Fertility in Enola
Fertility by Age in Enola
Average fertility rate in Enola is 69.0 births per 1,000 women. Women in the age bracket of 20 to 34 years have the highest fertility rate with 281.0 births per 1,000 women. Women in the age bracket of 20 to 34 years acount for 100.0% of all women with births.
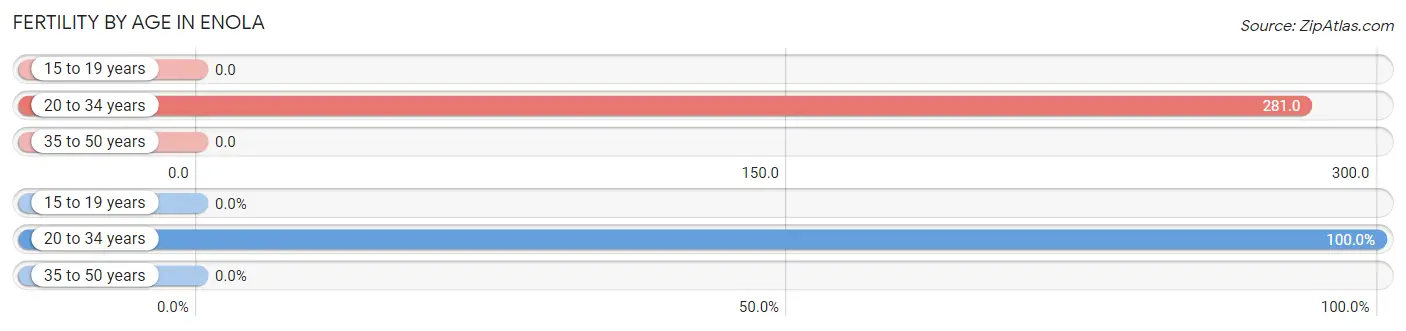
| Age Bracket | Women with Births | Births / 1,000 Women |
| 15 to 19 years | 0 (0.0%) | 0.0 |
| 20 to 34 years | 16 (100.0%) | 281.0 |
| 35 to 50 years | 0 (0.0%) | 0.0 |
| Total | 16 (100.0%) | 69.0 |
Fertility by Age by Marriage Status in Enola
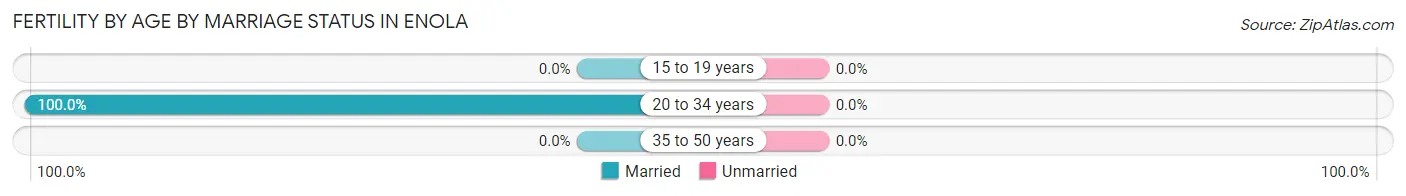
| Age Bracket | Married | Unmarried |
| 15 to 19 years | 0 (0.0%) | 0 (0.0%) |
| 20 to 34 years | 16 (100.0%) | 0 (0.0%) |
| 35 to 50 years | 0 (0.0%) | 0 (0.0%) |
| Total | 16 (100.0%) | 0 (0.0%) |
Fertility by Education in Enola
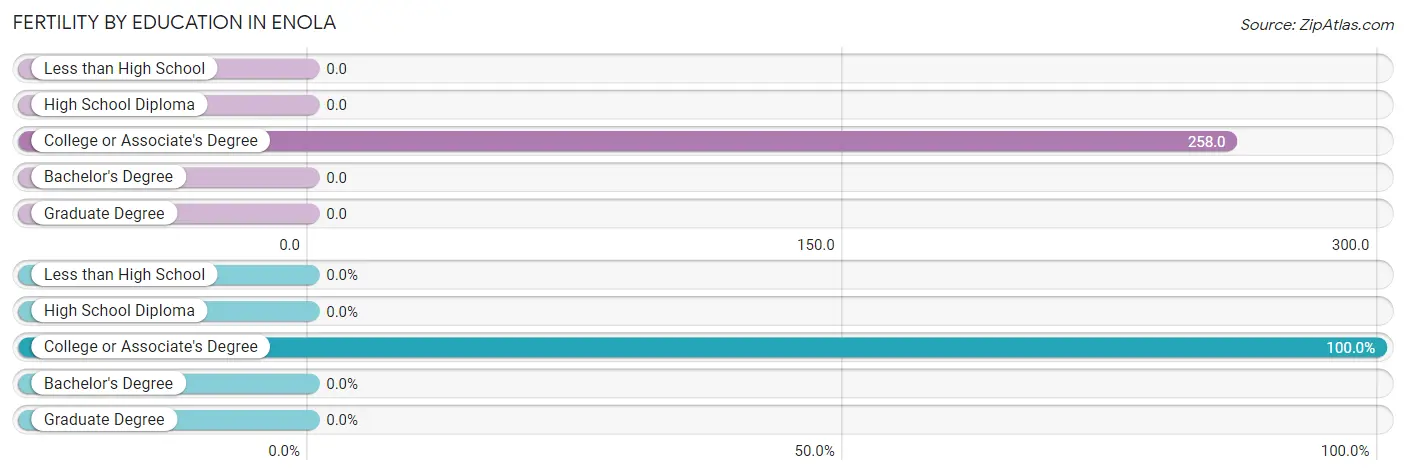
| Educational Attainment | Women with Births | Births / 1,000 Women |
| Less than High School | 0 (0.0%) | 0.0 |
| High School Diploma | 0 (0.0%) | 0.0 |
| College or Associate's Degree | 16 (100.0%) | 258.0 |
| Bachelor's Degree | 0 (0.0%) | 0.0 |
| Graduate Degree | 0 (0.0%) | 0.0 |
| Total | 16 (100.0%) | 69.0 |
Fertility by Education by Marriage Status in Enola
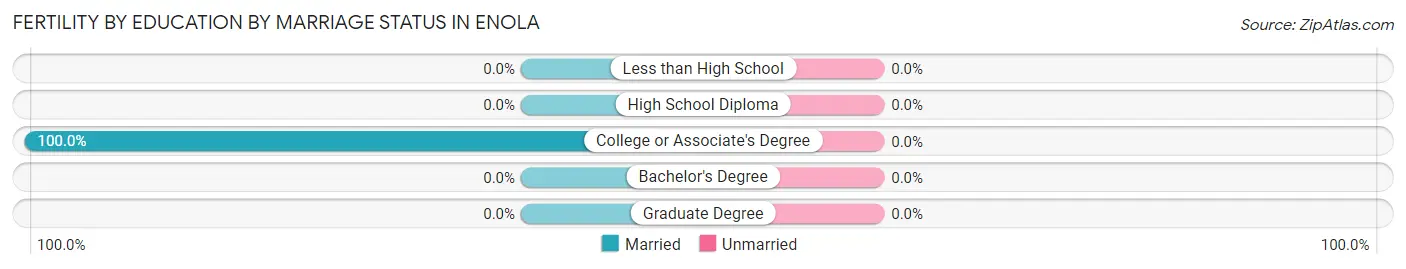
| Educational Attainment | Married | Unmarried |
| Less than High School | 0 (0.0%) | 0 (0.0%) |
| High School Diploma | 0 (0.0%) | 0 (0.0%) |
| College or Associate's Degree | 16 (100.0%) | 0 (0.0%) |
| Bachelor's Degree | 0 (0.0%) | 0 (0.0%) |
| Graduate Degree | 0 (0.0%) | 0 (0.0%) |
| Total | 16 (100.0%) | 0 (0.0%) |
Employment Characteristics in Enola
Employment by Class of Employer in Enola
Among the 288 employed individuals in Enola, private company employees (219 | 76.0%), self-employed (not incorporated) (26 | 9.0%), and not-for-profit organizations (14 | 4.9%) make up the most common classes of employment.
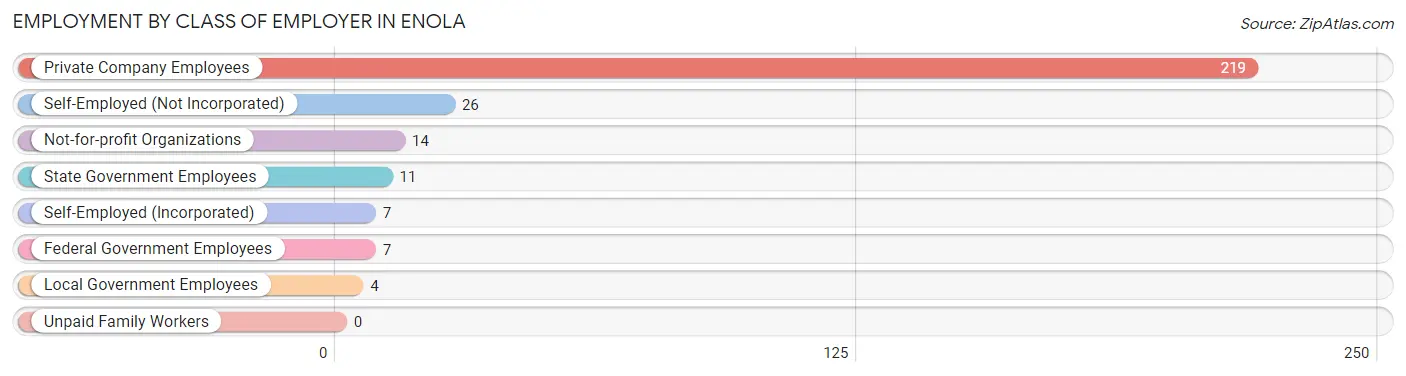
| Employer Class | # Employees | % Employees |
| Private Company Employees | 219 | 76.0% |
| Self-Employed (Incorporated) | 7 | 2.4% |
| Self-Employed (Not Incorporated) | 26 | 9.0% |
| Not-for-profit Organizations | 14 | 4.9% |
| Local Government Employees | 4 | 1.4% |
| State Government Employees | 11 | 3.8% |
| Federal Government Employees | 7 | 2.4% |
| Unpaid Family Workers | 0 | 0.0% |
| Total | 288 | 100.0% |
Employment Status by Age in Enola
According to the labor force statistics for Enola, out of the total population over 16 years of age (470), 61.5% or 289 individuals are in the labor force, with 0.3% or 1 of them unemployed. The age group with the highest labor force participation rate is 25 to 29 years, with 100.0% or 22 individuals in the labor force. Within the labor force, the 55 to 59 years age range has the highest percentage of unemployed individuals, with 5.3% or 1 of them being unemployed.
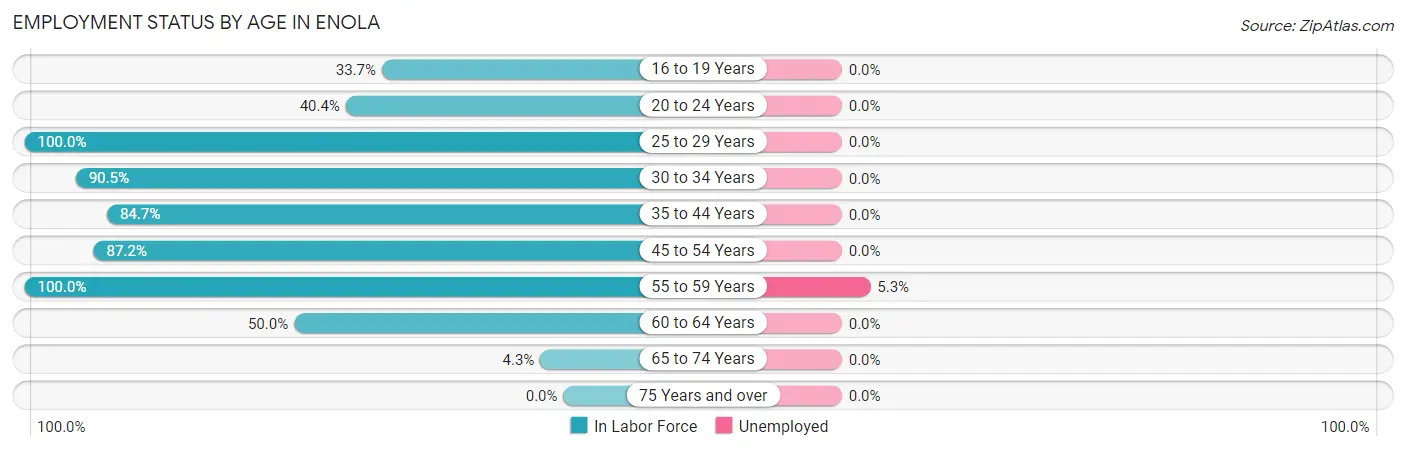
| Age Bracket | In Labor Force | Unemployed |
| 16 to 19 Years | 31 (33.7%) | 0 (0.0%) |
| 20 to 24 Years | 21 (40.4%) | 0 (0.0%) |
| 25 to 29 Years | 22 (100.0%) | 0 (0.0%) |
| 30 to 34 Years | 38 (90.5%) | 0 (0.0%) |
| 35 to 44 Years | 111 (84.7%) | 0 (0.0%) |
| 45 to 54 Years | 34 (87.2%) | 0 (0.0%) |
| 55 to 59 Years | 19 (100.0%) | 1 (5.3%) |
| 60 to 64 Years | 12 (50.0%) | 0 (0.0%) |
| 65 to 74 Years | 1 (4.3%) | 0 (0.0%) |
| 75 Years and over | 0 (0.0%) | 0 (0.0%) |
| Total | 289 (61.5%) | 1 (0.3%) |
Employment Status by Educational Attainment in Enola
According to labor force statistics for Enola, 85.2% of individuals (236) out of the total population between 25 and 64 years of age (277) are in the labor force, with 0.4% or 1 of them being unemployed. The group with the highest labor force participation rate are those with the educational attainment of college / associate degree, with 92.0% or 92 individuals in the labor force. Within the labor force, individuals with bachelor's degree or higher education have the highest percentage of unemployment, with 1.9% or 1 of them being unemployed.
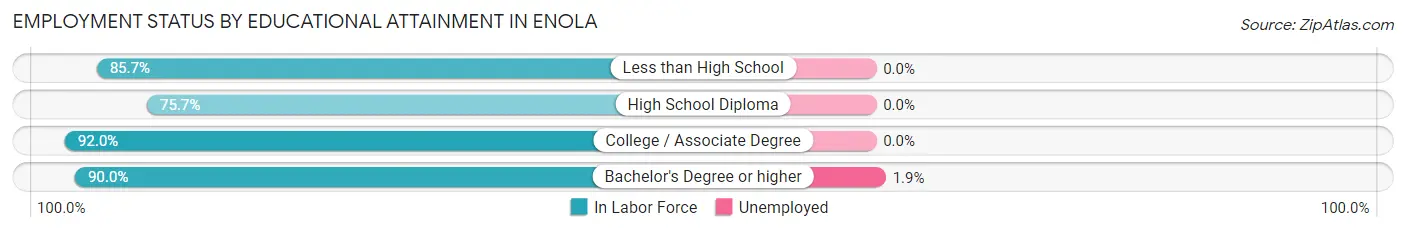
| Educational Attainment | In Labor Force | Unemployed |
| Less than High School | 12 (85.7%) | 0 (0.0%) |
| High School Diploma | 78 (75.7%) | 0 (0.0%) |
| College / Associate Degree | 92 (92.0%) | 0 (0.0%) |
| Bachelor's Degree or higher | 54 (90.0%) | 1 (1.9%) |
| Total | 236 (85.2%) | 1 (0.4%) |
Employment Occupations by Sex in Enola
Management, Business, Science and Arts Occupations
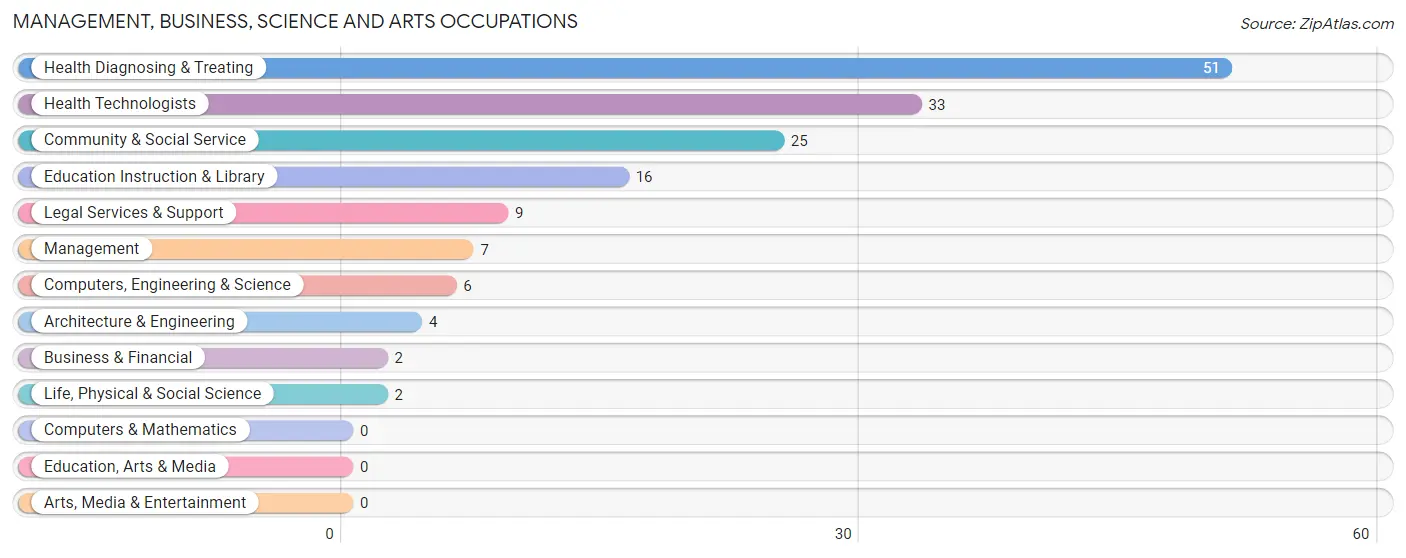
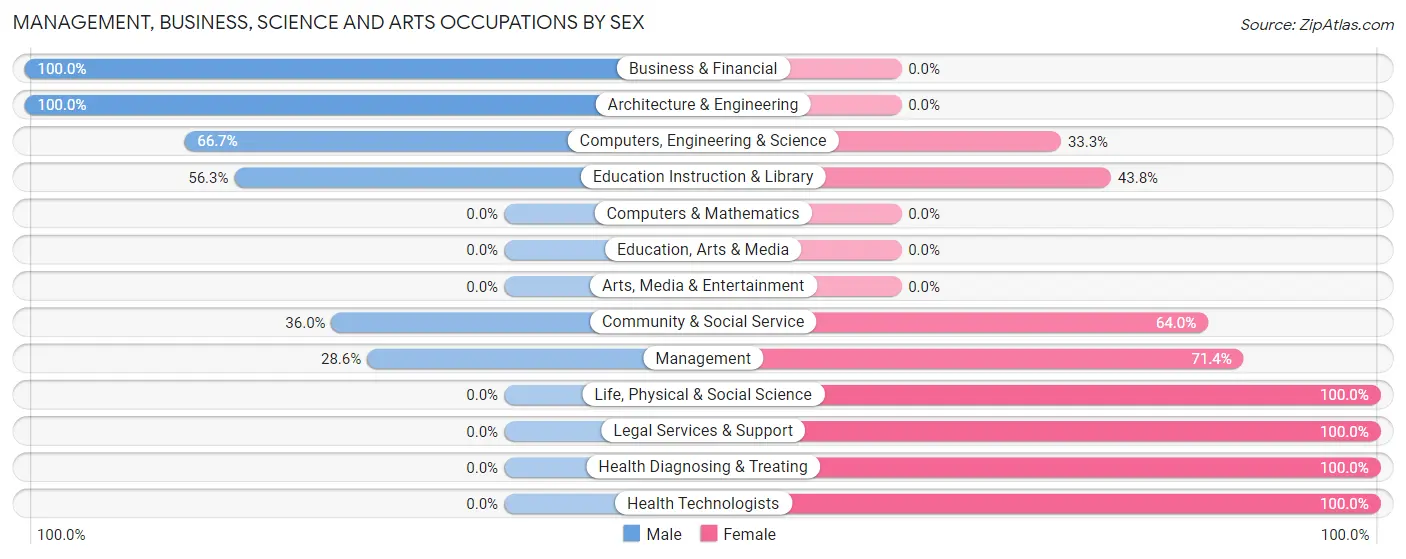
The most common Management, Business, Science and Arts occupations in Enola are Health Diagnosing & Treating (51 | 17.7%), Health Technologists (33 | 11.5%), Community & Social Service (25 | 8.7%), Education Instruction & Library (16 | 5.6%), and Legal Services & Support (9 | 3.1%).
Management, Business, Science and Arts Occupations by Sex
Within the Management, Business, Science and Arts occupations in Enola, the most male-oriented occupations are Business & Financial (100.0%), Architecture & Engineering (100.0%), and Computers, Engineering & Science (66.7%), while the most female-oriented occupations are Life, Physical & Social Science (100.0%), Legal Services & Support (100.0%), and Health Diagnosing & Treating (100.0%).
| Occupation | Male | Female |
| Management | 2 (28.6%) | 5 (71.4%) |
| Business & Financial | 2 (100.0%) | 0 (0.0%) |
| Computers, Engineering & Science | 4 (66.7%) | 2 (33.3%) |
| Computers & Mathematics | 0 (0.0%) | 0 (0.0%) |
| Architecture & Engineering | 4 (100.0%) | 0 (0.0%) |
| Life, Physical & Social Science | 0 (0.0%) | 2 (100.0%) |
| Community & Social Service | 9 (36.0%) | 16 (64.0%) |
| Education, Arts & Media | 0 (0.0%) | 0 (0.0%) |
| Legal Services & Support | 0 (0.0%) | 9 (100.0%) |
| Education Instruction & Library | 9 (56.2%) | 7 (43.8%) |
| Arts, Media & Entertainment | 0 (0.0%) | 0 (0.0%) |
| Health Diagnosing & Treating | 0 (0.0%) | 51 (100.0%) |
| Health Technologists | 0 (0.0%) | 33 (100.0%) |
| Total (Category) | 17 (18.7%) | 74 (81.3%) |
| Total (Overall) | 106 (36.8%) | 182 (63.2%) |
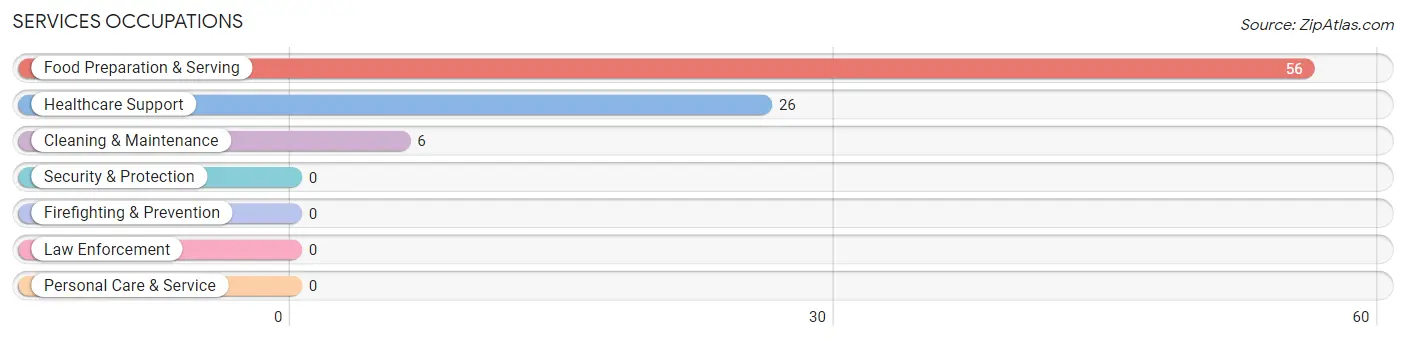
Services Occupations
The most common Services occupations in Enola are Food Preparation & Serving (56 | 19.4%), Healthcare Support (26 | 9.0%), and Cleaning & Maintenance (6 | 2.1%).
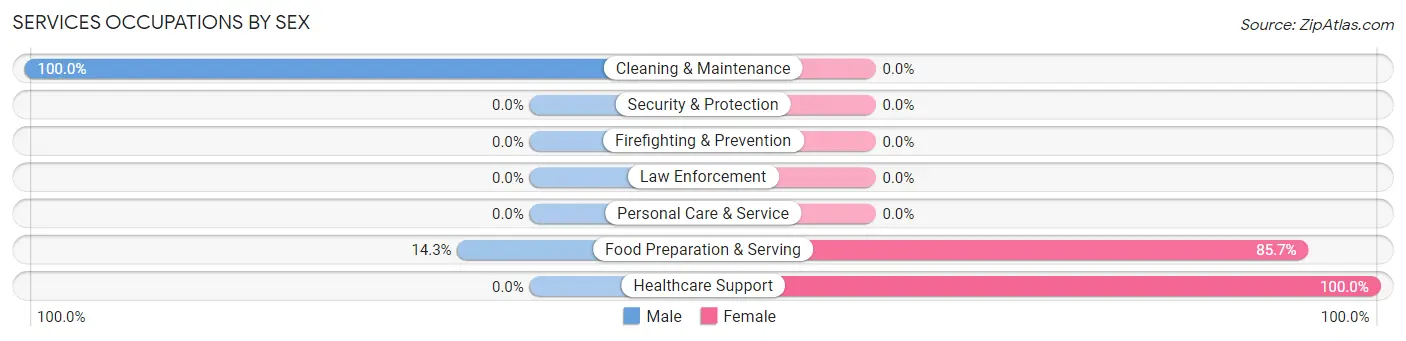
Services Occupations by Sex
Within the Services occupations in Enola, the most male-oriented occupations are Cleaning & Maintenance (100.0%), and Food Preparation & Serving (14.3%), while the most female-oriented occupations are Healthcare Support (100.0%), and Food Preparation & Serving (85.7%).
| Occupation | Male | Female |
| Healthcare Support | 0 (0.0%) | 26 (100.0%) |
| Security & Protection | 0 (0.0%) | 0 (0.0%) |
| Firefighting & Prevention | 0 (0.0%) | 0 (0.0%) |
| Law Enforcement | 0 (0.0%) | 0 (0.0%) |
| Food Preparation & Serving | 8 (14.3%) | 48 (85.7%) |
| Cleaning & Maintenance | 6 (100.0%) | 0 (0.0%) |
| Personal Care & Service | 0 (0.0%) | 0 (0.0%) |
| Total (Category) | 14 (15.9%) | 74 (84.1%) |
| Total (Overall) | 106 (36.8%) | 182 (63.2%) |
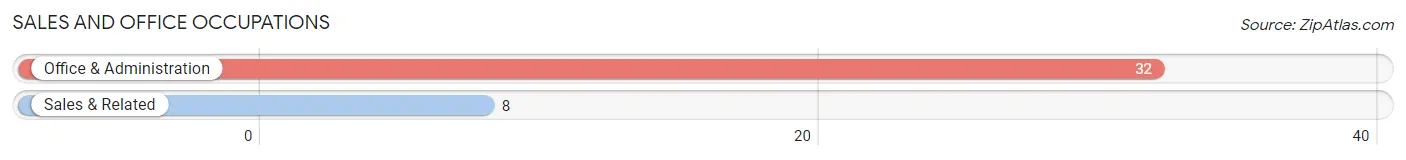
Sales and Office Occupations
The most common Sales and Office occupations in Enola are Office & Administration (32 | 11.1%), and Sales & Related (8 | 2.8%).
Sales and Office Occupations by Sex
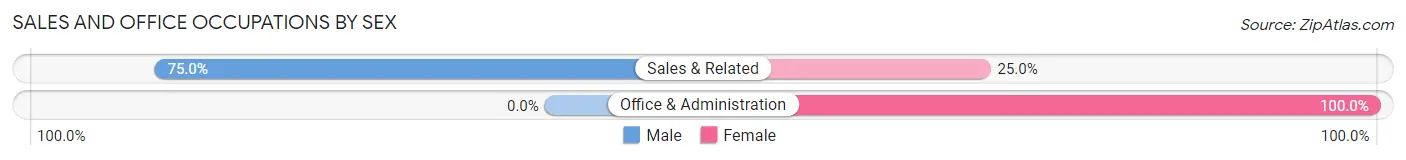
| Occupation | Male | Female |
| Sales & Related | 6 (75.0%) | 2 (25.0%) |
| Office & Administration | 0 (0.0%) | 32 (100.0%) |
| Total (Category) | 6 (15.0%) | 34 (85.0%) |
| Total (Overall) | 106 (36.8%) | 182 (63.2%) |
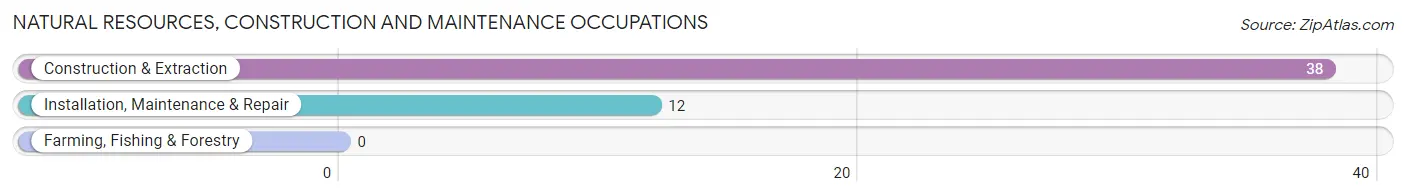
Natural Resources, Construction and Maintenance Occupations
The most common Natural Resources, Construction and Maintenance occupations in Enola are Construction & Extraction (38 | 13.2%), and Installation, Maintenance & Repair (12 | 4.2%).
Natural Resources, Construction and Maintenance Occupations by Sex
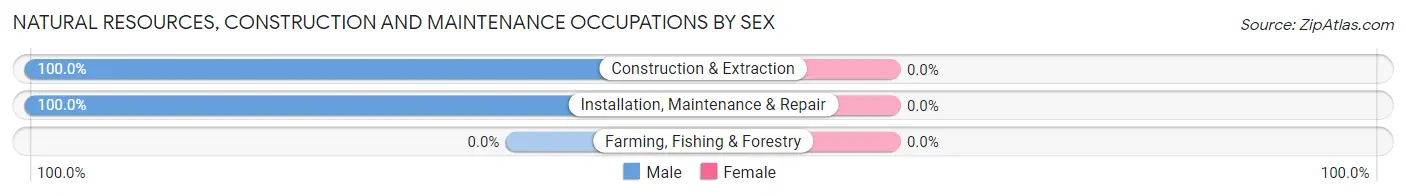
| Occupation | Male | Female |
| Farming, Fishing & Forestry | 0 (0.0%) | 0 (0.0%) |
| Construction & Extraction | 38 (100.0%) | 0 (0.0%) |
| Installation, Maintenance & Repair | 12 (100.0%) | 0 (0.0%) |
| Total (Category) | 50 (100.0%) | 0 (0.0%) |
| Total (Overall) | 106 (36.8%) | 182 (63.2%) |
Production, Transportation and Moving Occupations
The most common Production, Transportation and Moving occupations in Enola are Production (17 | 5.9%), and Material Moving (2 | 0.7%).
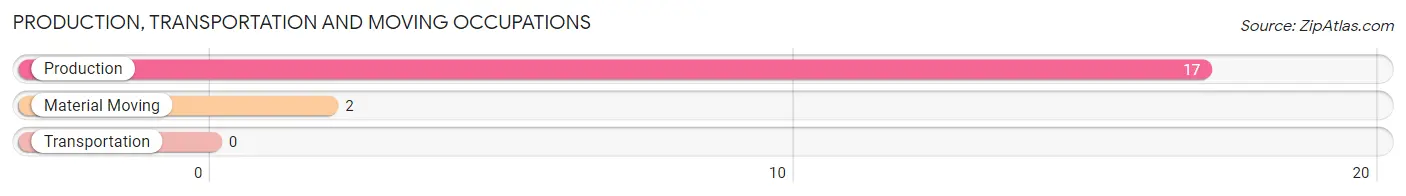
Production, Transportation and Moving Occupations by Sex
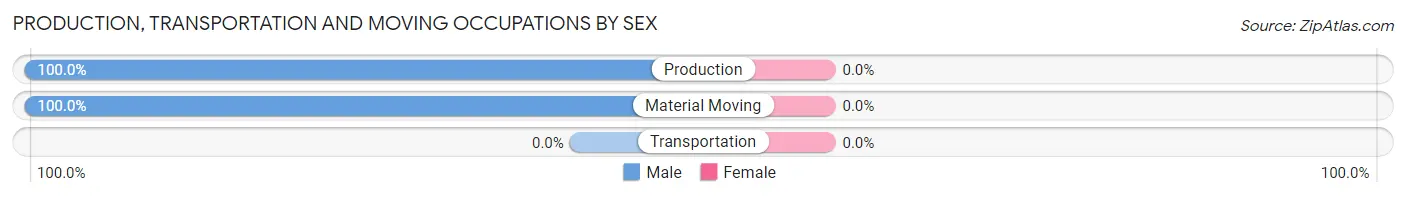
| Occupation | Male | Female |
| Production | 17 (100.0%) | 0 (0.0%) |
| Transportation | 0 (0.0%) | 0 (0.0%) |
| Material Moving | 2 (100.0%) | 0 (0.0%) |
| Total (Category) | 19 (100.0%) | 0 (0.0%) |
| Total (Overall) | 106 (36.8%) | 182 (63.2%) |
Employment Industries by Sex in Enola
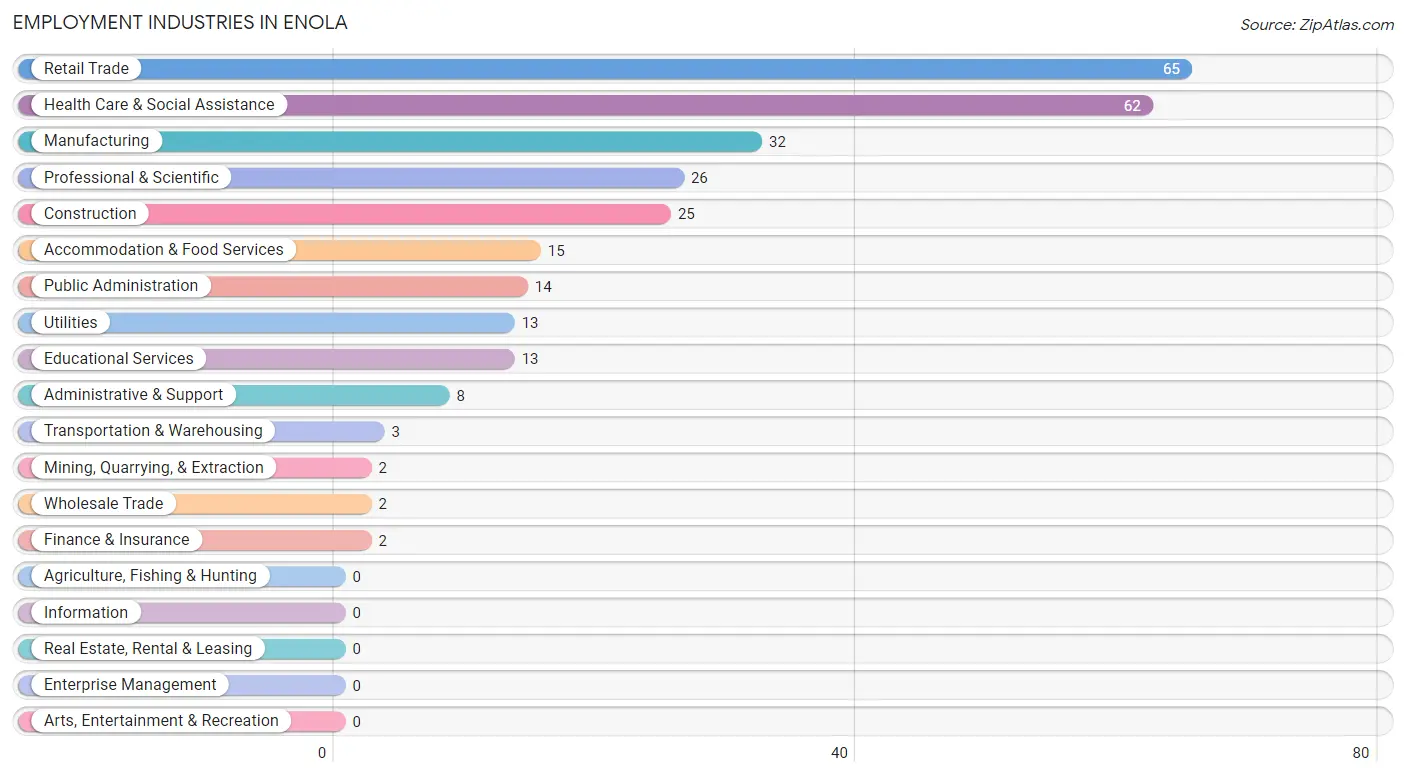
Employment Industries in Enola
The major employment industries in Enola include Retail Trade (65 | 22.6%), Health Care & Social Assistance (62 | 21.5%), Manufacturing (32 | 11.1%), Professional & Scientific (26 | 9.0%), and Construction (25 | 8.7%).
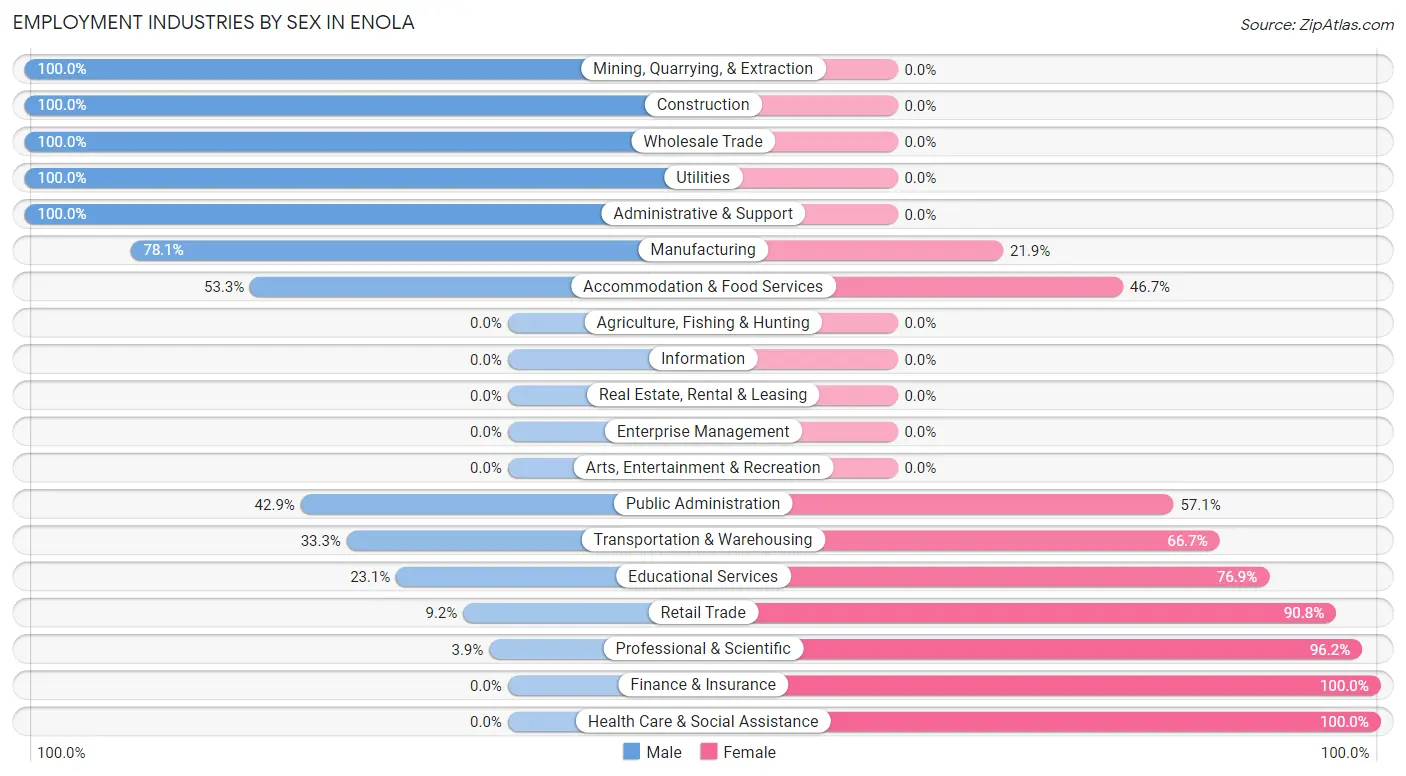
Employment Industries by Sex in Enola
The Enola industries that see more men than women are Mining, Quarrying, & Extraction (100.0%), Construction (100.0%), and Wholesale Trade (100.0%), whereas the industries that tend to have a higher number of women are Finance & Insurance (100.0%), Health Care & Social Assistance (100.0%), and Professional & Scientific (96.2%).
| Industry | Male | Female |
| Agriculture, Fishing & Hunting | 0 (0.0%) | 0 (0.0%) |
| Mining, Quarrying, & Extraction | 2 (100.0%) | 0 (0.0%) |
| Construction | 25 (100.0%) | 0 (0.0%) |
| Manufacturing | 25 (78.1%) | 7 (21.9%) |
| Wholesale Trade | 2 (100.0%) | 0 (0.0%) |
| Retail Trade | 6 (9.2%) | 59 (90.8%) |
| Transportation & Warehousing | 1 (33.3%) | 2 (66.7%) |
| Utilities | 13 (100.0%) | 0 (0.0%) |
| Information | 0 (0.0%) | 0 (0.0%) |
| Finance & Insurance | 0 (0.0%) | 2 (100.0%) |
| Real Estate, Rental & Leasing | 0 (0.0%) | 0 (0.0%) |
| Professional & Scientific | 1 (3.8%) | 25 (96.2%) |
| Enterprise Management | 0 (0.0%) | 0 (0.0%) |
| Administrative & Support | 8 (100.0%) | 0 (0.0%) |
| Educational Services | 3 (23.1%) | 10 (76.9%) |
| Health Care & Social Assistance | 0 (0.0%) | 62 (100.0%) |
| Arts, Entertainment & Recreation | 0 (0.0%) | 0 (0.0%) |
| Accommodation & Food Services | 8 (53.3%) | 7 (46.7%) |
| Public Administration | 6 (42.9%) | 8 (57.1%) |
| Total | 106 (36.8%) | 182 (63.2%) |
Education in Enola
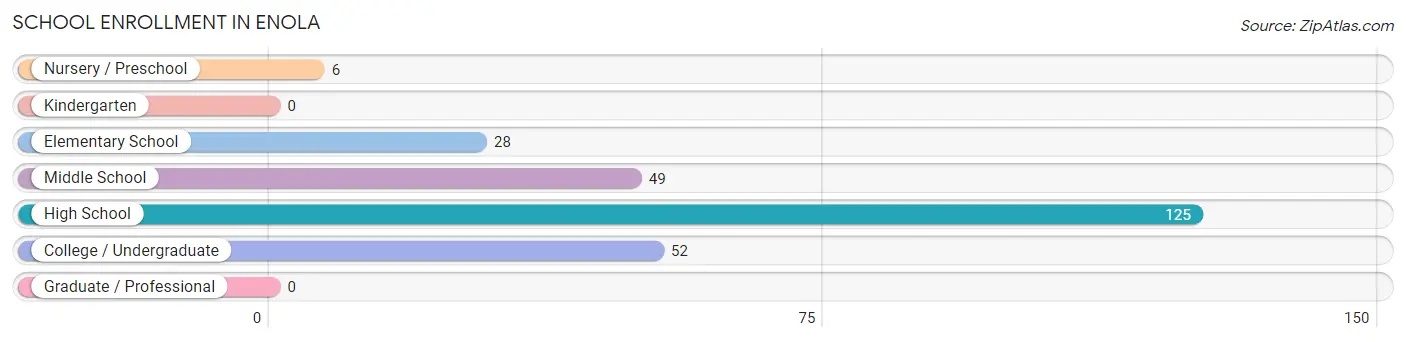
School Enrollment in Enola
The most common levels of schooling among the 260 students in Enola are high school (125 | 48.1%), college / undergraduate (52 | 20.0%), and middle school (49 | 18.9%).
| School Level | # Students | % Students |
| Nursery / Preschool | 6 | 2.3% |
| Kindergarten | 0 | 0.0% |
| Elementary School | 28 | 10.8% |
| Middle School | 49 | 18.9% |
| High School | 125 | 48.1% |
| College / Undergraduate | 52 | 20.0% |
| Graduate / Professional | 0 | 0.0% |
| Total | 260 | 100.0% |
School Enrollment by Age by Funding Source in Enola
Out of a total of 260 students who are enrolled in schools in Enola, 20 (7.7%) attend a private institution, while the remaining 240 (92.3%) are enrolled in public schools. The age group of 5 to 9 year old has the highest likelihood of being enrolled in private schools, with 13 (35.1% in the age bracket) enrolled. Conversely, the age group of 10 to 14 year olds has the lowest likelihood of being enrolled in a private school, with 53 (100.0% in the age bracket) attending a public institution.
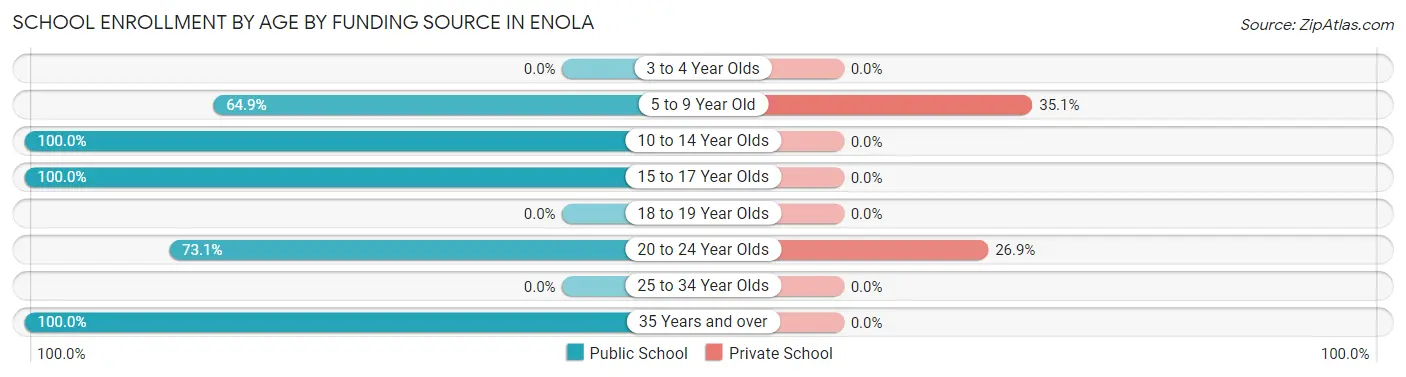
| Age Bracket | Public School | Private School |
| 3 to 4 Year Olds | 0 (0.0%) | 0 (0.0%) |
| 5 to 9 Year Old | 24 (64.9%) | 13 (35.1%) |
| 10 to 14 Year Olds | 53 (100.0%) | 0 (0.0%) |
| 15 to 17 Year Olds | 118 (100.0%) | 0 (0.0%) |
| 18 to 19 Year Olds | 0 (0.0%) | 0 (0.0%) |
| 20 to 24 Year Olds | 19 (73.1%) | 7 (26.9%) |
| 25 to 34 Year Olds | 0 (0.0%) | 0 (0.0%) |
| 35 Years and over | 26 (100.0%) | 0 (0.0%) |
| Total | 240 (92.3%) | 20 (7.7%) |
Educational Attainment by Field of Study in Enola
Science & technology (36 | 54.5%), social sciences (8 | 12.1%), education (8 | 12.1%), engineering (6 | 9.1%), and bio, nature & agricultural (2 | 3.0%) are the most common fields of study among 66 individuals in Enola who have obtained a bachelor's degree or higher.
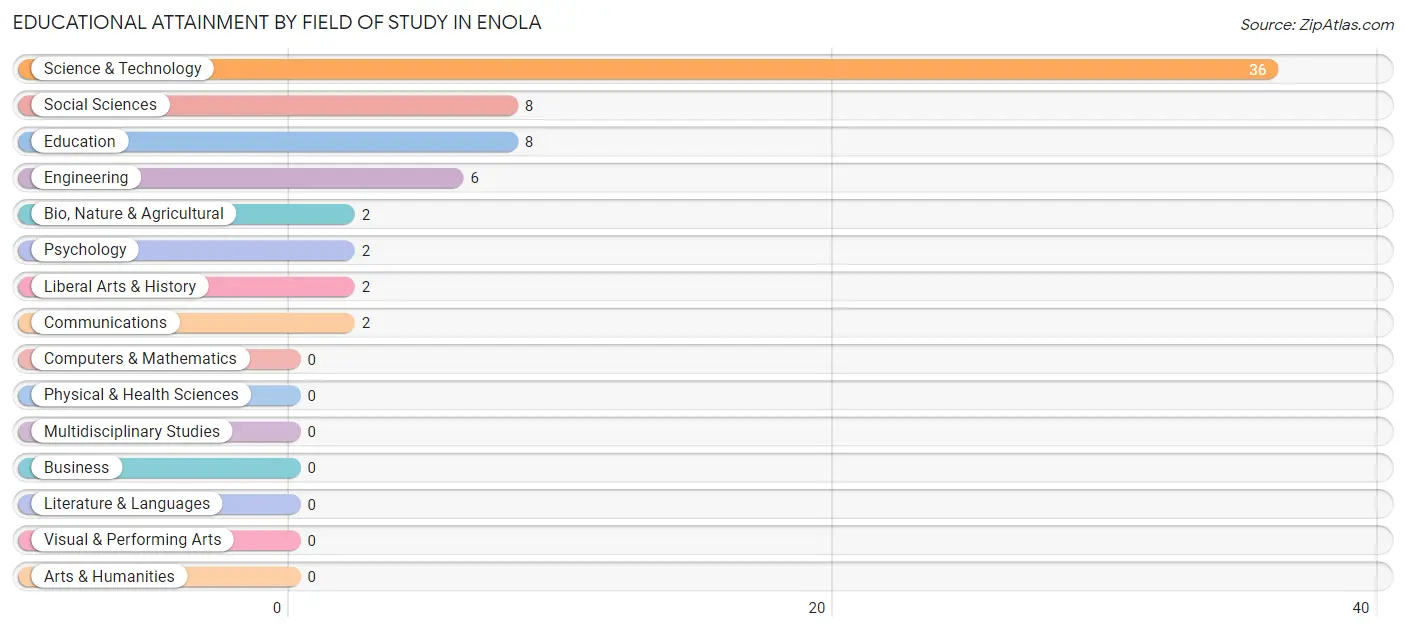
| Field of Study | # Graduates | % Graduates |
| Computers & Mathematics | 0 | 0.0% |
| Bio, Nature & Agricultural | 2 | 3.0% |
| Physical & Health Sciences | 0 | 0.0% |
| Psychology | 2 | 3.0% |
| Social Sciences | 8 | 12.1% |
| Engineering | 6 | 9.1% |
| Multidisciplinary Studies | 0 | 0.0% |
| Science & Technology | 36 | 54.5% |
| Business | 0 | 0.0% |
| Education | 8 | 12.1% |
| Literature & Languages | 0 | 0.0% |
| Liberal Arts & History | 2 | 3.0% |
| Visual & Performing Arts | 0 | 0.0% |
| Communications | 2 | 3.0% |
| Arts & Humanities | 0 | 0.0% |
| Total | 66 | 100.0% |
Transportation & Commute in Enola
Vehicle Availability by Sex in Enola
The most prevalent vehicle ownership categories in Enola are males with 3 vehicles (34, accounting for 32.1%) and females with 3 vehicles (69, making up 18.7%).
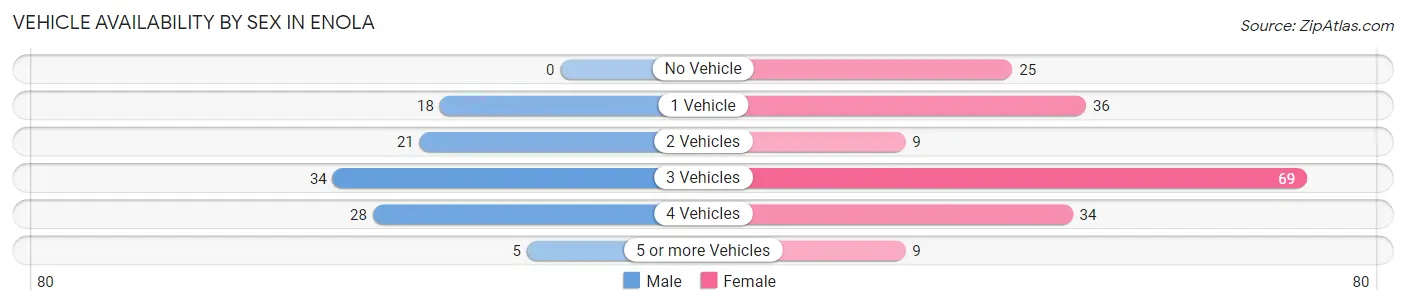
| Vehicles Available | Male | Female |
| No Vehicle | 0 (0.0%) | 25 (13.7%) |
| 1 Vehicle | 18 (17.0%) | 36 (19.8%) |
| 2 Vehicles | 21 (19.8%) | 9 (5.0%) |
| 3 Vehicles | 34 (32.1%) | 69 (37.9%) |
| 4 Vehicles | 28 (26.4%) | 34 (18.7%) |
| 5 or more Vehicles | 5 (4.7%) | 9 (5.0%) |
| Total | 106 (100.0%) | 182 (100.0%) |
Commute Time in Enola
The most frequently occuring commute durations in Enola are 30 to 34 minutes (58 commuters, 22.2%), 5 to 9 minutes (41 commuters, 15.7%), and 20 to 24 minutes (38 commuters, 14.6%).
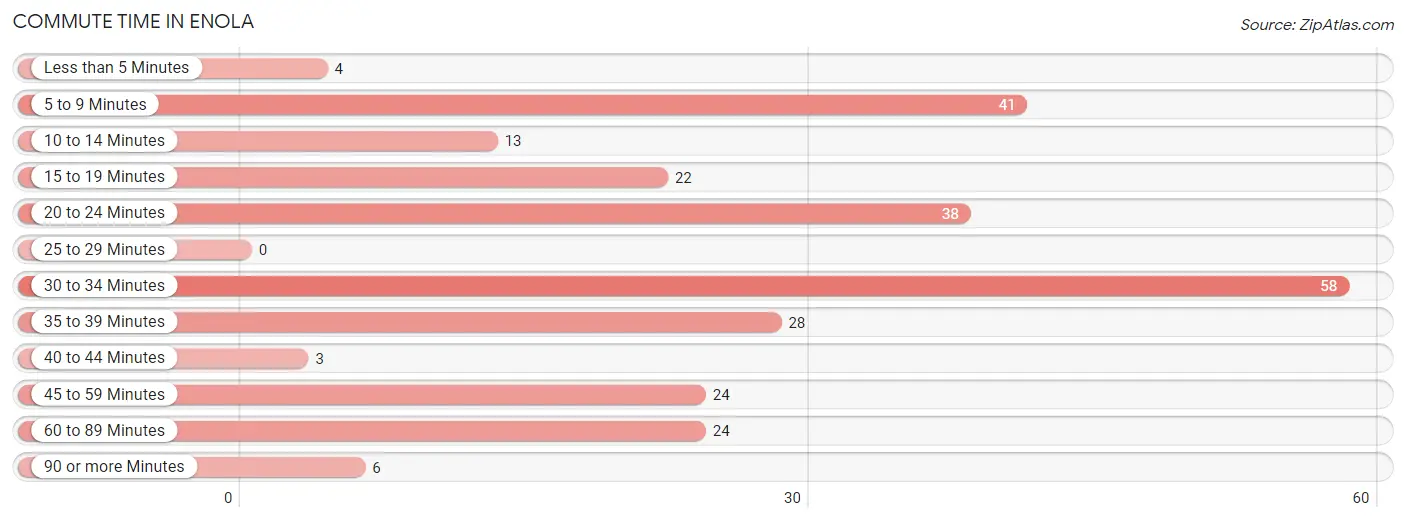
| Commute Time | # Commuters | % Commuters |
| Less than 5 Minutes | 4 | 1.5% |
| 5 to 9 Minutes | 41 | 15.7% |
| 10 to 14 Minutes | 13 | 5.0% |
| 15 to 19 Minutes | 22 | 8.4% |
| 20 to 24 Minutes | 38 | 14.6% |
| 25 to 29 Minutes | 0 | 0.0% |
| 30 to 34 Minutes | 58 | 22.2% |
| 35 to 39 Minutes | 28 | 10.7% |
| 40 to 44 Minutes | 3 | 1.1% |
| 45 to 59 Minutes | 24 | 9.2% |
| 60 to 89 Minutes | 24 | 9.2% |
| 90 or more Minutes | 6 | 2.3% |
Commute Time by Sex in Enola
The most common commute times in Enola are 20 to 24 minutes (22 commuters, 20.9%) for males and 5 to 9 minutes (41 commuters, 26.3%) for females.
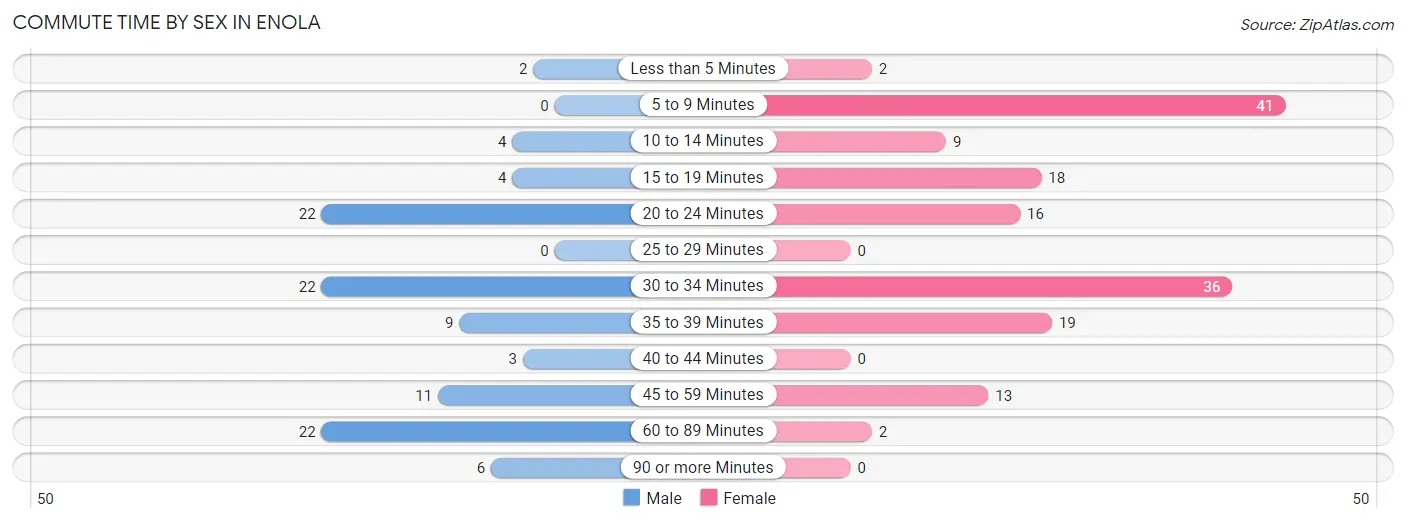
| Commute Time | Male | Female |
| Less than 5 Minutes | 2 (1.9%) | 2 (1.3%) |
| 5 to 9 Minutes | 0 (0.0%) | 41 (26.3%) |
| 10 to 14 Minutes | 4 (3.8%) | 9 (5.8%) |
| 15 to 19 Minutes | 4 (3.8%) | 18 (11.5%) |
| 20 to 24 Minutes | 22 (20.9%) | 16 (10.3%) |
| 25 to 29 Minutes | 0 (0.0%) | 0 (0.0%) |
| 30 to 34 Minutes | 22 (20.9%) | 36 (23.1%) |
| 35 to 39 Minutes | 9 (8.6%) | 19 (12.2%) |
| 40 to 44 Minutes | 3 (2.9%) | 0 (0.0%) |
| 45 to 59 Minutes | 11 (10.5%) | 13 (8.3%) |
| 60 to 89 Minutes | 22 (20.9%) | 2 (1.3%) |
| 90 or more Minutes | 6 (5.7%) | 0 (0.0%) |
Time of Departure to Work by Sex in Enola
The most frequent times of departure to work in Enola are 6:00 AM to 6:29 AM (27, 25.7%) for males and 7:00 AM to 7:29 AM (35, 22.4%) for females.
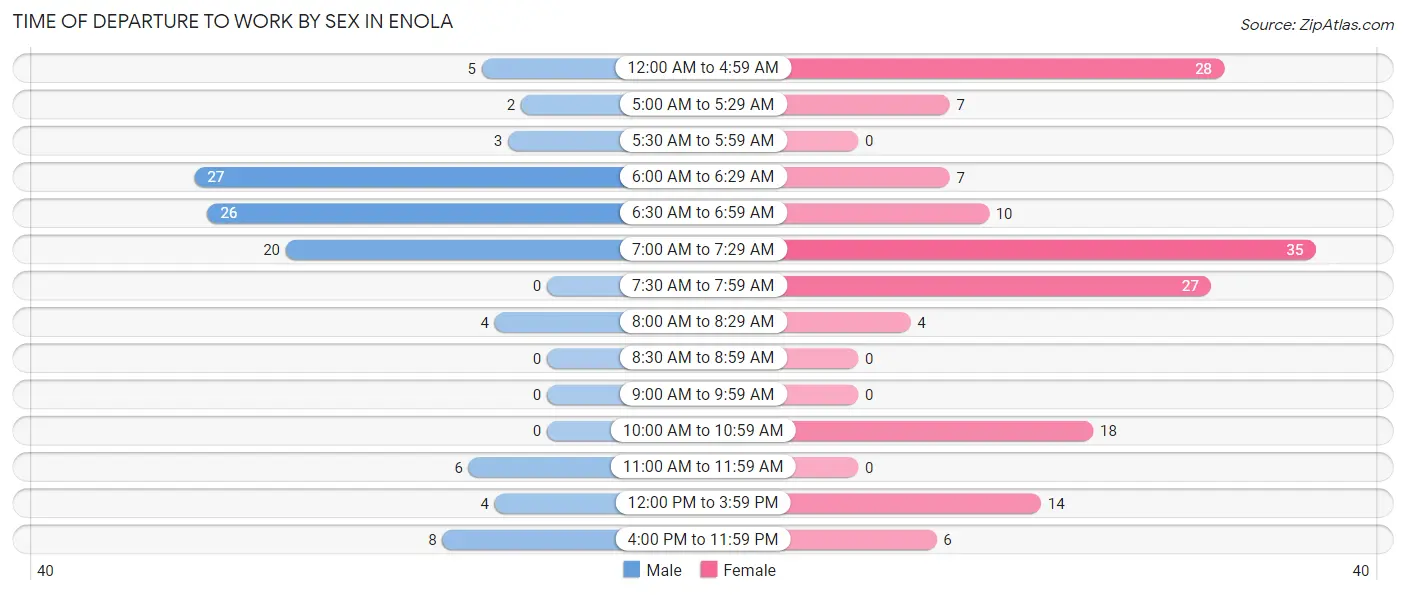
| Time of Departure | Male | Female |
| 12:00 AM to 4:59 AM | 5 (4.8%) | 28 (17.9%) |
| 5:00 AM to 5:29 AM | 2 (1.9%) | 7 (4.5%) |
| 5:30 AM to 5:59 AM | 3 (2.9%) | 0 (0.0%) |
| 6:00 AM to 6:29 AM | 27 (25.7%) | 7 (4.5%) |
| 6:30 AM to 6:59 AM | 26 (24.8%) | 10 (6.4%) |
| 7:00 AM to 7:29 AM | 20 (19.1%) | 35 (22.4%) |
| 7:30 AM to 7:59 AM | 0 (0.0%) | 27 (17.3%) |
| 8:00 AM to 8:29 AM | 4 (3.8%) | 4 (2.6%) |
| 8:30 AM to 8:59 AM | 0 (0.0%) | 0 (0.0%) |
| 9:00 AM to 9:59 AM | 0 (0.0%) | 0 (0.0%) |
| 10:00 AM to 10:59 AM | 0 (0.0%) | 18 (11.5%) |
| 11:00 AM to 11:59 AM | 6 (5.7%) | 0 (0.0%) |
| 12:00 PM to 3:59 PM | 4 (3.8%) | 14 (9.0%) |
| 4:00 PM to 11:59 PM | 8 (7.6%) | 6 (3.8%) |
| Total | 105 (100.0%) | 156 (100.0%) |
Housing Occupancy in Enola
Occupancy by Ownership in Enola
Of the total 219 dwellings in Enola, owner-occupied units account for 202 (92.2%), while renter-occupied units make up 17 (7.8%).
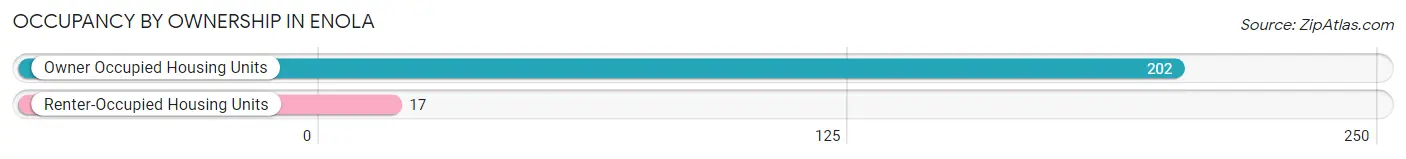
| Occupancy | # Housing Units | % Housing Units |
| Owner Occupied Housing Units | 202 | 92.2% |
| Renter-Occupied Housing Units | 17 | 7.8% |
| Total Occupied Housing Units | 219 | 100.0% |
Occupancy by Household Size in Enola
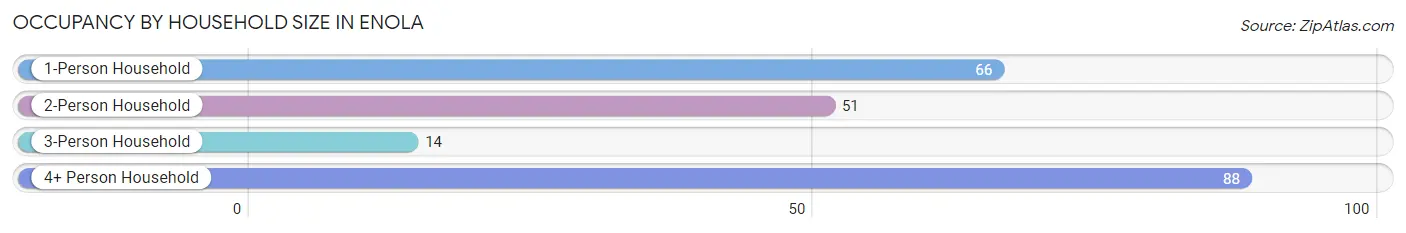
| Household Size | # Housing Units | % Housing Units |
| 1-Person Household | 66 | 30.1% |
| 2-Person Household | 51 | 23.3% |
| 3-Person Household | 14 | 6.4% |
| 4+ Person Household | 88 | 40.2% |
| Total Housing Units | 219 | 100.0% |
Occupancy by Ownership by Household Size in Enola
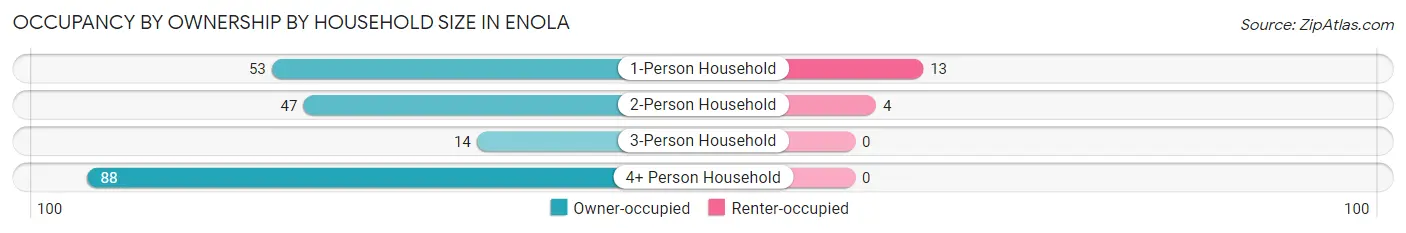
| Household Size | Owner-occupied | Renter-occupied |
| 1-Person Household | 53 (80.3%) | 13 (19.7%) |
| 2-Person Household | 47 (92.2%) | 4 (7.8%) |
| 3-Person Household | 14 (100.0%) | 0 (0.0%) |
| 4+ Person Household | 88 (100.0%) | 0 (0.0%) |
| Total Housing Units | 202 (92.2%) | 17 (7.8%) |
Occupancy by Educational Attainment in Enola
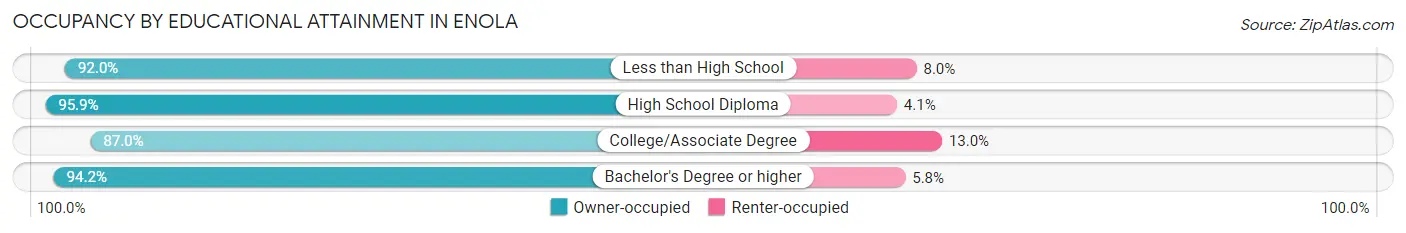
| Household Size | Owner-occupied | Renter-occupied |
| Less than High School | 23 (92.0%) | 2 (8.0%) |
| High School Diploma | 70 (95.9%) | 3 (4.1%) |
| College/Associate Degree | 60 (87.0%) | 9 (13.0%) |
| Bachelor's Degree or higher | 49 (94.2%) | 3 (5.8%) |
Occupancy by Age of Householder in Enola
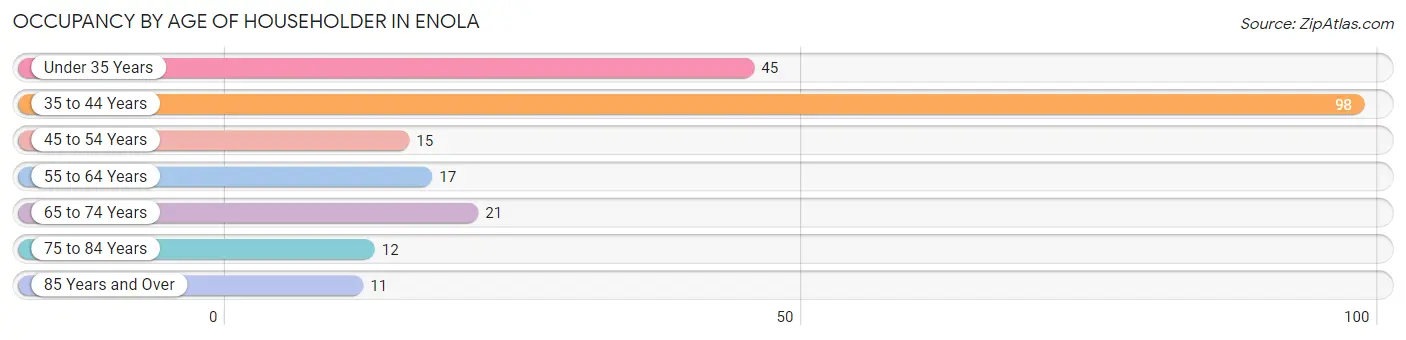
| Age Bracket | # Households | % Households |
| Under 35 Years | 45 | 20.5% |
| 35 to 44 Years | 98 | 44.8% |
| 45 to 54 Years | 15 | 6.9% |
| 55 to 64 Years | 17 | 7.8% |
| 65 to 74 Years | 21 | 9.6% |
| 75 to 84 Years | 12 | 5.5% |
| 85 Years and Over | 11 | 5.0% |
| Total | 219 | 100.0% |
Housing Finances in Enola
Median Income by Occupancy in Enola
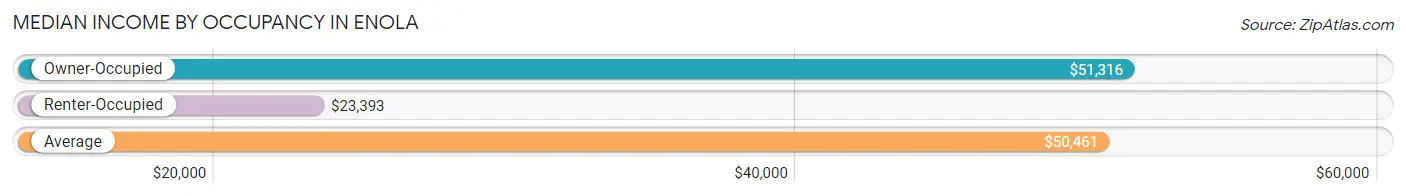
| Occupancy Type | # Households | Median Income |
| Owner-Occupied | 202 (92.2%) | $51,316 |
| Renter-Occupied | 17 (7.8%) | $23,393 |
| Average | 219 (100.0%) | $50,461 |
Occupancy by Householder Income Bracket in Enola
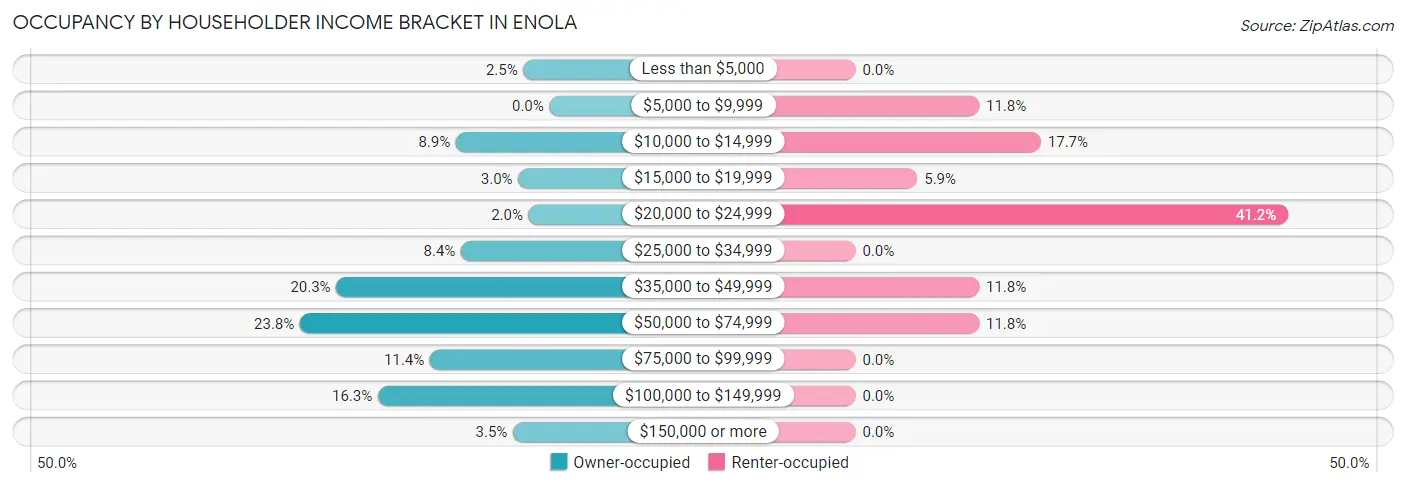
| Income Bracket | Owner-occupied | Renter-occupied |
| Less than $5,000 | 5 (2.5%) | 0 (0.0%) |
| $5,000 to $9,999 | 0 (0.0%) | 2 (11.8%) |
| $10,000 to $14,999 | 18 (8.9%) | 3 (17.6%) |
| $15,000 to $19,999 | 6 (3.0%) | 1 (5.9%) |
| $20,000 to $24,999 | 4 (2.0%) | 7 (41.2%) |
| $25,000 to $34,999 | 17 (8.4%) | 0 (0.0%) |
| $35,000 to $49,999 | 41 (20.3%) | 2 (11.8%) |
| $50,000 to $74,999 | 48 (23.8%) | 2 (11.8%) |
| $75,000 to $99,999 | 23 (11.4%) | 0 (0.0%) |
| $100,000 to $149,999 | 33 (16.3%) | 0 (0.0%) |
| $150,000 or more | 7 (3.5%) | 0 (0.0%) |
| Total | 202 (100.0%) | 17 (100.0%) |
Monthly Housing Cost Tiers in Enola
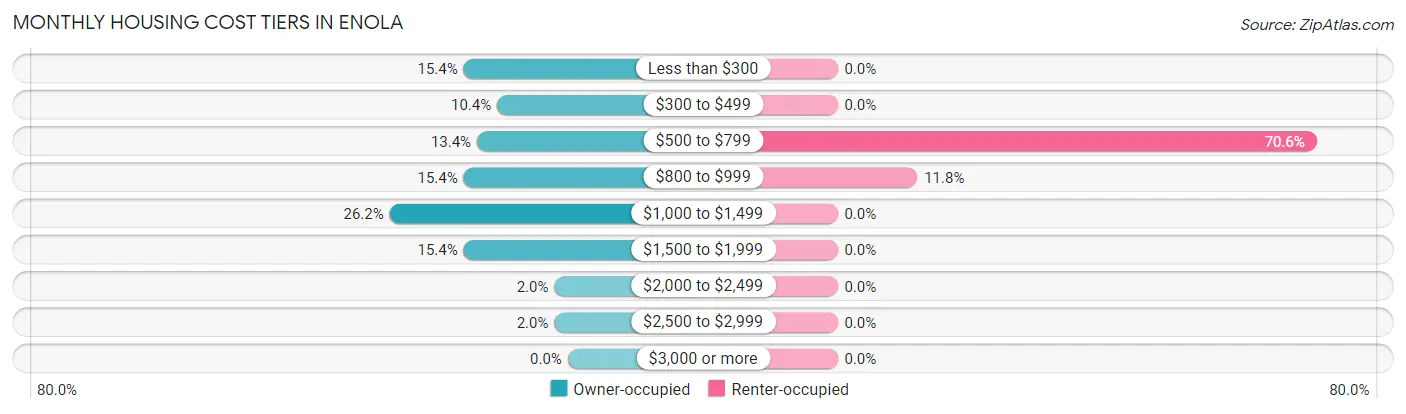
| Monthly Cost | Owner-occupied | Renter-occupied |
| Less than $300 | 31 (15.3%) | 0 (0.0%) |
| $300 to $499 | 21 (10.4%) | 0 (0.0%) |
| $500 to $799 | 27 (13.4%) | 12 (70.6%) |
| $800 to $999 | 31 (15.3%) | 2 (11.8%) |
| $1,000 to $1,499 | 53 (26.2%) | 0 (0.0%) |
| $1,500 to $1,999 | 31 (15.3%) | 0 (0.0%) |
| $2,000 to $2,499 | 4 (2.0%) | 0 (0.0%) |
| $2,500 to $2,999 | 4 (2.0%) | 0 (0.0%) |
| $3,000 or more | 0 (0.0%) | 0 (0.0%) |
| Total | 202 (100.0%) | 17 (100.0%) |
Physical Housing Characteristics in Enola
Housing Structures in Enola
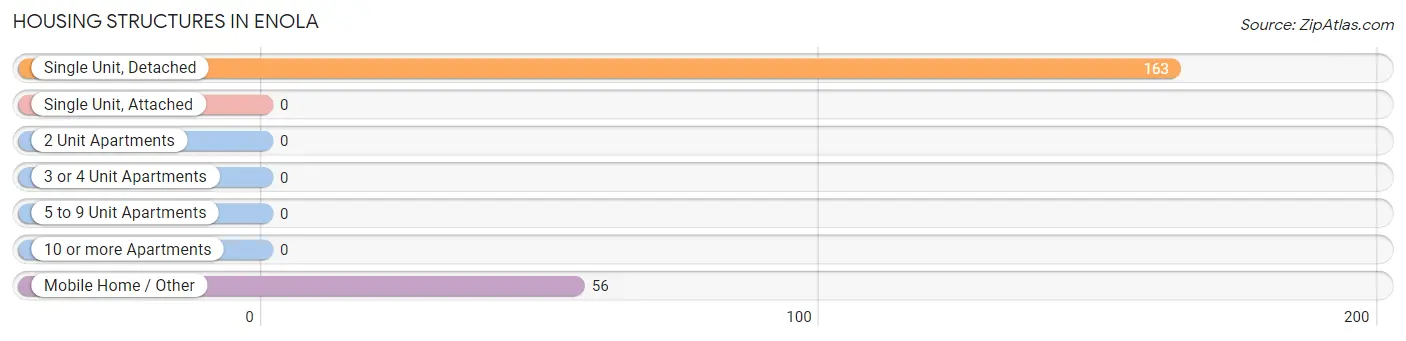
| Structure Type | # Housing Units | % Housing Units |
| Single Unit, Detached | 163 | 74.4% |
| Single Unit, Attached | 0 | 0.0% |
| 2 Unit Apartments | 0 | 0.0% |
| 3 or 4 Unit Apartments | 0 | 0.0% |
| 5 to 9 Unit Apartments | 0 | 0.0% |
| 10 or more Apartments | 0 | 0.0% |
| Mobile Home / Other | 56 | 25.6% |
| Total | 219 | 100.0% |
Housing Structures by Occupancy in Enola
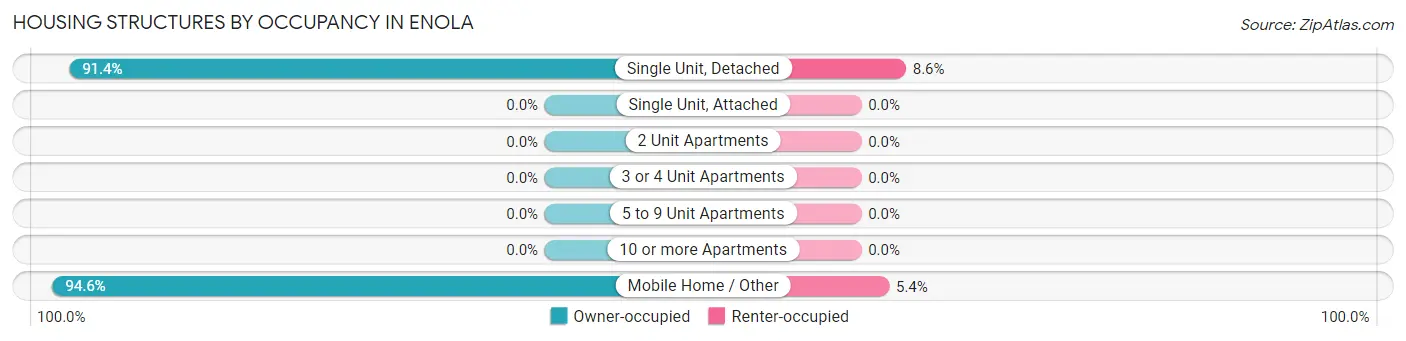
| Structure Type | Owner-occupied | Renter-occupied |
| Single Unit, Detached | 149 (91.4%) | 14 (8.6%) |
| Single Unit, Attached | 0 (0.0%) | 0 (0.0%) |
| 2 Unit Apartments | 0 (0.0%) | 0 (0.0%) |
| 3 or 4 Unit Apartments | 0 (0.0%) | 0 (0.0%) |
| 5 to 9 Unit Apartments | 0 (0.0%) | 0 (0.0%) |
| 10 or more Apartments | 0 (0.0%) | 0 (0.0%) |
| Mobile Home / Other | 53 (94.6%) | 3 (5.4%) |
| Total | 202 (92.2%) | 17 (7.8%) |
Housing Structures by Number of Rooms in Enola
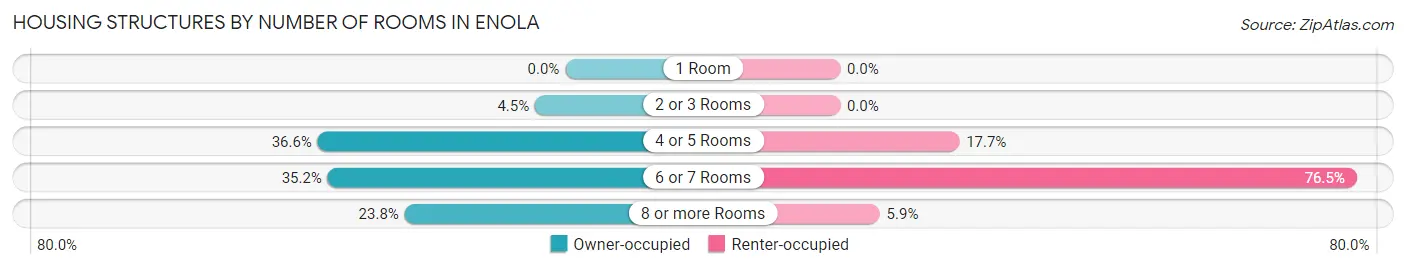
| Number of Rooms | Owner-occupied | Renter-occupied |
| 1 Room | 0 (0.0%) | 0 (0.0%) |
| 2 or 3 Rooms | 9 (4.5%) | 0 (0.0%) |
| 4 or 5 Rooms | 74 (36.6%) | 3 (17.6%) |
| 6 or 7 Rooms | 71 (35.1%) | 13 (76.5%) |
| 8 or more Rooms | 48 (23.8%) | 1 (5.9%) |
| Total | 202 (100.0%) | 17 (100.0%) |
Housing Structure by Heating Type in Enola
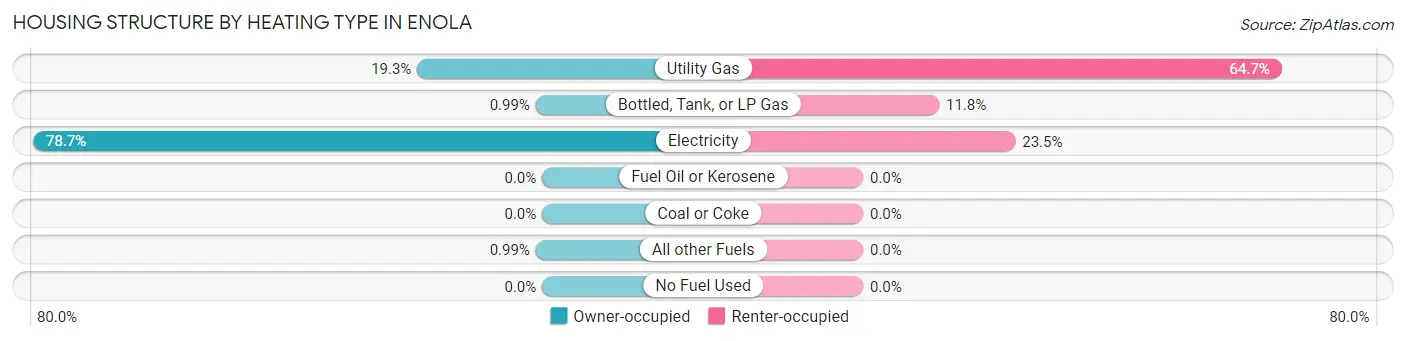
| Heating Type | Owner-occupied | Renter-occupied |
| Utility Gas | 39 (19.3%) | 11 (64.7%) |
| Bottled, Tank, or LP Gas | 2 (1.0%) | 2 (11.8%) |
| Electricity | 159 (78.7%) | 4 (23.5%) |
| Fuel Oil or Kerosene | 0 (0.0%) | 0 (0.0%) |
| Coal or Coke | 0 (0.0%) | 0 (0.0%) |
| All other Fuels | 2 (1.0%) | 0 (0.0%) |
| No Fuel Used | 0 (0.0%) | 0 (0.0%) |
| Total | 202 (100.0%) | 17 (100.0%) |
Household Vehicle Usage in Enola
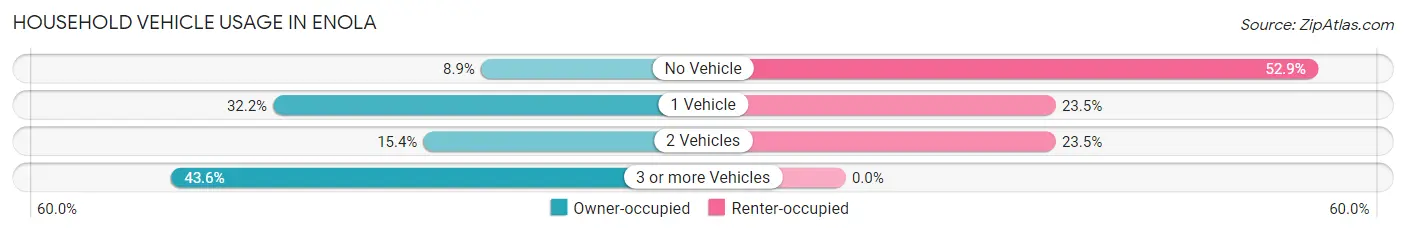
| Vehicles per Household | Owner-occupied | Renter-occupied |
| No Vehicle | 18 (8.9%) | 9 (52.9%) |
| 1 Vehicle | 65 (32.2%) | 4 (23.5%) |
| 2 Vehicles | 31 (15.3%) | 4 (23.5%) |
| 3 or more Vehicles | 88 (43.6%) | 0 (0.0%) |
| Total | 202 (100.0%) | 17 (100.0%) |
Real Estate & Mortgages in Enola
Real Estate and Mortgage Overview in Enola
| Characteristic | Without Mortgage | With Mortgage |
| Housing Units | 61 | 141 |
| Median Property Value | - | - |
| Median Household Income | $70,313 | $6 |
| Monthly Housing Costs | $296 | $0 |
| Real Estate Taxes | - | - |
Property Value by Mortgage Status in Enola
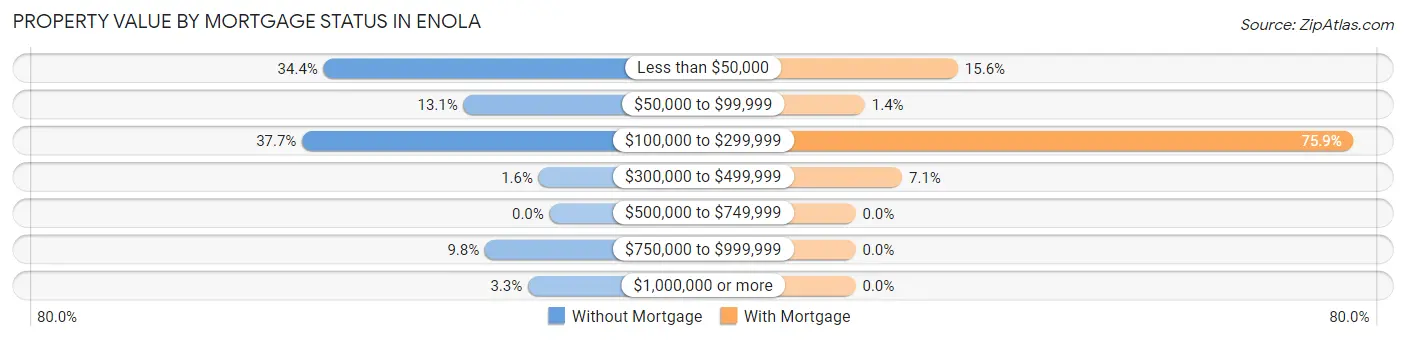
| Property Value | Without Mortgage | With Mortgage |
| Less than $50,000 | 21 (34.4%) | 22 (15.6%) |
| $50,000 to $99,999 | 8 (13.1%) | 2 (1.4%) |
| $100,000 to $299,999 | 23 (37.7%) | 107 (75.9%) |
| $300,000 to $499,999 | 1 (1.6%) | 10 (7.1%) |
| $500,000 to $749,999 | 0 (0.0%) | 0 (0.0%) |
| $750,000 to $999,999 | 6 (9.8%) | 0 (0.0%) |
| $1,000,000 or more | 2 (3.3%) | 0 (0.0%) |
| Total | 61 (100.0%) | 141 (100.0%) |
Household Income by Mortgage Status in Enola
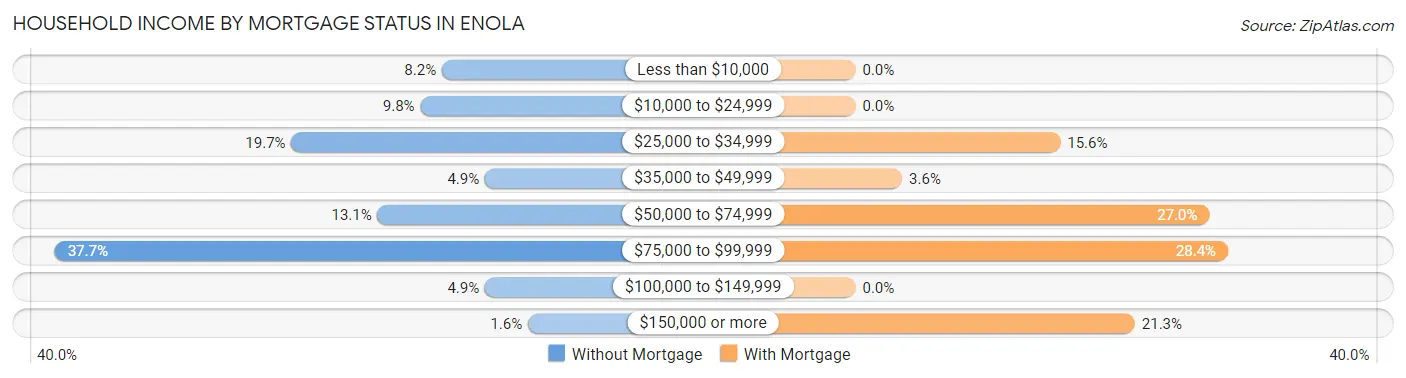
| Household Income | Without Mortgage | With Mortgage |
| Less than $10,000 | 5 (8.2%) | 0 (0.0%) |
| $10,000 to $24,999 | 6 (9.8%) | 0 (0.0%) |
| $25,000 to $34,999 | 12 (19.7%) | 22 (15.6%) |
| $35,000 to $49,999 | 3 (4.9%) | 5 (3.5%) |
| $50,000 to $74,999 | 8 (13.1%) | 38 (27.0%) |
| $75,000 to $99,999 | 23 (37.7%) | 40 (28.4%) |
| $100,000 to $149,999 | 3 (4.9%) | 0 (0.0%) |
| $150,000 or more | 1 (1.6%) | 30 (21.3%) |
| Total | 61 (100.0%) | 141 (100.0%) |
Property Value to Household Income Ratio in Enola
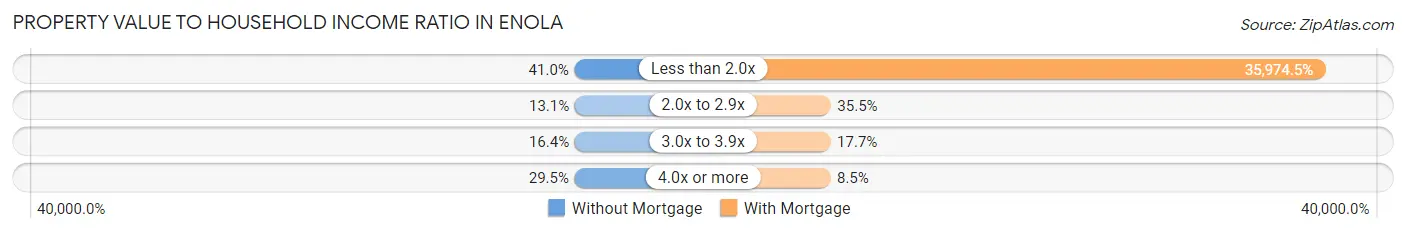
| Value-to-Income Ratio | Without Mortgage | With Mortgage |
| Less than 2.0x | 25 (41.0%) | 50,724 (35,974.5%) |
| 2.0x to 2.9x | 8 (13.1%) | 50 (35.5%) |
| 3.0x to 3.9x | 10 (16.4%) | 25 (17.7%) |
| 4.0x or more | 18 (29.5%) | 12 (8.5%) |
| Total | 61 (100.0%) | 141 (100.0%) |
Real Estate Taxes by Mortgage Status in Enola
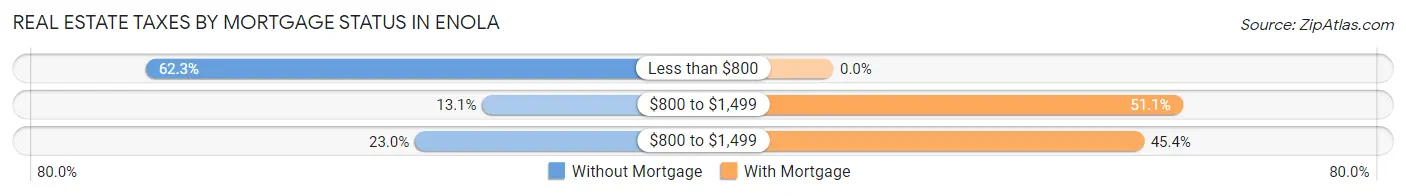
| Property Taxes | Without Mortgage | With Mortgage |
| Less than $800 | 38 (62.3%) | 0 (0.0%) |
| $800 to $1,499 | 8 (13.1%) | 72 (51.1%) |
| $800 to $1,499 | 14 (23.0%) | 64 (45.4%) |
| Total | 61 (100.0%) | 141 (100.0%) |
Health & Disability in Enola
Health Insurance Coverage by Age in Enola
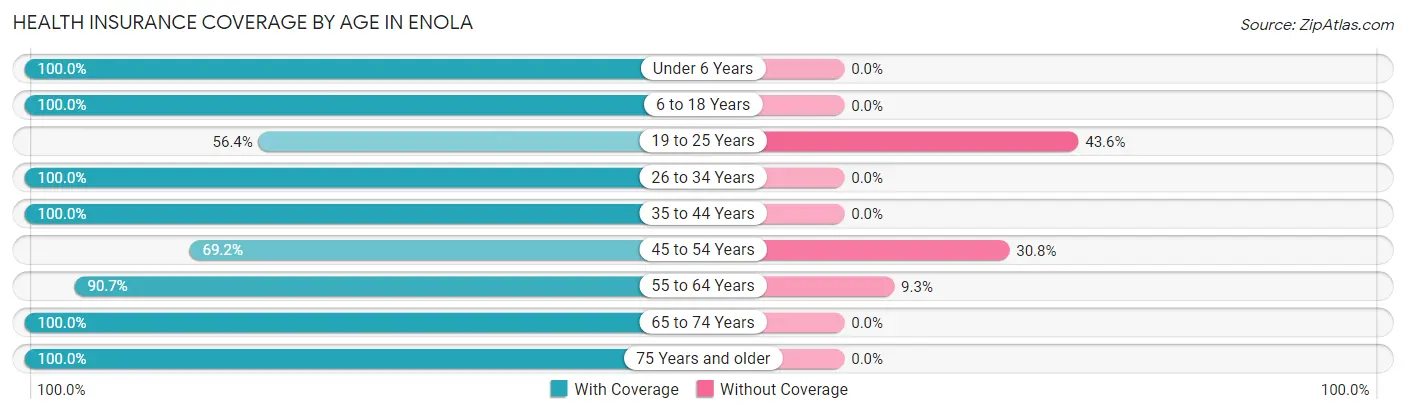
| Age Bracket | With Coverage | Without Coverage |
| Under 6 Years | 34 (100.0%) | 0 (0.0%) |
| 6 to 18 Years | 202 (100.0%) | 0 (0.0%) |
| 19 to 25 Years | 31 (56.4%) | 24 (43.6%) |
| 26 to 34 Years | 61 (100.0%) | 0 (0.0%) |
| 35 to 44 Years | 131 (100.0%) | 0 (0.0%) |
| 45 to 54 Years | 27 (69.2%) | 12 (30.8%) |
| 55 to 64 Years | 39 (90.7%) | 4 (9.3%) |
| 65 to 74 Years | 23 (100.0%) | 0 (0.0%) |
| 75 Years and older | 26 (100.0%) | 0 (0.0%) |
| Total | 574 (93.5%) | 40 (6.5%) |
Health Insurance Coverage by Citizenship Status in Enola
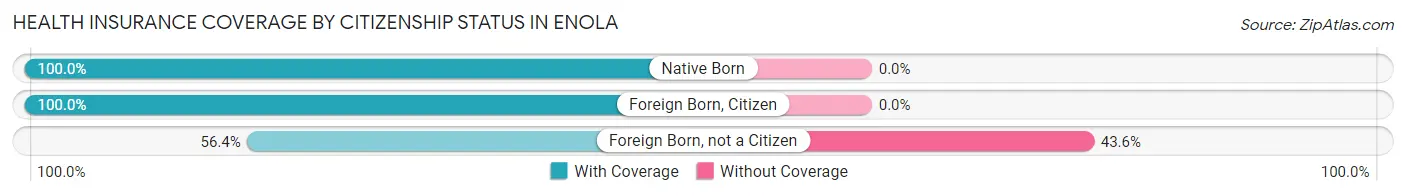
| Citizenship Status | With Coverage | Without Coverage |
| Native Born | 34 (100.0%) | 0 (0.0%) |
| Foreign Born, Citizen | 202 (100.0%) | 0 (0.0%) |
| Foreign Born, not a Citizen | 31 (56.4%) | 24 (43.6%) |
Health Insurance Coverage by Household Income in Enola
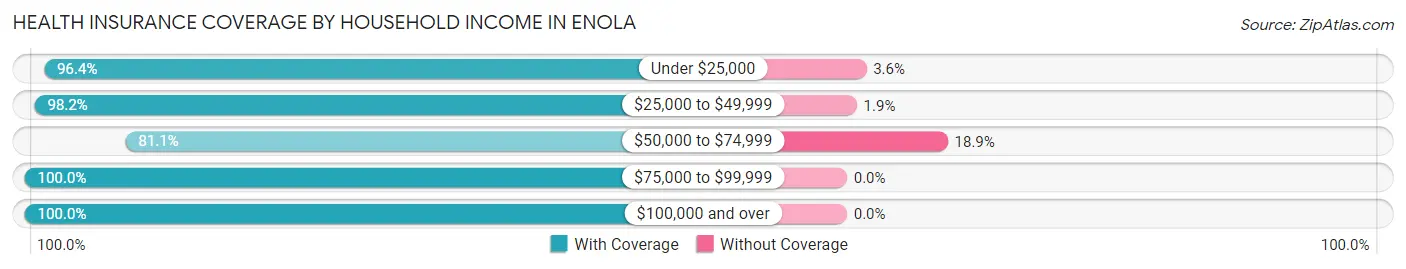
| Household Income | With Coverage | Without Coverage |
| Under $25,000 | 106 (96.4%) | 4 (3.6%) |
| $25,000 to $49,999 | 106 (98.2%) | 2 (1.8%) |
| $50,000 to $74,999 | 146 (81.1%) | 34 (18.9%) |
| $75,000 to $99,999 | 72 (100.0%) | 0 (0.0%) |
| $100,000 and over | 144 (100.0%) | 0 (0.0%) |
Public vs Private Health Insurance Coverage by Age in Enola
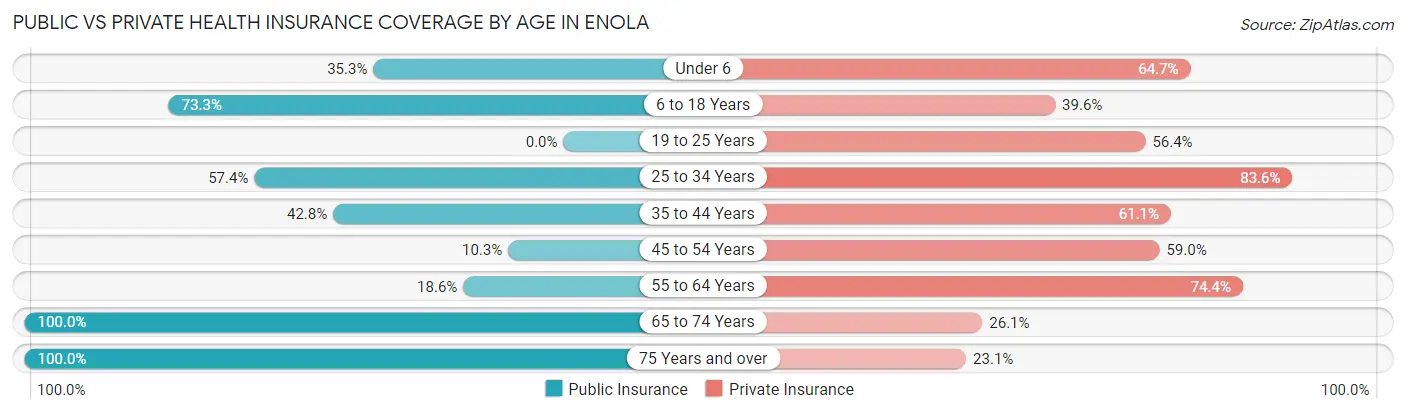
| Age Bracket | Public Insurance | Private Insurance |
| Under 6 | 12 (35.3%) | 22 (64.7%) |
| 6 to 18 Years | 148 (73.3%) | 80 (39.6%) |
| 19 to 25 Years | 0 (0.0%) | 31 (56.4%) |
| 25 to 34 Years | 35 (57.4%) | 51 (83.6%) |
| 35 to 44 Years | 56 (42.7%) | 80 (61.1%) |
| 45 to 54 Years | 4 (10.3%) | 23 (59.0%) |
| 55 to 64 Years | 8 (18.6%) | 32 (74.4%) |
| 65 to 74 Years | 23 (100.0%) | 6 (26.1%) |
| 75 Years and over | 26 (100.0%) | 6 (23.1%) |
| Total | 312 (50.8%) | 331 (53.9%) |
Disability Status by Sex by Age in Enola
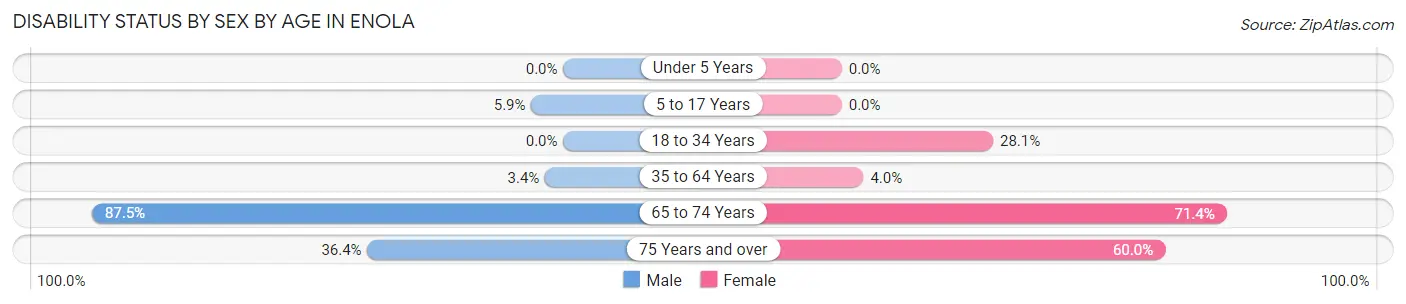
| Age Bracket | Male | Female |
| Under 5 Years | 0 (0.0%) | 0 (0.0%) |
| 5 to 17 Years | 6 (5.9%) | 0 (0.0%) |
| 18 to 34 Years | 0 (0.0%) | 16 (28.1%) |
| 35 to 64 Years | 3 (3.4%) | 5 (4.0%) |
| 65 to 74 Years | 14 (87.5%) | 5 (71.4%) |
| 75 Years and over | 4 (36.4%) | 9 (60.0%) |
Disability Class by Sex by Age in Enola
Disability Class: Hearing Difficulty
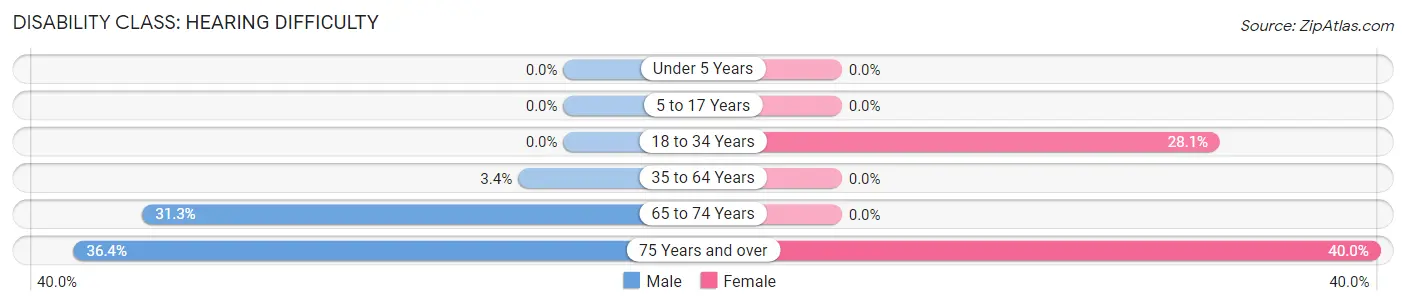
| Age Bracket | Male | Female |
| Under 5 Years | 0 (0.0%) | 0 (0.0%) |
| 5 to 17 Years | 0 (0.0%) | 0 (0.0%) |
| 18 to 34 Years | 0 (0.0%) | 16 (28.1%) |
| 35 to 64 Years | 3 (3.4%) | 0 (0.0%) |
| 65 to 74 Years | 5 (31.2%) | 0 (0.0%) |
| 75 Years and over | 4 (36.4%) | 6 (40.0%) |
Disability Class: Vision Difficulty
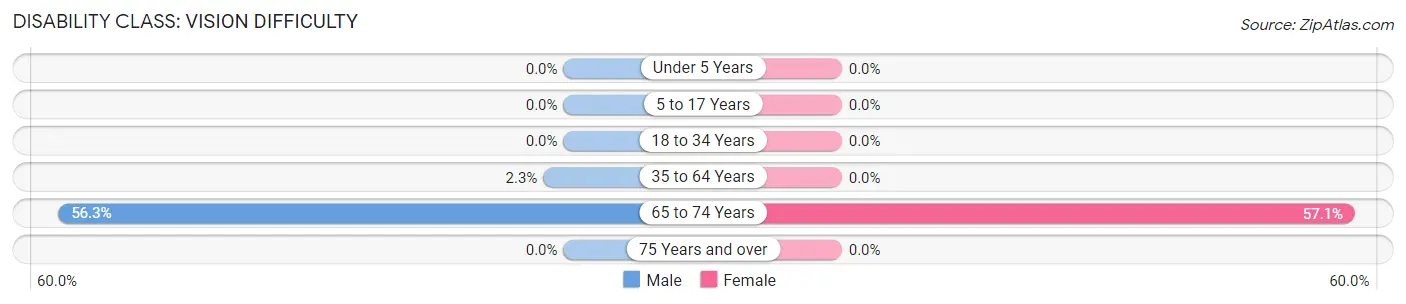
| Age Bracket | Male | Female |
| Under 5 Years | 0 (0.0%) | 0 (0.0%) |
| 5 to 17 Years | 0 (0.0%) | 0 (0.0%) |
| 18 to 34 Years | 0 (0.0%) | 0 (0.0%) |
| 35 to 64 Years | 2 (2.2%) | 0 (0.0%) |
| 65 to 74 Years | 9 (56.2%) | 4 (57.1%) |
| 75 Years and over | 0 (0.0%) | 0 (0.0%) |
Disability Class: Cognitive Difficulty
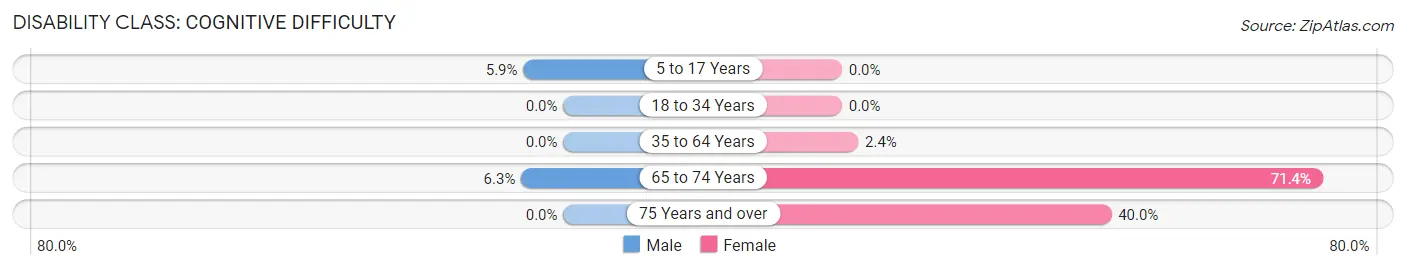
| Age Bracket | Male | Female |
| 5 to 17 Years | 6 (5.9%) | 0 (0.0%) |
| 18 to 34 Years | 0 (0.0%) | 0 (0.0%) |
| 35 to 64 Years | 0 (0.0%) | 3 (2.4%) |
| 65 to 74 Years | 1 (6.2%) | 5 (71.4%) |
| 75 Years and over | 0 (0.0%) | 6 (40.0%) |
Disability Class: Ambulatory Difficulty
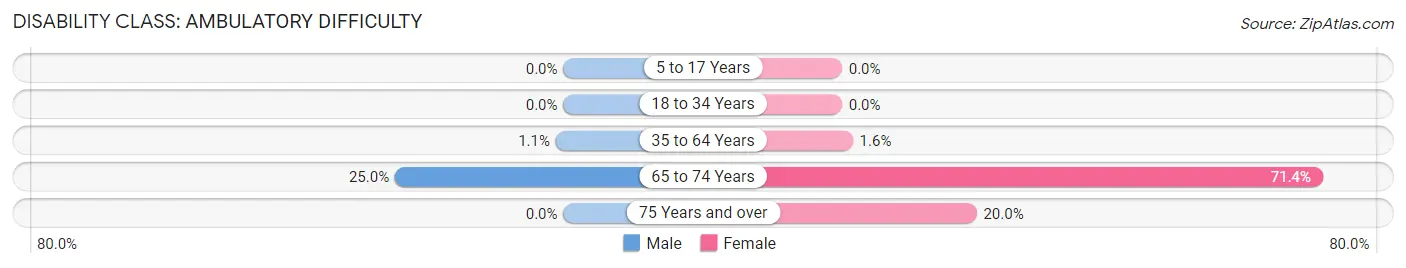
| Age Bracket | Male | Female |
| 5 to 17 Years | 0 (0.0%) | 0 (0.0%) |
| 18 to 34 Years | 0 (0.0%) | 0 (0.0%) |
| 35 to 64 Years | 1 (1.1%) | 2 (1.6%) |
| 65 to 74 Years | 4 (25.0%) | 5 (71.4%) |
| 75 Years and over | 0 (0.0%) | 3 (20.0%) |
Disability Class: Self-Care Difficulty
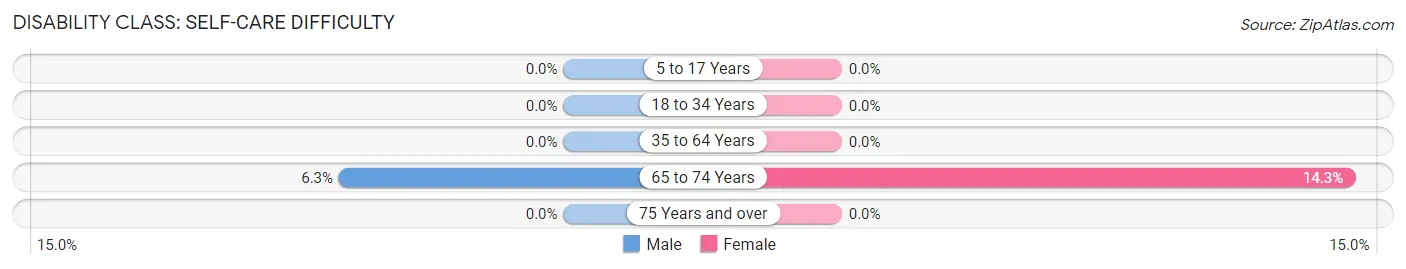
| Age Bracket | Male | Female |
| 5 to 17 Years | 0 (0.0%) | 0 (0.0%) |
| 18 to 34 Years | 0 (0.0%) | 0 (0.0%) |
| 35 to 64 Years | 0 (0.0%) | 0 (0.0%) |
| 65 to 74 Years | 1 (6.2%) | 1 (14.3%) |
| 75 Years and over | 0 (0.0%) | 0 (0.0%) |
Technology Access in Enola
Computing Device Access in Enola
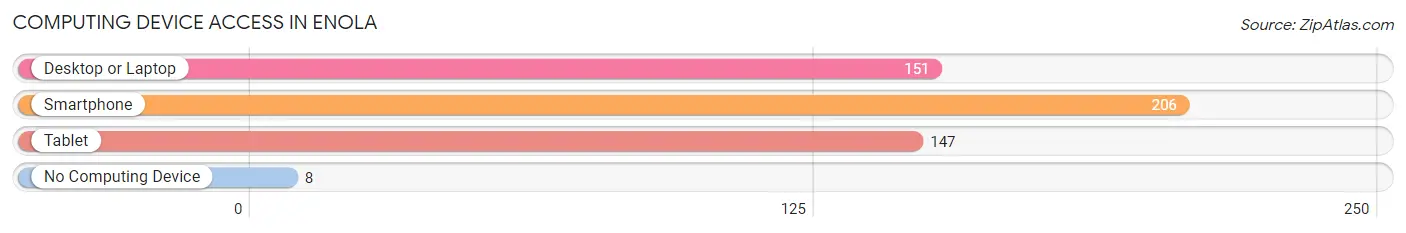
| Device Type | # Households | % Households |
| Desktop or Laptop | 151 | 69.0% |
| Smartphone | 206 | 94.1% |
| Tablet | 147 | 67.1% |
| No Computing Device | 8 | 3.6% |
| Total | 219 | 100.0% |
Internet Access in Enola
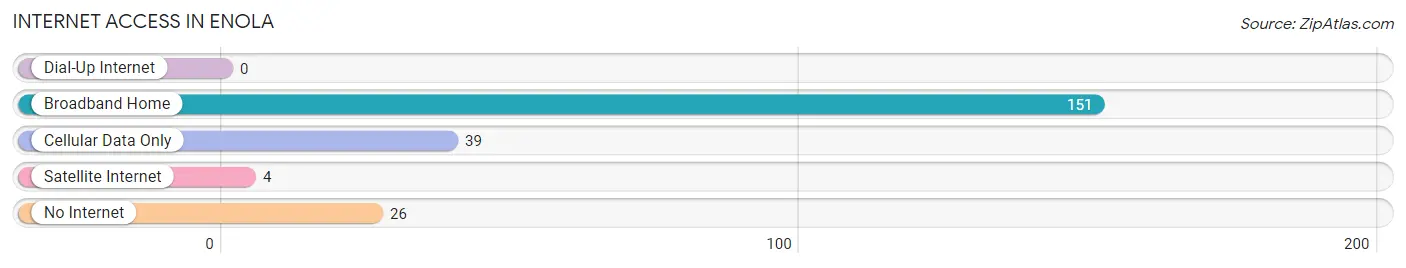
| Internet Type | # Households | % Households |
| Dial-Up Internet | 0 | 0.0% |
| Broadband Home | 151 | 69.0% |
| Cellular Data Only | 39 | 17.8% |
| Satellite Internet | 4 | 1.8% |
| No Internet | 26 | 11.9% |
| Total | 219 | 100.0% |
Enola Summary
Enola is a small town located in the foothills of the Ouachita Mountains in Faulkner County, Arkansas. It is situated about 10 miles east of Conway and about 25 miles north of Little Rock. The town was founded in 1883 and was named after the daughter of the first postmaster, Enola B. Smith.
Geography
Enola is located in the foothills of the Ouachita Mountains in Faulkner County, Arkansas. It is situated about 10 miles east of Conway and about 25 miles north of Little Rock. The town is located in the Central Arkansas region and is part of the Little Rock-North Little Rock-Conway Metropolitan Statistical Area. The town is situated on the banks of the Cadron Creek, which is a tributary of the Arkansas River. The town is surrounded by rolling hills and forests, and is known for its scenic beauty.
History
Enola was founded in 1883 and was named after the daughter of the first postmaster, Enola B. Smith. The town was originally a farming community, and the main crops grown were cotton, corn, and wheat. In the early 1900s, the town began to grow and develop, and by the 1920s, it had become a thriving community. The town was home to several businesses, including a bank, a hotel, a general store, and a sawmill.
In the 1950s, the town began to decline as many of its businesses closed and the population began to decline. In the 1970s, the town was revitalized with the opening of a new school and the construction of a new library. The town has since seen a resurgence in population and economic activity.
Economy
Enola’s economy is largely based on agriculture and tourism. The town is home to several farms, which produce a variety of crops, including cotton, corn, and wheat. The town is also home to several small businesses, including restaurants, retail stores, and service providers. The town is also home to several tourist attractions, including the Cadron Creek Nature Trail and the Enola Historic District.
Demographics
As of the 2010 census, Enola had a population of 1,072. The racial makeup of the town was 97.2% White, 0.7% African American, 0.3% Native American, 0.2% Asian, 0.1% Pacific Islander, 0.7% from other races, and 0.9% from two or more races. Hispanic or Latino of any race were 1.7% of the population.
The median household income in Enola was $37,500, and the median family income was $45,000. The per capita income for the town was $18,000. About 11.2% of families and 14.2% of the population were below the poverty line, including 18.2% of those under age 18 and 8.3% of those age 65 or over.
Conclusion
Enola is a small town located in the foothills of the Ouachita Mountains in Faulkner County, Arkansas. It was founded in 1883 and is known for its scenic beauty and its agricultural and tourist economy. The town has a population of 1,072 and a median household income of $37,500. The town is home to several farms, businesses, and tourist attractions, and is a popular destination for visitors to the area.
Common Questions
What is Per Capita Income in Enola?
Per Capita income in Enola is $22,642.
What is the Median Family Income in Enola?
Median Family Income in Enola is $56,806.
What is the Median Household income in Enola?
Median Household Income in Enola is $50,461.
What is Income or Wage Gap in Enola?
Income or Wage Gap in Enola is 36.2%.
Women in Enola earn 63.8 cents for every dollar earned by a man.
What is Inequality or Gini Index in Enola?
Inequality or Gini Index in Enola is 0.39.
What is the Total Population of Enola?
Total Population of Enola is 614.
What is the Total Male Population of Enola?
Total Male Population of Enola is 299.
What is the Total Female Population of Enola?
Total Female Population of Enola is 315.
What is the Ratio of Males per 100 Females in Enola?
There are 94.92 Males per 100 Females in Enola.
What is the Ratio of Females per 100 Males in Enola?
There are 105.35 Females per 100 Males in Enola.
What is the Median Population Age in Enola?
Median Population Age in Enola is 29.8 Years.
What is the Average Family Size in Enola
Average Family Size in Enola is 3.7 People.
What is the Average Household Size in Enola
Average Household Size in Enola is 2.8 People.
How Large is the Labor Force in Enola?
There are 289 People in the Labor Forcein in Enola.
What is the Percentage of People in the Labor Force in Enola?
61.5% of People are in the Labor Force in Enola.
What is the Unemployment Rate in Enola?
Unemployment Rate in Enola is 0.3%.