Egypt, AR Map & Demographics
Egypt Map
Egypt Overview
$21,237
PER CAPITA INCOME
$29,167
AVG FAMILY INCOME
$29,167
AVG HOUSEHOLD INCOME
10.2%
WAGE / INCOME GAP [ % ]
89.8¢/ $1
WAGE / INCOME GAP [ $ ]
0.42
INEQUALITY / GINI INDEX
73
TOTAL POPULATION
35
MALE POPULATION
38
FEMALE POPULATION
92.11
MALES / 100 FEMALES
108.57
FEMALES / 100 MALES
54.5
MEDIAN AGE
2.5
AVG FAMILY SIZE
2.0
AVG HOUSEHOLD SIZE
26
LABOR FORCE [ PEOPLE ]
38.2%
PERCENT IN LABOR FORCE
19.2%
UNEMPLOYMENT RATE
Egypt Zip Codes
Egypt Area Codes
Income in Egypt
Income Overview in Egypt
Per Capita Income in Egypt is $21,237, while median incomes of families and households are $29,167 and $29,167 respectively.
| Characteristic | Number | Measure |
| Per Capita Income | 73 | $21,237 |
| Median Family Income | 24 | $29,167 |
| Mean Family Income | 24 | $58,133 |
| Median Household Income | 36 | $29,167 |
| Mean Household Income | 36 | $47,358 |
| Income Deficit | 24 | $0 |
| Wage / Income Gap (%) | 73 | 10.18% |
| Wage / Income Gap ($) | 73 | 89.82¢ per $1 |
| Gini / Inequality Index | 73 | 0.42 |
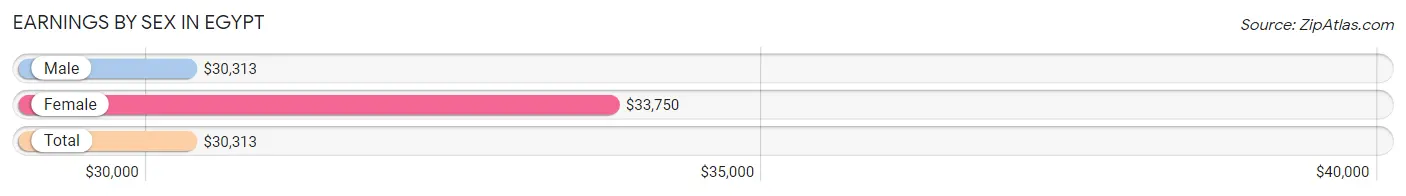
Earnings by Sex in Egypt
Average Earnings in Egypt are $30,313, $30,313 for men and $33,750 for women, a difference of 10.2%.
| Sex | Number | Average Earnings |
| Male | 17 (63.0%) | $30,313 |
| Female | 10 (37.0%) | $33,750 |
| Total | 27 (100.0%) | $30,313 |
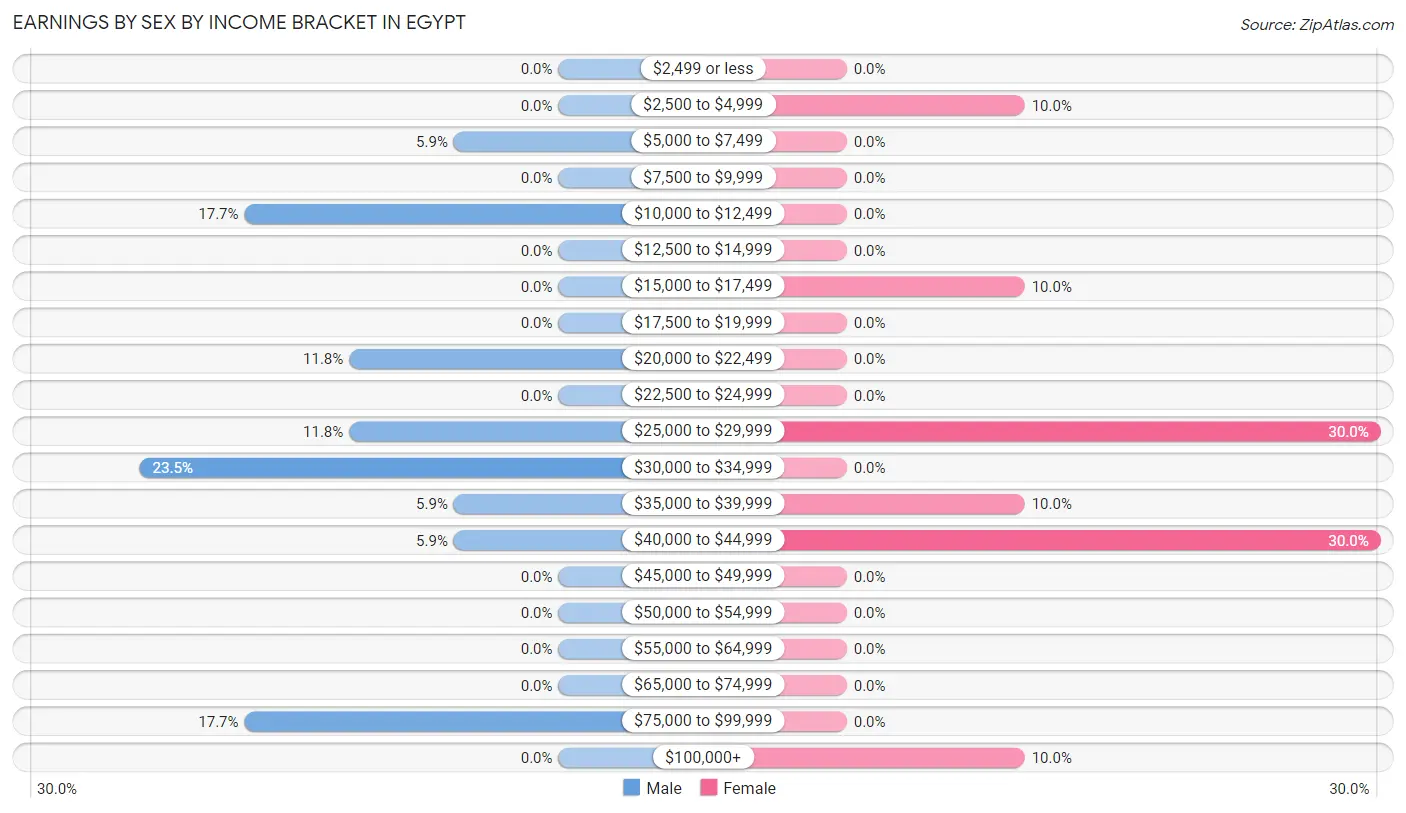
Earnings by Sex by Income Bracket in Egypt
The most common earnings brackets in Egypt are $30,000 to $34,999 for men (4 | 23.5%) and $25,000 to $29,999 for women (3 | 30.0%).
| Income | Male | Female |
| $2,499 or less | 0 (0.0%) | 0 (0.0%) |
| $2,500 to $4,999 | 0 (0.0%) | 1 (10.0%) |
| $5,000 to $7,499 | 1 (5.9%) | 0 (0.0%) |
| $7,500 to $9,999 | 0 (0.0%) | 0 (0.0%) |
| $10,000 to $12,499 | 3 (17.6%) | 0 (0.0%) |
| $12,500 to $14,999 | 0 (0.0%) | 0 (0.0%) |
| $15,000 to $17,499 | 0 (0.0%) | 1 (10.0%) |
| $17,500 to $19,999 | 0 (0.0%) | 0 (0.0%) |
| $20,000 to $22,499 | 2 (11.8%) | 0 (0.0%) |
| $22,500 to $24,999 | 0 (0.0%) | 0 (0.0%) |
| $25,000 to $29,999 | 2 (11.8%) | 3 (30.0%) |
| $30,000 to $34,999 | 4 (23.5%) | 0 (0.0%) |
| $35,000 to $39,999 | 1 (5.9%) | 1 (10.0%) |
| $40,000 to $44,999 | 1 (5.9%) | 3 (30.0%) |
| $45,000 to $49,999 | 0 (0.0%) | 0 (0.0%) |
| $50,000 to $54,999 | 0 (0.0%) | 0 (0.0%) |
| $55,000 to $64,999 | 0 (0.0%) | 0 (0.0%) |
| $65,000 to $74,999 | 0 (0.0%) | 0 (0.0%) |
| $75,000 to $99,999 | 3 (17.6%) | 0 (0.0%) |
| $100,000+ | 0 (0.0%) | 1 (10.0%) |
| Total | 17 (100.0%) | 10 (100.0%) |
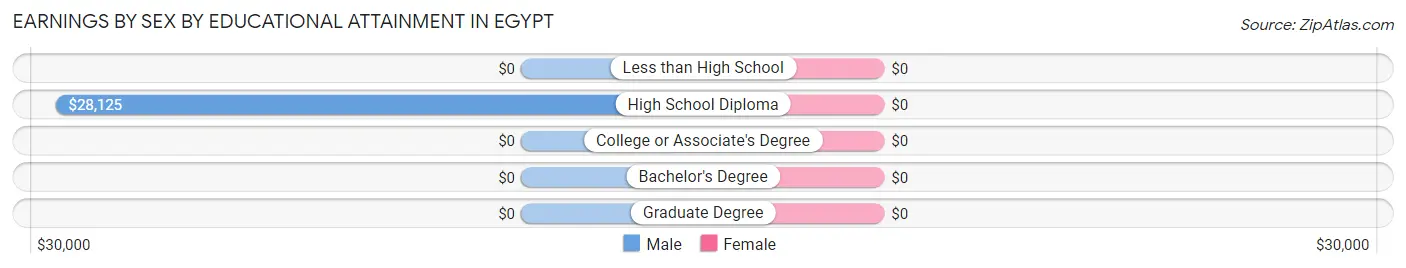
Earnings by Sex by Educational Attainment in Egypt
| Educational Attainment | Male Income | Female Income |
| Less than High School | - | - |
| High School Diploma | $28,125 | $0 |
| College or Associate's Degree | - | - |
| Bachelor's Degree | - | - |
| Graduate Degree | - | - |
| Total | $31,250 | $33,750 |
Family Income in Egypt
Family Income Brackets in Egypt
According to the Egypt family income data, there are 12 families falling into the $25,000 to $34,999 income range, which is the most common income bracket and makes up 50.0% of all families.
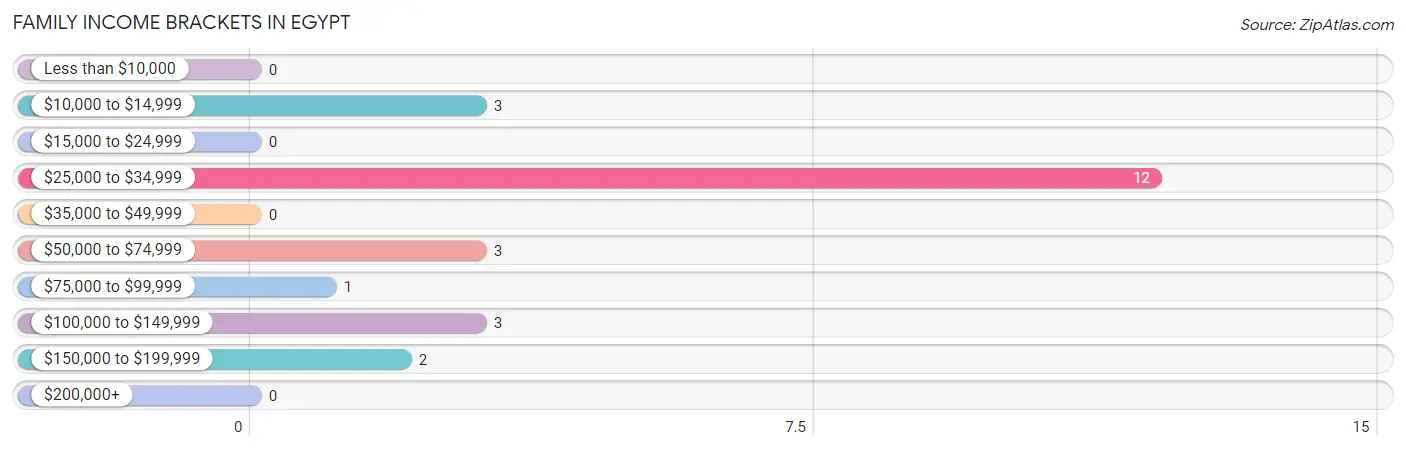
| Income Bracket | # Families | % Families |
| Less than $10,000 | 0 | 0.0% |
| $10,000 to $14,999 | 3 | 12.5% |
| $15,000 to $24,999 | 0 | 0.0% |
| $25,000 to $34,999 | 12 | 50.0% |
| $35,000 to $49,999 | 0 | 0.0% |
| $50,000 to $74,999 | 3 | 12.5% |
| $75,000 to $99,999 | 1 | 4.2% |
| $100,000 to $149,999 | 3 | 12.5% |
| $150,000 to $199,999 | 2 | 8.3% |
| $200,000+ | 0 | 0.0% |
Family Income by Famaliy Size in Egypt
2-person families (18 | 75.0%) account for the highest median family income in Egypt with $27,143 per family, while 2-person families (18 | 75.0%) have the highest median income of $13,572 per family member.
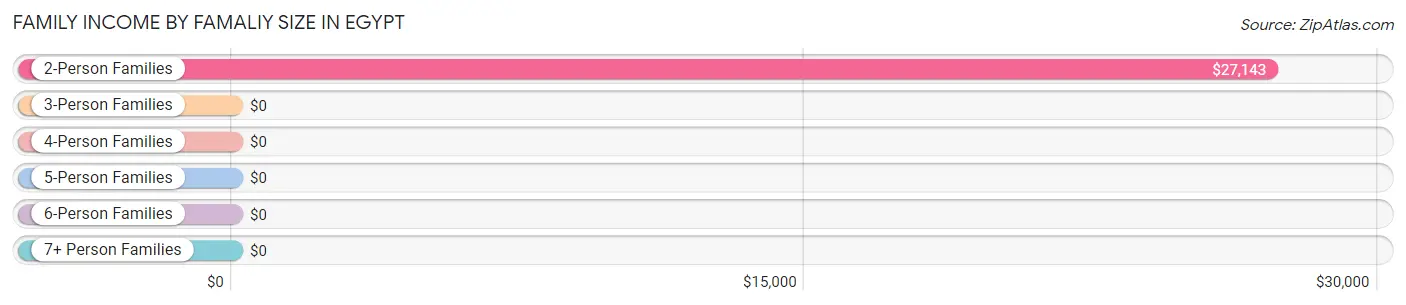
| Income Bracket | # Families | Median Income |
| 2-Person Families | 18 (75.0%) | $27,143 |
| 3-Person Families | 1 (4.2%) | $0 |
| 4-Person Families | 0 (0.0%) | $0 |
| 5-Person Families | 5 (20.8%) | $0 |
| 6-Person Families | 0 (0.0%) | $0 |
| 7+ Person Families | 0 (0.0%) | $0 |
| Total | 24 (100.0%) | $29,167 |
Family Income by Number of Earners in Egypt
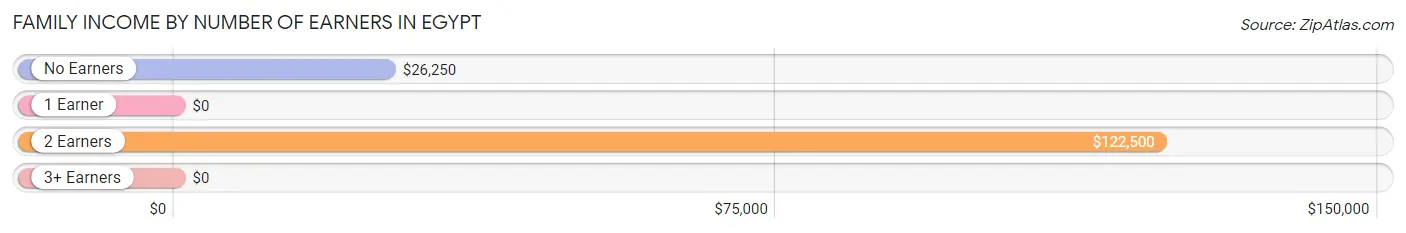
| Number of Earners | # Families | Median Income |
| No Earners | 13 (54.2%) | $26,250 |
| 1 Earner | 4 (16.7%) | $0 |
| 2 Earners | 4 (16.7%) | $122,500 |
| 3+ Earners | 3 (12.5%) | $0 |
| Total | 24 (100.0%) | $29,167 |
Household Income in Egypt
Household Income Brackets in Egypt
With 19 households falling in the category, the $25,000 to $34,999 income range is the most frequent in Egypt, accounting for 52.8% of all households.
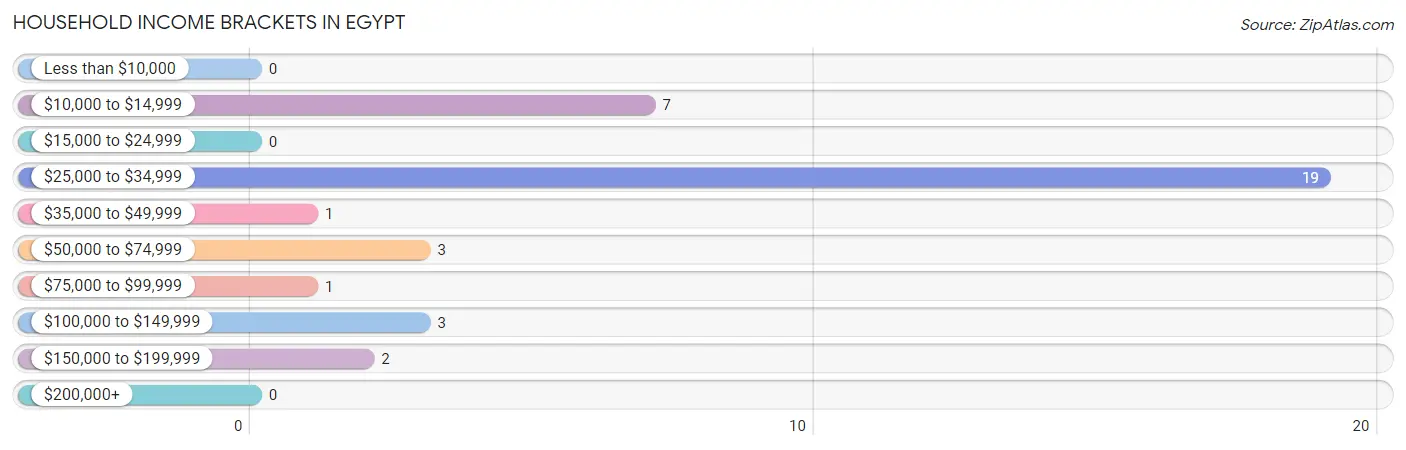
| Income Bracket | # Households | % Households |
| Less than $10,000 | 0 | 0.0% |
| $10,000 to $14,999 | 7 | 19.4% |
| $15,000 to $24,999 | 0 | 0.0% |
| $25,000 to $34,999 | 19 | 52.8% |
| $35,000 to $49,999 | 1 | 2.8% |
| $50,000 to $74,999 | 3 | 8.3% |
| $75,000 to $99,999 | 1 | 2.8% |
| $100,000 to $149,999 | 3 | 8.3% |
| $150,000 to $199,999 | 2 | 5.6% |
| $200,000+ | 0 | 0.0% |
Household Income by Householder Age in Egypt
The median household income in Egypt is $29,167, with the highest median household income of $50,000 found in the 45 to 64 years age bracket for the primary householder. A total of 8 households (22.2%) fall into this category.
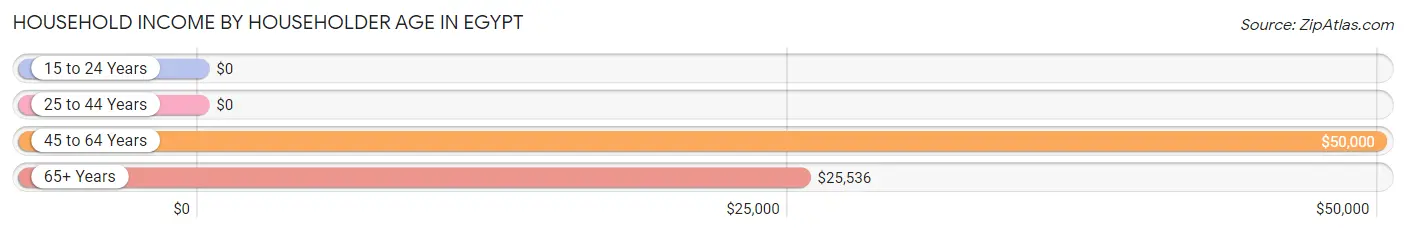
| Income Bracket | # Households | Median Income |
| 15 to 24 Years | 0 (0.0%) | $0 |
| 25 to 44 Years | 11 (30.6%) | $0 |
| 45 to 64 Years | 8 (22.2%) | $50,000 |
| 65+ Years | 17 (47.2%) | $25,536 |
| Total | 36 (100.0%) | $29,167 |
Poverty in Egypt
Income Below Poverty by Sex and Age in Egypt
With 8.6% poverty level for males and 23.7% for females among the residents of Egypt, 75 year old and over males and 45 to 54 year old females are the most vulnerable to poverty, with 3 males (33.3%) and 5 females (55.6%) in their respective age groups living below the poverty level.
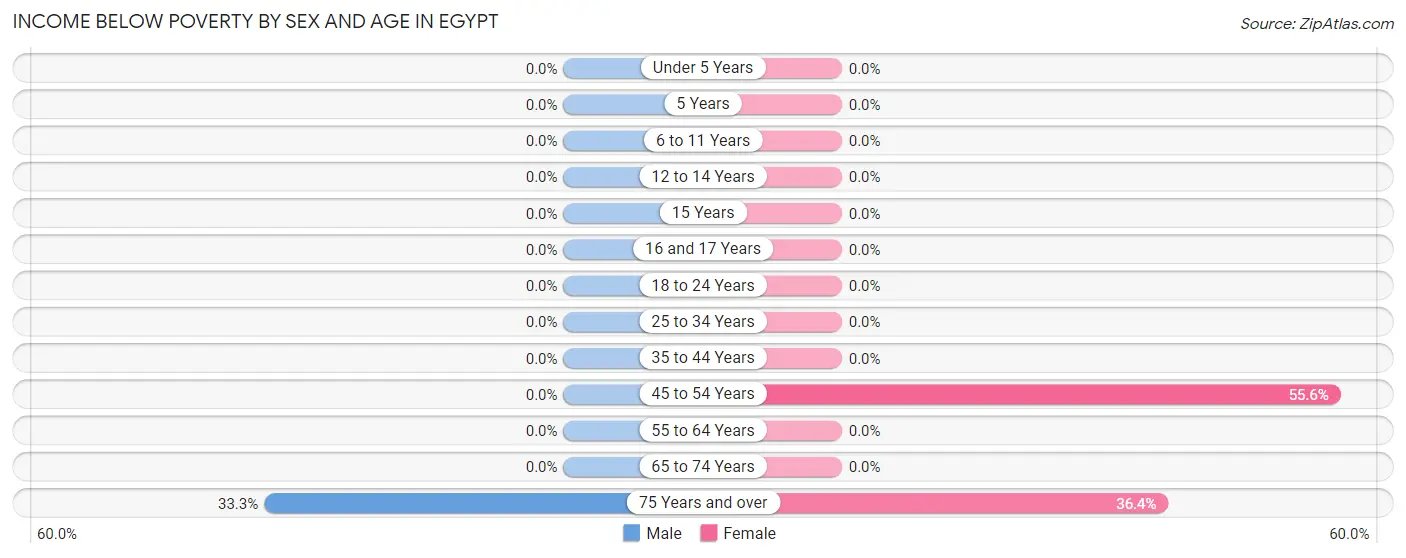
| Age Bracket | Male | Female |
| Under 5 Years | 0 (0.0%) | 0 (0.0%) |
| 5 Years | 0 (0.0%) | 0 (0.0%) |
| 6 to 11 Years | 0 (0.0%) | 0 (0.0%) |
| 12 to 14 Years | 0 (0.0%) | 0 (0.0%) |
| 15 Years | 0 (0.0%) | 0 (0.0%) |
| 16 and 17 Years | 0 (0.0%) | 0 (0.0%) |
| 18 to 24 Years | 0 (0.0%) | 0 (0.0%) |
| 25 to 34 Years | 0 (0.0%) | 0 (0.0%) |
| 35 to 44 Years | 0 (0.0%) | 0 (0.0%) |
| 45 to 54 Years | 0 (0.0%) | 5 (55.6%) |
| 55 to 64 Years | 0 (0.0%) | 0 (0.0%) |
| 65 to 74 Years | 0 (0.0%) | 0 (0.0%) |
| 75 Years and over | 3 (33.3%) | 4 (36.4%) |
| Total | 3 (8.6%) | 9 (23.7%) |
Income Above Poverty by Sex and Age in Egypt
According to the poverty statistics in Egypt, males aged 6 to 11 years and females aged 6 to 11 years are the age groups that are most secure financially, with 100.0% of males and 100.0% of females in these age groups living above the poverty line.
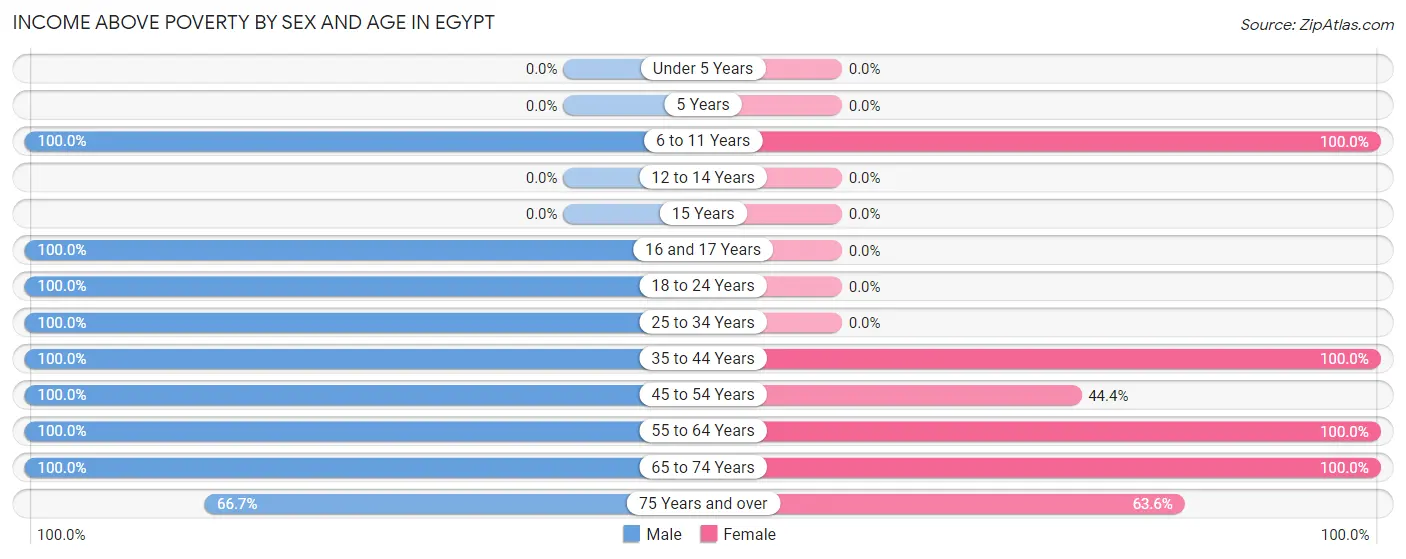
| Age Bracket | Male | Female |
| Under 5 Years | 0 (0.0%) | 0 (0.0%) |
| 5 Years | 0 (0.0%) | 0 (0.0%) |
| 6 to 11 Years | 2 (100.0%) | 3 (100.0%) |
| 12 to 14 Years | 0 (0.0%) | 0 (0.0%) |
| 15 Years | 0 (0.0%) | 0 (0.0%) |
| 16 and 17 Years | 2 (100.0%) | 0 (0.0%) |
| 18 to 24 Years | 3 (100.0%) | 0 (0.0%) |
| 25 to 34 Years | 4 (100.0%) | 0 (0.0%) |
| 35 to 44 Years | 4 (100.0%) | 6 (100.0%) |
| 45 to 54 Years | 4 (100.0%) | 4 (44.4%) |
| 55 to 64 Years | 4 (100.0%) | 4 (100.0%) |
| 65 to 74 Years | 3 (100.0%) | 5 (100.0%) |
| 75 Years and over | 6 (66.7%) | 7 (63.6%) |
| Total | 32 (91.4%) | 29 (76.3%) |
Income Below Poverty Among Married-Couple Families in Egypt
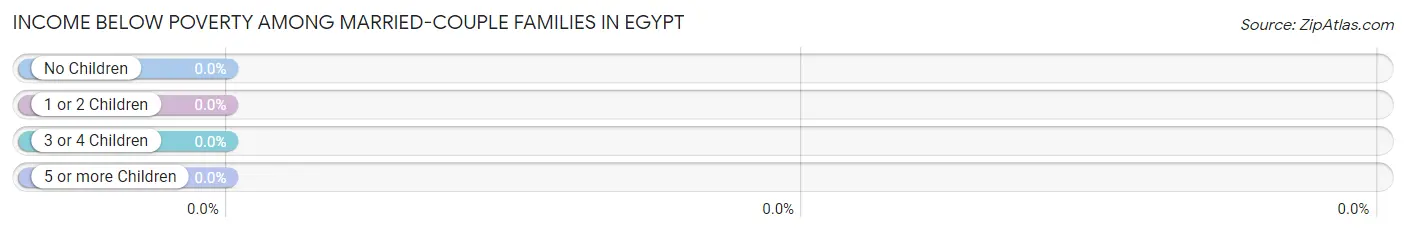
| Children | Above Poverty | Below Poverty |
| No Children | 16 (100.0%) | 0 (0.0%) |
| 1 or 2 Children | 5 (100.0%) | 0 (0.0%) |
| 3 or 4 Children | 0 (0.0%) | 0 (0.0%) |
| 5 or more Children | 0 (0.0%) | 0 (0.0%) |
| Total | 21 (100.0%) | 0 (0.0%) |
Income Below Poverty Among Single-Parent Households in Egypt
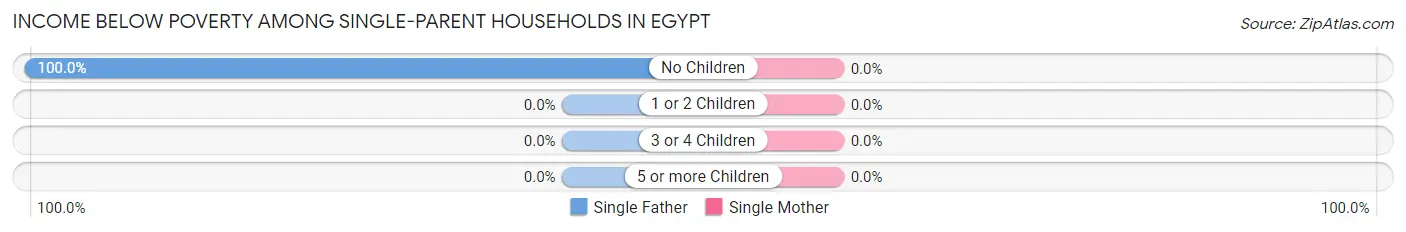
| Children | Single Father | Single Mother |
| No Children | 3 (100.0%) | 0 (0.0%) |
| 1 or 2 Children | 0 (0.0%) | 0 (0.0%) |
| 3 or 4 Children | 0 (0.0%) | 0 (0.0%) |
| 5 or more Children | 0 (0.0%) | 0 (0.0%) |
| Total | 3 (100.0%) | 0 (0.0%) |
Income Below Poverty Among Married-Couple vs Single-Parent Households in Egypt
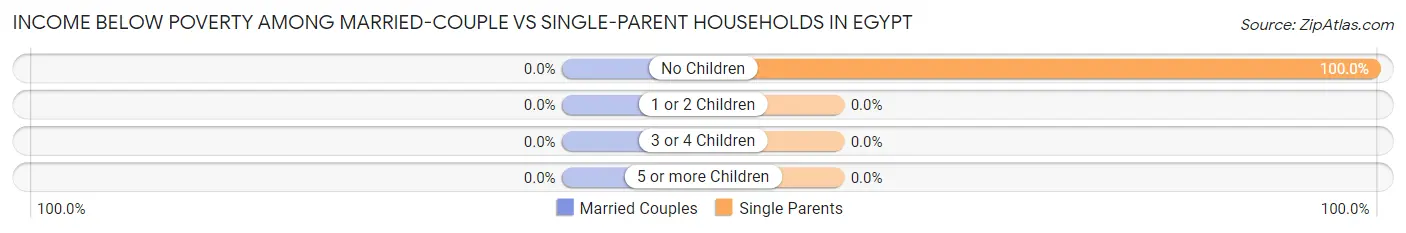
| Children | Married-Couple Families | Single-Parent Households |
| No Children | 0 (0.0%) | 3 (100.0%) |
| 1 or 2 Children | 0 (0.0%) | 0 (0.0%) |
| 3 or 4 Children | 0 (0.0%) | 0 (0.0%) |
| 5 or more Children | 0 (0.0%) | 0 (0.0%) |
| Total | 0 (0.0%) | 3 (100.0%) |
Race in Egypt
The most populous races in Egypt are White / Caucasian (71 | 97.3%), and Two or more Races (2 | 2.7%).
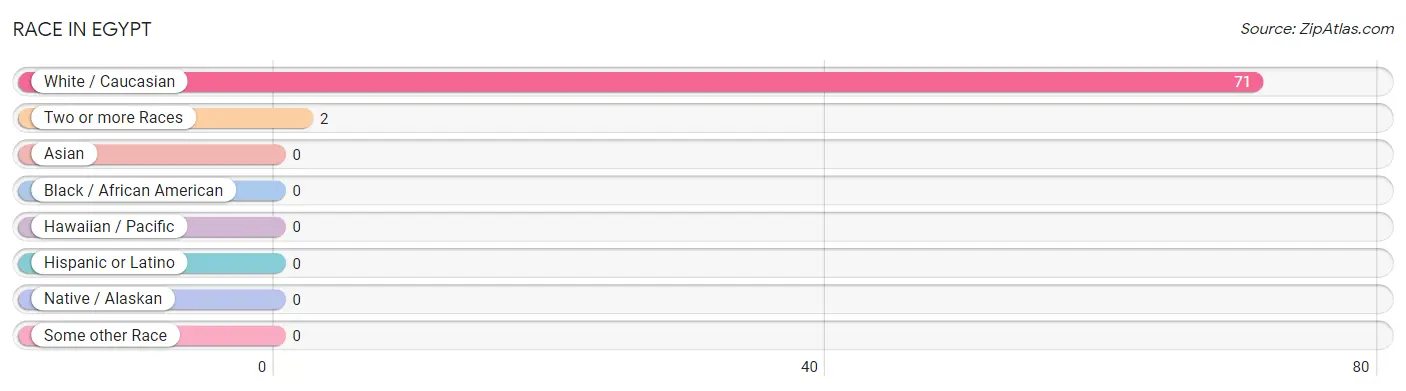
| Race | # Population | % Population |
| Asian | 0 | 0.0% |
| Black / African American | 0 | 0.0% |
| Hawaiian / Pacific | 0 | 0.0% |
| Hispanic or Latino | 0 | 0.0% |
| Native / Alaskan | 0 | 0.0% |
| White / Caucasian | 71 | 97.3% |
| Two or more Races | 2 | 2.7% |
| Some other Race | 0 | 0.0% |
| Total | 73 | 100.0% |
Ancestry in Egypt
The most populous ancestries reported in Egypt are American (18 | 24.7%), English (17 | 23.3%), Irish (8 | 11.0%), German (5 | 6.9%), and Cherokee (2 | 2.7%), together accounting for 68.5% of all Egypt residents.
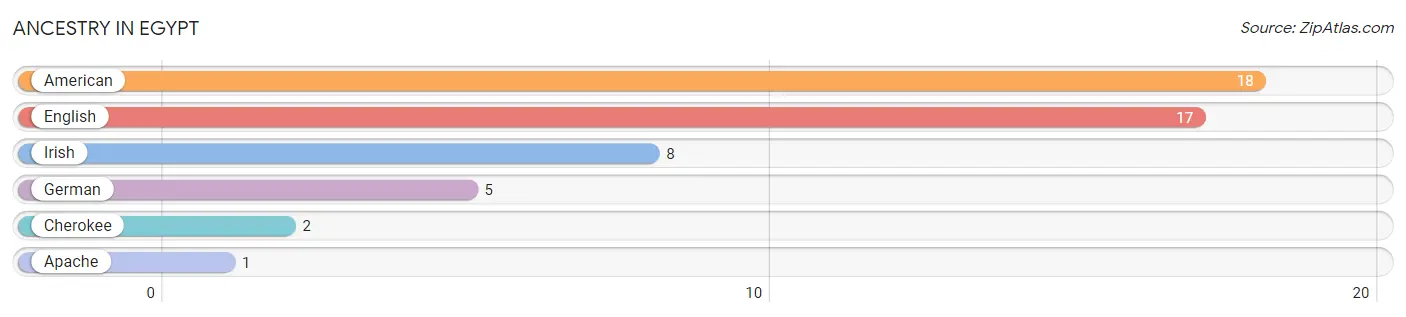
| Ancestry | # Population | % Population |
| American | 18 | 24.7% |
| Apache | 1 | 1.4% |
| Cherokee | 2 | 2.7% |
| English | 17 | 23.3% |
| German | 5 | 6.9% |
| Irish | 8 | 11.0% | View All 6 Rows |
Immigrants in Egypt

| Immigration Origin | # Population | % Population | View All 0 Rows |
Sex and Age in Egypt
Sex and Age in Egypt
The most populous age groups in Egypt are 75 to 79 Years (6 | 17.1%) for men and 75 to 79 Years (7 | 18.4%) for women.
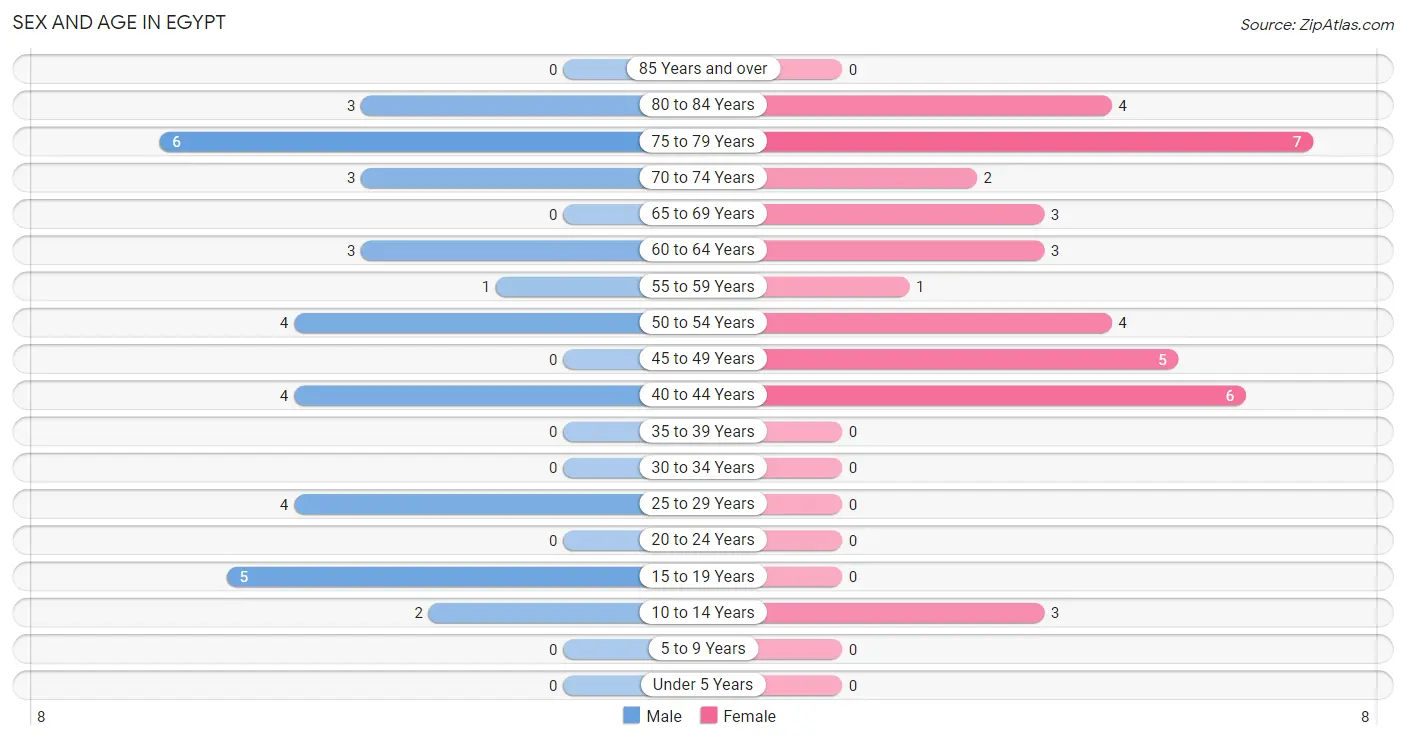
| Age Bracket | Male | Female |
| Under 5 Years | 0 (0.0%) | 0 (0.0%) |
| 5 to 9 Years | 0 (0.0%) | 0 (0.0%) |
| 10 to 14 Years | 2 (5.7%) | 3 (7.9%) |
| 15 to 19 Years | 5 (14.3%) | 0 (0.0%) |
| 20 to 24 Years | 0 (0.0%) | 0 (0.0%) |
| 25 to 29 Years | 4 (11.4%) | 0 (0.0%) |
| 30 to 34 Years | 0 (0.0%) | 0 (0.0%) |
| 35 to 39 Years | 0 (0.0%) | 0 (0.0%) |
| 40 to 44 Years | 4 (11.4%) | 6 (15.8%) |
| 45 to 49 Years | 0 (0.0%) | 5 (13.2%) |
| 50 to 54 Years | 4 (11.4%) | 4 (10.5%) |
| 55 to 59 Years | 1 (2.9%) | 1 (2.6%) |
| 60 to 64 Years | 3 (8.6%) | 3 (7.9%) |
| 65 to 69 Years | 0 (0.0%) | 3 (7.9%) |
| 70 to 74 Years | 3 (8.6%) | 2 (5.3%) |
| 75 to 79 Years | 6 (17.1%) | 7 (18.4%) |
| 80 to 84 Years | 3 (8.6%) | 4 (10.5%) |
| 85 Years and over | 0 (0.0%) | 0 (0.0%) |
| Total | 35 (100.0%) | 38 (100.0%) |
Families and Households in Egypt
Median Family Size in Egypt
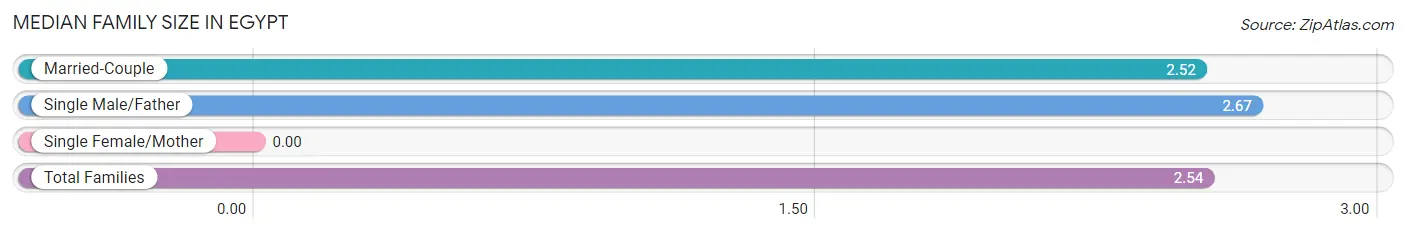
| Family Type | # Families | Family Size |
| Married-Couple | 21 (87.5%) | 2.52 |
| Single Male/Father | 3 (12.5%) | 2.67 |
| Single Female/Mother | 0 (0.0%) | - |
| Total Families | 24 (100.0%) | 2.54 |
Median Household Size in Egypt
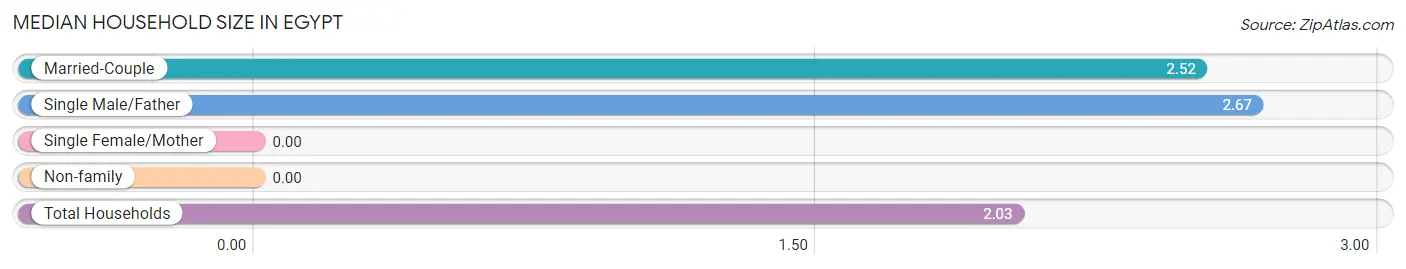
| Household Type | # Households | Household Size |
| Married-Couple | 21 (58.3%) | 2.52 |
| Single Male/Father | 3 (8.3%) | 2.67 |
| Single Female/Mother | 0 (0.0%) | - |
| Non-family | 12 (33.3%) | - |
| Total Households | 36 (100.0%) | 2.03 |
Household Size by Marriage Status in Egypt
Out of a total of 36 households in Egypt, 24 (66.7%) are family households, while 12 (33.3%) are nonfamily households. The most numerous type of family households are 2-person households, comprising 18, and the most common type of nonfamily households are 1-person households, comprising 12.
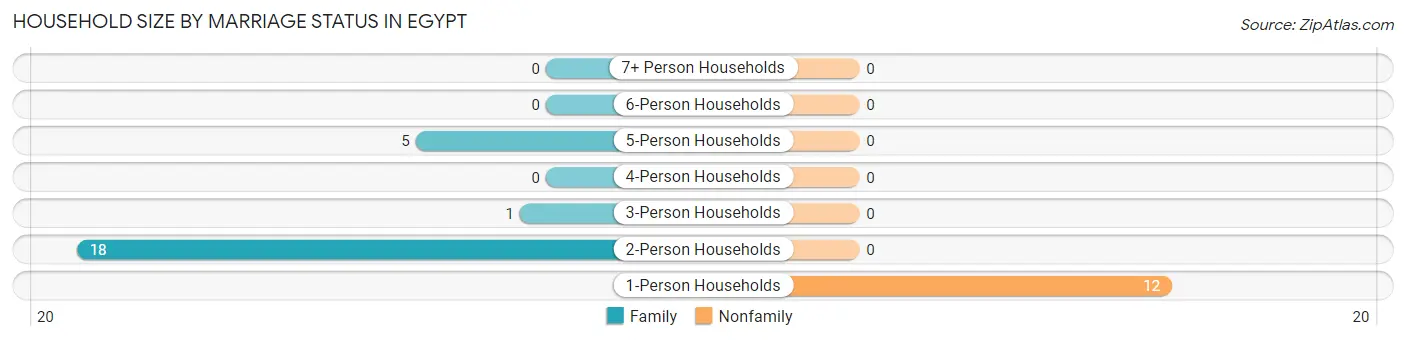
| Household Size | Family Households | Nonfamily Households |
| 1-Person Households | - | 12 (33.3%) |
| 2-Person Households | 18 (50.0%) | 0 (0.0%) |
| 3-Person Households | 1 (2.8%) | 0 (0.0%) |
| 4-Person Households | 0 (0.0%) | 0 (0.0%) |
| 5-Person Households | 5 (13.9%) | 0 (0.0%) |
| 6-Person Households | 0 (0.0%) | 0 (0.0%) |
| 7+ Person Households | 0 (0.0%) | 0 (0.0%) |
| Total | 24 (66.7%) | 12 (33.3%) |
Female Fertility in Egypt
Fertility by Age in Egypt
| Age Bracket | Women with Births | Births / 1,000 Women |
| 15 to 19 years | 0 (0.0%) | 0.0 |
| 20 to 34 years | 0 (0.0%) | 0.0 |
| 35 to 50 years | 0 (0.0%) | 0.0 |
| Total | 0 (0.0%) | 0.0 |
Fertility by Age by Marriage Status in Egypt
| Age Bracket | Married | Unmarried |
| 15 to 19 years | 0 (0.0%) | 0 (0.0%) |
| 20 to 34 years | 0 (0.0%) | 0 (0.0%) |
| 35 to 50 years | 0 (0.0%) | 0 (0.0%) |
| Total | 0 (0.0%) | 0 (0.0%) |
Fertility by Education in Egypt
| Educational Attainment | Women with Births | Births / 1,000 Women |
| Less than High School | 0 (0.0%) | 0.0 |
| High School Diploma | 0 (0.0%) | 0.0 |
| College or Associate's Degree | 0 (0.0%) | 0.0 |
| Bachelor's Degree | 0 (0.0%) | 0.0 |
| Graduate Degree | 0 (0.0%) | 0.0 |
| Total | 0 (0.0%) | 0.0 |
Fertility by Education by Marriage Status in Egypt
| Educational Attainment | Married | Unmarried |
| Less than High School | 0 (0.0%) | 0 (0.0%) |
| High School Diploma | 0 (0.0%) | 0 (0.0%) |
| College or Associate's Degree | 0 (0.0%) | 0 (0.0%) |
| Bachelor's Degree | 0 (0.0%) | 0 (0.0%) |
| Graduate Degree | 0 (0.0%) | 0 (0.0%) |
| Total | 0 (0.0%) | 0 (0.0%) |
Employment Characteristics in Egypt
Employment by Class of Employer in Egypt
Among the 21 employed individuals in Egypt, private company employees (16 | 76.2%), state government employees (4 | 19.1%), and not-for-profit organizations (1 | 4.8%) make up the most common classes of employment.
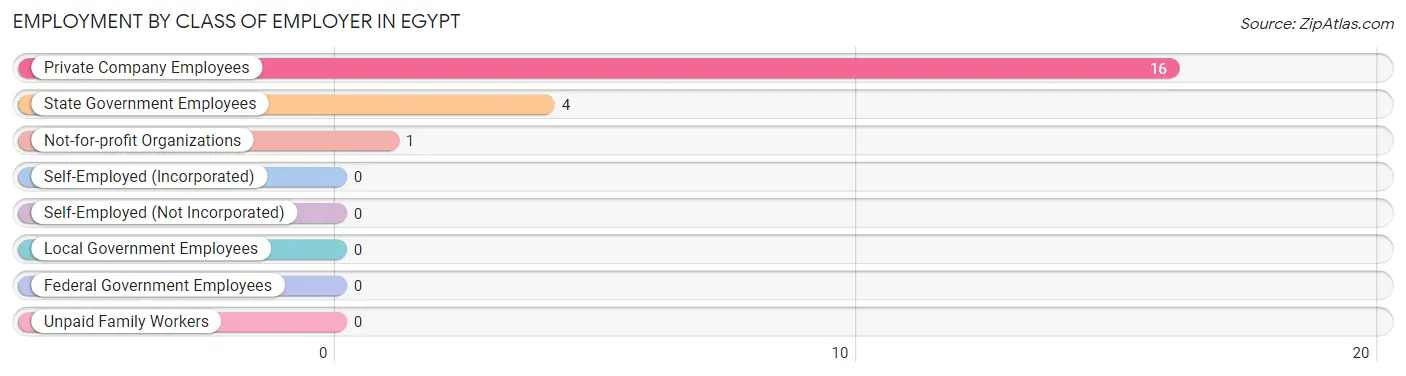
| Employer Class | # Employees | % Employees |
| Private Company Employees | 16 | 76.2% |
| Self-Employed (Incorporated) | 0 | 0.0% |
| Self-Employed (Not Incorporated) | 0 | 0.0% |
| Not-for-profit Organizations | 1 | 4.8% |
| Local Government Employees | 0 | 0.0% |
| State Government Employees | 4 | 19.1% |
| Federal Government Employees | 0 | 0.0% |
| Unpaid Family Workers | 0 | 0.0% |
| Total | 21 | 100.0% |
Employment Status by Age in Egypt
According to the labor force statistics for Egypt, out of the total population over 16 years of age (68), 38.2% or 26 individuals are in the labor force, with 19.2% or 5 of them unemployed. The age group with the highest labor force participation rate is 25 to 29 years, with 100.0% or 4 individuals in the labor force. Within the labor force, the 16 to 19 years age range has the highest percentage of unemployed individuals, with 100.0% or 3 of them being unemployed.
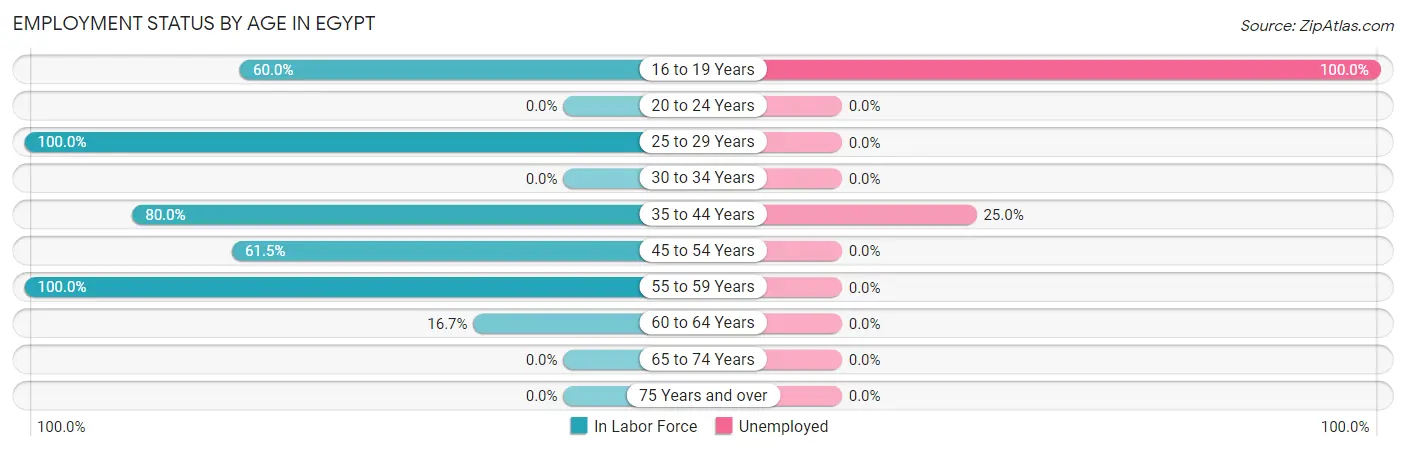
| Age Bracket | In Labor Force | Unemployed |
| 16 to 19 Years | 3 (60.0%) | 3 (100.0%) |
| 20 to 24 Years | 0 (0.0%) | 0 (0.0%) |
| 25 to 29 Years | 4 (100.0%) | 0 (0.0%) |
| 30 to 34 Years | 0 (0.0%) | 0 (0.0%) |
| 35 to 44 Years | 8 (80.0%) | 2 (25.0%) |
| 45 to 54 Years | 8 (61.5%) | 0 (0.0%) |
| 55 to 59 Years | 2 (100.0%) | 0 (0.0%) |
| 60 to 64 Years | 1 (16.7%) | 0 (0.0%) |
| 65 to 74 Years | 0 (0.0%) | 0 (0.0%) |
| 75 Years and over | 0 (0.0%) | 0 (0.0%) |
| Total | 26 (38.2%) | 5 (19.2%) |
Employment Status by Educational Attainment in Egypt
According to labor force statistics for Egypt, 65.7% of individuals (23) out of the total population between 25 and 64 years of age (35) are in the labor force, with 8.7% or 2 of them being unemployed. The group with the highest labor force participation rate are those with the educational attainment of bachelor's degree or higher, with 100.0% or 5 individuals in the labor force. Within the labor force, individuals with high school diploma education have the highest percentage of unemployment, with 22.2% or 2 of them being unemployed.
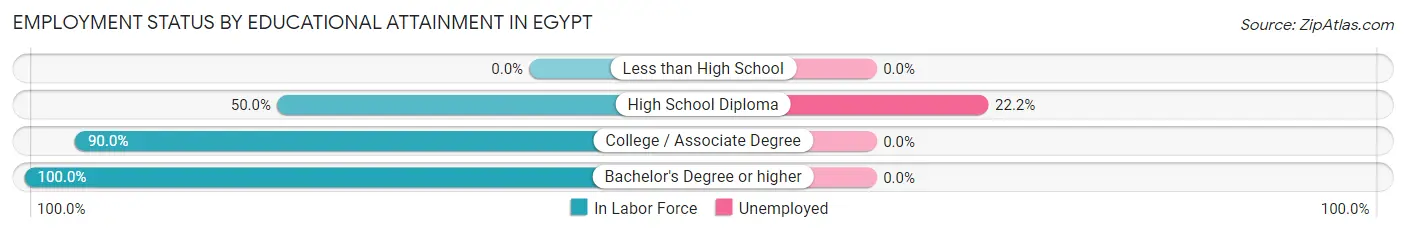
| Educational Attainment | In Labor Force | Unemployed |
| Less than High School | 0 (0.0%) | 0 (0.0%) |
| High School Diploma | 9 (50.0%) | 4 (22.2%) |
| College / Associate Degree | 9 (90.0%) | 0 (0.0%) |
| Bachelor's Degree or higher | 5 (100.0%) | 0 (0.0%) |
| Total | 23 (65.7%) | 3 (8.7%) |
Employment Occupations by Sex in Egypt
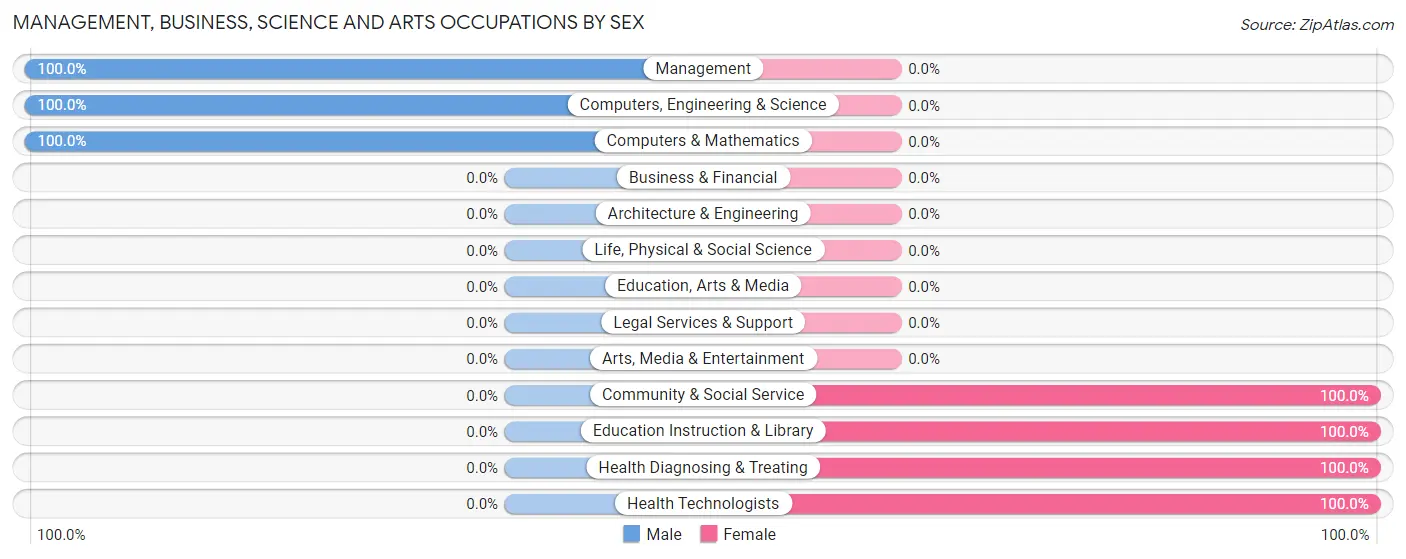
Management, Business, Science and Arts Occupations
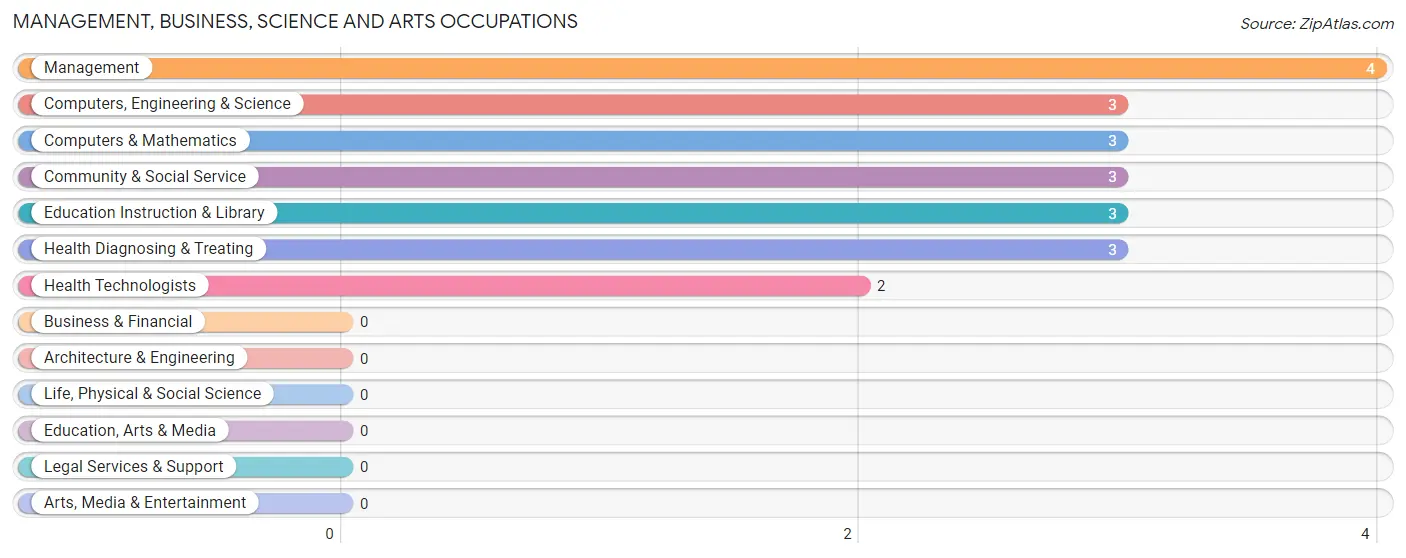
The most common Management, Business, Science and Arts occupations in Egypt are Management (4 | 19.1%), Computers, Engineering & Science (3 | 14.3%), Computers & Mathematics (3 | 14.3%), Community & Social Service (3 | 14.3%), and Education Instruction & Library (3 | 14.3%).
Management, Business, Science and Arts Occupations by Sex
Within the Management, Business, Science and Arts occupations in Egypt, the most male-oriented occupations are Management (100.0%), Computers, Engineering & Science (100.0%), and Computers & Mathematics (100.0%), while the most female-oriented occupations are Community & Social Service (100.0%), Education Instruction & Library (100.0%), and Health Diagnosing & Treating (100.0%).
| Occupation | Male | Female |
| Management | 4 (100.0%) | 0 (0.0%) |
| Business & Financial | 0 (0.0%) | 0 (0.0%) |
| Computers, Engineering & Science | 3 (100.0%) | 0 (0.0%) |
| Computers & Mathematics | 3 (100.0%) | 0 (0.0%) |
| Architecture & Engineering | 0 (0.0%) | 0 (0.0%) |
| Life, Physical & Social Science | 0 (0.0%) | 0 (0.0%) |
| Community & Social Service | 0 (0.0%) | 3 (100.0%) |
| Education, Arts & Media | 0 (0.0%) | 0 (0.0%) |
| Legal Services & Support | 0 (0.0%) | 0 (0.0%) |
| Education Instruction & Library | 0 (0.0%) | 3 (100.0%) |
| Arts, Media & Entertainment | 0 (0.0%) | 0 (0.0%) |
| Health Diagnosing & Treating | 0 (0.0%) | 3 (100.0%) |
| Health Technologists | 0 (0.0%) | 2 (100.0%) |
| Total (Category) | 7 (53.8%) | 6 (46.2%) |
| Total (Overall) | 11 (52.4%) | 10 (47.6%) |
Services Occupations
Services Occupations by Sex
| Occupation | Male | Female |
| Healthcare Support | 0 (0.0%) | 0 (0.0%) |
| Security & Protection | 0 (0.0%) | 0 (0.0%) |
| Firefighting & Prevention | 0 (0.0%) | 0 (0.0%) |
| Law Enforcement | 0 (0.0%) | 0 (0.0%) |
| Food Preparation & Serving | 0 (0.0%) | 0 (0.0%) |
| Cleaning & Maintenance | 0 (0.0%) | 0 (0.0%) |
| Personal Care & Service | 0 (0.0%) | 0 (0.0%) |
| Total (Category) | 0 (0.0%) | 0 (0.0%) |
| Total (Overall) | 11 (52.4%) | 10 (47.6%) |
Sales and Office Occupations
The most common Sales and Office occupations in Egypt are , and Sales & Related (3 | 14.3%).
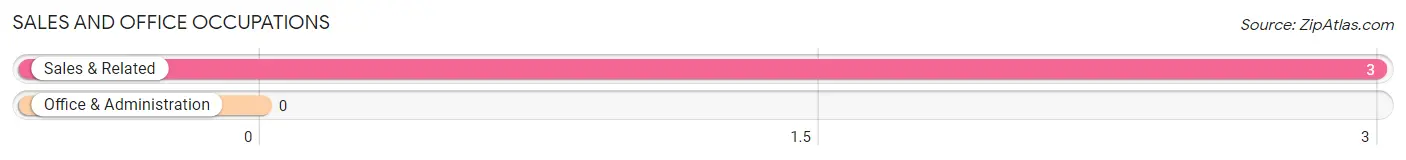
Sales and Office Occupations by Sex

| Occupation | Male | Female |
| Sales & Related | 0 (0.0%) | 3 (100.0%) |
| Office & Administration | 0 (0.0%) | 0 (0.0%) |
| Total (Category) | 0 (0.0%) | 3 (100.0%) |
| Total (Overall) | 11 (52.4%) | 10 (47.6%) |
Natural Resources, Construction and Maintenance Occupations
The most common Natural Resources, Construction and Maintenance occupations in Egypt are , and Farming, Fishing & Forestry (2 | 9.5%).
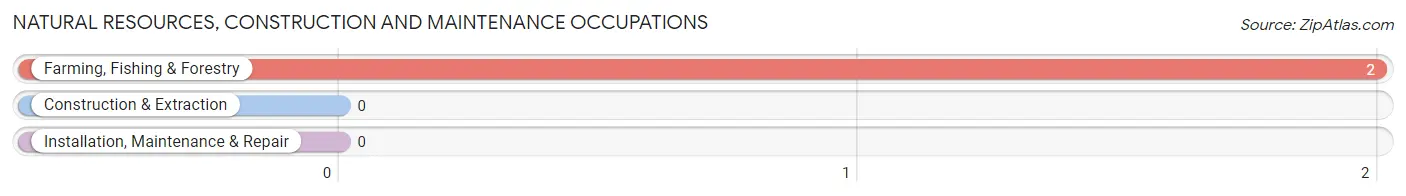
Natural Resources, Construction and Maintenance Occupations by Sex
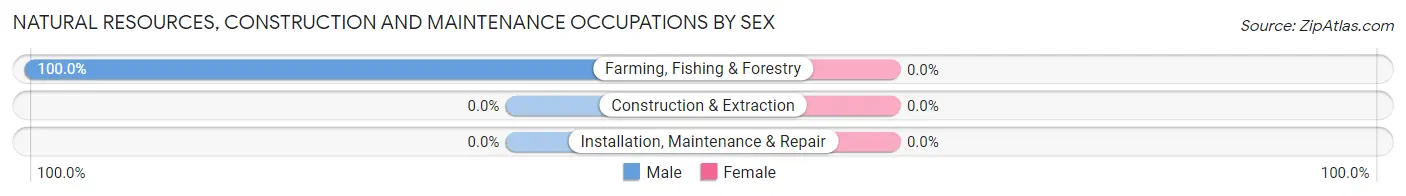
| Occupation | Male | Female |
| Farming, Fishing & Forestry | 2 (100.0%) | 0 (0.0%) |
| Construction & Extraction | 0 (0.0%) | 0 (0.0%) |
| Installation, Maintenance & Repair | 0 (0.0%) | 0 (0.0%) |
| Total (Category) | 2 (100.0%) | 0 (0.0%) |
| Total (Overall) | 11 (52.4%) | 10 (47.6%) |
Production, Transportation and Moving Occupations
The most common Production, Transportation and Moving occupations in Egypt are Production (2 | 9.5%), and Transportation (1 | 4.8%).
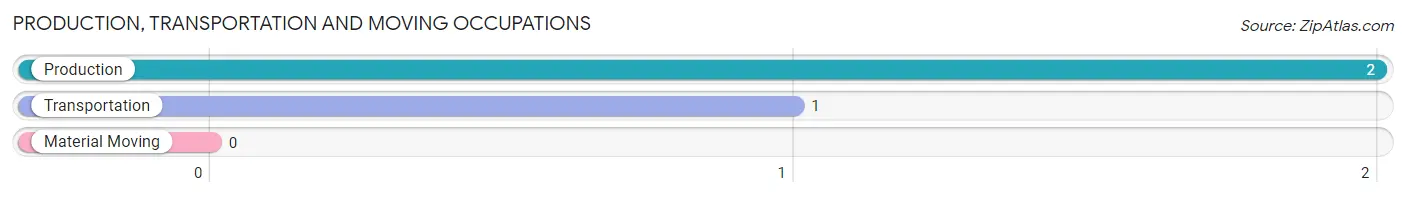
Production, Transportation and Moving Occupations by Sex
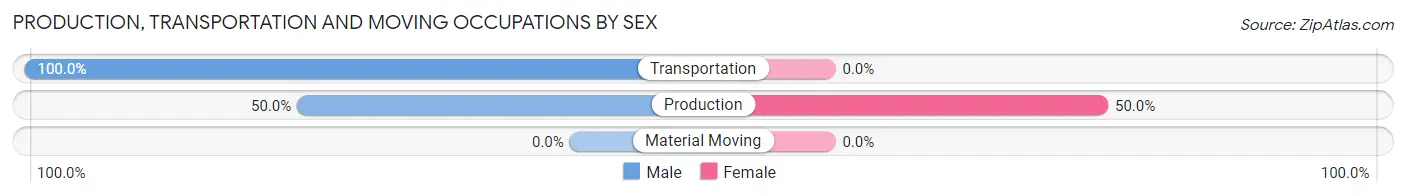
| Occupation | Male | Female |
| Production | 1 (50.0%) | 1 (50.0%) |
| Transportation | 1 (100.0%) | 0 (0.0%) |
| Material Moving | 0 (0.0%) | 0 (0.0%) |
| Total (Category) | 2 (66.7%) | 1 (33.3%) |
| Total (Overall) | 11 (52.4%) | 10 (47.6%) |
Employment Industries by Sex in Egypt
Employment Industries in Egypt
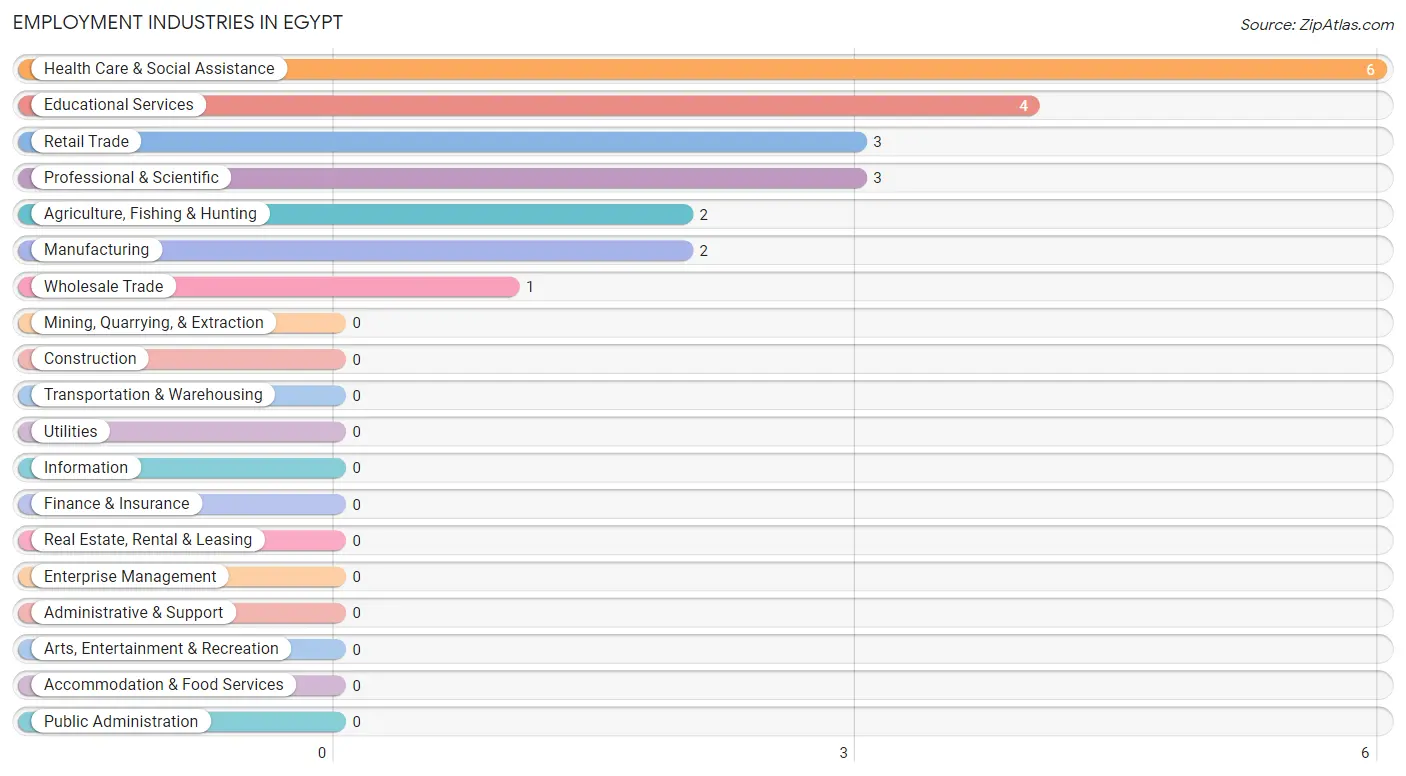
The major employment industries in Egypt include Health Care & Social Assistance (6 | 28.6%), Educational Services (4 | 19.1%), Retail Trade (3 | 14.3%), Professional & Scientific (3 | 14.3%), and Agriculture, Fishing & Hunting (2 | 9.5%).
Employment Industries by Sex in Egypt
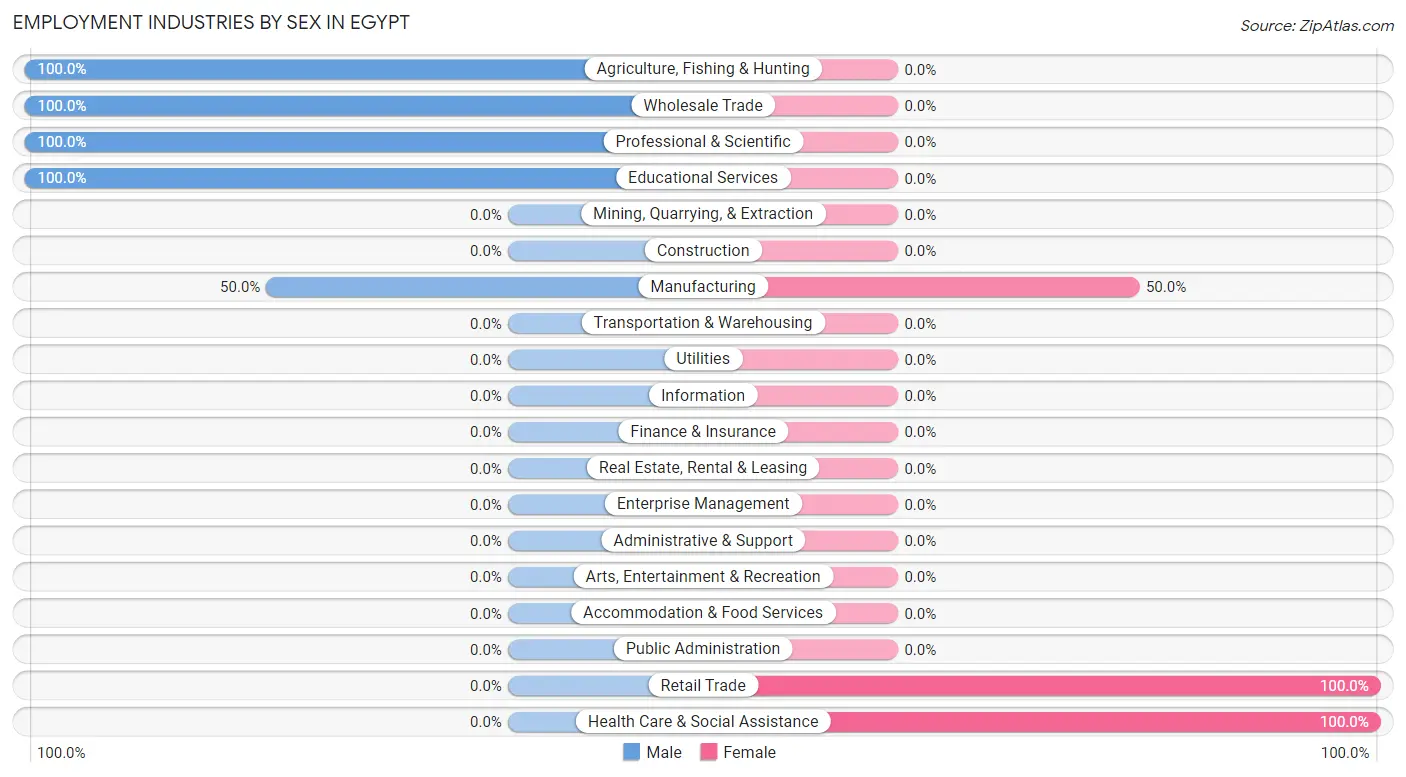
The Egypt industries that see more men than women are Agriculture, Fishing & Hunting (100.0%), Wholesale Trade (100.0%), and Professional & Scientific (100.0%), whereas the industries that tend to have a higher number of women are Retail Trade (100.0%), Health Care & Social Assistance (100.0%), and Manufacturing (50.0%).
| Industry | Male | Female |
| Agriculture, Fishing & Hunting | 2 (100.0%) | 0 (0.0%) |
| Mining, Quarrying, & Extraction | 0 (0.0%) | 0 (0.0%) |
| Construction | 0 (0.0%) | 0 (0.0%) |
| Manufacturing | 1 (50.0%) | 1 (50.0%) |
| Wholesale Trade | 1 (100.0%) | 0 (0.0%) |
| Retail Trade | 0 (0.0%) | 3 (100.0%) |
| Transportation & Warehousing | 0 (0.0%) | 0 (0.0%) |
| Utilities | 0 (0.0%) | 0 (0.0%) |
| Information | 0 (0.0%) | 0 (0.0%) |
| Finance & Insurance | 0 (0.0%) | 0 (0.0%) |
| Real Estate, Rental & Leasing | 0 (0.0%) | 0 (0.0%) |
| Professional & Scientific | 3 (100.0%) | 0 (0.0%) |
| Enterprise Management | 0 (0.0%) | 0 (0.0%) |
| Administrative & Support | 0 (0.0%) | 0 (0.0%) |
| Educational Services | 4 (100.0%) | 0 (0.0%) |
| Health Care & Social Assistance | 0 (0.0%) | 6 (100.0%) |
| Arts, Entertainment & Recreation | 0 (0.0%) | 0 (0.0%) |
| Accommodation & Food Services | 0 (0.0%) | 0 (0.0%) |
| Public Administration | 0 (0.0%) | 0 (0.0%) |
| Total | 11 (52.4%) | 10 (47.6%) |
Education in Egypt
School Enrollment in Egypt
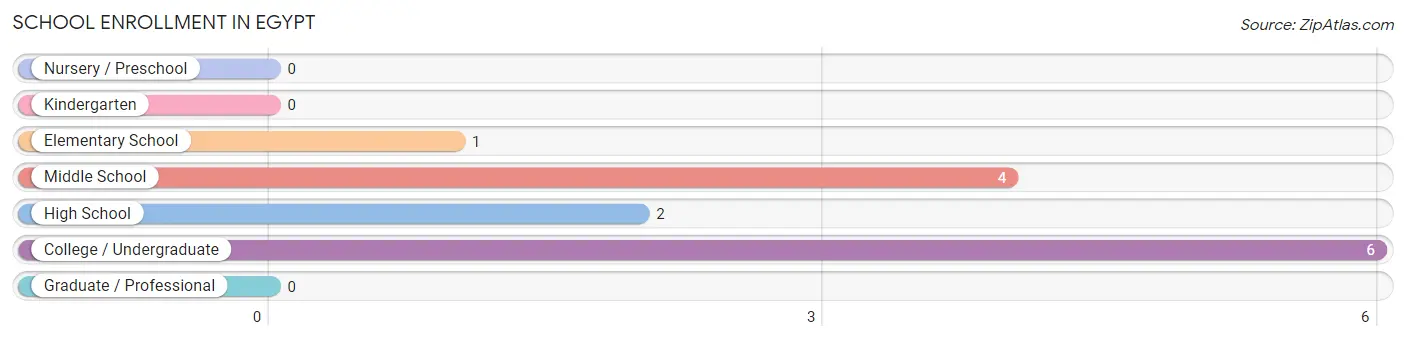
The most common levels of schooling among the 13 students in Egypt are college / undergraduate (6 | 46.2%), middle school (4 | 30.8%), and high school (2 | 15.4%).
| School Level | # Students | % Students |
| Nursery / Preschool | 0 | 0.0% |
| Kindergarten | 0 | 0.0% |
| Elementary School | 1 | 7.7% |
| Middle School | 4 | 30.8% |
| High School | 2 | 15.4% |
| College / Undergraduate | 6 | 46.2% |
| Graduate / Professional | 0 | 0.0% |
| Total | 13 | 100.0% |
School Enrollment by Age by Funding Source in Egypt
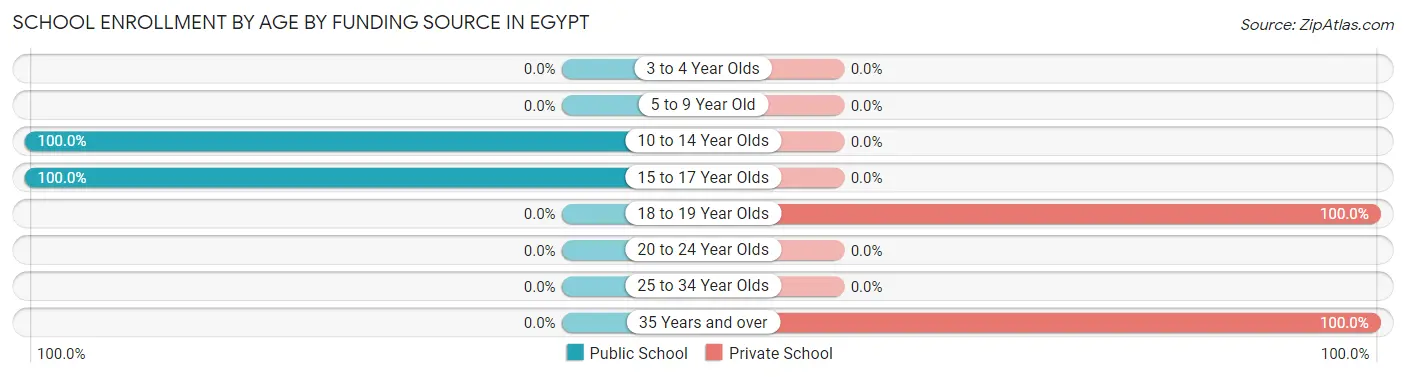
Out of a total of 13 students who are enrolled in schools in Egypt, 6 (46.2%) attend a private institution, while the remaining 7 (53.8%) are enrolled in public schools. The age group of 18 to 19 year olds has the highest likelihood of being enrolled in private schools, with 3 (100.0% in the age bracket) enrolled. Conversely, the age group of 10 to 14 year olds has the lowest likelihood of being enrolled in a private school, with 5 (100.0% in the age bracket) attending a public institution.
| Age Bracket | Public School | Private School |
| 3 to 4 Year Olds | 0 (0.0%) | 0 (0.0%) |
| 5 to 9 Year Old | 0 (0.0%) | 0 (0.0%) |
| 10 to 14 Year Olds | 5 (100.0%) | 0 (0.0%) |
| 15 to 17 Year Olds | 2 (100.0%) | 0 (0.0%) |
| 18 to 19 Year Olds | 0 (0.0%) | 3 (100.0%) |
| 20 to 24 Year Olds | 0 (0.0%) | 0 (0.0%) |
| 25 to 34 Year Olds | 0 (0.0%) | 0 (0.0%) |
| 35 Years and over | 0 (0.0%) | 3 (100.0%) |
| Total | 7 (53.8%) | 6 (46.2%) |
Educational Attainment by Field of Study in Egypt
Psychology (4 | 50.0%), arts & humanities (3 | 37.5%), and education (1 | 12.5%) are the most common fields of study among 8 individuals in Egypt who have obtained a bachelor's degree or higher.
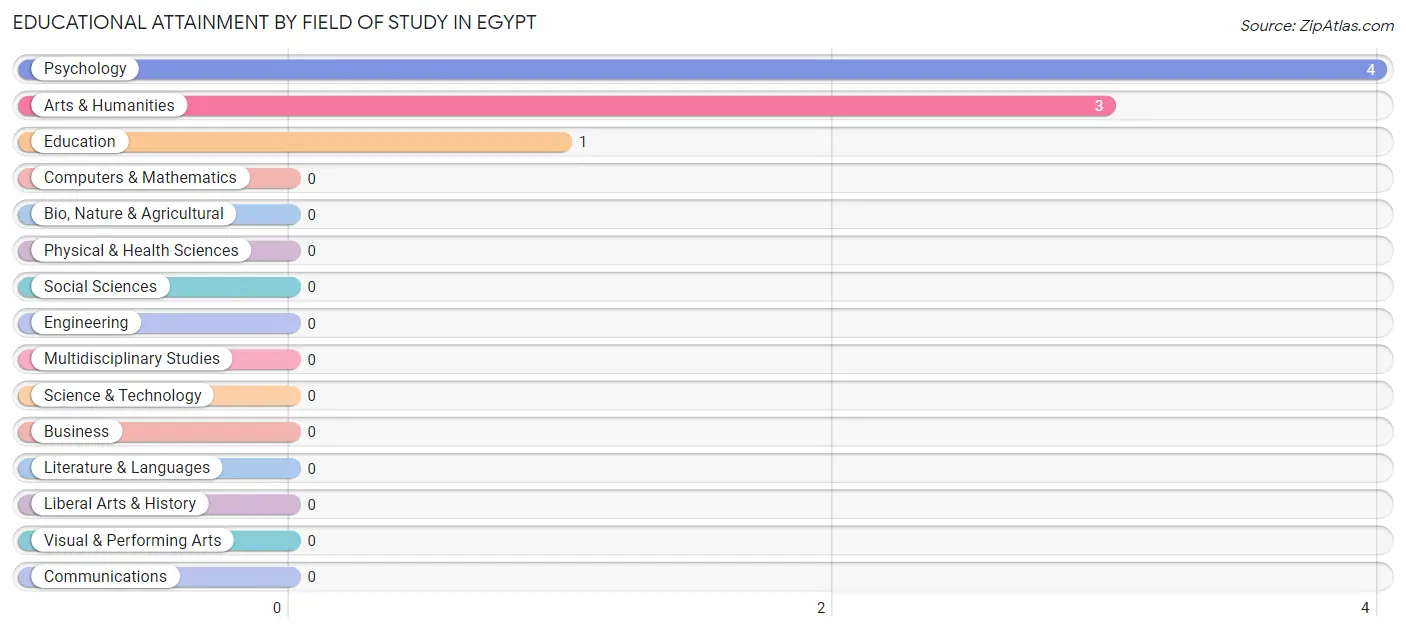
| Field of Study | # Graduates | % Graduates |
| Computers & Mathematics | 0 | 0.0% |
| Bio, Nature & Agricultural | 0 | 0.0% |
| Physical & Health Sciences | 0 | 0.0% |
| Psychology | 4 | 50.0% |
| Social Sciences | 0 | 0.0% |
| Engineering | 0 | 0.0% |
| Multidisciplinary Studies | 0 | 0.0% |
| Science & Technology | 0 | 0.0% |
| Business | 0 | 0.0% |
| Education | 1 | 12.5% |
| Literature & Languages | 0 | 0.0% |
| Liberal Arts & History | 0 | 0.0% |
| Visual & Performing Arts | 0 | 0.0% |
| Communications | 0 | 0.0% |
| Arts & Humanities | 3 | 37.5% |
| Total | 8 | 100.0% |
Transportation & Commute in Egypt
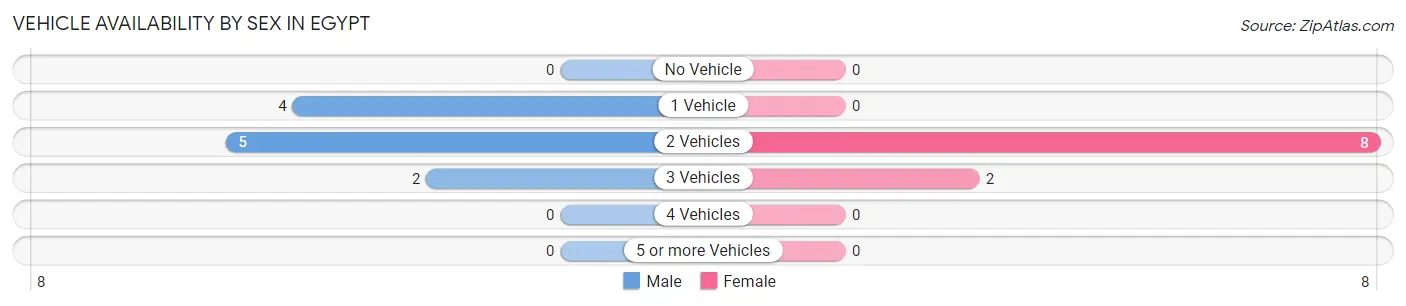
Vehicle Availability by Sex in Egypt
The most prevalent vehicle ownership categories in Egypt are males with 2 vehicles (5, accounting for 45.5%) and females with 2 vehicles (8, making up 50.0%).
| Vehicles Available | Male | Female |
| No Vehicle | 0 (0.0%) | 0 (0.0%) |
| 1 Vehicle | 4 (36.4%) | 0 (0.0%) |
| 2 Vehicles | 5 (45.5%) | 8 (80.0%) |
| 3 Vehicles | 2 (18.2%) | 2 (20.0%) |
| 4 Vehicles | 0 (0.0%) | 0 (0.0%) |
| 5 or more Vehicles | 0 (0.0%) | 0 (0.0%) |
| Total | 11 (100.0%) | 10 (100.0%) |
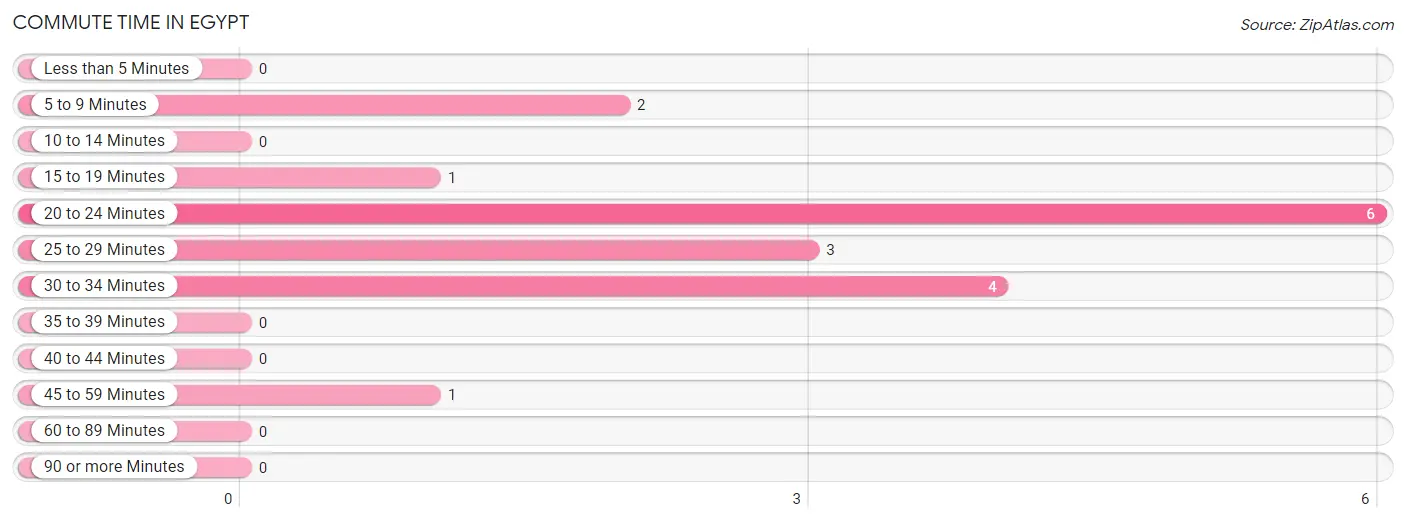
Commute Time in Egypt
The most frequently occuring commute durations in Egypt are 20 to 24 minutes (6 commuters, 35.3%), 30 to 34 minutes (4 commuters, 23.5%), and 25 to 29 minutes (3 commuters, 17.6%).
| Commute Time | # Commuters | % Commuters |
| Less than 5 Minutes | 0 | 0.0% |
| 5 to 9 Minutes | 2 | 11.8% |
| 10 to 14 Minutes | 0 | 0.0% |
| 15 to 19 Minutes | 1 | 5.9% |
| 20 to 24 Minutes | 6 | 35.3% |
| 25 to 29 Minutes | 3 | 17.6% |
| 30 to 34 Minutes | 4 | 23.5% |
| 35 to 39 Minutes | 0 | 0.0% |
| 40 to 44 Minutes | 0 | 0.0% |
| 45 to 59 Minutes | 1 | 5.9% |
| 60 to 89 Minutes | 0 | 0.0% |
| 90 or more Minutes | 0 | 0.0% |
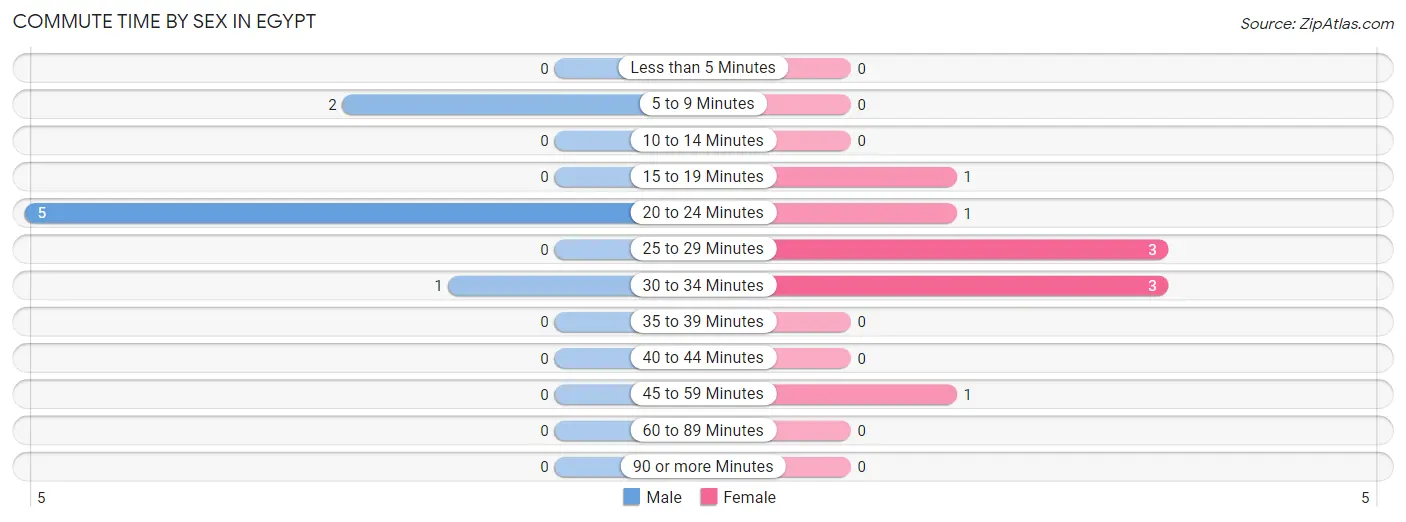
Commute Time by Sex in Egypt
The most common commute times in Egypt are 20 to 24 minutes (5 commuters, 62.5%) for males and 25 to 29 minutes (3 commuters, 33.3%) for females.
| Commute Time | Male | Female |
| Less than 5 Minutes | 0 (0.0%) | 0 (0.0%) |
| 5 to 9 Minutes | 2 (25.0%) | 0 (0.0%) |
| 10 to 14 Minutes | 0 (0.0%) | 0 (0.0%) |
| 15 to 19 Minutes | 0 (0.0%) | 1 (11.1%) |
| 20 to 24 Minutes | 5 (62.5%) | 1 (11.1%) |
| 25 to 29 Minutes | 0 (0.0%) | 3 (33.3%) |
| 30 to 34 Minutes | 1 (12.5%) | 3 (33.3%) |
| 35 to 39 Minutes | 0 (0.0%) | 0 (0.0%) |
| 40 to 44 Minutes | 0 (0.0%) | 0 (0.0%) |
| 45 to 59 Minutes | 0 (0.0%) | 1 (11.1%) |
| 60 to 89 Minutes | 0 (0.0%) | 0 (0.0%) |
| 90 or more Minutes | 0 (0.0%) | 0 (0.0%) |
Time of Departure to Work by Sex in Egypt
The most frequent times of departure to work in Egypt are 7:30 AM to 7:59 AM (4, 50.0%) for males and 6:30 AM to 6:59 AM (3, 33.3%) for females.
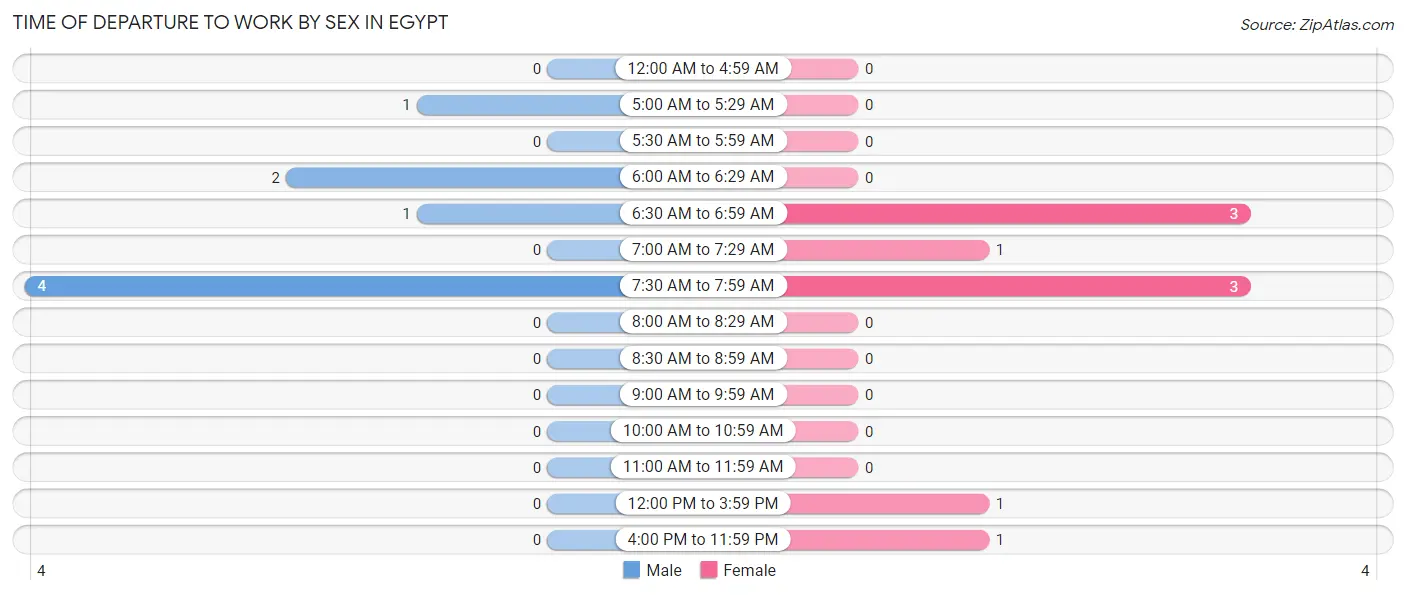
| Time of Departure | Male | Female |
| 12:00 AM to 4:59 AM | 0 (0.0%) | 0 (0.0%) |
| 5:00 AM to 5:29 AM | 1 (12.5%) | 0 (0.0%) |
| 5:30 AM to 5:59 AM | 0 (0.0%) | 0 (0.0%) |
| 6:00 AM to 6:29 AM | 2 (25.0%) | 0 (0.0%) |
| 6:30 AM to 6:59 AM | 1 (12.5%) | 3 (33.3%) |
| 7:00 AM to 7:29 AM | 0 (0.0%) | 1 (11.1%) |
| 7:30 AM to 7:59 AM | 4 (50.0%) | 3 (33.3%) |
| 8:00 AM to 8:29 AM | 0 (0.0%) | 0 (0.0%) |
| 8:30 AM to 8:59 AM | 0 (0.0%) | 0 (0.0%) |
| 9:00 AM to 9:59 AM | 0 (0.0%) | 0 (0.0%) |
| 10:00 AM to 10:59 AM | 0 (0.0%) | 0 (0.0%) |
| 11:00 AM to 11:59 AM | 0 (0.0%) | 0 (0.0%) |
| 12:00 PM to 3:59 PM | 0 (0.0%) | 1 (11.1%) |
| 4:00 PM to 11:59 PM | 0 (0.0%) | 1 (11.1%) |
| Total | 8 (100.0%) | 9 (100.0%) |
Housing Occupancy in Egypt
Occupancy by Ownership in Egypt
Of the total 36 dwellings in Egypt, owner-occupied units account for 30 (83.3%), while renter-occupied units make up 6 (16.7%).
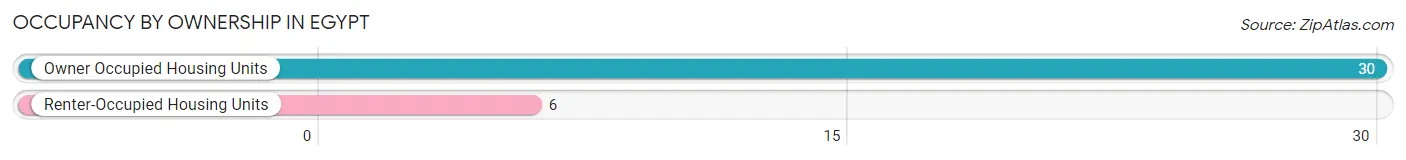
| Occupancy | # Housing Units | % Housing Units |
| Owner Occupied Housing Units | 30 | 83.3% |
| Renter-Occupied Housing Units | 6 | 16.7% |
| Total Occupied Housing Units | 36 | 100.0% |
Occupancy by Household Size in Egypt
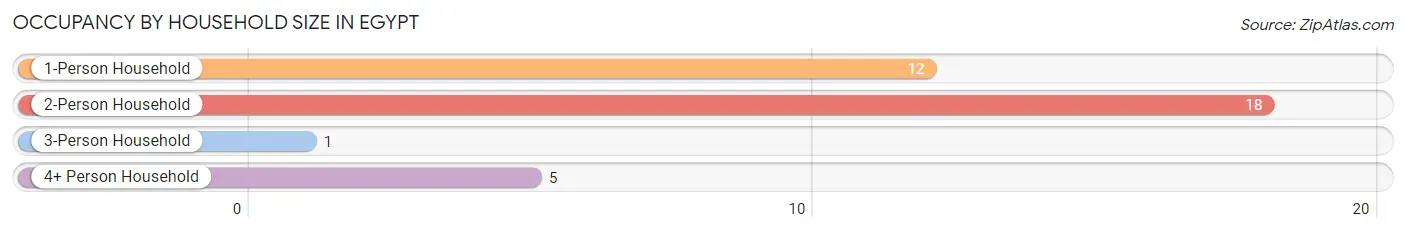
| Household Size | # Housing Units | % Housing Units |
| 1-Person Household | 12 | 33.3% |
| 2-Person Household | 18 | 50.0% |
| 3-Person Household | 1 | 2.8% |
| 4+ Person Household | 5 | 13.9% |
| Total Housing Units | 36 | 100.0% |
Occupancy by Ownership by Household Size in Egypt
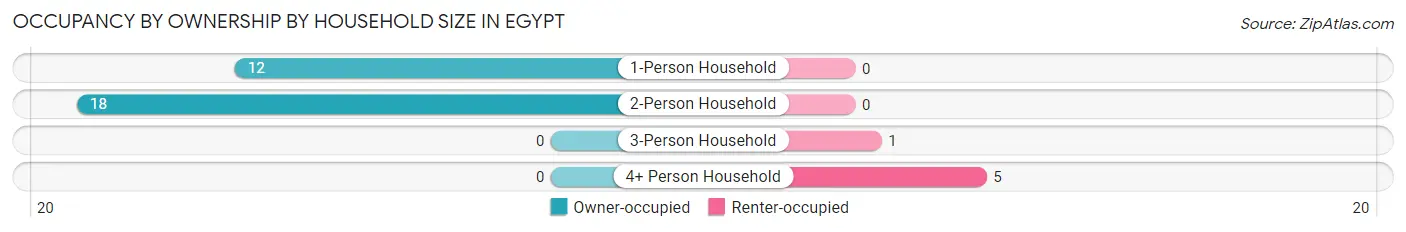
| Household Size | Owner-occupied | Renter-occupied |
| 1-Person Household | 12 (100.0%) | 0 (0.0%) |
| 2-Person Household | 18 (100.0%) | 0 (0.0%) |
| 3-Person Household | 0 (0.0%) | 1 (100.0%) |
| 4+ Person Household | 0 (0.0%) | 5 (100.0%) |
| Total Housing Units | 30 (83.3%) | 6 (16.7%) |
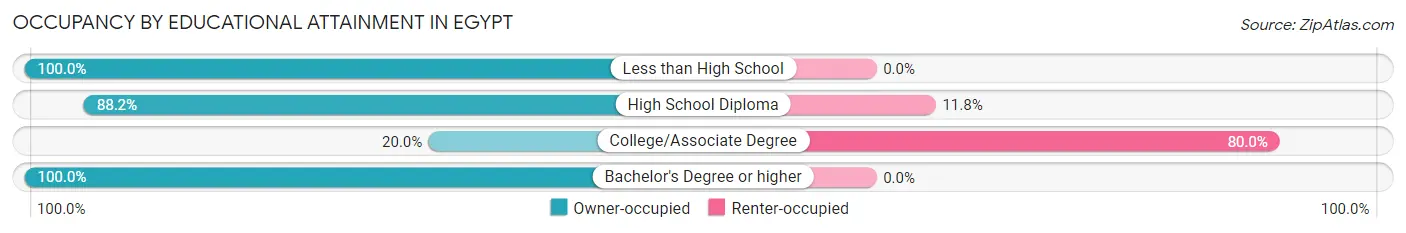
Occupancy by Educational Attainment in Egypt
| Household Size | Owner-occupied | Renter-occupied |
| Less than High School | 7 (100.0%) | 0 (0.0%) |
| High School Diploma | 15 (88.2%) | 2 (11.8%) |
| College/Associate Degree | 1 (20.0%) | 4 (80.0%) |
| Bachelor's Degree or higher | 7 (100.0%) | 0 (0.0%) |
Occupancy by Age of Householder in Egypt
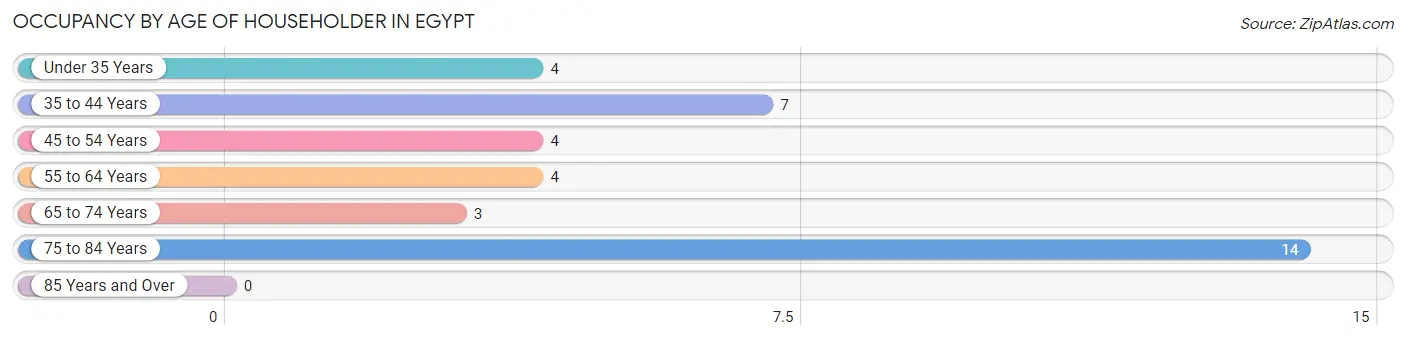
| Age Bracket | # Households | % Households |
| Under 35 Years | 4 | 11.1% |
| 35 to 44 Years | 7 | 19.4% |
| 45 to 54 Years | 4 | 11.1% |
| 55 to 64 Years | 4 | 11.1% |
| 65 to 74 Years | 3 | 8.3% |
| 75 to 84 Years | 14 | 38.9% |
| 85 Years and Over | 0 | 0.0% |
| Total | 36 | 100.0% |
Housing Finances in Egypt
Median Income by Occupancy in Egypt
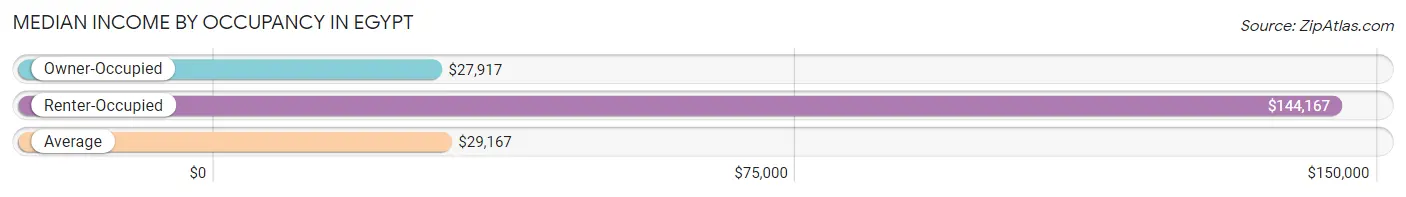
| Occupancy Type | # Households | Median Income |
| Owner-Occupied | 30 (83.3%) | $27,917 |
| Renter-Occupied | 6 (16.7%) | $144,167 |
| Average | 36 (100.0%) | $29,167 |
Occupancy by Householder Income Bracket in Egypt
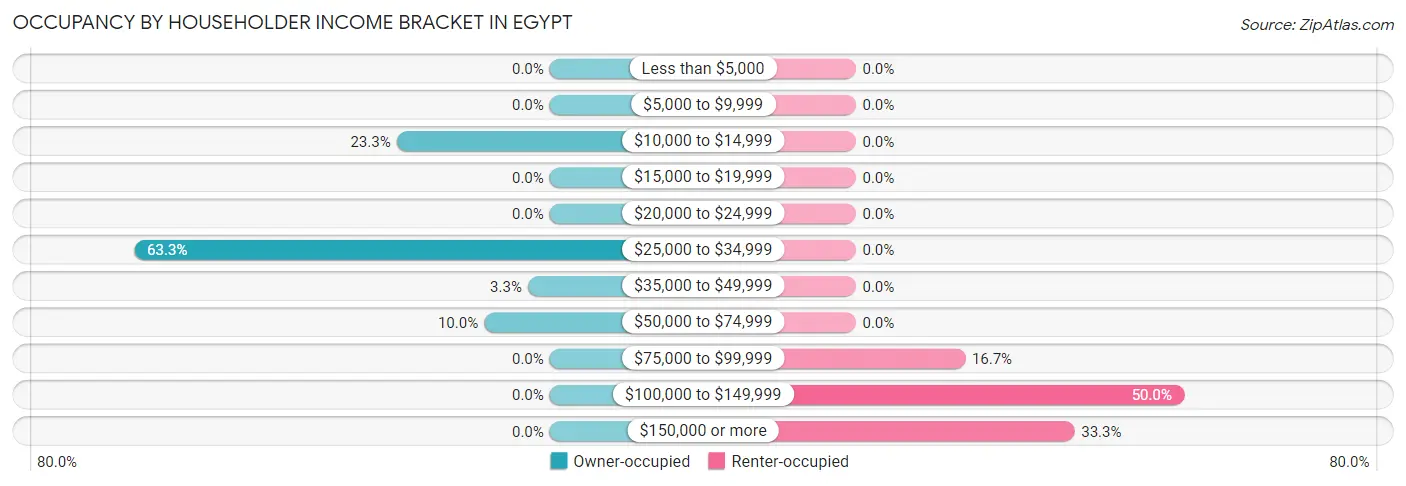
| Income Bracket | Owner-occupied | Renter-occupied |
| Less than $5,000 | 0 (0.0%) | 0 (0.0%) |
| $5,000 to $9,999 | 0 (0.0%) | 0 (0.0%) |
| $10,000 to $14,999 | 7 (23.3%) | 0 (0.0%) |
| $15,000 to $19,999 | 0 (0.0%) | 0 (0.0%) |
| $20,000 to $24,999 | 0 (0.0%) | 0 (0.0%) |
| $25,000 to $34,999 | 19 (63.3%) | 0 (0.0%) |
| $35,000 to $49,999 | 1 (3.3%) | 0 (0.0%) |
| $50,000 to $74,999 | 3 (10.0%) | 0 (0.0%) |
| $75,000 to $99,999 | 0 (0.0%) | 1 (16.7%) |
| $100,000 to $149,999 | 0 (0.0%) | 3 (50.0%) |
| $150,000 or more | 0 (0.0%) | 2 (33.3%) |
| Total | 30 (100.0%) | 6 (100.0%) |
Monthly Housing Cost Tiers in Egypt
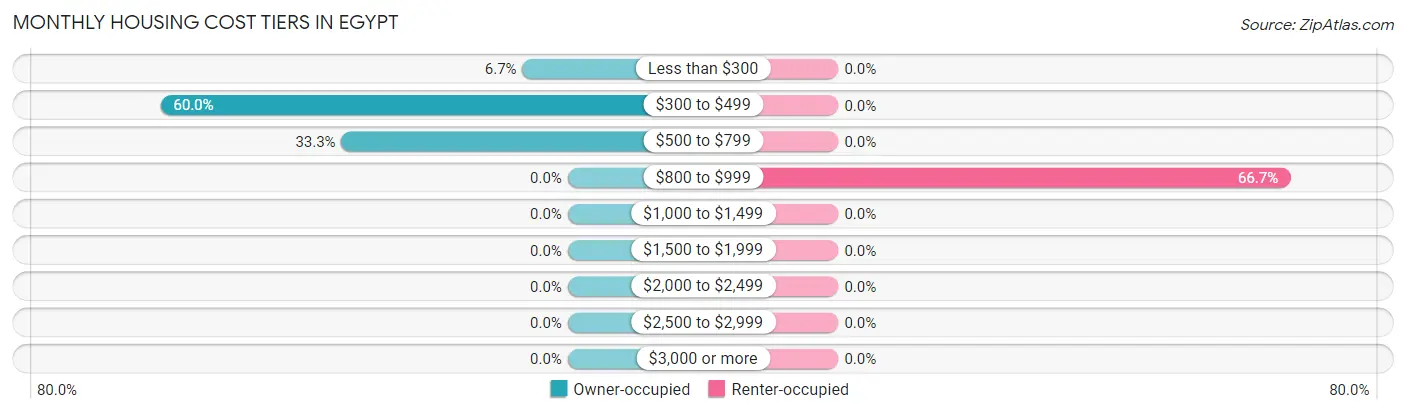
| Monthly Cost | Owner-occupied | Renter-occupied |
| Less than $300 | 2 (6.7%) | 0 (0.0%) |
| $300 to $499 | 18 (60.0%) | 0 (0.0%) |
| $500 to $799 | 10 (33.3%) | 0 (0.0%) |
| $800 to $999 | 0 (0.0%) | 4 (66.7%) |
| $1,000 to $1,499 | 0 (0.0%) | 0 (0.0%) |
| $1,500 to $1,999 | 0 (0.0%) | 0 (0.0%) |
| $2,000 to $2,499 | 0 (0.0%) | 0 (0.0%) |
| $2,500 to $2,999 | 0 (0.0%) | 0 (0.0%) |
| $3,000 or more | 0 (0.0%) | 0 (0.0%) |
| Total | 30 (100.0%) | 6 (100.0%) |
Physical Housing Characteristics in Egypt
Housing Structures in Egypt
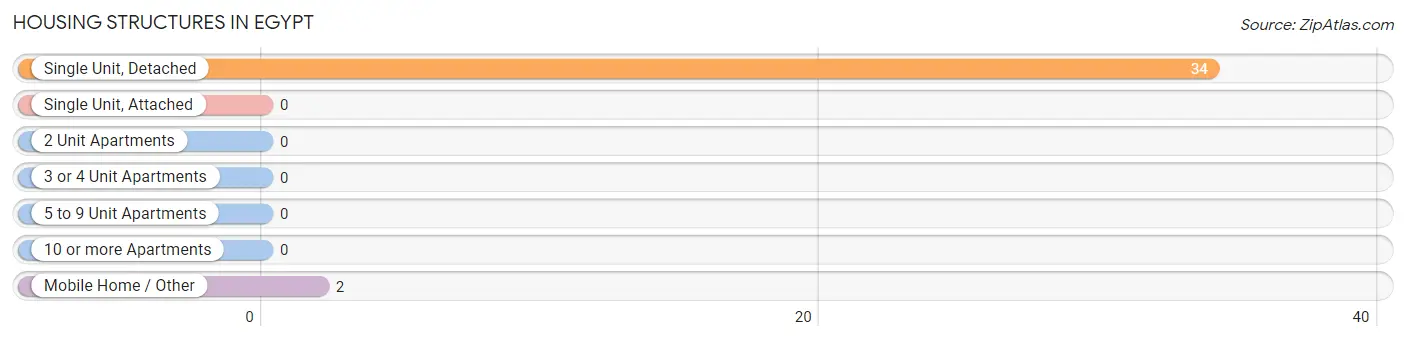
| Structure Type | # Housing Units | % Housing Units |
| Single Unit, Detached | 34 | 94.4% |
| Single Unit, Attached | 0 | 0.0% |
| 2 Unit Apartments | 0 | 0.0% |
| 3 or 4 Unit Apartments | 0 | 0.0% |
| 5 to 9 Unit Apartments | 0 | 0.0% |
| 10 or more Apartments | 0 | 0.0% |
| Mobile Home / Other | 2 | 5.6% |
| Total | 36 | 100.0% |
Housing Structures by Occupancy in Egypt
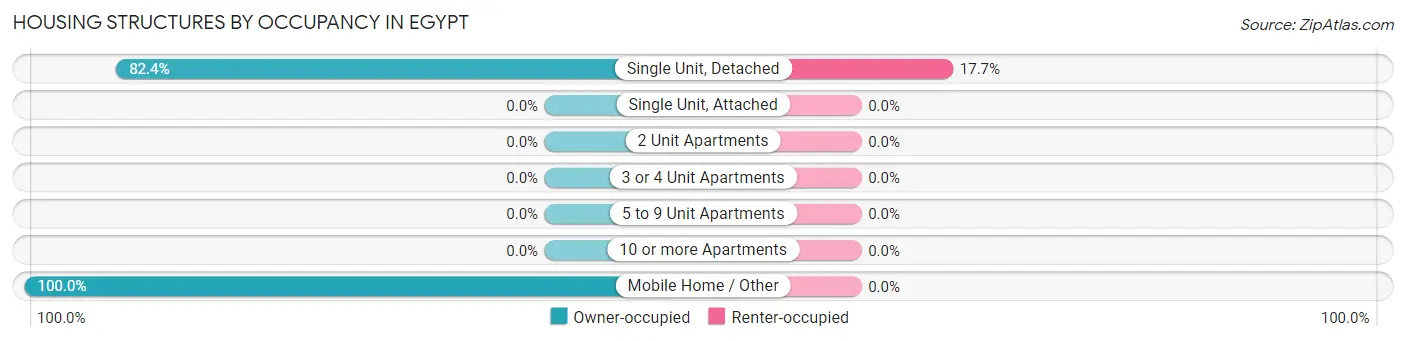
| Structure Type | Owner-occupied | Renter-occupied |
| Single Unit, Detached | 28 (82.4%) | 6 (17.6%) |
| Single Unit, Attached | 0 (0.0%) | 0 (0.0%) |
| 2 Unit Apartments | 0 (0.0%) | 0 (0.0%) |
| 3 or 4 Unit Apartments | 0 (0.0%) | 0 (0.0%) |
| 5 to 9 Unit Apartments | 0 (0.0%) | 0 (0.0%) |
| 10 or more Apartments | 0 (0.0%) | 0 (0.0%) |
| Mobile Home / Other | 2 (100.0%) | 0 (0.0%) |
| Total | 30 (83.3%) | 6 (16.7%) |
Housing Structures by Number of Rooms in Egypt
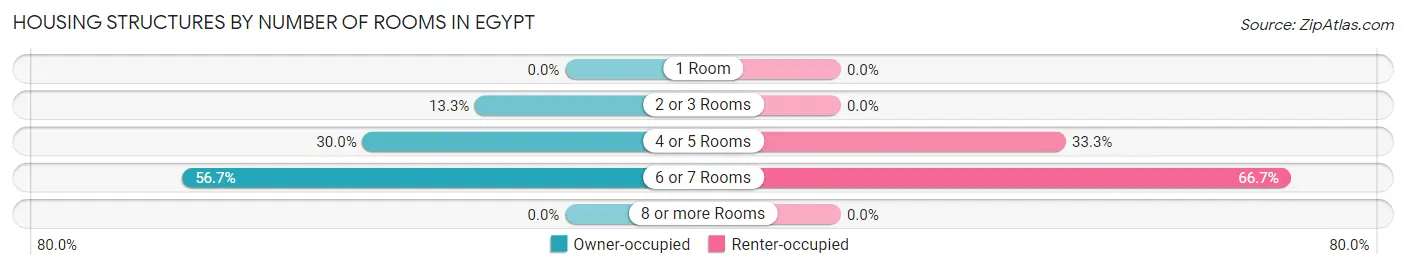
| Number of Rooms | Owner-occupied | Renter-occupied |
| 1 Room | 0 (0.0%) | 0 (0.0%) |
| 2 or 3 Rooms | 4 (13.3%) | 0 (0.0%) |
| 4 or 5 Rooms | 9 (30.0%) | 2 (33.3%) |
| 6 or 7 Rooms | 17 (56.7%) | 4 (66.7%) |
| 8 or more Rooms | 0 (0.0%) | 0 (0.0%) |
| Total | 30 (100.0%) | 6 (100.0%) |
Housing Structure by Heating Type in Egypt
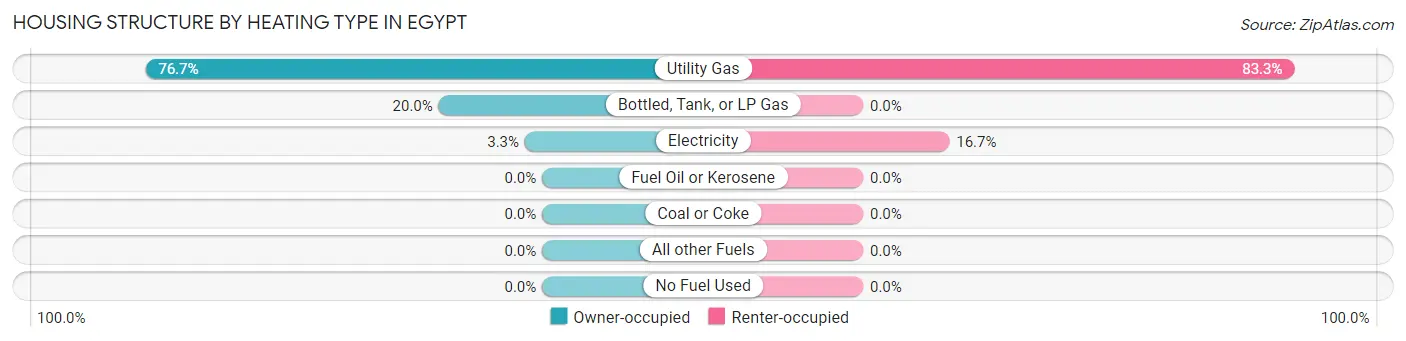
| Heating Type | Owner-occupied | Renter-occupied |
| Utility Gas | 23 (76.7%) | 5 (83.3%) |
| Bottled, Tank, or LP Gas | 6 (20.0%) | 0 (0.0%) |
| Electricity | 1 (3.3%) | 1 (16.7%) |
| Fuel Oil or Kerosene | 0 (0.0%) | 0 (0.0%) |
| Coal or Coke | 0 (0.0%) | 0 (0.0%) |
| All other Fuels | 0 (0.0%) | 0 (0.0%) |
| No Fuel Used | 0 (0.0%) | 0 (0.0%) |
| Total | 30 (100.0%) | 6 (100.0%) |
Household Vehicle Usage in Egypt
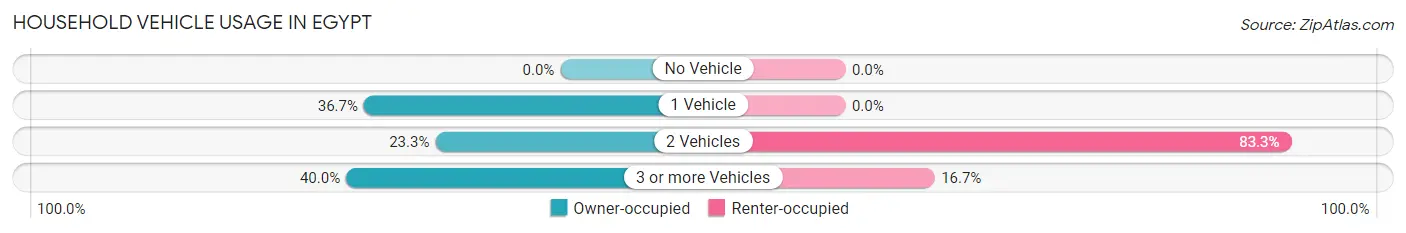
| Vehicles per Household | Owner-occupied | Renter-occupied |
| No Vehicle | 0 (0.0%) | 0 (0.0%) |
| 1 Vehicle | 11 (36.7%) | 0 (0.0%) |
| 2 Vehicles | 7 (23.3%) | 5 (83.3%) |
| 3 or more Vehicles | 12 (40.0%) | 1 (16.7%) |
| Total | 30 (100.0%) | 6 (100.0%) |
Real Estate & Mortgages in Egypt
Real Estate and Mortgage Overview in Egypt
| Characteristic | Without Mortgage | With Mortgage |
| Housing Units | 20 | 10 |
| Median Property Value | $66,700 | $83,300 |
| Median Household Income | $26,071 | $0 |
| Monthly Housing Costs | $379 | $0 |
| Real Estate Taxes | $199 | $0 |
Property Value by Mortgage Status in Egypt
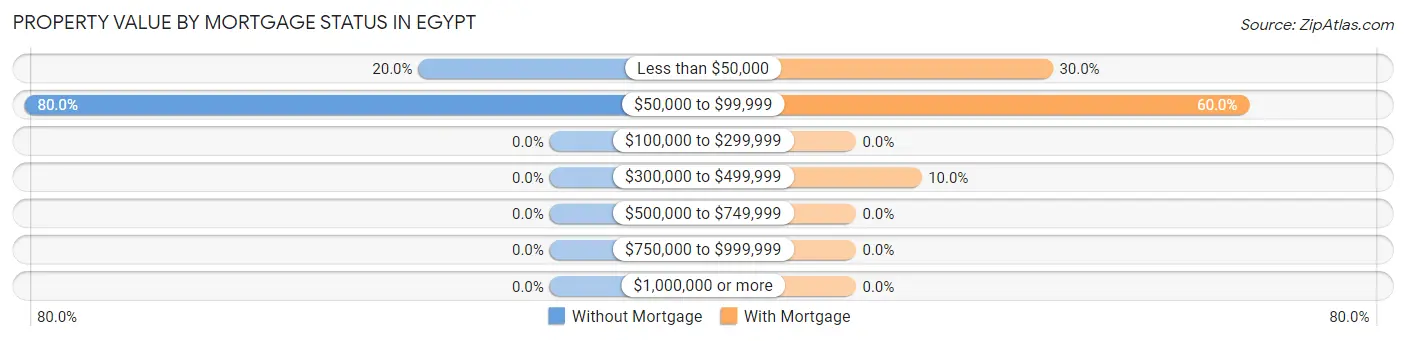
| Property Value | Without Mortgage | With Mortgage |
| Less than $50,000 | 4 (20.0%) | 3 (30.0%) |
| $50,000 to $99,999 | 16 (80.0%) | 6 (60.0%) |
| $100,000 to $299,999 | 0 (0.0%) | 0 (0.0%) |
| $300,000 to $499,999 | 0 (0.0%) | 1 (10.0%) |
| $500,000 to $749,999 | 0 (0.0%) | 0 (0.0%) |
| $750,000 to $999,999 | 0 (0.0%) | 0 (0.0%) |
| $1,000,000 or more | 0 (0.0%) | 0 (0.0%) |
| Total | 20 (100.0%) | 10 (100.0%) |
Household Income by Mortgage Status in Egypt
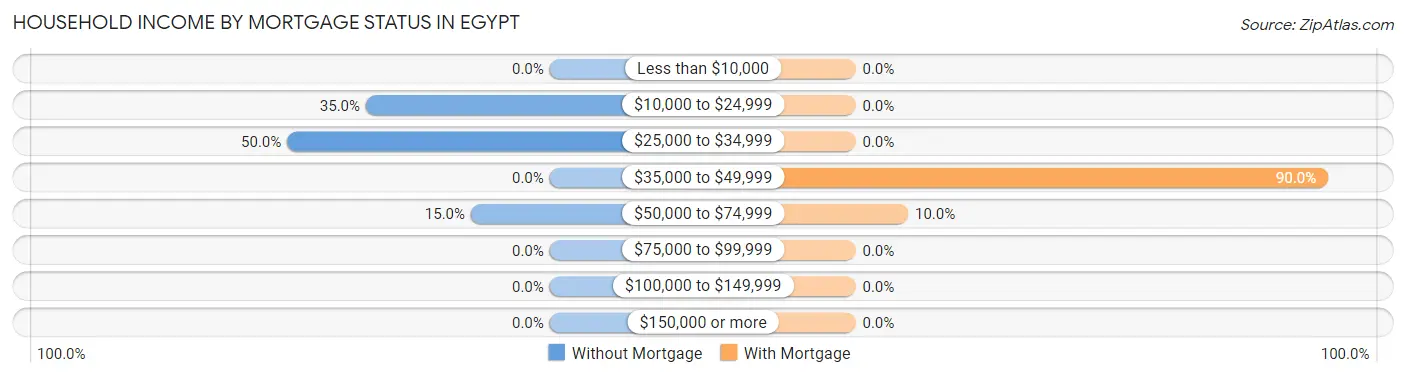
| Household Income | Without Mortgage | With Mortgage |
| Less than $10,000 | 0 (0.0%) | 0 (0.0%) |
| $10,000 to $24,999 | 7 (35.0%) | 0 (0.0%) |
| $25,000 to $34,999 | 10 (50.0%) | 0 (0.0%) |
| $35,000 to $49,999 | 0 (0.0%) | 9 (90.0%) |
| $50,000 to $74,999 | 3 (15.0%) | 1 (10.0%) |
| $75,000 to $99,999 | 0 (0.0%) | 0 (0.0%) |
| $100,000 to $149,999 | 0 (0.0%) | 0 (0.0%) |
| $150,000 or more | 0 (0.0%) | 0 (0.0%) |
| Total | 20 (100.0%) | 10 (100.0%) |
Property Value to Household Income Ratio in Egypt
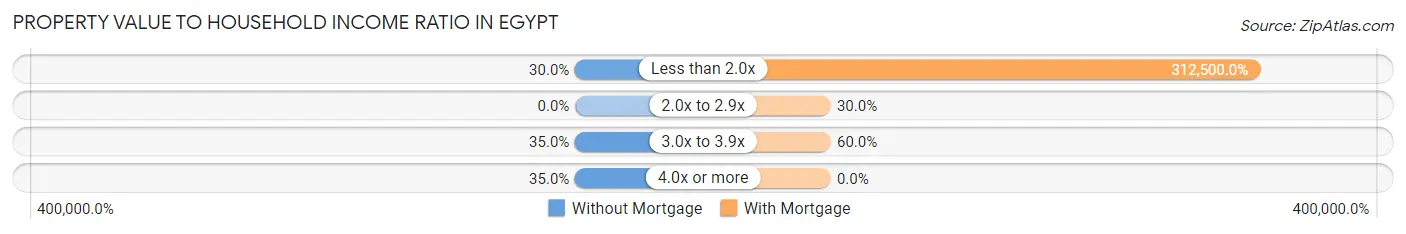
| Value-to-Income Ratio | Without Mortgage | With Mortgage |
| Less than 2.0x | 6 (30.0%) | 31,250 (312,500.0%) |
| 2.0x to 2.9x | 0 (0.0%) | 3 (30.0%) |
| 3.0x to 3.9x | 7 (35.0%) | 6 (60.0%) |
| 4.0x or more | 7 (35.0%) | 0 (0.0%) |
| Total | 20 (100.0%) | 10 (100.0%) |
Real Estate Taxes by Mortgage Status in Egypt
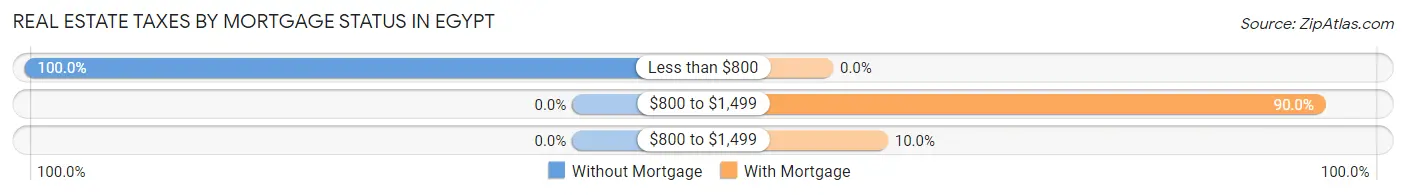
| Property Taxes | Without Mortgage | With Mortgage |
| Less than $800 | 20 (100.0%) | 0 (0.0%) |
| $800 to $1,499 | 0 (0.0%) | 9 (90.0%) |
| $800 to $1,499 | 0 (0.0%) | 1 (10.0%) |
| Total | 20 (100.0%) | 10 (100.0%) |
Health & Disability in Egypt
Health Insurance Coverage by Age in Egypt
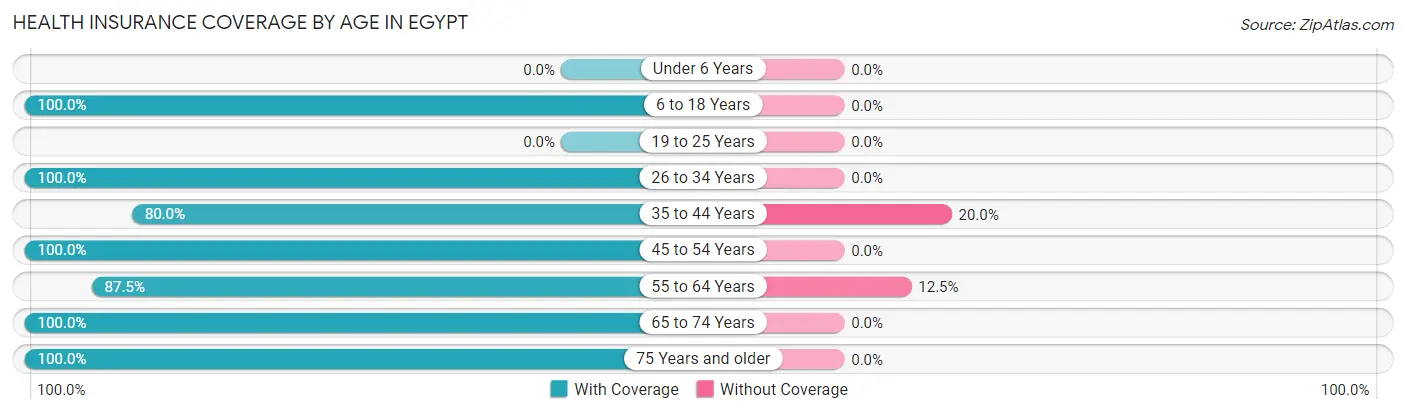
| Age Bracket | With Coverage | Without Coverage |
| Under 6 Years | 0 (0.0%) | 0 (0.0%) |
| 6 to 18 Years | 10 (100.0%) | 0 (0.0%) |
| 19 to 25 Years | 0 (0.0%) | 0 (0.0%) |
| 26 to 34 Years | 4 (100.0%) | 0 (0.0%) |
| 35 to 44 Years | 8 (80.0%) | 2 (20.0%) |
| 45 to 54 Years | 13 (100.0%) | 0 (0.0%) |
| 55 to 64 Years | 7 (87.5%) | 1 (12.5%) |
| 65 to 74 Years | 8 (100.0%) | 0 (0.0%) |
| 75 Years and older | 20 (100.0%) | 0 (0.0%) |
| Total | 70 (95.9%) | 3 (4.1%) |
Health Insurance Coverage by Citizenship Status in Egypt
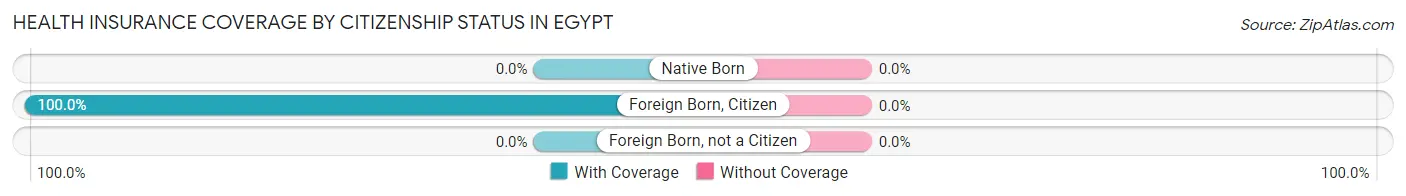
| Citizenship Status | With Coverage | Without Coverage |
| Native Born | 0 (0.0%) | 0 (0.0%) |
| Foreign Born, Citizen | 10 (100.0%) | 0 (0.0%) |
| Foreign Born, not a Citizen | 0 (0.0%) | 0 (0.0%) |
Health Insurance Coverage by Household Income in Egypt
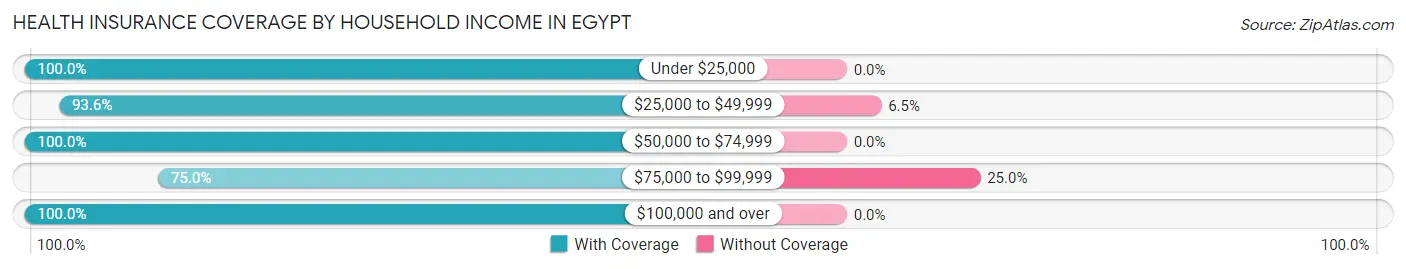
| Household Income | With Coverage | Without Coverage |
| Under $25,000 | 12 (100.0%) | 0 (0.0%) |
| $25,000 to $49,999 | 29 (93.5%) | 2 (6.5%) |
| $50,000 to $74,999 | 5 (100.0%) | 0 (0.0%) |
| $75,000 to $99,999 | 3 (75.0%) | 1 (25.0%) |
| $100,000 and over | 21 (100.0%) | 0 (0.0%) |
Public vs Private Health Insurance Coverage by Age in Egypt
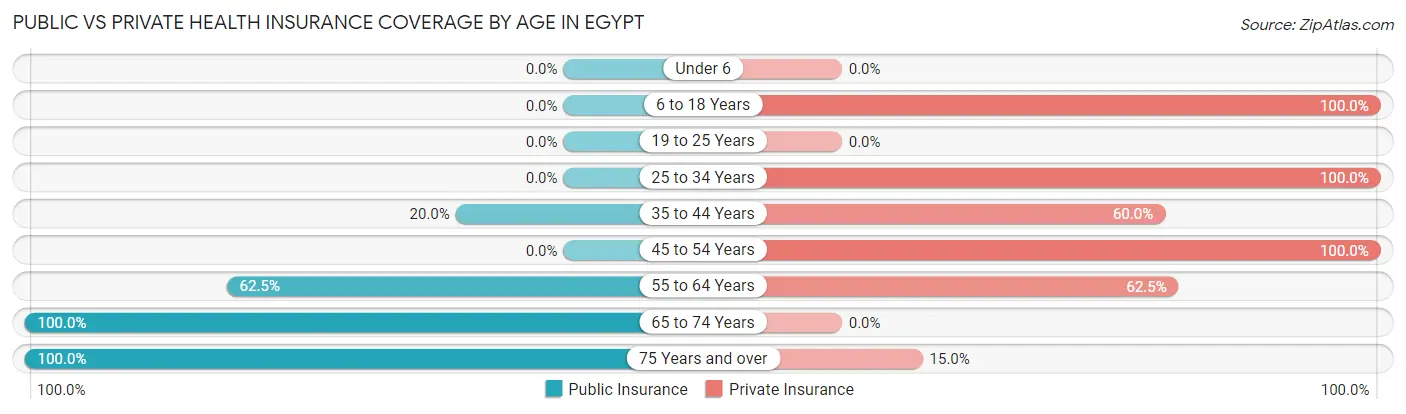
| Age Bracket | Public Insurance | Private Insurance |
| Under 6 | 0 (0.0%) | 0 (0.0%) |
| 6 to 18 Years | 0 (0.0%) | 10 (100.0%) |
| 19 to 25 Years | 0 (0.0%) | 0 (0.0%) |
| 25 to 34 Years | 0 (0.0%) | 4 (100.0%) |
| 35 to 44 Years | 2 (20.0%) | 6 (60.0%) |
| 45 to 54 Years | 0 (0.0%) | 13 (100.0%) |
| 55 to 64 Years | 5 (62.5%) | 5 (62.5%) |
| 65 to 74 Years | 8 (100.0%) | 0 (0.0%) |
| 75 Years and over | 20 (100.0%) | 3 (15.0%) |
| Total | 35 (47.9%) | 41 (56.2%) |
Disability Status by Sex by Age in Egypt
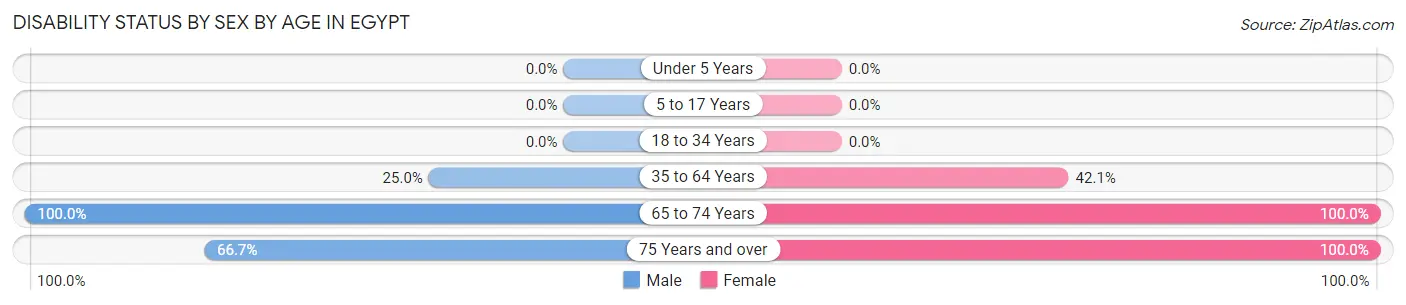
| Age Bracket | Male | Female |
| Under 5 Years | 0 (0.0%) | 0 (0.0%) |
| 5 to 17 Years | 0 (0.0%) | 0 (0.0%) |
| 18 to 34 Years | 0 (0.0%) | 0 (0.0%) |
| 35 to 64 Years | 3 (25.0%) | 8 (42.1%) |
| 65 to 74 Years | 3 (100.0%) | 5 (100.0%) |
| 75 Years and over | 6 (66.7%) | 11 (100.0%) |
Disability Class by Sex by Age in Egypt
Disability Class: Hearing Difficulty
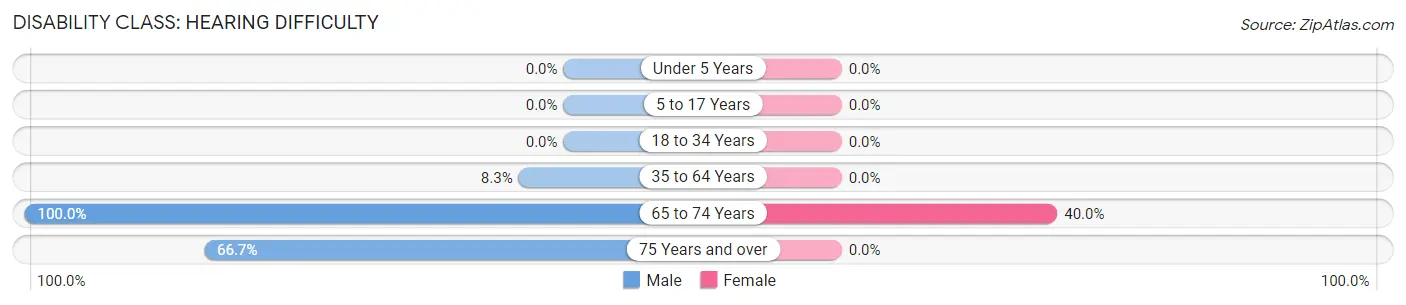
| Age Bracket | Male | Female |
| Under 5 Years | 0 (0.0%) | 0 (0.0%) |
| 5 to 17 Years | 0 (0.0%) | 0 (0.0%) |
| 18 to 34 Years | 0 (0.0%) | 0 (0.0%) |
| 35 to 64 Years | 1 (8.3%) | 0 (0.0%) |
| 65 to 74 Years | 3 (100.0%) | 2 (40.0%) |
| 75 Years and over | 6 (66.7%) | 0 (0.0%) |
Disability Class: Vision Difficulty
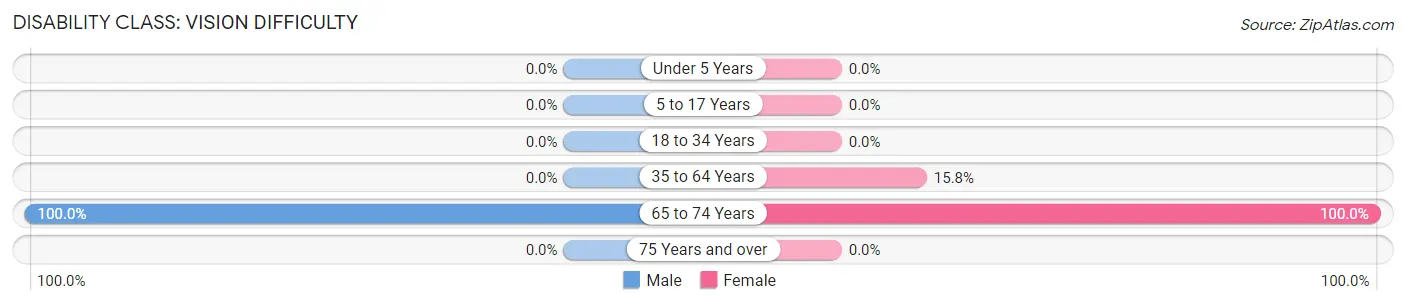
| Age Bracket | Male | Female |
| Under 5 Years | 0 (0.0%) | 0 (0.0%) |
| 5 to 17 Years | 0 (0.0%) | 0 (0.0%) |
| 18 to 34 Years | 0 (0.0%) | 0 (0.0%) |
| 35 to 64 Years | 0 (0.0%) | 3 (15.8%) |
| 65 to 74 Years | 3 (100.0%) | 5 (100.0%) |
| 75 Years and over | 0 (0.0%) | 0 (0.0%) |
Disability Class: Cognitive Difficulty
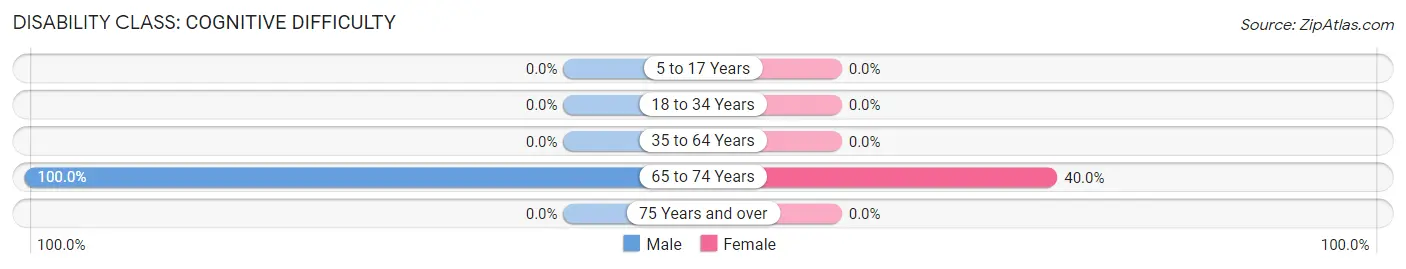
| Age Bracket | Male | Female |
| 5 to 17 Years | 0 (0.0%) | 0 (0.0%) |
| 18 to 34 Years | 0 (0.0%) | 0 (0.0%) |
| 35 to 64 Years | 0 (0.0%) | 0 (0.0%) |
| 65 to 74 Years | 3 (100.0%) | 2 (40.0%) |
| 75 Years and over | 0 (0.0%) | 0 (0.0%) |
Disability Class: Ambulatory Difficulty
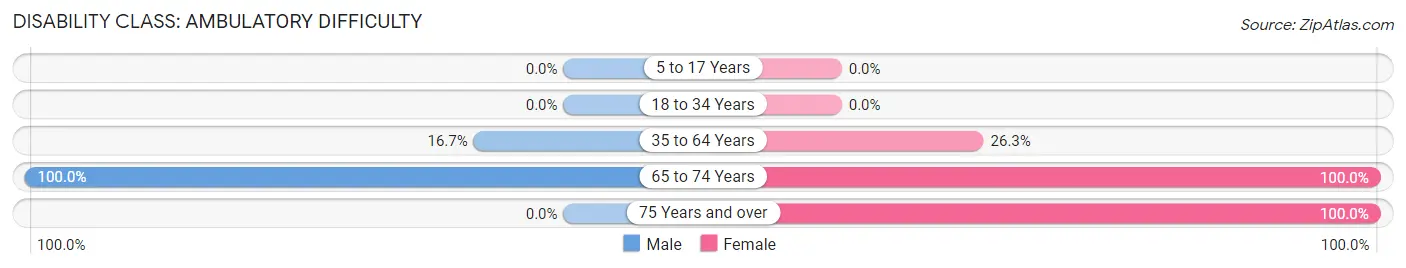
| Age Bracket | Male | Female |
| 5 to 17 Years | 0 (0.0%) | 0 (0.0%) |
| 18 to 34 Years | 0 (0.0%) | 0 (0.0%) |
| 35 to 64 Years | 2 (16.7%) | 5 (26.3%) |
| 65 to 74 Years | 3 (100.0%) | 5 (100.0%) |
| 75 Years and over | 0 (0.0%) | 11 (100.0%) |
Disability Class: Self-Care Difficulty
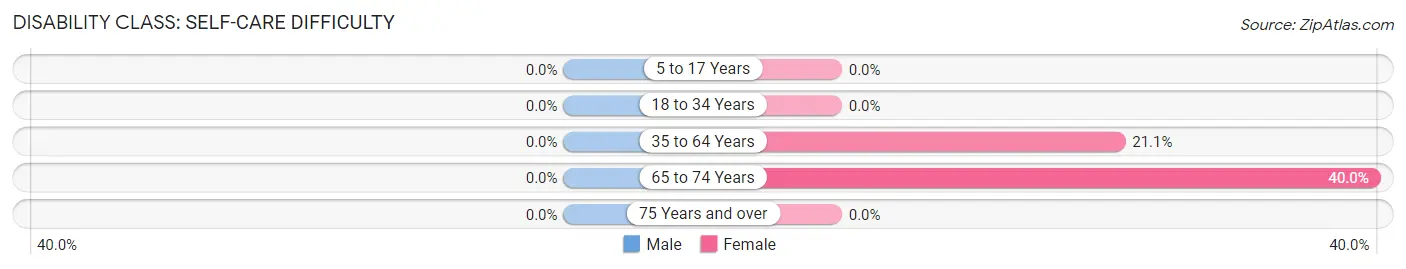
| Age Bracket | Male | Female |
| 5 to 17 Years | 0 (0.0%) | 0 (0.0%) |
| 18 to 34 Years | 0 (0.0%) | 0 (0.0%) |
| 35 to 64 Years | 0 (0.0%) | 4 (21.0%) |
| 65 to 74 Years | 0 (0.0%) | 2 (40.0%) |
| 75 Years and over | 0 (0.0%) | 0 (0.0%) |
Technology Access in Egypt
Computing Device Access in Egypt
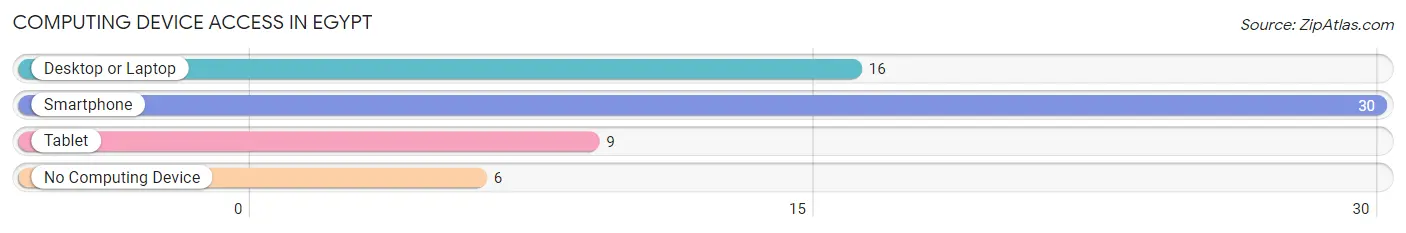
| Device Type | # Households | % Households |
| Desktop or Laptop | 16 | 44.4% |
| Smartphone | 30 | 83.3% |
| Tablet | 9 | 25.0% |
| No Computing Device | 6 | 16.7% |
| Total | 36 | 100.0% |
Internet Access in Egypt
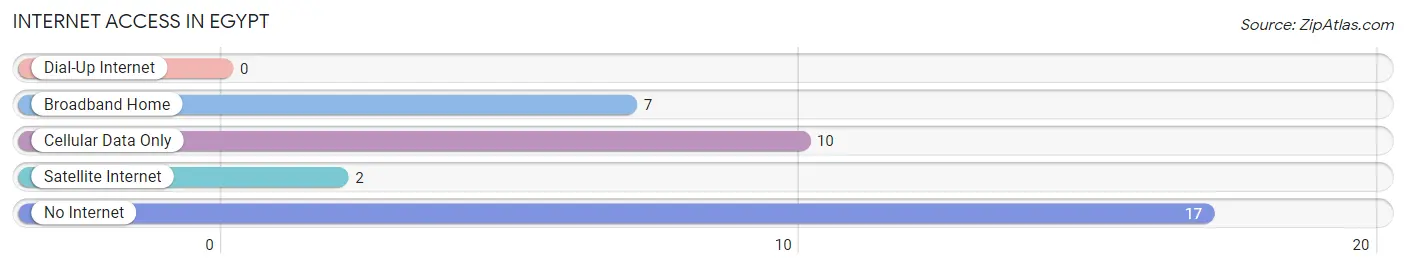
| Internet Type | # Households | % Households |
| Dial-Up Internet | 0 | 0.0% |
| Broadband Home | 7 | 19.4% |
| Cellular Data Only | 10 | 27.8% |
| Satellite Internet | 2 | 5.6% |
| No Internet | 17 | 47.2% |
| Total | 36 | 100.0% |
Egypt Summary
Egypt is a country located in the northeast corner of Africa, bordered by the Mediterranean Sea to the north, the Gaza Strip and Israel to the northeast, the Red Sea to the east, Sudan to the south, and Libya to the west. It is the most populous country in the Arab world and the second-most populous country in Africa, with a population of over 100 million people. Egypt is a transcontinental country, spanning the northeast corner of Africa and southwest corner of Asia by a land bridge formed by the Sinai Peninsula.
Geography
Egypt is a country of vast desert landscapes, rugged mountains, and the Nile River, which runs through the heart of the country. The Nile is the longest river in the world, and it is the lifeblood of Egypt, providing the country with water for drinking, irrigation, and transportation. The Nile Delta is a fertile region in the north of the country, where the river empties into the Mediterranean Sea. The majority of the population lives in this region, as it is the most agriculturally productive area in the country. The western desert is a vast expanse of sand and rock, with few settlements. The eastern desert is more mountainous, and is home to the Red Sea coast, which is a popular tourist destination.
History
Egypt has a long and rich history, dating back to the dawn of civilization. It was one of the earliest civilizations in the world, and was home to some of the earliest forms of writing, art, and architecture. The ancient Egyptians built the Great Pyramids of Giza, one of the Seven Wonders of the Ancient World, and the Great Sphinx of Giza, which still stands today.
Egypt was conquered by the Persians in 525 BC, and then by the Greeks in 332 BC. It was then conquered by the Romans in 30 BC, and then by the Arabs in 641 AD. The Arabs brought Islam to Egypt, and it remains the dominant religion in the country today.
In the 19th century, Egypt was conquered by the Ottoman Empire, and then by the British in 1882. The British ruled Egypt until 1952, when a revolution led by Gamal Abdel Nasser overthrew the monarchy and declared Egypt a republic. Nasser was the leader of Egypt until his death in 1970, and was succeeded by Anwar Sadat, who was assassinated in 1981. Hosni Mubarak was then elected president, and he ruled until 2011, when he was overthrown in a popular uprising.
Economy
Egypt has a mixed economy, with a large public sector and a growing private sector. The country is a major producer of oil and natural gas, and is a major exporter of cotton and other agricultural products. Tourism is also an important part of the economy, with millions of visitors coming to Egypt each year to visit its ancient monuments and archaeological sites.
The Egyptian economy has been struggling in recent years, due to a lack of foreign investment, high unemployment, and a weak currency. The government has implemented a number of reforms in an effort to improve the economy, including reducing subsidies, liberalizing the exchange rate, and encouraging foreign investment.
Demographics
Egypt is a diverse country, with a population of over 100 million people. The majority of the population is Arab, with a small minority of Bedouin, Nubian, and other ethnic groups. The official language is Arabic, and the majority of the population is Muslim.
Egypt is a young country, with a median age of 24.5 years. The population is growing rapidly, and is expected to reach over 150 million by 2050. The majority of the population lives in urban areas, with Cairo being the largest city.
Common Questions
What is Per Capita Income in Egypt?
Per Capita income in Egypt is $21,237.
What is the Median Family Income in Egypt?
Median Family Income in Egypt is $29,167.
What is the Median Household income in Egypt?
Median Household Income in Egypt is $29,167.
What is Income or Wage Gap in Egypt?
Income or Wage Gap in Egypt is 10.2%.
Women in Egypt earn 89.8 cents for every dollar earned by a man.
What is Inequality or Gini Index in Egypt?
Inequality or Gini Index in Egypt is 0.42.
What is the Total Population of Egypt?
Total Population of Egypt is 73.
What is the Total Male Population of Egypt?
Total Male Population of Egypt is 35.
What is the Total Female Population of Egypt?
Total Female Population of Egypt is 38.
What is the Ratio of Males per 100 Females in Egypt?
There are 92.11 Males per 100 Females in Egypt.
What is the Ratio of Females per 100 Males in Egypt?
There are 108.57 Females per 100 Males in Egypt.
What is the Median Population Age in Egypt?
Median Population Age in Egypt is 54.5 Years.
What is the Average Family Size in Egypt
Average Family Size in Egypt is 2.5 People.
What is the Average Household Size in Egypt
Average Household Size in Egypt is 2.0 People.
How Large is the Labor Force in Egypt?
There are 26 People in the Labor Forcein in Egypt.
What is the Percentage of People in the Labor Force in Egypt?
38.2% of People are in the Labor Force in Egypt.
What is the Unemployment Rate in Egypt?
Unemployment Rate in Egypt is 19.2%.