De Valls Bluff, AR Map & Demographics
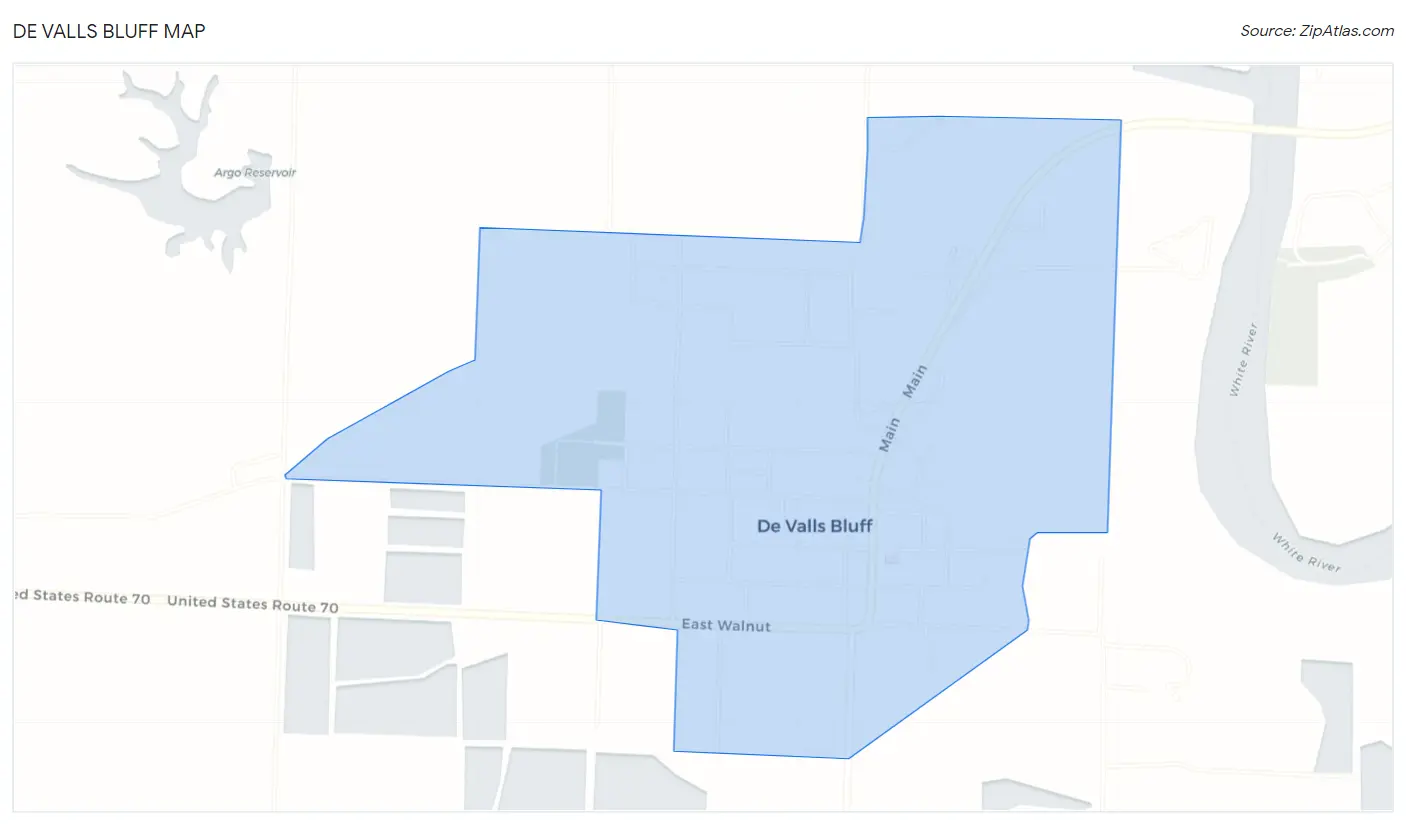
De Valls Bluff Map
De Valls Bluff Overview
$22,813
PER CAPITA INCOME
$43,409
AVG FAMILY INCOME
$23,056
AVG HOUSEHOLD INCOME
0.51
INEQUALITY / GINI INDEX
560
TOTAL POPULATION
246
MALE POPULATION
314
FEMALE POPULATION
78.34
MALES / 100 FEMALES
127.64
FEMALES / 100 MALES
54.8
MEDIAN AGE
3.4
AVG FAMILY SIZE
2.0
AVG HOUSEHOLD SIZE
145
LABOR FORCE [ PEOPLE ]
33.6%
PERCENT IN LABOR FORCE
De Valls Bluff Zip Codes
De Valls Bluff Area Codes
Income in De Valls Bluff
Income Overview in De Valls Bluff
Per Capita Income in De Valls Bluff is $22,813, while median incomes of families and households are $43,409 and $23,056 respectively.
| Characteristic | Number | Measure |
| Per Capita Income | 560 | $22,813 |
| Median Family Income | 110 | $43,409 |
| Mean Family Income | 110 | $66,853 |
| Median Household Income | 286 | $23,056 |
| Mean Household Income | 286 | $39,266 |
| Income Deficit | 110 | $0 |
| Wage / Income Gap (%) | 560 | 0.00% |
| Wage / Income Gap ($) | 560 | 100.00¢ per $1 |
| Gini / Inequality Index | 560 | 0.51 |
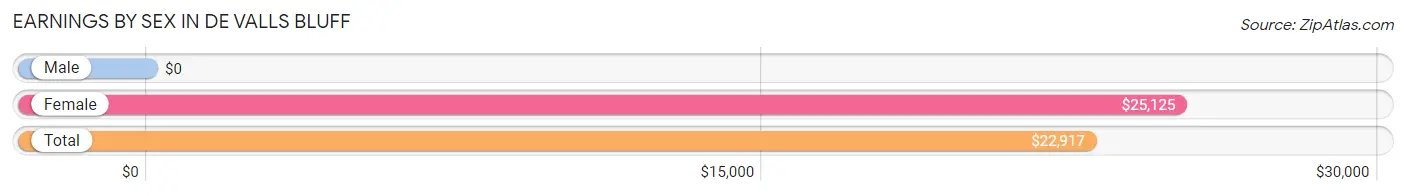
Earnings by Sex in De Valls Bluff
| Sex | Number | Average Earnings |
| Male | 59 (37.1%) | $0 |
| Female | 100 (62.9%) | $25,125 |
| Total | 159 (100.0%) | $22,917 |
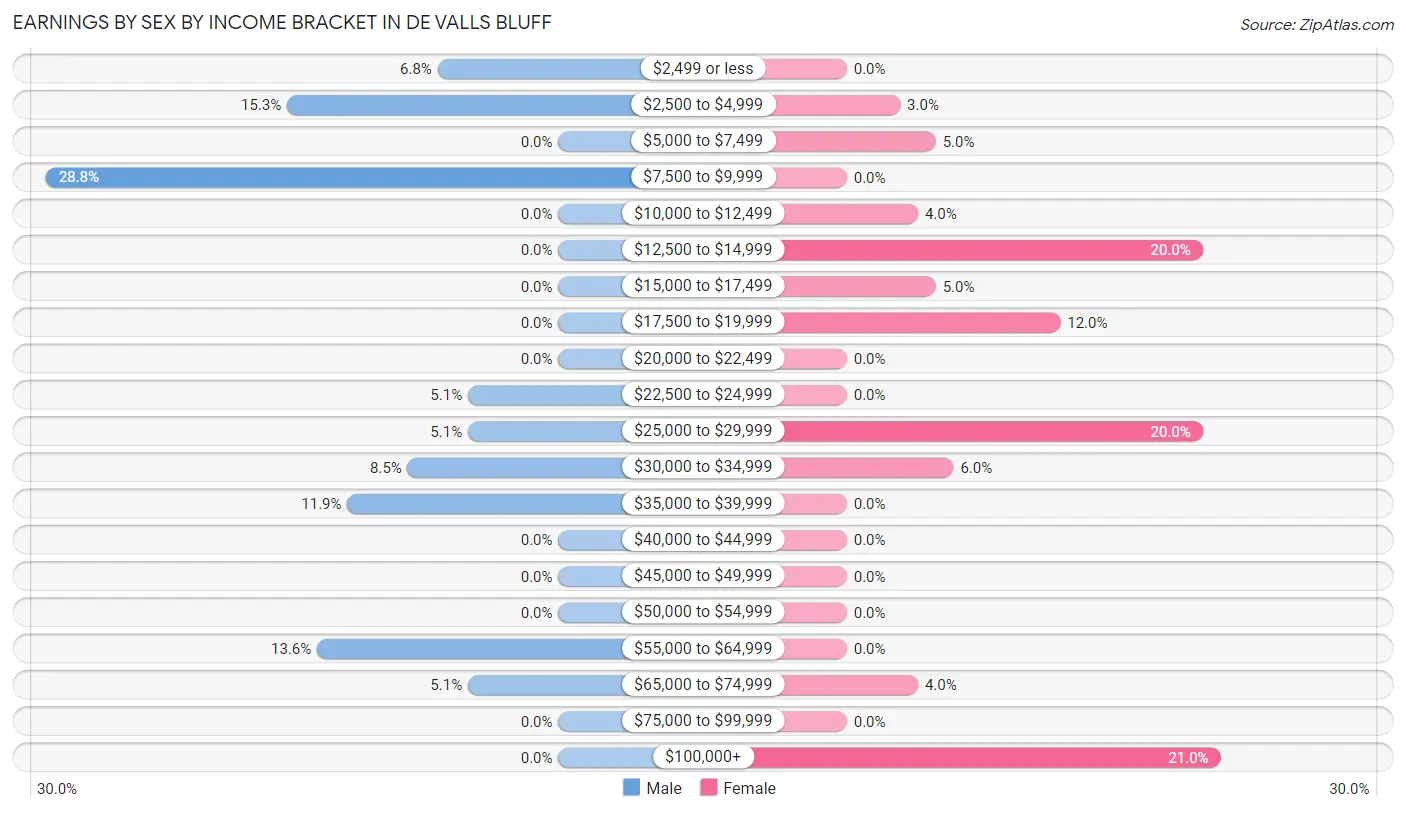
Earnings by Sex by Income Bracket in De Valls Bluff
The most common earnings brackets in De Valls Bluff are $7,500 to $9,999 for men (17 | 28.8%) and $100,000+ for women (21 | 21.0%).
| Income | Male | Female |
| $2,499 or less | 4 (6.8%) | 0 (0.0%) |
| $2,500 to $4,999 | 9 (15.2%) | 3 (3.0%) |
| $5,000 to $7,499 | 0 (0.0%) | 5 (5.0%) |
| $7,500 to $9,999 | 17 (28.8%) | 0 (0.0%) |
| $10,000 to $12,499 | 0 (0.0%) | 4 (4.0%) |
| $12,500 to $14,999 | 0 (0.0%) | 20 (20.0%) |
| $15,000 to $17,499 | 0 (0.0%) | 5 (5.0%) |
| $17,500 to $19,999 | 0 (0.0%) | 12 (12.0%) |
| $20,000 to $22,499 | 0 (0.0%) | 0 (0.0%) |
| $22,500 to $24,999 | 3 (5.1%) | 0 (0.0%) |
| $25,000 to $29,999 | 3 (5.1%) | 20 (20.0%) |
| $30,000 to $34,999 | 5 (8.5%) | 6 (6.0%) |
| $35,000 to $39,999 | 7 (11.9%) | 0 (0.0%) |
| $40,000 to $44,999 | 0 (0.0%) | 0 (0.0%) |
| $45,000 to $49,999 | 0 (0.0%) | 0 (0.0%) |
| $50,000 to $54,999 | 0 (0.0%) | 0 (0.0%) |
| $55,000 to $64,999 | 8 (13.6%) | 0 (0.0%) |
| $65,000 to $74,999 | 3 (5.1%) | 4 (4.0%) |
| $75,000 to $99,999 | 0 (0.0%) | 0 (0.0%) |
| $100,000+ | 0 (0.0%) | 21 (21.0%) |
| Total | 59 (100.0%) | 100 (100.0%) |
Earnings by Sex by Educational Attainment in De Valls Bluff
| Educational Attainment | Male Income | Female Income |
| Less than High School | - | - |
| High School Diploma | - | - |
| College or Associate's Degree | - | - |
| Bachelor's Degree | - | - |
| Graduate Degree | - | - |
| Total | - | - |
Family Income in De Valls Bluff
Family Income Brackets in De Valls Bluff
According to the De Valls Bluff family income data, there are 23 families falling into the $25,000 to $34,999 income range, which is the most common income bracket and makes up 20.9% of all families.
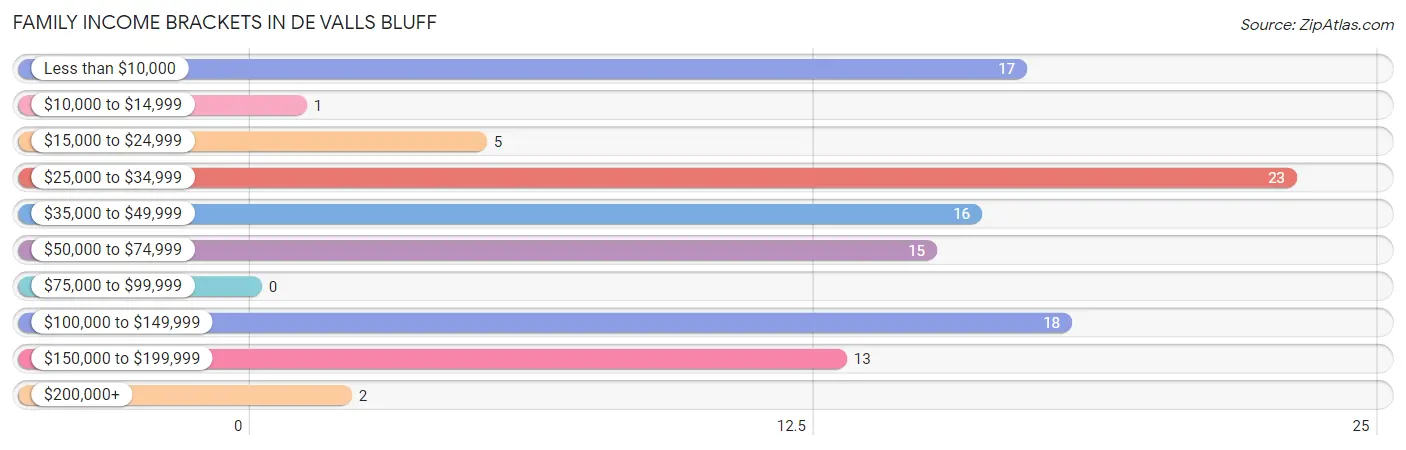
| Income Bracket | # Families | % Families |
| Less than $10,000 | 17 | 15.5% |
| $10,000 to $14,999 | 1 | 0.9% |
| $15,000 to $24,999 | 5 | 4.5% |
| $25,000 to $34,999 | 23 | 20.9% |
| $35,000 to $49,999 | 16 | 14.5% |
| $50,000 to $74,999 | 15 | 13.6% |
| $75,000 to $99,999 | 0 | 0.0% |
| $100,000 to $149,999 | 18 | 16.4% |
| $150,000 to $199,999 | 13 | 11.8% |
| $200,000+ | 2 | 1.8% |
Family Income by Famaliy Size in De Valls Bluff
2-person families (54 | 49.1%) account for the highest median family income in De Valls Bluff with $108,056 per family, while 2-person families (54 | 49.1%) have the highest median income of $54,028 per family member.
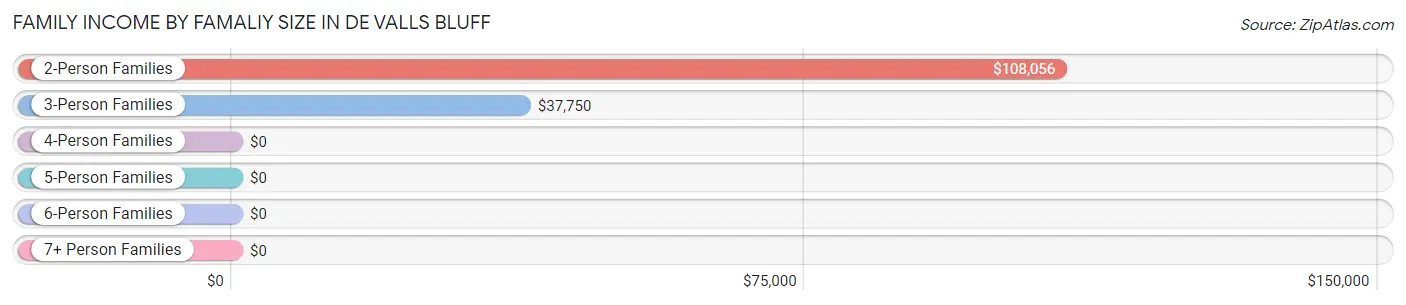
| Income Bracket | # Families | Median Income |
| 2-Person Families | 54 (49.1%) | $108,056 |
| 3-Person Families | 21 (19.1%) | $37,750 |
| 4-Person Families | 35 (31.8%) | $0 |
| 5-Person Families | 0 (0.0%) | $0 |
| 6-Person Families | 0 (0.0%) | $0 |
| 7+ Person Families | 0 (0.0%) | $0 |
| Total | 110 (100.0%) | $43,409 |
Family Income by Number of Earners in De Valls Bluff
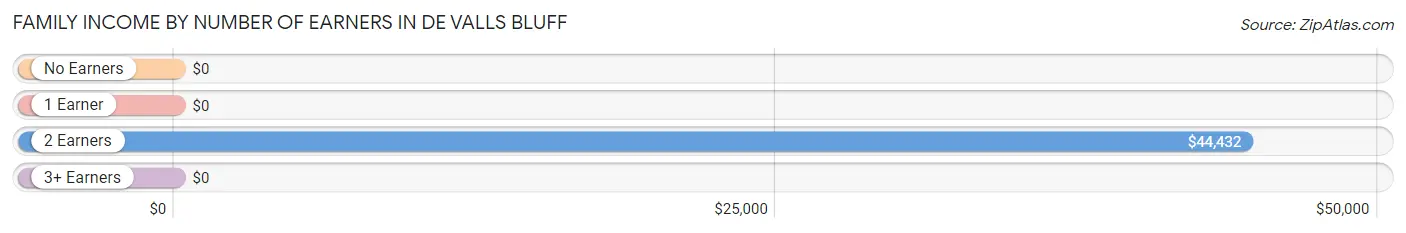
| Number of Earners | # Families | Median Income |
| No Earners | 33 (30.0%) | $0 |
| 1 Earner | 50 (45.5%) | $0 |
| 2 Earners | 27 (24.5%) | $44,432 |
| 3+ Earners | 0 (0.0%) | $0 |
| Total | 110 (100.0%) | $43,409 |
Household Income in De Valls Bluff
Household Income Brackets in De Valls Bluff
With 73 households falling in the category, the $15,000 to $24,999 income range is the most frequent in De Valls Bluff, accounting for 25.5% of all households.
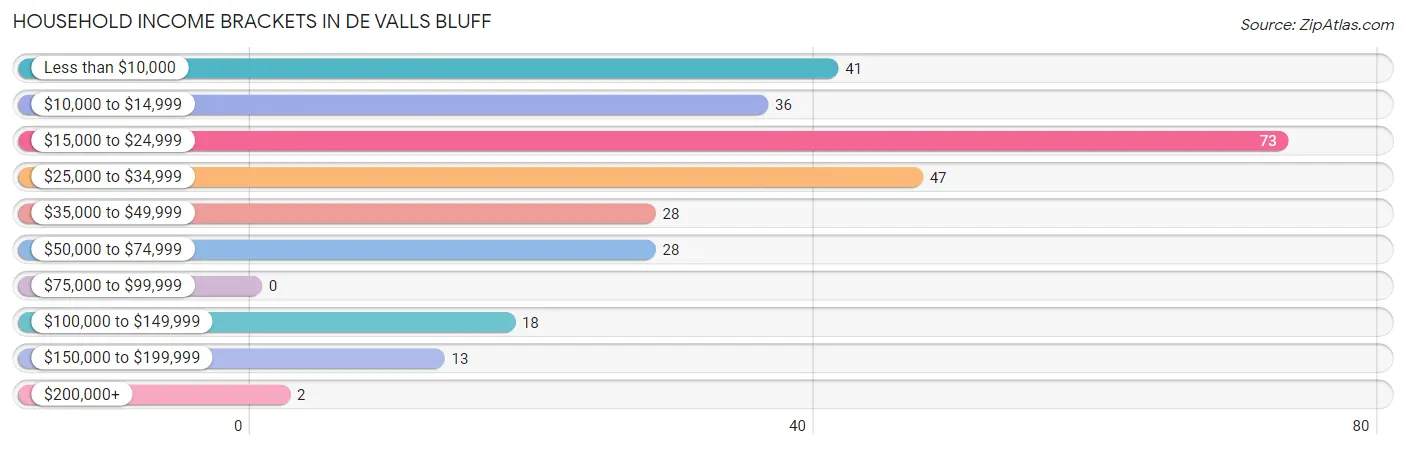
| Income Bracket | # Households | % Households |
| Less than $10,000 | 41 | 14.3% |
| $10,000 to $14,999 | 36 | 12.6% |
| $15,000 to $24,999 | 73 | 25.5% |
| $25,000 to $34,999 | 47 | 16.4% |
| $35,000 to $49,999 | 28 | 9.8% |
| $50,000 to $74,999 | 28 | 9.8% |
| $75,000 to $99,999 | 0 | 0.0% |
| $100,000 to $149,999 | 18 | 6.3% |
| $150,000 to $199,999 | 13 | 4.5% |
| $200,000+ | 2 | 0.7% |
Household Income by Householder Age in De Valls Bluff
The median household income in De Valls Bluff is $23,056, with the highest median household income of $57,500 found in the 45 to 64 years age bracket for the primary householder. A total of 30 households (10.5%) fall into this category.
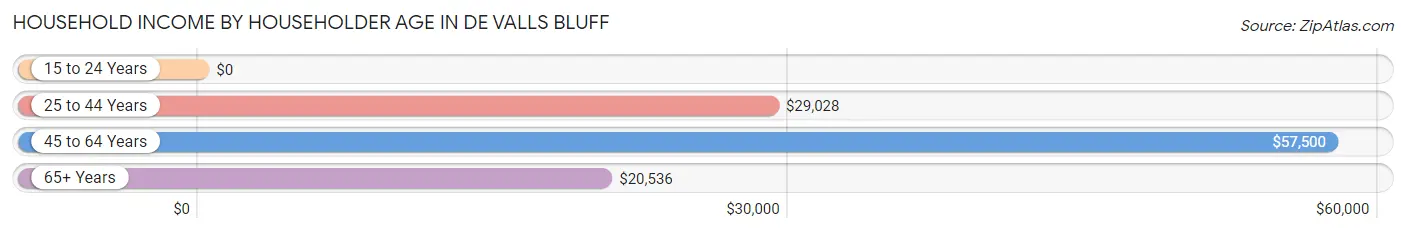
| Income Bracket | # Households | Median Income |
| 15 to 24 Years | 0 (0.0%) | $0 |
| 25 to 44 Years | 61 (21.3%) | $29,028 |
| 45 to 64 Years | 30 (10.5%) | $57,500 |
| 65+ Years | 195 (68.2%) | $20,536 |
| Total | 286 (100.0%) | $23,056 |
Poverty in De Valls Bluff
Income Below Poverty by Sex and Age in De Valls Bluff
With 28.1% poverty level for males and 22.3% for females among the residents of De Valls Bluff, 6 to 11 year old males and 16 and 17 year old females are the most vulnerable to poverty, with 14 males (100.0%) and 3 females (100.0%) in their respective age groups living below the poverty level.
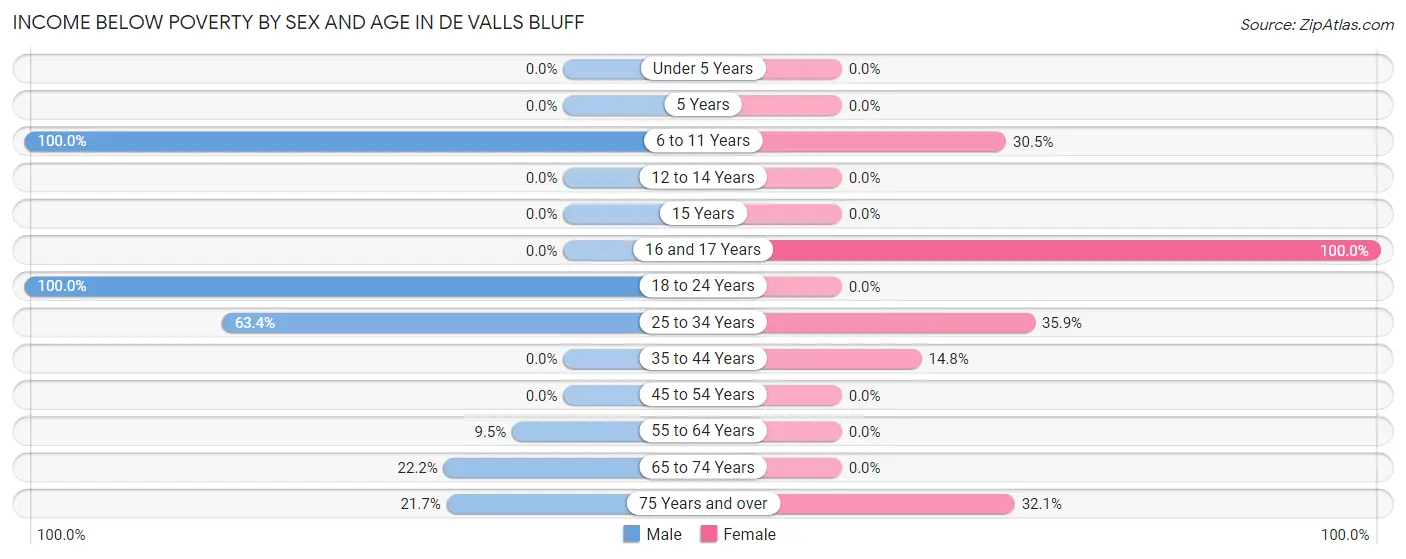
| Age Bracket | Male | Female |
| Under 5 Years | 0 (0.0%) | 0 (0.0%) |
| 5 Years | 0 (0.0%) | 0 (0.0%) |
| 6 to 11 Years | 14 (100.0%) | 18 (30.5%) |
| 12 to 14 Years | 0 (0.0%) | 0 (0.0%) |
| 15 Years | 0 (0.0%) | 0 (0.0%) |
| 16 and 17 Years | 0 (0.0%) | 3 (100.0%) |
| 18 to 24 Years | 3 (100.0%) | 0 (0.0%) |
| 25 to 34 Years | 26 (63.4%) | 19 (35.8%) |
| 35 to 44 Years | 0 (0.0%) | 4 (14.8%) |
| 45 to 54 Years | 0 (0.0%) | 0 (0.0%) |
| 55 to 64 Years | 2 (9.5%) | 0 (0.0%) |
| 65 to 74 Years | 6 (22.2%) | 0 (0.0%) |
| 75 Years and over | 18 (21.7%) | 26 (32.1%) |
| Total | 69 (28.1%) | 70 (22.3%) |
Income Above Poverty by Sex and Age in De Valls Bluff
According to the poverty statistics in De Valls Bluff, males aged under 5 years and females aged 12 to 14 years are the age groups that are most secure financially, with 100.0% of males and 100.0% of females in these age groups living above the poverty line.
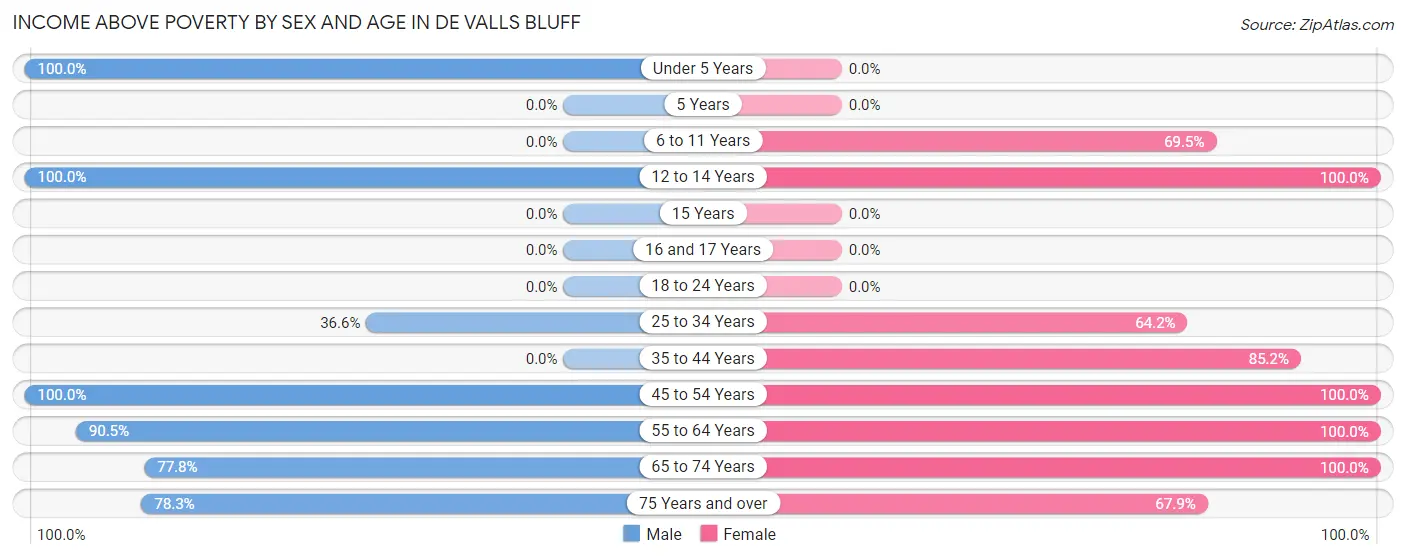
| Age Bracket | Male | Female |
| Under 5 Years | 46 (100.0%) | 0 (0.0%) |
| 5 Years | 0 (0.0%) | 0 (0.0%) |
| 6 to 11 Years | 0 (0.0%) | 41 (69.5%) |
| 12 to 14 Years | 4 (100.0%) | 5 (100.0%) |
| 15 Years | 0 (0.0%) | 0 (0.0%) |
| 16 and 17 Years | 0 (0.0%) | 0 (0.0%) |
| 18 to 24 Years | 0 (0.0%) | 0 (0.0%) |
| 25 to 34 Years | 15 (36.6%) | 34 (64.1%) |
| 35 to 44 Years | 0 (0.0%) | 23 (85.2%) |
| 45 to 54 Years | 7 (100.0%) | 24 (100.0%) |
| 55 to 64 Years | 19 (90.5%) | 5 (100.0%) |
| 65 to 74 Years | 21 (77.8%) | 57 (100.0%) |
| 75 Years and over | 65 (78.3%) | 55 (67.9%) |
| Total | 177 (72.0%) | 244 (77.7%) |
Income Below Poverty Among Married-Couple Families in De Valls Bluff
The poverty statistics for married-couple families in De Valls Bluff show that 29.8% or 17 of the total 57 families live below the poverty line. Families with 1 or 2 children have the highest poverty rate of 58.6%, comprising of 17 families. On the other hand, families with no children have the lowest poverty rate of 0.0%, which includes 0 families.
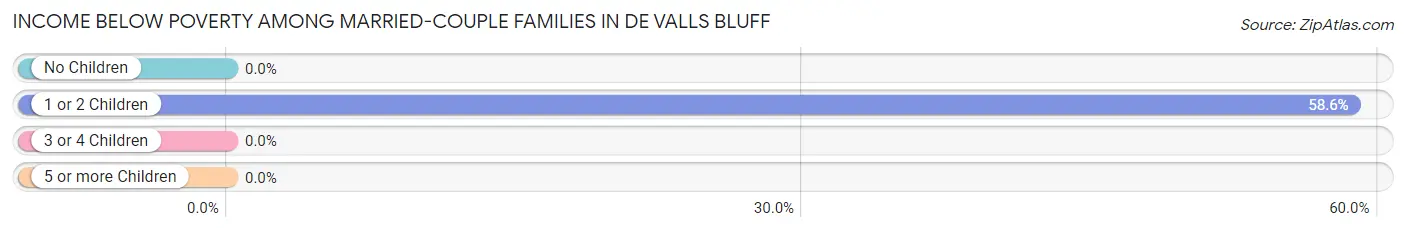
| Children | Above Poverty | Below Poverty |
| No Children | 28 (100.0%) | 0 (0.0%) |
| 1 or 2 Children | 12 (41.4%) | 17 (58.6%) |
| 3 or 4 Children | 0 (0.0%) | 0 (0.0%) |
| 5 or more Children | 0 (0.0%) | 0 (0.0%) |
| Total | 40 (70.2%) | 17 (29.8%) |
Income Below Poverty Among Single-Parent Households in De Valls Bluff
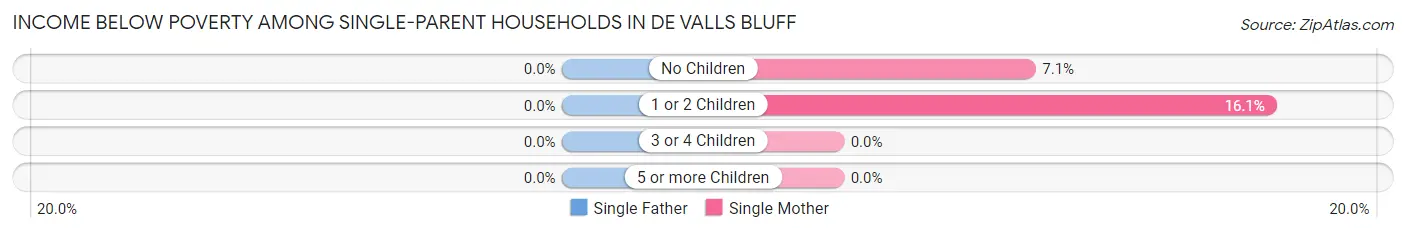
| Children | Single Father | Single Mother |
| No Children | 0 (0.0%) | 1 (7.1%) |
| 1 or 2 Children | 0 (0.0%) | 5 (16.1%) |
| 3 or 4 Children | 0 (0.0%) | 0 (0.0%) |
| 5 or more Children | 0 (0.0%) | 0 (0.0%) |
| Total | 0 (0.0%) | 6 (13.3%) |
Income Below Poverty Among Married-Couple vs Single-Parent Households in De Valls Bluff
The poverty data for De Valls Bluff shows that 17 of the married-couple family households (29.8%) and 6 of the single-parent households (11.3%) are living below the poverty level. Within the married-couple family households, those with 1 or 2 children have the highest poverty rate, with 17 households (58.6%) falling below the poverty line. Among the single-parent households, those with 1 or 2 children have the highest poverty rate, with 5 household (16.1%) living below poverty.
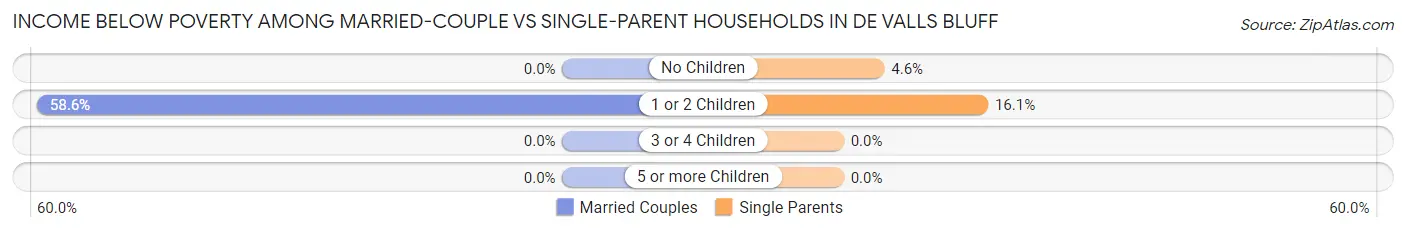
| Children | Married-Couple Families | Single-Parent Households |
| No Children | 0 (0.0%) | 1 (4.5%) |
| 1 or 2 Children | 17 (58.6%) | 5 (16.1%) |
| 3 or 4 Children | 0 (0.0%) | 0 (0.0%) |
| 5 or more Children | 0 (0.0%) | 0 (0.0%) |
| Total | 17 (29.8%) | 6 (11.3%) |
Race in De Valls Bluff
The most populous races in De Valls Bluff are White / Caucasian (473 | 84.5%), Black / African American (81 | 14.5%), and Two or more Races (6 | 1.1%).
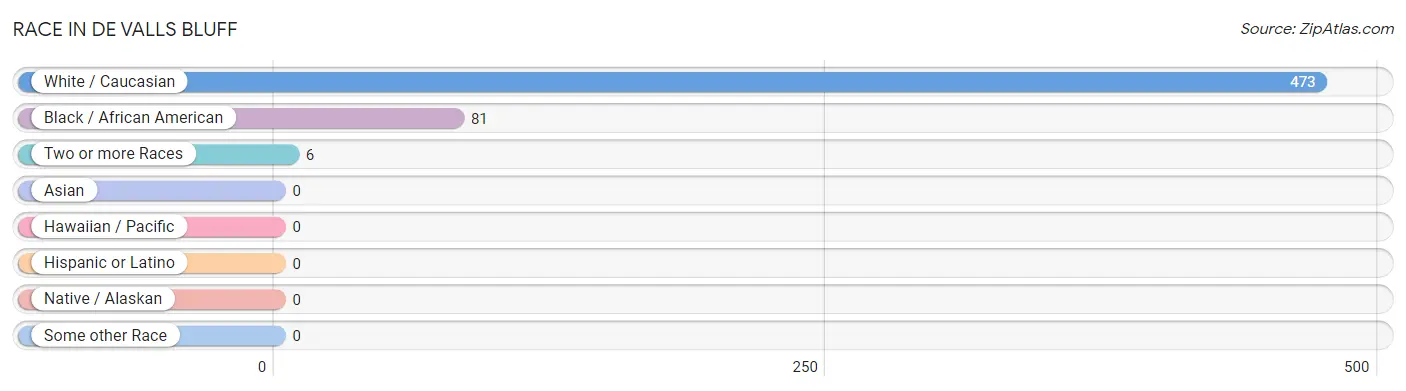
| Race | # Population | % Population |
| Asian | 0 | 0.0% |
| Black / African American | 81 | 14.5% |
| Hawaiian / Pacific | 0 | 0.0% |
| Hispanic or Latino | 0 | 0.0% |
| Native / Alaskan | 0 | 0.0% |
| White / Caucasian | 473 | 84.5% |
| Two or more Races | 6 | 1.1% |
| Some other Race | 0 | 0.0% |
| Total | 560 | 100.0% |
Ancestry in De Valls Bluff
The most populous ancestries reported in De Valls Bluff are Irish (78 | 13.9%), German (31 | 5.5%), English (11 | 2.0%), French (6 | 1.1%), and American (2 | 0.4%), together accounting for 22.9% of all De Valls Bluff residents.
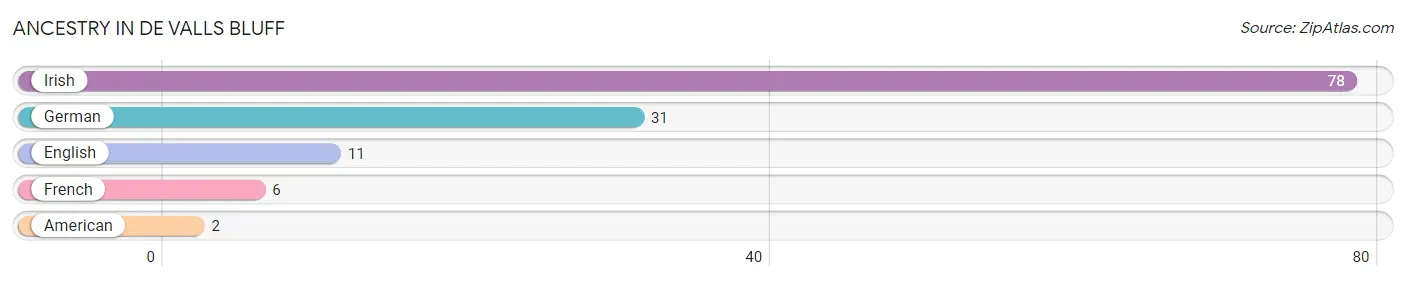
| Ancestry | # Population | % Population |
| American | 2 | 0.4% |
| English | 11 | 2.0% |
| French | 6 | 1.1% |
| German | 31 | 5.5% |
| Irish | 78 | 13.9% | View All 5 Rows |
Immigrants in De Valls Bluff

| Immigration Origin | # Population | % Population | View All 0 Rows |
Sex and Age in De Valls Bluff
Sex and Age in De Valls Bluff
The most populous age groups in De Valls Bluff are Under 5 Years (46 | 18.7%) for men and 5 to 9 Years (56 | 17.8%) for women.
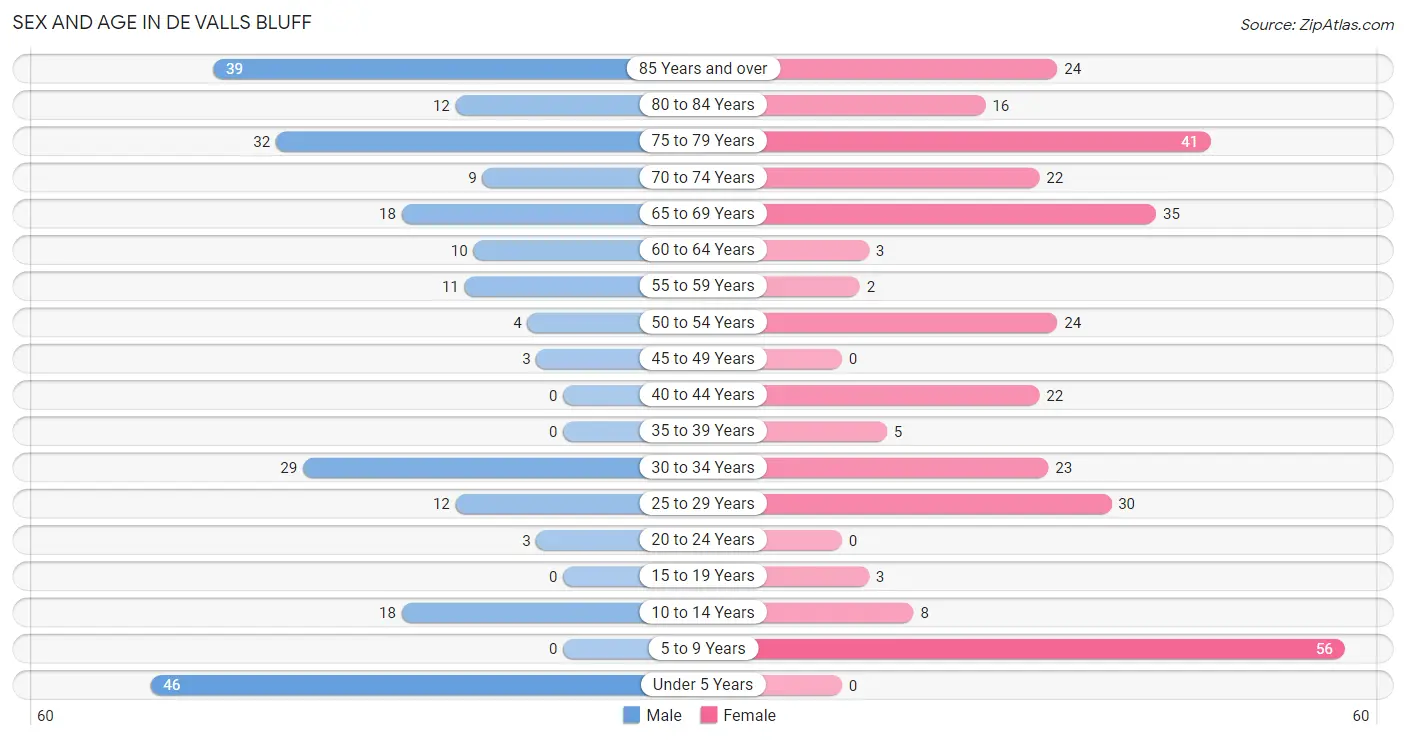
| Age Bracket | Male | Female |
| Under 5 Years | 46 (18.7%) | 0 (0.0%) |
| 5 to 9 Years | 0 (0.0%) | 56 (17.8%) |
| 10 to 14 Years | 18 (7.3%) | 8 (2.5%) |
| 15 to 19 Years | 0 (0.0%) | 3 (1.0%) |
| 20 to 24 Years | 3 (1.2%) | 0 (0.0%) |
| 25 to 29 Years | 12 (4.9%) | 30 (9.6%) |
| 30 to 34 Years | 29 (11.8%) | 23 (7.3%) |
| 35 to 39 Years | 0 (0.0%) | 5 (1.6%) |
| 40 to 44 Years | 0 (0.0%) | 22 (7.0%) |
| 45 to 49 Years | 3 (1.2%) | 0 (0.0%) |
| 50 to 54 Years | 4 (1.6%) | 24 (7.6%) |
| 55 to 59 Years | 11 (4.5%) | 2 (0.6%) |
| 60 to 64 Years | 10 (4.1%) | 3 (1.0%) |
| 65 to 69 Years | 18 (7.3%) | 35 (11.2%) |
| 70 to 74 Years | 9 (3.7%) | 22 (7.0%) |
| 75 to 79 Years | 32 (13.0%) | 41 (13.1%) |
| 80 to 84 Years | 12 (4.9%) | 16 (5.1%) |
| 85 Years and over | 39 (15.9%) | 24 (7.6%) |
| Total | 246 (100.0%) | 314 (100.0%) |
Families and Households in De Valls Bluff
Median Family Size in De Valls Bluff
The median family size in De Valls Bluff is 3.42 persons per family, with single female/mother families (45 | 40.9%) accounting for the largest median family size of 3.67 persons per family. On the other hand, married-couple families (57 | 51.8%) represent the smallest median family size with 3.21 persons per family.
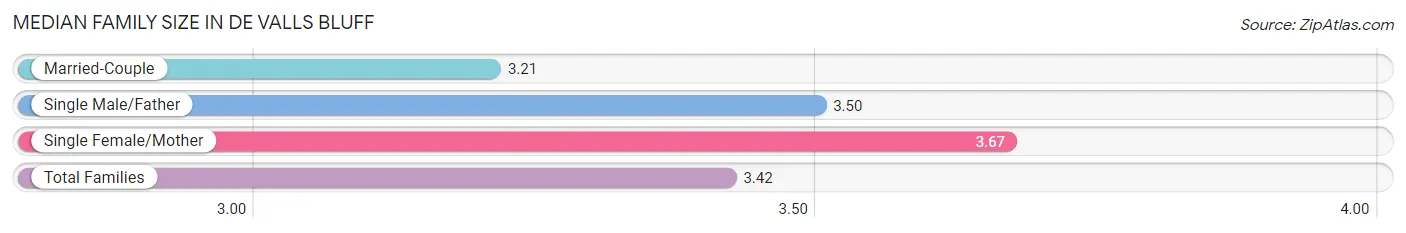
| Family Type | # Families | Family Size |
| Married-Couple | 57 (51.8%) | 3.21 |
| Single Male/Father | 8 (7.3%) | 3.50 |
| Single Female/Mother | 45 (40.9%) | 3.67 |
| Total Families | 110 (100.0%) | 3.42 |
Median Household Size in De Valls Bluff
The median household size in De Valls Bluff is 1.96 persons per household, with single female/mother households (45 | 15.7%) accounting for the largest median household size of 3.71 persons per household. non-family households (176 | 61.5%) represent the smallest median household size with 1.03 persons per household.
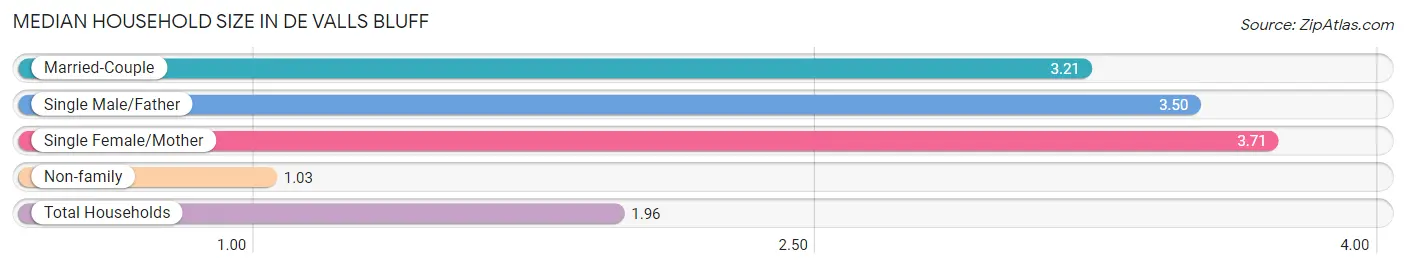
| Household Type | # Households | Household Size |
| Married-Couple | 57 (19.9%) | 3.21 |
| Single Male/Father | 8 (2.8%) | 3.50 |
| Single Female/Mother | 45 (15.7%) | 3.71 |
| Non-family | 176 (61.5%) | 1.03 |
| Total Households | 286 (100.0%) | 1.96 |
Household Size by Marriage Status in De Valls Bluff
Out of a total of 286 households in De Valls Bluff, 110 (38.5%) are family households, while 176 (61.5%) are nonfamily households. The most numerous type of family households are 2-person households, comprising 53, and the most common type of nonfamily households are 1-person households, comprising 174.
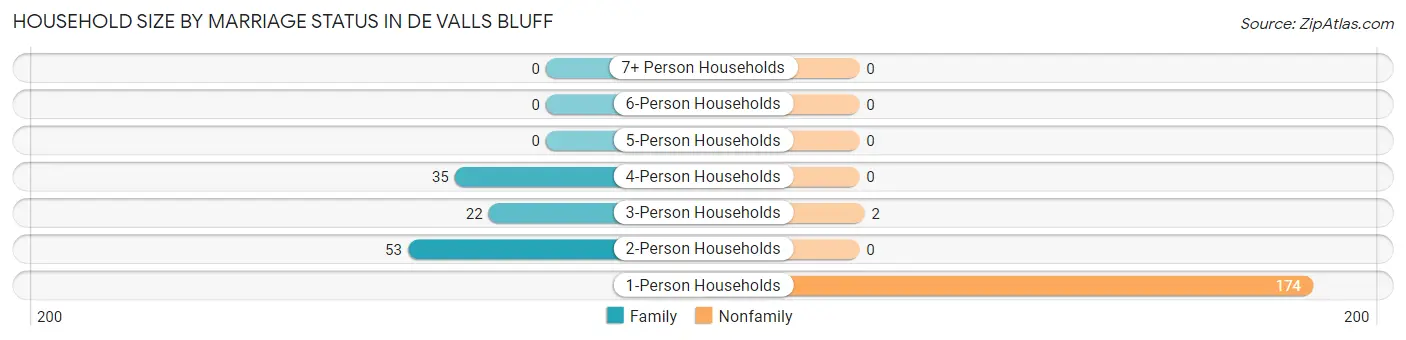
| Household Size | Family Households | Nonfamily Households |
| 1-Person Households | - | 174 (60.8%) |
| 2-Person Households | 53 (18.5%) | 0 (0.0%) |
| 3-Person Households | 22 (7.7%) | 2 (0.7%) |
| 4-Person Households | 35 (12.2%) | 0 (0.0%) |
| 5-Person Households | 0 (0.0%) | 0 (0.0%) |
| 6-Person Households | 0 (0.0%) | 0 (0.0%) |
| 7+ Person Households | 0 (0.0%) | 0 (0.0%) |
| Total | 110 (38.5%) | 176 (61.5%) |
Female Fertility in De Valls Bluff
Fertility by Age in De Valls Bluff
| Age Bracket | Women with Births | Births / 1,000 Women |
| 15 to 19 years | 0 (0.0%) | 0.0 |
| 20 to 34 years | 0 (0.0%) | 0.0 |
| 35 to 50 years | 0 (0.0%) | 0.0 |
| Total | 0 (0.0%) | 0.0 |
Fertility by Age by Marriage Status in De Valls Bluff
| Age Bracket | Married | Unmarried |
| 15 to 19 years | 0 (0.0%) | 0 (0.0%) |
| 20 to 34 years | 0 (0.0%) | 0 (0.0%) |
| 35 to 50 years | 0 (0.0%) | 0 (0.0%) |
| Total | 0 (0.0%) | 0 (0.0%) |
Fertility by Education in De Valls Bluff
| Educational Attainment | Women with Births | Births / 1,000 Women |
| Less than High School | 0 (0.0%) | 0.0 |
| High School Diploma | 0 (0.0%) | 0.0 |
| College or Associate's Degree | 0 (0.0%) | 0.0 |
| Bachelor's Degree | 0 (0.0%) | 0.0 |
| Graduate Degree | 0 (0.0%) | 0.0 |
| Total | 0 (0.0%) | 0.0 |
Fertility by Education by Marriage Status in De Valls Bluff
| Educational Attainment | Married | Unmarried |
| Less than High School | 0 (0.0%) | 0 (0.0%) |
| High School Diploma | 0 (0.0%) | 0 (0.0%) |
| College or Associate's Degree | 0 (0.0%) | 0 (0.0%) |
| Bachelor's Degree | 0 (0.0%) | 0 (0.0%) |
| Graduate Degree | 0 (0.0%) | 0 (0.0%) |
| Total | 0 (0.0%) | 0 (0.0%) |
Employment Characteristics in De Valls Bluff
Employment by Class of Employer in De Valls Bluff
Among the 133 employed individuals in De Valls Bluff, private company employees (109 | 82.0%), self-employed (not incorporated) (17 | 12.8%), and not-for-profit organizations (5 | 3.8%) make up the most common classes of employment.
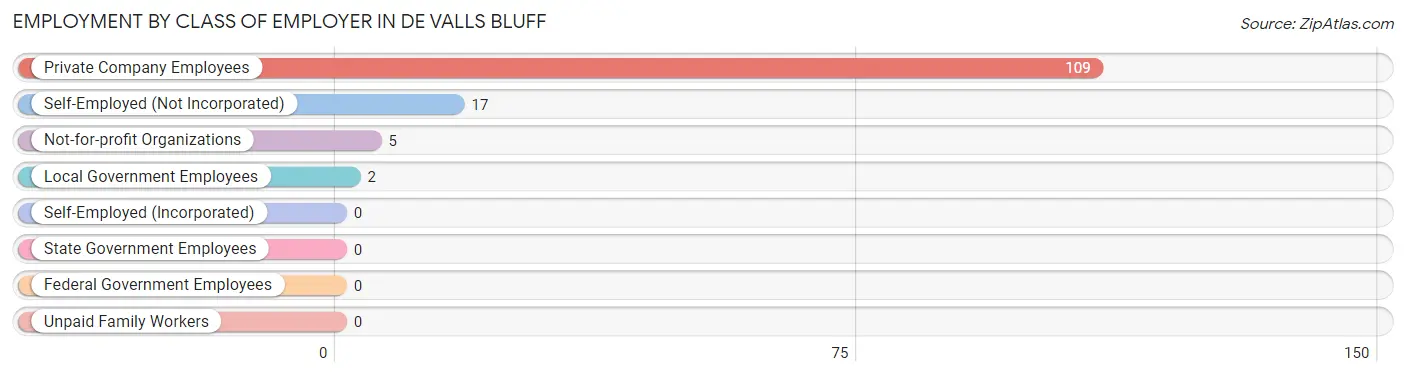
| Employer Class | # Employees | % Employees |
| Private Company Employees | 109 | 82.0% |
| Self-Employed (Incorporated) | 0 | 0.0% |
| Self-Employed (Not Incorporated) | 17 | 12.8% |
| Not-for-profit Organizations | 5 | 3.8% |
| Local Government Employees | 2 | 1.5% |
| State Government Employees | 0 | 0.0% |
| Federal Government Employees | 0 | 0.0% |
| Unpaid Family Workers | 0 | 0.0% |
| Total | 133 | 100.0% |
Employment Status by Age in De Valls Bluff
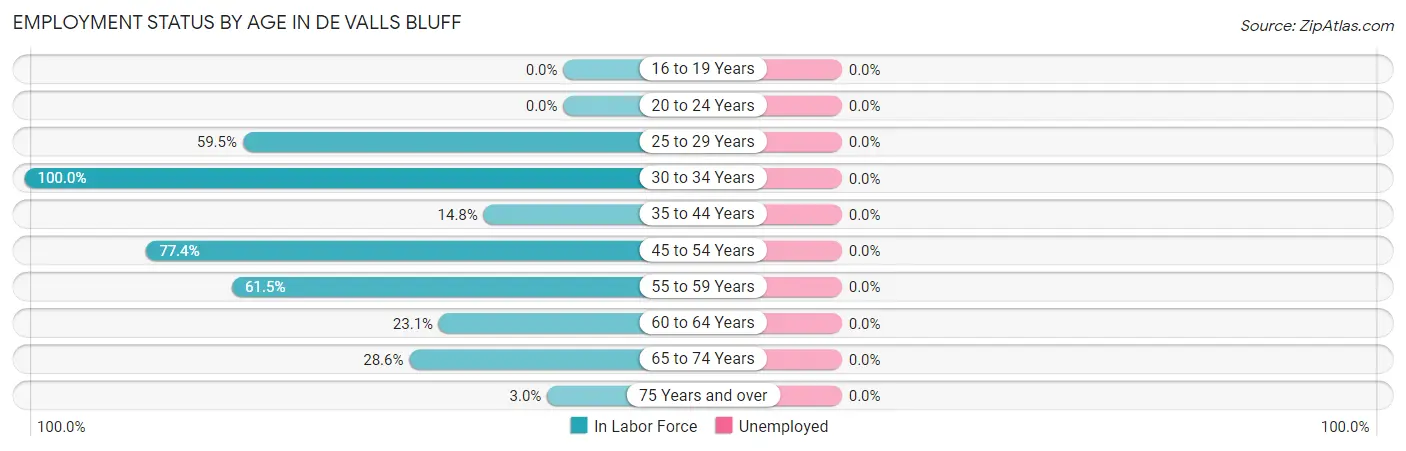
| Age Bracket | In Labor Force | Unemployed |
| 16 to 19 Years | 0 (0.0%) | 0 (0.0%) |
| 20 to 24 Years | 0 (0.0%) | 0 (0.0%) |
| 25 to 29 Years | 25 (59.5%) | 0 (0.0%) |
| 30 to 34 Years | 52 (100.0%) | 0 (0.0%) |
| 35 to 44 Years | 4 (14.8%) | 0 (0.0%) |
| 45 to 54 Years | 24 (77.4%) | 0 (0.0%) |
| 55 to 59 Years | 8 (61.5%) | 0 (0.0%) |
| 60 to 64 Years | 3 (23.1%) | 0 (0.0%) |
| 65 to 74 Years | 24 (28.6%) | 0 (0.0%) |
| 75 Years and over | 5 (3.0%) | 0 (0.0%) |
| Total | 145 (33.6%) | 0 (0.0%) |
Employment Status by Educational Attainment in De Valls Bluff
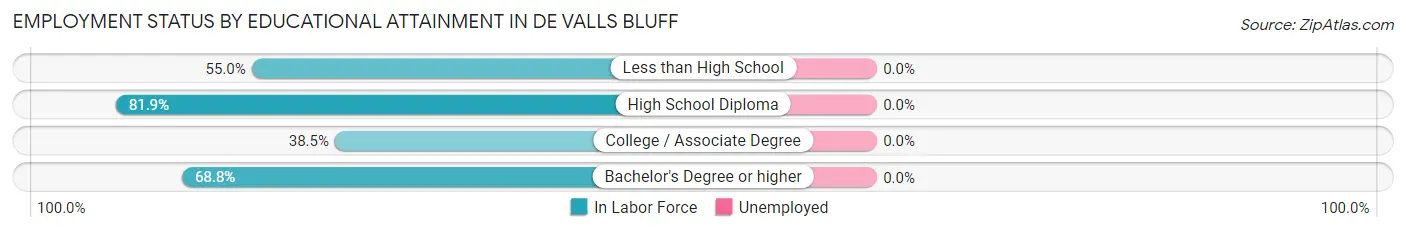
| Educational Attainment | In Labor Force | Unemployed |
| Less than High School | 22 (55.0%) | 0 (0.0%) |
| High School Diploma | 68 (81.9%) | 0 (0.0%) |
| College / Associate Degree | 15 (38.5%) | 0 (0.0%) |
| Bachelor's Degree or higher | 11 (68.8%) | 0 (0.0%) |
| Total | 116 (65.2%) | 0 (0.0%) |
Employment Occupations by Sex in De Valls Bluff
Management, Business, Science and Arts Occupations
The most common Management, Business, Science and Arts occupations in De Valls Bluff are Management (29 | 20.0%), and Health Diagnosing & Treating (5 | 3.5%).
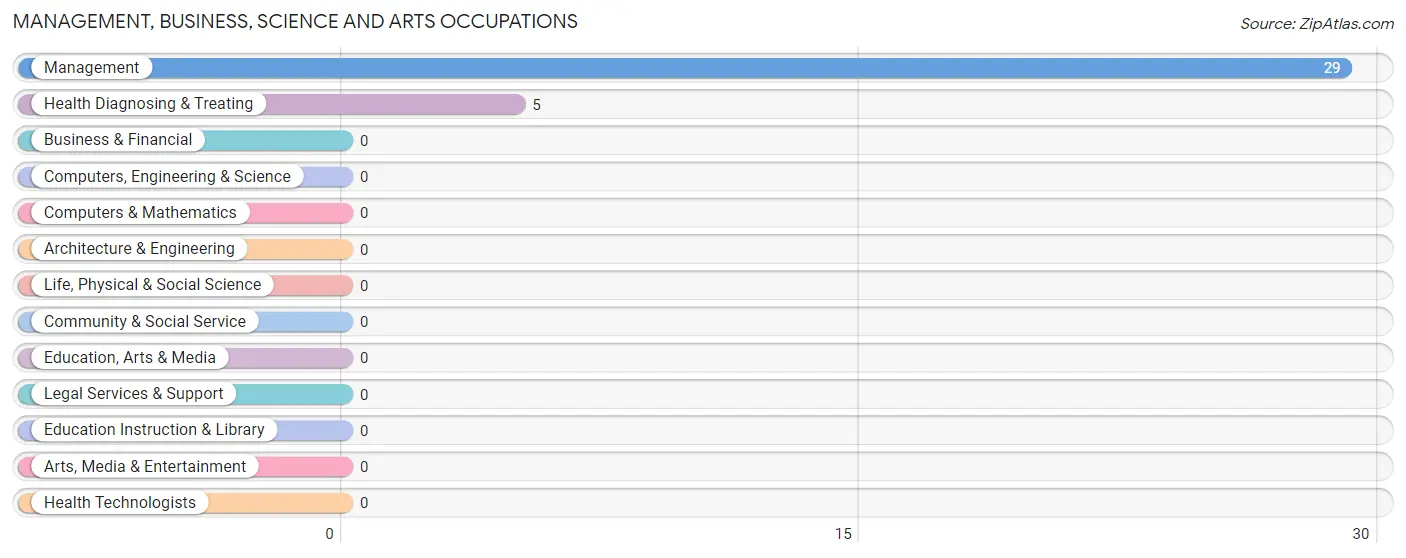
Management, Business, Science and Arts Occupations by Sex
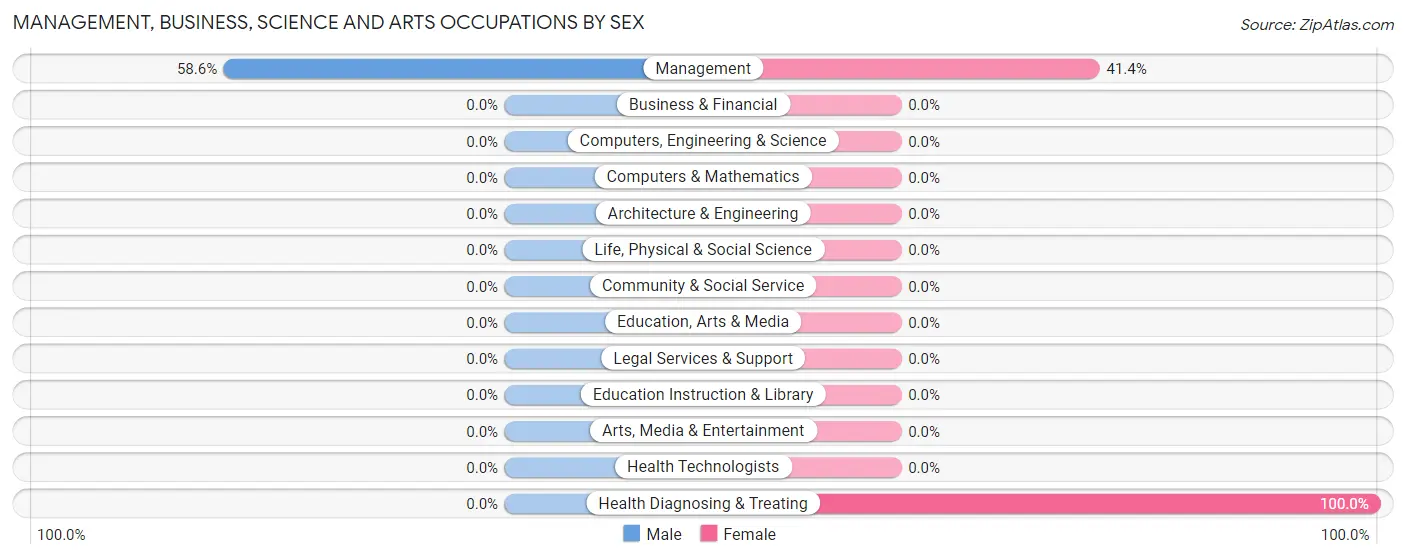
| Occupation | Male | Female |
| Management | 17 (58.6%) | 12 (41.4%) |
| Business & Financial | 0 (0.0%) | 0 (0.0%) |
| Computers, Engineering & Science | 0 (0.0%) | 0 (0.0%) |
| Computers & Mathematics | 0 (0.0%) | 0 (0.0%) |
| Architecture & Engineering | 0 (0.0%) | 0 (0.0%) |
| Life, Physical & Social Science | 0 (0.0%) | 0 (0.0%) |
| Community & Social Service | 0 (0.0%) | 0 (0.0%) |
| Education, Arts & Media | 0 (0.0%) | 0 (0.0%) |
| Legal Services & Support | 0 (0.0%) | 0 (0.0%) |
| Education Instruction & Library | 0 (0.0%) | 0 (0.0%) |
| Arts, Media & Entertainment | 0 (0.0%) | 0 (0.0%) |
| Health Diagnosing & Treating | 0 (0.0%) | 5 (100.0%) |
| Health Technologists | 0 (0.0%) | 0 (0.0%) |
| Total (Category) | 17 (50.0%) | 17 (50.0%) |
| Total (Overall) | 59 (40.7%) | 86 (59.3%) |
Services Occupations
The most common Services occupations in De Valls Bluff are Healthcare Support (4 | 2.8%), and Personal Care & Service (2 | 1.4%).
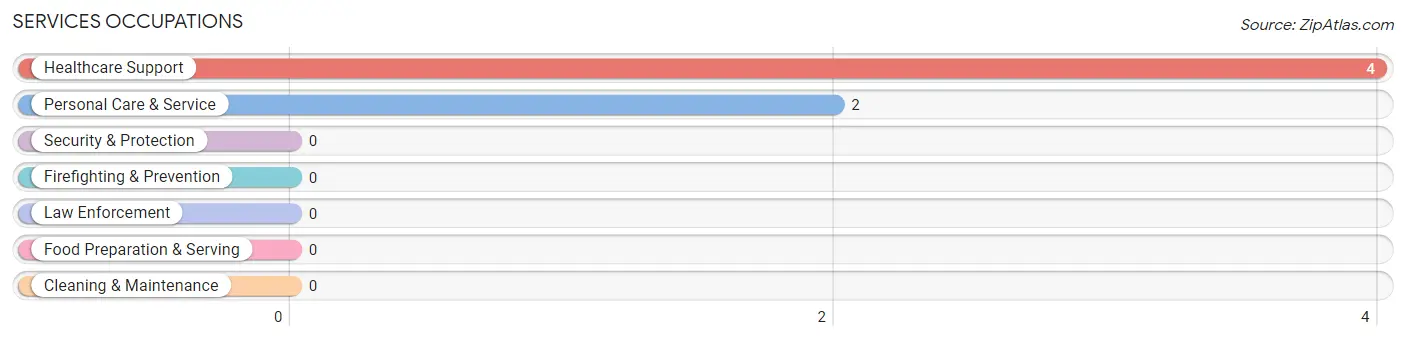
Services Occupations by Sex
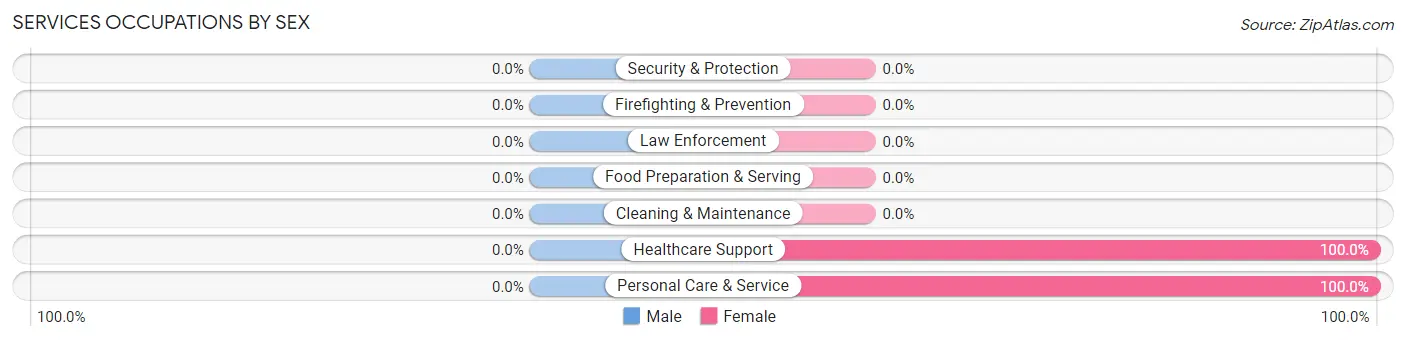
| Occupation | Male | Female |
| Healthcare Support | 0 (0.0%) | 4 (100.0%) |
| Security & Protection | 0 (0.0%) | 0 (0.0%) |
| Firefighting & Prevention | 0 (0.0%) | 0 (0.0%) |
| Law Enforcement | 0 (0.0%) | 0 (0.0%) |
| Food Preparation & Serving | 0 (0.0%) | 0 (0.0%) |
| Cleaning & Maintenance | 0 (0.0%) | 0 (0.0%) |
| Personal Care & Service | 0 (0.0%) | 2 (100.0%) |
| Total (Category) | 0 (0.0%) | 6 (100.0%) |
| Total (Overall) | 59 (40.7%) | 86 (59.3%) |
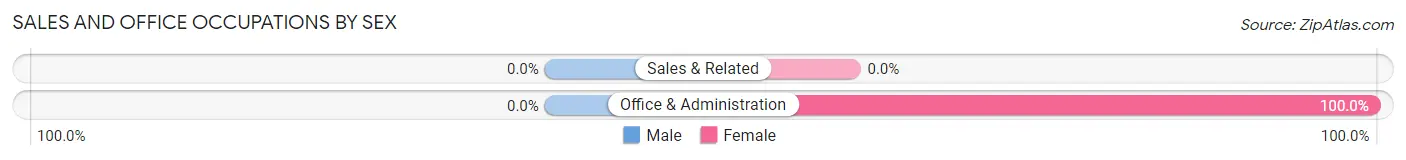
Sales and Office Occupations
The most common Sales and Office occupations in De Valls Bluff are , and Office & Administration (15 | 10.3%).
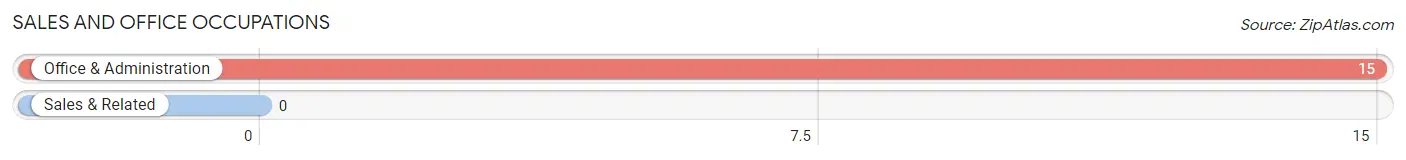
Sales and Office Occupations by Sex
| Occupation | Male | Female |
| Sales & Related | 0 (0.0%) | 0 (0.0%) |
| Office & Administration | 0 (0.0%) | 15 (100.0%) |
| Total (Category) | 0 (0.0%) | 15 (100.0%) |
| Total (Overall) | 59 (40.7%) | 86 (59.3%) |
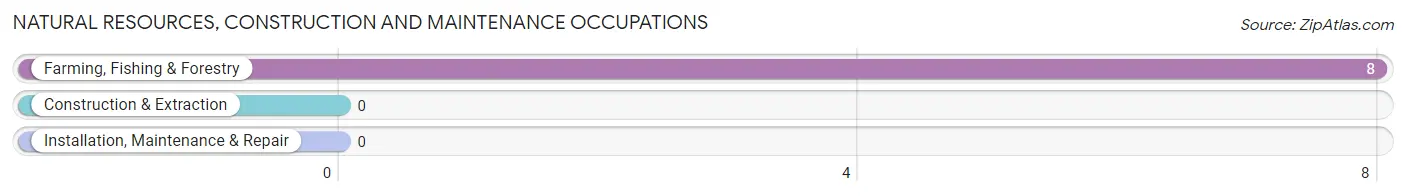
Natural Resources, Construction and Maintenance Occupations
The most common Natural Resources, Construction and Maintenance occupations in De Valls Bluff are , and Farming, Fishing & Forestry (8 | 5.5%).
Natural Resources, Construction and Maintenance Occupations by Sex
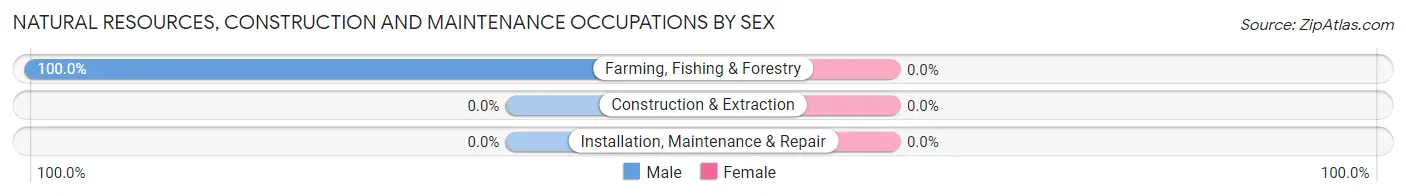
| Occupation | Male | Female |
| Farming, Fishing & Forestry | 8 (100.0%) | 0 (0.0%) |
| Construction & Extraction | 0 (0.0%) | 0 (0.0%) |
| Installation, Maintenance & Repair | 0 (0.0%) | 0 (0.0%) |
| Total (Category) | 8 (100.0%) | 0 (0.0%) |
| Total (Overall) | 59 (40.7%) | 86 (59.3%) |
Production, Transportation and Moving Occupations
The most common Production, Transportation and Moving occupations in De Valls Bluff are Material Moving (37 | 25.5%), Transportation (26 | 17.9%), and Production (19 | 13.1%).
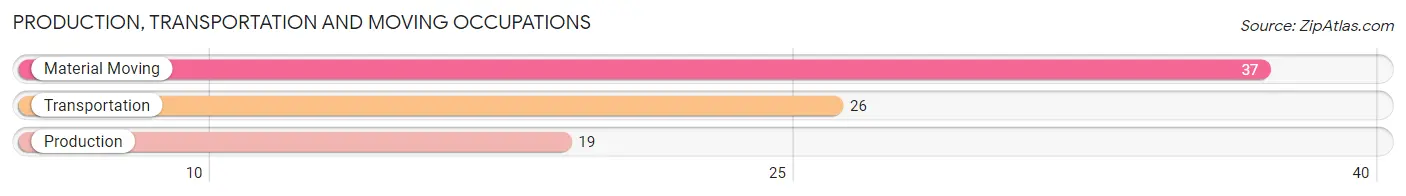
Production, Transportation and Moving Occupations by Sex
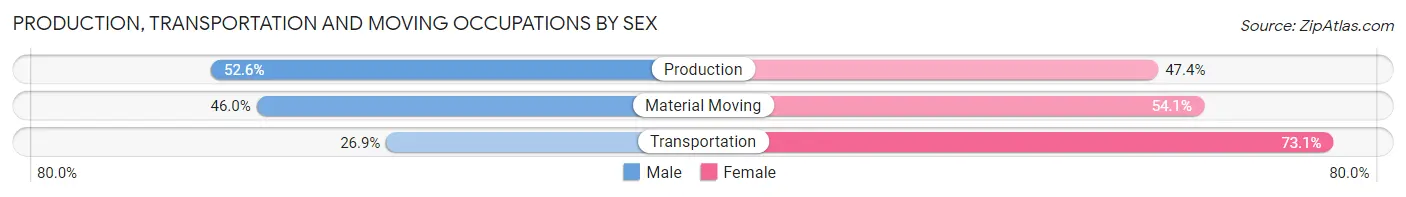
| Occupation | Male | Female |
| Production | 10 (52.6%) | 9 (47.4%) |
| Transportation | 7 (26.9%) | 19 (73.1%) |
| Material Moving | 17 (46.0%) | 20 (54.0%) |
| Total (Category) | 34 (41.5%) | 48 (58.5%) |
| Total (Overall) | 59 (40.7%) | 86 (59.3%) |
Employment Industries by Sex in De Valls Bluff
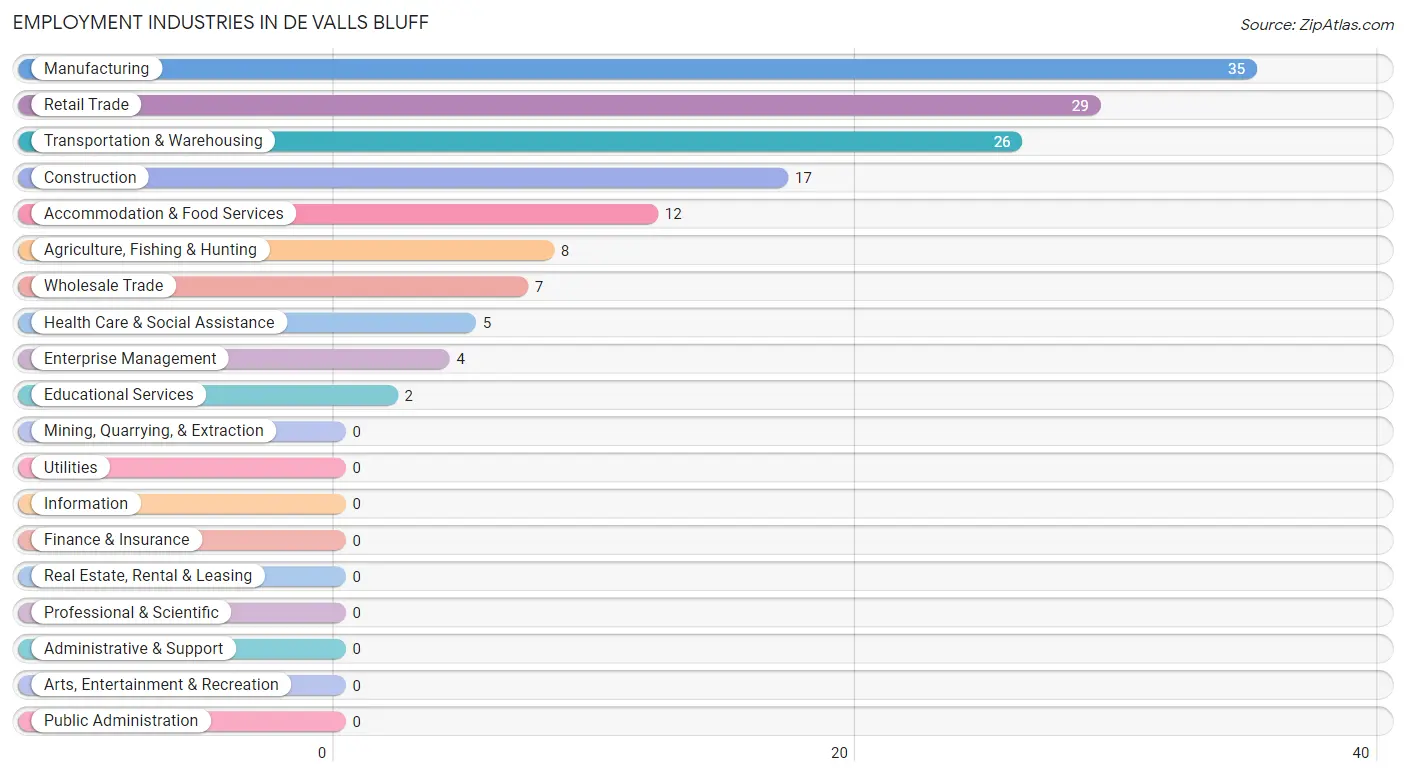
Employment Industries in De Valls Bluff
The major employment industries in De Valls Bluff include Manufacturing (35 | 24.1%), Retail Trade (29 | 20.0%), Transportation & Warehousing (26 | 17.9%), Construction (17 | 11.7%), and Accommodation & Food Services (12 | 8.3%).
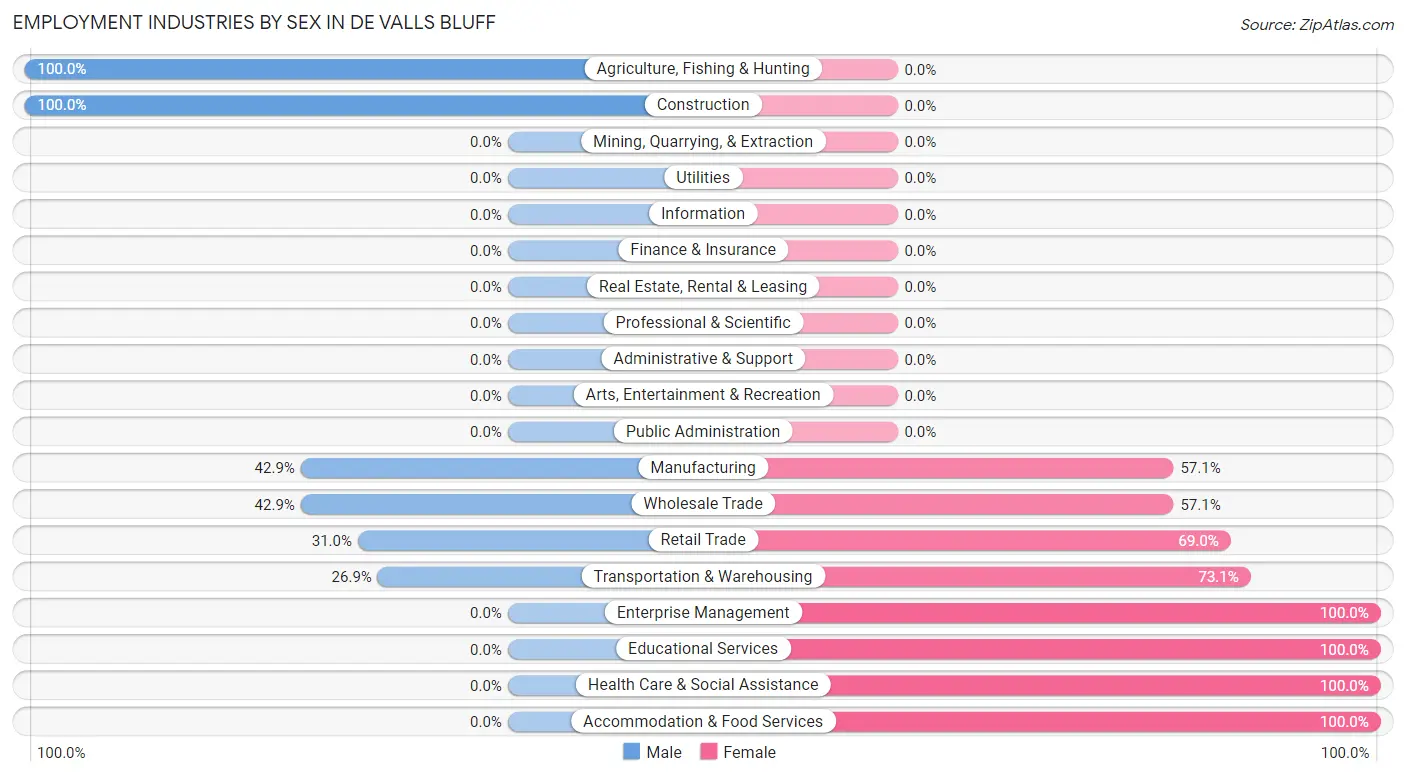
Employment Industries by Sex in De Valls Bluff
The De Valls Bluff industries that see more men than women are Agriculture, Fishing & Hunting (100.0%), Construction (100.0%), and Manufacturing (42.9%), whereas the industries that tend to have a higher number of women are Enterprise Management (100.0%), Educational Services (100.0%), and Health Care & Social Assistance (100.0%).
| Industry | Male | Female |
| Agriculture, Fishing & Hunting | 8 (100.0%) | 0 (0.0%) |
| Mining, Quarrying, & Extraction | 0 (0.0%) | 0 (0.0%) |
| Construction | 17 (100.0%) | 0 (0.0%) |
| Manufacturing | 15 (42.9%) | 20 (57.1%) |
| Wholesale Trade | 3 (42.9%) | 4 (57.1%) |
| Retail Trade | 9 (31.0%) | 20 (69.0%) |
| Transportation & Warehousing | 7 (26.9%) | 19 (73.1%) |
| Utilities | 0 (0.0%) | 0 (0.0%) |
| Information | 0 (0.0%) | 0 (0.0%) |
| Finance & Insurance | 0 (0.0%) | 0 (0.0%) |
| Real Estate, Rental & Leasing | 0 (0.0%) | 0 (0.0%) |
| Professional & Scientific | 0 (0.0%) | 0 (0.0%) |
| Enterprise Management | 0 (0.0%) | 4 (100.0%) |
| Administrative & Support | 0 (0.0%) | 0 (0.0%) |
| Educational Services | 0 (0.0%) | 2 (100.0%) |
| Health Care & Social Assistance | 0 (0.0%) | 5 (100.0%) |
| Arts, Entertainment & Recreation | 0 (0.0%) | 0 (0.0%) |
| Accommodation & Food Services | 0 (0.0%) | 12 (100.0%) |
| Public Administration | 0 (0.0%) | 0 (0.0%) |
| Total | 59 (40.7%) | 86 (59.3%) |
Education in De Valls Bluff
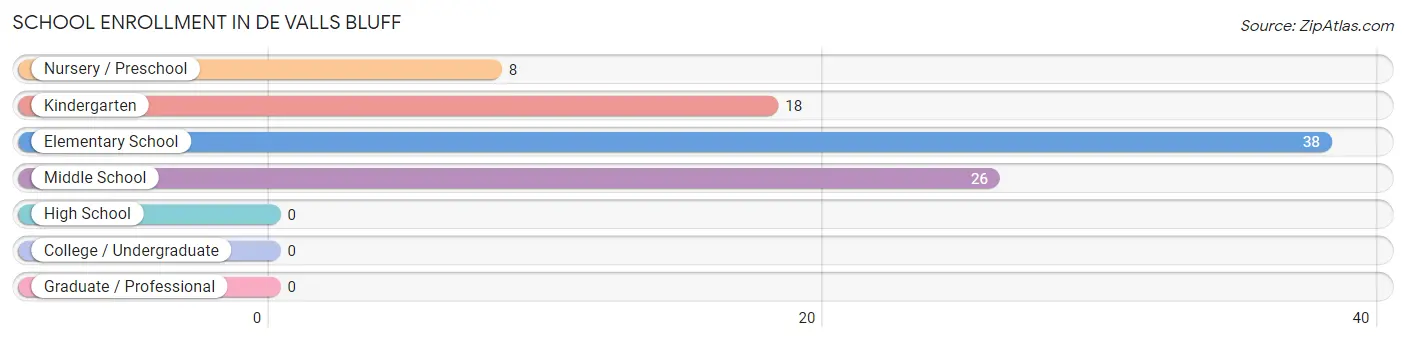
School Enrollment in De Valls Bluff
The most common levels of schooling among the 90 students in De Valls Bluff are elementary school (38 | 42.2%), middle school (26 | 28.9%), and kindergarten (18 | 20.0%).
| School Level | # Students | % Students |
| Nursery / Preschool | 8 | 8.9% |
| Kindergarten | 18 | 20.0% |
| Elementary School | 38 | 42.2% |
| Middle School | 26 | 28.9% |
| High School | 0 | 0.0% |
| College / Undergraduate | 0 | 0.0% |
| Graduate / Professional | 0 | 0.0% |
| Total | 90 | 100.0% |
School Enrollment by Age by Funding Source in De Valls Bluff
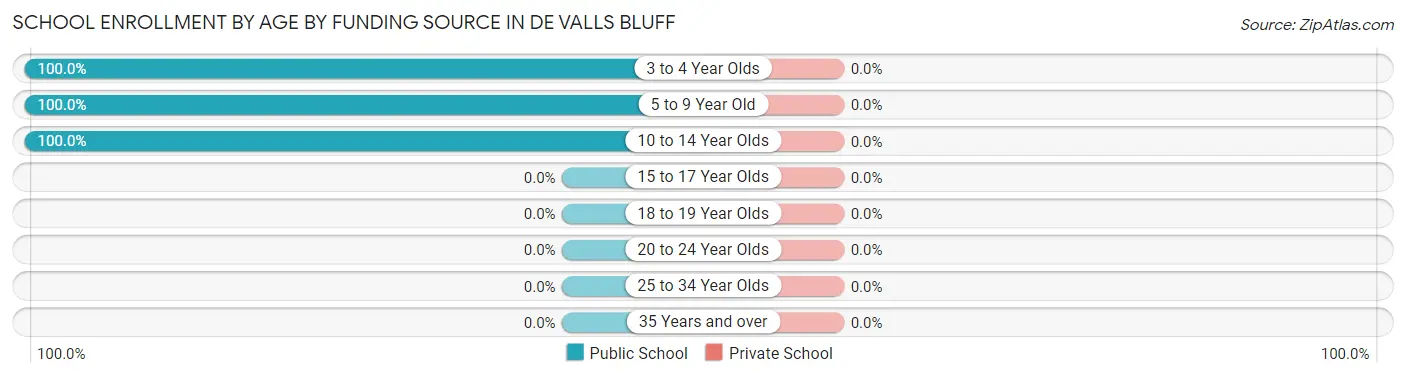
| Age Bracket | Public School | Private School |
| 3 to 4 Year Olds | 8 (100.0%) | 0 (0.0%) |
| 5 to 9 Year Old | 56 (100.0%) | 0 (0.0%) |
| 10 to 14 Year Olds | 26 (100.0%) | 0 (0.0%) |
| 15 to 17 Year Olds | 0 (0.0%) | 0 (0.0%) |
| 18 to 19 Year Olds | 0 (0.0%) | 0 (0.0%) |
| 20 to 24 Year Olds | 0 (0.0%) | 0 (0.0%) |
| 25 to 34 Year Olds | 0 (0.0%) | 0 (0.0%) |
| 35 Years and over | 0 (0.0%) | 0 (0.0%) |
| Total | 90 (100.0%) | 0 (0.0%) |
Educational Attainment by Field of Study in De Valls Bluff
Business (26 | 37.1%), education (19 | 27.1%), computers & mathematics (11 | 15.7%), literature & languages (9 | 12.9%), and arts & humanities (5 | 7.1%) are the most common fields of study among 70 individuals in De Valls Bluff who have obtained a bachelor's degree or higher.
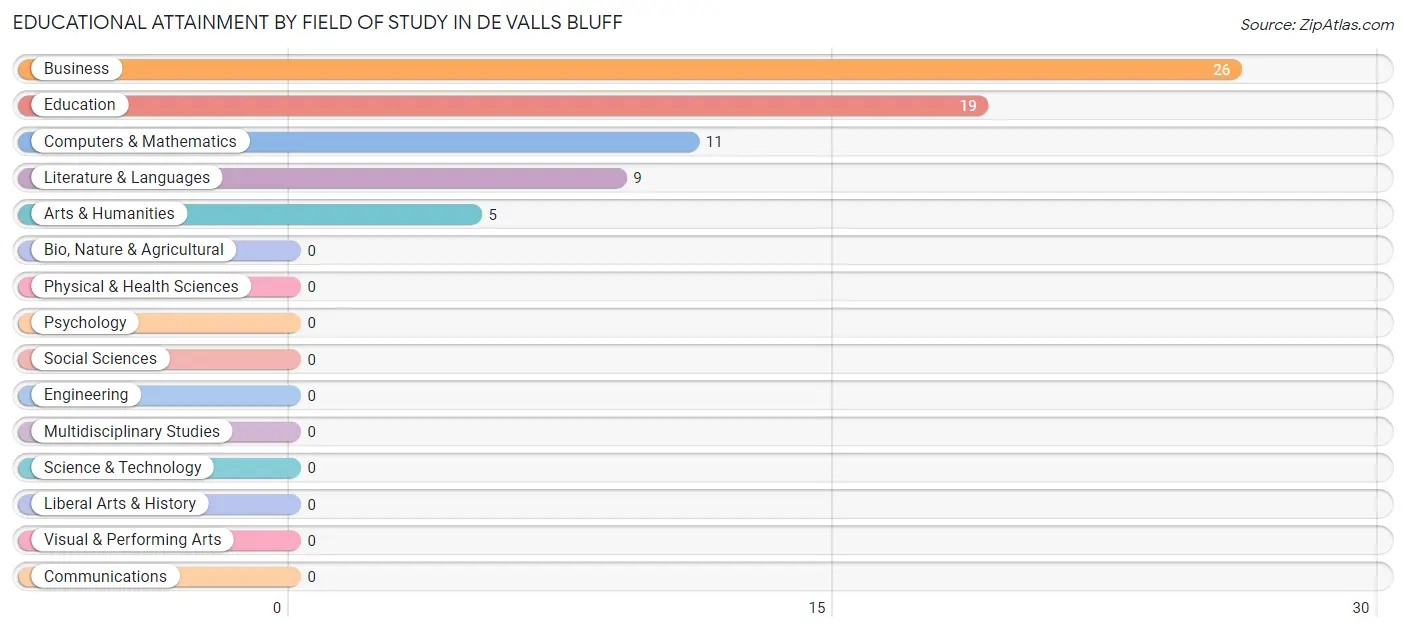
| Field of Study | # Graduates | % Graduates |
| Computers & Mathematics | 11 | 15.7% |
| Bio, Nature & Agricultural | 0 | 0.0% |
| Physical & Health Sciences | 0 | 0.0% |
| Psychology | 0 | 0.0% |
| Social Sciences | 0 | 0.0% |
| Engineering | 0 | 0.0% |
| Multidisciplinary Studies | 0 | 0.0% |
| Science & Technology | 0 | 0.0% |
| Business | 26 | 37.1% |
| Education | 19 | 27.1% |
| Literature & Languages | 9 | 12.9% |
| Liberal Arts & History | 0 | 0.0% |
| Visual & Performing Arts | 0 | 0.0% |
| Communications | 0 | 0.0% |
| Arts & Humanities | 5 | 7.1% |
| Total | 70 | 100.0% |
Transportation & Commute in De Valls Bluff
Vehicle Availability by Sex in De Valls Bluff
The most prevalent vehicle ownership categories in De Valls Bluff are males with 2 vehicles (19, accounting for 32.2%) and females with 2 vehicles (35, making up 25.7%).
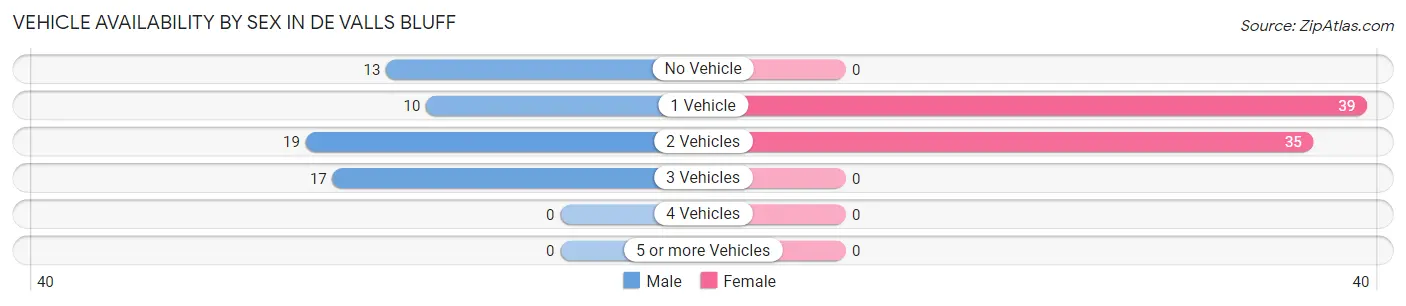
| Vehicles Available | Male | Female |
| No Vehicle | 13 (22.0%) | 0 (0.0%) |
| 1 Vehicle | 10 (17.0%) | 39 (52.7%) |
| 2 Vehicles | 19 (32.2%) | 35 (47.3%) |
| 3 Vehicles | 17 (28.8%) | 0 (0.0%) |
| 4 Vehicles | 0 (0.0%) | 0 (0.0%) |
| 5 or more Vehicles | 0 (0.0%) | 0 (0.0%) |
| Total | 59 (100.0%) | 74 (100.0%) |
Commute Time in De Valls Bluff
The most frequently occuring commute durations in De Valls Bluff are 15 to 19 minutes (36 commuters, 27.1%), 30 to 34 minutes (23 commuters, 17.3%), and 5 to 9 minutes (22 commuters, 16.5%).
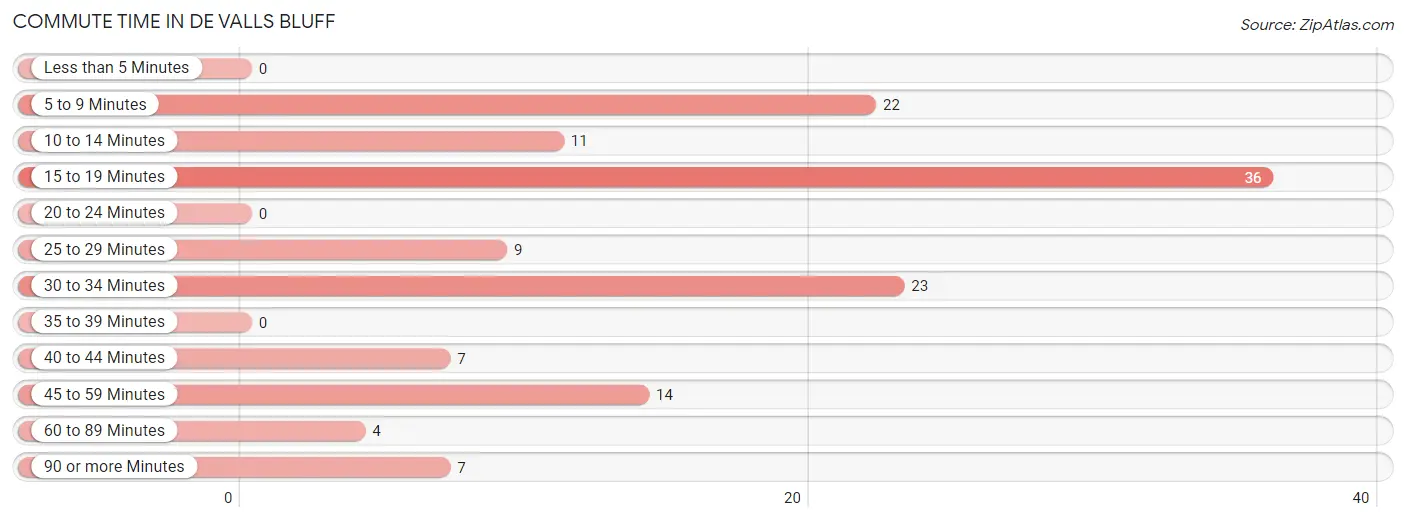
| Commute Time | # Commuters | % Commuters |
| Less than 5 Minutes | 0 | 0.0% |
| 5 to 9 Minutes | 22 | 16.5% |
| 10 to 14 Minutes | 11 | 8.3% |
| 15 to 19 Minutes | 36 | 27.1% |
| 20 to 24 Minutes | 0 | 0.0% |
| 25 to 29 Minutes | 9 | 6.8% |
| 30 to 34 Minutes | 23 | 17.3% |
| 35 to 39 Minutes | 0 | 0.0% |
| 40 to 44 Minutes | 7 | 5.3% |
| 45 to 59 Minutes | 14 | 10.5% |
| 60 to 89 Minutes | 4 | 3.0% |
| 90 or more Minutes | 7 | 5.3% |
Commute Time by Sex in De Valls Bluff
The most common commute times in De Valls Bluff are 5 to 9 minutes (22 commuters, 37.3%) for males and 15 to 19 minutes (27 commuters, 36.5%) for females.
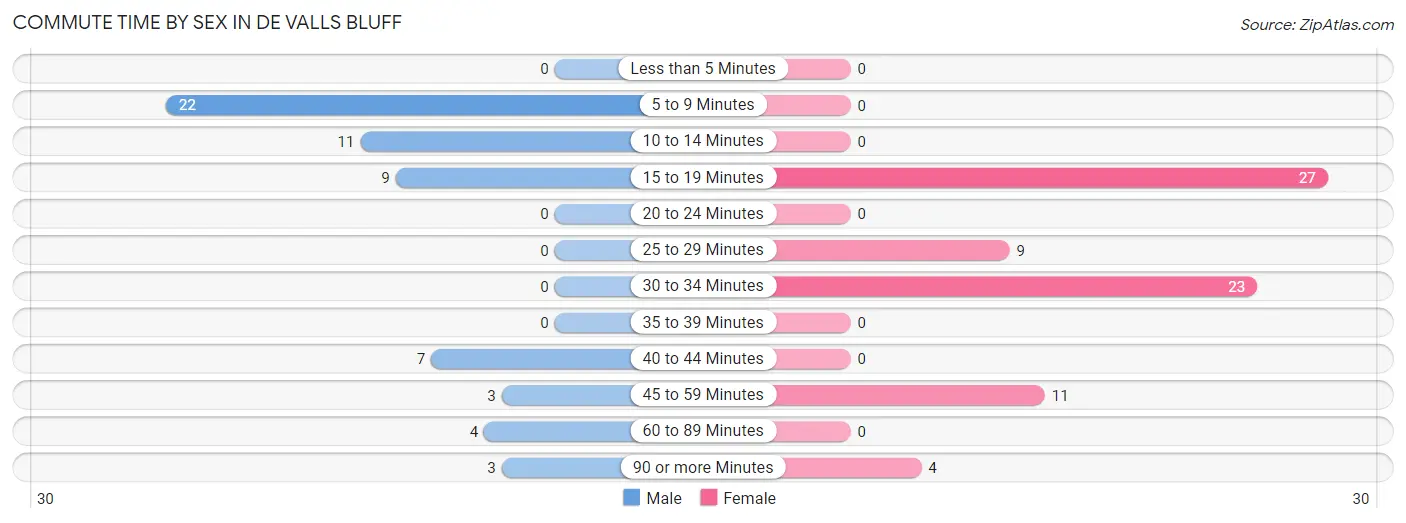
| Commute Time | Male | Female |
| Less than 5 Minutes | 0 (0.0%) | 0 (0.0%) |
| 5 to 9 Minutes | 22 (37.3%) | 0 (0.0%) |
| 10 to 14 Minutes | 11 (18.6%) | 0 (0.0%) |
| 15 to 19 Minutes | 9 (15.2%) | 27 (36.5%) |
| 20 to 24 Minutes | 0 (0.0%) | 0 (0.0%) |
| 25 to 29 Minutes | 0 (0.0%) | 9 (12.2%) |
| 30 to 34 Minutes | 0 (0.0%) | 23 (31.1%) |
| 35 to 39 Minutes | 0 (0.0%) | 0 (0.0%) |
| 40 to 44 Minutes | 7 (11.9%) | 0 (0.0%) |
| 45 to 59 Minutes | 3 (5.1%) | 11 (14.9%) |
| 60 to 89 Minutes | 4 (6.8%) | 0 (0.0%) |
| 90 or more Minutes | 3 (5.1%) | 4 (5.4%) |
Time of Departure to Work by Sex in De Valls Bluff
The most frequent times of departure to work in De Valls Bluff are 6:30 AM to 6:59 AM (26, 44.1%) for males and 6:00 AM to 6:29 AM (24, 32.4%) for females.
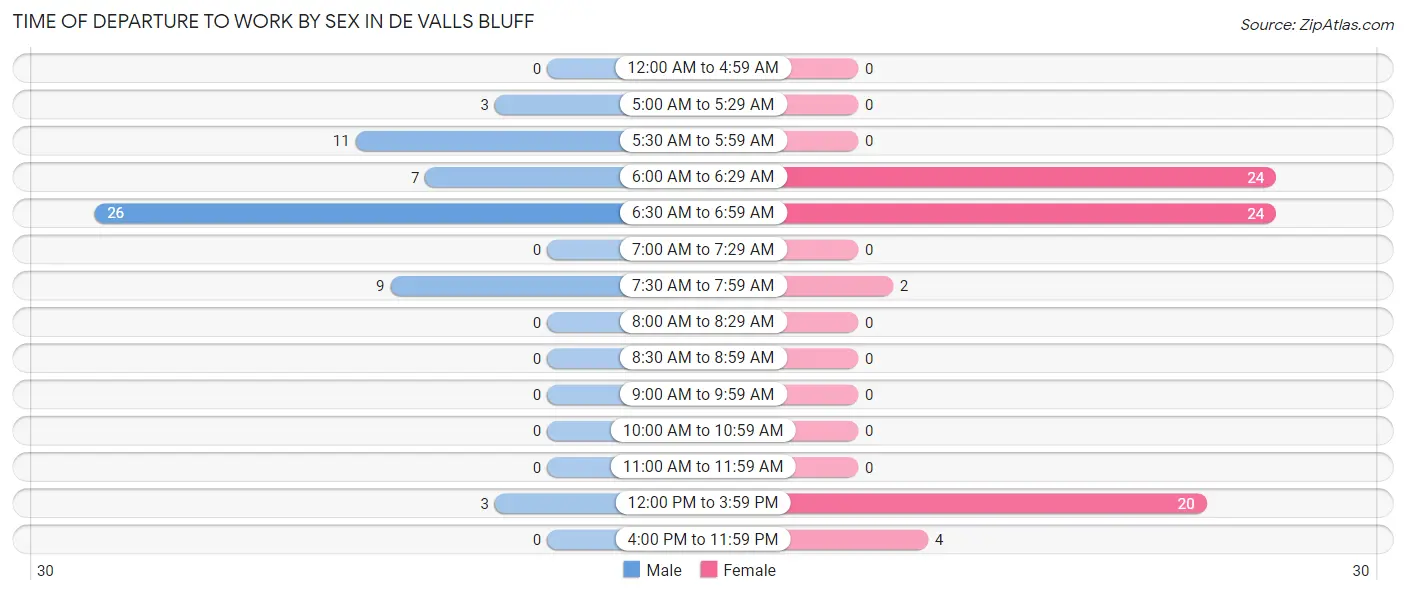
| Time of Departure | Male | Female |
| 12:00 AM to 4:59 AM | 0 (0.0%) | 0 (0.0%) |
| 5:00 AM to 5:29 AM | 3 (5.1%) | 0 (0.0%) |
| 5:30 AM to 5:59 AM | 11 (18.6%) | 0 (0.0%) |
| 6:00 AM to 6:29 AM | 7 (11.9%) | 24 (32.4%) |
| 6:30 AM to 6:59 AM | 26 (44.1%) | 24 (32.4%) |
| 7:00 AM to 7:29 AM | 0 (0.0%) | 0 (0.0%) |
| 7:30 AM to 7:59 AM | 9 (15.2%) | 2 (2.7%) |
| 8:00 AM to 8:29 AM | 0 (0.0%) | 0 (0.0%) |
| 8:30 AM to 8:59 AM | 0 (0.0%) | 0 (0.0%) |
| 9:00 AM to 9:59 AM | 0 (0.0%) | 0 (0.0%) |
| 10:00 AM to 10:59 AM | 0 (0.0%) | 0 (0.0%) |
| 11:00 AM to 11:59 AM | 0 (0.0%) | 0 (0.0%) |
| 12:00 PM to 3:59 PM | 3 (5.1%) | 20 (27.0%) |
| 4:00 PM to 11:59 PM | 0 (0.0%) | 4 (5.4%) |
| Total | 59 (100.0%) | 74 (100.0%) |
Housing Occupancy in De Valls Bluff
Occupancy by Ownership in De Valls Bluff
Of the total 286 dwellings in De Valls Bluff, owner-occupied units account for 198 (69.2%), while renter-occupied units make up 88 (30.8%).
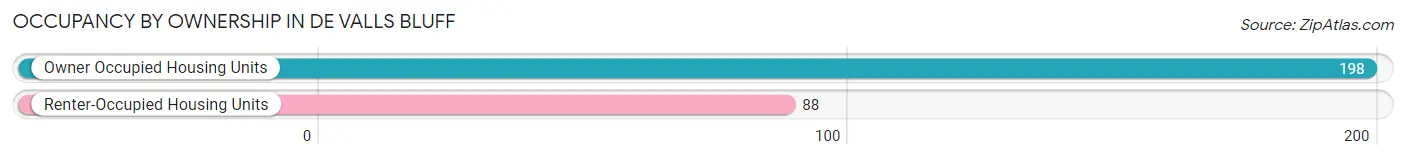
| Occupancy | # Housing Units | % Housing Units |
| Owner Occupied Housing Units | 198 | 69.2% |
| Renter-Occupied Housing Units | 88 | 30.8% |
| Total Occupied Housing Units | 286 | 100.0% |
Occupancy by Household Size in De Valls Bluff
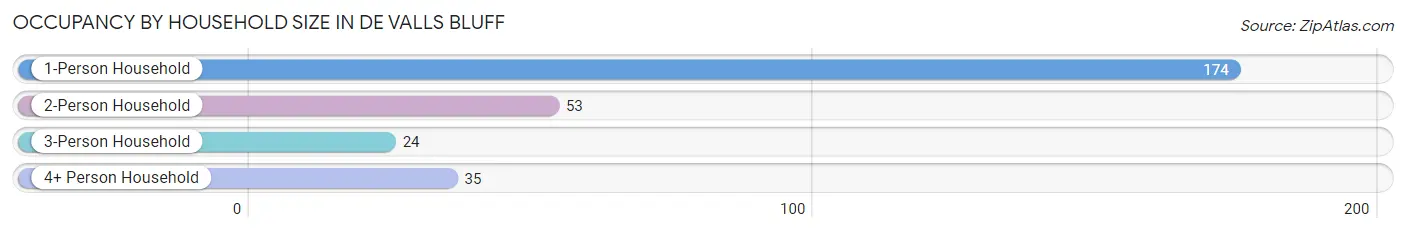
| Household Size | # Housing Units | % Housing Units |
| 1-Person Household | 174 | 60.8% |
| 2-Person Household | 53 | 18.5% |
| 3-Person Household | 24 | 8.4% |
| 4+ Person Household | 35 | 12.2% |
| Total Housing Units | 286 | 100.0% |
Occupancy by Ownership by Household Size in De Valls Bluff
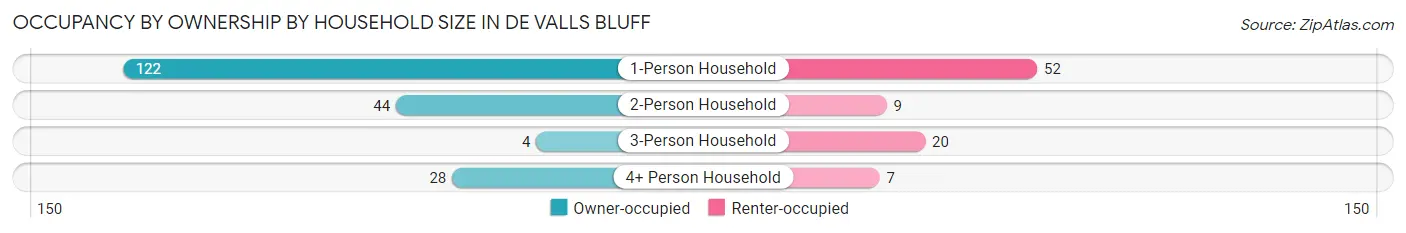
| Household Size | Owner-occupied | Renter-occupied |
| 1-Person Household | 122 (70.1%) | 52 (29.9%) |
| 2-Person Household | 44 (83.0%) | 9 (17.0%) |
| 3-Person Household | 4 (16.7%) | 20 (83.3%) |
| 4+ Person Household | 28 (80.0%) | 7 (20.0%) |
| Total Housing Units | 198 (69.2%) | 88 (30.8%) |
Occupancy by Educational Attainment in De Valls Bluff
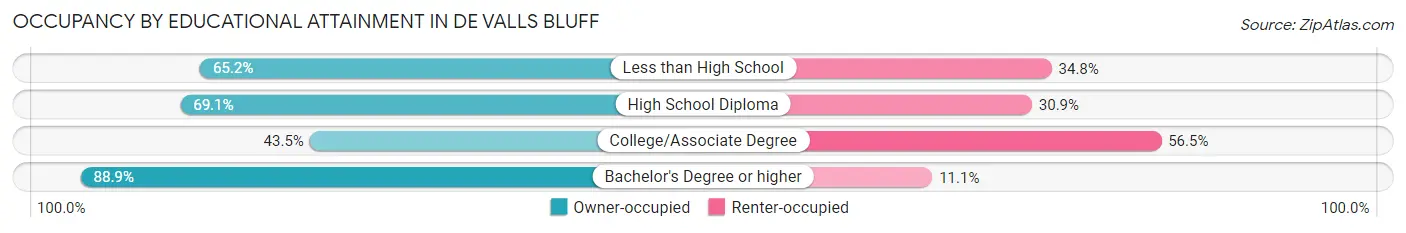
| Household Size | Owner-occupied | Renter-occupied |
| Less than High School | 45 (65.2%) | 24 (34.8%) |
| High School Diploma | 103 (69.1%) | 46 (30.9%) |
| College/Associate Degree | 10 (43.5%) | 13 (56.5%) |
| Bachelor's Degree or higher | 40 (88.9%) | 5 (11.1%) |
Occupancy by Age of Householder in De Valls Bluff
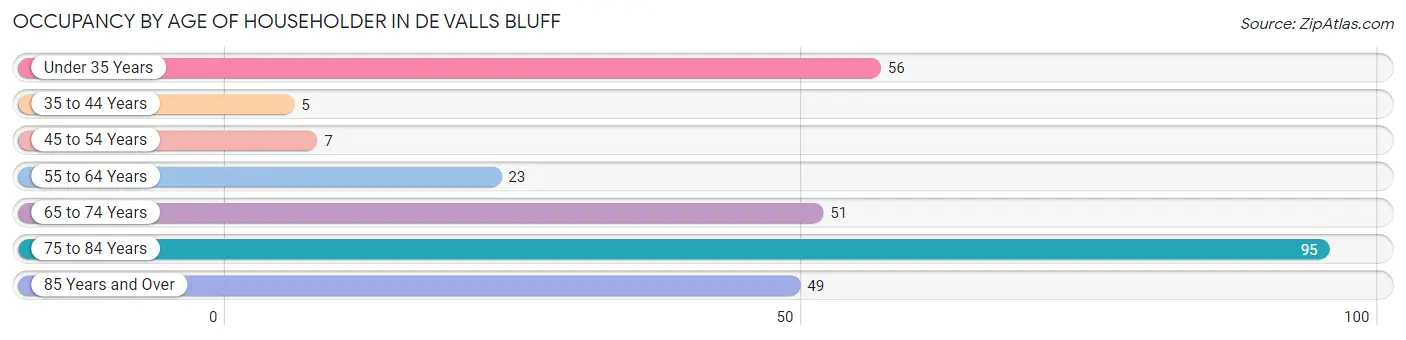
| Age Bracket | # Households | % Households |
| Under 35 Years | 56 | 19.6% |
| 35 to 44 Years | 5 | 1.8% |
| 45 to 54 Years | 7 | 2.5% |
| 55 to 64 Years | 23 | 8.0% |
| 65 to 74 Years | 51 | 17.8% |
| 75 to 84 Years | 95 | 33.2% |
| 85 Years and Over | 49 | 17.1% |
| Total | 286 | 100.0% |
Housing Finances in De Valls Bluff
Median Income by Occupancy in De Valls Bluff
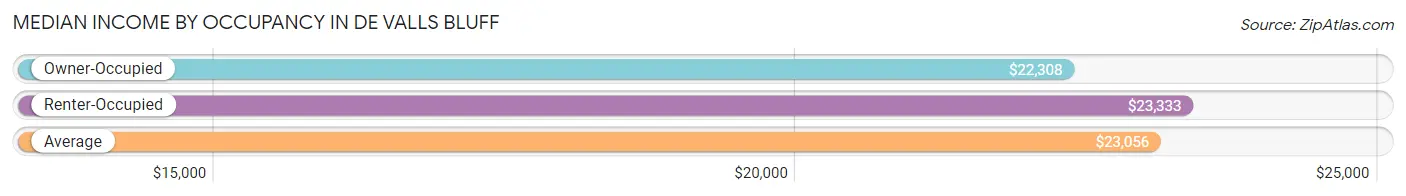
| Occupancy Type | # Households | Median Income |
| Owner-Occupied | 198 (69.2%) | $22,308 |
| Renter-Occupied | 88 (30.8%) | $23,333 |
| Average | 286 (100.0%) | $23,056 |
Occupancy by Householder Income Bracket in De Valls Bluff
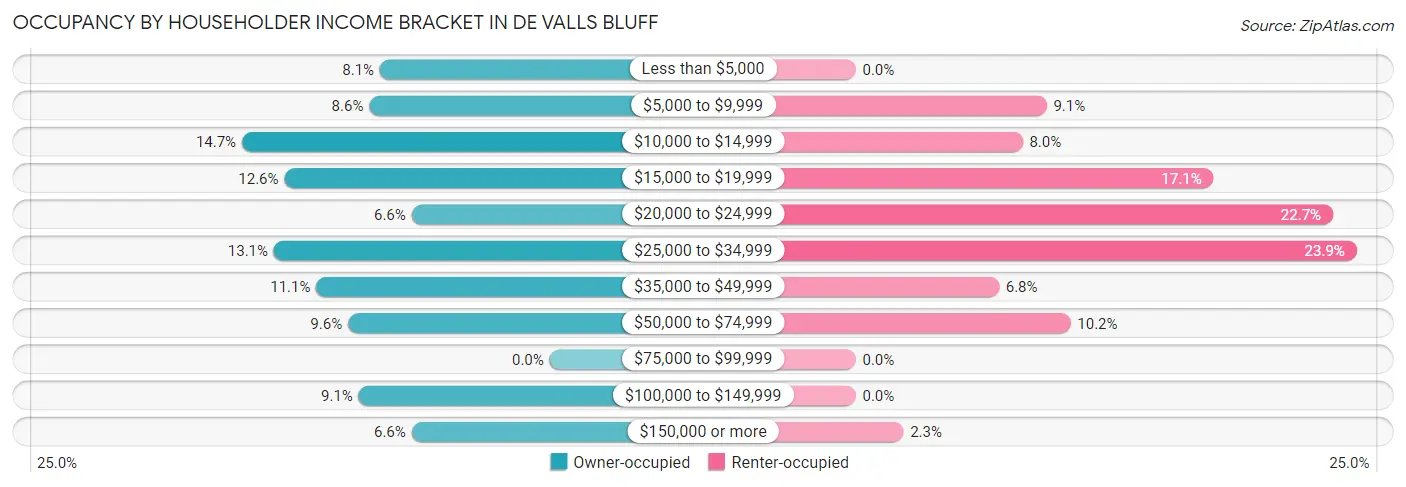
| Income Bracket | Owner-occupied | Renter-occupied |
| Less than $5,000 | 16 (8.1%) | 0 (0.0%) |
| $5,000 to $9,999 | 17 (8.6%) | 8 (9.1%) |
| $10,000 to $14,999 | 29 (14.6%) | 7 (8.0%) |
| $15,000 to $19,999 | 25 (12.6%) | 15 (17.1%) |
| $20,000 to $24,999 | 13 (6.6%) | 20 (22.7%) |
| $25,000 to $34,999 | 26 (13.1%) | 21 (23.9%) |
| $35,000 to $49,999 | 22 (11.1%) | 6 (6.8%) |
| $50,000 to $74,999 | 19 (9.6%) | 9 (10.2%) |
| $75,000 to $99,999 | 0 (0.0%) | 0 (0.0%) |
| $100,000 to $149,999 | 18 (9.1%) | 0 (0.0%) |
| $150,000 or more | 13 (6.6%) | 2 (2.3%) |
| Total | 198 (100.0%) | 88 (100.0%) |
Monthly Housing Cost Tiers in De Valls Bluff
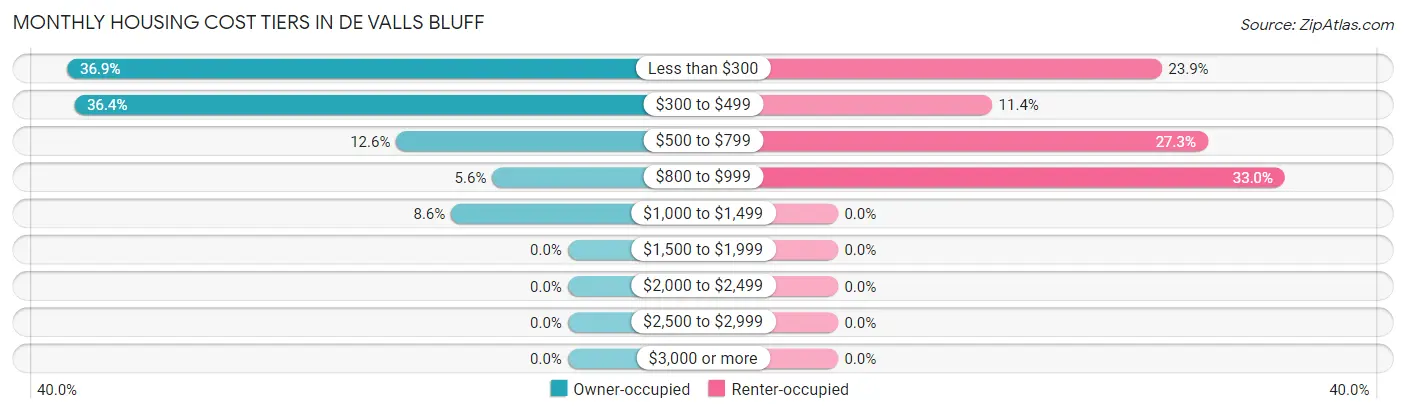
| Monthly Cost | Owner-occupied | Renter-occupied |
| Less than $300 | 73 (36.9%) | 21 (23.9%) |
| $300 to $499 | 72 (36.4%) | 10 (11.4%) |
| $500 to $799 | 25 (12.6%) | 24 (27.3%) |
| $800 to $999 | 11 (5.6%) | 29 (33.0%) |
| $1,000 to $1,499 | 17 (8.6%) | 0 (0.0%) |
| $1,500 to $1,999 | 0 (0.0%) | 0 (0.0%) |
| $2,000 to $2,499 | 0 (0.0%) | 0 (0.0%) |
| $2,500 to $2,999 | 0 (0.0%) | 0 (0.0%) |
| $3,000 or more | 0 (0.0%) | 0 (0.0%) |
| Total | 198 (100.0%) | 88 (100.0%) |
Physical Housing Characteristics in De Valls Bluff
Housing Structures in De Valls Bluff
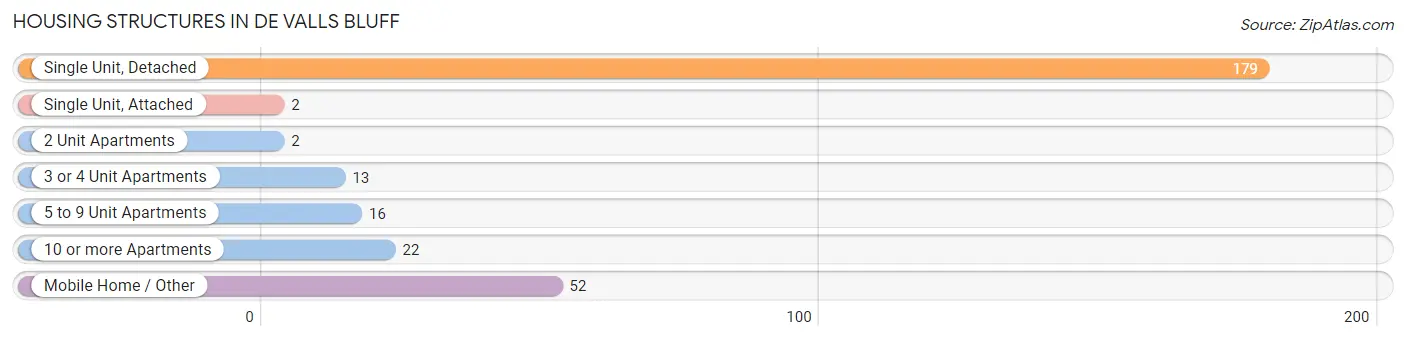
| Structure Type | # Housing Units | % Housing Units |
| Single Unit, Detached | 179 | 62.6% |
| Single Unit, Attached | 2 | 0.7% |
| 2 Unit Apartments | 2 | 0.7% |
| 3 or 4 Unit Apartments | 13 | 4.5% |
| 5 to 9 Unit Apartments | 16 | 5.6% |
| 10 or more Apartments | 22 | 7.7% |
| Mobile Home / Other | 52 | 18.2% |
| Total | 286 | 100.0% |
Housing Structures by Occupancy in De Valls Bluff
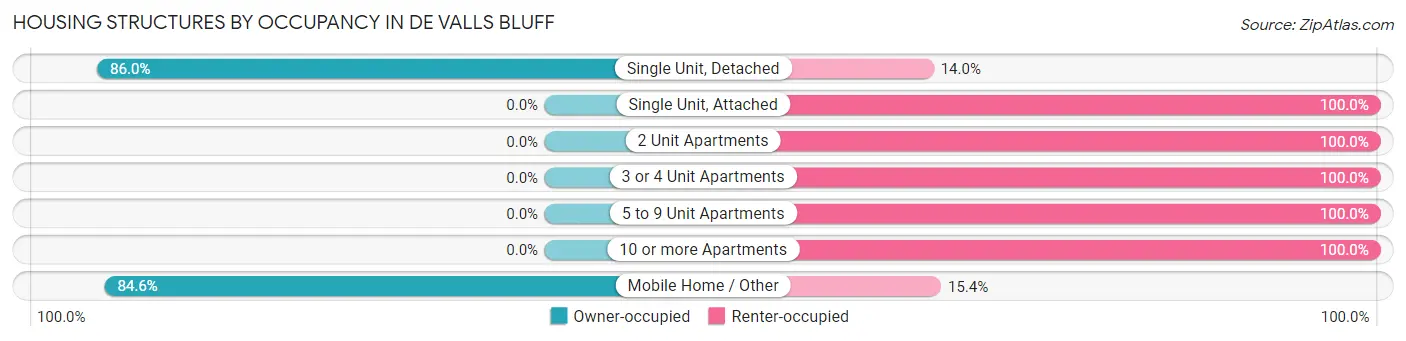
| Structure Type | Owner-occupied | Renter-occupied |
| Single Unit, Detached | 154 (86.0%) | 25 (14.0%) |
| Single Unit, Attached | 0 (0.0%) | 2 (100.0%) |
| 2 Unit Apartments | 0 (0.0%) | 2 (100.0%) |
| 3 or 4 Unit Apartments | 0 (0.0%) | 13 (100.0%) |
| 5 to 9 Unit Apartments | 0 (0.0%) | 16 (100.0%) |
| 10 or more Apartments | 0 (0.0%) | 22 (100.0%) |
| Mobile Home / Other | 44 (84.6%) | 8 (15.4%) |
| Total | 198 (69.2%) | 88 (30.8%) |
Housing Structures by Number of Rooms in De Valls Bluff
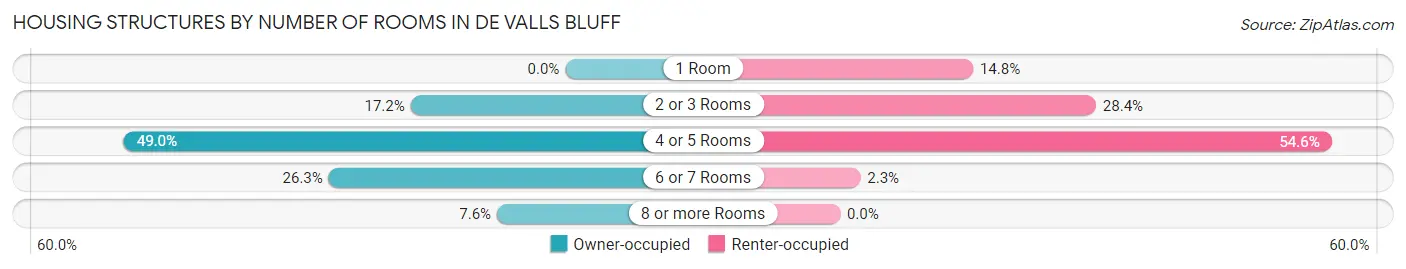
| Number of Rooms | Owner-occupied | Renter-occupied |
| 1 Room | 0 (0.0%) | 13 (14.8%) |
| 2 or 3 Rooms | 34 (17.2%) | 25 (28.4%) |
| 4 or 5 Rooms | 97 (49.0%) | 48 (54.5%) |
| 6 or 7 Rooms | 52 (26.3%) | 2 (2.3%) |
| 8 or more Rooms | 15 (7.6%) | 0 (0.0%) |
| Total | 198 (100.0%) | 88 (100.0%) |
Housing Structure by Heating Type in De Valls Bluff
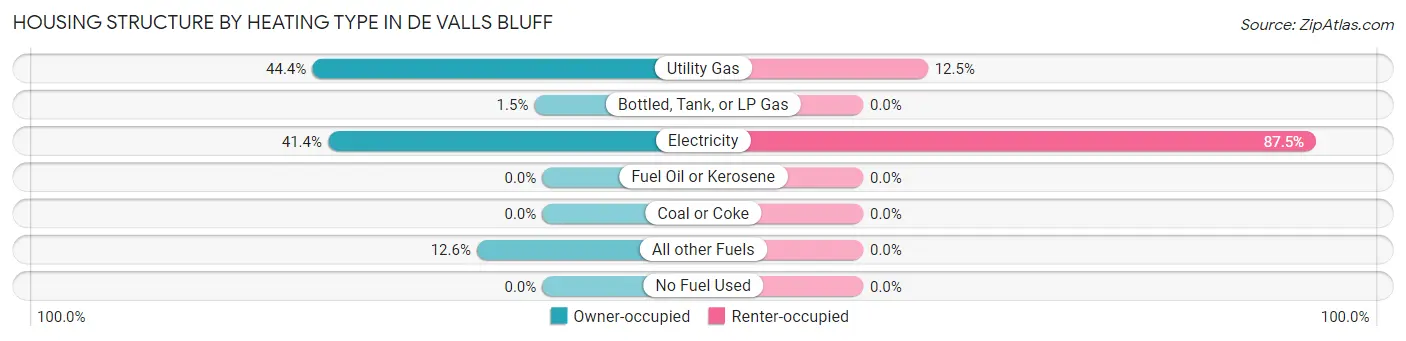
| Heating Type | Owner-occupied | Renter-occupied |
| Utility Gas | 88 (44.4%) | 11 (12.5%) |
| Bottled, Tank, or LP Gas | 3 (1.5%) | 0 (0.0%) |
| Electricity | 82 (41.4%) | 77 (87.5%) |
| Fuel Oil or Kerosene | 0 (0.0%) | 0 (0.0%) |
| Coal or Coke | 0 (0.0%) | 0 (0.0%) |
| All other Fuels | 25 (12.6%) | 0 (0.0%) |
| No Fuel Used | 0 (0.0%) | 0 (0.0%) |
| Total | 198 (100.0%) | 88 (100.0%) |
Household Vehicle Usage in De Valls Bluff
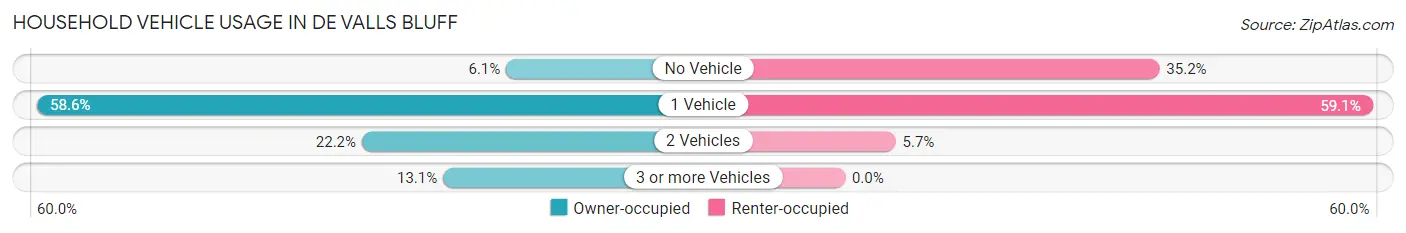
| Vehicles per Household | Owner-occupied | Renter-occupied |
| No Vehicle | 12 (6.1%) | 31 (35.2%) |
| 1 Vehicle | 116 (58.6%) | 52 (59.1%) |
| 2 Vehicles | 44 (22.2%) | 5 (5.7%) |
| 3 or more Vehicles | 26 (13.1%) | 0 (0.0%) |
| Total | 198 (100.0%) | 88 (100.0%) |
Real Estate & Mortgages in De Valls Bluff
Real Estate and Mortgage Overview in De Valls Bluff
| Characteristic | Without Mortgage | With Mortgage |
| Housing Units | 170 | 28 |
| Median Property Value | $34,700 | $0 |
| Median Household Income | $25,238 | $0 |
| Monthly Housing Costs | $318 | $0 |
| Real Estate Taxes | $255 | $0 |
Property Value by Mortgage Status in De Valls Bluff
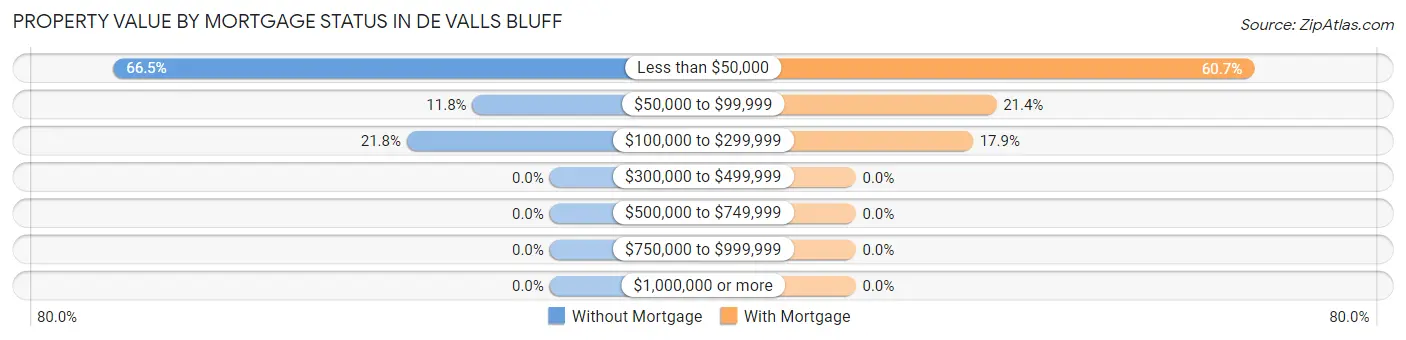
| Property Value | Without Mortgage | With Mortgage |
| Less than $50,000 | 113 (66.5%) | 17 (60.7%) |
| $50,000 to $99,999 | 20 (11.8%) | 6 (21.4%) |
| $100,000 to $299,999 | 37 (21.8%) | 5 (17.9%) |
| $300,000 to $499,999 | 0 (0.0%) | 0 (0.0%) |
| $500,000 to $749,999 | 0 (0.0%) | 0 (0.0%) |
| $750,000 to $999,999 | 0 (0.0%) | 0 (0.0%) |
| $1,000,000 or more | 0 (0.0%) | 0 (0.0%) |
| Total | 170 (100.0%) | 28 (100.0%) |
Household Income by Mortgage Status in De Valls Bluff
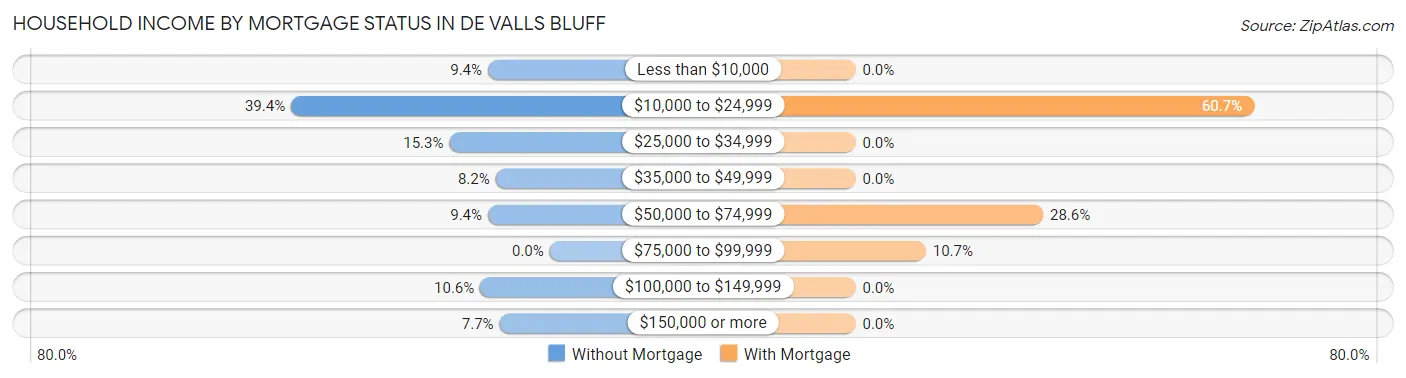
| Household Income | Without Mortgage | With Mortgage |
| Less than $10,000 | 16 (9.4%) | 0 (0.0%) |
| $10,000 to $24,999 | 67 (39.4%) | 17 (60.7%) |
| $25,000 to $34,999 | 26 (15.3%) | 0 (0.0%) |
| $35,000 to $49,999 | 14 (8.2%) | 0 (0.0%) |
| $50,000 to $74,999 | 16 (9.4%) | 8 (28.6%) |
| $75,000 to $99,999 | 0 (0.0%) | 3 (10.7%) |
| $100,000 to $149,999 | 18 (10.6%) | 0 (0.0%) |
| $150,000 or more | 13 (7.6%) | 0 (0.0%) |
| Total | 170 (100.0%) | 28 (100.0%) |
Property Value to Household Income Ratio in De Valls Bluff
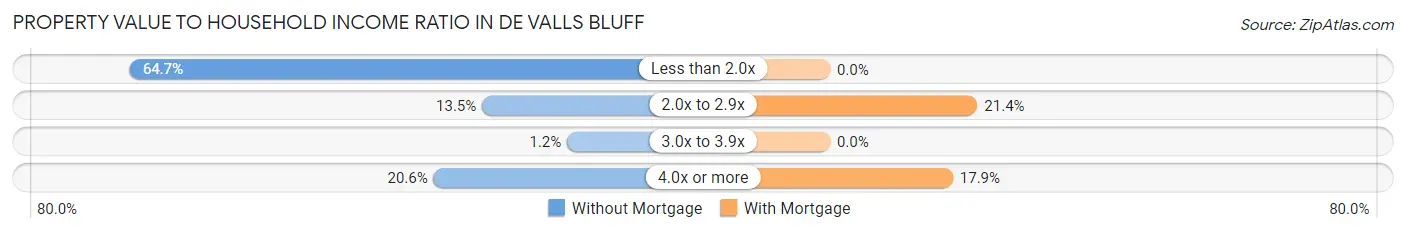
| Value-to-Income Ratio | Without Mortgage | With Mortgage |
| Less than 2.0x | 110 (64.7%) | 0 (0.0%) |
| 2.0x to 2.9x | 23 (13.5%) | 6 (21.4%) |
| 3.0x to 3.9x | 2 (1.2%) | 0 (0.0%) |
| 4.0x or more | 35 (20.6%) | 5 (17.9%) |
| Total | 170 (100.0%) | 28 (100.0%) |
Real Estate Taxes by Mortgage Status in De Valls Bluff
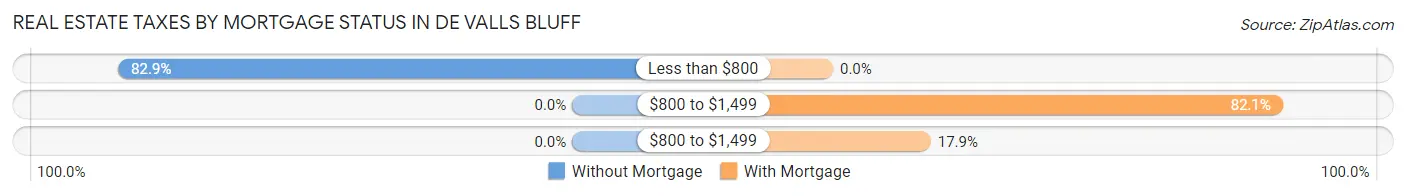
| Property Taxes | Without Mortgage | With Mortgage |
| Less than $800 | 141 (82.9%) | 0 (0.0%) |
| $800 to $1,499 | 0 (0.0%) | 23 (82.1%) |
| $800 to $1,499 | 0 (0.0%) | 5 (17.9%) |
| Total | 170 (100.0%) | 28 (100.0%) |
Health & Disability in De Valls Bluff
Health Insurance Coverage by Age in De Valls Bluff
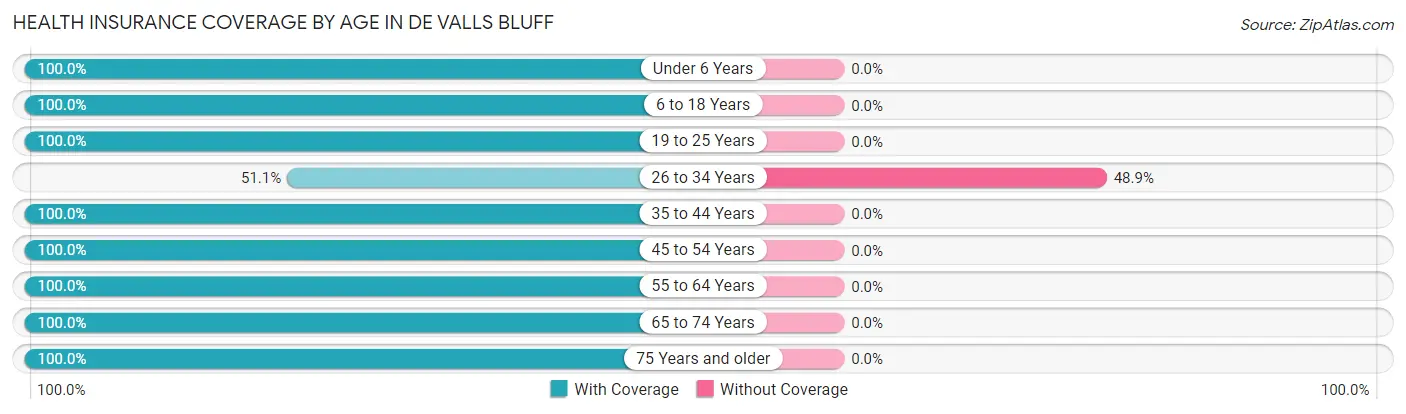
| Age Bracket | With Coverage | Without Coverage |
| Under 6 Years | 46 (100.0%) | 0 (0.0%) |
| 6 to 18 Years | 85 (100.0%) | 0 (0.0%) |
| 19 to 25 Years | 3 (100.0%) | 0 (0.0%) |
| 26 to 34 Years | 48 (51.1%) | 46 (48.9%) |
| 35 to 44 Years | 27 (100.0%) | 0 (0.0%) |
| 45 to 54 Years | 31 (100.0%) | 0 (0.0%) |
| 55 to 64 Years | 26 (100.0%) | 0 (0.0%) |
| 65 to 74 Years | 84 (100.0%) | 0 (0.0%) |
| 75 Years and older | 164 (100.0%) | 0 (0.0%) |
| Total | 514 (91.8%) | 46 (8.2%) |
Health Insurance Coverage by Citizenship Status in De Valls Bluff
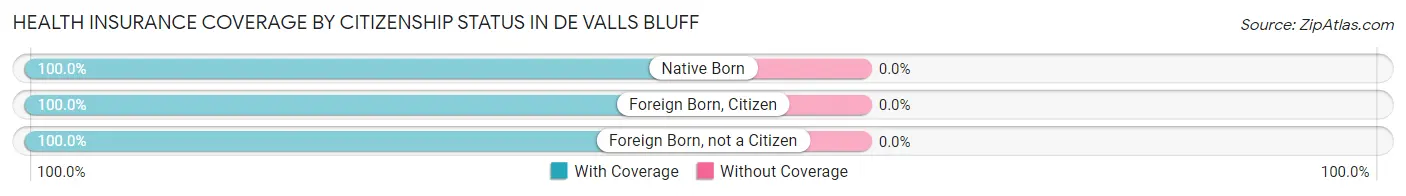
| Citizenship Status | With Coverage | Without Coverage |
| Native Born | 46 (100.0%) | 0 (0.0%) |
| Foreign Born, Citizen | 85 (100.0%) | 0 (0.0%) |
| Foreign Born, not a Citizen | 3 (100.0%) | 0 (0.0%) |
Health Insurance Coverage by Household Income in De Valls Bluff
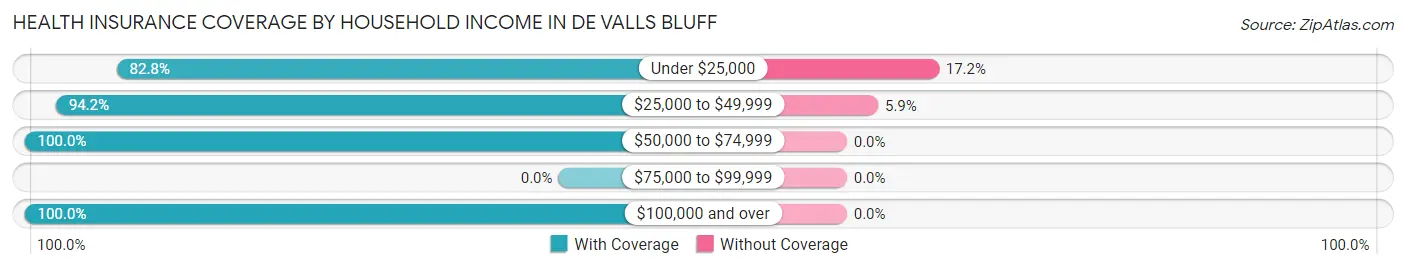
| Household Income | With Coverage | Without Coverage |
| Under $25,000 | 168 (82.8%) | 35 (17.2%) |
| $25,000 to $49,999 | 177 (94.2%) | 11 (5.9%) |
| $50,000 to $74,999 | 89 (100.0%) | 0 (0.0%) |
| $75,000 to $99,999 | 0 (0.0%) | 0 (0.0%) |
| $100,000 and over | 80 (100.0%) | 0 (0.0%) |
Public vs Private Health Insurance Coverage by Age in De Valls Bluff
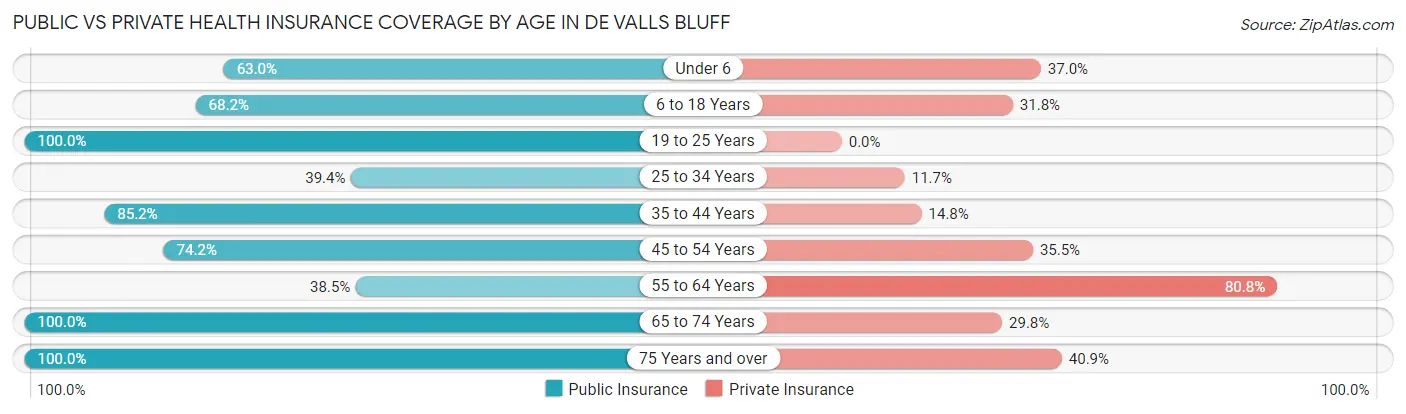
| Age Bracket | Public Insurance | Private Insurance |
| Under 6 | 29 (63.0%) | 17 (37.0%) |
| 6 to 18 Years | 58 (68.2%) | 27 (31.8%) |
| 19 to 25 Years | 3 (100.0%) | 0 (0.0%) |
| 25 to 34 Years | 37 (39.4%) | 11 (11.7%) |
| 35 to 44 Years | 23 (85.2%) | 4 (14.8%) |
| 45 to 54 Years | 23 (74.2%) | 11 (35.5%) |
| 55 to 64 Years | 10 (38.5%) | 21 (80.8%) |
| 65 to 74 Years | 84 (100.0%) | 25 (29.8%) |
| 75 Years and over | 164 (100.0%) | 67 (40.8%) |
| Total | 431 (77.0%) | 183 (32.7%) |
Disability Status by Sex by Age in De Valls Bluff
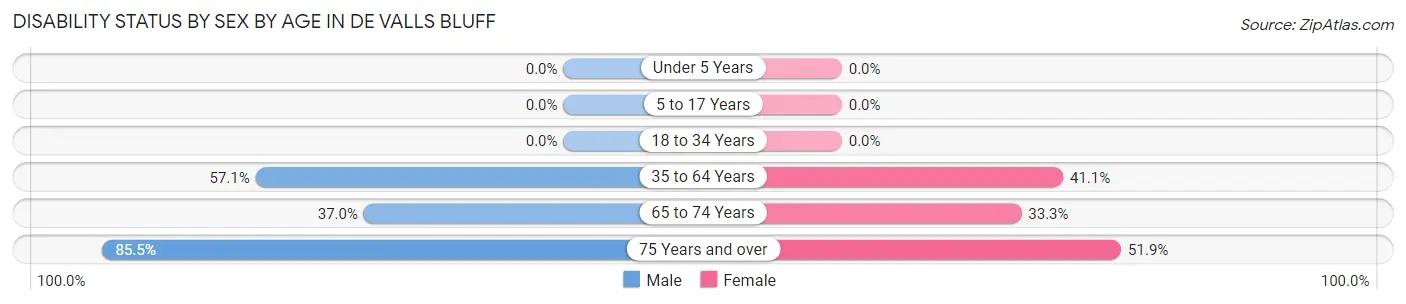
| Age Bracket | Male | Female |
| Under 5 Years | 0 (0.0%) | 0 (0.0%) |
| 5 to 17 Years | 0 (0.0%) | 0 (0.0%) |
| 18 to 34 Years | 0 (0.0%) | 0 (0.0%) |
| 35 to 64 Years | 16 (57.1%) | 23 (41.1%) |
| 65 to 74 Years | 10 (37.0%) | 19 (33.3%) |
| 75 Years and over | 71 (85.5%) | 42 (51.8%) |
Disability Class by Sex by Age in De Valls Bluff
Disability Class: Hearing Difficulty
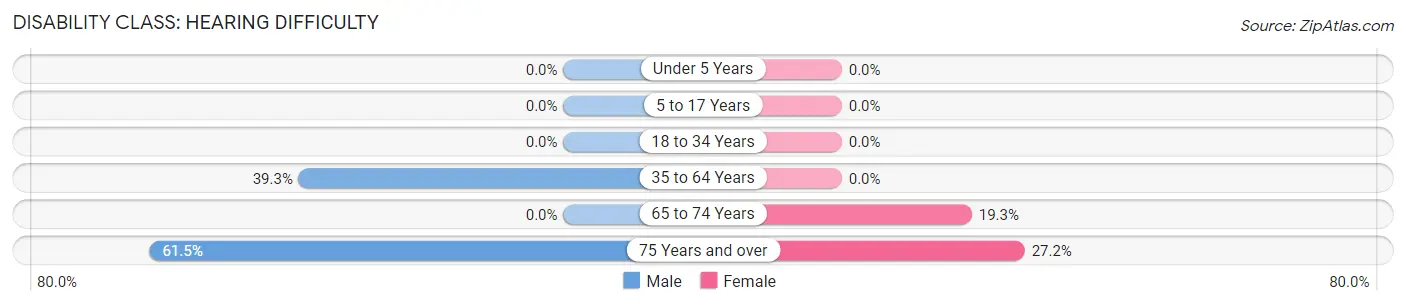
| Age Bracket | Male | Female |
| Under 5 Years | 0 (0.0%) | 0 (0.0%) |
| 5 to 17 Years | 0 (0.0%) | 0 (0.0%) |
| 18 to 34 Years | 0 (0.0%) | 0 (0.0%) |
| 35 to 64 Years | 11 (39.3%) | 0 (0.0%) |
| 65 to 74 Years | 0 (0.0%) | 11 (19.3%) |
| 75 Years and over | 51 (61.5%) | 22 (27.2%) |
Disability Class: Vision Difficulty
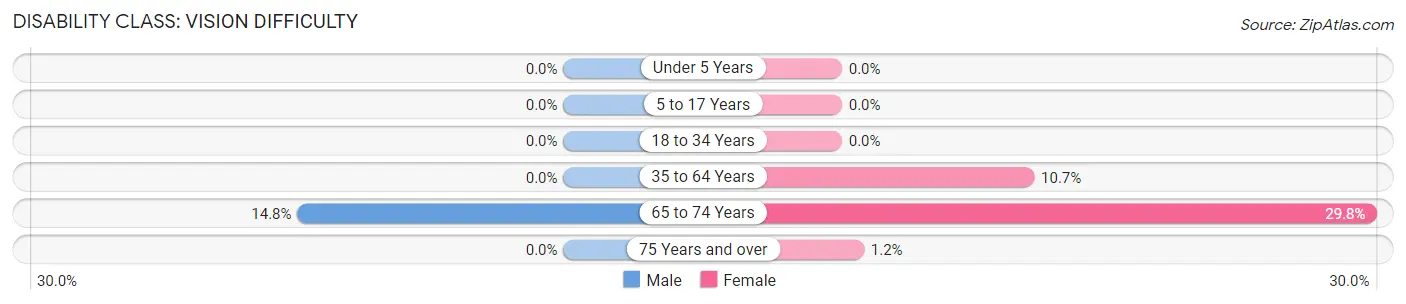
| Age Bracket | Male | Female |
| Under 5 Years | 0 (0.0%) | 0 (0.0%) |
| 5 to 17 Years | 0 (0.0%) | 0 (0.0%) |
| 18 to 34 Years | 0 (0.0%) | 0 (0.0%) |
| 35 to 64 Years | 0 (0.0%) | 6 (10.7%) |
| 65 to 74 Years | 4 (14.8%) | 17 (29.8%) |
| 75 Years and over | 0 (0.0%) | 1 (1.2%) |
Disability Class: Cognitive Difficulty
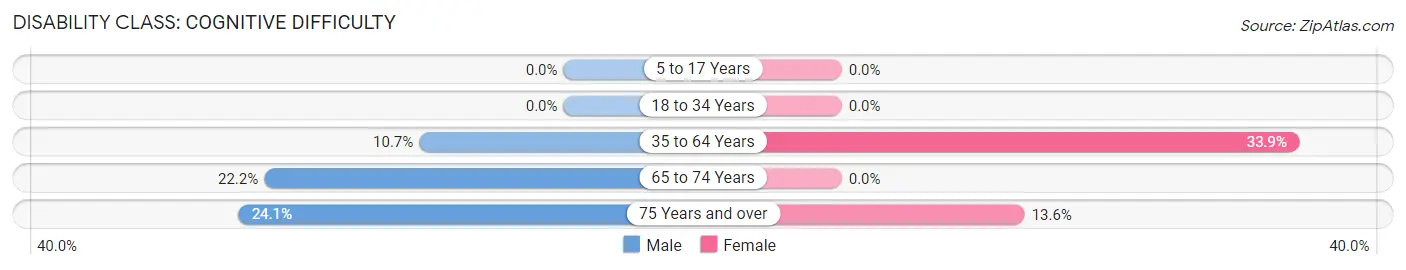
| Age Bracket | Male | Female |
| 5 to 17 Years | 0 (0.0%) | 0 (0.0%) |
| 18 to 34 Years | 0 (0.0%) | 0 (0.0%) |
| 35 to 64 Years | 3 (10.7%) | 19 (33.9%) |
| 65 to 74 Years | 6 (22.2%) | 0 (0.0%) |
| 75 Years and over | 20 (24.1%) | 11 (13.6%) |
Disability Class: Ambulatory Difficulty
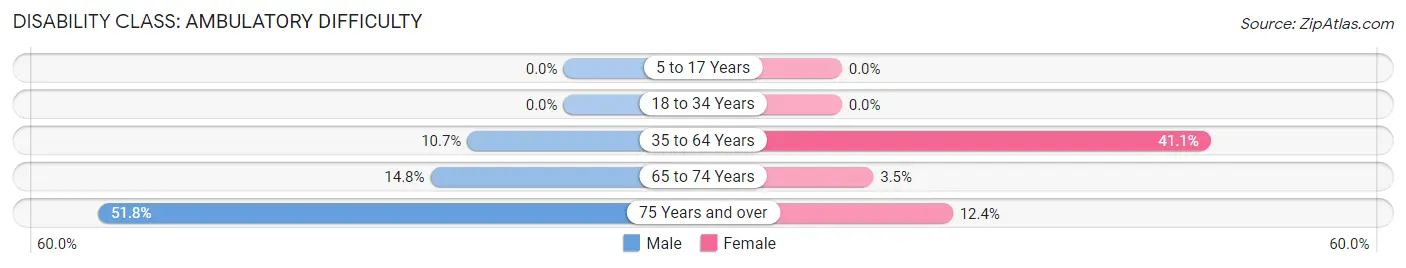
| Age Bracket | Male | Female |
| 5 to 17 Years | 0 (0.0%) | 0 (0.0%) |
| 18 to 34 Years | 0 (0.0%) | 0 (0.0%) |
| 35 to 64 Years | 3 (10.7%) | 23 (41.1%) |
| 65 to 74 Years | 4 (14.8%) | 2 (3.5%) |
| 75 Years and over | 43 (51.8%) | 10 (12.3%) |
Disability Class: Self-Care Difficulty
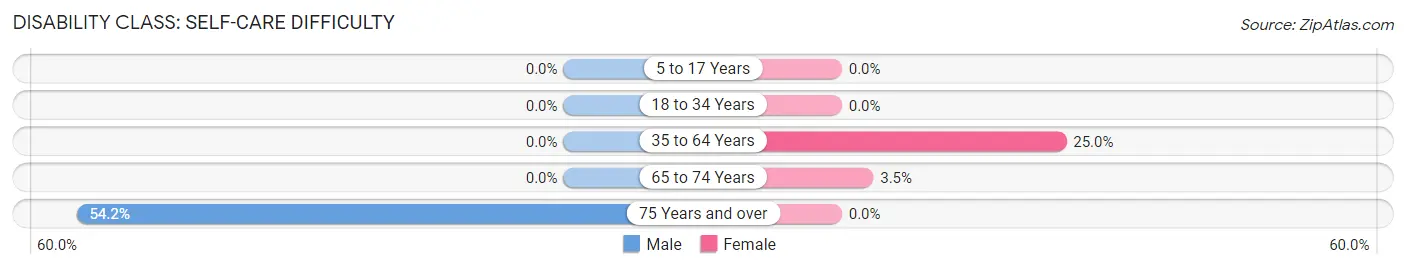
| Age Bracket | Male | Female |
| 5 to 17 Years | 0 (0.0%) | 0 (0.0%) |
| 18 to 34 Years | 0 (0.0%) | 0 (0.0%) |
| 35 to 64 Years | 0 (0.0%) | 14 (25.0%) |
| 65 to 74 Years | 0 (0.0%) | 2 (3.5%) |
| 75 Years and over | 45 (54.2%) | 0 (0.0%) |
Technology Access in De Valls Bluff
Computing Device Access in De Valls Bluff
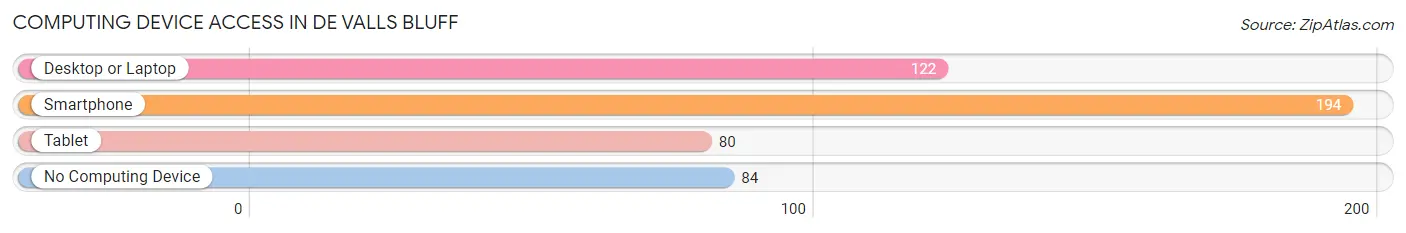
| Device Type | # Households | % Households |
| Desktop or Laptop | 122 | 42.7% |
| Smartphone | 194 | 67.8% |
| Tablet | 80 | 28.0% |
| No Computing Device | 84 | 29.4% |
| Total | 286 | 100.0% |
Internet Access in De Valls Bluff
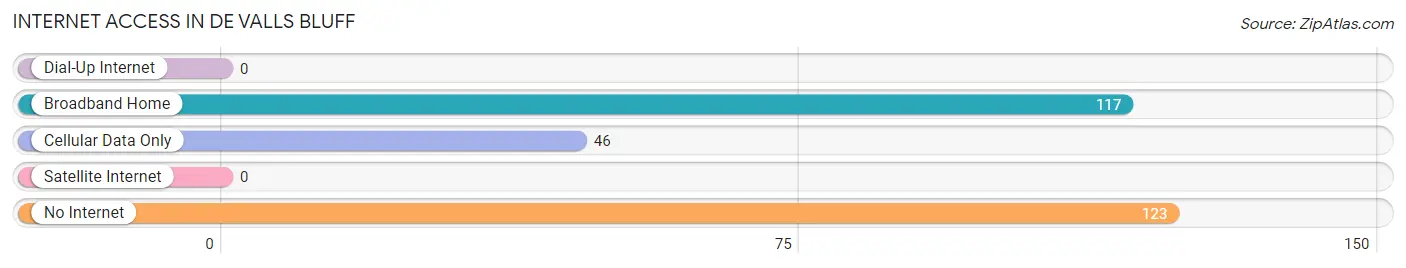
| Internet Type | # Households | % Households |
| Dial-Up Internet | 0 | 0.0% |
| Broadband Home | 117 | 40.9% |
| Cellular Data Only | 46 | 16.1% |
| Satellite Internet | 0 | 0.0% |
| No Internet | 123 | 43.0% |
| Total | 286 | 100.0% |
De Valls Bluff Summary
De Valls Bluff is a small town located in Prairie County, Arkansas, United States. It is situated on the White River, approximately 40 miles east of Little Rock. The town was founded in 1871 and named after a local landowner, William De Valls. The population of De Valls Bluff was 545 at the 2010 census, making it the smallest incorporated town in the county.
History
The area around De Valls Bluff was first settled in the early 1800s by settlers from the nearby town of DeValls Bluff. The town was officially founded in 1871 and named after William De Valls, a local landowner. The town was incorporated in 1876 and the first post office was established in 1877.
In the late 1800s, the town was a thriving river port and the center of a large cotton-producing region. The town was also home to a number of businesses, including a cotton gin, a grist mill, a sawmill, and a blacksmith shop.
In the early 1900s, the town began to decline as the river port business declined and the cotton industry moved away. The town was further impacted by the Great Depression and the Dust Bowl of the 1930s.
Geography
De Valls Bluff is located at 35°14'25" North, 91°25'45" West (35.240278, -91.429167). The town is situated on the White River, approximately 40 miles east of Little Rock.
The town has a total area of 0.8 square miles, all of which is land. The town is located in the Arkansas Delta region and is part of the Grand Prairie, an area of flat, fertile land that stretches from Little Rock to the Mississippi River.
Economy
The economy of De Valls Bluff is largely based on agriculture. The town is home to a number of farms, including cotton, soybean, and rice farms. The town is also home to a number of small businesses, including a grocery store, a hardware store, and a restaurant.
Demographics
As of the 2010 census, there were 545 people living in De Valls Bluff. The racial makeup of the town was 95.3% White, 0.7% African American, 0.2% Native American, 0.2% Asian, and 3.6% from other races. Hispanic or Latino of any race were 2.2% of the population.
The median income for a household in the town was $30,000, and the median income for a family was $35,000. The per capita income for the town was $14,000. About 18.2% of families and 20.7% of the population were below the poverty line, including 28.6% of those under age 18 and 10.7% of those age 65 or over.
Common Questions
What is Per Capita Income in De Valls Bluff?
Per Capita income in De Valls Bluff is $22,813.
What is the Median Family Income in De Valls Bluff?
Median Family Income in De Valls Bluff is $43,409.
What is the Median Household income in De Valls Bluff?
Median Household Income in De Valls Bluff is $23,056.
What is Inequality or Gini Index in De Valls Bluff?
Inequality or Gini Index in De Valls Bluff is 0.51.
What is the Total Population of De Valls Bluff?
Total Population of De Valls Bluff is 560.
What is the Total Male Population of De Valls Bluff?
Total Male Population of De Valls Bluff is 246.
What is the Total Female Population of De Valls Bluff?
Total Female Population of De Valls Bluff is 314.
What is the Ratio of Males per 100 Females in De Valls Bluff?
There are 78.34 Males per 100 Females in De Valls Bluff.
What is the Ratio of Females per 100 Males in De Valls Bluff?
There are 127.64 Females per 100 Males in De Valls Bluff.
What is the Median Population Age in De Valls Bluff?
Median Population Age in De Valls Bluff is 54.8 Years.
What is the Average Family Size in De Valls Bluff
Average Family Size in De Valls Bluff is 3.4 People.
What is the Average Household Size in De Valls Bluff
Average Household Size in De Valls Bluff is 2.0 People.
How Large is the Labor Force in De Valls Bluff?
There are 145 People in the Labor Forcein in De Valls Bluff.
What is the Percentage of People in the Labor Force in De Valls Bluff?
33.6% of People are in the Labor Force in De Valls Bluff.