Dardanelle, AR Map & Demographics
Dardanelle Map
Dardanelle Overview
$23,365
PER CAPITA INCOME
$58,204
AVG FAMILY INCOME
$47,724
AVG HOUSEHOLD INCOME
21.5%
WAGE / INCOME GAP [ % ]
78.5¢/ $1
WAGE / INCOME GAP [ $ ]
0.47
INEQUALITY / GINI INDEX
4,544
TOTAL POPULATION
2,205
MALE POPULATION
2,339
FEMALE POPULATION
94.27
MALES / 100 FEMALES
106.08
FEMALES / 100 MALES
37.9
MEDIAN AGE
3.3
AVG FAMILY SIZE
2.7
AVG HOUSEHOLD SIZE
2,168
LABOR FORCE [ PEOPLE ]
59.5%
PERCENT IN LABOR FORCE
6.8%
UNEMPLOYMENT RATE
Dardanelle Zip Codes
Dardanelle Area Codes
Income in Dardanelle
Income Overview in Dardanelle
Per Capita Income in Dardanelle is $23,365, while median incomes of families and households are $58,204 and $47,724 respectively.
| Characteristic | Number | Measure |
| Per Capita Income | 4,544 | $23,365 |
| Median Family Income | 1,138 | $58,204 |
| Mean Family Income | 1,138 | $64,800 |
| Median Household Income | 1,663 | $47,724 |
| Mean Household Income | 1,663 | $60,056 |
| Income Deficit | 1,138 | $0 |
| Wage / Income Gap (%) | 4,544 | 21.55% |
| Wage / Income Gap ($) | 4,544 | 78.45¢ per $1 |
| Gini / Inequality Index | 4,544 | 0.47 |
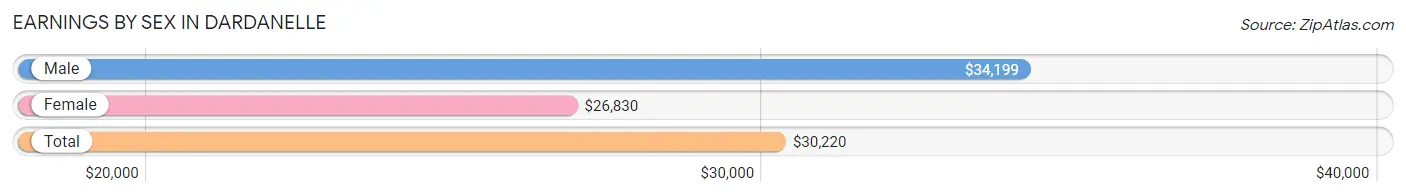
Earnings by Sex in Dardanelle
Average Earnings in Dardanelle are $30,220, $34,199 for men and $26,830 for women, a difference of 21.5%.
| Sex | Number | Average Earnings |
| Male | 1,065 (48.5%) | $34,199 |
| Female | 1,131 (51.5%) | $26,830 |
| Total | 2,196 (100.0%) | $30,220 |
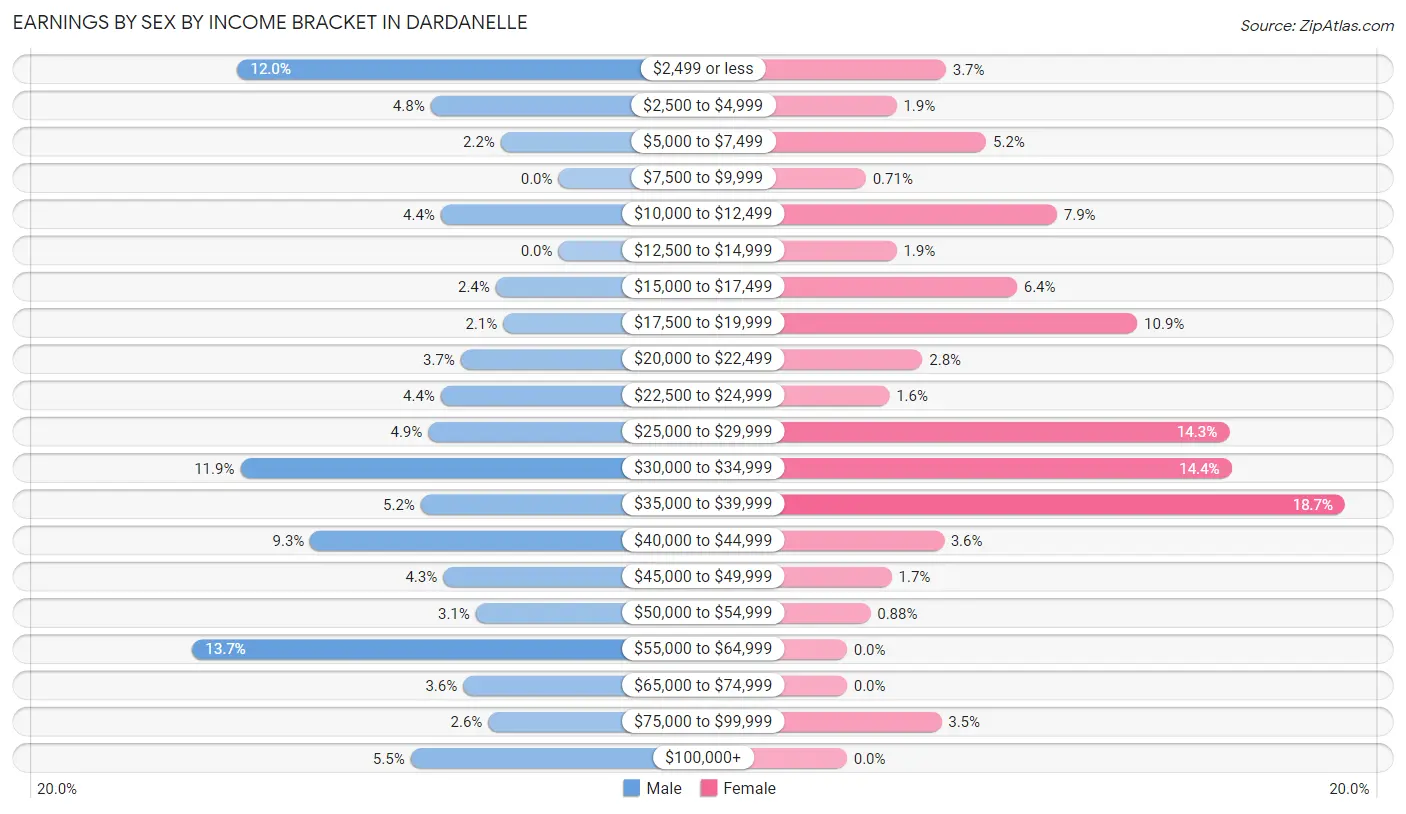
Earnings by Sex by Income Bracket in Dardanelle
The most common earnings brackets in Dardanelle are $55,000 to $64,999 for men (146 | 13.7%) and $35,000 to $39,999 for women (211 | 18.7%).
| Income | Male | Female |
| $2,499 or less | 128 (12.0%) | 42 (3.7%) |
| $2,500 to $4,999 | 51 (4.8%) | 21 (1.9%) |
| $5,000 to $7,499 | 23 (2.2%) | 59 (5.2%) |
| $7,500 to $9,999 | 0 (0.0%) | 8 (0.7%) |
| $10,000 to $12,499 | 47 (4.4%) | 89 (7.9%) |
| $12,500 to $14,999 | 0 (0.0%) | 21 (1.9%) |
| $15,000 to $17,499 | 25 (2.4%) | 72 (6.4%) |
| $17,500 to $19,999 | 22 (2.1%) | 123 (10.9%) |
| $20,000 to $22,499 | 39 (3.7%) | 32 (2.8%) |
| $22,500 to $24,999 | 47 (4.4%) | 18 (1.6%) |
| $25,000 to $29,999 | 52 (4.9%) | 162 (14.3%) |
| $30,000 to $34,999 | 127 (11.9%) | 163 (14.4%) |
| $35,000 to $39,999 | 55 (5.2%) | 211 (18.7%) |
| $40,000 to $44,999 | 99 (9.3%) | 41 (3.6%) |
| $45,000 to $49,999 | 46 (4.3%) | 19 (1.7%) |
| $50,000 to $54,999 | 33 (3.1%) | 10 (0.9%) |
| $55,000 to $64,999 | 146 (13.7%) | 0 (0.0%) |
| $65,000 to $74,999 | 38 (3.6%) | 0 (0.0%) |
| $75,000 to $99,999 | 28 (2.6%) | 40 (3.5%) |
| $100,000+ | 59 (5.5%) | 0 (0.0%) |
| Total | 1,065 (100.0%) | 1,131 (100.0%) |
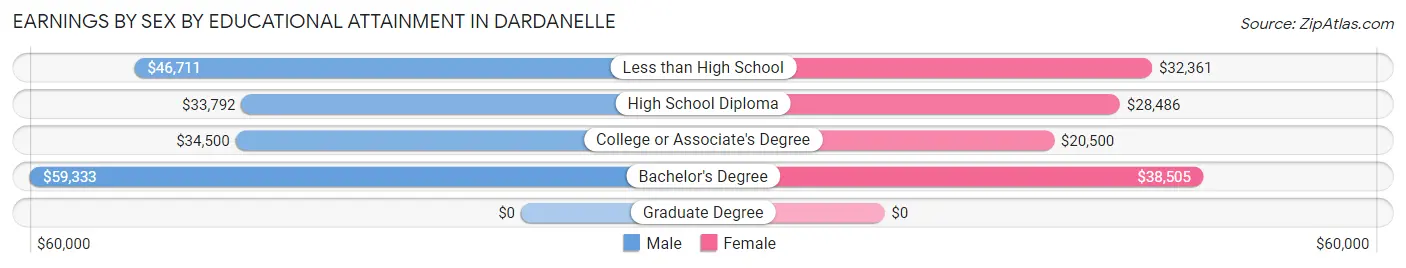
Earnings by Sex by Educational Attainment in Dardanelle
Average earnings in Dardanelle are $40,690 for men and $29,183 for women, a difference of 28.3%. Men with an educational attainment of bachelor's degree enjoy the highest average annual earnings of $59,333, while those with high school diploma education earn the least with $33,792. Women with an educational attainment of bachelor's degree earn the most with the average annual earnings of $38,505, while those with college or associate's degree education have the smallest earnings of $20,500.
| Educational Attainment | Male Income | Female Income |
| Less than High School | $46,711 | $32,361 |
| High School Diploma | $33,792 | $28,486 |
| College or Associate's Degree | $34,500 | $20,500 |
| Bachelor's Degree | $59,333 | $38,505 |
| Graduate Degree | - | - |
| Total | $40,690 | $29,183 |
Family Income in Dardanelle
Family Income Brackets in Dardanelle
According to the Dardanelle family income data, there are 289 families falling into the $50,000 to $74,999 income range, which is the most common income bracket and makes up 25.4% of all families.
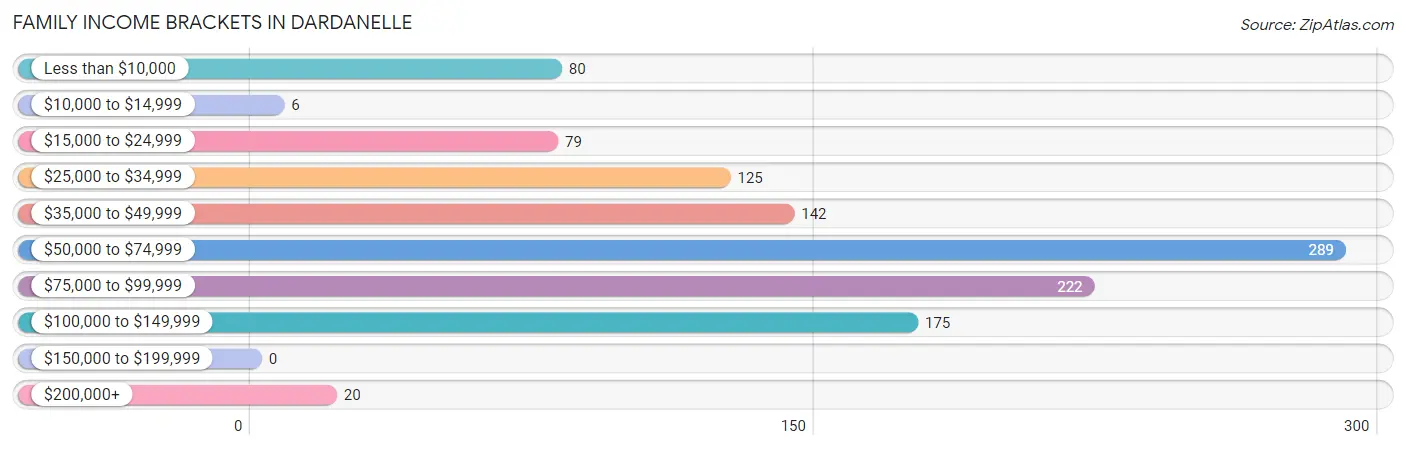
| Income Bracket | # Families | % Families |
| Less than $10,000 | 80 | 7.0% |
| $10,000 to $14,999 | 6 | 0.5% |
| $15,000 to $24,999 | 79 | 6.9% |
| $25,000 to $34,999 | 125 | 11.0% |
| $35,000 to $49,999 | 142 | 12.5% |
| $50,000 to $74,999 | 289 | 25.4% |
| $75,000 to $99,999 | 222 | 19.5% |
| $100,000 to $149,999 | 175 | 15.4% |
| $150,000 to $199,999 | 0 | 0.0% |
| $200,000+ | 20 | 1.8% |
Family Income by Famaliy Size in Dardanelle
5-person families (71 | 6.2%) account for the highest median family income in Dardanelle with $100,156 per family, while 2-person families (457 | 40.2%) have the highest median income of $27,949 per family member.
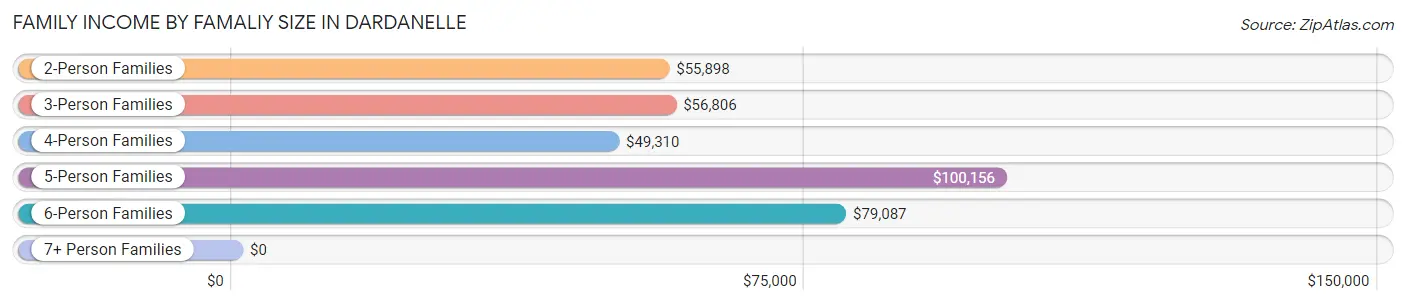
| Income Bracket | # Families | Median Income |
| 2-Person Families | 457 (40.2%) | $55,898 |
| 3-Person Families | 385 (33.8%) | $56,806 |
| 4-Person Families | 122 (10.7%) | $49,310 |
| 5-Person Families | 71 (6.2%) | $100,156 |
| 6-Person Families | 103 (9.0%) | $79,087 |
| 7+ Person Families | 0 (0.0%) | $0 |
| Total | 1,138 (100.0%) | $58,204 |
Family Income by Number of Earners in Dardanelle
The median family income in Dardanelle is $58,204, with families comprising 3+ earners (144) having the highest median family income of $79,808, while families with no earners (189) have the lowest median family income of $31,157, accounting for 12.7% and 16.6% of families, respectively.
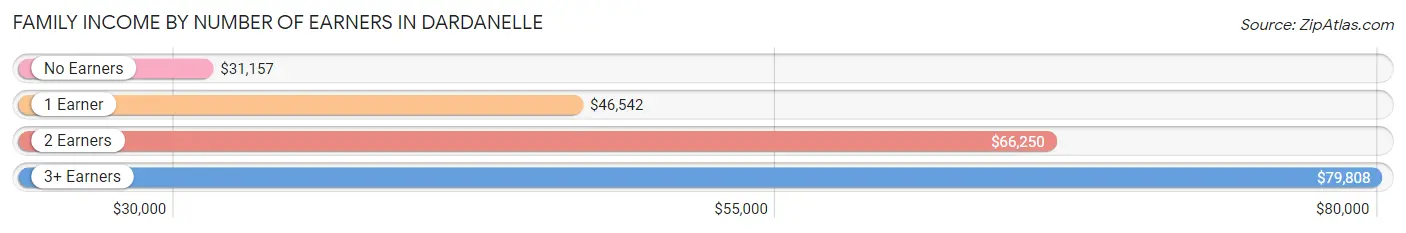
| Number of Earners | # Families | Median Income |
| No Earners | 189 (16.6%) | $31,157 |
| 1 Earner | 317 (27.9%) | $46,542 |
| 2 Earners | 488 (42.9%) | $66,250 |
| 3+ Earners | 144 (12.7%) | $79,808 |
| Total | 1,138 (100.0%) | $58,204 |
Household Income in Dardanelle
Household Income Brackets in Dardanelle
With 333 households falling in the category, the $50,000 to $74,999 income range is the most frequent in Dardanelle, accounting for 20.0% of all households.
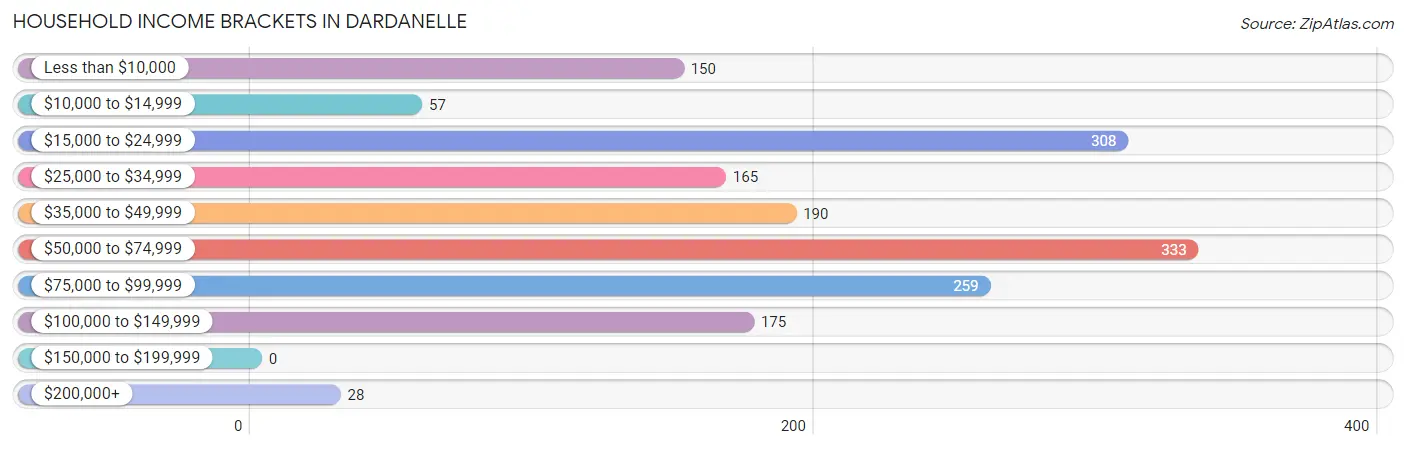
| Income Bracket | # Households | % Households |
| Less than $10,000 | 150 | 9.0% |
| $10,000 to $14,999 | 57 | 3.4% |
| $15,000 to $24,999 | 308 | 18.5% |
| $25,000 to $34,999 | 165 | 9.9% |
| $35,000 to $49,999 | 190 | 11.4% |
| $50,000 to $74,999 | 333 | 20.0% |
| $75,000 to $99,999 | 259 | 15.6% |
| $100,000 to $149,999 | 175 | 10.5% |
| $150,000 to $199,999 | 0 | 0.0% |
| $200,000+ | 28 | 1.7% |
Household Income by Householder Age in Dardanelle
The median household income in Dardanelle is $47,724, with the highest median household income of $59,196 found in the 45 to 64 years age bracket for the primary householder. A total of 595 households (35.8%) fall into this category. Meanwhile, the 65+ years age bracket for the primary householder has the lowest median household income of $24,365, with 437 households (26.3%) in this group.
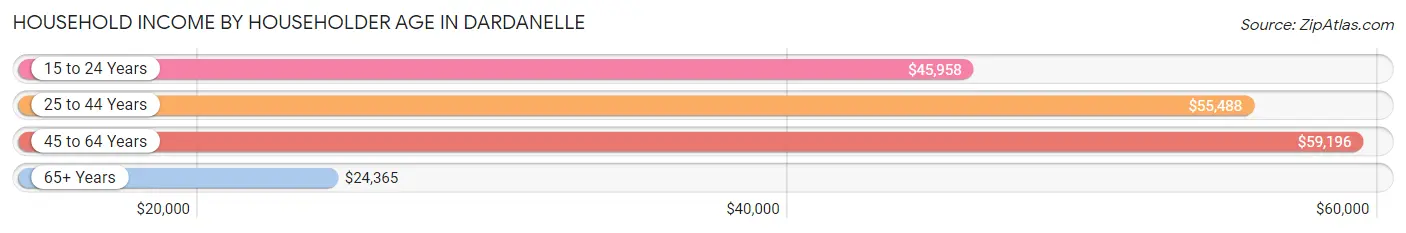
| Income Bracket | # Households | Median Income |
| 15 to 24 Years | 81 (4.9%) | $45,958 |
| 25 to 44 Years | 550 (33.1%) | $55,488 |
| 45 to 64 Years | 595 (35.8%) | $59,196 |
| 65+ Years | 437 (26.3%) | $24,365 |
| Total | 1,663 (100.0%) | $47,724 |
Poverty in Dardanelle
Income Below Poverty by Sex and Age in Dardanelle
With 15.8% poverty level for males and 10.0% for females among the residents of Dardanelle, 6 to 11 year old males and 6 to 11 year old females are the most vulnerable to poverty, with 42 males (34.7%) and 34 females (29.6%) in their respective age groups living below the poverty level.
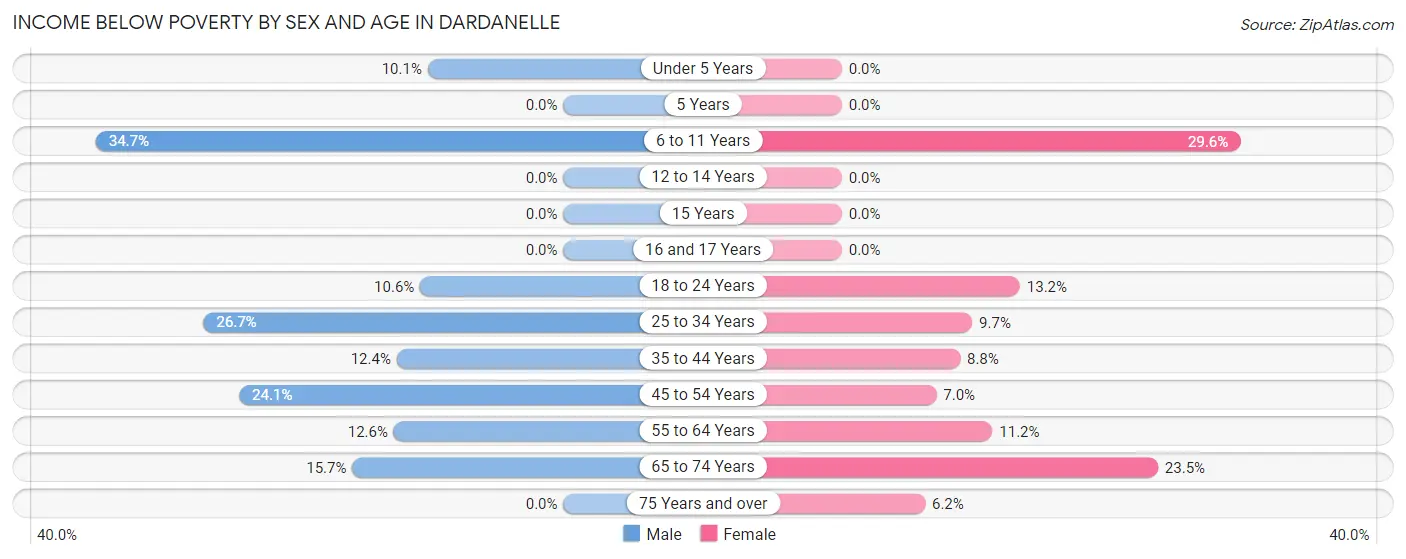
| Age Bracket | Male | Female |
| Under 5 Years | 14 (10.1%) | 0 (0.0%) |
| 5 Years | 0 (0.0%) | 0 (0.0%) |
| 6 to 11 Years | 42 (34.7%) | 34 (29.6%) |
| 12 to 14 Years | 0 (0.0%) | 0 (0.0%) |
| 15 Years | 0 (0.0%) | 0 (0.0%) |
| 16 and 17 Years | 0 (0.0%) | 0 (0.0%) |
| 18 to 24 Years | 27 (10.6%) | 32 (13.2%) |
| 25 to 34 Years | 93 (26.7%) | 18 (9.7%) |
| 35 to 44 Years | 37 (12.4%) | 31 (8.8%) |
| 45 to 54 Years | 58 (24.1%) | 16 (7.0%) |
| 55 to 64 Years | 37 (12.6%) | 36 (11.2%) |
| 65 to 74 Years | 34 (15.7%) | 46 (23.5%) |
| 75 Years and over | 0 (0.0%) | 11 (6.2%) |
| Total | 342 (15.8%) | 224 (10.0%) |
Income Above Poverty by Sex and Age in Dardanelle
According to the poverty statistics in Dardanelle, males aged 5 years and females aged under 5 years are the age groups that are most secure financially, with 100.0% of males and 100.0% of females in these age groups living above the poverty line.
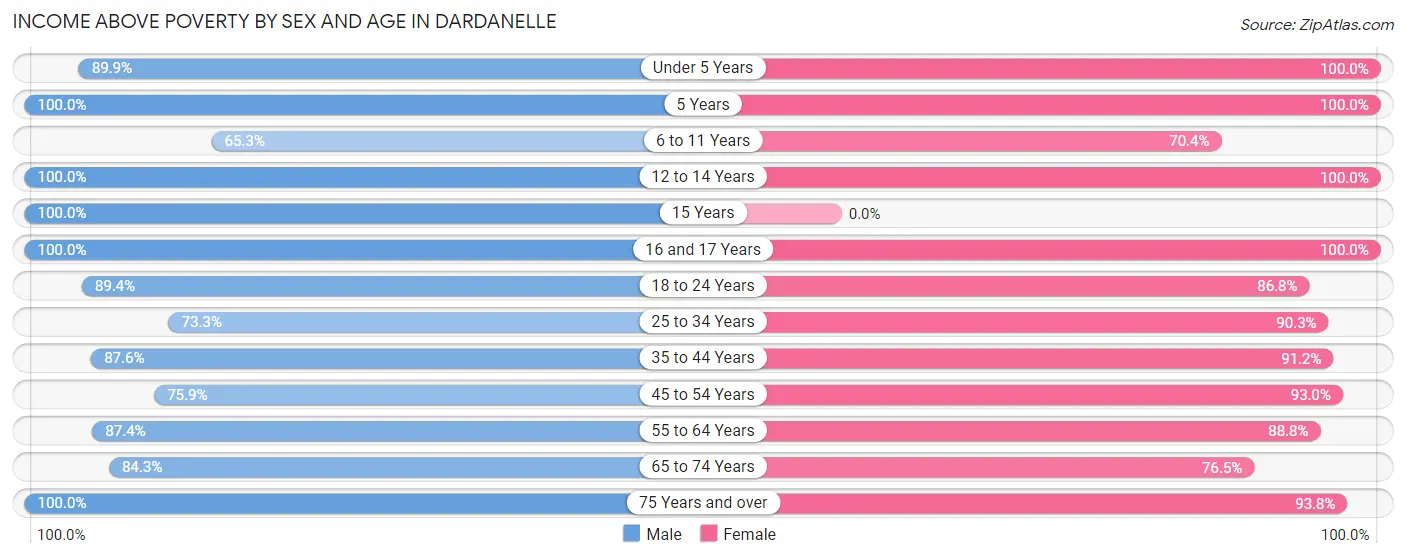
| Age Bracket | Male | Female |
| Under 5 Years | 125 (89.9%) | 230 (100.0%) |
| 5 Years | 86 (100.0%) | 11 (100.0%) |
| 6 to 11 Years | 79 (65.3%) | 81 (70.4%) |
| 12 to 14 Years | 35 (100.0%) | 124 (100.0%) |
| 15 Years | 8 (100.0%) | 0 (0.0%) |
| 16 and 17 Years | 73 (100.0%) | 66 (100.0%) |
| 18 to 24 Years | 227 (89.4%) | 210 (86.8%) |
| 25 to 34 Years | 255 (73.3%) | 168 (90.3%) |
| 35 to 44 Years | 262 (87.6%) | 322 (91.2%) |
| 45 to 54 Years | 183 (75.9%) | 212 (93.0%) |
| 55 to 64 Years | 257 (87.4%) | 286 (88.8%) |
| 65 to 74 Years | 183 (84.3%) | 150 (76.5%) |
| 75 Years and over | 52 (100.0%) | 167 (93.8%) |
| Total | 1,825 (84.2%) | 2,027 (90.0%) |
Income Below Poverty Among Married-Couple Families in Dardanelle
The poverty statistics for married-couple families in Dardanelle show that 8.8% or 72 of the total 817 families live below the poverty line. Families with no children have the highest poverty rate of 14.1%, comprising of 61 families. On the other hand, families with 3 or 4 children have the lowest poverty rate of 0.0%, which includes 0 families.
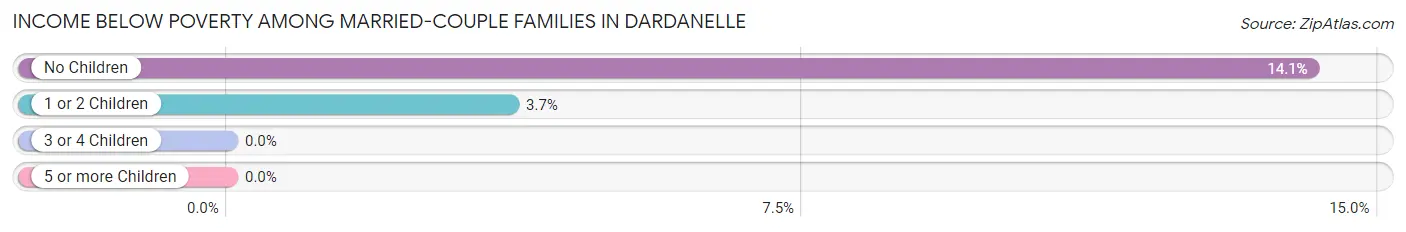
| Children | Above Poverty | Below Poverty |
| No Children | 371 (85.9%) | 61 (14.1%) |
| 1 or 2 Children | 289 (96.3%) | 11 (3.7%) |
| 3 or 4 Children | 85 (100.0%) | 0 (0.0%) |
| 5 or more Children | 0 (0.0%) | 0 (0.0%) |
| Total | 745 (91.2%) | 72 (8.8%) |
Income Below Poverty Among Single-Parent Households in Dardanelle
According to the poverty data in Dardanelle, 26.2% or 11 single-father households and 14.0% or 39 single-mother households are living below the poverty line. Among single-father households, those with 1 or 2 children have the highest poverty rate, with 11 households (44.0%) experiencing poverty. Likewise, among single-mother households, those with 1 or 2 children have the highest poverty rate, with 39 households (32.2%) falling below the poverty line.
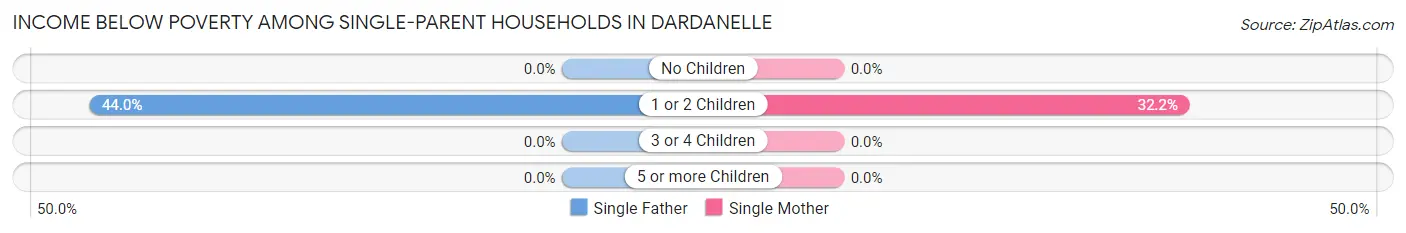
| Children | Single Father | Single Mother |
| No Children | 0 (0.0%) | 0 (0.0%) |
| 1 or 2 Children | 11 (44.0%) | 39 (32.2%) |
| 3 or 4 Children | 0 (0.0%) | 0 (0.0%) |
| 5 or more Children | 0 (0.0%) | 0 (0.0%) |
| Total | 11 (26.2%) | 39 (14.0%) |
Income Below Poverty Among Married-Couple vs Single-Parent Households in Dardanelle
The poverty data for Dardanelle shows that 72 of the married-couple family households (8.8%) and 50 of the single-parent households (15.6%) are living below the poverty level. Within the married-couple family households, those with no children have the highest poverty rate, with 61 households (14.1%) falling below the poverty line. Among the single-parent households, those with 1 or 2 children have the highest poverty rate, with 50 household (34.3%) living below poverty.
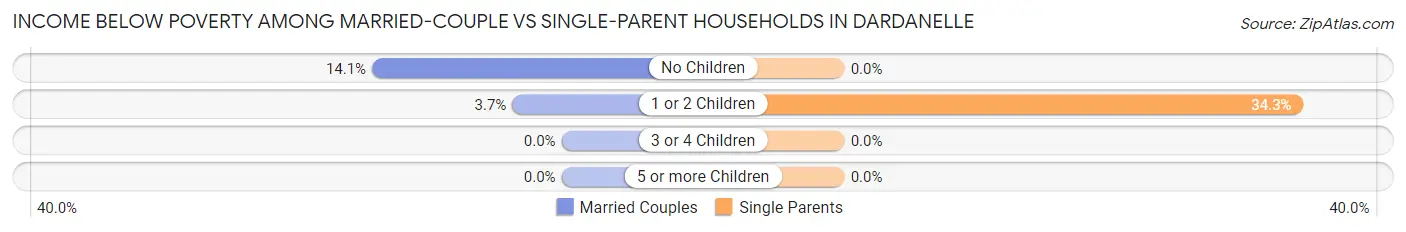
| Children | Married-Couple Families | Single-Parent Households |
| No Children | 61 (14.1%) | 0 (0.0%) |
| 1 or 2 Children | 11 (3.7%) | 50 (34.3%) |
| 3 or 4 Children | 0 (0.0%) | 0 (0.0%) |
| 5 or more Children | 0 (0.0%) | 0 (0.0%) |
| Total | 72 (8.8%) | 50 (15.6%) |
Race in Dardanelle
The most populous races in Dardanelle are White / Caucasian (2,998 | 66.0%), Hispanic or Latino (1,787 | 39.3%), and Some other Race (1,098 | 24.2%).
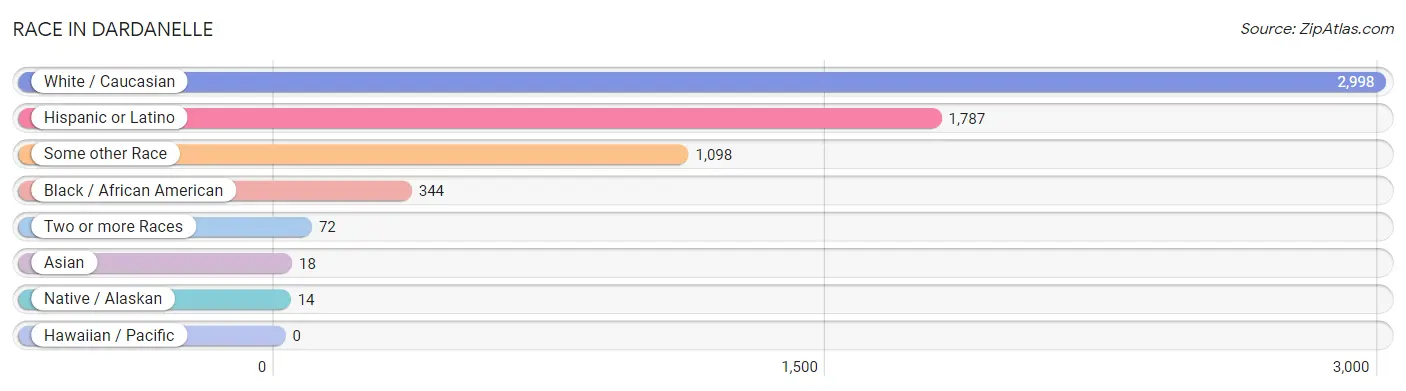
| Race | # Population | % Population |
| Asian | 18 | 0.4% |
| Black / African American | 344 | 7.6% |
| Hawaiian / Pacific | 0 | 0.0% |
| Hispanic or Latino | 1,787 | 39.3% |
| Native / Alaskan | 14 | 0.3% |
| White / Caucasian | 2,998 | 66.0% |
| Two or more Races | 72 | 1.6% |
| Some other Race | 1,098 | 24.2% |
| Total | 4,544 | 100.0% |
Ancestry in Dardanelle
The most populous ancestries reported in Dardanelle are Mexican (1,046 | 23.0%), Central American (550 | 12.1%), Salvadoran (505 | 11.1%), Irish (451 | 9.9%), and English (240 | 5.3%), together accounting for 61.4% of all Dardanelle residents.
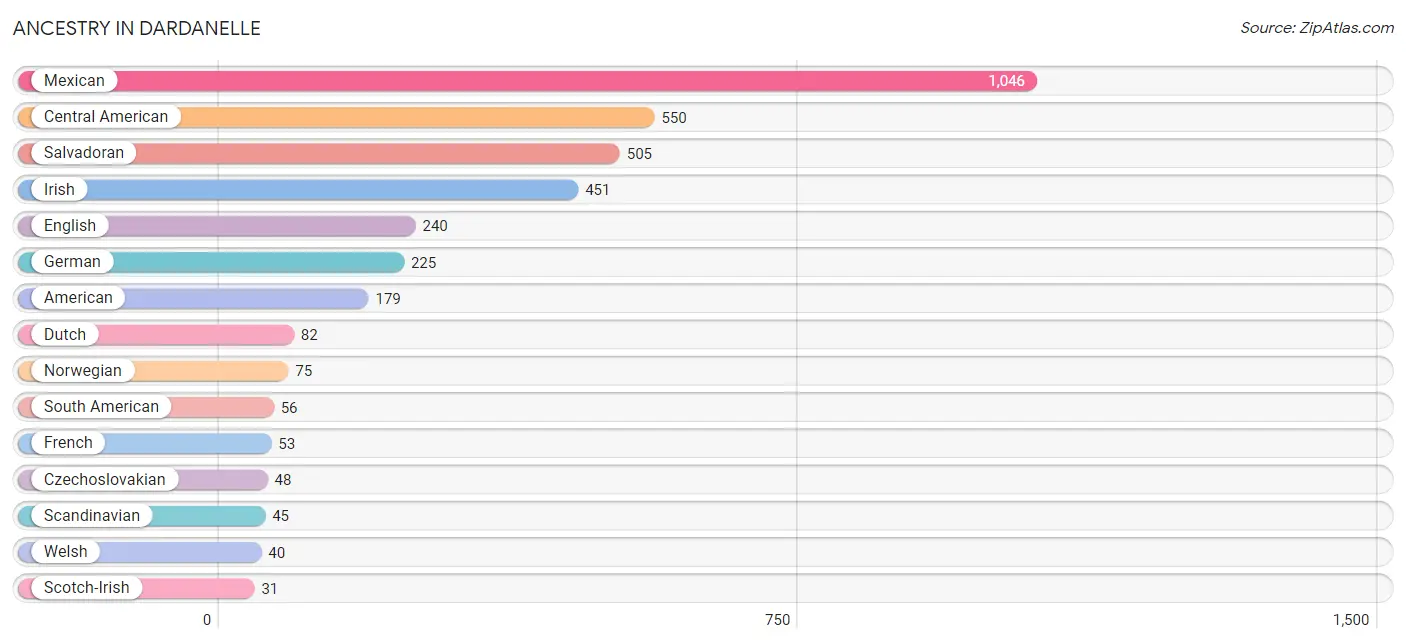
| Ancestry | # Population | % Population |
| American | 179 | 3.9% |
| Austrian | 20 | 0.4% |
| British | 21 | 0.5% |
| Burmese | 26 | 0.6% |
| Canadian | 5 | 0.1% |
| Central American | 550 | 12.1% |
| Central American Indian | 7 | 0.2% |
| Cherokee | 6 | 0.1% |
| Choctaw | 7 | 0.2% |
| Czech | 24 | 0.5% |
| Czechoslovakian | 48 | 1.1% |
| Dutch | 82 | 1.8% |
| Dutch West Indian | 25 | 0.5% |
| English | 240 | 5.3% |
| French | 53 | 1.2% |
| German | 225 | 5.0% |
| Guatemalan | 18 | 0.4% |
| Honduran | 27 | 0.6% |
| Irish | 451 | 9.9% |
| Italian | 25 | 0.5% |
| Mexican | 1,046 | 23.0% |
| Norwegian | 75 | 1.7% |
| Pakistani | 2 | 0.0% |
| Romanian | 9 | 0.2% |
| Russian | 9 | 0.2% |
| Salvadoran | 505 | 11.1% |
| Scandinavian | 45 | 1.0% |
| Scotch-Irish | 31 | 0.7% |
| Scottish | 26 | 0.6% |
| South American | 56 | 1.2% |
| Thai | 28 | 0.6% |
| Welsh | 40 | 0.9% | View All 32 Rows |
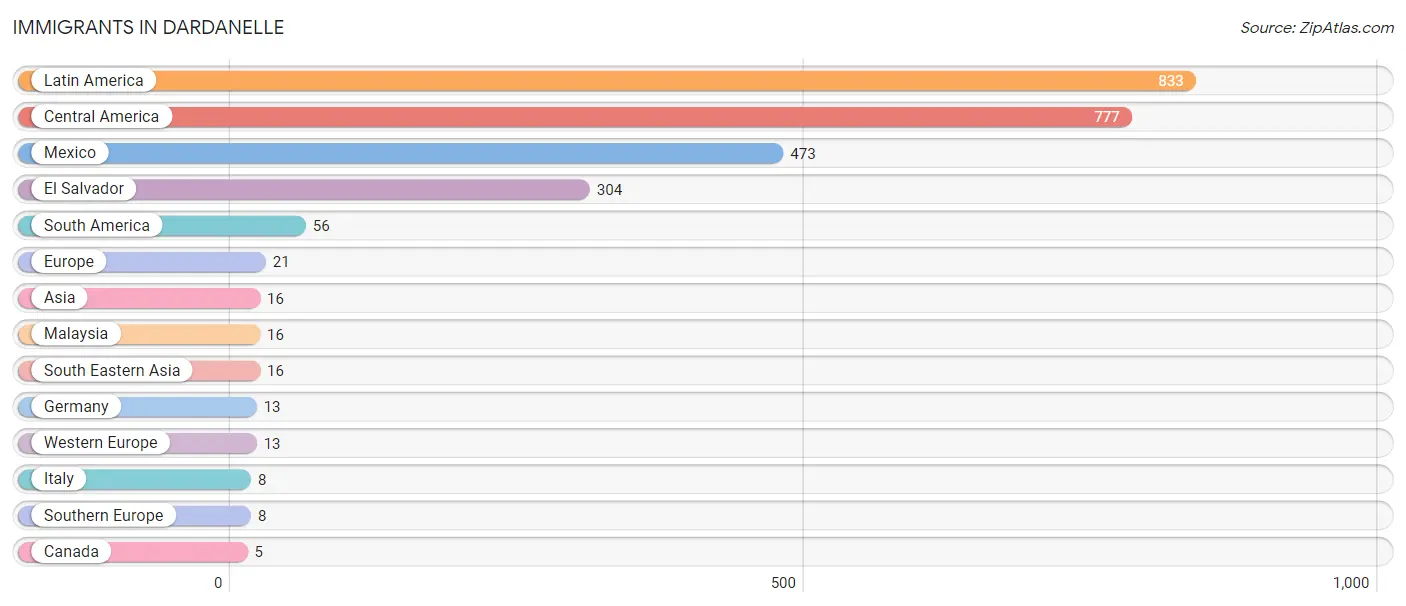
Immigrants in Dardanelle
The most numerous immigrant groups reported in Dardanelle came from Latin America (833 | 18.3%), Central America (777 | 17.1%), Mexico (473 | 10.4%), El Salvador (304 | 6.7%), and South America (56 | 1.2%), together accounting for 53.8% of all Dardanelle residents.
| Immigration Origin | # Population | % Population |
| Asia | 16 | 0.4% |
| Canada | 5 | 0.1% |
| Central America | 777 | 17.1% |
| El Salvador | 304 | 6.7% |
| Europe | 21 | 0.5% |
| Germany | 13 | 0.3% |
| Italy | 8 | 0.2% |
| Latin America | 833 | 18.3% |
| Malaysia | 16 | 0.4% |
| Mexico | 473 | 10.4% |
| South America | 56 | 1.2% |
| South Eastern Asia | 16 | 0.4% |
| Southern Europe | 8 | 0.2% |
| Western Europe | 13 | 0.3% | View All 14 Rows |
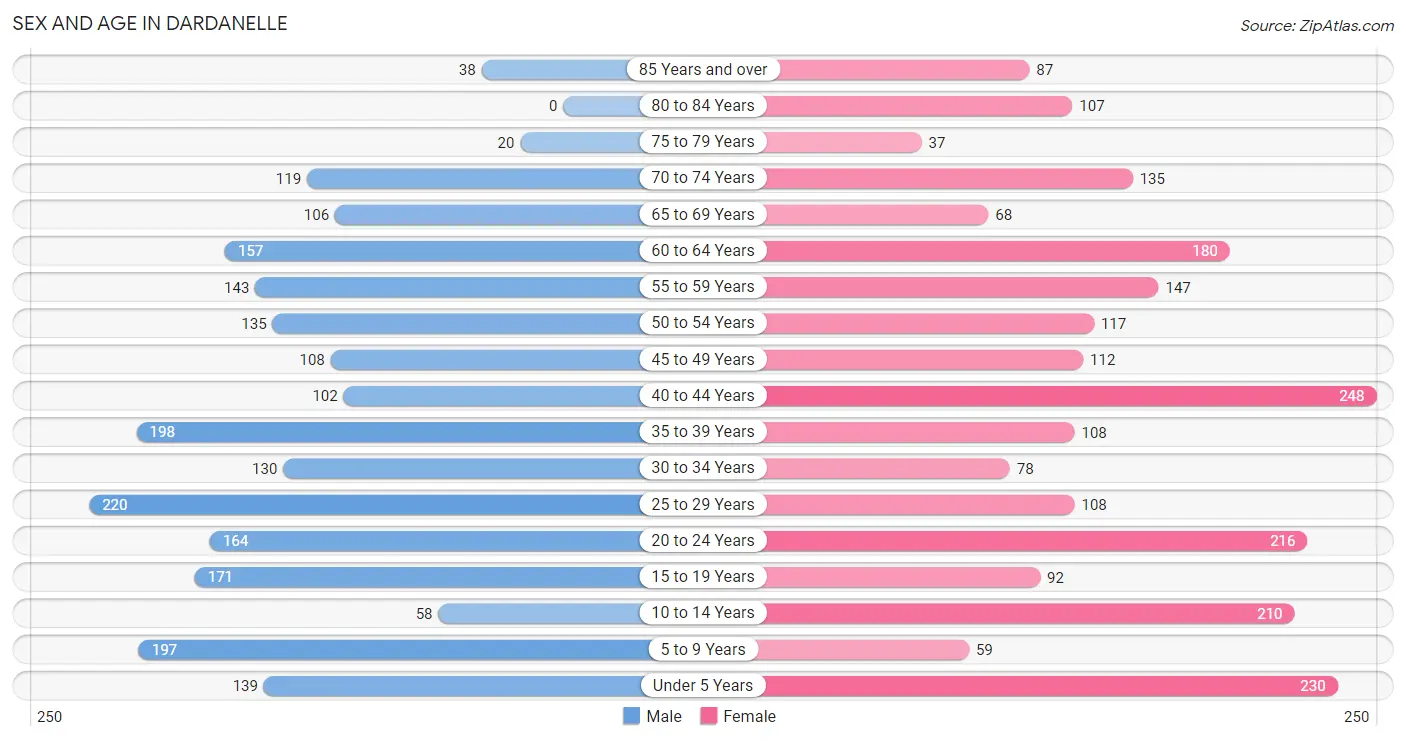
Sex and Age in Dardanelle
Sex and Age in Dardanelle
The most populous age groups in Dardanelle are 25 to 29 Years (220 | 10.0%) for men and 40 to 44 Years (248 | 10.6%) for women.
| Age Bracket | Male | Female |
| Under 5 Years | 139 (6.3%) | 230 (9.8%) |
| 5 to 9 Years | 197 (8.9%) | 59 (2.5%) |
| 10 to 14 Years | 58 (2.6%) | 210 (9.0%) |
| 15 to 19 Years | 171 (7.8%) | 92 (3.9%) |
| 20 to 24 Years | 164 (7.4%) | 216 (9.2%) |
| 25 to 29 Years | 220 (10.0%) | 108 (4.6%) |
| 30 to 34 Years | 130 (5.9%) | 78 (3.3%) |
| 35 to 39 Years | 198 (9.0%) | 108 (4.6%) |
| 40 to 44 Years | 102 (4.6%) | 248 (10.6%) |
| 45 to 49 Years | 108 (4.9%) | 112 (4.8%) |
| 50 to 54 Years | 135 (6.1%) | 117 (5.0%) |
| 55 to 59 Years | 143 (6.5%) | 147 (6.3%) |
| 60 to 64 Years | 157 (7.1%) | 180 (7.7%) |
| 65 to 69 Years | 106 (4.8%) | 68 (2.9%) |
| 70 to 74 Years | 119 (5.4%) | 135 (5.8%) |
| 75 to 79 Years | 20 (0.9%) | 37 (1.6%) |
| 80 to 84 Years | 0 (0.0%) | 107 (4.6%) |
| 85 Years and over | 38 (1.7%) | 87 (3.7%) |
| Total | 2,205 (100.0%) | 2,339 (100.0%) |
Families and Households in Dardanelle
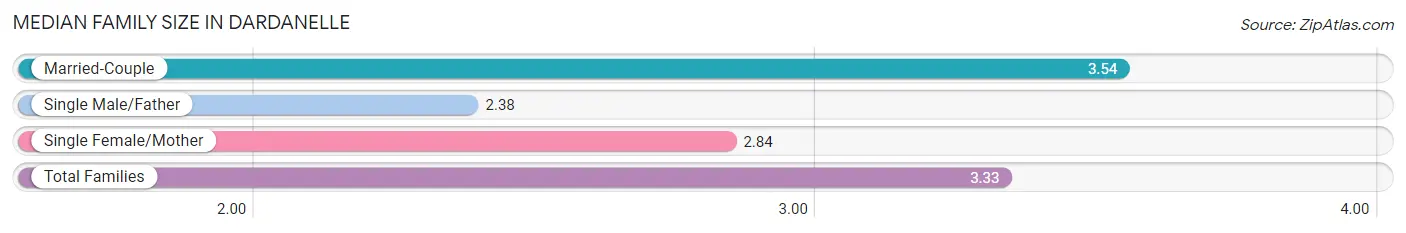
Median Family Size in Dardanelle
The median family size in Dardanelle is 3.33 persons per family, with married-couple families (817 | 71.8%) accounting for the largest median family size of 3.54 persons per family. On the other hand, single male/father families (42 | 3.7%) represent the smallest median family size with 2.38 persons per family.
| Family Type | # Families | Family Size |
| Married-Couple | 817 (71.8%) | 3.54 |
| Single Male/Father | 42 (3.7%) | 2.38 |
| Single Female/Mother | 279 (24.5%) | 2.84 |
| Total Families | 1,138 (100.0%) | 3.33 |
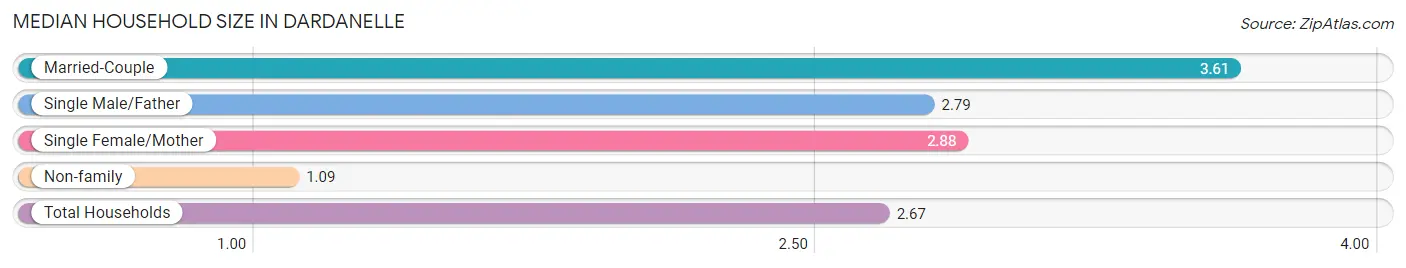
Median Household Size in Dardanelle
The median household size in Dardanelle is 2.67 persons per household, with married-couple households (817 | 49.1%) accounting for the largest median household size of 3.61 persons per household. non-family households (525 | 31.6%) represent the smallest median household size with 1.09 persons per household.
| Household Type | # Households | Household Size |
| Married-Couple | 817 (49.1%) | 3.61 |
| Single Male/Father | 42 (2.5%) | 2.79 |
| Single Female/Mother | 279 (16.8%) | 2.88 |
| Non-family | 525 (31.6%) | 1.09 |
| Total Households | 1,663 (100.0%) | 2.67 |
Household Size by Marriage Status in Dardanelle
Out of a total of 1,663 households in Dardanelle, 1,138 (68.4%) are family households, while 525 (31.6%) are nonfamily households. The most numerous type of family households are 2-person households, comprising 445, and the most common type of nonfamily households are 1-person households, comprising 475.
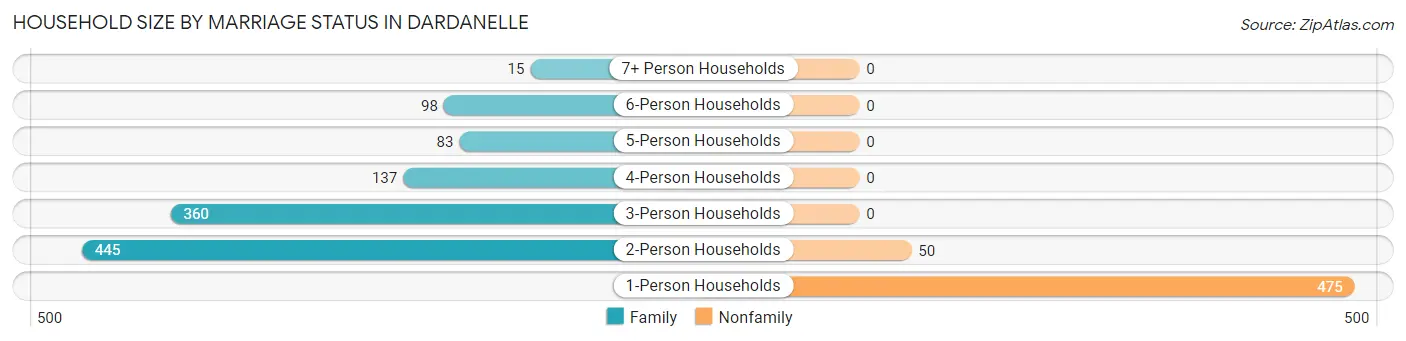
| Household Size | Family Households | Nonfamily Households |
| 1-Person Households | - | 475 (28.6%) |
| 2-Person Households | 445 (26.8%) | 50 (3.0%) |
| 3-Person Households | 360 (21.6%) | 0 (0.0%) |
| 4-Person Households | 137 (8.2%) | 0 (0.0%) |
| 5-Person Households | 83 (5.0%) | 0 (0.0%) |
| 6-Person Households | 98 (5.9%) | 0 (0.0%) |
| 7+ Person Households | 15 (0.9%) | 0 (0.0%) |
| Total | 1,138 (68.4%) | 525 (31.6%) |
Female Fertility in Dardanelle
Fertility by Age in Dardanelle
Average fertility rate in Dardanelle is 85.0 births per 1,000 women. Women in the age bracket of 20 to 34 years have the highest fertility rate with 206.0 births per 1,000 women. Women in the age bracket of 20 to 34 years acount for 100.0% of all women with births.
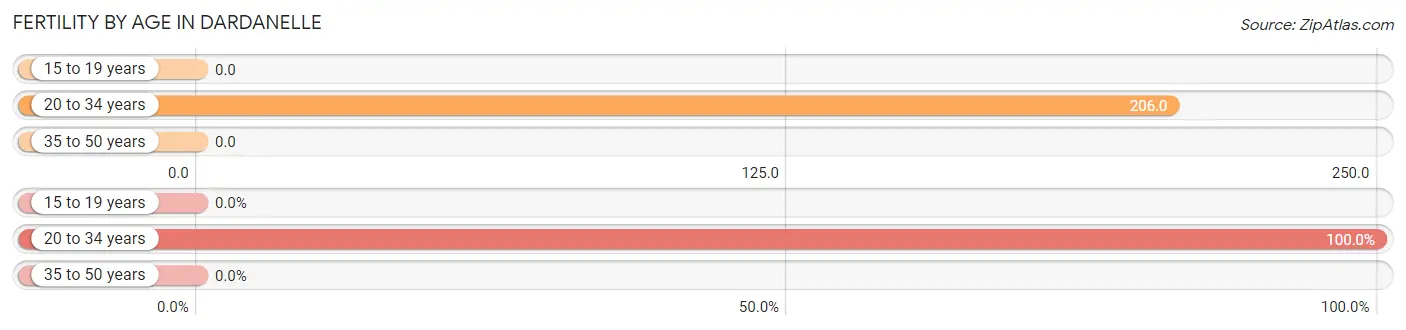
| Age Bracket | Women with Births | Births / 1,000 Women |
| 15 to 19 years | 0 (0.0%) | 0.0 |
| 20 to 34 years | 83 (100.0%) | 206.0 |
| 35 to 50 years | 0 (0.0%) | 0.0 |
| Total | 83 (100.0%) | 85.0 |
Fertility by Age by Marriage Status in Dardanelle
86.7% of women with births (83) in Dardanelle are married. The highest percentage of unmarried women with births falls into 20 to 34 years age bracket with 13.3% of them unmarried at the time of birth, while the lowest percentage of unmarried women with births belong to 20 to 34 years age bracket with 13.2% of them unmarried.
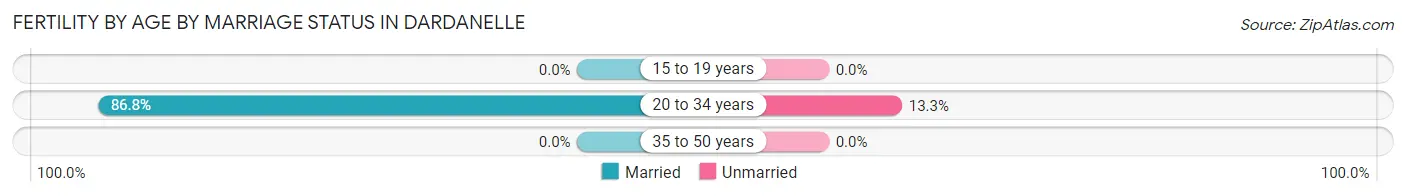
| Age Bracket | Married | Unmarried |
| 15 to 19 years | 0 (0.0%) | 0 (0.0%) |
| 20 to 34 years | 72 (86.8%) | 11 (13.3%) |
| 35 to 50 years | 0 (0.0%) | 0 (0.0%) |
| Total | 72 (86.8%) | 11 (13.3%) |
Fertility by Education in Dardanelle
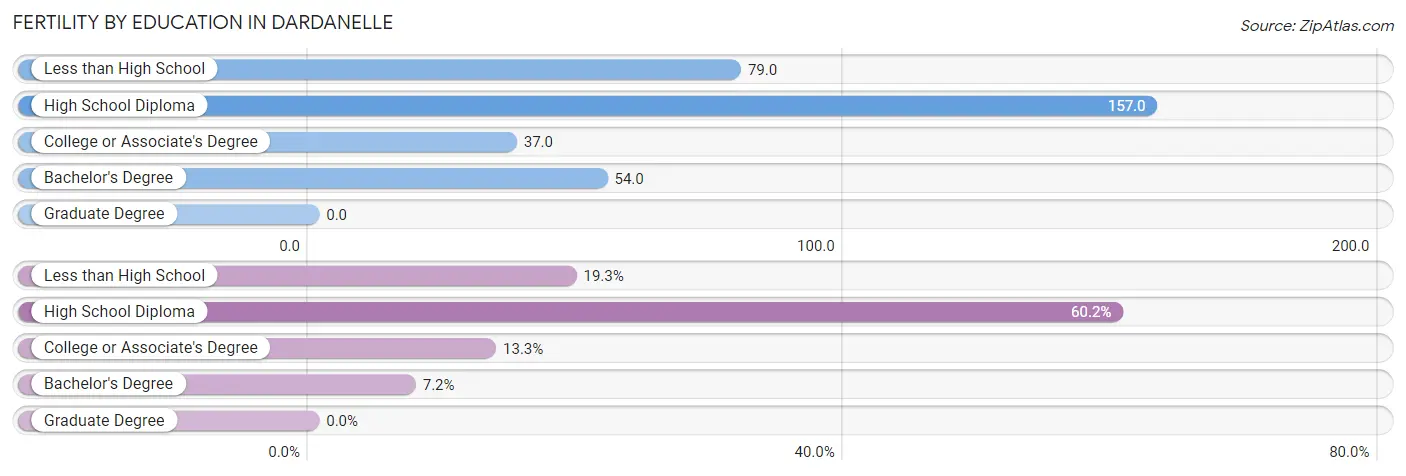
| Educational Attainment | Women with Births | Births / 1,000 Women |
| Less than High School | 16 (19.3%) | 79.0 |
| High School Diploma | 50 (60.2%) | 157.0 |
| College or Associate's Degree | 11 (13.3%) | 37.0 |
| Bachelor's Degree | 6 (7.2%) | 54.0 |
| Graduate Degree | 0 (0.0%) | 0.0 |
| Total | 83 (100.0%) | 85.0 |
Fertility by Education by Marriage Status in Dardanelle
13.3% of women with births in Dardanelle are unmarried. Women with the educational attainment of high school diploma are most likely to be married with 100.0% of them married at childbirth, while women with the educational attainment of less than high school are least likely to be married with 68.8% of them unmarried at childbirth.
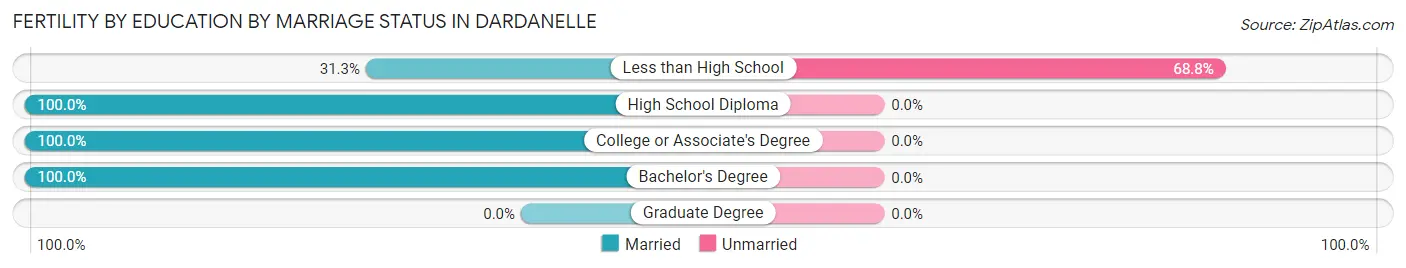
| Educational Attainment | Married | Unmarried |
| Less than High School | 5 (31.2%) | 11 (68.8%) |
| High School Diploma | 50 (100.0%) | 0 (0.0%) |
| College or Associate's Degree | 11 (100.0%) | 0 (0.0%) |
| Bachelor's Degree | 6 (100.0%) | 0 (0.0%) |
| Graduate Degree | 0 (0.0%) | 0 (0.0%) |
| Total | 72 (86.8%) | 11 (13.3%) |
Employment Characteristics in Dardanelle
Employment by Class of Employer in Dardanelle
Among the 2,019 employed individuals in Dardanelle, private company employees (1,650 | 81.7%), not-for-profit organizations (155 | 7.7%), and state government employees (75 | 3.7%) make up the most common classes of employment.
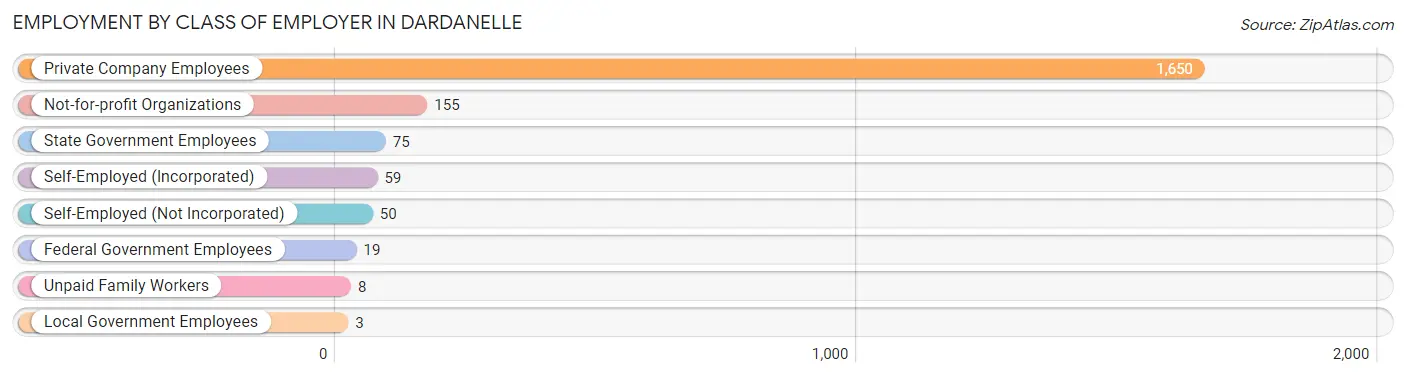
| Employer Class | # Employees | % Employees |
| Private Company Employees | 1,650 | 81.7% |
| Self-Employed (Incorporated) | 59 | 2.9% |
| Self-Employed (Not Incorporated) | 50 | 2.5% |
| Not-for-profit Organizations | 155 | 7.7% |
| Local Government Employees | 3 | 0.2% |
| State Government Employees | 75 | 3.7% |
| Federal Government Employees | 19 | 0.9% |
| Unpaid Family Workers | 8 | 0.4% |
| Total | 2,019 | 100.0% |
Employment Status by Age in Dardanelle
According to the labor force statistics for Dardanelle, out of the total population over 16 years of age (3,643), 59.5% or 2,168 individuals are in the labor force, with 6.8% or 147 of them unemployed. The age group with the highest labor force participation rate is 30 to 34 years, with 93.8% or 195 individuals in the labor force. Within the labor force, the 65 to 74 years age range has the highest percentage of unemployed individuals, with 66.7% or 18 of them being unemployed.
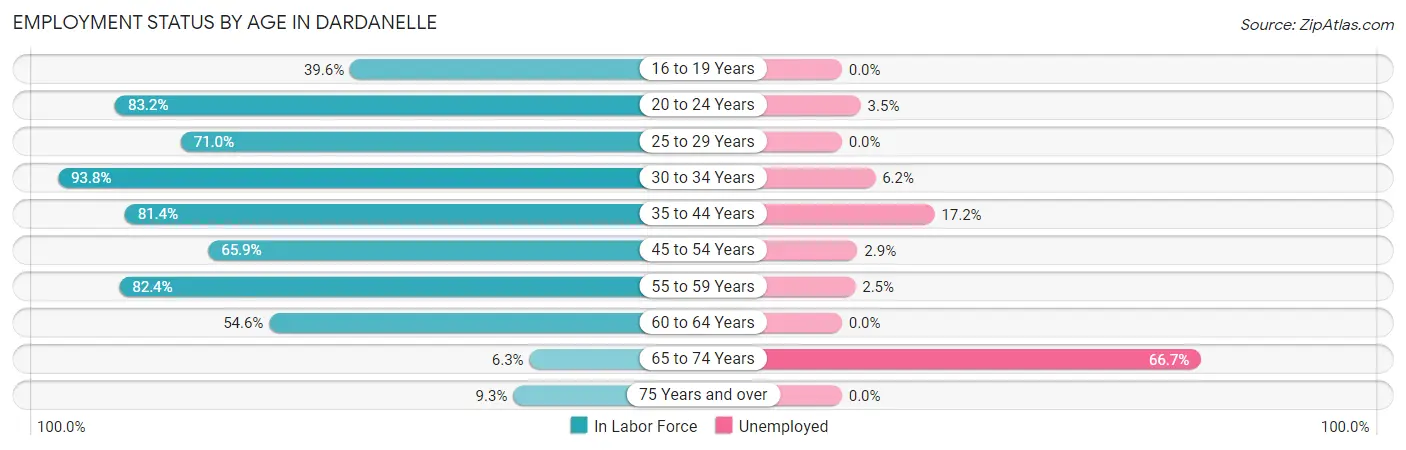
| Age Bracket | In Labor Force | Unemployed |
| 16 to 19 Years | 101 (39.6%) | 0 (0.0%) |
| 20 to 24 Years | 316 (83.2%) | 11 (3.5%) |
| 25 to 29 Years | 233 (71.0%) | 0 (0.0%) |
| 30 to 34 Years | 195 (93.8%) | 12 (6.2%) |
| 35 to 44 Years | 534 (81.4%) | 92 (17.2%) |
| 45 to 54 Years | 311 (65.9%) | 9 (2.9%) |
| 55 to 59 Years | 239 (82.4%) | 6 (2.5%) |
| 60 to 64 Years | 184 (54.6%) | 0 (0.0%) |
| 65 to 74 Years | 27 (6.3%) | 18 (66.7%) |
| 75 Years and over | 27 (9.3%) | 0 (0.0%) |
| Total | 2,168 (59.5%) | 147 (6.8%) |
Employment Status by Educational Attainment in Dardanelle
According to labor force statistics for Dardanelle, 74.0% of individuals (1,695) out of the total population between 25 and 64 years of age (2,291) are in the labor force, with 7.0% or 119 of them being unemployed. The group with the highest labor force participation rate are those with the educational attainment of bachelor's degree or higher, with 92.7% or 215 individuals in the labor force. Within the labor force, individuals with bachelor's degree or higher education have the highest percentage of unemployment, with 11.6% or 25 of them being unemployed.
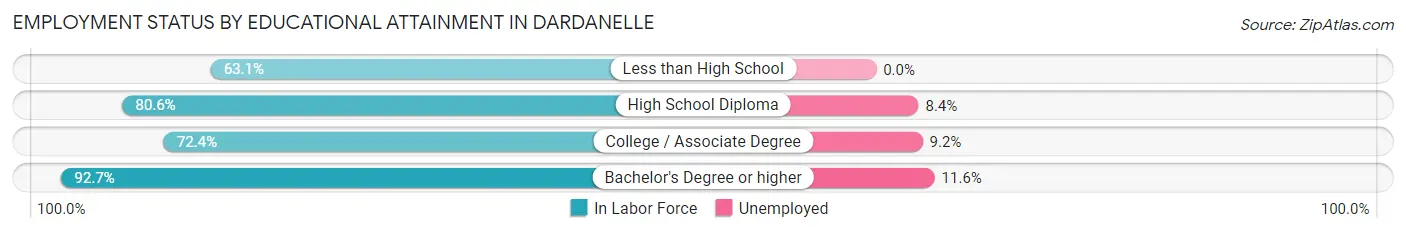
| Educational Attainment | In Labor Force | Unemployed |
| Less than High School | 412 (63.1%) | 0 (0.0%) |
| High School Diploma | 502 (80.6%) | 52 (8.4%) |
| College / Associate Degree | 567 (72.4%) | 72 (9.2%) |
| Bachelor's Degree or higher | 215 (92.7%) | 27 (11.6%) |
| Total | 1,695 (74.0%) | 160 (7.0%) |
Employment Occupations by Sex in Dardanelle
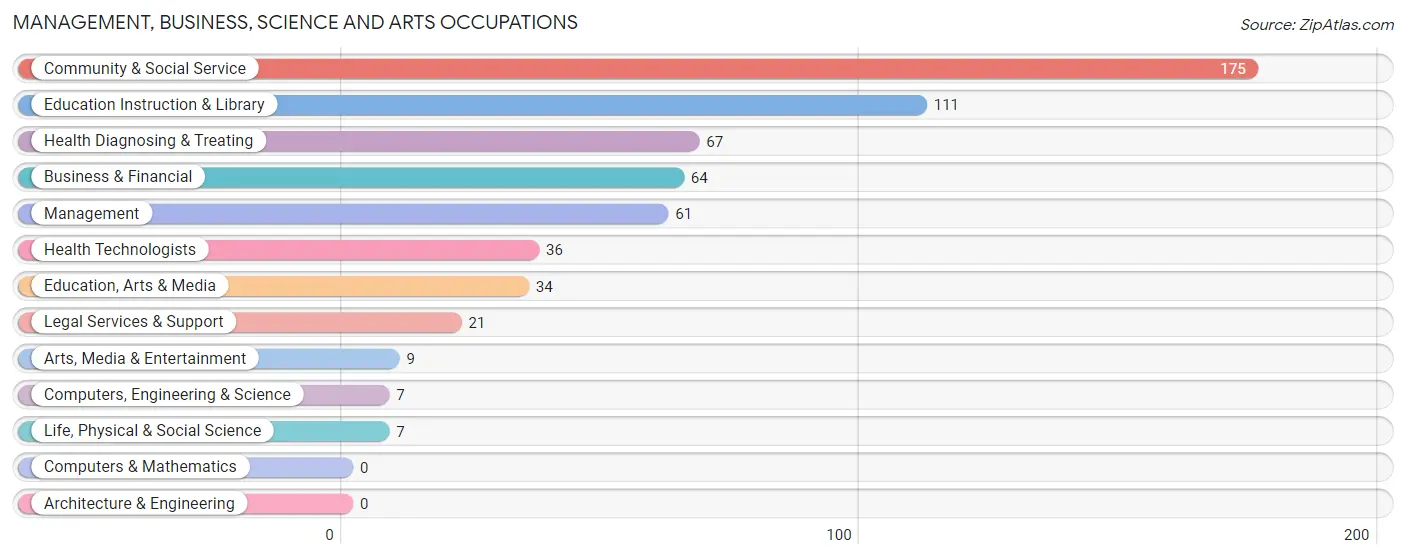
Management, Business, Science and Arts Occupations
The most common Management, Business, Science and Arts occupations in Dardanelle are Community & Social Service (175 | 8.7%), Education Instruction & Library (111 | 5.5%), Health Diagnosing & Treating (67 | 3.3%), Business & Financial (64 | 3.2%), and Management (61 | 3.0%).
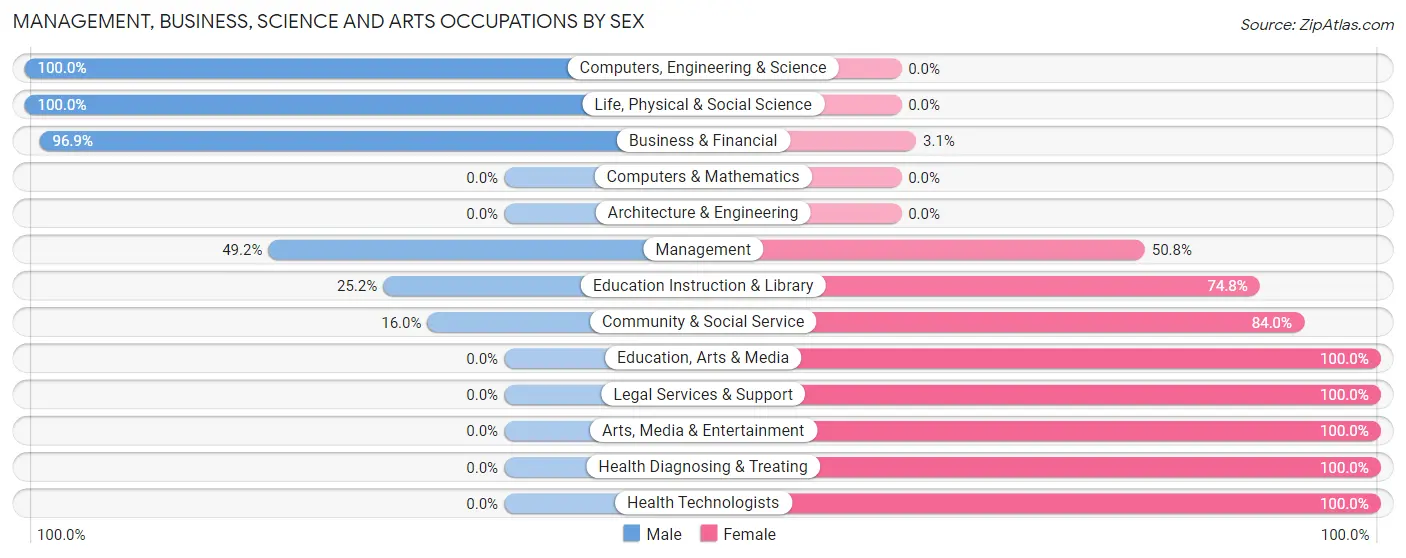
Management, Business, Science and Arts Occupations by Sex
Within the Management, Business, Science and Arts occupations in Dardanelle, the most male-oriented occupations are Computers, Engineering & Science (100.0%), Life, Physical & Social Science (100.0%), and Business & Financial (96.9%), while the most female-oriented occupations are Education, Arts & Media (100.0%), Legal Services & Support (100.0%), and Arts, Media & Entertainment (100.0%).
| Occupation | Male | Female |
| Management | 30 (49.2%) | 31 (50.8%) |
| Business & Financial | 62 (96.9%) | 2 (3.1%) |
| Computers, Engineering & Science | 7 (100.0%) | 0 (0.0%) |
| Computers & Mathematics | 0 (0.0%) | 0 (0.0%) |
| Architecture & Engineering | 0 (0.0%) | 0 (0.0%) |
| Life, Physical & Social Science | 7 (100.0%) | 0 (0.0%) |
| Community & Social Service | 28 (16.0%) | 147 (84.0%) |
| Education, Arts & Media | 0 (0.0%) | 34 (100.0%) |
| Legal Services & Support | 0 (0.0%) | 21 (100.0%) |
| Education Instruction & Library | 28 (25.2%) | 83 (74.8%) |
| Arts, Media & Entertainment | 0 (0.0%) | 9 (100.0%) |
| Health Diagnosing & Treating | 0 (0.0%) | 67 (100.0%) |
| Health Technologists | 0 (0.0%) | 36 (100.0%) |
| Total (Category) | 127 (34.0%) | 247 (66.0%) |
| Total (Overall) | 1,016 (50.3%) | 1,003 (49.7%) |
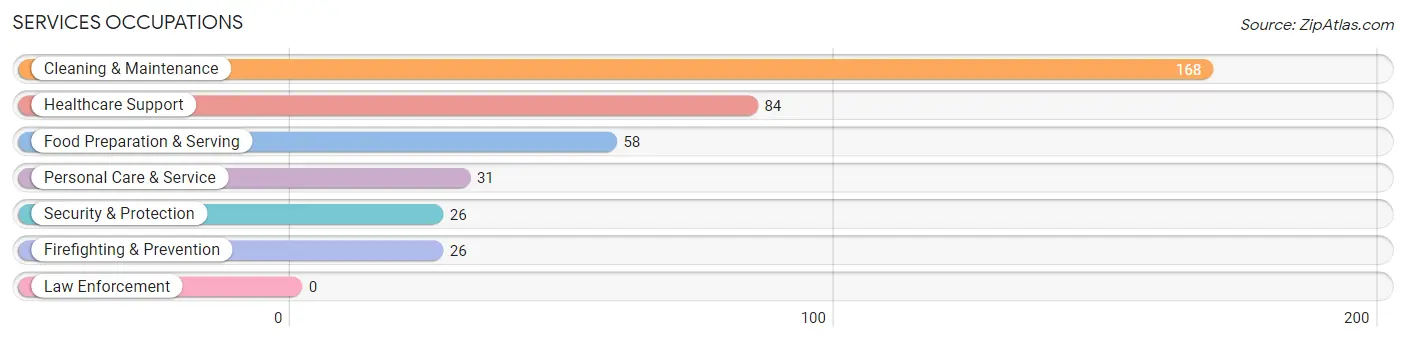
Services Occupations
The most common Services occupations in Dardanelle are Cleaning & Maintenance (168 | 8.3%), Healthcare Support (84 | 4.2%), Food Preparation & Serving (58 | 2.9%), Personal Care & Service (31 | 1.5%), and Security & Protection (26 | 1.3%).
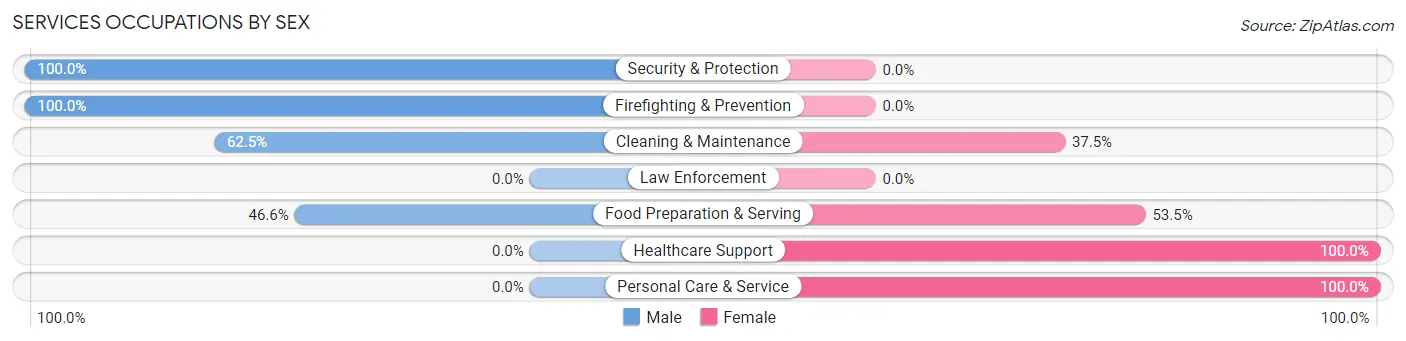
Services Occupations by Sex
Within the Services occupations in Dardanelle, the most male-oriented occupations are Security & Protection (100.0%), Firefighting & Prevention (100.0%), and Cleaning & Maintenance (62.5%), while the most female-oriented occupations are Healthcare Support (100.0%), Personal Care & Service (100.0%), and Food Preparation & Serving (53.4%).
| Occupation | Male | Female |
| Healthcare Support | 0 (0.0%) | 84 (100.0%) |
| Security & Protection | 26 (100.0%) | 0 (0.0%) |
| Firefighting & Prevention | 26 (100.0%) | 0 (0.0%) |
| Law Enforcement | 0 (0.0%) | 0 (0.0%) |
| Food Preparation & Serving | 27 (46.6%) | 31 (53.4%) |
| Cleaning & Maintenance | 105 (62.5%) | 63 (37.5%) |
| Personal Care & Service | 0 (0.0%) | 31 (100.0%) |
| Total (Category) | 158 (43.0%) | 209 (57.0%) |
| Total (Overall) | 1,016 (50.3%) | 1,003 (49.7%) |
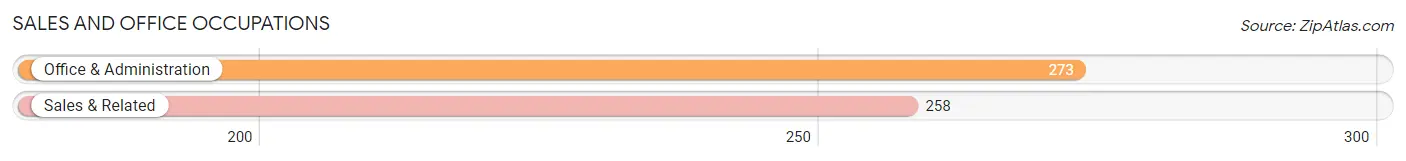
Sales and Office Occupations
The most common Sales and Office occupations in Dardanelle are Office & Administration (273 | 13.5%), and Sales & Related (258 | 12.8%).
Sales and Office Occupations by Sex
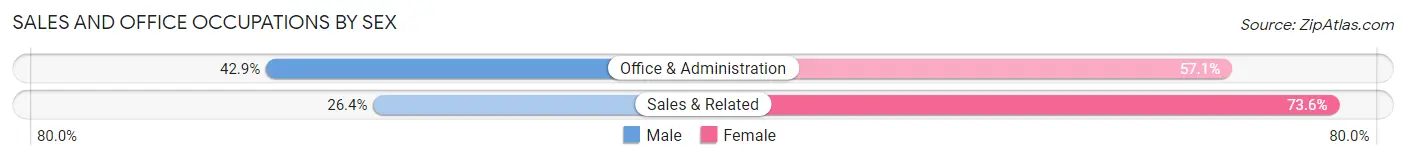
| Occupation | Male | Female |
| Sales & Related | 68 (26.4%) | 190 (73.6%) |
| Office & Administration | 117 (42.9%) | 156 (57.1%) |
| Total (Category) | 185 (34.8%) | 346 (65.2%) |
| Total (Overall) | 1,016 (50.3%) | 1,003 (49.7%) |
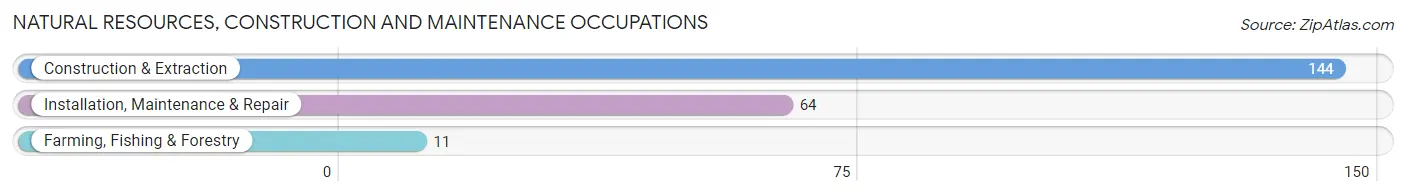
Natural Resources, Construction and Maintenance Occupations
The most common Natural Resources, Construction and Maintenance occupations in Dardanelle are Construction & Extraction (144 | 7.1%), Installation, Maintenance & Repair (64 | 3.2%), and Farming, Fishing & Forestry (11 | 0.5%).
Natural Resources, Construction and Maintenance Occupations by Sex
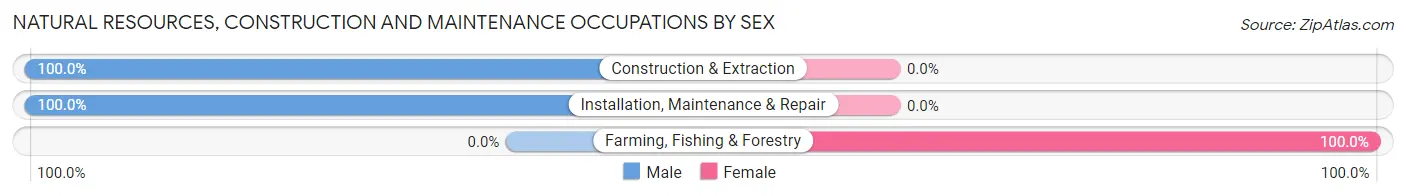
| Occupation | Male | Female |
| Farming, Fishing & Forestry | 0 (0.0%) | 11 (100.0%) |
| Construction & Extraction | 144 (100.0%) | 0 (0.0%) |
| Installation, Maintenance & Repair | 64 (100.0%) | 0 (0.0%) |
| Total (Category) | 208 (95.0%) | 11 (5.0%) |
| Total (Overall) | 1,016 (50.3%) | 1,003 (49.7%) |
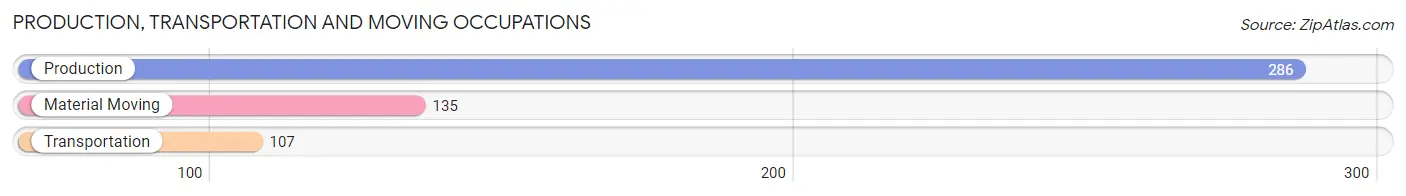
Production, Transportation and Moving Occupations
The most common Production, Transportation and Moving occupations in Dardanelle are Production (286 | 14.2%), Material Moving (135 | 6.7%), and Transportation (107 | 5.3%).
Production, Transportation and Moving Occupations by Sex
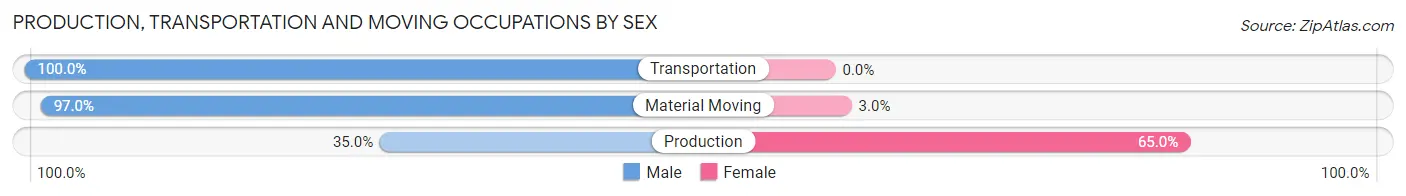
| Occupation | Male | Female |
| Production | 100 (35.0%) | 186 (65.0%) |
| Transportation | 107 (100.0%) | 0 (0.0%) |
| Material Moving | 131 (97.0%) | 4 (3.0%) |
| Total (Category) | 338 (64.0%) | 190 (36.0%) |
| Total (Overall) | 1,016 (50.3%) | 1,003 (49.7%) |
Employment Industries by Sex in Dardanelle
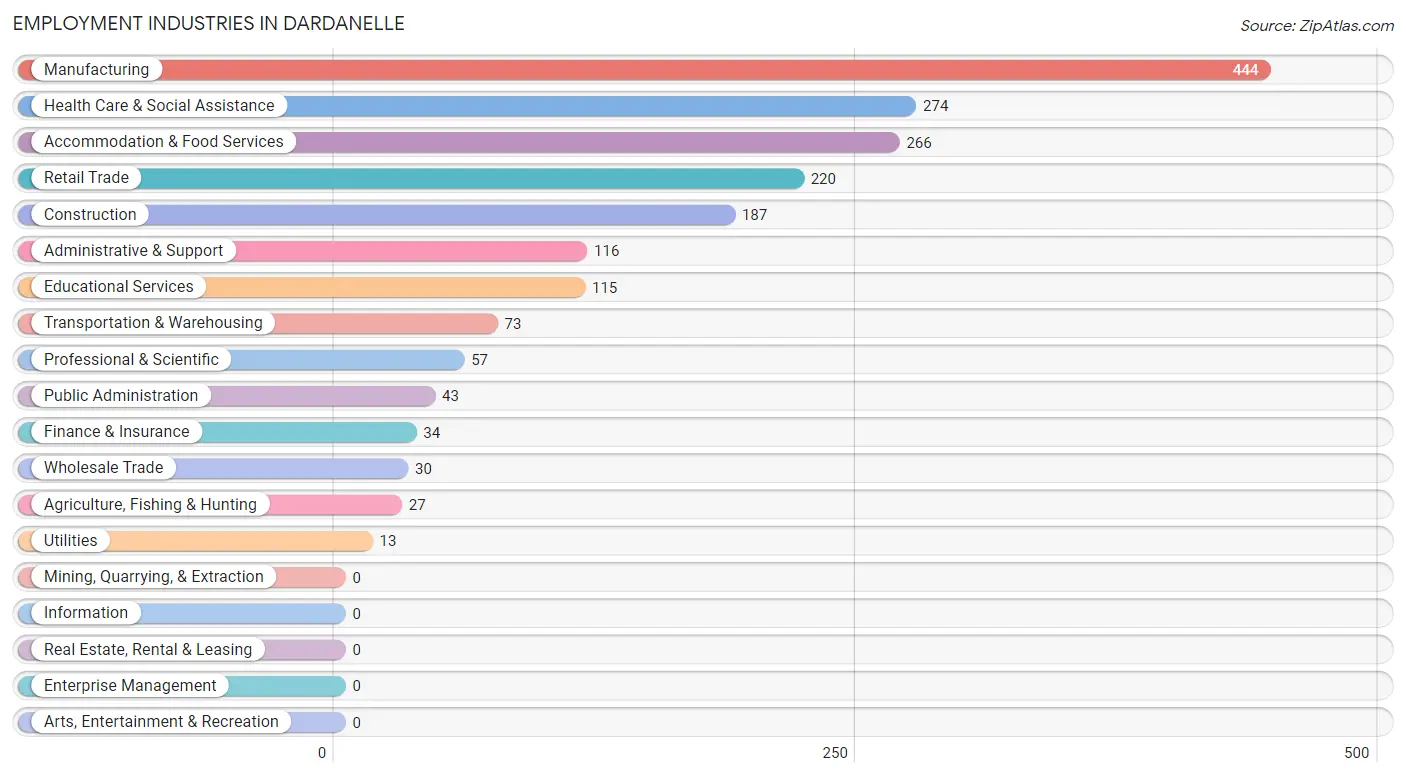
Employment Industries in Dardanelle
The major employment industries in Dardanelle include Manufacturing (444 | 22.0%), Health Care & Social Assistance (274 | 13.6%), Accommodation & Food Services (266 | 13.2%), Retail Trade (220 | 10.9%), and Construction (187 | 9.3%).
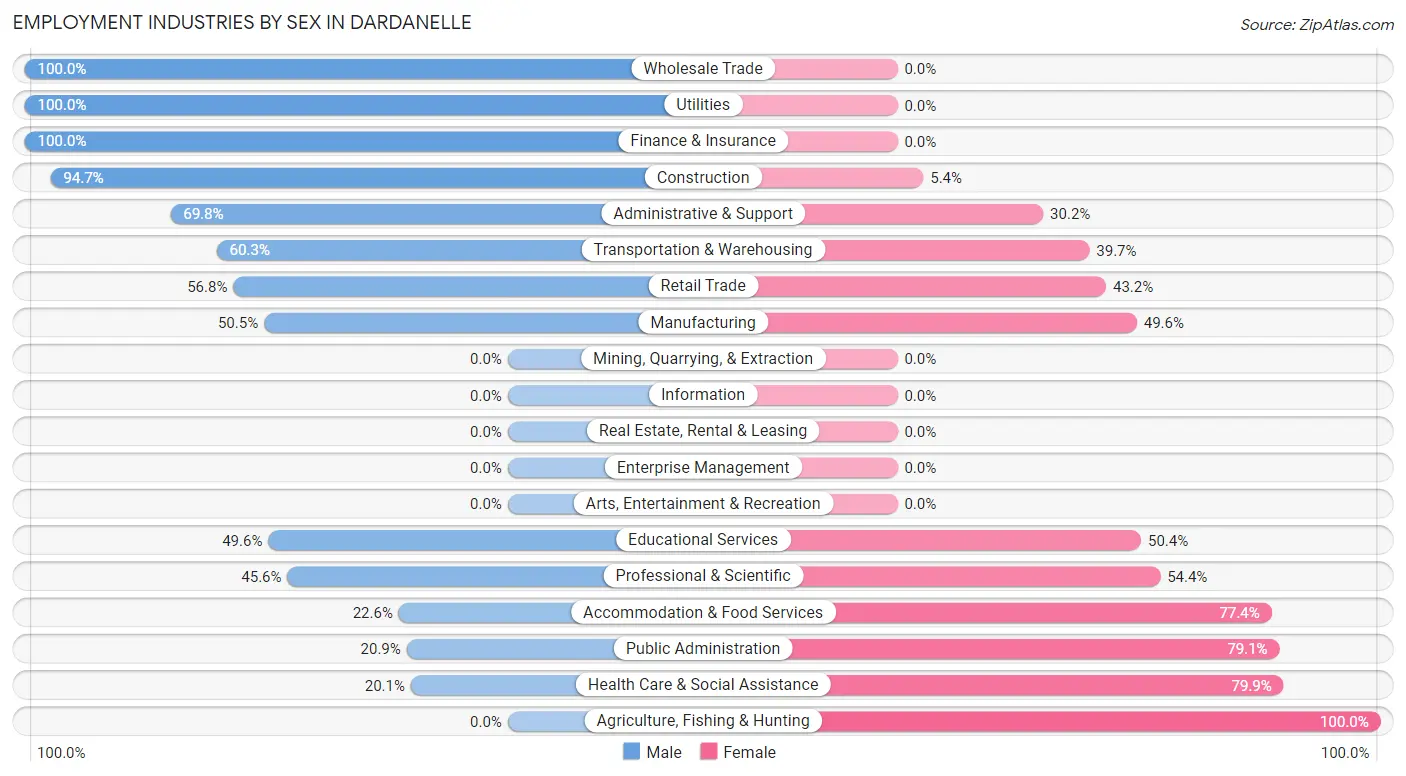
Employment Industries by Sex in Dardanelle
The Dardanelle industries that see more men than women are Wholesale Trade (100.0%), Utilities (100.0%), and Finance & Insurance (100.0%), whereas the industries that tend to have a higher number of women are Agriculture, Fishing & Hunting (100.0%), Health Care & Social Assistance (79.9%), and Public Administration (79.1%).
| Industry | Male | Female |
| Agriculture, Fishing & Hunting | 0 (0.0%) | 27 (100.0%) |
| Mining, Quarrying, & Extraction | 0 (0.0%) | 0 (0.0%) |
| Construction | 177 (94.7%) | 10 (5.3%) |
| Manufacturing | 224 (50.4%) | 220 (49.5%) |
| Wholesale Trade | 30 (100.0%) | 0 (0.0%) |
| Retail Trade | 125 (56.8%) | 95 (43.2%) |
| Transportation & Warehousing | 44 (60.3%) | 29 (39.7%) |
| Utilities | 13 (100.0%) | 0 (0.0%) |
| Information | 0 (0.0%) | 0 (0.0%) |
| Finance & Insurance | 34 (100.0%) | 0 (0.0%) |
| Real Estate, Rental & Leasing | 0 (0.0%) | 0 (0.0%) |
| Professional & Scientific | 26 (45.6%) | 31 (54.4%) |
| Enterprise Management | 0 (0.0%) | 0 (0.0%) |
| Administrative & Support | 81 (69.8%) | 35 (30.2%) |
| Educational Services | 57 (49.6%) | 58 (50.4%) |
| Health Care & Social Assistance | 55 (20.1%) | 219 (79.9%) |
| Arts, Entertainment & Recreation | 0 (0.0%) | 0 (0.0%) |
| Accommodation & Food Services | 60 (22.6%) | 206 (77.4%) |
| Public Administration | 9 (20.9%) | 34 (79.1%) |
| Total | 1,016 (50.3%) | 1,003 (49.7%) |
Education in Dardanelle
School Enrollment in Dardanelle
The most common levels of schooling among the 863 students in Dardanelle are high school (216 | 25.0%), middle school (188 | 21.8%), and college / undergraduate (170 | 19.7%).
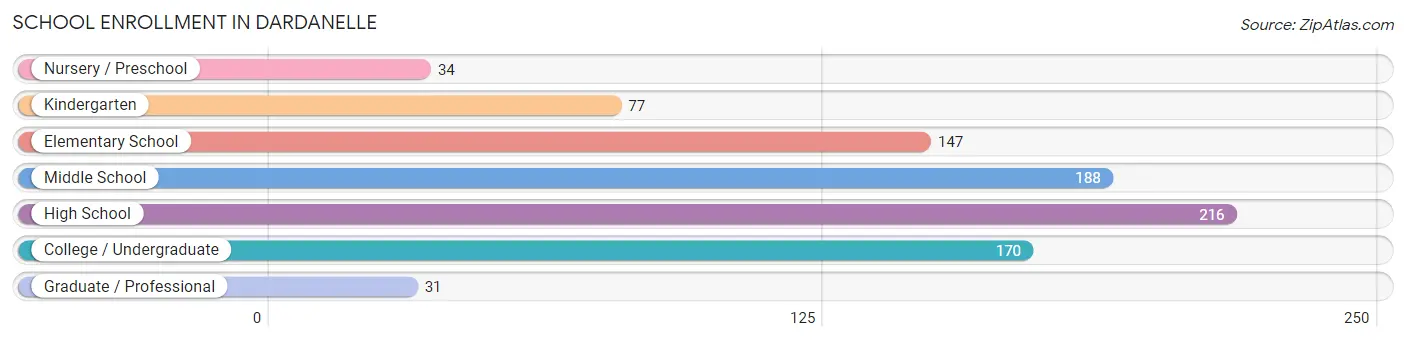
| School Level | # Students | % Students |
| Nursery / Preschool | 34 | 3.9% |
| Kindergarten | 77 | 8.9% |
| Elementary School | 147 | 17.0% |
| Middle School | 188 | 21.8% |
| High School | 216 | 25.0% |
| College / Undergraduate | 170 | 19.7% |
| Graduate / Professional | 31 | 3.6% |
| Total | 863 | 100.0% |
School Enrollment by Age by Funding Source in Dardanelle
Out of a total of 863 students who are enrolled in schools in Dardanelle, 15 (1.7%) attend a private institution, while the remaining 848 (98.3%) are enrolled in public schools. The age group of 5 to 9 year old has the highest likelihood of being enrolled in private schools, with 15 (6.9% in the age bracket) enrolled. Conversely, the age group of 3 to 4 year olds has the lowest likelihood of being enrolled in a private school, with 10 (100.0% in the age bracket) attending a public institution.
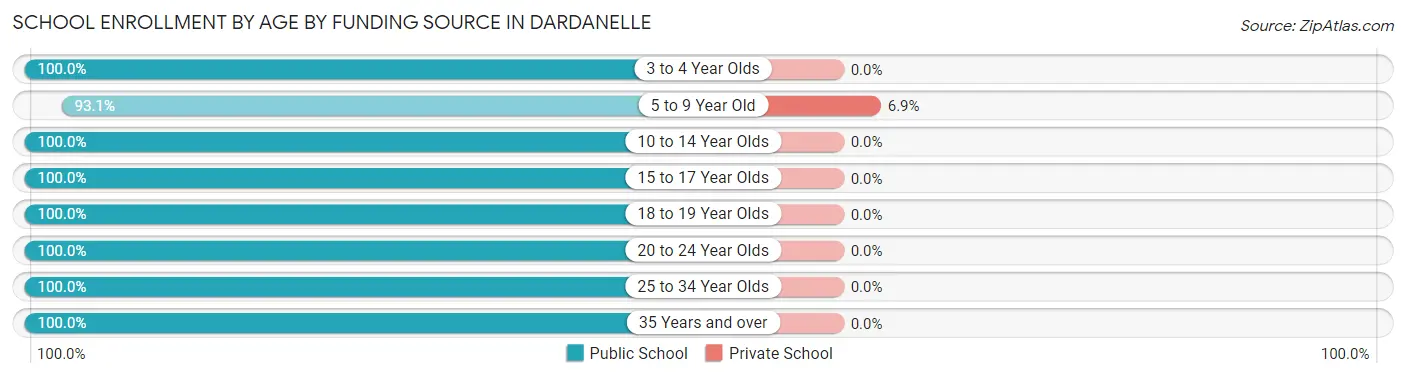
| Age Bracket | Public School | Private School |
| 3 to 4 Year Olds | 10 (100.0%) | 0 (0.0%) |
| 5 to 9 Year Old | 202 (93.1%) | 15 (6.9%) |
| 10 to 14 Year Olds | 268 (100.0%) | 0 (0.0%) |
| 15 to 17 Year Olds | 147 (100.0%) | 0 (0.0%) |
| 18 to 19 Year Olds | 71 (100.0%) | 0 (0.0%) |
| 20 to 24 Year Olds | 90 (100.0%) | 0 (0.0%) |
| 25 to 34 Year Olds | 42 (100.0%) | 0 (0.0%) |
| 35 Years and over | 18 (100.0%) | 0 (0.0%) |
| Total | 848 (98.3%) | 15 (1.7%) |
Educational Attainment by Field of Study in Dardanelle
Bio, nature & agricultural (84 | 22.0%), education (82 | 21.5%), business (68 | 17.8%), social sciences (31 | 8.1%), and psychology (29 | 7.6%) are the most common fields of study among 382 individuals in Dardanelle who have obtained a bachelor's degree or higher.
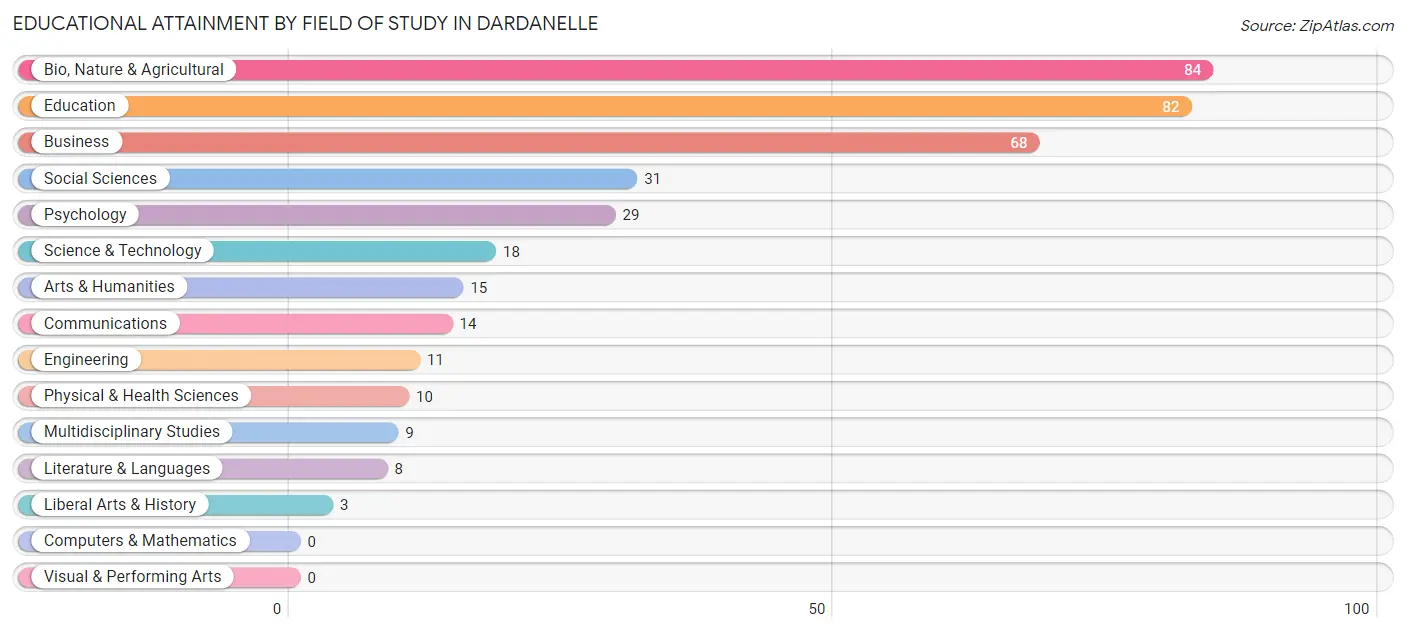
| Field of Study | # Graduates | % Graduates |
| Computers & Mathematics | 0 | 0.0% |
| Bio, Nature & Agricultural | 84 | 22.0% |
| Physical & Health Sciences | 10 | 2.6% |
| Psychology | 29 | 7.6% |
| Social Sciences | 31 | 8.1% |
| Engineering | 11 | 2.9% |
| Multidisciplinary Studies | 9 | 2.4% |
| Science & Technology | 18 | 4.7% |
| Business | 68 | 17.8% |
| Education | 82 | 21.5% |
| Literature & Languages | 8 | 2.1% |
| Liberal Arts & History | 3 | 0.8% |
| Visual & Performing Arts | 0 | 0.0% |
| Communications | 14 | 3.7% |
| Arts & Humanities | 15 | 3.9% |
| Total | 382 | 100.0% |
Transportation & Commute in Dardanelle
Vehicle Availability by Sex in Dardanelle
The most prevalent vehicle ownership categories in Dardanelle are males with 2 vehicles (460, accounting for 45.3%) and females with 2 vehicles (472, making up 45.9%).
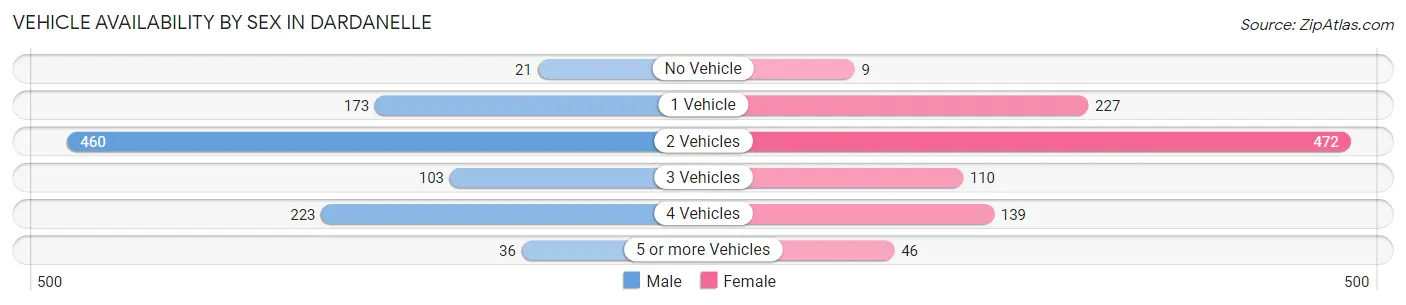
| Vehicles Available | Male | Female |
| No Vehicle | 21 (2.1%) | 9 (0.9%) |
| 1 Vehicle | 173 (17.0%) | 227 (22.6%) |
| 2 Vehicles | 460 (45.3%) | 472 (47.1%) |
| 3 Vehicles | 103 (10.1%) | 110 (11.0%) |
| 4 Vehicles | 223 (22.0%) | 139 (13.9%) |
| 5 or more Vehicles | 36 (3.5%) | 46 (4.6%) |
| Total | 1,016 (100.0%) | 1,003 (100.0%) |
Commute Time in Dardanelle
The most frequently occuring commute durations in Dardanelle are 10 to 14 minutes (426 commuters, 21.6%), 15 to 19 minutes (404 commuters, 20.4%), and less than 5 minutes (274 commuters, 13.9%).
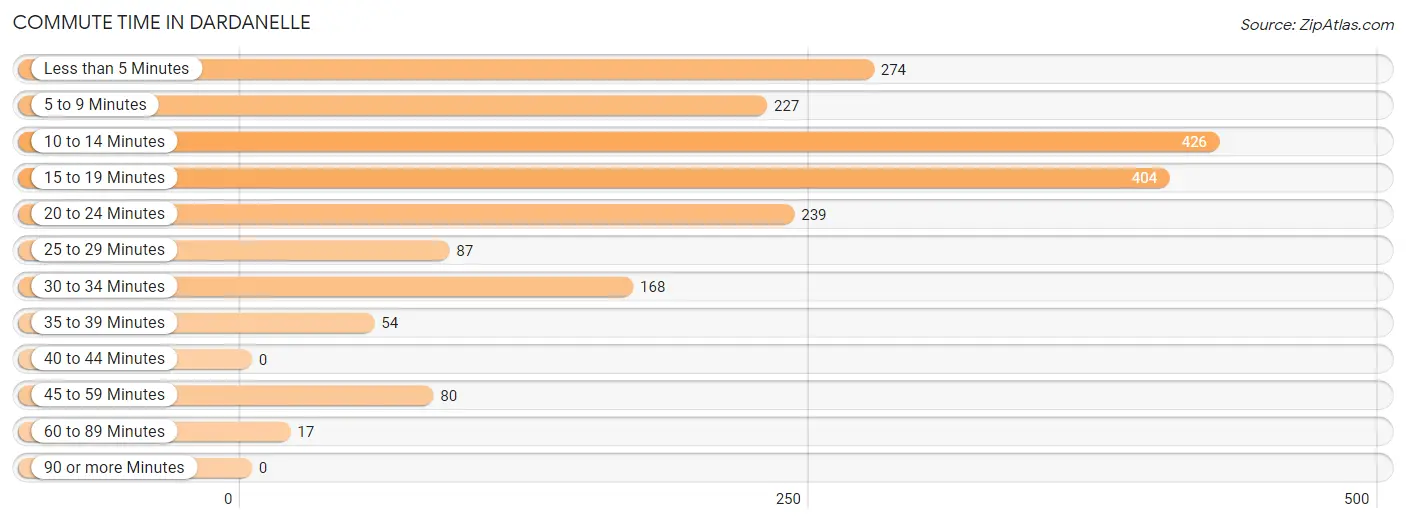
| Commute Time | # Commuters | % Commuters |
| Less than 5 Minutes | 274 | 13.9% |
| 5 to 9 Minutes | 227 | 11.5% |
| 10 to 14 Minutes | 426 | 21.6% |
| 15 to 19 Minutes | 404 | 20.4% |
| 20 to 24 Minutes | 239 | 12.1% |
| 25 to 29 Minutes | 87 | 4.4% |
| 30 to 34 Minutes | 168 | 8.5% |
| 35 to 39 Minutes | 54 | 2.7% |
| 40 to 44 Minutes | 0 | 0.0% |
| 45 to 59 Minutes | 80 | 4.1% |
| 60 to 89 Minutes | 17 | 0.9% |
| 90 or more Minutes | 0 | 0.0% |
Commute Time by Sex in Dardanelle
The most common commute times in Dardanelle are 15 to 19 minutes (258 commuters, 26.4%) for males and 10 to 14 minutes (267 commuters, 26.7%) for females.
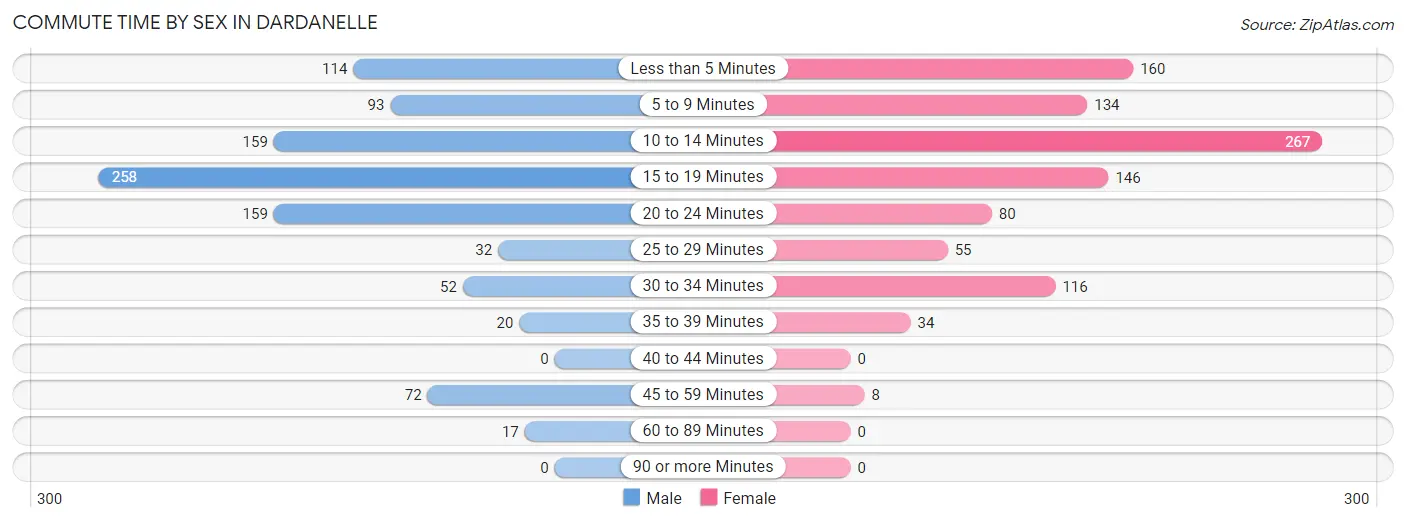
| Commute Time | Male | Female |
| Less than 5 Minutes | 114 (11.7%) | 160 (16.0%) |
| 5 to 9 Minutes | 93 (9.5%) | 134 (13.4%) |
| 10 to 14 Minutes | 159 (16.3%) | 267 (26.7%) |
| 15 to 19 Minutes | 258 (26.4%) | 146 (14.6%) |
| 20 to 24 Minutes | 159 (16.3%) | 80 (8.0%) |
| 25 to 29 Minutes | 32 (3.3%) | 55 (5.5%) |
| 30 to 34 Minutes | 52 (5.3%) | 116 (11.6%) |
| 35 to 39 Minutes | 20 (2.1%) | 34 (3.4%) |
| 40 to 44 Minutes | 0 (0.0%) | 0 (0.0%) |
| 45 to 59 Minutes | 72 (7.4%) | 8 (0.8%) |
| 60 to 89 Minutes | 17 (1.7%) | 0 (0.0%) |
| 90 or more Minutes | 0 (0.0%) | 0 (0.0%) |
Time of Departure to Work by Sex in Dardanelle
The most frequent times of departure to work in Dardanelle are 6:30 AM to 6:59 AM (259, 26.5%) for males and 7:30 AM to 7:59 AM (192, 19.2%) for females.
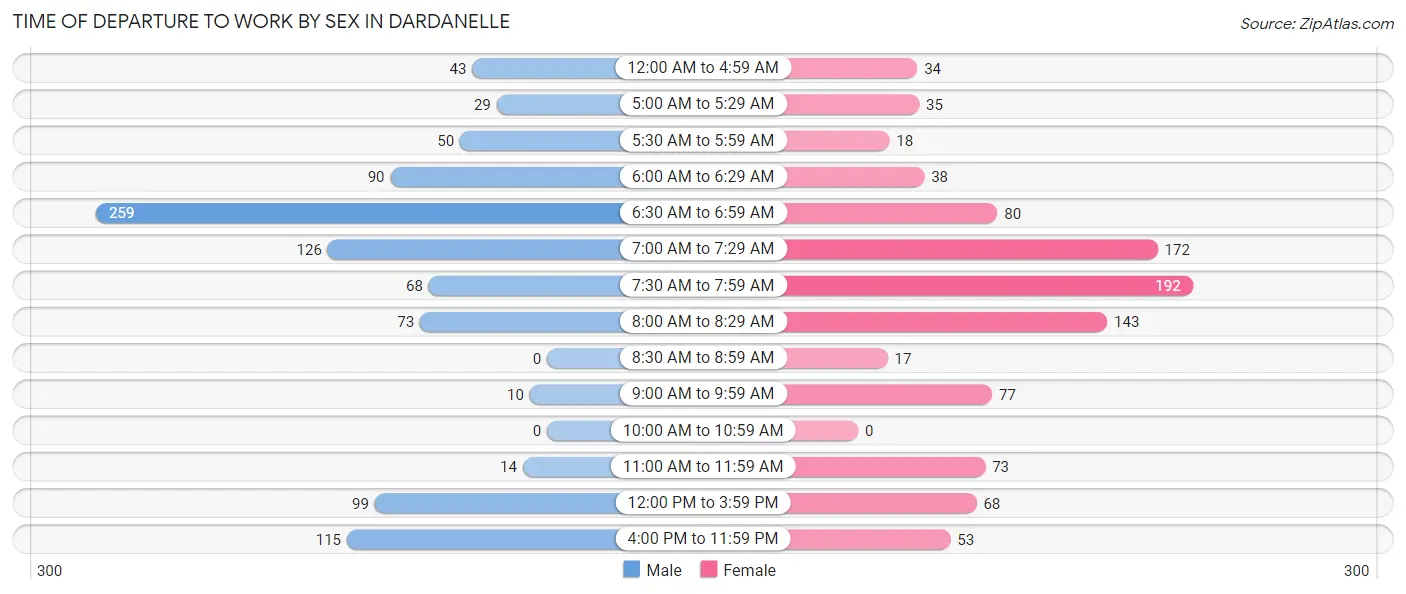
| Time of Departure | Male | Female |
| 12:00 AM to 4:59 AM | 43 (4.4%) | 34 (3.4%) |
| 5:00 AM to 5:29 AM | 29 (3.0%) | 35 (3.5%) |
| 5:30 AM to 5:59 AM | 50 (5.1%) | 18 (1.8%) |
| 6:00 AM to 6:29 AM | 90 (9.2%) | 38 (3.8%) |
| 6:30 AM to 6:59 AM | 259 (26.5%) | 80 (8.0%) |
| 7:00 AM to 7:29 AM | 126 (12.9%) | 172 (17.2%) |
| 7:30 AM to 7:59 AM | 68 (7.0%) | 192 (19.2%) |
| 8:00 AM to 8:29 AM | 73 (7.5%) | 143 (14.3%) |
| 8:30 AM to 8:59 AM | 0 (0.0%) | 17 (1.7%) |
| 9:00 AM to 9:59 AM | 10 (1.0%) | 77 (7.7%) |
| 10:00 AM to 10:59 AM | 0 (0.0%) | 0 (0.0%) |
| 11:00 AM to 11:59 AM | 14 (1.4%) | 73 (7.3%) |
| 12:00 PM to 3:59 PM | 99 (10.1%) | 68 (6.8%) |
| 4:00 PM to 11:59 PM | 115 (11.8%) | 53 (5.3%) |
| Total | 976 (100.0%) | 1,000 (100.0%) |
Housing Occupancy in Dardanelle
Occupancy by Ownership in Dardanelle
Of the total 1,663 dwellings in Dardanelle, owner-occupied units account for 954 (57.4%), while renter-occupied units make up 709 (42.6%).
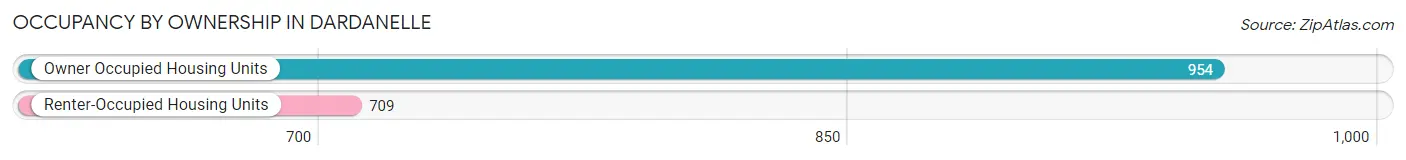
| Occupancy | # Housing Units | % Housing Units |
| Owner Occupied Housing Units | 954 | 57.4% |
| Renter-Occupied Housing Units | 709 | 42.6% |
| Total Occupied Housing Units | 1,663 | 100.0% |
Occupancy by Household Size in Dardanelle
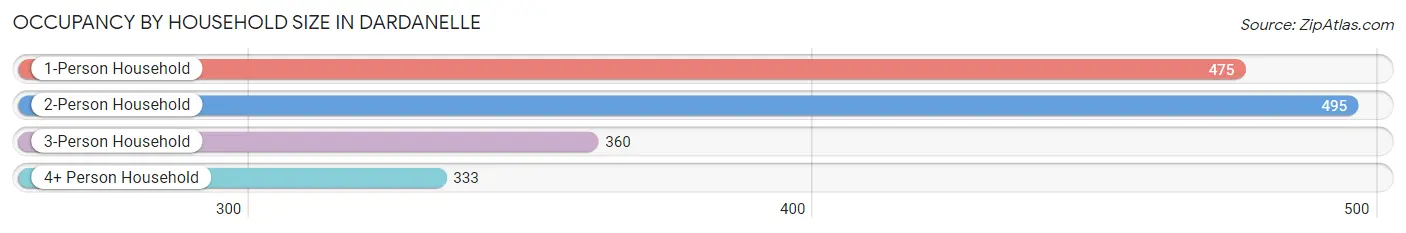
| Household Size | # Housing Units | % Housing Units |
| 1-Person Household | 475 | 28.6% |
| 2-Person Household | 495 | 29.8% |
| 3-Person Household | 360 | 21.6% |
| 4+ Person Household | 333 | 20.0% |
| Total Housing Units | 1,663 | 100.0% |
Occupancy by Ownership by Household Size in Dardanelle
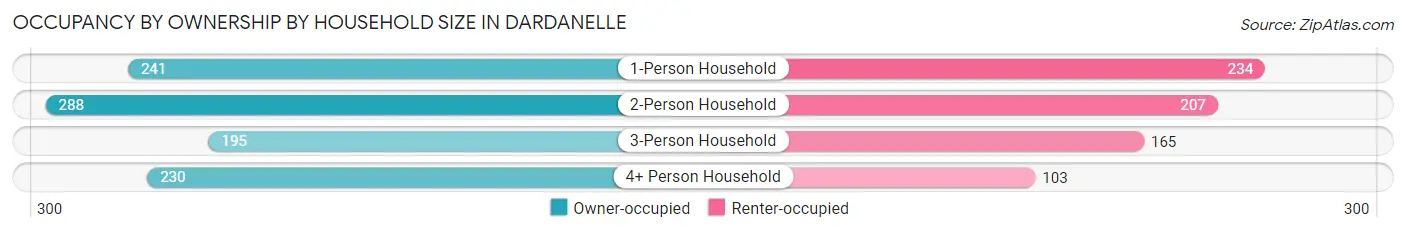
| Household Size | Owner-occupied | Renter-occupied |
| 1-Person Household | 241 (50.7%) | 234 (49.3%) |
| 2-Person Household | 288 (58.2%) | 207 (41.8%) |
| 3-Person Household | 195 (54.2%) | 165 (45.8%) |
| 4+ Person Household | 230 (69.1%) | 103 (30.9%) |
| Total Housing Units | 954 (57.4%) | 709 (42.6%) |
Occupancy by Educational Attainment in Dardanelle
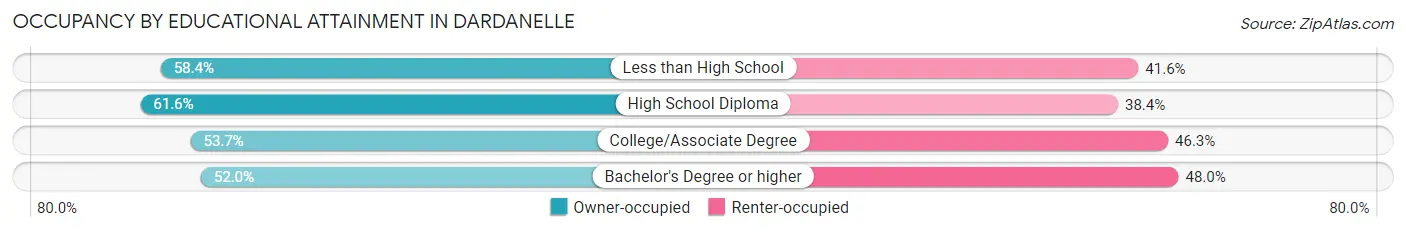
| Household Size | Owner-occupied | Renter-occupied |
| Less than High School | 243 (58.4%) | 173 (41.6%) |
| High School Diploma | 347 (61.6%) | 216 (38.4%) |
| College/Associate Degree | 262 (53.7%) | 226 (46.3%) |
| Bachelor's Degree or higher | 102 (52.0%) | 94 (48.0%) |
Occupancy by Age of Householder in Dardanelle
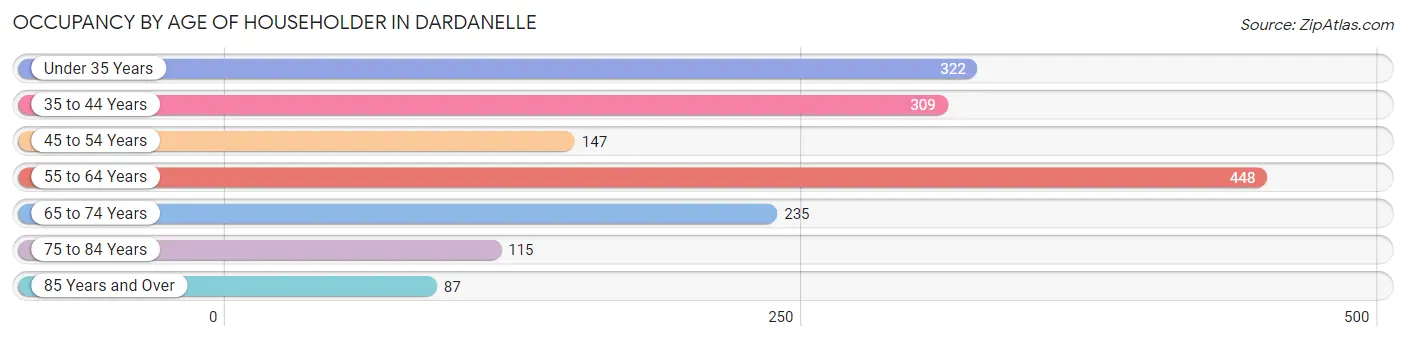
| Age Bracket | # Households | % Households |
| Under 35 Years | 322 | 19.4% |
| 35 to 44 Years | 309 | 18.6% |
| 45 to 54 Years | 147 | 8.8% |
| 55 to 64 Years | 448 | 26.9% |
| 65 to 74 Years | 235 | 14.1% |
| 75 to 84 Years | 115 | 6.9% |
| 85 Years and Over | 87 | 5.2% |
| Total | 1,663 | 100.0% |
Housing Finances in Dardanelle
Median Income by Occupancy in Dardanelle
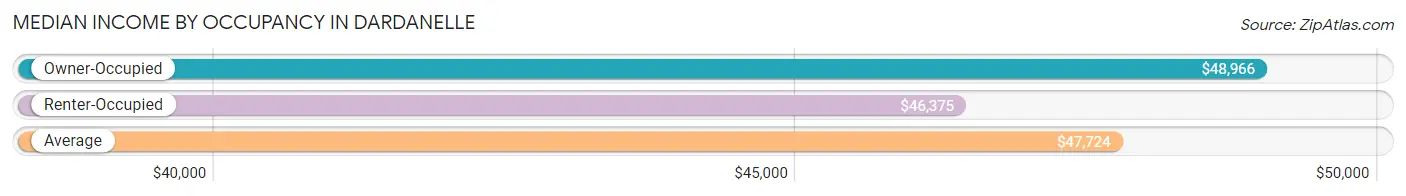
| Occupancy Type | # Households | Median Income |
| Owner-Occupied | 954 (57.4%) | $48,966 |
| Renter-Occupied | 709 (42.6%) | $46,375 |
| Average | 1,663 (100.0%) | $47,724 |
Occupancy by Householder Income Bracket in Dardanelle
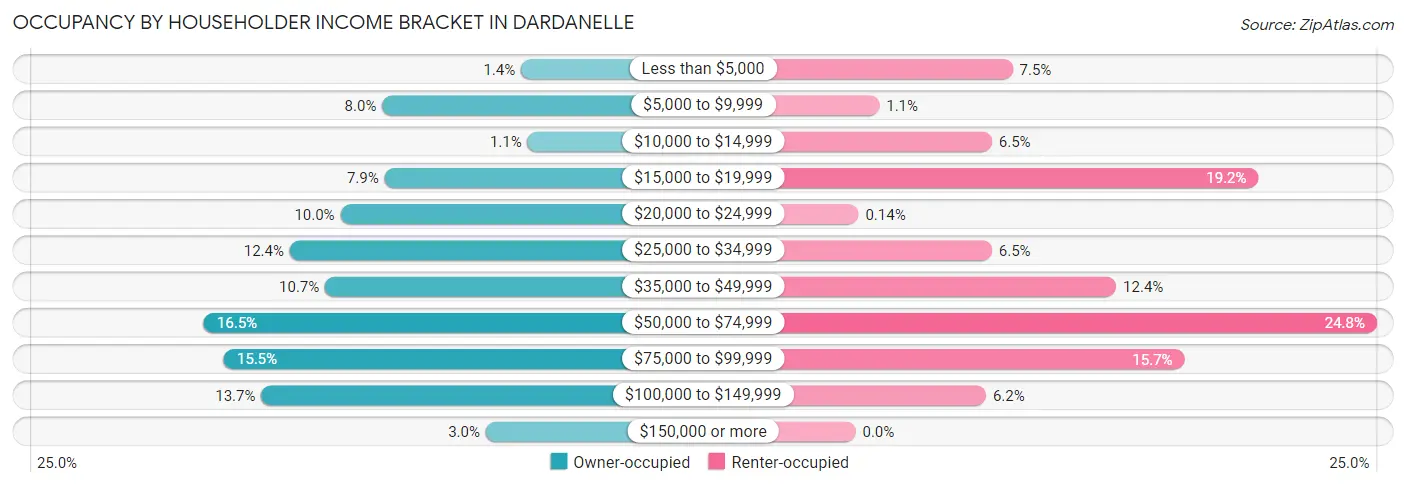
| Income Bracket | Owner-occupied | Renter-occupied |
| Less than $5,000 | 13 (1.4%) | 53 (7.5%) |
| $5,000 to $9,999 | 76 (8.0%) | 8 (1.1%) |
| $10,000 to $14,999 | 10 (1.1%) | 46 (6.5%) |
| $15,000 to $19,999 | 75 (7.9%) | 136 (19.2%) |
| $20,000 to $24,999 | 95 (10.0%) | 1 (0.1%) |
| $25,000 to $34,999 | 118 (12.4%) | 46 (6.5%) |
| $35,000 to $49,999 | 102 (10.7%) | 88 (12.4%) |
| $50,000 to $74,999 | 157 (16.5%) | 176 (24.8%) |
| $75,000 to $99,999 | 148 (15.5%) | 111 (15.7%) |
| $100,000 to $149,999 | 131 (13.7%) | 44 (6.2%) |
| $150,000 or more | 29 (3.0%) | 0 (0.0%) |
| Total | 954 (100.0%) | 709 (100.0%) |
Monthly Housing Cost Tiers in Dardanelle
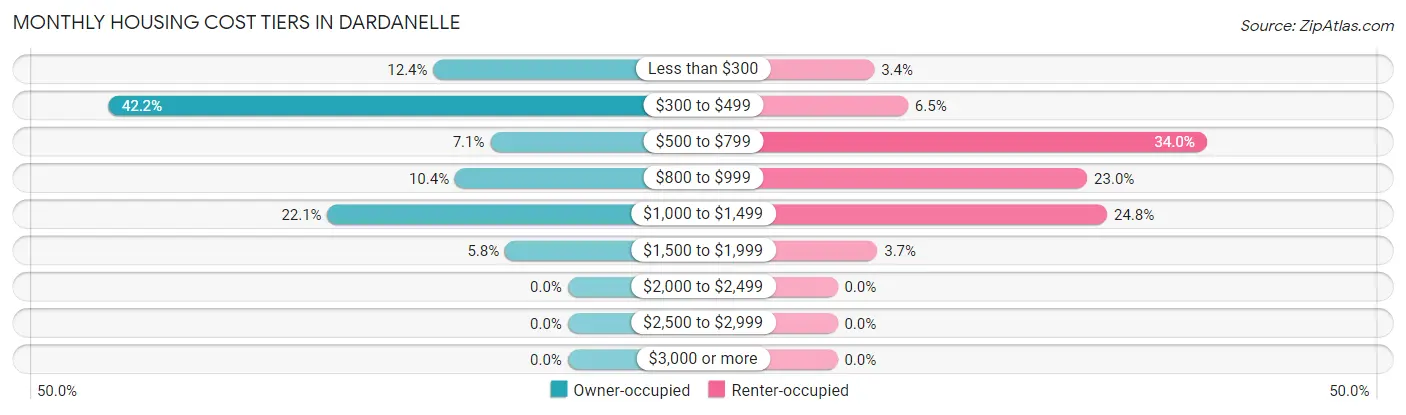
| Monthly Cost | Owner-occupied | Renter-occupied |
| Less than $300 | 118 (12.4%) | 24 (3.4%) |
| $300 to $499 | 403 (42.2%) | 46 (6.5%) |
| $500 to $799 | 68 (7.1%) | 241 (34.0%) |
| $800 to $999 | 99 (10.4%) | 163 (23.0%) |
| $1,000 to $1,499 | 211 (22.1%) | 176 (24.8%) |
| $1,500 to $1,999 | 55 (5.8%) | 26 (3.7%) |
| $2,000 to $2,499 | 0 (0.0%) | 0 (0.0%) |
| $2,500 to $2,999 | 0 (0.0%) | 0 (0.0%) |
| $3,000 or more | 0 (0.0%) | 0 (0.0%) |
| Total | 954 (100.0%) | 709 (100.0%) |
Physical Housing Characteristics in Dardanelle
Housing Structures in Dardanelle
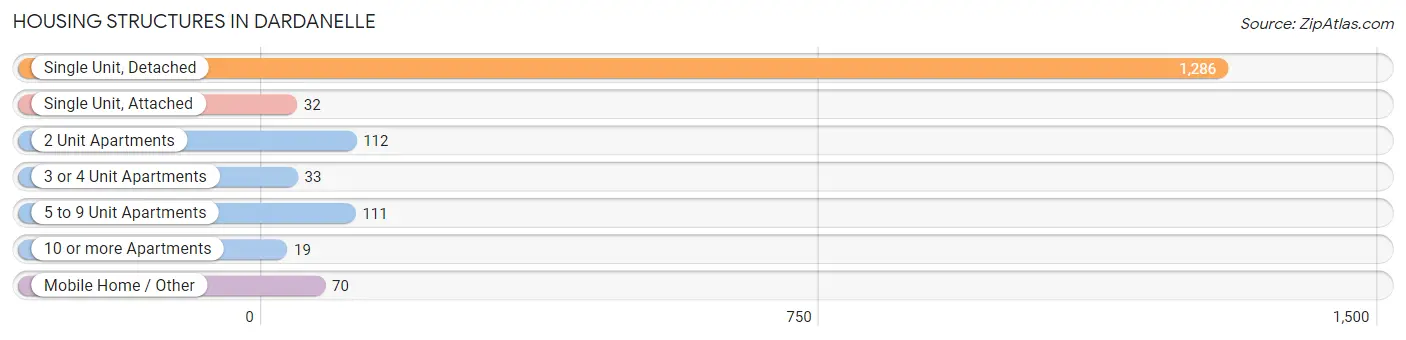
| Structure Type | # Housing Units | % Housing Units |
| Single Unit, Detached | 1,286 | 77.3% |
| Single Unit, Attached | 32 | 1.9% |
| 2 Unit Apartments | 112 | 6.7% |
| 3 or 4 Unit Apartments | 33 | 2.0% |
| 5 to 9 Unit Apartments | 111 | 6.7% |
| 10 or more Apartments | 19 | 1.1% |
| Mobile Home / Other | 70 | 4.2% |
| Total | 1,663 | 100.0% |
Housing Structures by Occupancy in Dardanelle
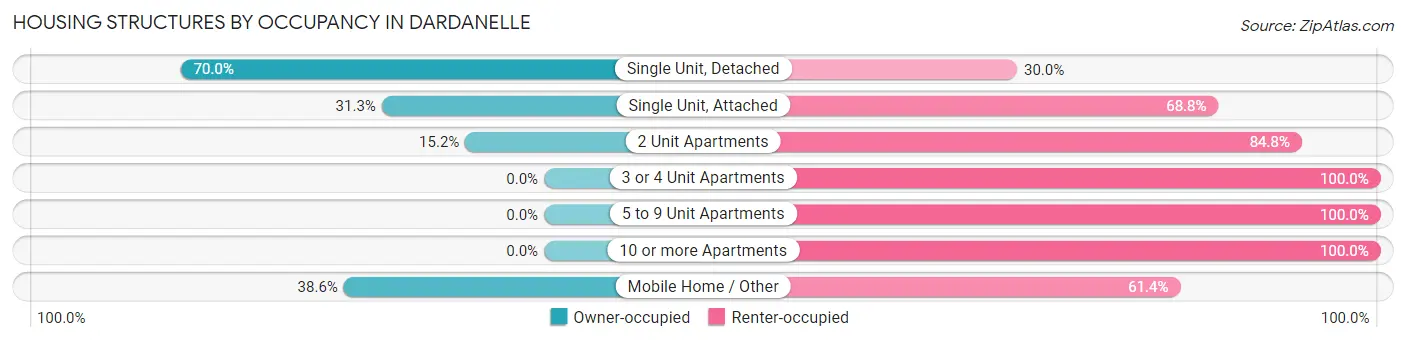
| Structure Type | Owner-occupied | Renter-occupied |
| Single Unit, Detached | 900 (70.0%) | 386 (30.0%) |
| Single Unit, Attached | 10 (31.2%) | 22 (68.8%) |
| 2 Unit Apartments | 17 (15.2%) | 95 (84.8%) |
| 3 or 4 Unit Apartments | 0 (0.0%) | 33 (100.0%) |
| 5 to 9 Unit Apartments | 0 (0.0%) | 111 (100.0%) |
| 10 or more Apartments | 0 (0.0%) | 19 (100.0%) |
| Mobile Home / Other | 27 (38.6%) | 43 (61.4%) |
| Total | 954 (57.4%) | 709 (42.6%) |
Housing Structures by Number of Rooms in Dardanelle
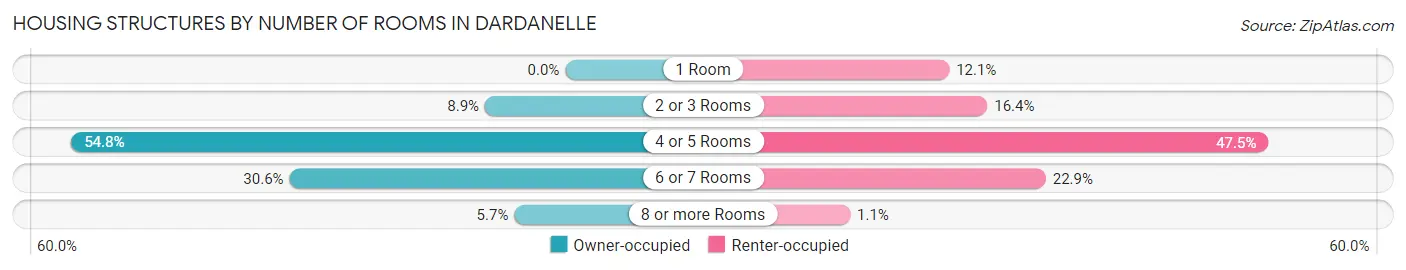
| Number of Rooms | Owner-occupied | Renter-occupied |
| 1 Room | 0 (0.0%) | 86 (12.1%) |
| 2 or 3 Rooms | 85 (8.9%) | 116 (16.4%) |
| 4 or 5 Rooms | 523 (54.8%) | 337 (47.5%) |
| 6 or 7 Rooms | 292 (30.6%) | 162 (22.9%) |
| 8 or more Rooms | 54 (5.7%) | 8 (1.1%) |
| Total | 954 (100.0%) | 709 (100.0%) |
Housing Structure by Heating Type in Dardanelle
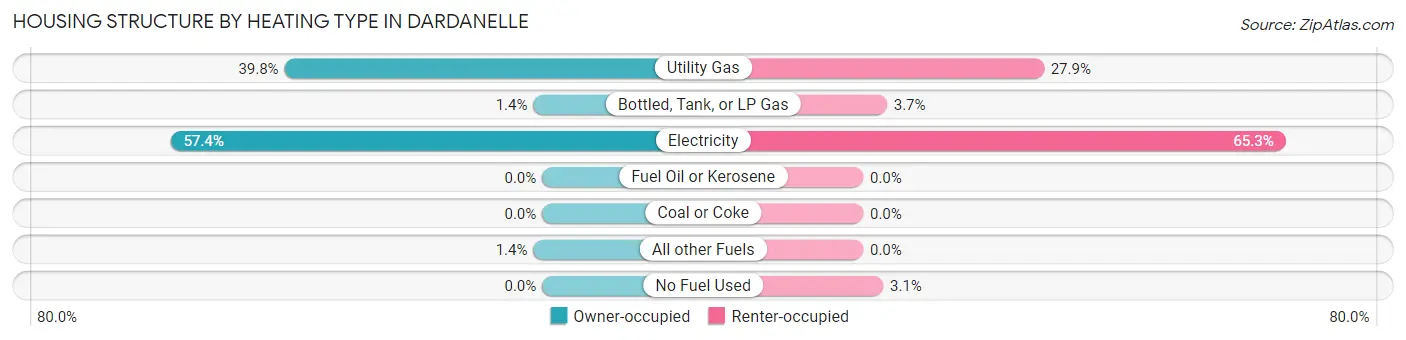
| Heating Type | Owner-occupied | Renter-occupied |
| Utility Gas | 380 (39.8%) | 198 (27.9%) |
| Bottled, Tank, or LP Gas | 13 (1.4%) | 26 (3.7%) |
| Electricity | 548 (57.4%) | 463 (65.3%) |
| Fuel Oil or Kerosene | 0 (0.0%) | 0 (0.0%) |
| Coal or Coke | 0 (0.0%) | 0 (0.0%) |
| All other Fuels | 13 (1.4%) | 0 (0.0%) |
| No Fuel Used | 0 (0.0%) | 22 (3.1%) |
| Total | 954 (100.0%) | 709 (100.0%) |
Household Vehicle Usage in Dardanelle
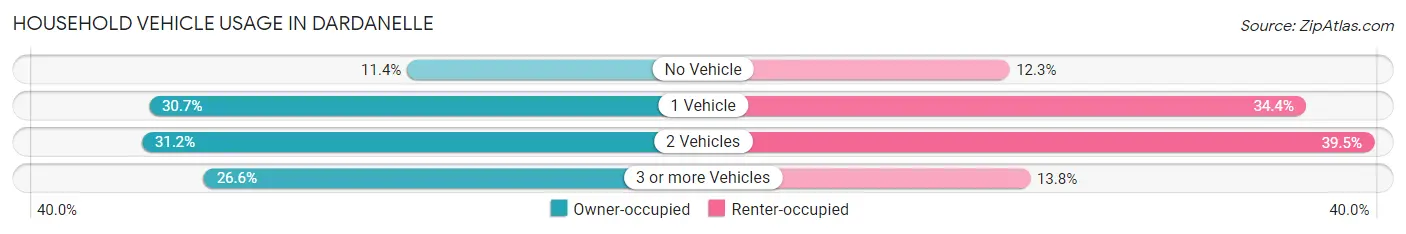
| Vehicles per Household | Owner-occupied | Renter-occupied |
| No Vehicle | 109 (11.4%) | 87 (12.3%) |
| 1 Vehicle | 293 (30.7%) | 244 (34.4%) |
| 2 Vehicles | 298 (31.2%) | 280 (39.5%) |
| 3 or more Vehicles | 254 (26.6%) | 98 (13.8%) |
| Total | 954 (100.0%) | 709 (100.0%) |
Real Estate & Mortgages in Dardanelle
Real Estate and Mortgage Overview in Dardanelle
| Characteristic | Without Mortgage | With Mortgage |
| Housing Units | 500 | 454 |
| Median Property Value | $110,700 | $134,200 |
| Median Household Income | $35,682 | $0 |
| Monthly Housing Costs | $359 | $0 |
| Real Estate Taxes | $569 | $23 |
Property Value by Mortgage Status in Dardanelle
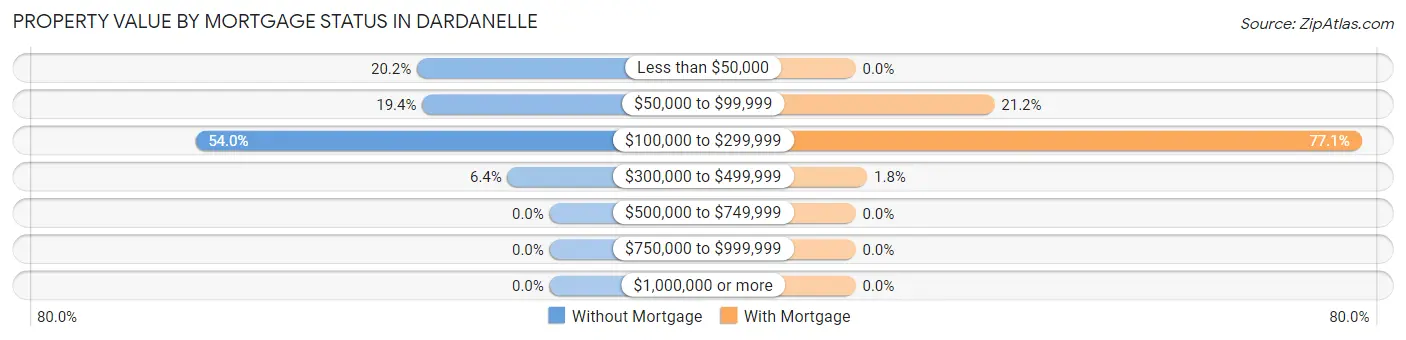
| Property Value | Without Mortgage | With Mortgage |
| Less than $50,000 | 101 (20.2%) | 0 (0.0%) |
| $50,000 to $99,999 | 97 (19.4%) | 96 (21.1%) |
| $100,000 to $299,999 | 270 (54.0%) | 350 (77.1%) |
| $300,000 to $499,999 | 32 (6.4%) | 8 (1.8%) |
| $500,000 to $749,999 | 0 (0.0%) | 0 (0.0%) |
| $750,000 to $999,999 | 0 (0.0%) | 0 (0.0%) |
| $1,000,000 or more | 0 (0.0%) | 0 (0.0%) |
| Total | 500 (100.0%) | 454 (100.0%) |
Household Income by Mortgage Status in Dardanelle
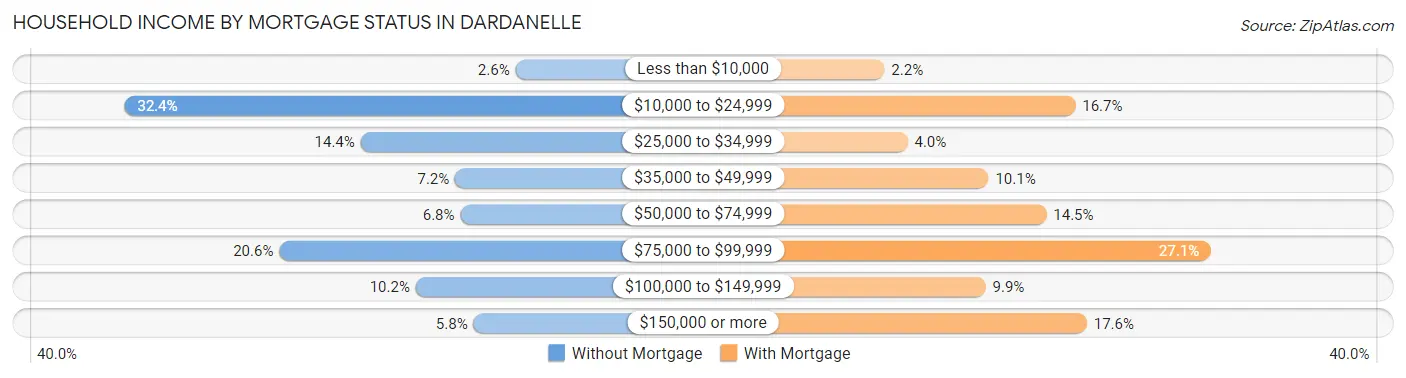
| Household Income | Without Mortgage | With Mortgage |
| Less than $10,000 | 13 (2.6%) | 10 (2.2%) |
| $10,000 to $24,999 | 162 (32.4%) | 76 (16.7%) |
| $25,000 to $34,999 | 72 (14.4%) | 18 (4.0%) |
| $35,000 to $49,999 | 36 (7.2%) | 46 (10.1%) |
| $50,000 to $74,999 | 34 (6.8%) | 66 (14.5%) |
| $75,000 to $99,999 | 103 (20.6%) | 123 (27.1%) |
| $100,000 to $149,999 | 51 (10.2%) | 45 (9.9%) |
| $150,000 or more | 29 (5.8%) | 80 (17.6%) |
| Total | 500 (100.0%) | 454 (100.0%) |
Property Value to Household Income Ratio in Dardanelle
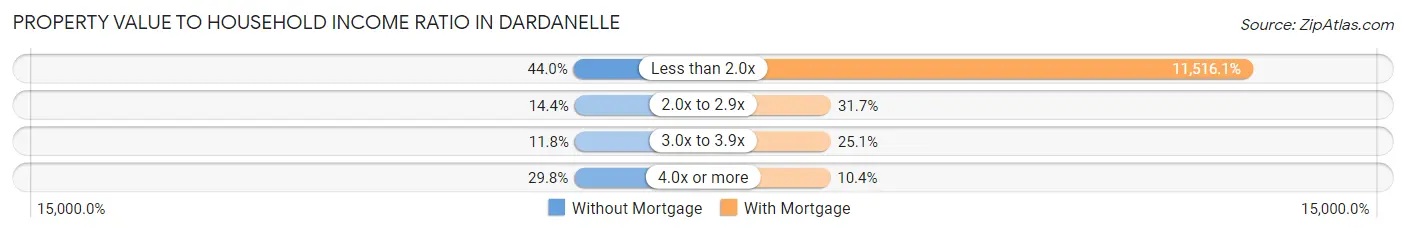
| Value-to-Income Ratio | Without Mortgage | With Mortgage |
| Less than 2.0x | 220 (44.0%) | 52,283 (11,516.1%) |
| 2.0x to 2.9x | 72 (14.4%) | 144 (31.7%) |
| 3.0x to 3.9x | 59 (11.8%) | 114 (25.1%) |
| 4.0x or more | 149 (29.8%) | 47 (10.3%) |
| Total | 500 (100.0%) | 454 (100.0%) |
Real Estate Taxes by Mortgage Status in Dardanelle
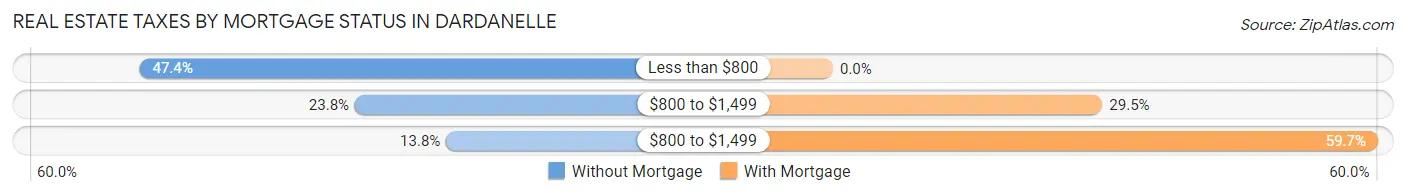
| Property Taxes | Without Mortgage | With Mortgage |
| Less than $800 | 237 (47.4%) | 0 (0.0%) |
| $800 to $1,499 | 119 (23.8%) | 134 (29.5%) |
| $800 to $1,499 | 69 (13.8%) | 271 (59.7%) |
| Total | 500 (100.0%) | 454 (100.0%) |
Health & Disability in Dardanelle
Health Insurance Coverage by Age in Dardanelle
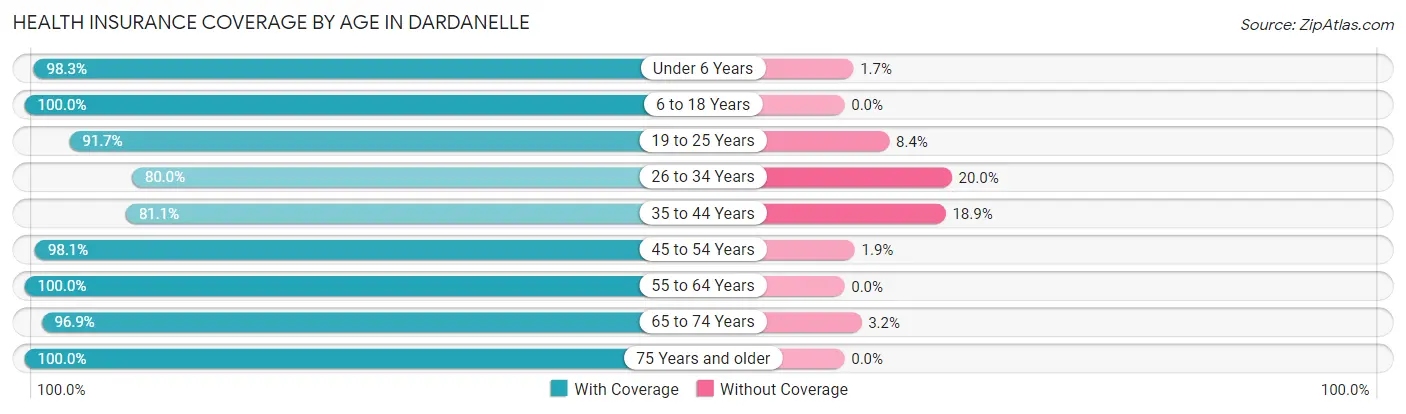
| Age Bracket | With Coverage | Without Coverage |
| Under 6 Years | 471 (98.3%) | 8 (1.7%) |
| 6 to 18 Years | 586 (100.0%) | 0 (0.0%) |
| 19 to 25 Years | 472 (91.6%) | 43 (8.4%) |
| 26 to 34 Years | 392 (80.0%) | 98 (20.0%) |
| 35 to 44 Years | 529 (81.1%) | 123 (18.9%) |
| 45 to 54 Years | 460 (98.1%) | 9 (1.9%) |
| 55 to 64 Years | 616 (100.0%) | 0 (0.0%) |
| 65 to 74 Years | 400 (96.9%) | 13 (3.2%) |
| 75 Years and older | 230 (100.0%) | 0 (0.0%) |
| Total | 4,156 (93.4%) | 294 (6.6%) |
Health Insurance Coverage by Citizenship Status in Dardanelle
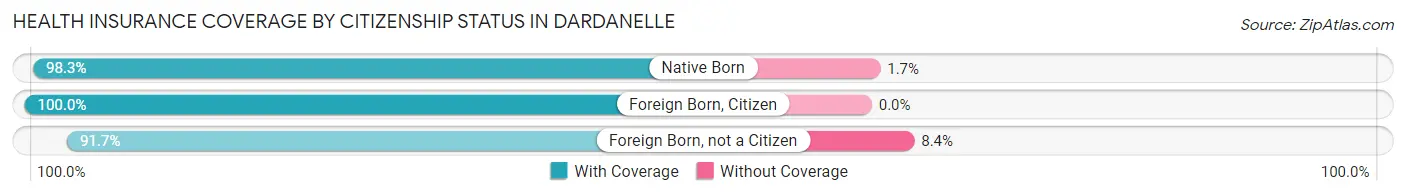
| Citizenship Status | With Coverage | Without Coverage |
| Native Born | 471 (98.3%) | 8 (1.7%) |
| Foreign Born, Citizen | 586 (100.0%) | 0 (0.0%) |
| Foreign Born, not a Citizen | 472 (91.6%) | 43 (8.4%) |
Health Insurance Coverage by Household Income in Dardanelle
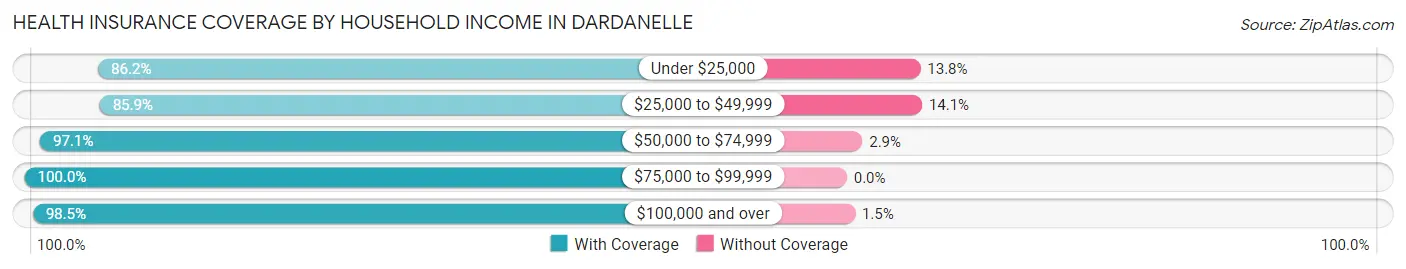
| Household Income | With Coverage | Without Coverage |
| Under $25,000 | 707 (86.2%) | 113 (13.8%) |
| $25,000 to $49,999 | 848 (85.9%) | 139 (14.1%) |
| $50,000 to $74,999 | 905 (97.1%) | 27 (2.9%) |
| $75,000 to $99,999 | 717 (100.0%) | 0 (0.0%) |
| $100,000 and over | 966 (98.5%) | 15 (1.5%) |
Public vs Private Health Insurance Coverage by Age in Dardanelle
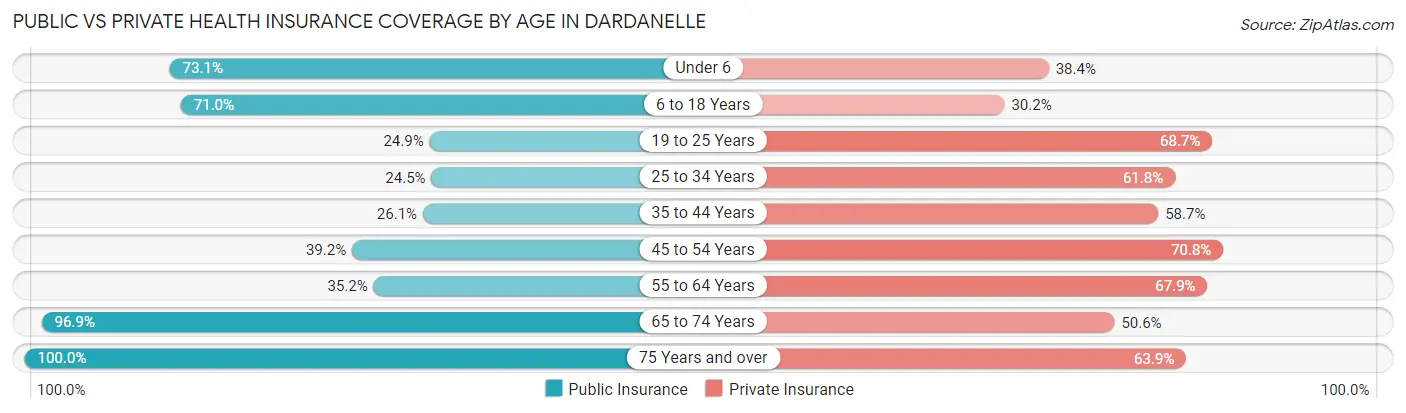
| Age Bracket | Public Insurance | Private Insurance |
| Under 6 | 350 (73.1%) | 184 (38.4%) |
| 6 to 18 Years | 416 (71.0%) | 177 (30.2%) |
| 19 to 25 Years | 128 (24.8%) | 354 (68.7%) |
| 25 to 34 Years | 120 (24.5%) | 303 (61.8%) |
| 35 to 44 Years | 170 (26.1%) | 383 (58.7%) |
| 45 to 54 Years | 184 (39.2%) | 332 (70.8%) |
| 55 to 64 Years | 217 (35.2%) | 418 (67.9%) |
| 65 to 74 Years | 400 (96.9%) | 209 (50.6%) |
| 75 Years and over | 230 (100.0%) | 147 (63.9%) |
| Total | 2,215 (49.8%) | 2,507 (56.3%) |
Disability Status by Sex by Age in Dardanelle
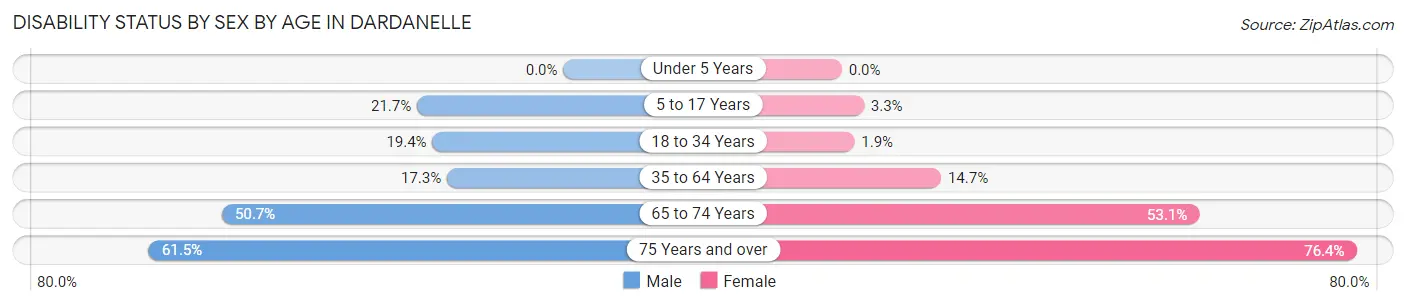
| Age Bracket | Male | Female |
| Under 5 Years | 0 (0.0%) | 0 (0.0%) |
| 5 to 17 Years | 73 (21.7%) | 11 (3.3%) |
| 18 to 34 Years | 117 (19.4%) | 8 (1.9%) |
| 35 to 64 Years | 144 (17.3%) | 133 (14.7%) |
| 65 to 74 Years | 110 (50.7%) | 104 (53.1%) |
| 75 Years and over | 32 (61.5%) | 136 (76.4%) |
Disability Class by Sex by Age in Dardanelle
Disability Class: Hearing Difficulty
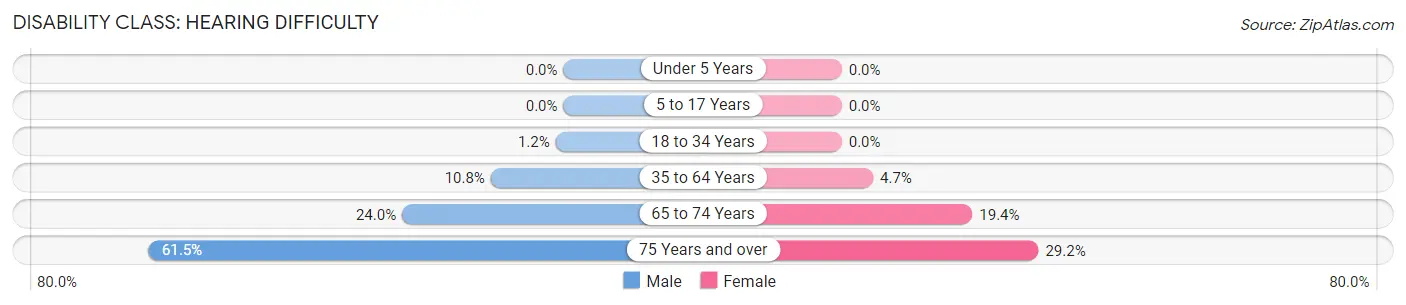
| Age Bracket | Male | Female |
| Under 5 Years | 0 (0.0%) | 0 (0.0%) |
| 5 to 17 Years | 0 (0.0%) | 0 (0.0%) |
| 18 to 34 Years | 7 (1.2%) | 0 (0.0%) |
| 35 to 64 Years | 90 (10.8%) | 42 (4.6%) |
| 65 to 74 Years | 52 (24.0%) | 38 (19.4%) |
| 75 Years and over | 32 (61.5%) | 52 (29.2%) |
Disability Class: Vision Difficulty
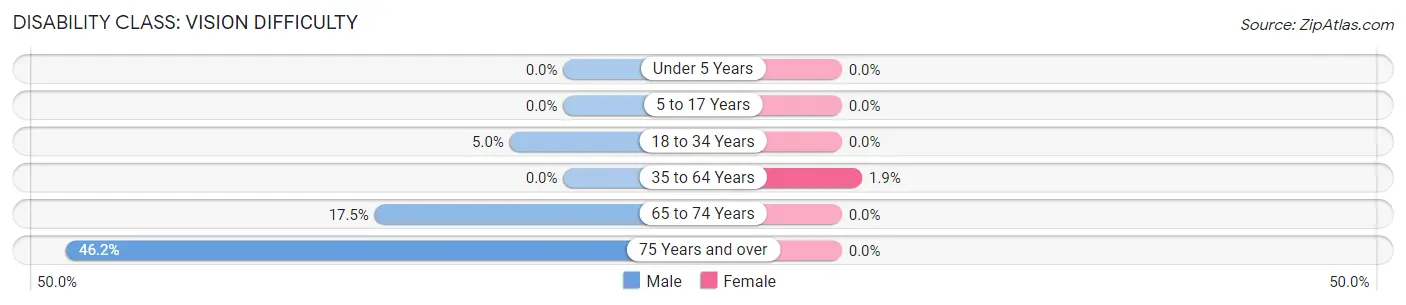
| Age Bracket | Male | Female |
| Under 5 Years | 0 (0.0%) | 0 (0.0%) |
| 5 to 17 Years | 0 (0.0%) | 0 (0.0%) |
| 18 to 34 Years | 30 (5.0%) | 0 (0.0%) |
| 35 to 64 Years | 0 (0.0%) | 17 (1.9%) |
| 65 to 74 Years | 38 (17.5%) | 0 (0.0%) |
| 75 Years and over | 24 (46.2%) | 0 (0.0%) |
Disability Class: Cognitive Difficulty
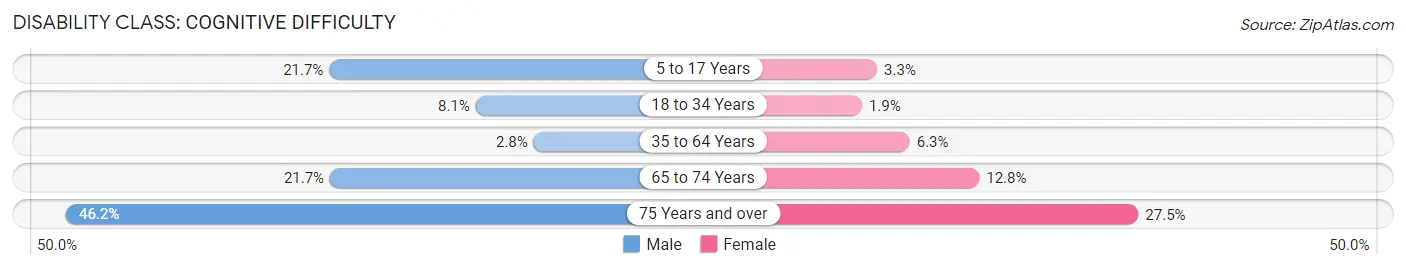
| Age Bracket | Male | Female |
| 5 to 17 Years | 73 (21.7%) | 11 (3.3%) |
| 18 to 34 Years | 49 (8.1%) | 8 (1.9%) |
| 35 to 64 Years | 23 (2.8%) | 57 (6.3%) |
| 65 to 74 Years | 47 (21.7%) | 25 (12.8%) |
| 75 Years and over | 24 (46.2%) | 49 (27.5%) |
Disability Class: Ambulatory Difficulty
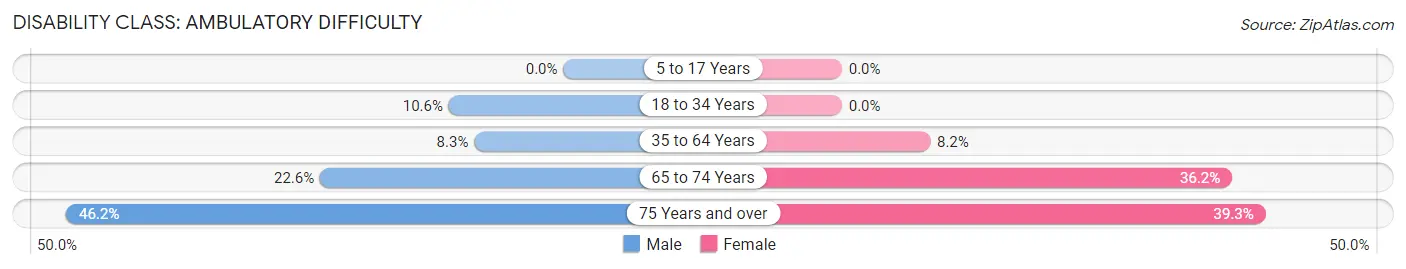
| Age Bracket | Male | Female |
| 5 to 17 Years | 0 (0.0%) | 0 (0.0%) |
| 18 to 34 Years | 64 (10.6%) | 0 (0.0%) |
| 35 to 64 Years | 69 (8.3%) | 74 (8.2%) |
| 65 to 74 Years | 49 (22.6%) | 71 (36.2%) |
| 75 Years and over | 24 (46.2%) | 70 (39.3%) |
Disability Class: Self-Care Difficulty
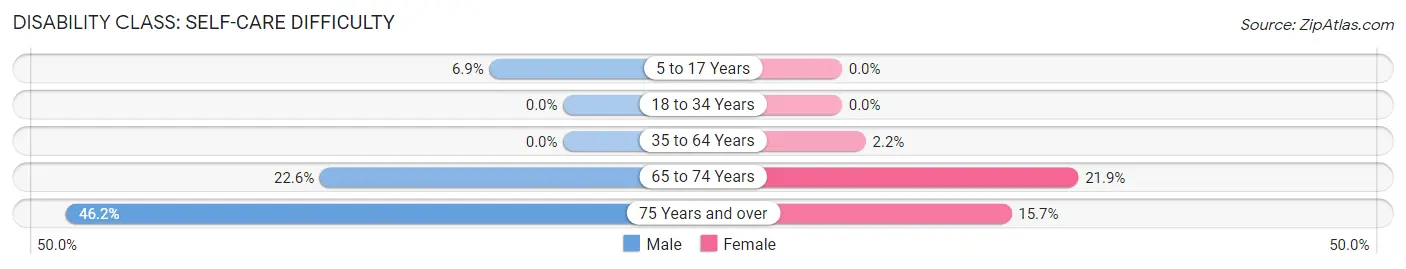
| Age Bracket | Male | Female |
| 5 to 17 Years | 23 (6.9%) | 0 (0.0%) |
| 18 to 34 Years | 0 (0.0%) | 0 (0.0%) |
| 35 to 64 Years | 0 (0.0%) | 20 (2.2%) |
| 65 to 74 Years | 49 (22.6%) | 43 (21.9%) |
| 75 Years and over | 24 (46.2%) | 28 (15.7%) |
Technology Access in Dardanelle
Computing Device Access in Dardanelle
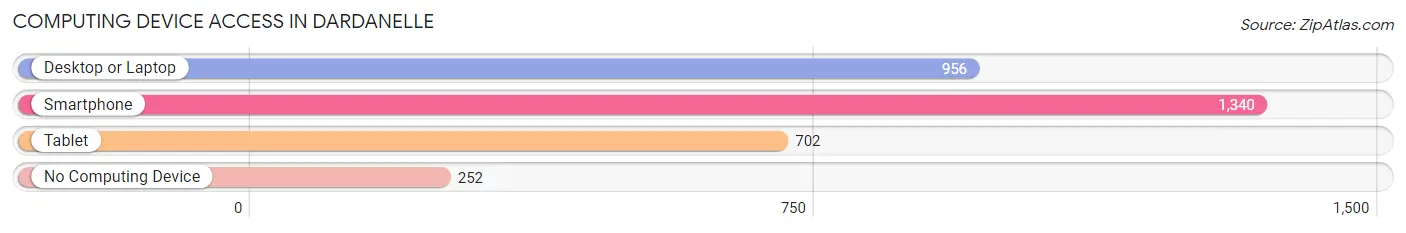
| Device Type | # Households | % Households |
| Desktop or Laptop | 956 | 57.5% |
| Smartphone | 1,340 | 80.6% |
| Tablet | 702 | 42.2% |
| No Computing Device | 252 | 15.1% |
| Total | 1,663 | 100.0% |
Internet Access in Dardanelle
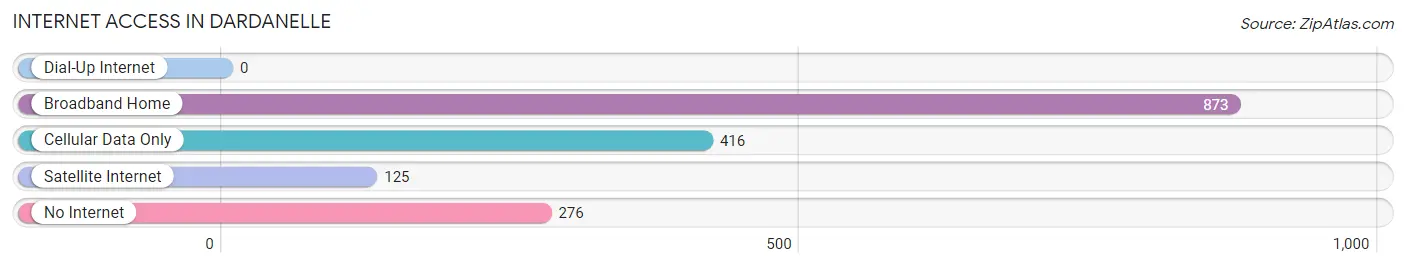
| Internet Type | # Households | % Households |
| Dial-Up Internet | 0 | 0.0% |
| Broadband Home | 873 | 52.5% |
| Cellular Data Only | 416 | 25.0% |
| Satellite Internet | 125 | 7.5% |
| No Internet | 276 | 16.6% |
| Total | 1,663 | 100.0% |
Dardanelle Summary
Dardanelle is a city located in Yell County, Arkansas, United States. It is situated on the Arkansas River, approximately 40 miles northwest of Little Rock. The population was 4,745 at the 2010 census.
History
Dardanelle was founded in 1854 by William Dardanelle, a French-Canadian fur trader. The city was originally known as Dardanelle’s Landing, and was a popular stop for steamboats traveling up and down the Arkansas River. The city was incorporated in 1875, and the name was shortened to Dardanelle.
In the late 19th century, Dardanelle was a major port for the timber industry, and the city was home to several sawmills and lumberyards. The city also had a thriving agricultural industry, with cotton, corn, and other crops being grown in the area.
In the early 20th century, Dardanelle was a popular tourist destination, with several resorts and hotels located along the Arkansas River. The city was also home to several manufacturing plants, including a cotton mill and a canning factory.
Geography
Dardanelle is located at 35°17'25" North, 93°7'25" West (35.290278, -93.123611). According to the United States Census Bureau, the city has a total area of 4.2 square miles (10.8 km2), of which 4.1 square miles (10.6 km2) is land and 0.1 square miles (0.2 km2) is water.
Economy
Dardanelle’s economy is largely based on agriculture and tourism. The city is home to several farms, and the surrounding area is known for its production of cotton, corn, soybeans, and other crops.
The city is also home to several manufacturing plants, including a cotton mill and a canning factory. The city is also home to several restaurants, hotels, and other businesses that cater to tourists.
Demographics
As of the 2010 census, there were 4,745 people, 1,945 households, and 1,232 families residing in the city. The population density was 1,154.2 people per square mile (446.3/km2). There were 2,093 housing units at an average density of 511.2 per square mile (197.3/km2). The racial makeup of the city was 81.2% White, 15.2% Black or African American, 0.3% Native American, 0.4% Asian, 0.1% Pacific Islander, 1.2% from other races, and 1.6% from two or more races. Hispanic or Latino of any race were 3.2% of the population.
There were 1,945 households, out of which 28.2% had children under the age of 18 living with them, 43.2% were married couples living together, 16.2% had a female householder with no husband present, and 36.2% were non-families. 32.2% of all households were made up of individuals, and 15.2% had someone living alone who was 65 years of age or older. The average household size was 2.35 and the average family size was 2.94.
In the city, the population was spread out, with 24.2% under the age of 18, 8.2% from 18 to 24, 25.2% from 25 to 44, 22.2% from 45 to 64, and 20.2% who were 65 years of age or older. The median age was 39 years. For every 100 females, there were 87.2 males. For every 100 females age 18 and over, there were 82.2 males.
The median income for a household in the city was $27,813, and the median income for a family was $35,938. Males had a median income of $30,000 versus $20,000 for females. The per capita income for the city was $15,845. About 14.2% of families and 17.2% of the population were below the poverty line, including 24.2% of those under age 18 and 14.2% of those age 65 or over.
Common Questions
What is Per Capita Income in Dardanelle?
Per Capita income in Dardanelle is $23,365.
What is the Median Family Income in Dardanelle?
Median Family Income in Dardanelle is $58,204.
What is the Median Household income in Dardanelle?
Median Household Income in Dardanelle is $47,724.
What is Income or Wage Gap in Dardanelle?
Income or Wage Gap in Dardanelle is 21.5%.
Women in Dardanelle earn 78.5 cents for every dollar earned by a man.
What is Inequality or Gini Index in Dardanelle?
Inequality or Gini Index in Dardanelle is 0.47.
What is the Total Population of Dardanelle?
Total Population of Dardanelle is 4,544.
What is the Total Male Population of Dardanelle?
Total Male Population of Dardanelle is 2,205.
What is the Total Female Population of Dardanelle?
Total Female Population of Dardanelle is 2,339.
What is the Ratio of Males per 100 Females in Dardanelle?
There are 94.27 Males per 100 Females in Dardanelle.
What is the Ratio of Females per 100 Males in Dardanelle?
There are 106.08 Females per 100 Males in Dardanelle.
What is the Median Population Age in Dardanelle?
Median Population Age in Dardanelle is 37.9 Years.
What is the Average Family Size in Dardanelle
Average Family Size in Dardanelle is 3.3 People.
What is the Average Household Size in Dardanelle
Average Household Size in Dardanelle is 2.7 People.
How Large is the Labor Force in Dardanelle?
There are 2,168 People in the Labor Forcein in Dardanelle.
What is the Percentage of People in the Labor Force in Dardanelle?
59.5% of People are in the Labor Force in Dardanelle.
What is the Unemployment Rate in Dardanelle?
Unemployment Rate in Dardanelle is 6.8%.