Crossett, AR Map & Demographics
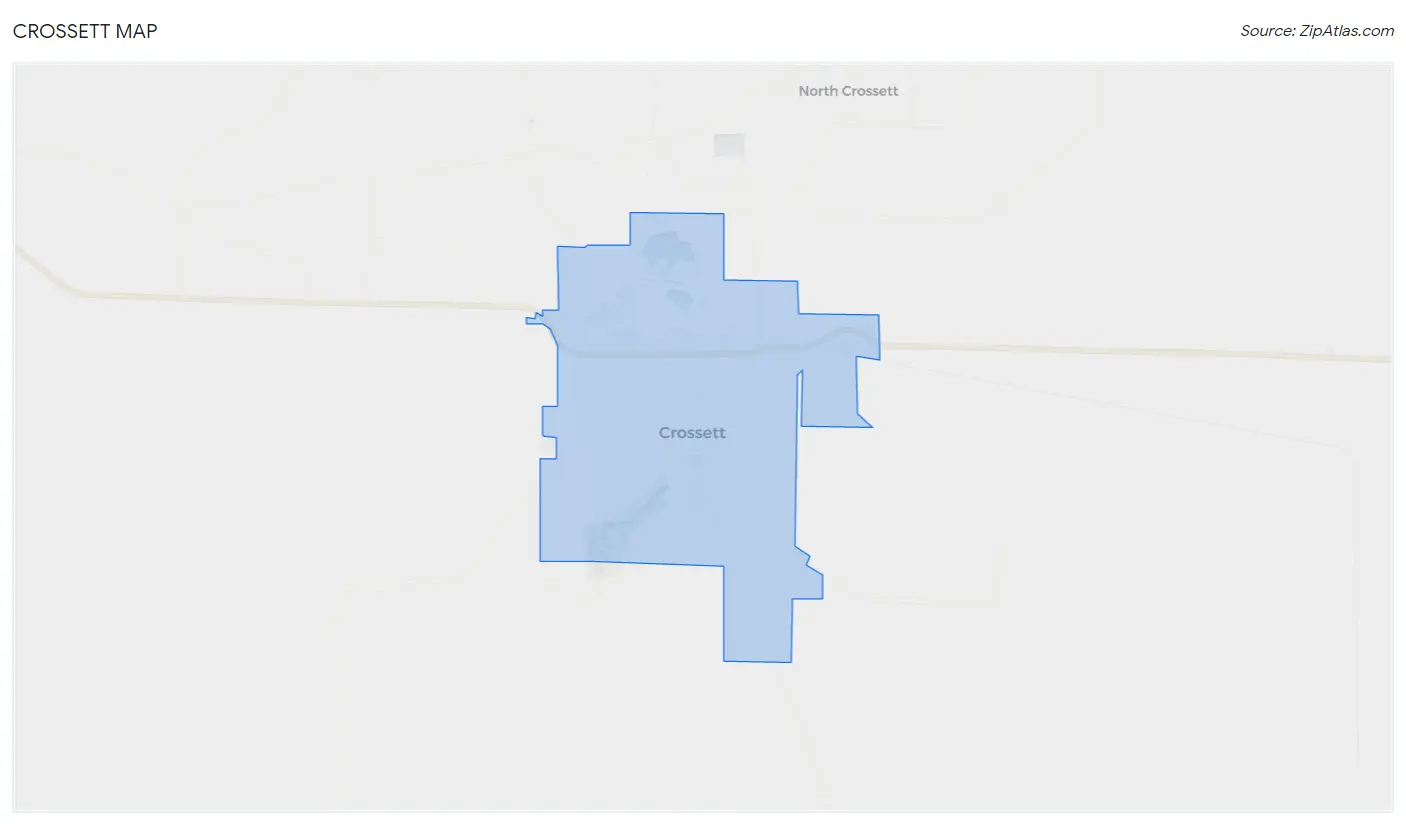
Crossett Map
Crossett Overview
$34,231
PER CAPITA INCOME
$64,531
AVG FAMILY INCOME
$41,250
AVG HOUSEHOLD INCOME
51.7%
WAGE / INCOME GAP [ % ]
48.3¢/ $1
WAGE / INCOME GAP [ $ ]
$11,180
FAMILY INCOME DEFICIT
0.61
INEQUALITY / GINI INDEX
4,805
TOTAL POPULATION
2,130
MALE POPULATION
2,675
FEMALE POPULATION
79.63
MALES / 100 FEMALES
125.59
FEMALES / 100 MALES
43.6
MEDIAN AGE
3.2
AVG FAMILY SIZE
2.3
AVG HOUSEHOLD SIZE
1,783
LABOR FORCE [ PEOPLE ]
45.1%
PERCENT IN LABOR FORCE
4.6%
UNEMPLOYMENT RATE
Crossett Zip Codes
Crossett Area Codes
Income in Crossett
Income Overview in Crossett
Per Capita Income in Crossett is $34,231, while median incomes of families and households are $64,531 and $41,250 respectively.
| Characteristic | Number | Measure |
| Per Capita Income | 4,805 | $34,231 |
| Median Family Income | 1,212 | $64,531 |
| Mean Family Income | 1,212 | $102,787 |
| Median Household Income | 2,073 | $41,250 |
| Mean Household Income | 2,073 | $80,921 |
| Income Deficit | 1,212 | $11,180 |
| Wage / Income Gap (%) | 4,805 | 51.75% |
| Wage / Income Gap ($) | 4,805 | 48.25¢ per $1 |
| Gini / Inequality Index | 4,805 | 0.61 |
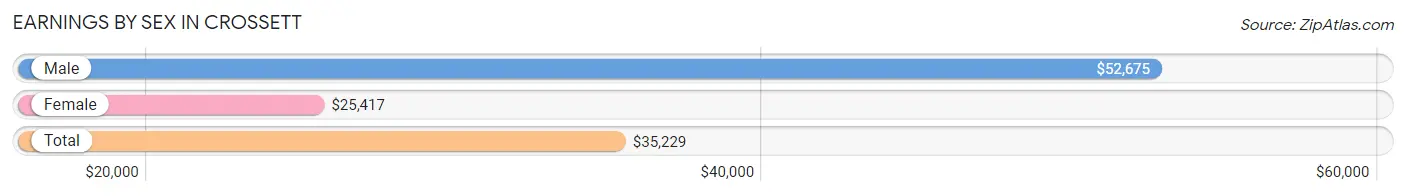
Earnings by Sex in Crossett
Average Earnings in Crossett are $35,229, $52,675 for men and $25,417 for women, a difference of 51.7%.
| Sex | Number | Average Earnings |
| Male | 783 (40.4%) | $52,675 |
| Female | 1,155 (59.6%) | $25,417 |
| Total | 1,938 (100.0%) | $35,229 |
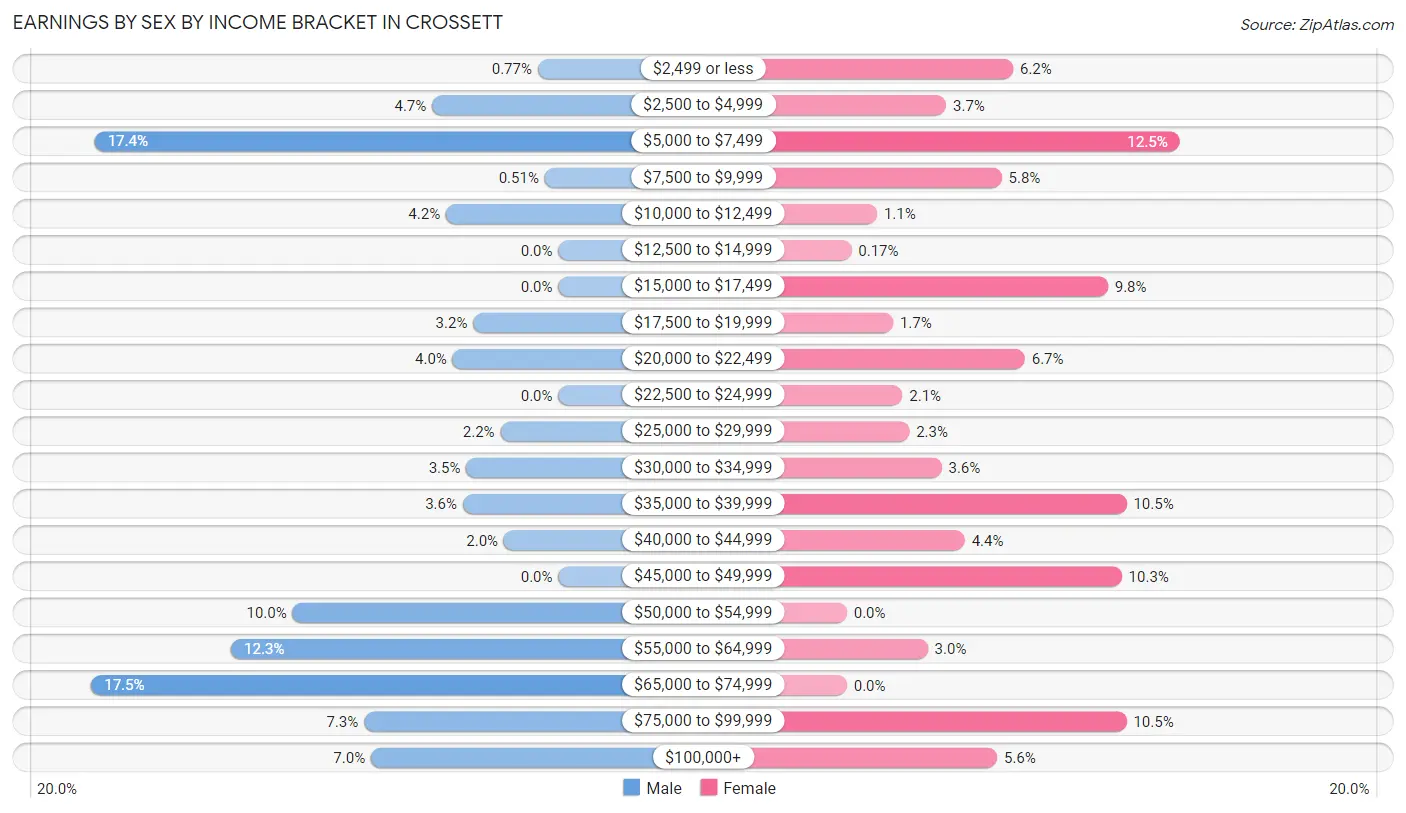
Earnings by Sex by Income Bracket in Crossett
The most common earnings brackets in Crossett are $65,000 to $74,999 for men (137 | 17.5%) and $5,000 to $7,499 for women (144 | 12.5%).
| Income | Male | Female |
| $2,499 or less | 6 (0.8%) | 72 (6.2%) |
| $2,500 to $4,999 | 37 (4.7%) | 43 (3.7%) |
| $5,000 to $7,499 | 136 (17.4%) | 144 (12.5%) |
| $7,500 to $9,999 | 4 (0.5%) | 67 (5.8%) |
| $10,000 to $12,499 | 33 (4.2%) | 13 (1.1%) |
| $12,500 to $14,999 | 0 (0.0%) | 2 (0.2%) |
| $15,000 to $17,499 | 0 (0.0%) | 113 (9.8%) |
| $17,500 to $19,999 | 25 (3.2%) | 20 (1.7%) |
| $20,000 to $22,499 | 31 (4.0%) | 77 (6.7%) |
| $22,500 to $24,999 | 0 (0.0%) | 24 (2.1%) |
| $25,000 to $29,999 | 17 (2.2%) | 27 (2.3%) |
| $30,000 to $34,999 | 27 (3.5%) | 41 (3.5%) |
| $35,000 to $39,999 | 28 (3.6%) | 121 (10.5%) |
| $40,000 to $44,999 | 16 (2.0%) | 51 (4.4%) |
| $45,000 to $49,999 | 0 (0.0%) | 119 (10.3%) |
| $50,000 to $54,999 | 78 (10.0%) | 0 (0.0%) |
| $55,000 to $64,999 | 96 (12.3%) | 35 (3.0%) |
| $65,000 to $74,999 | 137 (17.5%) | 0 (0.0%) |
| $75,000 to $99,999 | 57 (7.3%) | 121 (10.5%) |
| $100,000+ | 55 (7.0%) | 65 (5.6%) |
| Total | 783 (100.0%) | 1,155 (100.0%) |
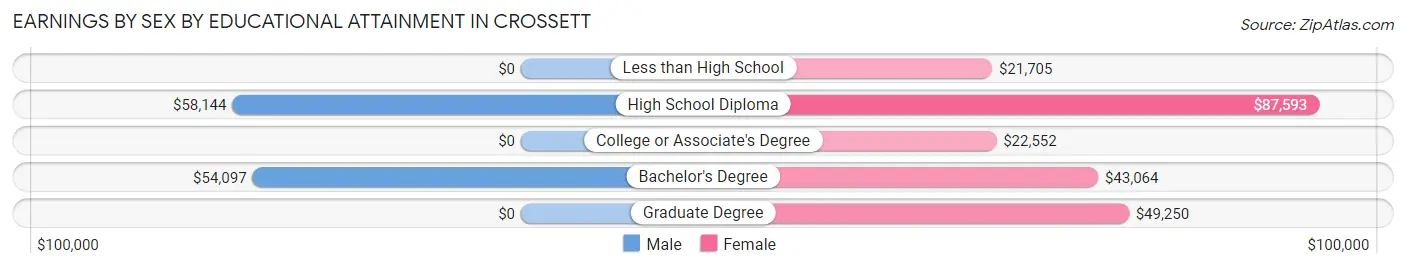
Earnings by Sex by Educational Attainment in Crossett
Average earnings in Crossett are $58,182 for men and $36,089 for women, a difference of 38.0%. Men with an educational attainment of high school diploma enjoy the highest average annual earnings of $58,144, while those with bachelor's degree education earn the least with $54,097. Women with an educational attainment of high school diploma earn the most with the average annual earnings of $87,593, while those with less than high school education have the smallest earnings of $21,705.
| Educational Attainment | Male Income | Female Income |
| Less than High School | - | - |
| High School Diploma | $58,144 | $87,593 |
| College or Associate's Degree | - | - |
| Bachelor's Degree | $54,097 | $43,064 |
| Graduate Degree | - | - |
| Total | $58,182 | $36,089 |
Family Income in Crossett
Family Income Brackets in Crossett
According to the Crossett family income data, there are 256 families falling into the $100,000 to $149,999 income range, which is the most common income bracket and makes up 21.1% of all families. Conversely, the $25,000 to $34,999 income bracket is the least frequent group with only 12 families (1.0%) belonging to this category.
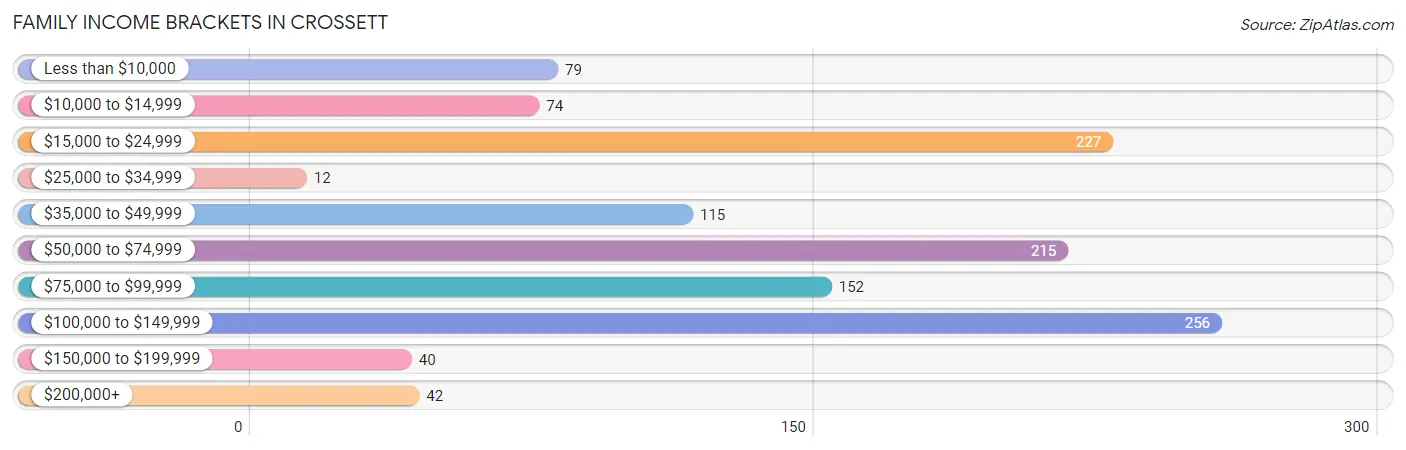
| Income Bracket | # Families | % Families |
| Less than $10,000 | 79 | 6.5% |
| $10,000 to $14,999 | 74 | 6.1% |
| $15,000 to $24,999 | 227 | 18.7% |
| $25,000 to $34,999 | 12 | 1.0% |
| $35,000 to $49,999 | 115 | 9.5% |
| $50,000 to $74,999 | 215 | 17.7% |
| $75,000 to $99,999 | 152 | 12.5% |
| $100,000 to $149,999 | 256 | 21.1% |
| $150,000 to $199,999 | 40 | 3.3% |
| $200,000+ | 42 | 3.5% |
Family Income by Famaliy Size in Crossett
2-person families (719 | 59.3%) account for the highest median family income in Crossett with $71,898 per family, while 2-person families (719 | 59.3%) have the highest median income of $35,949 per family member.
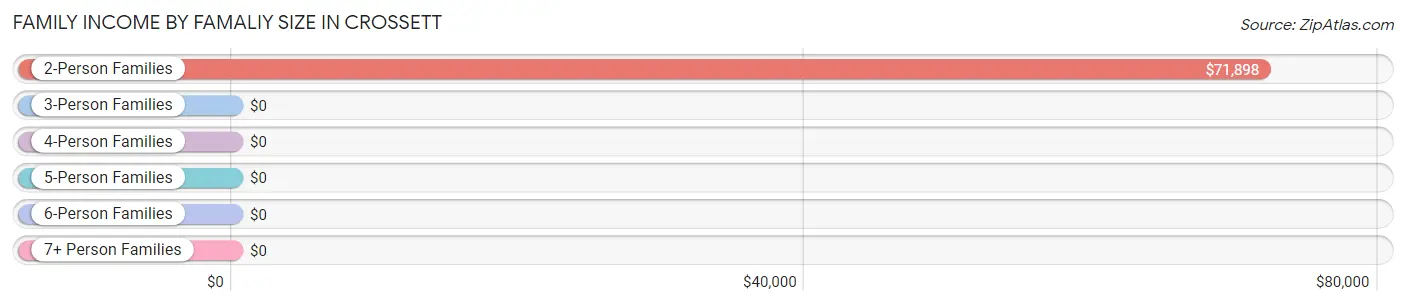
| Income Bracket | # Families | Median Income |
| 2-Person Families | 719 (59.3%) | $71,898 |
| 3-Person Families | 253 (20.9%) | $0 |
| 4-Person Families | 234 (19.3%) | $0 |
| 5-Person Families | 6 (0.5%) | $0 |
| 6-Person Families | 0 (0.0%) | $0 |
| 7+ Person Families | 0 (0.0%) | $0 |
| Total | 1,212 (100.0%) | $64,531 |
Family Income by Number of Earners in Crossett
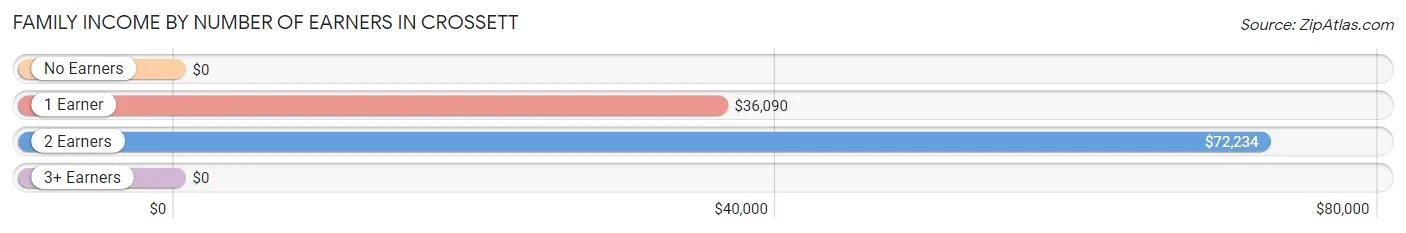
| Number of Earners | # Families | Median Income |
| No Earners | 421 (34.7%) | $0 |
| 1 Earner | 279 (23.0%) | $36,090 |
| 2 Earners | 493 (40.7%) | $72,234 |
| 3+ Earners | 19 (1.6%) | $0 |
| Total | 1,212 (100.0%) | $64,531 |
Household Income in Crossett
Household Income Brackets in Crossett
With 439 households falling in the category, the $15,000 to $24,999 income range is the most frequent in Crossett, accounting for 21.2% of all households. In contrast, only 39 households (1.9%) fall into the $150,000 to $199,999 income bracket, making it the least populous group.
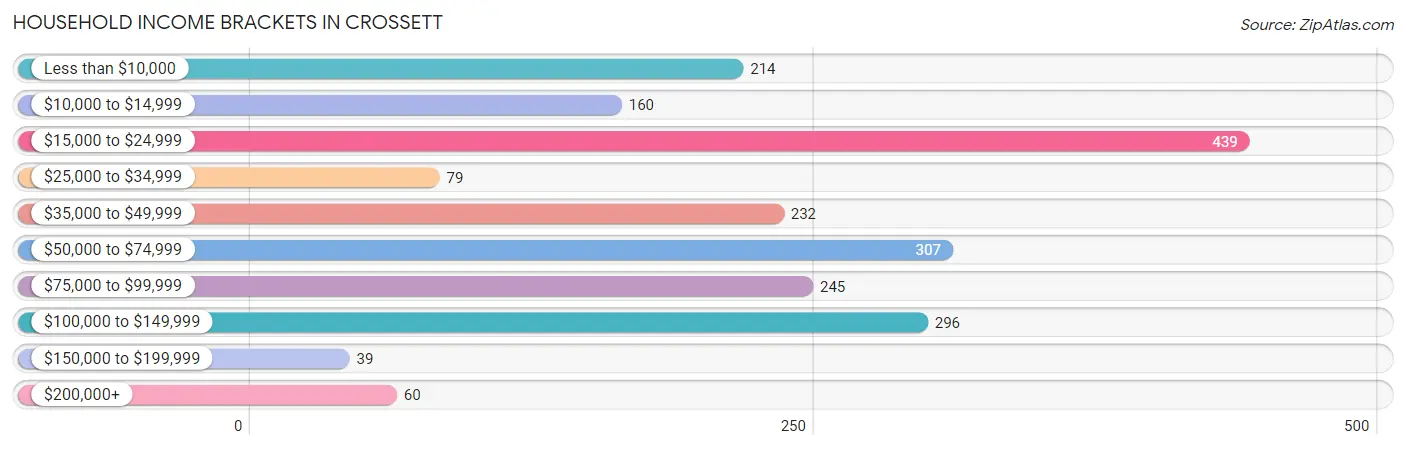
| Income Bracket | # Households | % Households |
| Less than $10,000 | 214 | 10.3% |
| $10,000 to $14,999 | 160 | 7.7% |
| $15,000 to $24,999 | 439 | 21.2% |
| $25,000 to $34,999 | 79 | 3.8% |
| $35,000 to $49,999 | 232 | 11.2% |
| $50,000 to $74,999 | 307 | 14.8% |
| $75,000 to $99,999 | 245 | 11.8% |
| $100,000 to $149,999 | 296 | 14.3% |
| $150,000 to $199,999 | 39 | 1.9% |
| $200,000+ | 60 | 2.9% |
Household Income by Householder Age in Crossett
The median household income in Crossett is $41,250, with the highest median household income of $69,306 found in the 45 to 64 years age bracket for the primary householder. A total of 693 households (33.4%) fall into this category. Meanwhile, the 15 to 24 years age bracket for the primary householder has the lowest median household income of $0, with 122 households (5.9%) in this group.
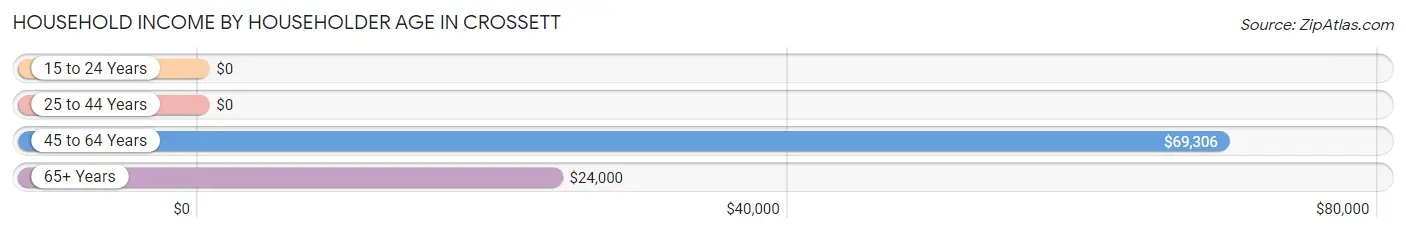
| Income Bracket | # Households | Median Income |
| 15 to 24 Years | 122 (5.9%) | $0 |
| 25 to 44 Years | 550 (26.5%) | $0 |
| 45 to 64 Years | 693 (33.4%) | $69,306 |
| 65+ Years | 708 (34.2%) | $24,000 |
| Total | 2,073 (100.0%) | $41,250 |
Poverty in Crossett
Income Below Poverty by Sex and Age in Crossett
With 21.6% poverty level for males and 30.3% for females among the residents of Crossett, 16 and 17 year old males and 5 year old females are the most vulnerable to poverty, with 46 males (100.0%) and 39 females (100.0%) in their respective age groups living below the poverty level.
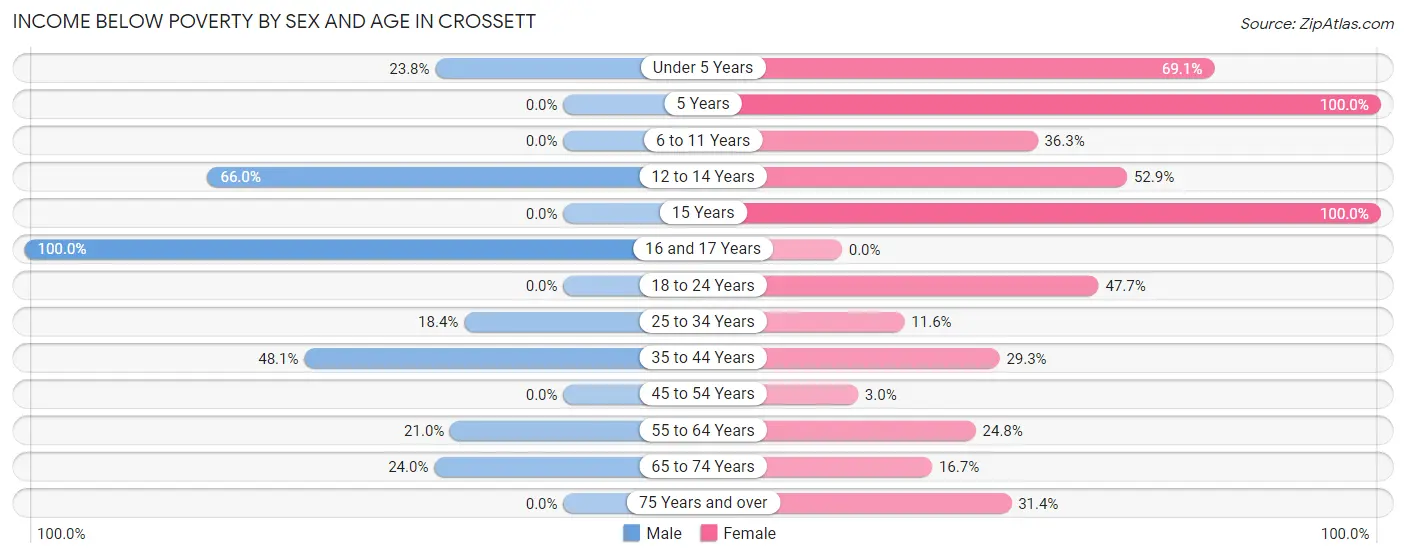
| Age Bracket | Male | Female |
| Under 5 Years | 24 (23.8%) | 114 (69.1%) |
| 5 Years | 0 (0.0%) | 39 (100.0%) |
| 6 to 11 Years | 0 (0.0%) | 81 (36.3%) |
| 12 to 14 Years | 35 (66.0%) | 81 (52.9%) |
| 15 Years | 0 (0.0%) | 33 (100.0%) |
| 16 and 17 Years | 46 (100.0%) | 0 (0.0%) |
| 18 to 24 Years | 0 (0.0%) | 122 (47.7%) |
| 25 to 34 Years | 44 (18.4%) | 23 (11.6%) |
| 35 to 44 Years | 150 (48.1%) | 91 (29.3%) |
| 45 to 54 Years | 0 (0.0%) | 12 (3.0%) |
| 55 to 64 Years | 71 (21.0%) | 39 (24.8%) |
| 65 to 74 Years | 87 (24.0%) | 40 (16.7%) |
| 75 Years and over | 0 (0.0%) | 122 (31.4%) |
| Total | 457 (21.6%) | 797 (30.3%) |
Income Above Poverty by Sex and Age in Crossett
According to the poverty statistics in Crossett, males aged 5 years and females aged 16 and 17 years are the age groups that are most secure financially, with 100.0% of males and 100.0% of females in these age groups living above the poverty line.
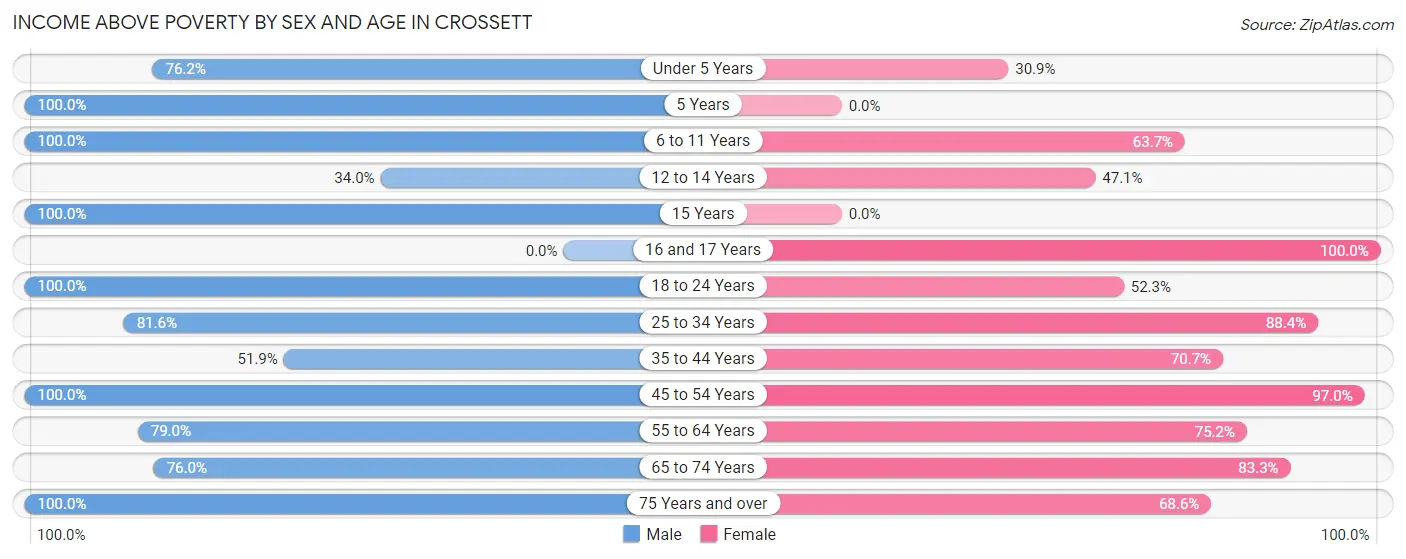
| Age Bracket | Male | Female |
| Under 5 Years | 77 (76.2%) | 51 (30.9%) |
| 5 Years | 6 (100.0%) | 0 (0.0%) |
| 6 to 11 Years | 55 (100.0%) | 142 (63.7%) |
| 12 to 14 Years | 18 (34.0%) | 72 (47.1%) |
| 15 Years | 24 (100.0%) | 0 (0.0%) |
| 16 and 17 Years | 0 (0.0%) | 68 (100.0%) |
| 18 to 24 Years | 188 (100.0%) | 134 (52.3%) |
| 25 to 34 Years | 195 (81.6%) | 175 (88.4%) |
| 35 to 44 Years | 162 (51.9%) | 220 (70.7%) |
| 45 to 54 Years | 289 (100.0%) | 389 (97.0%) |
| 55 to 64 Years | 267 (79.0%) | 118 (75.2%) |
| 65 to 74 Years | 276 (76.0%) | 199 (83.3%) |
| 75 Years and over | 104 (100.0%) | 266 (68.6%) |
| Total | 1,661 (78.4%) | 1,834 (69.7%) |
Income Below Poverty Among Married-Couple Families in Crossett
The poverty statistics for married-couple families in Crossett show that 17.1% or 154 of the total 900 families live below the poverty line. Families with 1 or 2 children have the highest poverty rate of 30.0%, comprising of 75 families. On the other hand, families with no children have the lowest poverty rate of 12.1%, which includes 79 families.
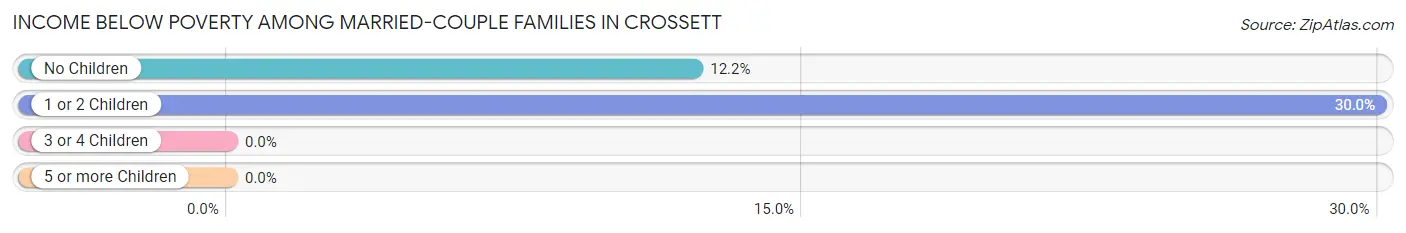
| Children | Above Poverty | Below Poverty |
| No Children | 571 (87.8%) | 79 (12.1%) |
| 1 or 2 Children | 175 (70.0%) | 75 (30.0%) |
| 3 or 4 Children | 0 (0.0%) | 0 (0.0%) |
| 5 or more Children | 0 (0.0%) | 0 (0.0%) |
| Total | 746 (82.9%) | 154 (17.1%) |
Income Below Poverty Among Single-Parent Households in Crossett
| Children | Single Father | Single Mother |
| No Children | 0 (0.0%) | 34 (30.6%) |
| 1 or 2 Children | 0 (0.0%) | 54 (41.9%) |
| 3 or 4 Children | 0 (0.0%) | 60 (100.0%) |
| 5 or more Children | 0 (0.0%) | 0 (0.0%) |
| Total | 0 (0.0%) | 148 (49.3%) |
Income Below Poverty Among Married-Couple vs Single-Parent Households in Crossett
The poverty data for Crossett shows that 154 of the married-couple family households (17.1%) and 148 of the single-parent households (47.4%) are living below the poverty level. Within the married-couple family households, those with 1 or 2 children have the highest poverty rate, with 75 households (30.0%) falling below the poverty line. Among the single-parent households, those with 3 or 4 children have the highest poverty rate, with 60 household (100.0%) living below poverty.
| Children | Married-Couple Families | Single-Parent Households |
| No Children | 79 (12.1%) | 34 (29.3%) |
| 1 or 2 Children | 75 (30.0%) | 54 (39.7%) |
| 3 or 4 Children | 0 (0.0%) | 60 (100.0%) |
| 5 or more Children | 0 (0.0%) | 0 (0.0%) |
| Total | 154 (17.1%) | 148 (47.4%) |
Race in Crossett
The most populous races in Crossett are White / Caucasian (2,630 | 54.7%), Black / African American (2,064 | 43.0%), and Hispanic or Latino (112 | 2.3%).
| Race | # Population | % Population |
| Asian | 0 | 0.0% |
| Black / African American | 2,064 | 43.0% |
| Hawaiian / Pacific | 0 | 0.0% |
| Hispanic or Latino | 112 | 2.3% |
| Native / Alaskan | 0 | 0.0% |
| White / Caucasian | 2,630 | 54.7% |
| Two or more Races | 111 | 2.3% |
| Some other Race | 0 | 0.0% |
| Total | 4,805 | 100.0% |
Ancestry in Crossett
The most populous ancestries reported in Crossett are American (573 | 11.9%), Irish (478 | 10.0%), English (423 | 8.8%), German (166 | 3.5%), and African (120 | 2.5%), together accounting for 36.6% of all Crossett residents.
| Ancestry | # Population | % Population |
| African | 120 | 2.5% |
| American | 573 | 11.9% |
| Argentinean | 66 | 1.4% |
| Dutch | 19 | 0.4% |
| English | 423 | 8.8% |
| European | 56 | 1.2% |
| German | 166 | 3.5% |
| Irish | 478 | 10.0% |
| Mexican | 46 | 1.0% |
| Scotch-Irish | 31 | 0.6% |
| Scottish | 46 | 1.0% |
| South American | 66 | 1.4% |
| Subsaharan African | 120 | 2.5% |
| Welsh | 19 | 0.4% | View All 14 Rows |
Immigrants in Crossett

| Immigration Origin | # Population | % Population | View All 0 Rows |
Sex and Age in Crossett
Sex and Age in Crossett
The most populous age groups in Crossett are 60 to 64 Years (224 | 10.5%) for men and 40 to 44 Years (260 | 9.7%) for women.
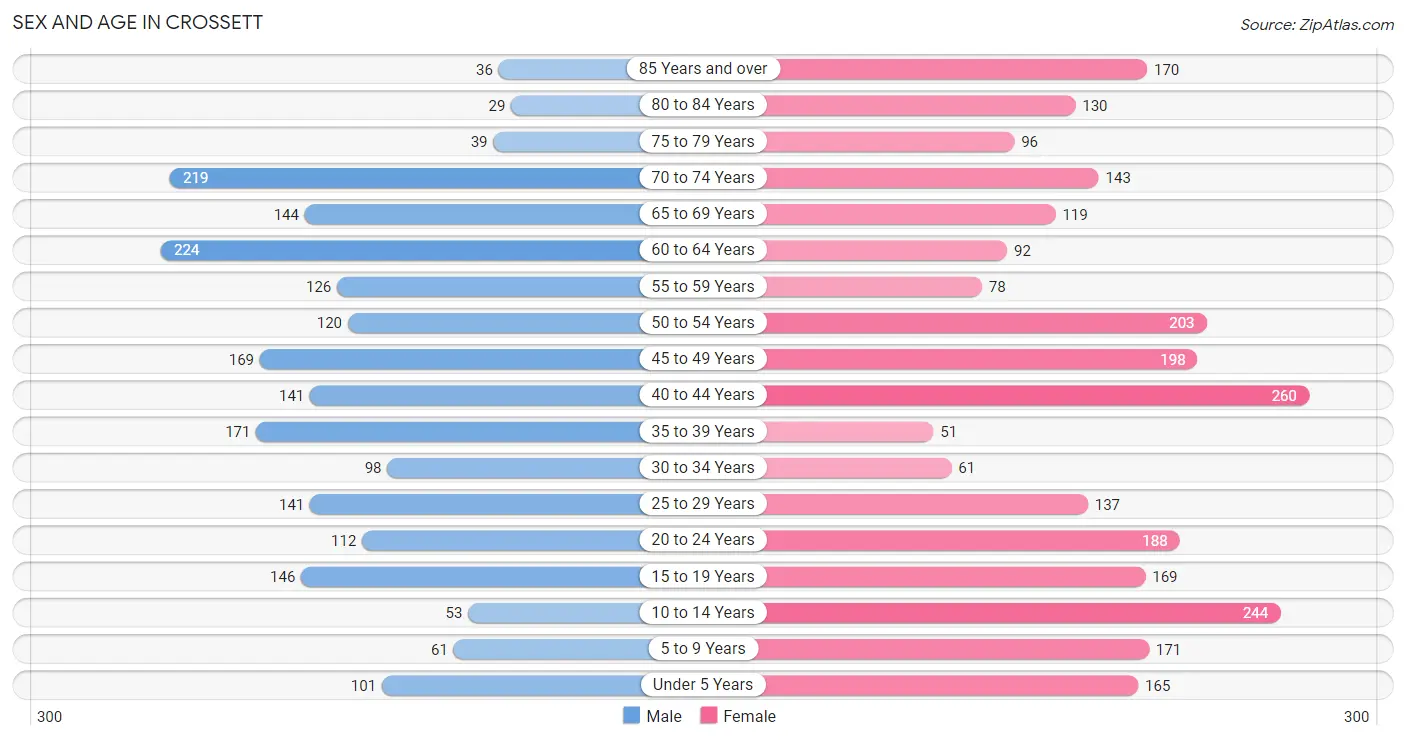
| Age Bracket | Male | Female |
| Under 5 Years | 101 (4.7%) | 165 (6.2%) |
| 5 to 9 Years | 61 (2.9%) | 171 (6.4%) |
| 10 to 14 Years | 53 (2.5%) | 244 (9.1%) |
| 15 to 19 Years | 146 (6.9%) | 169 (6.3%) |
| 20 to 24 Years | 112 (5.3%) | 188 (7.0%) |
| 25 to 29 Years | 141 (6.6%) | 137 (5.1%) |
| 30 to 34 Years | 98 (4.6%) | 61 (2.3%) |
| 35 to 39 Years | 171 (8.0%) | 51 (1.9%) |
| 40 to 44 Years | 141 (6.6%) | 260 (9.7%) |
| 45 to 49 Years | 169 (7.9%) | 198 (7.4%) |
| 50 to 54 Years | 120 (5.6%) | 203 (7.6%) |
| 55 to 59 Years | 126 (5.9%) | 78 (2.9%) |
| 60 to 64 Years | 224 (10.5%) | 92 (3.4%) |
| 65 to 69 Years | 144 (6.8%) | 119 (4.4%) |
| 70 to 74 Years | 219 (10.3%) | 143 (5.3%) |
| 75 to 79 Years | 39 (1.8%) | 96 (3.6%) |
| 80 to 84 Years | 29 (1.4%) | 130 (4.9%) |
| 85 Years and over | 36 (1.7%) | 170 (6.4%) |
| Total | 2,130 (100.0%) | 2,675 (100.0%) |
Families and Households in Crossett
Median Family Size in Crossett
The median family size in Crossett is 3.20 persons per family, with single male/father families (12 | 1.0%) accounting for the largest median family size of 4.42 persons per family. On the other hand, single female/mother families (300 | 24.7%) represent the smallest median family size with 3.09 persons per family.
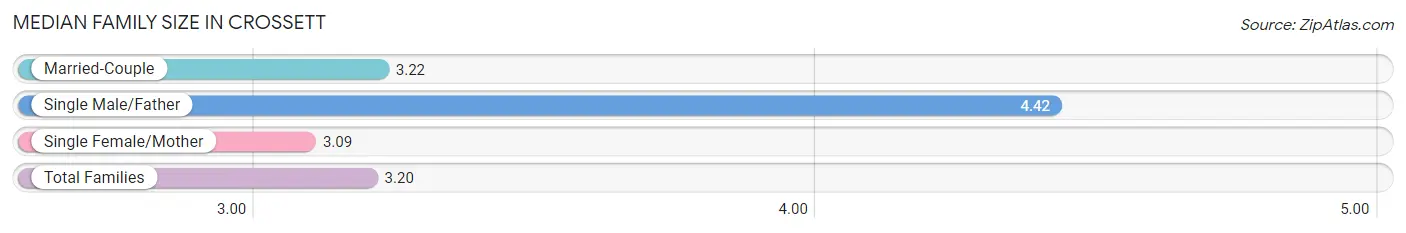
| Family Type | # Families | Family Size |
| Married-Couple | 900 (74.3%) | 3.22 |
| Single Male/Father | 12 (1.0%) | 4.42 |
| Single Female/Mother | 300 (24.7%) | 3.09 |
| Total Families | 1,212 (100.0%) | 3.20 |
Median Household Size in Crossett
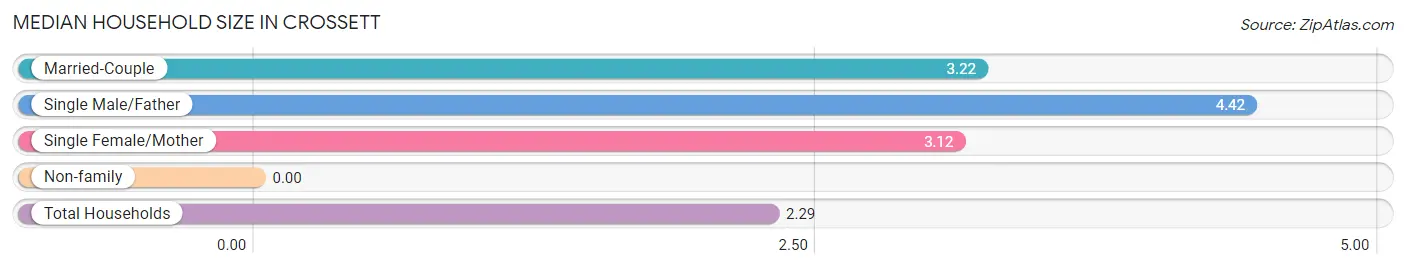
| Household Type | # Households | Household Size |
| Married-Couple | 900 (43.4%) | 3.22 |
| Single Male/Father | 12 (0.6%) | 4.42 |
| Single Female/Mother | 300 (14.5%) | 3.12 |
| Non-family | 861 (41.5%) | - |
| Total Households | 2,073 (100.0%) | 2.29 |
Household Size by Marriage Status in Crossett
Out of a total of 2,073 households in Crossett, 1,212 (58.5%) are family households, while 861 (41.5%) are nonfamily households. The most numerous type of family households are 2-person households, comprising 705, and the most common type of nonfamily households are 1-person households, comprising 861.
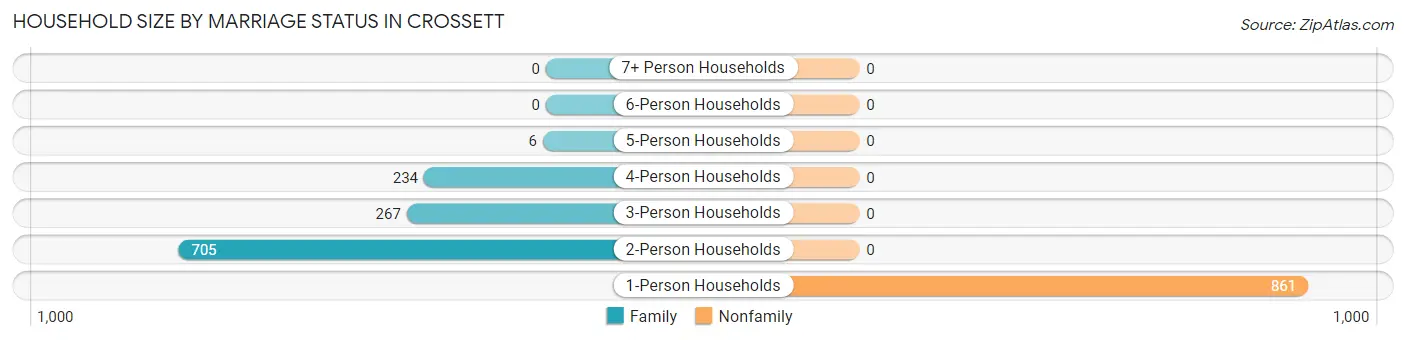
| Household Size | Family Households | Nonfamily Households |
| 1-Person Households | - | 861 (41.5%) |
| 2-Person Households | 705 (34.0%) | 0 (0.0%) |
| 3-Person Households | 267 (12.9%) | 0 (0.0%) |
| 4-Person Households | 234 (11.3%) | 0 (0.0%) |
| 5-Person Households | 6 (0.3%) | 0 (0.0%) |
| 6-Person Households | 0 (0.0%) | 0 (0.0%) |
| 7+ Person Households | 0 (0.0%) | 0 (0.0%) |
| Total | 1,212 (58.5%) | 861 (41.5%) |
Female Fertility in Crossett
Fertility by Age in Crossett
Average fertility rate in Crossett is 119.0 births per 1,000 women. Women in the age bracket of 20 to 34 years have the highest fertility rate with 272.0 births per 1,000 women. Women in the age bracket of 20 to 34 years acount for 73.4% of all women with births.
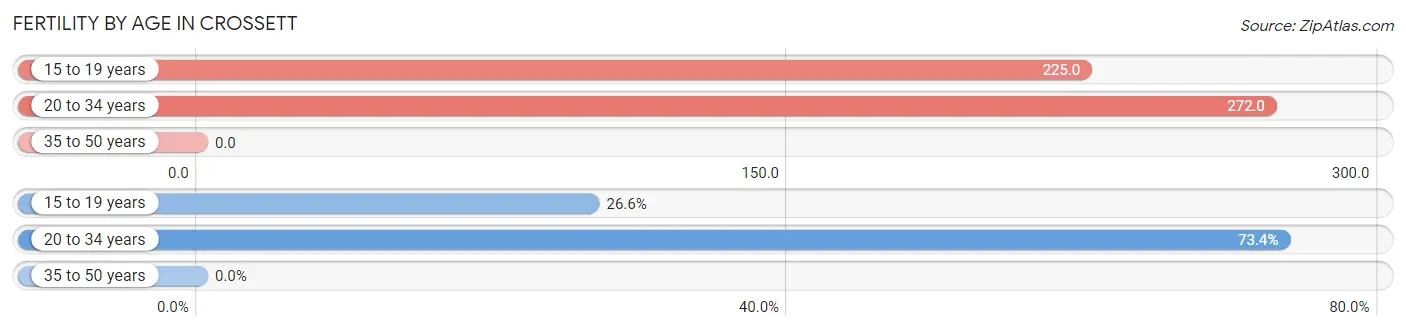
| Age Bracket | Women with Births | Births / 1,000 Women |
| 15 to 19 years | 38 (26.6%) | 225.0 |
| 20 to 34 years | 105 (73.4%) | 272.0 |
| 35 to 50 years | 0 (0.0%) | 0.0 |
| Total | 143 (100.0%) | 119.0 |
Fertility by Age by Marriage Status in Crossett
73.4% of women with births (143) in Crossett are married. The highest percentage of unmarried women with births falls into 15 to 19 years age bracket with 100.0% of them unmarried at the time of birth, while the lowest percentage of unmarried women with births belong to 20 to 34 years age bracket with 0.0% of them unmarried.
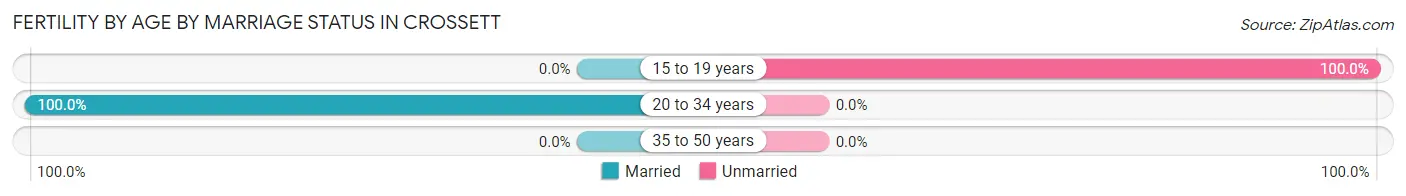
| Age Bracket | Married | Unmarried |
| 15 to 19 years | 0 (0.0%) | 38 (100.0%) |
| 20 to 34 years | 105 (100.0%) | 0 (0.0%) |
| 35 to 50 years | 0 (0.0%) | 0 (0.0%) |
| Total | 105 (73.4%) | 38 (26.6%) |
Fertility by Education in Crossett
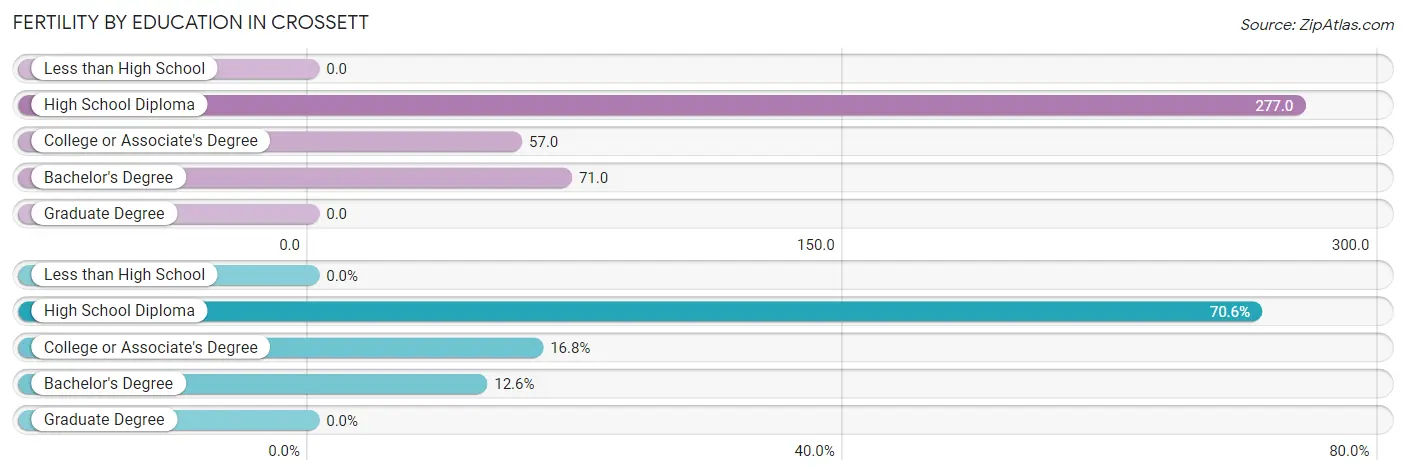
| Educational Attainment | Women with Births | Births / 1,000 Women |
| Less than High School | 0 (0.0%) | 0.0 |
| High School Diploma | 101 (70.6%) | 277.0 |
| College or Associate's Degree | 24 (16.8%) | 57.0 |
| Bachelor's Degree | 18 (12.6%) | 71.0 |
| Graduate Degree | 0 (0.0%) | 0.0 |
| Total | 143 (100.0%) | 119.0 |
Fertility by Education by Marriage Status in Crossett
26.6% of women with births in Crossett are unmarried. Women with the educational attainment of college or associate's degree are most likely to be married with 100.0% of them married at childbirth, while women with the educational attainment of high school diploma are least likely to be married with 37.6% of them unmarried at childbirth.
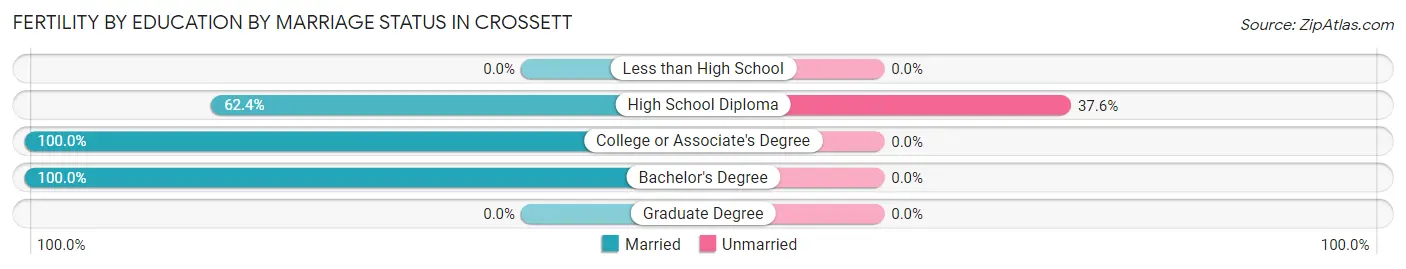
| Educational Attainment | Married | Unmarried |
| Less than High School | 0 (0.0%) | 0 (0.0%) |
| High School Diploma | 63 (62.4%) | 38 (37.6%) |
| College or Associate's Degree | 24 (100.0%) | 0 (0.0%) |
| Bachelor's Degree | 18 (100.0%) | 0 (0.0%) |
| Graduate Degree | 0 (0.0%) | 0 (0.0%) |
| Total | 105 (73.4%) | 38 (26.6%) |
Employment Characteristics in Crossett
Employment by Class of Employer in Crossett
Among the 1,680 employed individuals in Crossett, private company employees (1,085 | 64.6%), state government employees (207 | 12.3%), and not-for-profit organizations (153 | 9.1%) make up the most common classes of employment.
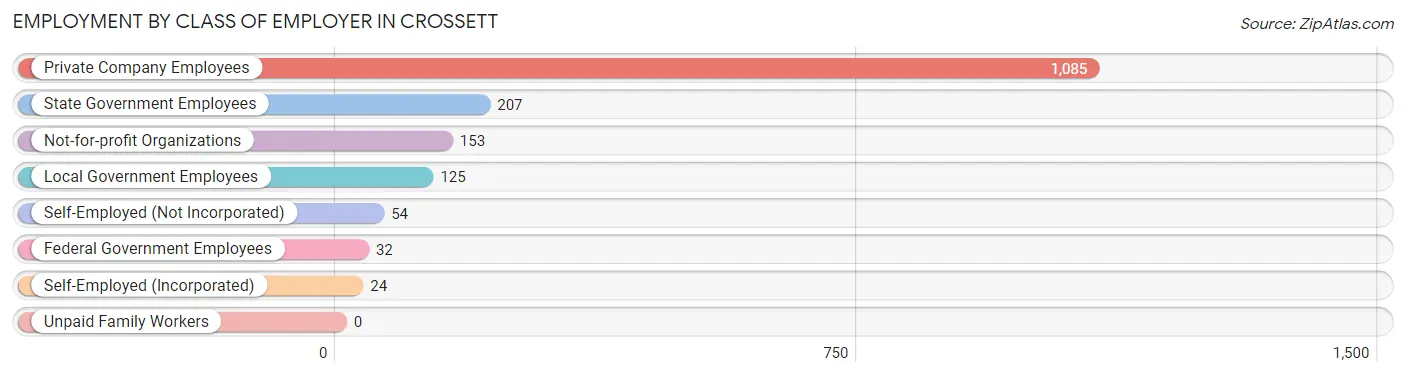
| Employer Class | # Employees | % Employees |
| Private Company Employees | 1,085 | 64.6% |
| Self-Employed (Incorporated) | 24 | 1.4% |
| Self-Employed (Not Incorporated) | 54 | 3.2% |
| Not-for-profit Organizations | 153 | 9.1% |
| Local Government Employees | 125 | 7.4% |
| State Government Employees | 207 | 12.3% |
| Federal Government Employees | 32 | 1.9% |
| Unpaid Family Workers | 0 | 0.0% |
| Total | 1,680 | 100.0% |
Employment Status by Age in Crossett
According to the labor force statistics for Crossett, out of the total population over 16 years of age (3,953), 45.1% or 1,783 individuals are in the labor force, with 4.6% or 82 of them unemployed. The age group with the highest labor force participation rate is 20 to 24 years, with 100.0% or 300 individuals in the labor force. Within the labor force, the 20 to 24 years age range has the highest percentage of unemployed individuals, with 19.7% or 59 of them being unemployed.
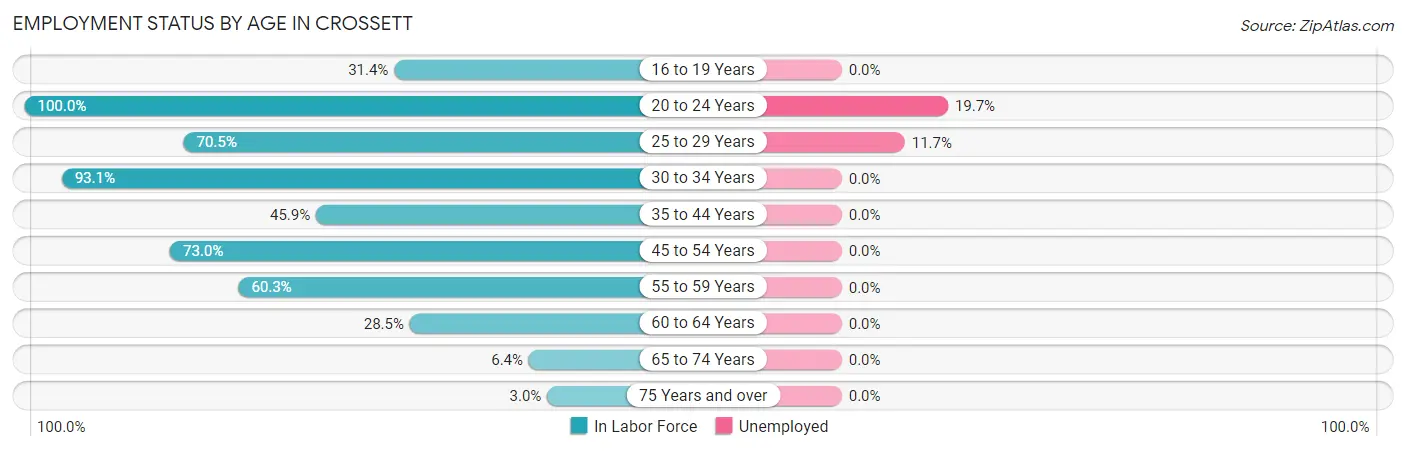
| Age Bracket | In Labor Force | Unemployed |
| 16 to 19 Years | 81 (31.4%) | 0 (0.0%) |
| 20 to 24 Years | 300 (100.0%) | 59 (19.7%) |
| 25 to 29 Years | 196 (70.5%) | 23 (11.7%) |
| 30 to 34 Years | 148 (93.1%) | 0 (0.0%) |
| 35 to 44 Years | 286 (45.9%) | 0 (0.0%) |
| 45 to 54 Years | 504 (73.0%) | 0 (0.0%) |
| 55 to 59 Years | 123 (60.3%) | 0 (0.0%) |
| 60 to 64 Years | 90 (28.5%) | 0 (0.0%) |
| 65 to 74 Years | 40 (6.4%) | 0 (0.0%) |
| 75 Years and over | 15 (3.0%) | 0 (0.0%) |
| Total | 1,783 (45.1%) | 82 (4.6%) |
Employment Status by Educational Attainment in Crossett
According to labor force statistics for Crossett, 59.3% of individuals (1,346) out of the total population between 25 and 64 years of age (2,270) are in the labor force, with 1.7% or 23 of them being unemployed. The group with the highest labor force participation rate are those with the educational attainment of bachelor's degree or higher, with 93.4% or 494 individuals in the labor force. Within the labor force, individuals with high school diploma education have the highest percentage of unemployment, with 5.2% or 23 of them being unemployed.
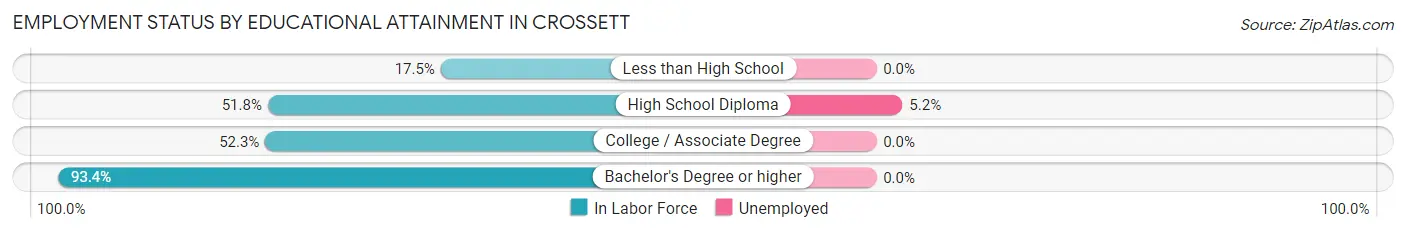
| Educational Attainment | In Labor Force | Unemployed |
| Less than High School | 27 (17.5%) | 0 (0.0%) |
| High School Diploma | 443 (51.8%) | 44 (5.2%) |
| College / Associate Degree | 383 (52.3%) | 0 (0.0%) |
| Bachelor's Degree or higher | 494 (93.4%) | 0 (0.0%) |
| Total | 1,346 (59.3%) | 39 (1.7%) |
Employment Occupations by Sex in Crossett
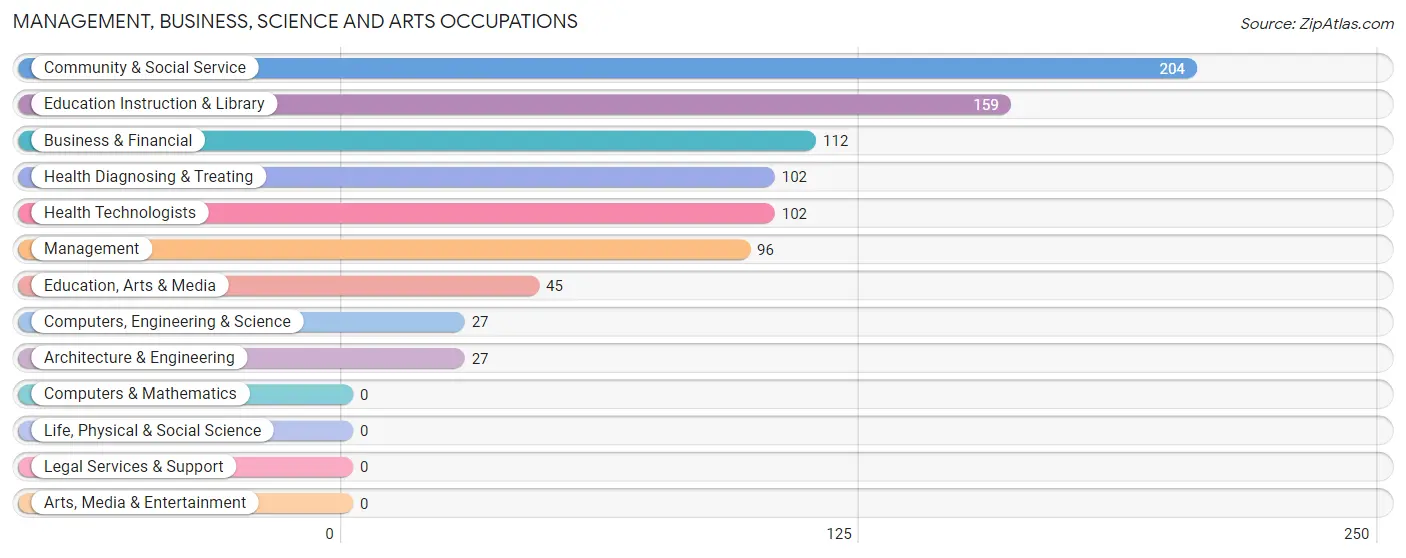
Management, Business, Science and Arts Occupations
The most common Management, Business, Science and Arts occupations in Crossett are Community & Social Service (204 | 12.0%), Education Instruction & Library (159 | 9.3%), Business & Financial (112 | 6.6%), Health Diagnosing & Treating (102 | 6.0%), and Health Technologists (102 | 6.0%).
Management, Business, Science and Arts Occupations by Sex
Within the Management, Business, Science and Arts occupations in Crossett, the most male-oriented occupations are Education, Arts & Media (100.0%), Community & Social Service (35.3%), and Management (22.9%), while the most female-oriented occupations are Computers, Engineering & Science (100.0%), Architecture & Engineering (100.0%), and Health Diagnosing & Treating (100.0%).
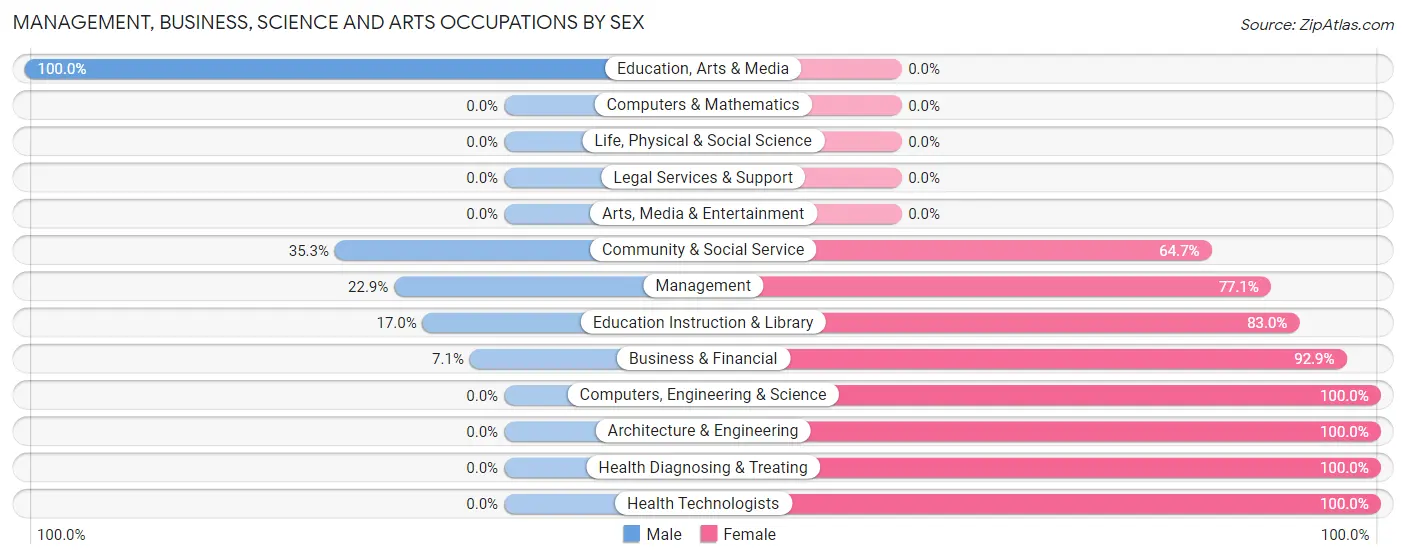
| Occupation | Male | Female |
| Management | 22 (22.9%) | 74 (77.1%) |
| Business & Financial | 8 (7.1%) | 104 (92.9%) |
| Computers, Engineering & Science | 0 (0.0%) | 27 (100.0%) |
| Computers & Mathematics | 0 (0.0%) | 0 (0.0%) |
| Architecture & Engineering | 0 (0.0%) | 27 (100.0%) |
| Life, Physical & Social Science | 0 (0.0%) | 0 (0.0%) |
| Community & Social Service | 72 (35.3%) | 132 (64.7%) |
| Education, Arts & Media | 45 (100.0%) | 0 (0.0%) |
| Legal Services & Support | 0 (0.0%) | 0 (0.0%) |
| Education Instruction & Library | 27 (17.0%) | 132 (83.0%) |
| Arts, Media & Entertainment | 0 (0.0%) | 0 (0.0%) |
| Health Diagnosing & Treating | 0 (0.0%) | 102 (100.0%) |
| Health Technologists | 0 (0.0%) | 102 (100.0%) |
| Total (Category) | 102 (18.9%) | 439 (81.1%) |
| Total (Overall) | 727 (42.7%) | 974 (57.3%) |
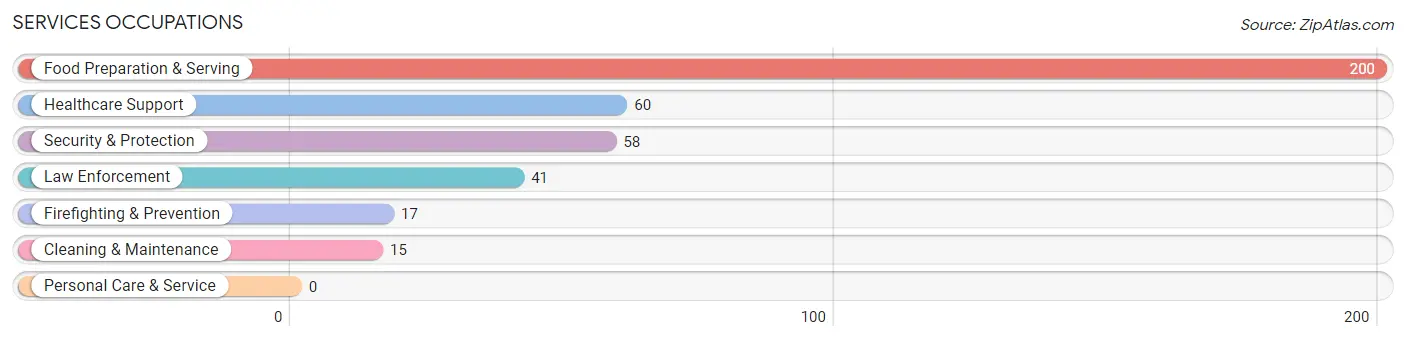
Services Occupations
The most common Services occupations in Crossett are Food Preparation & Serving (200 | 11.8%), Healthcare Support (60 | 3.5%), Security & Protection (58 | 3.4%), Law Enforcement (41 | 2.4%), and Firefighting & Prevention (17 | 1.0%).
Services Occupations by Sex
Within the Services occupations in Crossett, the most male-oriented occupations are Security & Protection (100.0%), Firefighting & Prevention (100.0%), and Law Enforcement (100.0%), while the most female-oriented occupations are Healthcare Support (100.0%), Cleaning & Maintenance (73.3%), and Food Preparation & Serving (28.5%).
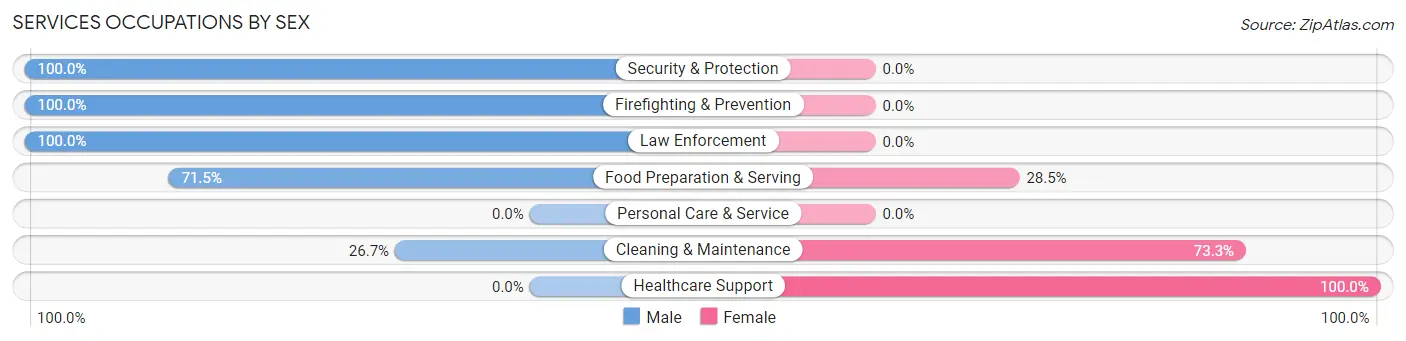
| Occupation | Male | Female |
| Healthcare Support | 0 (0.0%) | 60 (100.0%) |
| Security & Protection | 58 (100.0%) | 0 (0.0%) |
| Firefighting & Prevention | 17 (100.0%) | 0 (0.0%) |
| Law Enforcement | 41 (100.0%) | 0 (0.0%) |
| Food Preparation & Serving | 143 (71.5%) | 57 (28.5%) |
| Cleaning & Maintenance | 4 (26.7%) | 11 (73.3%) |
| Personal Care & Service | 0 (0.0%) | 0 (0.0%) |
| Total (Category) | 205 (61.6%) | 128 (38.4%) |
| Total (Overall) | 727 (42.7%) | 974 (57.3%) |
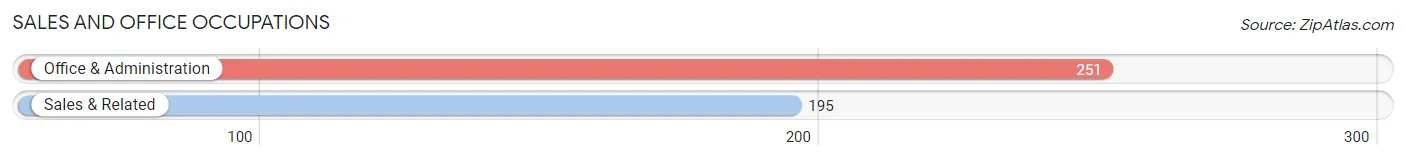
Sales and Office Occupations
The most common Sales and Office occupations in Crossett are Office & Administration (251 | 14.8%), and Sales & Related (195 | 11.5%).
Sales and Office Occupations by Sex
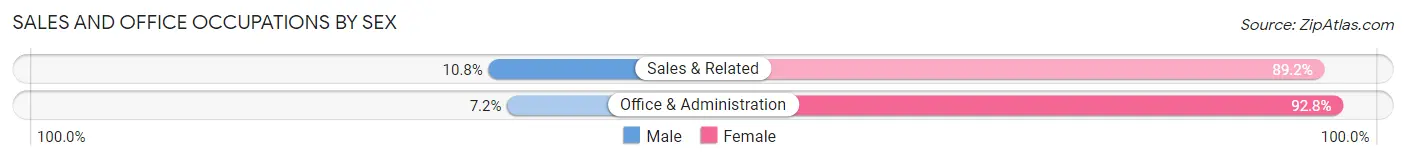
| Occupation | Male | Female |
| Sales & Related | 21 (10.8%) | 174 (89.2%) |
| Office & Administration | 18 (7.2%) | 233 (92.8%) |
| Total (Category) | 39 (8.7%) | 407 (91.3%) |
| Total (Overall) | 727 (42.7%) | 974 (57.3%) |
Natural Resources, Construction and Maintenance Occupations
The most common Natural Resources, Construction and Maintenance occupations in Crossett are , and Installation, Maintenance & Repair (54 | 3.2%).
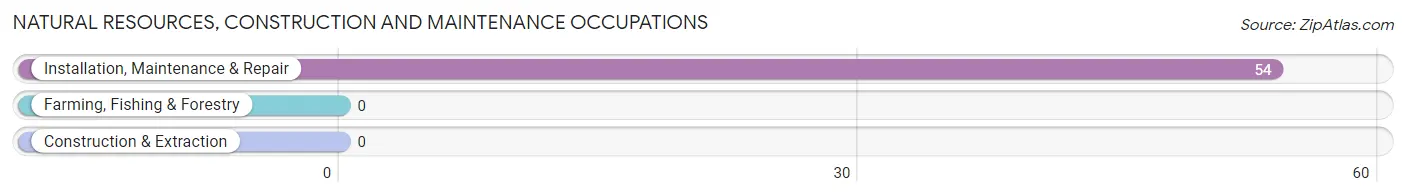
Natural Resources, Construction and Maintenance Occupations by Sex
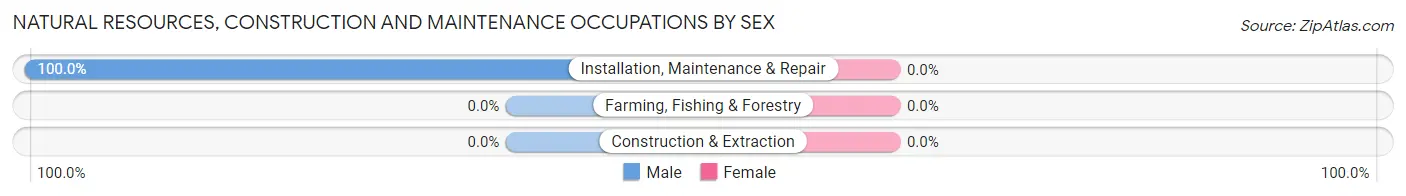
| Occupation | Male | Female |
| Farming, Fishing & Forestry | 0 (0.0%) | 0 (0.0%) |
| Construction & Extraction | 0 (0.0%) | 0 (0.0%) |
| Installation, Maintenance & Repair | 54 (100.0%) | 0 (0.0%) |
| Total (Category) | 54 (100.0%) | 0 (0.0%) |
| Total (Overall) | 727 (42.7%) | 974 (57.3%) |
Production, Transportation and Moving Occupations
The most common Production, Transportation and Moving occupations in Crossett are Production (221 | 13.0%), Transportation (57 | 3.4%), and Material Moving (49 | 2.9%).
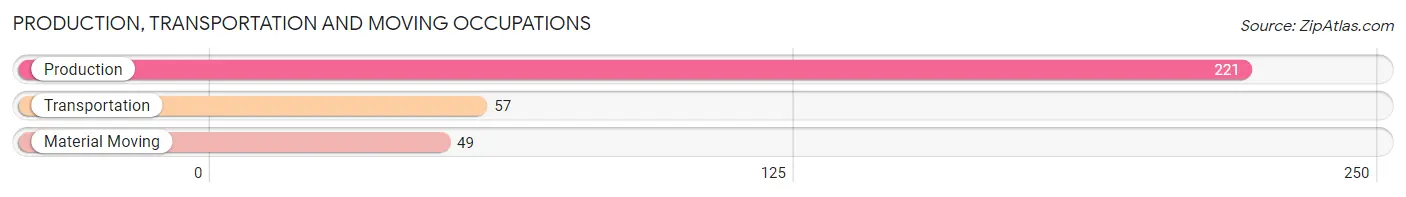
Production, Transportation and Moving Occupations by Sex
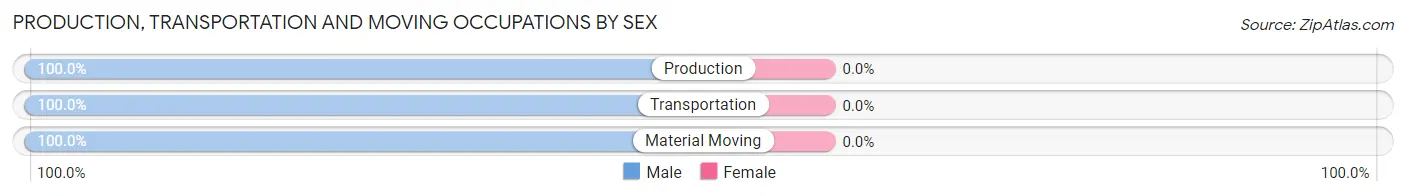
| Occupation | Male | Female |
| Production | 221 (100.0%) | 0 (0.0%) |
| Transportation | 57 (100.0%) | 0 (0.0%) |
| Material Moving | 49 (100.0%) | 0 (0.0%) |
| Total (Category) | 327 (100.0%) | 0 (0.0%) |
| Total (Overall) | 727 (42.7%) | 974 (57.3%) |
Employment Industries by Sex in Crossett
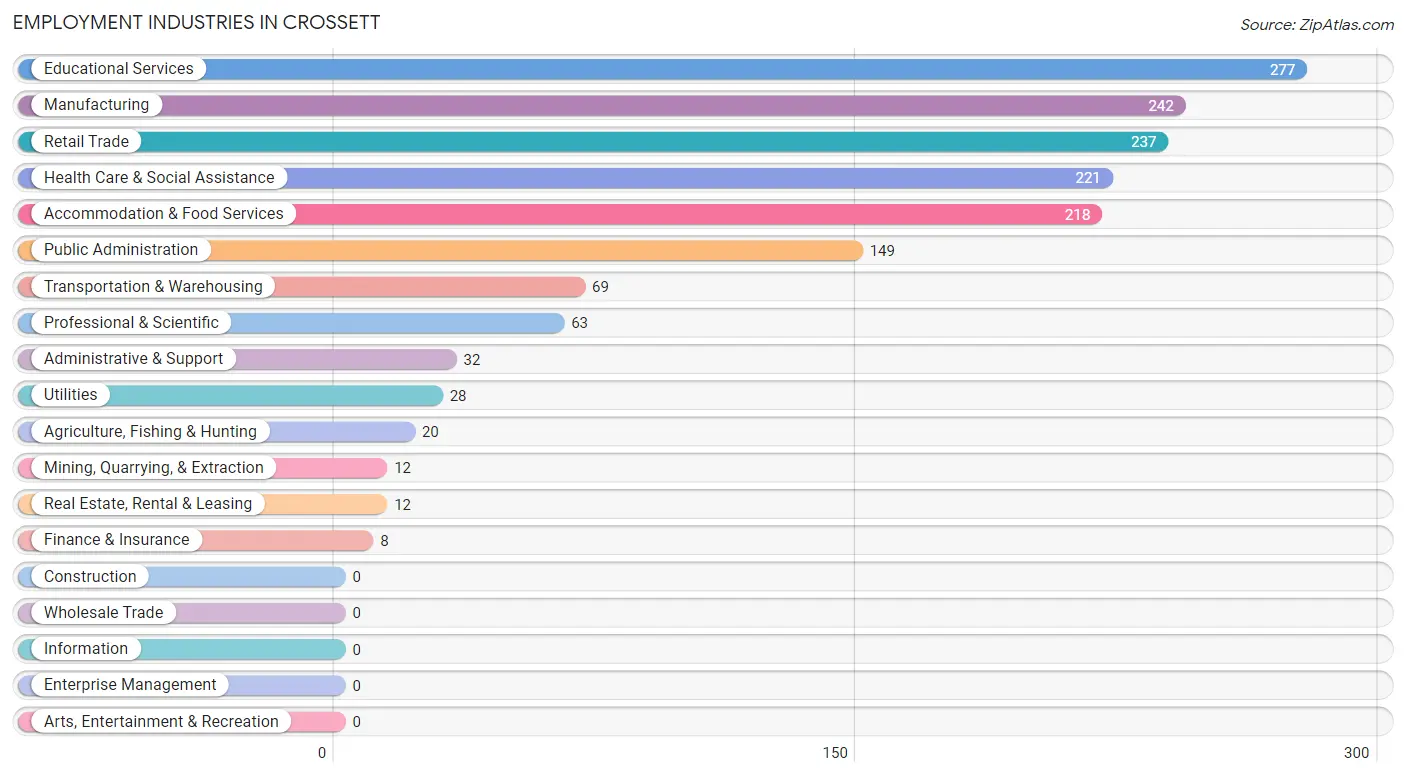
Employment Industries in Crossett
The major employment industries in Crossett include Educational Services (277 | 16.3%), Manufacturing (242 | 14.2%), Retail Trade (237 | 13.9%), Health Care & Social Assistance (221 | 13.0%), and Accommodation & Food Services (218 | 12.8%).
Employment Industries by Sex in Crossett
The Crossett industries that see more men than women are Mining, Quarrying, & Extraction (100.0%), Transportation & Warehousing (100.0%), and Utilities (100.0%), whereas the industries that tend to have a higher number of women are Agriculture, Fishing & Hunting (100.0%), Real Estate, Rental & Leasing (100.0%), and Professional & Scientific (100.0%).
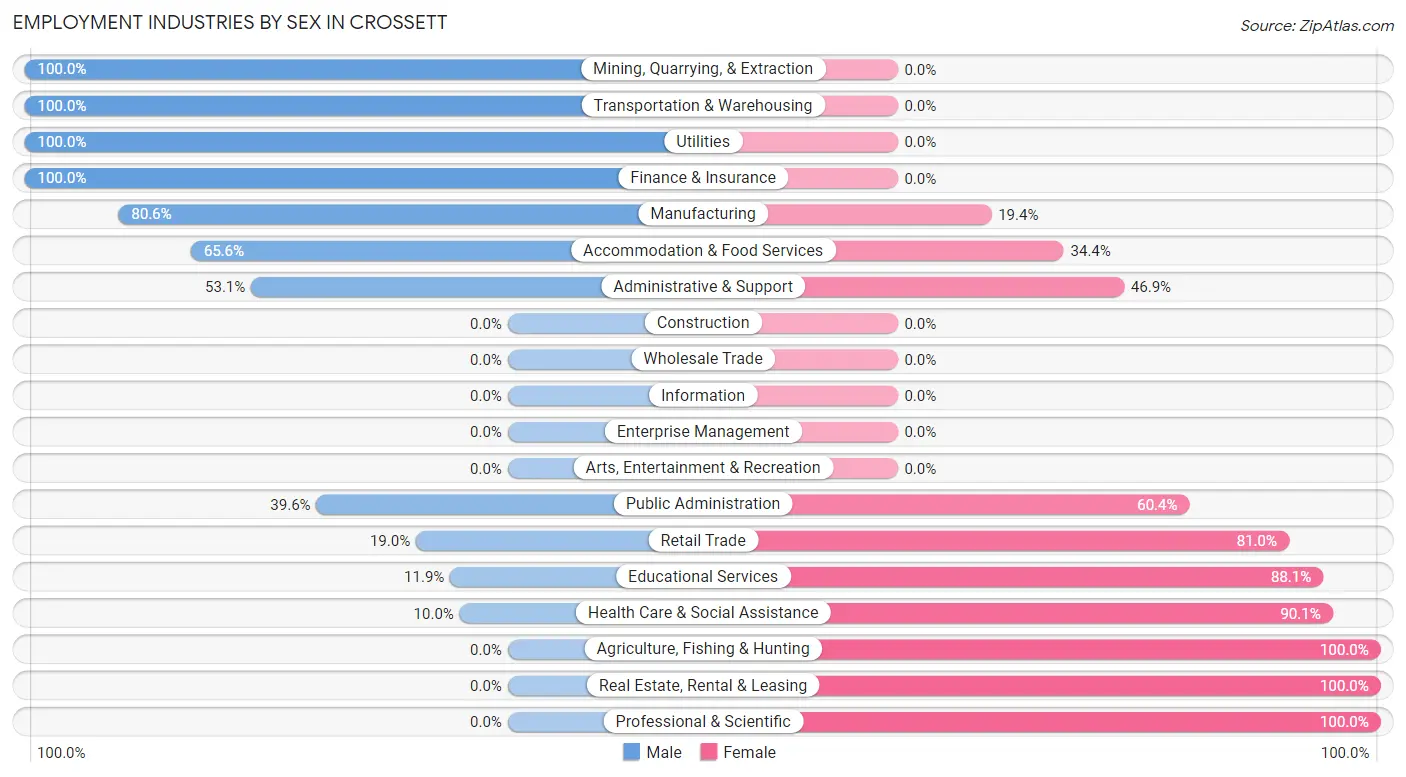
| Industry | Male | Female |
| Agriculture, Fishing & Hunting | 0 (0.0%) | 20 (100.0%) |
| Mining, Quarrying, & Extraction | 12 (100.0%) | 0 (0.0%) |
| Construction | 0 (0.0%) | 0 (0.0%) |
| Manufacturing | 195 (80.6%) | 47 (19.4%) |
| Wholesale Trade | 0 (0.0%) | 0 (0.0%) |
| Retail Trade | 45 (19.0%) | 192 (81.0%) |
| Transportation & Warehousing | 69 (100.0%) | 0 (0.0%) |
| Utilities | 28 (100.0%) | 0 (0.0%) |
| Information | 0 (0.0%) | 0 (0.0%) |
| Finance & Insurance | 8 (100.0%) | 0 (0.0%) |
| Real Estate, Rental & Leasing | 0 (0.0%) | 12 (100.0%) |
| Professional & Scientific | 0 (0.0%) | 63 (100.0%) |
| Enterprise Management | 0 (0.0%) | 0 (0.0%) |
| Administrative & Support | 17 (53.1%) | 15 (46.9%) |
| Educational Services | 33 (11.9%) | 244 (88.1%) |
| Health Care & Social Assistance | 22 (10.0%) | 199 (90.0%) |
| Arts, Entertainment & Recreation | 0 (0.0%) | 0 (0.0%) |
| Accommodation & Food Services | 143 (65.6%) | 75 (34.4%) |
| Public Administration | 59 (39.6%) | 90 (60.4%) |
| Total | 727 (42.7%) | 974 (57.3%) |
Education in Crossett
School Enrollment in Crossett
The most common levels of schooling among the 876 students in Crossett are middle school (330 | 37.7%), elementary school (187 | 21.3%), and high school (183 | 20.9%).
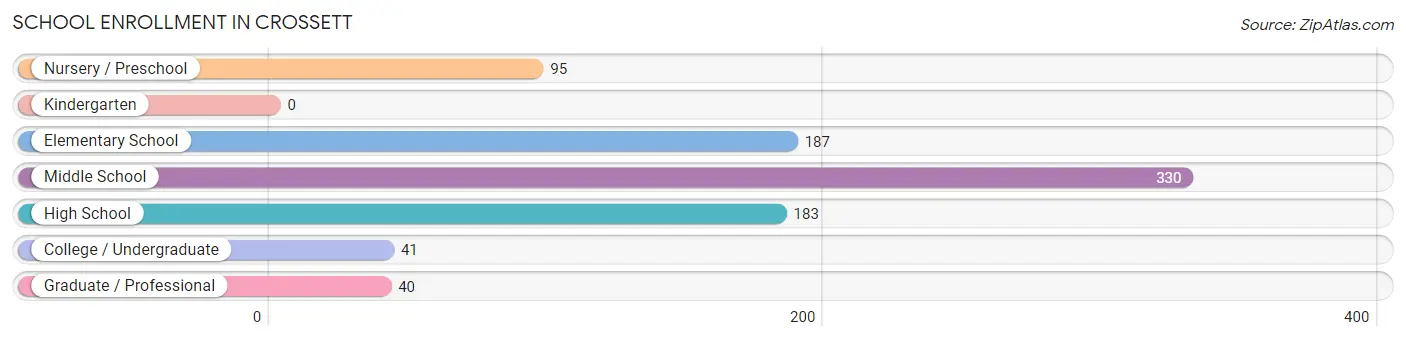
| School Level | # Students | % Students |
| Nursery / Preschool | 95 | 10.8% |
| Kindergarten | 0 | 0.0% |
| Elementary School | 187 | 21.3% |
| Middle School | 330 | 37.7% |
| High School | 183 | 20.9% |
| College / Undergraduate | 41 | 4.7% |
| Graduate / Professional | 40 | 4.6% |
| Total | 876 | 100.0% |
School Enrollment by Age by Funding Source in Crossett
Out of a total of 876 students who are enrolled in schools in Crossett, 13 (1.5%) attend a private institution, while the remaining 863 (98.5%) are enrolled in public schools. The age group of 35 years and over has the highest likelihood of being enrolled in private schools, with 13 (16.1% in the age bracket) enrolled. Conversely, the age group of 3 to 4 year olds has the lowest likelihood of being enrolled in a private school, with 50 (100.0% in the age bracket) attending a public institution.
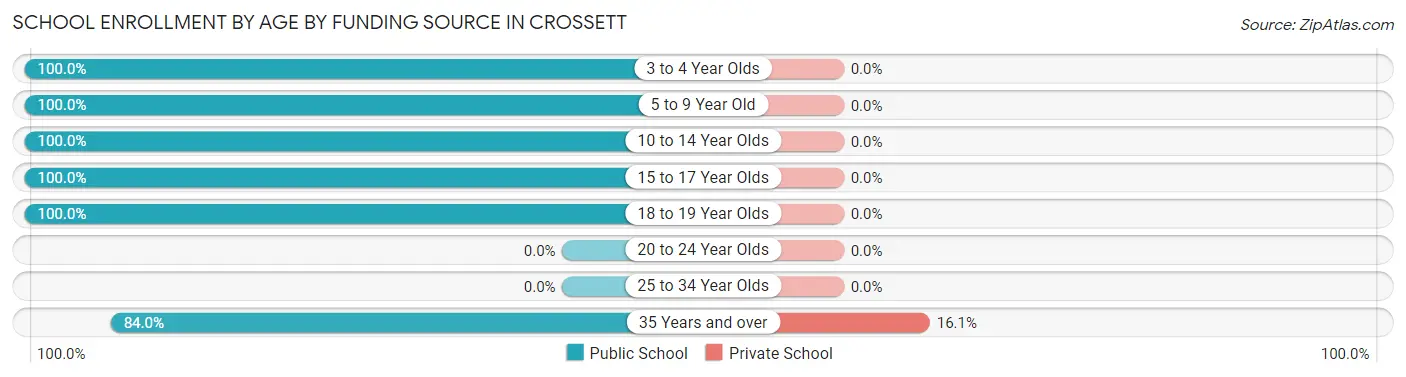
| Age Bracket | Public School | Private School |
| 3 to 4 Year Olds | 50 (100.0%) | 0 (0.0%) |
| 5 to 9 Year Old | 232 (100.0%) | 0 (0.0%) |
| 10 to 14 Year Olds | 297 (100.0%) | 0 (0.0%) |
| 15 to 17 Year Olds | 140 (100.0%) | 0 (0.0%) |
| 18 to 19 Year Olds | 76 (100.0%) | 0 (0.0%) |
| 20 to 24 Year Olds | 0 (0.0%) | 0 (0.0%) |
| 25 to 34 Year Olds | 0 (0.0%) | 0 (0.0%) |
| 35 Years and over | 68 (84.0%) | 13 (16.1%) |
| Total | 863 (98.5%) | 13 (1.5%) |
Educational Attainment by Field of Study in Crossett
Education (218 | 31.7%), business (166 | 24.2%), arts & humanities (57 | 8.3%), computers & mathematics (51 | 7.4%), and science & technology (43 | 6.3%) are the most common fields of study among 687 individuals in Crossett who have obtained a bachelor's degree or higher.
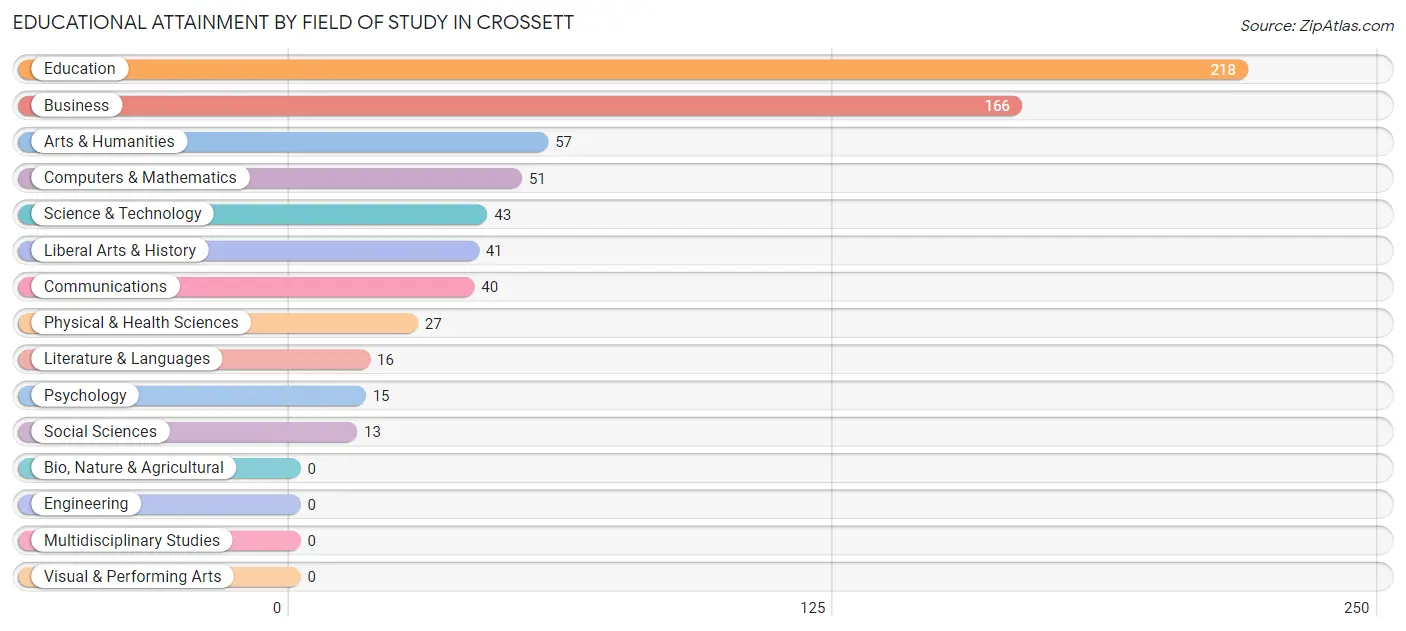
| Field of Study | # Graduates | % Graduates |
| Computers & Mathematics | 51 | 7.4% |
| Bio, Nature & Agricultural | 0 | 0.0% |
| Physical & Health Sciences | 27 | 3.9% |
| Psychology | 15 | 2.2% |
| Social Sciences | 13 | 1.9% |
| Engineering | 0 | 0.0% |
| Multidisciplinary Studies | 0 | 0.0% |
| Science & Technology | 43 | 6.3% |
| Business | 166 | 24.2% |
| Education | 218 | 31.7% |
| Literature & Languages | 16 | 2.3% |
| Liberal Arts & History | 41 | 6.0% |
| Visual & Performing Arts | 0 | 0.0% |
| Communications | 40 | 5.8% |
| Arts & Humanities | 57 | 8.3% |
| Total | 687 | 100.0% |
Transportation & Commute in Crossett
Vehicle Availability by Sex in Crossett
The most prevalent vehicle ownership categories in Crossett are males with 2 vehicles (265, accounting for 37.5%) and females with 2 vehicles (410, making up 27.2%).
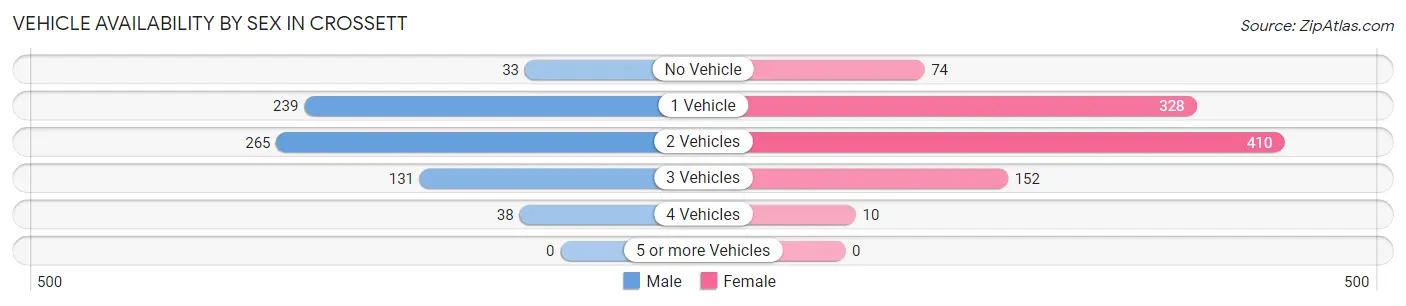
| Vehicles Available | Male | Female |
| No Vehicle | 33 (4.7%) | 74 (7.6%) |
| 1 Vehicle | 239 (33.9%) | 328 (33.7%) |
| 2 Vehicles | 265 (37.5%) | 410 (42.1%) |
| 3 Vehicles | 131 (18.6%) | 152 (15.6%) |
| 4 Vehicles | 38 (5.4%) | 10 (1.0%) |
| 5 or more Vehicles | 0 (0.0%) | 0 (0.0%) |
| Total | 706 (100.0%) | 974 (100.0%) |
Commute Time in Crossett
The most frequently occuring commute durations in Crossett are 5 to 9 minutes (595 commuters, 37.4%), less than 5 minutes (349 commuters, 21.9%), and 10 to 14 minutes (287 commuters, 18.0%).
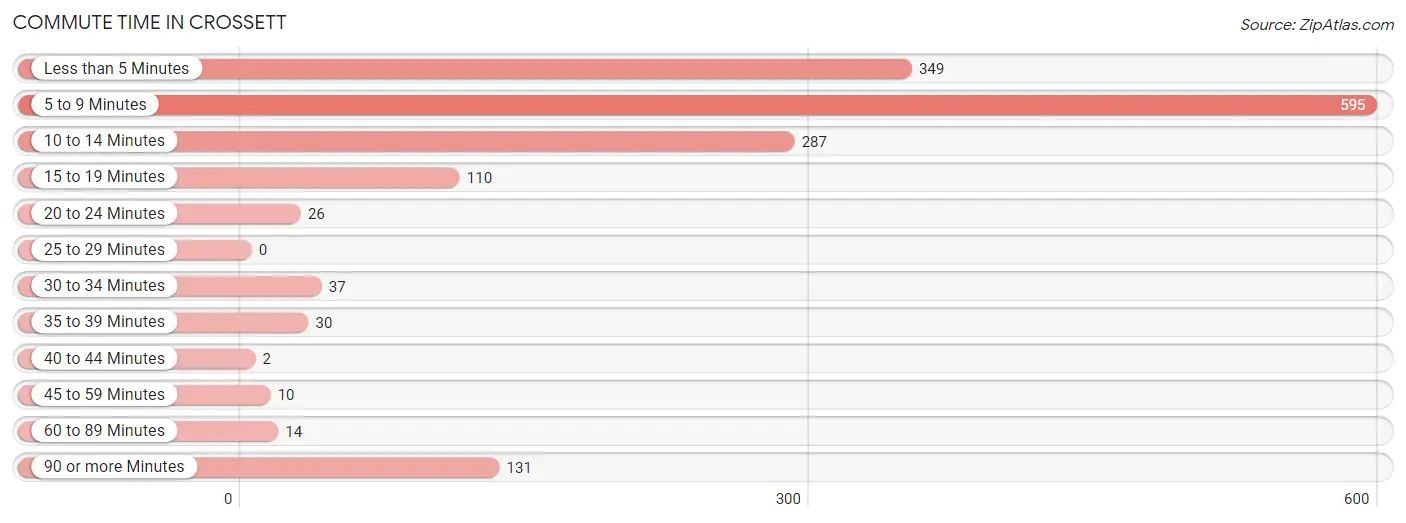
| Commute Time | # Commuters | % Commuters |
| Less than 5 Minutes | 349 | 21.9% |
| 5 to 9 Minutes | 595 | 37.4% |
| 10 to 14 Minutes | 287 | 18.0% |
| 15 to 19 Minutes | 110 | 6.9% |
| 20 to 24 Minutes | 26 | 1.6% |
| 25 to 29 Minutes | 0 | 0.0% |
| 30 to 34 Minutes | 37 | 2.3% |
| 35 to 39 Minutes | 30 | 1.9% |
| 40 to 44 Minutes | 2 | 0.1% |
| 45 to 59 Minutes | 10 | 0.6% |
| 60 to 89 Minutes | 14 | 0.9% |
| 90 or more Minutes | 131 | 8.2% |
Commute Time by Sex in Crossett
The most common commute times in Crossett are 5 to 9 minutes (243 commuters, 34.4%) for males and 5 to 9 minutes (352 commuters, 39.8%) for females.
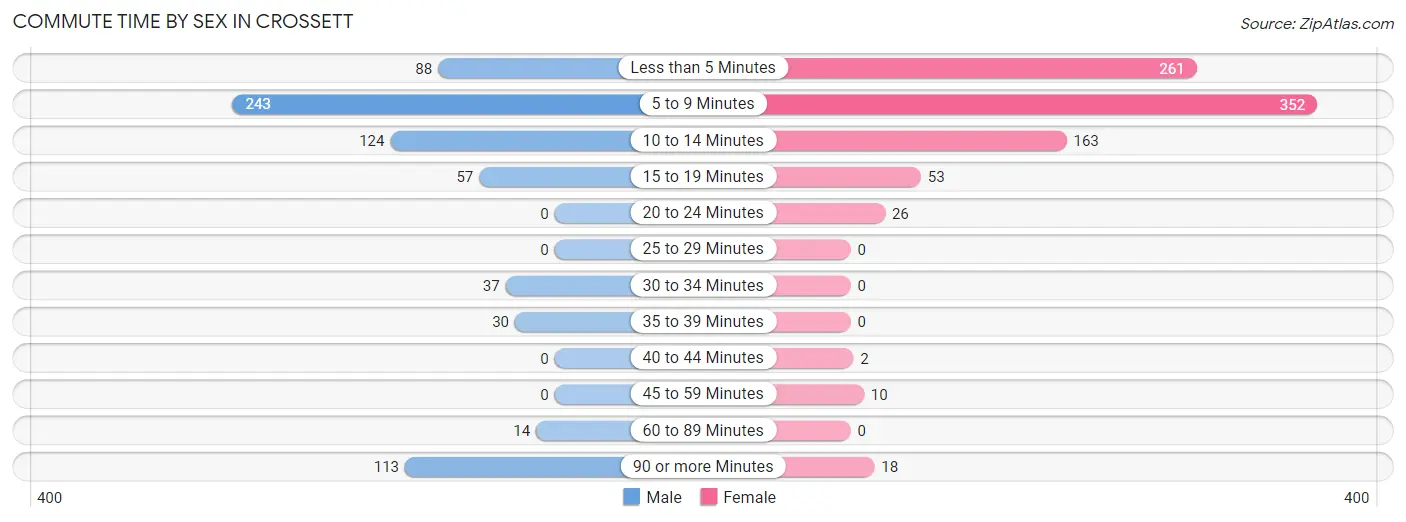
| Commute Time | Male | Female |
| Less than 5 Minutes | 88 (12.5%) | 261 (29.5%) |
| 5 to 9 Minutes | 243 (34.4%) | 352 (39.8%) |
| 10 to 14 Minutes | 124 (17.6%) | 163 (18.4%) |
| 15 to 19 Minutes | 57 (8.1%) | 53 (6.0%) |
| 20 to 24 Minutes | 0 (0.0%) | 26 (2.9%) |
| 25 to 29 Minutes | 0 (0.0%) | 0 (0.0%) |
| 30 to 34 Minutes | 37 (5.2%) | 0 (0.0%) |
| 35 to 39 Minutes | 30 (4.3%) | 0 (0.0%) |
| 40 to 44 Minutes | 0 (0.0%) | 2 (0.2%) |
| 45 to 59 Minutes | 0 (0.0%) | 10 (1.1%) |
| 60 to 89 Minutes | 14 (2.0%) | 0 (0.0%) |
| 90 or more Minutes | 113 (16.0%) | 18 (2.0%) |
Time of Departure to Work by Sex in Crossett
The most frequent times of departure to work in Crossett are 6:00 AM to 6:29 AM (286, 40.5%) for males and 7:00 AM to 7:29 AM (223, 25.2%) for females.
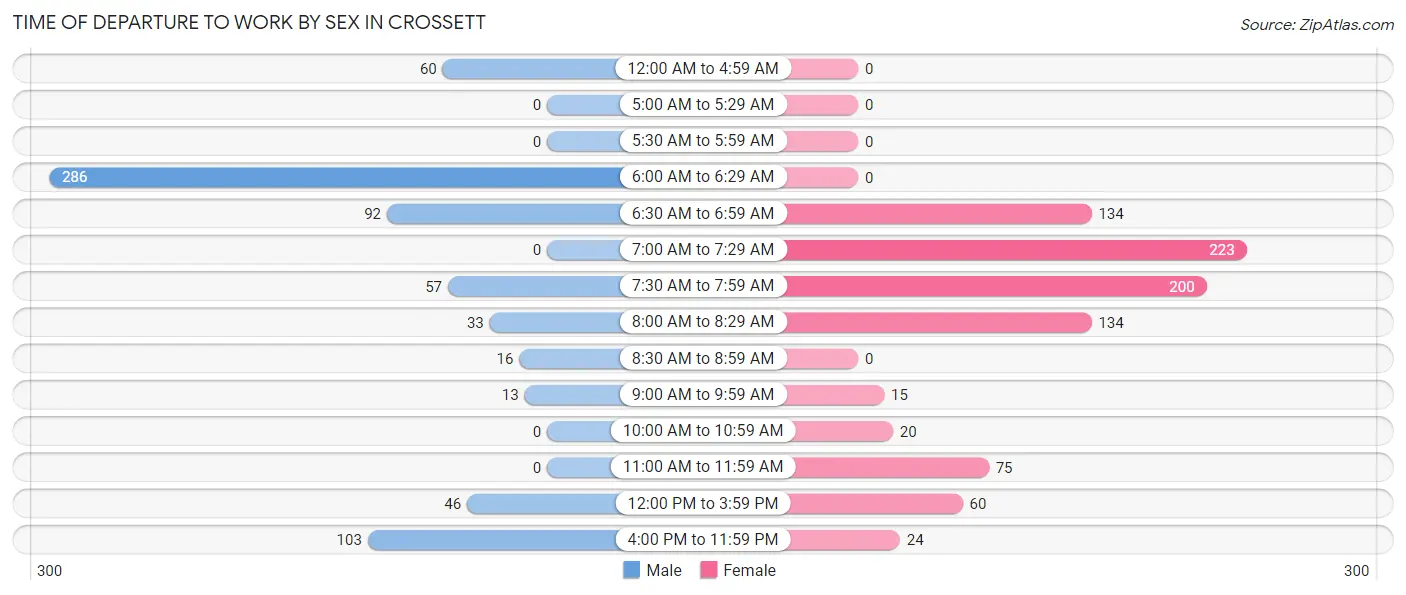
| Time of Departure | Male | Female |
| 12:00 AM to 4:59 AM | 60 (8.5%) | 0 (0.0%) |
| 5:00 AM to 5:29 AM | 0 (0.0%) | 0 (0.0%) |
| 5:30 AM to 5:59 AM | 0 (0.0%) | 0 (0.0%) |
| 6:00 AM to 6:29 AM | 286 (40.5%) | 0 (0.0%) |
| 6:30 AM to 6:59 AM | 92 (13.0%) | 134 (15.1%) |
| 7:00 AM to 7:29 AM | 0 (0.0%) | 223 (25.2%) |
| 7:30 AM to 7:59 AM | 57 (8.1%) | 200 (22.6%) |
| 8:00 AM to 8:29 AM | 33 (4.7%) | 134 (15.1%) |
| 8:30 AM to 8:59 AM | 16 (2.3%) | 0 (0.0%) |
| 9:00 AM to 9:59 AM | 13 (1.8%) | 15 (1.7%) |
| 10:00 AM to 10:59 AM | 0 (0.0%) | 20 (2.3%) |
| 11:00 AM to 11:59 AM | 0 (0.0%) | 75 (8.5%) |
| 12:00 PM to 3:59 PM | 46 (6.5%) | 60 (6.8%) |
| 4:00 PM to 11:59 PM | 103 (14.6%) | 24 (2.7%) |
| Total | 706 (100.0%) | 885 (100.0%) |
Housing Occupancy in Crossett
Occupancy by Ownership in Crossett
Of the total 2,073 dwellings in Crossett, owner-occupied units account for 1,227 (59.2%), while renter-occupied units make up 846 (40.8%).
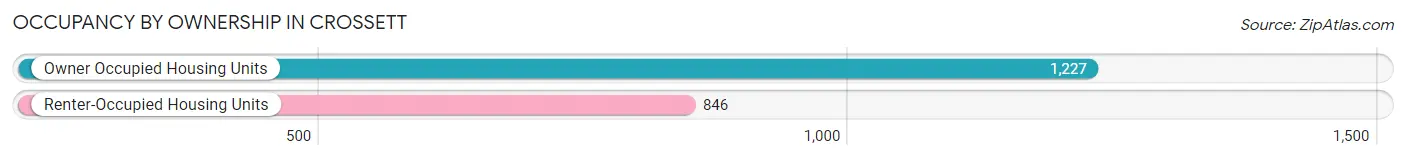
| Occupancy | # Housing Units | % Housing Units |
| Owner Occupied Housing Units | 1,227 | 59.2% |
| Renter-Occupied Housing Units | 846 | 40.8% |
| Total Occupied Housing Units | 2,073 | 100.0% |
Occupancy by Household Size in Crossett
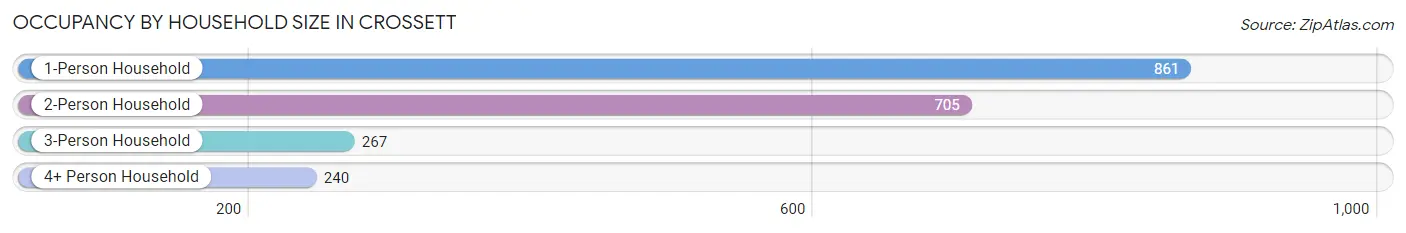
| Household Size | # Housing Units | % Housing Units |
| 1-Person Household | 861 | 41.5% |
| 2-Person Household | 705 | 34.0% |
| 3-Person Household | 267 | 12.9% |
| 4+ Person Household | 240 | 11.6% |
| Total Housing Units | 2,073 | 100.0% |
Occupancy by Ownership by Household Size in Crossett
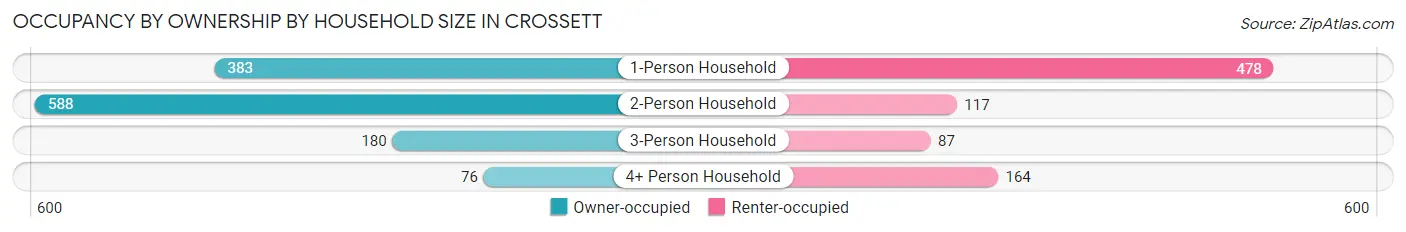
| Household Size | Owner-occupied | Renter-occupied |
| 1-Person Household | 383 (44.5%) | 478 (55.5%) |
| 2-Person Household | 588 (83.4%) | 117 (16.6%) |
| 3-Person Household | 180 (67.4%) | 87 (32.6%) |
| 4+ Person Household | 76 (31.7%) | 164 (68.3%) |
| Total Housing Units | 1,227 (59.2%) | 846 (40.8%) |
Occupancy by Educational Attainment in Crossett
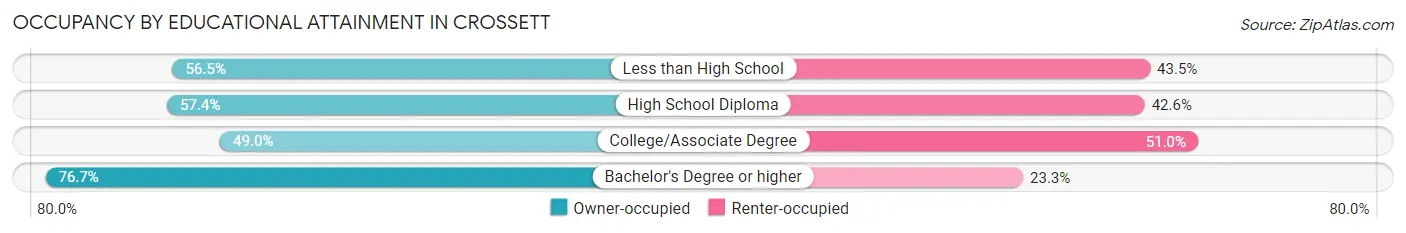
| Household Size | Owner-occupied | Renter-occupied |
| Less than High School | 134 (56.5%) | 103 (43.5%) |
| High School Diploma | 454 (57.4%) | 337 (42.6%) |
| College/Associate Degree | 287 (49.0%) | 299 (51.0%) |
| Bachelor's Degree or higher | 352 (76.7%) | 107 (23.3%) |
Occupancy by Age of Householder in Crossett
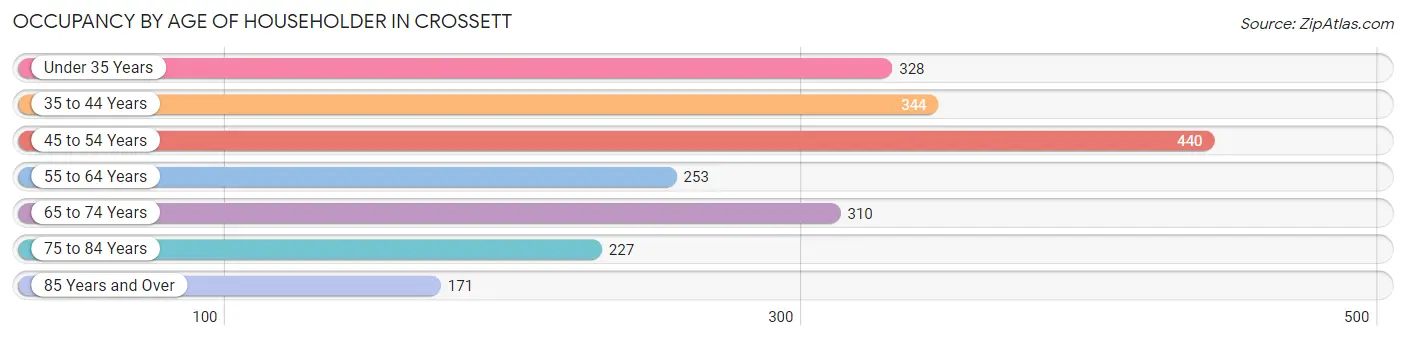
| Age Bracket | # Households | % Households |
| Under 35 Years | 328 | 15.8% |
| 35 to 44 Years | 344 | 16.6% |
| 45 to 54 Years | 440 | 21.2% |
| 55 to 64 Years | 253 | 12.2% |
| 65 to 74 Years | 310 | 14.9% |
| 75 to 84 Years | 227 | 11.0% |
| 85 Years and Over | 171 | 8.3% |
| Total | 2,073 | 100.0% |
Housing Finances in Crossett
Median Income by Occupancy in Crossett
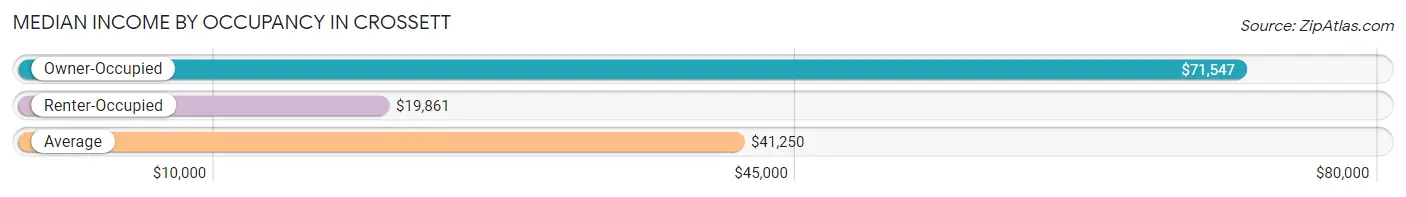
| Occupancy Type | # Households | Median Income |
| Owner-Occupied | 1,227 (59.2%) | $71,547 |
| Renter-Occupied | 846 (40.8%) | $19,861 |
| Average | 2,073 (100.0%) | $41,250 |
Occupancy by Householder Income Bracket in Crossett
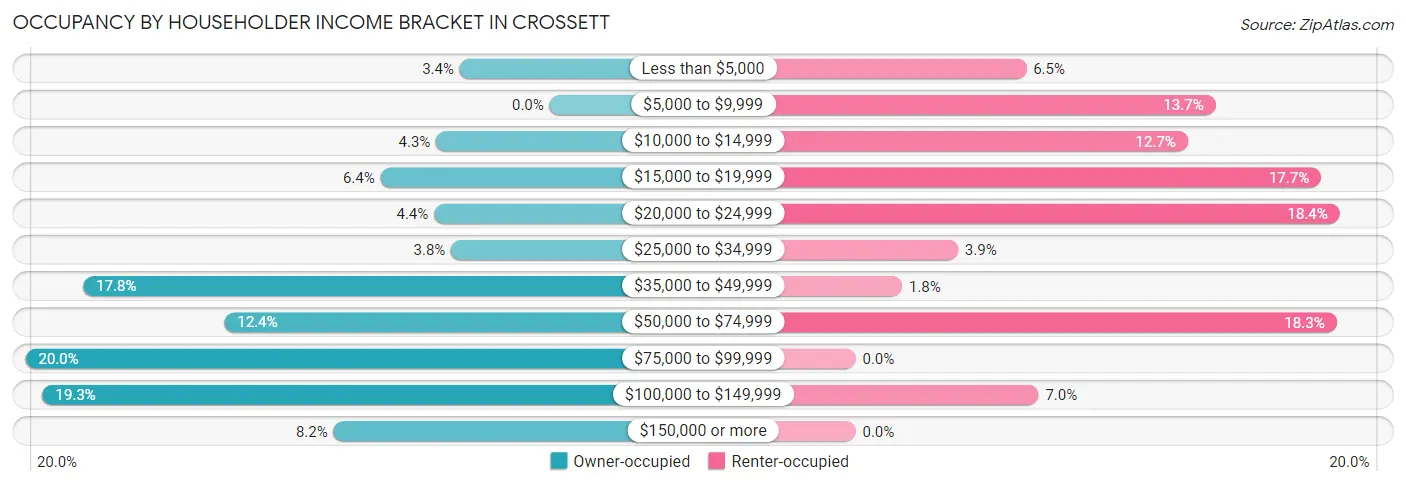
| Income Bracket | Owner-occupied | Renter-occupied |
| Less than $5,000 | 42 (3.4%) | 55 (6.5%) |
| $5,000 to $9,999 | 0 (0.0%) | 116 (13.7%) |
| $10,000 to $14,999 | 53 (4.3%) | 107 (12.7%) |
| $15,000 to $19,999 | 79 (6.4%) | 150 (17.7%) |
| $20,000 to $24,999 | 54 (4.4%) | 156 (18.4%) |
| $25,000 to $34,999 | 46 (3.7%) | 33 (3.9%) |
| $35,000 to $49,999 | 218 (17.8%) | 15 (1.8%) |
| $50,000 to $74,999 | 152 (12.4%) | 155 (18.3%) |
| $75,000 to $99,999 | 245 (20.0%) | 0 (0.0%) |
| $100,000 to $149,999 | 237 (19.3%) | 59 (7.0%) |
| $150,000 or more | 101 (8.2%) | 0 (0.0%) |
| Total | 1,227 (100.0%) | 846 (100.0%) |
Monthly Housing Cost Tiers in Crossett
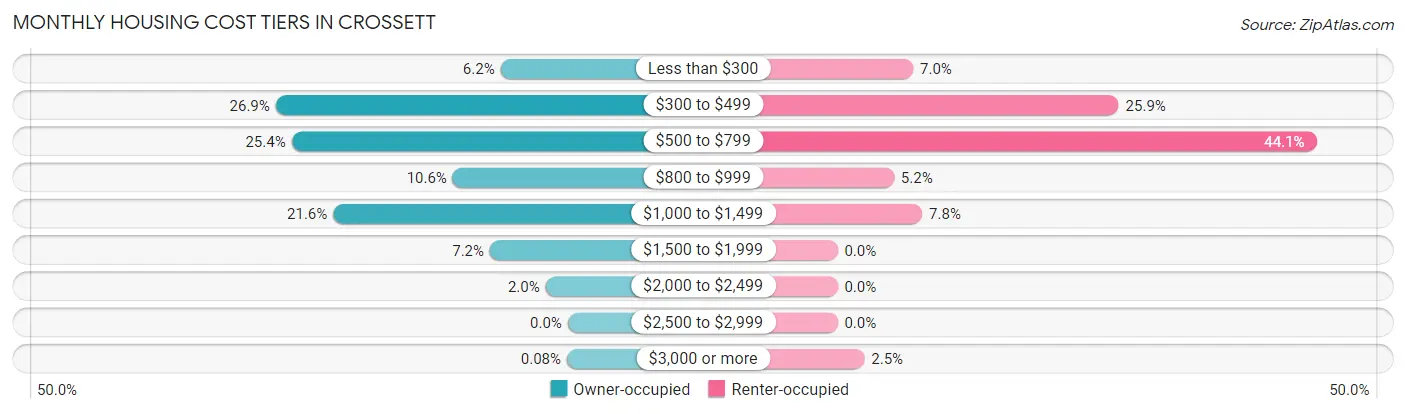
| Monthly Cost | Owner-occupied | Renter-occupied |
| Less than $300 | 76 (6.2%) | 59 (7.0%) |
| $300 to $499 | 330 (26.9%) | 219 (25.9%) |
| $500 to $799 | 312 (25.4%) | 373 (44.1%) |
| $800 to $999 | 130 (10.6%) | 44 (5.2%) |
| $1,000 to $1,499 | 265 (21.6%) | 66 (7.8%) |
| $1,500 to $1,999 | 88 (7.2%) | 0 (0.0%) |
| $2,000 to $2,499 | 25 (2.0%) | 0 (0.0%) |
| $2,500 to $2,999 | 0 (0.0%) | 0 (0.0%) |
| $3,000 or more | 1 (0.1%) | 21 (2.5%) |
| Total | 1,227 (100.0%) | 846 (100.0%) |
Physical Housing Characteristics in Crossett
Housing Structures in Crossett
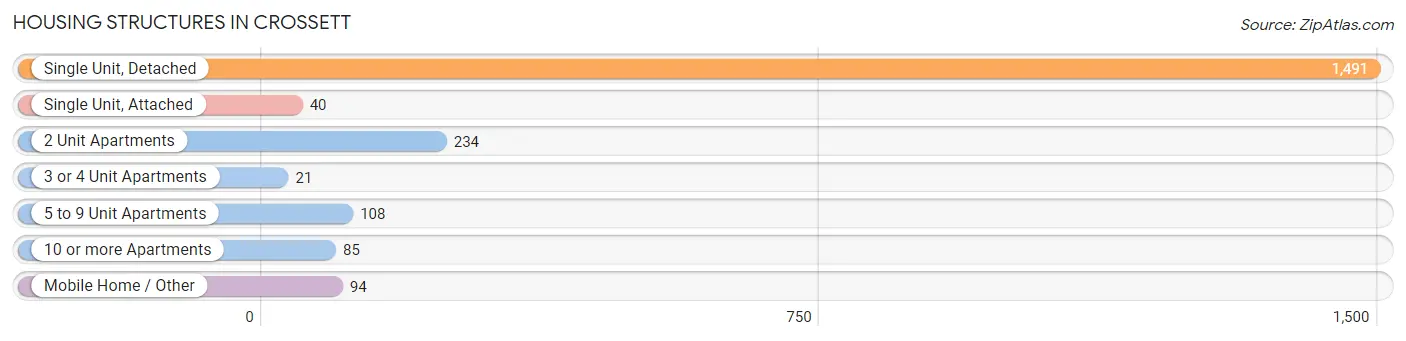
| Structure Type | # Housing Units | % Housing Units |
| Single Unit, Detached | 1,491 | 71.9% |
| Single Unit, Attached | 40 | 1.9% |
| 2 Unit Apartments | 234 | 11.3% |
| 3 or 4 Unit Apartments | 21 | 1.0% |
| 5 to 9 Unit Apartments | 108 | 5.2% |
| 10 or more Apartments | 85 | 4.1% |
| Mobile Home / Other | 94 | 4.5% |
| Total | 2,073 | 100.0% |
Housing Structures by Occupancy in Crossett
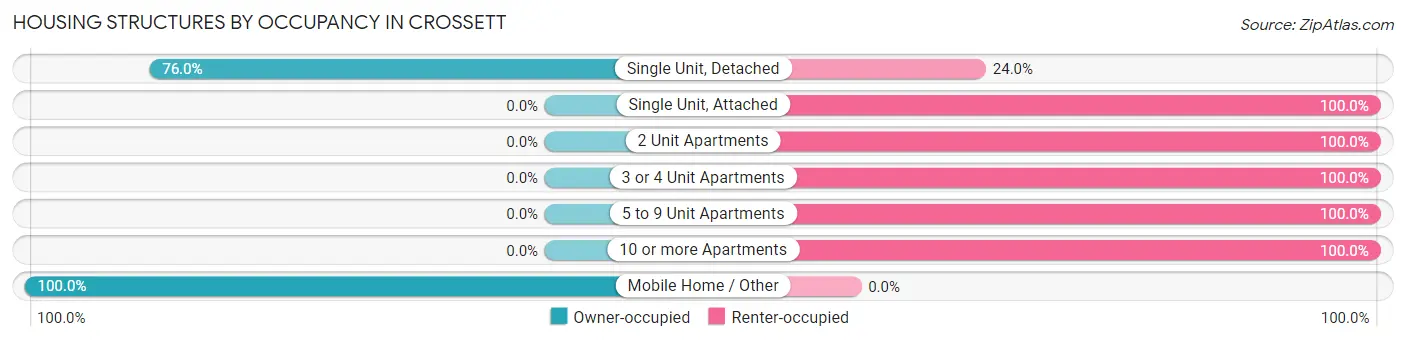
| Structure Type | Owner-occupied | Renter-occupied |
| Single Unit, Detached | 1,133 (76.0%) | 358 (24.0%) |
| Single Unit, Attached | 0 (0.0%) | 40 (100.0%) |
| 2 Unit Apartments | 0 (0.0%) | 234 (100.0%) |
| 3 or 4 Unit Apartments | 0 (0.0%) | 21 (100.0%) |
| 5 to 9 Unit Apartments | 0 (0.0%) | 108 (100.0%) |
| 10 or more Apartments | 0 (0.0%) | 85 (100.0%) |
| Mobile Home / Other | 94 (100.0%) | 0 (0.0%) |
| Total | 1,227 (59.2%) | 846 (40.8%) |
Housing Structures by Number of Rooms in Crossett
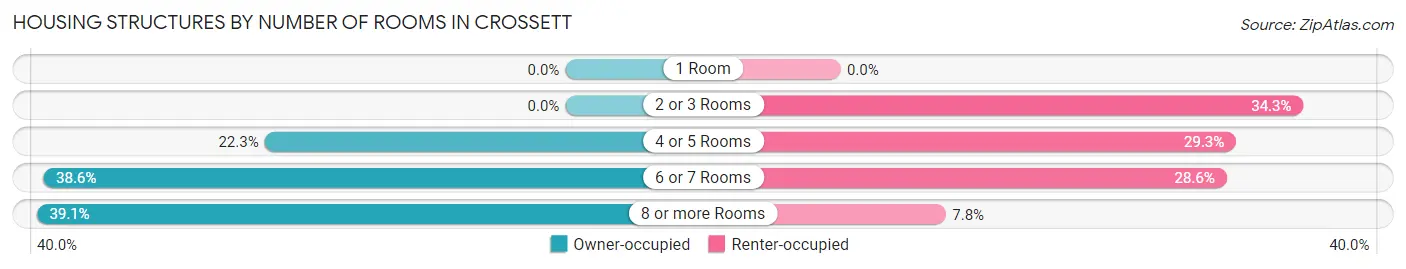
| Number of Rooms | Owner-occupied | Renter-occupied |
| 1 Room | 0 (0.0%) | 0 (0.0%) |
| 2 or 3 Rooms | 0 (0.0%) | 290 (34.3%) |
| 4 or 5 Rooms | 273 (22.3%) | 248 (29.3%) |
| 6 or 7 Rooms | 474 (38.6%) | 242 (28.6%) |
| 8 or more Rooms | 480 (39.1%) | 66 (7.8%) |
| Total | 1,227 (100.0%) | 846 (100.0%) |
Housing Structure by Heating Type in Crossett
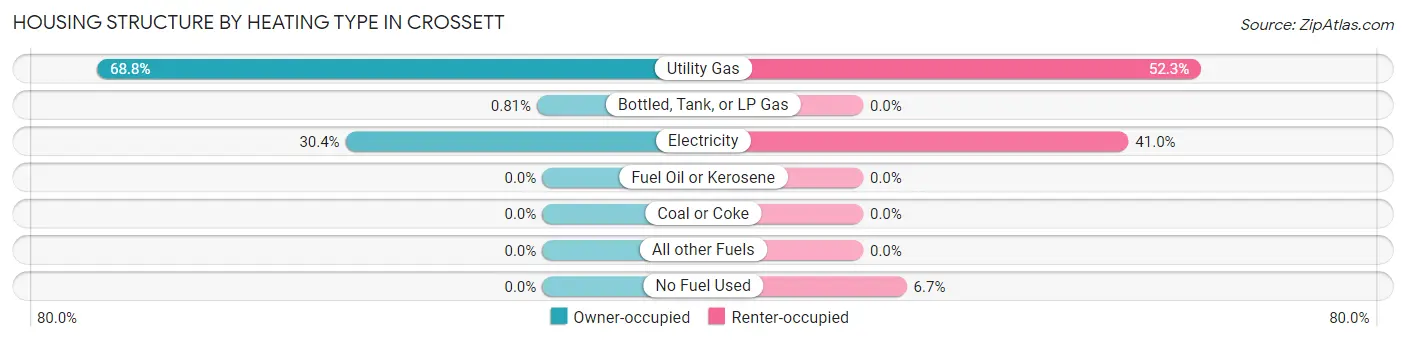
| Heating Type | Owner-occupied | Renter-occupied |
| Utility Gas | 844 (68.8%) | 442 (52.2%) |
| Bottled, Tank, or LP Gas | 10 (0.8%) | 0 (0.0%) |
| Electricity | 373 (30.4%) | 347 (41.0%) |
| Fuel Oil or Kerosene | 0 (0.0%) | 0 (0.0%) |
| Coal or Coke | 0 (0.0%) | 0 (0.0%) |
| All other Fuels | 0 (0.0%) | 0 (0.0%) |
| No Fuel Used | 0 (0.0%) | 57 (6.7%) |
| Total | 1,227 (100.0%) | 846 (100.0%) |
Household Vehicle Usage in Crossett
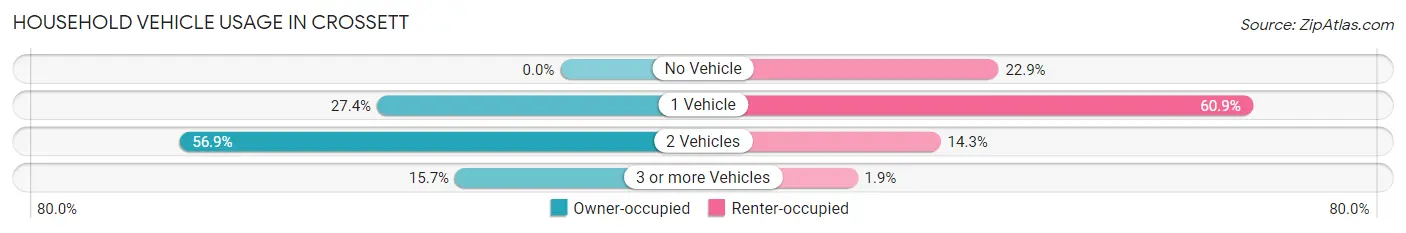
| Vehicles per Household | Owner-occupied | Renter-occupied |
| No Vehicle | 0 (0.0%) | 194 (22.9%) |
| 1 Vehicle | 336 (27.4%) | 515 (60.9%) |
| 2 Vehicles | 698 (56.9%) | 121 (14.3%) |
| 3 or more Vehicles | 193 (15.7%) | 16 (1.9%) |
| Total | 1,227 (100.0%) | 846 (100.0%) |
Real Estate & Mortgages in Crossett
Real Estate and Mortgage Overview in Crossett
| Characteristic | Without Mortgage | With Mortgage |
| Housing Units | 673 | 554 |
| Median Property Value | $84,600 | $122,600 |
| Median Household Income | $67,604 | $62 |
| Monthly Housing Costs | $436 | $0 |
| Real Estate Taxes | $586 | $19 |
Property Value by Mortgage Status in Crossett
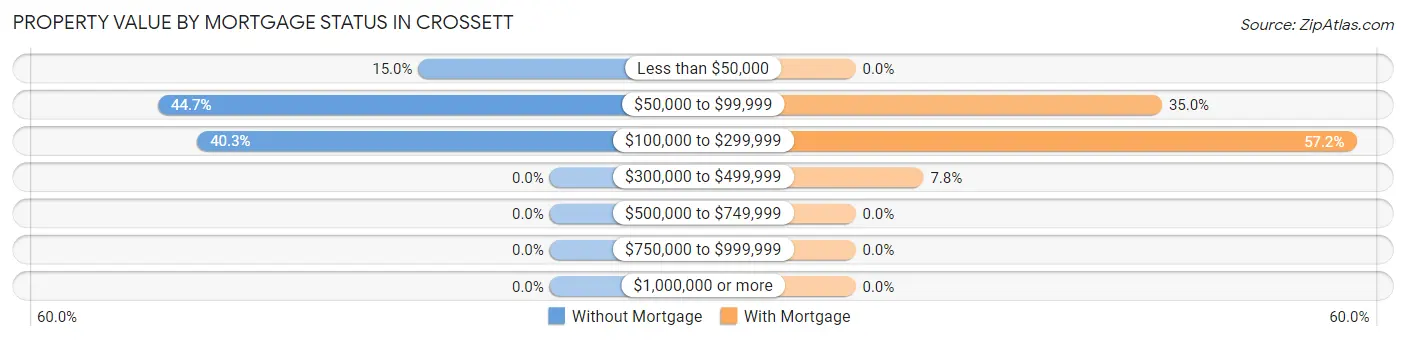
| Property Value | Without Mortgage | With Mortgage |
| Less than $50,000 | 101 (15.0%) | 0 (0.0%) |
| $50,000 to $99,999 | 301 (44.7%) | 194 (35.0%) |
| $100,000 to $299,999 | 271 (40.3%) | 317 (57.2%) |
| $300,000 to $499,999 | 0 (0.0%) | 43 (7.8%) |
| $500,000 to $749,999 | 0 (0.0%) | 0 (0.0%) |
| $750,000 to $999,999 | 0 (0.0%) | 0 (0.0%) |
| $1,000,000 or more | 0 (0.0%) | 0 (0.0%) |
| Total | 673 (100.0%) | 554 (100.0%) |
Household Income by Mortgage Status in Crossett
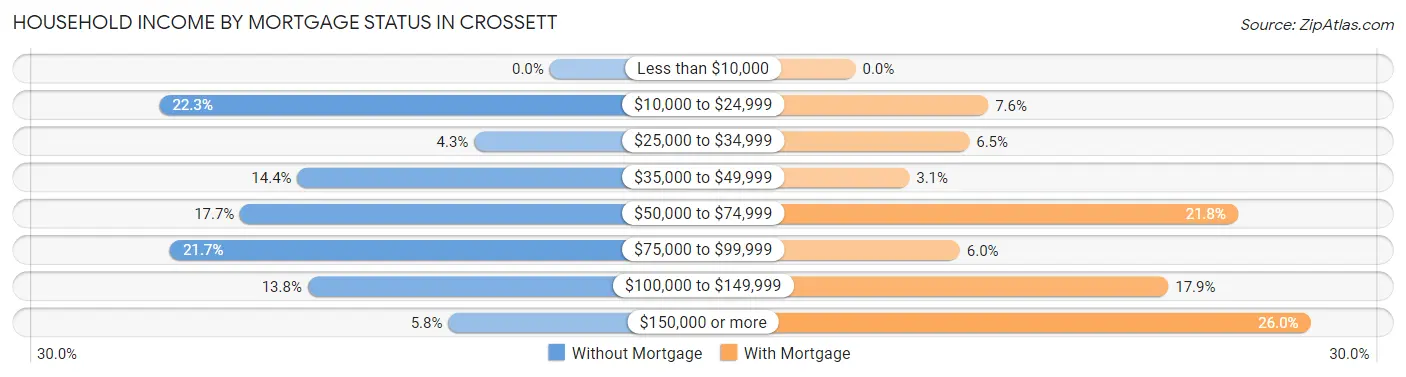
| Household Income | Without Mortgage | With Mortgage |
| Less than $10,000 | 0 (0.0%) | 0 (0.0%) |
| $10,000 to $24,999 | 150 (22.3%) | 42 (7.6%) |
| $25,000 to $34,999 | 29 (4.3%) | 36 (6.5%) |
| $35,000 to $49,999 | 97 (14.4%) | 17 (3.1%) |
| $50,000 to $74,999 | 119 (17.7%) | 121 (21.8%) |
| $75,000 to $99,999 | 146 (21.7%) | 33 (6.0%) |
| $100,000 to $149,999 | 93 (13.8%) | 99 (17.9%) |
| $150,000 or more | 39 (5.8%) | 144 (26.0%) |
| Total | 673 (100.0%) | 554 (100.0%) |
Property Value to Household Income Ratio in Crossett
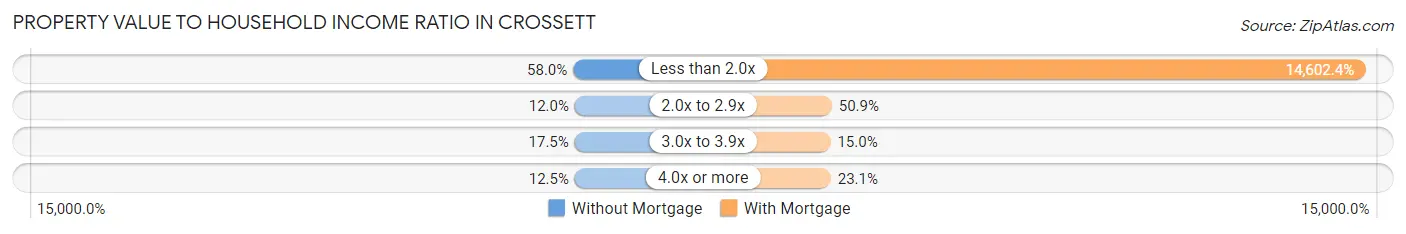
| Value-to-Income Ratio | Without Mortgage | With Mortgage |
| Less than 2.0x | 390 (58.0%) | 80,897 (14,602.4%) |
| 2.0x to 2.9x | 81 (12.0%) | 282 (50.9%) |
| 3.0x to 3.9x | 118 (17.5%) | 83 (15.0%) |
| 4.0x or more | 84 (12.5%) | 128 (23.1%) |
| Total | 673 (100.0%) | 554 (100.0%) |
Real Estate Taxes by Mortgage Status in Crossett
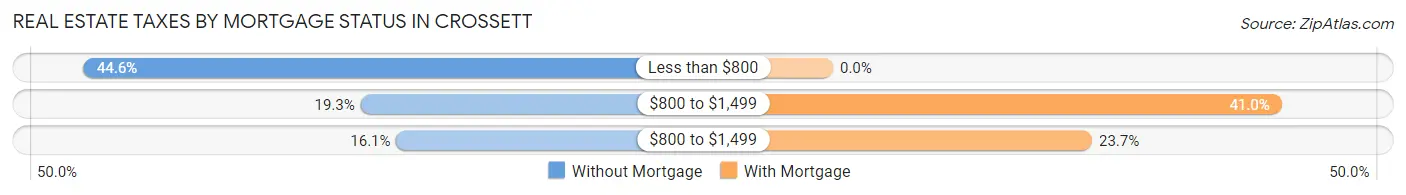
| Property Taxes | Without Mortgage | With Mortgage |
| Less than $800 | 300 (44.6%) | 0 (0.0%) |
| $800 to $1,499 | 130 (19.3%) | 227 (41.0%) |
| $800 to $1,499 | 108 (16.1%) | 131 (23.6%) |
| Total | 673 (100.0%) | 554 (100.0%) |
Health & Disability in Crossett
Health Insurance Coverage by Age in Crossett
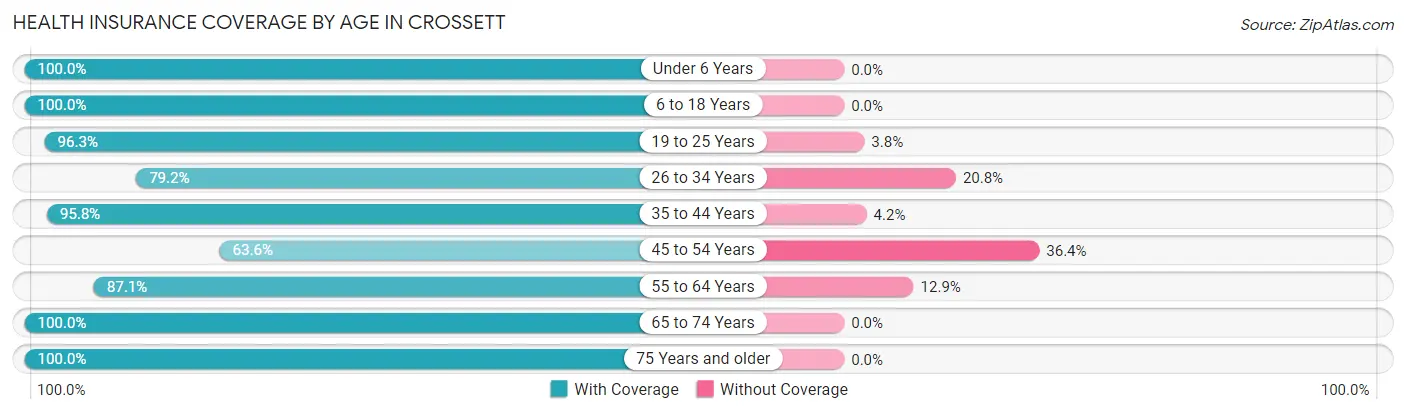
| Age Bracket | With Coverage | Without Coverage |
| Under 6 Years | 311 (100.0%) | 0 (0.0%) |
| 6 to 18 Years | 731 (100.0%) | 0 (0.0%) |
| 19 to 25 Years | 539 (96.3%) | 21 (3.7%) |
| 26 to 34 Years | 194 (79.2%) | 51 (20.8%) |
| 35 to 44 Years | 597 (95.8%) | 26 (4.2%) |
| 45 to 54 Years | 439 (63.6%) | 251 (36.4%) |
| 55 to 64 Years | 431 (87.1%) | 64 (12.9%) |
| 65 to 74 Years | 602 (100.0%) | 0 (0.0%) |
| 75 Years and older | 492 (100.0%) | 0 (0.0%) |
| Total | 4,336 (91.3%) | 413 (8.7%) |
Health Insurance Coverage by Citizenship Status in Crossett
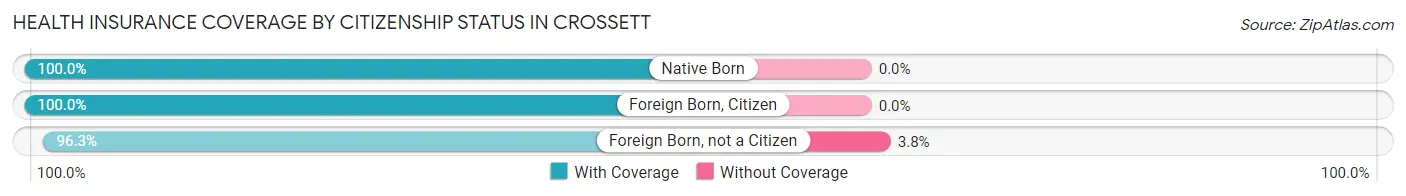
| Citizenship Status | With Coverage | Without Coverage |
| Native Born | 311 (100.0%) | 0 (0.0%) |
| Foreign Born, Citizen | 731 (100.0%) | 0 (0.0%) |
| Foreign Born, not a Citizen | 539 (96.3%) | 21 (3.7%) |
Health Insurance Coverage by Household Income in Crossett
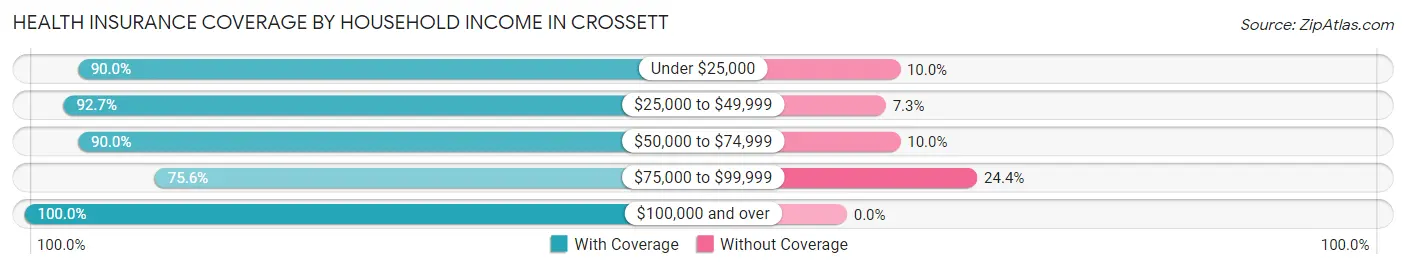
| Household Income | With Coverage | Without Coverage |
| Under $25,000 | 1,654 (90.0%) | 183 (10.0%) |
| $25,000 to $49,999 | 509 (92.7%) | 40 (7.3%) |
| $50,000 to $74,999 | 862 (90.0%) | 96 (10.0%) |
| $75,000 to $99,999 | 291 (75.6%) | 94 (24.4%) |
| $100,000 and over | 1,020 (100.0%) | 0 (0.0%) |
Public vs Private Health Insurance Coverage by Age in Crossett
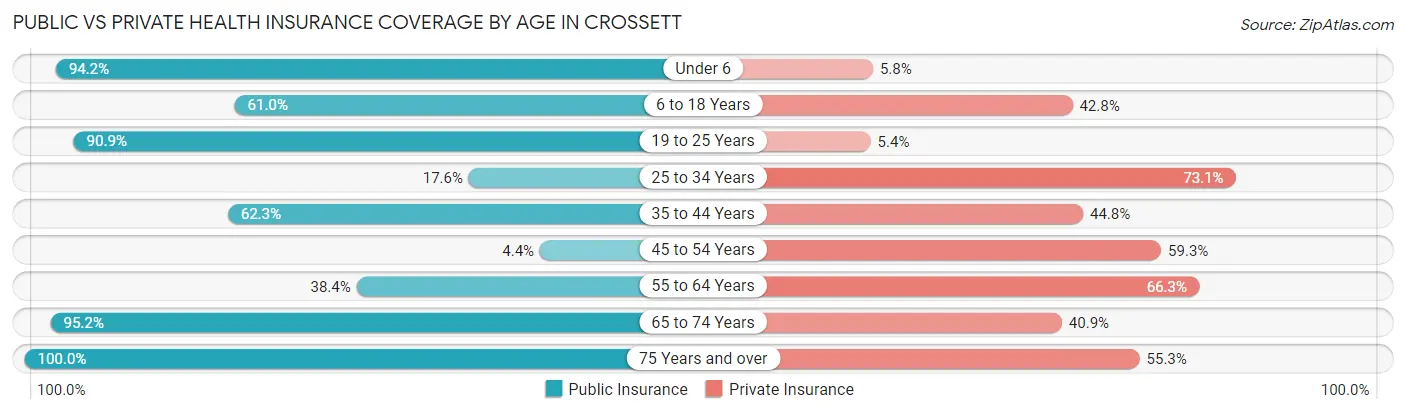
| Age Bracket | Public Insurance | Private Insurance |
| Under 6 | 293 (94.2%) | 18 (5.8%) |
| 6 to 18 Years | 446 (61.0%) | 313 (42.8%) |
| 19 to 25 Years | 509 (90.9%) | 30 (5.4%) |
| 25 to 34 Years | 43 (17.5%) | 179 (73.1%) |
| 35 to 44 Years | 388 (62.3%) | 279 (44.8%) |
| 45 to 54 Years | 30 (4.3%) | 409 (59.3%) |
| 55 to 64 Years | 190 (38.4%) | 328 (66.3%) |
| 65 to 74 Years | 573 (95.2%) | 246 (40.9%) |
| 75 Years and over | 492 (100.0%) | 272 (55.3%) |
| Total | 2,964 (62.4%) | 2,074 (43.7%) |
Disability Status by Sex by Age in Crossett
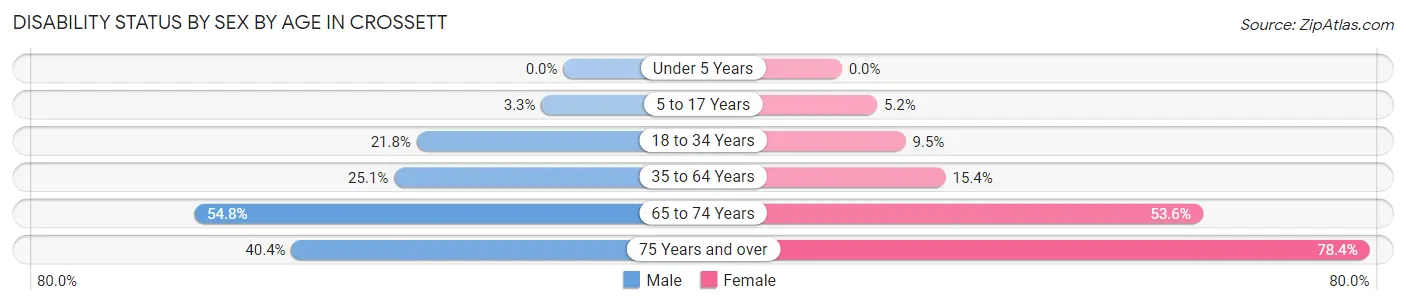
| Age Bracket | Male | Female |
| Under 5 Years | 0 (0.0%) | 0 (0.0%) |
| 5 to 17 Years | 6 (3.3%) | 27 (5.2%) |
| 18 to 34 Years | 93 (21.8%) | 43 (9.5%) |
| 35 to 64 Years | 236 (25.1%) | 134 (15.4%) |
| 65 to 74 Years | 199 (54.8%) | 128 (53.6%) |
| 75 Years and over | 42 (40.4%) | 304 (78.3%) |
Disability Class by Sex by Age in Crossett
Disability Class: Hearing Difficulty
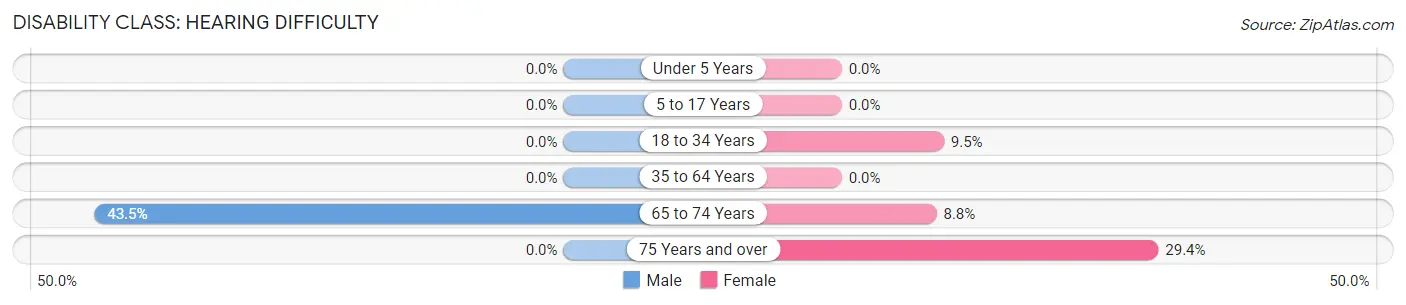
| Age Bracket | Male | Female |
| Under 5 Years | 0 (0.0%) | 0 (0.0%) |
| 5 to 17 Years | 0 (0.0%) | 0 (0.0%) |
| 18 to 34 Years | 0 (0.0%) | 43 (9.5%) |
| 35 to 64 Years | 0 (0.0%) | 0 (0.0%) |
| 65 to 74 Years | 158 (43.5%) | 21 (8.8%) |
| 75 Years and over | 0 (0.0%) | 114 (29.4%) |
Disability Class: Vision Difficulty
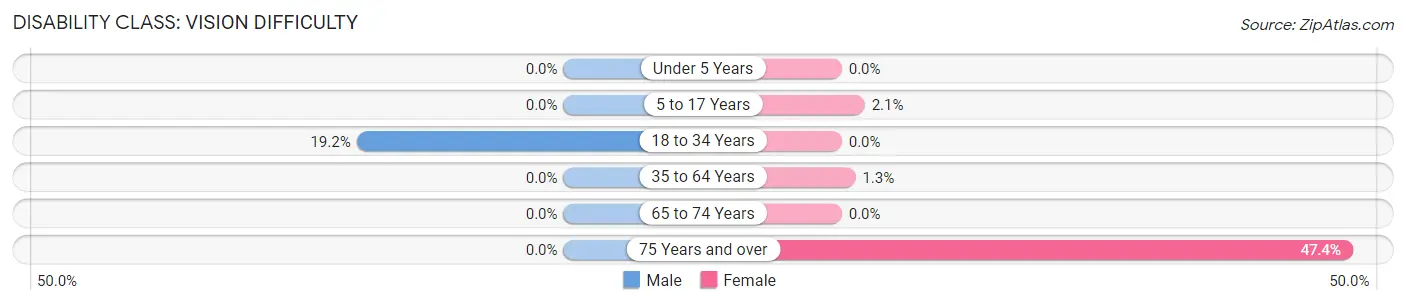
| Age Bracket | Male | Female |
| Under 5 Years | 0 (0.0%) | 0 (0.0%) |
| 5 to 17 Years | 0 (0.0%) | 11 (2.1%) |
| 18 to 34 Years | 82 (19.2%) | 0 (0.0%) |
| 35 to 64 Years | 0 (0.0%) | 11 (1.3%) |
| 65 to 74 Years | 0 (0.0%) | 0 (0.0%) |
| 75 Years and over | 0 (0.0%) | 184 (47.4%) |
Disability Class: Cognitive Difficulty
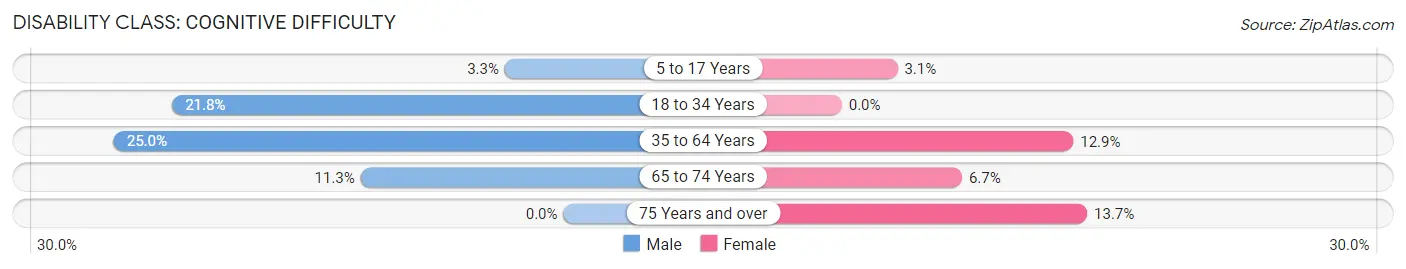
| Age Bracket | Male | Female |
| 5 to 17 Years | 6 (3.3%) | 16 (3.1%) |
| 18 to 34 Years | 93 (21.8%) | 0 (0.0%) |
| 35 to 64 Years | 235 (25.0%) | 112 (12.9%) |
| 65 to 74 Years | 41 (11.3%) | 16 (6.7%) |
| 75 Years and over | 0 (0.0%) | 53 (13.7%) |
Disability Class: Ambulatory Difficulty
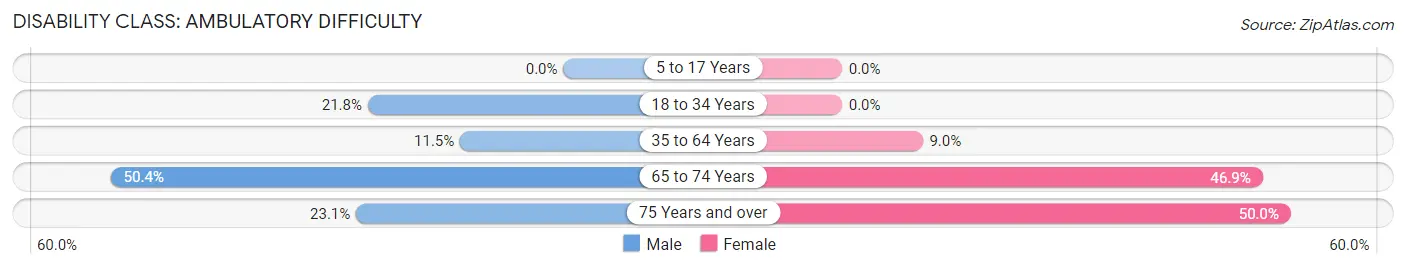
| Age Bracket | Male | Female |
| 5 to 17 Years | 0 (0.0%) | 0 (0.0%) |
| 18 to 34 Years | 93 (21.8%) | 0 (0.0%) |
| 35 to 64 Years | 108 (11.5%) | 78 (9.0%) |
| 65 to 74 Years | 183 (50.4%) | 112 (46.9%) |
| 75 Years and over | 24 (23.1%) | 194 (50.0%) |
Disability Class: Self-Care Difficulty
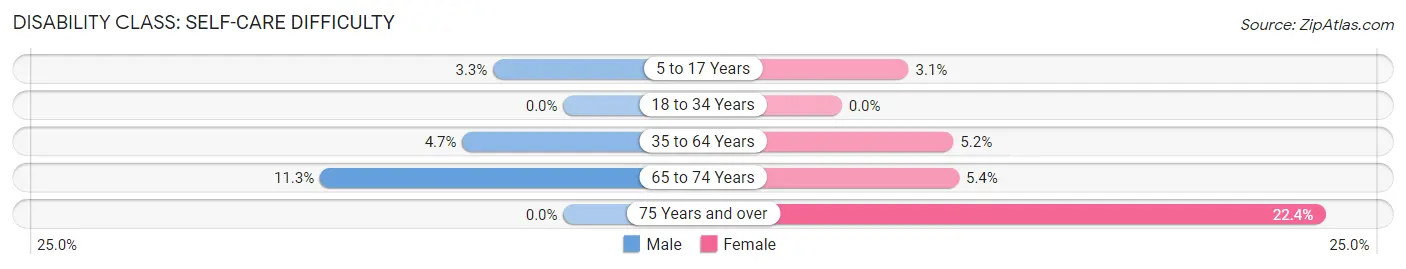
| Age Bracket | Male | Female |
| 5 to 17 Years | 6 (3.3%) | 16 (3.1%) |
| 18 to 34 Years | 0 (0.0%) | 0 (0.0%) |
| 35 to 64 Years | 44 (4.7%) | 45 (5.2%) |
| 65 to 74 Years | 41 (11.3%) | 13 (5.4%) |
| 75 Years and over | 0 (0.0%) | 87 (22.4%) |
Technology Access in Crossett
Computing Device Access in Crossett
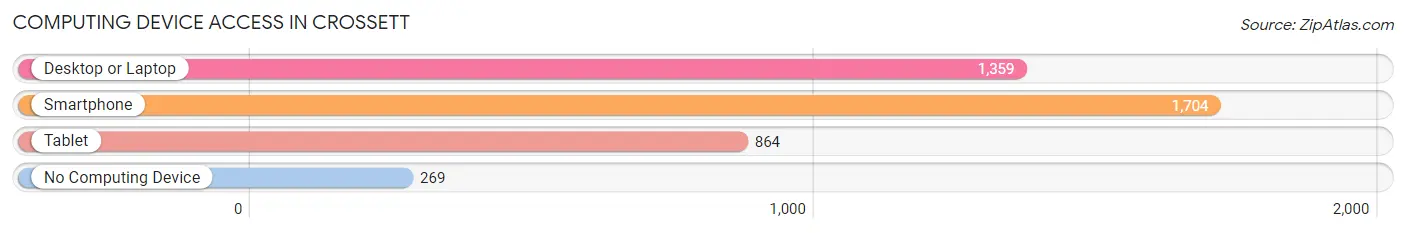
| Device Type | # Households | % Households |
| Desktop or Laptop | 1,359 | 65.6% |
| Smartphone | 1,704 | 82.2% |
| Tablet | 864 | 41.7% |
| No Computing Device | 269 | 13.0% |
| Total | 2,073 | 100.0% |
Internet Access in Crossett
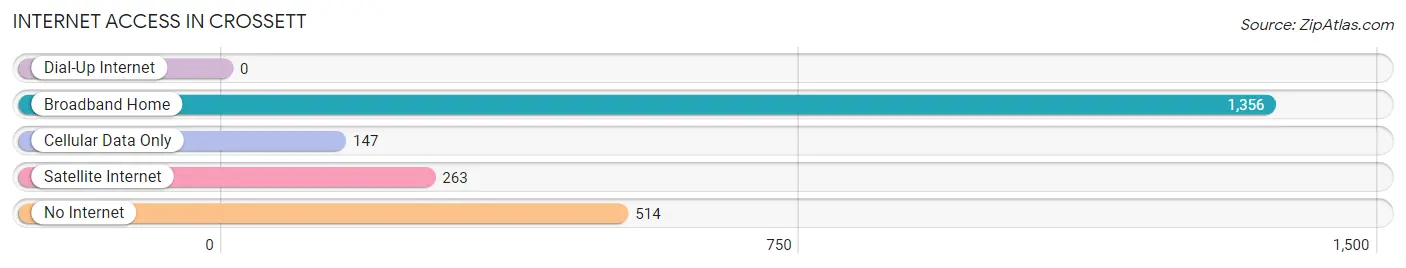
| Internet Type | # Households | % Households |
| Dial-Up Internet | 0 | 0.0% |
| Broadband Home | 1,356 | 65.4% |
| Cellular Data Only | 147 | 7.1% |
| Satellite Internet | 263 | 12.7% |
| No Internet | 514 | 24.8% |
| Total | 2,073 | 100.0% |
Crossett Summary
Crossett, Arkansas is a small town located in Ashley County in the southeastern corner of the state. It is situated on the banks of the Saline River, and is home to approximately 5,000 people. The town was founded in 1883 by the Crossett Lumber Company, and has since become a hub for the timber industry in the region.
Crossett is located in the heart of the Arkansas Timberlands, and is surrounded by vast forests of pine and hardwood trees. The town is situated at the intersection of U.S. Highway 82 and Arkansas Highway 133, and is approximately 90 miles south of Little Rock.
Crossett has a humid subtropical climate, with hot, humid summers and mild winters. The average annual temperature is around 64 degrees Fahrenheit, and the average annual precipitation is around 48 inches.
The economy of Crossett is largely based on the timber industry. The town is home to several lumber mills, and is a major supplier of timber products to the region. The town is also home to several manufacturing plants, including a paper mill, a furniture factory, and a plastics plant.
Crossett is served by the Ashley County School District, which includes two elementary schools, one middle school, and one high school. The town is also home to a branch of the University of Arkansas at Monticello.
The population of Crossett is approximately 5,000 people, with a median age of 38. The racial makeup of the town is approximately 75% white, 20% African American, and 5% other. The median household income is around $35,000, and the median home value is around $90,000.
Crossett is a small town with a rich history and a bright future. The town is home to a vibrant timber industry, and is a major supplier of timber products to the region. The town is also home to several manufacturing plants, and is served by the Ashley County School District. The town is a great place to live, work, and raise a family.
Common Questions
What is Per Capita Income in Crossett?
Per Capita income in Crossett is $34,231.
What is the Median Family Income in Crossett?
Median Family Income in Crossett is $64,531.
What is the Median Household income in Crossett?
Median Household Income in Crossett is $41,250.
What is Income or Wage Gap in Crossett?
Income or Wage Gap in Crossett is 51.7%.
Women in Crossett earn 48.3 cents for every dollar earned by a man.
What is Family Income Deficit in Crossett?
Family Income Deficit in Crossett is $11,180.
Families that are below poverty line in Crossett earn $11,180 less on average than the poverty threshold level.
What is Inequality or Gini Index in Crossett?
Inequality or Gini Index in Crossett is 0.61.
What is the Total Population of Crossett?
Total Population of Crossett is 4,805.
What is the Total Male Population of Crossett?
Total Male Population of Crossett is 2,130.
What is the Total Female Population of Crossett?
Total Female Population of Crossett is 2,675.
What is the Ratio of Males per 100 Females in Crossett?
There are 79.63 Males per 100 Females in Crossett.
What is the Ratio of Females per 100 Males in Crossett?
There are 125.59 Females per 100 Males in Crossett.
What is the Median Population Age in Crossett?
Median Population Age in Crossett is 43.6 Years.
What is the Average Family Size in Crossett
Average Family Size in Crossett is 3.2 People.
What is the Average Household Size in Crossett
Average Household Size in Crossett is 2.3 People.
How Large is the Labor Force in Crossett?
There are 1,783 People in the Labor Forcein in Crossett.
What is the Percentage of People in the Labor Force in Crossett?
45.1% of People are in the Labor Force in Crossett.
What is the Unemployment Rate in Crossett?
Unemployment Rate in Crossett is 4.6%.