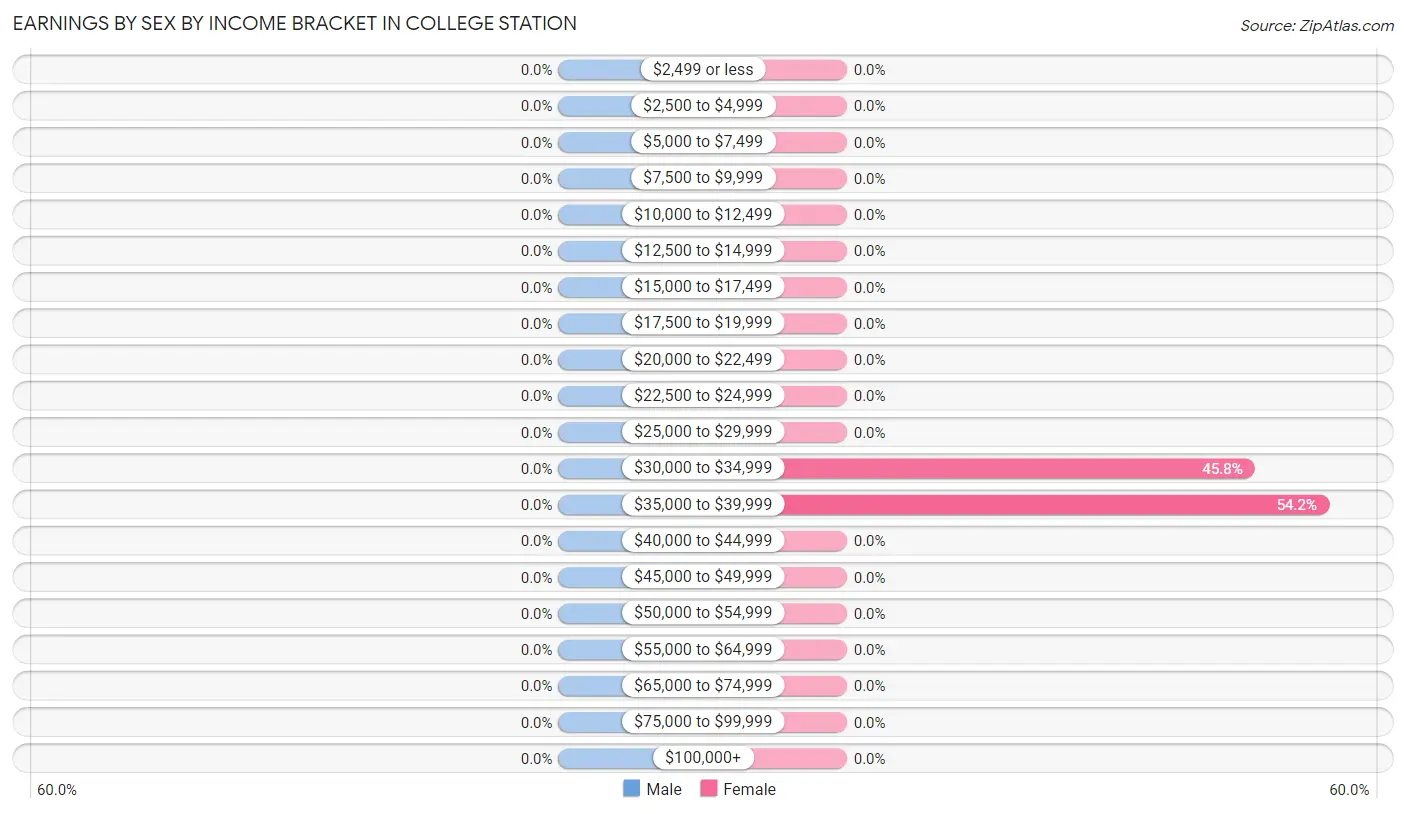
Earnings by Sex by Income Bracket in College Station
Income
Male
Female
$2,499 or less
0 (0.0%)
0 (0.0%)
$2,500 to $4,999
0 (0.0%)
0 (0.0%)
$5,000 to $7,499
0 (0.0%)
0 (0.0%)
$7,500 to $9,999
0 (0.0%)
0 (0.0%)
$10,000 to $12,499
0 (0.0%)
0 (0.0%)
$12,500 to $14,999
0 (0.0%)
0 (0.0%)
$15,000 to $17,499
0 (0.0%)
0 (0.0%)
$17,500 to $19,999
0 (0.0%)
0 (0.0%)
$20,000 to $22,499
0 (0.0%)
0 (0.0%)
$22,500 to $24,999
0 (0.0%)
0 (0.0%)
$25,000 to $29,999
0 (0.0%)
0 (0.0%)
$30,000 to $34,999
0 (0.0%)
77 (45.8%)
$35,000 to $39,999
0 (0.0%)
91 (54.2%)
$40,000 to $44,999
0 (0.0%)
0 (0.0%)
$45,000 to $49,999
0 (0.0%)
0 (0.0%)
$50,000 to $54,999
0 (0.0%)
0 (0.0%)
$55,000 to $64,999
0 (0.0%)
0 (0.0%)
$65,000 to $74,999
0 (0.0%)
0 (0.0%)
$75,000 to $99,999
0 (0.0%)
0 (0.0%)
$100,000+
0 (0.0%)
0 (0.0%)
Total
0 (0.0%)
168 (100.0%)
Earnings by Sex by Educational Attainment in College Station
Educational Attainment
Male Income
Female Income
Less than High School
-
-
High School Diploma
-
-
College or Associate's Degree
-
-
Bachelor's Degree
-
-
Graduate Degree
-
-
Total
-
-
Family Income in College Station
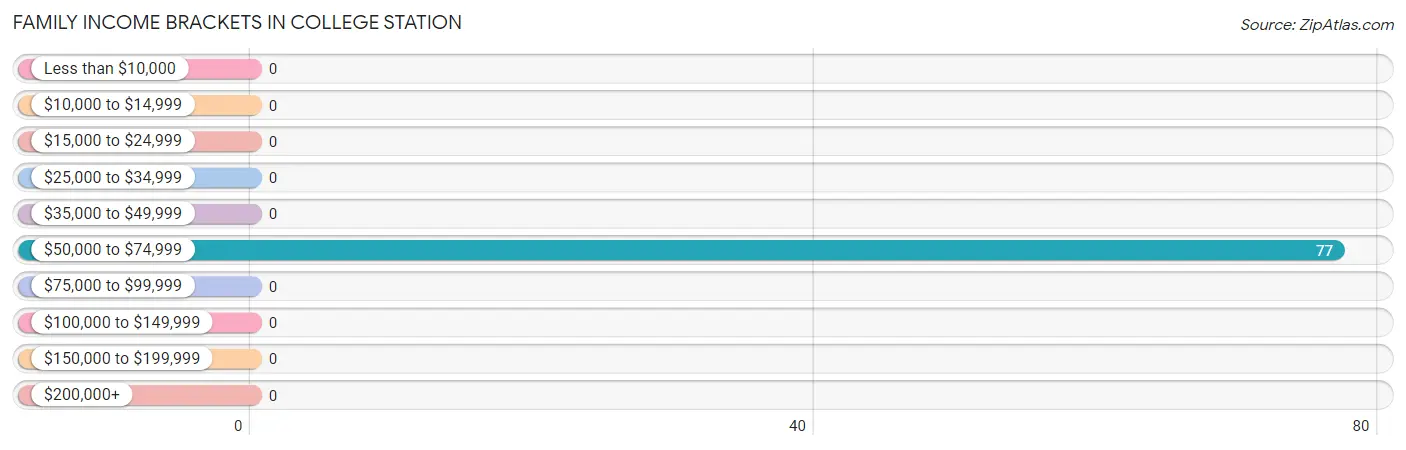
Family Income Brackets in College Station
According to the College Station family income data, there are 77 families falling into the $50,000 to $74,999 income range, which is the most common income bracket and makes up 100.0% of all families.
Income Bracket
# Families
% Families
Less than $10,000
0
0.0%
$10,000 to $14,999
0
0.0%
$15,000 to $24,999
0
0.0%
$25,000 to $34,999
0
0.0%
$35,000 to $49,999
0
0.0%
$50,000 to $74,999
77
100.0%
$75,000 to $99,999
0
0.0%
$100,000 to $149,999
0
0.0%
$150,000 to $199,999
0
0.0%
$200,000+
0
0.0%
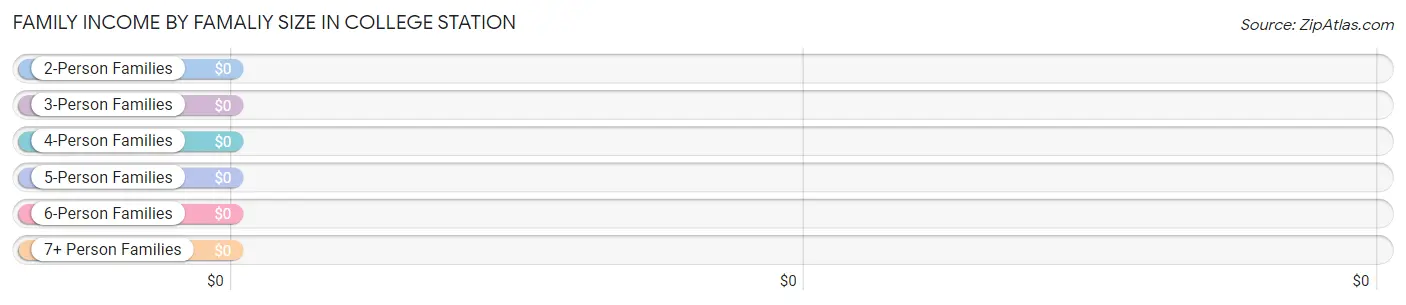
Family Income by Famaliy Size in College Station
Income Bracket
# Families
Median Income
2-Person Families
77 (100.0%)
$0
3-Person Families
0 (0.0%)
$0
4-Person Families
0 (0.0%)
$0
5-Person Families
0 (0.0%)
$0
6-Person Families
0 (0.0%)
$0
7+ Person Families
0 (0.0%)
$0
Total
77 (100.0%)
$0
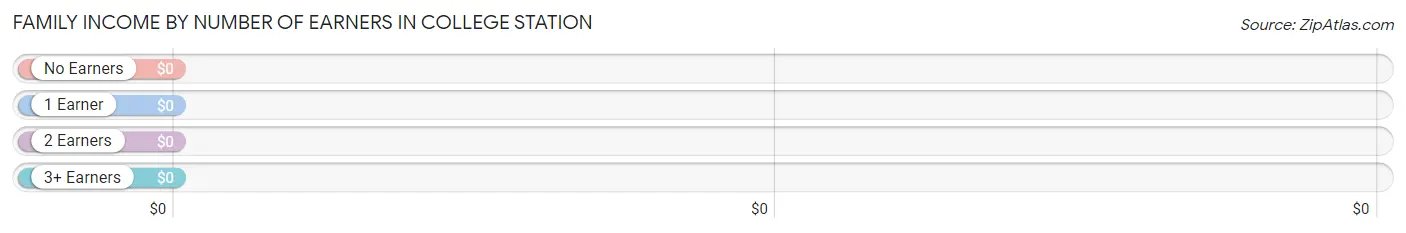
Family Income by Number of Earners in College Station
Number of Earners
# Families
Median Income
No Earners
0 (0.0%)
$0
1 Earner
0 (0.0%)
$0
2 Earners
77 (100.0%)
$0
3+ Earners
0 (0.0%)
$0
Total
77 (100.0%)
$0
Household Income in College Station
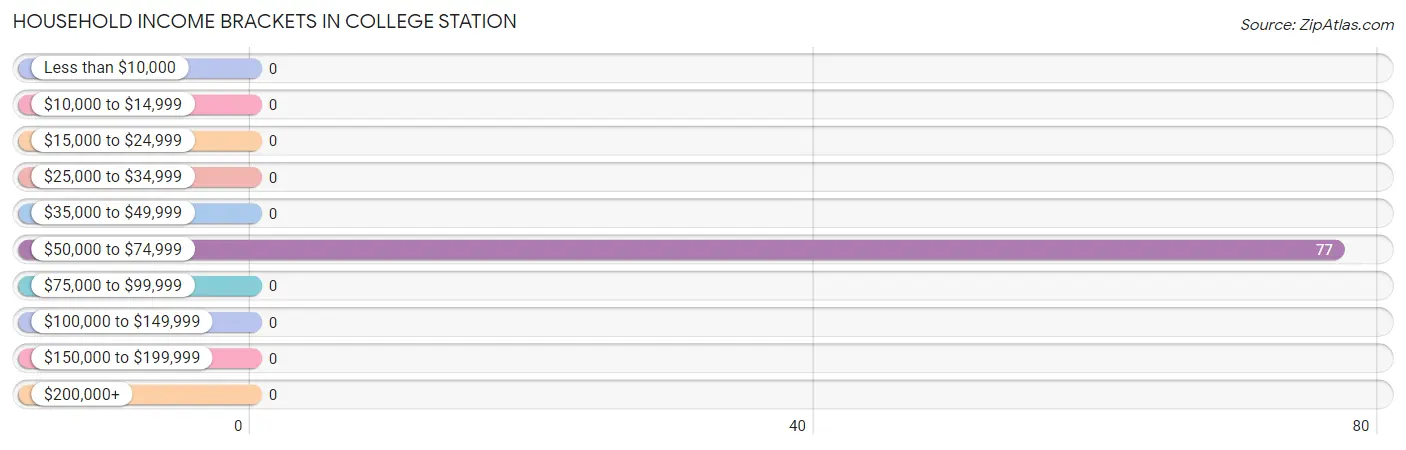
Household Income Brackets in College Station
With 77 households falling in the category, the $50,000 to $74,999 income range is the most frequent in College Station, accounting for 100.0% of all households.
Income Bracket
# Households
% Households
Less than $10,000
0
0.0%
$10,000 to $14,999
0
0.0%
$15,000 to $24,999
0
0.0%
$25,000 to $34,999
0
0.0%
$35,000 to $49,999
0
0.0%
$50,000 to $74,999
77
100.0%
$75,000 to $99,999
0
0.0%
$100,000 to $149,999
0
0.0%
$150,000 to $199,999
0
0.0%
$200,000+
0
0.0%
Household Income by Householder Age in College Station
Income Bracket
# Households
Median Income
15 to 24 Years
0 (0.0%)
$0
25 to 44 Years
77 (100.0%)
$0
45 to 64 Years
0 (0.0%)
$0
65+ Years
0 (0.0%)
$0
Total
77 (100.0%)
$0
Poverty in College Station
Income Below Poverty by Sex and Age in College Station
Age Bracket
Male
Female
Under 5 Years
0 (0.0%)
0 (0.0%)
5 Years
0 (0.0%)
0 (0.0%)
6 to 11 Years
0 (0.0%)
0 (0.0%)
12 to 14 Years
0 (0.0%)
0 (0.0%)
15 Years
0 (0.0%)
0 (0.0%)
16 and 17 Years
0 (0.0%)
0 (0.0%)
18 to 24 Years
0 (0.0%)
0 (0.0%)
25 to 34 Years
0 (0.0%)
0 (0.0%)
35 to 44 Years
0 (0.0%)
0 (0.0%)
45 to 54 Years
0 (0.0%)
0 (0.0%)
55 to 64 Years
0 (0.0%)
0 (0.0%)
65 to 74 Years
0 (0.0%)
0 (0.0%)
75 Years and over
0 (0.0%)
0 (0.0%)
Total
0 (0.0%)
0 (0.0%)
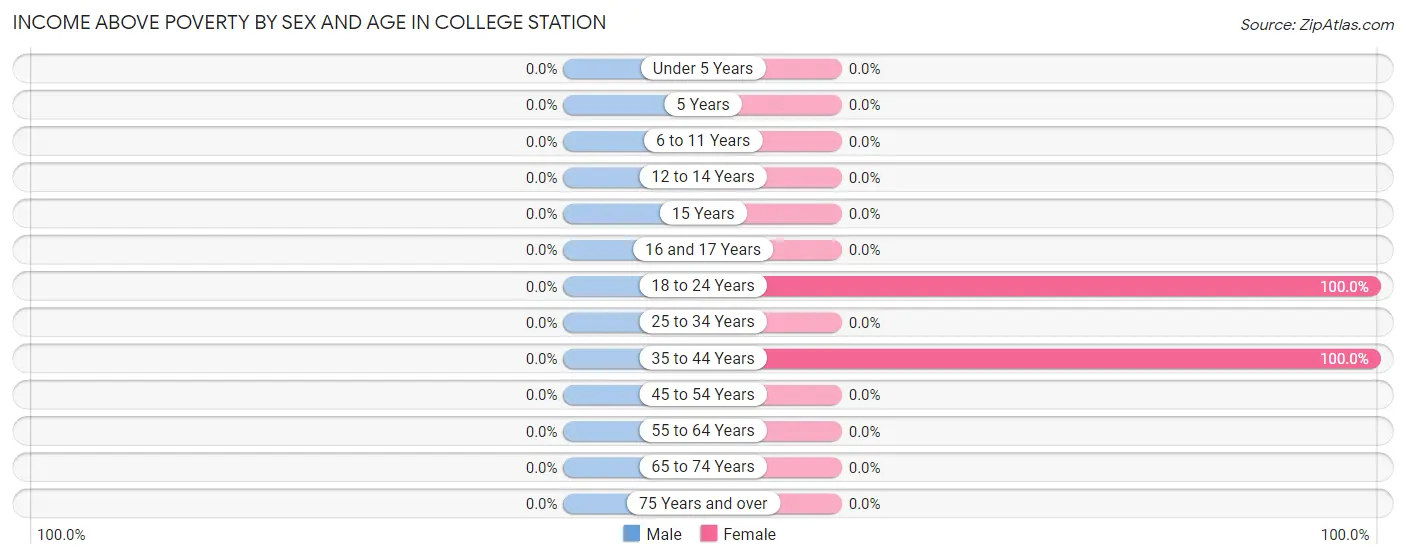
Income Above Poverty by Sex and Age in College Station
Age Bracket
Male
Female
Under 5 Years
0 (0.0%)
0 (0.0%)
5 Years
0 (0.0%)
0 (0.0%)
6 to 11 Years
0 (0.0%)
0 (0.0%)
12 to 14 Years
0 (0.0%)
0 (0.0%)
15 Years
0 (0.0%)
0 (0.0%)
16 and 17 Years
0 (0.0%)
0 (0.0%)
18 to 24 Years
0 (0.0%)
91 (100.0%)
25 to 34 Years
0 (0.0%)
0 (0.0%)
35 to 44 Years
0 (0.0%)
77 (100.0%)
45 to 54 Years
0 (0.0%)
0 (0.0%)
55 to 64 Years
0 (0.0%)
0 (0.0%)
65 to 74 Years
0 (0.0%)
0 (0.0%)
75 Years and over
0 (0.0%)
0 (0.0%)
Total
0 (0.0%)
168 (100.0%)
Income Below Poverty Among Married-Couple Families in College Station
Children
Above Poverty
Below Poverty
No Children
0 (0.0%)
0 (0.0%)
1 or 2 Children
0 (0.0%)
0 (0.0%)
3 or 4 Children
0 (0.0%)
0 (0.0%)
5 or more Children
0 (0.0%)
0 (0.0%)
Total
0 (0.0%)
0 (0.0%)
Income Below Poverty Among Single-Parent Households in College Station
Children
Single Father
Single Mother
No Children
0 (0.0%)
0 (0.0%)
1 or 2 Children
0 (0.0%)
0 (0.0%)
3 or 4 Children
0 (0.0%)
0 (0.0%)
5 or more Children
0 (0.0%)
0 (0.0%)
Total
0 (0.0%)
0 (0.0%)
Income Below Poverty Among Married-Couple vs Single-Parent Households in College Station
Children
Married-Couple Families
Single-Parent Households
No Children
0 (0.0%)
0 (0.0%)
1 or 2 Children
0 (0.0%)
0 (0.0%)
3 or 4 Children
0 (0.0%)
0 (0.0%)
5 or more Children
0 (0.0%)
0 (0.0%)
Total
0 (0.0%)
0 (0.0%)
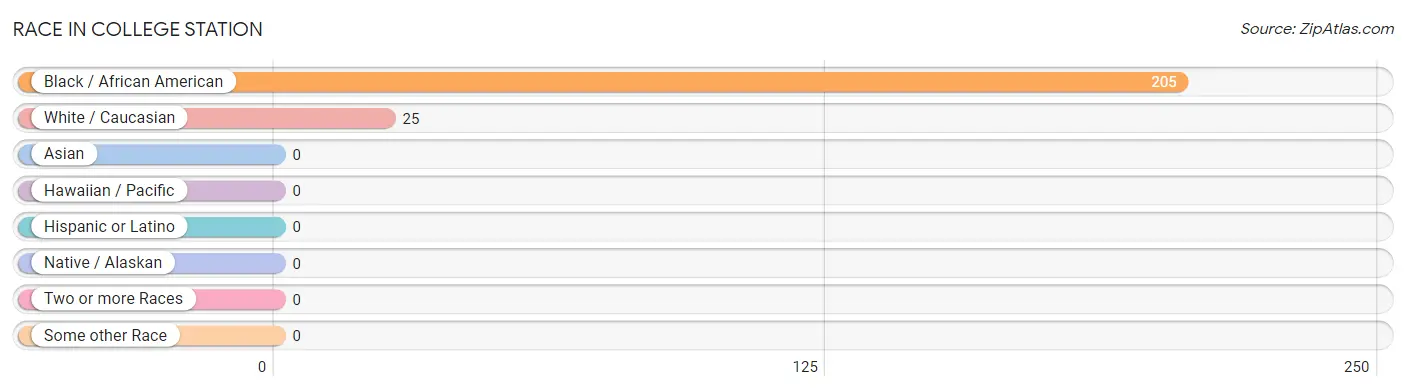
Race in College Station
The most populous races in College Station are Black / African American (205 | 89.1%), and White / Caucasian (25 | 10.9%).
Race
# Population
% Population
Asian
0
0.0%
Black / African American
205
89.1%
Hawaiian / Pacific
0
0.0%
Hispanic or Latino
0
0.0%
Native / Alaskan
0
0.0%
White / Caucasian
25
10.9%
Two or more Races
0
0.0%
Some other Race
0
0.0%
Total
230
100.0%
Ancestry in College Station
The most populous ancestries reported in College Station are , and American (13 | 5.7%), together accounting for 5.7% of all College Station residents.
Ancestry
# Population
% Population
American
13
5.7%
View All 1 Rows
Immigrants in College Station
Immigration Origin
# Population
% Population
View All 0 Rows
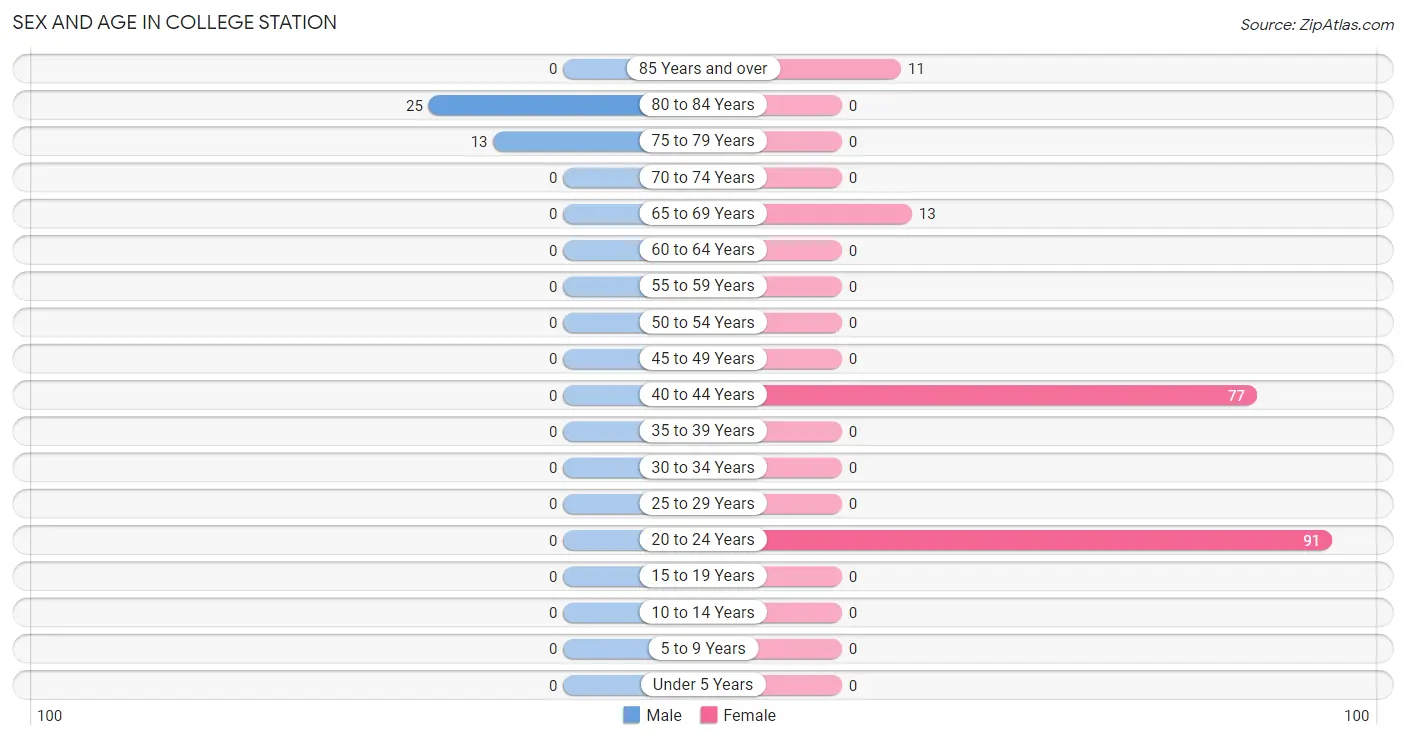
Sex and Age in College Station
Sex and Age in College Station
The most populous age groups in College Station are 80 to 84 Years (25 | 65.8%) for men and 20 to 24 Years (91 | 47.4%) for women.
Age Bracket
Male
Female
Under 5 Years
0 (0.0%)
0 (0.0%)
5 to 9 Years
0 (0.0%)
0 (0.0%)
10 to 14 Years
0 (0.0%)
0 (0.0%)
15 to 19 Years
0 (0.0%)
0 (0.0%)
20 to 24 Years
0 (0.0%)
91 (47.4%)
25 to 29 Years
0 (0.0%)
0 (0.0%)
30 to 34 Years
0 (0.0%)
0 (0.0%)
35 to 39 Years
0 (0.0%)
0 (0.0%)
40 to 44 Years
0 (0.0%)
77 (40.1%)
45 to 49 Years
0 (0.0%)
0 (0.0%)
50 to 54 Years
0 (0.0%)
0 (0.0%)
55 to 59 Years
0 (0.0%)
0 (0.0%)
60 to 64 Years
0 (0.0%)
0 (0.0%)
65 to 69 Years
0 (0.0%)
13 (6.8%)
70 to 74 Years
0 (0.0%)
0 (0.0%)
75 to 79 Years
13 (34.2%)
0 (0.0%)
80 to 84 Years
25 (65.8%)
0 (0.0%)
85 Years and over
0 (0.0%)
11 (5.7%)
Total
38 (100.0%)
192 (100.0%)
Families and Households in College Station
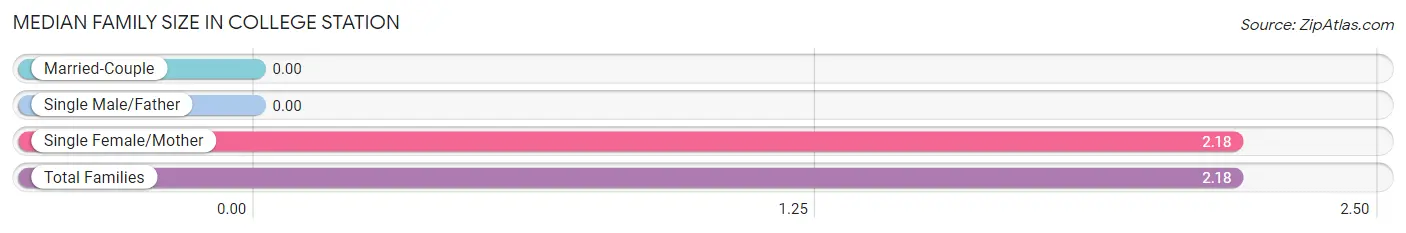
Median Family Size in College Station
Family Type
# Families
Family Size
Married-Couple
0 (0.0%)
-
Single Male/Father
0 (0.0%)
-
Single Female/Mother
77 (100.0%)
2.18
Total Families
77 (100.0%)
2.18
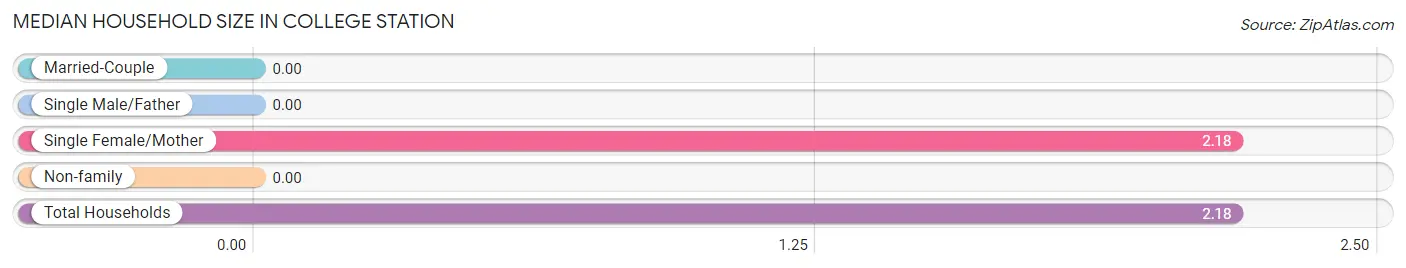
Median Household Size in College Station
Household Type
# Households
Household Size
Married-Couple
0 (0.0%)
-
Single Male/Father
0 (0.0%)
-
Single Female/Mother
77 (100.0%)
2.18
Non-family
0 (0.0%)
-
Total Households
77 (100.0%)
2.18
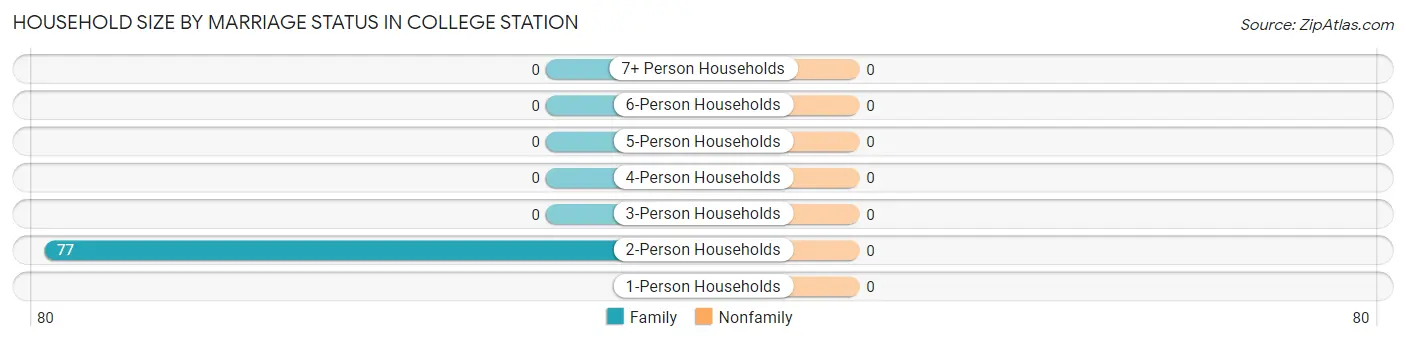
Household Size by Marriage Status in College Station
Household Size
Family Households
Nonfamily Households
1-Person Households
-
0 (0.0%)
2-Person Households
77 (100.0%)
0 (0.0%)
3-Person Households
0 (0.0%)
0 (0.0%)
4-Person Households
0 (0.0%)
0 (0.0%)
5-Person Households
0 (0.0%)
0 (0.0%)
6-Person Households
0 (0.0%)
0 (0.0%)
7+ Person Households
0 (0.0%)
0 (0.0%)
Total
77 (100.0%)
0 (0.0%)
Female Fertility in College Station
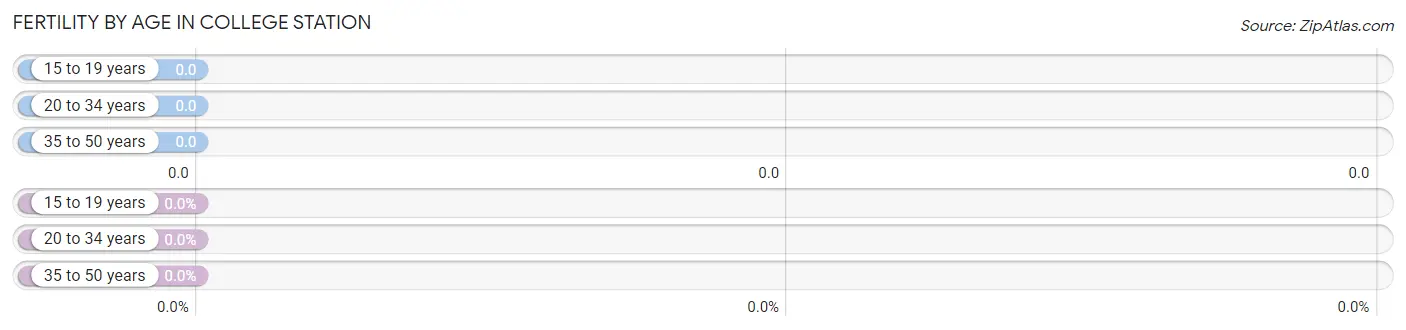
Fertility by Age in College Station
Age Bracket
Women with Births
Births / 1,000 Women
15 to 19 years
0 (0.0%)
0.0
20 to 34 years
0 (0.0%)
0.0
35 to 50 years
0 (0.0%)
0.0
Total
0 (0.0%)
0.0
Fertility by Age by Marriage Status in College Station
Age Bracket
Married
Unmarried
15 to 19 years
0 (0.0%)
0 (0.0%)
20 to 34 years
0 (0.0%)
0 (0.0%)
35 to 50 years
0 (0.0%)
0 (0.0%)
Total
0 (0.0%)
0 (0.0%)
Fertility by Education in College Station
Educational Attainment
Women with Births
Births / 1,000 Women
Less than High School
0 (0.0%)
0.0
High School Diploma
0 (0.0%)
0.0
College or Associate's Degree
0 (0.0%)
0.0
Bachelor's Degree
0 (0.0%)
0.0
Graduate Degree
0 (0.0%)
0.0
Total
0 (0.0%)
0.0
Fertility by Education by Marriage Status in College Station
Educational Attainment
Married
Unmarried
Less than High School
0 (0.0%)
0 (0.0%)
High School Diploma
0 (0.0%)
0 (0.0%)
College or Associate's Degree
0 (0.0%)
0 (0.0%)
Bachelor's Degree
0 (0.0%)
0 (0.0%)
Graduate Degree
0 (0.0%)
0 (0.0%)
Total
0 (0.0%)
0 (0.0%)
Employment Characteristics in College Station
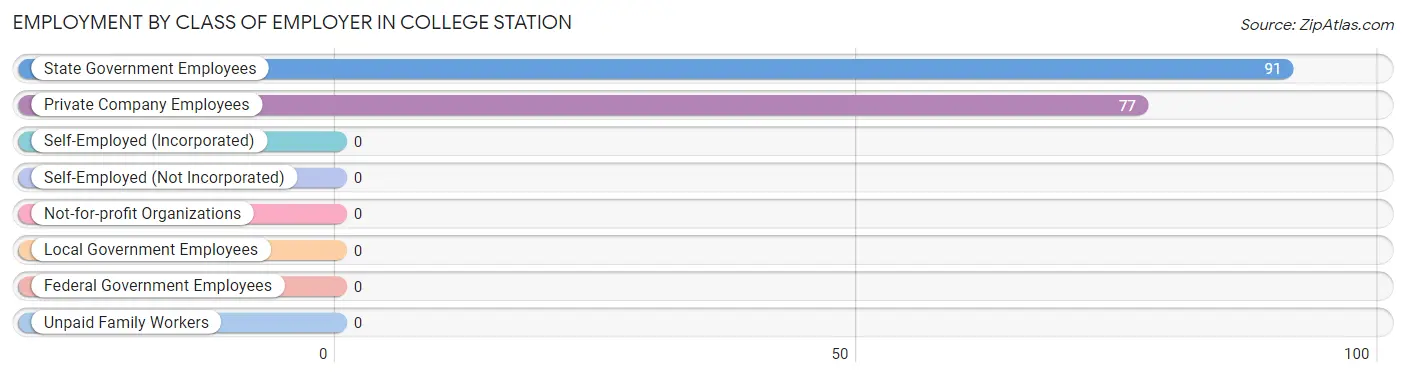
Employment by Class of Employer in College Station
Among the 168 employed individuals in College Station, state government employees (91 | 54.2%), and private company employees (77 | 45.8%) make up the most common classes of employment.
Employer Class
# Employees
% Employees
Private Company Employees
77
45.8%
Self-Employed (Incorporated)
0
0.0%
Self-Employed (Not Incorporated)
0
0.0%
Not-for-profit Organizations
0
0.0%
Local Government Employees
0
0.0%
State Government Employees
91
54.2%
Federal Government Employees
0
0.0%
Unpaid Family Workers
0
0.0%
Total
168
100.0%
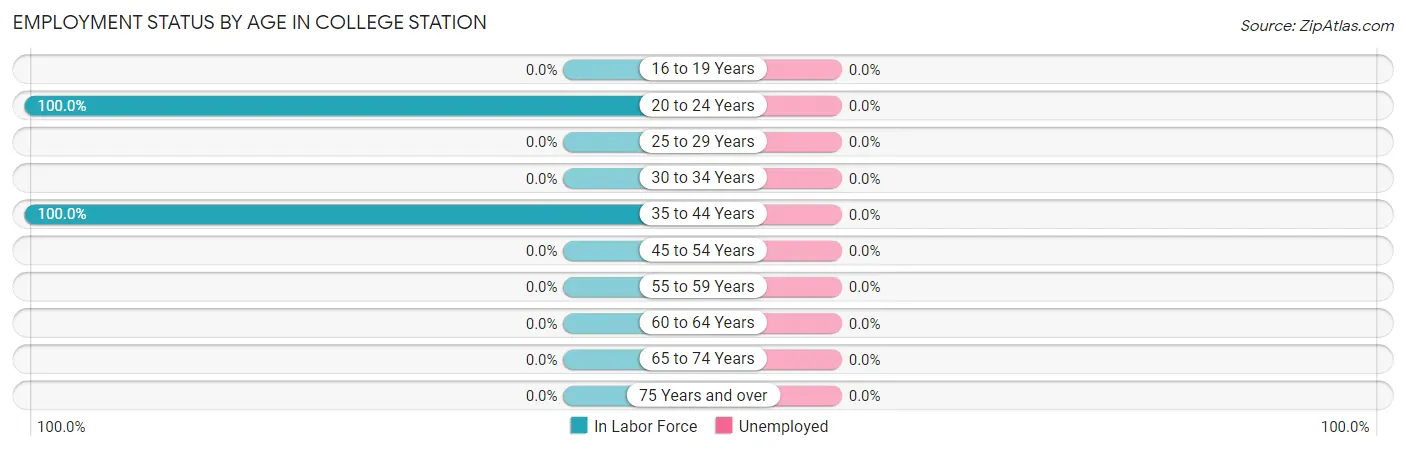
Employment Status by Age in College Station
Age Bracket
In Labor Force
Unemployed
16 to 19 Years
0 (0.0%)
0 (0.0%)
20 to 24 Years
91 (100.0%)
0 (0.0%)
25 to 29 Years
0 (0.0%)
0 (0.0%)
30 to 34 Years
0 (0.0%)
0 (0.0%)
35 to 44 Years
77 (100.0%)
0 (0.0%)
45 to 54 Years
0 (0.0%)
0 (0.0%)
55 to 59 Years
0 (0.0%)
0 (0.0%)
60 to 64 Years
0 (0.0%)
0 (0.0%)
65 to 74 Years
0 (0.0%)
0 (0.0%)
75 Years and over
0 (0.0%)
0 (0.0%)
Total
168 (73.0%)
0 (0.0%)
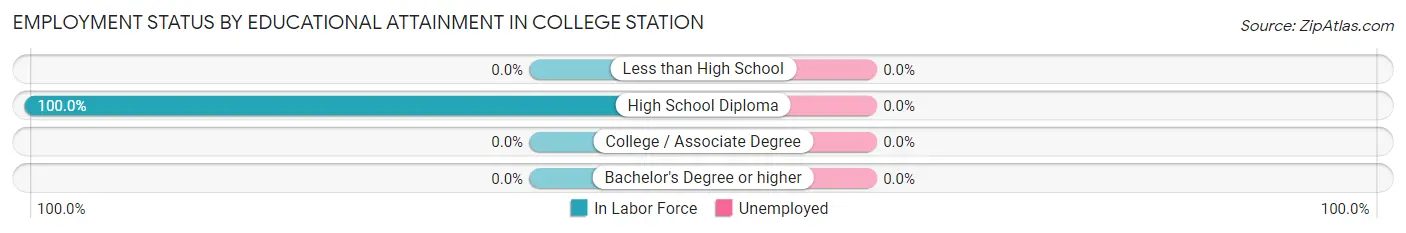
Employment Status by Educational Attainment in College Station
Educational Attainment
In Labor Force
Unemployed
Less than High School
0 (0.0%)
0 (0.0%)
High School Diploma
77 (100.0%)
0 (0.0%)
College / Associate Degree
0 (0.0%)
0 (0.0%)
Bachelor's Degree or higher
0 (0.0%)
0 (0.0%)
Total
77 (100.0%)
0 (0.0%)
Employment Occupations by Sex in College Station
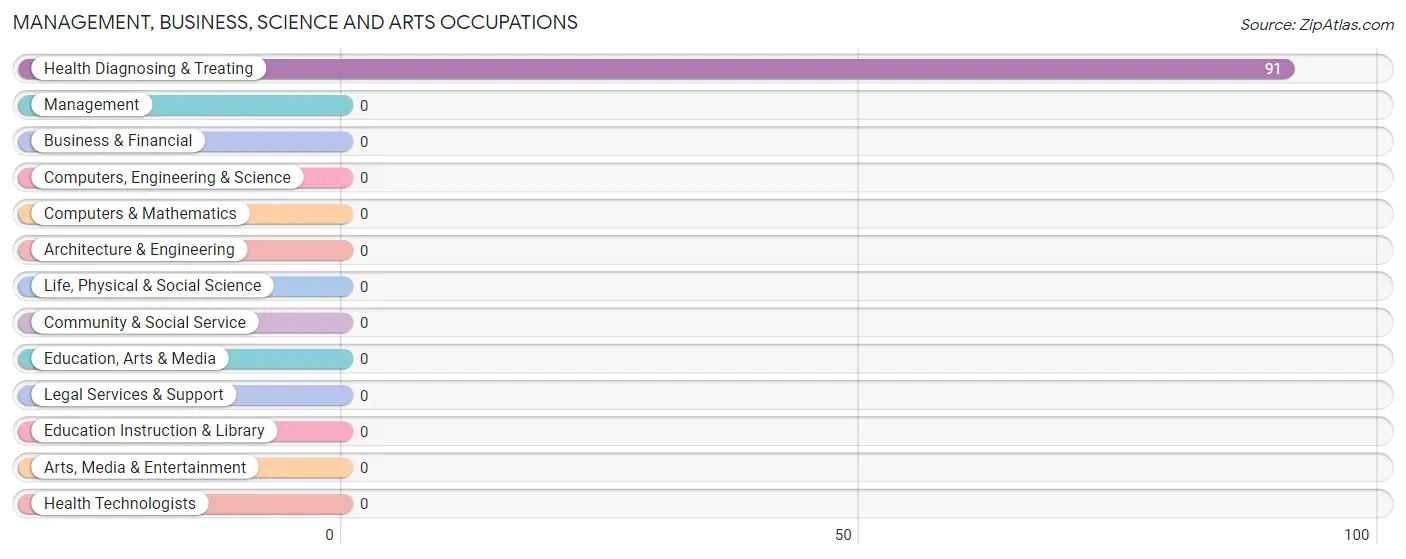
Management, Business, Science and Arts Occupations
The most common Management, Business, Science and Arts occupations in College Station are , and Health Diagnosing & Treating (91 | 54.2%).
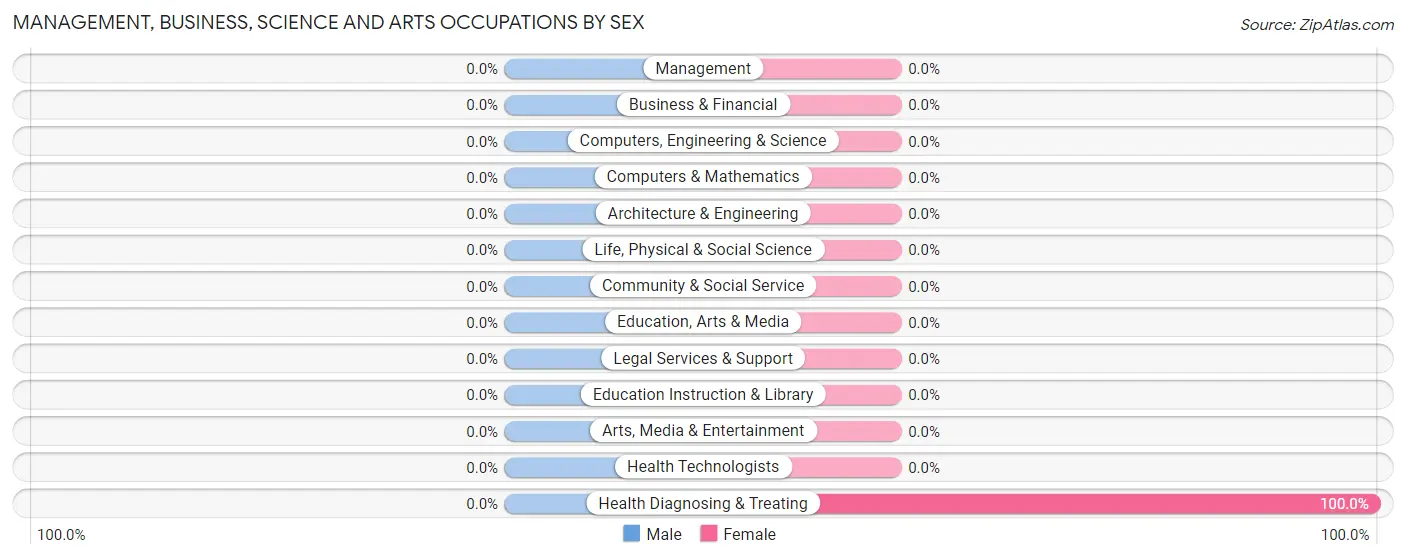
Management, Business, Science and Arts Occupations by Sex
Occupation
Male
Female
Management
0 (0.0%)
0 (0.0%)
Business & Financial
0 (0.0%)
0 (0.0%)
Computers, Engineering & Science
0 (0.0%)
0 (0.0%)
Computers & Mathematics
0 (0.0%)
0 (0.0%)
Architecture & Engineering
0 (0.0%)
0 (0.0%)
Life, Physical & Social Science
0 (0.0%)
0 (0.0%)
Community & Social Service
0 (0.0%)
0 (0.0%)
Education, Arts & Media
0 (0.0%)
0 (0.0%)
Legal Services & Support
0 (0.0%)
0 (0.0%)
Education Instruction & Library
0 (0.0%)
0 (0.0%)
Arts, Media & Entertainment
0 (0.0%)
0 (0.0%)
Health Diagnosing & Treating
0 (0.0%)
91 (100.0%)
Health Technologists
0 (0.0%)
0 (0.0%)
Total (Category)
0 (0.0%)
91 (100.0%)
Total (Overall)
0 (0.0%)
168 (100.0%)
Services Occupations
Services Occupations by Sex
Occupation
Male
Female
Healthcare Support
0 (0.0%)
0 (0.0%)
Security & Protection
0 (0.0%)
0 (0.0%)
Firefighting & Prevention
0 (0.0%)
0 (0.0%)
Law Enforcement
0 (0.0%)
0 (0.0%)
Food Preparation & Serving
0 (0.0%)
0 (0.0%)
Cleaning & Maintenance
0 (0.0%)
0 (0.0%)
Personal Care & Service
0 (0.0%)
0 (0.0%)
Total (Category)
0 (0.0%)
0 (0.0%)
Total (Overall)
0 (0.0%)
168 (100.0%)
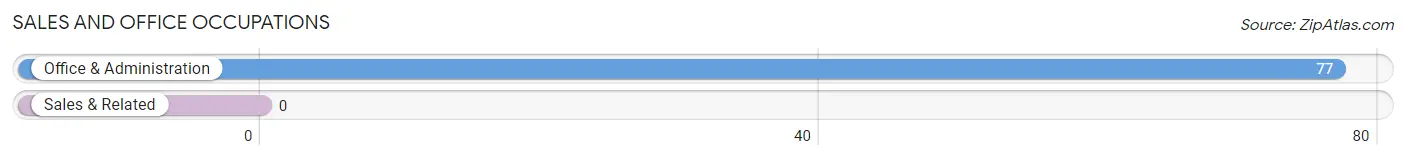
Sales and Office Occupations
The most common Sales and Office occupations in College Station are , and Office & Administration (77 | 45.8%).
Sales and Office Occupations by Sex
Occupation
Male
Female
Sales & Related
0 (0.0%)
0 (0.0%)
Office & Administration
0 (0.0%)
77 (100.0%)
Total (Category)
0 (0.0%)
77 (100.0%)
Total (Overall)
0 (0.0%)
168 (100.0%)
Natural Resources, Construction and Maintenance Occupations
Natural Resources, Construction and Maintenance Occupations by Sex
Occupation
Male
Female
Farming, Fishing & Forestry
0 (0.0%)
0 (0.0%)
Construction & Extraction
0 (0.0%)
0 (0.0%)
Installation, Maintenance & Repair
0 (0.0%)
0 (0.0%)
Total (Category)
0 (0.0%)
0 (0.0%)
Total (Overall)
0 (0.0%)
168 (100.0%)
Production, Transportation and Moving Occupations
Production, Transportation and Moving Occupations by Sex
Occupation
Male
Female
Production
0 (0.0%)
0 (0.0%)
Transportation
0 (0.0%)
0 (0.0%)
Material Moving
0 (0.0%)
0 (0.0%)
Total (Category)
0 (0.0%)
0 (0.0%)
Total (Overall)
0 (0.0%)
168 (100.0%)
Employment Industries by Sex in College Station
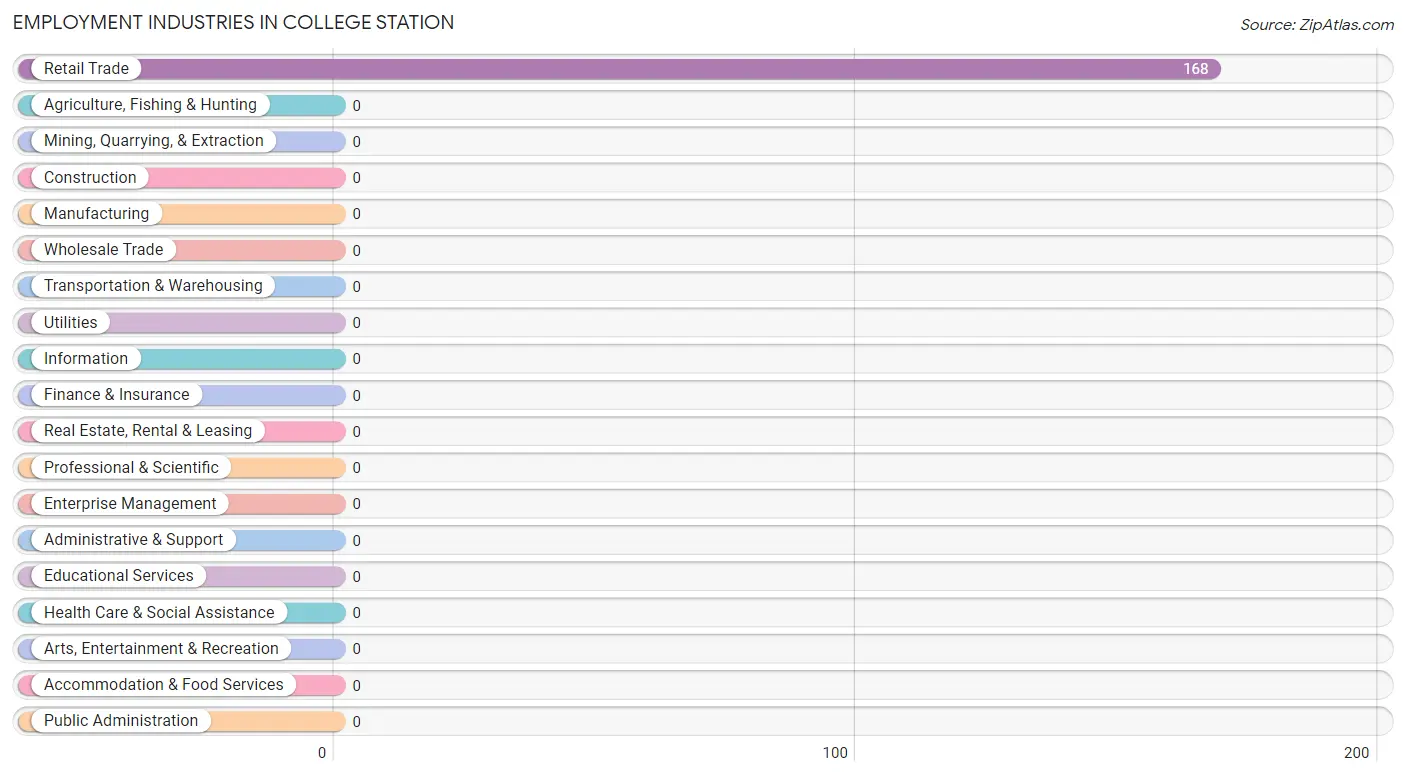
Employment Industries in College Station
The major employment industries in College Station include , and Retail Trade (168 | 100.0%).
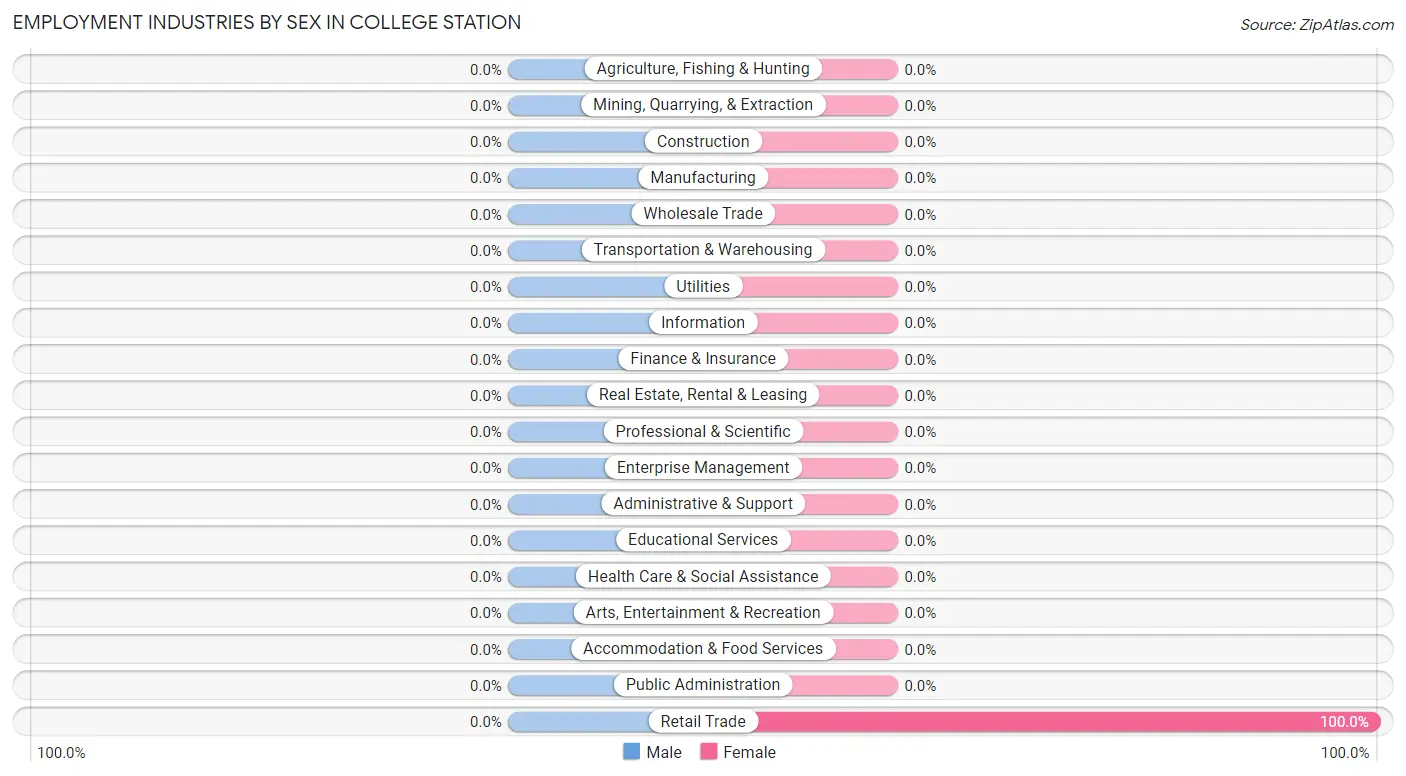
Employment Industries by Sex in College Station
Industry
Male
Female
Agriculture, Fishing & Hunting
0 (0.0%)
0 (0.0%)
Mining, Quarrying, & Extraction
0 (0.0%)
0 (0.0%)
Construction
0 (0.0%)
0 (0.0%)
Manufacturing
0 (0.0%)
0 (0.0%)
Wholesale Trade
0 (0.0%)
0 (0.0%)
Retail Trade
0 (0.0%)
168 (100.0%)
Transportation & Warehousing
0 (0.0%)
0 (0.0%)
Utilities
0 (0.0%)
0 (0.0%)
Information
0 (0.0%)
0 (0.0%)
Finance & Insurance
0 (0.0%)
0 (0.0%)
Real Estate, Rental & Leasing
0 (0.0%)
0 (0.0%)
Professional & Scientific
0 (0.0%)
0 (0.0%)
Enterprise Management
0 (0.0%)
0 (0.0%)
Administrative & Support
0 (0.0%)
0 (0.0%)
Educational Services
0 (0.0%)
0 (0.0%)
Health Care & Social Assistance
0 (0.0%)
0 (0.0%)
Arts, Entertainment & Recreation
0 (0.0%)
0 (0.0%)
Accommodation & Food Services
0 (0.0%)
0 (0.0%)
Public Administration
0 (0.0%)
0 (0.0%)
Total
0 (0.0%)
168 (100.0%)
Education in College Station
School Enrollment in College Station
School Level
# Students
% Students
Nursery / Preschool
0
0.0%
Kindergarten
0
0.0%
Elementary School
0
0.0%
Middle School
0
0.0%
High School
0
0.0%
College / Undergraduate
0
0.0%
Graduate / Professional
0
0.0%
Total
0
0.0%
School Enrollment by Age by Funding Source in College Station
Age Bracket
Public School
Private School
3 to 4 Year Olds
0 (0.0%)
0 (0.0%)
5 to 9 Year Old
0 (0.0%)
0 (0.0%)
10 to 14 Year Olds
0 (0.0%)
0 (0.0%)
15 to 17 Year Olds
0 (0.0%)
0 (0.0%)
18 to 19 Year Olds
0 (0.0%)
0 (0.0%)
20 to 24 Year Olds
0 (0.0%)
0 (0.0%)
25 to 34 Year Olds
0 (0.0%)
0 (0.0%)
35 Years and over
0 (0.0%)
0 (0.0%)
Total
0 (0.0%)
0 (0.0%)
Educational Attainment by Field of Study in College Station
Field of Study
# Graduates
% Graduates
Computers & Mathematics
0
0.0%
Bio, Nature & Agricultural
0
0.0%
Physical & Health Sciences
0
0.0%
Psychology
0
0.0%
Social Sciences
0
0.0%
Engineering
0
0.0%
Multidisciplinary Studies
0
0.0%
Science & Technology
0
0.0%
Business
0
0.0%
Education
0
0.0%
Literature & Languages
0
0.0%
Liberal Arts & History
0
0.0%
Visual & Performing Arts
0
0.0%
Communications
0
0.0%
Arts & Humanities
0
0.0%
Total
0
0.0%
Transportation & Commute in College Station
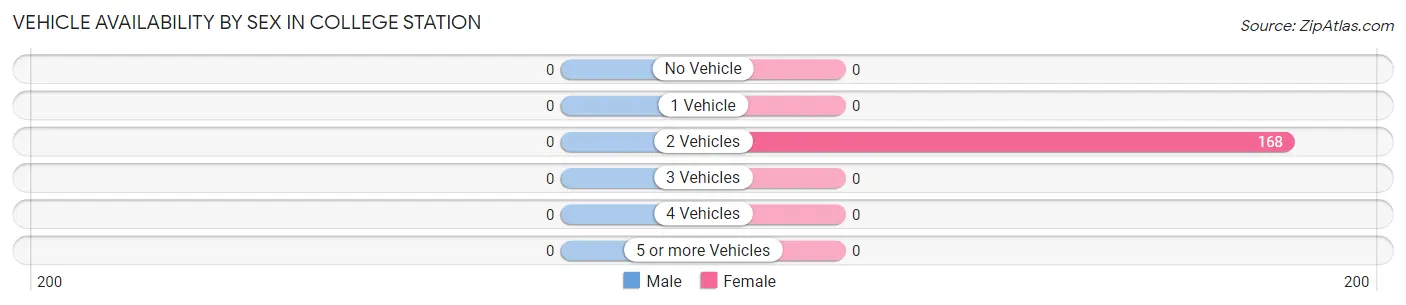
Vehicle Availability by Sex in College Station
Vehicles Available
Male
Female
No Vehicle
0 (0.0%)
0 (0.0%)
1 Vehicle
0 (0.0%)
0 (0.0%)
2 Vehicles
0 (0.0%)
168 (100.0%)
3 Vehicles
0 (0.0%)
0 (0.0%)
4 Vehicles
0 (0.0%)
0 (0.0%)
5 or more Vehicles
0 (0.0%)
0 (0.0%)
Total
0 (0.0%)
168 (100.0%)
Commute Time in College Station
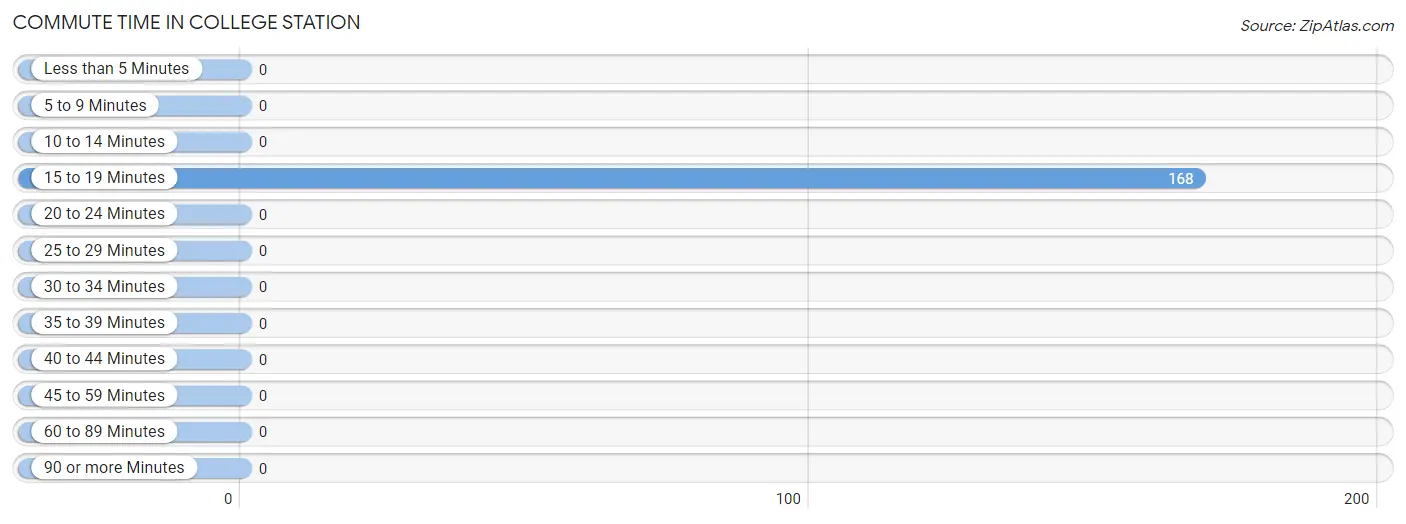
The most frequently occuring commute durations in College Station are 15 to 19 minutes (168 commuters, 100.0%), less than 5 minutes (0 commuters, 0.0%), and 5 to 9 minutes (0 commuters, 0.0%).
Commute Time
# Commuters
% Commuters
Less than 5 Minutes
0
0.0%
5 to 9 Minutes
0
0.0%
10 to 14 Minutes
0
0.0%
15 to 19 Minutes
168
100.0%
20 to 24 Minutes
0
0.0%
25 to 29 Minutes
0
0.0%
30 to 34 Minutes
0
0.0%
35 to 39 Minutes
0
0.0%
40 to 44 Minutes
0
0.0%
45 to 59 Minutes
0
0.0%
60 to 89 Minutes
0
0.0%
90 or more Minutes
0
0.0%
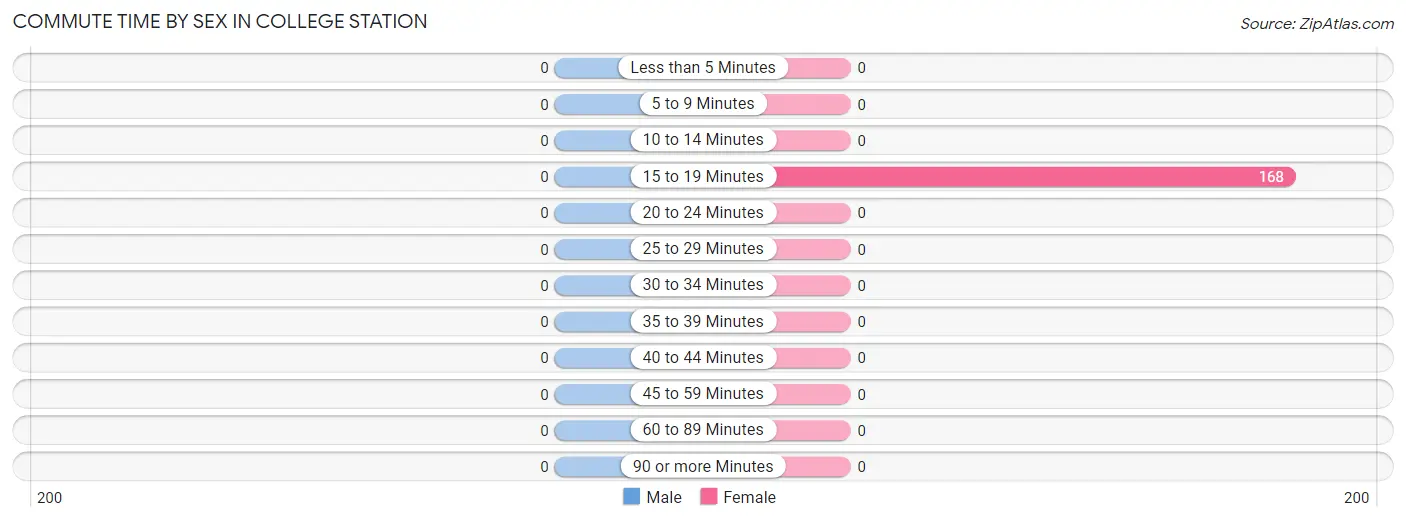
Commute Time by Sex in College Station
Commute Time
Male
Female
Less than 5 Minutes
0 (0.0%)
0 (0.0%)
5 to 9 Minutes
0 (0.0%)
0 (0.0%)
10 to 14 Minutes
0 (0.0%)
0 (0.0%)
15 to 19 Minutes
0 (0.0%)
168 (100.0%)
20 to 24 Minutes
0 (0.0%)
0 (0.0%)
25 to 29 Minutes
0 (0.0%)
0 (0.0%)
30 to 34 Minutes
0 (0.0%)
0 (0.0%)
35 to 39 Minutes
0 (0.0%)
0 (0.0%)
40 to 44 Minutes
0 (0.0%)
0 (0.0%)
45 to 59 Minutes
0 (0.0%)
0 (0.0%)
60 to 89 Minutes
0 (0.0%)
0 (0.0%)
90 or more Minutes
0 (0.0%)
0 (0.0%)
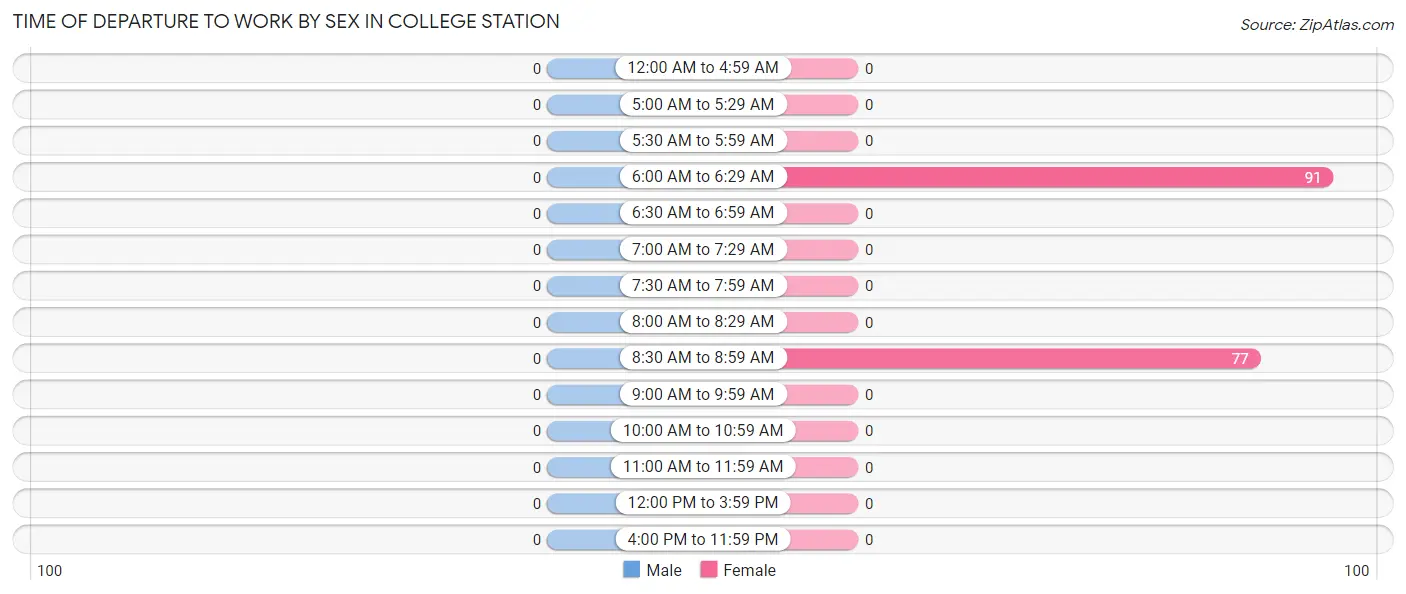
Time of Departure to Work by Sex in College Station
Time of Departure
Male
Female
12:00 AM to 4:59 AM
0 (0.0%)
0 (0.0%)
5:00 AM to 5:29 AM
0 (0.0%)
0 (0.0%)
5:30 AM to 5:59 AM
0 (0.0%)
0 (0.0%)
6:00 AM to 6:29 AM
0 (0.0%)
91 (54.2%)
6:30 AM to 6:59 AM
0 (0.0%)
0 (0.0%)
7:00 AM to 7:29 AM
0 (0.0%)
0 (0.0%)
7:30 AM to 7:59 AM
0 (0.0%)
0 (0.0%)
8:00 AM to 8:29 AM
0 (0.0%)
0 (0.0%)
8:30 AM to 8:59 AM
0 (0.0%)
77 (45.8%)
9:00 AM to 9:59 AM
0 (0.0%)
0 (0.0%)
10:00 AM to 10:59 AM
0 (0.0%)
0 (0.0%)
11:00 AM to 11:59 AM
0 (0.0%)
0 (0.0%)
12:00 PM to 3:59 PM
0 (0.0%)
0 (0.0%)
4:00 PM to 11:59 PM
0 (0.0%)
0 (0.0%)
Total
0 (0.0%)
168 (100.0%)
Housing Occupancy in College Station
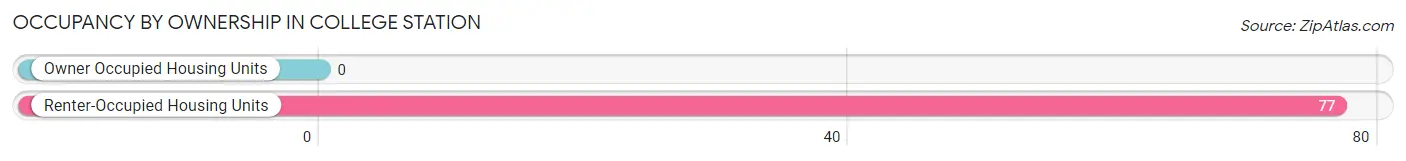
Occupancy by Ownership in College Station
Of the total 77 dwellings in College Station, owner-occupied units account for 0 (0.0%), while renter-occupied units make up 77 (100.0%).
Occupancy
# Housing Units
% Housing Units
Owner Occupied Housing Units
0
0.0%
Renter-Occupied Housing Units
77
100.0%
Total Occupied Housing Units
77
100.0%
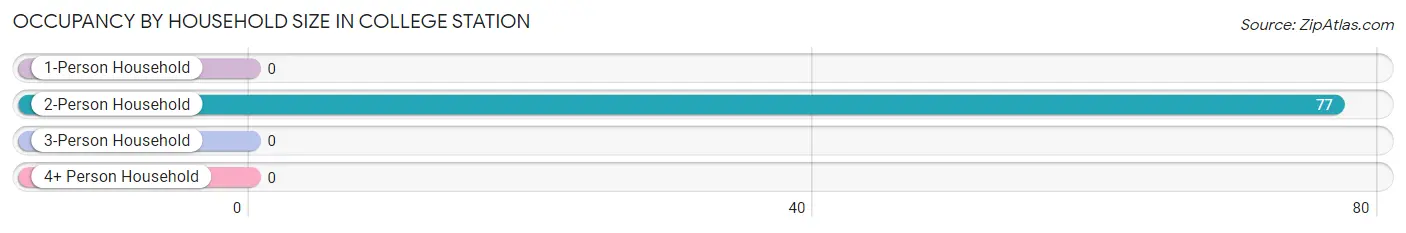
Occupancy by Household Size in College Station
Household Size
# Housing Units
% Housing Units
1-Person Household
0
0.0%
2-Person Household
77
100.0%
3-Person Household
0
0.0%
4+ Person Household
0
0.0%
Total Housing Units
77
100.0%
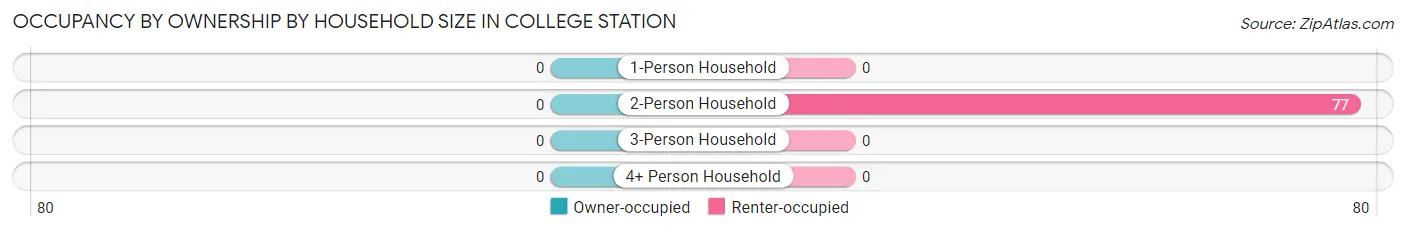
Occupancy by Ownership by Household Size in College Station
Household Size
Owner-occupied
Renter-occupied
1-Person Household
0 (0.0%)
0 (0.0%)
2-Person Household
0 (0.0%)
77 (100.0%)
3-Person Household
0 (0.0%)
0 (0.0%)
4+ Person Household
0 (0.0%)
0 (0.0%)
Total Housing Units
0 (0.0%)
77 (100.0%)
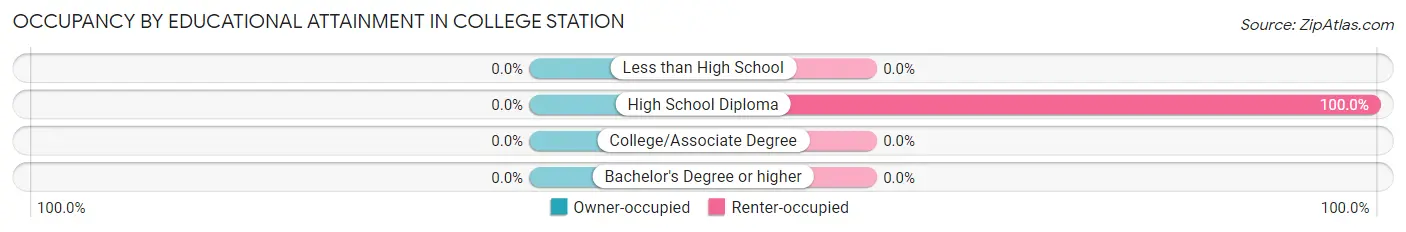
Occupancy by Educational Attainment in College Station
Household Size
Owner-occupied
Renter-occupied
Less than High School
0 (0.0%)
0 (0.0%)
High School Diploma
0 (0.0%)
77 (100.0%)
College/Associate Degree
0 (0.0%)
0 (0.0%)
Bachelor's Degree or higher
0 (0.0%)
0 (0.0%)
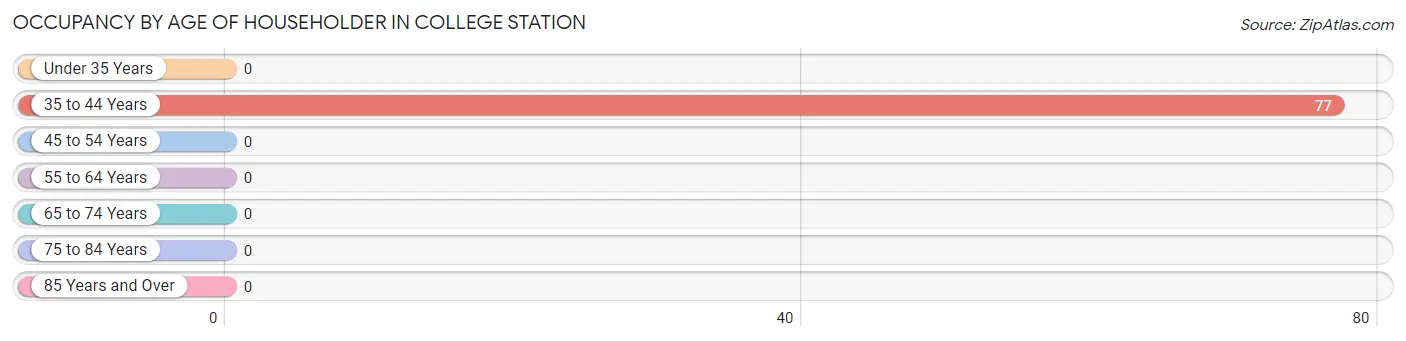
Occupancy by Age of Householder in College Station
Age Bracket
# Households
% Households
Under 35 Years
0
0.0%
35 to 44 Years
77
100.0%
45 to 54 Years
0
0.0%
55 to 64 Years
0
0.0%
65 to 74 Years
0
0.0%
75 to 84 Years
0
0.0%
85 Years and Over
0
0.0%
Total
77
100.0%
Housing Finances in College Station
Median Income by Occupancy in College Station
Occupancy Type
# Households
Median Income
Owner-Occupied
0 (0.0%)
$0
Renter-Occupied
77 (100.0%)
$0
Average
77 (100.0%)
$0
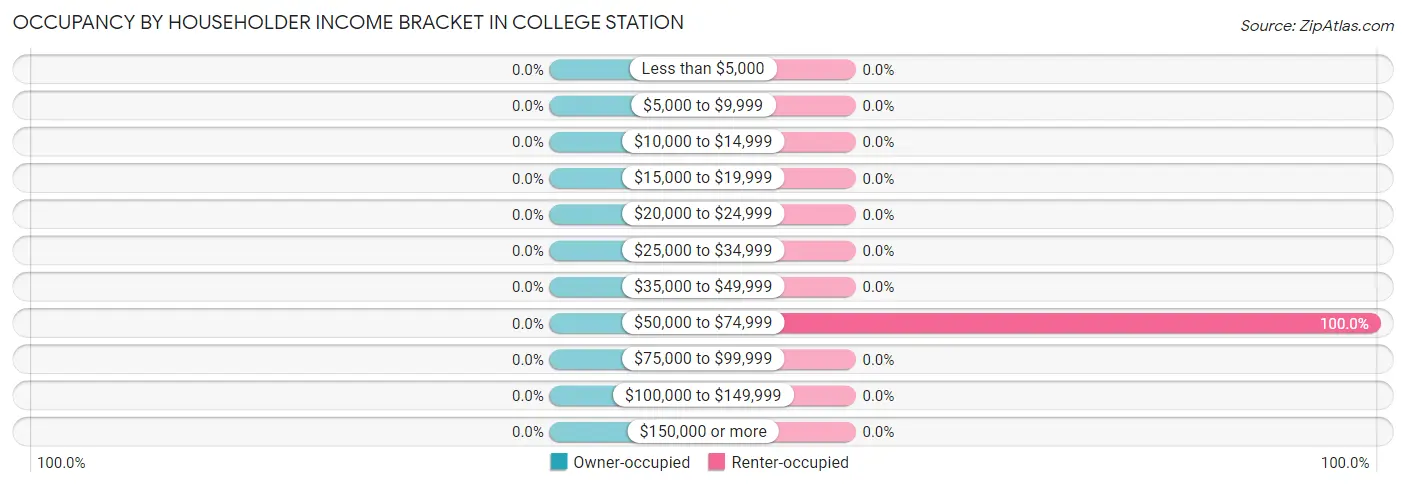
Occupancy by Householder Income Bracket in College Station
Income Bracket
Owner-occupied
Renter-occupied
Less than $5,000
0 (0.0%)
0 (0.0%)
$5,000 to $9,999
0 (0.0%)
0 (0.0%)
$10,000 to $14,999
0 (0.0%)
0 (0.0%)
$15,000 to $19,999
0 (0.0%)
0 (0.0%)
$20,000 to $24,999
0 (0.0%)
0 (0.0%)
$25,000 to $34,999
0 (0.0%)
0 (0.0%)
$35,000 to $49,999
0 (0.0%)
0 (0.0%)
$50,000 to $74,999
0 (0.0%)
77 (100.0%)
$75,000 to $99,999
0 (0.0%)
0 (0.0%)
$100,000 to $149,999
0 (0.0%)
0 (0.0%)
$150,000 or more
0 (0.0%)
0 (0.0%)
Total
0 (0.0%)
77 (100.0%)
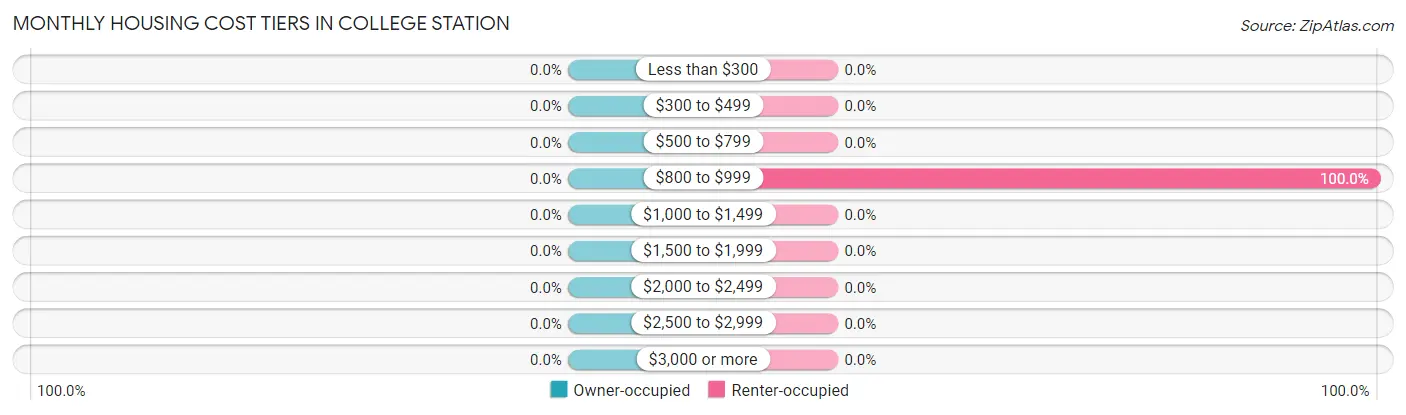
Monthly Housing Cost Tiers in College Station
Monthly Cost
Owner-occupied
Renter-occupied
Less than $300
0 (0.0%)
0 (0.0%)
$300 to $499
0 (0.0%)
0 (0.0%)
$500 to $799
0 (0.0%)
0 (0.0%)
$800 to $999
0 (0.0%)
77 (100.0%)
$1,000 to $1,499
0 (0.0%)
0 (0.0%)
$1,500 to $1,999
0 (0.0%)
0 (0.0%)
$2,000 to $2,499
0 (0.0%)
0 (0.0%)
$2,500 to $2,999
0 (0.0%)
0 (0.0%)
$3,000 or more
0 (0.0%)
0 (0.0%)
Total
0 (0.0%)
77 (100.0%)
Physical Housing Characteristics in College Station
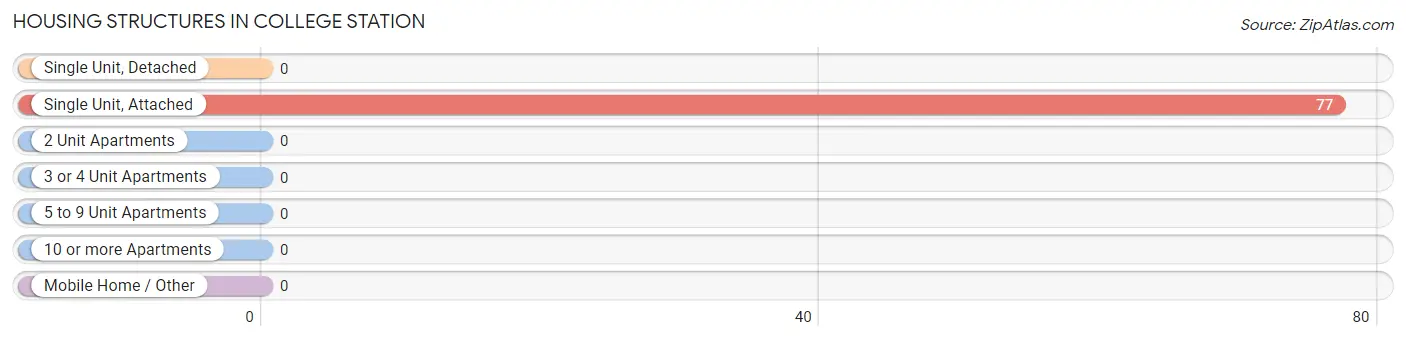
Housing Structures in College Station
Structure Type
# Housing Units
% Housing Units
Single Unit, Detached
0
0.0%
Single Unit, Attached
77
100.0%
2 Unit Apartments
0
0.0%
3 or 4 Unit Apartments
0
0.0%
5 to 9 Unit Apartments
0
0.0%
10 or more Apartments
0
0.0%
Mobile Home / Other
0
0.0%
Total
77
100.0%
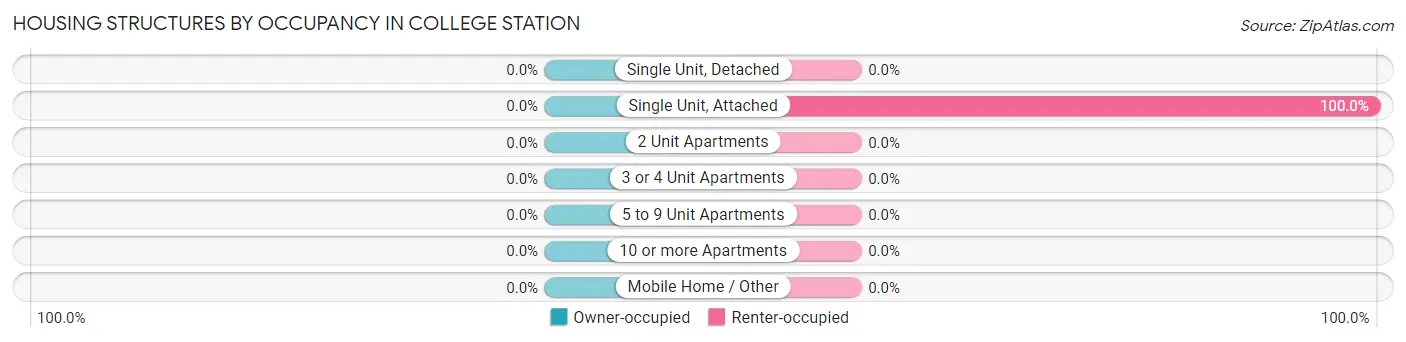
Housing Structures by Occupancy in College Station
Structure Type
Owner-occupied
Renter-occupied
Single Unit, Detached
0 (0.0%)
0 (0.0%)
Single Unit, Attached
0 (0.0%)
77 (100.0%)
2 Unit Apartments
0 (0.0%)
0 (0.0%)
3 or 4 Unit Apartments
0 (0.0%)
0 (0.0%)
5 to 9 Unit Apartments
0 (0.0%)
0 (0.0%)
10 or more Apartments
0 (0.0%)
0 (0.0%)
Mobile Home / Other
0 (0.0%)
0 (0.0%)
Total
0 (0.0%)
77 (100.0%)
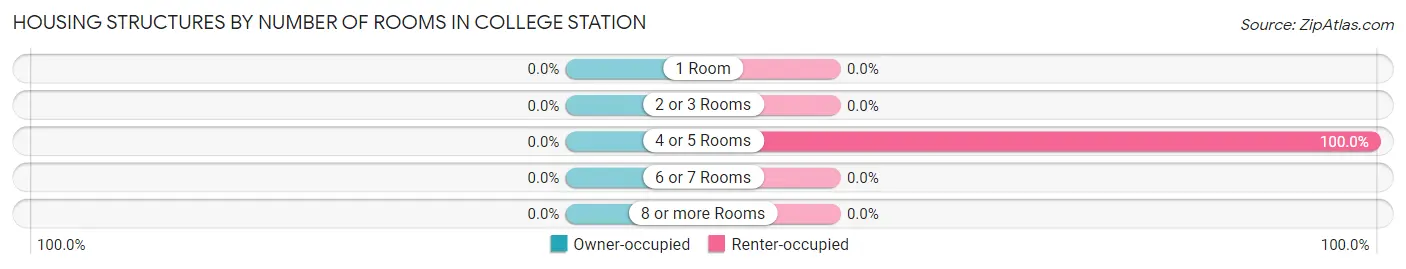
Housing Structures by Number of Rooms in College Station
Number of Rooms
Owner-occupied
Renter-occupied
1 Room
0 (0.0%)
0 (0.0%)
2 or 3 Rooms
0 (0.0%)
0 (0.0%)
4 or 5 Rooms
0 (0.0%)
77 (100.0%)
6 or 7 Rooms
0 (0.0%)
0 (0.0%)
8 or more Rooms
0 (0.0%)
0 (0.0%)
Total
0 (0.0%)
77 (100.0%)
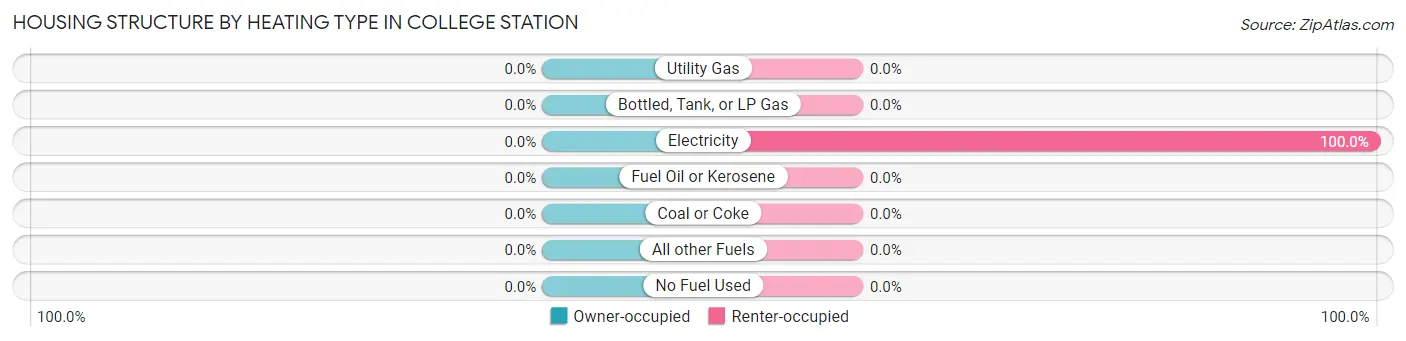
Housing Structure by Heating Type in College Station
Heating Type
Owner-occupied
Renter-occupied
Utility Gas
0 (0.0%)
0 (0.0%)
Bottled, Tank, or LP Gas
0 (0.0%)
0 (0.0%)
Electricity
0 (0.0%)
77 (100.0%)
Fuel Oil or Kerosene
0 (0.0%)
0 (0.0%)
Coal or Coke
0 (0.0%)
0 (0.0%)
All other Fuels
0 (0.0%)
0 (0.0%)
No Fuel Used
0 (0.0%)
0 (0.0%)
Total
0 (0.0%)
77 (100.0%)
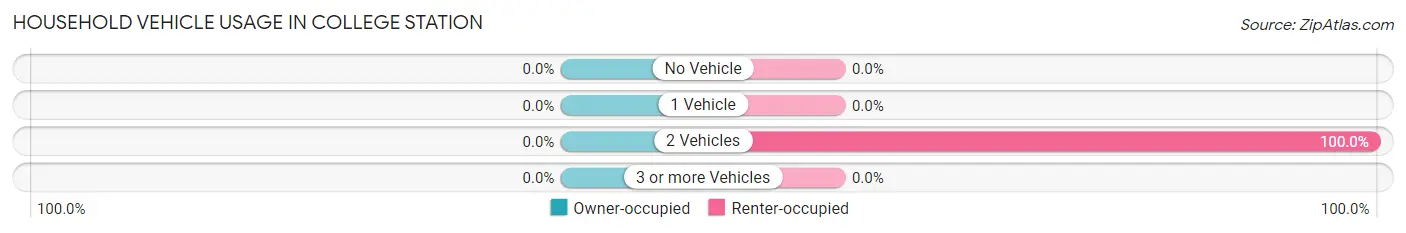
Household Vehicle Usage in College Station
Vehicles per Household
Owner-occupied
Renter-occupied
No Vehicle
0 (0.0%)
0 (0.0%)
1 Vehicle
0 (0.0%)
0 (0.0%)
2 Vehicles
0 (0.0%)
77 (100.0%)
3 or more Vehicles
0 (0.0%)
0 (0.0%)
Total
0 (0.0%)
77 (100.0%)
Real Estate & Mortgages in College Station
Real Estate and Mortgage Overview in College Station
Characteristic
Without Mortgage
With Mortgage
Housing Units
0
0
Median Property Value
-
-
Median Household Income
-
-
Monthly Housing Costs
-
-
Real Estate Taxes
-
-
Property Value by Mortgage Status in College Station
Property Value
Without Mortgage
With Mortgage
Less than $50,000
0 (0.0%)
0 (0.0%)
$50,000 to $99,999
0 (0.0%)
0 (0.0%)
$100,000 to $299,999
0 (0.0%)
0 (0.0%)
$300,000 to $499,999
0 (0.0%)
0 (0.0%)
$500,000 to $749,999
0 (0.0%)
0 (0.0%)
$750,000 to $999,999
0 (0.0%)
0 (0.0%)
$1,000,000 or more
0 (0.0%)
0 (0.0%)
Total
0 (0.0%)
0 (0.0%)
Household Income by Mortgage Status in College Station
Household Income
Without Mortgage
With Mortgage
Less than $10,000
0 (0.0%)
0 (0.0%)
$10,000 to $24,999
0 (0.0%)
0 (0.0%)
$25,000 to $34,999
0 (0.0%)
0 (0.0%)
$35,000 to $49,999
0 (0.0%)
0 (0.0%)
$50,000 to $74,999
0 (0.0%)
0 (0.0%)
$75,000 to $99,999
0 (0.0%)
0 (0.0%)
$100,000 to $149,999
0 (0.0%)
0 (0.0%)
$150,000 or more
0 (0.0%)
0 (0.0%)
Total
0 (0.0%)
0 (0.0%)
Property Value to Household Income Ratio in College Station
Value-to-Income Ratio
Without Mortgage
With Mortgage
Less than 2.0x
0 (0.0%)
0 (0.0%)
2.0x to 2.9x
0 (0.0%)
0 (0.0%)
3.0x to 3.9x
0 (0.0%)
0 (0.0%)
4.0x or more
0 (0.0%)
0 (0.0%)
Total
0 (0.0%)
0 (0.0%)
Real Estate Taxes by Mortgage Status in College Station
Property Taxes
Without Mortgage
With Mortgage
Less than $800
0 (0.0%)
0 (0.0%)
$800 to $1,499
0 (0.0%)
0 (0.0%)
$800 to $1,499
0 (0.0%)
0 (0.0%)
Total
0 (0.0%)
0 (0.0%)
Health & Disability in College Station
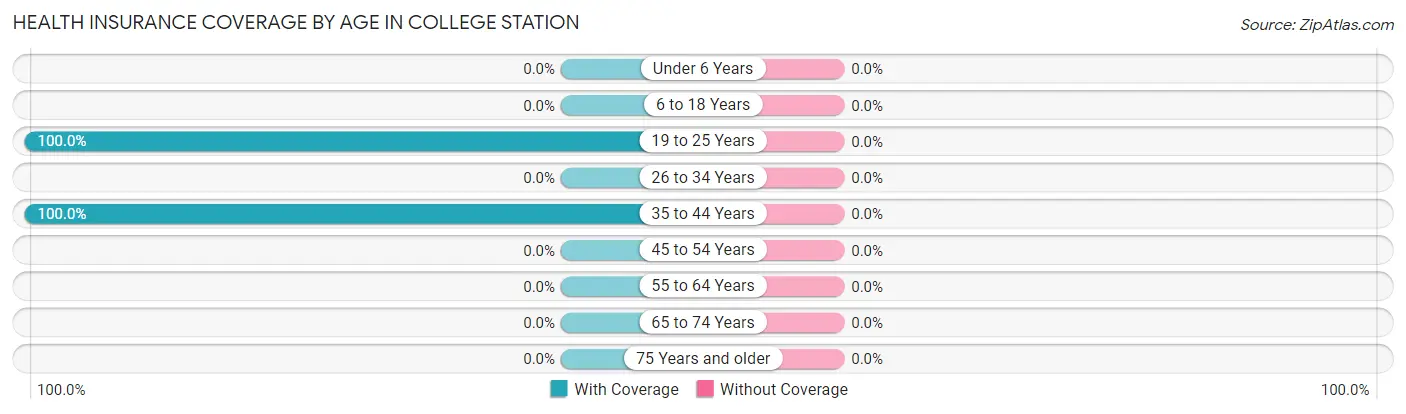
Health Insurance Coverage by Age in College Station
Age Bracket
With Coverage
Without Coverage
Under 6 Years
0 (0.0%)
0 (0.0%)
6 to 18 Years
0 (0.0%)
0 (0.0%)
19 to 25 Years
91 (100.0%)
0 (0.0%)
26 to 34 Years
0 (0.0%)
0 (0.0%)
35 to 44 Years
77 (100.0%)
0 (0.0%)
45 to 54 Years
0 (0.0%)
0 (0.0%)
55 to 64 Years
0 (0.0%)
0 (0.0%)
65 to 74 Years
0 (0.0%)
0 (0.0%)
75 Years and older
0 (0.0%)
0 (0.0%)
Total
168 (100.0%)
0 (0.0%)
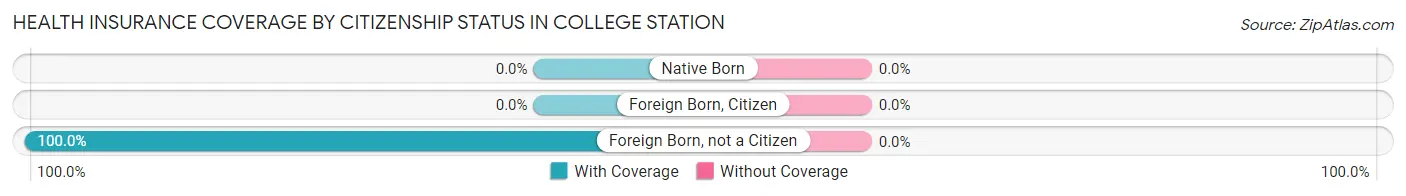
Health Insurance Coverage by Citizenship Status in College Station
Citizenship Status
With Coverage
Without Coverage
Native Born
0 (0.0%)
0 (0.0%)
Foreign Born, Citizen
0 (0.0%)
0 (0.0%)
Foreign Born, not a Citizen
91 (100.0%)
0 (0.0%)
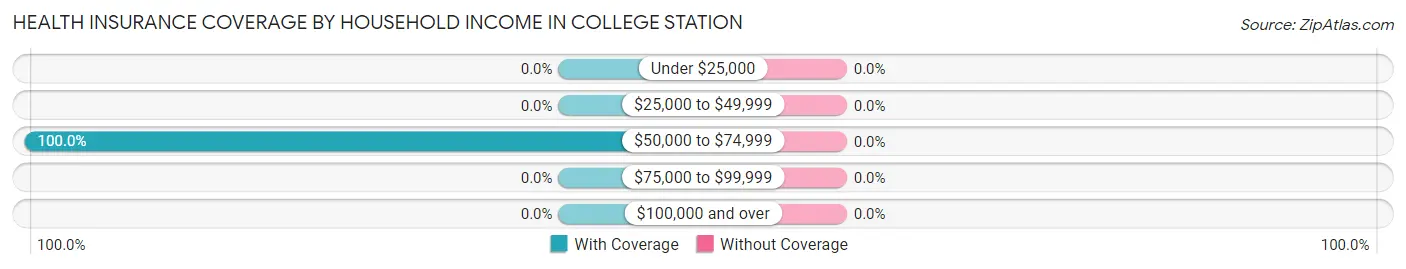
Health Insurance Coverage by Household Income in College Station
Household Income
With Coverage
Without Coverage
Under $25,000
0 (0.0%)
0 (0.0%)
$25,000 to $49,999
0 (0.0%)
0 (0.0%)
$50,000 to $74,999
168 (100.0%)
0 (0.0%)
$75,000 to $99,999
0 (0.0%)
0 (0.0%)
$100,000 and over
0 (0.0%)
0 (0.0%)
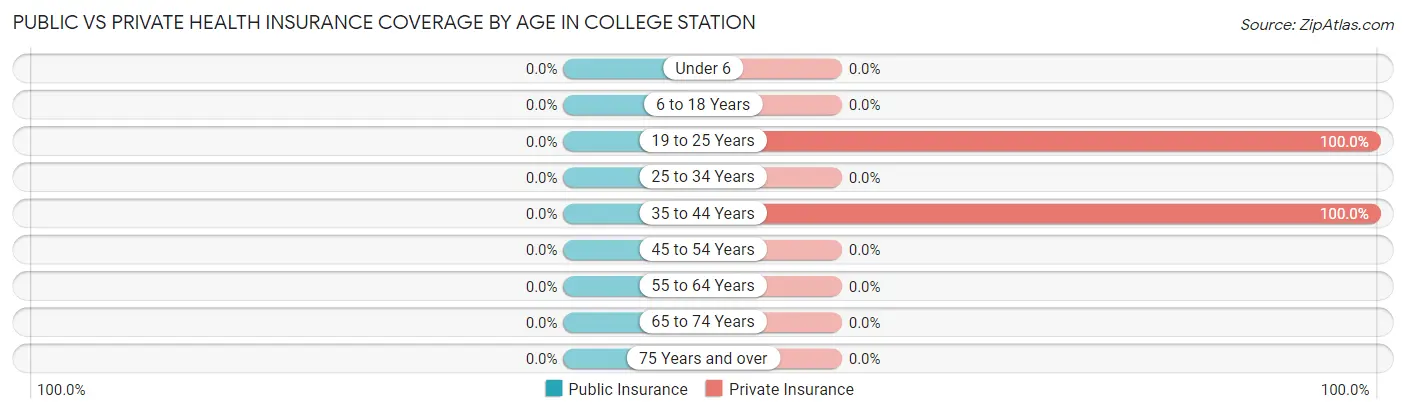
Public vs Private Health Insurance Coverage by Age in College Station
Age Bracket
Public Insurance
Private Insurance
Under 6
0 (0.0%)
0 (0.0%)
6 to 18 Years
0 (0.0%)
0 (0.0%)
19 to 25 Years
0 (0.0%)
91 (100.0%)
25 to 34 Years
0 (0.0%)
0 (0.0%)
35 to 44 Years
0 (0.0%)
77 (100.0%)
45 to 54 Years
0 (0.0%)
0 (0.0%)
55 to 64 Years
0 (0.0%)
0 (0.0%)
65 to 74 Years
0 (0.0%)
0 (0.0%)
75 Years and over
0 (0.0%)
0 (0.0%)
Total
0 (0.0%)
168 (100.0%)
Disability Status by Sex by Age in College Station
Age Bracket
Male
Female
Under 5 Years
0 (0.0%)
0 (0.0%)
5 to 17 Years
0 (0.0%)
0 (0.0%)
18 to 34 Years
0 (0.0%)
0 (0.0%)
35 to 64 Years
0 (0.0%)
0 (0.0%)
65 to 74 Years
0 (0.0%)
0 (0.0%)
75 Years and over
0 (0.0%)
0 (0.0%)
Disability Class by Sex by Age in College Station
Disability Class: Hearing Difficulty
Age Bracket
Male
Female
Under 5 Years
0 (0.0%)
0 (0.0%)
5 to 17 Years
0 (0.0%)
0 (0.0%)
18 to 34 Years
0 (0.0%)
0 (0.0%)
35 to 64 Years
0 (0.0%)
0 (0.0%)
65 to 74 Years
0 (0.0%)
0 (0.0%)
75 Years and over
0 (0.0%)
0 (0.0%)
Disability Class: Vision Difficulty
Age Bracket
Male
Female
Under 5 Years
0 (0.0%)
0 (0.0%)
5 to 17 Years
0 (0.0%)
0 (0.0%)
18 to 34 Years
0 (0.0%)
0 (0.0%)
35 to 64 Years
0 (0.0%)
0 (0.0%)
65 to 74 Years
0 (0.0%)
0 (0.0%)
75 Years and over
0 (0.0%)
0 (0.0%)
Disability Class: Cognitive Difficulty
Age Bracket
Male
Female
5 to 17 Years
0 (0.0%)
0 (0.0%)
18 to 34 Years
0 (0.0%)
0 (0.0%)
35 to 64 Years
0 (0.0%)
0 (0.0%)
65 to 74 Years
0 (0.0%)
0 (0.0%)
75 Years and over
0 (0.0%)
0 (0.0%)
Disability Class: Ambulatory Difficulty
Age Bracket
Male
Female
5 to 17 Years
0 (0.0%)
0 (0.0%)
18 to 34 Years
0 (0.0%)
0 (0.0%)
35 to 64 Years
0 (0.0%)
0 (0.0%)
65 to 74 Years
0 (0.0%)
0 (0.0%)
75 Years and over
0 (0.0%)
0 (0.0%)
Disability Class: Self-Care Difficulty
Age Bracket
Male
Female
5 to 17 Years
0 (0.0%)
0 (0.0%)
18 to 34 Years
0 (0.0%)
0 (0.0%)
35 to 64 Years
0 (0.0%)
0 (0.0%)
65 to 74 Years
0 (0.0%)
0 (0.0%)
75 Years and over
0 (0.0%)
0 (0.0%)
Technology Access in College Station
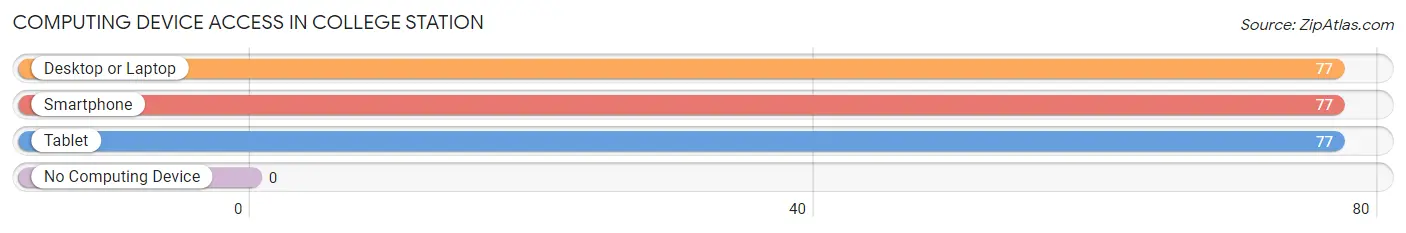
Computing Device Access in College Station
Device Type
# Households
% Households
Desktop or Laptop
77
100.0%
Smartphone
77
100.0%
Tablet
77
100.0%
No Computing Device
0
0.0%
Total
77
100.0%
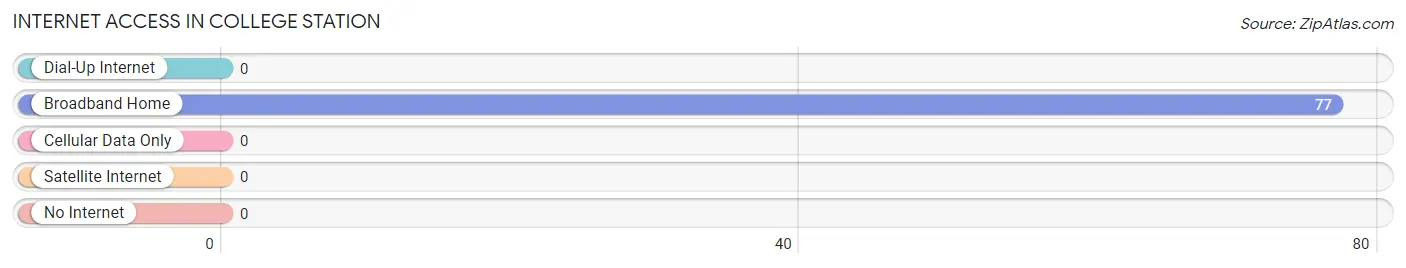
Internet Access in College Station
Internet Type
# Households
% Households
Dial-Up Internet
0
0.0%
Broadband Home
77
100.0%
Cellular Data Only
0
0.0%
Satellite Internet
0
0.0%
No Internet
0
0.0%
Total
77
100.0%
College Station Summary
History
The city of College Station, Arkansas is located in the northwest corner of the state, in Washington County. It is situated on the banks of the White River, and is the county seat of Washington County. The city was founded in 1836, and was originally known as Washington Courthouse. The city was renamed College Station in 1875, when the Arkansas Industrial University (now the University of Arkansas) was established in the city.
The city of College Station has a rich history, and has been home to many notable figures throughout its history. The city was the birthplace of the famous Arkansas politician and statesman, Senator J. William Fulbright. Fulbright was born in College Station in 1905, and went on to become a United States Senator from Arkansas, and the namesake of the Fulbright Program.
The city was also home to the first African-American college in Arkansas, the Arkansas Baptist College. The college was founded in 1884, and was the first college in the state to offer higher education to African-Americans. The college was closed in the late 1960s, but its legacy still lives on in the city.
Geography
College Station is located in the northwest corner of Arkansas, in Washington County. The city is situated on the banks of the White River, and is bordered by the cities of Fayetteville, Springdale, and Rogers. The city is located in the Ozark Mountains, and is surrounded by rolling hills and forests. The city has a total area of 8.3 square miles, and has an elevation of 845 feet.
The climate in College Station is humid subtropical, with hot, humid summers and mild winters. The average annual temperature is around 64 degrees Fahrenheit, and the average annual precipitation is around 45 inches.
Economy
The economy of College Station is largely based on the University of Arkansas, which is the largest employer in the city. Other major employers in the city include the Washington Regional Medical Center, the Washington County Courthouse, and the Washington County Sheriff's Office.
The city also has a thriving tourism industry, with many visitors coming to the city to visit the University of Arkansas, as well as the many historical sites in the city. The city is also home to several wineries, and is a popular destination for wine enthusiasts.
Demographics
As of the 2010 census, the population of College Station was 8,845. The racial makeup of the city was 79.2% White, 15.3% African American, 0.4% Native American, 1.2% Asian, 0.1% Pacific Islander, and 3.8% from other races. The median household income in the city was $37,945, and the median family income was $45,945. The per capita income in the city was $20,945.
Conclusion
College Station, Arkansas is a city with a rich history and a vibrant economy. The city is home to the University of Arkansas, as well as many other businesses and attractions. The city has a diverse population, and is a popular destination for tourists and wine enthusiasts. The city has a humid subtropical climate, and is surrounded by rolling hills and forests. College Station is a great place to live, work, and visit.
Common Questions
What is Per Capita Income in College Station?
Per Capita income in College Station is $27,306.
What is the Total Population of College Station?
Total Population of College Station is 230.
What is the Total Male Population of College Station?
Total Male Population of College Station is 38.
What is the Total Female Population of College Station?
Total Female Population of College Station is 192.
What is the Ratio of Males per 100 Females in College Station?
There are 19.79 Males per 100 Females in College Station.
What is the Ratio of Females per 100 Males in College Station?
There are 505.26 Females per 100 Males in College Station.
What is the Median Population Age in College Station?
Median Population Age in College Station is 44.3 Years.
What is the Average Family Size in College Station
Average Family Size in College Station is 2.2 People.
What is the Average Household Size in College Station
Average Household Size in College Station is 2.2 People.
How Large is the Labor Force in College Station?
There are 168 People in the Labor Forcein in College Station.
What is the Percentage of People in the Labor Force in College Station?
73.0% of People are in the Labor Force in College Station.
Report Title
Report Link
HTML Copy & Paste Link
Social Media
Copy and paste the folowing code into any webpage where you would like this interactive chart to display