Chidester, AR Map & Demographics
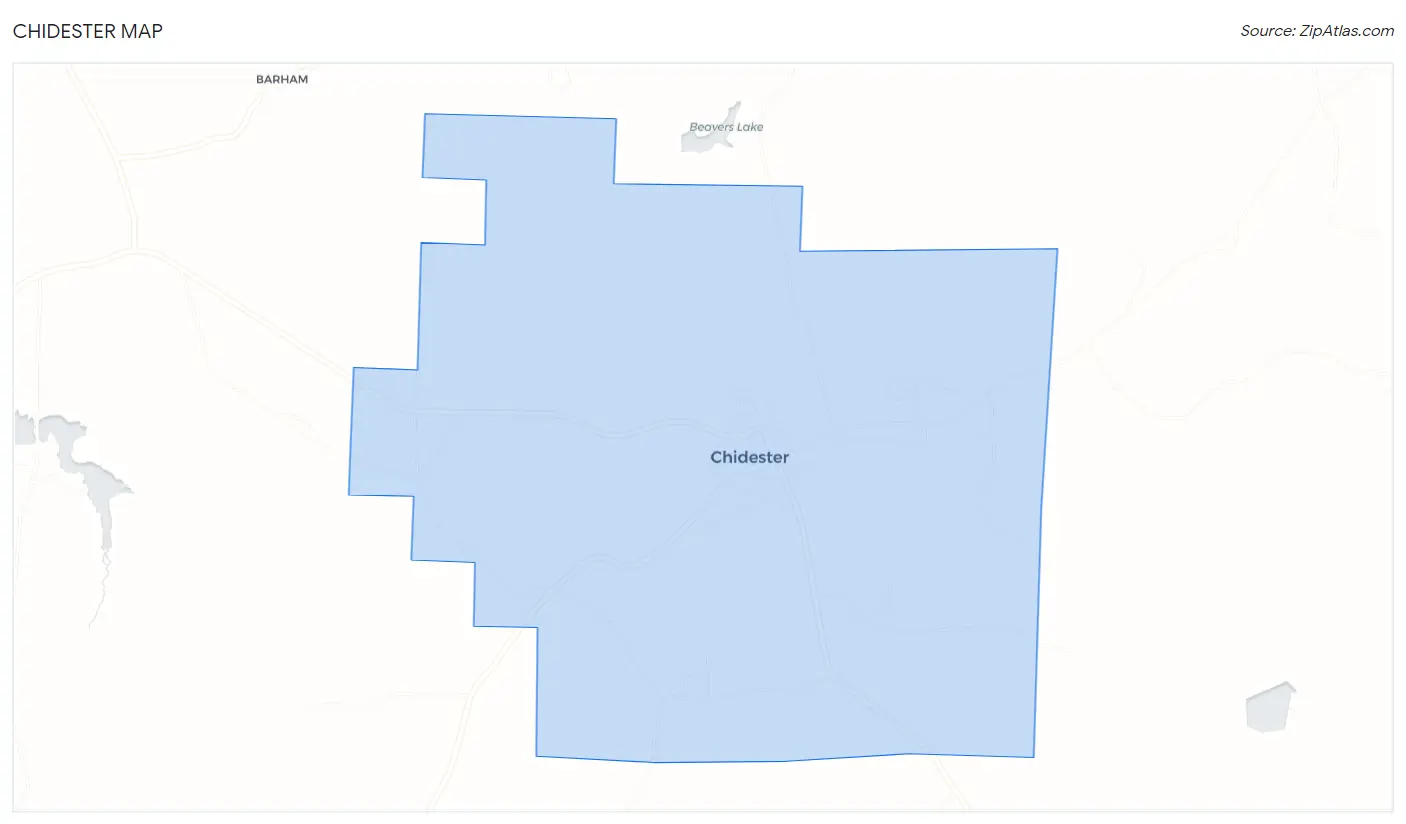
Chidester Map
Chidester Overview
$14,459
PER CAPITA INCOME
$68,036
AVG FAMILY INCOME
$22,167
AVG HOUSEHOLD INCOME
0.48
INEQUALITY / GINI INDEX
397
TOTAL POPULATION
226
MALE POPULATION
171
FEMALE POPULATION
132.16
MALES / 100 FEMALES
75.66
FEMALES / 100 MALES
51.5
MEDIAN AGE
4.5
AVG FAMILY SIZE
3.0
AVG HOUSEHOLD SIZE
113
LABOR FORCE [ PEOPLE ]
33.4%
PERCENT IN LABOR FORCE
Chidester Zip Codes
Chidester Area Codes
Income in Chidester
Income Overview in Chidester
Per Capita Income in Chidester is $14,459, while median incomes of families and households are $68,036 and $22,167 respectively.
| Characteristic | Number | Measure |
| Per Capita Income | 397 | $14,459 |
| Median Family Income | 71 | $68,036 |
| Mean Family Income | 71 | $58,439 |
| Median Household Income | 132 | $22,167 |
| Mean Household Income | 132 | $38,989 |
| Income Deficit | 71 | $0 |
| Wage / Income Gap (%) | 397 | 0.00% |
| Wage / Income Gap ($) | 397 | 100.00¢ per $1 |
| Gini / Inequality Index | 397 | 0.48 |
Earnings by Sex in Chidester
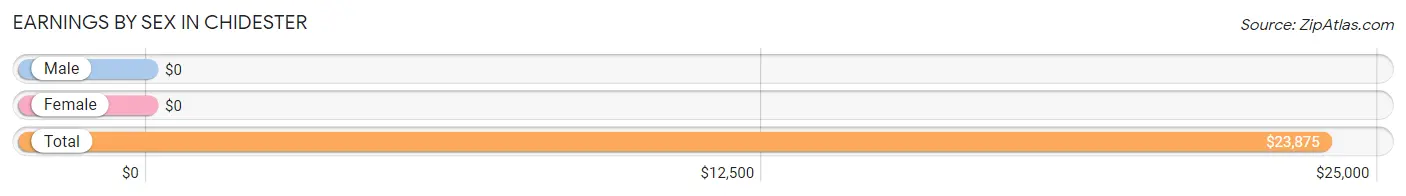
| Sex | Number | Average Earnings |
| Male | 50 (43.5%) | $0 |
| Female | 65 (56.5%) | $0 |
| Total | 115 (100.0%) | $23,875 |
Earnings by Sex by Income Bracket in Chidester
The most common earnings brackets in Chidester are $15,000 to $17,499 for men (13 | 26.0%) and $2,500 to $4,999 for women (26 | 40.0%).
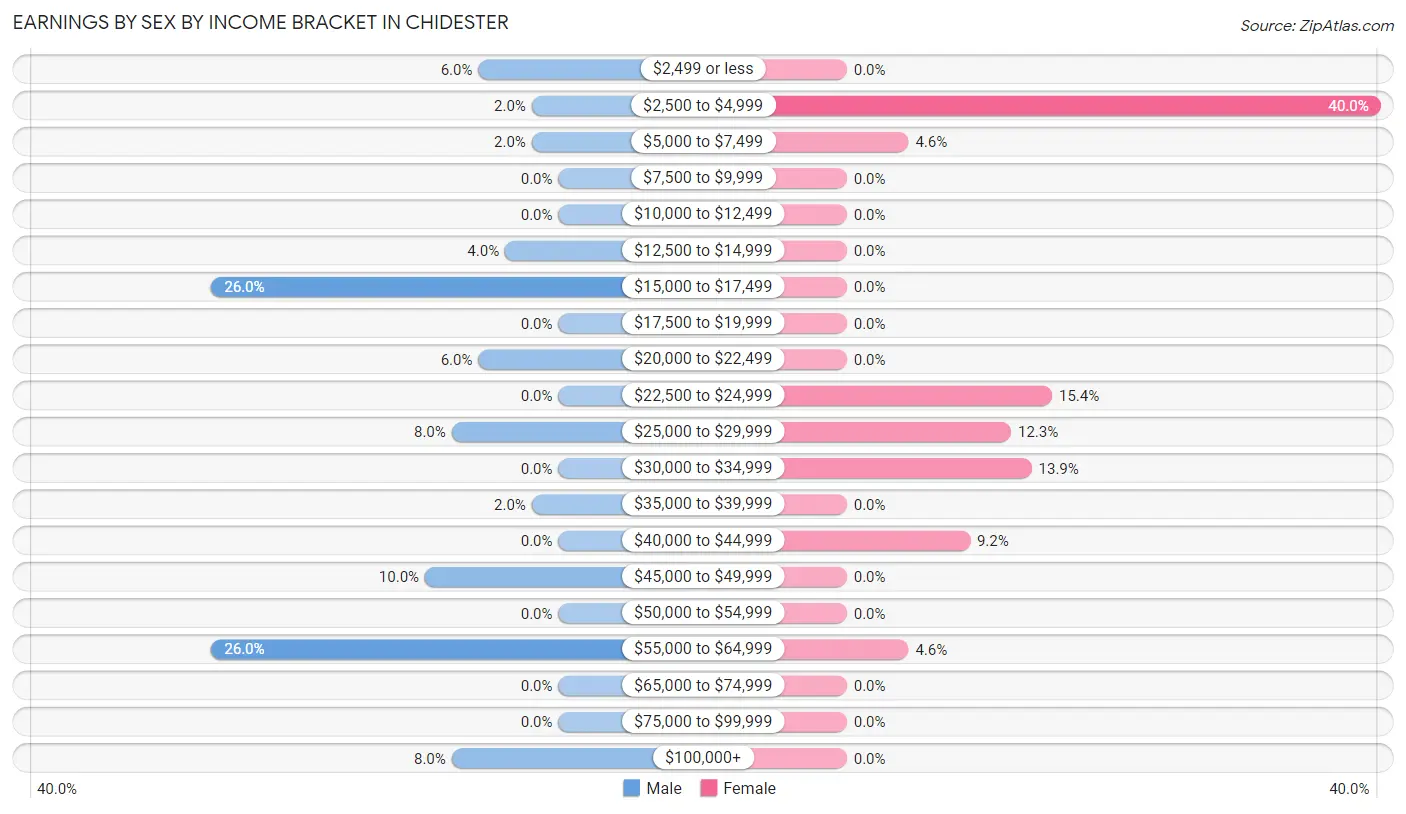
| Income | Male | Female |
| $2,499 or less | 3 (6.0%) | 0 (0.0%) |
| $2,500 to $4,999 | 1 (2.0%) | 26 (40.0%) |
| $5,000 to $7,499 | 1 (2.0%) | 3 (4.6%) |
| $7,500 to $9,999 | 0 (0.0%) | 0 (0.0%) |
| $10,000 to $12,499 | 0 (0.0%) | 0 (0.0%) |
| $12,500 to $14,999 | 2 (4.0%) | 0 (0.0%) |
| $15,000 to $17,499 | 13 (26.0%) | 0 (0.0%) |
| $17,500 to $19,999 | 0 (0.0%) | 0 (0.0%) |
| $20,000 to $22,499 | 3 (6.0%) | 0 (0.0%) |
| $22,500 to $24,999 | 0 (0.0%) | 10 (15.4%) |
| $25,000 to $29,999 | 4 (8.0%) | 8 (12.3%) |
| $30,000 to $34,999 | 0 (0.0%) | 9 (13.9%) |
| $35,000 to $39,999 | 1 (2.0%) | 0 (0.0%) |
| $40,000 to $44,999 | 0 (0.0%) | 6 (9.2%) |
| $45,000 to $49,999 | 5 (10.0%) | 0 (0.0%) |
| $50,000 to $54,999 | 0 (0.0%) | 0 (0.0%) |
| $55,000 to $64,999 | 13 (26.0%) | 3 (4.6%) |
| $65,000 to $74,999 | 0 (0.0%) | 0 (0.0%) |
| $75,000 to $99,999 | 0 (0.0%) | 0 (0.0%) |
| $100,000+ | 4 (8.0%) | 0 (0.0%) |
| Total | 50 (100.0%) | 65 (100.0%) |
Earnings by Sex by Educational Attainment in Chidester
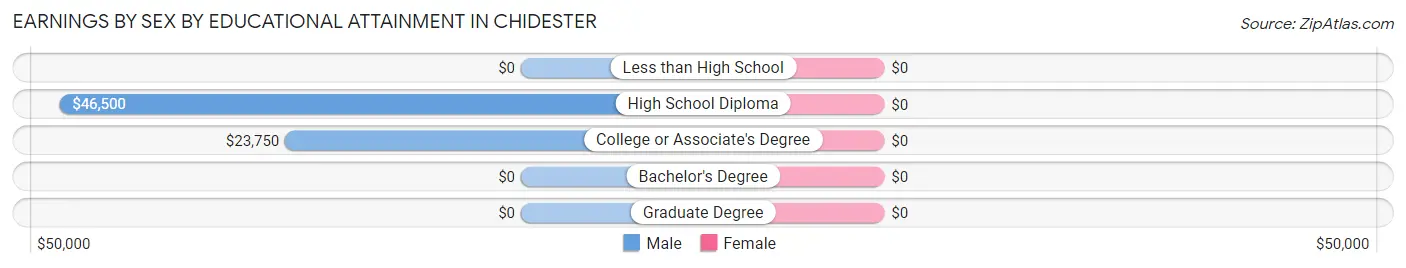
| Educational Attainment | Male Income | Female Income |
| Less than High School | - | - |
| High School Diploma | $46,500 | $0 |
| College or Associate's Degree | $23,750 | $0 |
| Bachelor's Degree | - | - |
| Graduate Degree | - | - |
| Total | $47,000 | $0 |
Family Income in Chidester
Family Income Brackets in Chidester
According to the Chidester family income data, there are 20 families falling into the $75,000 to $99,999 income range, which is the most common income bracket and makes up 28.2% of all families.
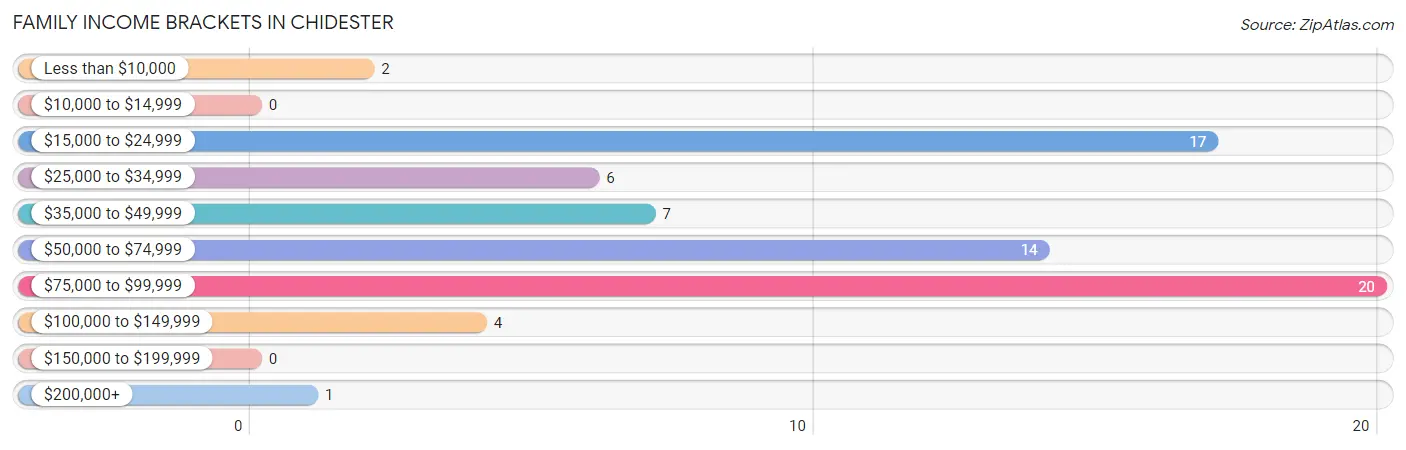
| Income Bracket | # Families | % Families |
| Less than $10,000 | 2 | 2.8% |
| $10,000 to $14,999 | 0 | 0.0% |
| $15,000 to $24,999 | 17 | 23.9% |
| $25,000 to $34,999 | 6 | 8.5% |
| $35,000 to $49,999 | 7 | 9.9% |
| $50,000 to $74,999 | 14 | 19.7% |
| $75,000 to $99,999 | 20 | 28.2% |
| $100,000 to $149,999 | 4 | 5.6% |
| $150,000 to $199,999 | 0 | 0.0% |
| $200,000+ | 1 | 1.4% |
Family Income by Famaliy Size in Chidester
2-person families (39 | 54.9%) account for the highest median family income in Chidester with $56,875 per family, while 2-person families (39 | 54.9%) have the highest median income of $28,438 per family member.
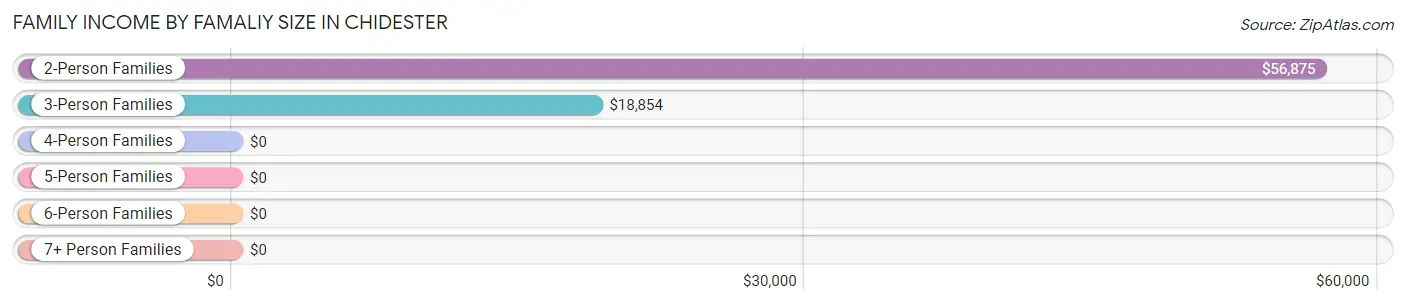
| Income Bracket | # Families | Median Income |
| 2-Person Families | 39 (54.9%) | $56,875 |
| 3-Person Families | 15 (21.1%) | $18,854 |
| 4-Person Families | 3 (4.2%) | $0 |
| 5-Person Families | 14 (19.7%) | $0 |
| 6-Person Families | 0 (0.0%) | $0 |
| 7+ Person Families | 0 (0.0%) | $0 |
| Total | 71 (100.0%) | $68,036 |
Family Income by Number of Earners in Chidester
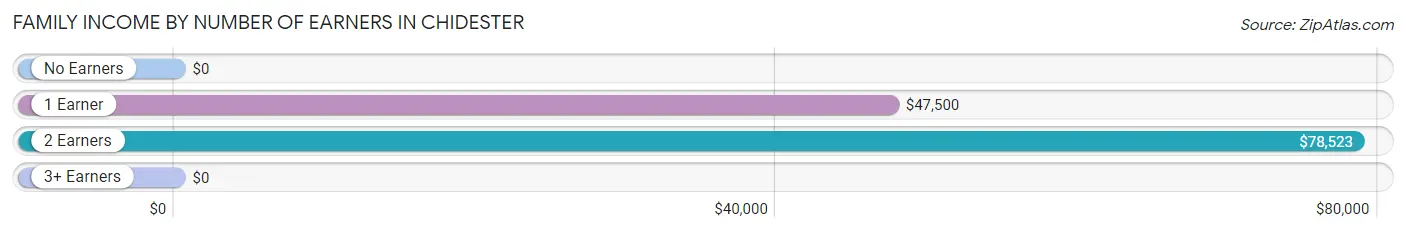
| Number of Earners | # Families | Median Income |
| No Earners | 25 (35.2%) | $0 |
| 1 Earner | 18 (25.4%) | $47,500 |
| 2 Earners | 21 (29.6%) | $78,523 |
| 3+ Earners | 7 (9.9%) | $0 |
| Total | 71 (100.0%) | $68,036 |
Household Income in Chidester
Household Income Brackets in Chidester
With 39 households falling in the category, the $15,000 to $24,999 income range is the most frequent in Chidester, accounting for 29.5% of all households.
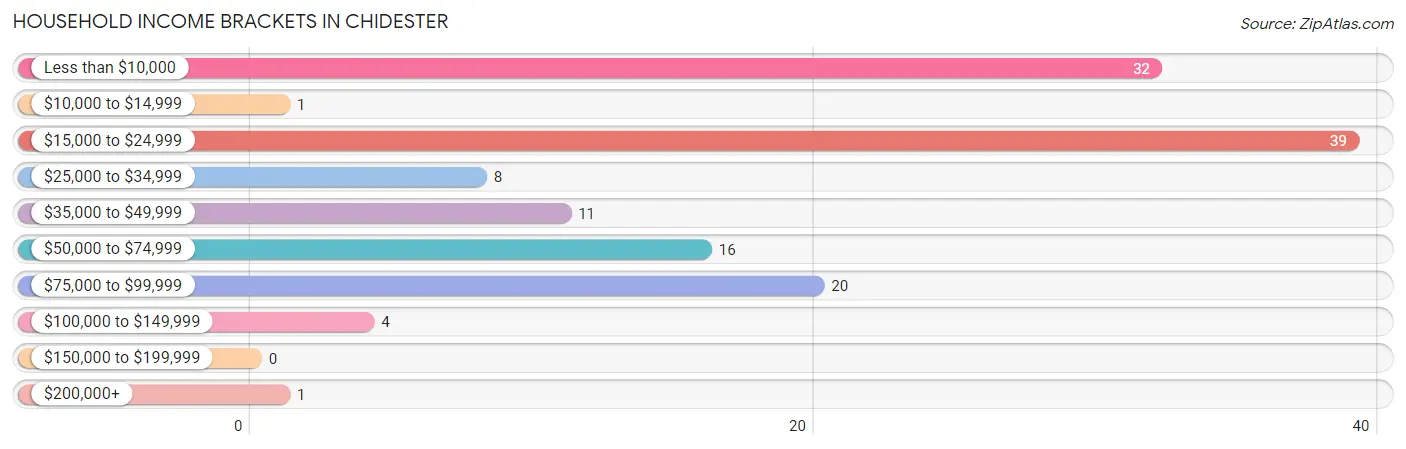
| Income Bracket | # Households | % Households |
| Less than $10,000 | 32 | 24.2% |
| $10,000 to $14,999 | 1 | 0.8% |
| $15,000 to $24,999 | 39 | 29.5% |
| $25,000 to $34,999 | 8 | 6.1% |
| $35,000 to $49,999 | 11 | 8.3% |
| $50,000 to $74,999 | 16 | 12.1% |
| $75,000 to $99,999 | 20 | 15.2% |
| $100,000 to $149,999 | 4 | 3.0% |
| $150,000 to $199,999 | 0 | 0.0% |
| $200,000+ | 1 | 0.8% |
Household Income by Householder Age in Chidester
The median household income in Chidester is $22,167, with the highest median household income of $21,518 found in the 65+ years age bracket for the primary householder. A total of 67 households (50.8%) fall into this category.
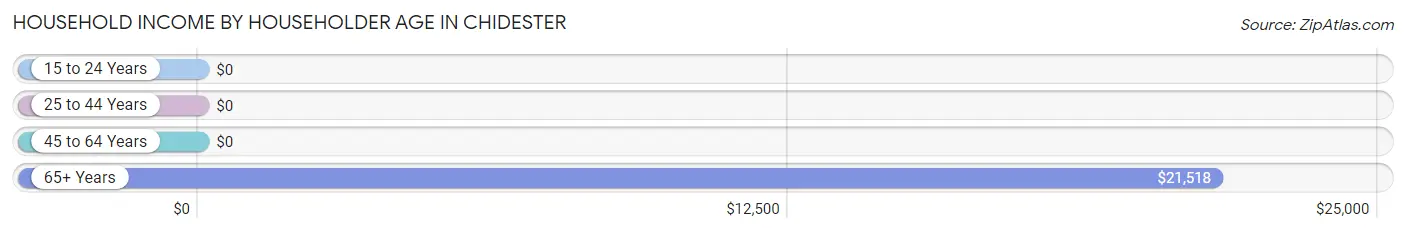
| Income Bracket | # Households | Median Income |
| 15 to 24 Years | 0 (0.0%) | $0 |
| 25 to 44 Years | 31 (23.5%) | $0 |
| 45 to 64 Years | 34 (25.8%) | $0 |
| 65+ Years | 67 (50.8%) | $21,518 |
| Total | 132 (100.0%) | $22,167 |
Poverty in Chidester
Income Below Poverty by Sex and Age in Chidester
With 58.9% poverty level for males and 20.8% for females among the residents of Chidester, 55 to 64 year old males and 55 to 64 year old females are the most vulnerable to poverty, with 38 males (86.4%) and 12 females (57.1%) in their respective age groups living below the poverty level.
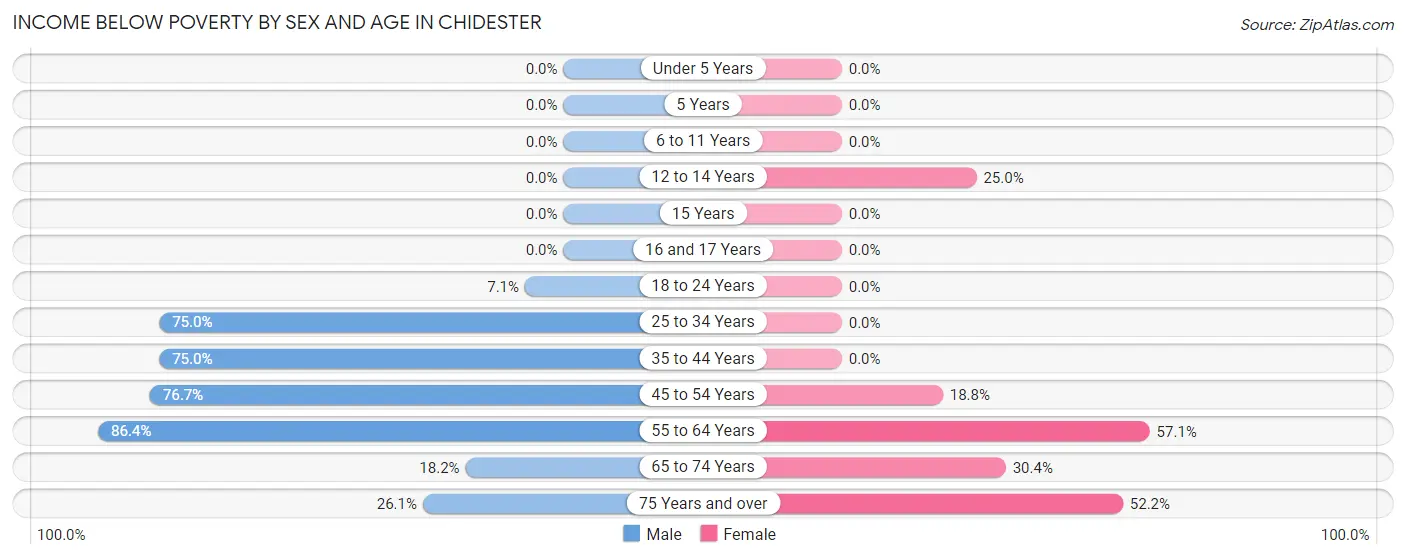
| Age Bracket | Male | Female |
| Under 5 Years | 0 (0.0%) | 0 (0.0%) |
| 5 Years | 0 (0.0%) | 0 (0.0%) |
| 6 to 11 Years | 0 (0.0%) | 0 (0.0%) |
| 12 to 14 Years | 0 (0.0%) | 1 (25.0%) |
| 15 Years | 0 (0.0%) | 0 (0.0%) |
| 16 and 17 Years | 0 (0.0%) | 0 (0.0%) |
| 18 to 24 Years | 1 (7.1%) | 0 (0.0%) |
| 25 to 34 Years | 9 (75.0%) | 0 (0.0%) |
| 35 to 44 Years | 9 (75.0%) | 0 (0.0%) |
| 45 to 54 Years | 66 (76.7%) | 3 (18.8%) |
| 55 to 64 Years | 38 (86.4%) | 12 (57.1%) |
| 65 to 74 Years | 4 (18.2%) | 7 (30.4%) |
| 75 Years and over | 6 (26.1%) | 12 (52.2%) |
| Total | 133 (58.9%) | 35 (20.8%) |
Income Above Poverty by Sex and Age in Chidester
According to the poverty statistics in Chidester, males aged 6 to 11 years and females aged 5 years are the age groups that are most secure financially, with 100.0% of males and 100.0% of females in these age groups living above the poverty line.
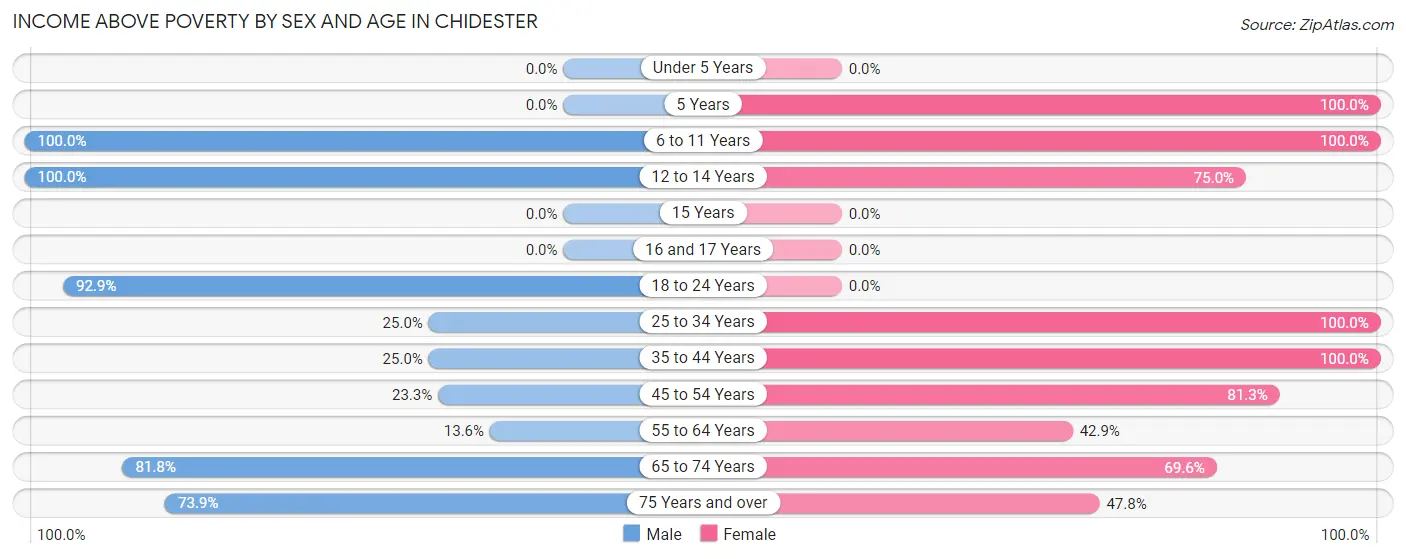
| Age Bracket | Male | Female |
| Under 5 Years | 0 (0.0%) | 0 (0.0%) |
| 5 Years | 0 (0.0%) | 3 (100.0%) |
| 6 to 11 Years | 11 (100.0%) | 36 (100.0%) |
| 12 to 14 Years | 2 (100.0%) | 3 (75.0%) |
| 15 Years | 0 (0.0%) | 0 (0.0%) |
| 16 and 17 Years | 0 (0.0%) | 0 (0.0%) |
| 18 to 24 Years | 13 (92.9%) | 0 (0.0%) |
| 25 to 34 Years | 3 (25.0%) | 30 (100.0%) |
| 35 to 44 Years | 3 (25.0%) | 12 (100.0%) |
| 45 to 54 Years | 20 (23.3%) | 13 (81.2%) |
| 55 to 64 Years | 6 (13.6%) | 9 (42.9%) |
| 65 to 74 Years | 18 (81.8%) | 16 (69.6%) |
| 75 Years and over | 17 (73.9%) | 11 (47.8%) |
| Total | 93 (41.1%) | 133 (79.2%) |
Income Below Poverty Among Married-Couple Families in Chidester
The poverty statistics for married-couple families in Chidester show that 7.5% or 4 of the total 53 families live below the poverty line. Families with no children have the highest poverty rate of 8.8%, comprising of 3 families. On the other hand, families with 1 or 2 children have the lowest poverty rate of 5.3%, which includes 1 families.
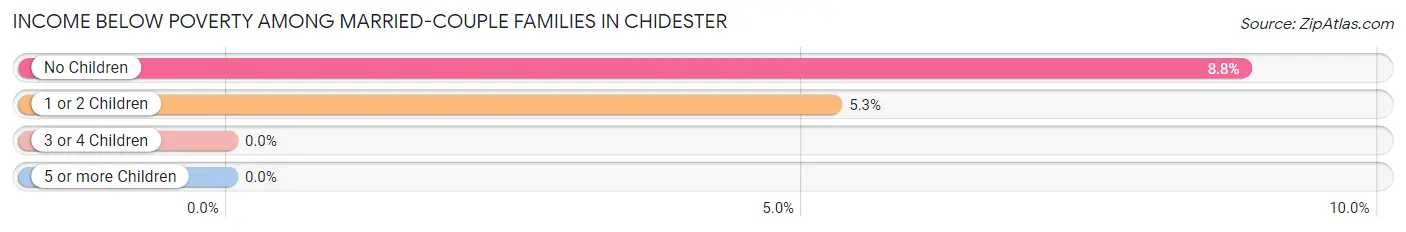
| Children | Above Poverty | Below Poverty |
| No Children | 31 (91.2%) | 3 (8.8%) |
| 1 or 2 Children | 18 (94.7%) | 1 (5.3%) |
| 3 or 4 Children | 0 (0.0%) | 0 (0.0%) |
| 5 or more Children | 0 (0.0%) | 0 (0.0%) |
| Total | 49 (92.4%) | 4 (7.5%) |
Income Below Poverty Among Single-Parent Households in Chidester
According to the poverty data in Chidester, 100.0% or 3 single-father households and 80.0% or 12 single-mother households are living below the poverty line. Among single-father households, those with no children have the highest poverty rate, with 3 households (100.0%) experiencing poverty. Likewise, among single-mother households, those with no children have the highest poverty rate, with 12 households (92.3%) falling below the poverty line.
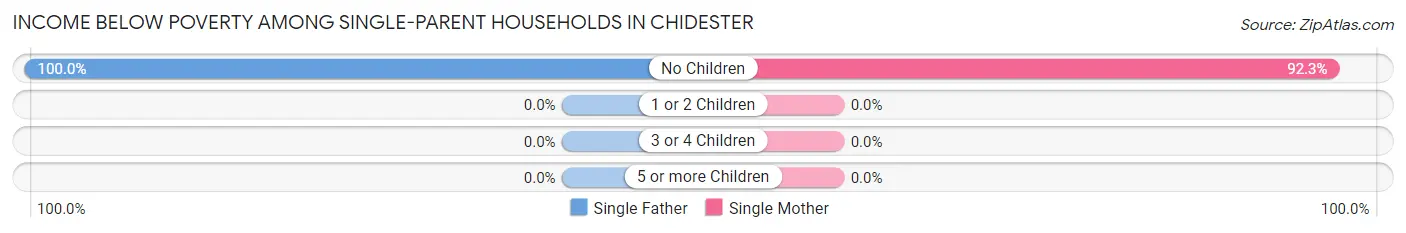
| Children | Single Father | Single Mother |
| No Children | 3 (100.0%) | 12 (92.3%) |
| 1 or 2 Children | 0 (0.0%) | 0 (0.0%) |
| 3 or 4 Children | 0 (0.0%) | 0 (0.0%) |
| 5 or more Children | 0 (0.0%) | 0 (0.0%) |
| Total | 3 (100.0%) | 12 (80.0%) |
Income Below Poverty Among Married-Couple vs Single-Parent Households in Chidester
The poverty data for Chidester shows that 4 of the married-couple family households (7.5%) and 15 of the single-parent households (83.3%) are living below the poverty level. Within the married-couple family households, those with no children have the highest poverty rate, with 3 households (8.8%) falling below the poverty line. Among the single-parent households, those with no children have the highest poverty rate, with 15 household (93.8%) living below poverty.
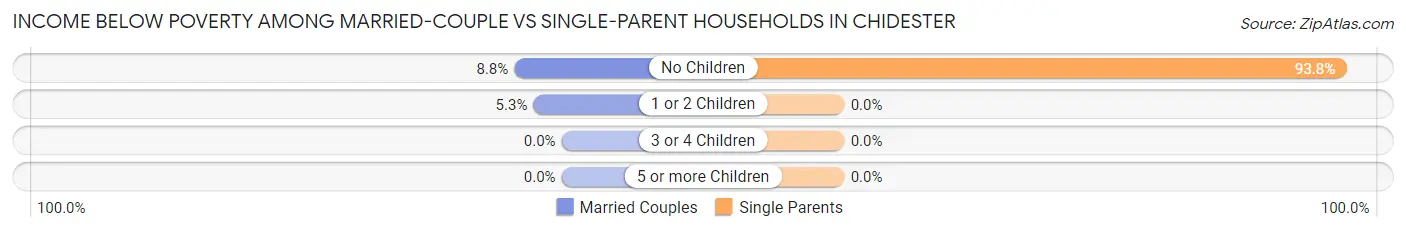
| Children | Married-Couple Families | Single-Parent Households |
| No Children | 3 (8.8%) | 15 (93.8%) |
| 1 or 2 Children | 1 (5.3%) | 0 (0.0%) |
| 3 or 4 Children | 0 (0.0%) | 0 (0.0%) |
| 5 or more Children | 0 (0.0%) | 0 (0.0%) |
| Total | 4 (7.5%) | 15 (83.3%) |
Race in Chidester
The most populous races in Chidester are Black / African American (327 | 82.4%), White / Caucasian (67 | 16.9%), and Asian (3 | 0.8%).
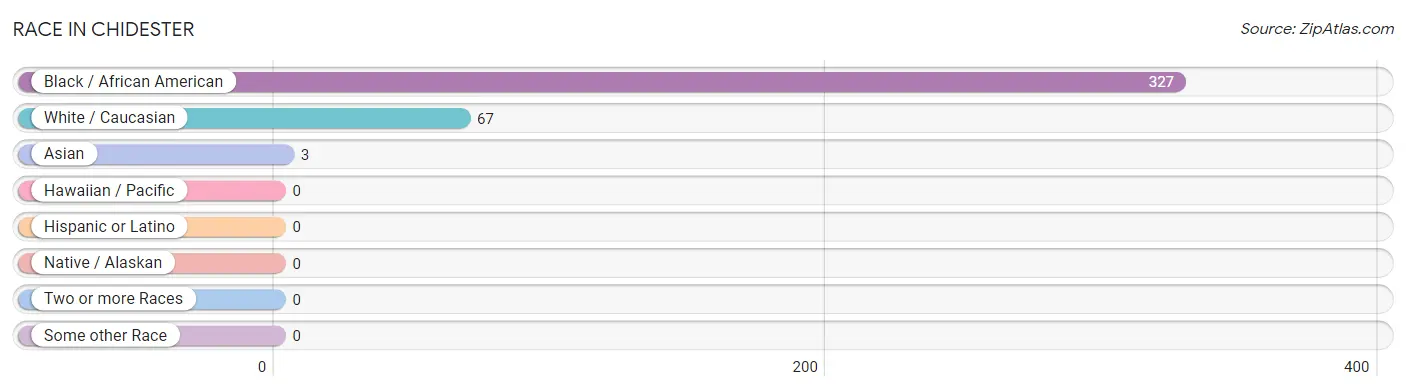
| Race | # Population | % Population |
| Asian | 3 | 0.8% |
| Black / African American | 327 | 82.4% |
| Hawaiian / Pacific | 0 | 0.0% |
| Hispanic or Latino | 0 | 0.0% |
| Native / Alaskan | 0 | 0.0% |
| White / Caucasian | 67 | 16.9% |
| Two or more Races | 0 | 0.0% |
| Some other Race | 0 | 0.0% |
| Total | 397 | 100.0% |
Ancestry in Chidester
The most populous ancestries reported in Chidester are American (26 | 6.6%), German (9 | 2.3%), Danish (6 | 1.5%), English (4 | 1.0%), and Irish (4 | 1.0%), together accounting for 12.3% of all Chidester residents.
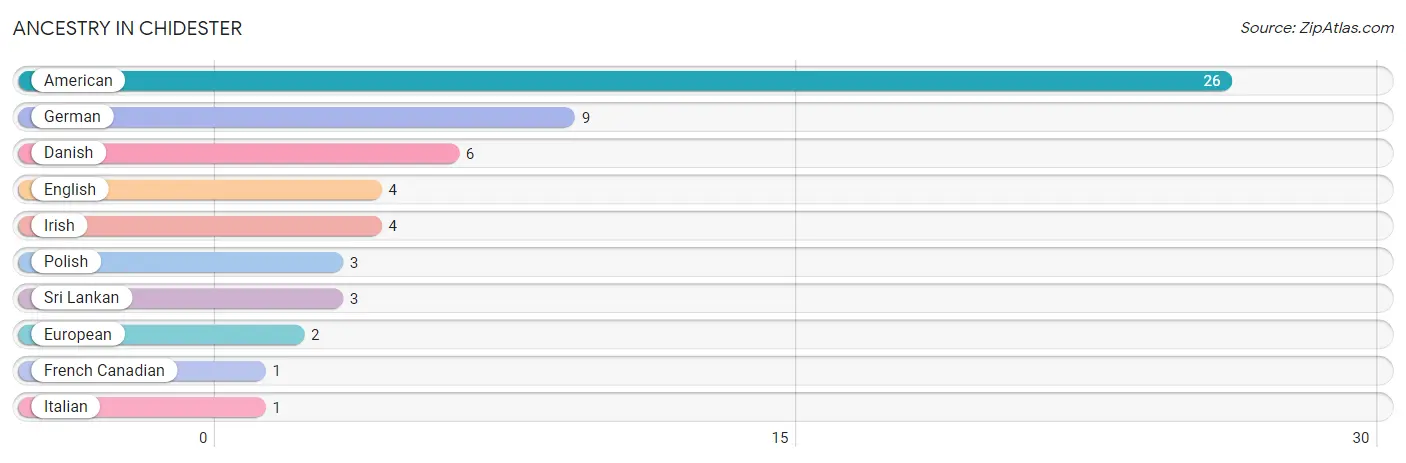
| Ancestry | # Population | % Population |
| American | 26 | 6.6% |
| Danish | 6 | 1.5% |
| English | 4 | 1.0% |
| European | 2 | 0.5% |
| French Canadian | 1 | 0.3% |
| German | 9 | 2.3% |
| Irish | 4 | 1.0% |
| Italian | 1 | 0.3% |
| Polish | 3 | 0.8% |
| Sri Lankan | 3 | 0.8% | View All 10 Rows |
Immigrants in Chidester
The most numerous immigrant groups reported in Chidester came from Africa (3 | 0.8%), Nigeria (3 | 0.8%), and Western Africa (3 | 0.8%), together accounting for 2.3% of all Chidester residents.
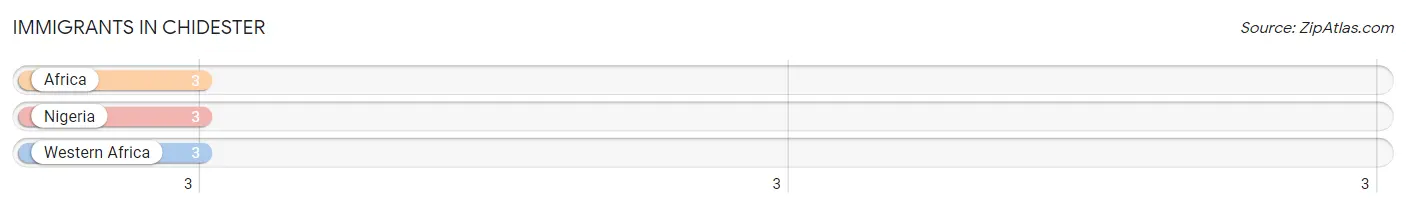
| Immigration Origin | # Population | % Population |
| Africa | 3 | 0.8% |
| Nigeria | 3 | 0.8% |
| Western Africa | 3 | 0.8% | View All 3 Rows |
Sex and Age in Chidester
Sex and Age in Chidester
The most populous age groups in Chidester are 50 to 54 Years (75 | 33.2%) for men and 5 to 9 Years (29 | 17.0%) for women.
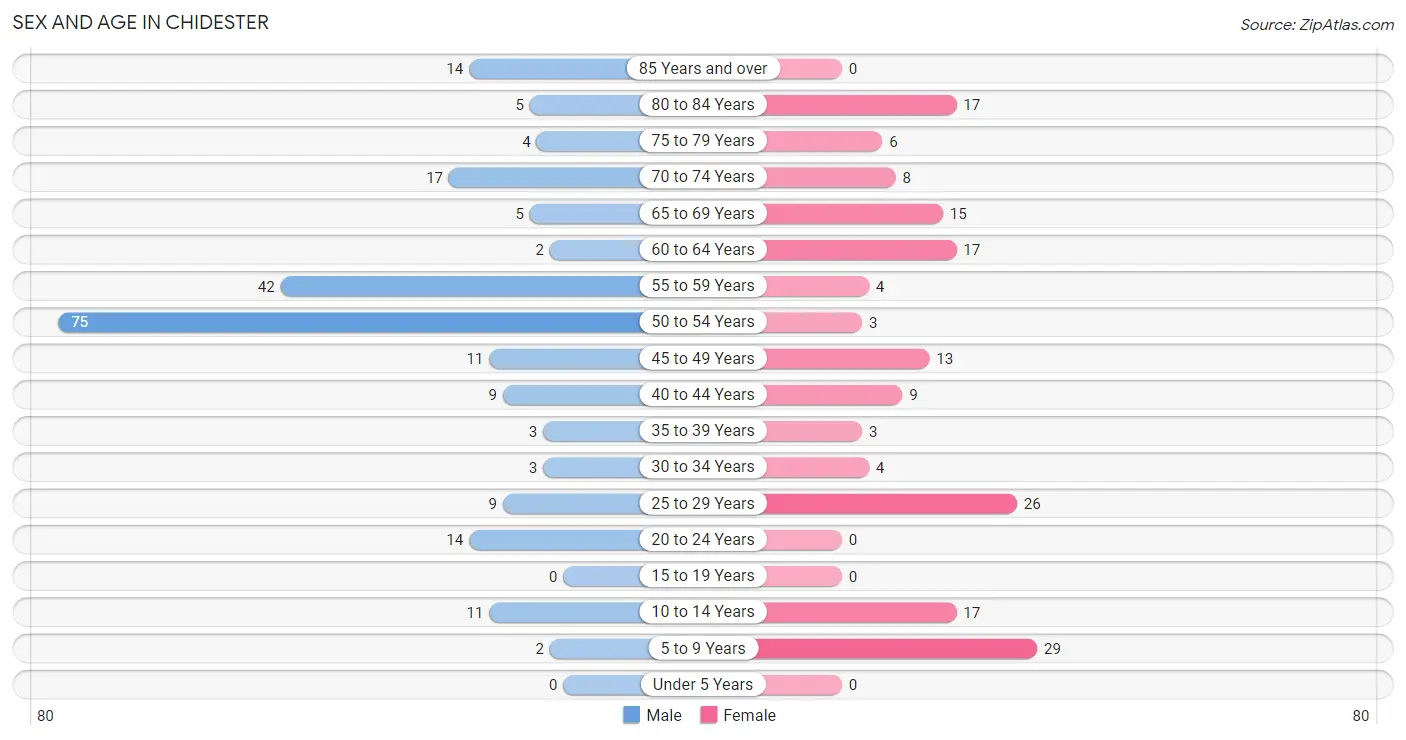
| Age Bracket | Male | Female |
| Under 5 Years | 0 (0.0%) | 0 (0.0%) |
| 5 to 9 Years | 2 (0.9%) | 29 (17.0%) |
| 10 to 14 Years | 11 (4.9%) | 17 (9.9%) |
| 15 to 19 Years | 0 (0.0%) | 0 (0.0%) |
| 20 to 24 Years | 14 (6.2%) | 0 (0.0%) |
| 25 to 29 Years | 9 (4.0%) | 26 (15.2%) |
| 30 to 34 Years | 3 (1.3%) | 4 (2.3%) |
| 35 to 39 Years | 3 (1.3%) | 3 (1.8%) |
| 40 to 44 Years | 9 (4.0%) | 9 (5.3%) |
| 45 to 49 Years | 11 (4.9%) | 13 (7.6%) |
| 50 to 54 Years | 75 (33.2%) | 3 (1.8%) |
| 55 to 59 Years | 42 (18.6%) | 4 (2.3%) |
| 60 to 64 Years | 2 (0.9%) | 17 (9.9%) |
| 65 to 69 Years | 5 (2.2%) | 15 (8.8%) |
| 70 to 74 Years | 17 (7.5%) | 8 (4.7%) |
| 75 to 79 Years | 4 (1.8%) | 6 (3.5%) |
| 80 to 84 Years | 5 (2.2%) | 17 (9.9%) |
| 85 Years and over | 14 (6.2%) | 0 (0.0%) |
| Total | 226 (100.0%) | 171 (100.0%) |
Families and Households in Chidester
Median Family Size in Chidester
The median family size in Chidester is 4.54 persons per family, with single female/mother families (15 | 21.1%) accounting for the largest median family size of 8.13 persons per family. On the other hand, single male/father families (3 | 4.2%) represent the smallest median family size with 2.33 persons per family.
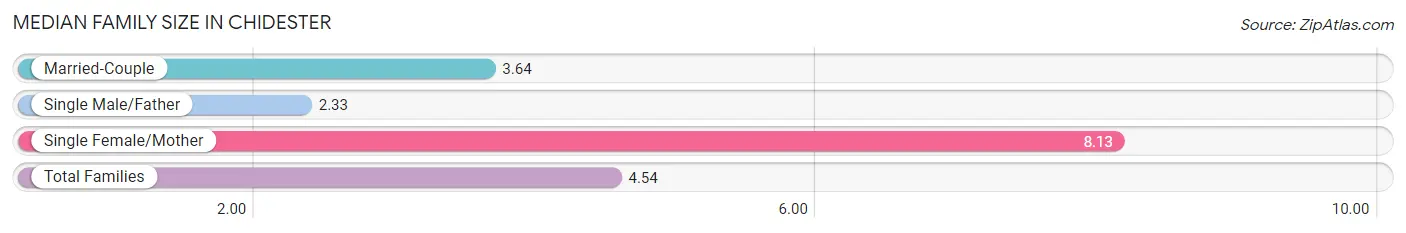
| Family Type | # Families | Family Size |
| Married-Couple | 53 (74.7%) | 3.64 |
| Single Male/Father | 3 (4.2%) | 2.33 |
| Single Female/Mother | 15 (21.1%) | 8.13 |
| Total Families | 71 (100.0%) | 4.54 |
Median Household Size in Chidester
The median household size in Chidester is 3.01 persons per household, with single female/mother households (15 | 11.4%) accounting for the largest median household size of 8.13 persons per household. non-family households (61 | 46.2%) represent the smallest median household size with 1.18 persons per household.
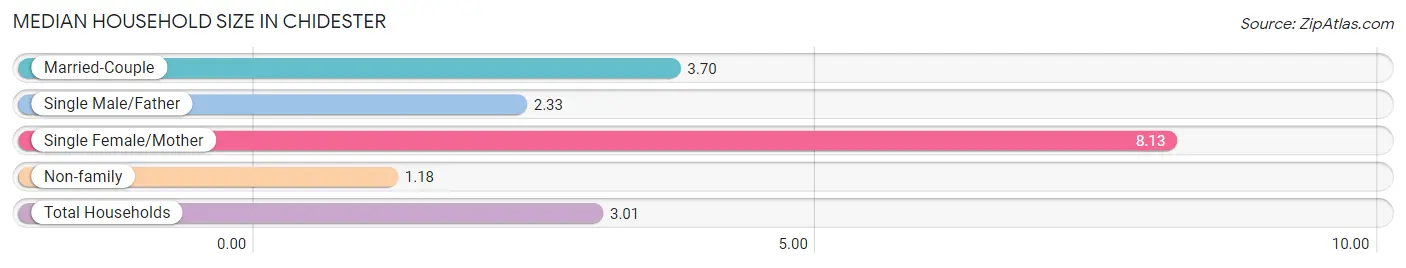
| Household Type | # Households | Household Size |
| Married-Couple | 53 (40.2%) | 3.70 |
| Single Male/Father | 3 (2.3%) | 2.33 |
| Single Female/Mother | 15 (11.4%) | 8.13 |
| Non-family | 61 (46.2%) | 1.18 |
| Total Households | 132 (100.0%) | 3.01 |
Household Size by Marriage Status in Chidester
Out of a total of 132 households in Chidester, 71 (53.8%) are family households, while 61 (46.2%) are nonfamily households. The most numerous type of family households are 2-person households, comprising 39, and the most common type of nonfamily households are 1-person households, comprising 57.
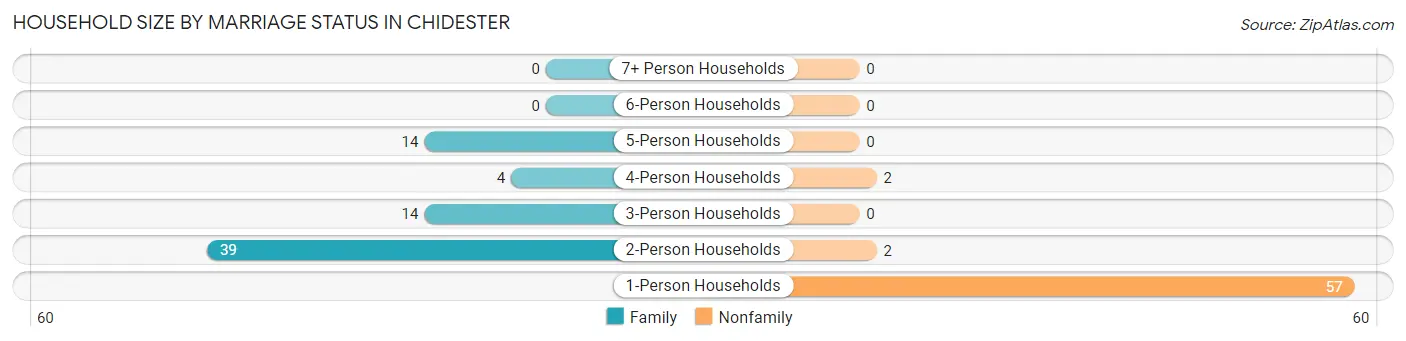
| Household Size | Family Households | Nonfamily Households |
| 1-Person Households | - | 57 (43.2%) |
| 2-Person Households | 39 (29.5%) | 2 (1.5%) |
| 3-Person Households | 14 (10.6%) | 0 (0.0%) |
| 4-Person Households | 4 (3.0%) | 2 (1.5%) |
| 5-Person Households | 14 (10.6%) | 0 (0.0%) |
| 6-Person Households | 0 (0.0%) | 0 (0.0%) |
| 7+ Person Households | 0 (0.0%) | 0 (0.0%) |
| Total | 71 (53.8%) | 61 (46.2%) |
Female Fertility in Chidester
Fertility by Age in Chidester
| Age Bracket | Women with Births | Births / 1,000 Women |
| 15 to 19 years | 0 (0.0%) | 0.0 |
| 20 to 34 years | 0 (0.0%) | 0.0 |
| 35 to 50 years | 0 (0.0%) | 0.0 |
| Total | 0 (0.0%) | 0.0 |
Fertility by Age by Marriage Status in Chidester
| Age Bracket | Married | Unmarried |
| 15 to 19 years | 0 (0.0%) | 0 (0.0%) |
| 20 to 34 years | 0 (0.0%) | 0 (0.0%) |
| 35 to 50 years | 0 (0.0%) | 0 (0.0%) |
| Total | 0 (0.0%) | 0 (0.0%) |
Fertility by Education in Chidester
| Educational Attainment | Women with Births | Births / 1,000 Women |
| Less than High School | 0 (0.0%) | 0.0 |
| High School Diploma | 0 (0.0%) | 0.0 |
| College or Associate's Degree | 0 (0.0%) | 0.0 |
| Bachelor's Degree | 0 (0.0%) | 0.0 |
| Graduate Degree | 0 (0.0%) | 0.0 |
| Total | 0 (0.0%) | 0.0 |
Fertility by Education by Marriage Status in Chidester
| Educational Attainment | Married | Unmarried |
| Less than High School | 0 (0.0%) | 0 (0.0%) |
| High School Diploma | 0 (0.0%) | 0 (0.0%) |
| College or Associate's Degree | 0 (0.0%) | 0 (0.0%) |
| Bachelor's Degree | 0 (0.0%) | 0 (0.0%) |
| Graduate Degree | 0 (0.0%) | 0 (0.0%) |
| Total | 0 (0.0%) | 0 (0.0%) |
Employment Characteristics in Chidester
Employment by Class of Employer in Chidester
Among the 113 employed individuals in Chidester, private company employees (65 | 57.5%), state government employees (23 | 20.3%), and local government employees (9 | 8.0%) make up the most common classes of employment.
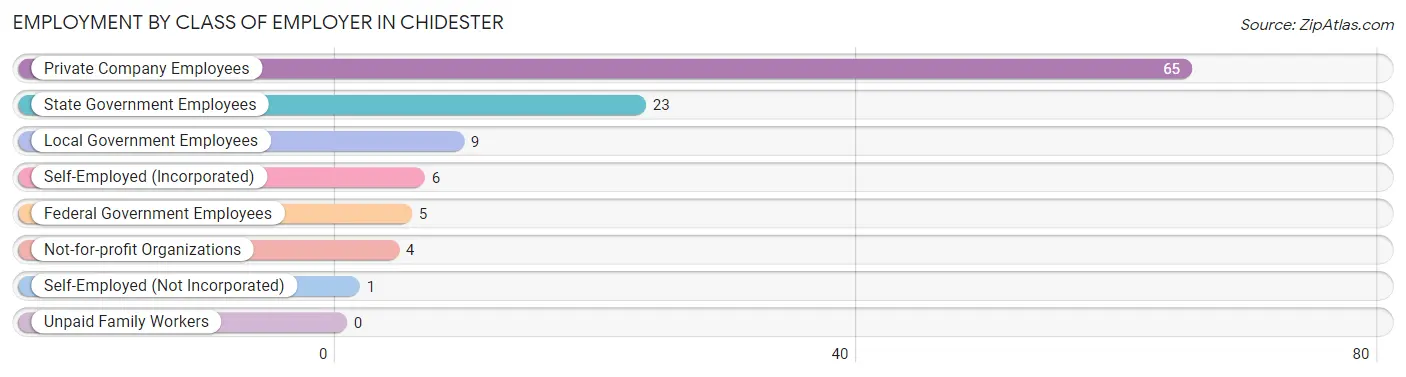
| Employer Class | # Employees | % Employees |
| Private Company Employees | 65 | 57.5% |
| Self-Employed (Incorporated) | 6 | 5.3% |
| Self-Employed (Not Incorporated) | 1 | 0.9% |
| Not-for-profit Organizations | 4 | 3.5% |
| Local Government Employees | 9 | 8.0% |
| State Government Employees | 23 | 20.3% |
| Federal Government Employees | 5 | 4.4% |
| Unpaid Family Workers | 0 | 0.0% |
| Total | 113 | 100.0% |
Employment Status by Age in Chidester
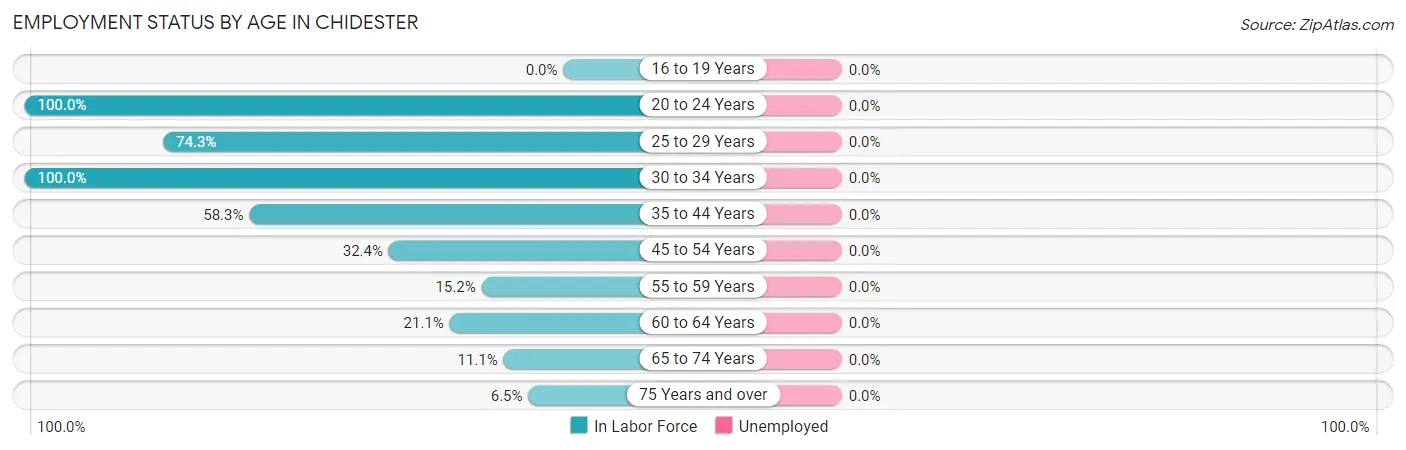
| Age Bracket | In Labor Force | Unemployed |
| 16 to 19 Years | 0 (0.0%) | 0 (0.0%) |
| 20 to 24 Years | 14 (100.0%) | 0 (0.0%) |
| 25 to 29 Years | 26 (74.3%) | 0 (0.0%) |
| 30 to 34 Years | 7 (100.0%) | 0 (0.0%) |
| 35 to 44 Years | 14 (58.3%) | 0 (0.0%) |
| 45 to 54 Years | 33 (32.4%) | 0 (0.0%) |
| 55 to 59 Years | 7 (15.2%) | 0 (0.0%) |
| 60 to 64 Years | 4 (21.1%) | 0 (0.0%) |
| 65 to 74 Years | 5 (11.1%) | 0 (0.0%) |
| 75 Years and over | 3 (6.5%) | 0 (0.0%) |
| Total | 113 (33.4%) | 0 (0.0%) |
Employment Status by Educational Attainment in Chidester
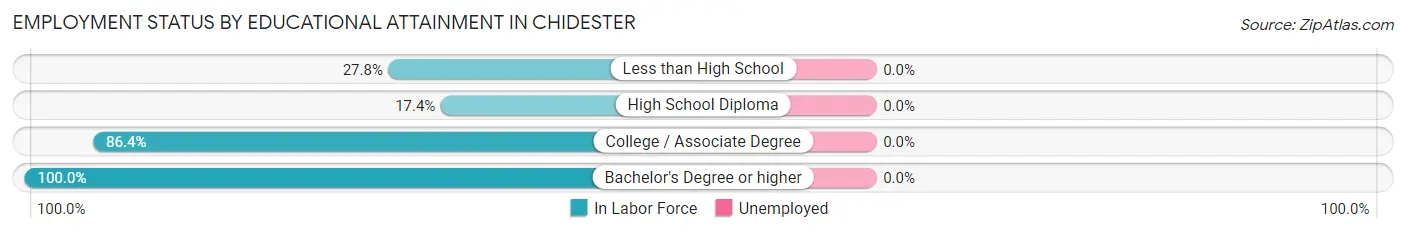
| Educational Attainment | In Labor Force | Unemployed |
| Less than High School | 15 (27.8%) | 0 (0.0%) |
| High School Diploma | 20 (17.4%) | 0 (0.0%) |
| College / Associate Degree | 51 (86.4%) | 0 (0.0%) |
| Bachelor's Degree or higher | 5 (100.0%) | 0 (0.0%) |
| Total | 91 (39.1%) | 0 (0.0%) |
Employment Occupations by Sex in Chidester
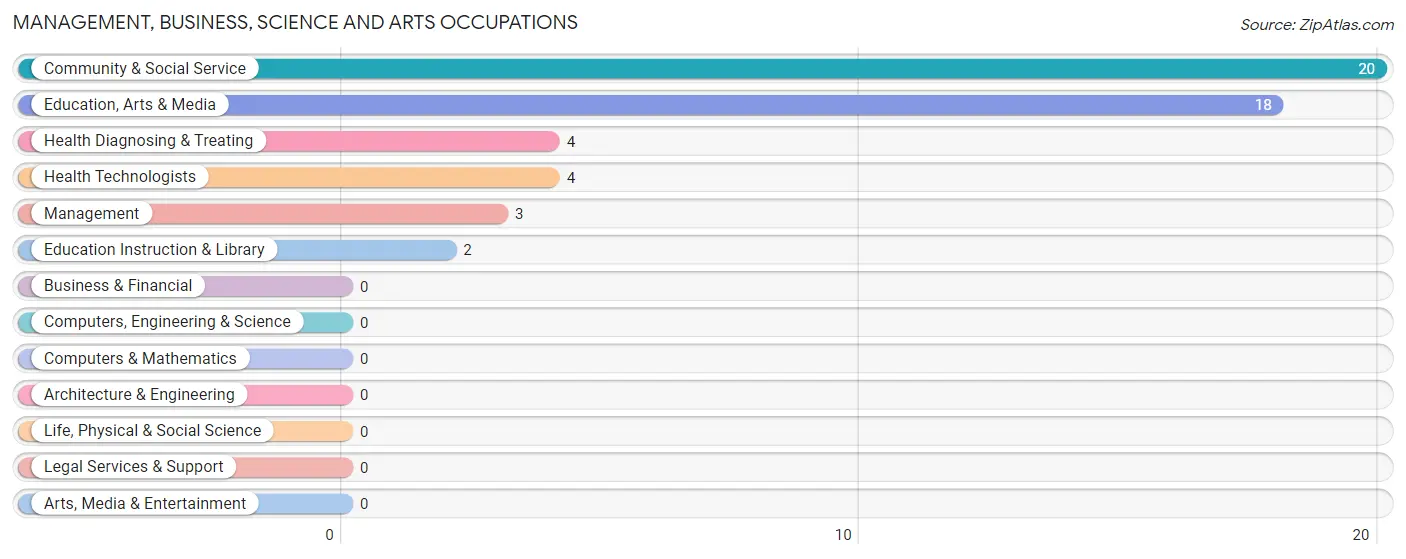
Management, Business, Science and Arts Occupations
The most common Management, Business, Science and Arts occupations in Chidester are Community & Social Service (20 | 17.7%), Education, Arts & Media (18 | 15.9%), Health Diagnosing & Treating (4 | 3.5%), Health Technologists (4 | 3.5%), and Management (3 | 2.6%).
Management, Business, Science and Arts Occupations by Sex
Within the Management, Business, Science and Arts occupations in Chidester, the most male-oriented occupations are Education, Arts & Media (88.9%), and Community & Social Service (80.0%), while the most female-oriented occupations are Management (100.0%), Education Instruction & Library (100.0%), and Health Diagnosing & Treating (100.0%).
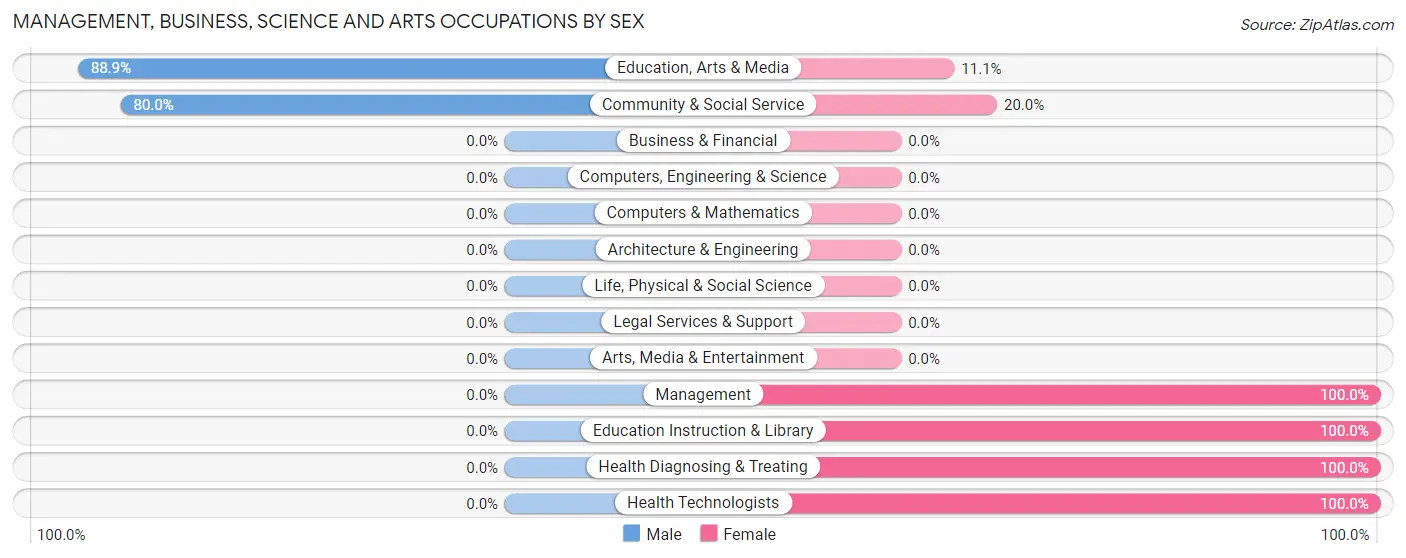
| Occupation | Male | Female |
| Management | 0 (0.0%) | 3 (100.0%) |
| Business & Financial | 0 (0.0%) | 0 (0.0%) |
| Computers, Engineering & Science | 0 (0.0%) | 0 (0.0%) |
| Computers & Mathematics | 0 (0.0%) | 0 (0.0%) |
| Architecture & Engineering | 0 (0.0%) | 0 (0.0%) |
| Life, Physical & Social Science | 0 (0.0%) | 0 (0.0%) |
| Community & Social Service | 16 (80.0%) | 4 (20.0%) |
| Education, Arts & Media | 16 (88.9%) | 2 (11.1%) |
| Legal Services & Support | 0 (0.0%) | 0 (0.0%) |
| Education Instruction & Library | 0 (0.0%) | 2 (100.0%) |
| Arts, Media & Entertainment | 0 (0.0%) | 0 (0.0%) |
| Health Diagnosing & Treating | 0 (0.0%) | 4 (100.0%) |
| Health Technologists | 0 (0.0%) | 4 (100.0%) |
| Total (Category) | 16 (59.3%) | 11 (40.7%) |
| Total (Overall) | 48 (42.5%) | 65 (57.5%) |
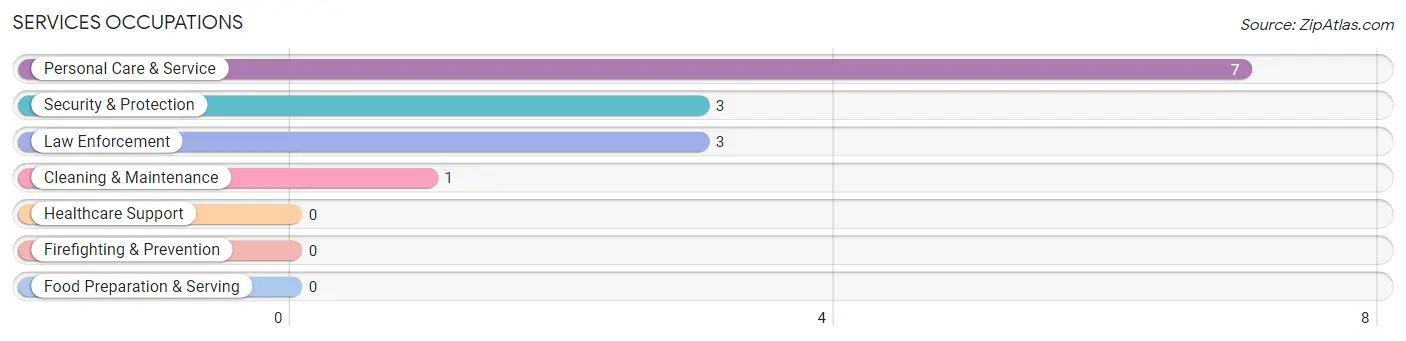
Services Occupations
The most common Services occupations in Chidester are Personal Care & Service (7 | 6.2%), Security & Protection (3 | 2.6%), Law Enforcement (3 | 2.6%), and Cleaning & Maintenance (1 | 0.9%).
Services Occupations by Sex
Within the Services occupations in Chidester, the most male-oriented occupations are Security & Protection (100.0%), and Law Enforcement (100.0%), while the most female-oriented occupations are Cleaning & Maintenance (100.0%), and Personal Care & Service (100.0%).
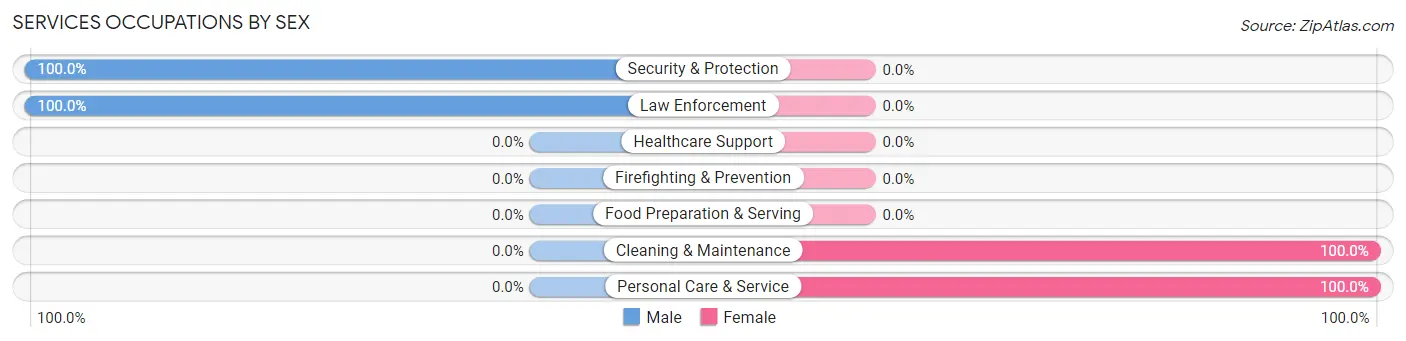
| Occupation | Male | Female |
| Healthcare Support | 0 (0.0%) | 0 (0.0%) |
| Security & Protection | 3 (100.0%) | 0 (0.0%) |
| Firefighting & Prevention | 0 (0.0%) | 0 (0.0%) |
| Law Enforcement | 3 (100.0%) | 0 (0.0%) |
| Food Preparation & Serving | 0 (0.0%) | 0 (0.0%) |
| Cleaning & Maintenance | 0 (0.0%) | 1 (100.0%) |
| Personal Care & Service | 0 (0.0%) | 7 (100.0%) |
| Total (Category) | 3 (27.3%) | 8 (72.7%) |
| Total (Overall) | 48 (42.5%) | 65 (57.5%) |
Sales and Office Occupations
The most common Sales and Office occupations in Chidester are Office & Administration (12 | 10.6%), and Sales & Related (3 | 2.6%).
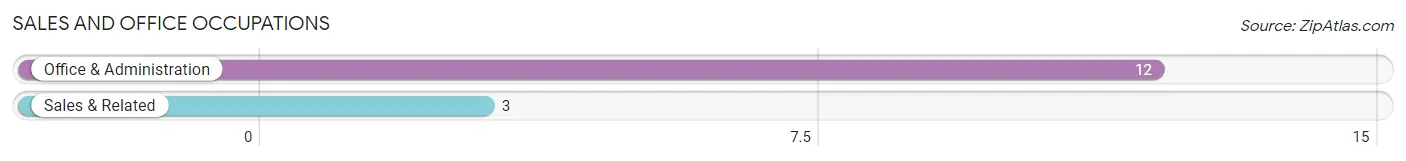
Sales and Office Occupations by Sex

| Occupation | Male | Female |
| Sales & Related | 1 (33.3%) | 2 (66.7%) |
| Office & Administration | 2 (16.7%) | 10 (83.3%) |
| Total (Category) | 3 (20.0%) | 12 (80.0%) |
| Total (Overall) | 48 (42.5%) | 65 (57.5%) |
Natural Resources, Construction and Maintenance Occupations
The most common Natural Resources, Construction and Maintenance occupations in Chidester are Farming, Fishing & Forestry (11 | 9.7%), Installation, Maintenance & Repair (3 | 2.6%), and Construction & Extraction (1 | 0.9%).
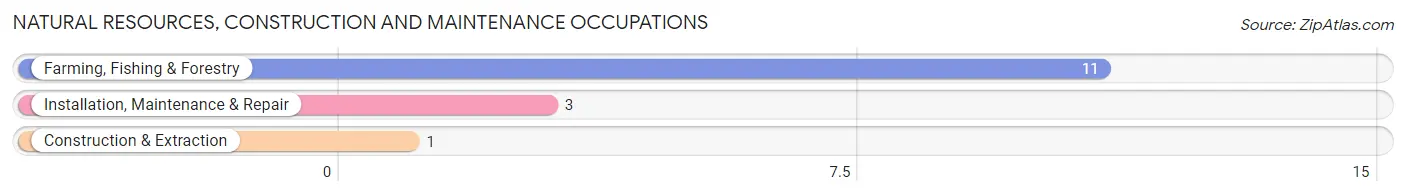
Natural Resources, Construction and Maintenance Occupations by Sex
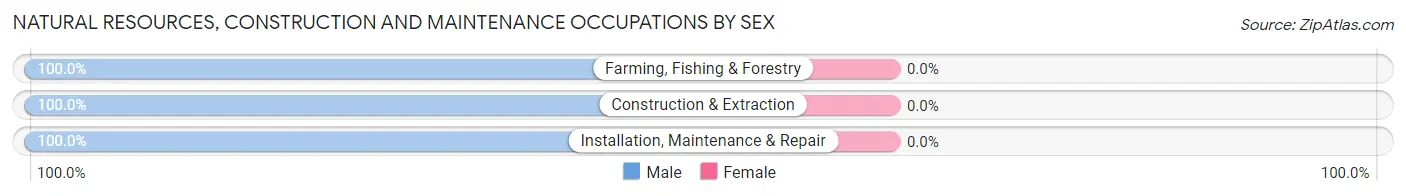
| Occupation | Male | Female |
| Farming, Fishing & Forestry | 11 (100.0%) | 0 (0.0%) |
| Construction & Extraction | 1 (100.0%) | 0 (0.0%) |
| Installation, Maintenance & Repair | 3 (100.0%) | 0 (0.0%) |
| Total (Category) | 15 (100.0%) | 0 (0.0%) |
| Total (Overall) | 48 (42.5%) | 65 (57.5%) |
Production, Transportation and Moving Occupations
The most common Production, Transportation and Moving occupations in Chidester are Material Moving (31 | 27.4%), Production (10 | 8.8%), and Transportation (4 | 3.5%).
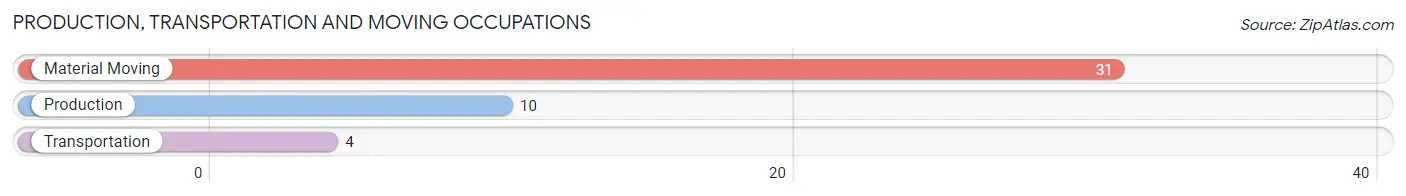
Production, Transportation and Moving Occupations by Sex
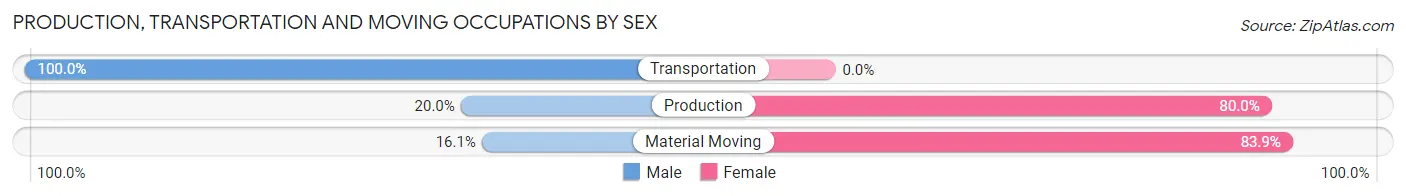
| Occupation | Male | Female |
| Production | 2 (20.0%) | 8 (80.0%) |
| Transportation | 4 (100.0%) | 0 (0.0%) |
| Material Moving | 5 (16.1%) | 26 (83.9%) |
| Total (Category) | 11 (24.4%) | 34 (75.6%) |
| Total (Overall) | 48 (42.5%) | 65 (57.5%) |
Employment Industries by Sex in Chidester
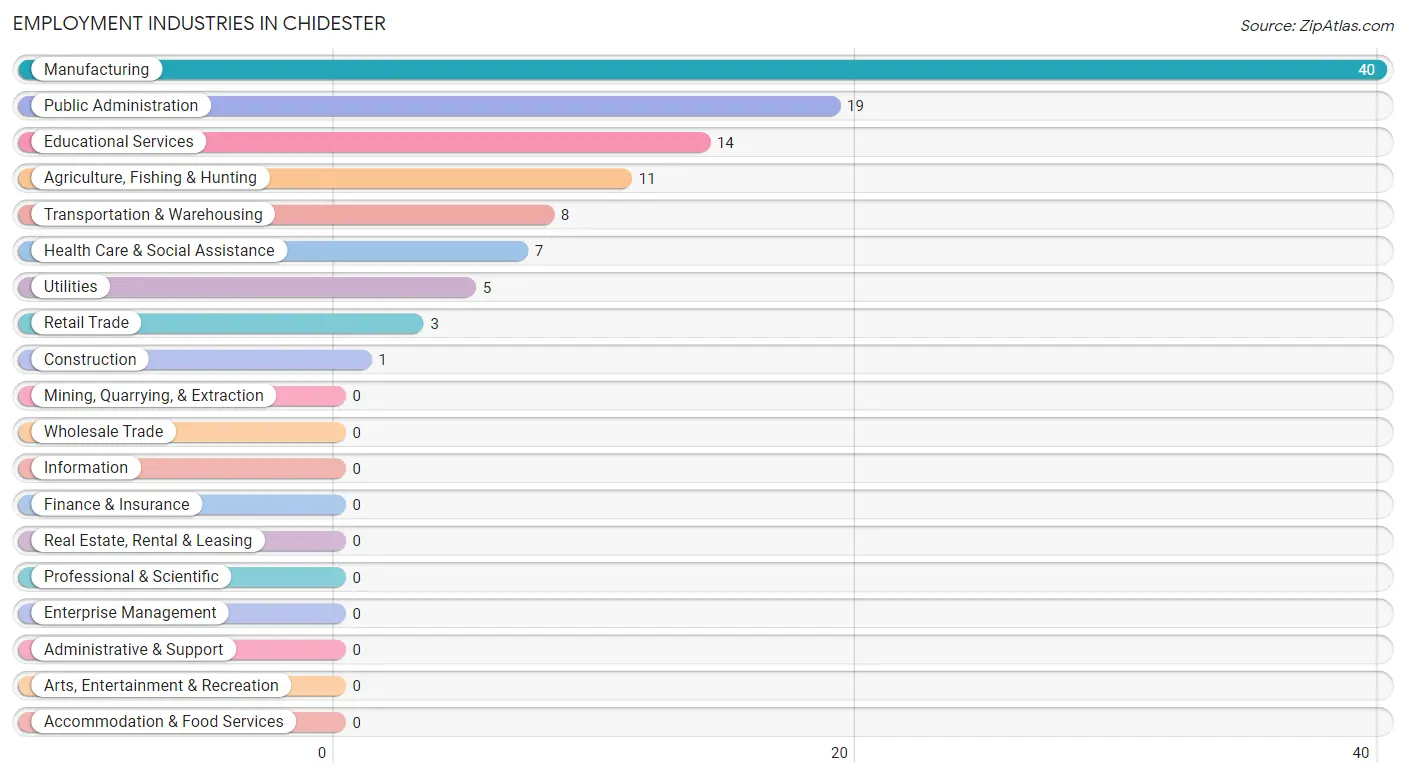
Employment Industries in Chidester
The major employment industries in Chidester include Manufacturing (40 | 35.4%), Public Administration (19 | 16.8%), Educational Services (14 | 12.4%), Agriculture, Fishing & Hunting (11 | 9.7%), and Transportation & Warehousing (8 | 7.1%).
Employment Industries by Sex in Chidester
The Chidester industries that see more men than women are Agriculture, Fishing & Hunting (100.0%), Construction (100.0%), and Public Administration (100.0%), whereas the industries that tend to have a higher number of women are Health Care & Social Assistance (100.0%), Educational Services (85.7%), and Manufacturing (85.0%).
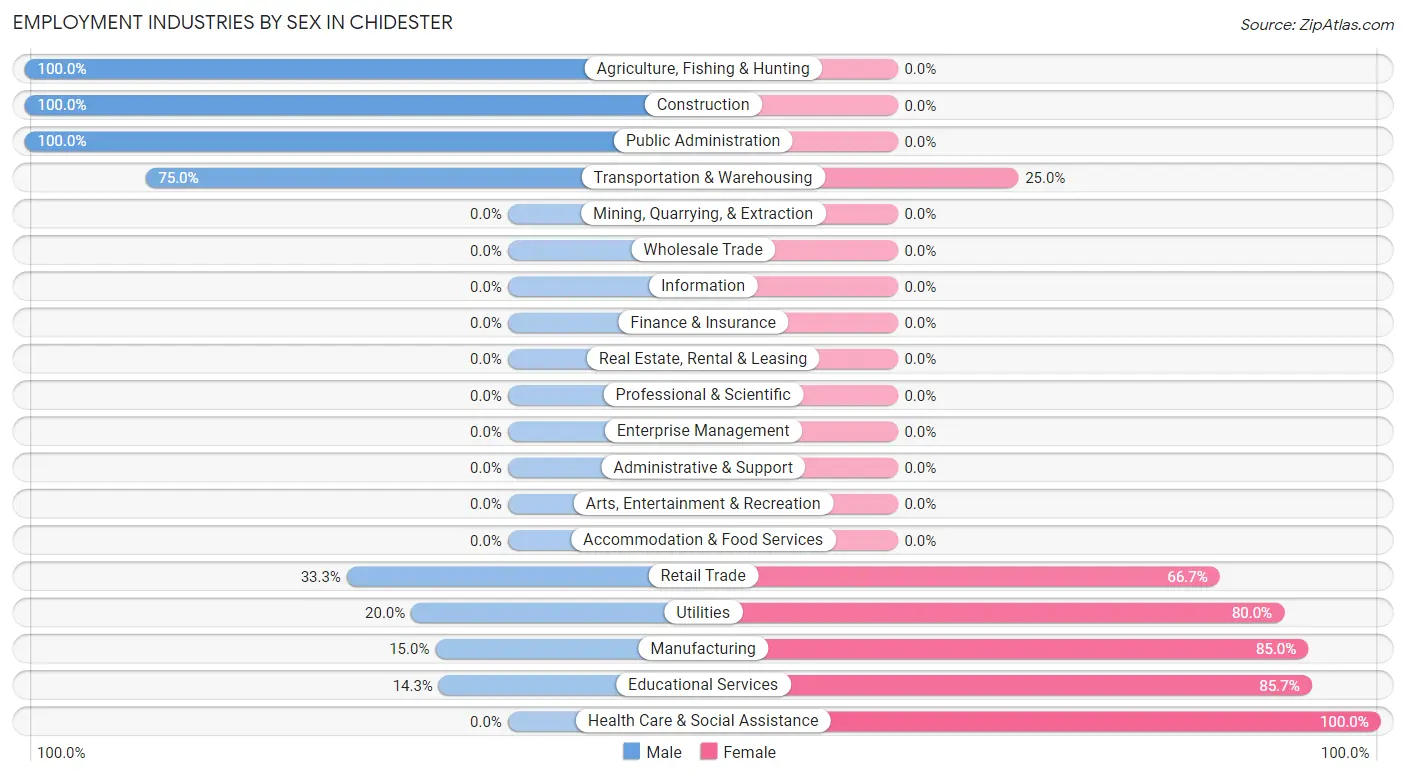
| Industry | Male | Female |
| Agriculture, Fishing & Hunting | 11 (100.0%) | 0 (0.0%) |
| Mining, Quarrying, & Extraction | 0 (0.0%) | 0 (0.0%) |
| Construction | 1 (100.0%) | 0 (0.0%) |
| Manufacturing | 6 (15.0%) | 34 (85.0%) |
| Wholesale Trade | 0 (0.0%) | 0 (0.0%) |
| Retail Trade | 1 (33.3%) | 2 (66.7%) |
| Transportation & Warehousing | 6 (75.0%) | 2 (25.0%) |
| Utilities | 1 (20.0%) | 4 (80.0%) |
| Information | 0 (0.0%) | 0 (0.0%) |
| Finance & Insurance | 0 (0.0%) | 0 (0.0%) |
| Real Estate, Rental & Leasing | 0 (0.0%) | 0 (0.0%) |
| Professional & Scientific | 0 (0.0%) | 0 (0.0%) |
| Enterprise Management | 0 (0.0%) | 0 (0.0%) |
| Administrative & Support | 0 (0.0%) | 0 (0.0%) |
| Educational Services | 2 (14.3%) | 12 (85.7%) |
| Health Care & Social Assistance | 0 (0.0%) | 7 (100.0%) |
| Arts, Entertainment & Recreation | 0 (0.0%) | 0 (0.0%) |
| Accommodation & Food Services | 0 (0.0%) | 0 (0.0%) |
| Public Administration | 19 (100.0%) | 0 (0.0%) |
| Total | 48 (42.5%) | 65 (57.5%) |
Education in Chidester
School Enrollment in Chidester
The most common levels of schooling among the 59 students in Chidester are elementary school (38 | 64.4%), middle school (18 | 30.5%), and kindergarten (3 | 5.1%).
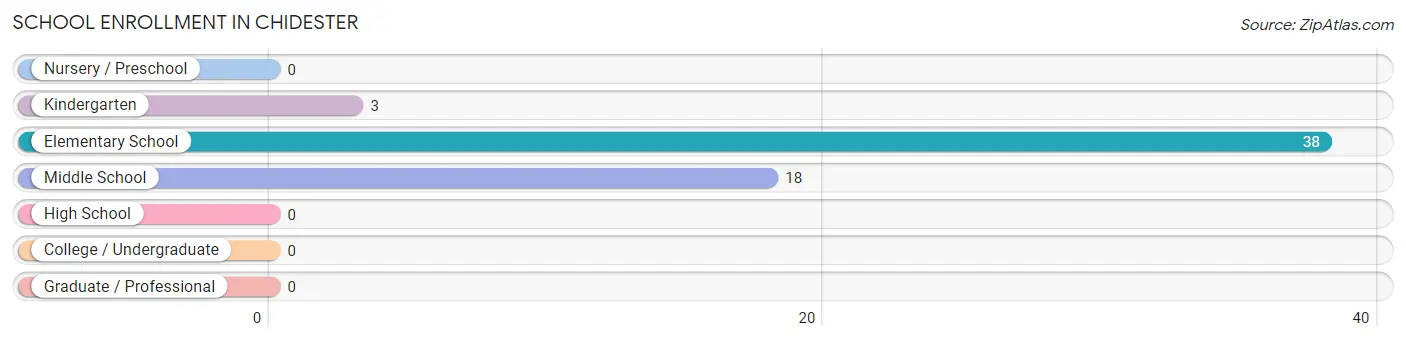
| School Level | # Students | % Students |
| Nursery / Preschool | 0 | 0.0% |
| Kindergarten | 3 | 5.1% |
| Elementary School | 38 | 64.4% |
| Middle School | 18 | 30.5% |
| High School | 0 | 0.0% |
| College / Undergraduate | 0 | 0.0% |
| Graduate / Professional | 0 | 0.0% |
| Total | 59 | 100.0% |
School Enrollment by Age by Funding Source in Chidester
Out of a total of 59 students who are enrolled in schools in Chidester, 3 (5.1%) attend a private institution, while the remaining 56 (94.9%) are enrolled in public schools. The age group of 5 to 9 year old has the highest likelihood of being enrolled in private schools, with 3 (9.7% in the age bracket) enrolled. Conversely, the age group of 10 to 14 year olds has the lowest likelihood of being enrolled in a private school, with 28 (100.0% in the age bracket) attending a public institution.
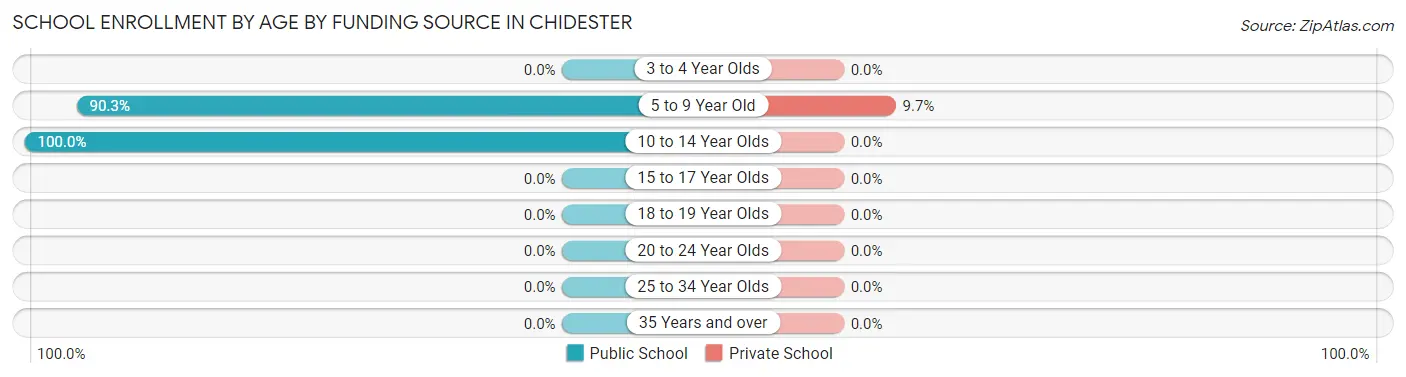
| Age Bracket | Public School | Private School |
| 3 to 4 Year Olds | 0 (0.0%) | 0 (0.0%) |
| 5 to 9 Year Old | 28 (90.3%) | 3 (9.7%) |
| 10 to 14 Year Olds | 28 (100.0%) | 0 (0.0%) |
| 15 to 17 Year Olds | 0 (0.0%) | 0 (0.0%) |
| 18 to 19 Year Olds | 0 (0.0%) | 0 (0.0%) |
| 20 to 24 Year Olds | 0 (0.0%) | 0 (0.0%) |
| 25 to 34 Year Olds | 0 (0.0%) | 0 (0.0%) |
| 35 Years and over | 0 (0.0%) | 0 (0.0%) |
| Total | 56 (94.9%) | 3 (5.1%) |
Educational Attainment by Field of Study in Chidester
Education (6 | 40.0%), science & technology (5 | 33.3%), bio, nature & agricultural (2 | 13.3%), and literature & languages (2 | 13.3%) are the most common fields of study among 15 individuals in Chidester who have obtained a bachelor's degree or higher.
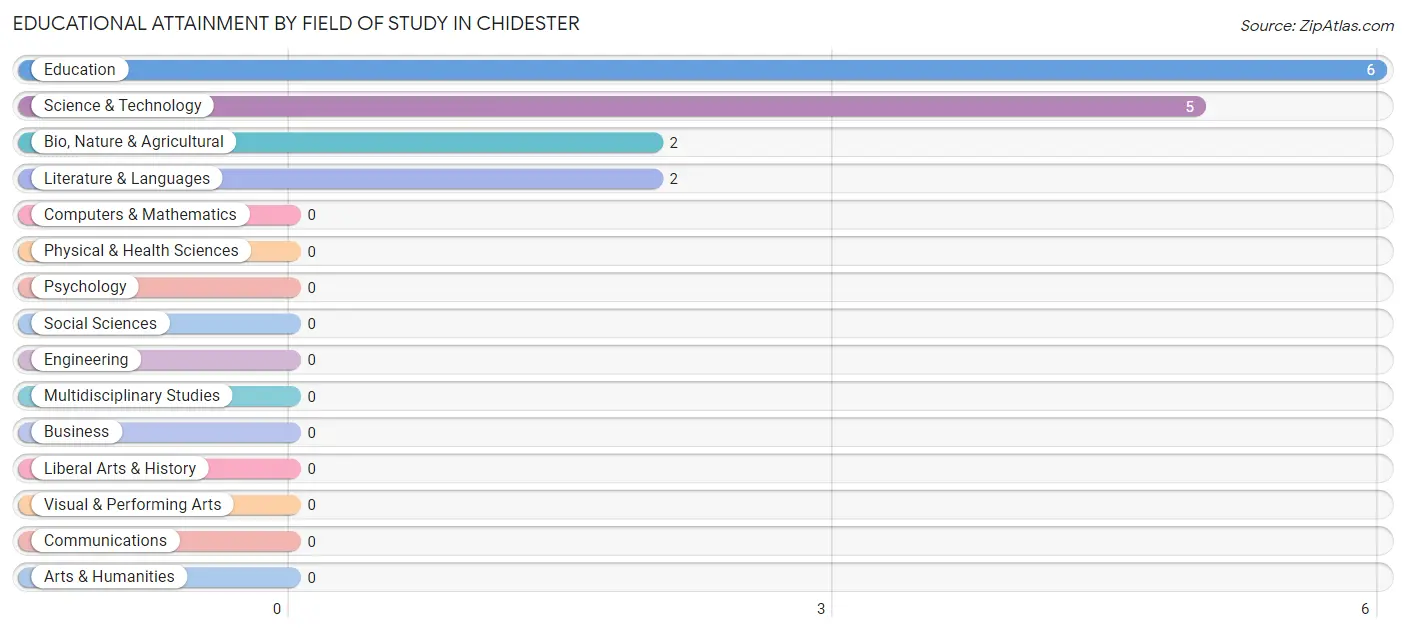
| Field of Study | # Graduates | % Graduates |
| Computers & Mathematics | 0 | 0.0% |
| Bio, Nature & Agricultural | 2 | 13.3% |
| Physical & Health Sciences | 0 | 0.0% |
| Psychology | 0 | 0.0% |
| Social Sciences | 0 | 0.0% |
| Engineering | 0 | 0.0% |
| Multidisciplinary Studies | 0 | 0.0% |
| Science & Technology | 5 | 33.3% |
| Business | 0 | 0.0% |
| Education | 6 | 40.0% |
| Literature & Languages | 2 | 13.3% |
| Liberal Arts & History | 0 | 0.0% |
| Visual & Performing Arts | 0 | 0.0% |
| Communications | 0 | 0.0% |
| Arts & Humanities | 0 | 0.0% |
| Total | 15 | 100.0% |
Transportation & Commute in Chidester
Vehicle Availability by Sex in Chidester
The most prevalent vehicle ownership categories in Chidester are males with 2 vehicles (23, accounting for 47.9%) and females with 2 vehicles (21, making up 35.4%).
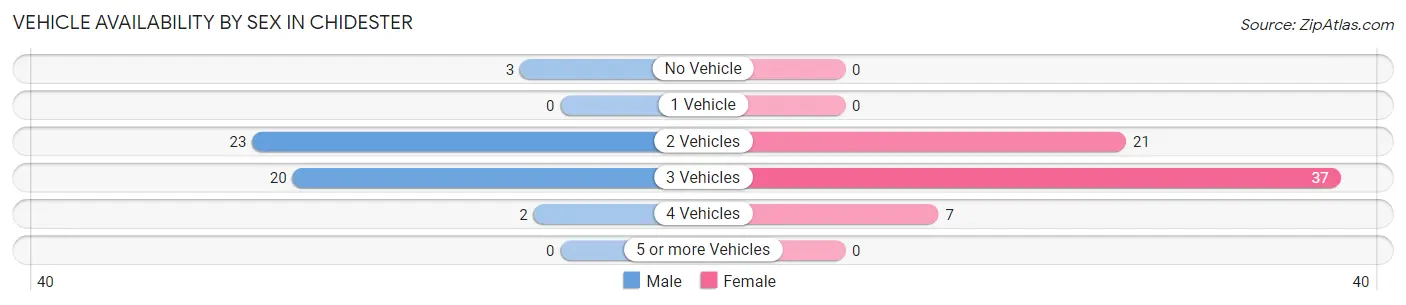
| Vehicles Available | Male | Female |
| No Vehicle | 3 (6.2%) | 0 (0.0%) |
| 1 Vehicle | 0 (0.0%) | 0 (0.0%) |
| 2 Vehicles | 23 (47.9%) | 21 (32.3%) |
| 3 Vehicles | 20 (41.7%) | 37 (56.9%) |
| 4 Vehicles | 2 (4.2%) | 7 (10.8%) |
| 5 or more Vehicles | 0 (0.0%) | 0 (0.0%) |
| Total | 48 (100.0%) | 65 (100.0%) |
Commute Time in Chidester
The most frequently occuring commute durations in Chidester are 40 to 44 minutes (52 commuters, 46.0%), 20 to 24 minutes (19 commuters, 16.8%), and 60 to 89 minutes (14 commuters, 12.4%).
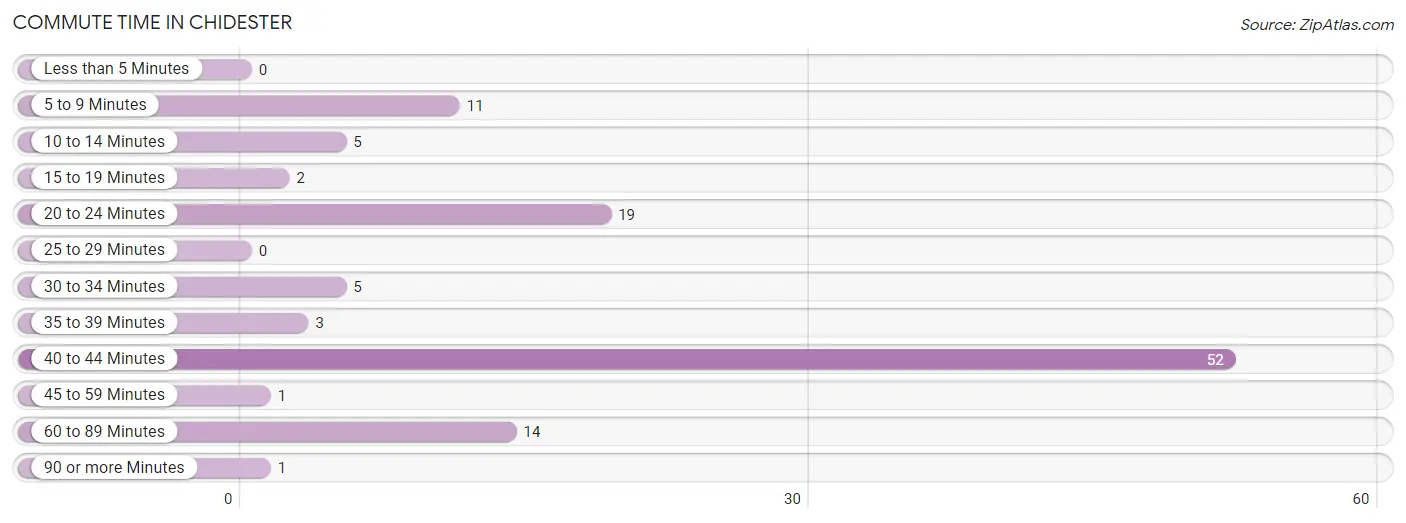
| Commute Time | # Commuters | % Commuters |
| Less than 5 Minutes | 0 | 0.0% |
| 5 to 9 Minutes | 11 | 9.7% |
| 10 to 14 Minutes | 5 | 4.4% |
| 15 to 19 Minutes | 2 | 1.8% |
| 20 to 24 Minutes | 19 | 16.8% |
| 25 to 29 Minutes | 0 | 0.0% |
| 30 to 34 Minutes | 5 | 4.4% |
| 35 to 39 Minutes | 3 | 2.6% |
| 40 to 44 Minutes | 52 | 46.0% |
| 45 to 59 Minutes | 1 | 0.9% |
| 60 to 89 Minutes | 14 | 12.4% |
| 90 or more Minutes | 1 | 0.9% |
Commute Time by Sex in Chidester
The most common commute times in Chidester are 40 to 44 minutes (14 commuters, 29.2%) for males and 40 to 44 minutes (38 commuters, 58.5%) for females.
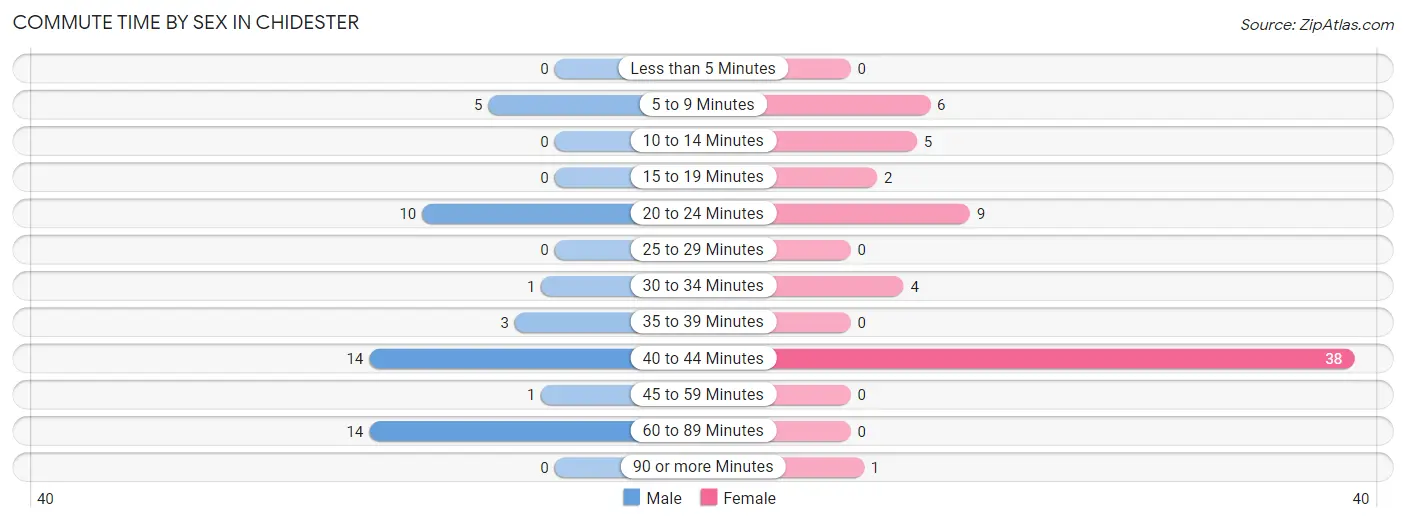
| Commute Time | Male | Female |
| Less than 5 Minutes | 0 (0.0%) | 0 (0.0%) |
| 5 to 9 Minutes | 5 (10.4%) | 6 (9.2%) |
| 10 to 14 Minutes | 0 (0.0%) | 5 (7.7%) |
| 15 to 19 Minutes | 0 (0.0%) | 2 (3.1%) |
| 20 to 24 Minutes | 10 (20.8%) | 9 (13.9%) |
| 25 to 29 Minutes | 0 (0.0%) | 0 (0.0%) |
| 30 to 34 Minutes | 1 (2.1%) | 4 (6.1%) |
| 35 to 39 Minutes | 3 (6.2%) | 0 (0.0%) |
| 40 to 44 Minutes | 14 (29.2%) | 38 (58.5%) |
| 45 to 59 Minutes | 1 (2.1%) | 0 (0.0%) |
| 60 to 89 Minutes | 14 (29.2%) | 0 (0.0%) |
| 90 or more Minutes | 0 (0.0%) | 1 (1.5%) |
Time of Departure to Work by Sex in Chidester
The most frequent times of departure to work in Chidester are 6:30 AM to 6:59 AM (20, 41.7%) for males and 6:00 AM to 6:29 AM (28, 43.1%) for females.
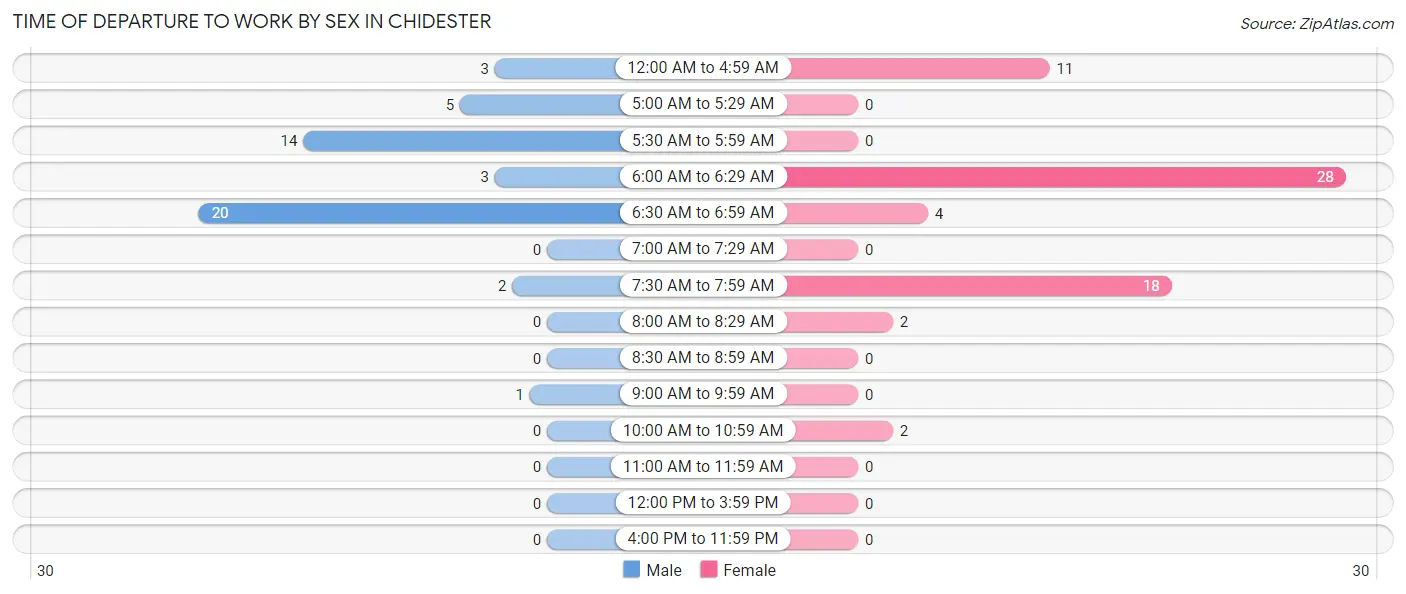
| Time of Departure | Male | Female |
| 12:00 AM to 4:59 AM | 3 (6.2%) | 11 (16.9%) |
| 5:00 AM to 5:29 AM | 5 (10.4%) | 0 (0.0%) |
| 5:30 AM to 5:59 AM | 14 (29.2%) | 0 (0.0%) |
| 6:00 AM to 6:29 AM | 3 (6.2%) | 28 (43.1%) |
| 6:30 AM to 6:59 AM | 20 (41.7%) | 4 (6.1%) |
| 7:00 AM to 7:29 AM | 0 (0.0%) | 0 (0.0%) |
| 7:30 AM to 7:59 AM | 2 (4.2%) | 18 (27.7%) |
| 8:00 AM to 8:29 AM | 0 (0.0%) | 2 (3.1%) |
| 8:30 AM to 8:59 AM | 0 (0.0%) | 0 (0.0%) |
| 9:00 AM to 9:59 AM | 1 (2.1%) | 0 (0.0%) |
| 10:00 AM to 10:59 AM | 0 (0.0%) | 2 (3.1%) |
| 11:00 AM to 11:59 AM | 0 (0.0%) | 0 (0.0%) |
| 12:00 PM to 3:59 PM | 0 (0.0%) | 0 (0.0%) |
| 4:00 PM to 11:59 PM | 0 (0.0%) | 0 (0.0%) |
| Total | 48 (100.0%) | 65 (100.0%) |
Housing Occupancy in Chidester
Occupancy by Ownership in Chidester
Of the total 132 dwellings in Chidester, owner-occupied units account for 99 (75.0%), while renter-occupied units make up 33 (25.0%).
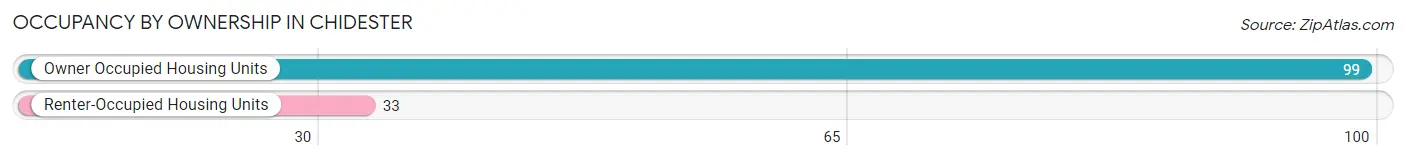
| Occupancy | # Housing Units | % Housing Units |
| Owner Occupied Housing Units | 99 | 75.0% |
| Renter-Occupied Housing Units | 33 | 25.0% |
| Total Occupied Housing Units | 132 | 100.0% |
Occupancy by Household Size in Chidester
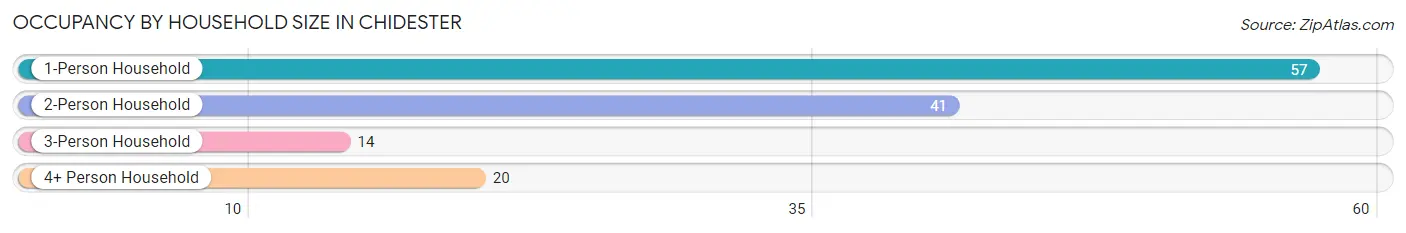
| Household Size | # Housing Units | % Housing Units |
| 1-Person Household | 57 | 43.2% |
| 2-Person Household | 41 | 31.1% |
| 3-Person Household | 14 | 10.6% |
| 4+ Person Household | 20 | 15.1% |
| Total Housing Units | 132 | 100.0% |
Occupancy by Ownership by Household Size in Chidester
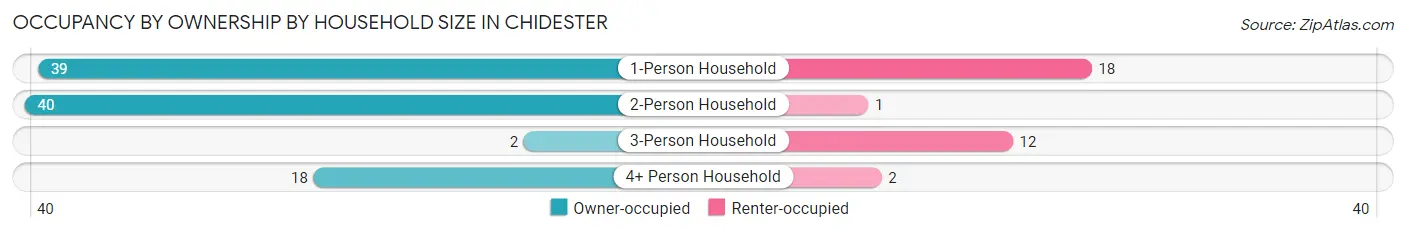
| Household Size | Owner-occupied | Renter-occupied |
| 1-Person Household | 39 (68.4%) | 18 (31.6%) |
| 2-Person Household | 40 (97.6%) | 1 (2.4%) |
| 3-Person Household | 2 (14.3%) | 12 (85.7%) |
| 4+ Person Household | 18 (90.0%) | 2 (10.0%) |
| Total Housing Units | 99 (75.0%) | 33 (25.0%) |
Occupancy by Educational Attainment in Chidester
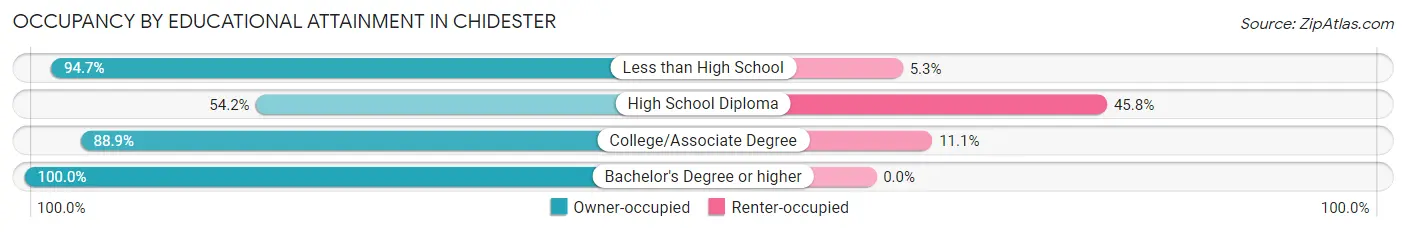
| Household Size | Owner-occupied | Renter-occupied |
| Less than High School | 18 (94.7%) | 1 (5.3%) |
| High School Diploma | 32 (54.2%) | 27 (45.8%) |
| College/Associate Degree | 40 (88.9%) | 5 (11.1%) |
| Bachelor's Degree or higher | 9 (100.0%) | 0 (0.0%) |
Occupancy by Age of Householder in Chidester
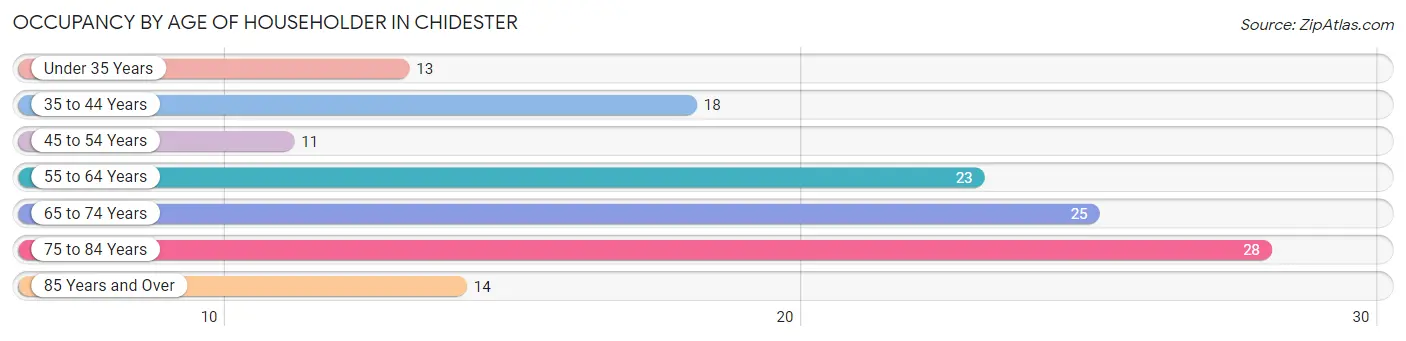
| Age Bracket | # Households | % Households |
| Under 35 Years | 13 | 9.9% |
| 35 to 44 Years | 18 | 13.6% |
| 45 to 54 Years | 11 | 8.3% |
| 55 to 64 Years | 23 | 17.4% |
| 65 to 74 Years | 25 | 18.9% |
| 75 to 84 Years | 28 | 21.2% |
| 85 Years and Over | 14 | 10.6% |
| Total | 132 | 100.0% |
Housing Finances in Chidester
Median Income by Occupancy in Chidester
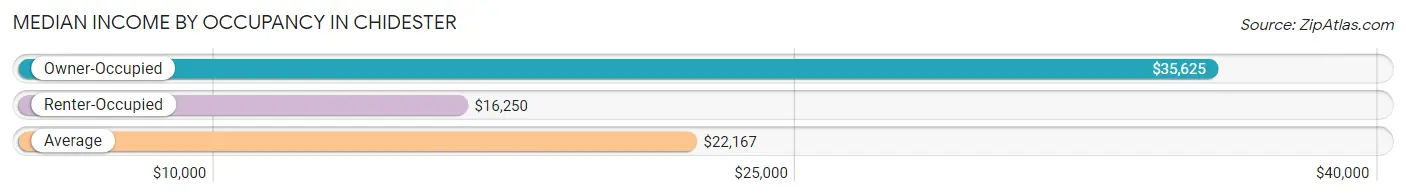
| Occupancy Type | # Households | Median Income |
| Owner-Occupied | 99 (75.0%) | $35,625 |
| Renter-Occupied | 33 (25.0%) | $16,250 |
| Average | 132 (100.0%) | $22,167 |
Occupancy by Householder Income Bracket in Chidester
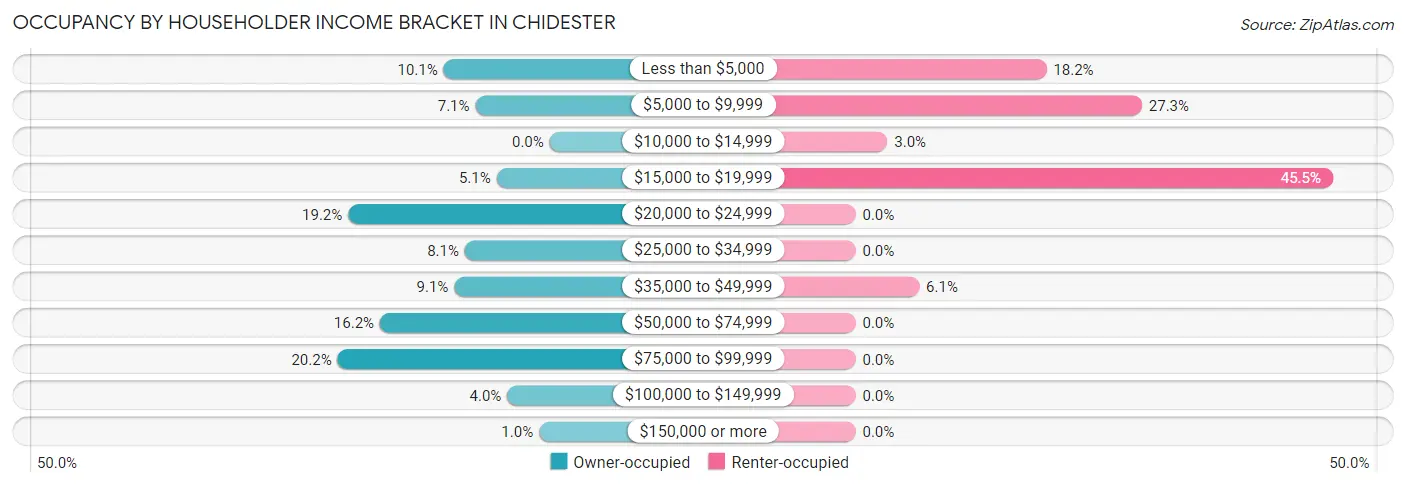
| Income Bracket | Owner-occupied | Renter-occupied |
| Less than $5,000 | 10 (10.1%) | 6 (18.2%) |
| $5,000 to $9,999 | 7 (7.1%) | 9 (27.3%) |
| $10,000 to $14,999 | 0 (0.0%) | 1 (3.0%) |
| $15,000 to $19,999 | 5 (5.1%) | 15 (45.5%) |
| $20,000 to $24,999 | 19 (19.2%) | 0 (0.0%) |
| $25,000 to $34,999 | 8 (8.1%) | 0 (0.0%) |
| $35,000 to $49,999 | 9 (9.1%) | 2 (6.1%) |
| $50,000 to $74,999 | 16 (16.2%) | 0 (0.0%) |
| $75,000 to $99,999 | 20 (20.2%) | 0 (0.0%) |
| $100,000 to $149,999 | 4 (4.0%) | 0 (0.0%) |
| $150,000 or more | 1 (1.0%) | 0 (0.0%) |
| Total | 99 (100.0%) | 33 (100.0%) |
Monthly Housing Cost Tiers in Chidester
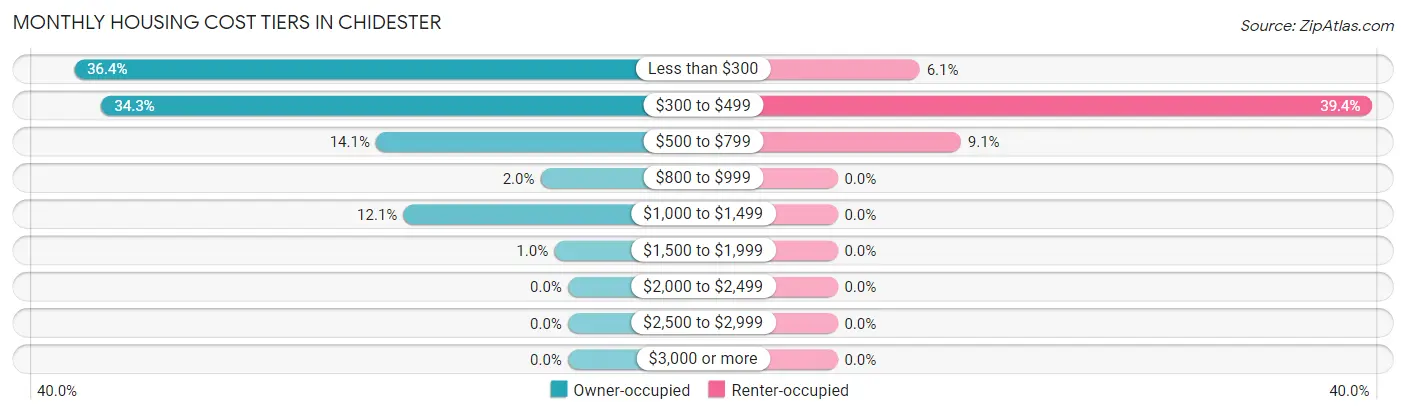
| Monthly Cost | Owner-occupied | Renter-occupied |
| Less than $300 | 36 (36.4%) | 2 (6.1%) |
| $300 to $499 | 34 (34.3%) | 13 (39.4%) |
| $500 to $799 | 14 (14.1%) | 3 (9.1%) |
| $800 to $999 | 2 (2.0%) | 0 (0.0%) |
| $1,000 to $1,499 | 12 (12.1%) | 0 (0.0%) |
| $1,500 to $1,999 | 1 (1.0%) | 0 (0.0%) |
| $2,000 to $2,499 | 0 (0.0%) | 0 (0.0%) |
| $2,500 to $2,999 | 0 (0.0%) | 0 (0.0%) |
| $3,000 or more | 0 (0.0%) | 0 (0.0%) |
| Total | 99 (100.0%) | 33 (100.0%) |
Physical Housing Characteristics in Chidester
Housing Structures in Chidester
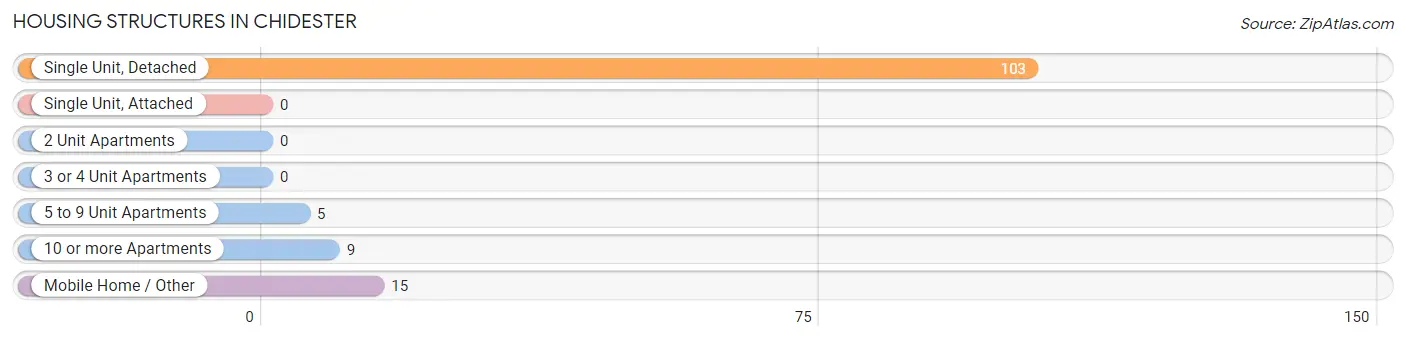
| Structure Type | # Housing Units | % Housing Units |
| Single Unit, Detached | 103 | 78.0% |
| Single Unit, Attached | 0 | 0.0% |
| 2 Unit Apartments | 0 | 0.0% |
| 3 or 4 Unit Apartments | 0 | 0.0% |
| 5 to 9 Unit Apartments | 5 | 3.8% |
| 10 or more Apartments | 9 | 6.8% |
| Mobile Home / Other | 15 | 11.4% |
| Total | 132 | 100.0% |
Housing Structures by Occupancy in Chidester
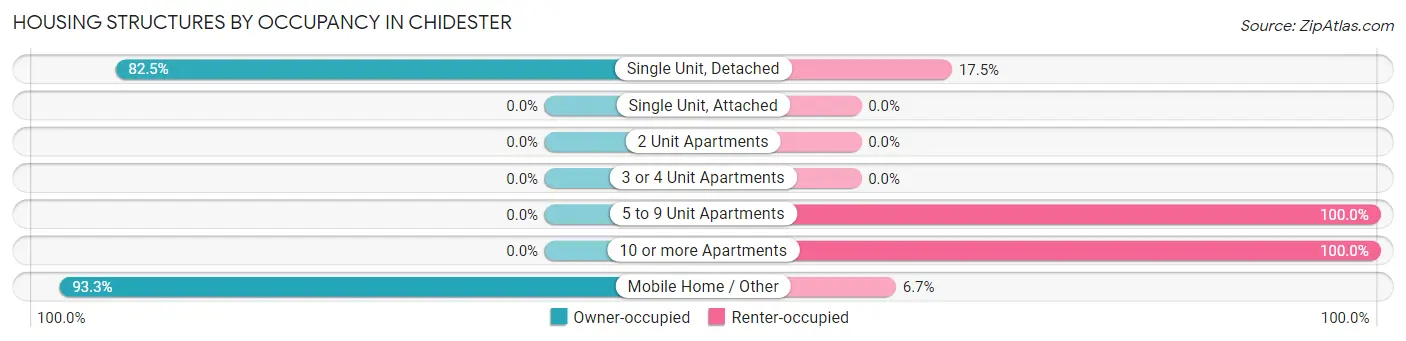
| Structure Type | Owner-occupied | Renter-occupied |
| Single Unit, Detached | 85 (82.5%) | 18 (17.5%) |
| Single Unit, Attached | 0 (0.0%) | 0 (0.0%) |
| 2 Unit Apartments | 0 (0.0%) | 0 (0.0%) |
| 3 or 4 Unit Apartments | 0 (0.0%) | 0 (0.0%) |
| 5 to 9 Unit Apartments | 0 (0.0%) | 5 (100.0%) |
| 10 or more Apartments | 0 (0.0%) | 9 (100.0%) |
| Mobile Home / Other | 14 (93.3%) | 1 (6.7%) |
| Total | 99 (75.0%) | 33 (25.0%) |
Housing Structures by Number of Rooms in Chidester
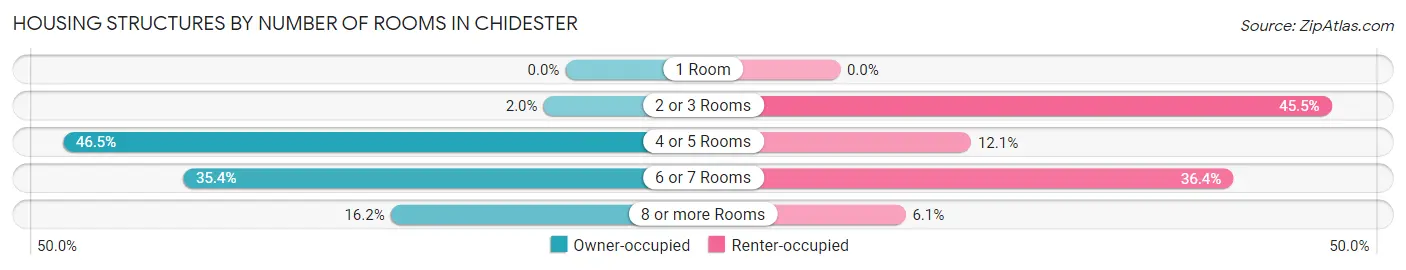
| Number of Rooms | Owner-occupied | Renter-occupied |
| 1 Room | 0 (0.0%) | 0 (0.0%) |
| 2 or 3 Rooms | 2 (2.0%) | 15 (45.5%) |
| 4 or 5 Rooms | 46 (46.5%) | 4 (12.1%) |
| 6 or 7 Rooms | 35 (35.3%) | 12 (36.4%) |
| 8 or more Rooms | 16 (16.2%) | 2 (6.1%) |
| Total | 99 (100.0%) | 33 (100.0%) |
Housing Structure by Heating Type in Chidester
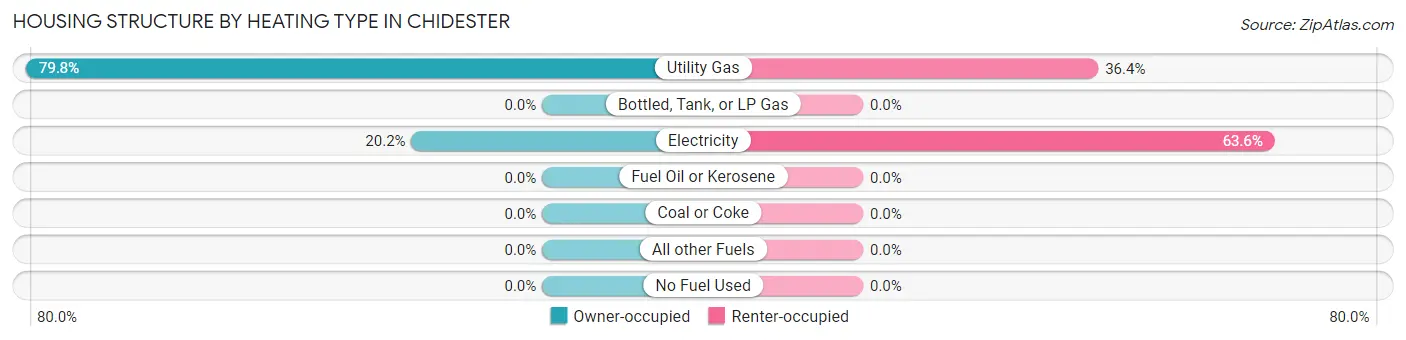
| Heating Type | Owner-occupied | Renter-occupied |
| Utility Gas | 79 (79.8%) | 12 (36.4%) |
| Bottled, Tank, or LP Gas | 0 (0.0%) | 0 (0.0%) |
| Electricity | 20 (20.2%) | 21 (63.6%) |
| Fuel Oil or Kerosene | 0 (0.0%) | 0 (0.0%) |
| Coal or Coke | 0 (0.0%) | 0 (0.0%) |
| All other Fuels | 0 (0.0%) | 0 (0.0%) |
| No Fuel Used | 0 (0.0%) | 0 (0.0%) |
| Total | 99 (100.0%) | 33 (100.0%) |
Household Vehicle Usage in Chidester
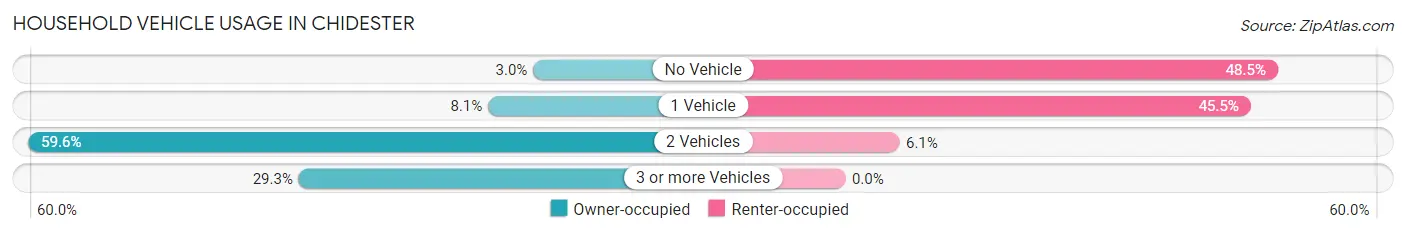
| Vehicles per Household | Owner-occupied | Renter-occupied |
| No Vehicle | 3 (3.0%) | 16 (48.5%) |
| 1 Vehicle | 8 (8.1%) | 15 (45.5%) |
| 2 Vehicles | 59 (59.6%) | 2 (6.1%) |
| 3 or more Vehicles | 29 (29.3%) | 0 (0.0%) |
| Total | 99 (100.0%) | 33 (100.0%) |
Real Estate & Mortgages in Chidester
Real Estate and Mortgage Overview in Chidester
| Characteristic | Without Mortgage | With Mortgage |
| Housing Units | 82 | 17 |
| Median Property Value | $64,000 | $202,800 |
| Median Household Income | - | - |
| Monthly Housing Costs | $313 | $0 |
| Real Estate Taxes | $363 | $0 |
Property Value by Mortgage Status in Chidester
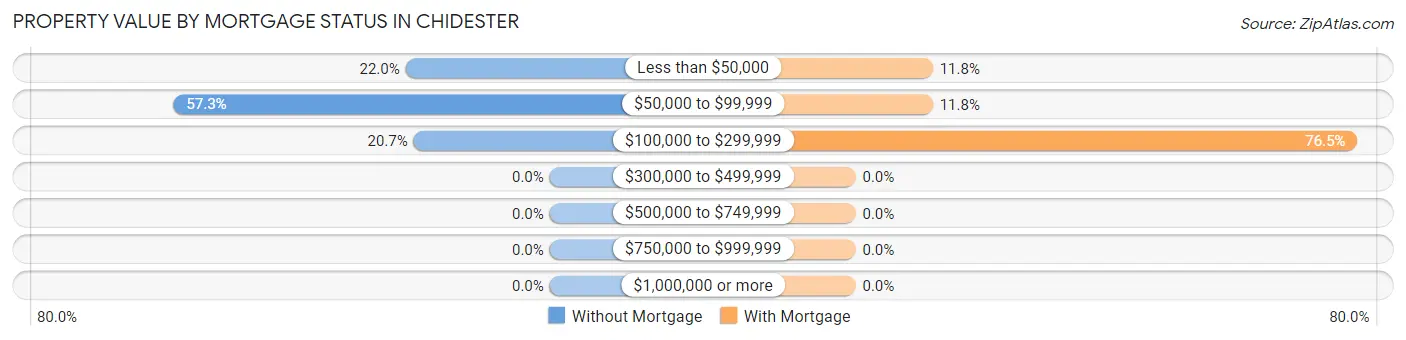
| Property Value | Without Mortgage | With Mortgage |
| Less than $50,000 | 18 (22.0%) | 2 (11.8%) |
| $50,000 to $99,999 | 47 (57.3%) | 2 (11.8%) |
| $100,000 to $299,999 | 17 (20.7%) | 13 (76.5%) |
| $300,000 to $499,999 | 0 (0.0%) | 0 (0.0%) |
| $500,000 to $749,999 | 0 (0.0%) | 0 (0.0%) |
| $750,000 to $999,999 | 0 (0.0%) | 0 (0.0%) |
| $1,000,000 or more | 0 (0.0%) | 0 (0.0%) |
| Total | 82 (100.0%) | 17 (100.0%) |
Household Income by Mortgage Status in Chidester
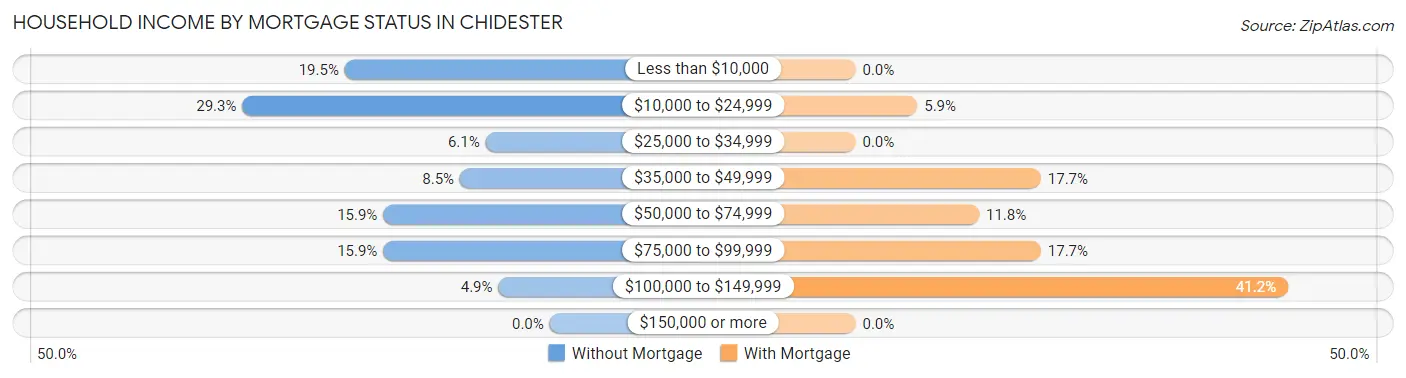
| Household Income | Without Mortgage | With Mortgage |
| Less than $10,000 | 16 (19.5%) | 0 (0.0%) |
| $10,000 to $24,999 | 24 (29.3%) | 1 (5.9%) |
| $25,000 to $34,999 | 5 (6.1%) | 0 (0.0%) |
| $35,000 to $49,999 | 7 (8.5%) | 3 (17.6%) |
| $50,000 to $74,999 | 13 (15.9%) | 2 (11.8%) |
| $75,000 to $99,999 | 13 (15.9%) | 3 (17.6%) |
| $100,000 to $149,999 | 4 (4.9%) | 7 (41.2%) |
| $150,000 or more | 0 (0.0%) | 0 (0.0%) |
| Total | 82 (100.0%) | 17 (100.0%) |
Property Value to Household Income Ratio in Chidester
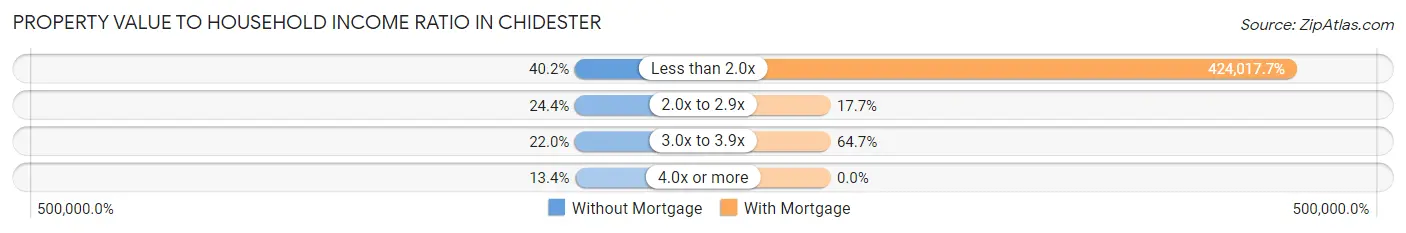
| Value-to-Income Ratio | Without Mortgage | With Mortgage |
| Less than 2.0x | 33 (40.2%) | 72,083 (424,017.6%) |
| 2.0x to 2.9x | 20 (24.4%) | 3 (17.6%) |
| 3.0x to 3.9x | 18 (22.0%) | 11 (64.7%) |
| 4.0x or more | 11 (13.4%) | 0 (0.0%) |
| Total | 82 (100.0%) | 17 (100.0%) |
Real Estate Taxes by Mortgage Status in Chidester
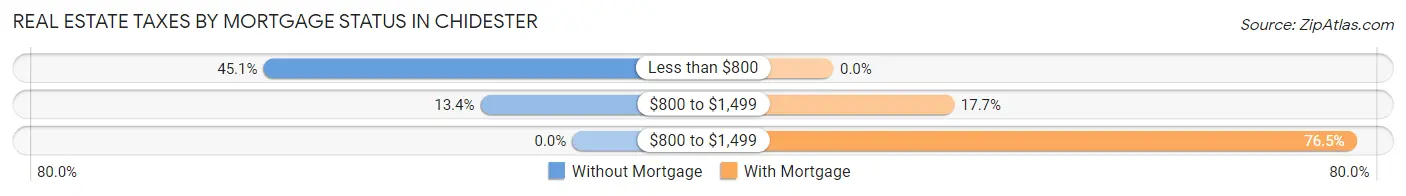
| Property Taxes | Without Mortgage | With Mortgage |
| Less than $800 | 37 (45.1%) | 0 (0.0%) |
| $800 to $1,499 | 11 (13.4%) | 3 (17.6%) |
| $800 to $1,499 | 0 (0.0%) | 13 (76.5%) |
| Total | 82 (100.0%) | 17 (100.0%) |
Health & Disability in Chidester
Health Insurance Coverage by Age in Chidester
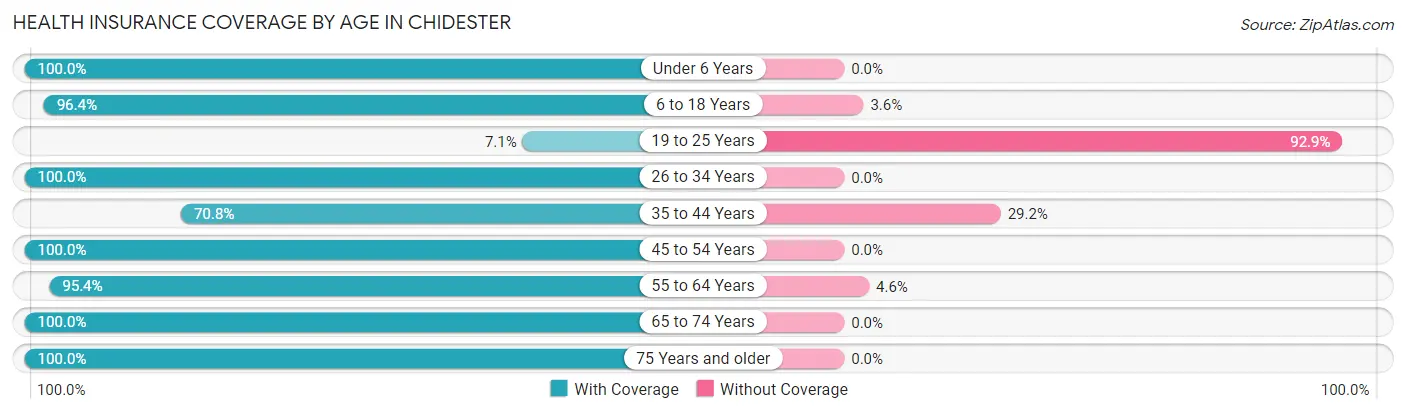
| Age Bracket | With Coverage | Without Coverage |
| Under 6 Years | 3 (100.0%) | 0 (0.0%) |
| 6 to 18 Years | 54 (96.4%) | 2 (3.6%) |
| 19 to 25 Years | 1 (7.1%) | 13 (92.9%) |
| 26 to 34 Years | 42 (100.0%) | 0 (0.0%) |
| 35 to 44 Years | 17 (70.8%) | 7 (29.2%) |
| 45 to 54 Years | 102 (100.0%) | 0 (0.0%) |
| 55 to 64 Years | 62 (95.4%) | 3 (4.6%) |
| 65 to 74 Years | 45 (100.0%) | 0 (0.0%) |
| 75 Years and older | 46 (100.0%) | 0 (0.0%) |
| Total | 372 (93.7%) | 25 (6.3%) |
Health Insurance Coverage by Citizenship Status in Chidester
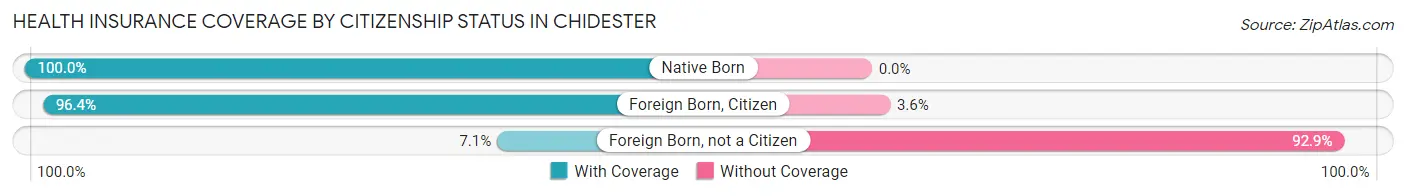
| Citizenship Status | With Coverage | Without Coverage |
| Native Born | 3 (100.0%) | 0 (0.0%) |
| Foreign Born, Citizen | 54 (96.4%) | 2 (3.6%) |
| Foreign Born, not a Citizen | 1 (7.1%) | 13 (92.9%) |
Health Insurance Coverage by Household Income in Chidester
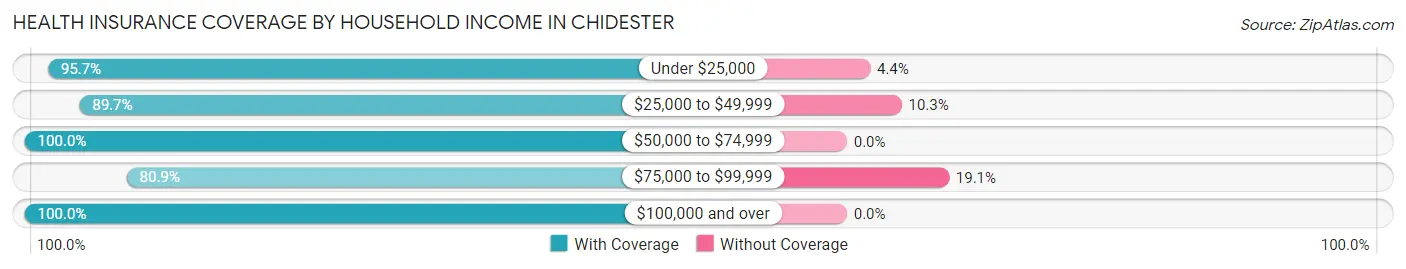
| Household Income | With Coverage | Without Coverage |
| Under $25,000 | 176 (95.7%) | 8 (4.3%) |
| $25,000 to $49,999 | 35 (89.7%) | 4 (10.3%) |
| $50,000 to $74,999 | 90 (100.0%) | 0 (0.0%) |
| $75,000 to $99,999 | 55 (80.9%) | 13 (19.1%) |
| $100,000 and over | 16 (100.0%) | 0 (0.0%) |
Public vs Private Health Insurance Coverage by Age in Chidester
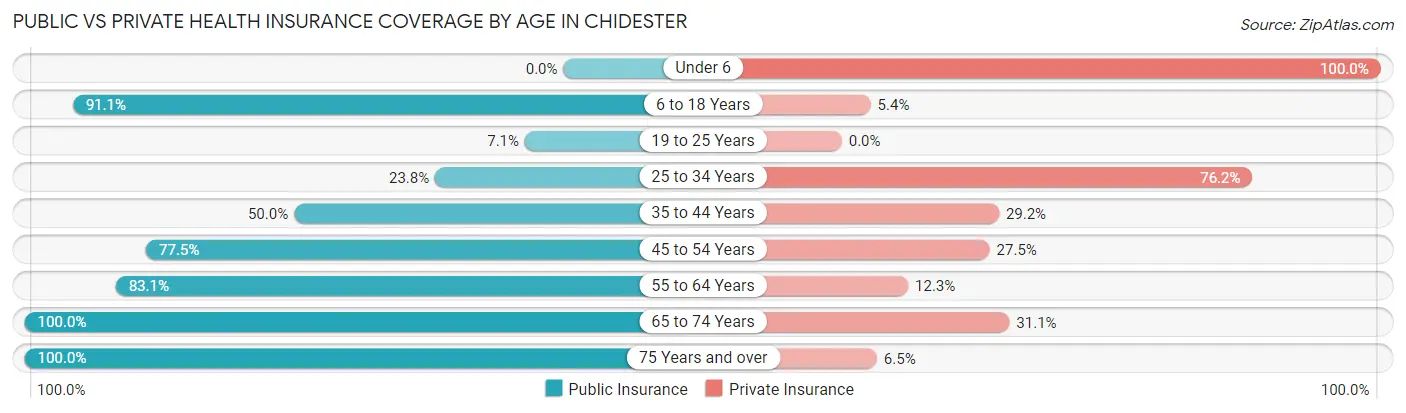
| Age Bracket | Public Insurance | Private Insurance |
| Under 6 | 0 (0.0%) | 3 (100.0%) |
| 6 to 18 Years | 51 (91.1%) | 3 (5.4%) |
| 19 to 25 Years | 1 (7.1%) | 0 (0.0%) |
| 25 to 34 Years | 10 (23.8%) | 32 (76.2%) |
| 35 to 44 Years | 12 (50.0%) | 7 (29.2%) |
| 45 to 54 Years | 79 (77.4%) | 28 (27.5%) |
| 55 to 64 Years | 54 (83.1%) | 8 (12.3%) |
| 65 to 74 Years | 45 (100.0%) | 14 (31.1%) |
| 75 Years and over | 46 (100.0%) | 3 (6.5%) |
| Total | 298 (75.1%) | 98 (24.7%) |
Disability Status by Sex by Age in Chidester
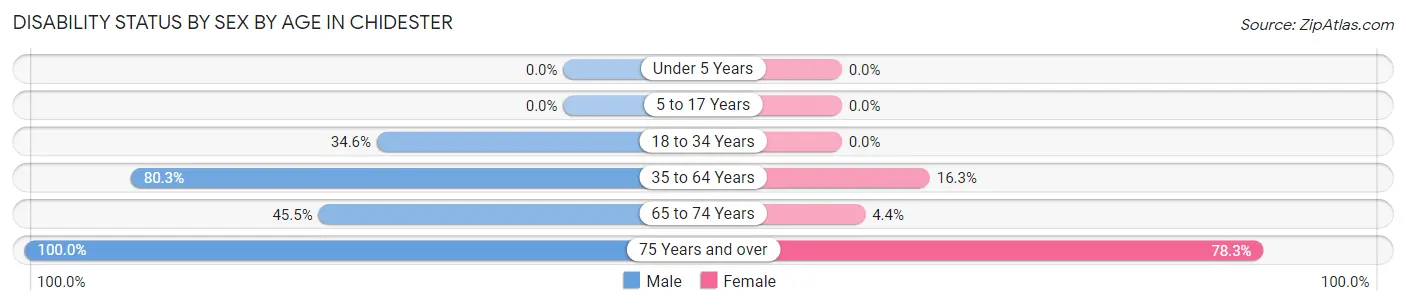
| Age Bracket | Male | Female |
| Under 5 Years | 0 (0.0%) | 0 (0.0%) |
| 5 to 17 Years | 0 (0.0%) | 0 (0.0%) |
| 18 to 34 Years | 9 (34.6%) | 0 (0.0%) |
| 35 to 64 Years | 114 (80.3%) | 8 (16.3%) |
| 65 to 74 Years | 10 (45.5%) | 1 (4.3%) |
| 75 Years and over | 23 (100.0%) | 18 (78.3%) |
Disability Class by Sex by Age in Chidester
Disability Class: Hearing Difficulty
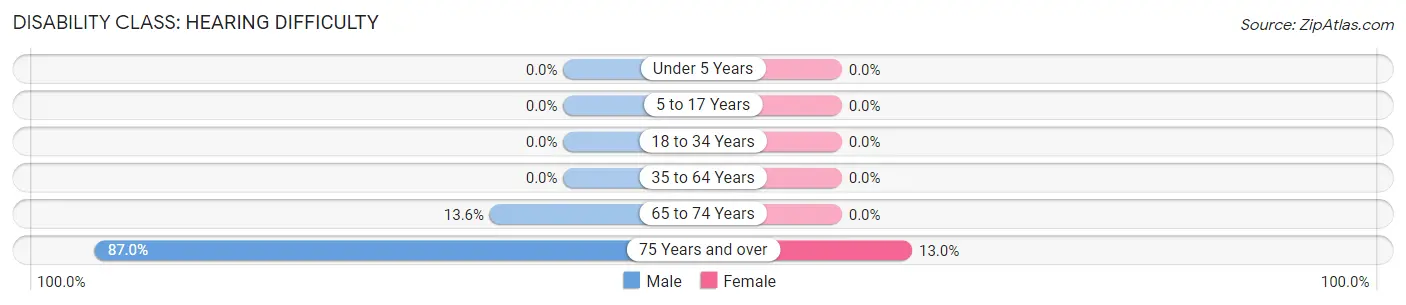
| Age Bracket | Male | Female |
| Under 5 Years | 0 (0.0%) | 0 (0.0%) |
| 5 to 17 Years | 0 (0.0%) | 0 (0.0%) |
| 18 to 34 Years | 0 (0.0%) | 0 (0.0%) |
| 35 to 64 Years | 0 (0.0%) | 0 (0.0%) |
| 65 to 74 Years | 3 (13.6%) | 0 (0.0%) |
| 75 Years and over | 20 (87.0%) | 3 (13.0%) |
Disability Class: Vision Difficulty
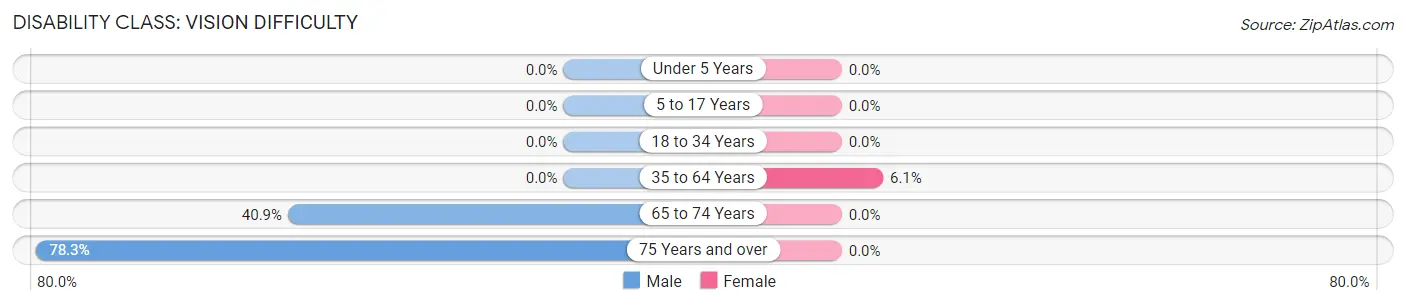
| Age Bracket | Male | Female |
| Under 5 Years | 0 (0.0%) | 0 (0.0%) |
| 5 to 17 Years | 0 (0.0%) | 0 (0.0%) |
| 18 to 34 Years | 0 (0.0%) | 0 (0.0%) |
| 35 to 64 Years | 0 (0.0%) | 3 (6.1%) |
| 65 to 74 Years | 9 (40.9%) | 0 (0.0%) |
| 75 Years and over | 18 (78.3%) | 0 (0.0%) |
Disability Class: Cognitive Difficulty
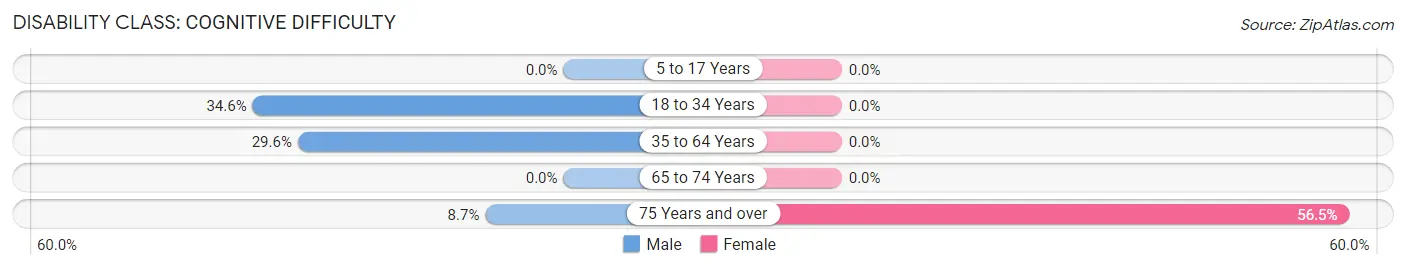
| Age Bracket | Male | Female |
| 5 to 17 Years | 0 (0.0%) | 0 (0.0%) |
| 18 to 34 Years | 9 (34.6%) | 0 (0.0%) |
| 35 to 64 Years | 42 (29.6%) | 0 (0.0%) |
| 65 to 74 Years | 0 (0.0%) | 0 (0.0%) |
| 75 Years and over | 2 (8.7%) | 13 (56.5%) |
Disability Class: Ambulatory Difficulty
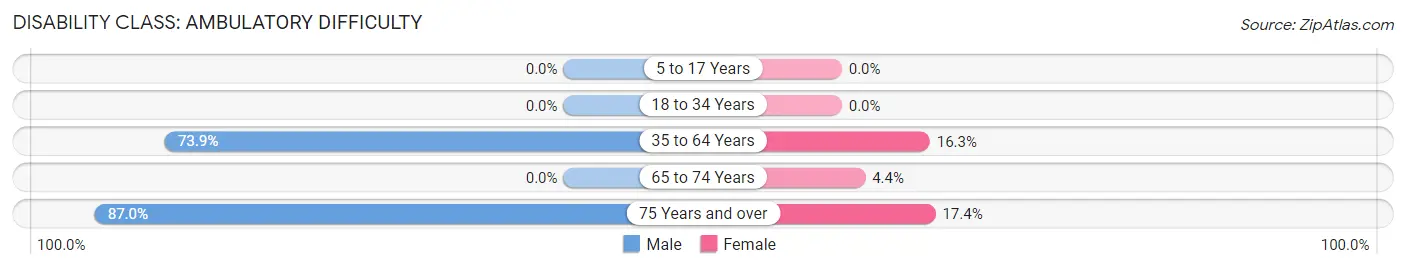
| Age Bracket | Male | Female |
| 5 to 17 Years | 0 (0.0%) | 0 (0.0%) |
| 18 to 34 Years | 0 (0.0%) | 0 (0.0%) |
| 35 to 64 Years | 105 (73.9%) | 8 (16.3%) |
| 65 to 74 Years | 0 (0.0%) | 1 (4.3%) |
| 75 Years and over | 20 (87.0%) | 4 (17.4%) |
Disability Class: Self-Care Difficulty
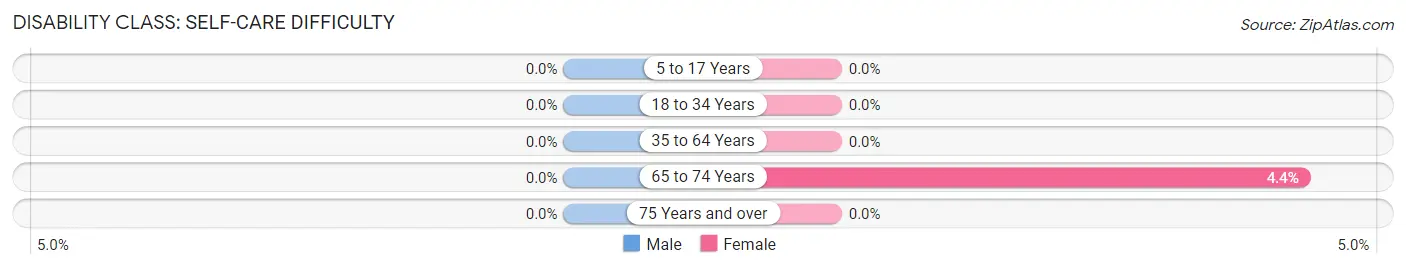
| Age Bracket | Male | Female |
| 5 to 17 Years | 0 (0.0%) | 0 (0.0%) |
| 18 to 34 Years | 0 (0.0%) | 0 (0.0%) |
| 35 to 64 Years | 0 (0.0%) | 0 (0.0%) |
| 65 to 74 Years | 0 (0.0%) | 1 (4.3%) |
| 75 Years and over | 0 (0.0%) | 0 (0.0%) |
Technology Access in Chidester
Computing Device Access in Chidester
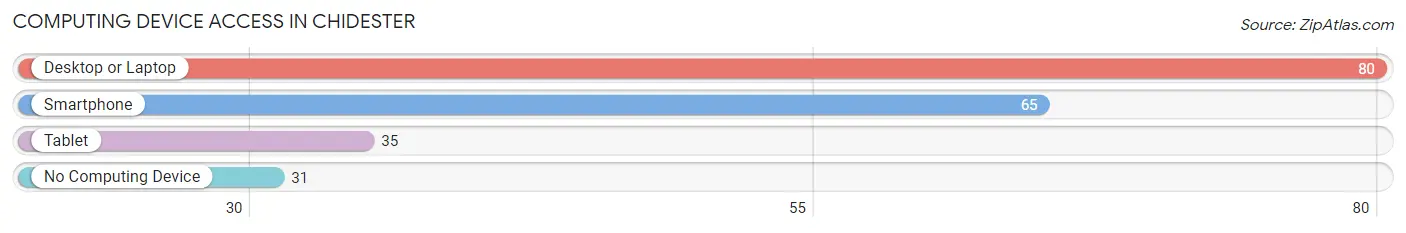
| Device Type | # Households | % Households |
| Desktop or Laptop | 80 | 60.6% |
| Smartphone | 65 | 49.2% |
| Tablet | 35 | 26.5% |
| No Computing Device | 31 | 23.5% |
| Total | 132 | 100.0% |
Internet Access in Chidester
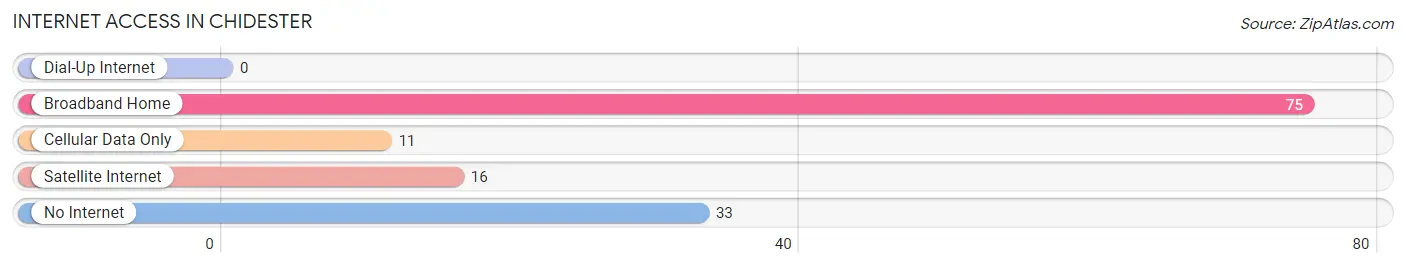
| Internet Type | # Households | % Households |
| Dial-Up Internet | 0 | 0.0% |
| Broadband Home | 75 | 56.8% |
| Cellular Data Only | 11 | 8.3% |
| Satellite Internet | 16 | 12.1% |
| No Internet | 33 | 25.0% |
| Total | 132 | 100.0% |
Chidester Summary
Chidester is a small town located in Ouachita County, Arkansas. It is situated in the foothills of the Ouachita Mountains, approximately 20 miles south of Camden. The town was founded in 1883 and was named after the Chidester family, who were early settlers in the area. The population of Chidester was 545 in the 2010 census.
Geography
Chidester is located at 33°41'25"N, 92°51'45"W (33.690278, -92.862500). The town is situated in the foothills of the Ouachita Mountains, approximately 20 miles south of Camden. The terrain is mostly flat with some rolling hills. The town is located in the Ouachita National Forest, which is home to a variety of wildlife, including deer, turkey, and black bear.
Climate
Chidester has a humid subtropical climate, with hot, humid summers and mild winters. The average annual temperature is 64°F (18°C). The average annual precipitation is 48 inches (122 cm).
Economy
The economy of Chidester is largely based on agriculture. The town is home to several farms, which produce a variety of crops, including cotton, soybeans, corn, and wheat. The town also has a small manufacturing sector, which produces furniture, clothing, and other goods.
Demographics
As of the 2010 census, the population of Chidester was 545. The racial makeup of the town was 95.2% White, 0.7% African American, 0.2% Native American, 0.2% Asian, 0.2% from other races, and 3.7% from two or more races. Hispanic or Latino of any race were 1.3% of the population.
The median income for a household in Chidester was $30,000, and the median income for a family was $35,000. The per capita income for the town was $14,000. About 17.2% of families and 20.2% of the population were below the poverty line, including 28.3% of those under age 18 and 10.7% of those age 65 or over.
Education
Chidester is served by the Ouachita County School District. The town has one elementary school, one middle school, and one high school. The town also has a public library.
Conclusion
Chidester is a small town located in Ouachita County, Arkansas. It is situated in the foothills of the Ouachita Mountains, approximately 20 miles south of Camden. The town was founded in 1883 and was named after the Chidester family, who were early settlers in the area. The population of Chidester was 545 in the 2010 census. The economy of Chidester is largely based on agriculture, with some manufacturing. The town is served by the Ouachita County School District and has a public library.
Common Questions
What is Per Capita Income in Chidester?
Per Capita income in Chidester is $14,459.
What is the Median Family Income in Chidester?
Median Family Income in Chidester is $68,036.
What is the Median Household income in Chidester?
Median Household Income in Chidester is $22,167.
What is Inequality or Gini Index in Chidester?
Inequality or Gini Index in Chidester is 0.48.
What is the Total Population of Chidester?
Total Population of Chidester is 397.
What is the Total Male Population of Chidester?
Total Male Population of Chidester is 226.
What is the Total Female Population of Chidester?
Total Female Population of Chidester is 171.
What is the Ratio of Males per 100 Females in Chidester?
There are 132.16 Males per 100 Females in Chidester.
What is the Ratio of Females per 100 Males in Chidester?
There are 75.66 Females per 100 Males in Chidester.
What is the Median Population Age in Chidester?
Median Population Age in Chidester is 51.5 Years.
What is the Average Family Size in Chidester
Average Family Size in Chidester is 4.5 People.
What is the Average Household Size in Chidester
Average Household Size in Chidester is 3.0 People.
How Large is the Labor Force in Chidester?
There are 113 People in the Labor Forcein in Chidester.
What is the Percentage of People in the Labor Force in Chidester?
33.4% of People are in the Labor Force in Chidester.