Cave City, AR Map & Demographics
Cave City Map
Cave City Overview
$20,252
PER CAPITA INCOME
$51,442
AVG FAMILY INCOME
$40,441
AVG HOUSEHOLD INCOME
44.8%
WAGE / INCOME GAP [ % ]
55.2¢/ $1
WAGE / INCOME GAP [ $ ]
0.47
INEQUALITY / GINI INDEX
2,038
TOTAL POPULATION
875
MALE POPULATION
1,163
FEMALE POPULATION
75.24
MALES / 100 FEMALES
132.91
FEMALES / 100 MALES
35.7
MEDIAN AGE
3.0
AVG FAMILY SIZE
2.5
AVG HOUSEHOLD SIZE
762
LABOR FORCE [ PEOPLE ]
50.6%
PERCENT IN LABOR FORCE
4.3%
UNEMPLOYMENT RATE
Cave City Zip Codes
Cave City Area Codes
Income in Cave City
Income Overview in Cave City
Per Capita Income in Cave City is $20,252, while median incomes of families and households are $51,442 and $40,441 respectively.
| Characteristic | Number | Measure |
| Per Capita Income | 2,038 | $20,252 |
| Median Family Income | 535 | $51,442 |
| Mean Family Income | 535 | $63,674 |
| Median Household Income | 790 | $40,441 |
| Mean Household Income | 790 | $52,802 |
| Income Deficit | 535 | $0 |
| Wage / Income Gap (%) | 2,038 | 44.80% |
| Wage / Income Gap ($) | 2,038 | 55.20¢ per $1 |
| Gini / Inequality Index | 2,038 | 0.47 |
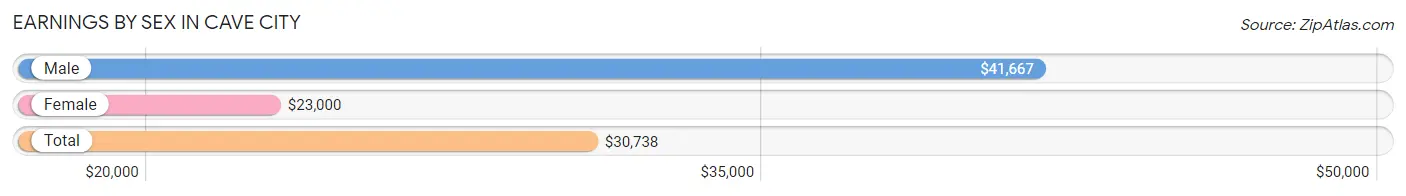
Earnings by Sex in Cave City
Average Earnings in Cave City are $30,738, $41,667 for men and $23,000 for women, a difference of 44.8%.
| Sex | Number | Average Earnings |
| Male | 368 (47.1%) | $41,667 |
| Female | 414 (52.9%) | $23,000 |
| Total | 782 (100.0%) | $30,738 |
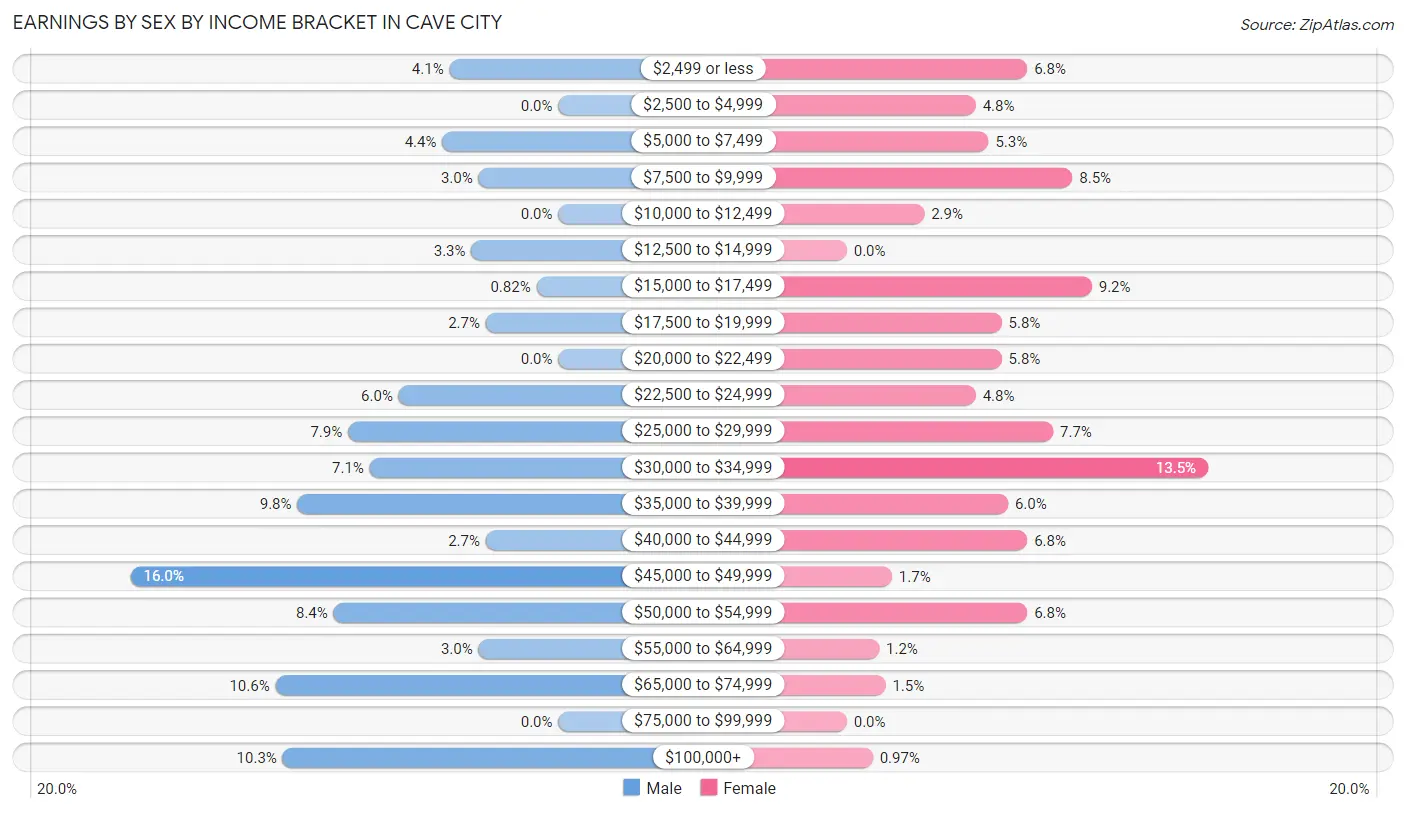
Earnings by Sex by Income Bracket in Cave City
The most common earnings brackets in Cave City are $45,000 to $49,999 for men (59 | 16.0%) and $30,000 to $34,999 for women (56 | 13.5%).
| Income | Male | Female |
| $2,499 or less | 15 (4.1%) | 28 (6.8%) |
| $2,500 to $4,999 | 0 (0.0%) | 20 (4.8%) |
| $5,000 to $7,499 | 16 (4.3%) | 22 (5.3%) |
| $7,500 to $9,999 | 11 (3.0%) | 35 (8.5%) |
| $10,000 to $12,499 | 0 (0.0%) | 12 (2.9%) |
| $12,500 to $14,999 | 12 (3.3%) | 0 (0.0%) |
| $15,000 to $17,499 | 3 (0.8%) | 38 (9.2%) |
| $17,500 to $19,999 | 10 (2.7%) | 24 (5.8%) |
| $20,000 to $22,499 | 0 (0.0%) | 24 (5.8%) |
| $22,500 to $24,999 | 22 (6.0%) | 20 (4.8%) |
| $25,000 to $29,999 | 29 (7.9%) | 32 (7.7%) |
| $30,000 to $34,999 | 26 (7.1%) | 56 (13.5%) |
| $35,000 to $39,999 | 36 (9.8%) | 25 (6.0%) |
| $40,000 to $44,999 | 10 (2.7%) | 28 (6.8%) |
| $45,000 to $49,999 | 59 (16.0%) | 7 (1.7%) |
| $50,000 to $54,999 | 31 (8.4%) | 28 (6.8%) |
| $55,000 to $64,999 | 11 (3.0%) | 5 (1.2%) |
| $65,000 to $74,999 | 39 (10.6%) | 6 (1.5%) |
| $75,000 to $99,999 | 0 (0.0%) | 0 (0.0%) |
| $100,000+ | 38 (10.3%) | 4 (1.0%) |
| Total | 368 (100.0%) | 414 (100.0%) |
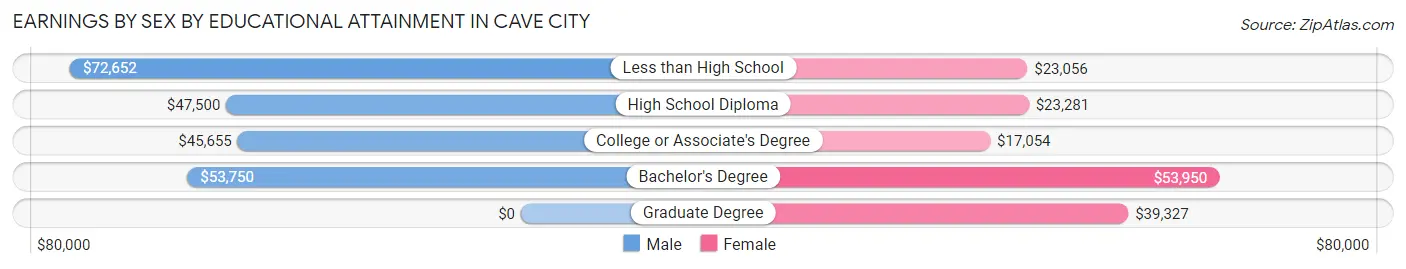
Earnings by Sex by Educational Attainment in Cave City
Average earnings in Cave City are $47,250 for men and $23,603 for women, a difference of 50.0%. Men with an educational attainment of less than high school enjoy the highest average annual earnings of $72,652, while those with college or associate's degree education earn the least with $45,655. Women with an educational attainment of bachelor's degree earn the most with the average annual earnings of $53,950, while those with college or associate's degree education have the smallest earnings of $17,054.
| Educational Attainment | Male Income | Female Income |
| Less than High School | $72,652 | $23,056 |
| High School Diploma | $47,500 | $23,281 |
| College or Associate's Degree | $45,655 | $17,054 |
| Bachelor's Degree | $53,750 | $53,950 |
| Graduate Degree | - | - |
| Total | $47,250 | $23,603 |
Family Income in Cave City
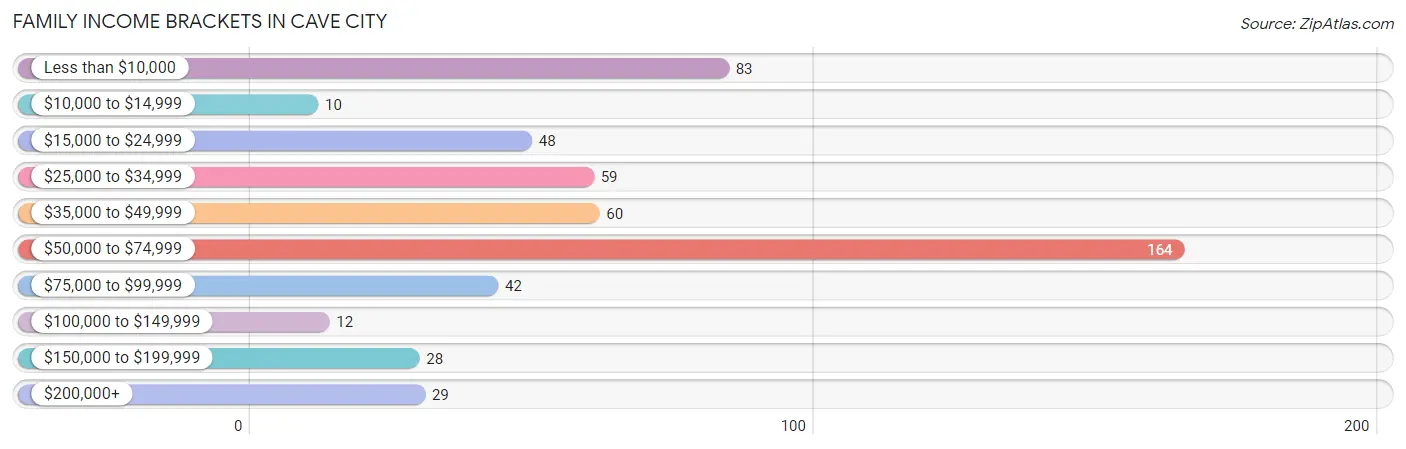
Family Income Brackets in Cave City
According to the Cave City family income data, there are 164 families falling into the $50,000 to $74,999 income range, which is the most common income bracket and makes up 30.6% of all families. Conversely, the $10,000 to $14,999 income bracket is the least frequent group with only 10 families (1.9%) belonging to this category.
| Income Bracket | # Families | % Families |
| Less than $10,000 | 83 | 15.5% |
| $10,000 to $14,999 | 10 | 1.9% |
| $15,000 to $24,999 | 48 | 9.0% |
| $25,000 to $34,999 | 59 | 11.0% |
| $35,000 to $49,999 | 60 | 11.2% |
| $50,000 to $74,999 | 164 | 30.7% |
| $75,000 to $99,999 | 42 | 7.9% |
| $100,000 to $149,999 | 12 | 2.2% |
| $150,000 to $199,999 | 28 | 5.2% |
| $200,000+ | 29 | 5.4% |
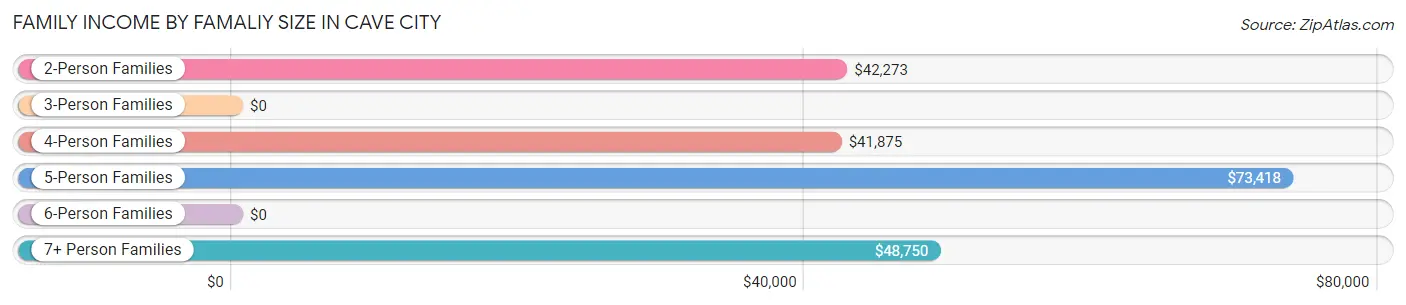
Family Income by Famaliy Size in Cave City
5-person families (93 | 17.4%) account for the highest median family income in Cave City with $73,418 per family, while 2-person families (208 | 38.9%) have the highest median income of $21,136 per family member.
| Income Bracket | # Families | Median Income |
| 2-Person Families | 208 (38.9%) | $42,273 |
| 3-Person Families | 147 (27.5%) | $0 |
| 4-Person Families | 65 (12.1%) | $41,875 |
| 5-Person Families | 93 (17.4%) | $73,418 |
| 6-Person Families | 2 (0.4%) | $0 |
| 7+ Person Families | 20 (3.7%) | $48,750 |
| Total | 535 (100.0%) | $51,442 |
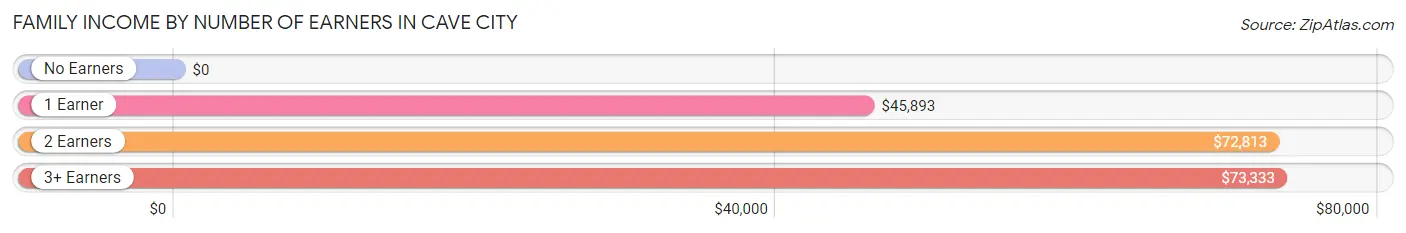
Family Income by Number of Earners in Cave City
| Number of Earners | # Families | Median Income |
| No Earners | 98 (18.3%) | $0 |
| 1 Earner | 227 (42.4%) | $45,893 |
| 2 Earners | 174 (32.5%) | $72,813 |
| 3+ Earners | 36 (6.7%) | $73,333 |
| Total | 535 (100.0%) | $51,442 |
Household Income in Cave City
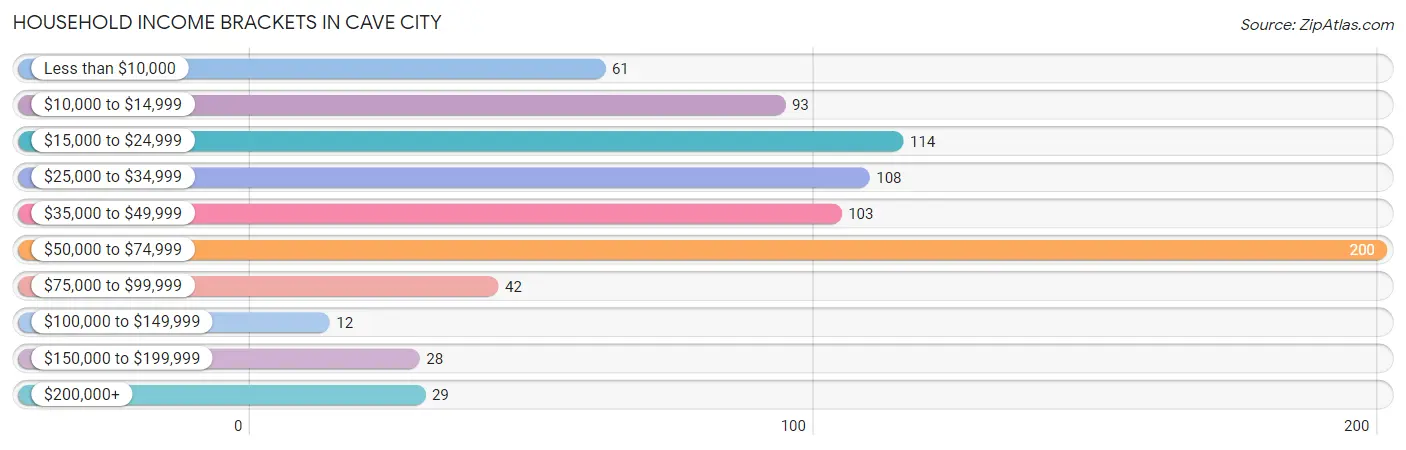
Household Income Brackets in Cave City
With 200 households falling in the category, the $50,000 to $74,999 income range is the most frequent in Cave City, accounting for 25.3% of all households. In contrast, only 12 households (1.5%) fall into the $100,000 to $149,999 income bracket, making it the least populous group.
| Income Bracket | # Households | % Households |
| Less than $10,000 | 61 | 7.7% |
| $10,000 to $14,999 | 93 | 11.8% |
| $15,000 to $24,999 | 114 | 14.4% |
| $25,000 to $34,999 | 108 | 13.7% |
| $35,000 to $49,999 | 103 | 13.0% |
| $50,000 to $74,999 | 200 | 25.3% |
| $75,000 to $99,999 | 42 | 5.3% |
| $100,000 to $149,999 | 12 | 1.5% |
| $150,000 to $199,999 | 28 | 3.5% |
| $200,000+ | 29 | 3.7% |
Household Income by Householder Age in Cave City
The median household income in Cave City is $40,441, with the highest median household income of $57,902 found in the 25 to 44 years age bracket for the primary householder. A total of 303 households (38.4%) fall into this category. Meanwhile, the 15 to 24 years age bracket for the primary householder has the lowest median household income of $0, with 64 households (8.1%) in this group.
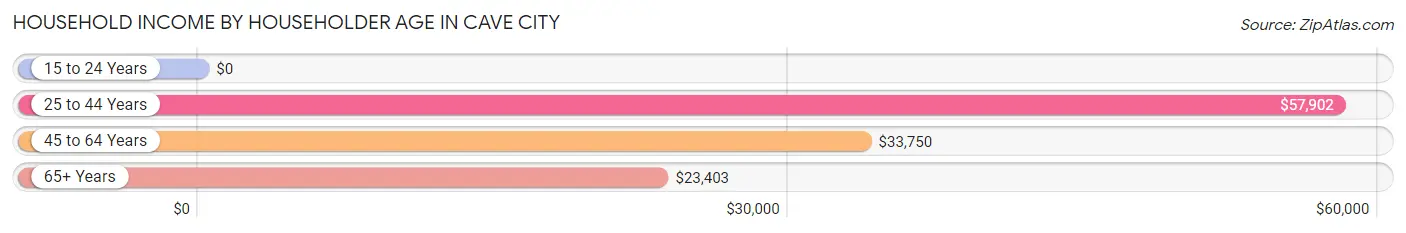
| Income Bracket | # Households | Median Income |
| 15 to 24 Years | 64 (8.1%) | $0 |
| 25 to 44 Years | 303 (38.4%) | $57,902 |
| 45 to 64 Years | 176 (22.3%) | $33,750 |
| 65+ Years | 247 (31.3%) | $23,403 |
| Total | 790 (100.0%) | $40,441 |
Poverty in Cave City
Income Below Poverty by Sex and Age in Cave City
With 24.0% poverty level for males and 27.6% for females among the residents of Cave City, 16 and 17 year old males and 5 year old females are the most vulnerable to poverty, with 35 males (61.4%) and 10 females (62.5%) in their respective age groups living below the poverty level.
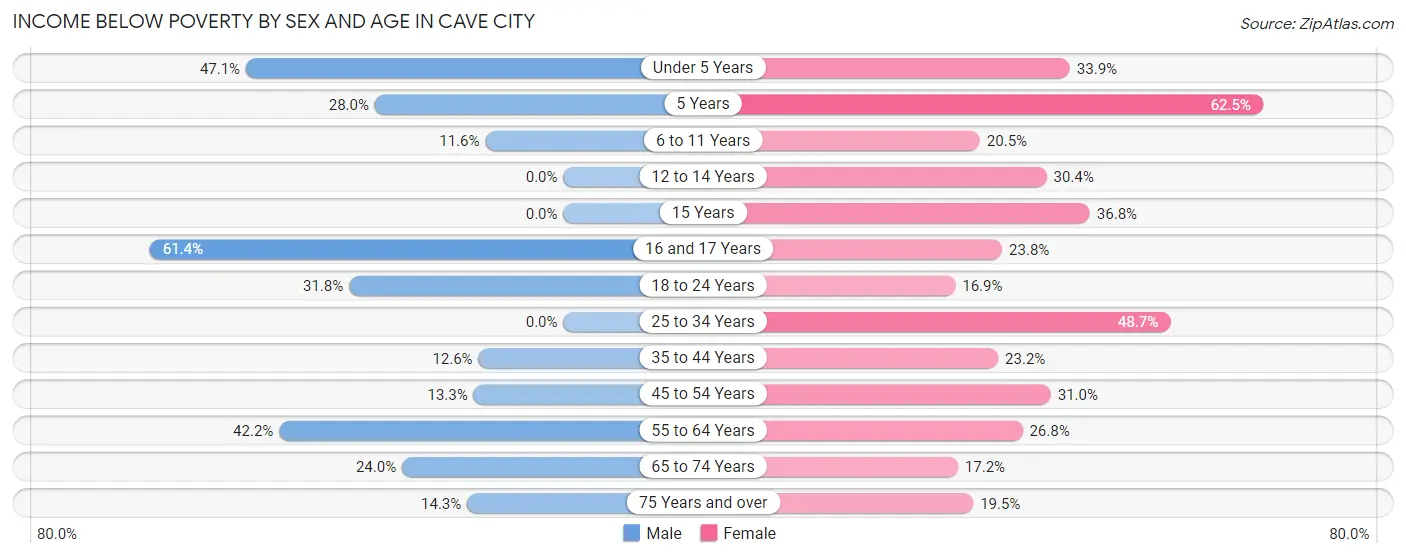
| Age Bracket | Male | Female |
| Under 5 Years | 41 (47.1%) | 21 (33.9%) |
| 5 Years | 7 (28.0%) | 10 (62.5%) |
| 6 to 11 Years | 8 (11.6%) | 16 (20.5%) |
| 12 to 14 Years | 0 (0.0%) | 38 (30.4%) |
| 15 Years | 0 (0.0%) | 7 (36.8%) |
| 16 and 17 Years | 35 (61.4%) | 10 (23.8%) |
| 18 to 24 Years | 21 (31.8%) | 15 (16.9%) |
| 25 to 34 Years | 0 (0.0%) | 58 (48.7%) |
| 35 to 44 Years | 15 (12.6%) | 49 (23.2%) |
| 45 to 54 Years | 6 (13.3%) | 18 (31.0%) |
| 55 to 64 Years | 46 (42.2%) | 33 (26.8%) |
| 65 to 74 Years | 23 (24.0%) | 20 (17.2%) |
| 75 Years and over | 6 (14.3%) | 8 (19.5%) |
| Total | 208 (24.0%) | 303 (27.6%) |
Income Above Poverty by Sex and Age in Cave City
According to the poverty statistics in Cave City, males aged 12 to 14 years and females aged 18 to 24 years are the age groups that are most secure financially, with 100.0% of males and 83.2% of females in these age groups living above the poverty line.
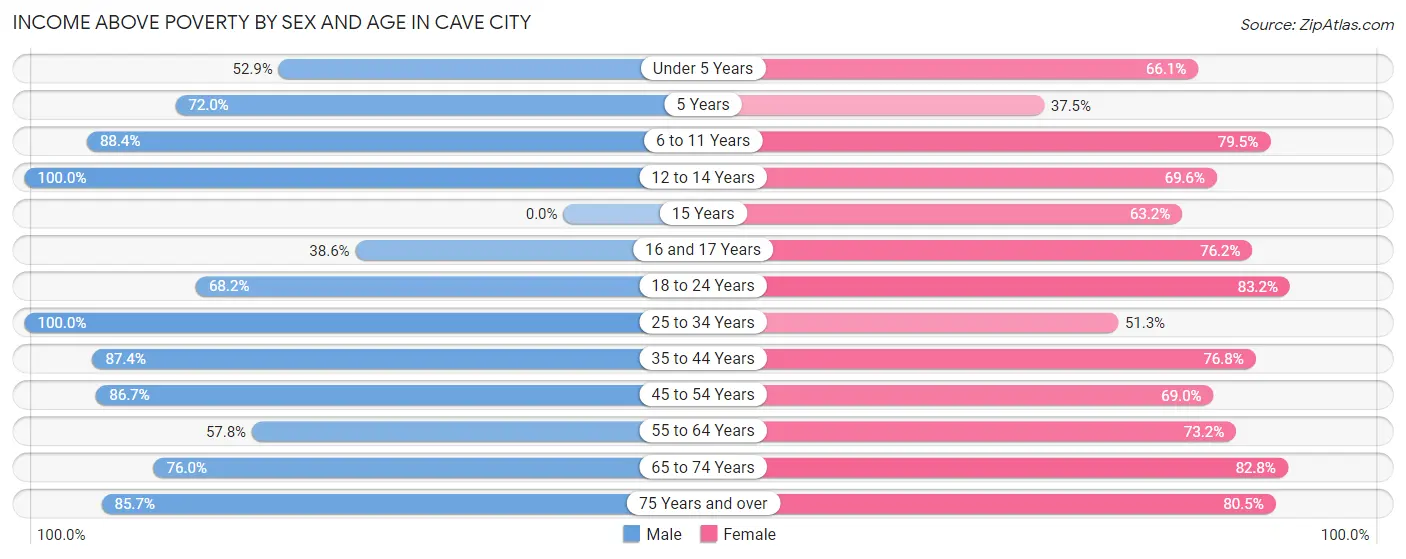
| Age Bracket | Male | Female |
| Under 5 Years | 46 (52.9%) | 41 (66.1%) |
| 5 Years | 18 (72.0%) | 6 (37.5%) |
| 6 to 11 Years | 61 (88.4%) | 62 (79.5%) |
| 12 to 14 Years | 52 (100.0%) | 87 (69.6%) |
| 15 Years | 0 (0.0%) | 12 (63.2%) |
| 16 and 17 Years | 22 (38.6%) | 32 (76.2%) |
| 18 to 24 Years | 45 (68.2%) | 74 (83.2%) |
| 25 to 34 Years | 98 (100.0%) | 61 (51.3%) |
| 35 to 44 Years | 104 (87.4%) | 162 (76.8%) |
| 45 to 54 Years | 39 (86.7%) | 40 (69.0%) |
| 55 to 64 Years | 63 (57.8%) | 90 (73.2%) |
| 65 to 74 Years | 73 (76.0%) | 96 (82.8%) |
| 75 Years and over | 36 (85.7%) | 33 (80.5%) |
| Total | 657 (75.9%) | 796 (72.4%) |
Income Below Poverty Among Married-Couple Families in Cave City
The poverty statistics for married-couple families in Cave City show that 6.3% or 24 of the total 382 families live below the poverty line. Families with 1 or 2 children have the highest poverty rate of 12.8%, comprising of 13 families. On the other hand, families with 5 or more children have the lowest poverty rate of 0.0%, which includes 0 families.
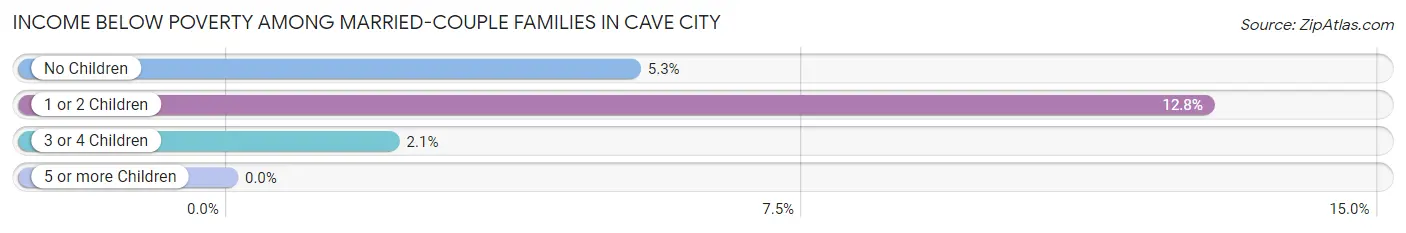
| Children | Above Poverty | Below Poverty |
| No Children | 162 (94.7%) | 9 (5.3%) |
| 1 or 2 Children | 89 (87.3%) | 13 (12.8%) |
| 3 or 4 Children | 93 (97.9%) | 2 (2.1%) |
| 5 or more Children | 14 (100.0%) | 0 (0.0%) |
| Total | 358 (93.7%) | 24 (6.3%) |
Income Below Poverty Among Single-Parent Households in Cave City
According to the poverty data in Cave City, 50.0% or 7 single-father households and 69.1% or 96 single-mother households are living below the poverty line. Among single-father households, those with 1 or 2 children have the highest poverty rate, with 7 households (63.6%) experiencing poverty. Likewise, among single-mother households, those with 3 or 4 children have the highest poverty rate, with 14 households (100.0%) falling below the poverty line.
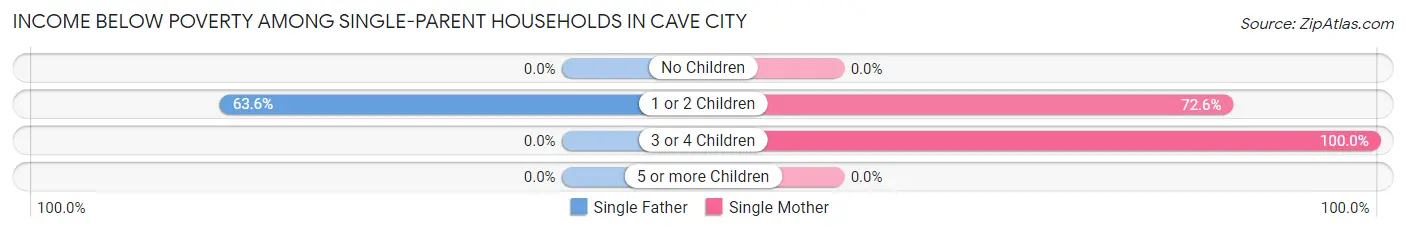
| Children | Single Father | Single Mother |
| No Children | 0 (0.0%) | 0 (0.0%) |
| 1 or 2 Children | 7 (63.6%) | 82 (72.6%) |
| 3 or 4 Children | 0 (0.0%) | 14 (100.0%) |
| 5 or more Children | 0 (0.0%) | 0 (0.0%) |
| Total | 7 (50.0%) | 96 (69.1%) |
Income Below Poverty Among Married-Couple vs Single-Parent Households in Cave City
The poverty data for Cave City shows that 24 of the married-couple family households (6.3%) and 103 of the single-parent households (67.3%) are living below the poverty level. Within the married-couple family households, those with 1 or 2 children have the highest poverty rate, with 13 households (12.8%) falling below the poverty line. Among the single-parent households, those with 3 or 4 children have the highest poverty rate, with 14 household (100.0%) living below poverty.
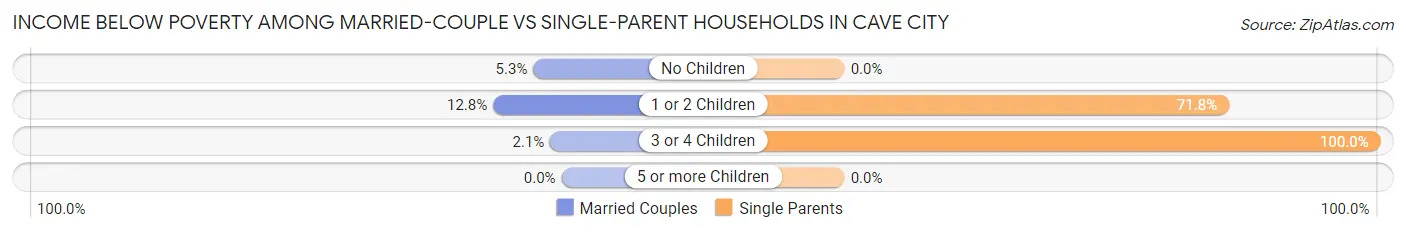
| Children | Married-Couple Families | Single-Parent Households |
| No Children | 9 (5.3%) | 0 (0.0%) |
| 1 or 2 Children | 13 (12.8%) | 89 (71.8%) |
| 3 or 4 Children | 2 (2.1%) | 14 (100.0%) |
| 5 or more Children | 0 (0.0%) | 0 (0.0%) |
| Total | 24 (6.3%) | 103 (67.3%) |
Race in Cave City
The most populous races in Cave City are White / Caucasian (1,992 | 97.7%), Hispanic or Latino (83 | 4.1%), and Two or more Races (34 | 1.7%).
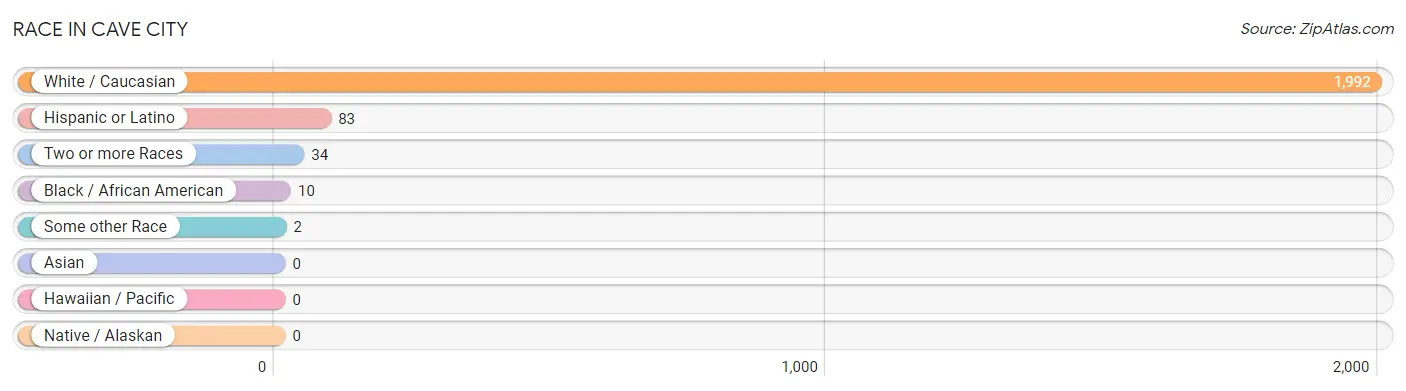
| Race | # Population | % Population |
| Asian | 0 | 0.0% |
| Black / African American | 10 | 0.5% |
| Hawaiian / Pacific | 0 | 0.0% |
| Hispanic or Latino | 83 | 4.1% |
| Native / Alaskan | 0 | 0.0% |
| White / Caucasian | 1,992 | 97.7% |
| Two or more Races | 34 | 1.7% |
| Some other Race | 2 | 0.1% |
| Total | 2,038 | 100.0% |
Ancestry in Cave City
The most populous ancestries reported in Cave City are English (225 | 11.0%), Irish (213 | 10.4%), American (149 | 7.3%), German (120 | 5.9%), and French (98 | 4.8%), together accounting for 39.5% of all Cave City residents.
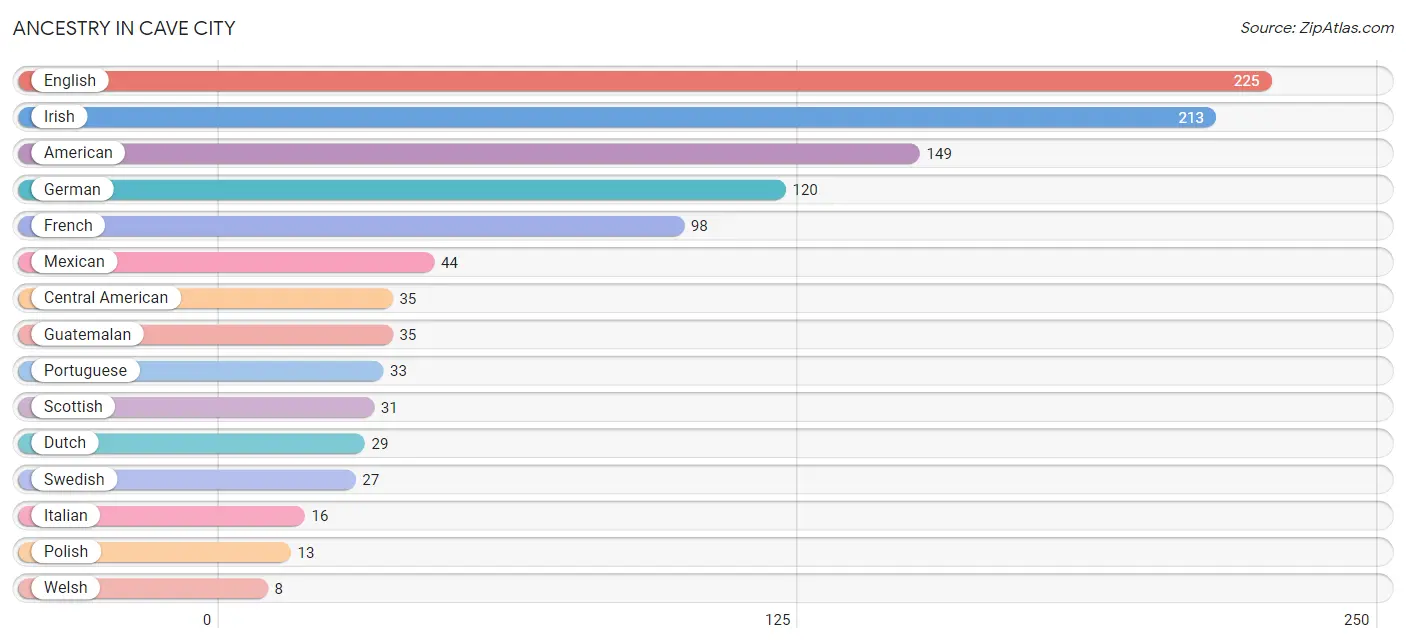
| Ancestry | # Population | % Population |
| American | 149 | 7.3% |
| British | 3 | 0.2% |
| Canadian | 3 | 0.2% |
| Central American | 35 | 1.7% |
| Cherokee | 2 | 0.1% |
| Dutch | 29 | 1.4% |
| English | 225 | 11.0% |
| French | 98 | 4.8% |
| German | 120 | 5.9% |
| Guatemalan | 35 | 1.7% |
| Irish | 213 | 10.4% |
| Italian | 16 | 0.8% |
| Mexican | 44 | 2.2% |
| Polish | 13 | 0.6% |
| Portuguese | 33 | 1.6% |
| Puerto Rican | 4 | 0.2% |
| Scotch-Irish | 2 | 0.1% |
| Scottish | 31 | 1.5% |
| Swedish | 27 | 1.3% |
| Welsh | 8 | 0.4% |
| Yugoslavian | 3 | 0.2% | View All 21 Rows |
Immigrants in Cave City
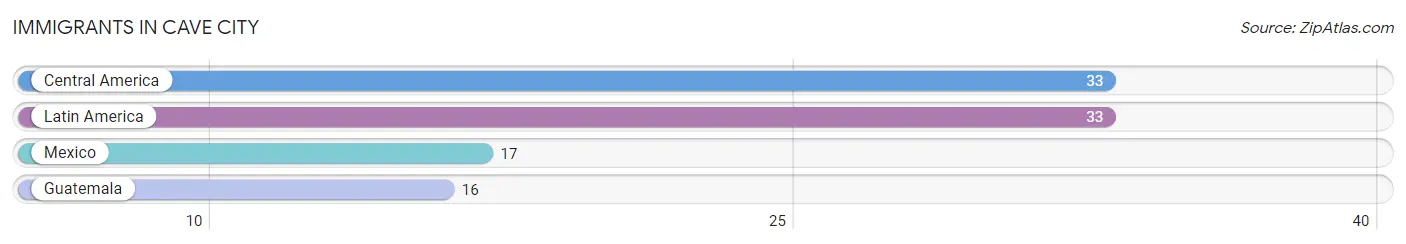
The most numerous immigrant groups reported in Cave City came from Central America (33 | 1.6%), Latin America (33 | 1.6%), Mexico (17 | 0.8%), and Guatemala (16 | 0.8%), together accounting for 4.9% of all Cave City residents.
| Immigration Origin | # Population | % Population |
| Central America | 33 | 1.6% |
| Guatemala | 16 | 0.8% |
| Latin America | 33 | 1.6% |
| Mexico | 17 | 0.8% | View All 4 Rows |
Sex and Age in Cave City
Sex and Age in Cave City
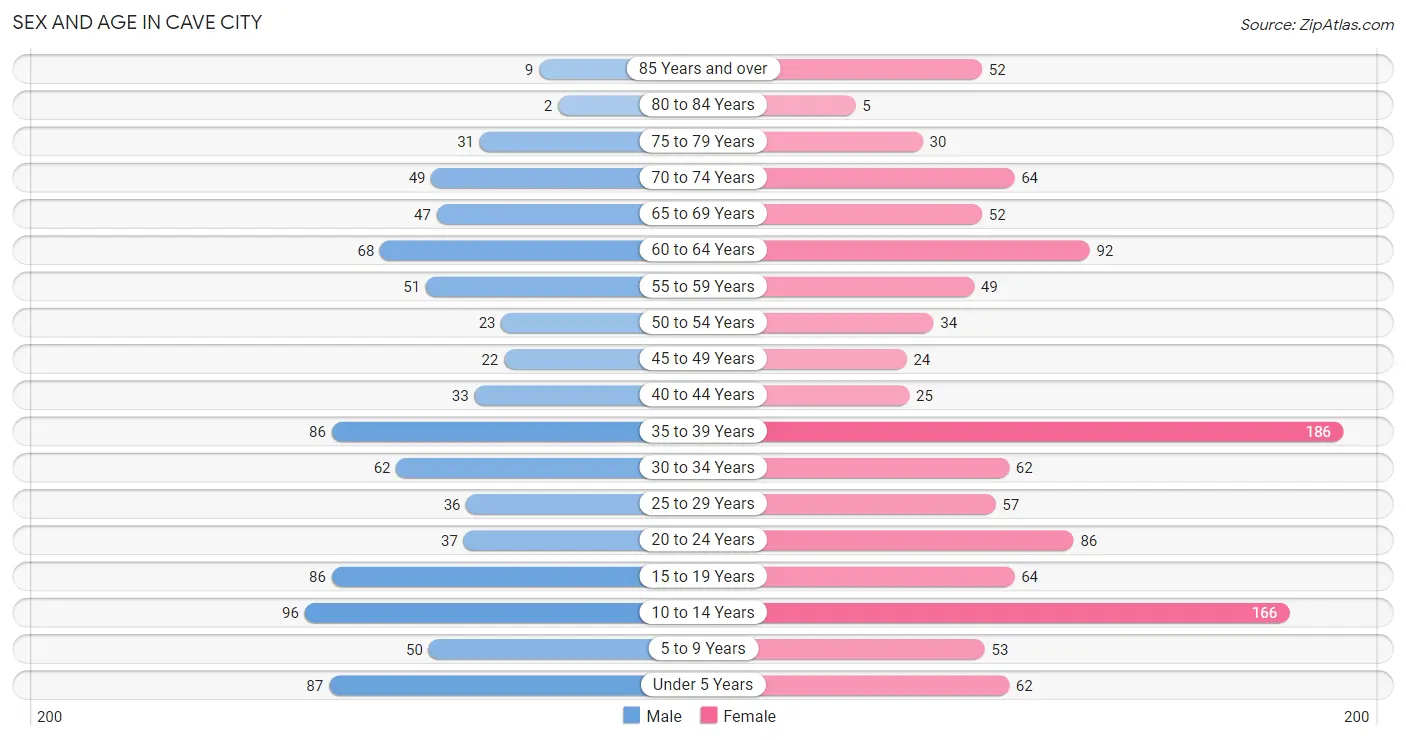
The most populous age groups in Cave City are 10 to 14 Years (96 | 11.0%) for men and 35 to 39 Years (186 | 16.0%) for women.
| Age Bracket | Male | Female |
| Under 5 Years | 87 (9.9%) | 62 (5.3%) |
| 5 to 9 Years | 50 (5.7%) | 53 (4.6%) |
| 10 to 14 Years | 96 (11.0%) | 166 (14.3%) |
| 15 to 19 Years | 86 (9.8%) | 64 (5.5%) |
| 20 to 24 Years | 37 (4.2%) | 86 (7.4%) |
| 25 to 29 Years | 36 (4.1%) | 57 (4.9%) |
| 30 to 34 Years | 62 (7.1%) | 62 (5.3%) |
| 35 to 39 Years | 86 (9.8%) | 186 (16.0%) |
| 40 to 44 Years | 33 (3.8%) | 25 (2.1%) |
| 45 to 49 Years | 22 (2.5%) | 24 (2.1%) |
| 50 to 54 Years | 23 (2.6%) | 34 (2.9%) |
| 55 to 59 Years | 51 (5.8%) | 49 (4.2%) |
| 60 to 64 Years | 68 (7.8%) | 92 (7.9%) |
| 65 to 69 Years | 47 (5.4%) | 52 (4.5%) |
| 70 to 74 Years | 49 (5.6%) | 64 (5.5%) |
| 75 to 79 Years | 31 (3.5%) | 30 (2.6%) |
| 80 to 84 Years | 2 (0.2%) | 5 (0.4%) |
| 85 Years and over | 9 (1.0%) | 52 (4.5%) |
| Total | 875 (100.0%) | 1,163 (100.0%) |
Families and Households in Cave City
Median Family Size in Cave City
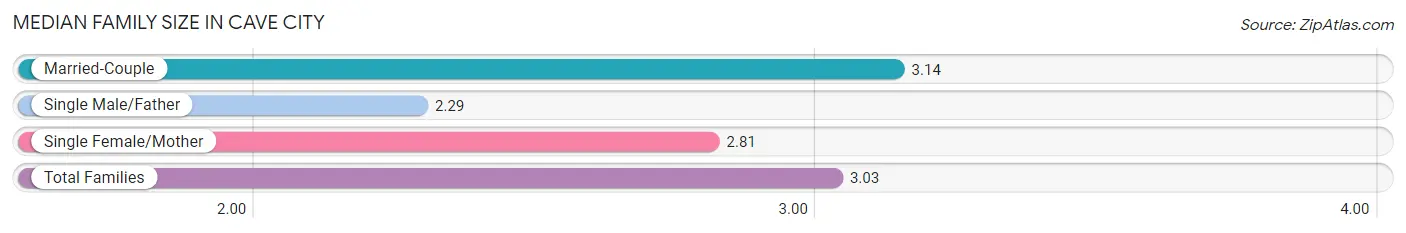
The median family size in Cave City is 3.03 persons per family, with married-couple families (382 | 71.4%) accounting for the largest median family size of 3.14 persons per family. On the other hand, single male/father families (14 | 2.6%) represent the smallest median family size with 2.29 persons per family.
| Family Type | # Families | Family Size |
| Married-Couple | 382 (71.4%) | 3.14 |
| Single Male/Father | 14 (2.6%) | 2.29 |
| Single Female/Mother | 139 (26.0%) | 2.81 |
| Total Families | 535 (100.0%) | 3.03 |
Median Household Size in Cave City
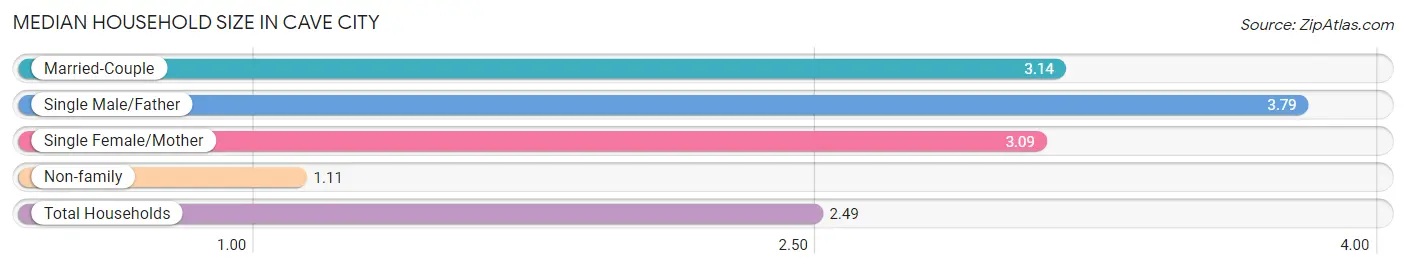
The median household size in Cave City is 2.49 persons per household, with single male/father households (14 | 1.8%) accounting for the largest median household size of 3.79 persons per household. non-family households (255 | 32.3%) represent the smallest median household size with 1.11 persons per household.
| Household Type | # Households | Household Size |
| Married-Couple | 382 (48.3%) | 3.14 |
| Single Male/Father | 14 (1.8%) | 3.79 |
| Single Female/Mother | 139 (17.6%) | 3.09 |
| Non-family | 255 (32.3%) | 1.11 |
| Total Households | 790 (100.0%) | 2.49 |
Household Size by Marriage Status in Cave City
Out of a total of 790 households in Cave City, 535 (67.7%) are family households, while 255 (32.3%) are nonfamily households. The most numerous type of family households are 2-person households, comprising 200, and the most common type of nonfamily households are 1-person households, comprising 237.
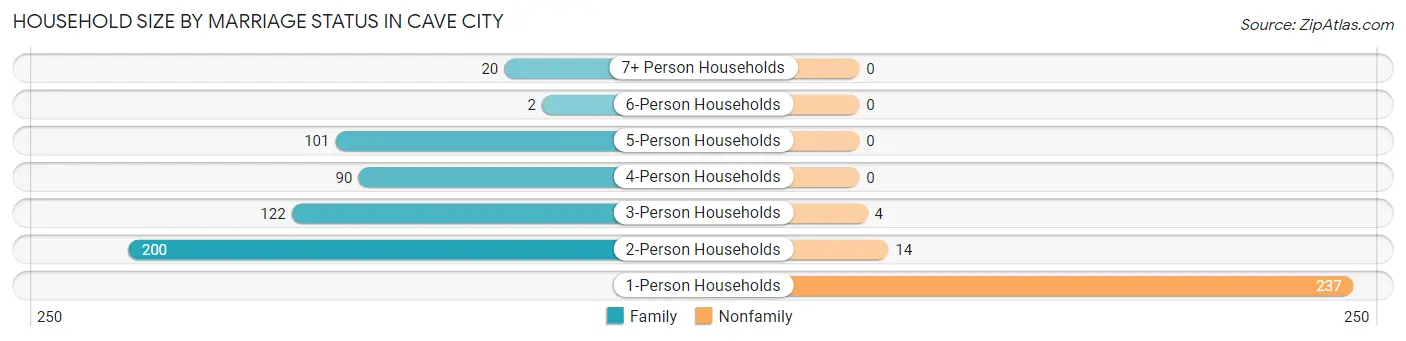
| Household Size | Family Households | Nonfamily Households |
| 1-Person Households | - | 237 (30.0%) |
| 2-Person Households | 200 (25.3%) | 14 (1.8%) |
| 3-Person Households | 122 (15.4%) | 4 (0.5%) |
| 4-Person Households | 90 (11.4%) | 0 (0.0%) |
| 5-Person Households | 101 (12.8%) | 0 (0.0%) |
| 6-Person Households | 2 (0.3%) | 0 (0.0%) |
| 7+ Person Households | 20 (2.5%) | 0 (0.0%) |
| Total | 535 (67.7%) | 255 (32.3%) |
Female Fertility in Cave City
Fertility by Age in Cave City
Average fertility rate in Cave City is 75.0 births per 1,000 women. Women in the age bracket of 20 to 34 years have the highest fertility rate with 185.0 births per 1,000 women. Women in the age bracket of 20 to 34 years acount for 100.0% of all women with births.
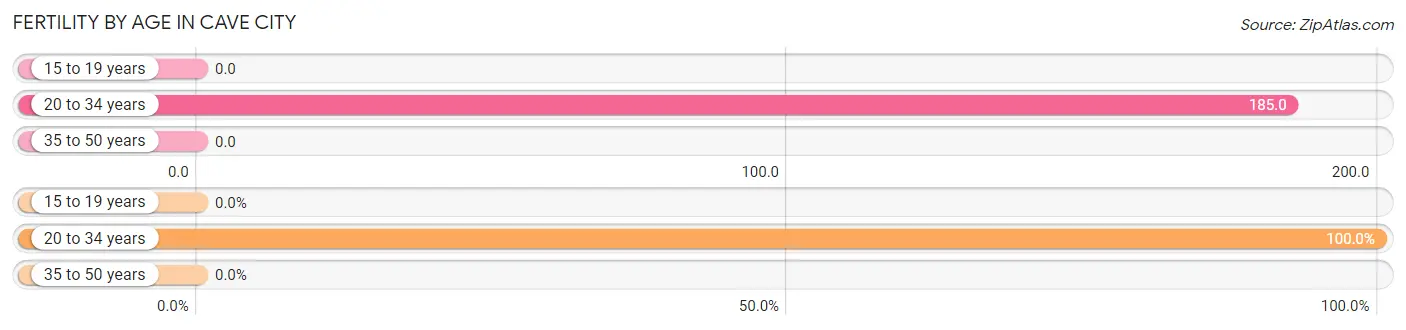
| Age Bracket | Women with Births | Births / 1,000 Women |
| 15 to 19 years | 0 (0.0%) | 0.0 |
| 20 to 34 years | 38 (100.0%) | 185.0 |
| 35 to 50 years | 0 (0.0%) | 0.0 |
| Total | 38 (100.0%) | 75.0 |
Fertility by Age by Marriage Status in Cave City
28.9% of women with births (38) in Cave City are married. The highest percentage of unmarried women with births falls into 20 to 34 years age bracket with 71.1% of them unmarried at the time of birth, while the lowest percentage of unmarried women with births belong to 20 to 34 years age bracket with 71.1% of them unmarried.
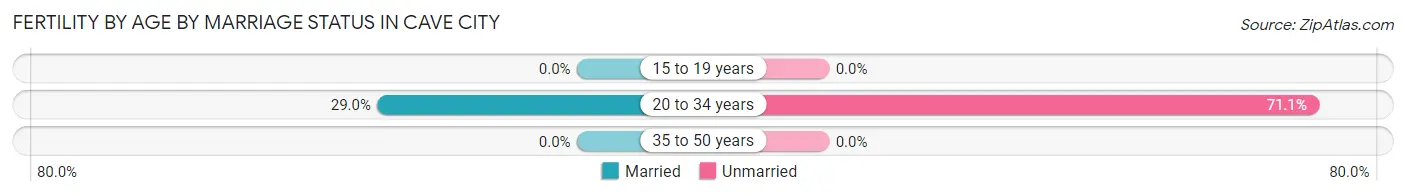
| Age Bracket | Married | Unmarried |
| 15 to 19 years | 0 (0.0%) | 0 (0.0%) |
| 20 to 34 years | 11 (28.9%) | 27 (71.1%) |
| 35 to 50 years | 0 (0.0%) | 0 (0.0%) |
| Total | 11 (28.9%) | 27 (71.1%) |
Fertility by Education in Cave City
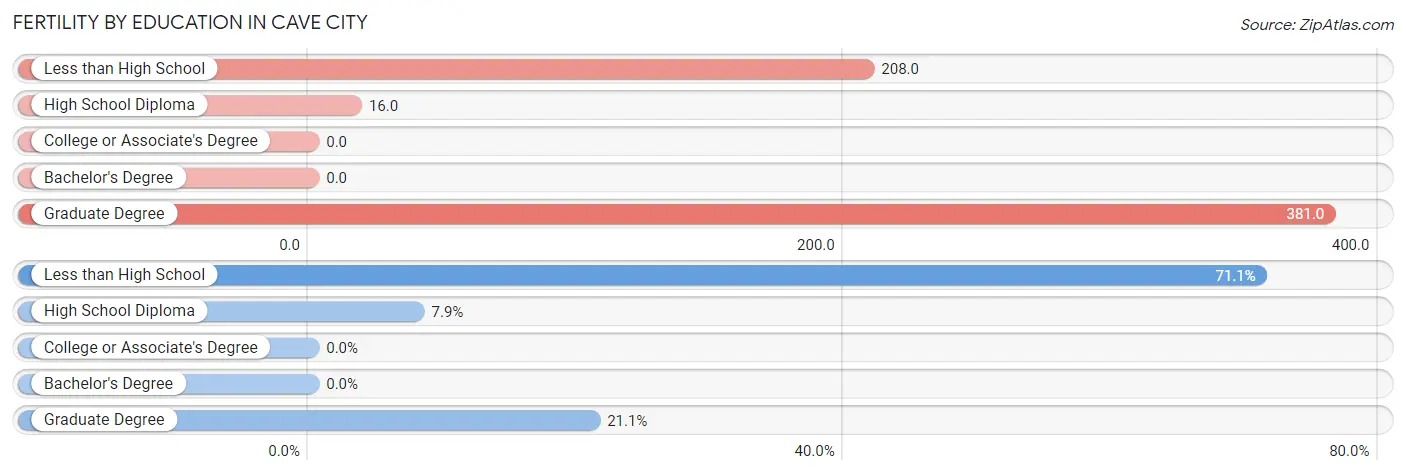
| Educational Attainment | Women with Births | Births / 1,000 Women |
| Less than High School | 27 (71.1%) | 208.0 |
| High School Diploma | 3 (7.9%) | 16.0 |
| College or Associate's Degree | 0 (0.0%) | 0.0 |
| Bachelor's Degree | 0 (0.0%) | 0.0 |
| Graduate Degree | 8 (21.0%) | 381.0 |
| Total | 38 (100.0%) | 75.0 |
Fertility by Education by Marriage Status in Cave City
71.1% of women with births in Cave City are unmarried. Women with the educational attainment of high school diploma are most likely to be married with 100.0% of them married at childbirth, while women with the educational attainment of less than high school are least likely to be married with 100.0% of them unmarried at childbirth.
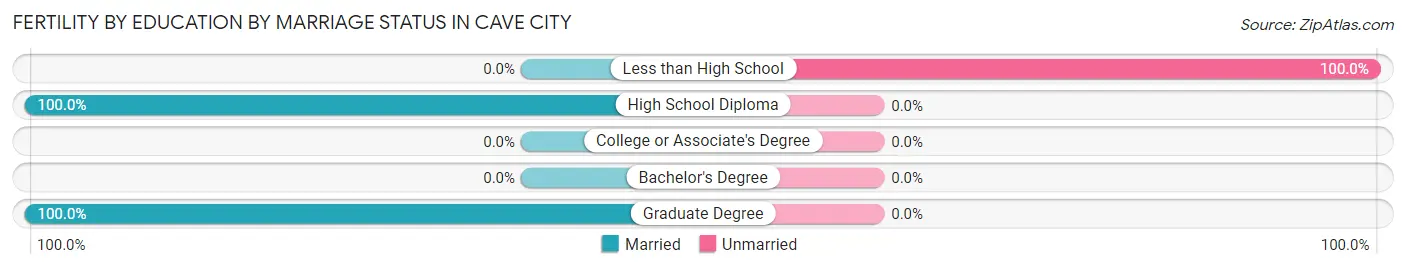
| Educational Attainment | Married | Unmarried |
| Less than High School | 0 (0.0%) | 27 (100.0%) |
| High School Diploma | 3 (100.0%) | 0 (0.0%) |
| College or Associate's Degree | 0 (0.0%) | 0 (0.0%) |
| Bachelor's Degree | 0 (0.0%) | 0 (0.0%) |
| Graduate Degree | 8 (100.0%) | 0 (0.0%) |
| Total | 11 (28.9%) | 27 (71.1%) |
Employment Characteristics in Cave City
Employment by Class of Employer in Cave City
Among the 729 employed individuals in Cave City, private company employees (529 | 72.6%), self-employed (incorporated) (67 | 9.2%), and local government employees (50 | 6.9%) make up the most common classes of employment.
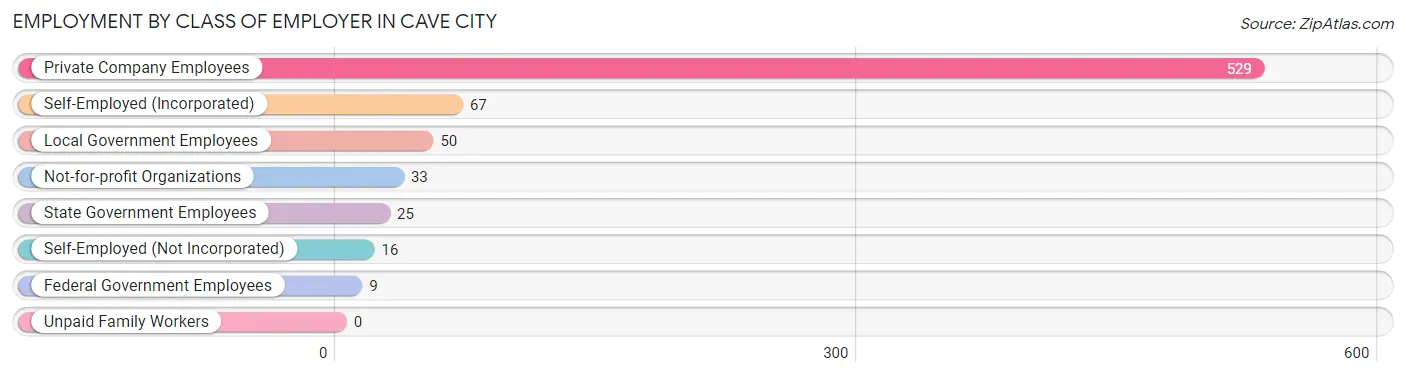
| Employer Class | # Employees | % Employees |
| Private Company Employees | 529 | 72.6% |
| Self-Employed (Incorporated) | 67 | 9.2% |
| Self-Employed (Not Incorporated) | 16 | 2.2% |
| Not-for-profit Organizations | 33 | 4.5% |
| Local Government Employees | 50 | 6.9% |
| State Government Employees | 25 | 3.4% |
| Federal Government Employees | 9 | 1.2% |
| Unpaid Family Workers | 0 | 0.0% |
| Total | 729 | 100.0% |
Employment Status by Age in Cave City
According to the labor force statistics for Cave City, out of the total population over 16 years of age (1,505), 50.6% or 762 individuals are in the labor force, with 4.3% or 33 of them unemployed. The age group with the highest labor force participation rate is 30 to 34 years, with 88.7% or 110 individuals in the labor force. Within the labor force, the 16 to 19 years age range has the highest percentage of unemployed individuals, with 30.3% or 10 of them being unemployed.
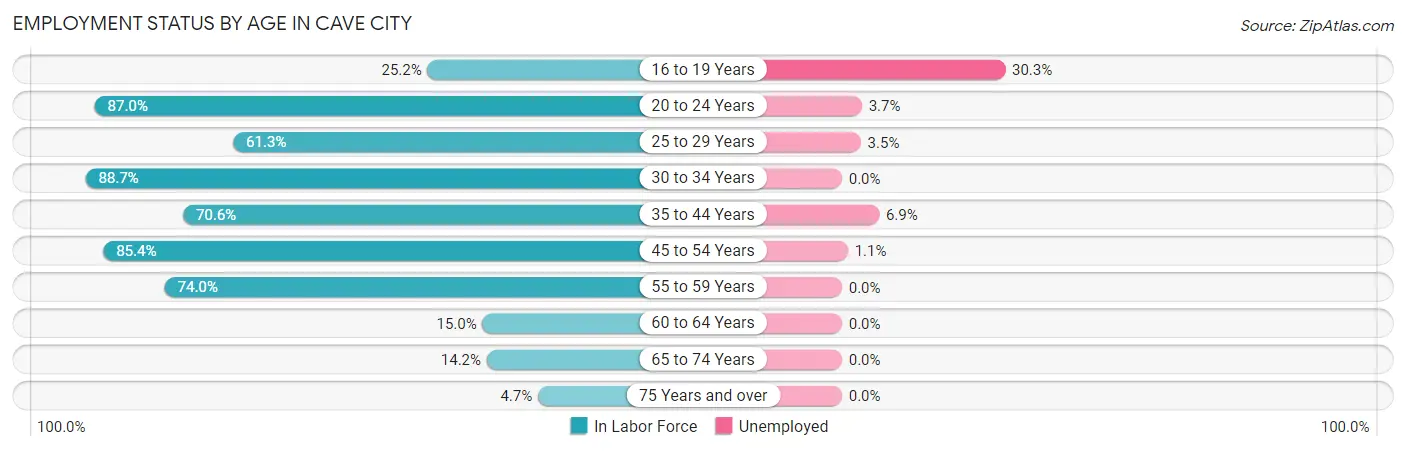
| Age Bracket | In Labor Force | Unemployed |
| 16 to 19 Years | 33 (25.2%) | 10 (30.3%) |
| 20 to 24 Years | 107 (87.0%) | 4 (3.7%) |
| 25 to 29 Years | 57 (61.3%) | 2 (3.5%) |
| 30 to 34 Years | 110 (88.7%) | 0 (0.0%) |
| 35 to 44 Years | 233 (70.6%) | 16 (6.9%) |
| 45 to 54 Years | 88 (85.4%) | 1 (1.1%) |
| 55 to 59 Years | 74 (74.0%) | 0 (0.0%) |
| 60 to 64 Years | 24 (15.0%) | 0 (0.0%) |
| 65 to 74 Years | 30 (14.2%) | 0 (0.0%) |
| 75 Years and over | 6 (4.7%) | 0 (0.0%) |
| Total | 762 (50.6%) | 33 (4.3%) |
Employment Status by Educational Attainment in Cave City
According to labor force statistics for Cave City, 64.4% of individuals (586) out of the total population between 25 and 64 years of age (910) are in the labor force, with 3.2% or 19 of them being unemployed. The group with the highest labor force participation rate are those with the educational attainment of bachelor's degree or higher, with 87.7% or 57 individuals in the labor force. Within the labor force, individuals with less than high school education have the highest percentage of unemployment, with 8.5% or 8 of them being unemployed.
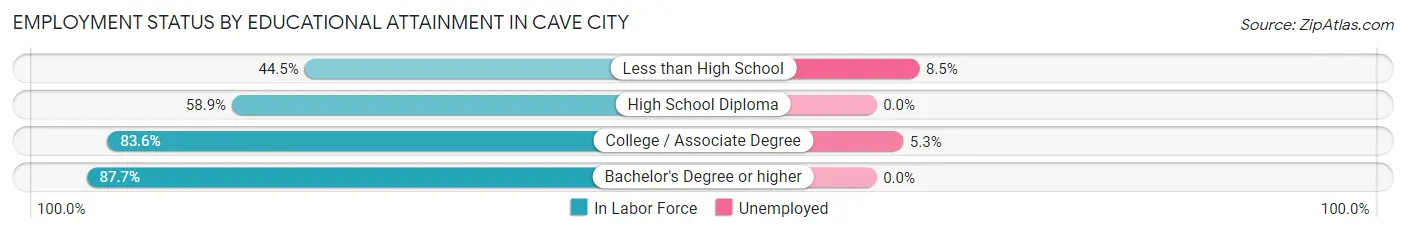
| Educational Attainment | In Labor Force | Unemployed |
| Less than High School | 94 (44.5%) | 18 (8.5%) |
| High School Diploma | 226 (58.9%) | 0 (0.0%) |
| College / Associate Degree | 209 (83.6%) | 13 (5.3%) |
| Bachelor's Degree or higher | 57 (87.7%) | 0 (0.0%) |
| Total | 586 (64.4%) | 29 (3.2%) |
Employment Occupations by Sex in Cave City
Management, Business, Science and Arts Occupations
The most common Management, Business, Science and Arts occupations in Cave City are Community & Social Service (53 | 7.3%), Education Instruction & Library (53 | 7.3%), Management (52 | 7.1%), Health Diagnosing & Treating (31 | 4.3%), and Health Technologists (24 | 3.3%).
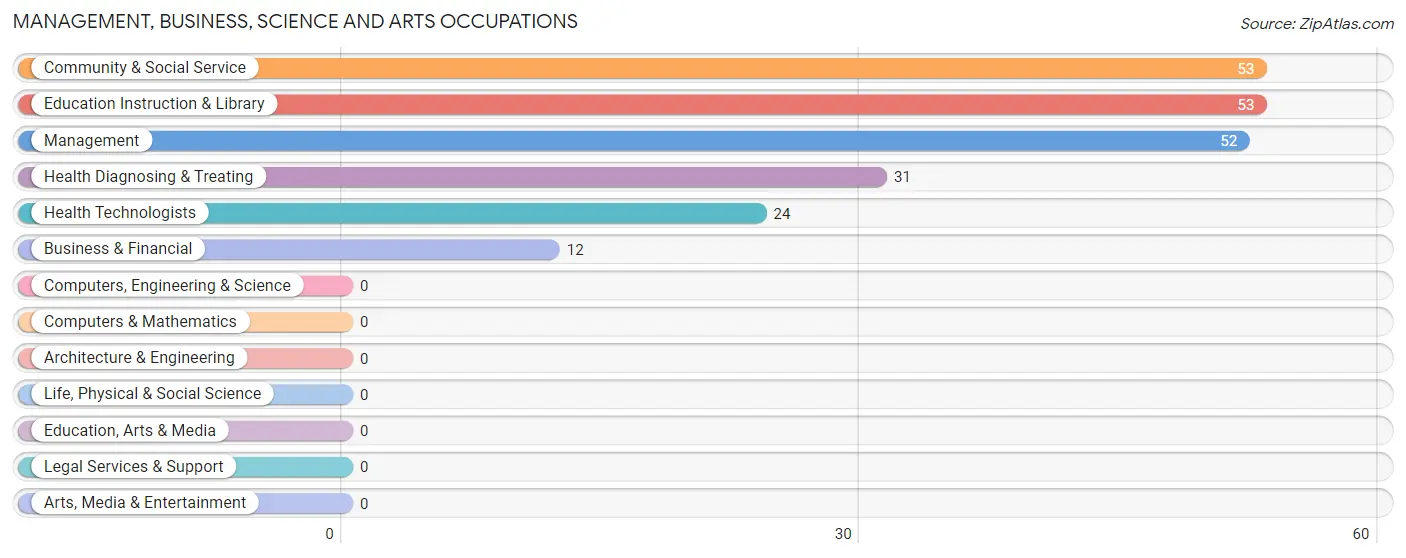
Management, Business, Science and Arts Occupations by Sex
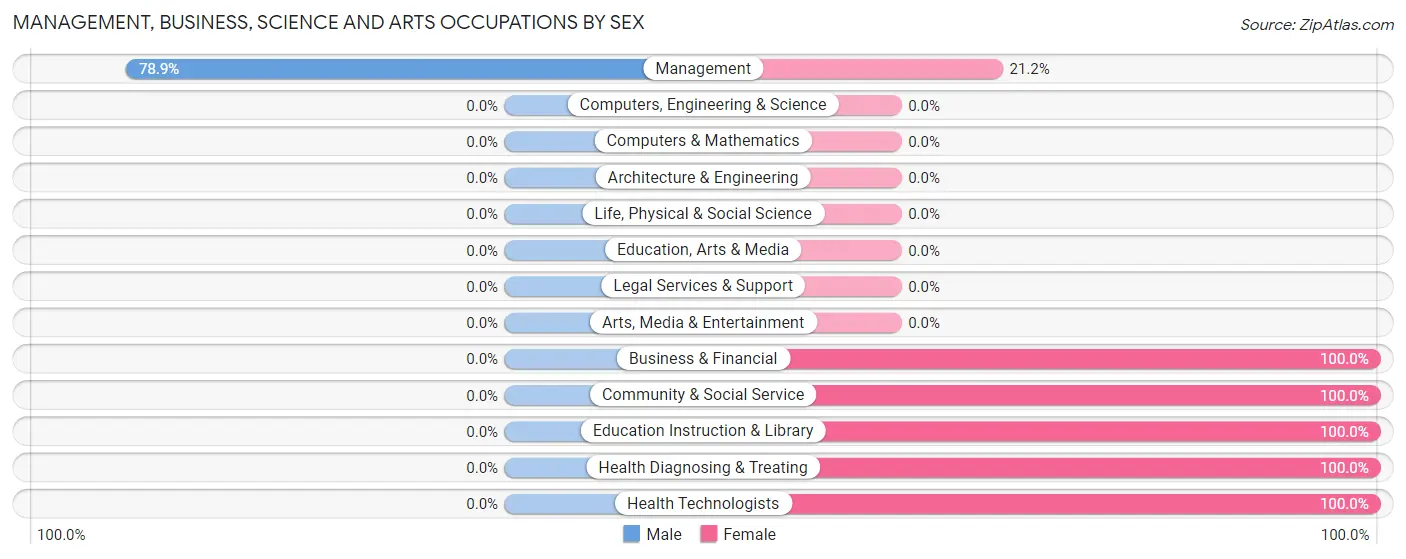
| Occupation | Male | Female |
| Management | 41 (78.8%) | 11 (21.1%) |
| Business & Financial | 0 (0.0%) | 12 (100.0%) |
| Computers, Engineering & Science | 0 (0.0%) | 0 (0.0%) |
| Computers & Mathematics | 0 (0.0%) | 0 (0.0%) |
| Architecture & Engineering | 0 (0.0%) | 0 (0.0%) |
| Life, Physical & Social Science | 0 (0.0%) | 0 (0.0%) |
| Community & Social Service | 0 (0.0%) | 53 (100.0%) |
| Education, Arts & Media | 0 (0.0%) | 0 (0.0%) |
| Legal Services & Support | 0 (0.0%) | 0 (0.0%) |
| Education Instruction & Library | 0 (0.0%) | 53 (100.0%) |
| Arts, Media & Entertainment | 0 (0.0%) | 0 (0.0%) |
| Health Diagnosing & Treating | 0 (0.0%) | 31 (100.0%) |
| Health Technologists | 0 (0.0%) | 24 (100.0%) |
| Total (Category) | 41 (27.7%) | 107 (72.3%) |
| Total (Overall) | 346 (47.5%) | 383 (52.5%) |
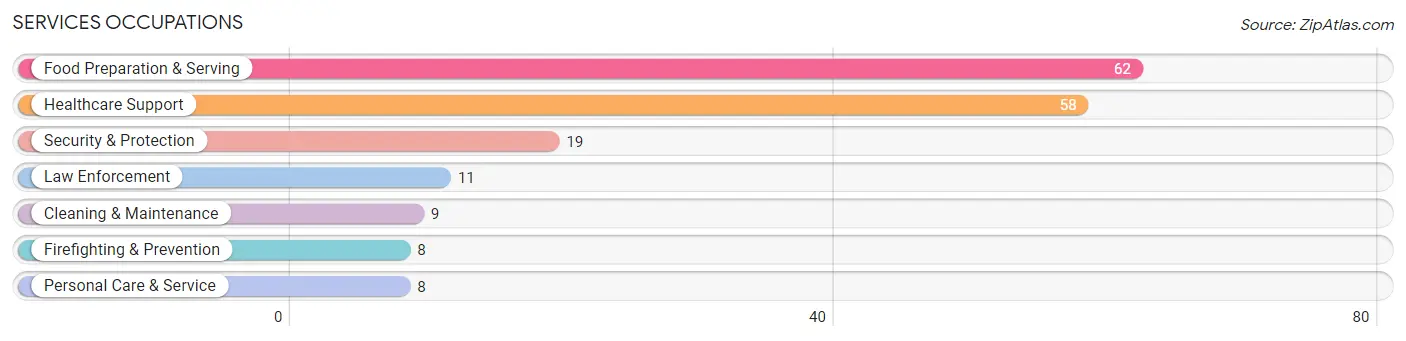
Services Occupations
The most common Services occupations in Cave City are Food Preparation & Serving (62 | 8.5%), Healthcare Support (58 | 8.0%), Security & Protection (19 | 2.6%), Law Enforcement (11 | 1.5%), and Cleaning & Maintenance (9 | 1.2%).
Services Occupations by Sex
Within the Services occupations in Cave City, the most male-oriented occupations are Law Enforcement (100.0%), Security & Protection (78.9%), and Cleaning & Maintenance (77.8%), while the most female-oriented occupations are Personal Care & Service (100.0%), Healthcare Support (94.8%), and Food Preparation & Serving (77.4%).
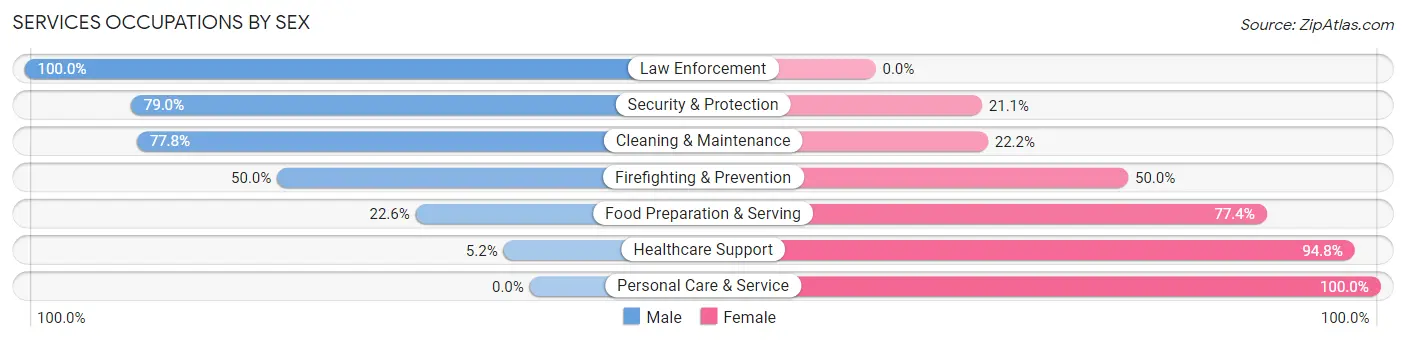
| Occupation | Male | Female |
| Healthcare Support | 3 (5.2%) | 55 (94.8%) |
| Security & Protection | 15 (78.9%) | 4 (21.0%) |
| Firefighting & Prevention | 4 (50.0%) | 4 (50.0%) |
| Law Enforcement | 11 (100.0%) | 0 (0.0%) |
| Food Preparation & Serving | 14 (22.6%) | 48 (77.4%) |
| Cleaning & Maintenance | 7 (77.8%) | 2 (22.2%) |
| Personal Care & Service | 0 (0.0%) | 8 (100.0%) |
| Total (Category) | 39 (25.0%) | 117 (75.0%) |
| Total (Overall) | 346 (47.5%) | 383 (52.5%) |
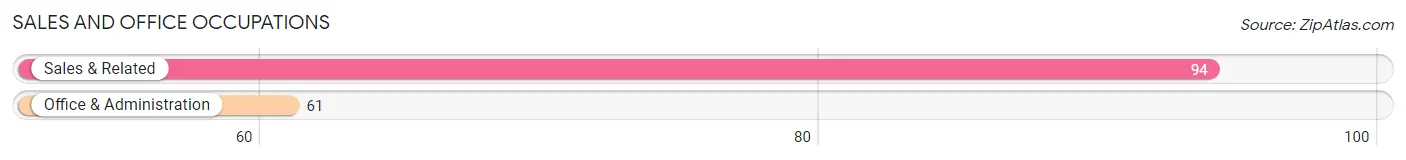
Sales and Office Occupations
The most common Sales and Office occupations in Cave City are Sales & Related (94 | 12.9%), and Office & Administration (61 | 8.4%).
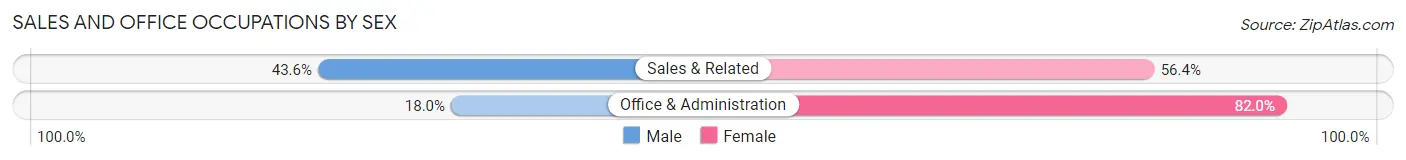
Sales and Office Occupations by Sex
| Occupation | Male | Female |
| Sales & Related | 41 (43.6%) | 53 (56.4%) |
| Office & Administration | 11 (18.0%) | 50 (82.0%) |
| Total (Category) | 52 (33.6%) | 103 (66.4%) |
| Total (Overall) | 346 (47.5%) | 383 (52.5%) |
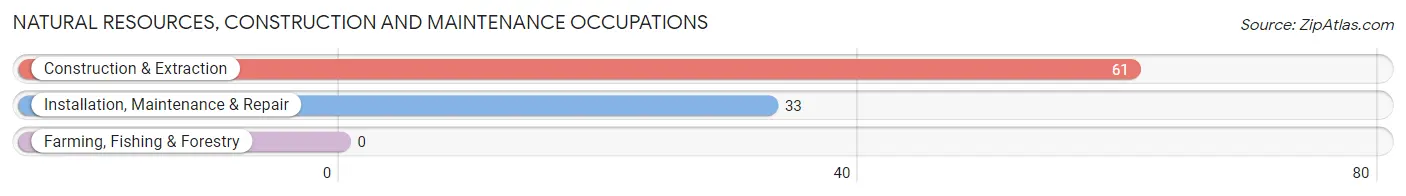
Natural Resources, Construction and Maintenance Occupations
The most common Natural Resources, Construction and Maintenance occupations in Cave City are Construction & Extraction (61 | 8.4%), and Installation, Maintenance & Repair (33 | 4.5%).
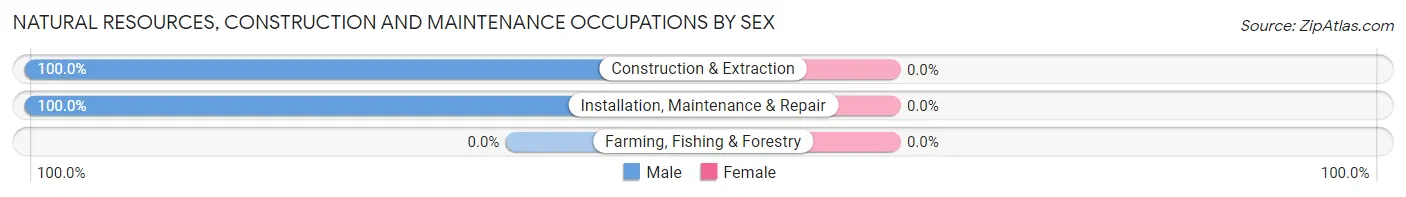
Natural Resources, Construction and Maintenance Occupations by Sex
| Occupation | Male | Female |
| Farming, Fishing & Forestry | 0 (0.0%) | 0 (0.0%) |
| Construction & Extraction | 61 (100.0%) | 0 (0.0%) |
| Installation, Maintenance & Repair | 33 (100.0%) | 0 (0.0%) |
| Total (Category) | 94 (100.0%) | 0 (0.0%) |
| Total (Overall) | 346 (47.5%) | 383 (52.5%) |
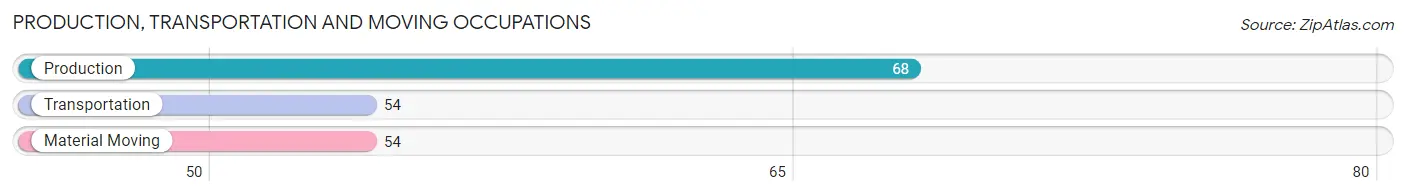
Production, Transportation and Moving Occupations
The most common Production, Transportation and Moving occupations in Cave City are Production (68 | 9.3%), Transportation (54 | 7.4%), and Material Moving (54 | 7.4%).
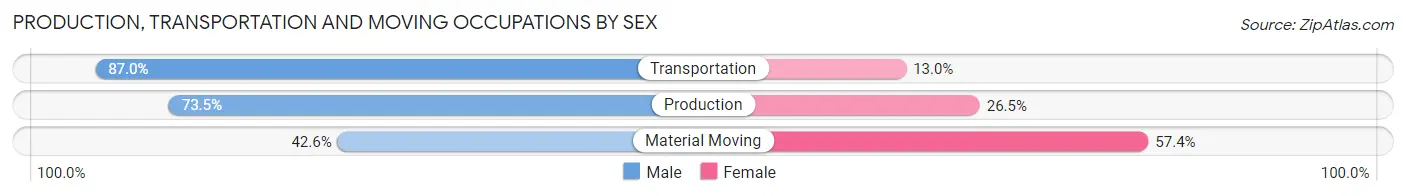
Production, Transportation and Moving Occupations by Sex
| Occupation | Male | Female |
| Production | 50 (73.5%) | 18 (26.5%) |
| Transportation | 47 (87.0%) | 7 (13.0%) |
| Material Moving | 23 (42.6%) | 31 (57.4%) |
| Total (Category) | 120 (68.2%) | 56 (31.8%) |
| Total (Overall) | 346 (47.5%) | 383 (52.5%) |
Employment Industries by Sex in Cave City
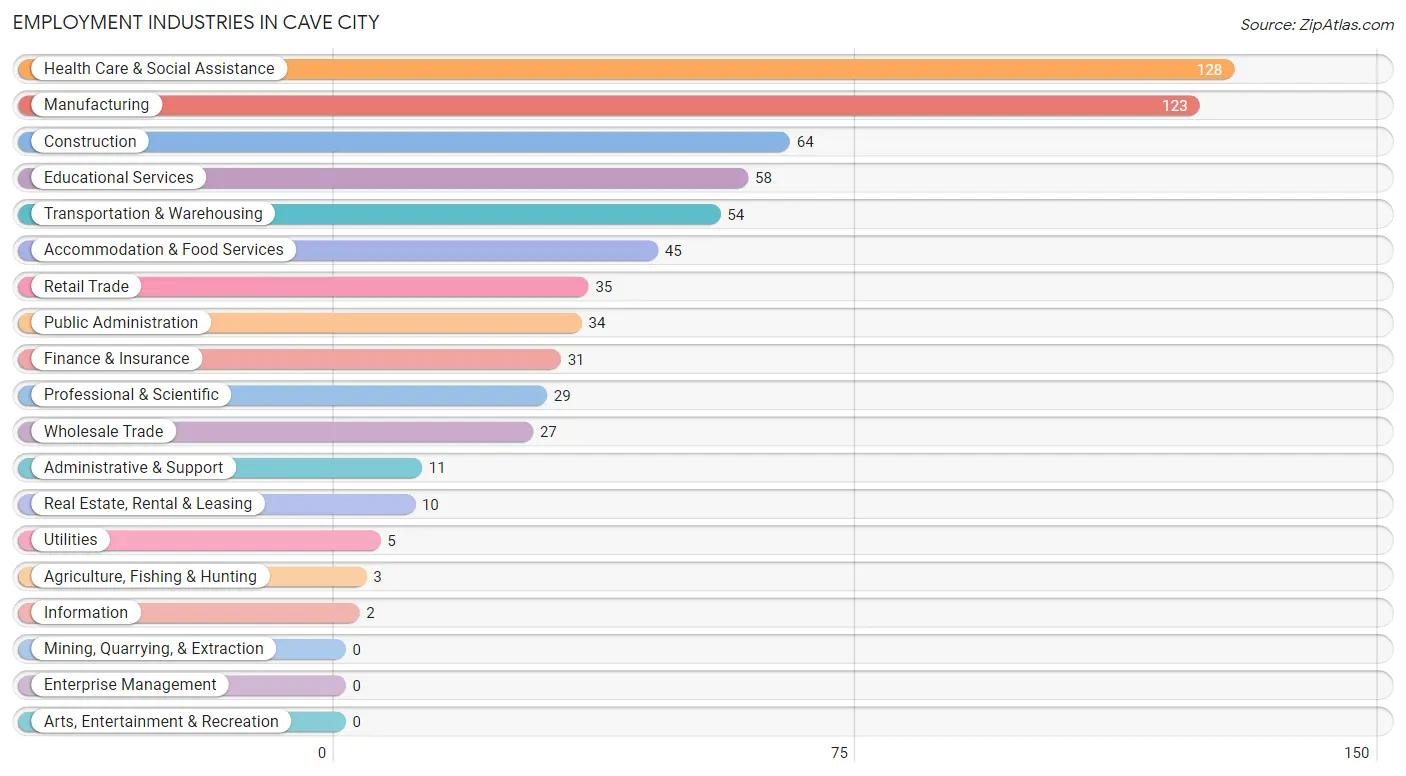
Employment Industries in Cave City
The major employment industries in Cave City include Health Care & Social Assistance (128 | 17.6%), Manufacturing (123 | 16.9%), Construction (64 | 8.8%), Educational Services (58 | 8.0%), and Transportation & Warehousing (54 | 7.4%).
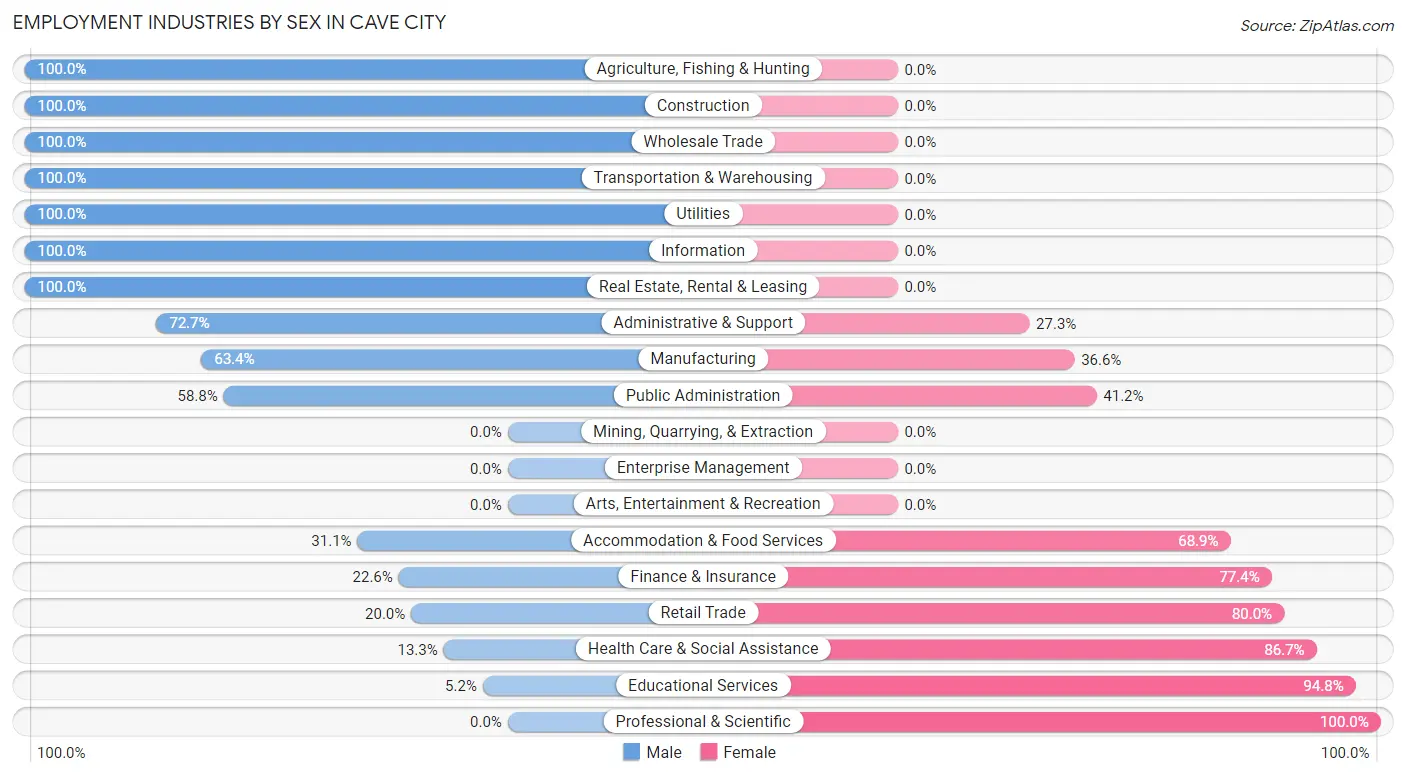
Employment Industries by Sex in Cave City
The Cave City industries that see more men than women are Agriculture, Fishing & Hunting (100.0%), Construction (100.0%), and Wholesale Trade (100.0%), whereas the industries that tend to have a higher number of women are Professional & Scientific (100.0%), Educational Services (94.8%), and Health Care & Social Assistance (86.7%).
| Industry | Male | Female |
| Agriculture, Fishing & Hunting | 3 (100.0%) | 0 (0.0%) |
| Mining, Quarrying, & Extraction | 0 (0.0%) | 0 (0.0%) |
| Construction | 64 (100.0%) | 0 (0.0%) |
| Manufacturing | 78 (63.4%) | 45 (36.6%) |
| Wholesale Trade | 27 (100.0%) | 0 (0.0%) |
| Retail Trade | 7 (20.0%) | 28 (80.0%) |
| Transportation & Warehousing | 54 (100.0%) | 0 (0.0%) |
| Utilities | 5 (100.0%) | 0 (0.0%) |
| Information | 2 (100.0%) | 0 (0.0%) |
| Finance & Insurance | 7 (22.6%) | 24 (77.4%) |
| Real Estate, Rental & Leasing | 10 (100.0%) | 0 (0.0%) |
| Professional & Scientific | 0 (0.0%) | 29 (100.0%) |
| Enterprise Management | 0 (0.0%) | 0 (0.0%) |
| Administrative & Support | 8 (72.7%) | 3 (27.3%) |
| Educational Services | 3 (5.2%) | 55 (94.8%) |
| Health Care & Social Assistance | 17 (13.3%) | 111 (86.7%) |
| Arts, Entertainment & Recreation | 0 (0.0%) | 0 (0.0%) |
| Accommodation & Food Services | 14 (31.1%) | 31 (68.9%) |
| Public Administration | 20 (58.8%) | 14 (41.2%) |
| Total | 346 (47.5%) | 383 (52.5%) |
Education in Cave City
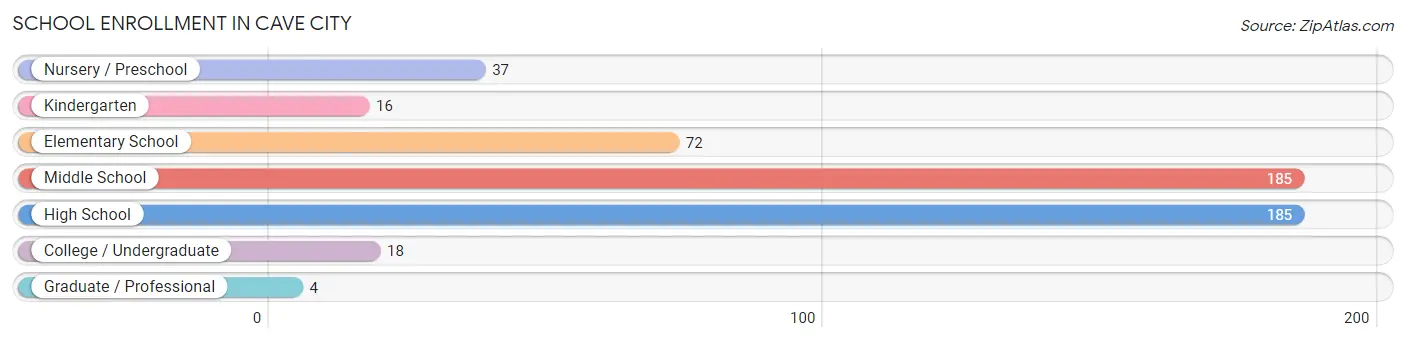
School Enrollment in Cave City
The most common levels of schooling among the 517 students in Cave City are middle school (185 | 35.8%), high school (185 | 35.8%), and elementary school (72 | 13.9%).
| School Level | # Students | % Students |
| Nursery / Preschool | 37 | 7.2% |
| Kindergarten | 16 | 3.1% |
| Elementary School | 72 | 13.9% |
| Middle School | 185 | 35.8% |
| High School | 185 | 35.8% |
| College / Undergraduate | 18 | 3.5% |
| Graduate / Professional | 4 | 0.8% |
| Total | 517 | 100.0% |
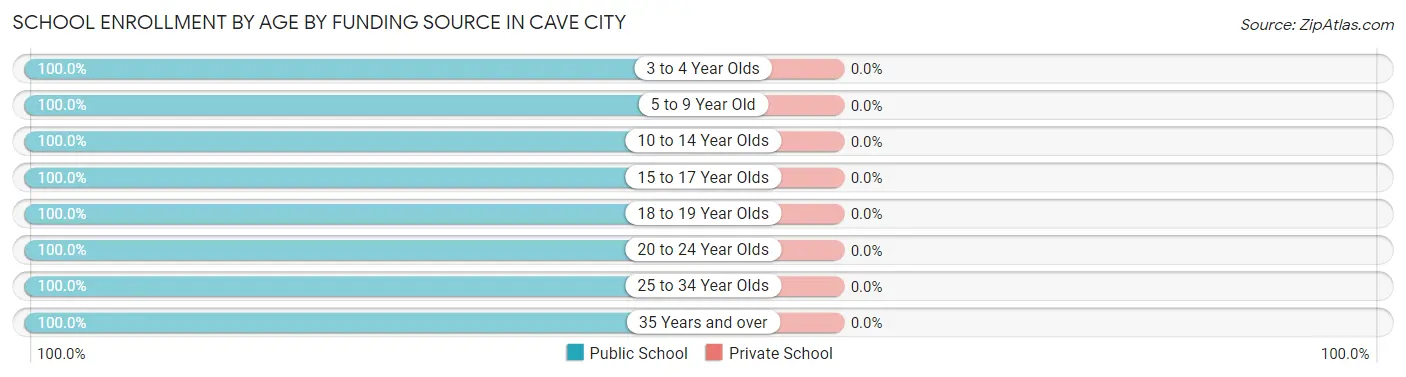
School Enrollment by Age by Funding Source in Cave City
| Age Bracket | Public School | Private School |
| 3 to 4 Year Olds | 32 (100.0%) | 0 (0.0%) |
| 5 to 9 Year Old | 69 (100.0%) | 0 (0.0%) |
| 10 to 14 Year Olds | 262 (100.0%) | 0 (0.0%) |
| 15 to 17 Year Olds | 118 (100.0%) | 0 (0.0%) |
| 18 to 19 Year Olds | 14 (100.0%) | 0 (0.0%) |
| 20 to 24 Year Olds | 5 (100.0%) | 0 (0.0%) |
| 25 to 34 Year Olds | 6 (100.0%) | 0 (0.0%) |
| 35 Years and over | 11 (100.0%) | 0 (0.0%) |
| Total | 517 (100.0%) | 0 (0.0%) |
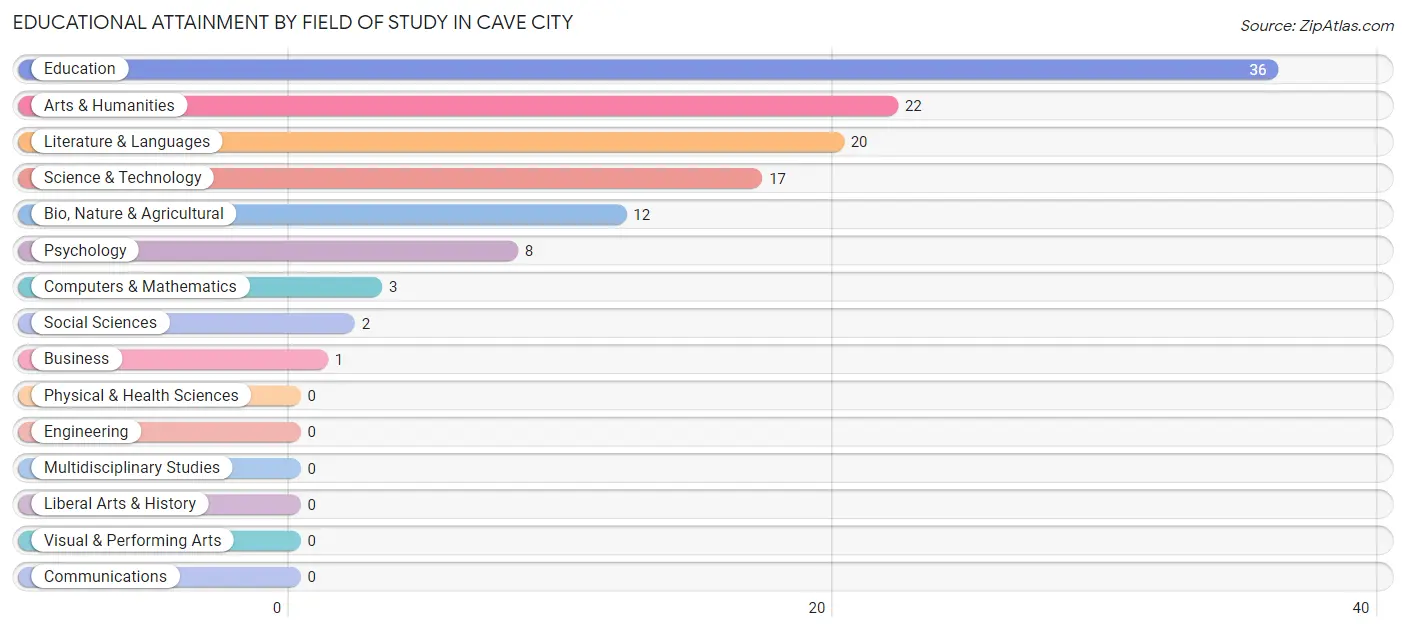
Educational Attainment by Field of Study in Cave City
Education (36 | 29.7%), arts & humanities (22 | 18.2%), literature & languages (20 | 16.5%), science & technology (17 | 14.1%), and bio, nature & agricultural (12 | 9.9%) are the most common fields of study among 121 individuals in Cave City who have obtained a bachelor's degree or higher.
| Field of Study | # Graduates | % Graduates |
| Computers & Mathematics | 3 | 2.5% |
| Bio, Nature & Agricultural | 12 | 9.9% |
| Physical & Health Sciences | 0 | 0.0% |
| Psychology | 8 | 6.6% |
| Social Sciences | 2 | 1.7% |
| Engineering | 0 | 0.0% |
| Multidisciplinary Studies | 0 | 0.0% |
| Science & Technology | 17 | 14.1% |
| Business | 1 | 0.8% |
| Education | 36 | 29.7% |
| Literature & Languages | 20 | 16.5% |
| Liberal Arts & History | 0 | 0.0% |
| Visual & Performing Arts | 0 | 0.0% |
| Communications | 0 | 0.0% |
| Arts & Humanities | 22 | 18.2% |
| Total | 121 | 100.0% |
Transportation & Commute in Cave City
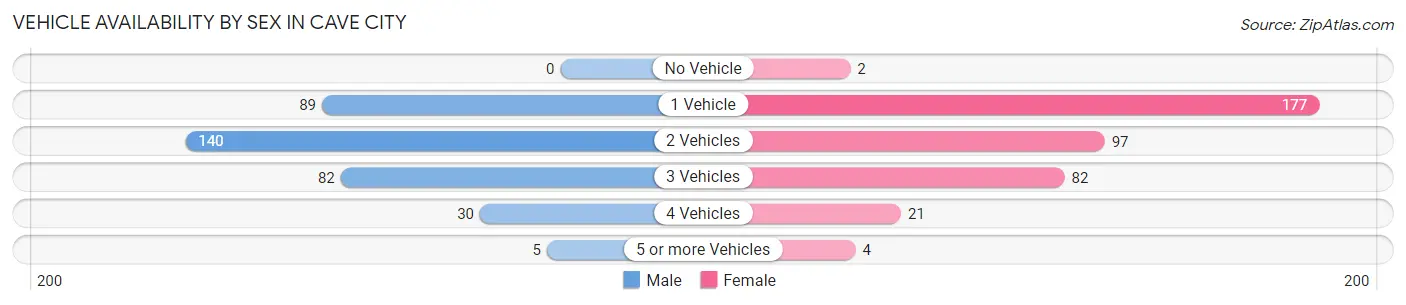
Vehicle Availability by Sex in Cave City
The most prevalent vehicle ownership categories in Cave City are males with 2 vehicles (140, accounting for 40.5%) and females with 2 vehicles (97, making up 36.5%).
| Vehicles Available | Male | Female |
| No Vehicle | 0 (0.0%) | 2 (0.5%) |
| 1 Vehicle | 89 (25.7%) | 177 (46.2%) |
| 2 Vehicles | 140 (40.5%) | 97 (25.3%) |
| 3 Vehicles | 82 (23.7%) | 82 (21.4%) |
| 4 Vehicles | 30 (8.7%) | 21 (5.5%) |
| 5 or more Vehicles | 5 (1.5%) | 4 (1.0%) |
| Total | 346 (100.0%) | 383 (100.0%) |
Commute Time in Cave City
The most frequently occuring commute durations in Cave City are 20 to 24 minutes (183 commuters, 25.5%), 15 to 19 minutes (119 commuters, 16.6%), and 30 to 34 minutes (111 commuters, 15.5%).
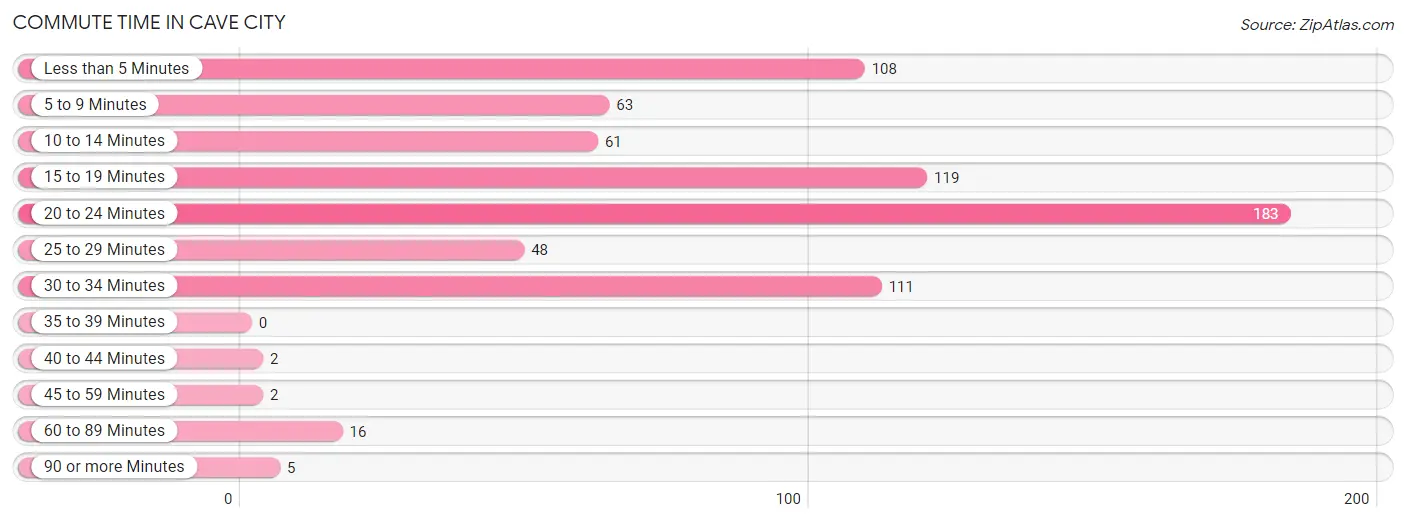
| Commute Time | # Commuters | % Commuters |
| Less than 5 Minutes | 108 | 15.0% |
| 5 to 9 Minutes | 63 | 8.8% |
| 10 to 14 Minutes | 61 | 8.5% |
| 15 to 19 Minutes | 119 | 16.6% |
| 20 to 24 Minutes | 183 | 25.5% |
| 25 to 29 Minutes | 48 | 6.7% |
| 30 to 34 Minutes | 111 | 15.5% |
| 35 to 39 Minutes | 0 | 0.0% |
| 40 to 44 Minutes | 2 | 0.3% |
| 45 to 59 Minutes | 2 | 0.3% |
| 60 to 89 Minutes | 16 | 2.2% |
| 90 or more Minutes | 5 | 0.7% |
Commute Time by Sex in Cave City
The most common commute times in Cave City are 20 to 24 minutes (62 commuters, 18.1%) for males and 20 to 24 minutes (121 commuters, 32.3%) for females.
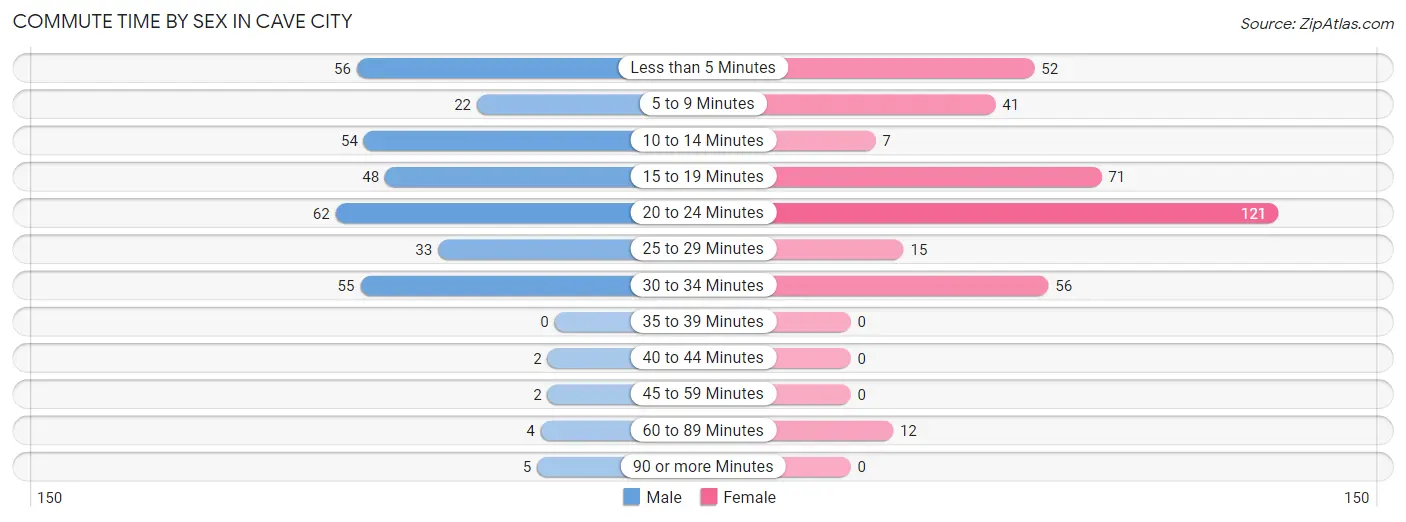
| Commute Time | Male | Female |
| Less than 5 Minutes | 56 (16.3%) | 52 (13.9%) |
| 5 to 9 Minutes | 22 (6.4%) | 41 (10.9%) |
| 10 to 14 Minutes | 54 (15.7%) | 7 (1.9%) |
| 15 to 19 Minutes | 48 (14.0%) | 71 (18.9%) |
| 20 to 24 Minutes | 62 (18.1%) | 121 (32.3%) |
| 25 to 29 Minutes | 33 (9.6%) | 15 (4.0%) |
| 30 to 34 Minutes | 55 (16.0%) | 56 (14.9%) |
| 35 to 39 Minutes | 0 (0.0%) | 0 (0.0%) |
| 40 to 44 Minutes | 2 (0.6%) | 0 (0.0%) |
| 45 to 59 Minutes | 2 (0.6%) | 0 (0.0%) |
| 60 to 89 Minutes | 4 (1.2%) | 12 (3.2%) |
| 90 or more Minutes | 5 (1.5%) | 0 (0.0%) |
Time of Departure to Work by Sex in Cave City
The most frequent times of departure to work in Cave City are 6:00 AM to 6:29 AM (71, 20.7%) for males and 7:30 AM to 7:59 AM (102, 27.2%) for females.
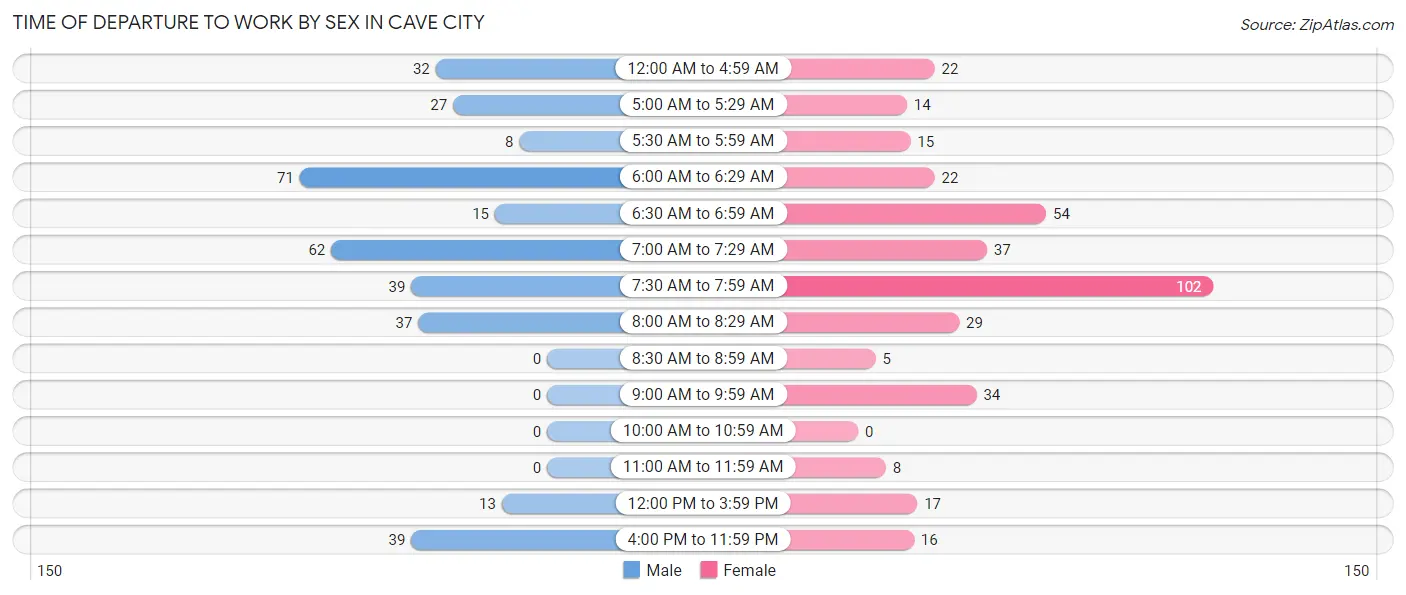
| Time of Departure | Male | Female |
| 12:00 AM to 4:59 AM | 32 (9.3%) | 22 (5.9%) |
| 5:00 AM to 5:29 AM | 27 (7.9%) | 14 (3.7%) |
| 5:30 AM to 5:59 AM | 8 (2.3%) | 15 (4.0%) |
| 6:00 AM to 6:29 AM | 71 (20.7%) | 22 (5.9%) |
| 6:30 AM to 6:59 AM | 15 (4.4%) | 54 (14.4%) |
| 7:00 AM to 7:29 AM | 62 (18.1%) | 37 (9.9%) |
| 7:30 AM to 7:59 AM | 39 (11.4%) | 102 (27.2%) |
| 8:00 AM to 8:29 AM | 37 (10.8%) | 29 (7.7%) |
| 8:30 AM to 8:59 AM | 0 (0.0%) | 5 (1.3%) |
| 9:00 AM to 9:59 AM | 0 (0.0%) | 34 (9.1%) |
| 10:00 AM to 10:59 AM | 0 (0.0%) | 0 (0.0%) |
| 11:00 AM to 11:59 AM | 0 (0.0%) | 8 (2.1%) |
| 12:00 PM to 3:59 PM | 13 (3.8%) | 17 (4.5%) |
| 4:00 PM to 11:59 PM | 39 (11.4%) | 16 (4.3%) |
| Total | 343 (100.0%) | 375 (100.0%) |
Housing Occupancy in Cave City
Occupancy by Ownership in Cave City
Of the total 790 dwellings in Cave City, owner-occupied units account for 412 (52.1%), while renter-occupied units make up 378 (47.8%).
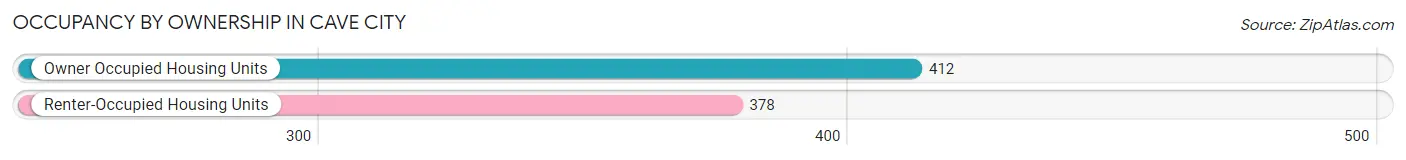
| Occupancy | # Housing Units | % Housing Units |
| Owner Occupied Housing Units | 412 | 52.1% |
| Renter-Occupied Housing Units | 378 | 47.8% |
| Total Occupied Housing Units | 790 | 100.0% |
Occupancy by Household Size in Cave City
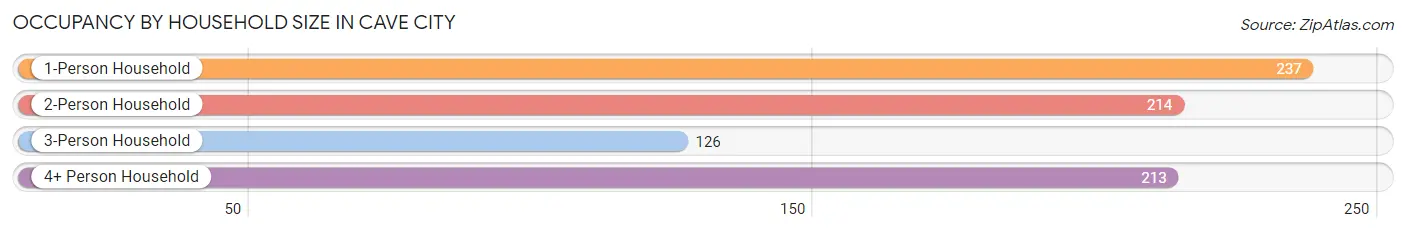
| Household Size | # Housing Units | % Housing Units |
| 1-Person Household | 237 | 30.0% |
| 2-Person Household | 214 | 27.1% |
| 3-Person Household | 126 | 16.0% |
| 4+ Person Household | 213 | 27.0% |
| Total Housing Units | 790 | 100.0% |
Occupancy by Ownership by Household Size in Cave City
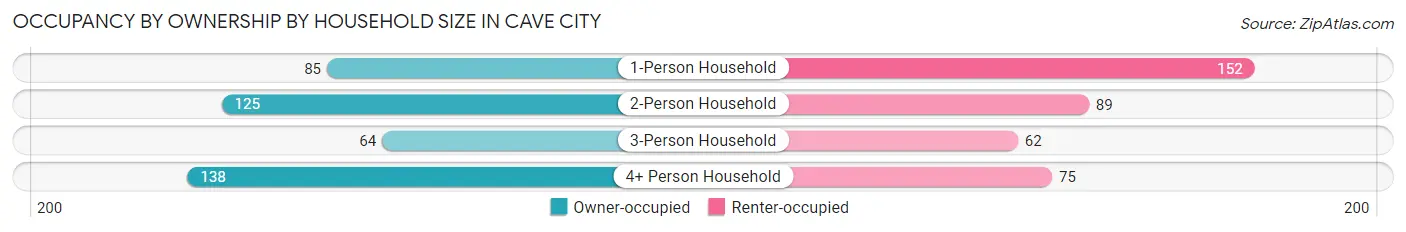
| Household Size | Owner-occupied | Renter-occupied |
| 1-Person Household | 85 (35.9%) | 152 (64.1%) |
| 2-Person Household | 125 (58.4%) | 89 (41.6%) |
| 3-Person Household | 64 (50.8%) | 62 (49.2%) |
| 4+ Person Household | 138 (64.8%) | 75 (35.2%) |
| Total Housing Units | 412 (52.1%) | 378 (47.8%) |
Occupancy by Educational Attainment in Cave City
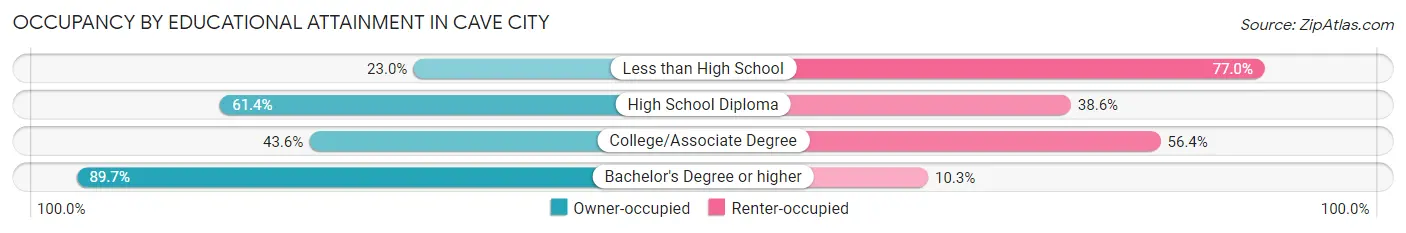
| Household Size | Owner-occupied | Renter-occupied |
| Less than High School | 31 (23.0%) | 104 (77.0%) |
| High School Diploma | 221 (61.4%) | 139 (38.6%) |
| College/Associate Degree | 99 (43.6%) | 128 (56.4%) |
| Bachelor's Degree or higher | 61 (89.7%) | 7 (10.3%) |
Occupancy by Age of Householder in Cave City
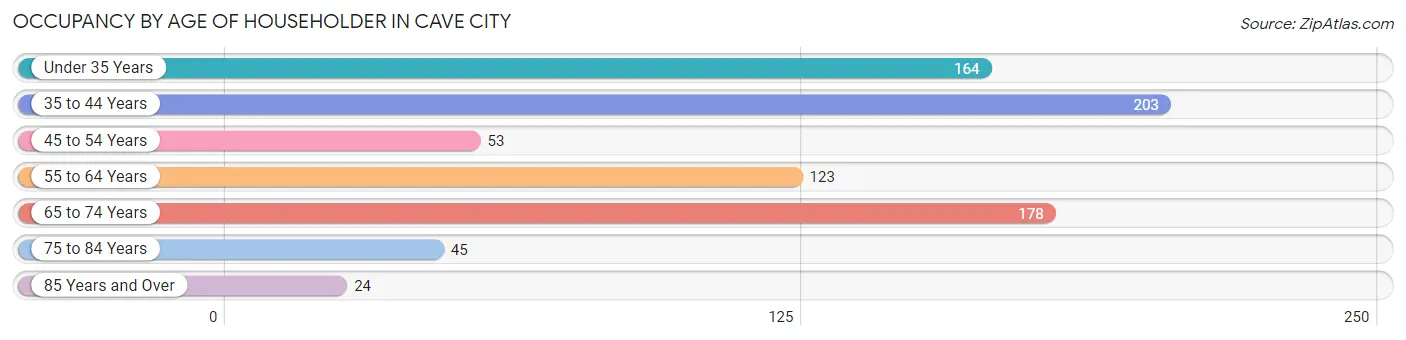
| Age Bracket | # Households | % Households |
| Under 35 Years | 164 | 20.8% |
| 35 to 44 Years | 203 | 25.7% |
| 45 to 54 Years | 53 | 6.7% |
| 55 to 64 Years | 123 | 15.6% |
| 65 to 74 Years | 178 | 22.5% |
| 75 to 84 Years | 45 | 5.7% |
| 85 Years and Over | 24 | 3.0% |
| Total | 790 | 100.0% |
Housing Finances in Cave City
Median Income by Occupancy in Cave City
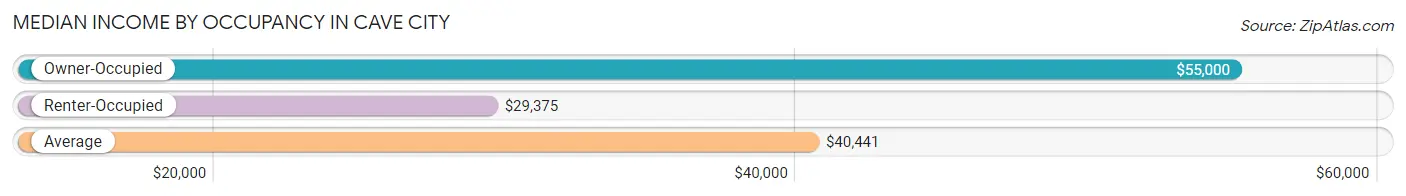
| Occupancy Type | # Households | Median Income |
| Owner-Occupied | 412 (52.1%) | $55,000 |
| Renter-Occupied | 378 (47.8%) | $29,375 |
| Average | 790 (100.0%) | $40,441 |
Occupancy by Householder Income Bracket in Cave City
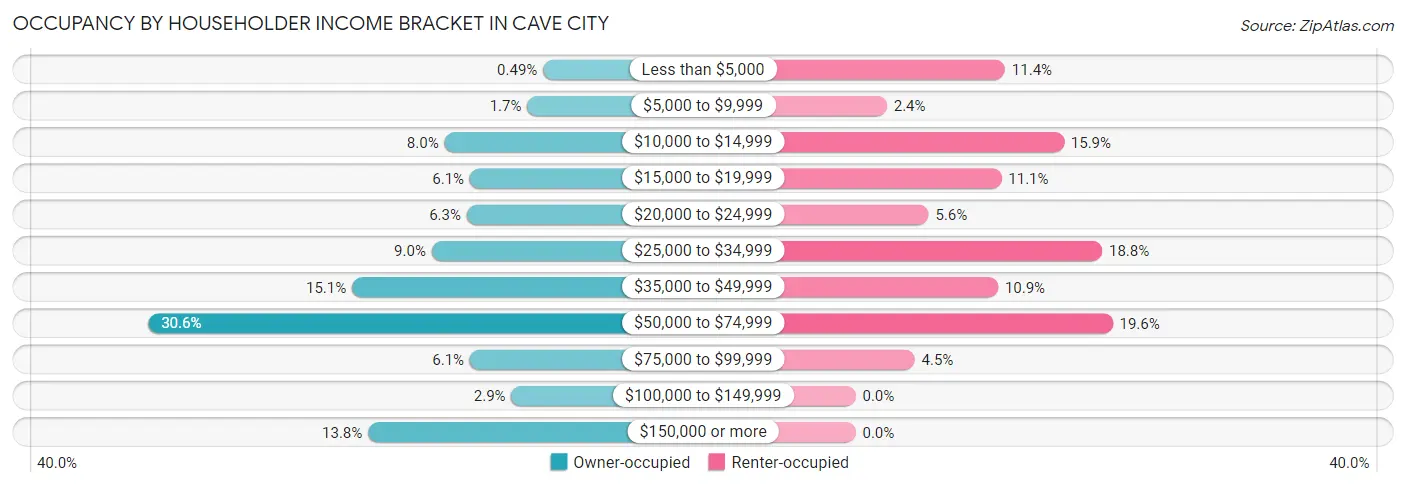
| Income Bracket | Owner-occupied | Renter-occupied |
| Less than $5,000 | 2 (0.5%) | 43 (11.4%) |
| $5,000 to $9,999 | 7 (1.7%) | 9 (2.4%) |
| $10,000 to $14,999 | 33 (8.0%) | 60 (15.9%) |
| $15,000 to $19,999 | 25 (6.1%) | 42 (11.1%) |
| $20,000 to $24,999 | 26 (6.3%) | 21 (5.6%) |
| $25,000 to $34,999 | 37 (9.0%) | 71 (18.8%) |
| $35,000 to $49,999 | 62 (15.0%) | 41 (10.8%) |
| $50,000 to $74,999 | 126 (30.6%) | 74 (19.6%) |
| $75,000 to $99,999 | 25 (6.1%) | 17 (4.5%) |
| $100,000 to $149,999 | 12 (2.9%) | 0 (0.0%) |
| $150,000 or more | 57 (13.8%) | 0 (0.0%) |
| Total | 412 (100.0%) | 378 (100.0%) |
Monthly Housing Cost Tiers in Cave City
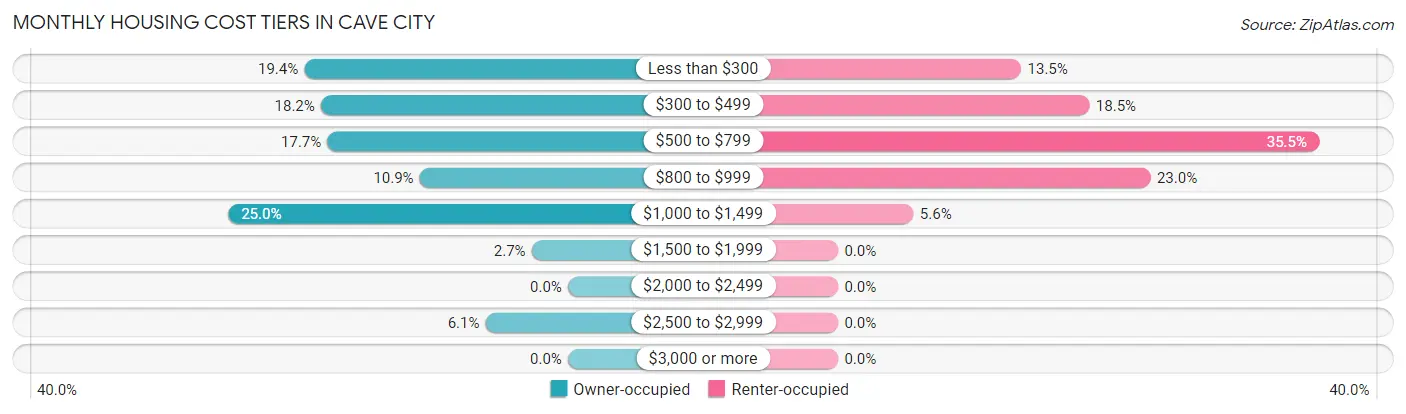
| Monthly Cost | Owner-occupied | Renter-occupied |
| Less than $300 | 80 (19.4%) | 51 (13.5%) |
| $300 to $499 | 75 (18.2%) | 70 (18.5%) |
| $500 to $799 | 73 (17.7%) | 134 (35.4%) |
| $800 to $999 | 45 (10.9%) | 87 (23.0%) |
| $1,000 to $1,499 | 103 (25.0%) | 21 (5.6%) |
| $1,500 to $1,999 | 11 (2.7%) | 0 (0.0%) |
| $2,000 to $2,499 | 0 (0.0%) | 0 (0.0%) |
| $2,500 to $2,999 | 25 (6.1%) | 0 (0.0%) |
| $3,000 or more | 0 (0.0%) | 0 (0.0%) |
| Total | 412 (100.0%) | 378 (100.0%) |
Physical Housing Characteristics in Cave City
Housing Structures in Cave City
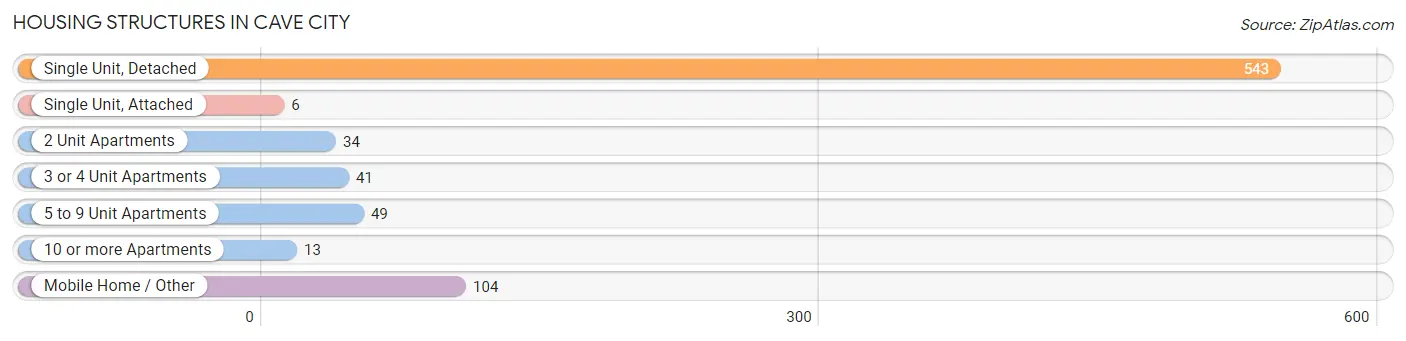
| Structure Type | # Housing Units | % Housing Units |
| Single Unit, Detached | 543 | 68.7% |
| Single Unit, Attached | 6 | 0.8% |
| 2 Unit Apartments | 34 | 4.3% |
| 3 or 4 Unit Apartments | 41 | 5.2% |
| 5 to 9 Unit Apartments | 49 | 6.2% |
| 10 or more Apartments | 13 | 1.7% |
| Mobile Home / Other | 104 | 13.2% |
| Total | 790 | 100.0% |
Housing Structures by Occupancy in Cave City
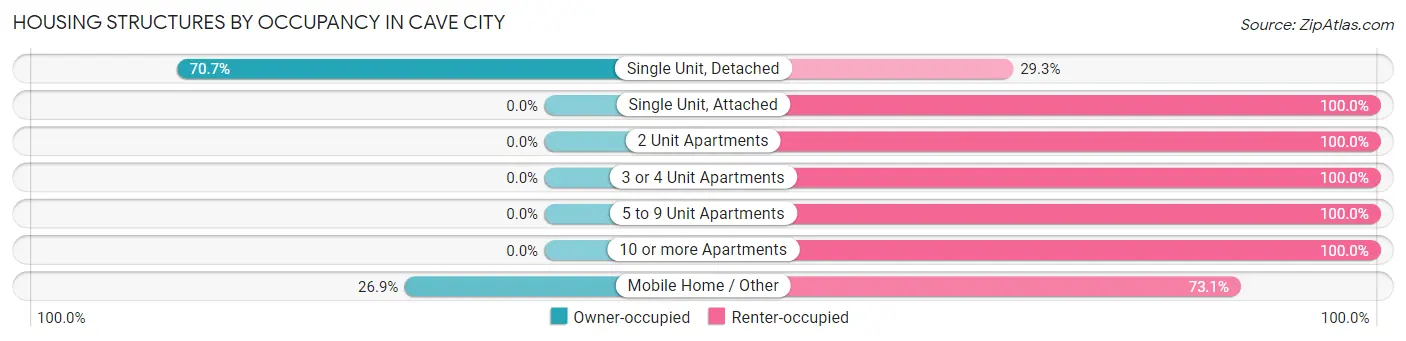
| Structure Type | Owner-occupied | Renter-occupied |
| Single Unit, Detached | 384 (70.7%) | 159 (29.3%) |
| Single Unit, Attached | 0 (0.0%) | 6 (100.0%) |
| 2 Unit Apartments | 0 (0.0%) | 34 (100.0%) |
| 3 or 4 Unit Apartments | 0 (0.0%) | 41 (100.0%) |
| 5 to 9 Unit Apartments | 0 (0.0%) | 49 (100.0%) |
| 10 or more Apartments | 0 (0.0%) | 13 (100.0%) |
| Mobile Home / Other | 28 (26.9%) | 76 (73.1%) |
| Total | 412 (52.1%) | 378 (47.8%) |
Housing Structures by Number of Rooms in Cave City
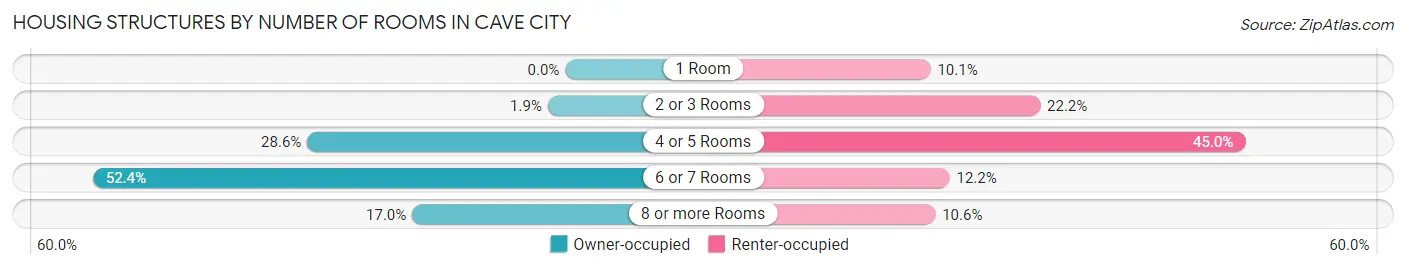
| Number of Rooms | Owner-occupied | Renter-occupied |
| 1 Room | 0 (0.0%) | 38 (10.1%) |
| 2 or 3 Rooms | 8 (1.9%) | 84 (22.2%) |
| 4 or 5 Rooms | 118 (28.6%) | 170 (45.0%) |
| 6 or 7 Rooms | 216 (52.4%) | 46 (12.2%) |
| 8 or more Rooms | 70 (17.0%) | 40 (10.6%) |
| Total | 412 (100.0%) | 378 (100.0%) |
Housing Structure by Heating Type in Cave City
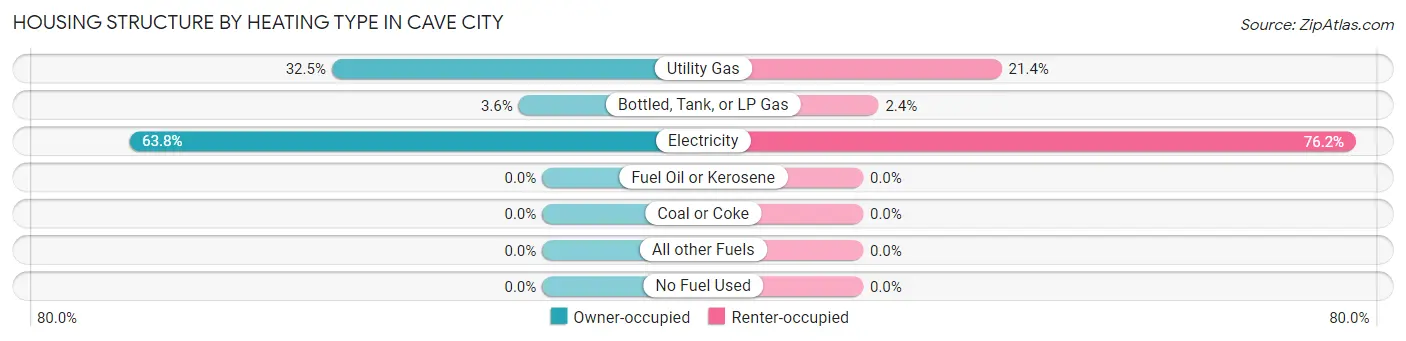
| Heating Type | Owner-occupied | Renter-occupied |
| Utility Gas | 134 (32.5%) | 81 (21.4%) |
| Bottled, Tank, or LP Gas | 15 (3.6%) | 9 (2.4%) |
| Electricity | 263 (63.8%) | 288 (76.2%) |
| Fuel Oil or Kerosene | 0 (0.0%) | 0 (0.0%) |
| Coal or Coke | 0 (0.0%) | 0 (0.0%) |
| All other Fuels | 0 (0.0%) | 0 (0.0%) |
| No Fuel Used | 0 (0.0%) | 0 (0.0%) |
| Total | 412 (100.0%) | 378 (100.0%) |
Household Vehicle Usage in Cave City
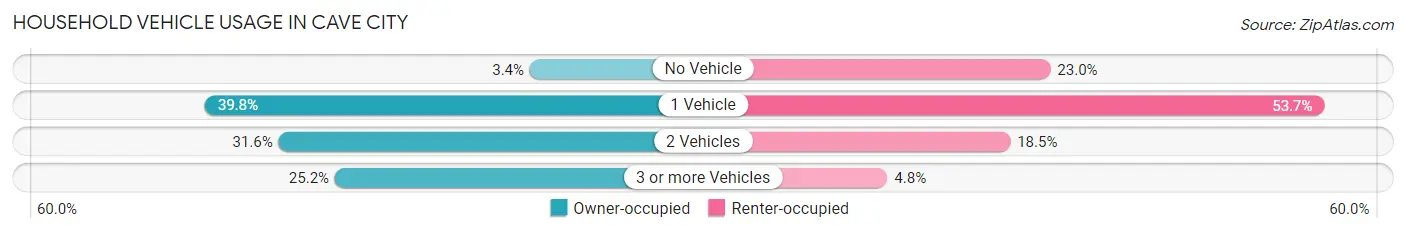
| Vehicles per Household | Owner-occupied | Renter-occupied |
| No Vehicle | 14 (3.4%) | 87 (23.0%) |
| 1 Vehicle | 164 (39.8%) | 203 (53.7%) |
| 2 Vehicles | 130 (31.6%) | 70 (18.5%) |
| 3 or more Vehicles | 104 (25.2%) | 18 (4.8%) |
| Total | 412 (100.0%) | 378 (100.0%) |
Real Estate & Mortgages in Cave City
Real Estate and Mortgage Overview in Cave City
| Characteristic | Without Mortgage | With Mortgage |
| Housing Units | 159 | 253 |
| Median Property Value | $105,100 | $95,900 |
| Median Household Income | $34,875 | $47 |
| Monthly Housing Costs | $299 | $0 |
| Real Estate Taxes | $555 | $5 |
Property Value by Mortgage Status in Cave City
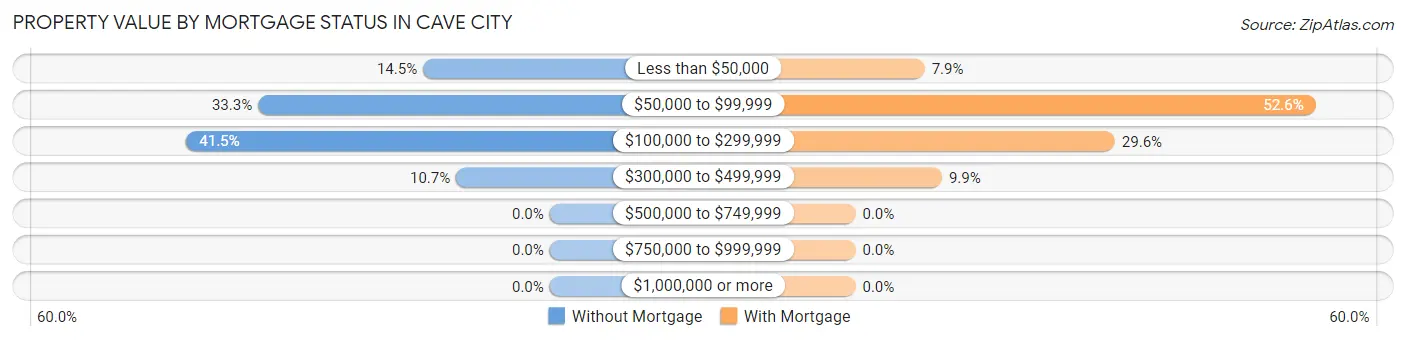
| Property Value | Without Mortgage | With Mortgage |
| Less than $50,000 | 23 (14.5%) | 20 (7.9%) |
| $50,000 to $99,999 | 53 (33.3%) | 133 (52.6%) |
| $100,000 to $299,999 | 66 (41.5%) | 75 (29.6%) |
| $300,000 to $499,999 | 17 (10.7%) | 25 (9.9%) |
| $500,000 to $749,999 | 0 (0.0%) | 0 (0.0%) |
| $750,000 to $999,999 | 0 (0.0%) | 0 (0.0%) |
| $1,000,000 or more | 0 (0.0%) | 0 (0.0%) |
| Total | 159 (100.0%) | 253 (100.0%) |
Household Income by Mortgage Status in Cave City
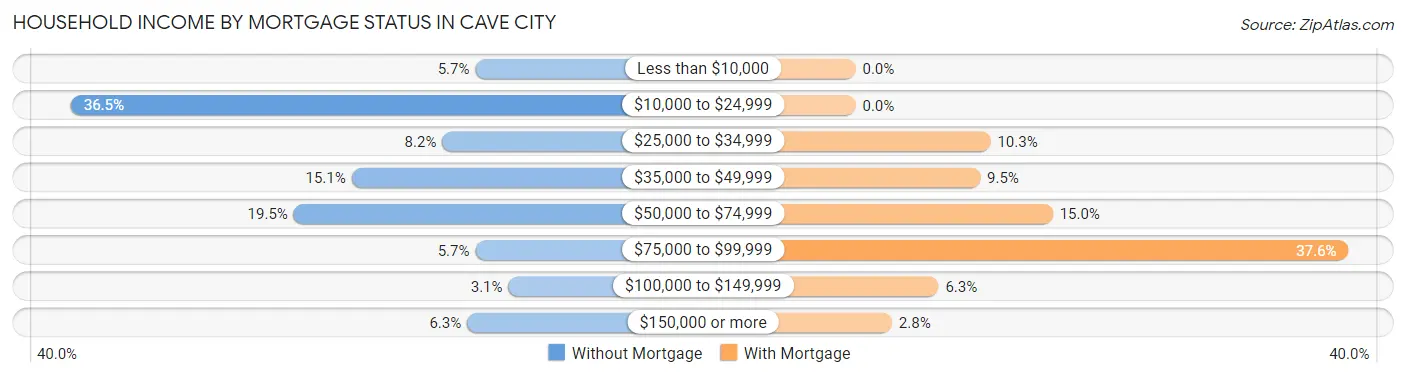
| Household Income | Without Mortgage | With Mortgage |
| Less than $10,000 | 9 (5.7%) | 0 (0.0%) |
| $10,000 to $24,999 | 58 (36.5%) | 0 (0.0%) |
| $25,000 to $34,999 | 13 (8.2%) | 26 (10.3%) |
| $35,000 to $49,999 | 24 (15.1%) | 24 (9.5%) |
| $50,000 to $74,999 | 31 (19.5%) | 38 (15.0%) |
| $75,000 to $99,999 | 9 (5.7%) | 95 (37.6%) |
| $100,000 to $149,999 | 5 (3.1%) | 16 (6.3%) |
| $150,000 or more | 10 (6.3%) | 7 (2.8%) |
| Total | 159 (100.0%) | 253 (100.0%) |
Property Value to Household Income Ratio in Cave City
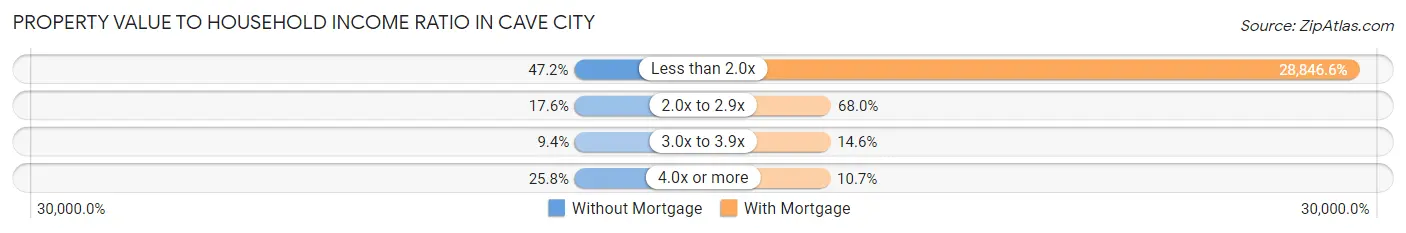
| Value-to-Income Ratio | Without Mortgage | With Mortgage |
| Less than 2.0x | 75 (47.2%) | 72,982 (28,846.6%) |
| 2.0x to 2.9x | 28 (17.6%) | 172 (68.0%) |
| 3.0x to 3.9x | 15 (9.4%) | 37 (14.6%) |
| 4.0x or more | 41 (25.8%) | 27 (10.7%) |
| Total | 159 (100.0%) | 253 (100.0%) |
Real Estate Taxes by Mortgage Status in Cave City
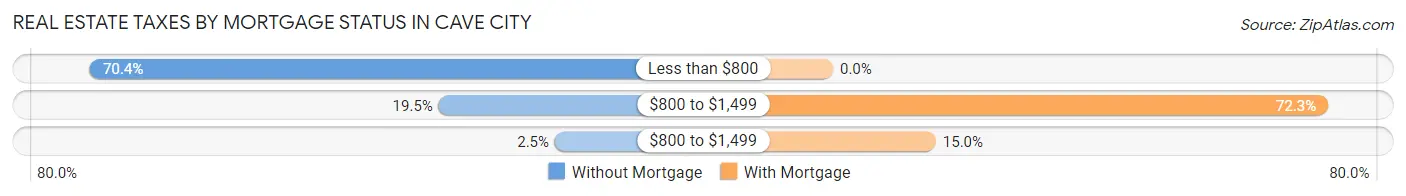
| Property Taxes | Without Mortgage | With Mortgage |
| Less than $800 | 112 (70.4%) | 0 (0.0%) |
| $800 to $1,499 | 31 (19.5%) | 183 (72.3%) |
| $800 to $1,499 | 4 (2.5%) | 38 (15.0%) |
| Total | 159 (100.0%) | 253 (100.0%) |
Health & Disability in Cave City
Health Insurance Coverage by Age in Cave City
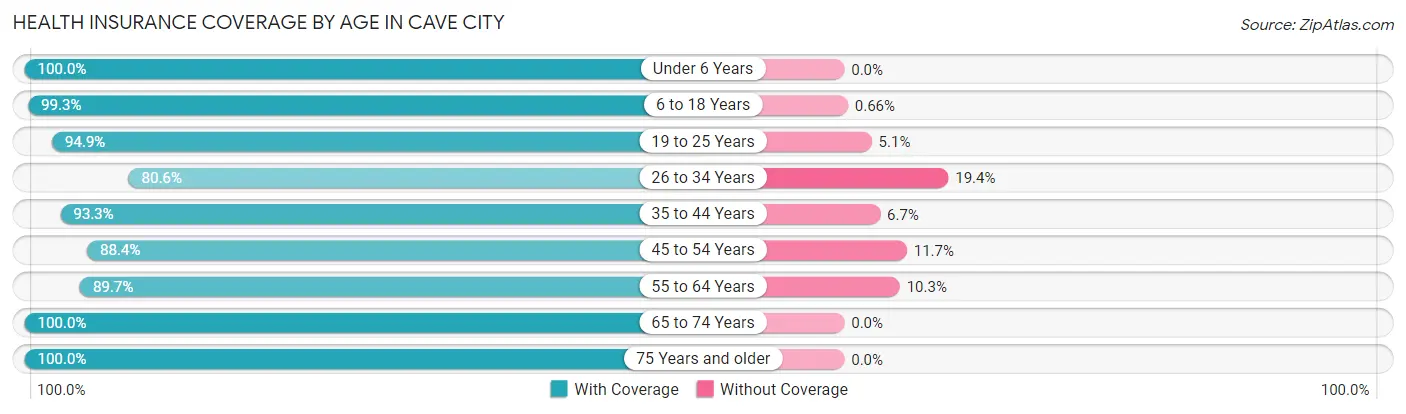
| Age Bracket | With Coverage | Without Coverage |
| Under 6 Years | 190 (100.0%) | 0 (0.0%) |
| 6 to 18 Years | 453 (99.3%) | 3 (0.7%) |
| 19 to 25 Years | 149 (94.9%) | 8 (5.1%) |
| 26 to 34 Years | 162 (80.6%) | 39 (19.4%) |
| 35 to 44 Years | 308 (93.3%) | 22 (6.7%) |
| 45 to 54 Years | 91 (88.3%) | 12 (11.7%) |
| 55 to 64 Years | 208 (89.7%) | 24 (10.3%) |
| 65 to 74 Years | 212 (100.0%) | 0 (0.0%) |
| 75 Years and older | 83 (100.0%) | 0 (0.0%) |
| Total | 1,856 (94.5%) | 108 (5.5%) |
Health Insurance Coverage by Citizenship Status in Cave City
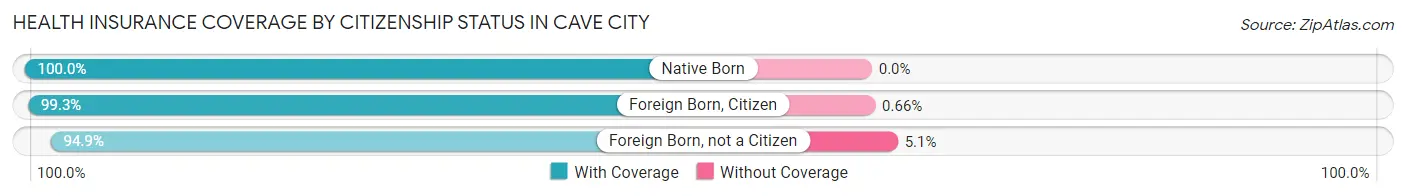
| Citizenship Status | With Coverage | Without Coverage |
| Native Born | 190 (100.0%) | 0 (0.0%) |
| Foreign Born, Citizen | 453 (99.3%) | 3 (0.7%) |
| Foreign Born, not a Citizen | 149 (94.9%) | 8 (5.1%) |
Health Insurance Coverage by Household Income in Cave City
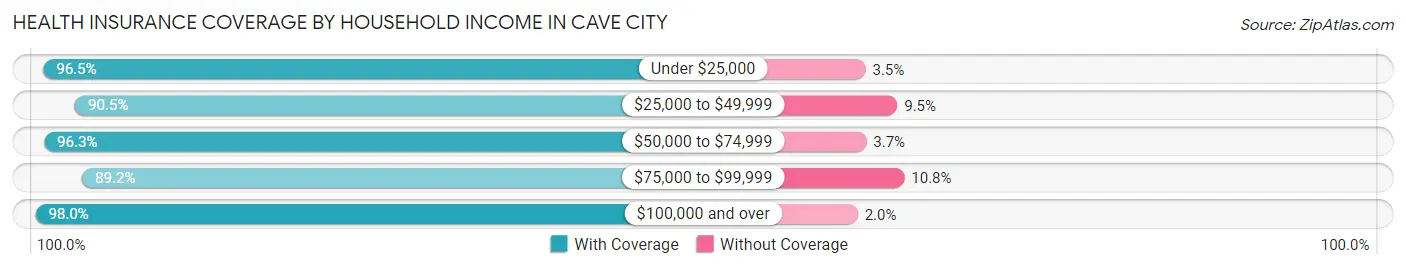
| Household Income | With Coverage | Without Coverage |
| Under $25,000 | 467 (96.5%) | 17 (3.5%) |
| $25,000 to $49,999 | 469 (90.5%) | 49 (9.5%) |
| $50,000 to $74,999 | 604 (96.3%) | 23 (3.7%) |
| $75,000 to $99,999 | 124 (89.2%) | 15 (10.8%) |
| $100,000 and over | 192 (98.0%) | 4 (2.0%) |
Public vs Private Health Insurance Coverage by Age in Cave City
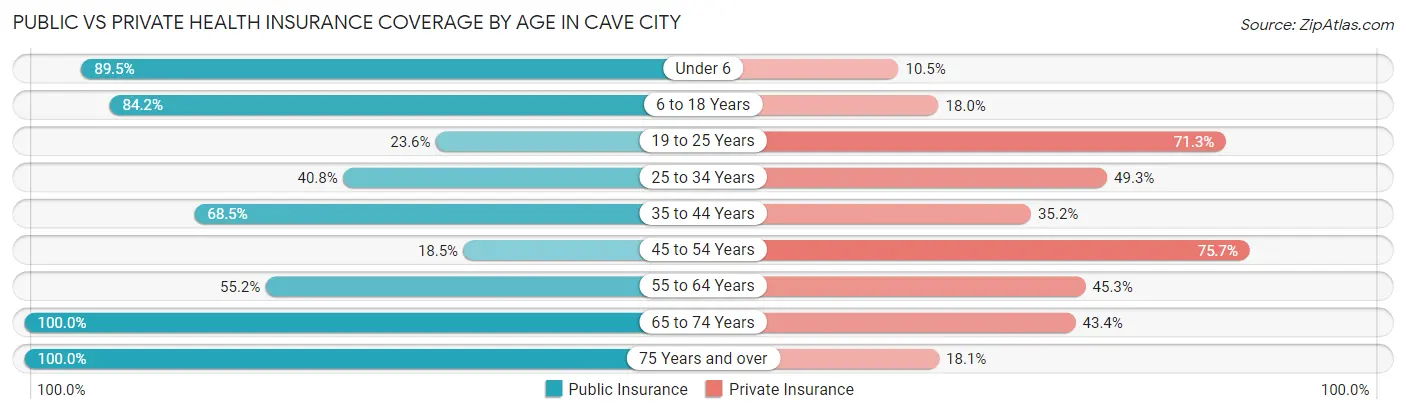
| Age Bracket | Public Insurance | Private Insurance |
| Under 6 | 170 (89.5%) | 20 (10.5%) |
| 6 to 18 Years | 384 (84.2%) | 82 (18.0%) |
| 19 to 25 Years | 37 (23.6%) | 112 (71.3%) |
| 25 to 34 Years | 82 (40.8%) | 99 (49.2%) |
| 35 to 44 Years | 226 (68.5%) | 116 (35.1%) |
| 45 to 54 Years | 19 (18.4%) | 78 (75.7%) |
| 55 to 64 Years | 128 (55.2%) | 105 (45.3%) |
| 65 to 74 Years | 212 (100.0%) | 92 (43.4%) |
| 75 Years and over | 83 (100.0%) | 15 (18.1%) |
| Total | 1,341 (68.3%) | 719 (36.6%) |
Disability Status by Sex by Age in Cave City
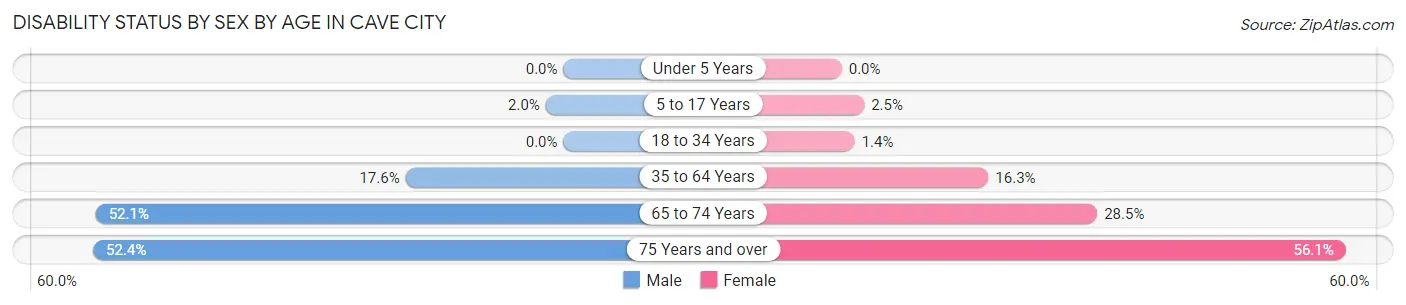
| Age Bracket | Male | Female |
| Under 5 Years | 0 (0.0%) | 0 (0.0%) |
| 5 to 17 Years | 4 (2.0%) | 7 (2.5%) |
| 18 to 34 Years | 0 (0.0%) | 3 (1.4%) |
| 35 to 64 Years | 48 (17.6%) | 64 (16.3%) |
| 65 to 74 Years | 50 (52.1%) | 33 (28.4%) |
| 75 Years and over | 22 (52.4%) | 23 (56.1%) |
Disability Class by Sex by Age in Cave City
Disability Class: Hearing Difficulty
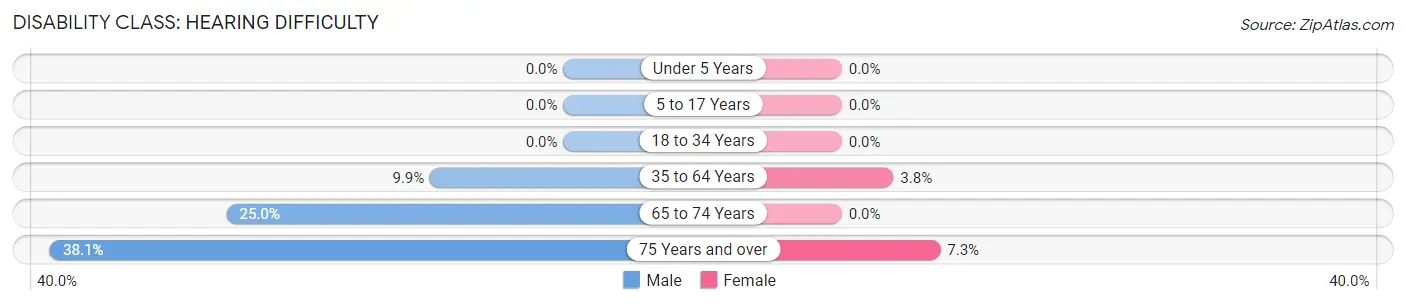
| Age Bracket | Male | Female |
| Under 5 Years | 0 (0.0%) | 0 (0.0%) |
| 5 to 17 Years | 0 (0.0%) | 0 (0.0%) |
| 18 to 34 Years | 0 (0.0%) | 0 (0.0%) |
| 35 to 64 Years | 27 (9.9%) | 15 (3.8%) |
| 65 to 74 Years | 24 (25.0%) | 0 (0.0%) |
| 75 Years and over | 16 (38.1%) | 3 (7.3%) |
Disability Class: Vision Difficulty
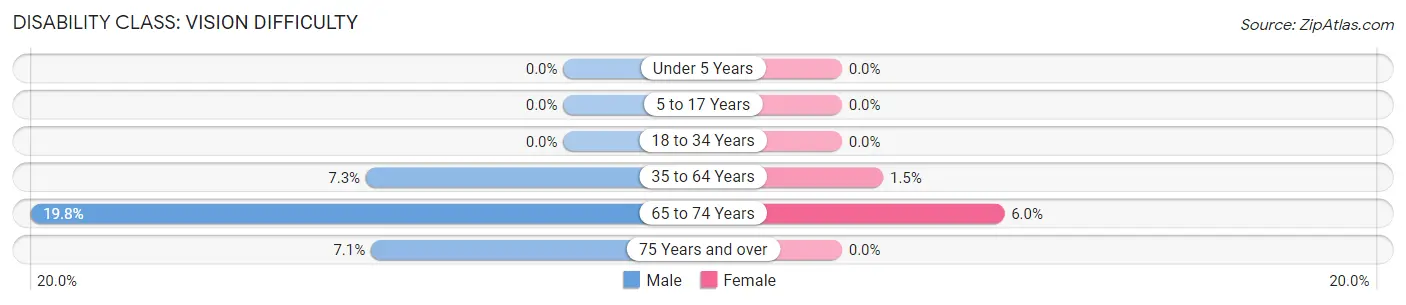
| Age Bracket | Male | Female |
| Under 5 Years | 0 (0.0%) | 0 (0.0%) |
| 5 to 17 Years | 0 (0.0%) | 0 (0.0%) |
| 18 to 34 Years | 0 (0.0%) | 0 (0.0%) |
| 35 to 64 Years | 20 (7.3%) | 6 (1.5%) |
| 65 to 74 Years | 19 (19.8%) | 7 (6.0%) |
| 75 Years and over | 3 (7.1%) | 0 (0.0%) |
Disability Class: Cognitive Difficulty
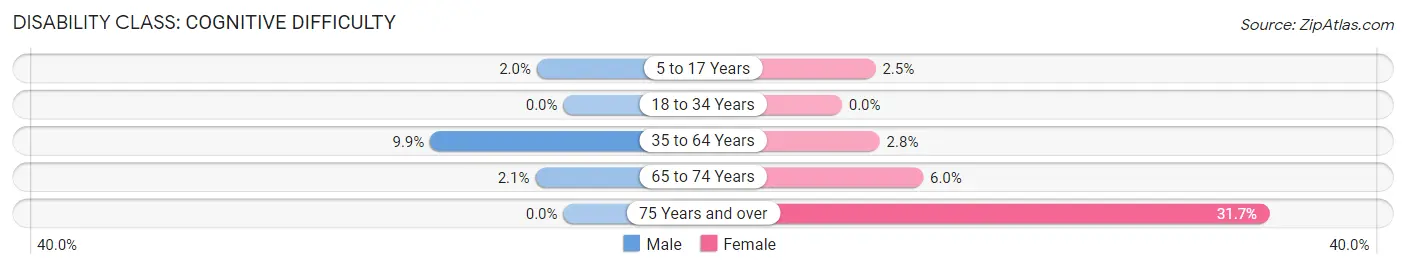
| Age Bracket | Male | Female |
| 5 to 17 Years | 4 (2.0%) | 7 (2.5%) |
| 18 to 34 Years | 0 (0.0%) | 0 (0.0%) |
| 35 to 64 Years | 27 (9.9%) | 11 (2.8%) |
| 65 to 74 Years | 2 (2.1%) | 7 (6.0%) |
| 75 Years and over | 0 (0.0%) | 13 (31.7%) |
Disability Class: Ambulatory Difficulty
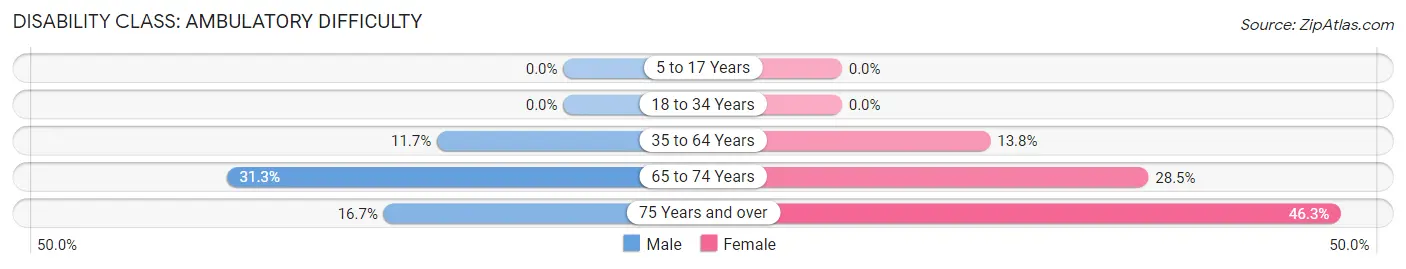
| Age Bracket | Male | Female |
| 5 to 17 Years | 0 (0.0%) | 0 (0.0%) |
| 18 to 34 Years | 0 (0.0%) | 0 (0.0%) |
| 35 to 64 Years | 32 (11.7%) | 54 (13.8%) |
| 65 to 74 Years | 30 (31.2%) | 33 (28.4%) |
| 75 Years and over | 7 (16.7%) | 19 (46.3%) |
Disability Class: Self-Care Difficulty
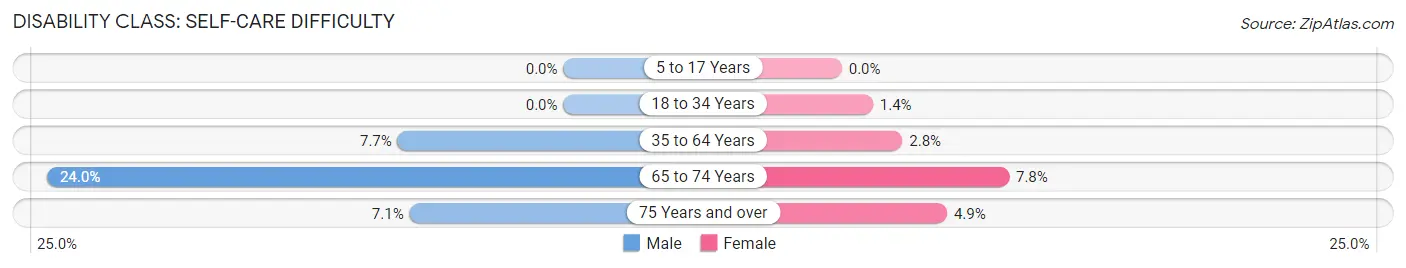
| Age Bracket | Male | Female |
| 5 to 17 Years | 0 (0.0%) | 0 (0.0%) |
| 18 to 34 Years | 0 (0.0%) | 3 (1.4%) |
| 35 to 64 Years | 21 (7.7%) | 11 (2.8%) |
| 65 to 74 Years | 23 (24.0%) | 9 (7.8%) |
| 75 Years and over | 3 (7.1%) | 2 (4.9%) |
Technology Access in Cave City
Computing Device Access in Cave City
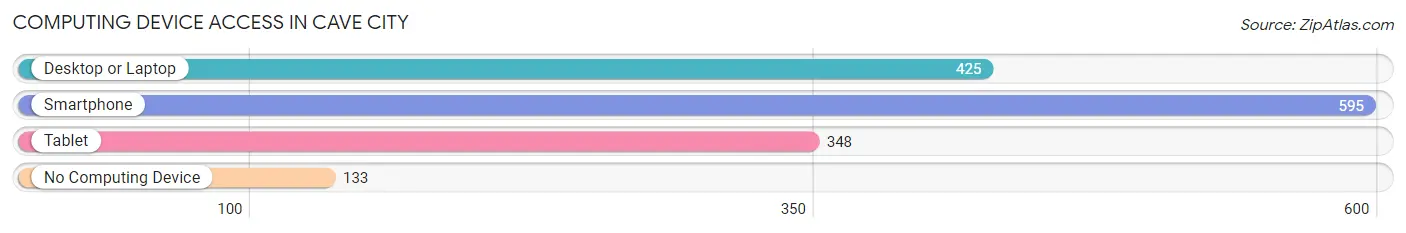
| Device Type | # Households | % Households |
| Desktop or Laptop | 425 | 53.8% |
| Smartphone | 595 | 75.3% |
| Tablet | 348 | 44.1% |
| No Computing Device | 133 | 16.8% |
| Total | 790 | 100.0% |
Internet Access in Cave City
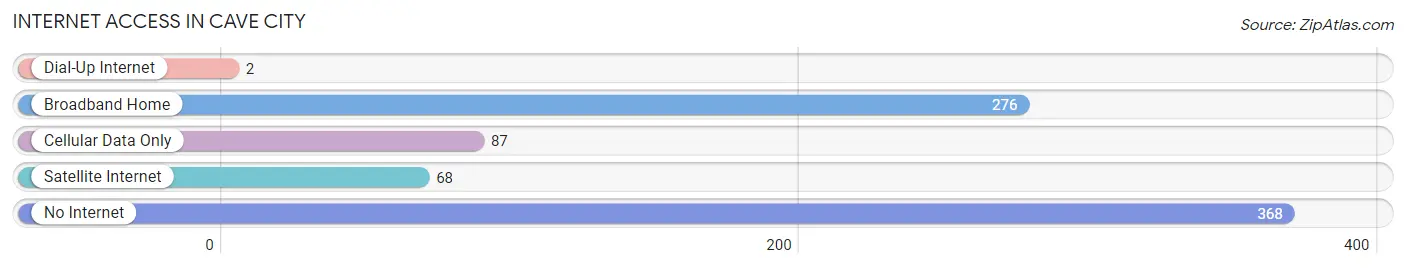
| Internet Type | # Households | % Households |
| Dial-Up Internet | 2 | 0.3% |
| Broadband Home | 276 | 34.9% |
| Cellular Data Only | 87 | 11.0% |
| Satellite Internet | 68 | 8.6% |
| No Internet | 368 | 46.6% |
| Total | 790 | 100.0% |
Cave City Summary
Cave City, Arkansas is a small city located in Sharp County in the northeast corner of the state. It is situated on the banks of the Spring River, which is a popular destination for fishing, canoeing, and other recreational activities. The city is home to a population of approximately 1,800 people, and is the county seat of Sharp County.
Cave City was founded in 1883 by a group of settlers from Kentucky and Tennessee. The city was named for the nearby Blanchard Springs Caverns, which are a popular tourist attraction. The city was incorporated in 1887 and has since grown to become a thriving community.
Geographically, Cave City is located in the Ozark Mountains, which are known for their rugged terrain and beautiful scenery. The city is situated at the intersection of two major highways, US Highway 167 and Arkansas Highway 230. The city is also located near the Buffalo National River, which is a popular destination for outdoor recreation.
The economy of Cave City is largely based on agriculture and tourism. The city is home to several farms, which produce a variety of crops, including corn, soybeans, and cotton. The city is also home to several tourist attractions, including the Blanchard Springs Caverns, the Ozark Folk Center, and the Ozark National Forest.
Demographically, Cave City is a predominantly white city, with a population that is approximately 95% white. The median household income is approximately $30,000, and the median age is around 40 years old. The city is home to a variety of religious denominations, including Baptist, Methodist, and Catholic.
Cave City is a small city with a rich history and a vibrant economy. It is a great place to live, work, and play, and is a great destination for tourists looking to explore the Ozark Mountains. With its beautiful scenery, friendly people, and diverse economy, Cave City is a great place to call home.
Common Questions
What is Per Capita Income in Cave City?
Per Capita income in Cave City is $20,252.
What is the Median Family Income in Cave City?
Median Family Income in Cave City is $51,442.
What is the Median Household income in Cave City?
Median Household Income in Cave City is $40,441.
What is Income or Wage Gap in Cave City?
Income or Wage Gap in Cave City is 44.8%.
Women in Cave City earn 55.2 cents for every dollar earned by a man.
What is Inequality or Gini Index in Cave City?
Inequality or Gini Index in Cave City is 0.47.
What is the Total Population of Cave City?
Total Population of Cave City is 2,038.
What is the Total Male Population of Cave City?
Total Male Population of Cave City is 875.
What is the Total Female Population of Cave City?
Total Female Population of Cave City is 1,163.
What is the Ratio of Males per 100 Females in Cave City?
There are 75.24 Males per 100 Females in Cave City.
What is the Ratio of Females per 100 Males in Cave City?
There are 132.91 Females per 100 Males in Cave City.
What is the Median Population Age in Cave City?
Median Population Age in Cave City is 35.7 Years.
What is the Average Family Size in Cave City
Average Family Size in Cave City is 3.0 People.
What is the Average Household Size in Cave City
Average Household Size in Cave City is 2.5 People.
How Large is the Labor Force in Cave City?
There are 762 People in the Labor Forcein in Cave City.
What is the Percentage of People in the Labor Force in Cave City?
50.6% of People are in the Labor Force in Cave City.
What is the Unemployment Rate in Cave City?
Unemployment Rate in Cave City is 4.3%.