Carthage, AR Map & Demographics
Carthage Map
Carthage Overview
$21,130
PER CAPITA INCOME
$47,083
AVG FAMILY INCOME
60.1%
WAGE / INCOME GAP [ % ]
39.9¢/ $1
WAGE / INCOME GAP [ $ ]
0.47
INEQUALITY / GINI INDEX
178
TOTAL POPULATION
97
MALE POPULATION
81
FEMALE POPULATION
119.75
MALES / 100 FEMALES
83.51
FEMALES / 100 MALES
60.0
MEDIAN AGE
3.0
AVG FAMILY SIZE
2.0
AVG HOUSEHOLD SIZE
51
LABOR FORCE [ PEOPLE ]
34.2%
PERCENT IN LABOR FORCE
3.9%
UNEMPLOYMENT RATE
Carthage Zip Codes
Carthage Area Codes
Income in Carthage
Income Overview in Carthage
| Characteristic | Number | Measure |
| Per Capita Income | 178 | $21,130 |
| Median Family Income | 44 | $47,083 |
| Mean Family Income | 44 | $50,464 |
| Median Household Income | 91 | $0 |
| Mean Household Income | 91 | $36,165 |
| Income Deficit | 44 | $0 |
| Wage / Income Gap (%) | 178 | 60.14% |
| Wage / Income Gap ($) | 178 | 39.86¢ per $1 |
| Gini / Inequality Index | 178 | 0.47 |
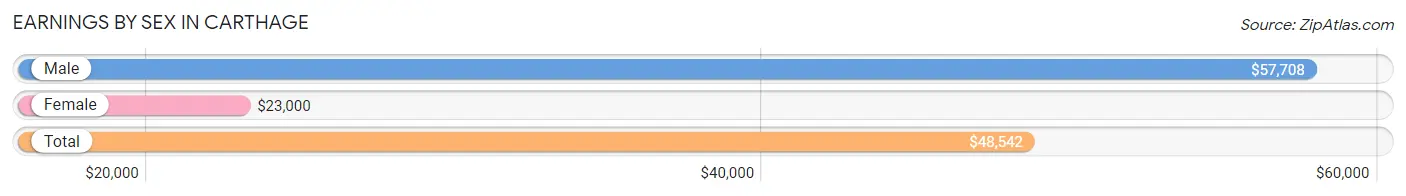
Earnings by Sex in Carthage
Average Earnings in Carthage are $48,542, $57,708 for men and $23,000 for women, a difference of 60.1%.
| Sex | Number | Average Earnings |
| Male | 31 (54.4%) | $57,708 |
| Female | 26 (45.6%) | $23,000 |
| Total | 57 (100.0%) | $48,542 |
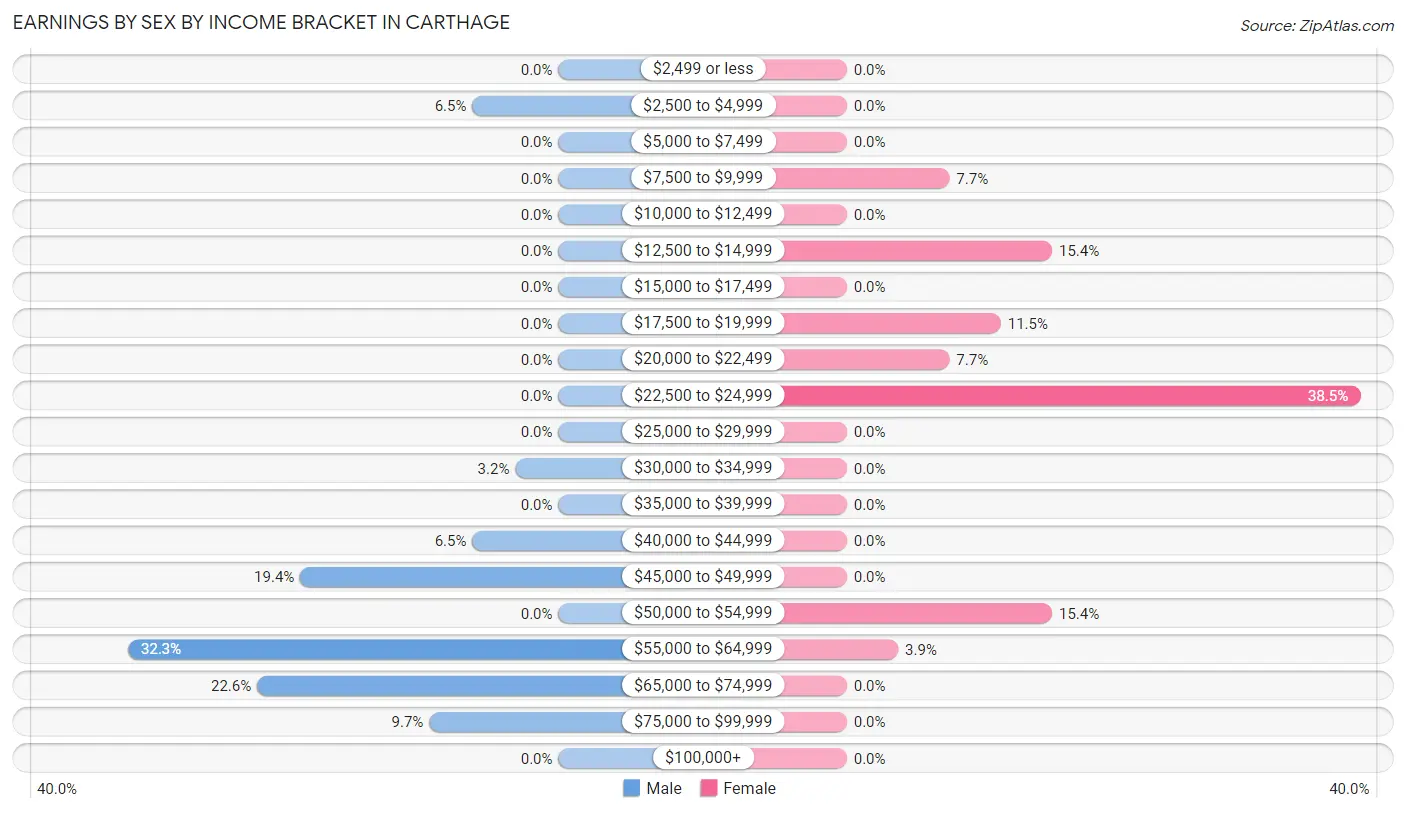
Earnings by Sex by Income Bracket in Carthage
The most common earnings brackets in Carthage are $55,000 to $64,999 for men (10 | 32.3%) and $22,500 to $24,999 for women (10 | 38.5%).
| Income | Male | Female |
| $2,499 or less | 0 (0.0%) | 0 (0.0%) |
| $2,500 to $4,999 | 2 (6.5%) | 0 (0.0%) |
| $5,000 to $7,499 | 0 (0.0%) | 0 (0.0%) |
| $7,500 to $9,999 | 0 (0.0%) | 2 (7.7%) |
| $10,000 to $12,499 | 0 (0.0%) | 0 (0.0%) |
| $12,500 to $14,999 | 0 (0.0%) | 4 (15.4%) |
| $15,000 to $17,499 | 0 (0.0%) | 0 (0.0%) |
| $17,500 to $19,999 | 0 (0.0%) | 3 (11.5%) |
| $20,000 to $22,499 | 0 (0.0%) | 2 (7.7%) |
| $22,500 to $24,999 | 0 (0.0%) | 10 (38.5%) |
| $25,000 to $29,999 | 0 (0.0%) | 0 (0.0%) |
| $30,000 to $34,999 | 1 (3.2%) | 0 (0.0%) |
| $35,000 to $39,999 | 0 (0.0%) | 0 (0.0%) |
| $40,000 to $44,999 | 2 (6.5%) | 0 (0.0%) |
| $45,000 to $49,999 | 6 (19.4%) | 0 (0.0%) |
| $50,000 to $54,999 | 0 (0.0%) | 4 (15.4%) |
| $55,000 to $64,999 | 10 (32.3%) | 1 (3.8%) |
| $65,000 to $74,999 | 7 (22.6%) | 0 (0.0%) |
| $75,000 to $99,999 | 3 (9.7%) | 0 (0.0%) |
| $100,000+ | 0 (0.0%) | 0 (0.0%) |
| Total | 31 (100.0%) | 26 (100.0%) |
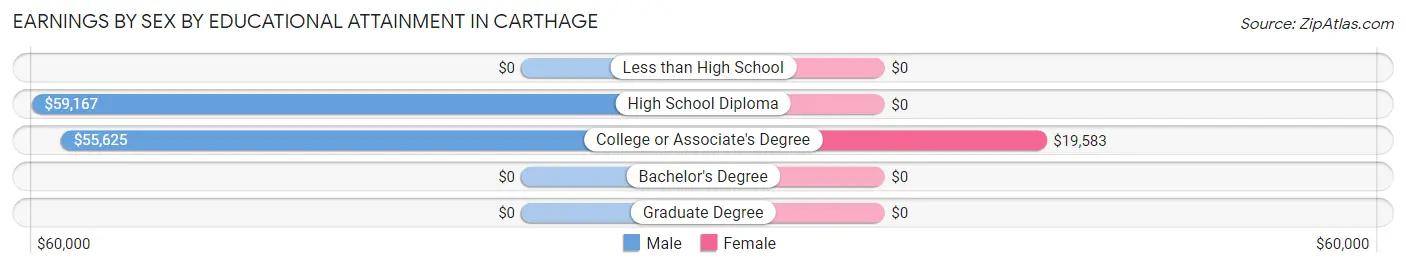
Earnings by Sex by Educational Attainment in Carthage
Average earnings in Carthage are $57,917 for men and $23,000 for women, a difference of 60.3%. Men with an educational attainment of high school diploma enjoy the highest average annual earnings of $59,167, while those with college or associate's degree education earn the least with $55,625. Women with an educational attainment of college or associate's degree earn the most with the average annual earnings of $19,583, while those with college or associate's degree education have the smallest earnings of $19,583.
| Educational Attainment | Male Income | Female Income |
| Less than High School | - | - |
| High School Diploma | $59,167 | $0 |
| College or Associate's Degree | $55,625 | $19,583 |
| Bachelor's Degree | - | - |
| Graduate Degree | - | - |
| Total | $57,917 | $23,000 |
Family Income in Carthage
Family Income Brackets in Carthage
According to the Carthage family income data, there are 10 families falling into the $35,000 to $49,999 income range, which is the most common income bracket and makes up 22.7% of all families.
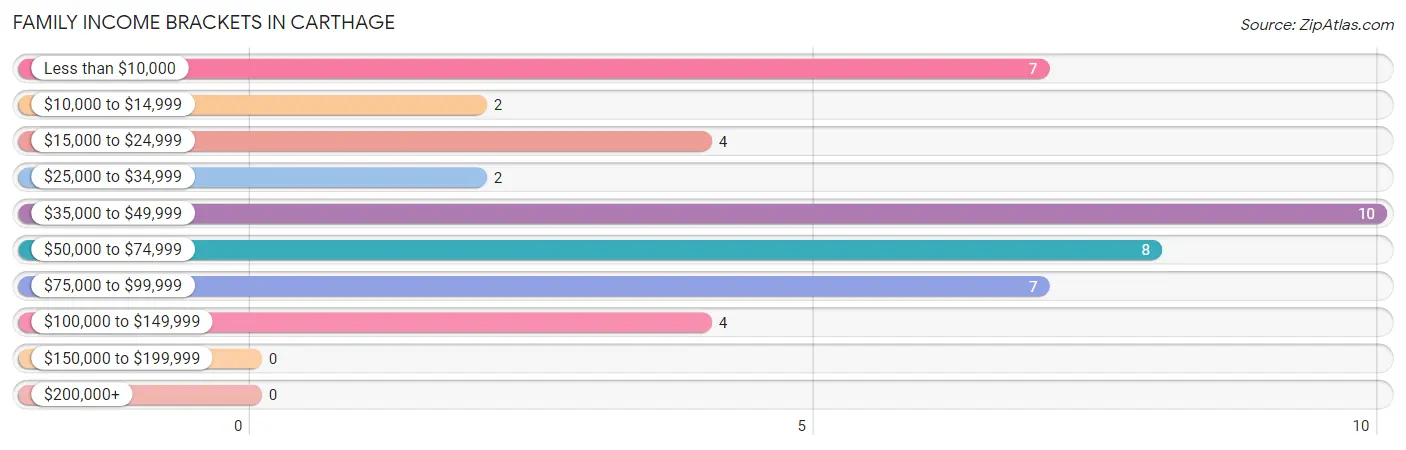
| Income Bracket | # Families | % Families |
| Less than $10,000 | 7 | 15.9% |
| $10,000 to $14,999 | 2 | 4.5% |
| $15,000 to $24,999 | 4 | 9.1% |
| $25,000 to $34,999 | 2 | 4.5% |
| $35,000 to $49,999 | 10 | 22.7% |
| $50,000 to $74,999 | 8 | 18.2% |
| $75,000 to $99,999 | 7 | 15.9% |
| $100,000 to $149,999 | 4 | 9.1% |
| $150,000 to $199,999 | 0 | 0.0% |
| $200,000+ | 0 | 0.0% |
Family Income by Famaliy Size in Carthage
2-person families (38 | 86.4%) account for the highest median family income in Carthage with $46,667 per family, while 2-person families (38 | 86.4%) have the highest median income of $23,334 per family member.
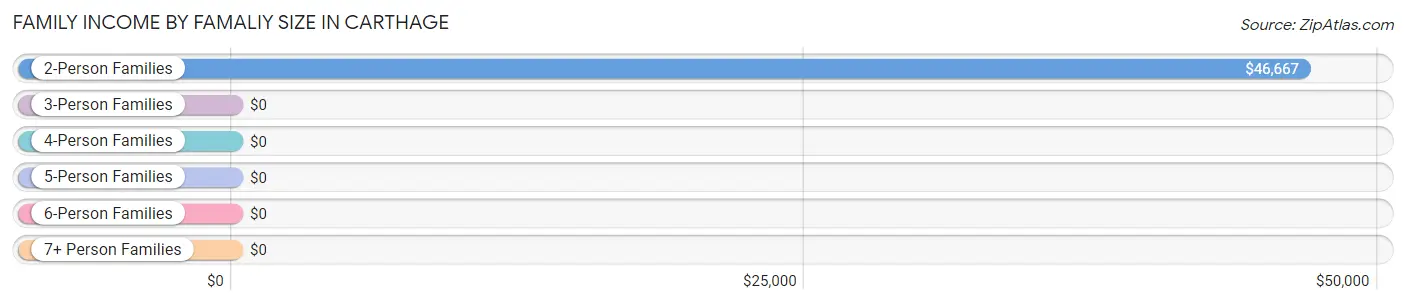
| Income Bracket | # Families | Median Income |
| 2-Person Families | 38 (86.4%) | $46,667 |
| 3-Person Families | 0 (0.0%) | $0 |
| 4-Person Families | 3 (6.8%) | $0 |
| 5-Person Families | 3 (6.8%) | $0 |
| 6-Person Families | 0 (0.0%) | $0 |
| 7+ Person Families | 0 (0.0%) | $0 |
| Total | 44 (100.0%) | $47,083 |
Family Income by Number of Earners in Carthage
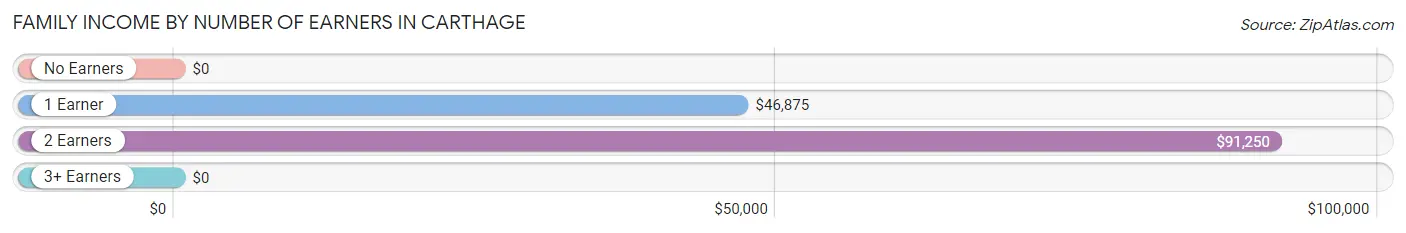
| Number of Earners | # Families | Median Income |
| No Earners | 11 (25.0%) | $0 |
| 1 Earner | 25 (56.8%) | $46,875 |
| 2 Earners | 8 (18.2%) | $91,250 |
| 3+ Earners | 0 (0.0%) | $0 |
| Total | 44 (100.0%) | $47,083 |
Household Income in Carthage
Household Income Brackets in Carthage
With 21 households falling in the category, the less than $10,000 income range is the most frequent in Carthage, accounting for 23.1% of all households.
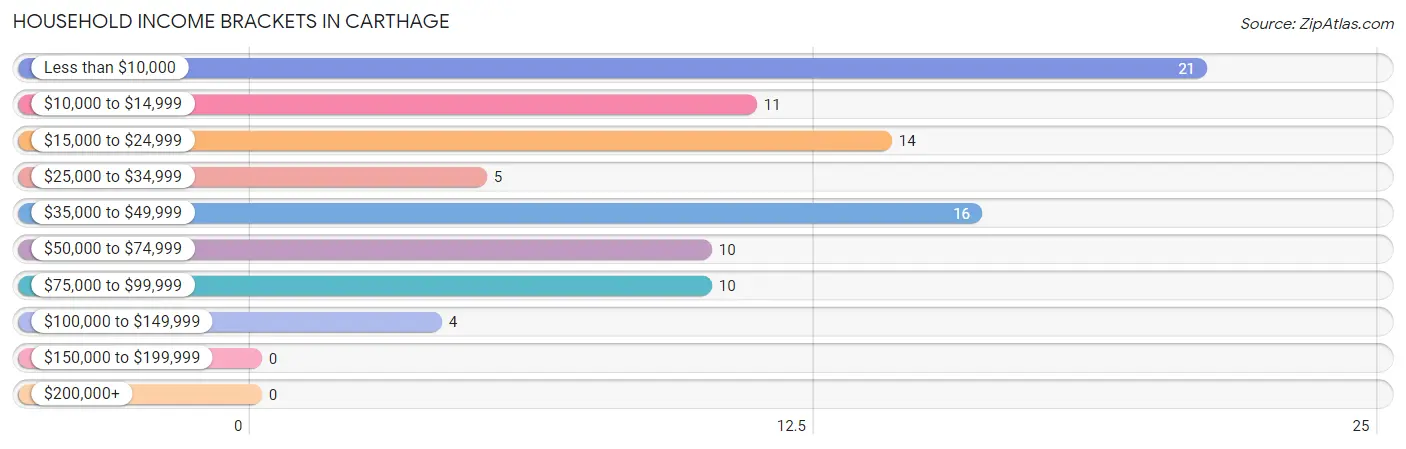
| Income Bracket | # Households | % Households |
| Less than $10,000 | 21 | 23.1% |
| $10,000 to $14,999 | 11 | 12.1% |
| $15,000 to $24,999 | 14 | 15.4% |
| $25,000 to $34,999 | 5 | 5.5% |
| $35,000 to $49,999 | 16 | 17.6% |
| $50,000 to $74,999 | 10 | 11.0% |
| $75,000 to $99,999 | 10 | 11.0% |
| $100,000 to $149,999 | 4 | 4.4% |
| $150,000 to $199,999 | 0 | 0.0% |
| $200,000+ | 0 | 0.0% |
Household Income by Householder Age in Carthage
The median household income in Carthage is $0, with the highest median household income of $48,542 found in the 25 to 44 years age bracket for the primary householder. A total of 9 households (9.9%) fall into this category.
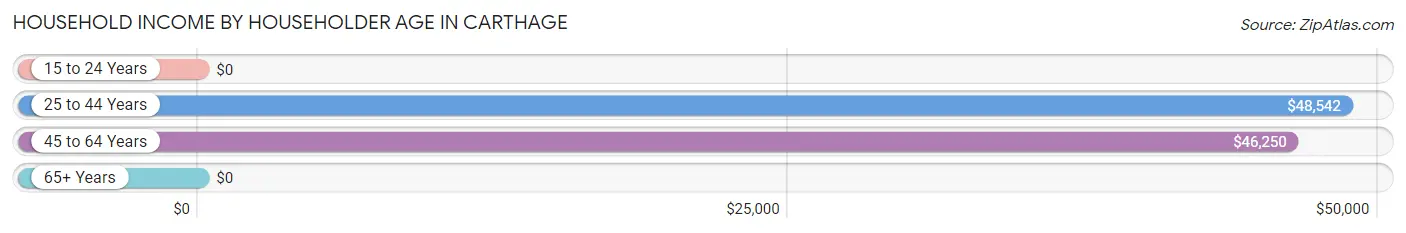
| Income Bracket | # Households | Median Income |
| 15 to 24 Years | 0 (0.0%) | $0 |
| 25 to 44 Years | 9 (9.9%) | $48,542 |
| 45 to 64 Years | 42 (46.2%) | $46,250 |
| 65+ Years | 40 (44.0%) | $0 |
| Total | 91 (100.0%) | $0 |
Poverty in Carthage
Income Below Poverty by Sex and Age in Carthage
With 25.8% poverty level for males and 30.9% for females among the residents of Carthage, 12 to 14 year old males and 6 to 11 year old females are the most vulnerable to poverty, with 4 males (100.0%) and 4 females (100.0%) in their respective age groups living below the poverty level.
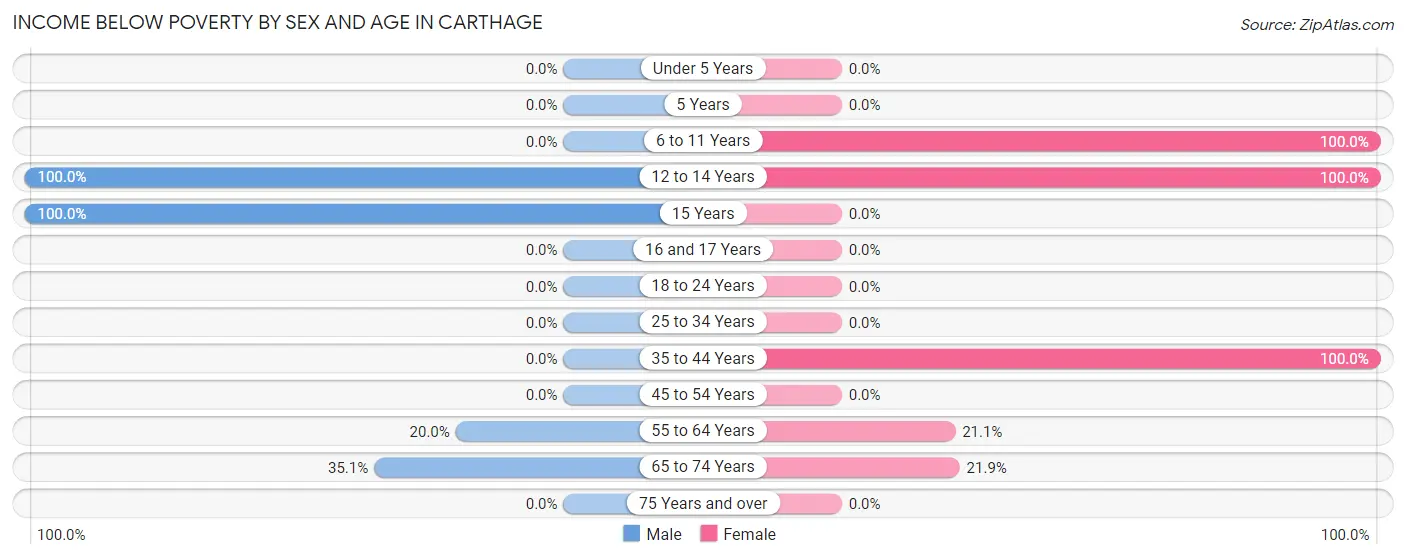
| Age Bracket | Male | Female |
| Under 5 Years | 0 (0.0%) | 0 (0.0%) |
| 5 Years | 0 (0.0%) | 0 (0.0%) |
| 6 to 11 Years | 0 (0.0%) | 4 (100.0%) |
| 12 to 14 Years | 4 (100.0%) | 8 (100.0%) |
| 15 Years | 2 (100.0%) | 0 (0.0%) |
| 16 and 17 Years | 0 (0.0%) | 0 (0.0%) |
| 18 to 24 Years | 0 (0.0%) | 0 (0.0%) |
| 25 to 34 Years | 0 (0.0%) | 0 (0.0%) |
| 35 to 44 Years | 0 (0.0%) | 2 (100.0%) |
| 45 to 54 Years | 0 (0.0%) | 0 (0.0%) |
| 55 to 64 Years | 6 (20.0%) | 4 (21.0%) |
| 65 to 74 Years | 13 (35.1%) | 7 (21.9%) |
| 75 Years and over | 0 (0.0%) | 0 (0.0%) |
| Total | 25 (25.8%) | 25 (30.9%) |
Income Above Poverty by Sex and Age in Carthage
According to the poverty statistics in Carthage, males aged under 5 years and females aged under 5 years are the age groups that are most secure financially, with 100.0% of males and 100.0% of females in these age groups living above the poverty line.
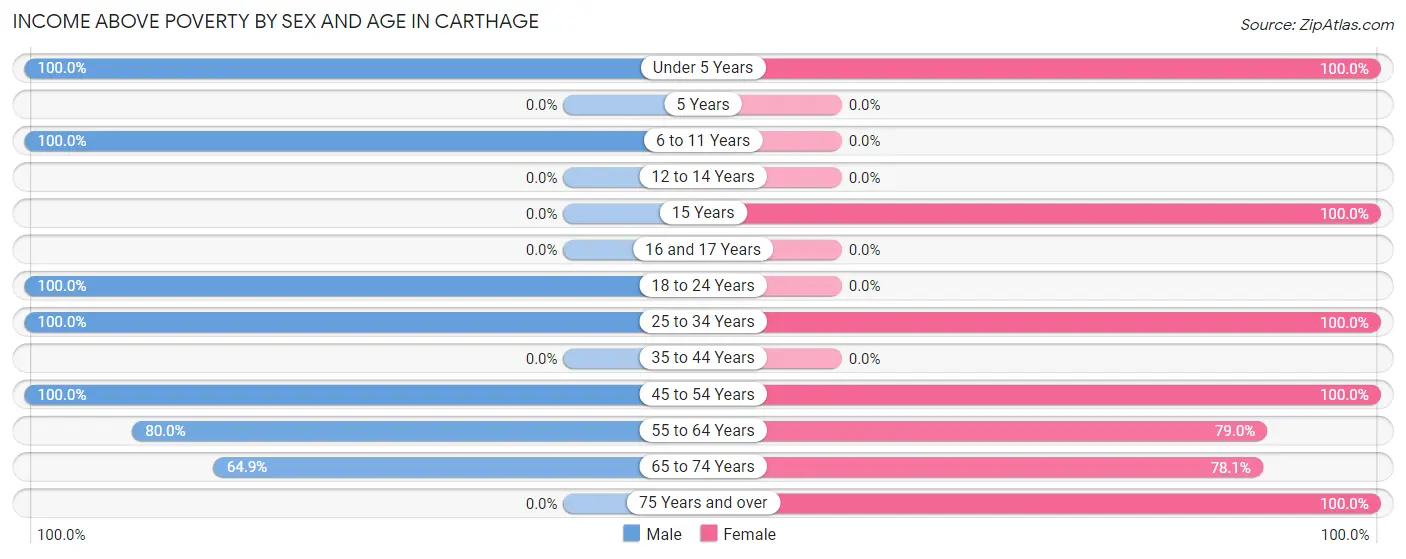
| Age Bracket | Male | Female |
| Under 5 Years | 3 (100.0%) | 5 (100.0%) |
| 5 Years | 0 (0.0%) | 0 (0.0%) |
| 6 to 11 Years | 2 (100.0%) | 0 (0.0%) |
| 12 to 14 Years | 0 (0.0%) | 0 (0.0%) |
| 15 Years | 0 (0.0%) | 1 (100.0%) |
| 16 and 17 Years | 0 (0.0%) | 0 (0.0%) |
| 18 to 24 Years | 1 (100.0%) | 0 (0.0%) |
| 25 to 34 Years | 9 (100.0%) | 1 (100.0%) |
| 35 to 44 Years | 0 (0.0%) | 0 (0.0%) |
| 45 to 54 Years | 9 (100.0%) | 7 (100.0%) |
| 55 to 64 Years | 24 (80.0%) | 15 (78.9%) |
| 65 to 74 Years | 24 (64.9%) | 25 (78.1%) |
| 75 Years and over | 0 (0.0%) | 2 (100.0%) |
| Total | 72 (74.2%) | 56 (69.1%) |
Income Below Poverty Among Married-Couple Families in Carthage
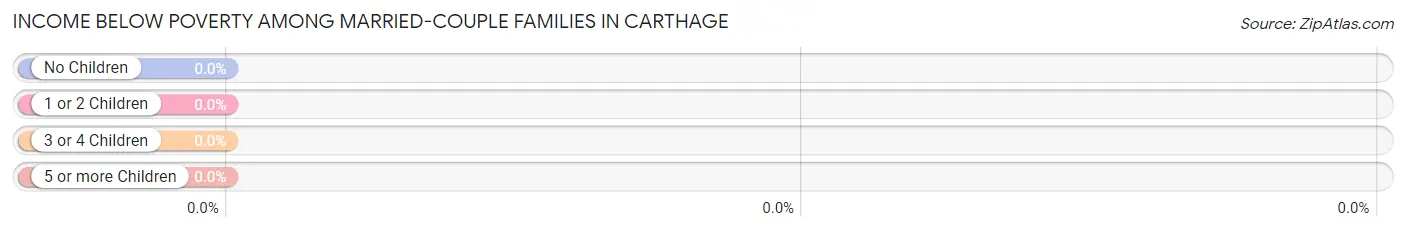
| Children | Above Poverty | Below Poverty |
| No Children | 25 (100.0%) | 0 (0.0%) |
| 1 or 2 Children | 3 (100.0%) | 0 (0.0%) |
| 3 or 4 Children | 1 (100.0%) | 0 (0.0%) |
| 5 or more Children | 0 (0.0%) | 0 (0.0%) |
| Total | 29 (100.0%) | 0 (0.0%) |
Income Below Poverty Among Single-Parent Households in Carthage
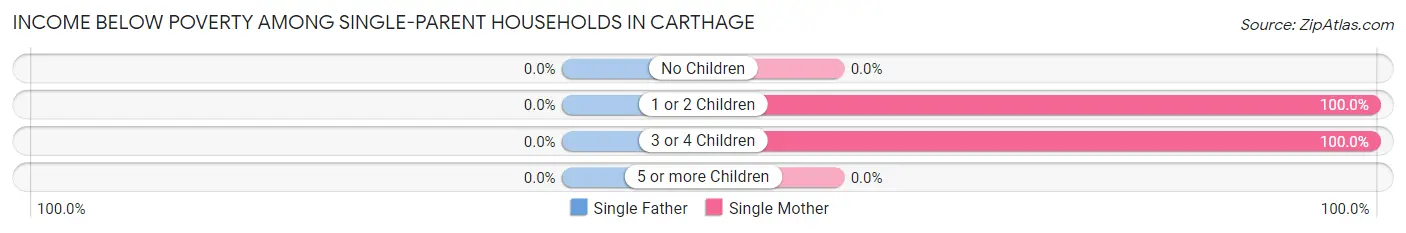
| Children | Single Father | Single Mother |
| No Children | 0 (0.0%) | 0 (0.0%) |
| 1 or 2 Children | 0 (0.0%) | 7 (100.0%) |
| 3 or 4 Children | 0 (0.0%) | 2 (100.0%) |
| 5 or more Children | 0 (0.0%) | 0 (0.0%) |
| Total | 0 (0.0%) | 9 (90.0%) |
Income Below Poverty Among Married-Couple vs Single-Parent Households in Carthage
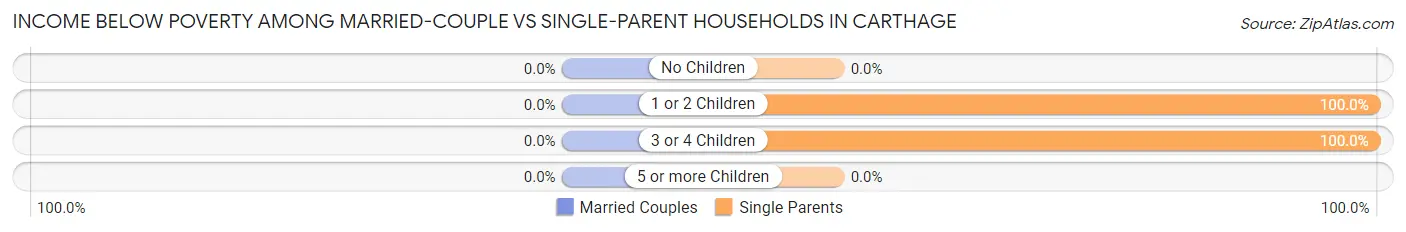
| Children | Married-Couple Families | Single-Parent Households |
| No Children | 0 (0.0%) | 0 (0.0%) |
| 1 or 2 Children | 0 (0.0%) | 7 (100.0%) |
| 3 or 4 Children | 0 (0.0%) | 2 (100.0%) |
| 5 or more Children | 0 (0.0%) | 0 (0.0%) |
| Total | 0 (0.0%) | 9 (60.0%) |
Race in Carthage
The most populous races in Carthage are Black / African American (156 | 87.6%), White / Caucasian (22 | 12.4%), and Hispanic or Latino (3 | 1.7%).
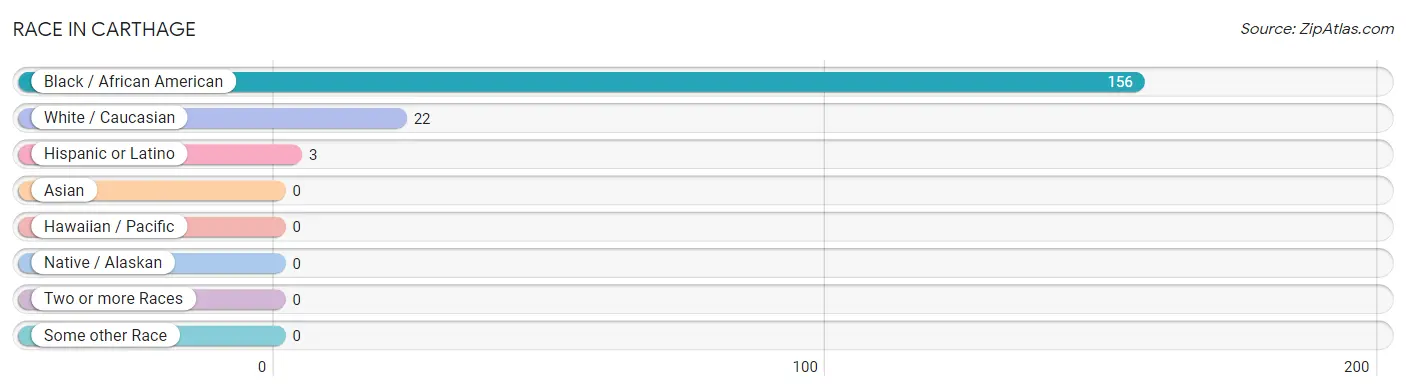
| Race | # Population | % Population |
| Asian | 0 | 0.0% |
| Black / African American | 156 | 87.6% |
| Hawaiian / Pacific | 0 | 0.0% |
| Hispanic or Latino | 3 | 1.7% |
| Native / Alaskan | 0 | 0.0% |
| White / Caucasian | 22 | 12.4% |
| Two or more Races | 0 | 0.0% |
| Some other Race | 0 | 0.0% |
| Total | 178 | 100.0% |
Ancestry in Carthage
The most populous ancestries reported in Carthage are Italian (8 | 4.5%), English (6 | 3.4%), Mexican (3 | 1.7%), and American (1 | 0.6%), together accounting for 10.1% of all Carthage residents.
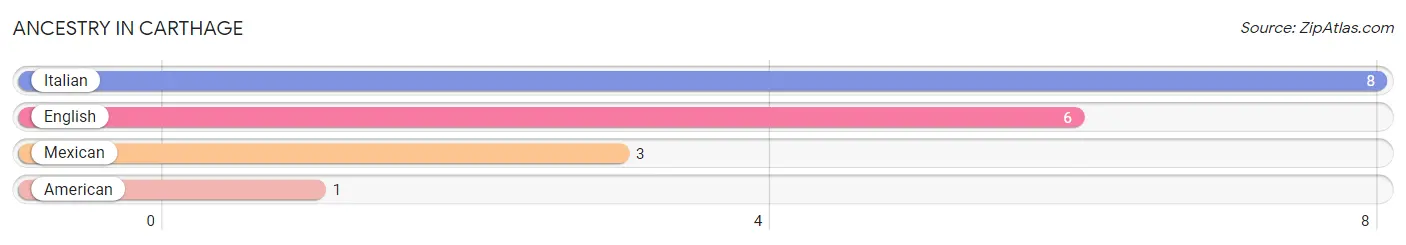
| Ancestry | # Population | % Population |
| American | 1 | 0.6% |
| English | 6 | 3.4% |
| Italian | 8 | 4.5% |
| Mexican | 3 | 1.7% | View All 4 Rows |
Immigrants in Carthage

| Immigration Origin | # Population | % Population | View All 0 Rows |
Sex and Age in Carthage
Sex and Age in Carthage
The most populous age groups in Carthage are 65 to 69 Years (35 | 36.1%) for men and 65 to 69 Years (22 | 27.2%) for women.
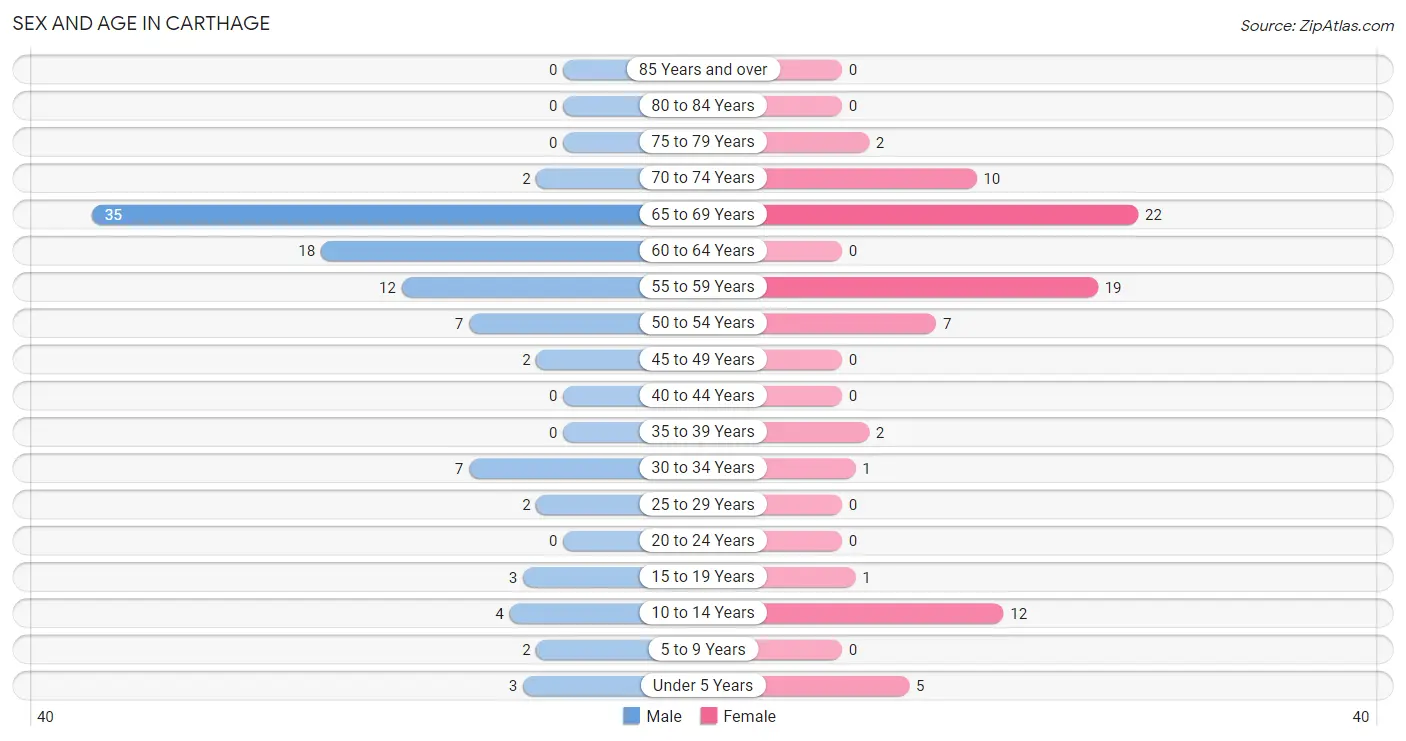
| Age Bracket | Male | Female |
| Under 5 Years | 3 (3.1%) | 5 (6.2%) |
| 5 to 9 Years | 2 (2.1%) | 0 (0.0%) |
| 10 to 14 Years | 4 (4.1%) | 12 (14.8%) |
| 15 to 19 Years | 3 (3.1%) | 1 (1.2%) |
| 20 to 24 Years | 0 (0.0%) | 0 (0.0%) |
| 25 to 29 Years | 2 (2.1%) | 0 (0.0%) |
| 30 to 34 Years | 7 (7.2%) | 1 (1.2%) |
| 35 to 39 Years | 0 (0.0%) | 2 (2.5%) |
| 40 to 44 Years | 0 (0.0%) | 0 (0.0%) |
| 45 to 49 Years | 2 (2.1%) | 0 (0.0%) |
| 50 to 54 Years | 7 (7.2%) | 7 (8.6%) |
| 55 to 59 Years | 12 (12.4%) | 19 (23.5%) |
| 60 to 64 Years | 18 (18.6%) | 0 (0.0%) |
| 65 to 69 Years | 35 (36.1%) | 22 (27.2%) |
| 70 to 74 Years | 2 (2.1%) | 10 (12.3%) |
| 75 to 79 Years | 0 (0.0%) | 2 (2.5%) |
| 80 to 84 Years | 0 (0.0%) | 0 (0.0%) |
| 85 Years and over | 0 (0.0%) | 0 (0.0%) |
| Total | 97 (100.0%) | 81 (100.0%) |
Families and Households in Carthage
Median Family Size in Carthage
The median family size in Carthage is 2.98 persons per family, with single male/father families (5 | 11.4%) accounting for the largest median family size of 4.2 persons per family. On the other hand, married-couple families (29 | 65.9%) represent the smallest median family size with 2.76 persons per family.
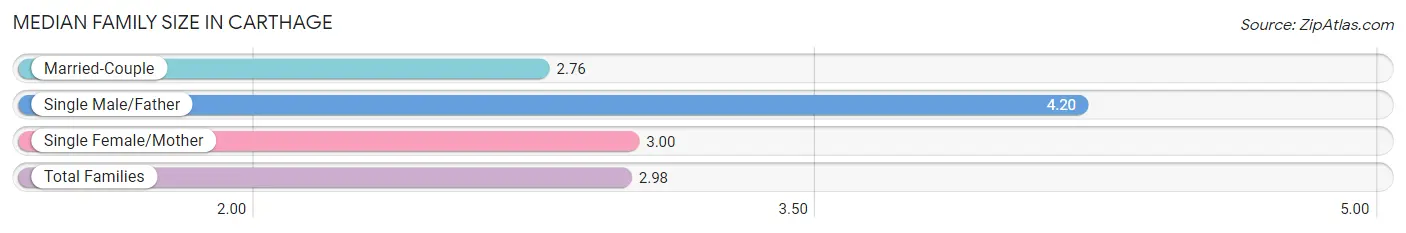
| Family Type | # Families | Family Size |
| Married-Couple | 29 (65.9%) | 2.76 |
| Single Male/Father | 5 (11.4%) | 4.20 |
| Single Female/Mother | 10 (22.7%) | 3.00 |
| Total Families | 44 (100.0%) | 2.98 |
Median Household Size in Carthage
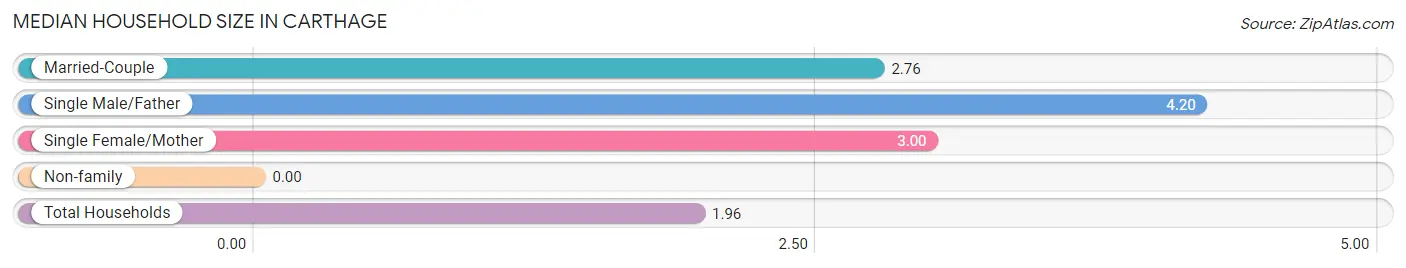
| Household Type | # Households | Household Size |
| Married-Couple | 29 (31.9%) | 2.76 |
| Single Male/Father | 5 (5.5%) | 4.20 |
| Single Female/Mother | 10 (11.0%) | 3.00 |
| Non-family | 47 (51.6%) | - |
| Total Households | 91 (100.0%) | 1.96 |
Household Size by Marriage Status in Carthage
Out of a total of 91 households in Carthage, 44 (48.3%) are family households, while 47 (51.6%) are nonfamily households. The most numerous type of family households are 2-person households, comprising 38, and the most common type of nonfamily households are 1-person households, comprising 47.
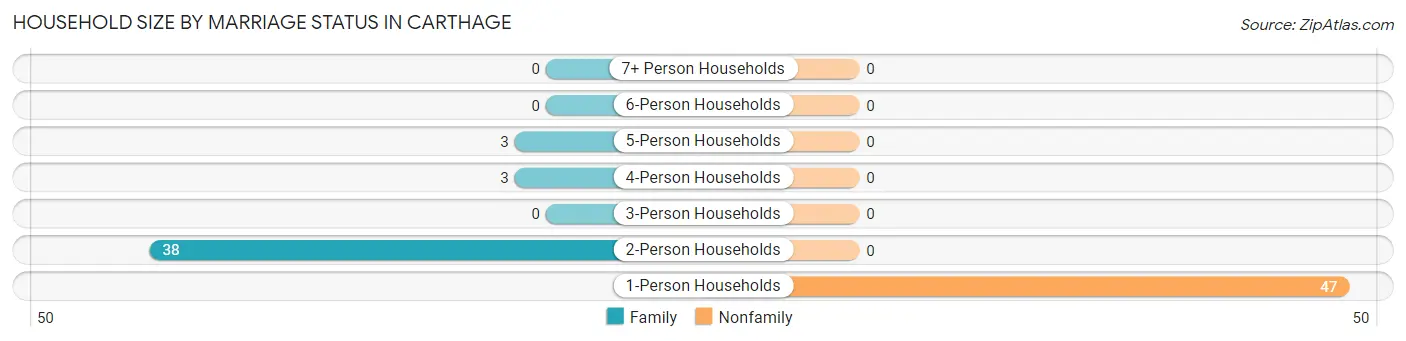
| Household Size | Family Households | Nonfamily Households |
| 1-Person Households | - | 47 (51.6%) |
| 2-Person Households | 38 (41.8%) | 0 (0.0%) |
| 3-Person Households | 0 (0.0%) | 0 (0.0%) |
| 4-Person Households | 3 (3.3%) | 0 (0.0%) |
| 5-Person Households | 3 (3.3%) | 0 (0.0%) |
| 6-Person Households | 0 (0.0%) | 0 (0.0%) |
| 7+ Person Households | 0 (0.0%) | 0 (0.0%) |
| Total | 44 (48.3%) | 47 (51.6%) |
Female Fertility in Carthage
Fertility by Age in Carthage
| Age Bracket | Women with Births | Births / 1,000 Women |
| 15 to 19 years | 0 (0.0%) | 0.0 |
| 20 to 34 years | 0 (0.0%) | 0.0 |
| 35 to 50 years | 0 (0.0%) | 0.0 |
| Total | 0 (0.0%) | 0.0 |
Fertility by Age by Marriage Status in Carthage
| Age Bracket | Married | Unmarried |
| 15 to 19 years | 0 (0.0%) | 0 (0.0%) |
| 20 to 34 years | 0 (0.0%) | 0 (0.0%) |
| 35 to 50 years | 0 (0.0%) | 0 (0.0%) |
| Total | 0 (0.0%) | 0 (0.0%) |
Fertility by Education in Carthage
| Educational Attainment | Women with Births | Births / 1,000 Women |
| Less than High School | 0 (0.0%) | 0.0 |
| High School Diploma | 0 (0.0%) | 0.0 |
| College or Associate's Degree | 0 (0.0%) | 0.0 |
| Bachelor's Degree | 0 (0.0%) | 0.0 |
| Graduate Degree | 0 (0.0%) | 0.0 |
| Total | 0 (0.0%) | 0.0 |
Fertility by Education by Marriage Status in Carthage
| Educational Attainment | Married | Unmarried |
| Less than High School | 0 (0.0%) | 0 (0.0%) |
| High School Diploma | 0 (0.0%) | 0 (0.0%) |
| College or Associate's Degree | 0 (0.0%) | 0 (0.0%) |
| Bachelor's Degree | 0 (0.0%) | 0 (0.0%) |
| Graduate Degree | 0 (0.0%) | 0 (0.0%) |
| Total | 0 (0.0%) | 0 (0.0%) |
Employment Characteristics in Carthage
Employment by Class of Employer in Carthage
Among the 49 employed individuals in Carthage, private company employees (36 | 73.5%), state government employees (4 | 8.2%), and not-for-profit organizations (3 | 6.1%) make up the most common classes of employment.
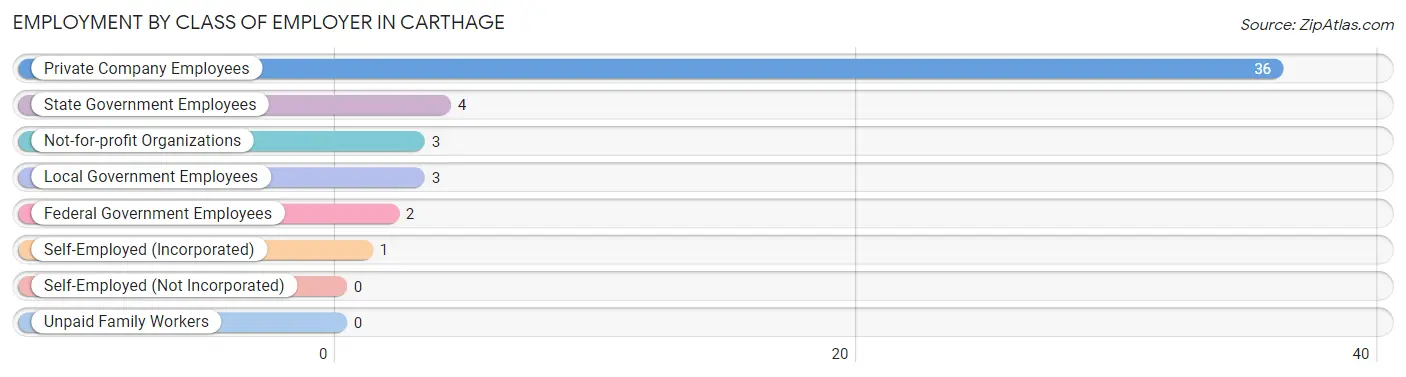
| Employer Class | # Employees | % Employees |
| Private Company Employees | 36 | 73.5% |
| Self-Employed (Incorporated) | 1 | 2.0% |
| Self-Employed (Not Incorporated) | 0 | 0.0% |
| Not-for-profit Organizations | 3 | 6.1% |
| Local Government Employees | 3 | 6.1% |
| State Government Employees | 4 | 8.2% |
| Federal Government Employees | 2 | 4.1% |
| Unpaid Family Workers | 0 | 0.0% |
| Total | 49 | 100.0% |
Employment Status by Age in Carthage
According to the labor force statistics for Carthage, out of the total population over 16 years of age (149), 34.2% or 51 individuals are in the labor force, with 3.9% or 2 of them unemployed. The age group with the highest labor force participation rate is 16 to 19 years, with 100.0% or 1 individuals in the labor force. Within the labor force, the 25 to 29 years age range has the highest percentage of unemployed individuals, with 100.0% or 2 of them being unemployed.
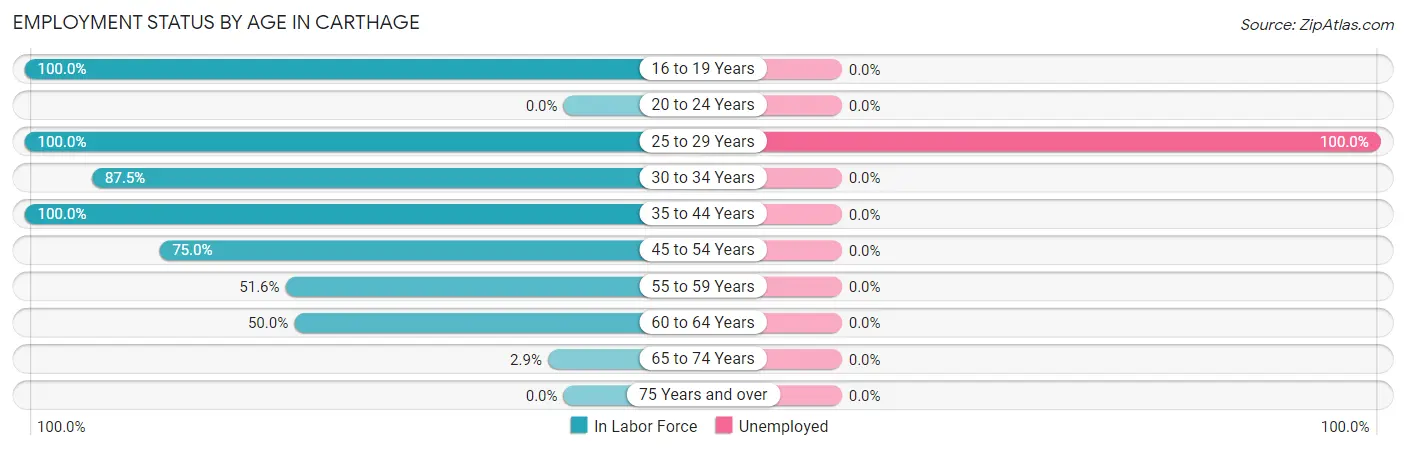
| Age Bracket | In Labor Force | Unemployed |
| 16 to 19 Years | 1 (100.0%) | 0 (0.0%) |
| 20 to 24 Years | 0 (0.0%) | 0 (0.0%) |
| 25 to 29 Years | 2 (100.0%) | 2 (100.0%) |
| 30 to 34 Years | 7 (87.5%) | 0 (0.0%) |
| 35 to 44 Years | 2 (100.0%) | 0 (0.0%) |
| 45 to 54 Years | 12 (75.0%) | 0 (0.0%) |
| 55 to 59 Years | 16 (51.6%) | 0 (0.0%) |
| 60 to 64 Years | 9 (50.0%) | 0 (0.0%) |
| 65 to 74 Years | 2 (2.9%) | 0 (0.0%) |
| 75 Years and over | 0 (0.0%) | 0 (0.0%) |
| Total | 51 (34.2%) | 2 (3.9%) |
Employment Status by Educational Attainment in Carthage
According to labor force statistics for Carthage, 62.3% of individuals (48) out of the total population between 25 and 64 years of age (77) are in the labor force, with 4.2% or 2 of them being unemployed. The group with the highest labor force participation rate are those with the educational attainment of college / associate degree, with 68.4% or 13 individuals in the labor force. Within the labor force, individuals with high school diploma education have the highest percentage of unemployment, with 5.7% or 2 of them being unemployed.
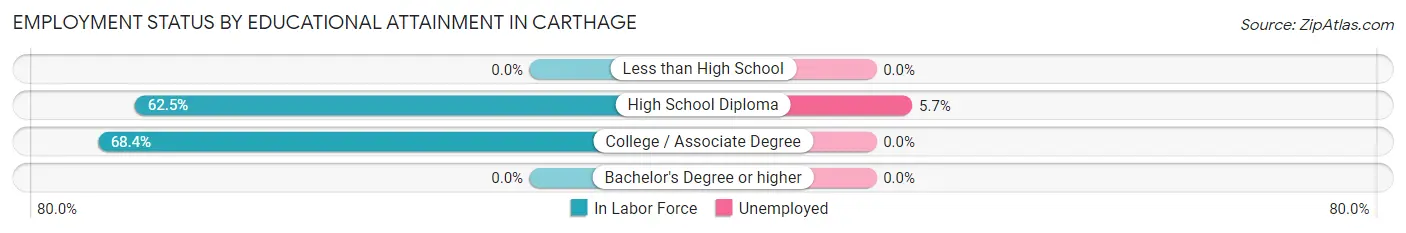
| Educational Attainment | In Labor Force | Unemployed |
| Less than High School | 0 (0.0%) | 0 (0.0%) |
| High School Diploma | 35 (62.5%) | 3 (5.7%) |
| College / Associate Degree | 13 (68.4%) | 0 (0.0%) |
| Bachelor's Degree or higher | 0 (0.0%) | 0 (0.0%) |
| Total | 48 (62.3%) | 3 (4.2%) |
Employment Occupations by Sex in Carthage
Management, Business, Science and Arts Occupations
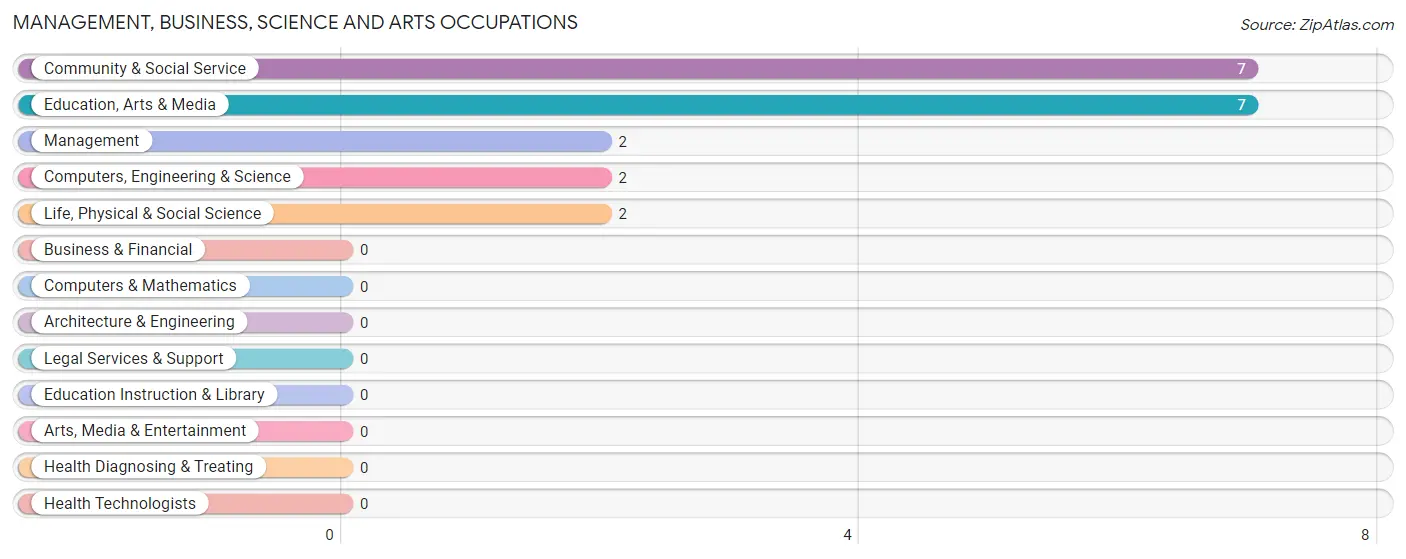
The most common Management, Business, Science and Arts occupations in Carthage are Community & Social Service (7 | 14.3%), Education, Arts & Media (7 | 14.3%), Management (2 | 4.1%), Computers, Engineering & Science (2 | 4.1%), and Life, Physical & Social Science (2 | 4.1%).
Management, Business, Science and Arts Occupations by Sex
Within the Management, Business, Science and Arts occupations in Carthage, the most male-oriented occupations are Management (100.0%), Computers, Engineering & Science (100.0%), and Life, Physical & Social Science (100.0%), while the most female-oriented occupations are Community & Social Service (57.1%), and Education, Arts & Media (57.1%).
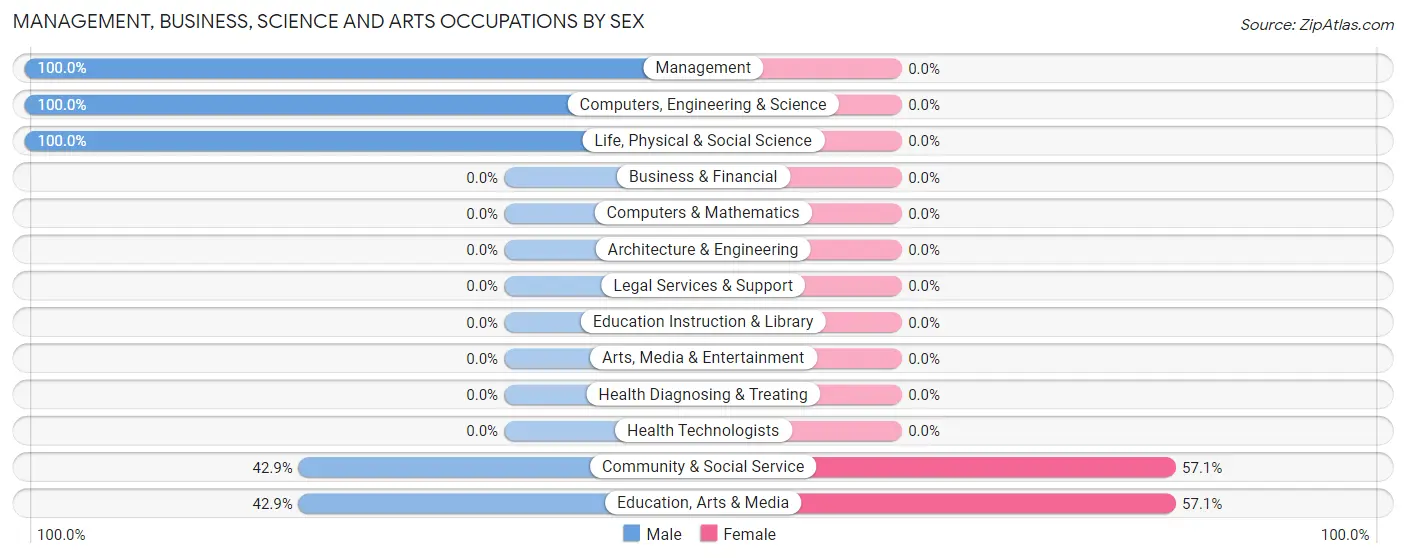
| Occupation | Male | Female |
| Management | 2 (100.0%) | 0 (0.0%) |
| Business & Financial | 0 (0.0%) | 0 (0.0%) |
| Computers, Engineering & Science | 2 (100.0%) | 0 (0.0%) |
| Computers & Mathematics | 0 (0.0%) | 0 (0.0%) |
| Architecture & Engineering | 0 (0.0%) | 0 (0.0%) |
| Life, Physical & Social Science | 2 (100.0%) | 0 (0.0%) |
| Community & Social Service | 3 (42.9%) | 4 (57.1%) |
| Education, Arts & Media | 3 (42.9%) | 4 (57.1%) |
| Legal Services & Support | 0 (0.0%) | 0 (0.0%) |
| Education Instruction & Library | 0 (0.0%) | 0 (0.0%) |
| Arts, Media & Entertainment | 0 (0.0%) | 0 (0.0%) |
| Health Diagnosing & Treating | 0 (0.0%) | 0 (0.0%) |
| Health Technologists | 0 (0.0%) | 0 (0.0%) |
| Total (Category) | 7 (63.6%) | 4 (36.4%) |
| Total (Overall) | 29 (59.2%) | 20 (40.8%) |
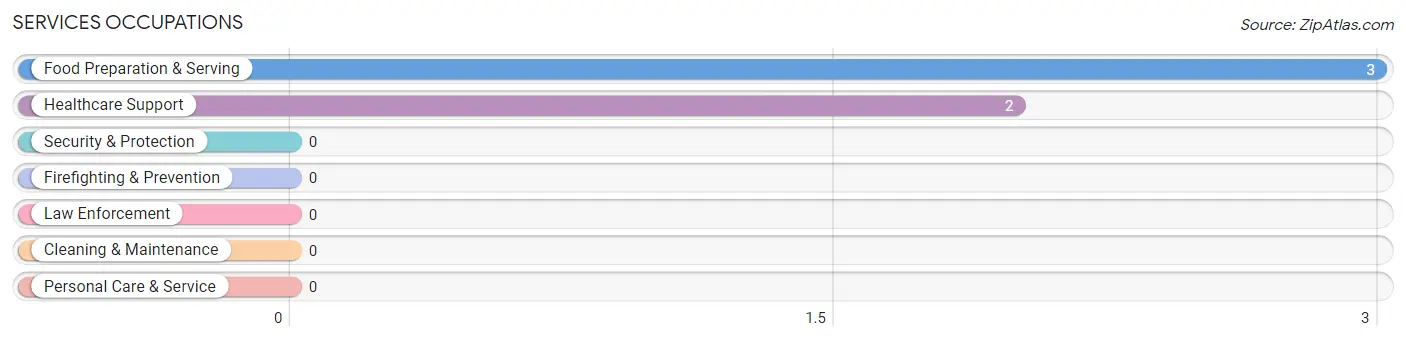
Services Occupations
The most common Services occupations in Carthage are Food Preparation & Serving (3 | 6.1%), and Healthcare Support (2 | 4.1%).
Services Occupations by Sex
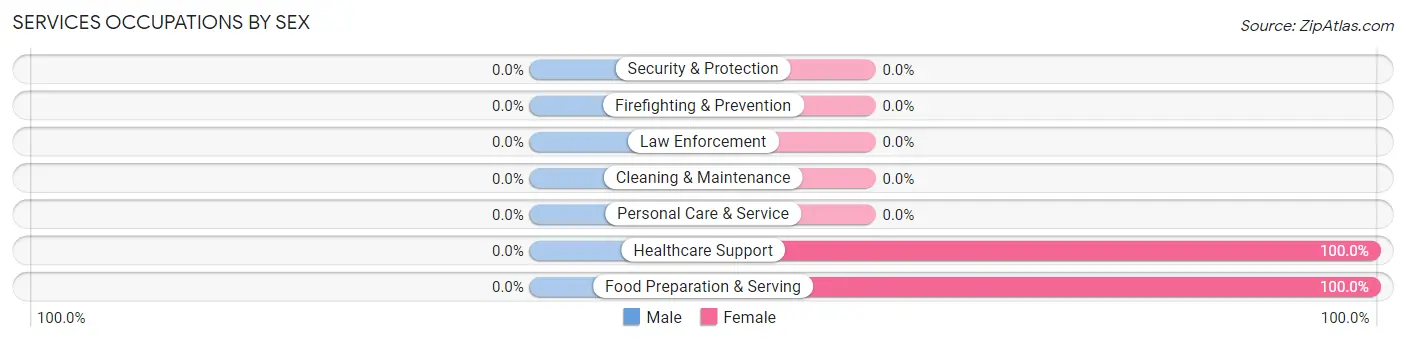
| Occupation | Male | Female |
| Healthcare Support | 0 (0.0%) | 2 (100.0%) |
| Security & Protection | 0 (0.0%) | 0 (0.0%) |
| Firefighting & Prevention | 0 (0.0%) | 0 (0.0%) |
| Law Enforcement | 0 (0.0%) | 0 (0.0%) |
| Food Preparation & Serving | 0 (0.0%) | 3 (100.0%) |
| Cleaning & Maintenance | 0 (0.0%) | 0 (0.0%) |
| Personal Care & Service | 0 (0.0%) | 0 (0.0%) |
| Total (Category) | 0 (0.0%) | 5 (100.0%) |
| Total (Overall) | 29 (59.2%) | 20 (40.8%) |
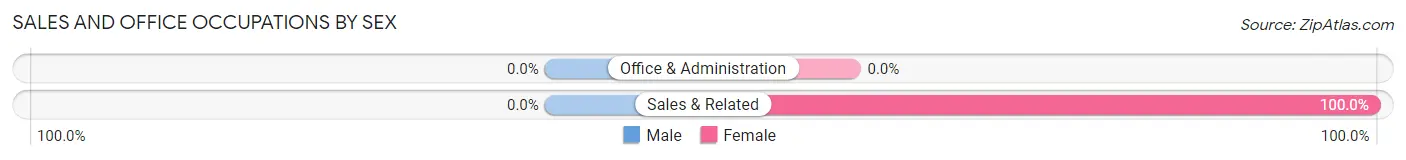
Sales and Office Occupations
The most common Sales and Office occupations in Carthage are , and Sales & Related (2 | 4.1%).
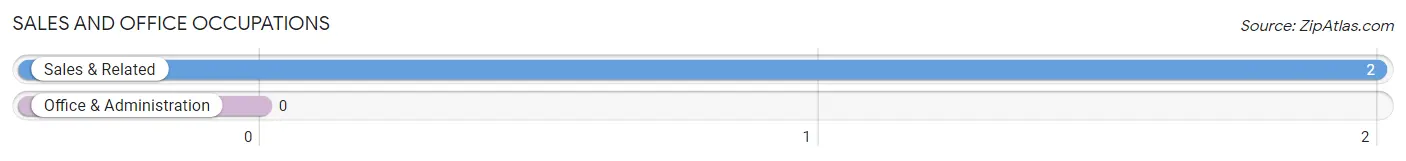
Sales and Office Occupations by Sex
| Occupation | Male | Female |
| Sales & Related | 0 (0.0%) | 2 (100.0%) |
| Office & Administration | 0 (0.0%) | 0 (0.0%) |
| Total (Category) | 0 (0.0%) | 2 (100.0%) |
| Total (Overall) | 29 (59.2%) | 20 (40.8%) |
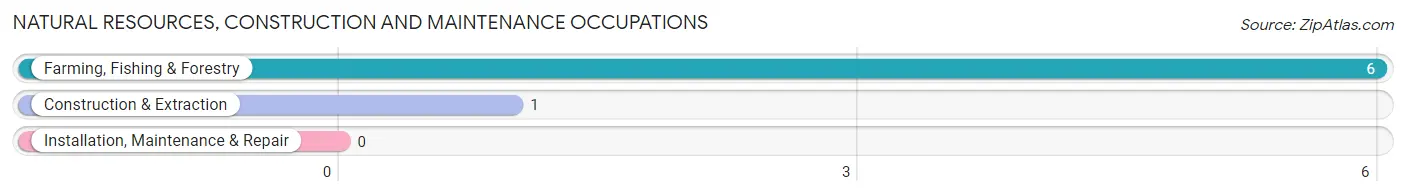
Natural Resources, Construction and Maintenance Occupations
The most common Natural Resources, Construction and Maintenance occupations in Carthage are Farming, Fishing & Forestry (6 | 12.2%), and Construction & Extraction (1 | 2.0%).
Natural Resources, Construction and Maintenance Occupations by Sex
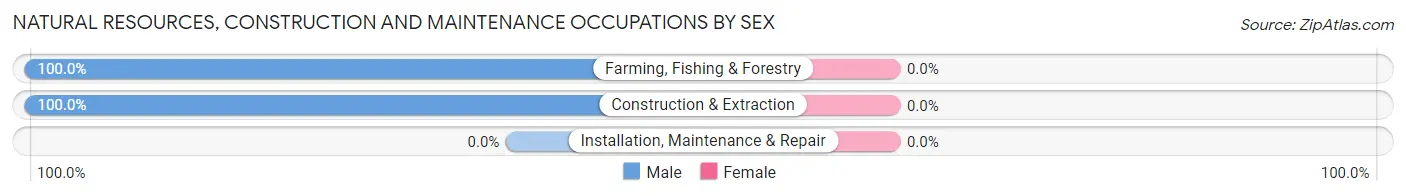
| Occupation | Male | Female |
| Farming, Fishing & Forestry | 6 (100.0%) | 0 (0.0%) |
| Construction & Extraction | 1 (100.0%) | 0 (0.0%) |
| Installation, Maintenance & Repair | 0 (0.0%) | 0 (0.0%) |
| Total (Category) | 7 (100.0%) | 0 (0.0%) |
| Total (Overall) | 29 (59.2%) | 20 (40.8%) |
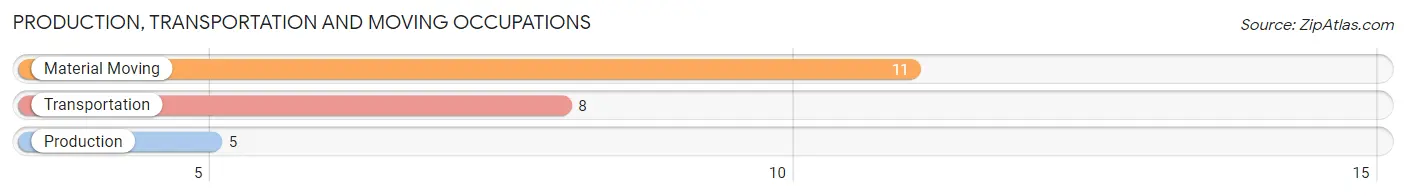
Production, Transportation and Moving Occupations
The most common Production, Transportation and Moving occupations in Carthage are Material Moving (11 | 22.5%), Transportation (8 | 16.3%), and Production (5 | 10.2%).
Production, Transportation and Moving Occupations by Sex
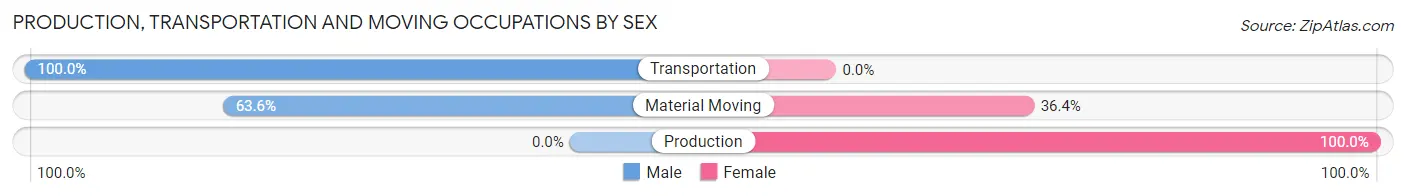
| Occupation | Male | Female |
| Production | 0 (0.0%) | 5 (100.0%) |
| Transportation | 8 (100.0%) | 0 (0.0%) |
| Material Moving | 7 (63.6%) | 4 (36.4%) |
| Total (Category) | 15 (62.5%) | 9 (37.5%) |
| Total (Overall) | 29 (59.2%) | 20 (40.8%) |
Employment Industries by Sex in Carthage
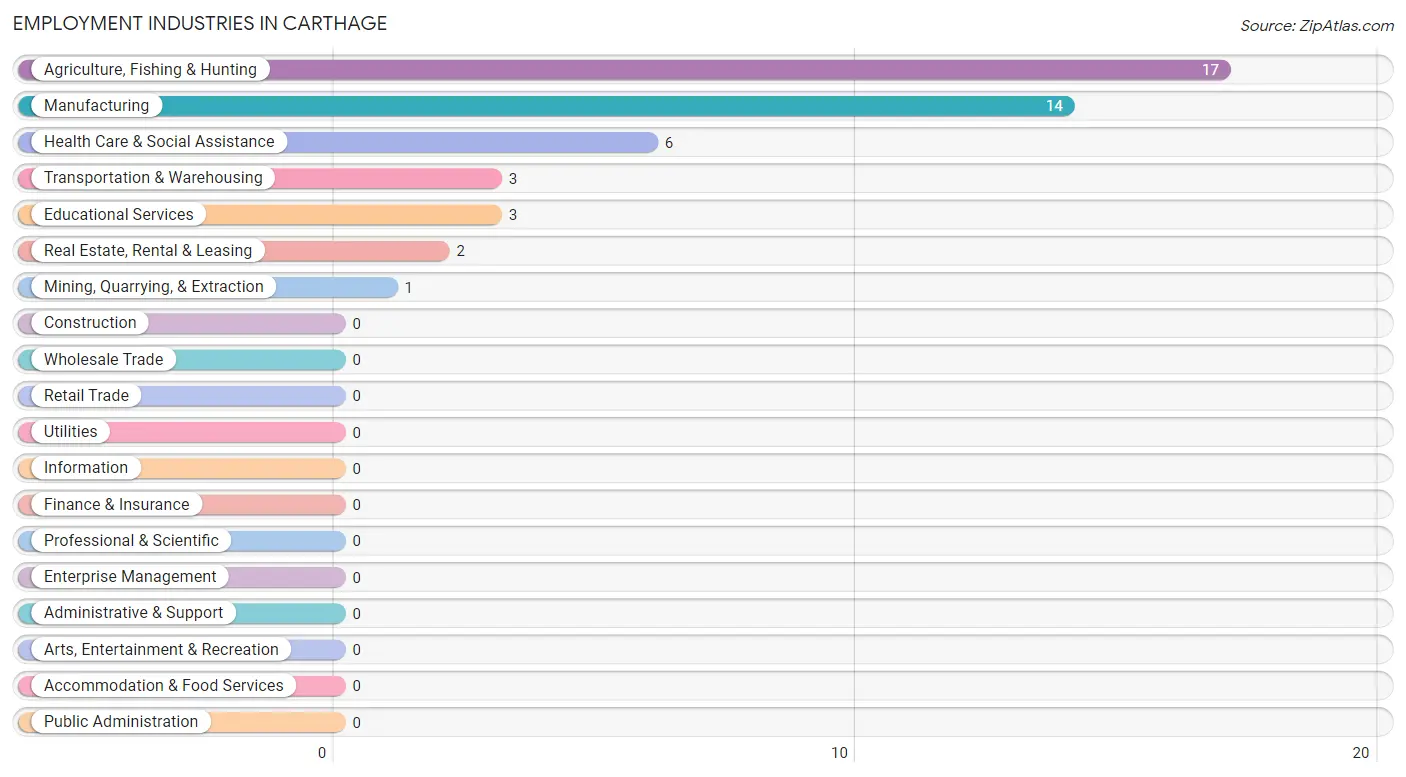
Employment Industries in Carthage
The major employment industries in Carthage include Agriculture, Fishing & Hunting (17 | 34.7%), Manufacturing (14 | 28.6%), Health Care & Social Assistance (6 | 12.2%), Transportation & Warehousing (3 | 6.1%), and Educational Services (3 | 6.1%).
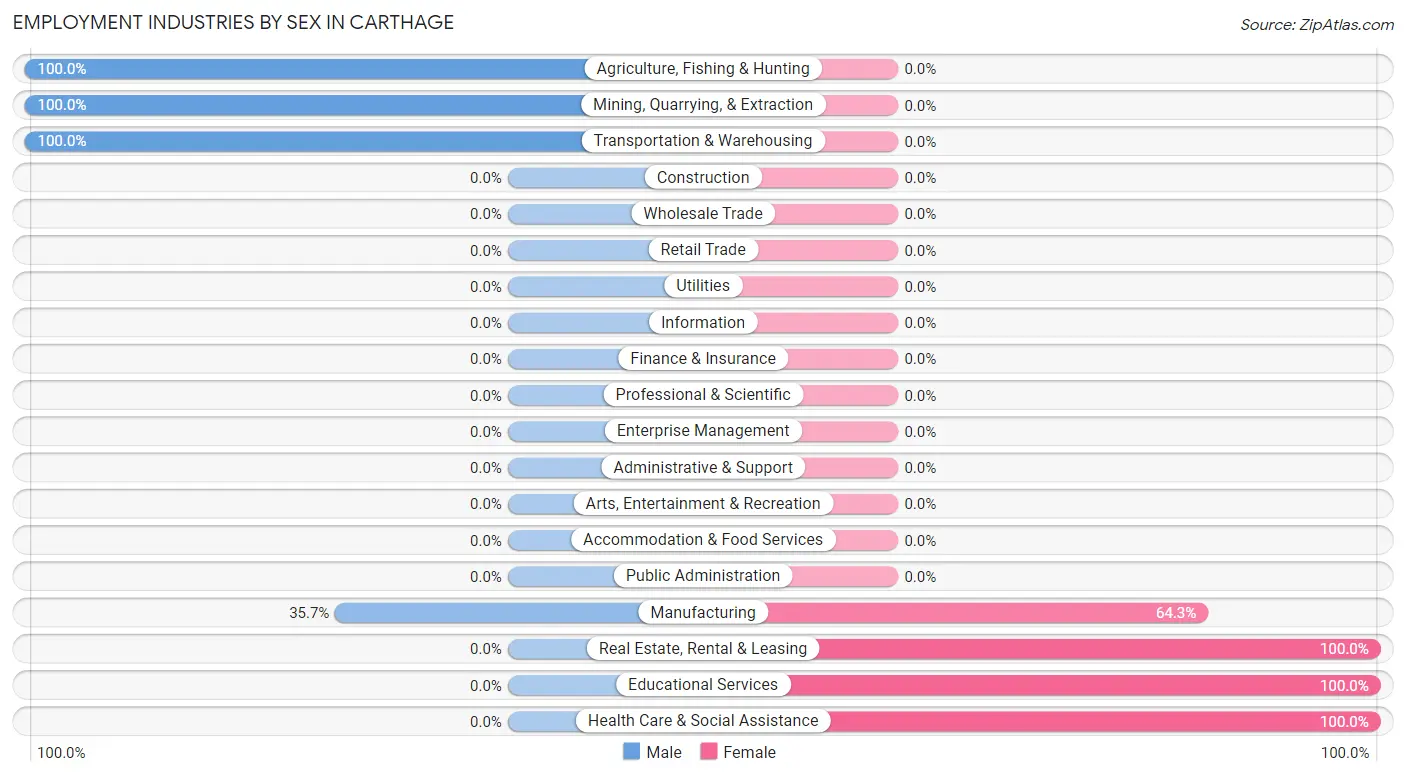
Employment Industries by Sex in Carthage
The Carthage industries that see more men than women are Agriculture, Fishing & Hunting (100.0%), Mining, Quarrying, & Extraction (100.0%), and Transportation & Warehousing (100.0%), whereas the industries that tend to have a higher number of women are Real Estate, Rental & Leasing (100.0%), Educational Services (100.0%), and Health Care & Social Assistance (100.0%).
| Industry | Male | Female |
| Agriculture, Fishing & Hunting | 17 (100.0%) | 0 (0.0%) |
| Mining, Quarrying, & Extraction | 1 (100.0%) | 0 (0.0%) |
| Construction | 0 (0.0%) | 0 (0.0%) |
| Manufacturing | 5 (35.7%) | 9 (64.3%) |
| Wholesale Trade | 0 (0.0%) | 0 (0.0%) |
| Retail Trade | 0 (0.0%) | 0 (0.0%) |
| Transportation & Warehousing | 3 (100.0%) | 0 (0.0%) |
| Utilities | 0 (0.0%) | 0 (0.0%) |
| Information | 0 (0.0%) | 0 (0.0%) |
| Finance & Insurance | 0 (0.0%) | 0 (0.0%) |
| Real Estate, Rental & Leasing | 0 (0.0%) | 2 (100.0%) |
| Professional & Scientific | 0 (0.0%) | 0 (0.0%) |
| Enterprise Management | 0 (0.0%) | 0 (0.0%) |
| Administrative & Support | 0 (0.0%) | 0 (0.0%) |
| Educational Services | 0 (0.0%) | 3 (100.0%) |
| Health Care & Social Assistance | 0 (0.0%) | 6 (100.0%) |
| Arts, Entertainment & Recreation | 0 (0.0%) | 0 (0.0%) |
| Accommodation & Food Services | 0 (0.0%) | 0 (0.0%) |
| Public Administration | 0 (0.0%) | 0 (0.0%) |
| Total | 29 (59.2%) | 20 (40.8%) |
Education in Carthage
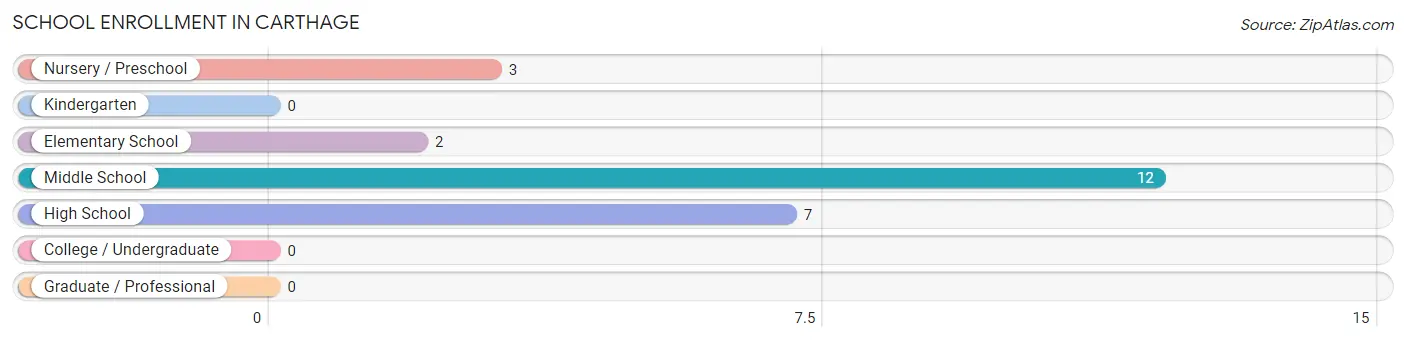
School Enrollment in Carthage
The most common levels of schooling among the 24 students in Carthage are middle school (12 | 50.0%), high school (7 | 29.2%), and nursery / preschool (3 | 12.5%).
| School Level | # Students | % Students |
| Nursery / Preschool | 3 | 12.5% |
| Kindergarten | 0 | 0.0% |
| Elementary School | 2 | 8.3% |
| Middle School | 12 | 50.0% |
| High School | 7 | 29.2% |
| College / Undergraduate | 0 | 0.0% |
| Graduate / Professional | 0 | 0.0% |
| Total | 24 | 100.0% |
School Enrollment by Age by Funding Source in Carthage
Out of a total of 24 students who are enrolled in schools in Carthage, 3 (12.5%) attend a private institution, while the remaining 21 (87.5%) are enrolled in public schools. The age group of 5 to 9 year old has the highest likelihood of being enrolled in private schools, with 2 (100.0% in the age bracket) enrolled. Conversely, the age group of 3 to 4 year olds has the lowest likelihood of being enrolled in a private school, with 3 (100.0% in the age bracket) attending a public institution.
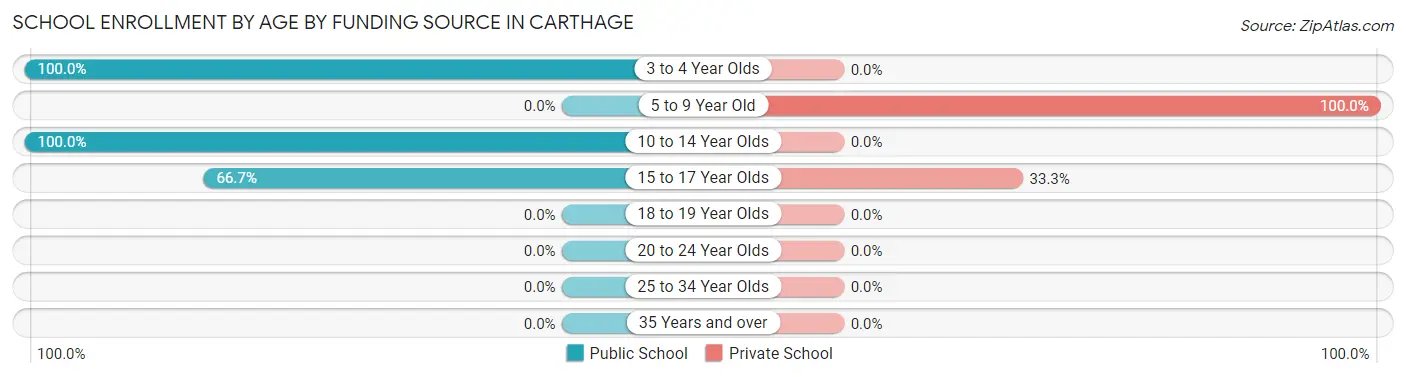
| Age Bracket | Public School | Private School |
| 3 to 4 Year Olds | 3 (100.0%) | 0 (0.0%) |
| 5 to 9 Year Old | 0 (0.0%) | 2 (100.0%) |
| 10 to 14 Year Olds | 16 (100.0%) | 0 (0.0%) |
| 15 to 17 Year Olds | 2 (66.7%) | 1 (33.3%) |
| 18 to 19 Year Olds | 0 (0.0%) | 0 (0.0%) |
| 20 to 24 Year Olds | 0 (0.0%) | 0 (0.0%) |
| 25 to 34 Year Olds | 0 (0.0%) | 0 (0.0%) |
| 35 Years and over | 0 (0.0%) | 0 (0.0%) |
| Total | 21 (87.5%) | 3 (12.5%) |
Educational Attainment by Field of Study in Carthage
, and education (2 | 100.0%) are the most common fields of study among 2 individuals in Carthage who have obtained a bachelor's degree or higher.
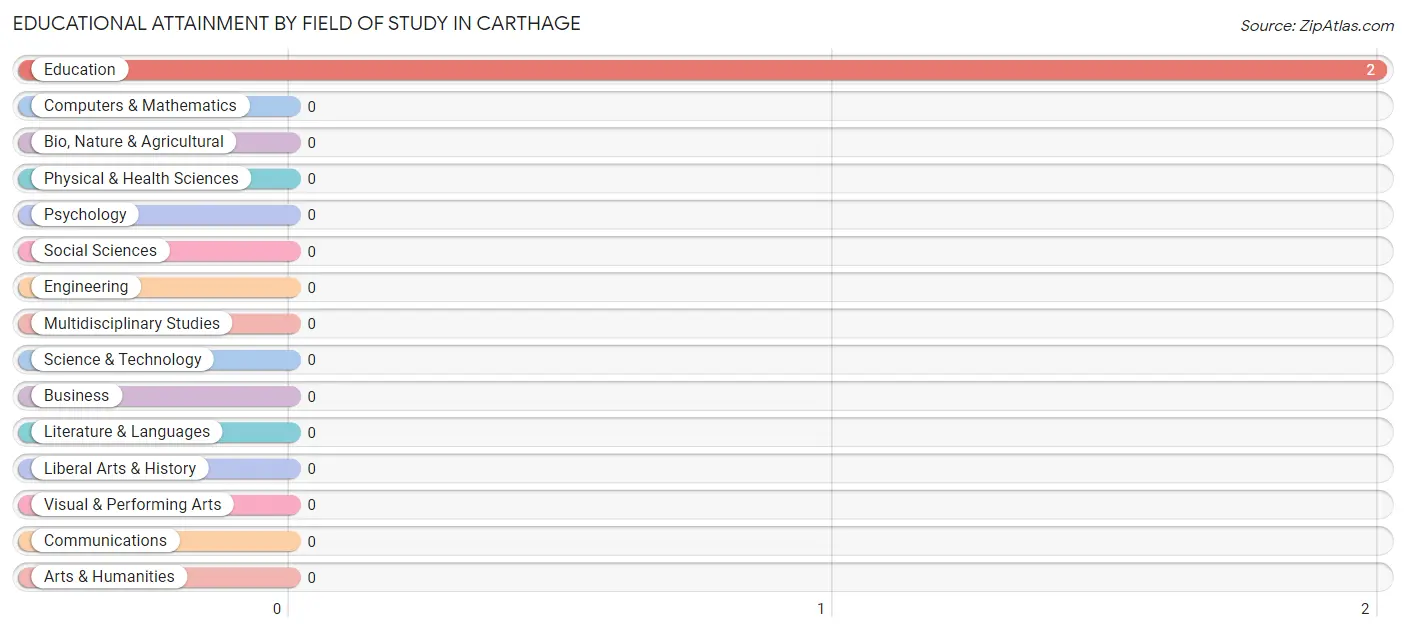
| Field of Study | # Graduates | % Graduates |
| Computers & Mathematics | 0 | 0.0% |
| Bio, Nature & Agricultural | 0 | 0.0% |
| Physical & Health Sciences | 0 | 0.0% |
| Psychology | 0 | 0.0% |
| Social Sciences | 0 | 0.0% |
| Engineering | 0 | 0.0% |
| Multidisciplinary Studies | 0 | 0.0% |
| Science & Technology | 0 | 0.0% |
| Business | 0 | 0.0% |
| Education | 2 | 100.0% |
| Literature & Languages | 0 | 0.0% |
| Liberal Arts & History | 0 | 0.0% |
| Visual & Performing Arts | 0 | 0.0% |
| Communications | 0 | 0.0% |
| Arts & Humanities | 0 | 0.0% |
| Total | 2 | 100.0% |
Transportation & Commute in Carthage
Vehicle Availability by Sex in Carthage
The most prevalent vehicle ownership categories in Carthage are males with 3 vehicles (11, accounting for 37.9%) and females with 3 vehicles (6, making up 55.0%).
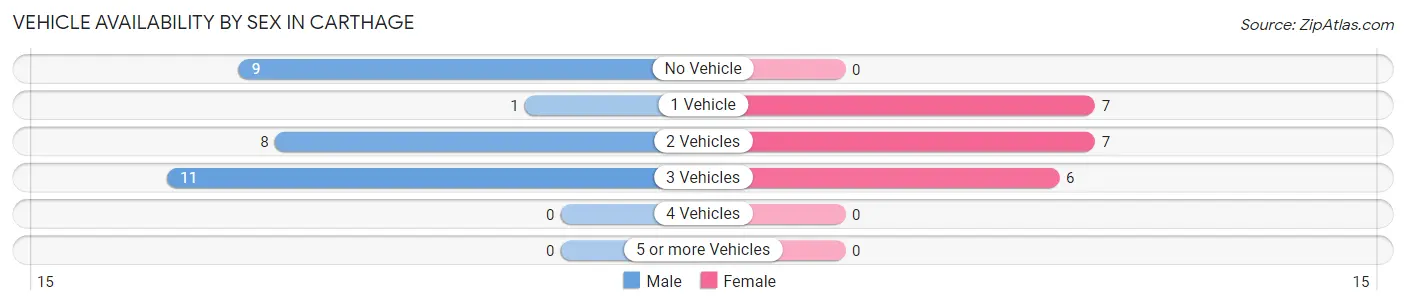
| Vehicles Available | Male | Female |
| No Vehicle | 9 (31.0%) | 0 (0.0%) |
| 1 Vehicle | 1 (3.5%) | 7 (35.0%) |
| 2 Vehicles | 8 (27.6%) | 7 (35.0%) |
| 3 Vehicles | 11 (37.9%) | 6 (30.0%) |
| 4 Vehicles | 0 (0.0%) | 0 (0.0%) |
| 5 or more Vehicles | 0 (0.0%) | 0 (0.0%) |
| Total | 29 (100.0%) | 20 (100.0%) |
Commute Time in Carthage
The most frequently occuring commute durations in Carthage are less than 5 minutes (11 commuters, 22.5%), 10 to 14 minutes (10 commuters, 20.4%), and 30 to 34 minutes (8 commuters, 16.3%).
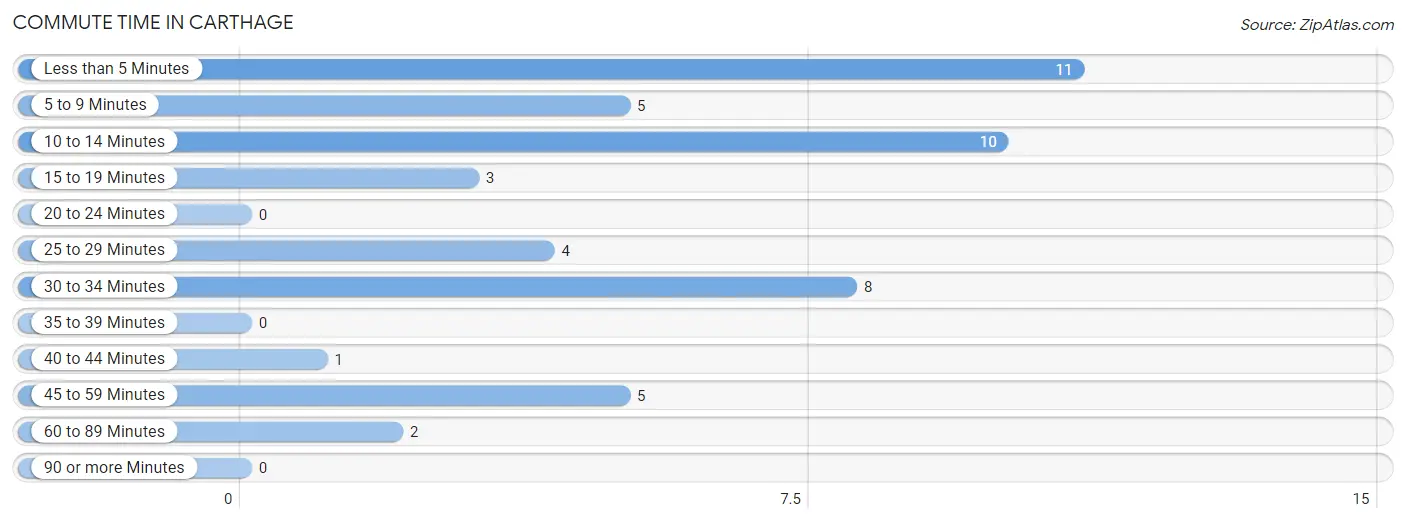
| Commute Time | # Commuters | % Commuters |
| Less than 5 Minutes | 11 | 22.5% |
| 5 to 9 Minutes | 5 | 10.2% |
| 10 to 14 Minutes | 10 | 20.4% |
| 15 to 19 Minutes | 3 | 6.1% |
| 20 to 24 Minutes | 0 | 0.0% |
| 25 to 29 Minutes | 4 | 8.2% |
| 30 to 34 Minutes | 8 | 16.3% |
| 35 to 39 Minutes | 0 | 0.0% |
| 40 to 44 Minutes | 1 | 2.0% |
| 45 to 59 Minutes | 5 | 10.2% |
| 60 to 89 Minutes | 2 | 4.1% |
| 90 or more Minutes | 0 | 0.0% |
Commute Time by Sex in Carthage
The most common commute times in Carthage are less than 5 minutes (11 commuters, 37.9%) for males and 5 to 9 minutes (5 commuters, 25.0%) for females.
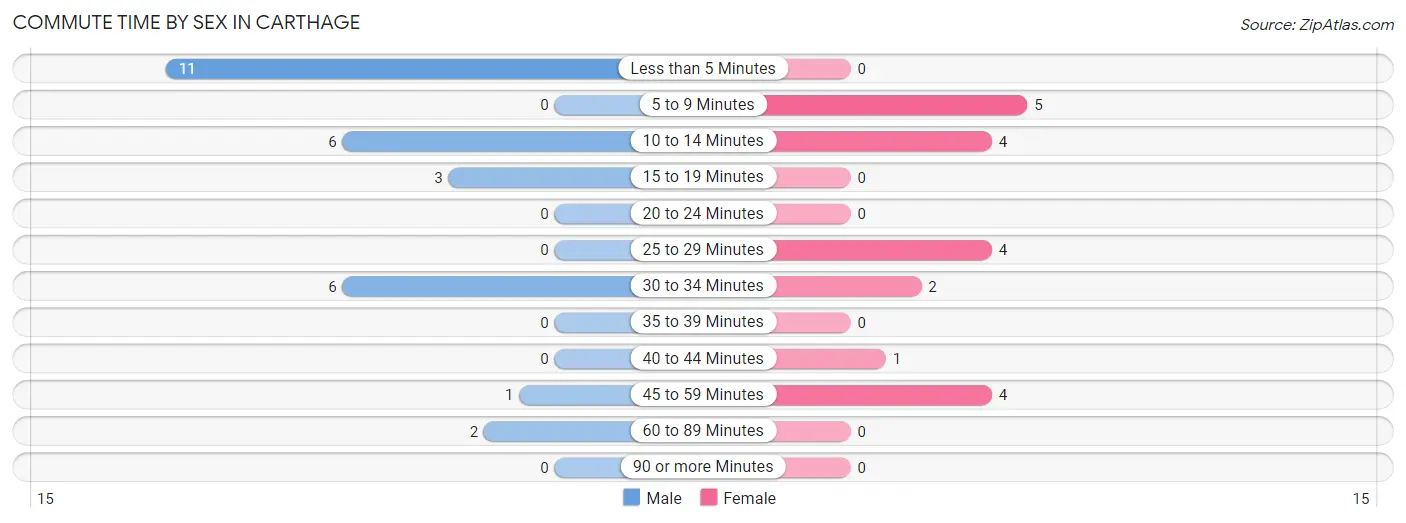
| Commute Time | Male | Female |
| Less than 5 Minutes | 11 (37.9%) | 0 (0.0%) |
| 5 to 9 Minutes | 0 (0.0%) | 5 (25.0%) |
| 10 to 14 Minutes | 6 (20.7%) | 4 (20.0%) |
| 15 to 19 Minutes | 3 (10.3%) | 0 (0.0%) |
| 20 to 24 Minutes | 0 (0.0%) | 0 (0.0%) |
| 25 to 29 Minutes | 0 (0.0%) | 4 (20.0%) |
| 30 to 34 Minutes | 6 (20.7%) | 2 (10.0%) |
| 35 to 39 Minutes | 0 (0.0%) | 0 (0.0%) |
| 40 to 44 Minutes | 0 (0.0%) | 1 (5.0%) |
| 45 to 59 Minutes | 1 (3.5%) | 4 (20.0%) |
| 60 to 89 Minutes | 2 (6.9%) | 0 (0.0%) |
| 90 or more Minutes | 0 (0.0%) | 0 (0.0%) |
Time of Departure to Work by Sex in Carthage
The most frequent times of departure to work in Carthage are 6:00 AM to 6:29 AM (14, 48.3%) for males and 12:00 AM to 4:59 AM (5, 25.0%) for females.
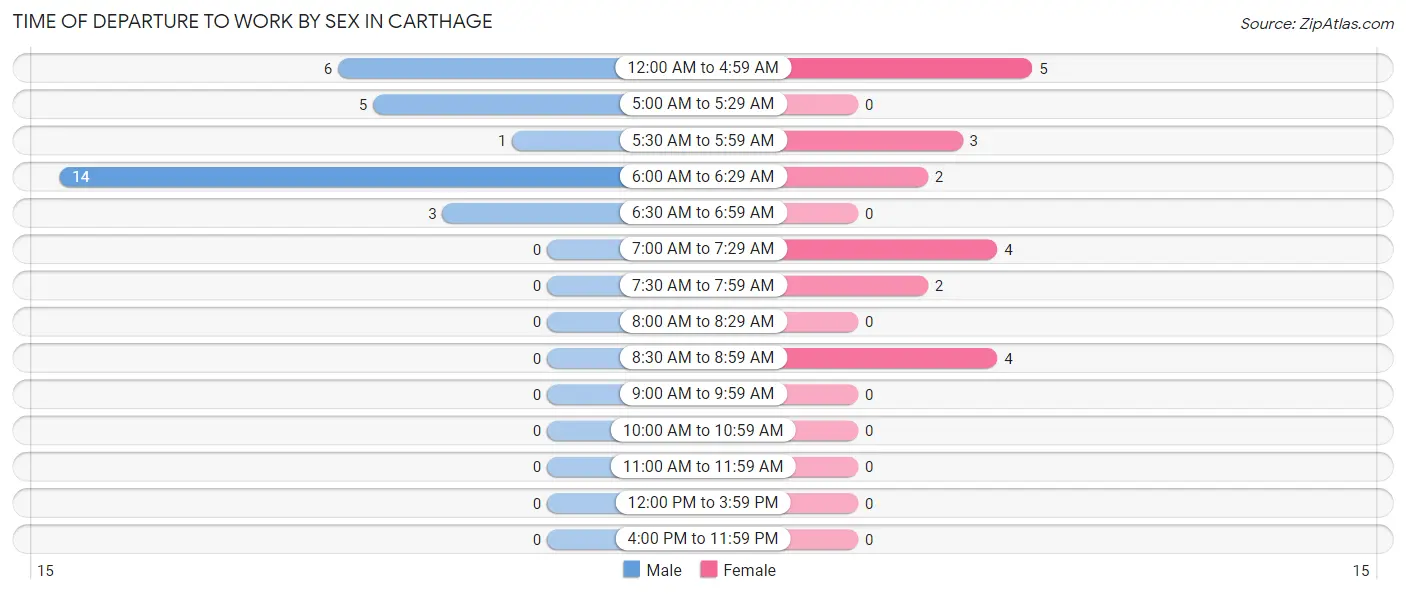
| Time of Departure | Male | Female |
| 12:00 AM to 4:59 AM | 6 (20.7%) | 5 (25.0%) |
| 5:00 AM to 5:29 AM | 5 (17.2%) | 0 (0.0%) |
| 5:30 AM to 5:59 AM | 1 (3.5%) | 3 (15.0%) |
| 6:00 AM to 6:29 AM | 14 (48.3%) | 2 (10.0%) |
| 6:30 AM to 6:59 AM | 3 (10.3%) | 0 (0.0%) |
| 7:00 AM to 7:29 AM | 0 (0.0%) | 4 (20.0%) |
| 7:30 AM to 7:59 AM | 0 (0.0%) | 2 (10.0%) |
| 8:00 AM to 8:29 AM | 0 (0.0%) | 0 (0.0%) |
| 8:30 AM to 8:59 AM | 0 (0.0%) | 4 (20.0%) |
| 9:00 AM to 9:59 AM | 0 (0.0%) | 0 (0.0%) |
| 10:00 AM to 10:59 AM | 0 (0.0%) | 0 (0.0%) |
| 11:00 AM to 11:59 AM | 0 (0.0%) | 0 (0.0%) |
| 12:00 PM to 3:59 PM | 0 (0.0%) | 0 (0.0%) |
| 4:00 PM to 11:59 PM | 0 (0.0%) | 0 (0.0%) |
| Total | 29 (100.0%) | 20 (100.0%) |
Housing Occupancy in Carthage
Occupancy by Ownership in Carthage
Of the total 91 dwellings in Carthage, owner-occupied units account for 66 (72.5%), while renter-occupied units make up 25 (27.5%).
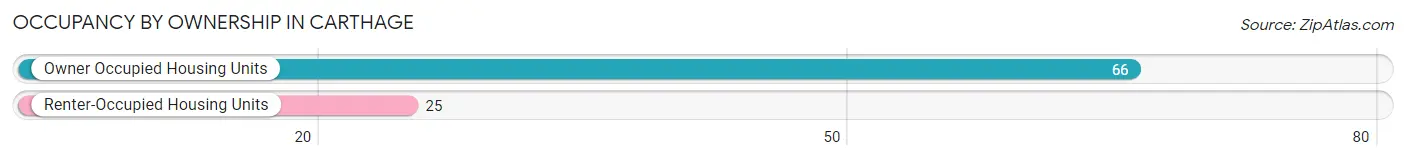
| Occupancy | # Housing Units | % Housing Units |
| Owner Occupied Housing Units | 66 | 72.5% |
| Renter-Occupied Housing Units | 25 | 27.5% |
| Total Occupied Housing Units | 91 | 100.0% |
Occupancy by Household Size in Carthage
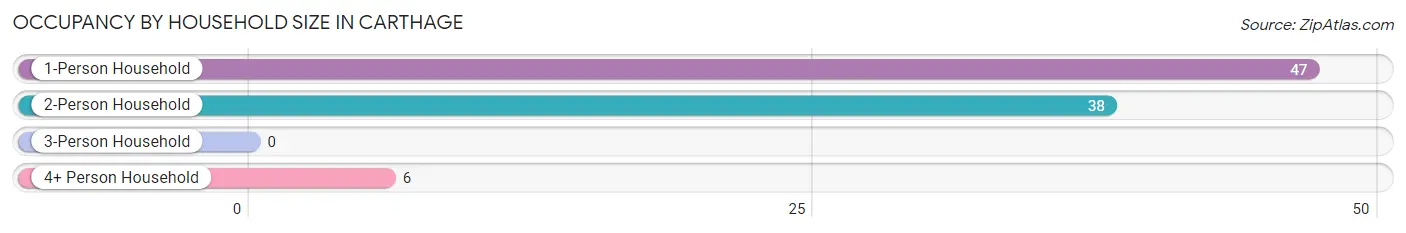
| Household Size | # Housing Units | % Housing Units |
| 1-Person Household | 47 | 51.6% |
| 2-Person Household | 38 | 41.8% |
| 3-Person Household | 0 | 0.0% |
| 4+ Person Household | 6 | 6.6% |
| Total Housing Units | 91 | 100.0% |
Occupancy by Ownership by Household Size in Carthage
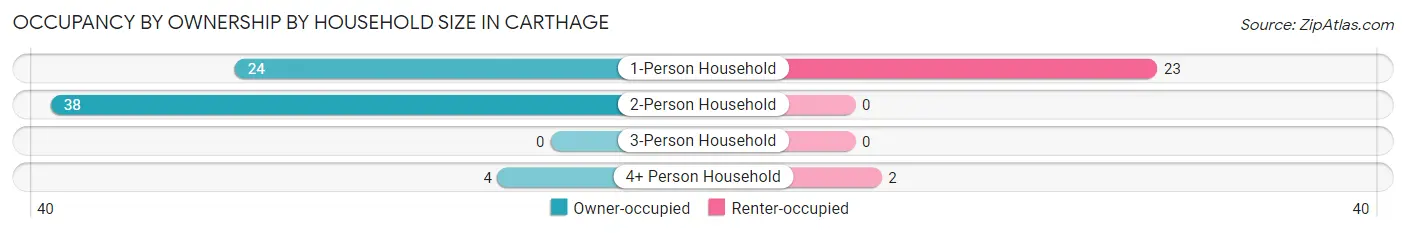
| Household Size | Owner-occupied | Renter-occupied |
| 1-Person Household | 24 (51.1%) | 23 (48.9%) |
| 2-Person Household | 38 (100.0%) | 0 (0.0%) |
| 3-Person Household | 0 (0.0%) | 0 (0.0%) |
| 4+ Person Household | 4 (66.7%) | 2 (33.3%) |
| Total Housing Units | 66 (72.5%) | 25 (27.5%) |
Occupancy by Educational Attainment in Carthage
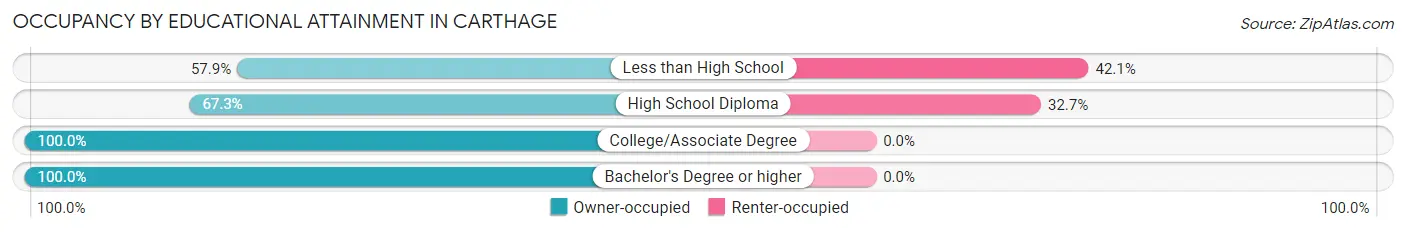
| Household Size | Owner-occupied | Renter-occupied |
| Less than High School | 11 (57.9%) | 8 (42.1%) |
| High School Diploma | 35 (67.3%) | 17 (32.7%) |
| College/Associate Degree | 18 (100.0%) | 0 (0.0%) |
| Bachelor's Degree or higher | 2 (100.0%) | 0 (0.0%) |
Occupancy by Age of Householder in Carthage
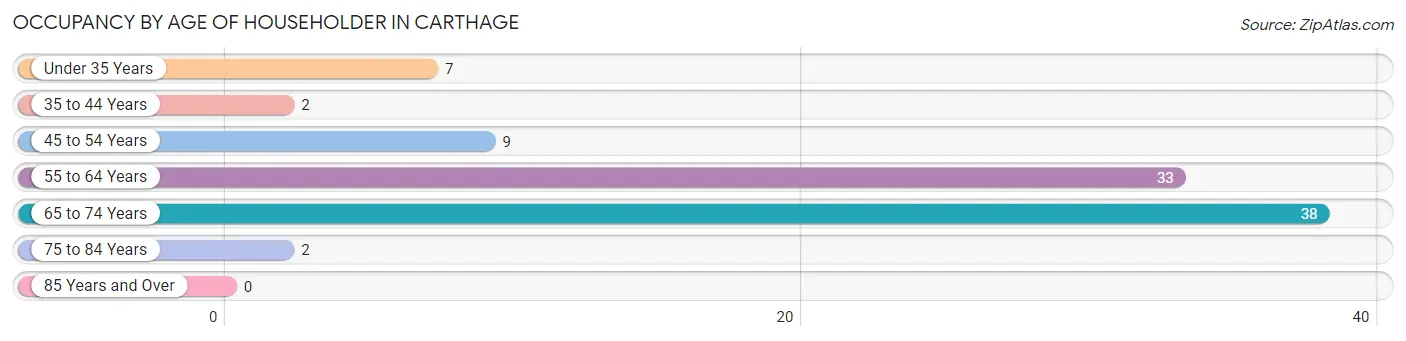
| Age Bracket | # Households | % Households |
| Under 35 Years | 7 | 7.7% |
| 35 to 44 Years | 2 | 2.2% |
| 45 to 54 Years | 9 | 9.9% |
| 55 to 64 Years | 33 | 36.3% |
| 65 to 74 Years | 38 | 41.8% |
| 75 to 84 Years | 2 | 2.2% |
| 85 Years and Over | 0 | 0.0% |
| Total | 91 | 100.0% |
Housing Finances in Carthage
Median Income by Occupancy in Carthage
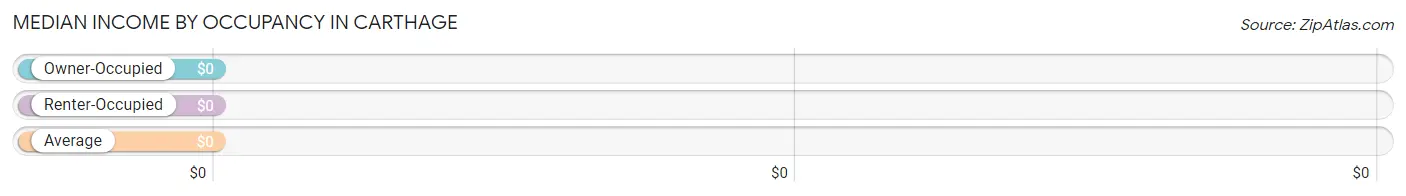
| Occupancy Type | # Households | Median Income |
| Owner-Occupied | 66 (72.5%) | $0 |
| Renter-Occupied | 25 (27.5%) | $0 |
| Average | 91 (100.0%) | $0 |
Occupancy by Householder Income Bracket in Carthage
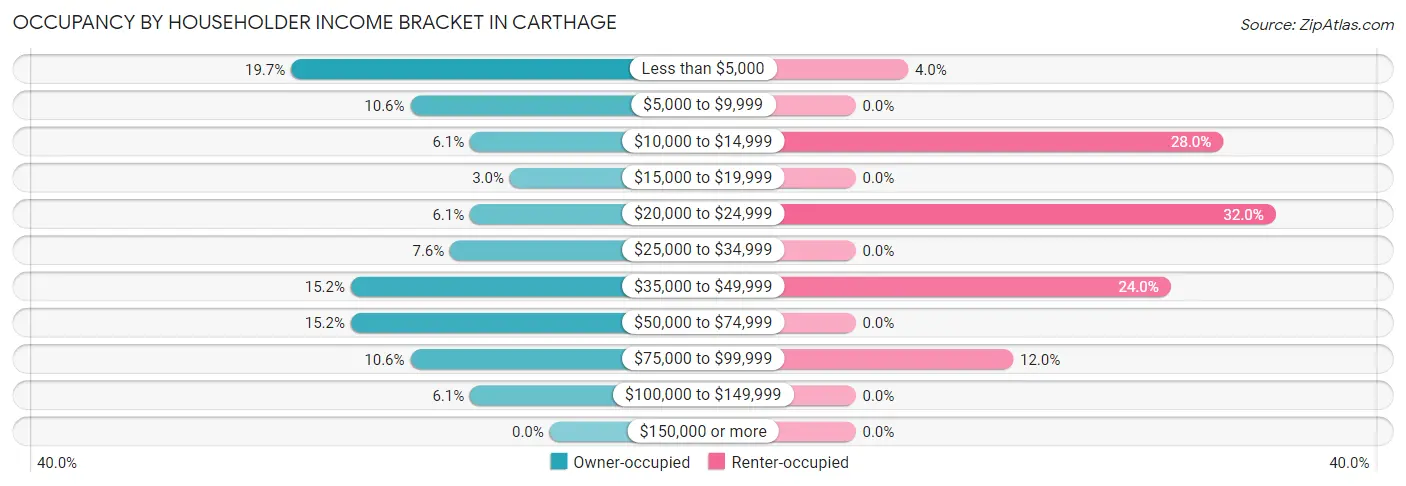
| Income Bracket | Owner-occupied | Renter-occupied |
| Less than $5,000 | 13 (19.7%) | 1 (4.0%) |
| $5,000 to $9,999 | 7 (10.6%) | 0 (0.0%) |
| $10,000 to $14,999 | 4 (6.1%) | 7 (28.0%) |
| $15,000 to $19,999 | 2 (3.0%) | 0 (0.0%) |
| $20,000 to $24,999 | 4 (6.1%) | 8 (32.0%) |
| $25,000 to $34,999 | 5 (7.6%) | 0 (0.0%) |
| $35,000 to $49,999 | 10 (15.1%) | 6 (24.0%) |
| $50,000 to $74,999 | 10 (15.1%) | 0 (0.0%) |
| $75,000 to $99,999 | 7 (10.6%) | 3 (12.0%) |
| $100,000 to $149,999 | 4 (6.1%) | 0 (0.0%) |
| $150,000 or more | 0 (0.0%) | 0 (0.0%) |
| Total | 66 (100.0%) | 25 (100.0%) |
Monthly Housing Cost Tiers in Carthage
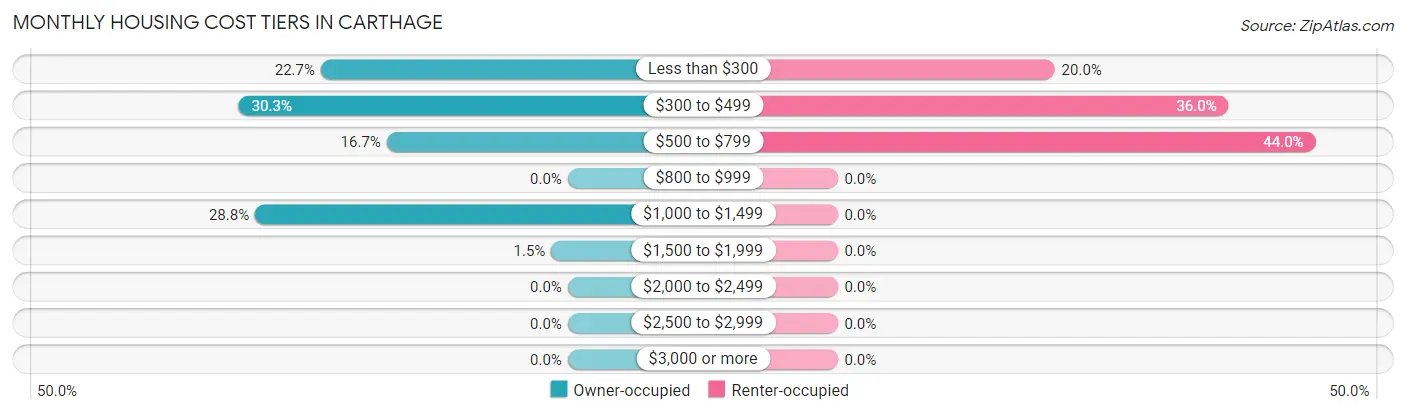
| Monthly Cost | Owner-occupied | Renter-occupied |
| Less than $300 | 15 (22.7%) | 5 (20.0%) |
| $300 to $499 | 20 (30.3%) | 9 (36.0%) |
| $500 to $799 | 11 (16.7%) | 11 (44.0%) |
| $800 to $999 | 0 (0.0%) | 0 (0.0%) |
| $1,000 to $1,499 | 19 (28.8%) | 0 (0.0%) |
| $1,500 to $1,999 | 1 (1.5%) | 0 (0.0%) |
| $2,000 to $2,499 | 0 (0.0%) | 0 (0.0%) |
| $2,500 to $2,999 | 0 (0.0%) | 0 (0.0%) |
| $3,000 or more | 0 (0.0%) | 0 (0.0%) |
| Total | 66 (100.0%) | 25 (100.0%) |
Physical Housing Characteristics in Carthage
Housing Structures in Carthage
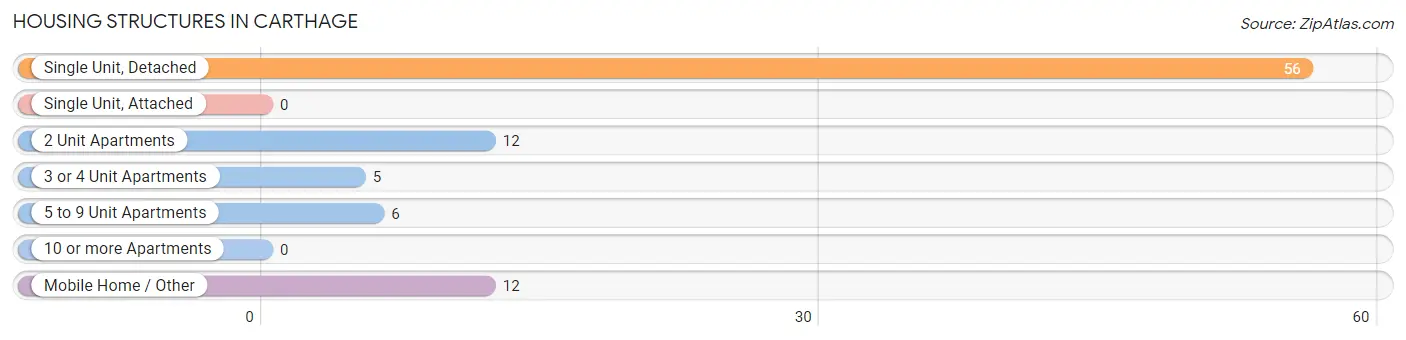
| Structure Type | # Housing Units | % Housing Units |
| Single Unit, Detached | 56 | 61.5% |
| Single Unit, Attached | 0 | 0.0% |
| 2 Unit Apartments | 12 | 13.2% |
| 3 or 4 Unit Apartments | 5 | 5.5% |
| 5 to 9 Unit Apartments | 6 | 6.6% |
| 10 or more Apartments | 0 | 0.0% |
| Mobile Home / Other | 12 | 13.2% |
| Total | 91 | 100.0% |
Housing Structures by Occupancy in Carthage
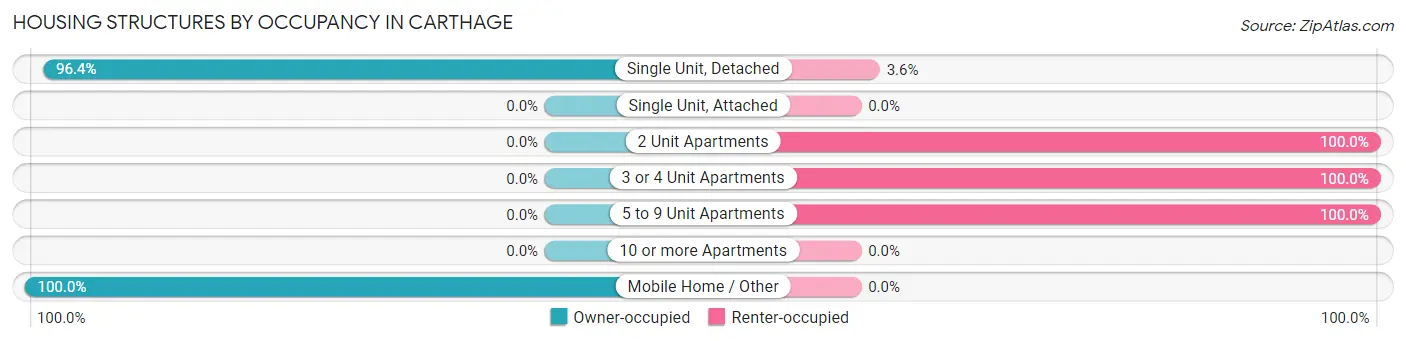
| Structure Type | Owner-occupied | Renter-occupied |
| Single Unit, Detached | 54 (96.4%) | 2 (3.6%) |
| Single Unit, Attached | 0 (0.0%) | 0 (0.0%) |
| 2 Unit Apartments | 0 (0.0%) | 12 (100.0%) |
| 3 or 4 Unit Apartments | 0 (0.0%) | 5 (100.0%) |
| 5 to 9 Unit Apartments | 0 (0.0%) | 6 (100.0%) |
| 10 or more Apartments | 0 (0.0%) | 0 (0.0%) |
| Mobile Home / Other | 12 (100.0%) | 0 (0.0%) |
| Total | 66 (72.5%) | 25 (27.5%) |
Housing Structures by Number of Rooms in Carthage
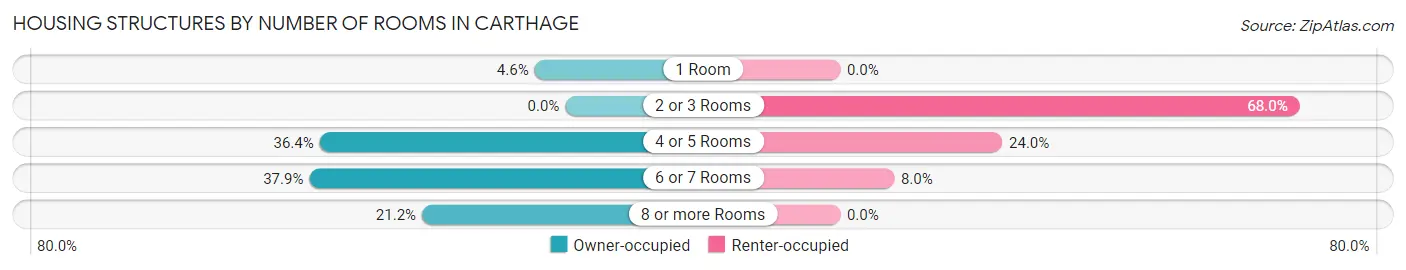
| Number of Rooms | Owner-occupied | Renter-occupied |
| 1 Room | 3 (4.5%) | 0 (0.0%) |
| 2 or 3 Rooms | 0 (0.0%) | 17 (68.0%) |
| 4 or 5 Rooms | 24 (36.4%) | 6 (24.0%) |
| 6 or 7 Rooms | 25 (37.9%) | 2 (8.0%) |
| 8 or more Rooms | 14 (21.2%) | 0 (0.0%) |
| Total | 66 (100.0%) | 25 (100.0%) |
Housing Structure by Heating Type in Carthage
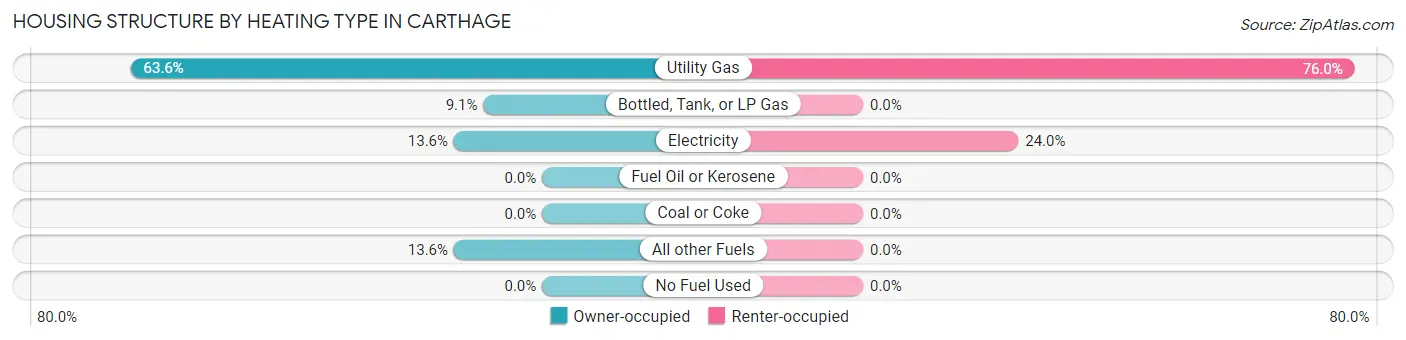
| Heating Type | Owner-occupied | Renter-occupied |
| Utility Gas | 42 (63.6%) | 19 (76.0%) |
| Bottled, Tank, or LP Gas | 6 (9.1%) | 0 (0.0%) |
| Electricity | 9 (13.6%) | 6 (24.0%) |
| Fuel Oil or Kerosene | 0 (0.0%) | 0 (0.0%) |
| Coal or Coke | 0 (0.0%) | 0 (0.0%) |
| All other Fuels | 9 (13.6%) | 0 (0.0%) |
| No Fuel Used | 0 (0.0%) | 0 (0.0%) |
| Total | 66 (100.0%) | 25 (100.0%) |
Household Vehicle Usage in Carthage
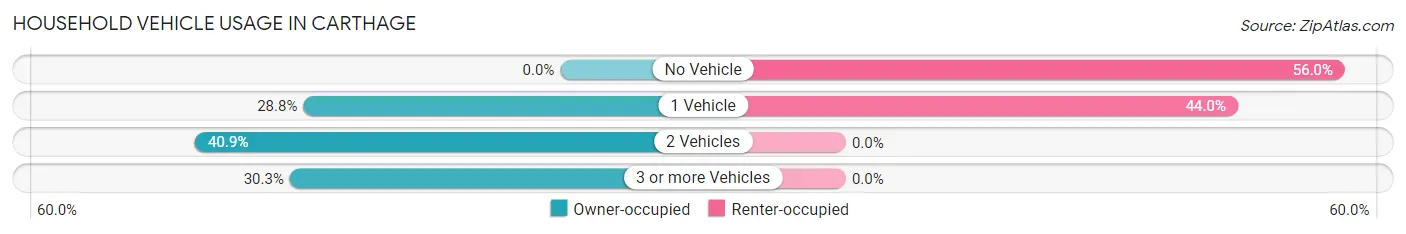
| Vehicles per Household | Owner-occupied | Renter-occupied |
| No Vehicle | 0 (0.0%) | 14 (56.0%) |
| 1 Vehicle | 19 (28.8%) | 11 (44.0%) |
| 2 Vehicles | 27 (40.9%) | 0 (0.0%) |
| 3 or more Vehicles | 20 (30.3%) | 0 (0.0%) |
| Total | 66 (100.0%) | 25 (100.0%) |
Real Estate & Mortgages in Carthage
Real Estate and Mortgage Overview in Carthage
| Characteristic | Without Mortgage | With Mortgage |
| Housing Units | 42 | 24 |
| Median Property Value | $56,000 | $128,800 |
| Median Household Income | $48,750 | $0 |
| Monthly Housing Costs | $343 | $0 |
| Real Estate Taxes | $523 | $0 |
Property Value by Mortgage Status in Carthage
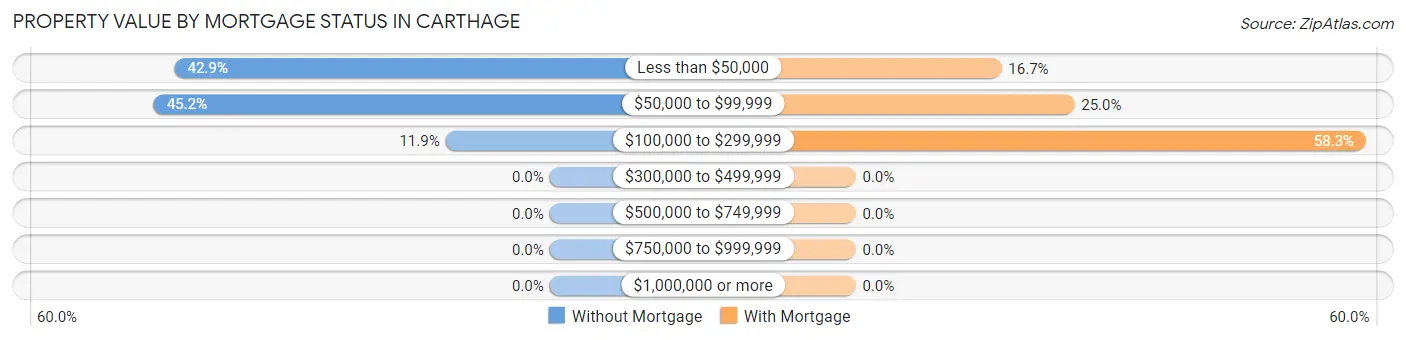
| Property Value | Without Mortgage | With Mortgage |
| Less than $50,000 | 18 (42.9%) | 4 (16.7%) |
| $50,000 to $99,999 | 19 (45.2%) | 6 (25.0%) |
| $100,000 to $299,999 | 5 (11.9%) | 14 (58.3%) |
| $300,000 to $499,999 | 0 (0.0%) | 0 (0.0%) |
| $500,000 to $749,999 | 0 (0.0%) | 0 (0.0%) |
| $750,000 to $999,999 | 0 (0.0%) | 0 (0.0%) |
| $1,000,000 or more | 0 (0.0%) | 0 (0.0%) |
| Total | 42 (100.0%) | 24 (100.0%) |
Household Income by Mortgage Status in Carthage
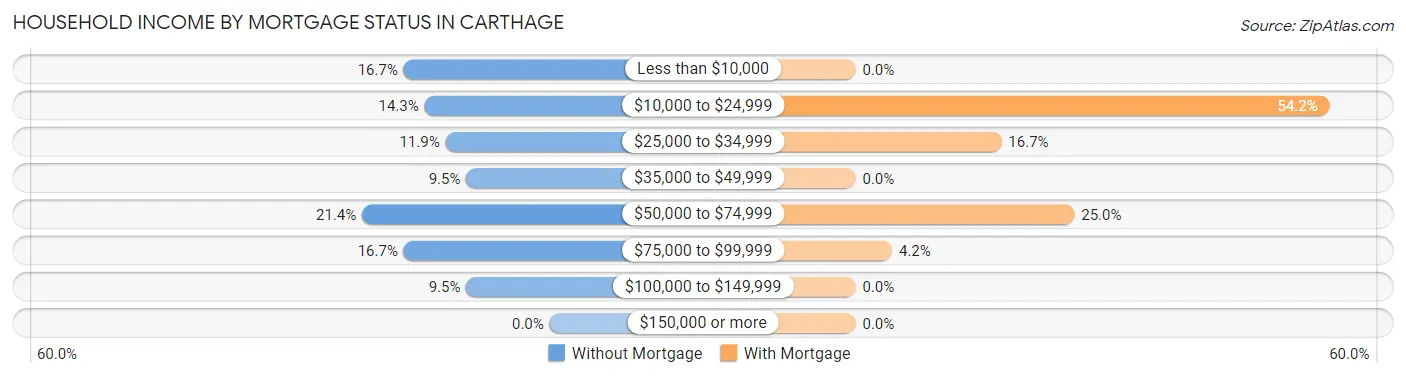
| Household Income | Without Mortgage | With Mortgage |
| Less than $10,000 | 7 (16.7%) | 0 (0.0%) |
| $10,000 to $24,999 | 6 (14.3%) | 13 (54.2%) |
| $25,000 to $34,999 | 5 (11.9%) | 4 (16.7%) |
| $35,000 to $49,999 | 4 (9.5%) | 0 (0.0%) |
| $50,000 to $74,999 | 9 (21.4%) | 6 (25.0%) |
| $75,000 to $99,999 | 7 (16.7%) | 1 (4.2%) |
| $100,000 to $149,999 | 4 (9.5%) | 0 (0.0%) |
| $150,000 or more | 0 (0.0%) | 0 (0.0%) |
| Total | 42 (100.0%) | 24 (100.0%) |
Property Value to Household Income Ratio in Carthage
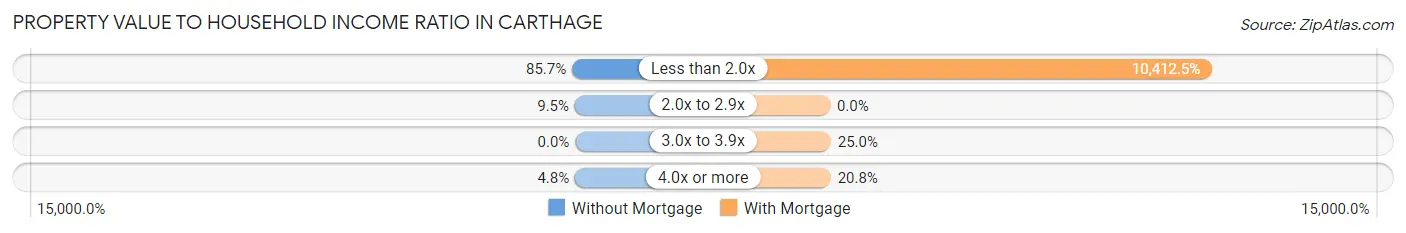
| Value-to-Income Ratio | Without Mortgage | With Mortgage |
| Less than 2.0x | 36 (85.7%) | 2,499 (10,412.5%) |
| 2.0x to 2.9x | 4 (9.5%) | 0 (0.0%) |
| 3.0x to 3.9x | 0 (0.0%) | 6 (25.0%) |
| 4.0x or more | 2 (4.8%) | 5 (20.8%) |
| Total | 42 (100.0%) | 24 (100.0%) |
Real Estate Taxes by Mortgage Status in Carthage
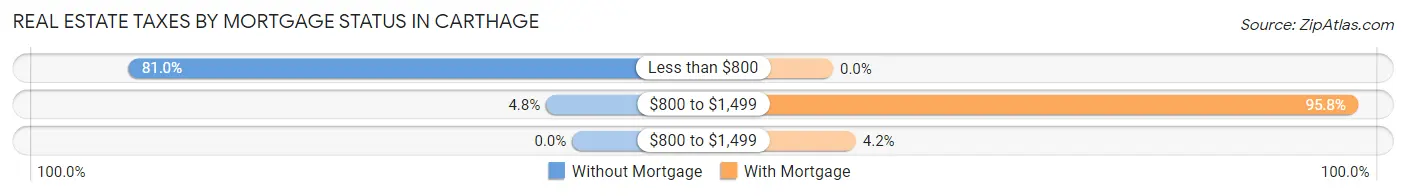
| Property Taxes | Without Mortgage | With Mortgage |
| Less than $800 | 34 (80.9%) | 0 (0.0%) |
| $800 to $1,499 | 2 (4.8%) | 23 (95.8%) |
| $800 to $1,499 | 0 (0.0%) | 1 (4.2%) |
| Total | 42 (100.0%) | 24 (100.0%) |
Health & Disability in Carthage
Health Insurance Coverage by Age in Carthage
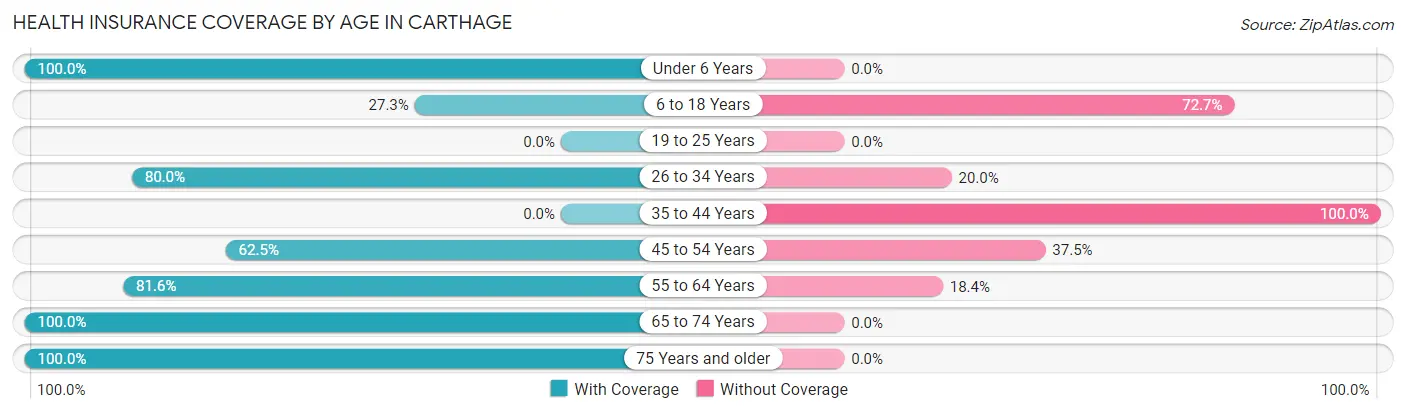
| Age Bracket | With Coverage | Without Coverage |
| Under 6 Years | 8 (100.0%) | 0 (0.0%) |
| 6 to 18 Years | 6 (27.3%) | 16 (72.7%) |
| 19 to 25 Years | 0 (0.0%) | 0 (0.0%) |
| 26 to 34 Years | 8 (80.0%) | 2 (20.0%) |
| 35 to 44 Years | 0 (0.0%) | 2 (100.0%) |
| 45 to 54 Years | 10 (62.5%) | 6 (37.5%) |
| 55 to 64 Years | 40 (81.6%) | 9 (18.4%) |
| 65 to 74 Years | 69 (100.0%) | 0 (0.0%) |
| 75 Years and older | 2 (100.0%) | 0 (0.0%) |
| Total | 143 (80.3%) | 35 (19.7%) |
Health Insurance Coverage by Citizenship Status in Carthage
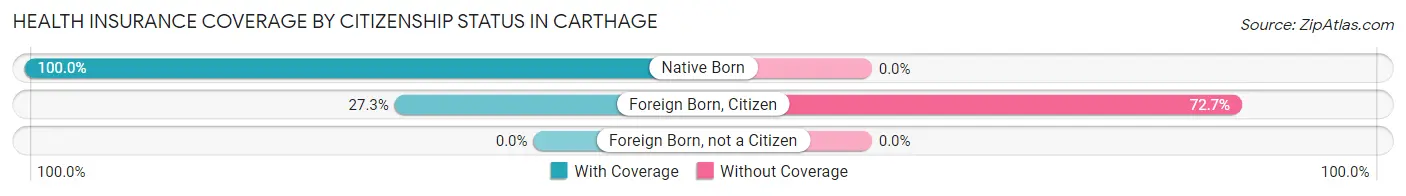
| Citizenship Status | With Coverage | Without Coverage |
| Native Born | 8 (100.0%) | 0 (0.0%) |
| Foreign Born, Citizen | 6 (27.3%) | 16 (72.7%) |
| Foreign Born, not a Citizen | 0 (0.0%) | 0 (0.0%) |
Health Insurance Coverage by Household Income in Carthage
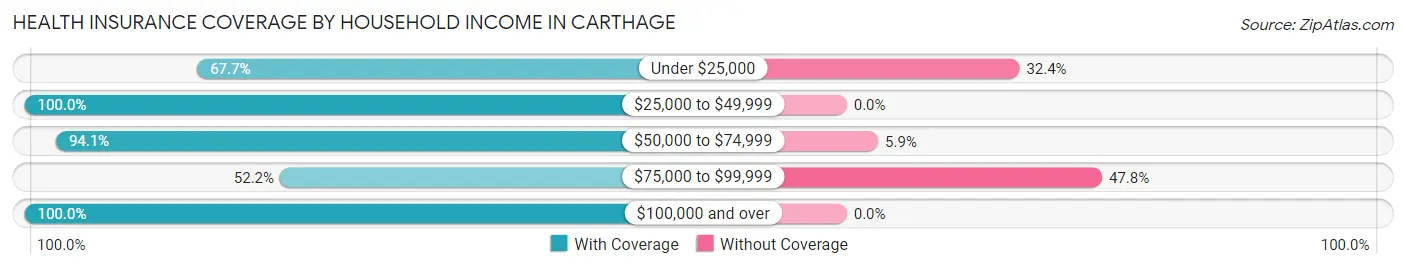
| Household Income | With Coverage | Without Coverage |
| Under $25,000 | 46 (67.6%) | 22 (32.4%) |
| $25,000 to $49,999 | 43 (100.0%) | 0 (0.0%) |
| $50,000 to $74,999 | 32 (94.1%) | 2 (5.9%) |
| $75,000 to $99,999 | 12 (52.2%) | 11 (47.8%) |
| $100,000 and over | 10 (100.0%) | 0 (0.0%) |
Public vs Private Health Insurance Coverage by Age in Carthage
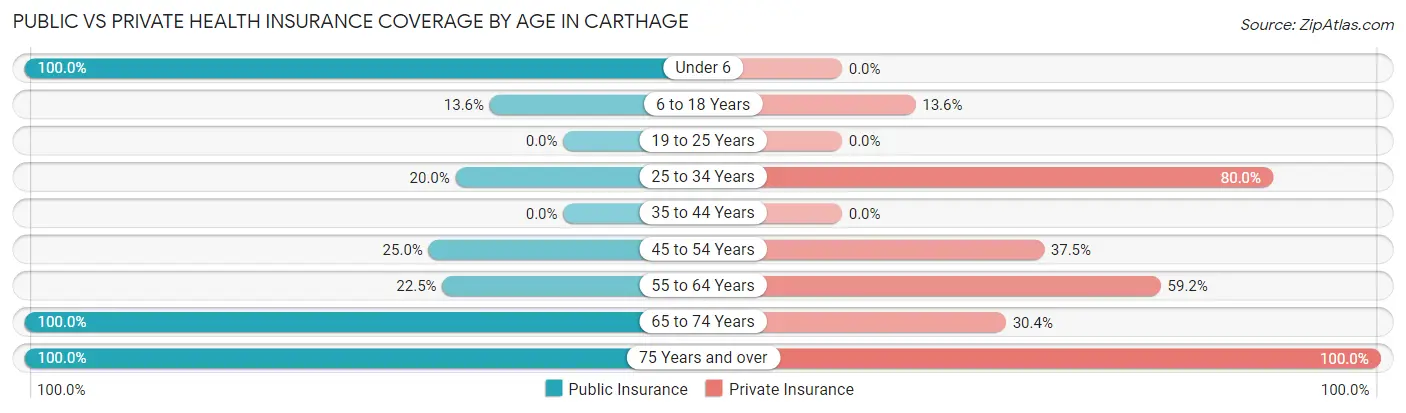
| Age Bracket | Public Insurance | Private Insurance |
| Under 6 | 8 (100.0%) | 0 (0.0%) |
| 6 to 18 Years | 3 (13.6%) | 3 (13.6%) |
| 19 to 25 Years | 0 (0.0%) | 0 (0.0%) |
| 25 to 34 Years | 2 (20.0%) | 8 (80.0%) |
| 35 to 44 Years | 0 (0.0%) | 0 (0.0%) |
| 45 to 54 Years | 4 (25.0%) | 6 (37.5%) |
| 55 to 64 Years | 11 (22.5%) | 29 (59.2%) |
| 65 to 74 Years | 69 (100.0%) | 21 (30.4%) |
| 75 Years and over | 2 (100.0%) | 2 (100.0%) |
| Total | 99 (55.6%) | 69 (38.8%) |
Disability Status by Sex by Age in Carthage
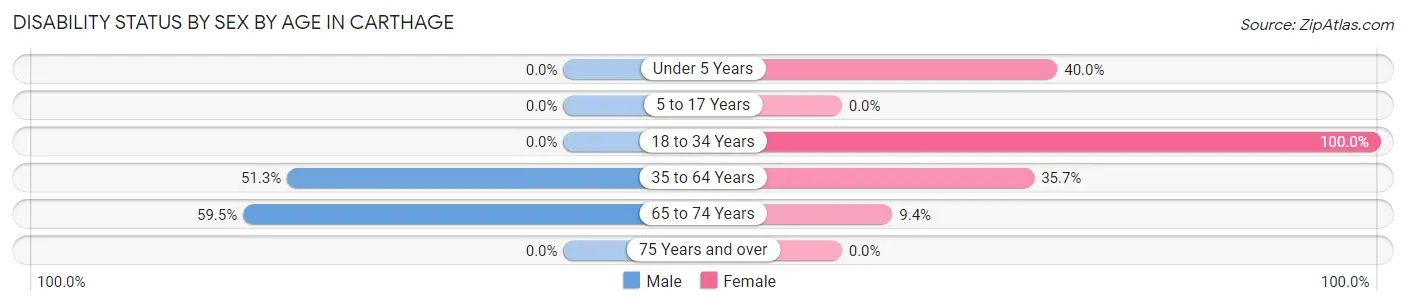
| Age Bracket | Male | Female |
| Under 5 Years | 0 (0.0%) | 2 (40.0%) |
| 5 to 17 Years | 0 (0.0%) | 0 (0.0%) |
| 18 to 34 Years | 0 (0.0%) | 1 (100.0%) |
| 35 to 64 Years | 20 (51.3%) | 10 (35.7%) |
| 65 to 74 Years | 22 (59.5%) | 3 (9.4%) |
| 75 Years and over | 0 (0.0%) | 0 (0.0%) |
Disability Class by Sex by Age in Carthage
Disability Class: Hearing Difficulty
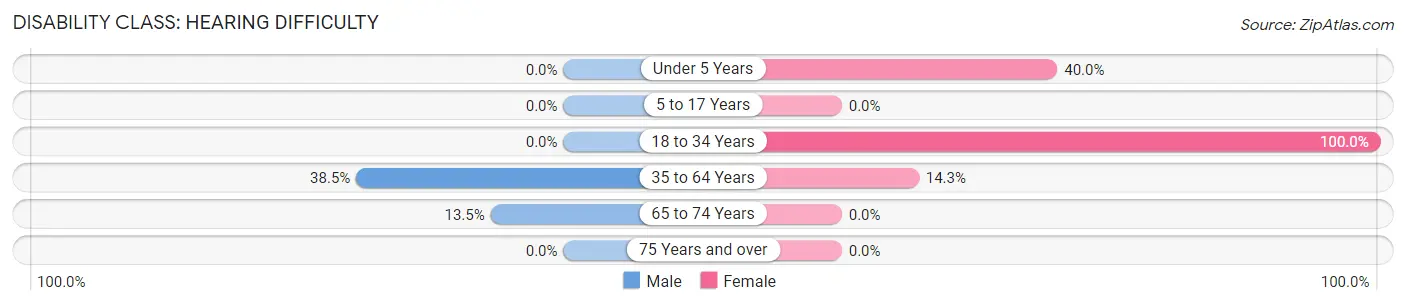
| Age Bracket | Male | Female |
| Under 5 Years | 0 (0.0%) | 2 (40.0%) |
| 5 to 17 Years | 0 (0.0%) | 0 (0.0%) |
| 18 to 34 Years | 0 (0.0%) | 1 (100.0%) |
| 35 to 64 Years | 15 (38.5%) | 4 (14.3%) |
| 65 to 74 Years | 5 (13.5%) | 0 (0.0%) |
| 75 Years and over | 0 (0.0%) | 0 (0.0%) |
Disability Class: Vision Difficulty
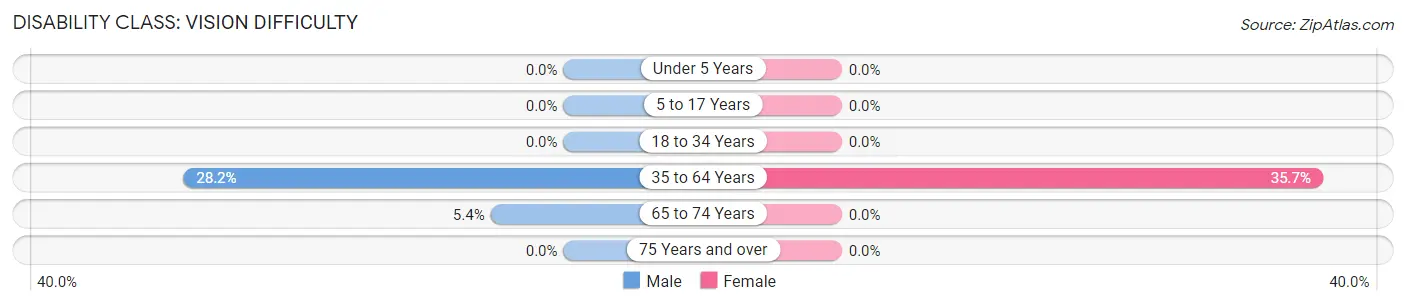
| Age Bracket | Male | Female |
| Under 5 Years | 0 (0.0%) | 0 (0.0%) |
| 5 to 17 Years | 0 (0.0%) | 0 (0.0%) |
| 18 to 34 Years | 0 (0.0%) | 0 (0.0%) |
| 35 to 64 Years | 11 (28.2%) | 10 (35.7%) |
| 65 to 74 Years | 2 (5.4%) | 0 (0.0%) |
| 75 Years and over | 0 (0.0%) | 0 (0.0%) |
Disability Class: Cognitive Difficulty
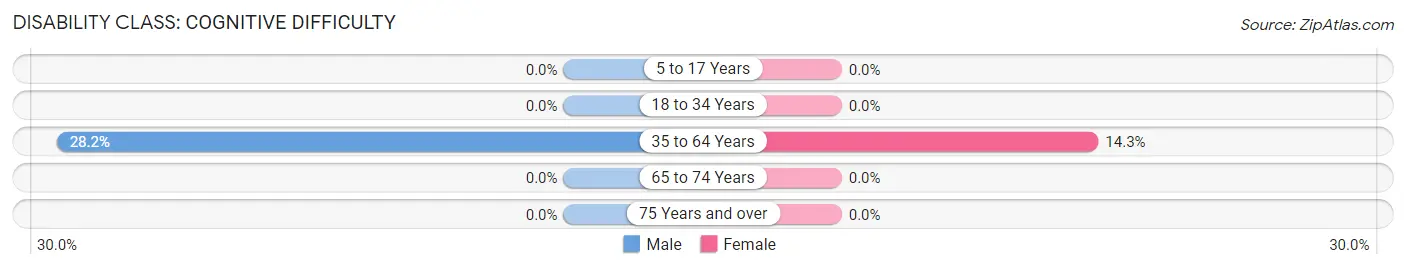
| Age Bracket | Male | Female |
| 5 to 17 Years | 0 (0.0%) | 0 (0.0%) |
| 18 to 34 Years | 0 (0.0%) | 0 (0.0%) |
| 35 to 64 Years | 11 (28.2%) | 4 (14.3%) |
| 65 to 74 Years | 0 (0.0%) | 0 (0.0%) |
| 75 Years and over | 0 (0.0%) | 0 (0.0%) |
Disability Class: Ambulatory Difficulty
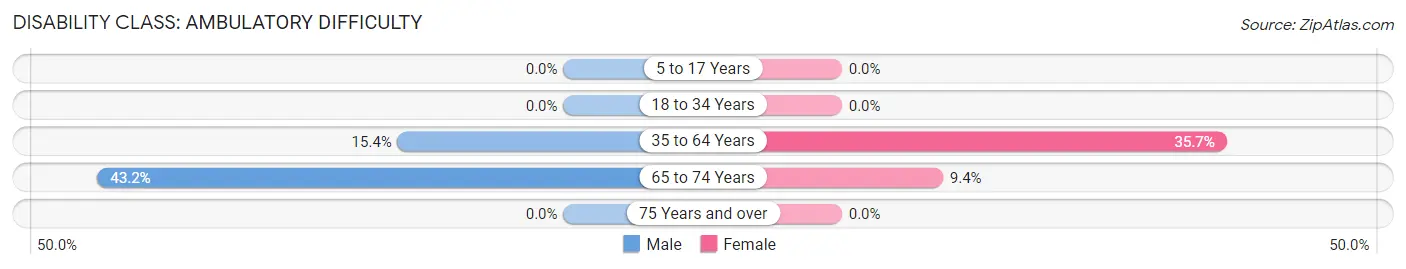
| Age Bracket | Male | Female |
| 5 to 17 Years | 0 (0.0%) | 0 (0.0%) |
| 18 to 34 Years | 0 (0.0%) | 0 (0.0%) |
| 35 to 64 Years | 6 (15.4%) | 10 (35.7%) |
| 65 to 74 Years | 16 (43.2%) | 3 (9.4%) |
| 75 Years and over | 0 (0.0%) | 0 (0.0%) |
Disability Class: Self-Care Difficulty
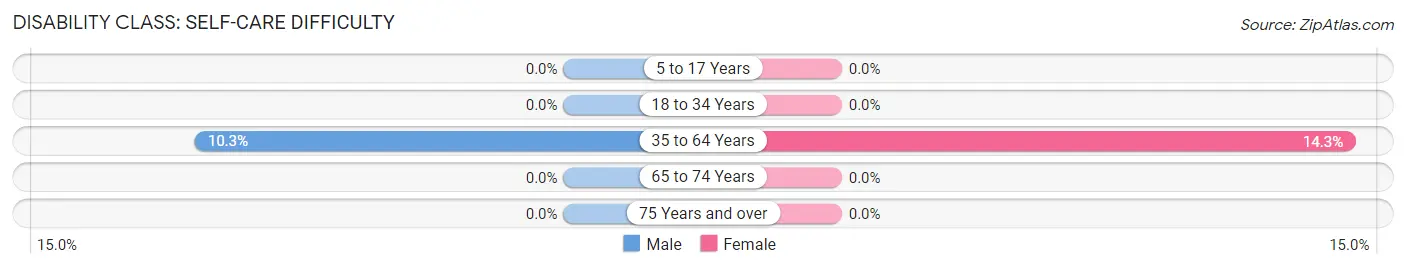
| Age Bracket | Male | Female |
| 5 to 17 Years | 0 (0.0%) | 0 (0.0%) |
| 18 to 34 Years | 0 (0.0%) | 0 (0.0%) |
| 35 to 64 Years | 4 (10.3%) | 4 (14.3%) |
| 65 to 74 Years | 0 (0.0%) | 0 (0.0%) |
| 75 Years and over | 0 (0.0%) | 0 (0.0%) |
Technology Access in Carthage
Computing Device Access in Carthage
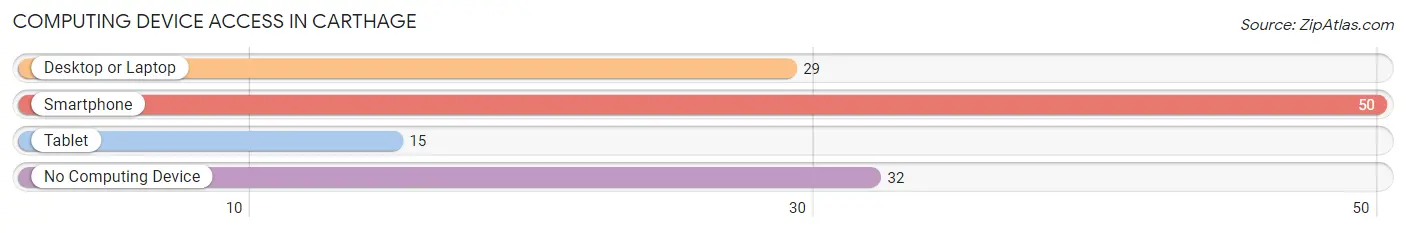
| Device Type | # Households | % Households |
| Desktop or Laptop | 29 | 31.9% |
| Smartphone | 50 | 54.9% |
| Tablet | 15 | 16.5% |
| No Computing Device | 32 | 35.2% |
| Total | 91 | 100.0% |
Internet Access in Carthage
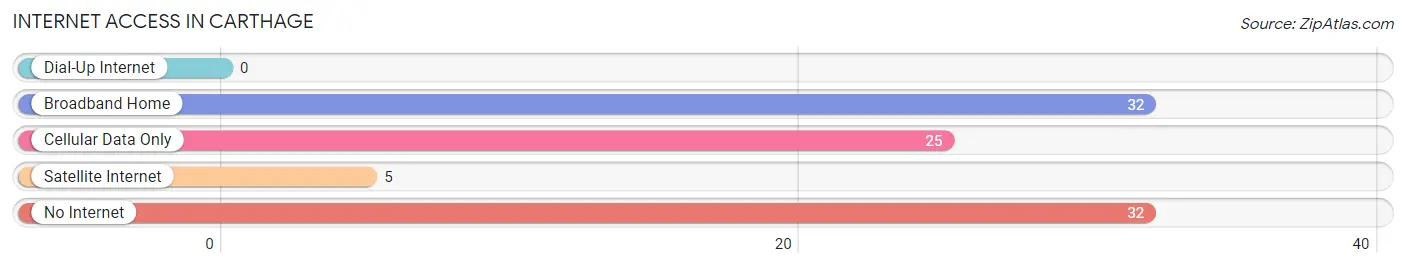
| Internet Type | # Households | % Households |
| Dial-Up Internet | 0 | 0.0% |
| Broadband Home | 32 | 35.2% |
| Cellular Data Only | 25 | 27.5% |
| Satellite Internet | 5 | 5.5% |
| No Internet | 32 | 35.2% |
| Total | 91 | 100.0% |
Carthage Summary
Carthage, Arkansas is a small town located in the southwestern corner of the state, near the Oklahoma border. It is the county seat of Little River County and has a population of just over 1,000 people. The town was founded in 1871 and was named after the ancient city of Carthage in Tunisia.
Geography
Carthage is located in the Ouachita Mountains region of Arkansas. The town is situated on the banks of the Little River, which flows through the area. The town is surrounded by rolling hills and forests, and is located about 30 miles from the nearest major city, Texarkana. The climate in the area is humid subtropical, with hot summers and mild winters.
Economy
The economy of Carthage is largely based on agriculture and timber. The town is home to several small farms and ranches, as well as a few timber companies. The town also has a few small businesses, including a grocery store, a hardware store, and a few restaurants.
Demographics
As of the 2010 census, the population of Carthage was 1,072. The racial makeup of the town was 95.3% White, 0.7% African American, 0.3% Native American, 0.2% Asian, 0.1% Pacific Islander, and 3.4% from two or more races. The median household income was $30,938, and the median family income was $37,500.
History
Carthage was founded in 1871 by a group of settlers from Tennessee. The town was named after the ancient city of Carthage in Tunisia. The town was incorporated in 1876 and quickly grew to become an important trading center in the area. The town was also home to a number of sawmills and timber companies, which helped to fuel the local economy.
In the early 20th century, Carthage was a popular tourist destination, with many visitors coming to the area to enjoy the natural beauty of the Ouachita Mountains. The town was also home to a number of resorts and hotels, which attracted visitors from all over the country.
In the late 20th century, the economy of Carthage shifted away from agriculture and timber and towards tourism. The town is now home to a number of bed and breakfasts, as well as a few small businesses. The town is also home to a number of historic sites, including the Little River County Courthouse, which was built in 1876.
Today, Carthage is a small, quiet town with a population of just over 1,000 people. The town is still home to a number of small farms and ranches, as well as a few timber companies. The town is also home to a number of bed and breakfasts, as well as a few small businesses. The town is also home to a number of historic sites, including the Little River County Courthouse, which was built in 1876.
Common Questions
What is Per Capita Income in Carthage?
Per Capita income in Carthage is $21,130.
What is the Median Family Income in Carthage?
Median Family Income in Carthage is $47,083.
What is Income or Wage Gap in Carthage?
Income or Wage Gap in Carthage is 60.1%.
Women in Carthage earn 39.9 cents for every dollar earned by a man.
What is Inequality or Gini Index in Carthage?
Inequality or Gini Index in Carthage is 0.47.
What is the Total Population of Carthage?
Total Population of Carthage is 178.
What is the Total Male Population of Carthage?
Total Male Population of Carthage is 97.
What is the Total Female Population of Carthage?
Total Female Population of Carthage is 81.
What is the Ratio of Males per 100 Females in Carthage?
There are 119.75 Males per 100 Females in Carthage.
What is the Ratio of Females per 100 Males in Carthage?
There are 83.51 Females per 100 Males in Carthage.
What is the Median Population Age in Carthage?
Median Population Age in Carthage is 60.0 Years.
What is the Average Family Size in Carthage
Average Family Size in Carthage is 3.0 People.
What is the Average Household Size in Carthage
Average Household Size in Carthage is 2.0 People.
How Large is the Labor Force in Carthage?
There are 51 People in the Labor Forcein in Carthage.
What is the Percentage of People in the Labor Force in Carthage?
34.2% of People are in the Labor Force in Carthage.
What is the Unemployment Rate in Carthage?
Unemployment Rate in Carthage is 3.9%.