Camden, AR Map & Demographics
Camden Map
Camden Overview
$24,706
PER CAPITA INCOME
$67,337
AVG FAMILY INCOME
$48,302
AVG HOUSEHOLD INCOME
19.7%
WAGE / INCOME GAP [ % ]
80.3¢/ $1
WAGE / INCOME GAP [ $ ]
0.44
INEQUALITY / GINI INDEX
10,587
TOTAL POPULATION
5,141
MALE POPULATION
5,446
FEMALE POPULATION
94.40
MALES / 100 FEMALES
105.93
FEMALES / 100 MALES
38.7
MEDIAN AGE
3.4
AVG FAMILY SIZE
2.5
AVG HOUSEHOLD SIZE
4,312
LABOR FORCE [ PEOPLE ]
52.5%
PERCENT IN LABOR FORCE
5.8%
UNEMPLOYMENT RATE
Camden Zip Codes
Camden Area Codes
Income in Camden
Income Overview in Camden
Per Capita Income in Camden is $24,706, while median incomes of families and households are $67,337 and $48,302 respectively.
| Characteristic | Number | Measure |
| Per Capita Income | 10,587 | $24,706 |
| Median Family Income | 2,509 | $67,337 |
| Mean Family Income | 2,509 | $73,452 |
| Median Household Income | 4,026 | $48,302 |
| Mean Household Income | 4,026 | $61,046 |
| Income Deficit | 2,509 | $0 |
| Wage / Income Gap (%) | 10,587 | 19.68% |
| Wage / Income Gap ($) | 10,587 | 80.32¢ per $1 |
| Gini / Inequality Index | 10,587 | 0.44 |
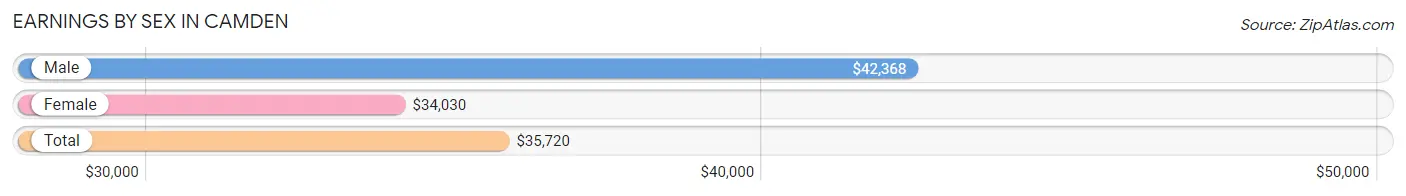
Earnings by Sex in Camden
Average Earnings in Camden are $35,720, $42,368 for men and $34,030 for women, a difference of 19.7%.
| Sex | Number | Average Earnings |
| Male | 2,334 (51.5%) | $42,368 |
| Female | 2,201 (48.5%) | $34,030 |
| Total | 4,535 (100.0%) | $35,720 |
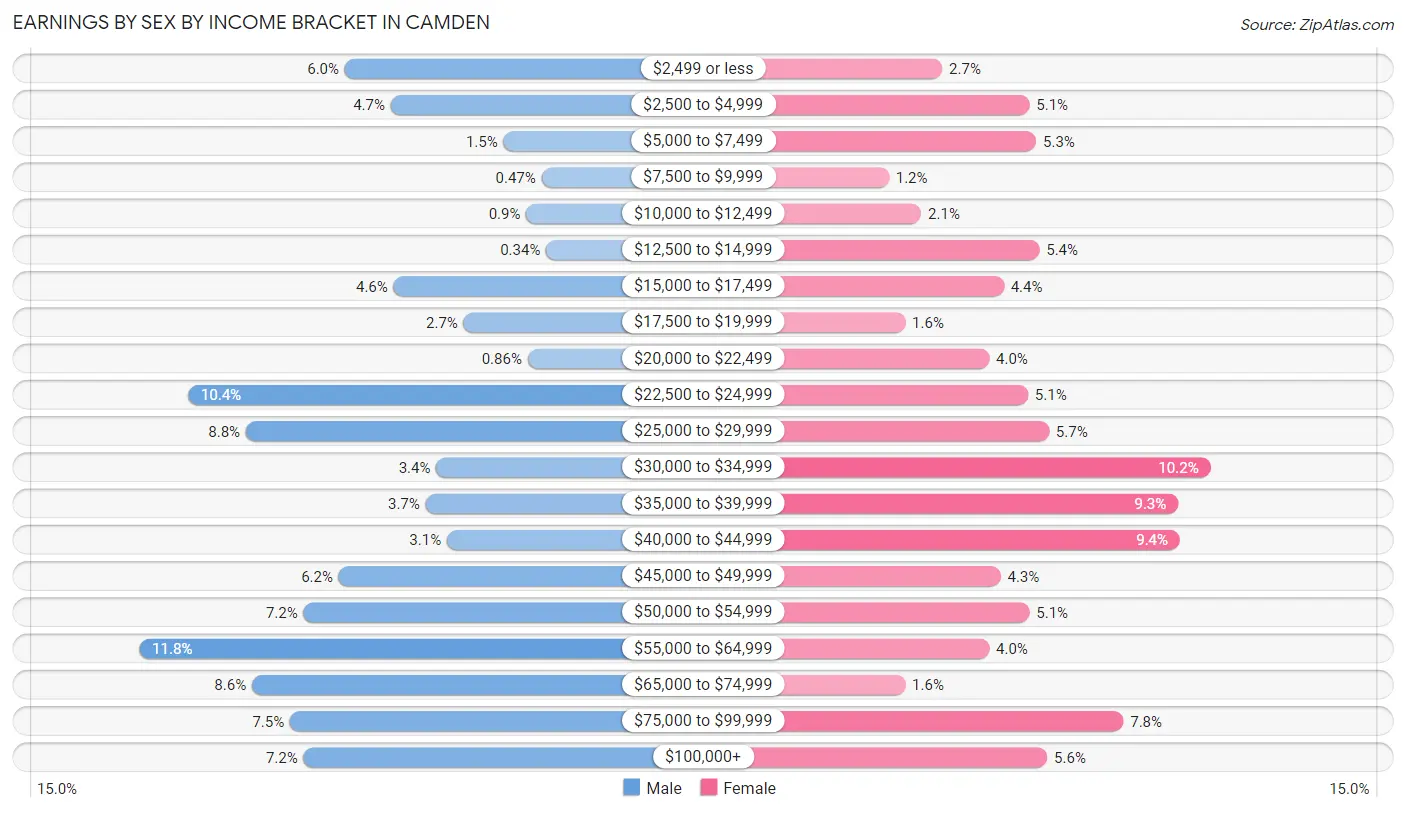
Earnings by Sex by Income Bracket in Camden
The most common earnings brackets in Camden are $55,000 to $64,999 for men (275 | 11.8%) and $30,000 to $34,999 for women (225 | 10.2%).
| Income | Male | Female |
| $2,499 or less | 140 (6.0%) | 59 (2.7%) |
| $2,500 to $4,999 | 110 (4.7%) | 113 (5.1%) |
| $5,000 to $7,499 | 36 (1.5%) | 117 (5.3%) |
| $7,500 to $9,999 | 11 (0.5%) | 26 (1.2%) |
| $10,000 to $12,499 | 21 (0.9%) | 46 (2.1%) |
| $12,500 to $14,999 | 8 (0.3%) | 119 (5.4%) |
| $15,000 to $17,499 | 108 (4.6%) | 97 (4.4%) |
| $17,500 to $19,999 | 62 (2.7%) | 36 (1.6%) |
| $20,000 to $22,499 | 20 (0.9%) | 88 (4.0%) |
| $22,500 to $24,999 | 243 (10.4%) | 112 (5.1%) |
| $25,000 to $29,999 | 205 (8.8%) | 125 (5.7%) |
| $30,000 to $34,999 | 80 (3.4%) | 225 (10.2%) |
| $35,000 to $39,999 | 87 (3.7%) | 205 (9.3%) |
| $40,000 to $44,999 | 73 (3.1%) | 206 (9.4%) |
| $45,000 to $49,999 | 144 (6.2%) | 95 (4.3%) |
| $50,000 to $54,999 | 167 (7.2%) | 113 (5.1%) |
| $55,000 to $64,999 | 275 (11.8%) | 88 (4.0%) |
| $65,000 to $74,999 | 201 (8.6%) | 36 (1.6%) |
| $75,000 to $99,999 | 176 (7.5%) | 171 (7.8%) |
| $100,000+ | 167 (7.2%) | 124 (5.6%) |
| Total | 2,334 (100.0%) | 2,201 (100.0%) |
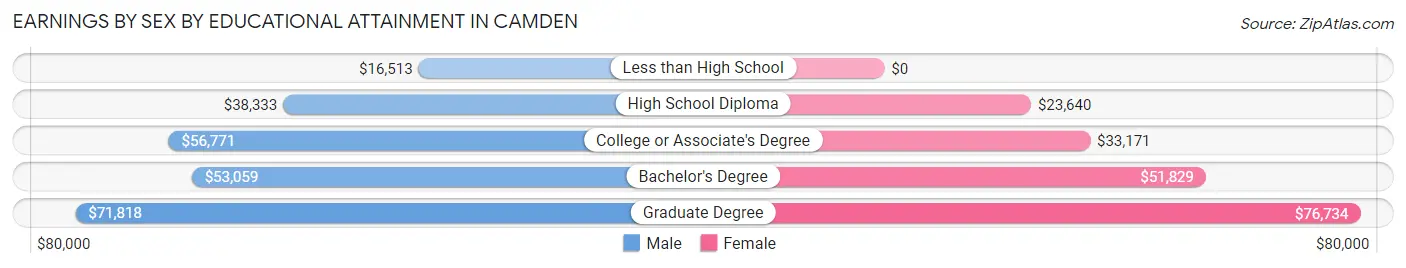
Earnings by Sex by Educational Attainment in Camden
Average earnings in Camden are $50,033 for men and $34,610 for women, a difference of 30.8%. Men with an educational attainment of graduate degree enjoy the highest average annual earnings of $71,818, while those with less than high school education earn the least with $16,513. Women with an educational attainment of graduate degree earn the most with the average annual earnings of $76,734, while those with high school diploma education have the smallest earnings of $23,640.
| Educational Attainment | Male Income | Female Income |
| Less than High School | $16,513 | $0 |
| High School Diploma | $38,333 | $23,640 |
| College or Associate's Degree | $56,771 | $33,171 |
| Bachelor's Degree | $53,059 | $51,829 |
| Graduate Degree | $71,818 | $76,734 |
| Total | $50,033 | $34,610 |
Family Income in Camden
Family Income Brackets in Camden
According to the Camden family income data, there are 529 families falling into the $100,000 to $149,999 income range, which is the most common income bracket and makes up 21.1% of all families. Conversely, the $200,000+ income bracket is the least frequent group with only 50 families (2.0%) belonging to this category.
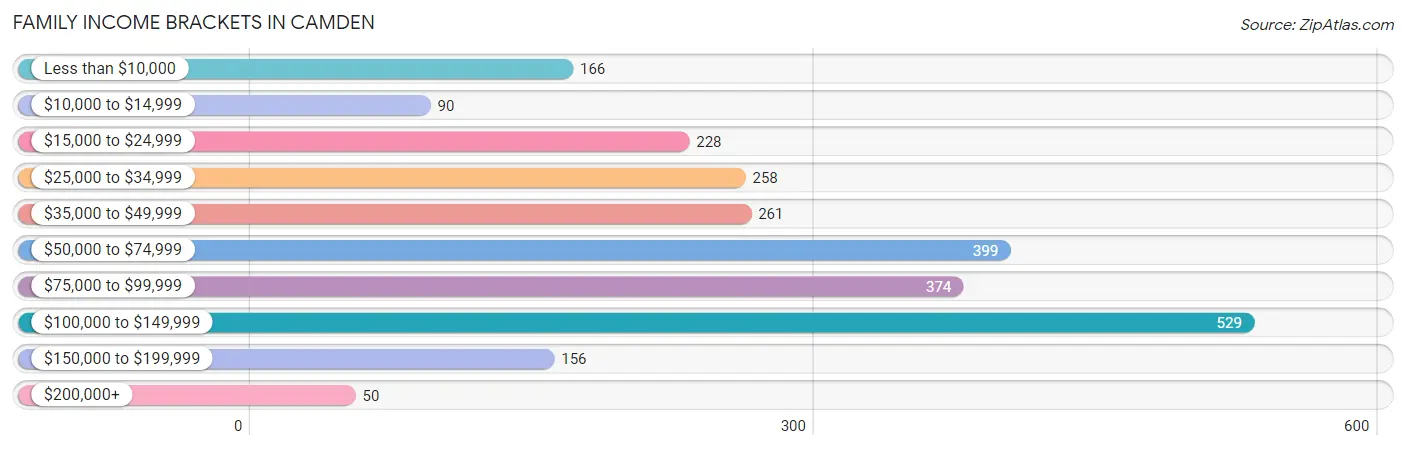
| Income Bracket | # Families | % Families |
| Less than $10,000 | 166 | 6.6% |
| $10,000 to $14,999 | 90 | 3.6% |
| $15,000 to $24,999 | 228 | 9.1% |
| $25,000 to $34,999 | 258 | 10.3% |
| $35,000 to $49,999 | 261 | 10.4% |
| $50,000 to $74,999 | 399 | 15.9% |
| $75,000 to $99,999 | 374 | 14.9% |
| $100,000 to $149,999 | 529 | 21.1% |
| $150,000 to $199,999 | 156 | 6.2% |
| $200,000+ | 50 | 2.0% |
Family Income by Famaliy Size in Camden
4-person families (375 | 14.9%) account for the highest median family income in Camden with $86,771 per family, while 2-person families (1,385 | 55.2%) have the highest median income of $28,740 per family member.
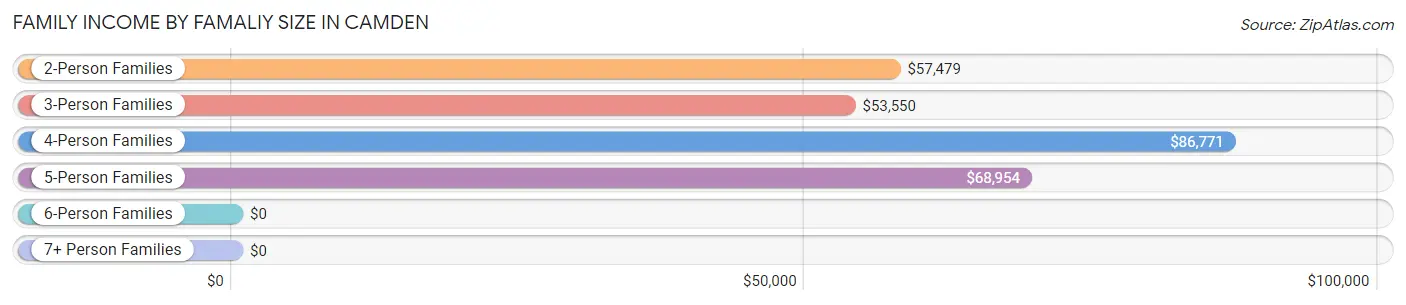
| Income Bracket | # Families | Median Income |
| 2-Person Families | 1,385 (55.2%) | $57,479 |
| 3-Person Families | 543 (21.6%) | $53,550 |
| 4-Person Families | 375 (14.9%) | $86,771 |
| 5-Person Families | 193 (7.7%) | $68,954 |
| 6-Person Families | 4 (0.2%) | $0 |
| 7+ Person Families | 9 (0.4%) | $0 |
| Total | 2,509 (100.0%) | $67,337 |
Family Income by Number of Earners in Camden
The median family income in Camden is $67,337, with families comprising 3+ earners (62) having the highest median family income of $114,911, while families with no earners (581) have the lowest median family income of $29,406, accounting for 2.5% and 23.2% of families, respectively.
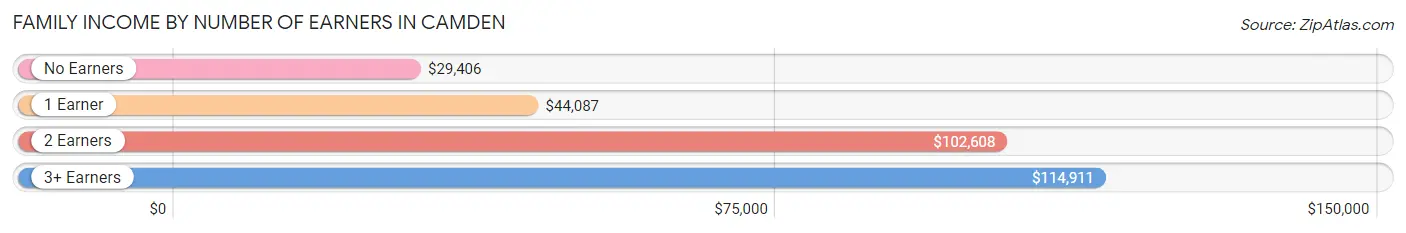
| Number of Earners | # Families | Median Income |
| No Earners | 581 (23.2%) | $29,406 |
| 1 Earner | 892 (35.5%) | $44,087 |
| 2 Earners | 974 (38.8%) | $102,608 |
| 3+ Earners | 62 (2.5%) | $114,911 |
| Total | 2,509 (100.0%) | $67,337 |
Household Income in Camden
Household Income Brackets in Camden
With 684 households falling in the category, the $50,000 to $74,999 income range is the most frequent in Camden, accounting for 17.0% of all households. In contrast, only 64 households (1.6%) fall into the $200,000+ income bracket, making it the least populous group.
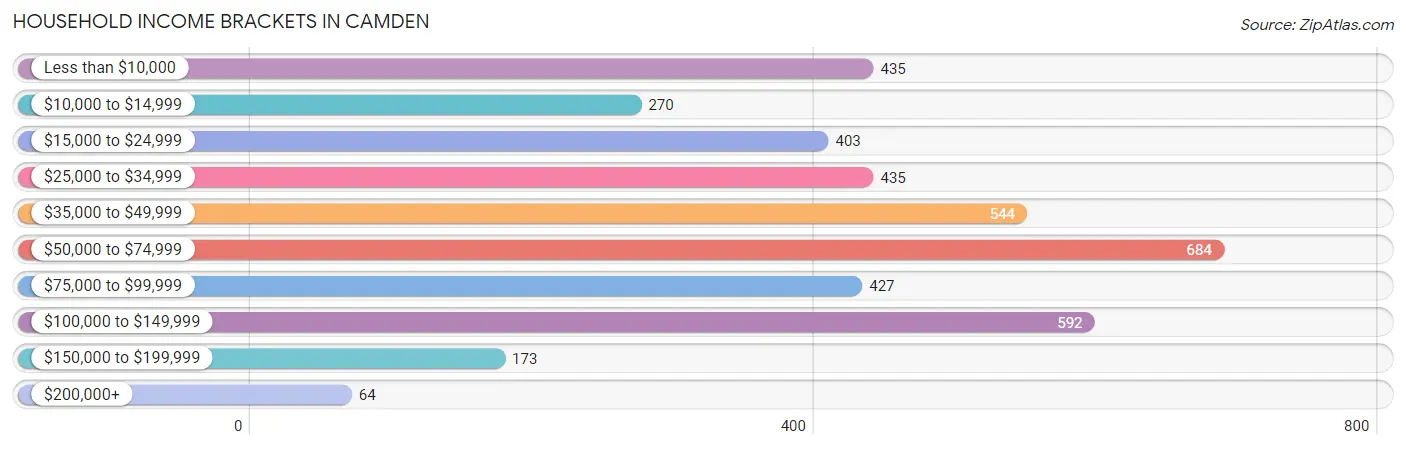
| Income Bracket | # Households | % Households |
| Less than $10,000 | 435 | 10.8% |
| $10,000 to $14,999 | 270 | 6.7% |
| $15,000 to $24,999 | 403 | 10.0% |
| $25,000 to $34,999 | 435 | 10.8% |
| $35,000 to $49,999 | 544 | 13.5% |
| $50,000 to $74,999 | 684 | 17.0% |
| $75,000 to $99,999 | 427 | 10.6% |
| $100,000 to $149,999 | 592 | 14.7% |
| $150,000 to $199,999 | 173 | 4.3% |
| $200,000+ | 64 | 1.6% |
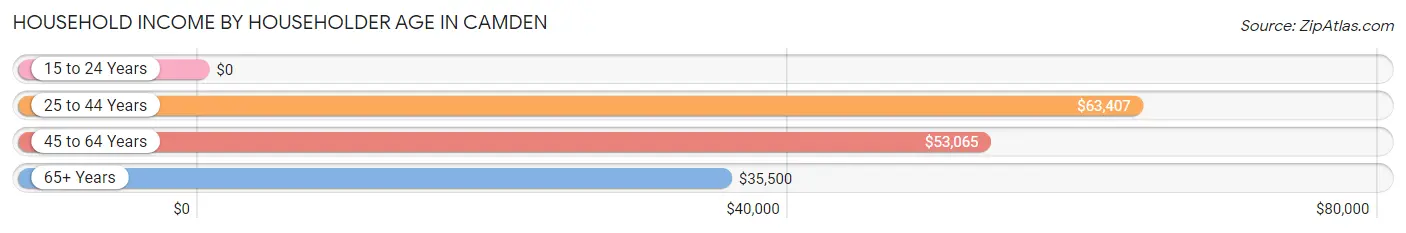
Household Income by Householder Age in Camden
The median household income in Camden is $48,302, with the highest median household income of $63,407 found in the 25 to 44 years age bracket for the primary householder. A total of 1,533 households (38.1%) fall into this category. Meanwhile, the 15 to 24 years age bracket for the primary householder has the lowest median household income of $0, with 37 households (0.9%) in this group.
| Income Bracket | # Households | Median Income |
| 15 to 24 Years | 37 (0.9%) | $0 |
| 25 to 44 Years | 1,533 (38.1%) | $63,407 |
| 45 to 64 Years | 1,286 (31.9%) | $53,065 |
| 65+ Years | 1,170 (29.1%) | $35,500 |
| Total | 4,026 (100.0%) | $48,302 |
Poverty in Camden
Income Below Poverty by Sex and Age in Camden
With 20.8% poverty level for males and 21.5% for females among the residents of Camden, 5 year old males and 16 and 17 year old females are the most vulnerable to poverty, with 51 males (100.0%) and 61 females (100.0%) in their respective age groups living below the poverty level.
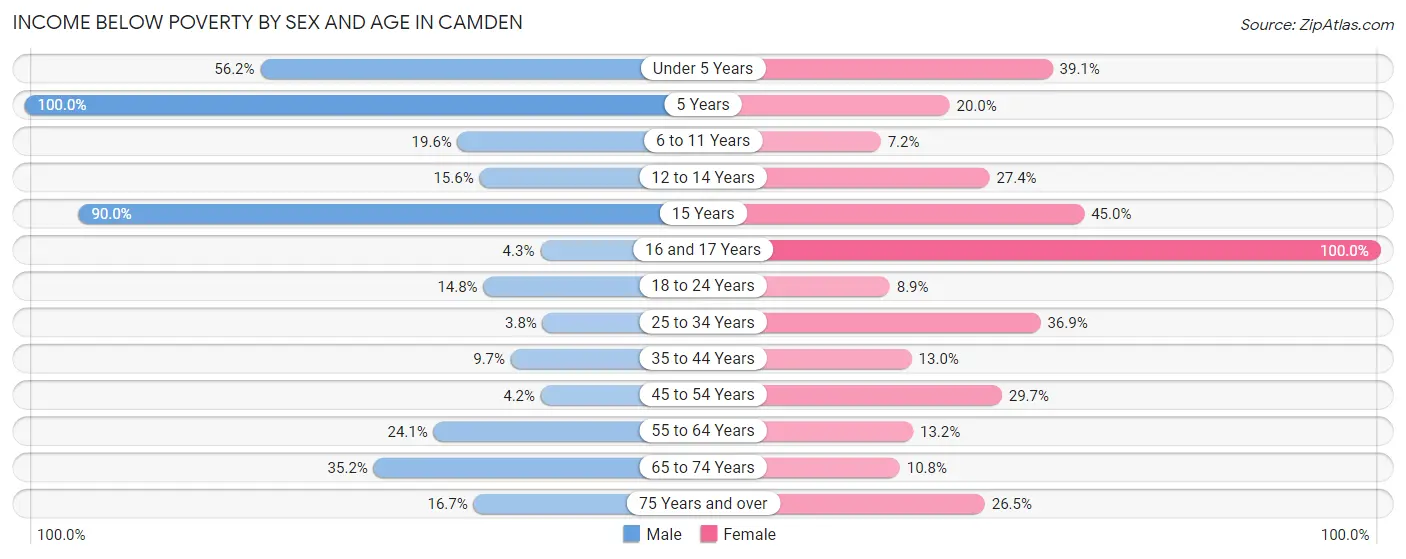
| Age Bracket | Male | Female |
| Under 5 Years | 266 (56.2%) | 99 (39.1%) |
| 5 Years | 51 (100.0%) | 11 (20.0%) |
| 6 to 11 Years | 92 (19.6%) | 31 (7.2%) |
| 12 to 14 Years | 33 (15.6%) | 91 (27.4%) |
| 15 Years | 54 (90.0%) | 18 (45.0%) |
| 16 and 17 Years | 10 (4.3%) | 61 (100.0%) |
| 18 to 24 Years | 70 (14.8%) | 23 (8.9%) |
| 25 to 34 Years | 24 (3.8%) | 239 (36.9%) |
| 35 to 44 Years | 52 (9.7%) | 96 (13.0%) |
| 45 to 54 Years | 20 (4.2%) | 147 (29.7%) |
| 55 to 64 Years | 159 (24.1%) | 102 (13.2%) |
| 65 to 74 Years | 163 (35.2%) | 68 (10.8%) |
| 75 Years and over | 42 (16.7%) | 151 (26.5%) |
| Total | 1,036 (20.8%) | 1,137 (21.5%) |
Income Above Poverty by Sex and Age in Camden
According to the poverty statistics in Camden, males aged 25 to 34 years and females aged 6 to 11 years are the age groups that are most secure financially, with 96.2% of males and 92.8% of females in these age groups living above the poverty line.
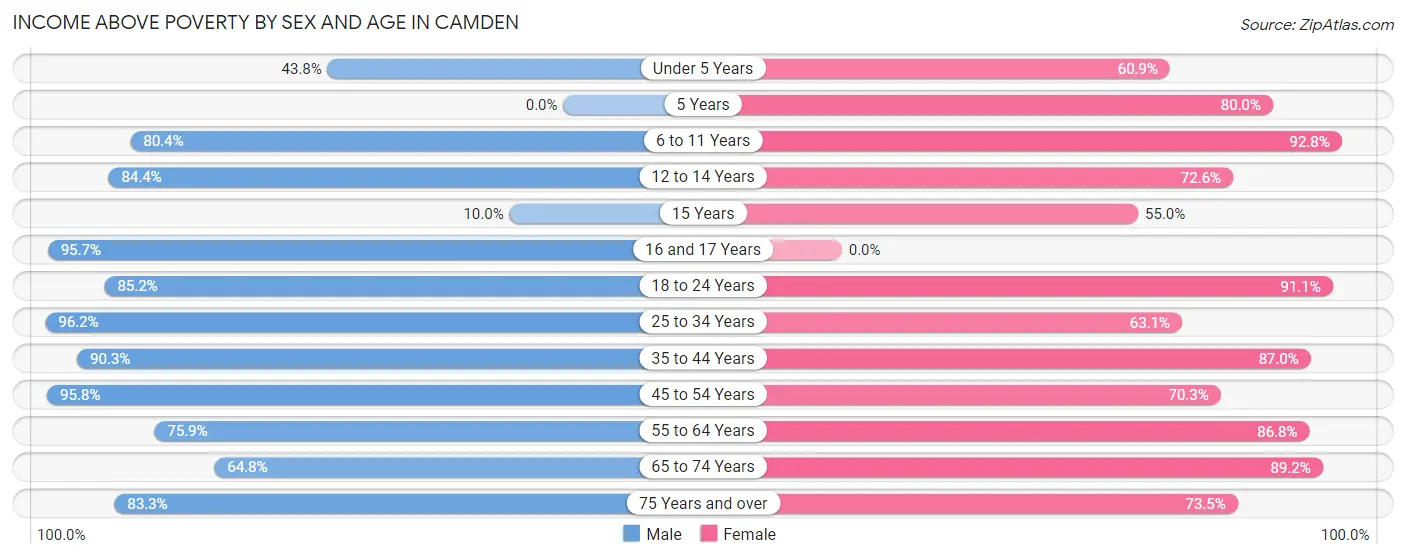
| Age Bracket | Male | Female |
| Under 5 Years | 207 (43.8%) | 154 (60.9%) |
| 5 Years | 0 (0.0%) | 44 (80.0%) |
| 6 to 11 Years | 377 (80.4%) | 398 (92.8%) |
| 12 to 14 Years | 179 (84.4%) | 241 (72.6%) |
| 15 Years | 6 (10.0%) | 22 (55.0%) |
| 16 and 17 Years | 223 (95.7%) | 0 (0.0%) |
| 18 to 24 Years | 402 (85.2%) | 235 (91.1%) |
| 25 to 34 Years | 601 (96.2%) | 409 (63.1%) |
| 35 to 44 Years | 482 (90.3%) | 644 (87.0%) |
| 45 to 54 Years | 460 (95.8%) | 348 (70.3%) |
| 55 to 64 Years | 501 (75.9%) | 669 (86.8%) |
| 65 to 74 Years | 300 (64.8%) | 564 (89.2%) |
| 75 Years and over | 210 (83.3%) | 418 (73.5%) |
| Total | 3,948 (79.2%) | 4,146 (78.5%) |
Income Below Poverty Among Married-Couple Families in Camden
The poverty statistics for married-couple families in Camden show that 1.9% or 27 of the total 1,437 families live below the poverty line. Families with 1 or 2 children have the highest poverty rate of 4.0%, comprising of 15 families. On the other hand, families with 3 or 4 children have the lowest poverty rate of 0.0%, which includes 0 families.
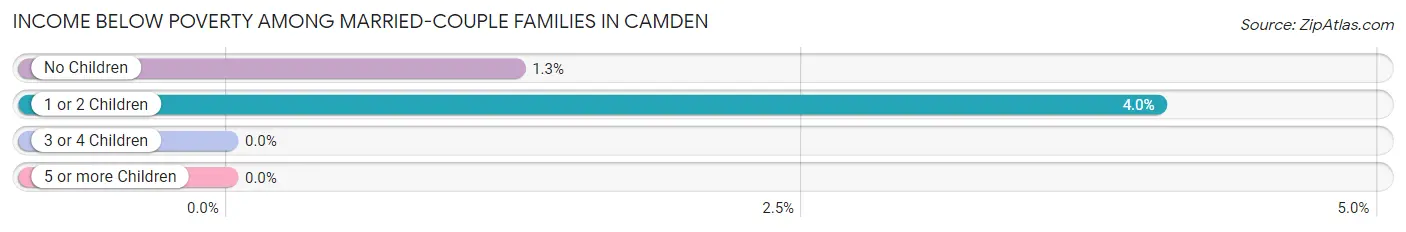
| Children | Above Poverty | Below Poverty |
| No Children | 948 (98.8%) | 12 (1.3%) |
| 1 or 2 Children | 356 (96.0%) | 15 (4.0%) |
| 3 or 4 Children | 106 (100.0%) | 0 (0.0%) |
| 5 or more Children | 0 (0.0%) | 0 (0.0%) |
| Total | 1,410 (98.1%) | 27 (1.9%) |
Income Below Poverty Among Single-Parent Households in Camden
According to the poverty data in Camden, 28.2% or 40 single-father households and 30.6% or 285 single-mother households are living below the poverty line. Among single-father households, those with 1 or 2 children have the highest poverty rate, with 25 households (45.5%) experiencing poverty. Likewise, among single-mother households, those with 5 or more children have the highest poverty rate, with 9 households (100.0%) falling below the poverty line.
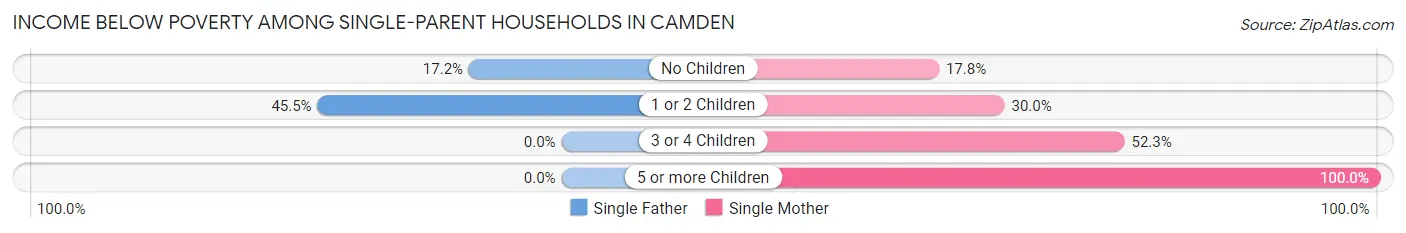
| Children | Single Father | Single Mother |
| No Children | 15 (17.2%) | 49 (17.7%) |
| 1 or 2 Children | 25 (45.5%) | 148 (30.0%) |
| 3 or 4 Children | 0 (0.0%) | 79 (52.3%) |
| 5 or more Children | 0 (0.0%) | 9 (100.0%) |
| Total | 40 (28.2%) | 285 (30.6%) |
Income Below Poverty Among Married-Couple vs Single-Parent Households in Camden
The poverty data for Camden shows that 27 of the married-couple family households (1.9%) and 325 of the single-parent households (30.3%) are living below the poverty level. Within the married-couple family households, those with 1 or 2 children have the highest poverty rate, with 15 households (4.0%) falling below the poverty line. Among the single-parent households, those with 5 or more children have the highest poverty rate, with 9 household (100.0%) living below poverty.
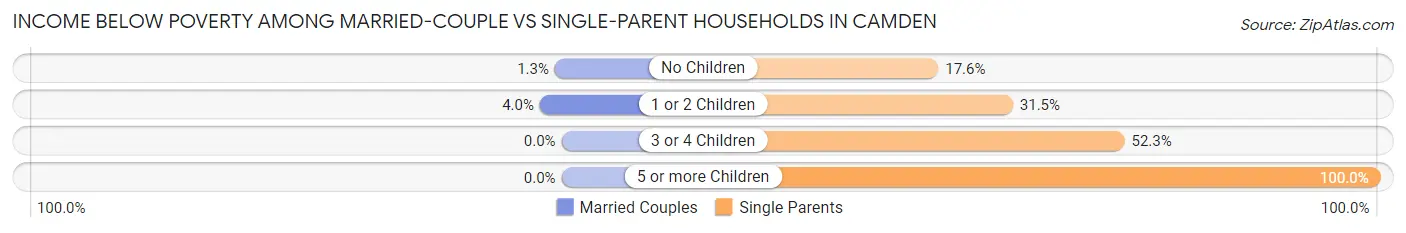
| Children | Married-Couple Families | Single-Parent Households |
| No Children | 12 (1.3%) | 64 (17.6%) |
| 1 or 2 Children | 15 (4.0%) | 173 (31.5%) |
| 3 or 4 Children | 0 (0.0%) | 79 (52.3%) |
| 5 or more Children | 0 (0.0%) | 9 (100.0%) |
| Total | 27 (1.9%) | 325 (30.3%) |
Race in Camden
The most populous races in Camden are Black / African American (5,315 | 50.2%), White / Caucasian (4,977 | 47.0%), and Two or more Races (247 | 2.3%).
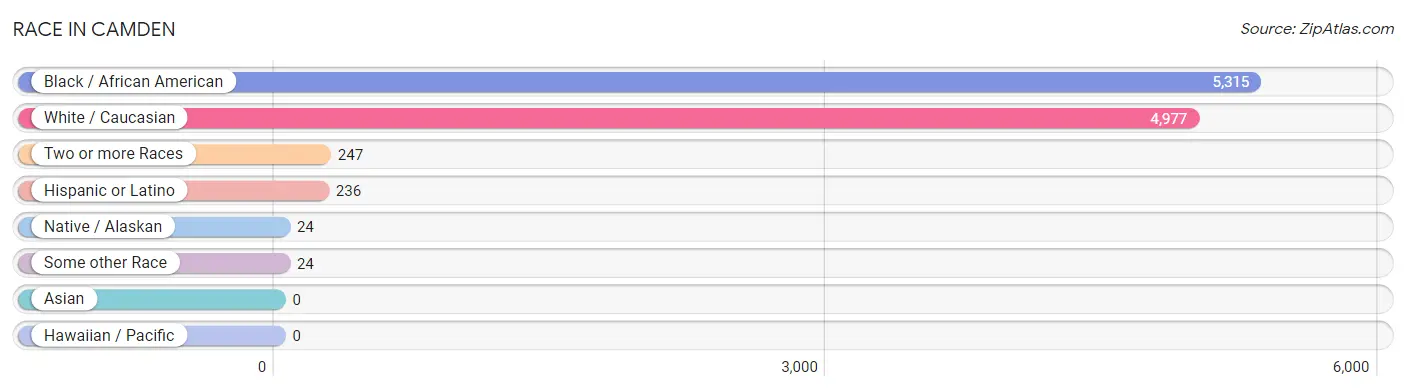
| Race | # Population | % Population |
| Asian | 0 | 0.0% |
| Black / African American | 5,315 | 50.2% |
| Hawaiian / Pacific | 0 | 0.0% |
| Hispanic or Latino | 236 | 2.2% |
| Native / Alaskan | 24 | 0.2% |
| White / Caucasian | 4,977 | 47.0% |
| Two or more Races | 247 | 2.3% |
| Some other Race | 24 | 0.2% |
| Total | 10,587 | 100.0% |
Ancestry in Camden
The most populous ancestries reported in Camden are Irish (725 | 6.9%), English (691 | 6.5%), American (326 | 3.1%), Scottish (248 | 2.3%), and Mexican (201 | 1.9%), together accounting for 20.7% of all Camden residents.
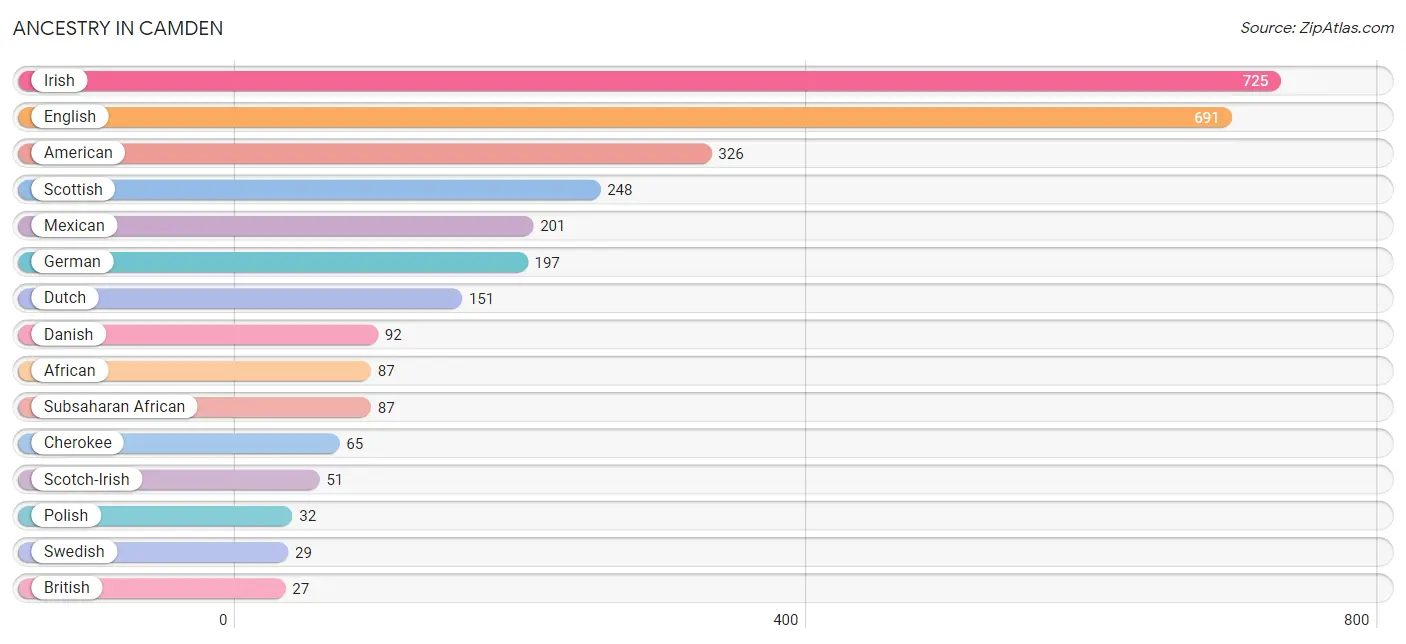
| Ancestry | # Population | % Population |
| African | 87 | 0.8% |
| American | 326 | 3.1% |
| British | 27 | 0.3% |
| Canadian | 21 | 0.2% |
| Central American | 11 | 0.1% |
| Cherokee | 65 | 0.6% |
| Danish | 92 | 0.9% |
| Dutch | 151 | 1.4% |
| English | 691 | 6.5% |
| European | 13 | 0.1% |
| French | 19 | 0.2% |
| German | 197 | 1.9% |
| Guatemalan | 11 | 0.1% |
| Haitian | 7 | 0.1% |
| Irish | 725 | 6.9% |
| Italian | 14 | 0.1% |
| Mexican | 201 | 1.9% |
| Norwegian | 5 | 0.1% |
| Osage | 6 | 0.1% |
| Polish | 32 | 0.3% |
| Scandinavian | 19 | 0.2% |
| Scotch-Irish | 51 | 0.5% |
| Scottish | 248 | 2.3% |
| Spaniard | 6 | 0.1% |
| Subsaharan African | 87 | 0.8% |
| Swedish | 29 | 0.3% | View All 26 Rows |
Immigrants in Camden
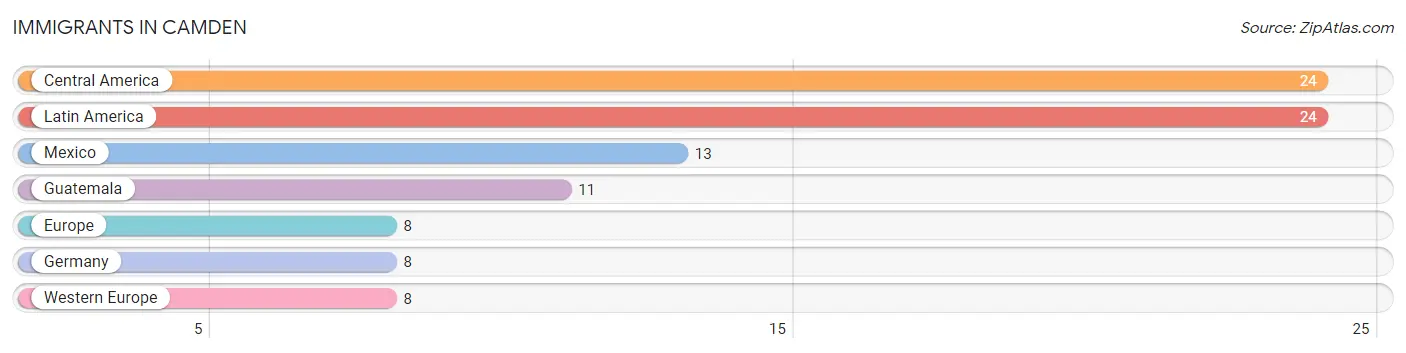
The most numerous immigrant groups reported in Camden came from Central America (24 | 0.2%), Latin America (24 | 0.2%), Mexico (13 | 0.1%), Guatemala (11 | 0.1%), and Europe (8 | 0.1%), together accounting for 0.8% of all Camden residents.
| Immigration Origin | # Population | % Population |
| Central America | 24 | 0.2% |
| Europe | 8 | 0.1% |
| Germany | 8 | 0.1% |
| Guatemala | 11 | 0.1% |
| Latin America | 24 | 0.2% |
| Mexico | 13 | 0.1% |
| Western Europe | 8 | 0.1% | View All 7 Rows |
Sex and Age in Camden
Sex and Age in Camden
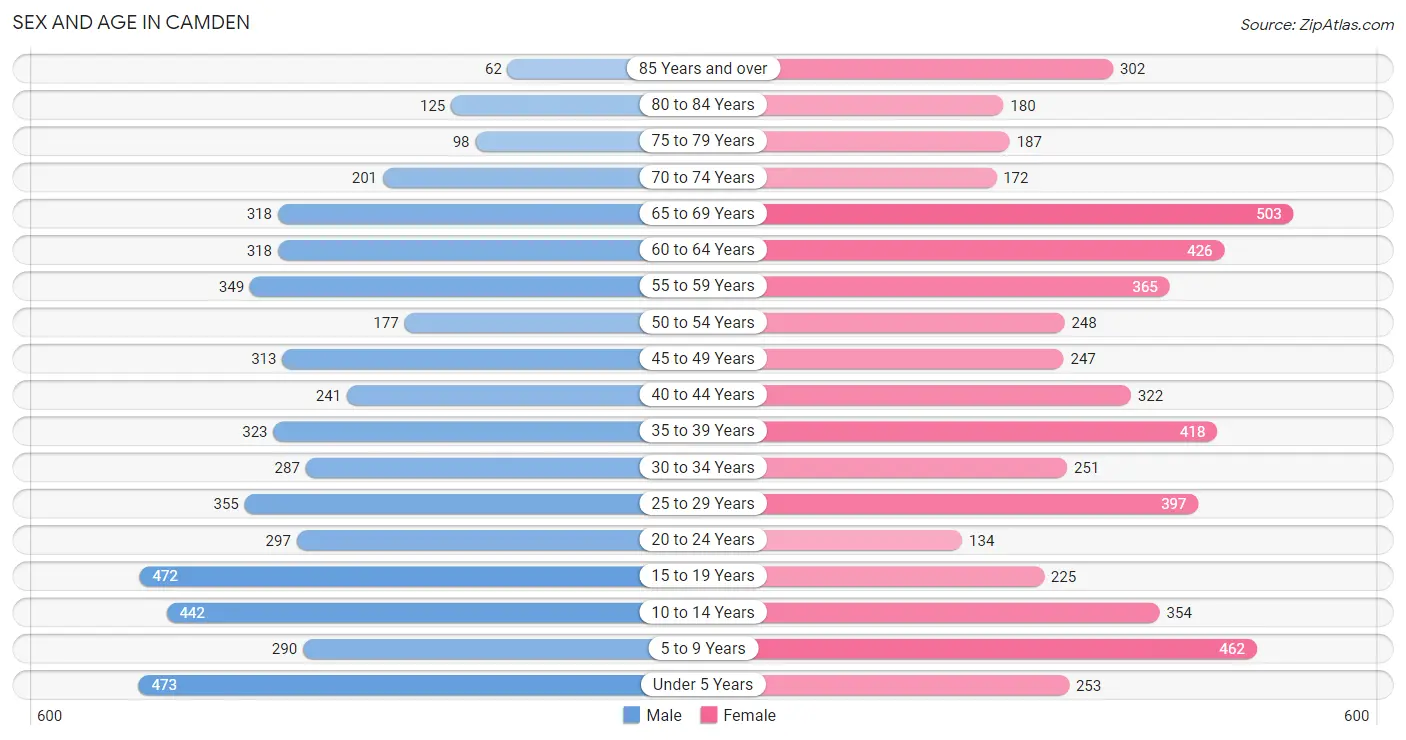
The most populous age groups in Camden are Under 5 Years (473 | 9.2%) for men and 65 to 69 Years (503 | 9.2%) for women.
| Age Bracket | Male | Female |
| Under 5 Years | 473 (9.2%) | 253 (4.6%) |
| 5 to 9 Years | 290 (5.6%) | 462 (8.5%) |
| 10 to 14 Years | 442 (8.6%) | 354 (6.5%) |
| 15 to 19 Years | 472 (9.2%) | 225 (4.1%) |
| 20 to 24 Years | 297 (5.8%) | 134 (2.5%) |
| 25 to 29 Years | 355 (6.9%) | 397 (7.3%) |
| 30 to 34 Years | 287 (5.6%) | 251 (4.6%) |
| 35 to 39 Years | 323 (6.3%) | 418 (7.7%) |
| 40 to 44 Years | 241 (4.7%) | 322 (5.9%) |
| 45 to 49 Years | 313 (6.1%) | 247 (4.5%) |
| 50 to 54 Years | 177 (3.4%) | 248 (4.5%) |
| 55 to 59 Years | 349 (6.8%) | 365 (6.7%) |
| 60 to 64 Years | 318 (6.2%) | 426 (7.8%) |
| 65 to 69 Years | 318 (6.2%) | 503 (9.2%) |
| 70 to 74 Years | 201 (3.9%) | 172 (3.2%) |
| 75 to 79 Years | 98 (1.9%) | 187 (3.4%) |
| 80 to 84 Years | 125 (2.4%) | 180 (3.3%) |
| 85 Years and over | 62 (1.2%) | 302 (5.6%) |
| Total | 5,141 (100.0%) | 5,446 (100.0%) |
Families and Households in Camden
Median Family Size in Camden
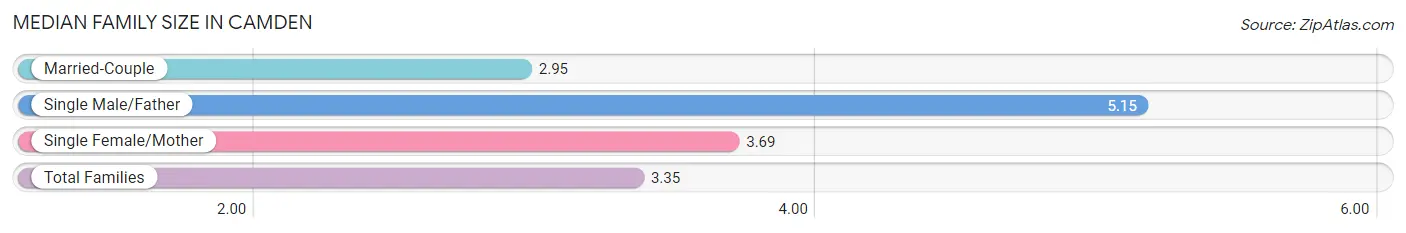
The median family size in Camden is 3.35 persons per family, with single male/father families (142 | 5.7%) accounting for the largest median family size of 5.15 persons per family. On the other hand, married-couple families (1,437 | 57.3%) represent the smallest median family size with 2.95 persons per family.
| Family Type | # Families | Family Size |
| Married-Couple | 1,437 (57.3%) | 2.95 |
| Single Male/Father | 142 (5.7%) | 5.15 |
| Single Female/Mother | 930 (37.1%) | 3.69 |
| Total Families | 2,509 (100.0%) | 3.35 |
Median Household Size in Camden
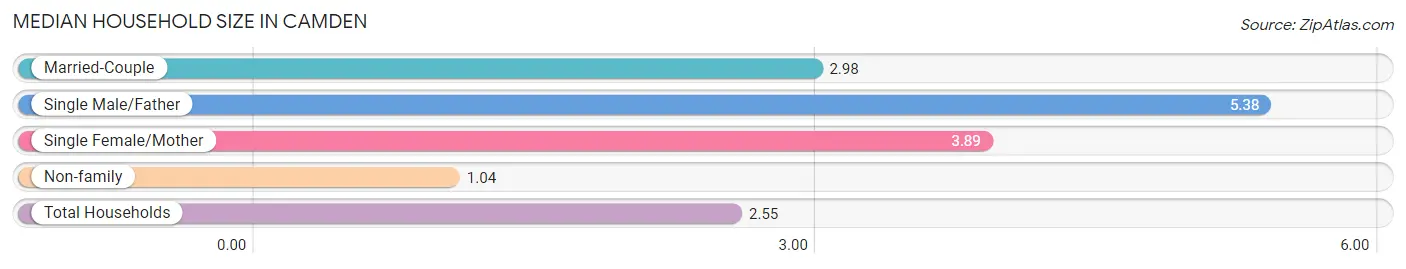
The median household size in Camden is 2.55 persons per household, with single male/father households (142 | 3.5%) accounting for the largest median household size of 5.38 persons per household. non-family households (1,517 | 37.7%) represent the smallest median household size with 1.04 persons per household.
| Household Type | # Households | Household Size |
| Married-Couple | 1,437 (35.7%) | 2.98 |
| Single Male/Father | 142 (3.5%) | 5.38 |
| Single Female/Mother | 930 (23.1%) | 3.89 |
| Non-family | 1,517 (37.7%) | 1.04 |
| Total Households | 4,026 (100.0%) | 2.55 |
Household Size by Marriage Status in Camden
Out of a total of 4,026 households in Camden, 2,509 (62.3%) are family households, while 1,517 (37.7%) are nonfamily households. The most numerous type of family households are 2-person households, comprising 1,260, and the most common type of nonfamily households are 1-person households, comprising 1,463.
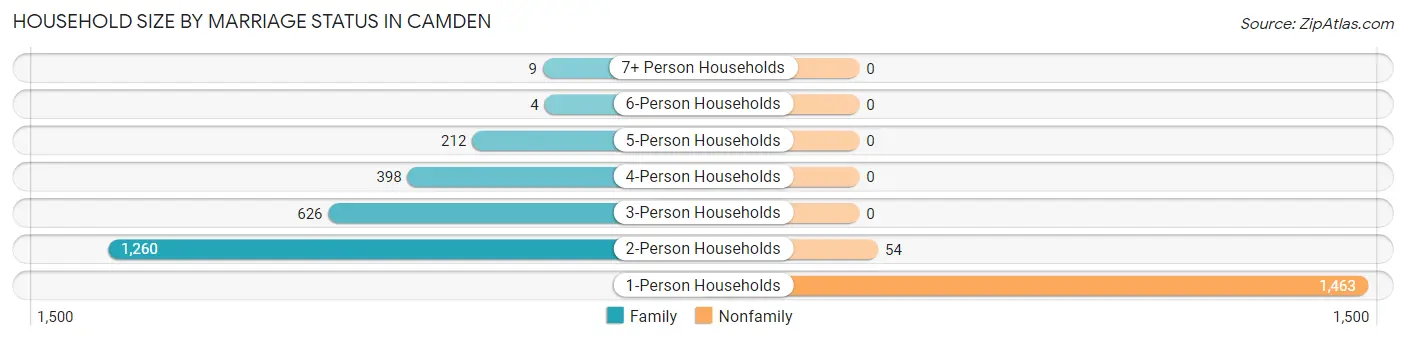
| Household Size | Family Households | Nonfamily Households |
| 1-Person Households | - | 1,463 (36.3%) |
| 2-Person Households | 1,260 (31.3%) | 54 (1.3%) |
| 3-Person Households | 626 (15.5%) | 0 (0.0%) |
| 4-Person Households | 398 (9.9%) | 0 (0.0%) |
| 5-Person Households | 212 (5.3%) | 0 (0.0%) |
| 6-Person Households | 4 (0.1%) | 0 (0.0%) |
| 7+ Person Households | 9 (0.2%) | 0 (0.0%) |
| Total | 2,509 (62.3%) | 1,517 (37.7%) |
Female Fertility in Camden
Fertility by Age in Camden
Average fertility rate in Camden is 104.0 births per 1,000 women. Women in the age bracket of 20 to 34 years have the highest fertility rate with 173.0 births per 1,000 women. Women in the age bracket of 20 to 34 years acount for 65.2% of all women with births.
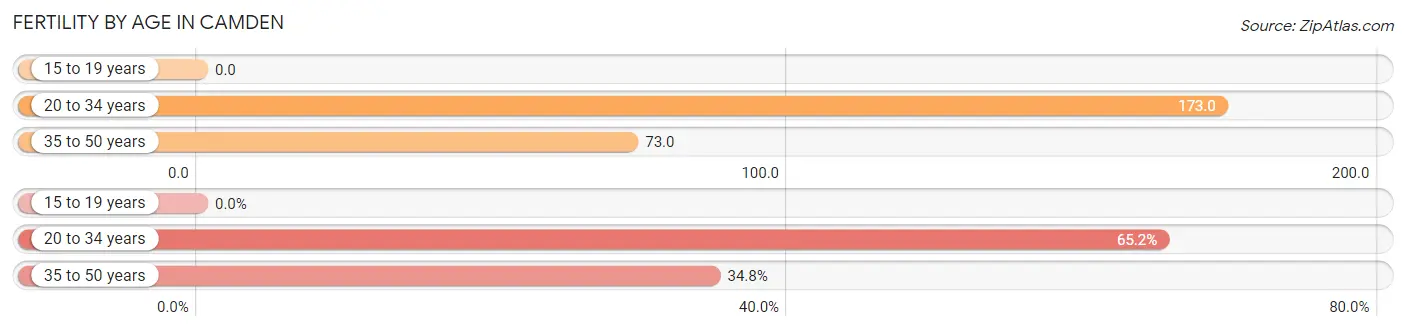
| Age Bracket | Women with Births | Births / 1,000 Women |
| 15 to 19 years | 0 (0.0%) | 0.0 |
| 20 to 34 years | 135 (65.2%) | 173.0 |
| 35 to 50 years | 72 (34.8%) | 73.0 |
| Total | 207 (100.0%) | 104.0 |
Fertility by Age by Marriage Status in Camden
20.3% of women with births (207) in Camden are married. The highest percentage of unmarried women with births falls into 35 to 50 years age bracket with 100.0% of them unmarried at the time of birth, while the lowest percentage of unmarried women with births belong to 20 to 34 years age bracket with 68.9% of them unmarried.
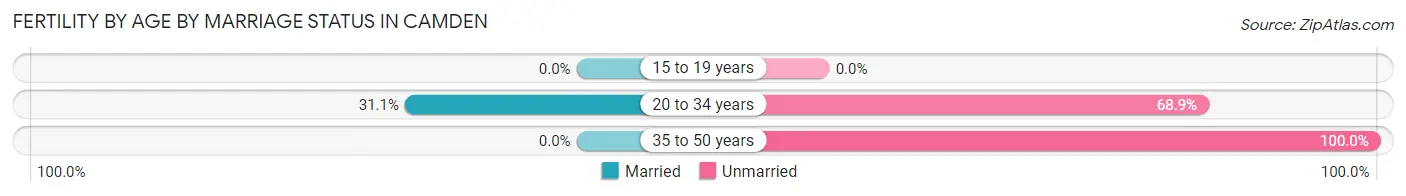
| Age Bracket | Married | Unmarried |
| 15 to 19 years | 0 (0.0%) | 0 (0.0%) |
| 20 to 34 years | 42 (31.1%) | 93 (68.9%) |
| 35 to 50 years | 0 (0.0%) | 72 (100.0%) |
| Total | 42 (20.3%) | 165 (79.7%) |
Fertility by Education in Camden
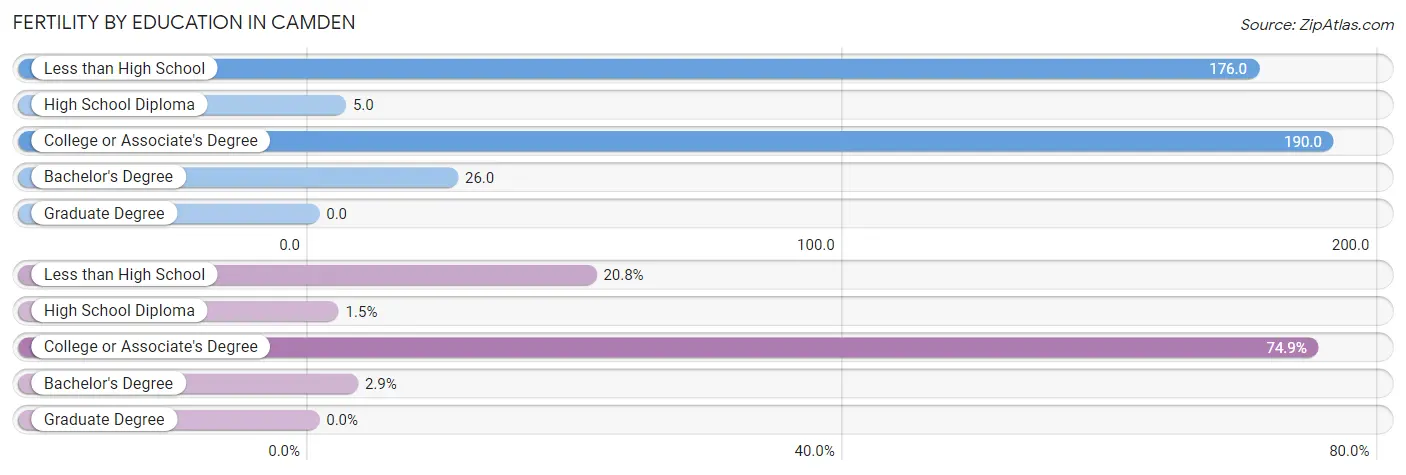
| Educational Attainment | Women with Births | Births / 1,000 Women |
| Less than High School | 43 (20.8%) | 176.0 |
| High School Diploma | 3 (1.5%) | 5.0 |
| College or Associate's Degree | 155 (74.9%) | 190.0 |
| Bachelor's Degree | 6 (2.9%) | 26.0 |
| Graduate Degree | 0 (0.0%) | 0.0 |
| Total | 207 (100.0%) | 104.0 |
Fertility by Education by Marriage Status in Camden
79.7% of women with births in Camden are unmarried. Women with the educational attainment of high school diploma are most likely to be married with 100.0% of them married at childbirth, while women with the educational attainment of college or associate's degree are least likely to be married with 97.4% of them unmarried at childbirth.
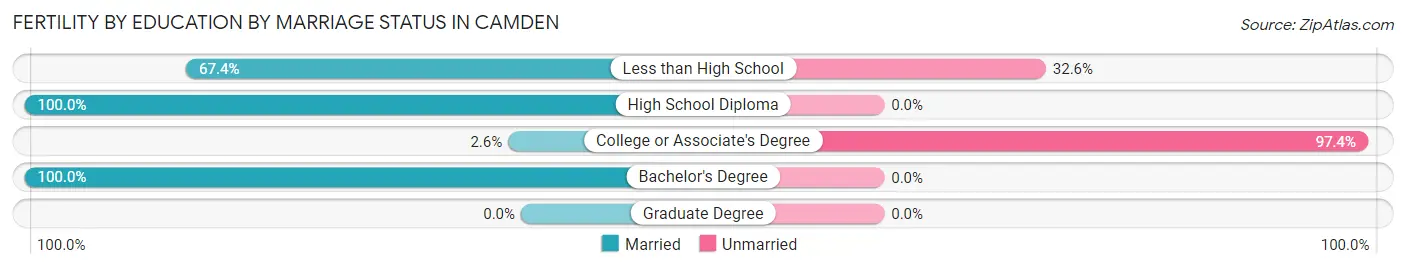
| Educational Attainment | Married | Unmarried |
| Less than High School | 29 (67.4%) | 14 (32.6%) |
| High School Diploma | 3 (100.0%) | 0 (0.0%) |
| College or Associate's Degree | 4 (2.6%) | 151 (97.4%) |
| Bachelor's Degree | 6 (100.0%) | 0 (0.0%) |
| Graduate Degree | 0 (0.0%) | 0 (0.0%) |
| Total | 42 (20.3%) | 165 (79.7%) |
Employment Characteristics in Camden
Employment by Class of Employer in Camden
Among the 3,962 employed individuals in Camden, private company employees (2,727 | 68.8%), self-employed (not incorporated) (298 | 7.5%), and local government employees (287 | 7.2%) make up the most common classes of employment.
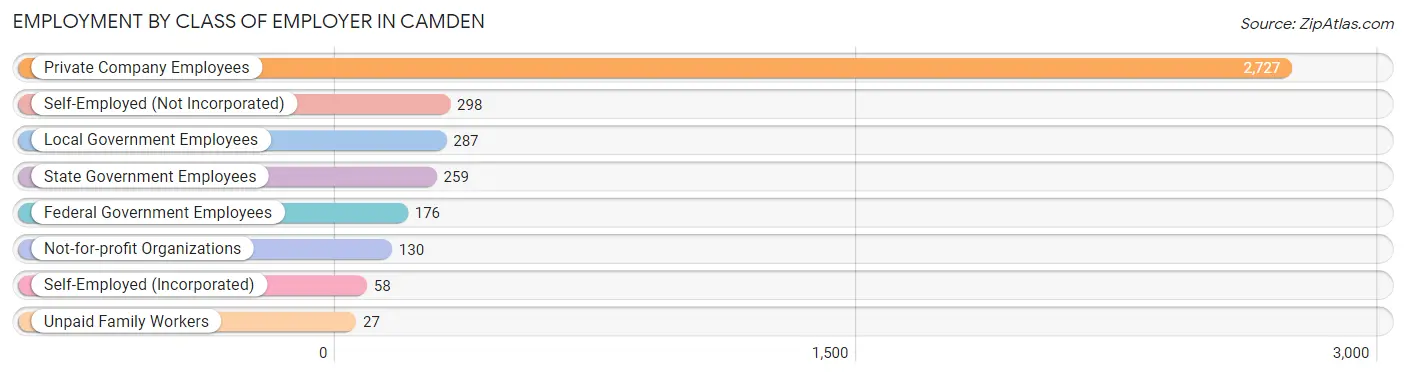
| Employer Class | # Employees | % Employees |
| Private Company Employees | 2,727 | 68.8% |
| Self-Employed (Incorporated) | 58 | 1.5% |
| Self-Employed (Not Incorporated) | 298 | 7.5% |
| Not-for-profit Organizations | 130 | 3.3% |
| Local Government Employees | 287 | 7.2% |
| State Government Employees | 259 | 6.5% |
| Federal Government Employees | 176 | 4.4% |
| Unpaid Family Workers | 27 | 0.7% |
| Total | 3,962 | 100.0% |
Employment Status by Age in Camden
According to the labor force statistics for Camden, out of the total population over 16 years of age (8,213), 52.5% or 4,312 individuals are in the labor force, with 5.8% or 250 of them unemployed. The age group with the highest labor force participation rate is 30 to 34 years, with 92.6% or 498 individuals in the labor force. Within the labor force, the 20 to 24 years age range has the highest percentage of unemployed individuals, with 22.7% or 81 of them being unemployed.
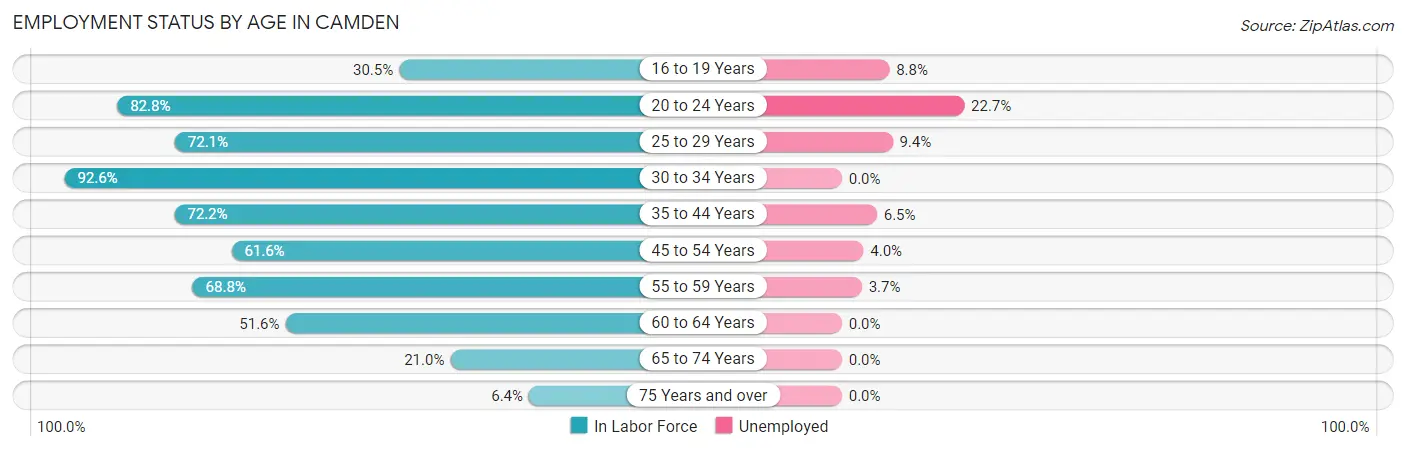
| Age Bracket | In Labor Force | Unemployed |
| 16 to 19 Years | 182 (30.5%) | 16 (8.8%) |
| 20 to 24 Years | 357 (82.8%) | 81 (22.7%) |
| 25 to 29 Years | 542 (72.1%) | 51 (9.4%) |
| 30 to 34 Years | 498 (92.6%) | 0 (0.0%) |
| 35 to 44 Years | 941 (72.2%) | 61 (6.5%) |
| 45 to 54 Years | 607 (61.6%) | 24 (4.0%) |
| 55 to 59 Years | 491 (68.8%) | 18 (3.7%) |
| 60 to 64 Years | 384 (51.6%) | 0 (0.0%) |
| 65 to 74 Years | 251 (21.0%) | 0 (0.0%) |
| 75 Years and over | 61 (6.4%) | 0 (0.0%) |
| Total | 4,312 (52.5%) | 250 (5.8%) |
Employment Status by Educational Attainment in Camden
According to labor force statistics for Camden, 68.8% of individuals (3,465) out of the total population between 25 and 64 years of age (5,037) are in the labor force, with 4.5% or 156 of them being unemployed. The group with the highest labor force participation rate are those with the educational attainment of bachelor's degree or higher, with 93.1% or 804 individuals in the labor force. Within the labor force, individuals with less than high school education have the highest percentage of unemployment, with 19.6% or 44 of them being unemployed.
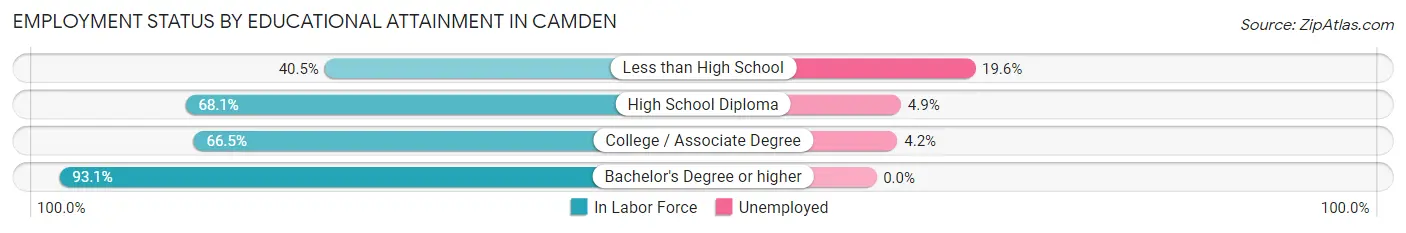
| Educational Attainment | In Labor Force | Unemployed |
| Less than High School | 225 (40.5%) | 109 (19.6%) |
| High School Diploma | 1,183 (68.1%) | 85 (4.9%) |
| College / Associate Degree | 1,251 (66.5%) | 79 (4.2%) |
| Bachelor's Degree or higher | 804 (93.1%) | 0 (0.0%) |
| Total | 3,465 (68.8%) | 227 (4.5%) |
Employment Occupations by Sex in Camden
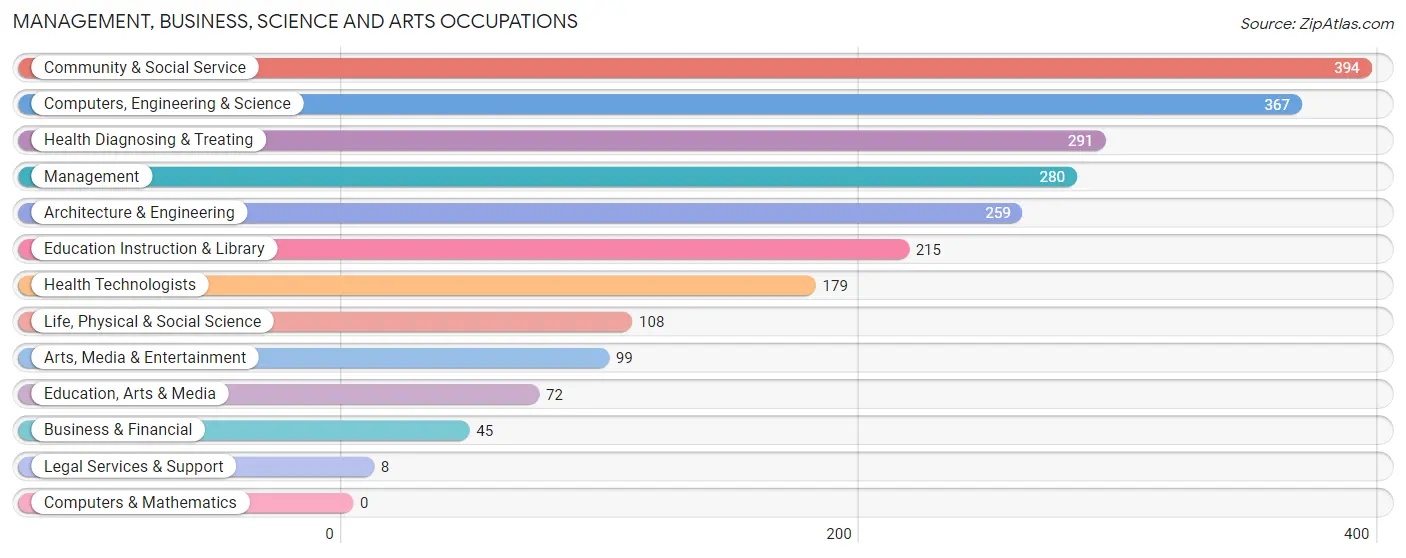
Management, Business, Science and Arts Occupations
The most common Management, Business, Science and Arts occupations in Camden are Community & Social Service (394 | 9.7%), Computers, Engineering & Science (367 | 9.0%), Health Diagnosing & Treating (291 | 7.2%), Management (280 | 6.9%), and Architecture & Engineering (259 | 6.4%).
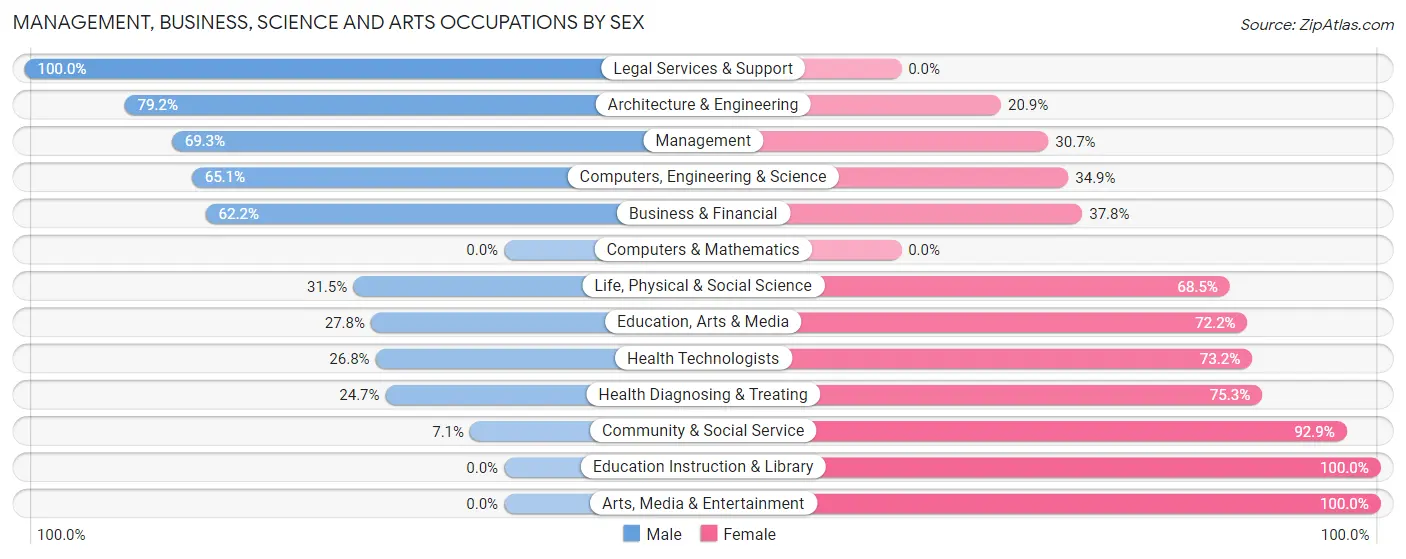
Management, Business, Science and Arts Occupations by Sex
Within the Management, Business, Science and Arts occupations in Camden, the most male-oriented occupations are Legal Services & Support (100.0%), Architecture & Engineering (79.1%), and Management (69.3%), while the most female-oriented occupations are Education Instruction & Library (100.0%), Arts, Media & Entertainment (100.0%), and Community & Social Service (92.9%).
| Occupation | Male | Female |
| Management | 194 (69.3%) | 86 (30.7%) |
| Business & Financial | 28 (62.2%) | 17 (37.8%) |
| Computers, Engineering & Science | 239 (65.1%) | 128 (34.9%) |
| Computers & Mathematics | 0 (0.0%) | 0 (0.0%) |
| Architecture & Engineering | 205 (79.1%) | 54 (20.8%) |
| Life, Physical & Social Science | 34 (31.5%) | 74 (68.5%) |
| Community & Social Service | 28 (7.1%) | 366 (92.9%) |
| Education, Arts & Media | 20 (27.8%) | 52 (72.2%) |
| Legal Services & Support | 8 (100.0%) | 0 (0.0%) |
| Education Instruction & Library | 0 (0.0%) | 215 (100.0%) |
| Arts, Media & Entertainment | 0 (0.0%) | 99 (100.0%) |
| Health Diagnosing & Treating | 72 (24.7%) | 219 (75.3%) |
| Health Technologists | 48 (26.8%) | 131 (73.2%) |
| Total (Category) | 561 (40.7%) | 816 (59.3%) |
| Total (Overall) | 2,158 (53.2%) | 1,900 (46.8%) |
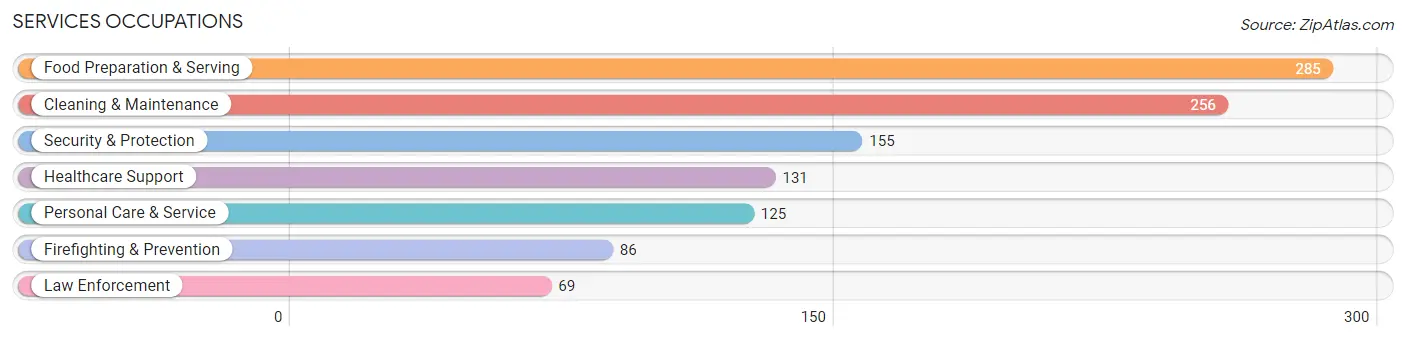
Services Occupations
The most common Services occupations in Camden are Food Preparation & Serving (285 | 7.0%), Cleaning & Maintenance (256 | 6.3%), Security & Protection (155 | 3.8%), Healthcare Support (131 | 3.2%), and Personal Care & Service (125 | 3.1%).
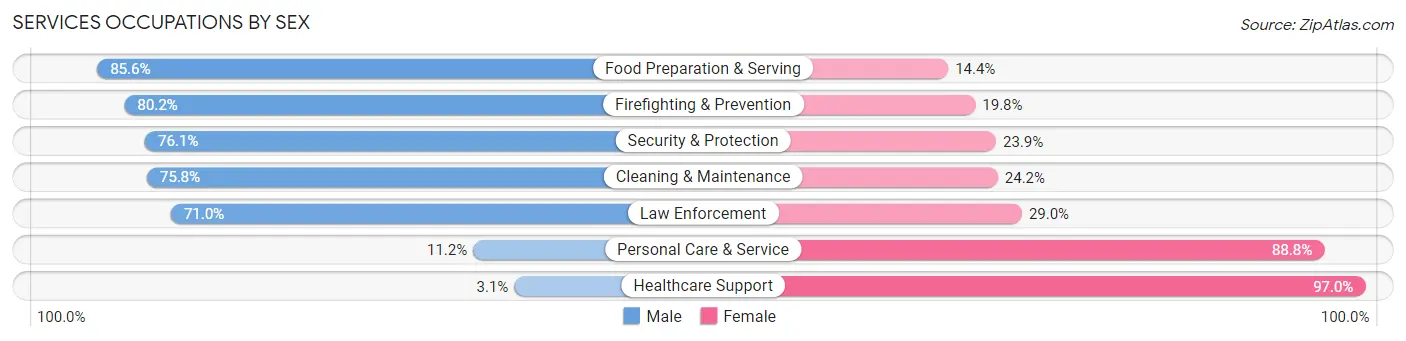
Services Occupations by Sex
Within the Services occupations in Camden, the most male-oriented occupations are Food Preparation & Serving (85.6%), Firefighting & Prevention (80.2%), and Security & Protection (76.1%), while the most female-oriented occupations are Healthcare Support (97.0%), Personal Care & Service (88.8%), and Law Enforcement (29.0%).
| Occupation | Male | Female |
| Healthcare Support | 4 (3.0%) | 127 (97.0%) |
| Security & Protection | 118 (76.1%) | 37 (23.9%) |
| Firefighting & Prevention | 69 (80.2%) | 17 (19.8%) |
| Law Enforcement | 49 (71.0%) | 20 (29.0%) |
| Food Preparation & Serving | 244 (85.6%) | 41 (14.4%) |
| Cleaning & Maintenance | 194 (75.8%) | 62 (24.2%) |
| Personal Care & Service | 14 (11.2%) | 111 (88.8%) |
| Total (Category) | 574 (60.3%) | 378 (39.7%) |
| Total (Overall) | 2,158 (53.2%) | 1,900 (46.8%) |
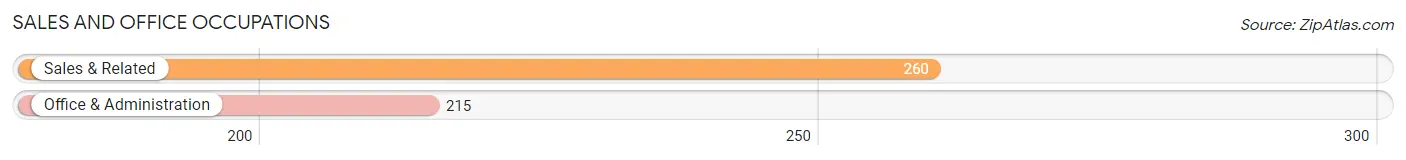
Sales and Office Occupations
The most common Sales and Office occupations in Camden are Sales & Related (260 | 6.4%), and Office & Administration (215 | 5.3%).
Sales and Office Occupations by Sex

| Occupation | Male | Female |
| Sales & Related | 69 (26.5%) | 191 (73.5%) |
| Office & Administration | 20 (9.3%) | 195 (90.7%) |
| Total (Category) | 89 (18.7%) | 386 (81.3%) |
| Total (Overall) | 2,158 (53.2%) | 1,900 (46.8%) |
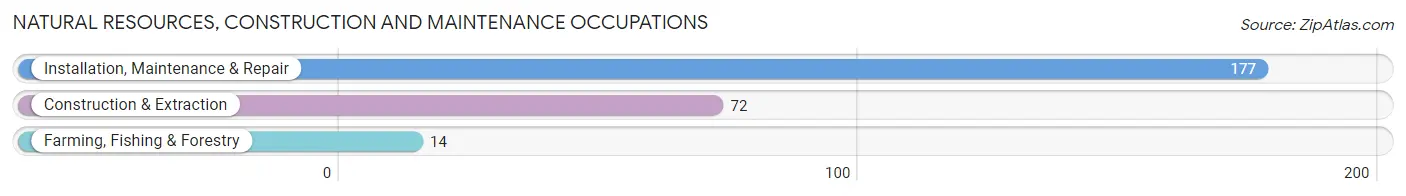
Natural Resources, Construction and Maintenance Occupations
The most common Natural Resources, Construction and Maintenance occupations in Camden are Installation, Maintenance & Repair (177 | 4.4%), Construction & Extraction (72 | 1.8%), and Farming, Fishing & Forestry (14 | 0.3%).
Natural Resources, Construction and Maintenance Occupations by Sex
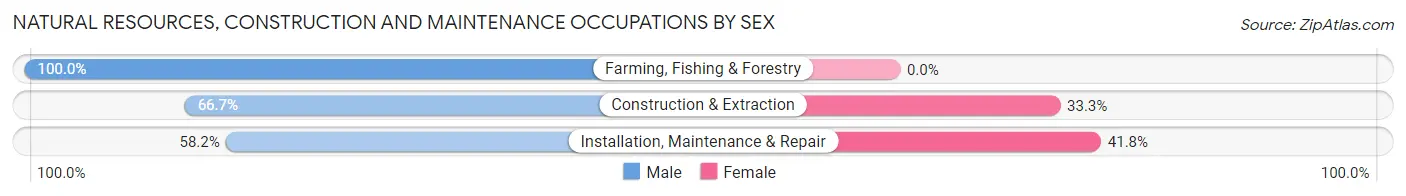
| Occupation | Male | Female |
| Farming, Fishing & Forestry | 14 (100.0%) | 0 (0.0%) |
| Construction & Extraction | 48 (66.7%) | 24 (33.3%) |
| Installation, Maintenance & Repair | 103 (58.2%) | 74 (41.8%) |
| Total (Category) | 165 (62.7%) | 98 (37.3%) |
| Total (Overall) | 2,158 (53.2%) | 1,900 (46.8%) |
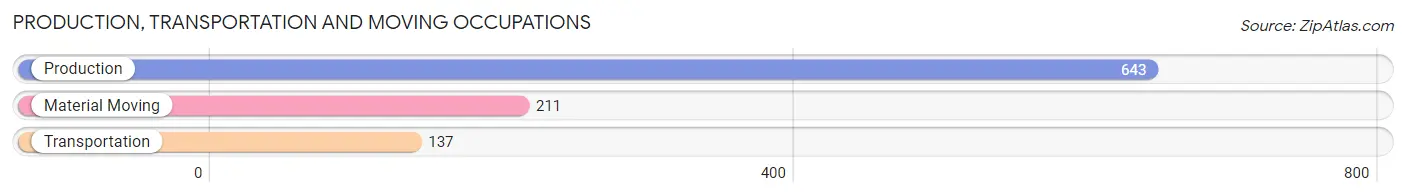
Production, Transportation and Moving Occupations
The most common Production, Transportation and Moving occupations in Camden are Production (643 | 15.9%), Material Moving (211 | 5.2%), and Transportation (137 | 3.4%).
Production, Transportation and Moving Occupations by Sex
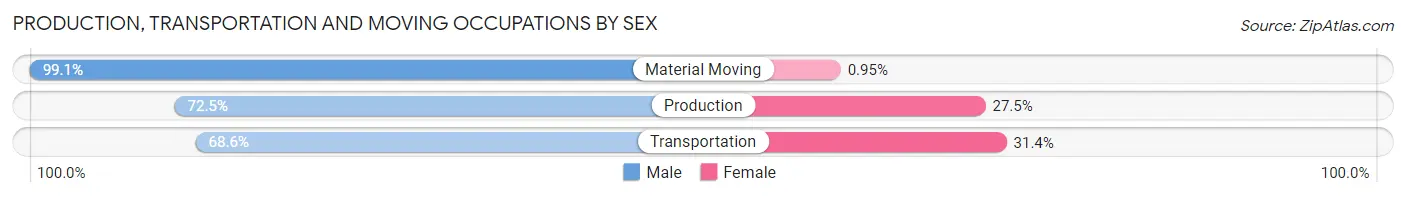
| Occupation | Male | Female |
| Production | 466 (72.5%) | 177 (27.5%) |
| Transportation | 94 (68.6%) | 43 (31.4%) |
| Material Moving | 209 (99.1%) | 2 (0.9%) |
| Total (Category) | 769 (77.6%) | 222 (22.4%) |
| Total (Overall) | 2,158 (53.2%) | 1,900 (46.8%) |
Employment Industries by Sex in Camden
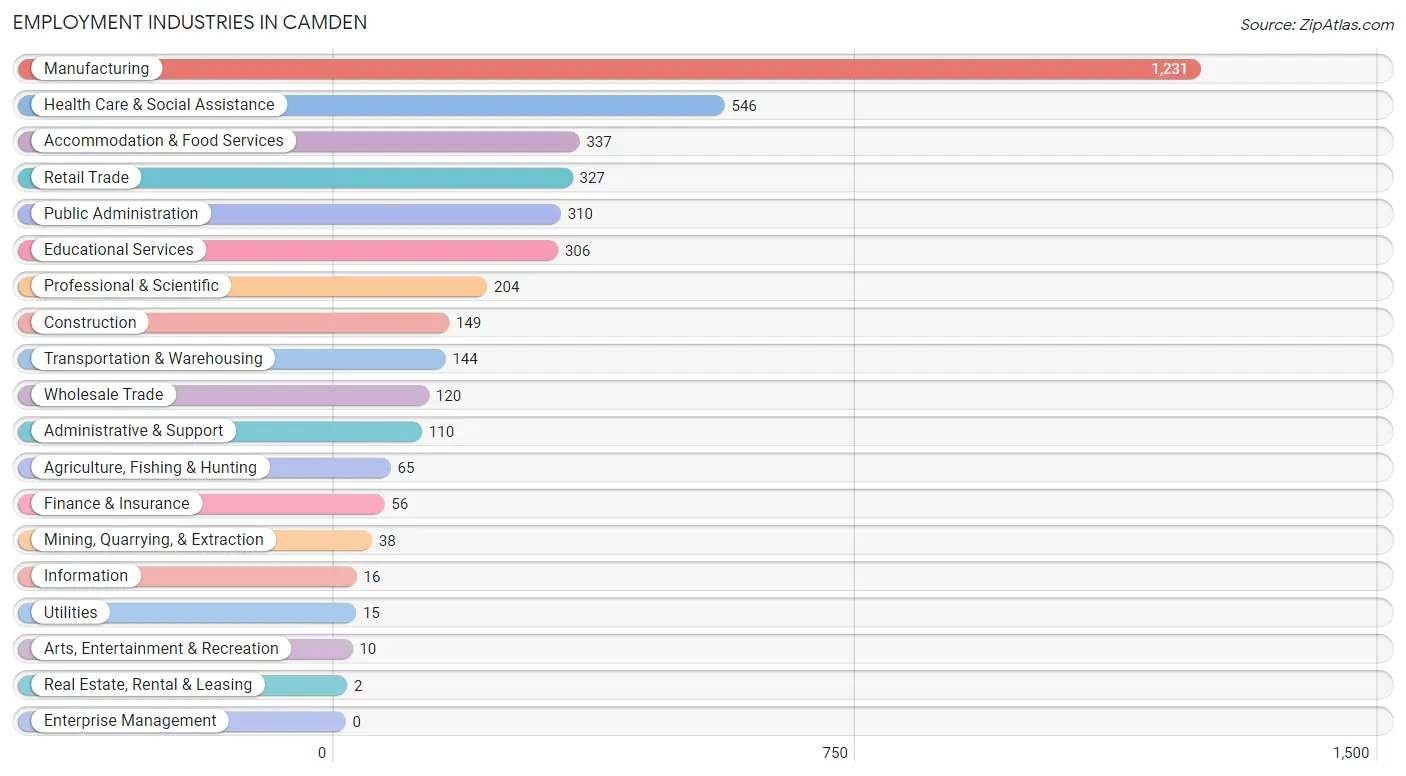
Employment Industries in Camden
The major employment industries in Camden include Manufacturing (1,231 | 30.3%), Health Care & Social Assistance (546 | 13.5%), Accommodation & Food Services (337 | 8.3%), Retail Trade (327 | 8.1%), and Public Administration (310 | 7.6%).
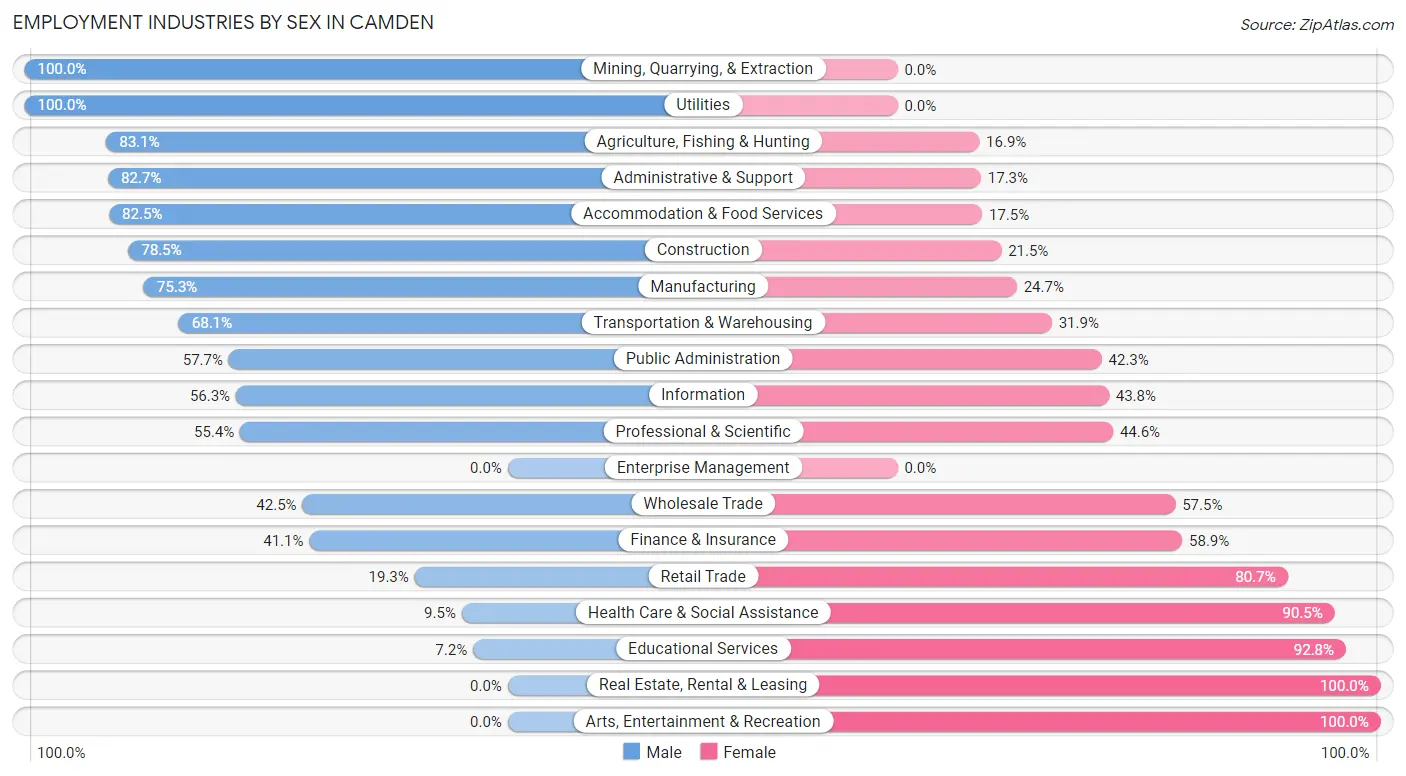
Employment Industries by Sex in Camden
The Camden industries that see more men than women are Mining, Quarrying, & Extraction (100.0%), Utilities (100.0%), and Agriculture, Fishing & Hunting (83.1%), whereas the industries that tend to have a higher number of women are Real Estate, Rental & Leasing (100.0%), Arts, Entertainment & Recreation (100.0%), and Educational Services (92.8%).
| Industry | Male | Female |
| Agriculture, Fishing & Hunting | 54 (83.1%) | 11 (16.9%) |
| Mining, Quarrying, & Extraction | 38 (100.0%) | 0 (0.0%) |
| Construction | 117 (78.5%) | 32 (21.5%) |
| Manufacturing | 927 (75.3%) | 304 (24.7%) |
| Wholesale Trade | 51 (42.5%) | 69 (57.5%) |
| Retail Trade | 63 (19.3%) | 264 (80.7%) |
| Transportation & Warehousing | 98 (68.1%) | 46 (31.9%) |
| Utilities | 15 (100.0%) | 0 (0.0%) |
| Information | 9 (56.2%) | 7 (43.8%) |
| Finance & Insurance | 23 (41.1%) | 33 (58.9%) |
| Real Estate, Rental & Leasing | 0 (0.0%) | 2 (100.0%) |
| Professional & Scientific | 113 (55.4%) | 91 (44.6%) |
| Enterprise Management | 0 (0.0%) | 0 (0.0%) |
| Administrative & Support | 91 (82.7%) | 19 (17.3%) |
| Educational Services | 22 (7.2%) | 284 (92.8%) |
| Health Care & Social Assistance | 52 (9.5%) | 494 (90.5%) |
| Arts, Entertainment & Recreation | 0 (0.0%) | 10 (100.0%) |
| Accommodation & Food Services | 278 (82.5%) | 59 (17.5%) |
| Public Administration | 179 (57.7%) | 131 (42.3%) |
| Total | 2,158 (53.2%) | 1,900 (46.8%) |
Education in Camden
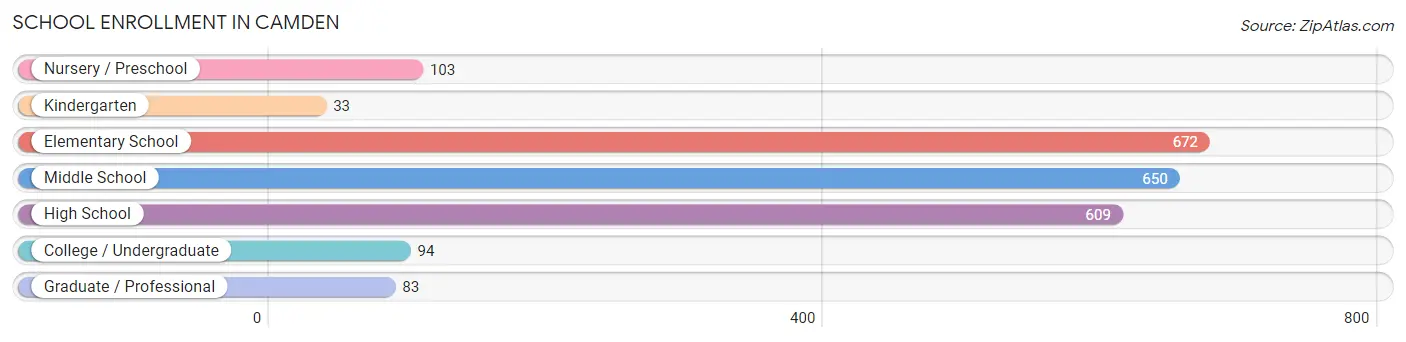
School Enrollment in Camden
The most common levels of schooling among the 2,244 students in Camden are elementary school (672 | 29.9%), middle school (650 | 29.0%), and high school (609 | 27.1%).
| School Level | # Students | % Students |
| Nursery / Preschool | 103 | 4.6% |
| Kindergarten | 33 | 1.5% |
| Elementary School | 672 | 29.9% |
| Middle School | 650 | 29.0% |
| High School | 609 | 27.1% |
| College / Undergraduate | 94 | 4.2% |
| Graduate / Professional | 83 | 3.7% |
| Total | 2,244 | 100.0% |
School Enrollment by Age by Funding Source in Camden
Out of a total of 2,244 students who are enrolled in schools in Camden, 101 (4.5%) attend a private institution, while the remaining 2,143 (95.5%) are enrolled in public schools. The age group of 35 years and over has the highest likelihood of being enrolled in private schools, with 28 (37.3% in the age bracket) enrolled. Conversely, the age group of 3 to 4 year olds has the lowest likelihood of being enrolled in a private school, with 61 (100.0% in the age bracket) attending a public institution.
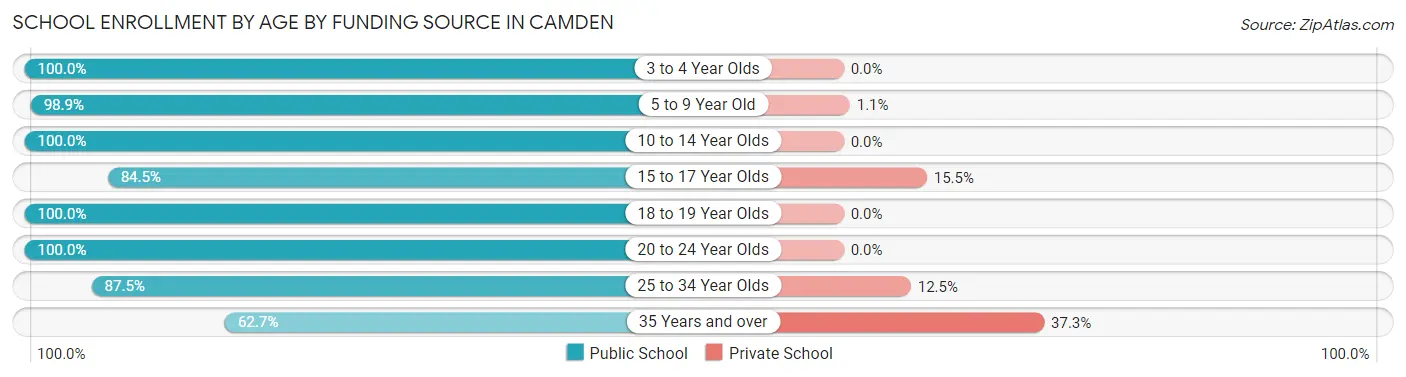
| Age Bracket | Public School | Private School |
| 3 to 4 Year Olds | 61 (100.0%) | 0 (0.0%) |
| 5 to 9 Year Old | 693 (98.9%) | 8 (1.1%) |
| 10 to 14 Year Olds | 796 (100.0%) | 0 (0.0%) |
| 15 to 17 Year Olds | 333 (84.5%) | 61 (15.5%) |
| 18 to 19 Year Olds | 144 (100.0%) | 0 (0.0%) |
| 20 to 24 Year Olds | 33 (100.0%) | 0 (0.0%) |
| 25 to 34 Year Olds | 35 (87.5%) | 5 (12.5%) |
| 35 Years and over | 47 (62.7%) | 28 (37.3%) |
| Total | 2,143 (95.5%) | 101 (4.5%) |
Educational Attainment by Field of Study in Camden
Education (319 | 26.7%), business (269 | 22.5%), engineering (174 | 14.6%), science & technology (135 | 11.3%), and bio, nature & agricultural (100 | 8.4%) are the most common fields of study among 1,195 individuals in Camden who have obtained a bachelor's degree or higher.
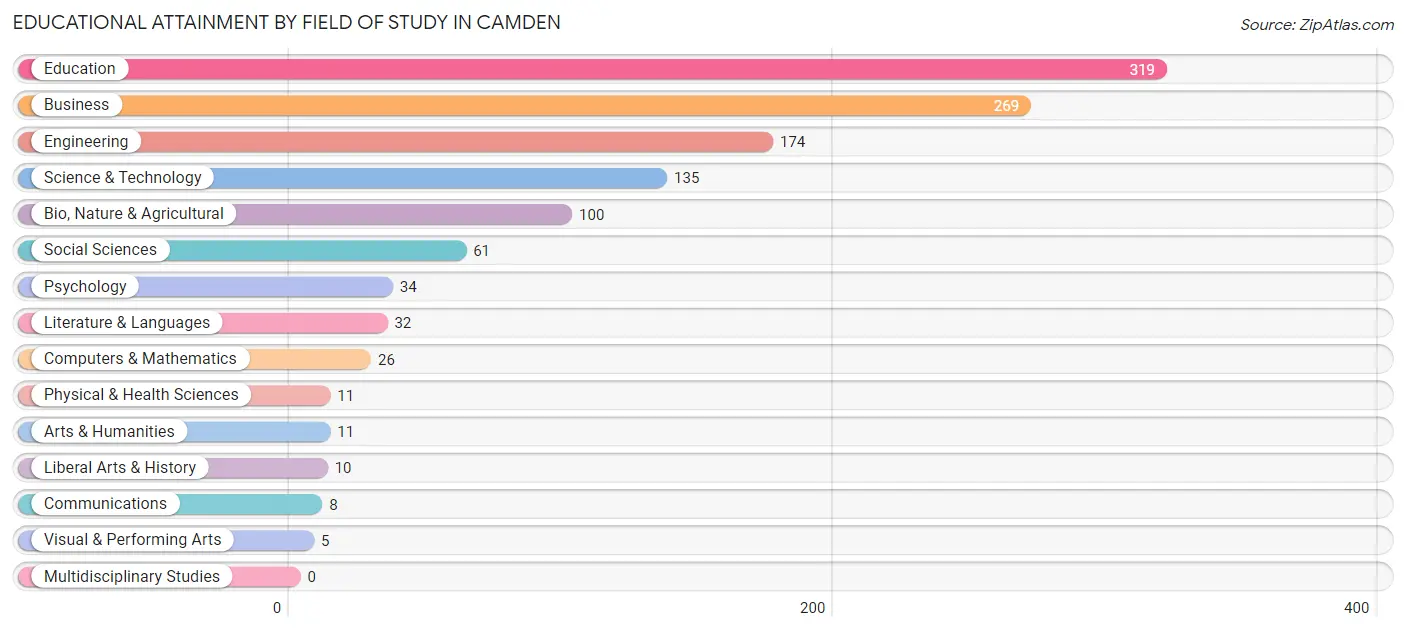
| Field of Study | # Graduates | % Graduates |
| Computers & Mathematics | 26 | 2.2% |
| Bio, Nature & Agricultural | 100 | 8.4% |
| Physical & Health Sciences | 11 | 0.9% |
| Psychology | 34 | 2.9% |
| Social Sciences | 61 | 5.1% |
| Engineering | 174 | 14.6% |
| Multidisciplinary Studies | 0 | 0.0% |
| Science & Technology | 135 | 11.3% |
| Business | 269 | 22.5% |
| Education | 319 | 26.7% |
| Literature & Languages | 32 | 2.7% |
| Liberal Arts & History | 10 | 0.8% |
| Visual & Performing Arts | 5 | 0.4% |
| Communications | 8 | 0.7% |
| Arts & Humanities | 11 | 0.9% |
| Total | 1,195 | 100.0% |
Transportation & Commute in Camden
Vehicle Availability by Sex in Camden
The most prevalent vehicle ownership categories in Camden are males with 2 vehicles (828, accounting for 38.3%) and females with 2 vehicles (591, making up 46.1%).
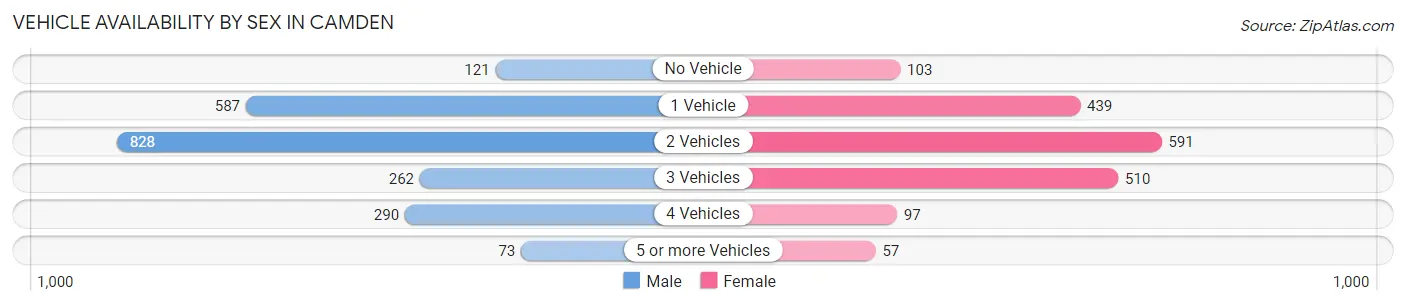
| Vehicles Available | Male | Female |
| No Vehicle | 121 (5.6%) | 103 (5.7%) |
| 1 Vehicle | 587 (27.2%) | 439 (24.4%) |
| 2 Vehicles | 828 (38.3%) | 591 (32.9%) |
| 3 Vehicles | 262 (12.1%) | 510 (28.4%) |
| 4 Vehicles | 290 (13.4%) | 97 (5.4%) |
| 5 or more Vehicles | 73 (3.4%) | 57 (3.2%) |
| Total | 2,161 (100.0%) | 1,797 (100.0%) |
Commute Time in Camden
The most frequently occuring commute durations in Camden are 10 to 14 minutes (879 commuters, 22.7%), 5 to 9 minutes (581 commuters, 15.0%), and 15 to 19 minutes (580 commuters, 15.0%).
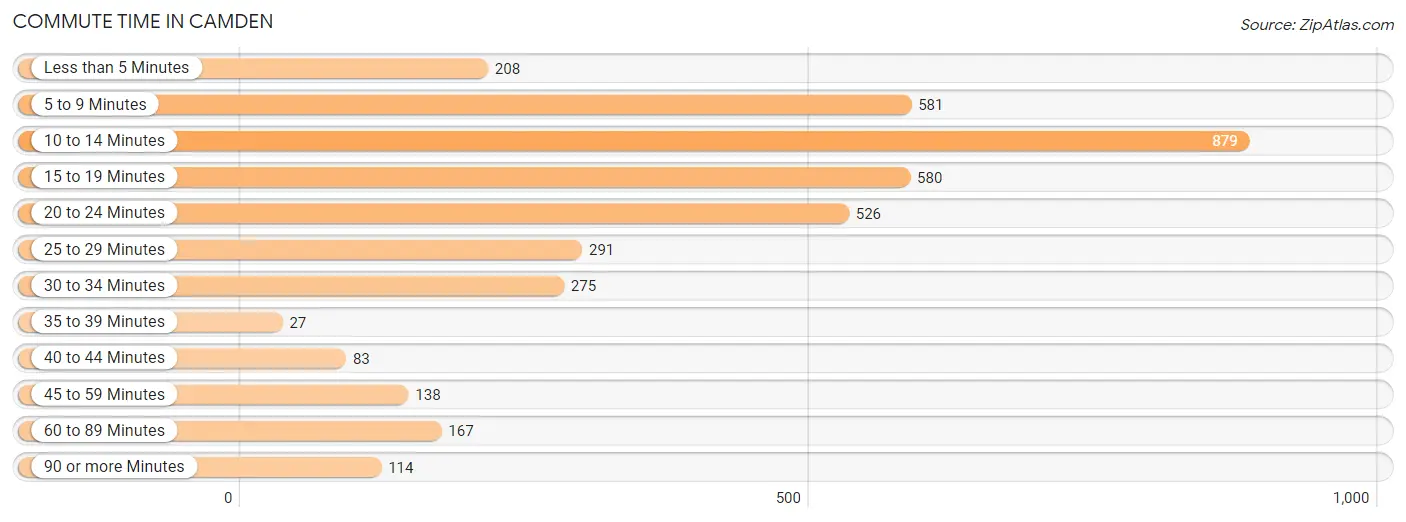
| Commute Time | # Commuters | % Commuters |
| Less than 5 Minutes | 208 | 5.4% |
| 5 to 9 Minutes | 581 | 15.0% |
| 10 to 14 Minutes | 879 | 22.7% |
| 15 to 19 Minutes | 580 | 15.0% |
| 20 to 24 Minutes | 526 | 13.6% |
| 25 to 29 Minutes | 291 | 7.5% |
| 30 to 34 Minutes | 275 | 7.1% |
| 35 to 39 Minutes | 27 | 0.7% |
| 40 to 44 Minutes | 83 | 2.1% |
| 45 to 59 Minutes | 138 | 3.6% |
| 60 to 89 Minutes | 167 | 4.3% |
| 90 or more Minutes | 114 | 2.9% |
Commute Time by Sex in Camden
The most common commute times in Camden are 15 to 19 minutes (478 commuters, 22.3%) for males and 10 to 14 minutes (619 commuters, 36.0%) for females.
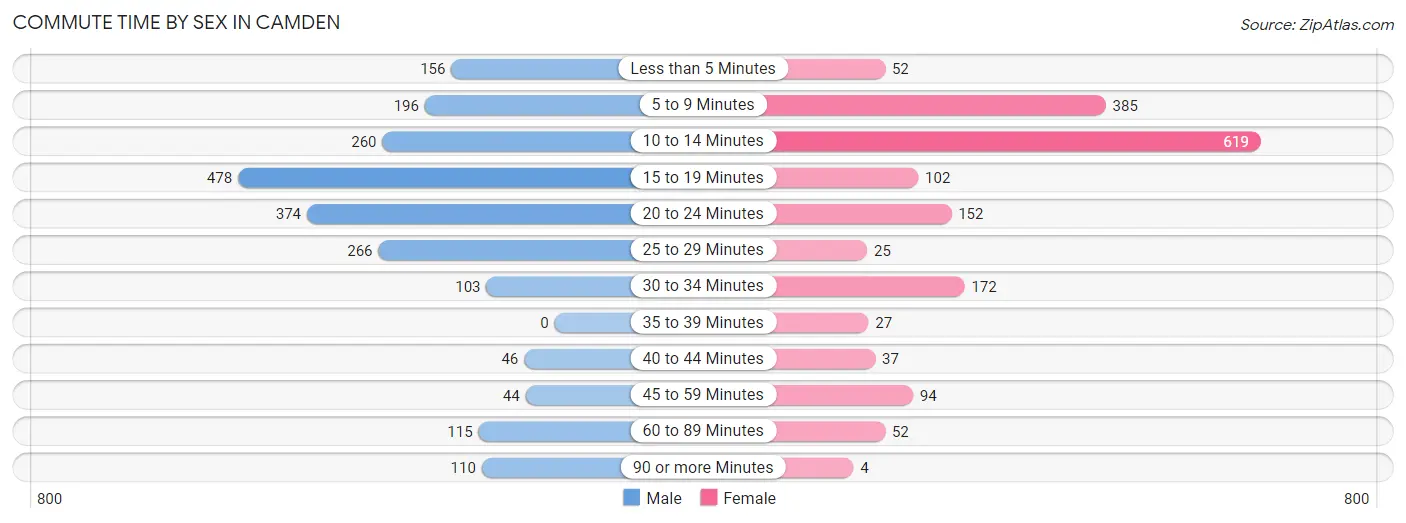
| Commute Time | Male | Female |
| Less than 5 Minutes | 156 (7.3%) | 52 (3.0%) |
| 5 to 9 Minutes | 196 (9.1%) | 385 (22.4%) |
| 10 to 14 Minutes | 260 (12.1%) | 619 (36.0%) |
| 15 to 19 Minutes | 478 (22.3%) | 102 (5.9%) |
| 20 to 24 Minutes | 374 (17.4%) | 152 (8.8%) |
| 25 to 29 Minutes | 266 (12.4%) | 25 (1.5%) |
| 30 to 34 Minutes | 103 (4.8%) | 172 (10.0%) |
| 35 to 39 Minutes | 0 (0.0%) | 27 (1.6%) |
| 40 to 44 Minutes | 46 (2.1%) | 37 (2.1%) |
| 45 to 59 Minutes | 44 (2.1%) | 94 (5.5%) |
| 60 to 89 Minutes | 115 (5.3%) | 52 (3.0%) |
| 90 or more Minutes | 110 (5.1%) | 4 (0.2%) |
Time of Departure to Work by Sex in Camden
The most frequent times of departure to work in Camden are 5:00 AM to 5:29 AM (321, 14.9%) for males and 7:30 AM to 7:59 AM (471, 27.4%) for females.
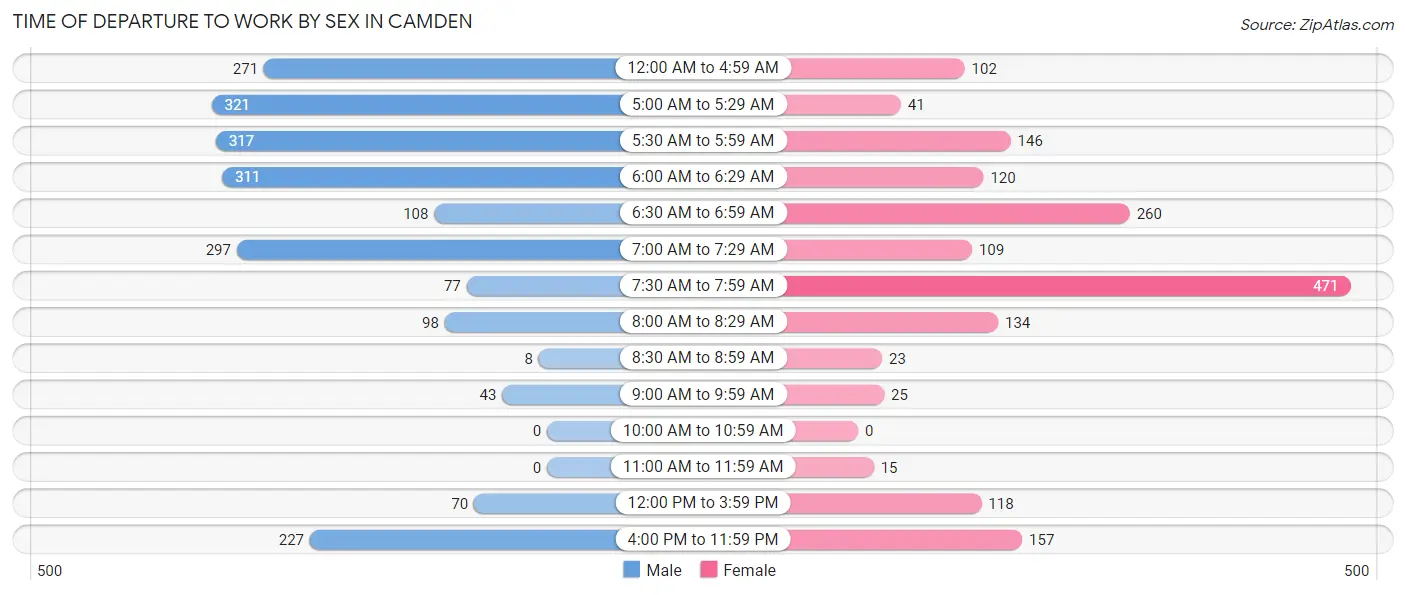
| Time of Departure | Male | Female |
| 12:00 AM to 4:59 AM | 271 (12.6%) | 102 (5.9%) |
| 5:00 AM to 5:29 AM | 321 (14.9%) | 41 (2.4%) |
| 5:30 AM to 5:59 AM | 317 (14.8%) | 146 (8.5%) |
| 6:00 AM to 6:29 AM | 311 (14.5%) | 120 (7.0%) |
| 6:30 AM to 6:59 AM | 108 (5.0%) | 260 (15.1%) |
| 7:00 AM to 7:29 AM | 297 (13.8%) | 109 (6.3%) |
| 7:30 AM to 7:59 AM | 77 (3.6%) | 471 (27.4%) |
| 8:00 AM to 8:29 AM | 98 (4.6%) | 134 (7.8%) |
| 8:30 AM to 8:59 AM | 8 (0.4%) | 23 (1.3%) |
| 9:00 AM to 9:59 AM | 43 (2.0%) | 25 (1.5%) |
| 10:00 AM to 10:59 AM | 0 (0.0%) | 0 (0.0%) |
| 11:00 AM to 11:59 AM | 0 (0.0%) | 15 (0.9%) |
| 12:00 PM to 3:59 PM | 70 (3.3%) | 118 (6.9%) |
| 4:00 PM to 11:59 PM | 227 (10.6%) | 157 (9.1%) |
| Total | 2,148 (100.0%) | 1,721 (100.0%) |
Housing Occupancy in Camden
Occupancy by Ownership in Camden
Of the total 4,026 dwellings in Camden, owner-occupied units account for 2,546 (63.2%), while renter-occupied units make up 1,480 (36.8%).
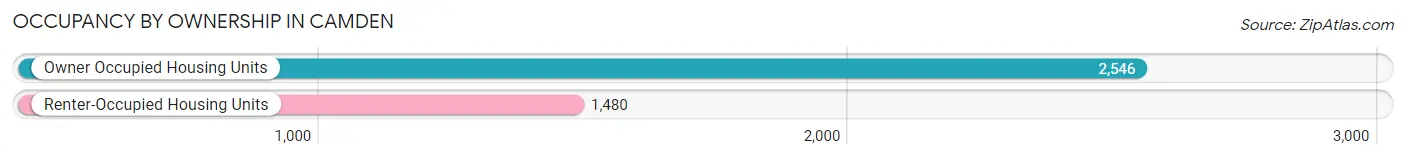
| Occupancy | # Housing Units | % Housing Units |
| Owner Occupied Housing Units | 2,546 | 63.2% |
| Renter-Occupied Housing Units | 1,480 | 36.8% |
| Total Occupied Housing Units | 4,026 | 100.0% |
Occupancy by Household Size in Camden
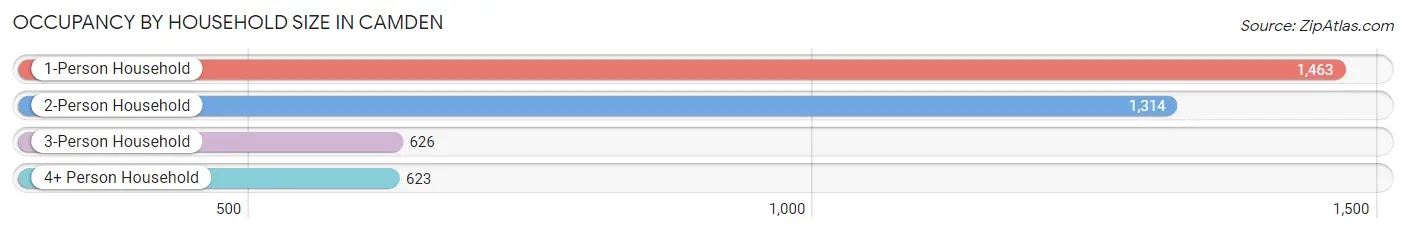
| Household Size | # Housing Units | % Housing Units |
| 1-Person Household | 1,463 | 36.3% |
| 2-Person Household | 1,314 | 32.6% |
| 3-Person Household | 626 | 15.5% |
| 4+ Person Household | 623 | 15.5% |
| Total Housing Units | 4,026 | 100.0% |
Occupancy by Ownership by Household Size in Camden
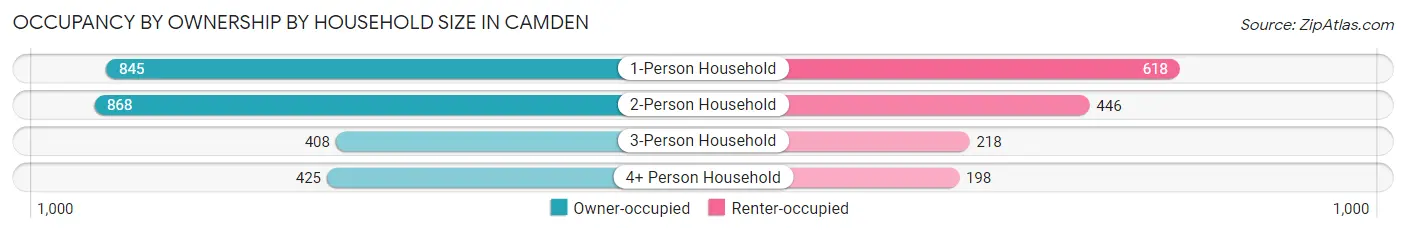
| Household Size | Owner-occupied | Renter-occupied |
| 1-Person Household | 845 (57.8%) | 618 (42.2%) |
| 2-Person Household | 868 (66.1%) | 446 (33.9%) |
| 3-Person Household | 408 (65.2%) | 218 (34.8%) |
| 4+ Person Household | 425 (68.2%) | 198 (31.8%) |
| Total Housing Units | 2,546 (63.2%) | 1,480 (36.8%) |
Occupancy by Educational Attainment in Camden
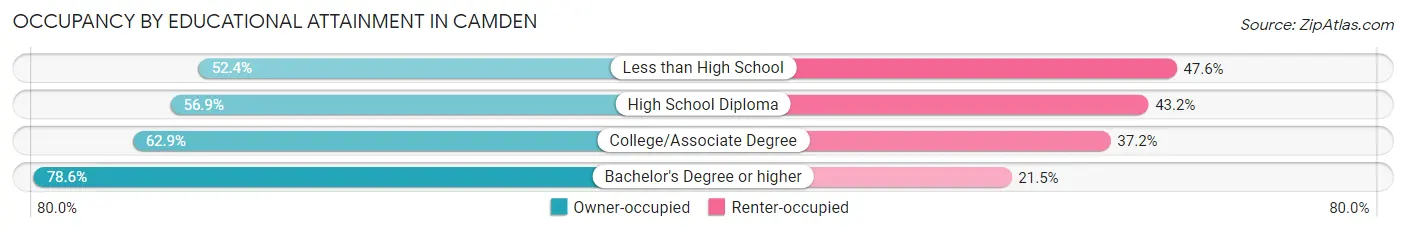
| Household Size | Owner-occupied | Renter-occupied |
| Less than High School | 243 (52.4%) | 221 (47.6%) |
| High School Diploma | 668 (56.9%) | 507 (43.1%) |
| College/Associate Degree | 961 (62.8%) | 568 (37.1%) |
| Bachelor's Degree or higher | 674 (78.5%) | 184 (21.4%) |
Occupancy by Age of Householder in Camden
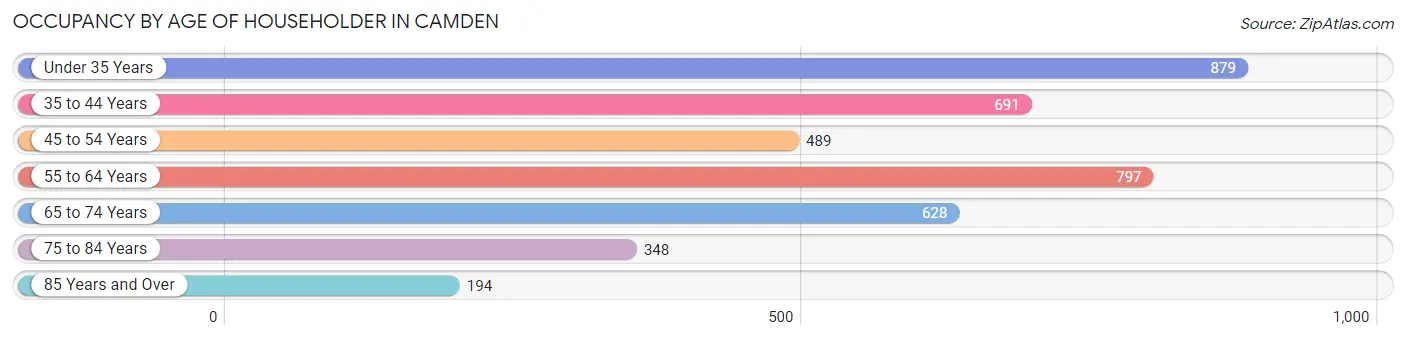
| Age Bracket | # Households | % Households |
| Under 35 Years | 879 | 21.8% |
| 35 to 44 Years | 691 | 17.2% |
| 45 to 54 Years | 489 | 12.1% |
| 55 to 64 Years | 797 | 19.8% |
| 65 to 74 Years | 628 | 15.6% |
| 75 to 84 Years | 348 | 8.6% |
| 85 Years and Over | 194 | 4.8% |
| Total | 4,026 | 100.0% |
Housing Finances in Camden
Median Income by Occupancy in Camden
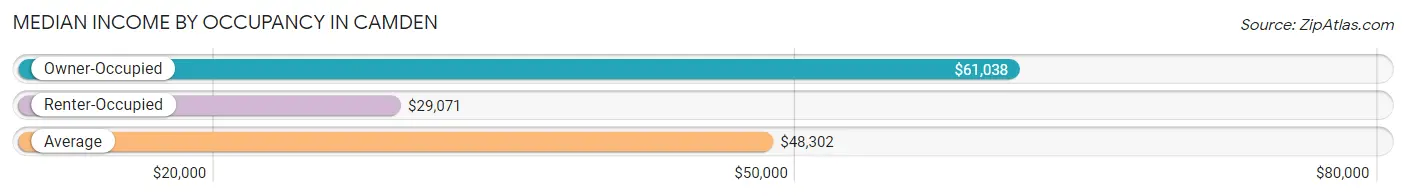
| Occupancy Type | # Households | Median Income |
| Owner-Occupied | 2,546 (63.2%) | $61,038 |
| Renter-Occupied | 1,480 (36.8%) | $29,071 |
| Average | 4,026 (100.0%) | $48,302 |
Occupancy by Householder Income Bracket in Camden
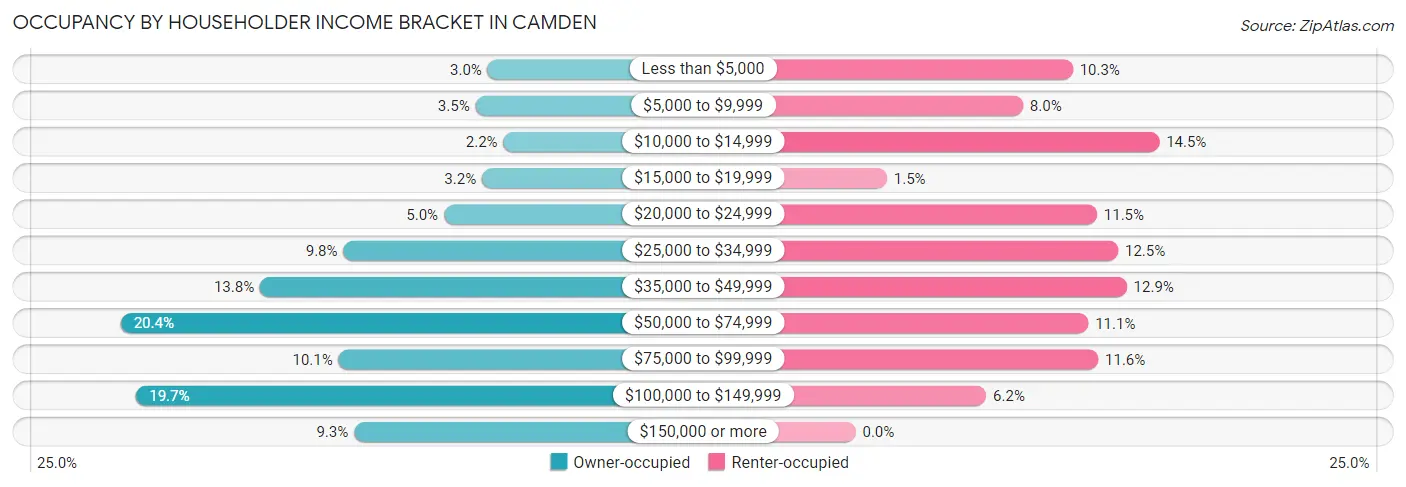
| Income Bracket | Owner-occupied | Renter-occupied |
| Less than $5,000 | 75 (2.9%) | 153 (10.3%) |
| $5,000 to $9,999 | 90 (3.5%) | 118 (8.0%) |
| $10,000 to $14,999 | 56 (2.2%) | 214 (14.5%) |
| $15,000 to $19,999 | 82 (3.2%) | 22 (1.5%) |
| $20,000 to $24,999 | 128 (5.0%) | 170 (11.5%) |
| $25,000 to $34,999 | 250 (9.8%) | 185 (12.5%) |
| $35,000 to $49,999 | 351 (13.8%) | 191 (12.9%) |
| $50,000 to $74,999 | 520 (20.4%) | 164 (11.1%) |
| $75,000 to $99,999 | 256 (10.1%) | 171 (11.6%) |
| $100,000 to $149,999 | 501 (19.7%) | 92 (6.2%) |
| $150,000 or more | 237 (9.3%) | 0 (0.0%) |
| Total | 2,546 (100.0%) | 1,480 (100.0%) |
Monthly Housing Cost Tiers in Camden
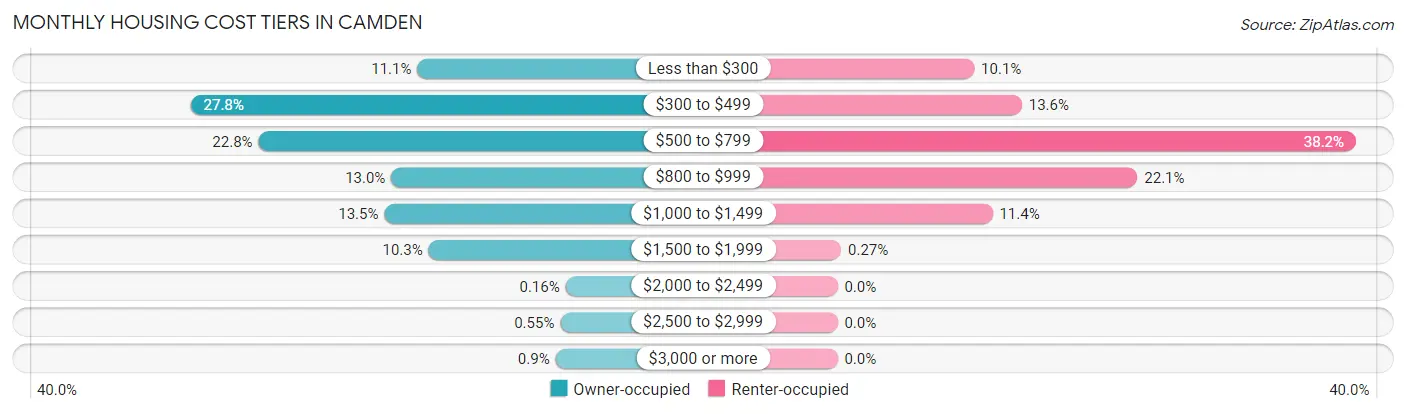
| Monthly Cost | Owner-occupied | Renter-occupied |
| Less than $300 | 282 (11.1%) | 149 (10.1%) |
| $300 to $499 | 707 (27.8%) | 201 (13.6%) |
| $500 to $799 | 580 (22.8%) | 565 (38.2%) |
| $800 to $999 | 331 (13.0%) | 327 (22.1%) |
| $1,000 to $1,499 | 344 (13.5%) | 169 (11.4%) |
| $1,500 to $1,999 | 261 (10.2%) | 4 (0.3%) |
| $2,000 to $2,499 | 4 (0.2%) | 0 (0.0%) |
| $2,500 to $2,999 | 14 (0.5%) | 0 (0.0%) |
| $3,000 or more | 23 (0.9%) | 0 (0.0%) |
| Total | 2,546 (100.0%) | 1,480 (100.0%) |
Physical Housing Characteristics in Camden
Housing Structures in Camden
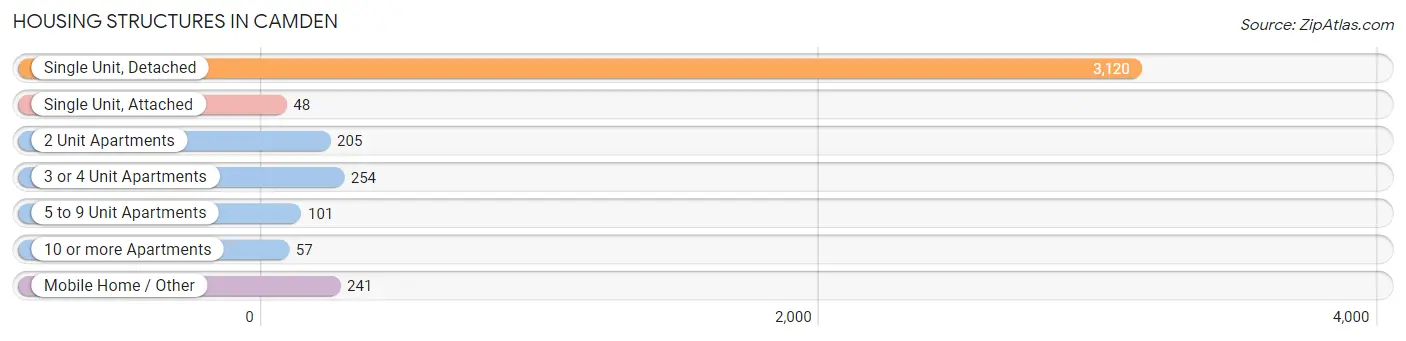
| Structure Type | # Housing Units | % Housing Units |
| Single Unit, Detached | 3,120 | 77.5% |
| Single Unit, Attached | 48 | 1.2% |
| 2 Unit Apartments | 205 | 5.1% |
| 3 or 4 Unit Apartments | 254 | 6.3% |
| 5 to 9 Unit Apartments | 101 | 2.5% |
| 10 or more Apartments | 57 | 1.4% |
| Mobile Home / Other | 241 | 6.0% |
| Total | 4,026 | 100.0% |
Housing Structures by Occupancy in Camden
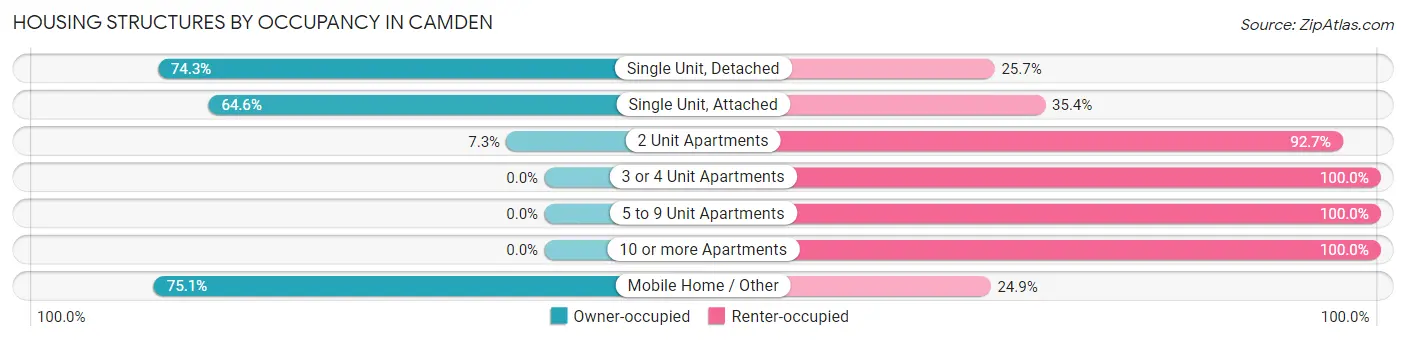
| Structure Type | Owner-occupied | Renter-occupied |
| Single Unit, Detached | 2,319 (74.3%) | 801 (25.7%) |
| Single Unit, Attached | 31 (64.6%) | 17 (35.4%) |
| 2 Unit Apartments | 15 (7.3%) | 190 (92.7%) |
| 3 or 4 Unit Apartments | 0 (0.0%) | 254 (100.0%) |
| 5 to 9 Unit Apartments | 0 (0.0%) | 101 (100.0%) |
| 10 or more Apartments | 0 (0.0%) | 57 (100.0%) |
| Mobile Home / Other | 181 (75.1%) | 60 (24.9%) |
| Total | 2,546 (63.2%) | 1,480 (36.8%) |
Housing Structures by Number of Rooms in Camden
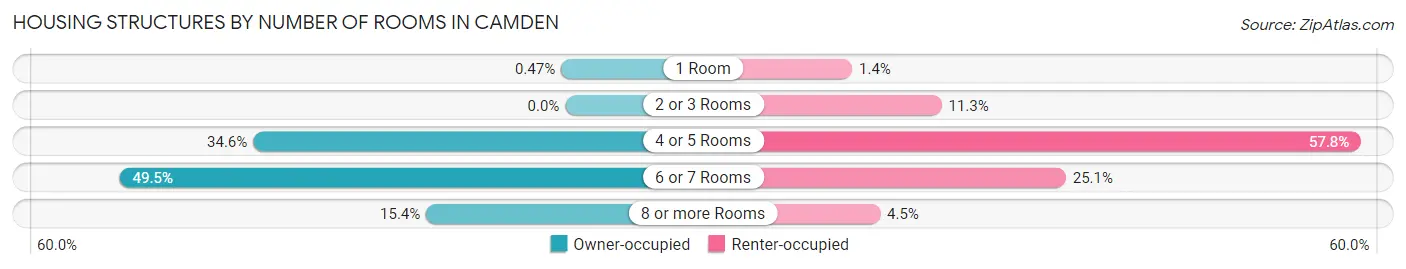
| Number of Rooms | Owner-occupied | Renter-occupied |
| 1 Room | 12 (0.5%) | 20 (1.3%) |
| 2 or 3 Rooms | 0 (0.0%) | 167 (11.3%) |
| 4 or 5 Rooms | 882 (34.6%) | 856 (57.8%) |
| 6 or 7 Rooms | 1,259 (49.4%) | 371 (25.1%) |
| 8 or more Rooms | 393 (15.4%) | 66 (4.5%) |
| Total | 2,546 (100.0%) | 1,480 (100.0%) |
Housing Structure by Heating Type in Camden
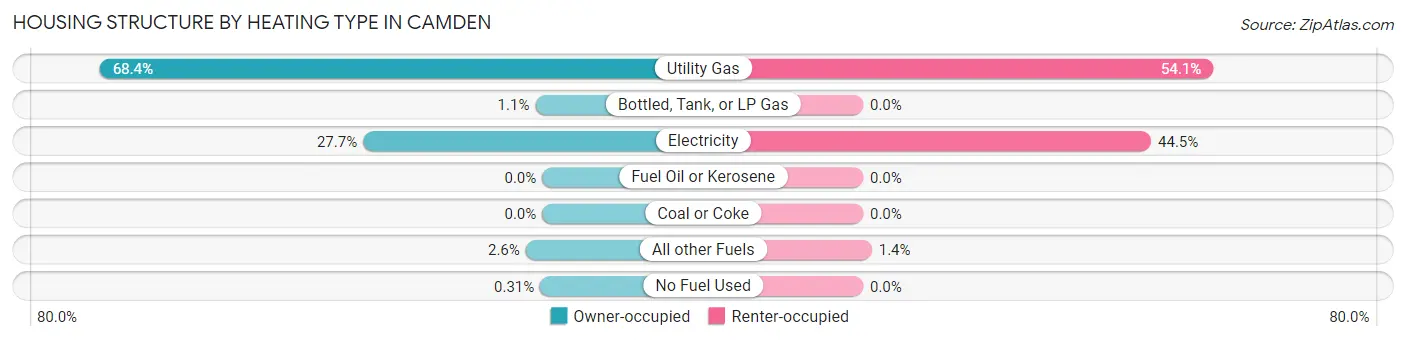
| Heating Type | Owner-occupied | Renter-occupied |
| Utility Gas | 1,741 (68.4%) | 801 (54.1%) |
| Bottled, Tank, or LP Gas | 27 (1.1%) | 0 (0.0%) |
| Electricity | 705 (27.7%) | 659 (44.5%) |
| Fuel Oil or Kerosene | 0 (0.0%) | 0 (0.0%) |
| Coal or Coke | 0 (0.0%) | 0 (0.0%) |
| All other Fuels | 65 (2.5%) | 20 (1.3%) |
| No Fuel Used | 8 (0.3%) | 0 (0.0%) |
| Total | 2,546 (100.0%) | 1,480 (100.0%) |
Household Vehicle Usage in Camden
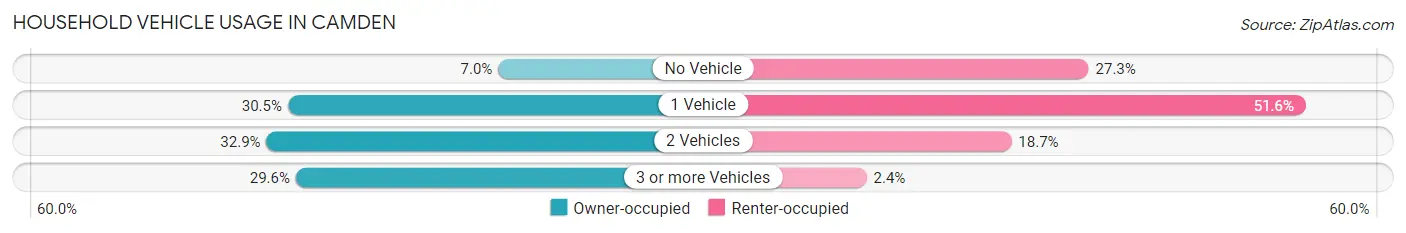
| Vehicles per Household | Owner-occupied | Renter-occupied |
| No Vehicle | 177 (7.0%) | 404 (27.3%) |
| 1 Vehicle | 777 (30.5%) | 764 (51.6%) |
| 2 Vehicles | 838 (32.9%) | 276 (18.6%) |
| 3 or more Vehicles | 754 (29.6%) | 36 (2.4%) |
| Total | 2,546 (100.0%) | 1,480 (100.0%) |
Real Estate & Mortgages in Camden
Real Estate and Mortgage Overview in Camden
| Characteristic | Without Mortgage | With Mortgage |
| Housing Units | 1,123 | 1,423 |
| Median Property Value | $101,500 | $89,300 |
| Median Household Income | $44,160 | $178 |
| Monthly Housing Costs | $389 | $23 |
| Real Estate Taxes | $472 | $41 |
Property Value by Mortgage Status in Camden
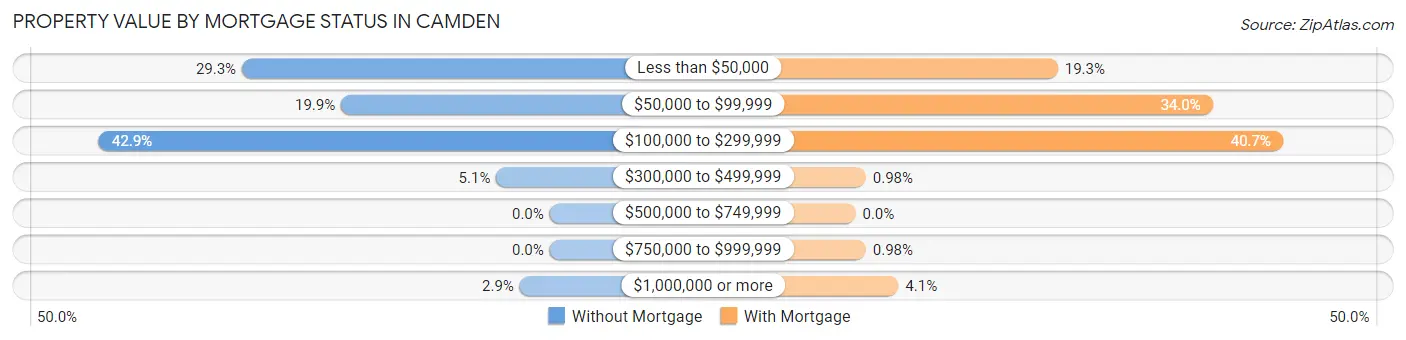
| Property Value | Without Mortgage | With Mortgage |
| Less than $50,000 | 329 (29.3%) | 274 (19.3%) |
| $50,000 to $99,999 | 223 (19.9%) | 484 (34.0%) |
| $100,000 to $299,999 | 482 (42.9%) | 579 (40.7%) |
| $300,000 to $499,999 | 57 (5.1%) | 14 (1.0%) |
| $500,000 to $749,999 | 0 (0.0%) | 0 (0.0%) |
| $750,000 to $999,999 | 0 (0.0%) | 14 (1.0%) |
| $1,000,000 or more | 32 (2.9%) | 58 (4.1%) |
| Total | 1,123 (100.0%) | 1,423 (100.0%) |
Household Income by Mortgage Status in Camden
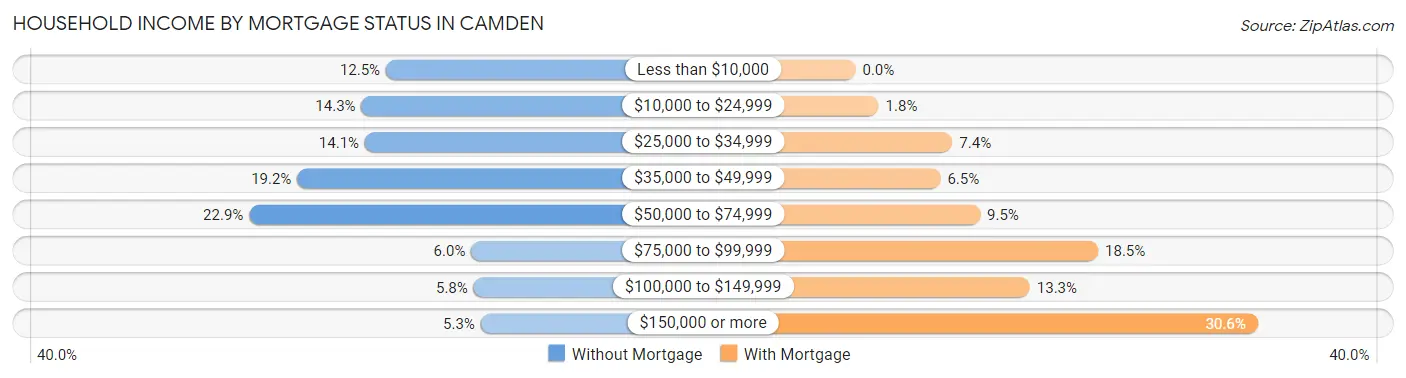
| Household Income | Without Mortgage | With Mortgage |
| Less than $10,000 | 140 (12.5%) | 0 (0.0%) |
| $10,000 to $24,999 | 161 (14.3%) | 25 (1.8%) |
| $25,000 to $34,999 | 158 (14.1%) | 105 (7.4%) |
| $35,000 to $49,999 | 216 (19.2%) | 92 (6.5%) |
| $50,000 to $74,999 | 257 (22.9%) | 135 (9.5%) |
| $75,000 to $99,999 | 67 (6.0%) | 263 (18.5%) |
| $100,000 to $149,999 | 65 (5.8%) | 189 (13.3%) |
| $150,000 or more | 59 (5.2%) | 436 (30.6%) |
| Total | 1,123 (100.0%) | 1,423 (100.0%) |
Property Value to Household Income Ratio in Camden
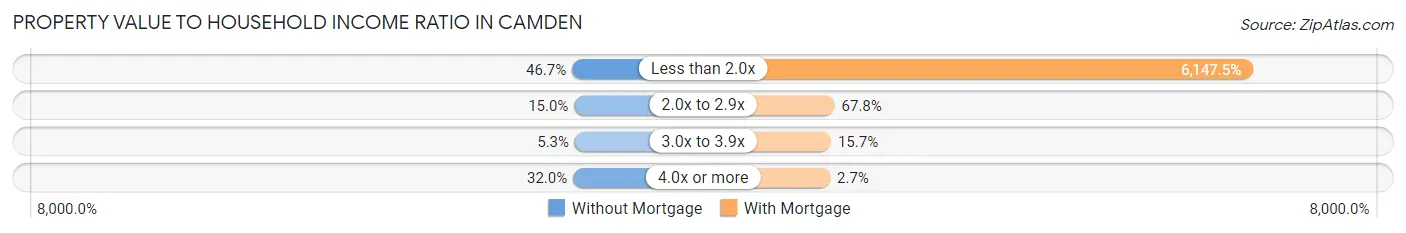
| Value-to-Income Ratio | Without Mortgage | With Mortgage |
| Less than 2.0x | 524 (46.7%) | 87,479 (6,147.5%) |
| 2.0x to 2.9x | 168 (15.0%) | 965 (67.8%) |
| 3.0x to 3.9x | 60 (5.3%) | 223 (15.7%) |
| 4.0x or more | 359 (32.0%) | 38 (2.7%) |
| Total | 1,123 (100.0%) | 1,423 (100.0%) |
Real Estate Taxes by Mortgage Status in Camden
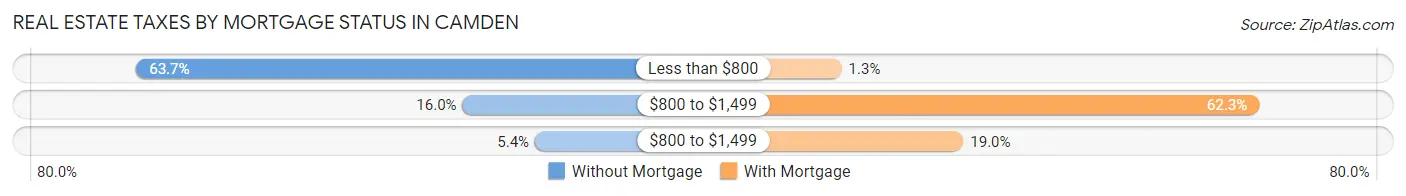
| Property Taxes | Without Mortgage | With Mortgage |
| Less than $800 | 715 (63.7%) | 18 (1.3%) |
| $800 to $1,499 | 180 (16.0%) | 886 (62.3%) |
| $800 to $1,499 | 61 (5.4%) | 271 (19.0%) |
| Total | 1,123 (100.0%) | 1,423 (100.0%) |
Health & Disability in Camden
Health Insurance Coverage by Age in Camden
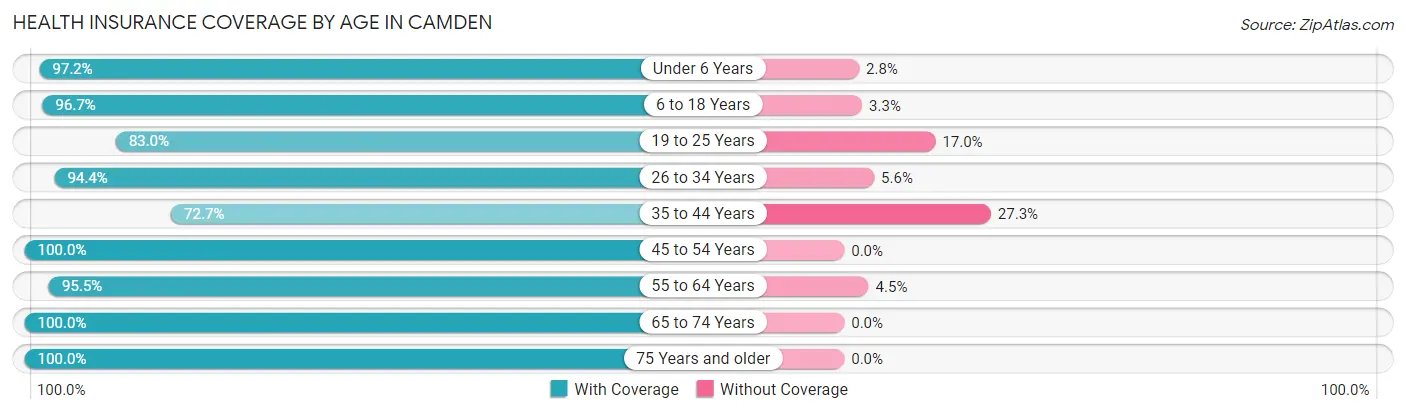
| Age Bracket | With Coverage | Without Coverage |
| Under 6 Years | 809 (97.2%) | 23 (2.8%) |
| 6 to 18 Years | 1,914 (96.7%) | 66 (3.3%) |
| 19 to 25 Years | 664 (83.0%) | 136 (17.0%) |
| 26 to 34 Years | 1,000 (94.4%) | 59 (5.6%) |
| 35 to 44 Years | 922 (72.7%) | 347 (27.3%) |
| 45 to 54 Years | 975 (100.0%) | 0 (0.0%) |
| 55 to 64 Years | 1,366 (95.5%) | 65 (4.5%) |
| 65 to 74 Years | 1,095 (100.0%) | 0 (0.0%) |
| 75 Years and older | 821 (100.0%) | 0 (0.0%) |
| Total | 9,566 (93.2%) | 696 (6.8%) |
Health Insurance Coverage by Citizenship Status in Camden
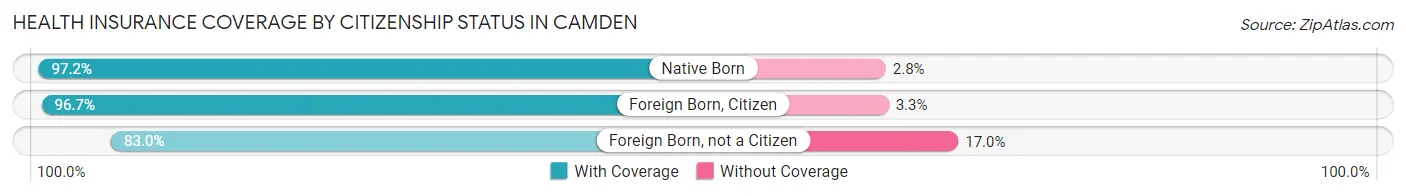
| Citizenship Status | With Coverage | Without Coverage |
| Native Born | 809 (97.2%) | 23 (2.8%) |
| Foreign Born, Citizen | 1,914 (96.7%) | 66 (3.3%) |
| Foreign Born, not a Citizen | 664 (83.0%) | 136 (17.0%) |
Health Insurance Coverage by Household Income in Camden
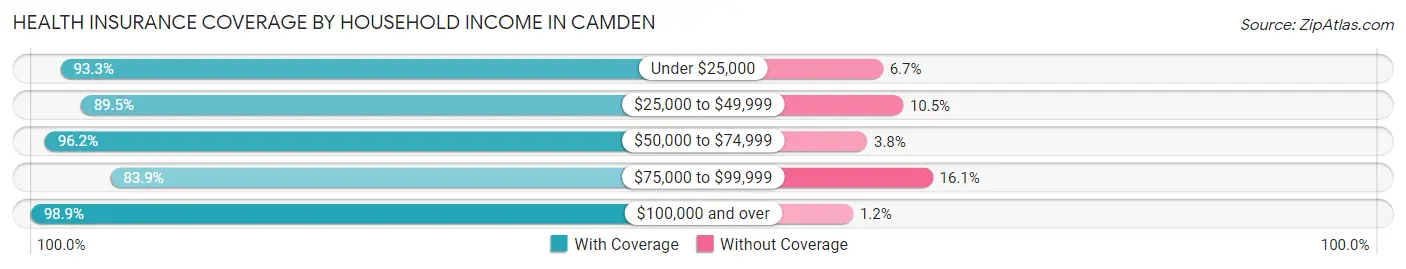
| Household Income | With Coverage | Without Coverage |
| Under $25,000 | 2,025 (93.3%) | 146 (6.7%) |
| $25,000 to $49,999 | 2,151 (89.5%) | 253 (10.5%) |
| $50,000 to $74,999 | 1,851 (96.2%) | 73 (3.8%) |
| $75,000 to $99,999 | 1,018 (83.9%) | 195 (16.1%) |
| $100,000 and over | 2,503 (98.9%) | 29 (1.1%) |
Public vs Private Health Insurance Coverage by Age in Camden
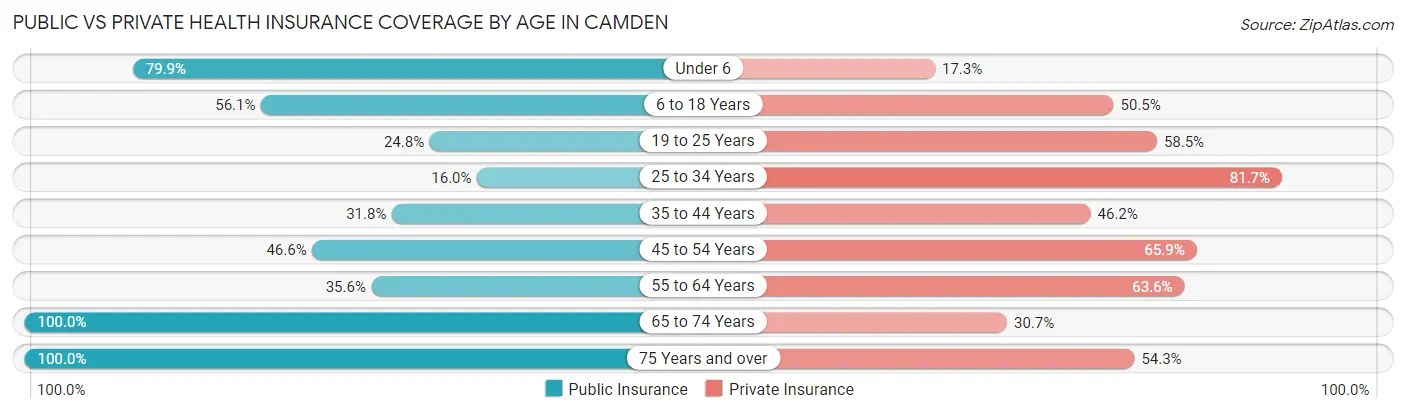
| Age Bracket | Public Insurance | Private Insurance |
| Under 6 | 665 (79.9%) | 144 (17.3%) |
| 6 to 18 Years | 1,110 (56.1%) | 999 (50.4%) |
| 19 to 25 Years | 198 (24.7%) | 468 (58.5%) |
| 25 to 34 Years | 169 (16.0%) | 865 (81.7%) |
| 35 to 44 Years | 403 (31.8%) | 586 (46.2%) |
| 45 to 54 Years | 454 (46.6%) | 642 (65.8%) |
| 55 to 64 Years | 509 (35.6%) | 910 (63.6%) |
| 65 to 74 Years | 1,095 (100.0%) | 336 (30.7%) |
| 75 Years and over | 821 (100.0%) | 446 (54.3%) |
| Total | 5,424 (52.9%) | 5,396 (52.6%) |
Disability Status by Sex by Age in Camden
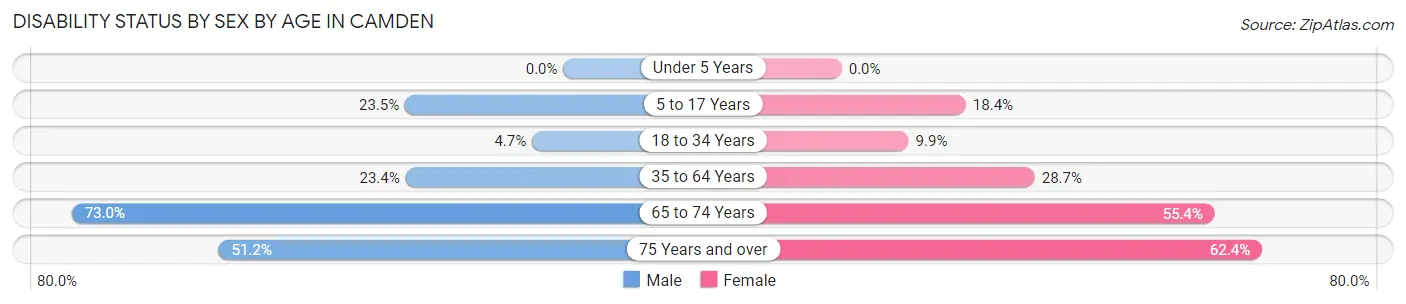
| Age Bracket | Male | Female |
| Under 5 Years | 0 (0.0%) | 0 (0.0%) |
| 5 to 17 Years | 241 (23.5%) | 169 (18.4%) |
| 18 to 34 Years | 51 (4.6%) | 90 (9.9%) |
| 35 to 64 Years | 391 (23.4%) | 575 (28.7%) |
| 65 to 74 Years | 338 (73.0%) | 350 (55.4%) |
| 75 Years and over | 129 (51.2%) | 355 (62.4%) |
Disability Class by Sex by Age in Camden
Disability Class: Hearing Difficulty
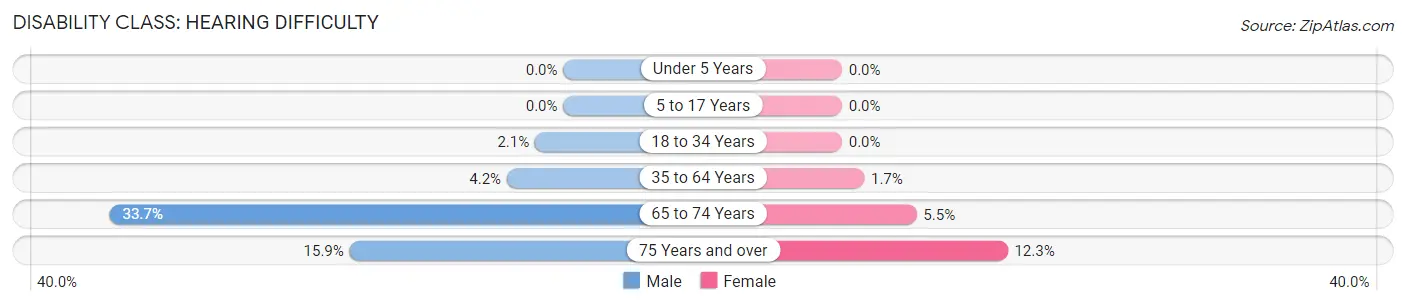
| Age Bracket | Male | Female |
| Under 5 Years | 0 (0.0%) | 0 (0.0%) |
| 5 to 17 Years | 0 (0.0%) | 0 (0.0%) |
| 18 to 34 Years | 23 (2.1%) | 0 (0.0%) |
| 35 to 64 Years | 70 (4.2%) | 33 (1.7%) |
| 65 to 74 Years | 156 (33.7%) | 35 (5.5%) |
| 75 Years and over | 40 (15.9%) | 70 (12.3%) |
Disability Class: Vision Difficulty
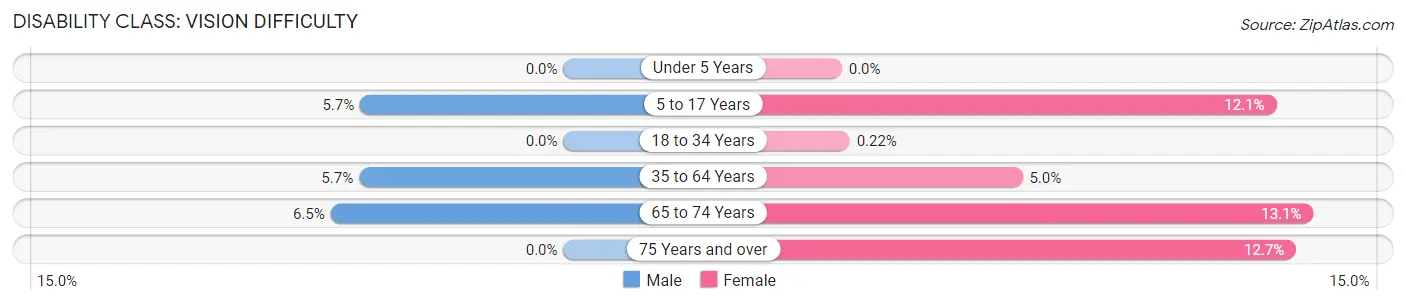
| Age Bracket | Male | Female |
| Under 5 Years | 0 (0.0%) | 0 (0.0%) |
| 5 to 17 Years | 58 (5.7%) | 111 (12.1%) |
| 18 to 34 Years | 0 (0.0%) | 2 (0.2%) |
| 35 to 64 Years | 95 (5.7%) | 101 (5.0%) |
| 65 to 74 Years | 30 (6.5%) | 83 (13.1%) |
| 75 Years and over | 0 (0.0%) | 72 (12.7%) |
Disability Class: Cognitive Difficulty
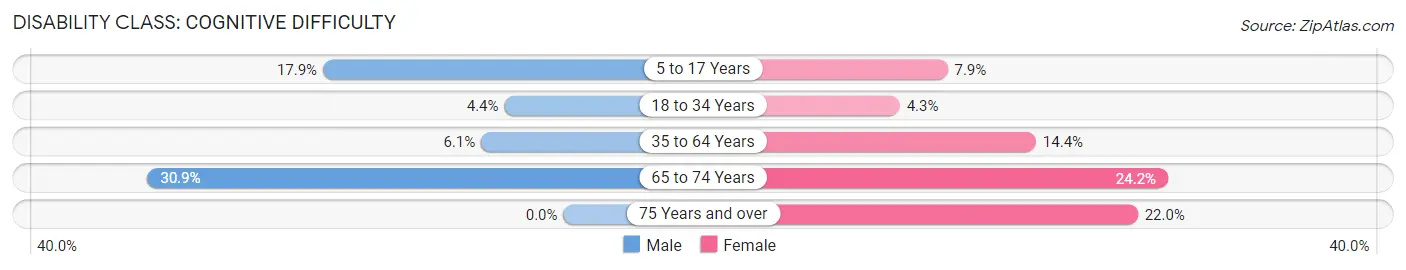
| Age Bracket | Male | Female |
| 5 to 17 Years | 183 (17.8%) | 72 (7.9%) |
| 18 to 34 Years | 48 (4.4%) | 39 (4.3%) |
| 35 to 64 Years | 102 (6.1%) | 289 (14.4%) |
| 65 to 74 Years | 143 (30.9%) | 153 (24.2%) |
| 75 Years and over | 0 (0.0%) | 125 (22.0%) |
Disability Class: Ambulatory Difficulty
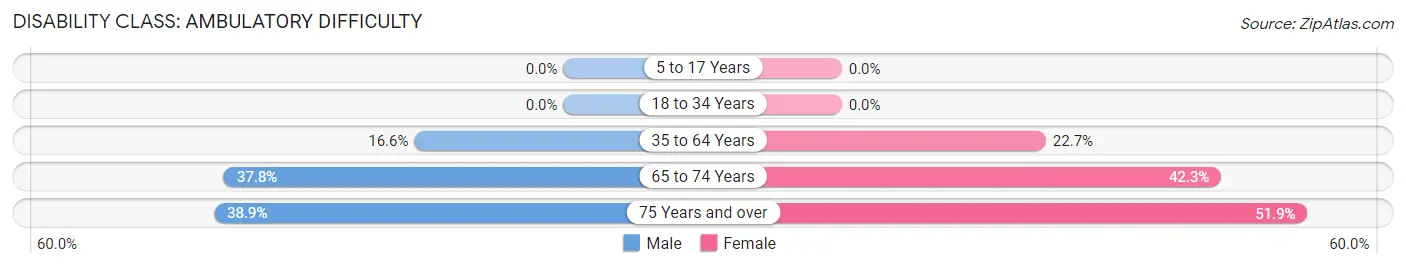
| Age Bracket | Male | Female |
| 5 to 17 Years | 0 (0.0%) | 0 (0.0%) |
| 18 to 34 Years | 0 (0.0%) | 0 (0.0%) |
| 35 to 64 Years | 277 (16.6%) | 456 (22.7%) |
| 65 to 74 Years | 175 (37.8%) | 267 (42.2%) |
| 75 Years and over | 98 (38.9%) | 295 (51.8%) |
Disability Class: Self-Care Difficulty
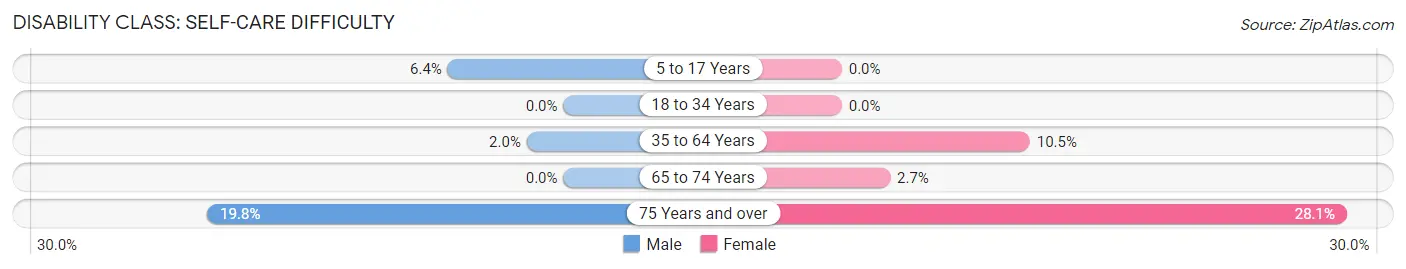
| Age Bracket | Male | Female |
| 5 to 17 Years | 66 (6.4%) | 0 (0.0%) |
| 18 to 34 Years | 0 (0.0%) | 0 (0.0%) |
| 35 to 64 Years | 34 (2.0%) | 210 (10.5%) |
| 65 to 74 Years | 0 (0.0%) | 17 (2.7%) |
| 75 Years and over | 50 (19.8%) | 160 (28.1%) |
Technology Access in Camden
Computing Device Access in Camden
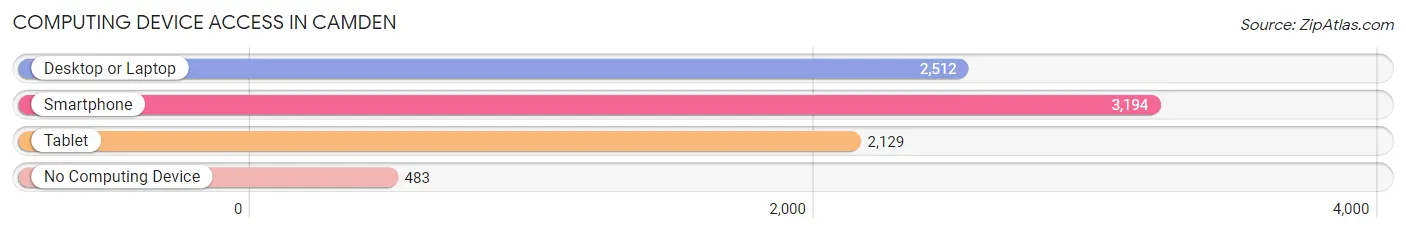
| Device Type | # Households | % Households |
| Desktop or Laptop | 2,512 | 62.4% |
| Smartphone | 3,194 | 79.3% |
| Tablet | 2,129 | 52.9% |
| No Computing Device | 483 | 12.0% |
| Total | 4,026 | 100.0% |
Internet Access in Camden
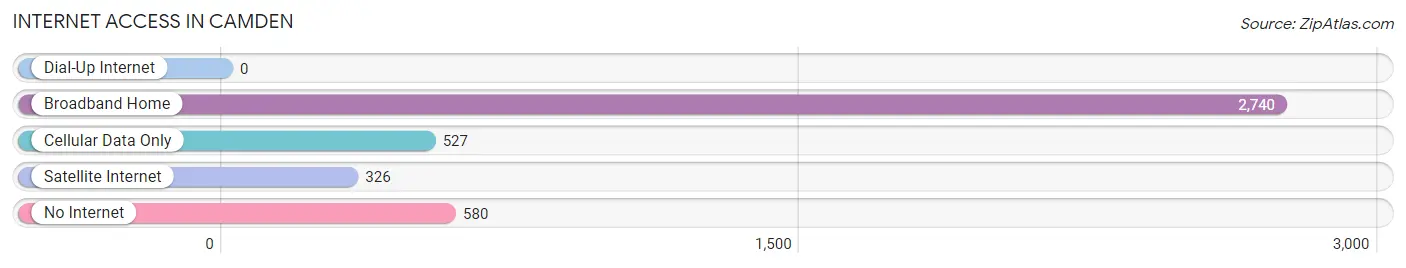
| Internet Type | # Households | % Households |
| Dial-Up Internet | 0 | 0.0% |
| Broadband Home | 2,740 | 68.1% |
| Cellular Data Only | 527 | 13.1% |
| Satellite Internet | 326 | 8.1% |
| No Internet | 580 | 14.4% |
| Total | 4,026 | 100.0% |
Camden Summary
Camden, Arkansas is a city located in Ouachita County in the south-central part of the state. It is the county seat and the largest city in the county. The city is situated on the Ouachita River and is home to a population of approximately 12,000 people.
History
The area that is now Camden was first settled in the early 1800s by a group of French-speaking settlers from the nearby town of Camden, Louisiana. The settlers named the area after their hometown and established a trading post on the Ouachita River. The town was officially incorporated in 1844 and was named the county seat of Ouachita County in 1848.
In the late 1800s, Camden became a major center for the timber industry. The city was home to several sawmills and lumber companies, and the timber industry provided a major source of employment for the city’s residents.
In the early 1900s, Camden began to experience a period of growth and development. The city was home to several cotton mills, and the local economy was bolstered by the construction of the Camden and Ouachita Railroad. The railroad connected Camden to other cities in the region, and it helped to spur economic growth in the area.
In the mid-1900s, Camden experienced a period of decline. The timber industry began to decline, and the city’s population began to decrease. However, in the late 1900s, the city began to experience a period of revitalization. The city was home to several new businesses, and the local economy began to diversify.
Geography
Camden is located in the south-central part of Arkansas, in Ouachita County. The city is situated on the Ouachita River, and it is surrounded by several small towns and rural areas. The city is located approximately 80 miles south of Little Rock, the state capital.
The city has a total area of 8.3 square miles, and it has an elevation of approximately 300 feet. The climate in Camden is humid subtropical, and the city experiences hot, humid summers and mild winters.
Economy
The economy of Camden is largely based on the timber industry. The city is home to several sawmills and lumber companies, and the timber industry provides a major source of employment for the city’s residents.
In addition to the timber industry, Camden is also home to several manufacturing companies. The city is home to several food processing plants, and it is also home to several automotive parts manufacturers.
The city is also home to several retail stores and restaurants. The city is home to several shopping centers, and it is also home to several small businesses.
Demographics
As of the 2010 census, Camden had a population of 12,183 people. The city has a population density of 1,457 people per square mile. The median age in Camden is 37.7 years, and the median household income is $35,945.
The racial makeup of Camden is 73.3% White, 22.2% African American, 0.7% Native American, 0.7% Asian, 0.1% Pacific Islander, and 2.9% from other races. The city is home to a large Hispanic population, and approximately 10.3% of the city’s population is of Hispanic or Latino origin.
The city is home to several churches, and the majority of the city’s residents are Christian. The city is also home to several schools, and the city is served by the Ouachita County School District.
Common Questions
What is Per Capita Income in Camden?
Per Capita income in Camden is $24,706.
What is the Median Family Income in Camden?
Median Family Income in Camden is $67,337.
What is the Median Household income in Camden?
Median Household Income in Camden is $48,302.
What is Income or Wage Gap in Camden?
Income or Wage Gap in Camden is 19.7%.
Women in Camden earn 80.3 cents for every dollar earned by a man.
What is Inequality or Gini Index in Camden?
Inequality or Gini Index in Camden is 0.44.
What is the Total Population of Camden?
Total Population of Camden is 10,587.
What is the Total Male Population of Camden?
Total Male Population of Camden is 5,141.
What is the Total Female Population of Camden?
Total Female Population of Camden is 5,446.
What is the Ratio of Males per 100 Females in Camden?
There are 94.40 Males per 100 Females in Camden.
What is the Ratio of Females per 100 Males in Camden?
There are 105.93 Females per 100 Males in Camden.
What is the Median Population Age in Camden?
Median Population Age in Camden is 38.7 Years.
What is the Average Family Size in Camden
Average Family Size in Camden is 3.4 People.
What is the Average Household Size in Camden
Average Household Size in Camden is 2.5 People.
How Large is the Labor Force in Camden?
There are 4,312 People in the Labor Forcein in Camden.
What is the Percentage of People in the Labor Force in Camden?
52.5% of People are in the Labor Force in Camden.
What is the Unemployment Rate in Camden?
Unemployment Rate in Camden is 5.8%.