Bradley County, AR Map & Demographics
Bradley County Map
Bradley County Overview
$23,830
PER CAPITA INCOME
$60,497
AVG FAMILY INCOME
$43,688
AVG HOUSEHOLD INCOME
43.7%
WAGE / INCOME GAP [ % ]
56.3¢/ $1
WAGE / INCOME GAP [ $ ]
0.47
INEQUALITY / GINI INDEX
10,461
TOTAL POPULATION
5,058
MALE POPULATION
5,403
FEMALE POPULATION
93.61
MALES / 100 FEMALES
106.82
FEMALES / 100 MALES
40.2
MEDIAN AGE
4.0
AVG FAMILY SIZE
2.9
AVG HOUSEHOLD SIZE
3,965
LABOR FORCE [ PEOPLE ]
48.6%
PERCENT IN LABOR FORCE
5.6%
UNEMPLOYMENT RATE
Bradley County Area Codes
Income in Bradley County
Income Overview in Bradley County
Per Capita Income in Bradley County is $23,830, while median incomes of families and households are $60,497 and $43,688 respectively.
| Characteristic | Number | Measure |
| Per Capita Income | 10,461 | $23,830 |
| Median Family Income | 2,165 | $60,497 |
| Mean Family Income | 2,165 | $73,609 |
| Median Household Income | 3,587 | $43,688 |
| Mean Household Income | 3,587 | $57,798 |
| Income Deficit | 2,165 | $0 |
| Wage / Income Gap (%) | 10,461 | 43.71% |
| Wage / Income Gap ($) | 10,461 | 56.29¢ per $1 |
| Gini / Inequality Index | 10,461 | 0.47 |
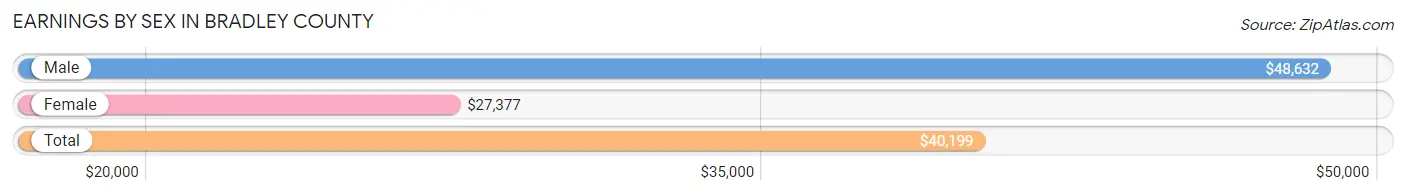
Earnings by Sex in Bradley County
Average Earnings in Bradley County are $40,199, $48,632 for men and $27,377 for women, a difference of 43.7%.
| Sex | Number | Average Earnings |
| Male | 2,141 (51.7%) | $48,632 |
| Female | 2,003 (48.3%) | $27,377 |
| Total | 4,144 (100.0%) | $40,199 |
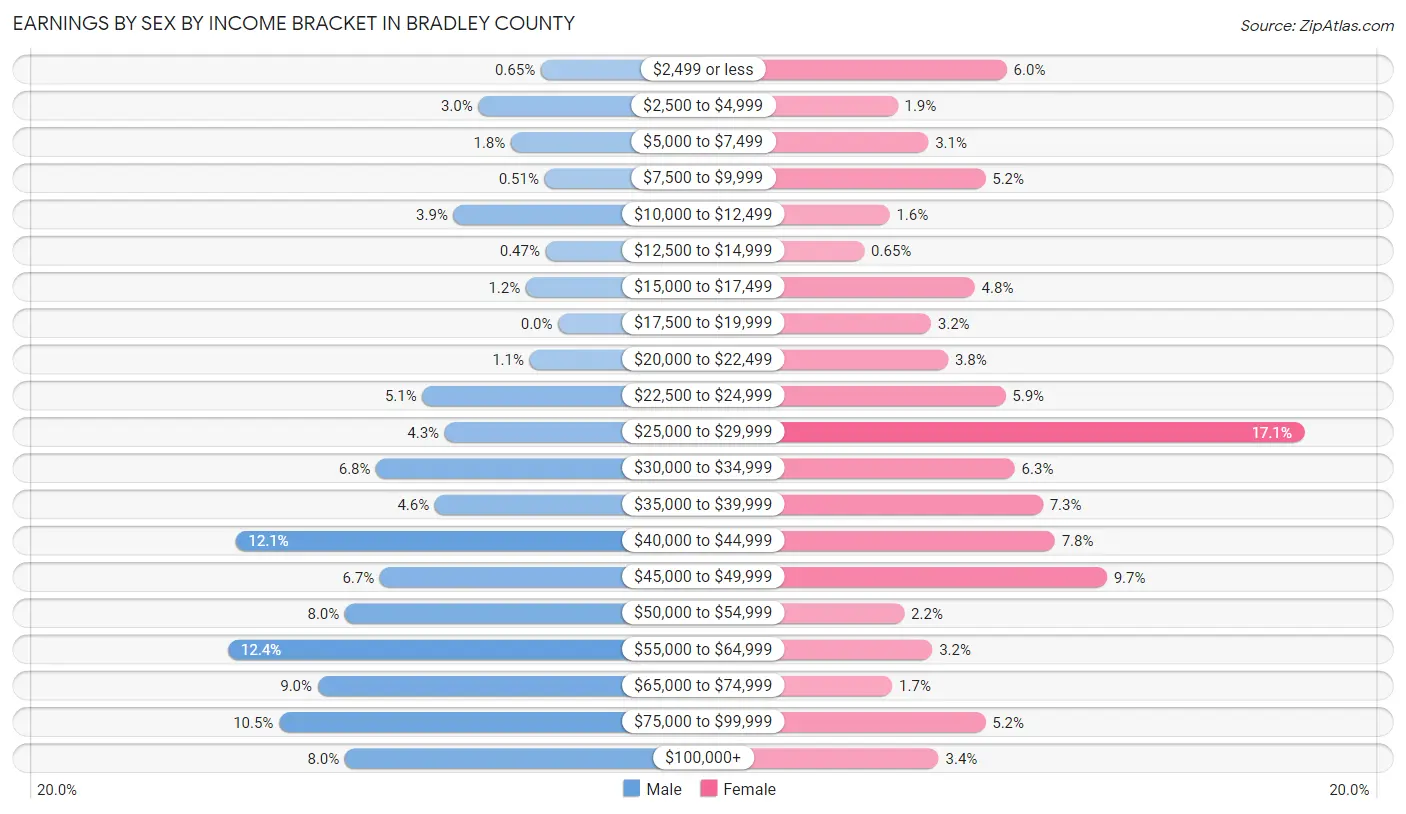
Earnings by Sex by Income Bracket in Bradley County
The most common earnings brackets in Bradley County are $55,000 to $64,999 for men (265 | 12.4%) and $25,000 to $29,999 for women (343 | 17.1%).
| Income | Male | Female |
| $2,499 or less | 14 (0.6%) | 120 (6.0%) |
| $2,500 to $4,999 | 64 (3.0%) | 38 (1.9%) |
| $5,000 to $7,499 | 38 (1.8%) | 61 (3.0%) |
| $7,500 to $9,999 | 11 (0.5%) | 104 (5.2%) |
| $10,000 to $12,499 | 84 (3.9%) | 32 (1.6%) |
| $12,500 to $14,999 | 10 (0.5%) | 13 (0.6%) |
| $15,000 to $17,499 | 26 (1.2%) | 96 (4.8%) |
| $17,500 to $19,999 | 0 (0.0%) | 63 (3.2%) |
| $20,000 to $22,499 | 23 (1.1%) | 76 (3.8%) |
| $22,500 to $24,999 | 109 (5.1%) | 119 (5.9%) |
| $25,000 to $29,999 | 91 (4.3%) | 343 (17.1%) |
| $30,000 to $34,999 | 146 (6.8%) | 126 (6.3%) |
| $35,000 to $39,999 | 99 (4.6%) | 147 (7.3%) |
| $40,000 to $44,999 | 259 (12.1%) | 156 (7.8%) |
| $45,000 to $49,999 | 143 (6.7%) | 195 (9.7%) |
| $50,000 to $54,999 | 171 (8.0%) | 43 (2.1%) |
| $55,000 to $64,999 | 265 (12.4%) | 64 (3.2%) |
| $65,000 to $74,999 | 193 (9.0%) | 34 (1.7%) |
| $75,000 to $99,999 | 224 (10.5%) | 104 (5.2%) |
| $100,000+ | 171 (8.0%) | 69 (3.4%) |
| Total | 2,141 (100.0%) | 2,003 (100.0%) |
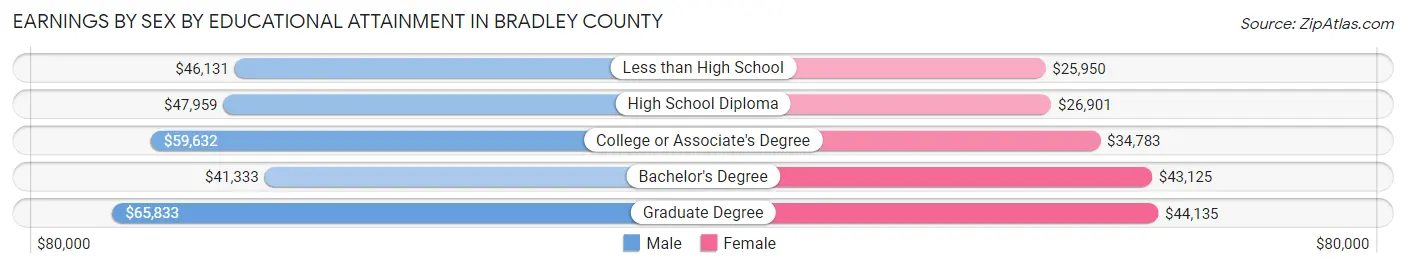
Earnings by Sex by Educational Attainment in Bradley County
Average earnings in Bradley County are $50,859 for men and $30,852 for women, a difference of 39.3%. Men with an educational attainment of graduate degree enjoy the highest average annual earnings of $65,833, while those with bachelor's degree education earn the least with $41,333. Women with an educational attainment of graduate degree earn the most with the average annual earnings of $44,135, while those with less than high school education have the smallest earnings of $25,950.
| Educational Attainment | Male Income | Female Income |
| Less than High School | $46,131 | $25,950 |
| High School Diploma | $47,959 | $26,901 |
| College or Associate's Degree | $59,632 | $34,783 |
| Bachelor's Degree | $41,333 | $43,125 |
| Graduate Degree | $65,833 | $44,135 |
| Total | $50,859 | $30,852 |
Family Income in Bradley County
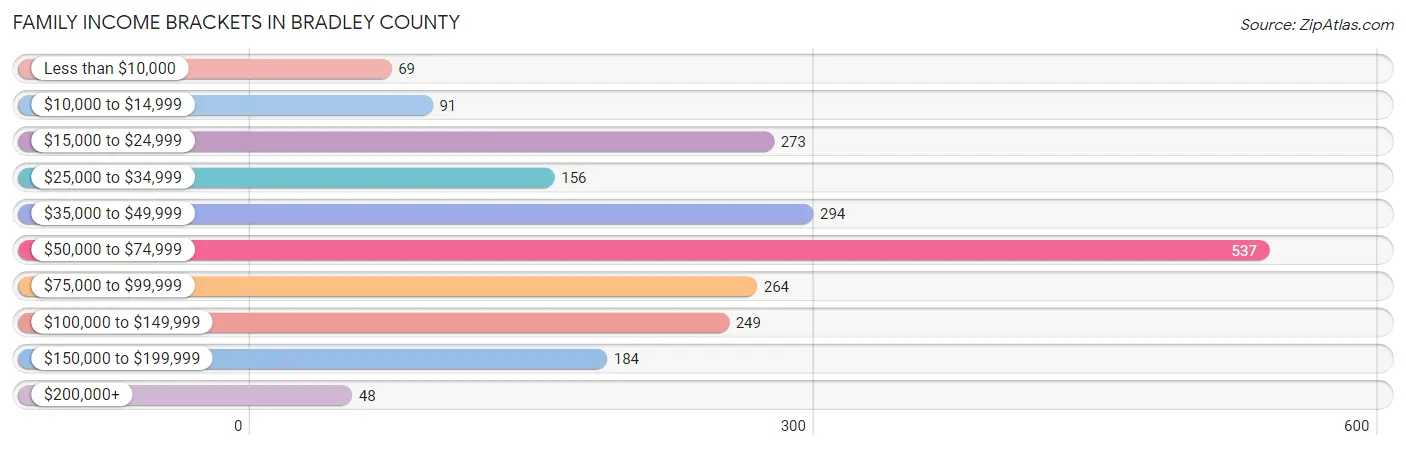
Family Income Brackets in Bradley County
According to the Bradley County family income data, there are 537 families falling into the $50,000 to $74,999 income range, which is the most common income bracket and makes up 24.8% of all families. Conversely, the $200,000+ income bracket is the least frequent group with only 48 families (2.2%) belonging to this category.
| Income Bracket | # Families | % Families |
| Less than $10,000 | 69 | 3.2% |
| $10,000 to $14,999 | 91 | 4.2% |
| $15,000 to $24,999 | 273 | 12.6% |
| $25,000 to $34,999 | 156 | 7.2% |
| $35,000 to $49,999 | 294 | 13.6% |
| $50,000 to $74,999 | 537 | 24.8% |
| $75,000 to $99,999 | 264 | 12.2% |
| $100,000 to $149,999 | 249 | 11.5% |
| $150,000 to $199,999 | 184 | 8.5% |
| $200,000+ | 48 | 2.2% |
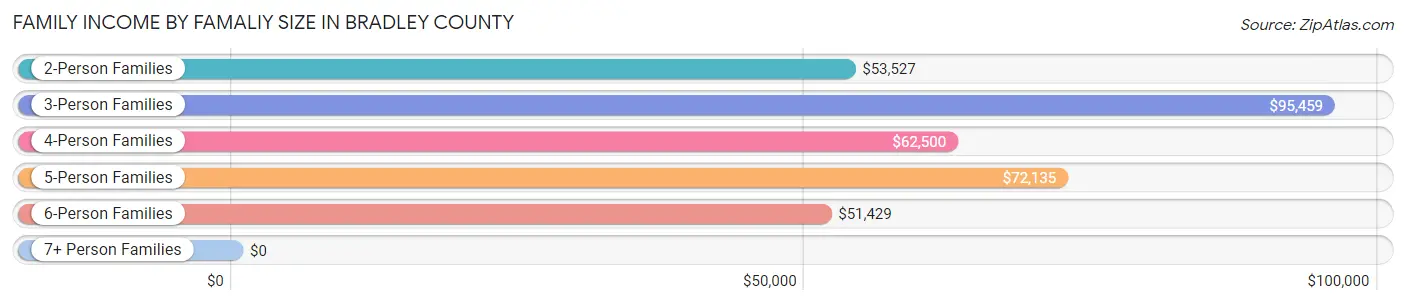
Family Income by Famaliy Size in Bradley County
3-person families (422 | 19.5%) account for the highest median family income in Bradley County with $95,459 per family, while 3-person families (422 | 19.5%) have the highest median income of $31,820 per family member.
| Income Bracket | # Families | Median Income |
| 2-Person Families | 1,169 (54.0%) | $53,527 |
| 3-Person Families | 422 (19.5%) | $95,459 |
| 4-Person Families | 268 (12.4%) | $62,500 |
| 5-Person Families | 165 (7.6%) | $72,135 |
| 6-Person Families | 102 (4.7%) | $51,429 |
| 7+ Person Families | 39 (1.8%) | $0 |
| Total | 2,165 (100.0%) | $60,497 |
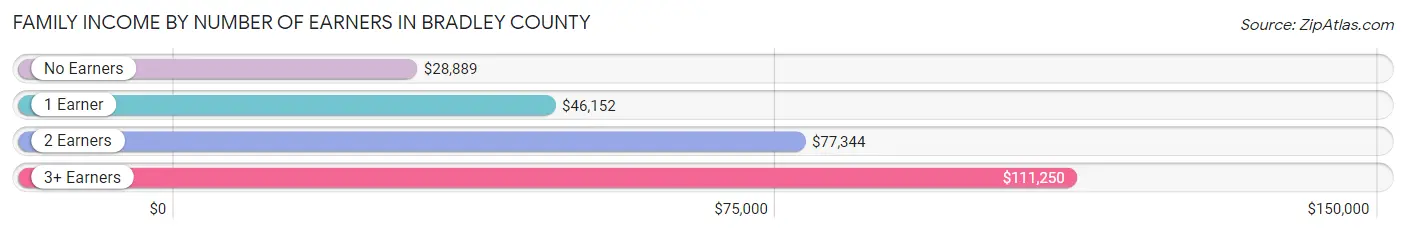
Family Income by Number of Earners in Bradley County
The median family income in Bradley County is $60,497, with families comprising 3+ earners (175) having the highest median family income of $111,250, while families with no earners (550) have the lowest median family income of $28,889, accounting for 8.1% and 25.4% of families, respectively.
| Number of Earners | # Families | Median Income |
| No Earners | 550 (25.4%) | $28,889 |
| 1 Earner | 781 (36.1%) | $46,152 |
| 2 Earners | 659 (30.4%) | $77,344 |
| 3+ Earners | 175 (8.1%) | $111,250 |
| Total | 2,165 (100.0%) | $60,497 |
Household Income in Bradley County
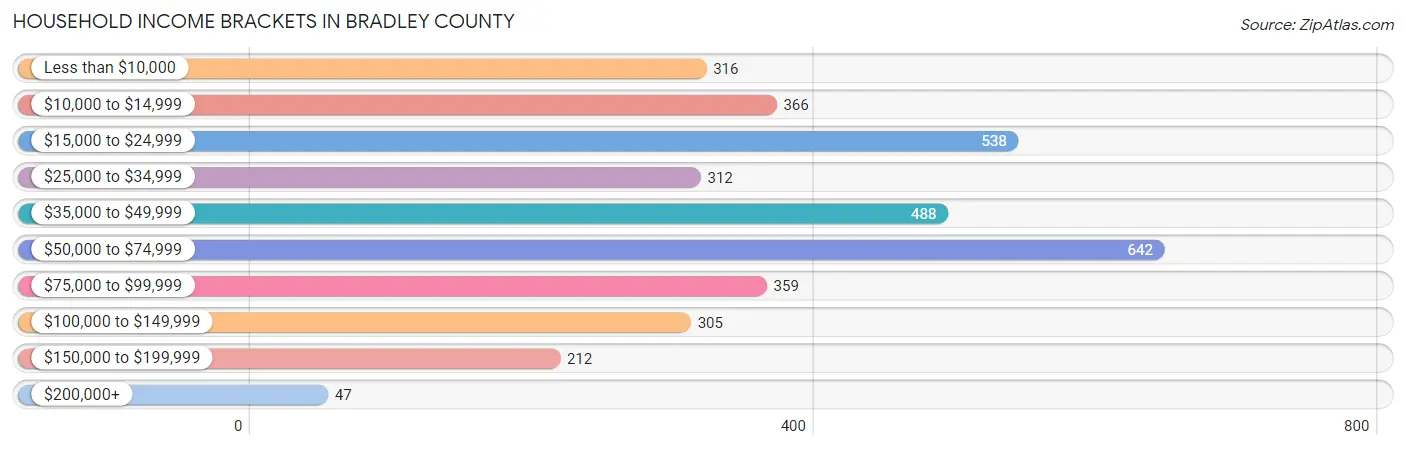
Household Income Brackets in Bradley County
With 642 households falling in the category, the $50,000 to $74,999 income range is the most frequent in Bradley County, accounting for 17.9% of all households. In contrast, only 47 households (1.3%) fall into the $200,000+ income bracket, making it the least populous group.
| Income Bracket | # Households | % Households |
| Less than $10,000 | 316 | 8.8% |
| $10,000 to $14,999 | 366 | 10.2% |
| $15,000 to $24,999 | 538 | 15.0% |
| $25,000 to $34,999 | 312 | 8.7% |
| $35,000 to $49,999 | 488 | 13.6% |
| $50,000 to $74,999 | 642 | 17.9% |
| $75,000 to $99,999 | 359 | 10.0% |
| $100,000 to $149,999 | 305 | 8.5% |
| $150,000 to $199,999 | 212 | 5.9% |
| $200,000+ | 47 | 1.3% |
Household Income by Householder Age in Bradley County
The median household income in Bradley County is $43,688, with the highest median household income of $54,922 found in the 15 to 24 years age bracket for the primary householder. A total of 89 households (2.5%) fall into this category. Meanwhile, the 65+ years age bracket for the primary householder has the lowest median household income of $26,413, with 1,206 households (33.6%) in this group.
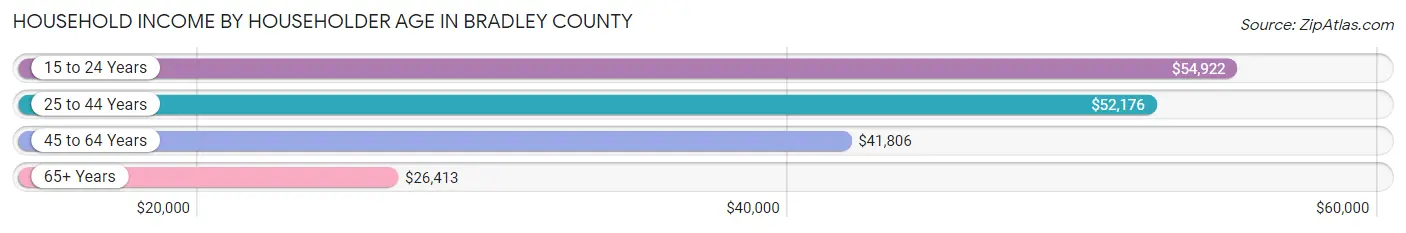
| Income Bracket | # Households | Median Income |
| 15 to 24 Years | 89 (2.5%) | $54,922 |
| 25 to 44 Years | 1,048 (29.2%) | $52,176 |
| 45 to 64 Years | 1,244 (34.7%) | $41,806 |
| 65+ Years | 1,206 (33.6%) | $26,413 |
| Total | 3,587 (100.0%) | $43,688 |
Poverty in Bradley County
Income Below Poverty by Sex and Age in Bradley County
With 11.3% poverty level for males and 18.8% for females among the residents of Bradley County, 5 year old males and 5 year old females are the most vulnerable to poverty, with 29 males (45.3%) and 24 females (42.1%) in their respective age groups living below the poverty level.
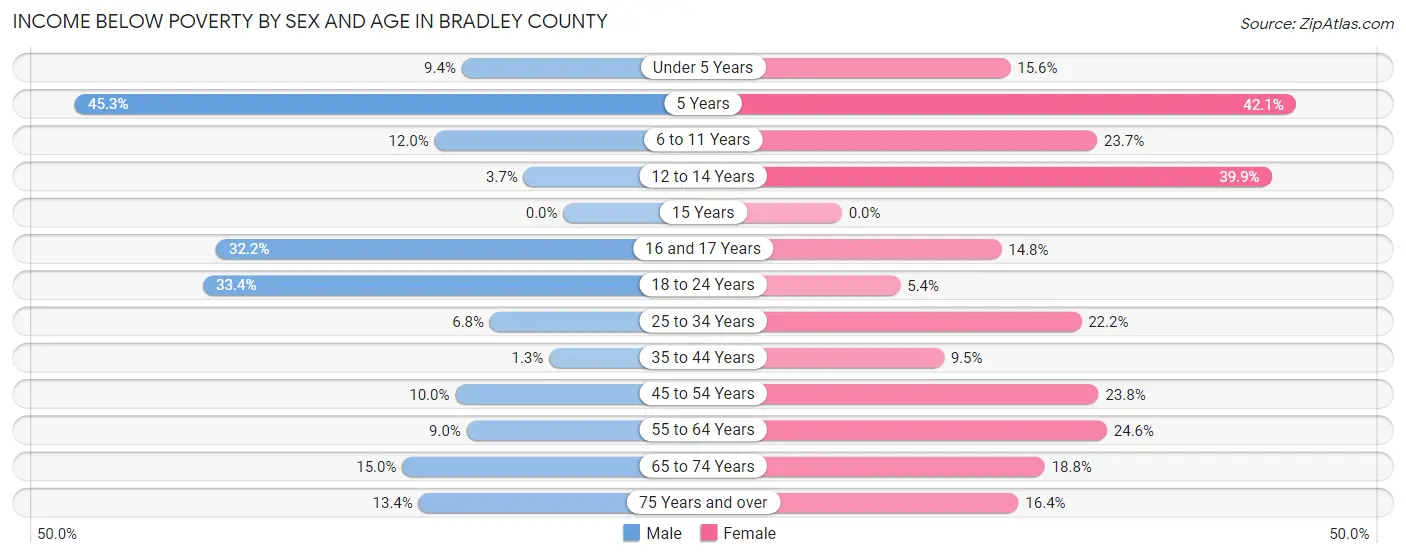
| Age Bracket | Male | Female |
| Under 5 Years | 35 (9.4%) | 43 (15.6%) |
| 5 Years | 29 (45.3%) | 24 (42.1%) |
| 6 to 11 Years | 52 (11.9%) | 113 (23.7%) |
| 12 to 14 Years | 14 (3.7%) | 61 (39.9%) |
| 15 Years | 0 (0.0%) | 0 (0.0%) |
| 16 and 17 Years | 39 (32.2%) | 20 (14.8%) |
| 18 to 24 Years | 119 (33.4%) | 24 (5.4%) |
| 25 to 34 Years | 39 (6.8%) | 130 (22.2%) |
| 35 to 44 Years | 9 (1.3%) | 72 (9.5%) |
| 45 to 54 Years | 62 (10.0%) | 161 (23.8%) |
| 55 to 64 Years | 52 (9.0%) | 170 (24.6%) |
| 65 to 74 Years | 77 (14.9%) | 109 (18.8%) |
| 75 Years and over | 38 (13.4%) | 78 (16.4%) |
| Total | 565 (11.3%) | 1,005 (18.8%) |
Income Above Poverty by Sex and Age in Bradley County
According to the poverty statistics in Bradley County, males aged 15 years and females aged 15 years are the age groups that are most secure financially, with 100.0% of males and 100.0% of females in these age groups living above the poverty line.
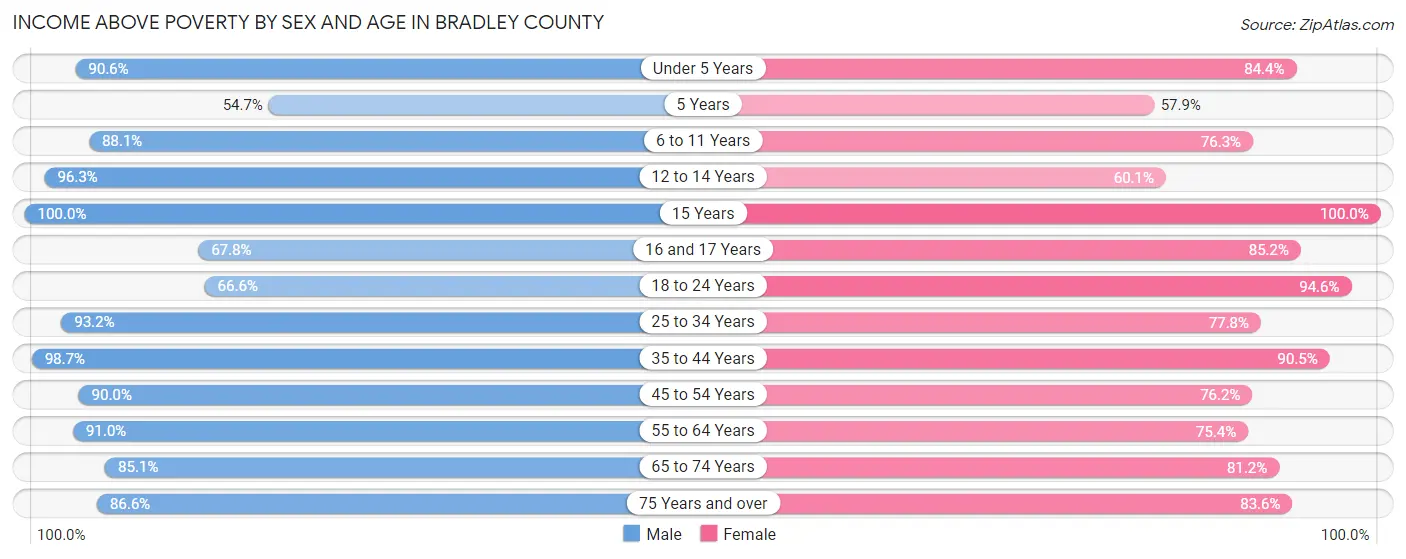
| Age Bracket | Male | Female |
| Under 5 Years | 336 (90.6%) | 232 (84.4%) |
| 5 Years | 35 (54.7%) | 33 (57.9%) |
| 6 to 11 Years | 383 (88.0%) | 364 (76.3%) |
| 12 to 14 Years | 365 (96.3%) | 92 (60.1%) |
| 15 Years | 32 (100.0%) | 50 (100.0%) |
| 16 and 17 Years | 82 (67.8%) | 115 (85.2%) |
| 18 to 24 Years | 237 (66.6%) | 418 (94.6%) |
| 25 to 34 Years | 533 (93.2%) | 455 (77.8%) |
| 35 to 44 Years | 671 (98.7%) | 689 (90.5%) |
| 45 to 54 Years | 556 (90.0%) | 515 (76.2%) |
| 55 to 64 Years | 528 (91.0%) | 521 (75.4%) |
| 65 to 74 Years | 438 (85.1%) | 470 (81.2%) |
| 75 Years and over | 245 (86.6%) | 398 (83.6%) |
| Total | 4,441 (88.7%) | 4,352 (81.2%) |
Income Below Poverty Among Married-Couple Families in Bradley County
The poverty statistics for married-couple families in Bradley County show that 5.0% or 74 of the total 1,483 families live below the poverty line. Families with 3 or 4 children have the highest poverty rate of 24.1%, comprising of 20 families. On the other hand, families with 5 or more children have the lowest poverty rate of 0.0%, which includes 0 families.
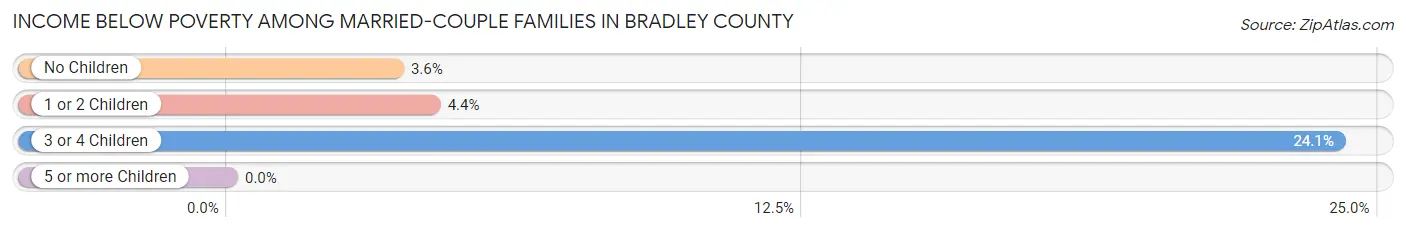
| Children | Above Poverty | Below Poverty |
| No Children | 828 (96.4%) | 31 (3.6%) |
| 1 or 2 Children | 498 (95.6%) | 23 (4.4%) |
| 3 or 4 Children | 63 (75.9%) | 20 (24.1%) |
| 5 or more Children | 20 (100.0%) | 0 (0.0%) |
| Total | 1,409 (95.0%) | 74 (5.0%) |
Income Below Poverty Among Single-Parent Households in Bradley County
According to the poverty data in Bradley County, 8.8% or 10 single-father households and 38.2% or 217 single-mother households are living below the poverty line. Among single-father households, those with no children have the highest poverty rate, with 6 households (9.8%) experiencing poverty. Likewise, among single-mother households, those with 5 or more children have the highest poverty rate, with 5 households (100.0%) falling below the poverty line.
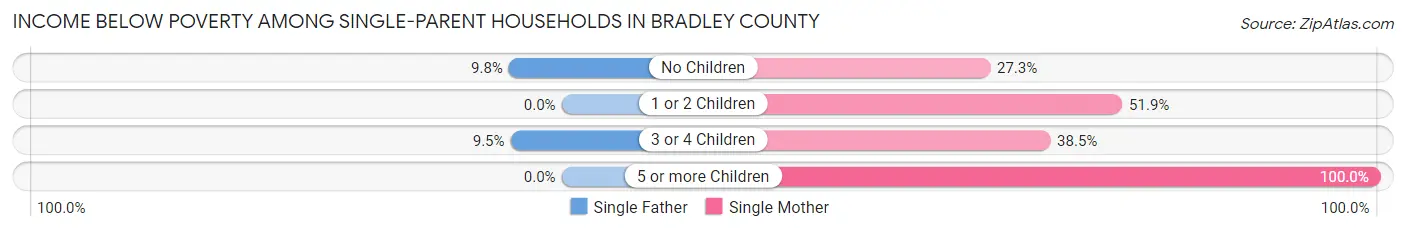
| Children | Single Father | Single Mother |
| No Children | 6 (9.8%) | 81 (27.3%) |
| 1 or 2 Children | 0 (0.0%) | 111 (51.9%) |
| 3 or 4 Children | 4 (9.5%) | 20 (38.5%) |
| 5 or more Children | 0 (0.0%) | 5 (100.0%) |
| Total | 10 (8.8%) | 217 (38.2%) |
Income Below Poverty Among Married-Couple vs Single-Parent Households in Bradley County
The poverty data for Bradley County shows that 74 of the married-couple family households (5.0%) and 227 of the single-parent households (33.3%) are living below the poverty level. Within the married-couple family households, those with 3 or 4 children have the highest poverty rate, with 20 households (24.1%) falling below the poverty line. Among the single-parent households, those with 5 or more children have the highest poverty rate, with 5 household (100.0%) living below poverty.
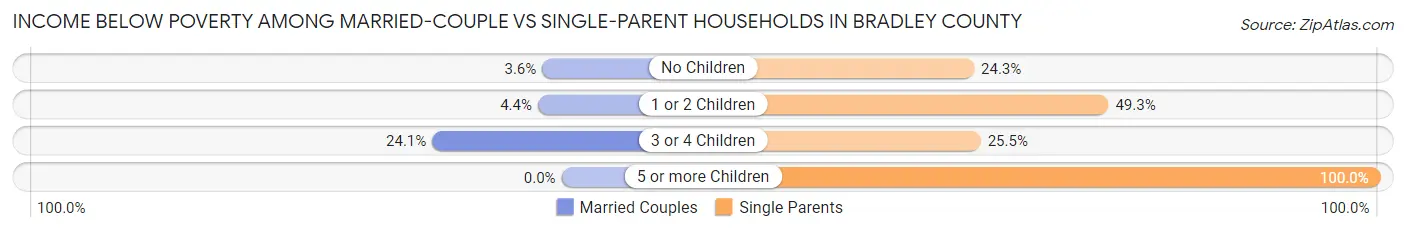
| Children | Married-Couple Families | Single-Parent Households |
| No Children | 31 (3.6%) | 87 (24.3%) |
| 1 or 2 Children | 23 (4.4%) | 111 (49.3%) |
| 3 or 4 Children | 20 (24.1%) | 24 (25.5%) |
| 5 or more Children | 0 (0.0%) | 5 (100.0%) |
| Total | 74 (5.0%) | 227 (33.3%) |
Race in Bradley County
The most populous races in Bradley County are White / Caucasian (6,370 | 60.9%), Black / African American (2,722 | 26.0%), and Hispanic or Latino (1,674 | 16.0%).
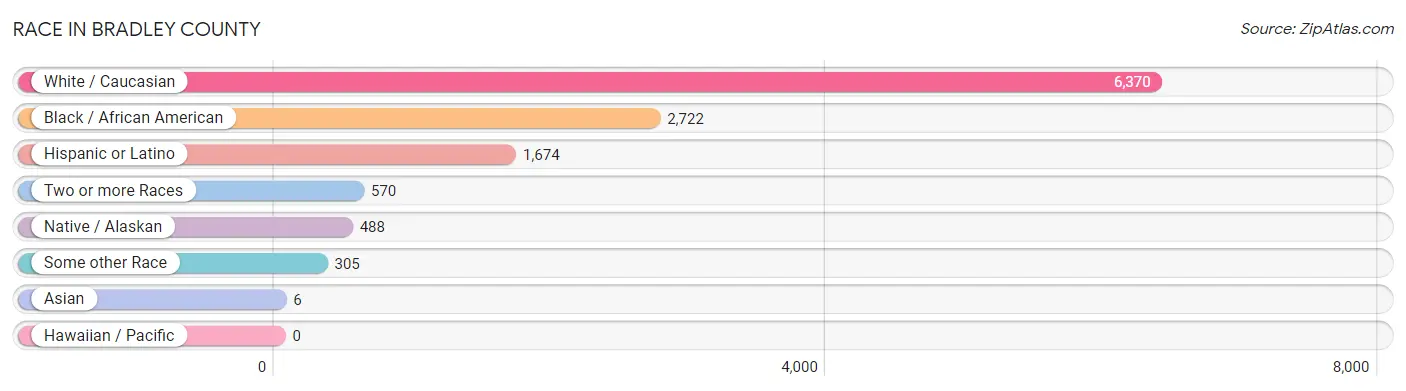
| Race | # Population | % Population |
| Asian | 6 | 0.1% |
| Black / African American | 2,722 | 26.0% |
| Hawaiian / Pacific | 0 | 0.0% |
| Hispanic or Latino | 1,674 | 16.0% |
| Native / Alaskan | 488 | 4.7% |
| White / Caucasian | 6,370 | 60.9% |
| Two or more Races | 570 | 5.4% |
| Some other Race | 305 | 2.9% |
| Total | 10,461 | 100.0% |
Ancestry in Bradley County
The most populous ancestries reported in Bradley County are Mexican (1,660 | 15.9%), English (946 | 9.0%), American (753 | 7.2%), Mexican American Indian (488 | 4.7%), and Irish (447 | 4.3%), together accounting for 41.0% of all Bradley County residents.
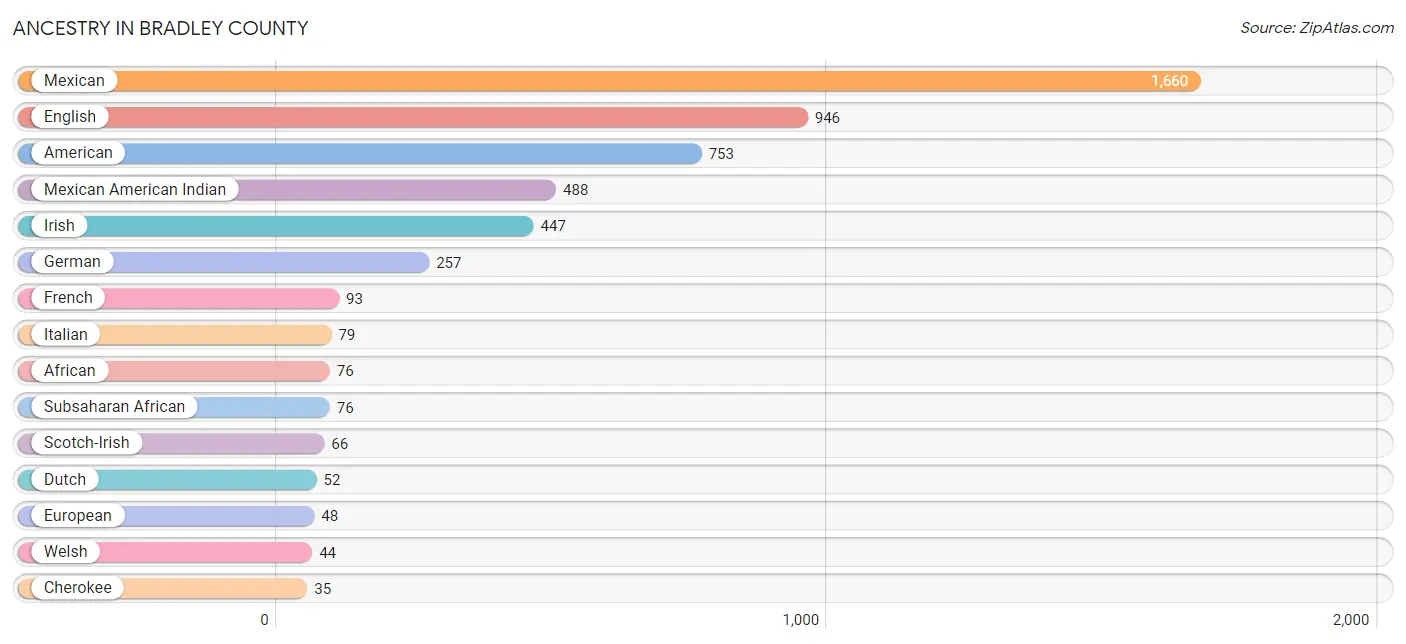
| Ancestry | # Population | % Population |
| African | 76 | 0.7% |
| American | 753 | 7.2% |
| Bhutanese | 6 | 0.1% |
| British | 11 | 0.1% |
| Cajun | 25 | 0.2% |
| Celtic | 4 | 0.0% |
| Cherokee | 35 | 0.3% |
| Dutch | 52 | 0.5% |
| English | 946 | 9.0% |
| European | 48 | 0.5% |
| French | 93 | 0.9% |
| French Canadian | 20 | 0.2% |
| German | 257 | 2.5% |
| Irish | 447 | 4.3% |
| Italian | 79 | 0.8% |
| Mexican | 1,660 | 15.9% |
| Mexican American Indian | 488 | 4.7% |
| Pakistani | 10 | 0.1% |
| Polish | 12 | 0.1% |
| Russian | 11 | 0.1% |
| Scotch-Irish | 66 | 0.6% |
| Scottish | 13 | 0.1% |
| Subsaharan African | 76 | 0.7% |
| Swedish | 3 | 0.0% |
| Welsh | 44 | 0.4% | View All 25 Rows |
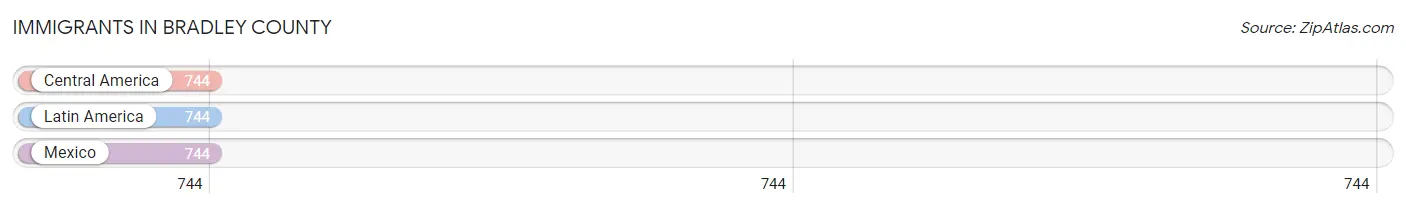
Immigrants in Bradley County
The most numerous immigrant groups reported in Bradley County came from Central America (744 | 7.1%), Latin America (744 | 7.1%), and Mexico (744 | 7.1%), together accounting for 21.3% of all Bradley County residents.
| Immigration Origin | # Population | % Population |
| Central America | 744 | 7.1% |
| Latin America | 744 | 7.1% |
| Mexico | 744 | 7.1% | View All 3 Rows |
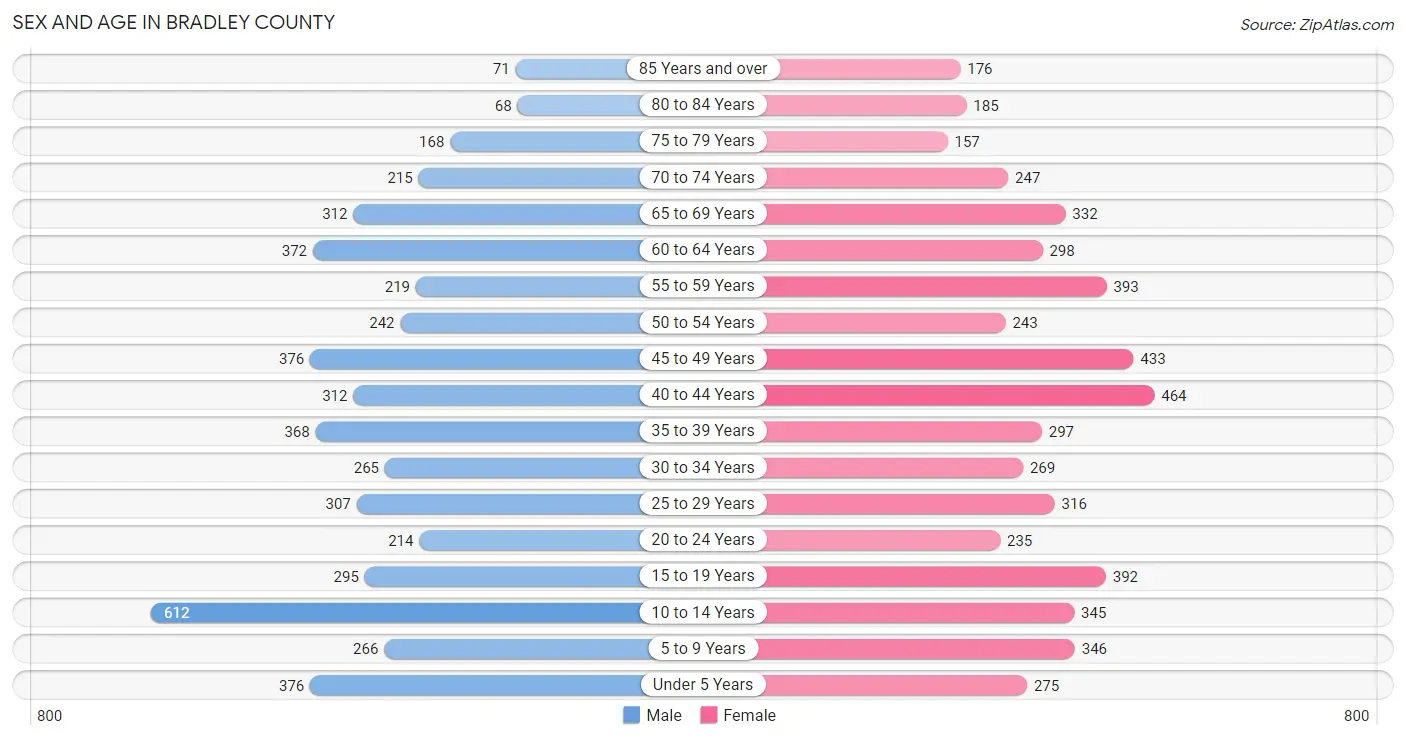
Sex and Age in Bradley County
Sex and Age in Bradley County
The most populous age groups in Bradley County are 10 to 14 Years (612 | 12.1%) for men and 40 to 44 Years (464 | 8.6%) for women.
| Age Bracket | Male | Female |
| Under 5 Years | 376 (7.4%) | 275 (5.1%) |
| 5 to 9 Years | 266 (5.3%) | 346 (6.4%) |
| 10 to 14 Years | 612 (12.1%) | 345 (6.4%) |
| 15 to 19 Years | 295 (5.8%) | 392 (7.3%) |
| 20 to 24 Years | 214 (4.2%) | 235 (4.3%) |
| 25 to 29 Years | 307 (6.1%) | 316 (5.9%) |
| 30 to 34 Years | 265 (5.2%) | 269 (5.0%) |
| 35 to 39 Years | 368 (7.3%) | 297 (5.5%) |
| 40 to 44 Years | 312 (6.2%) | 464 (8.6%) |
| 45 to 49 Years | 376 (7.4%) | 433 (8.0%) |
| 50 to 54 Years | 242 (4.8%) | 243 (4.5%) |
| 55 to 59 Years | 219 (4.3%) | 393 (7.3%) |
| 60 to 64 Years | 372 (7.3%) | 298 (5.5%) |
| 65 to 69 Years | 312 (6.2%) | 332 (6.1%) |
| 70 to 74 Years | 215 (4.3%) | 247 (4.6%) |
| 75 to 79 Years | 168 (3.3%) | 157 (2.9%) |
| 80 to 84 Years | 68 (1.3%) | 185 (3.4%) |
| 85 Years and over | 71 (1.4%) | 176 (3.3%) |
| Total | 5,058 (100.0%) | 5,403 (100.0%) |
Families and Households in Bradley County
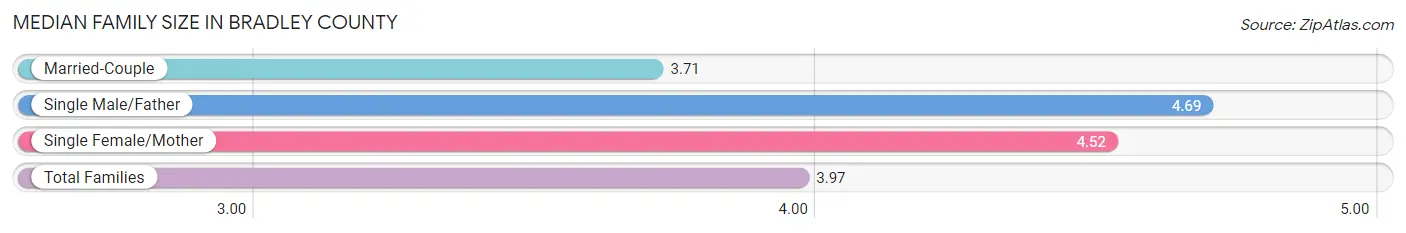
Median Family Size in Bradley County
The median family size in Bradley County is 3.97 persons per family, with single male/father families (114 | 5.3%) accounting for the largest median family size of 4.69 persons per family. On the other hand, married-couple families (1,483 | 68.5%) represent the smallest median family size with 3.71 persons per family.
| Family Type | # Families | Family Size |
| Married-Couple | 1,483 (68.5%) | 3.71 |
| Single Male/Father | 114 (5.3%) | 4.69 |
| Single Female/Mother | 568 (26.2%) | 4.52 |
| Total Families | 2,165 (100.0%) | 3.97 |
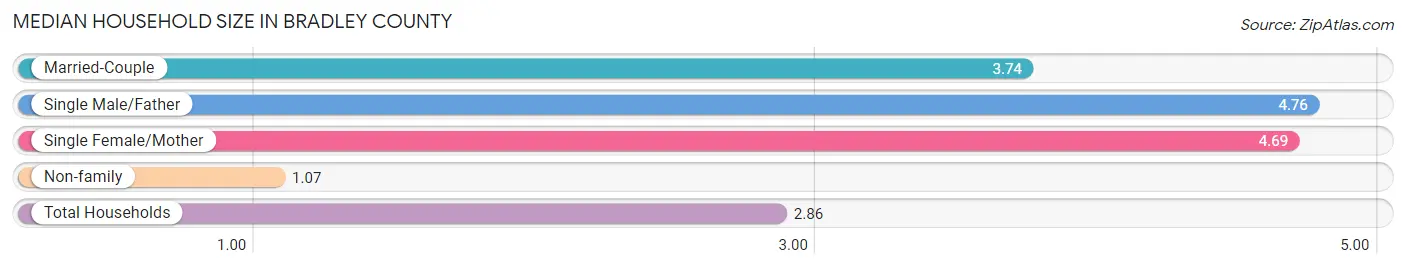
Median Household Size in Bradley County
The median household size in Bradley County is 2.86 persons per household, with single male/father households (114 | 3.2%) accounting for the largest median household size of 4.76 persons per household. non-family households (1,422 | 39.6%) represent the smallest median household size with 1.07 persons per household.
| Household Type | # Households | Household Size |
| Married-Couple | 1,483 (41.3%) | 3.74 |
| Single Male/Father | 114 (3.2%) | 4.76 |
| Single Female/Mother | 568 (15.8%) | 4.69 |
| Non-family | 1,422 (39.6%) | 1.07 |
| Total Households | 3,587 (100.0%) | 2.86 |
Household Size by Marriage Status in Bradley County
Out of a total of 3,587 households in Bradley County, 2,165 (60.4%) are family households, while 1,422 (39.6%) are nonfamily households. The most numerous type of family households are 2-person households, comprising 1,119, and the most common type of nonfamily households are 1-person households, comprising 1,324.
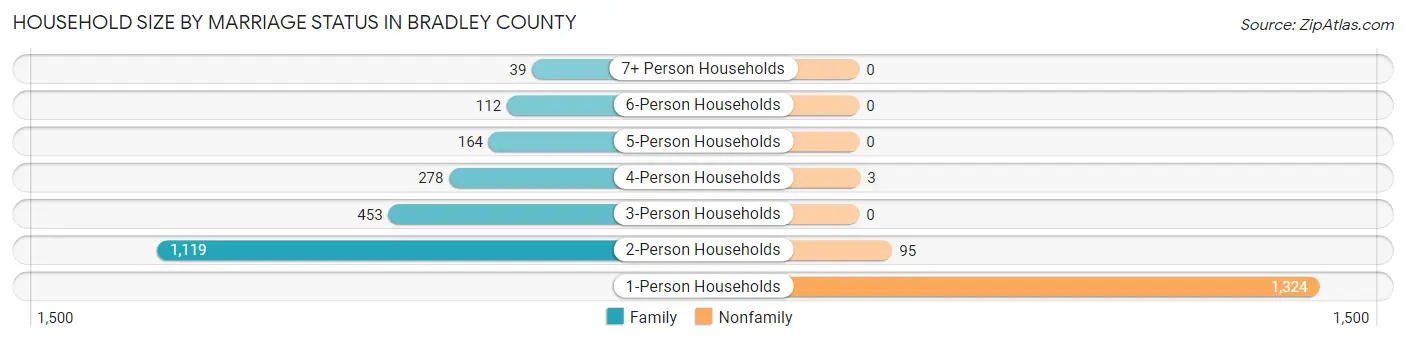
| Household Size | Family Households | Nonfamily Households |
| 1-Person Households | - | 1,324 (36.9%) |
| 2-Person Households | 1,119 (31.2%) | 95 (2.6%) |
| 3-Person Households | 453 (12.6%) | 0 (0.0%) |
| 4-Person Households | 278 (7.7%) | 3 (0.1%) |
| 5-Person Households | 164 (4.6%) | 0 (0.0%) |
| 6-Person Households | 112 (3.1%) | 0 (0.0%) |
| 7+ Person Households | 39 (1.1%) | 0 (0.0%) |
| Total | 2,165 (60.4%) | 1,422 (39.6%) |
Female Fertility in Bradley County
Fertility by Age in Bradley County
Average fertility rate in Bradley County is 60.0 births per 1,000 women. Women in the age bracket of 20 to 34 years have the highest fertility rate with 129.0 births per 1,000 women. Women in the age bracket of 20 to 34 years acount for 73.1% of all women with births.
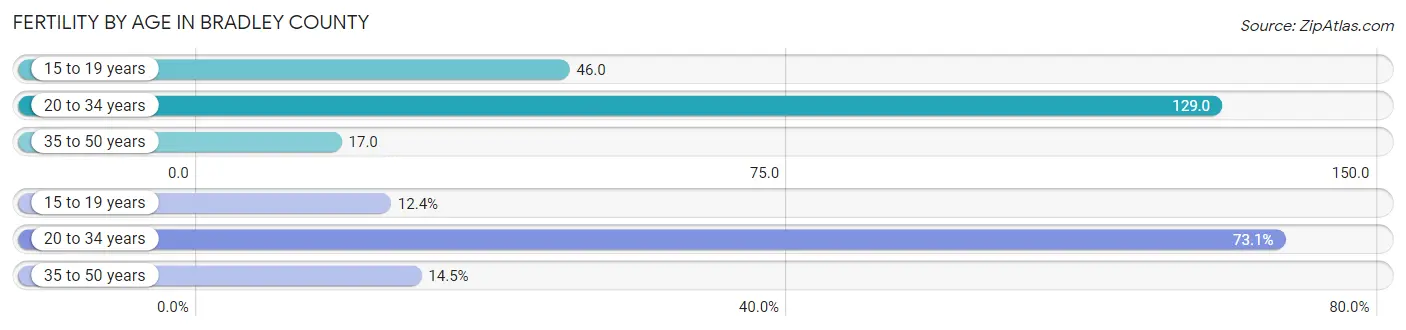
| Age Bracket | Women with Births | Births / 1,000 Women |
| 15 to 19 years | 18 (12.4%) | 46.0 |
| 20 to 34 years | 106 (73.1%) | 129.0 |
| 35 to 50 years | 21 (14.5%) | 17.0 |
| Total | 145 (100.0%) | 60.0 |
Fertility by Age by Marriage Status in Bradley County
47.6% of women with births (145) in Bradley County are married. The highest percentage of unmarried women with births falls into 15 to 19 years age bracket with 100.0% of them unmarried at the time of birth, while the lowest percentage of unmarried women with births belong to 35 to 50 years age bracket with 0.0% of them unmarried.
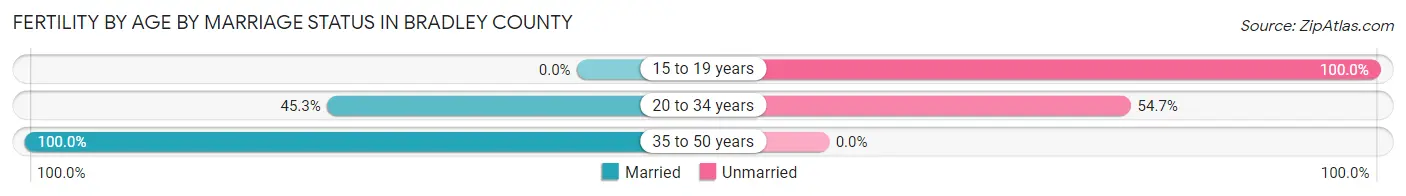
| Age Bracket | Married | Unmarried |
| 15 to 19 years | 0 (0.0%) | 18 (100.0%) |
| 20 to 34 years | 48 (45.3%) | 58 (54.7%) |
| 35 to 50 years | 21 (100.0%) | 0 (0.0%) |
| Total | 69 (47.6%) | 76 (52.4%) |
Fertility by Education in Bradley County
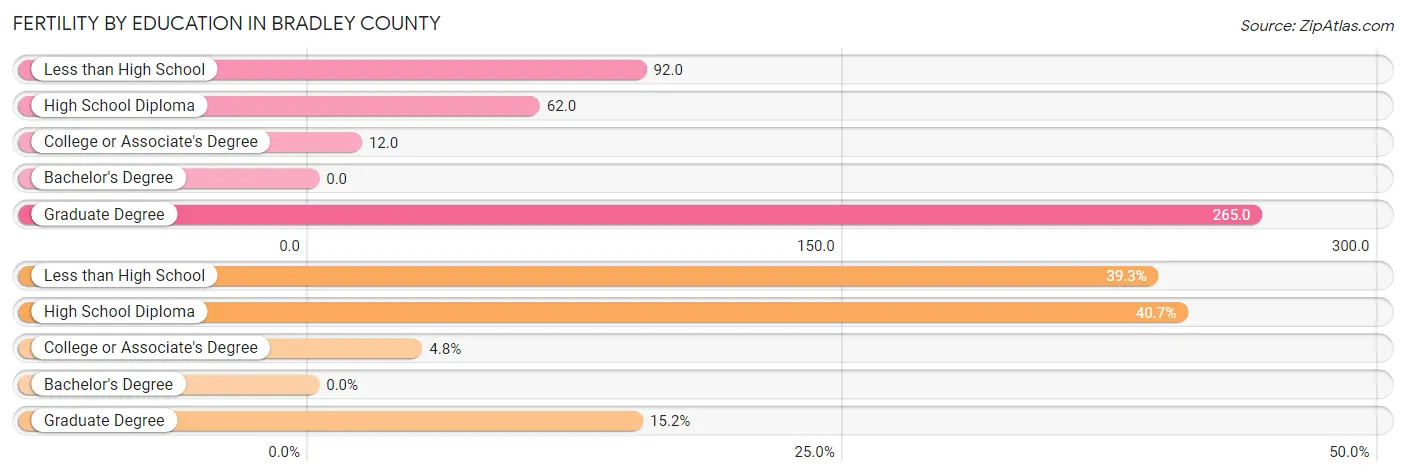
| Educational Attainment | Women with Births | Births / 1,000 Women |
| Less than High School | 57 (39.3%) | 92.0 |
| High School Diploma | 59 (40.7%) | 62.0 |
| College or Associate's Degree | 7 (4.8%) | 12.0 |
| Bachelor's Degree | 0 (0.0%) | 0.0 |
| Graduate Degree | 22 (15.2%) | 265.0 |
| Total | 145 (100.0%) | 60.0 |
Fertility by Education by Marriage Status in Bradley County
52.4% of women with births in Bradley County are unmarried. Women with the educational attainment of college or associate's degree are most likely to be married with 100.0% of them married at childbirth, while women with the educational attainment of high school diploma are least likely to be married with 98.3% of them unmarried at childbirth.
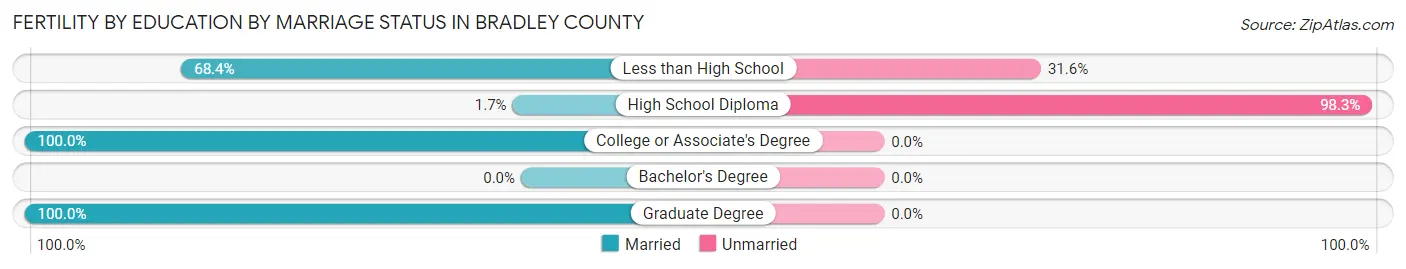
| Educational Attainment | Married | Unmarried |
| Less than High School | 39 (68.4%) | 18 (31.6%) |
| High School Diploma | 1 (1.7%) | 58 (98.3%) |
| College or Associate's Degree | 7 (100.0%) | 0 (0.0%) |
| Bachelor's Degree | 0 (0.0%) | 0 (0.0%) |
| Graduate Degree | 22 (100.0%) | 0 (0.0%) |
| Total | 69 (47.6%) | 76 (52.4%) |
Employment Characteristics in Bradley County
Employment by Class of Employer in Bradley County
Among the 3,691 employed individuals in Bradley County, private company employees (2,540 | 68.8%), state government employees (467 | 12.7%), and local government employees (242 | 6.6%) make up the most common classes of employment.
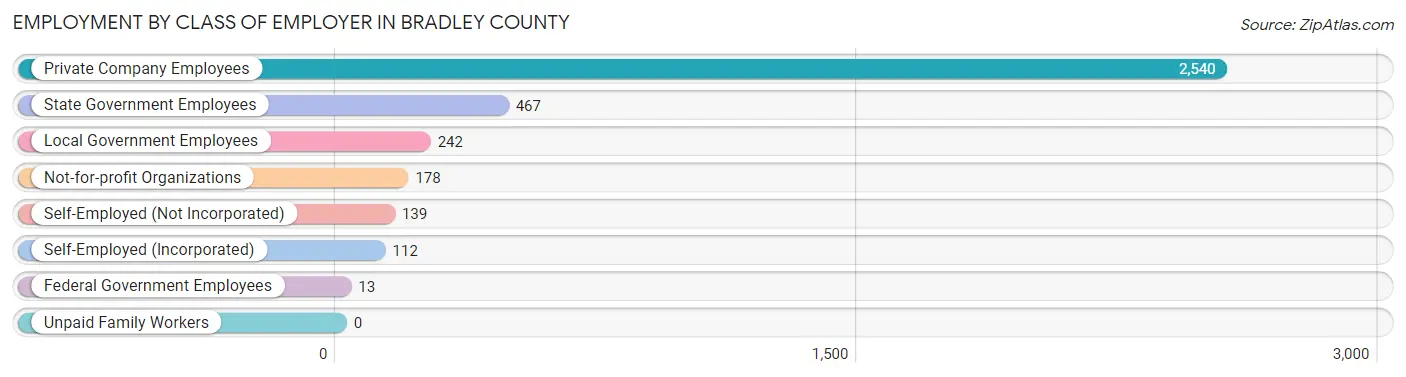
| Employer Class | # Employees | % Employees |
| Private Company Employees | 2,540 | 68.8% |
| Self-Employed (Incorporated) | 112 | 3.0% |
| Self-Employed (Not Incorporated) | 139 | 3.8% |
| Not-for-profit Organizations | 178 | 4.8% |
| Local Government Employees | 242 | 6.6% |
| State Government Employees | 467 | 12.7% |
| Federal Government Employees | 13 | 0.4% |
| Unpaid Family Workers | 0 | 0.0% |
| Total | 3,691 | 100.0% |
Employment Status by Age in Bradley County
According to the labor force statistics for Bradley County, out of the total population over 16 years of age (8,159), 48.6% or 3,965 individuals are in the labor force, with 5.6% or 222 of them unemployed. The age group with the highest labor force participation rate is 30 to 34 years, with 80.1% or 428 individuals in the labor force. Within the labor force, the 20 to 24 years age range has the highest percentage of unemployed individuals, with 17.3% or 61 of them being unemployed.
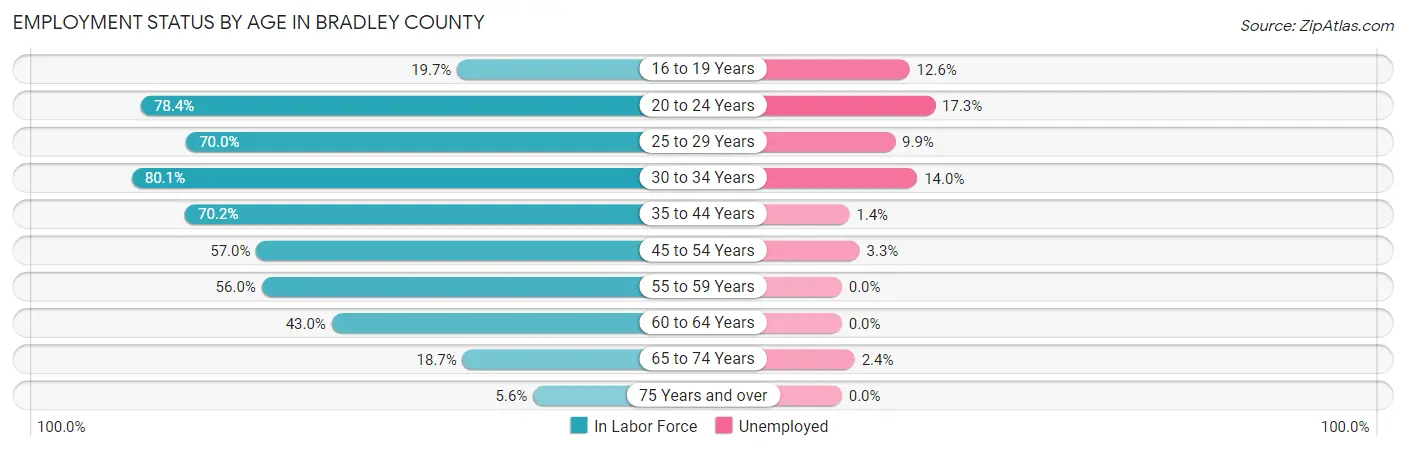
| Age Bracket | In Labor Force | Unemployed |
| 16 to 19 Years | 119 (19.7%) | 15 (12.6%) |
| 20 to 24 Years | 352 (78.4%) | 61 (17.3%) |
| 25 to 29 Years | 436 (70.0%) | 43 (9.9%) |
| 30 to 34 Years | 428 (80.1%) | 60 (14.0%) |
| 35 to 44 Years | 1,012 (70.2%) | 14 (1.4%) |
| 45 to 54 Years | 738 (57.0%) | 24 (3.3%) |
| 55 to 59 Years | 343 (56.0%) | 0 (0.0%) |
| 60 to 64 Years | 288 (43.0%) | 0 (0.0%) |
| 65 to 74 Years | 207 (18.7%) | 5 (2.4%) |
| 75 Years and over | 46 (5.6%) | 0 (0.0%) |
| Total | 3,965 (48.6%) | 222 (5.6%) |
Employment Status by Educational Attainment in Bradley County
According to labor force statistics for Bradley County, 62.7% of individuals (3,244) out of the total population between 25 and 64 years of age (5,174) are in the labor force, with 4.3% or 139 of them being unemployed. The group with the highest labor force participation rate are those with the educational attainment of college / associate degree, with 79.5% or 1,221 individuals in the labor force. Within the labor force, individuals with college / associate degree education have the highest percentage of unemployment, with 8.7% or 106 of them being unemployed.
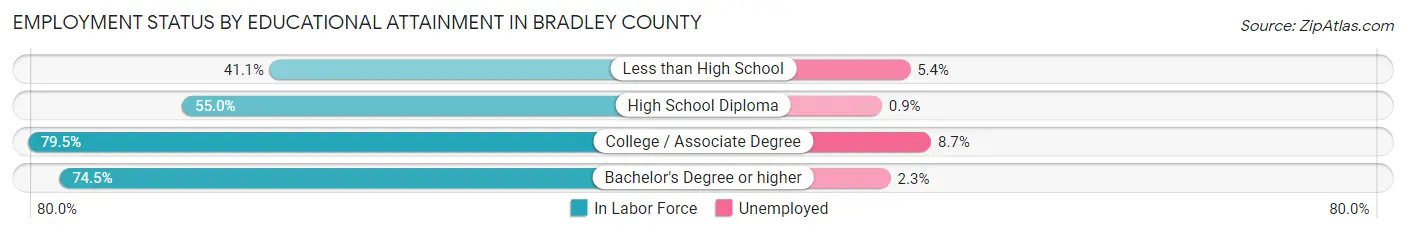
| Educational Attainment | In Labor Force | Unemployed |
| Less than High School | 241 (41.1%) | 32 (5.4%) |
| High School Diploma | 1,390 (55.0%) | 23 (0.9%) |
| College / Associate Degree | 1,221 (79.5%) | 134 (8.7%) |
| Bachelor's Degree or higher | 391 (74.5%) | 12 (2.3%) |
| Total | 3,244 (62.7%) | 222 (4.3%) |
Employment Occupations by Sex in Bradley County
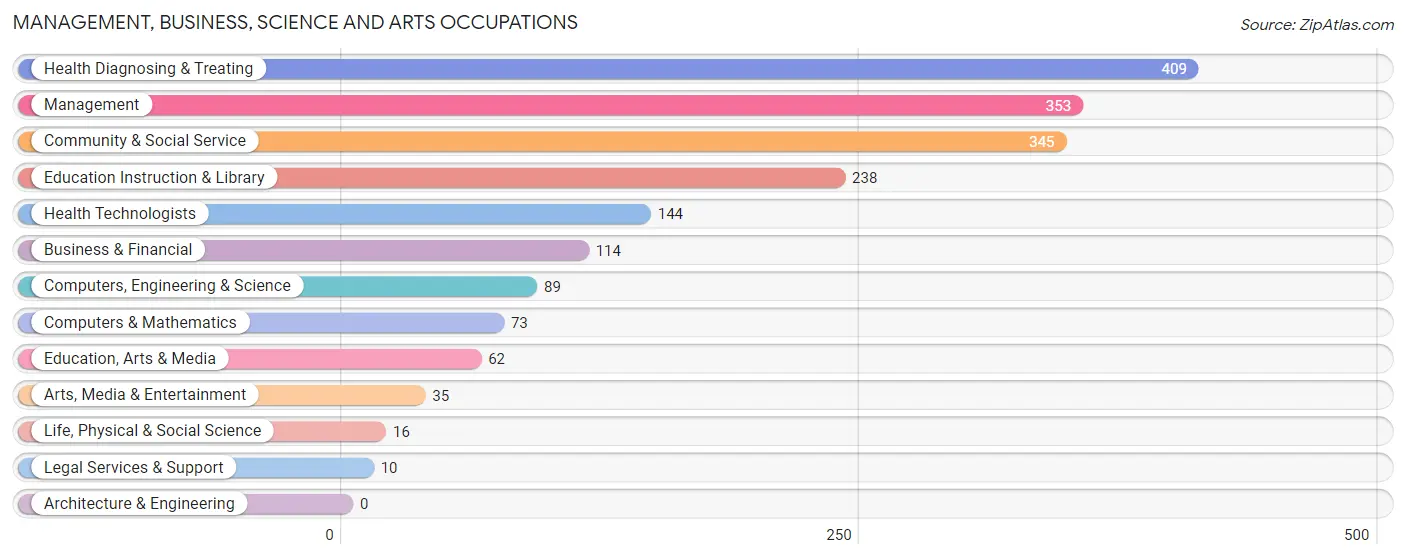
Management, Business, Science and Arts Occupations
The most common Management, Business, Science and Arts occupations in Bradley County are Health Diagnosing & Treating (409 | 10.9%), Management (353 | 9.4%), Community & Social Service (345 | 9.2%), Education Instruction & Library (238 | 6.4%), and Health Technologists (144 | 3.8%).
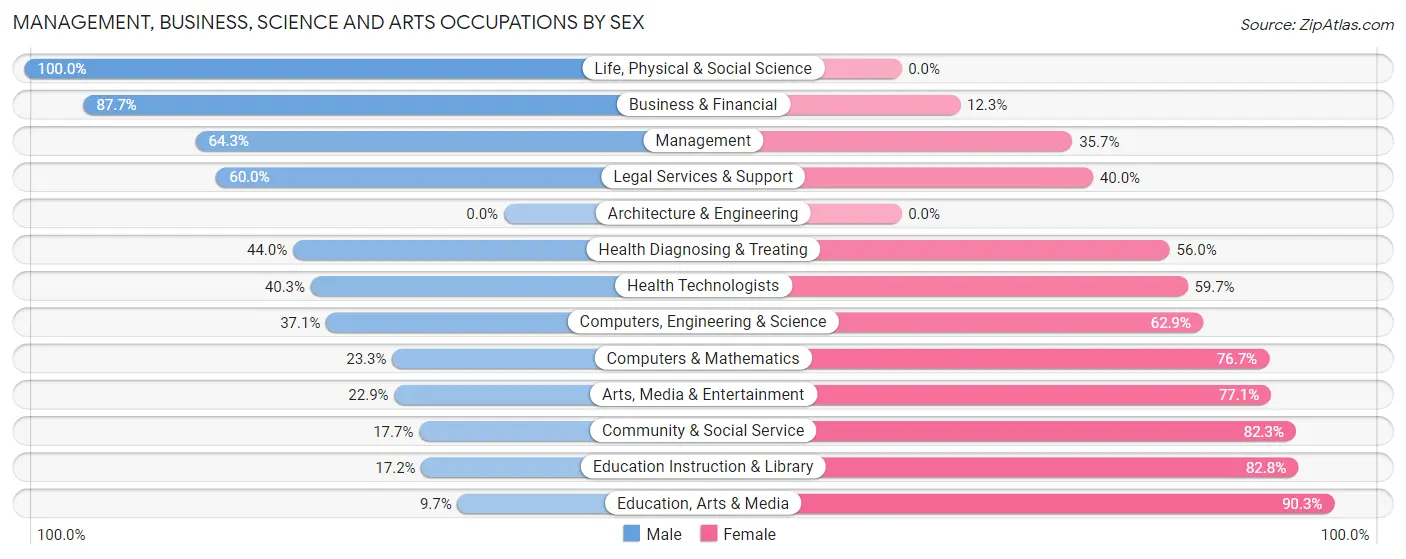
Management, Business, Science and Arts Occupations by Sex
Within the Management, Business, Science and Arts occupations in Bradley County, the most male-oriented occupations are Life, Physical & Social Science (100.0%), Business & Financial (87.7%), and Management (64.3%), while the most female-oriented occupations are Education, Arts & Media (90.3%), Education Instruction & Library (82.8%), and Community & Social Service (82.3%).
| Occupation | Male | Female |
| Management | 227 (64.3%) | 126 (35.7%) |
| Business & Financial | 100 (87.7%) | 14 (12.3%) |
| Computers, Engineering & Science | 33 (37.1%) | 56 (62.9%) |
| Computers & Mathematics | 17 (23.3%) | 56 (76.7%) |
| Architecture & Engineering | 0 (0.0%) | 0 (0.0%) |
| Life, Physical & Social Science | 16 (100.0%) | 0 (0.0%) |
| Community & Social Service | 61 (17.7%) | 284 (82.3%) |
| Education, Arts & Media | 6 (9.7%) | 56 (90.3%) |
| Legal Services & Support | 6 (60.0%) | 4 (40.0%) |
| Education Instruction & Library | 41 (17.2%) | 197 (82.8%) |
| Arts, Media & Entertainment | 8 (22.9%) | 27 (77.1%) |
| Health Diagnosing & Treating | 180 (44.0%) | 229 (56.0%) |
| Health Technologists | 58 (40.3%) | 86 (59.7%) |
| Total (Category) | 601 (45.9%) | 709 (54.1%) |
| Total (Overall) | 1,980 (52.9%) | 1,765 (47.1%) |
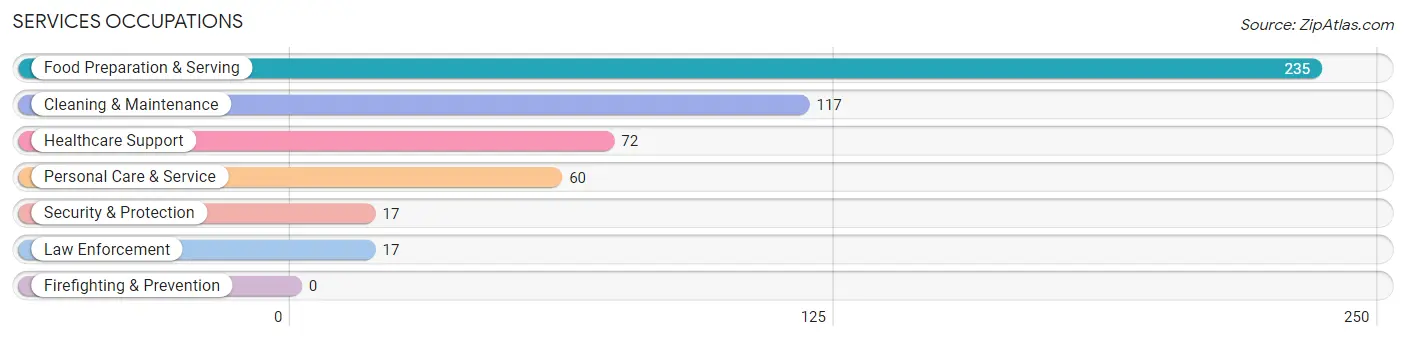
Services Occupations
The most common Services occupations in Bradley County are Food Preparation & Serving (235 | 6.3%), Cleaning & Maintenance (117 | 3.1%), Healthcare Support (72 | 1.9%), Personal Care & Service (60 | 1.6%), and Security & Protection (17 | 0.4%).
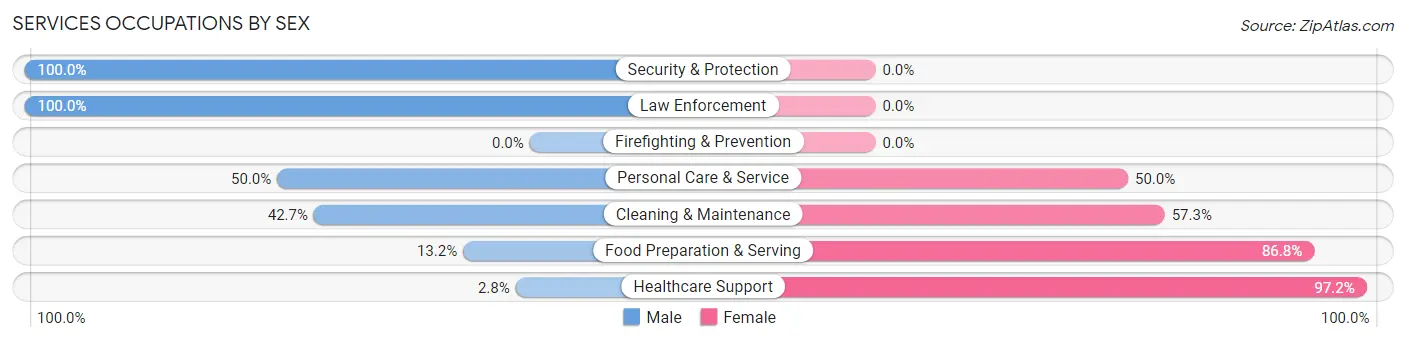
Services Occupations by Sex
Within the Services occupations in Bradley County, the most male-oriented occupations are Security & Protection (100.0%), Law Enforcement (100.0%), and Personal Care & Service (50.0%), while the most female-oriented occupations are Healthcare Support (97.2%), Food Preparation & Serving (86.8%), and Cleaning & Maintenance (57.3%).
| Occupation | Male | Female |
| Healthcare Support | 2 (2.8%) | 70 (97.2%) |
| Security & Protection | 17 (100.0%) | 0 (0.0%) |
| Firefighting & Prevention | 0 (0.0%) | 0 (0.0%) |
| Law Enforcement | 17 (100.0%) | 0 (0.0%) |
| Food Preparation & Serving | 31 (13.2%) | 204 (86.8%) |
| Cleaning & Maintenance | 50 (42.7%) | 67 (57.3%) |
| Personal Care & Service | 30 (50.0%) | 30 (50.0%) |
| Total (Category) | 130 (26.0%) | 371 (74.1%) |
| Total (Overall) | 1,980 (52.9%) | 1,765 (47.1%) |
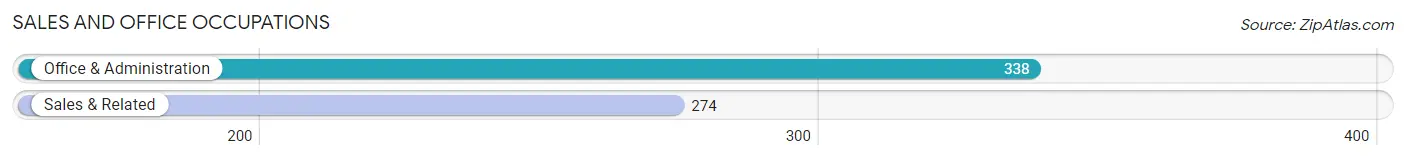
Sales and Office Occupations
The most common Sales and Office occupations in Bradley County are Office & Administration (338 | 9.0%), and Sales & Related (274 | 7.3%).
Sales and Office Occupations by Sex
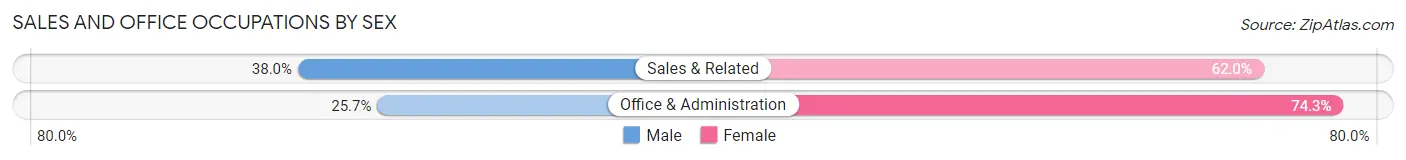
| Occupation | Male | Female |
| Sales & Related | 104 (38.0%) | 170 (62.0%) |
| Office & Administration | 87 (25.7%) | 251 (74.3%) |
| Total (Category) | 191 (31.2%) | 421 (68.8%) |
| Total (Overall) | 1,980 (52.9%) | 1,765 (47.1%) |
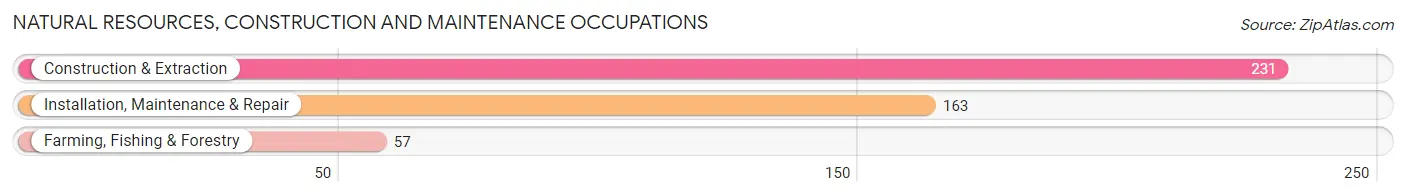
Natural Resources, Construction and Maintenance Occupations
The most common Natural Resources, Construction and Maintenance occupations in Bradley County are Construction & Extraction (231 | 6.2%), Installation, Maintenance & Repair (163 | 4.3%), and Farming, Fishing & Forestry (57 | 1.5%).
Natural Resources, Construction and Maintenance Occupations by Sex
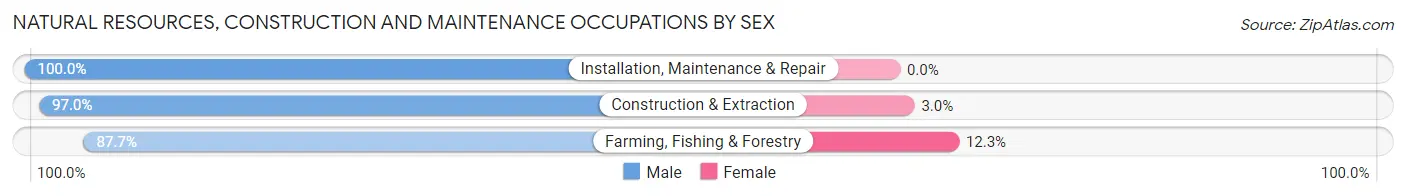
| Occupation | Male | Female |
| Farming, Fishing & Forestry | 50 (87.7%) | 7 (12.3%) |
| Construction & Extraction | 224 (97.0%) | 7 (3.0%) |
| Installation, Maintenance & Repair | 163 (100.0%) | 0 (0.0%) |
| Total (Category) | 437 (96.9%) | 14 (3.1%) |
| Total (Overall) | 1,980 (52.9%) | 1,765 (47.1%) |
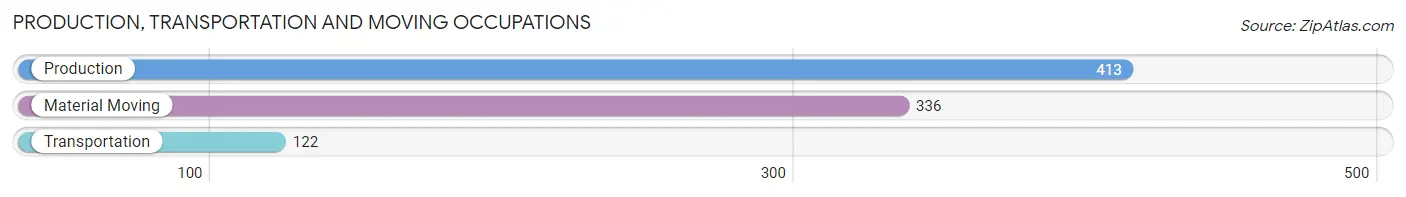
Production, Transportation and Moving Occupations
The most common Production, Transportation and Moving occupations in Bradley County are Production (413 | 11.0%), Material Moving (336 | 9.0%), and Transportation (122 | 3.3%).
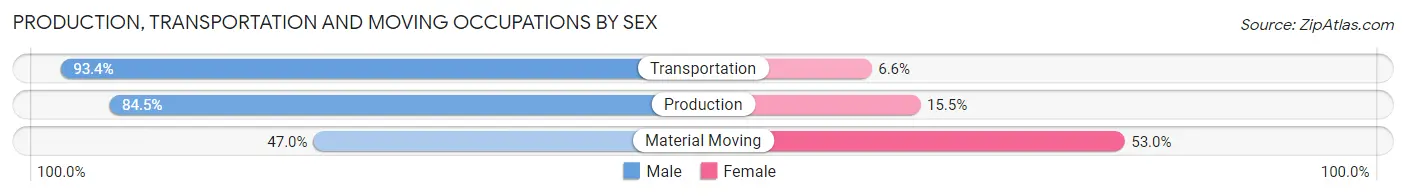
Production, Transportation and Moving Occupations by Sex
| Occupation | Male | Female |
| Production | 349 (84.5%) | 64 (15.5%) |
| Transportation | 114 (93.4%) | 8 (6.6%) |
| Material Moving | 158 (47.0%) | 178 (53.0%) |
| Total (Category) | 621 (71.3%) | 250 (28.7%) |
| Total (Overall) | 1,980 (52.9%) | 1,765 (47.1%) |
Employment Industries by Sex in Bradley County
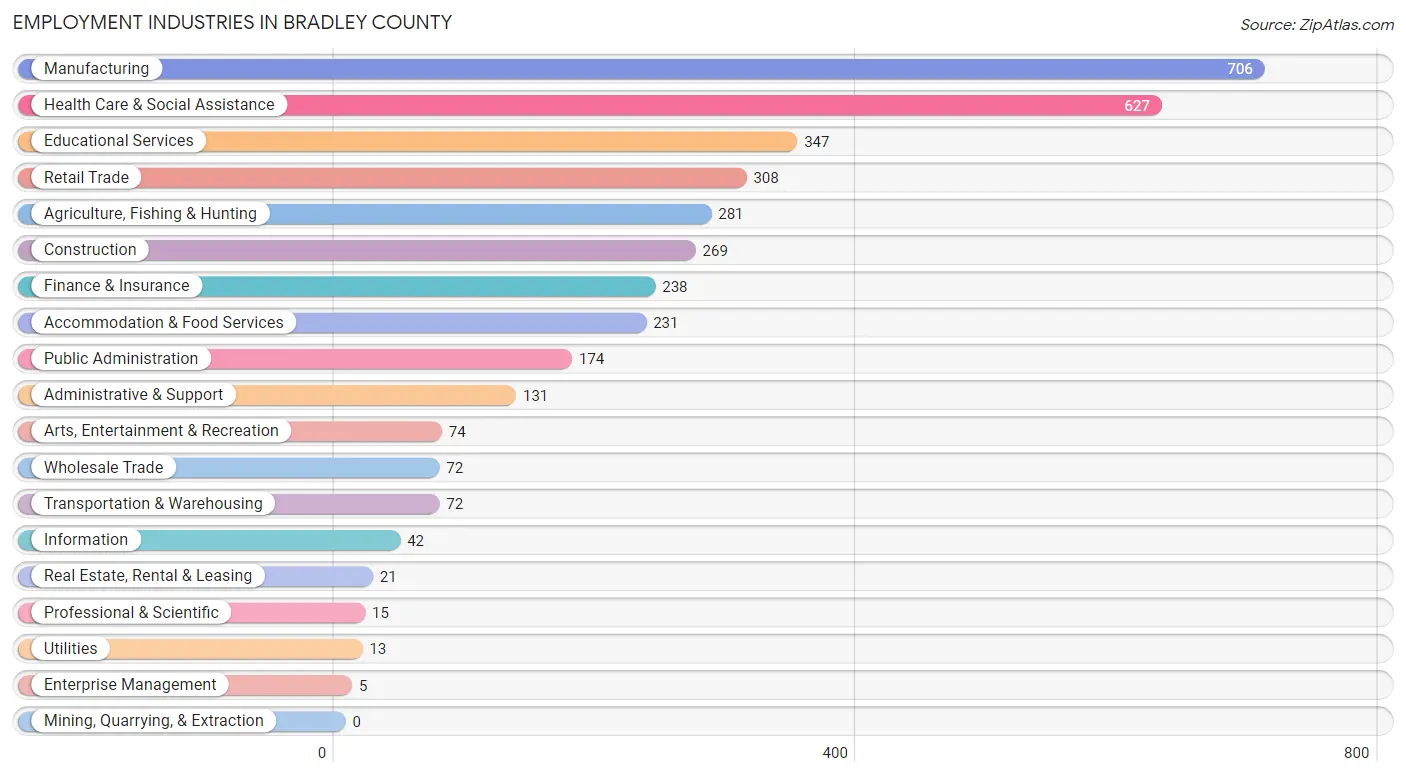
Employment Industries in Bradley County
The major employment industries in Bradley County include Manufacturing (706 | 18.9%), Health Care & Social Assistance (627 | 16.7%), Educational Services (347 | 9.3%), Retail Trade (308 | 8.2%), and Agriculture, Fishing & Hunting (281 | 7.5%).
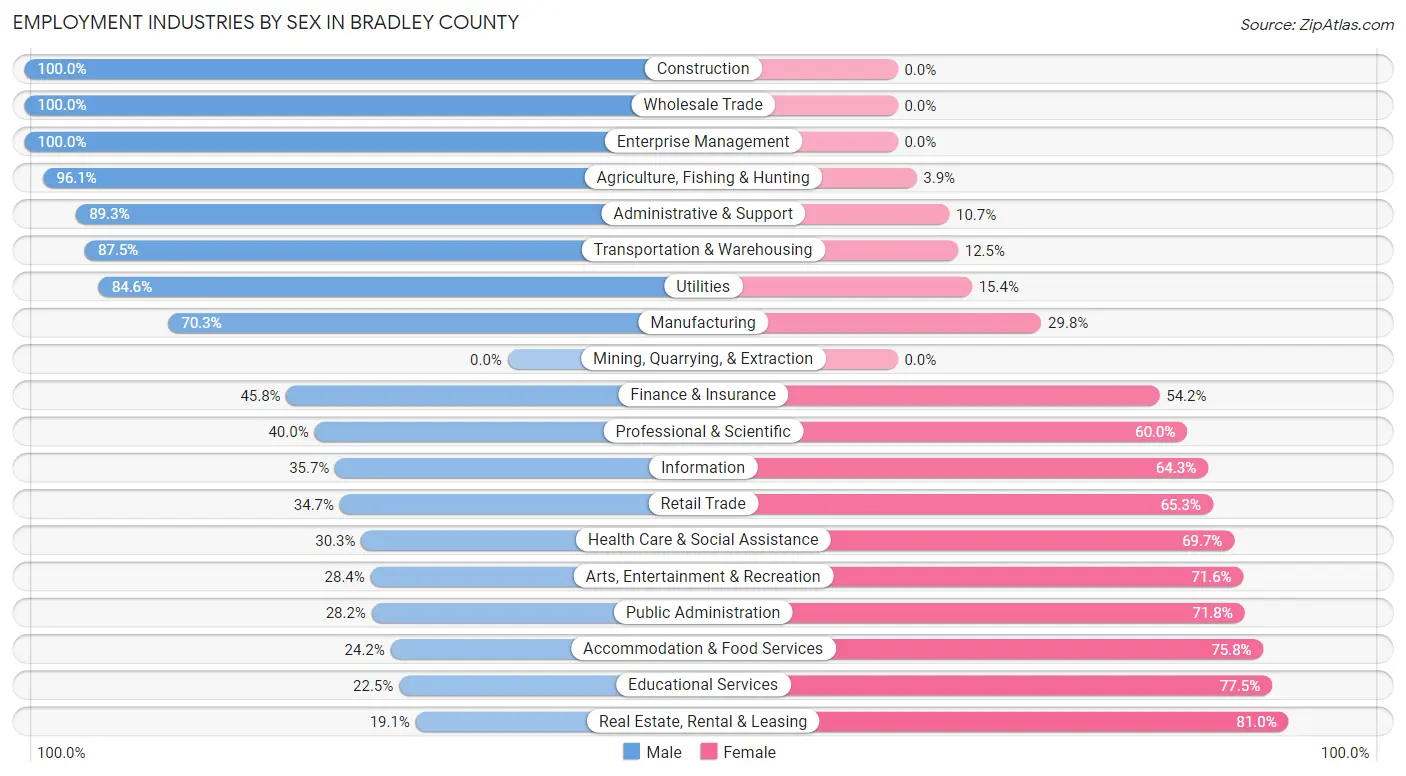
Employment Industries by Sex in Bradley County
The Bradley County industries that see more men than women are Construction (100.0%), Wholesale Trade (100.0%), and Enterprise Management (100.0%), whereas the industries that tend to have a higher number of women are Real Estate, Rental & Leasing (80.9%), Educational Services (77.5%), and Accommodation & Food Services (75.8%).
| Industry | Male | Female |
| Agriculture, Fishing & Hunting | 270 (96.1%) | 11 (3.9%) |
| Mining, Quarrying, & Extraction | 0 (0.0%) | 0 (0.0%) |
| Construction | 269 (100.0%) | 0 (0.0%) |
| Manufacturing | 496 (70.3%) | 210 (29.7%) |
| Wholesale Trade | 72 (100.0%) | 0 (0.0%) |
| Retail Trade | 107 (34.7%) | 201 (65.3%) |
| Transportation & Warehousing | 63 (87.5%) | 9 (12.5%) |
| Utilities | 11 (84.6%) | 2 (15.4%) |
| Information | 15 (35.7%) | 27 (64.3%) |
| Finance & Insurance | 109 (45.8%) | 129 (54.2%) |
| Real Estate, Rental & Leasing | 4 (19.1%) | 17 (80.9%) |
| Professional & Scientific | 6 (40.0%) | 9 (60.0%) |
| Enterprise Management | 5 (100.0%) | 0 (0.0%) |
| Administrative & Support | 117 (89.3%) | 14 (10.7%) |
| Educational Services | 78 (22.5%) | 269 (77.5%) |
| Health Care & Social Assistance | 190 (30.3%) | 437 (69.7%) |
| Arts, Entertainment & Recreation | 21 (28.4%) | 53 (71.6%) |
| Accommodation & Food Services | 56 (24.2%) | 175 (75.8%) |
| Public Administration | 49 (28.2%) | 125 (71.8%) |
| Total | 1,980 (52.9%) | 1,765 (47.1%) |
Education in Bradley County
School Enrollment in Bradley County
The most common levels of schooling among the 2,507 students in Bradley County are elementary school (657 | 26.2%), high school (650 | 25.9%), and middle school (649 | 25.9%).
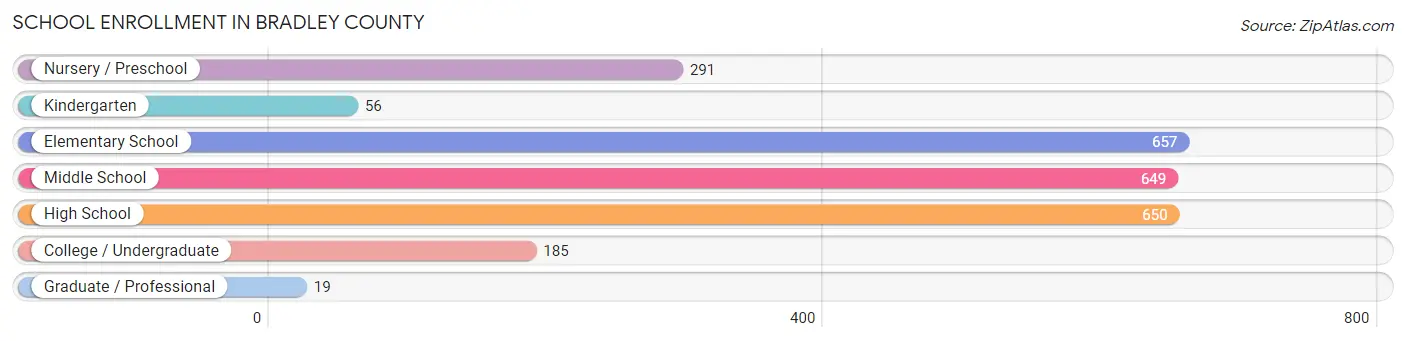
| School Level | # Students | % Students |
| Nursery / Preschool | 291 | 11.6% |
| Kindergarten | 56 | 2.2% |
| Elementary School | 657 | 26.2% |
| Middle School | 649 | 25.9% |
| High School | 650 | 25.9% |
| College / Undergraduate | 185 | 7.4% |
| Graduate / Professional | 19 | 0.8% |
| Total | 2,507 | 100.0% |
School Enrollment by Age by Funding Source in Bradley County
Out of a total of 2,507 students who are enrolled in schools in Bradley County, 78 (3.1%) attend a private institution, while the remaining 2,429 (96.9%) are enrolled in public schools. The age group of 25 to 34 year olds has the highest likelihood of being enrolled in private schools, with 13 (26.5% in the age bracket) enrolled. Conversely, the age group of 10 to 14 year olds has the lowest likelihood of being enrolled in a private school, with 947 (100.0% in the age bracket) attending a public institution.
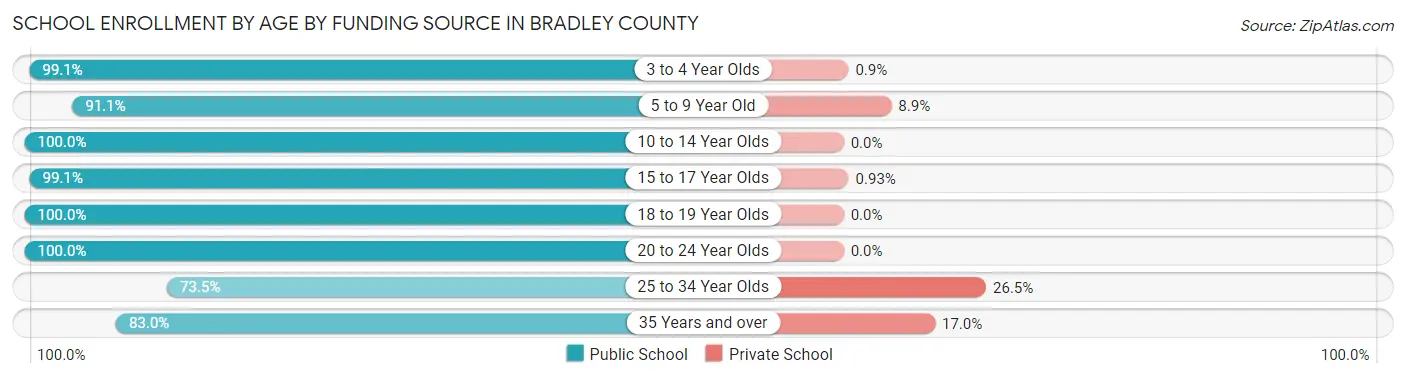
| Age Bracket | Public School | Private School |
| 3 to 4 Year Olds | 219 (99.1%) | 2 (0.9%) |
| 5 to 9 Year Old | 523 (91.1%) | 51 (8.9%) |
| 10 to 14 Year Olds | 947 (100.0%) | 0 (0.0%) |
| 15 to 17 Year Olds | 319 (99.1%) | 3 (0.9%) |
| 18 to 19 Year Olds | 242 (100.0%) | 0 (0.0%) |
| 20 to 24 Year Olds | 105 (100.0%) | 0 (0.0%) |
| 25 to 34 Year Olds | 36 (73.5%) | 13 (26.5%) |
| 35 Years and over | 39 (83.0%) | 8 (17.0%) |
| Total | 2,429 (96.9%) | 78 (3.1%) |
Educational Attainment by Field of Study in Bradley County
Education (195 | 19.8%), business (143 | 14.5%), science & technology (139 | 14.1%), arts & humanities (99 | 10.0%), and computers & mathematics (83 | 8.4%) are the most common fields of study among 986 individuals in Bradley County who have obtained a bachelor's degree or higher.
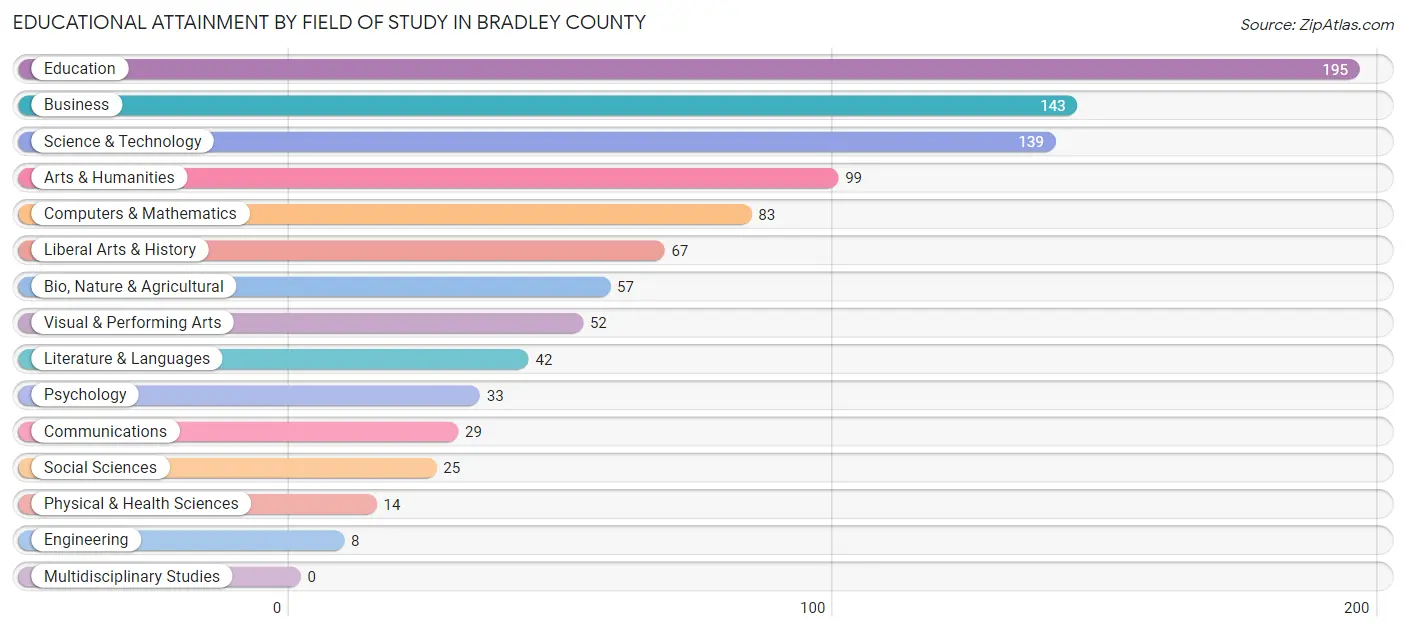
| Field of Study | # Graduates | % Graduates |
| Computers & Mathematics | 83 | 8.4% |
| Bio, Nature & Agricultural | 57 | 5.8% |
| Physical & Health Sciences | 14 | 1.4% |
| Psychology | 33 | 3.4% |
| Social Sciences | 25 | 2.5% |
| Engineering | 8 | 0.8% |
| Multidisciplinary Studies | 0 | 0.0% |
| Science & Technology | 139 | 14.1% |
| Business | 143 | 14.5% |
| Education | 195 | 19.8% |
| Literature & Languages | 42 | 4.3% |
| Liberal Arts & History | 67 | 6.8% |
| Visual & Performing Arts | 52 | 5.3% |
| Communications | 29 | 2.9% |
| Arts & Humanities | 99 | 10.0% |
| Total | 986 | 100.0% |
Transportation & Commute in Bradley County
Vehicle Availability by Sex in Bradley County
The most prevalent vehicle ownership categories in Bradley County are males with 2 vehicles (758, accounting for 38.4%) and females with 2 vehicles (584, making up 44.3%).
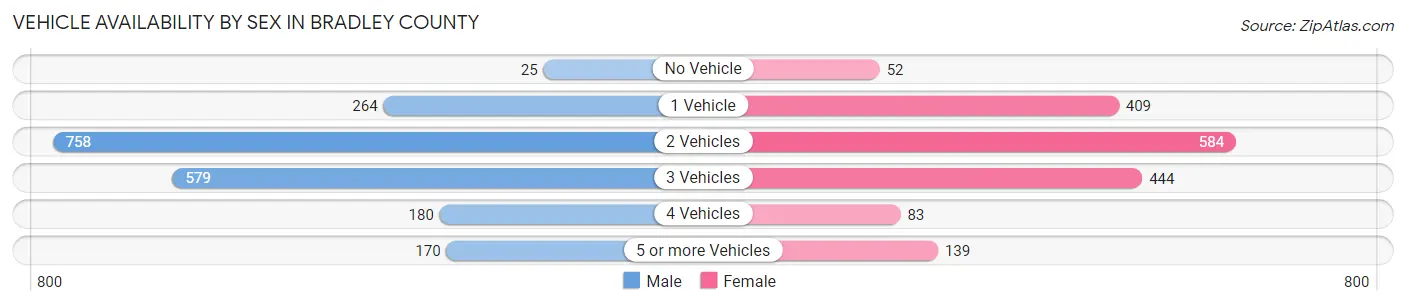
| Vehicles Available | Male | Female |
| No Vehicle | 25 (1.3%) | 52 (3.0%) |
| 1 Vehicle | 264 (13.4%) | 409 (23.9%) |
| 2 Vehicles | 758 (38.4%) | 584 (34.1%) |
| 3 Vehicles | 579 (29.3%) | 444 (26.0%) |
| 4 Vehicles | 180 (9.1%) | 83 (4.9%) |
| 5 or more Vehicles | 170 (8.6%) | 139 (8.1%) |
| Total | 1,976 (100.0%) | 1,711 (100.0%) |
Commute Time in Bradley County
The most frequently occuring commute durations in Bradley County are 10 to 14 minutes (726 commuters, 19.9%), 5 to 9 minutes (563 commuters, 15.5%), and less than 5 minutes (411 commuters, 11.3%).
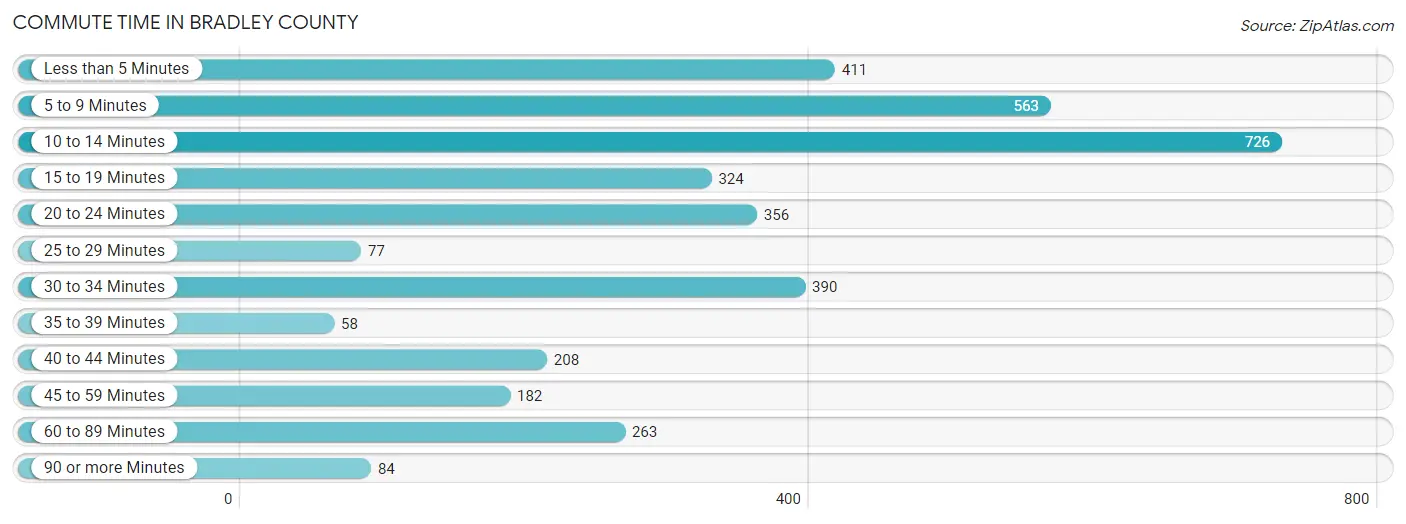
| Commute Time | # Commuters | % Commuters |
| Less than 5 Minutes | 411 | 11.3% |
| 5 to 9 Minutes | 563 | 15.5% |
| 10 to 14 Minutes | 726 | 19.9% |
| 15 to 19 Minutes | 324 | 8.9% |
| 20 to 24 Minutes | 356 | 9.8% |
| 25 to 29 Minutes | 77 | 2.1% |
| 30 to 34 Minutes | 390 | 10.7% |
| 35 to 39 Minutes | 58 | 1.6% |
| 40 to 44 Minutes | 208 | 5.7% |
| 45 to 59 Minutes | 182 | 5.0% |
| 60 to 89 Minutes | 263 | 7.2% |
| 90 or more Minutes | 84 | 2.3% |
Commute Time by Sex in Bradley County
The most common commute times in Bradley County are 10 to 14 minutes (405 commuters, 20.7%) for males and 10 to 14 minutes (321 commuters, 19.0%) for females.
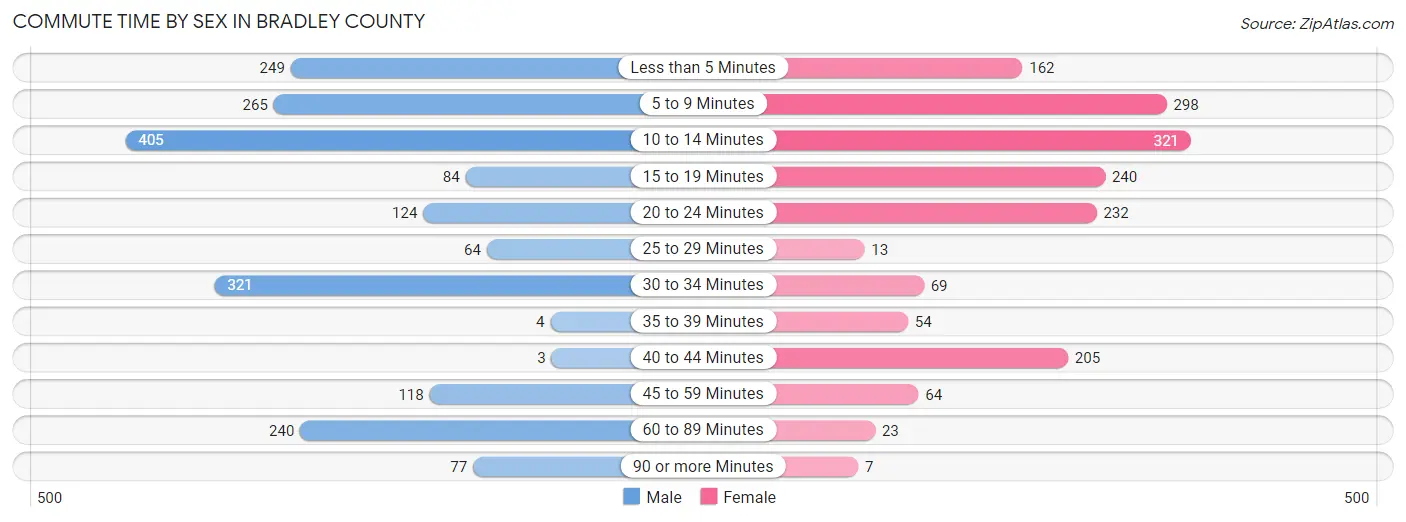
| Commute Time | Male | Female |
| Less than 5 Minutes | 249 (12.7%) | 162 (9.6%) |
| 5 to 9 Minutes | 265 (13.6%) | 298 (17.6%) |
| 10 to 14 Minutes | 405 (20.7%) | 321 (19.0%) |
| 15 to 19 Minutes | 84 (4.3%) | 240 (14.2%) |
| 20 to 24 Minutes | 124 (6.4%) | 232 (13.7%) |
| 25 to 29 Minutes | 64 (3.3%) | 13 (0.8%) |
| 30 to 34 Minutes | 321 (16.4%) | 69 (4.1%) |
| 35 to 39 Minutes | 4 (0.2%) | 54 (3.2%) |
| 40 to 44 Minutes | 3 (0.2%) | 205 (12.1%) |
| 45 to 59 Minutes | 118 (6.0%) | 64 (3.8%) |
| 60 to 89 Minutes | 240 (12.3%) | 23 (1.4%) |
| 90 or more Minutes | 77 (3.9%) | 7 (0.4%) |
Time of Departure to Work by Sex in Bradley County
The most frequent times of departure to work in Bradley County are 6:30 AM to 6:59 AM (297, 15.2%) for males and 7:00 AM to 7:29 AM (279, 16.5%) for females.
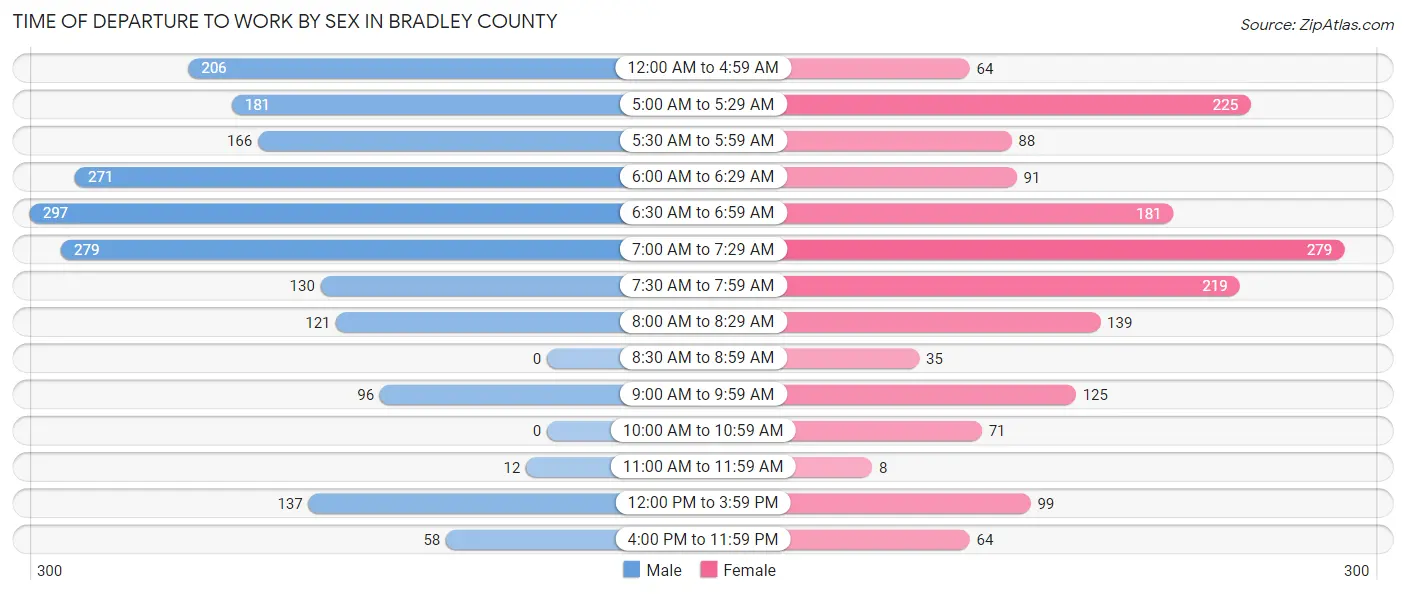
| Time of Departure | Male | Female |
| 12:00 AM to 4:59 AM | 206 (10.5%) | 64 (3.8%) |
| 5:00 AM to 5:29 AM | 181 (9.3%) | 225 (13.3%) |
| 5:30 AM to 5:59 AM | 166 (8.5%) | 88 (5.2%) |
| 6:00 AM to 6:29 AM | 271 (13.9%) | 91 (5.4%) |
| 6:30 AM to 6:59 AM | 297 (15.2%) | 181 (10.7%) |
| 7:00 AM to 7:29 AM | 279 (14.3%) | 279 (16.5%) |
| 7:30 AM to 7:59 AM | 130 (6.7%) | 219 (13.0%) |
| 8:00 AM to 8:29 AM | 121 (6.2%) | 139 (8.2%) |
| 8:30 AM to 8:59 AM | 0 (0.0%) | 35 (2.1%) |
| 9:00 AM to 9:59 AM | 96 (4.9%) | 125 (7.4%) |
| 10:00 AM to 10:59 AM | 0 (0.0%) | 71 (4.2%) |
| 11:00 AM to 11:59 AM | 12 (0.6%) | 8 (0.5%) |
| 12:00 PM to 3:59 PM | 137 (7.0%) | 99 (5.9%) |
| 4:00 PM to 11:59 PM | 58 (3.0%) | 64 (3.8%) |
| Total | 1,954 (100.0%) | 1,688 (100.0%) |
Housing Occupancy in Bradley County
Occupancy by Ownership in Bradley County
Of the total 3,587 dwellings in Bradley County, owner-occupied units account for 2,329 (64.9%), while renter-occupied units make up 1,258 (35.1%).
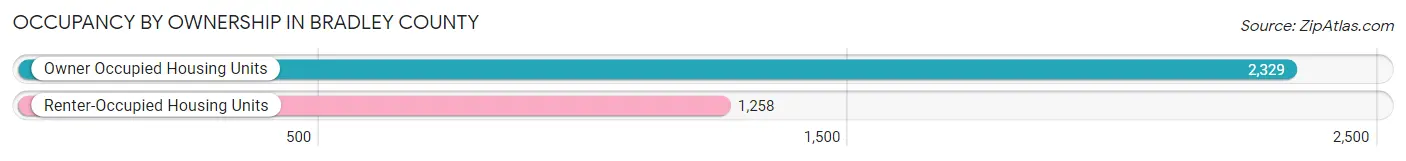
| Occupancy | # Housing Units | % Housing Units |
| Owner Occupied Housing Units | 2,329 | 64.9% |
| Renter-Occupied Housing Units | 1,258 | 35.1% |
| Total Occupied Housing Units | 3,587 | 100.0% |
Occupancy by Household Size in Bradley County
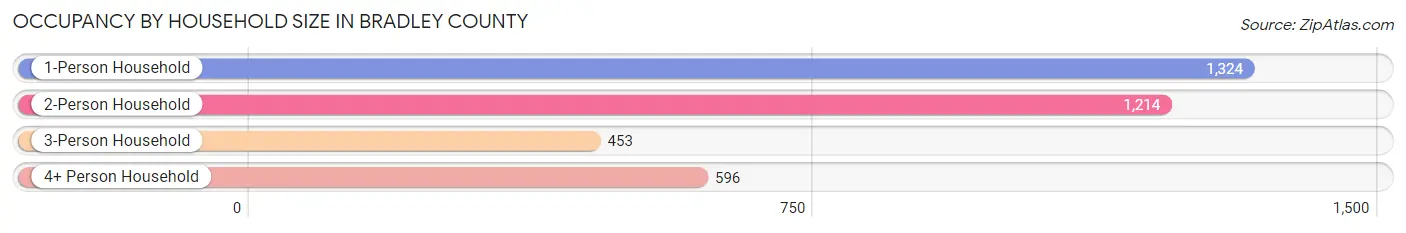
| Household Size | # Housing Units | % Housing Units |
| 1-Person Household | 1,324 | 36.9% |
| 2-Person Household | 1,214 | 33.8% |
| 3-Person Household | 453 | 12.6% |
| 4+ Person Household | 596 | 16.6% |
| Total Housing Units | 3,587 | 100.0% |
Occupancy by Ownership by Household Size in Bradley County
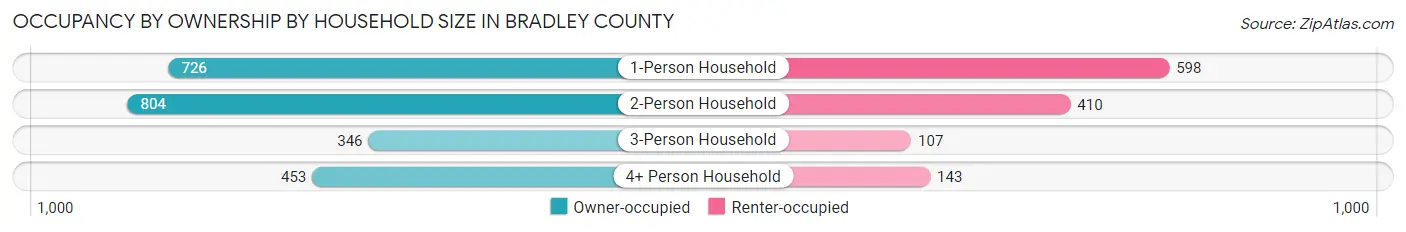
| Household Size | Owner-occupied | Renter-occupied |
| 1-Person Household | 726 (54.8%) | 598 (45.2%) |
| 2-Person Household | 804 (66.2%) | 410 (33.8%) |
| 3-Person Household | 346 (76.4%) | 107 (23.6%) |
| 4+ Person Household | 453 (76.0%) | 143 (24.0%) |
| Total Housing Units | 2,329 (64.9%) | 1,258 (35.1%) |
Occupancy by Educational Attainment in Bradley County
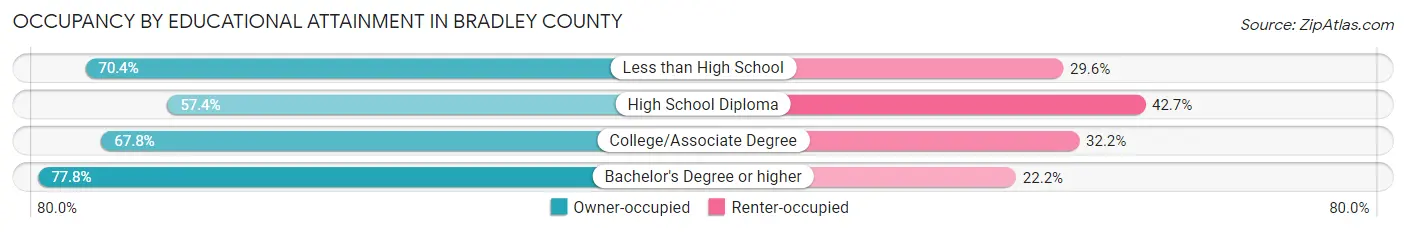
| Household Size | Owner-occupied | Renter-occupied |
| Less than High School | 368 (70.4%) | 155 (29.6%) |
| High School Diploma | 925 (57.4%) | 688 (42.6%) |
| College/Associate Degree | 632 (67.8%) | 300 (32.2%) |
| Bachelor's Degree or higher | 404 (77.8%) | 115 (22.2%) |
Occupancy by Age of Householder in Bradley County
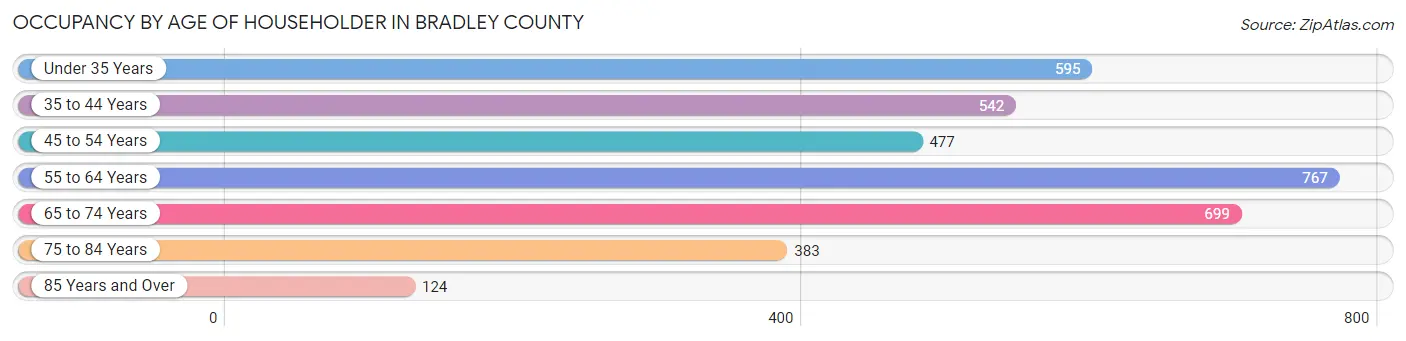
| Age Bracket | # Households | % Households |
| Under 35 Years | 595 | 16.6% |
| 35 to 44 Years | 542 | 15.1% |
| 45 to 54 Years | 477 | 13.3% |
| 55 to 64 Years | 767 | 21.4% |
| 65 to 74 Years | 699 | 19.5% |
| 75 to 84 Years | 383 | 10.7% |
| 85 Years and Over | 124 | 3.5% |
| Total | 3,587 | 100.0% |
Housing Finances in Bradley County
Median Income by Occupancy in Bradley County
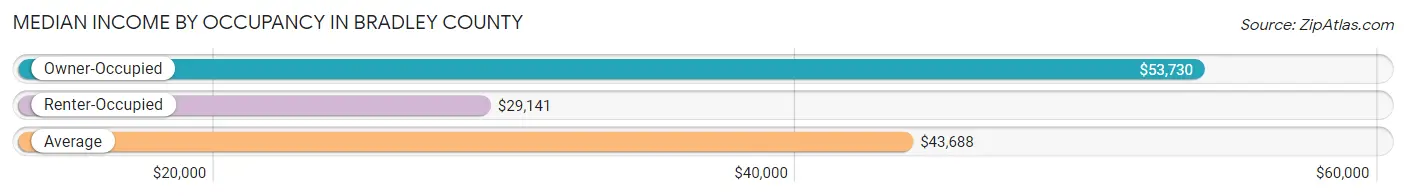
| Occupancy Type | # Households | Median Income |
| Owner-Occupied | 2,329 (64.9%) | $53,730 |
| Renter-Occupied | 1,258 (35.1%) | $29,141 |
| Average | 3,587 (100.0%) | $43,688 |
Occupancy by Householder Income Bracket in Bradley County
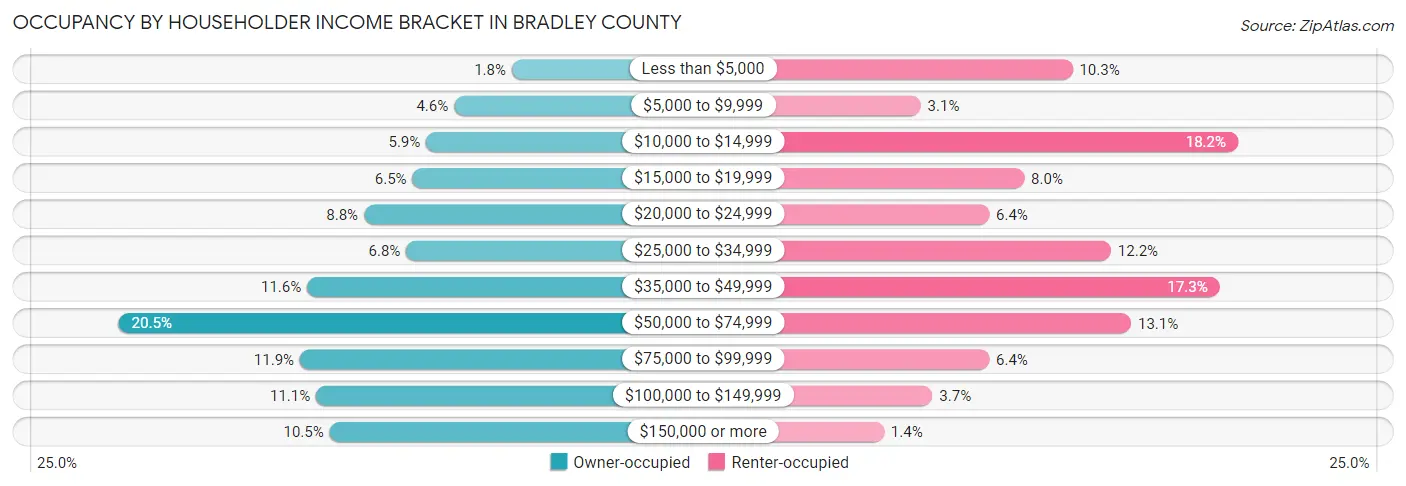
| Income Bracket | Owner-occupied | Renter-occupied |
| Less than $5,000 | 42 (1.8%) | 130 (10.3%) |
| $5,000 to $9,999 | 106 (4.5%) | 39 (3.1%) |
| $10,000 to $14,999 | 137 (5.9%) | 229 (18.2%) |
| $15,000 to $19,999 | 152 (6.5%) | 101 (8.0%) |
| $20,000 to $24,999 | 206 (8.8%) | 80 (6.4%) |
| $25,000 to $34,999 | 159 (6.8%) | 153 (12.2%) |
| $35,000 to $49,999 | 269 (11.6%) | 218 (17.3%) |
| $50,000 to $74,999 | 478 (20.5%) | 165 (13.1%) |
| $75,000 to $99,999 | 277 (11.9%) | 80 (6.4%) |
| $100,000 to $149,999 | 259 (11.1%) | 46 (3.7%) |
| $150,000 or more | 244 (10.5%) | 17 (1.3%) |
| Total | 2,329 (100.0%) | 1,258 (100.0%) |
Monthly Housing Cost Tiers in Bradley County
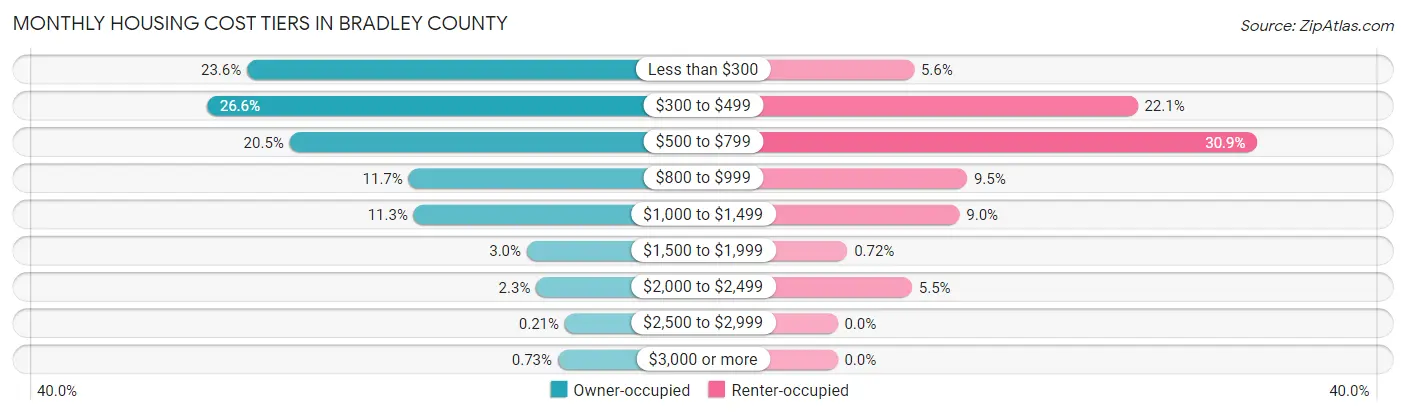
| Monthly Cost | Owner-occupied | Renter-occupied |
| Less than $300 | 550 (23.6%) | 71 (5.6%) |
| $300 to $499 | 619 (26.6%) | 278 (22.1%) |
| $500 to $799 | 477 (20.5%) | 389 (30.9%) |
| $800 to $999 | 273 (11.7%) | 120 (9.5%) |
| $1,000 to $1,499 | 264 (11.3%) | 113 (9.0%) |
| $1,500 to $1,999 | 70 (3.0%) | 9 (0.7%) |
| $2,000 to $2,499 | 54 (2.3%) | 69 (5.5%) |
| $2,500 to $2,999 | 5 (0.2%) | 0 (0.0%) |
| $3,000 or more | 17 (0.7%) | 0 (0.0%) |
| Total | 2,329 (100.0%) | 1,258 (100.0%) |
Physical Housing Characteristics in Bradley County
Housing Structures in Bradley County
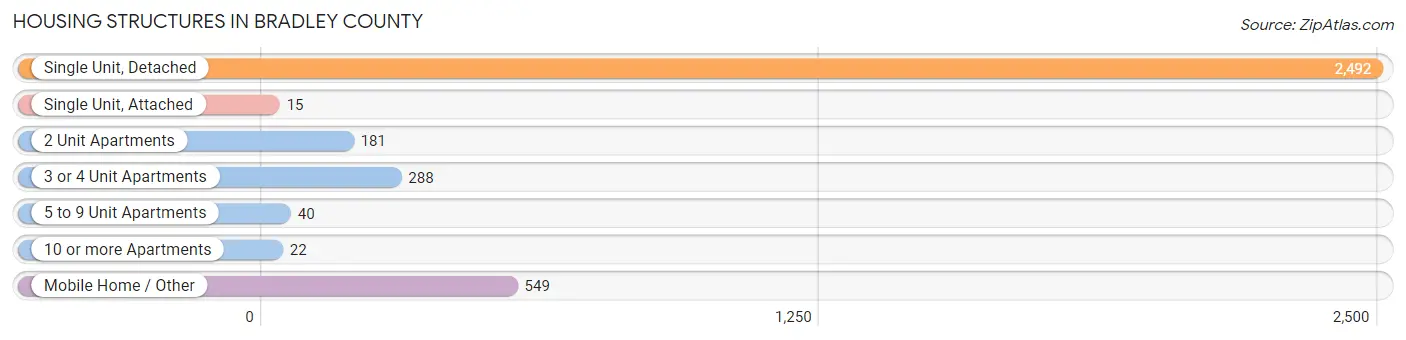
| Structure Type | # Housing Units | % Housing Units |
| Single Unit, Detached | 2,492 | 69.5% |
| Single Unit, Attached | 15 | 0.4% |
| 2 Unit Apartments | 181 | 5.1% |
| 3 or 4 Unit Apartments | 288 | 8.0% |
| 5 to 9 Unit Apartments | 40 | 1.1% |
| 10 or more Apartments | 22 | 0.6% |
| Mobile Home / Other | 549 | 15.3% |
| Total | 3,587 | 100.0% |
Housing Structures by Occupancy in Bradley County
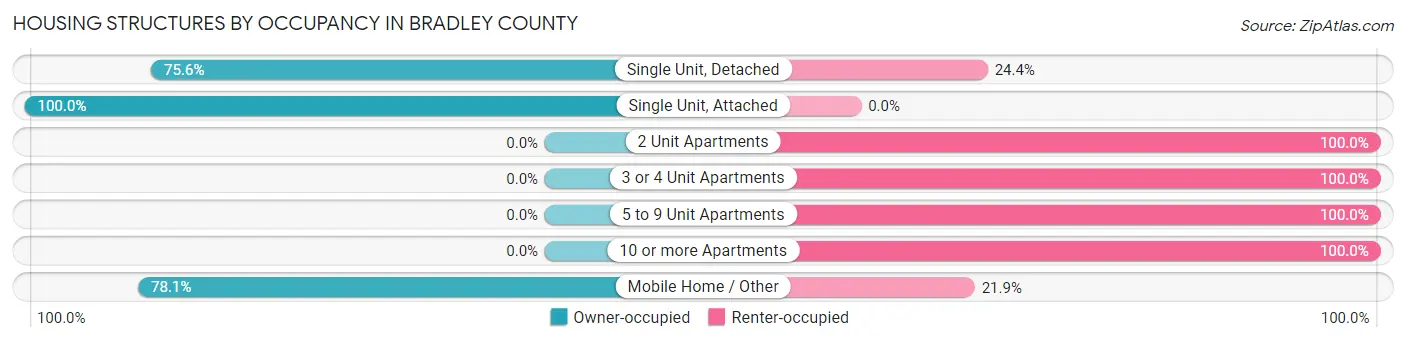
| Structure Type | Owner-occupied | Renter-occupied |
| Single Unit, Detached | 1,885 (75.6%) | 607 (24.4%) |
| Single Unit, Attached | 15 (100.0%) | 0 (0.0%) |
| 2 Unit Apartments | 0 (0.0%) | 181 (100.0%) |
| 3 or 4 Unit Apartments | 0 (0.0%) | 288 (100.0%) |
| 5 to 9 Unit Apartments | 0 (0.0%) | 40 (100.0%) |
| 10 or more Apartments | 0 (0.0%) | 22 (100.0%) |
| Mobile Home / Other | 429 (78.1%) | 120 (21.9%) |
| Total | 2,329 (64.9%) | 1,258 (35.1%) |
Housing Structures by Number of Rooms in Bradley County
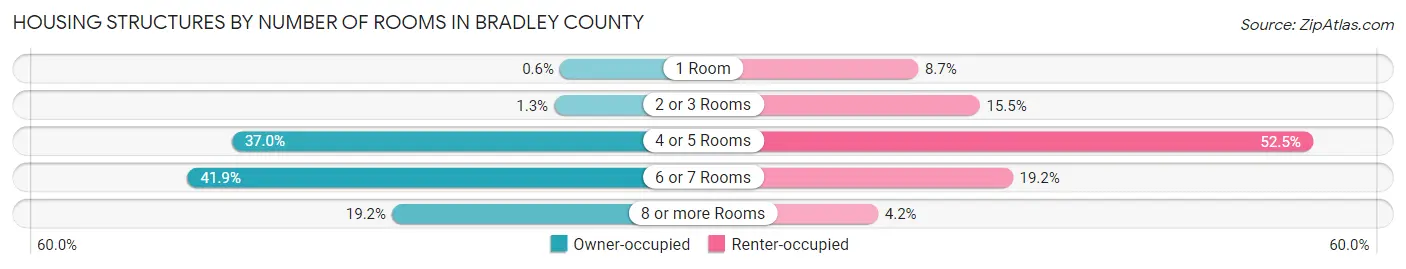
| Number of Rooms | Owner-occupied | Renter-occupied |
| 1 Room | 14 (0.6%) | 109 (8.7%) |
| 2 or 3 Rooms | 29 (1.3%) | 195 (15.5%) |
| 4 or 5 Rooms | 862 (37.0%) | 660 (52.5%) |
| 6 or 7 Rooms | 976 (41.9%) | 241 (19.2%) |
| 8 or more Rooms | 448 (19.2%) | 53 (4.2%) |
| Total | 2,329 (100.0%) | 1,258 (100.0%) |
Housing Structure by Heating Type in Bradley County
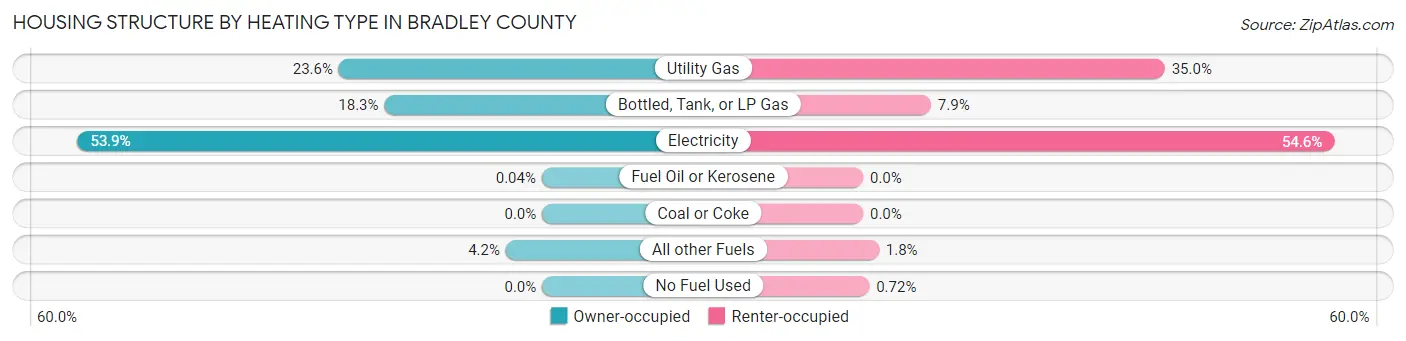
| Heating Type | Owner-occupied | Renter-occupied |
| Utility Gas | 549 (23.6%) | 440 (35.0%) |
| Bottled, Tank, or LP Gas | 426 (18.3%) | 99 (7.9%) |
| Electricity | 1,255 (53.9%) | 687 (54.6%) |
| Fuel Oil or Kerosene | 1 (0.0%) | 0 (0.0%) |
| Coal or Coke | 0 (0.0%) | 0 (0.0%) |
| All other Fuels | 98 (4.2%) | 23 (1.8%) |
| No Fuel Used | 0 (0.0%) | 9 (0.7%) |
| Total | 2,329 (100.0%) | 1,258 (100.0%) |
Household Vehicle Usage in Bradley County
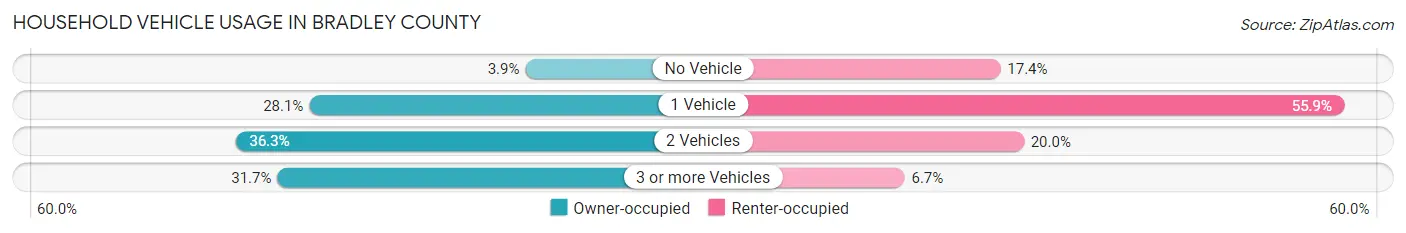
| Vehicles per Household | Owner-occupied | Renter-occupied |
| No Vehicle | 91 (3.9%) | 219 (17.4%) |
| 1 Vehicle | 655 (28.1%) | 703 (55.9%) |
| 2 Vehicles | 845 (36.3%) | 252 (20.0%) |
| 3 or more Vehicles | 738 (31.7%) | 84 (6.7%) |
| Total | 2,329 (100.0%) | 1,258 (100.0%) |
Real Estate & Mortgages in Bradley County
Real Estate and Mortgage Overview in Bradley County
| Characteristic | Without Mortgage | With Mortgage |
| Housing Units | 1,559 | 770 |
| Median Property Value | $80,900 | $110,600 |
| Median Household Income | $43,108 | $123 |
| Monthly Housing Costs | $356 | $17 |
| Real Estate Taxes | $460 | $129 |
Property Value by Mortgage Status in Bradley County
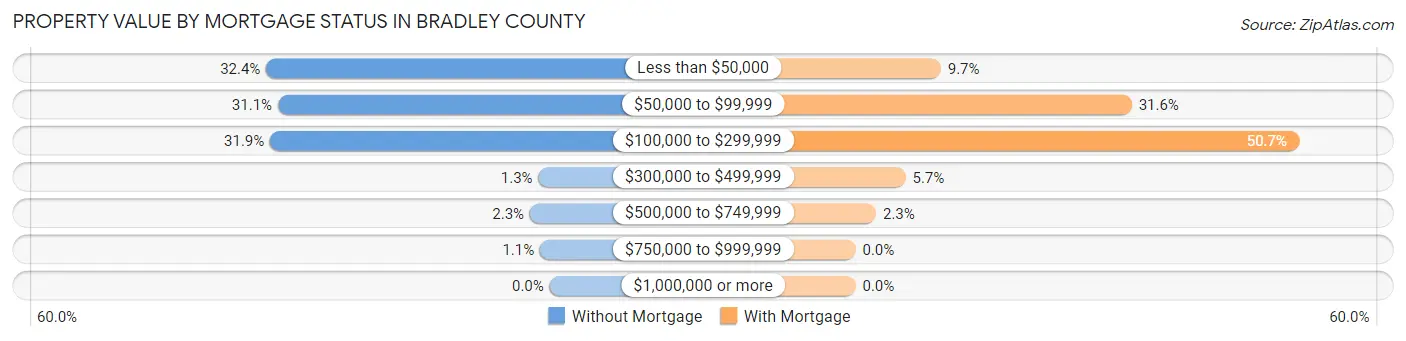
| Property Value | Without Mortgage | With Mortgage |
| Less than $50,000 | 505 (32.4%) | 75 (9.7%) |
| $50,000 to $99,999 | 484 (31.0%) | 243 (31.6%) |
| $100,000 to $299,999 | 498 (31.9%) | 390 (50.6%) |
| $300,000 to $499,999 | 20 (1.3%) | 44 (5.7%) |
| $500,000 to $749,999 | 35 (2.2%) | 18 (2.3%) |
| $750,000 to $999,999 | 17 (1.1%) | 0 (0.0%) |
| $1,000,000 or more | 0 (0.0%) | 0 (0.0%) |
| Total | 1,559 (100.0%) | 770 (100.0%) |
Household Income by Mortgage Status in Bradley County
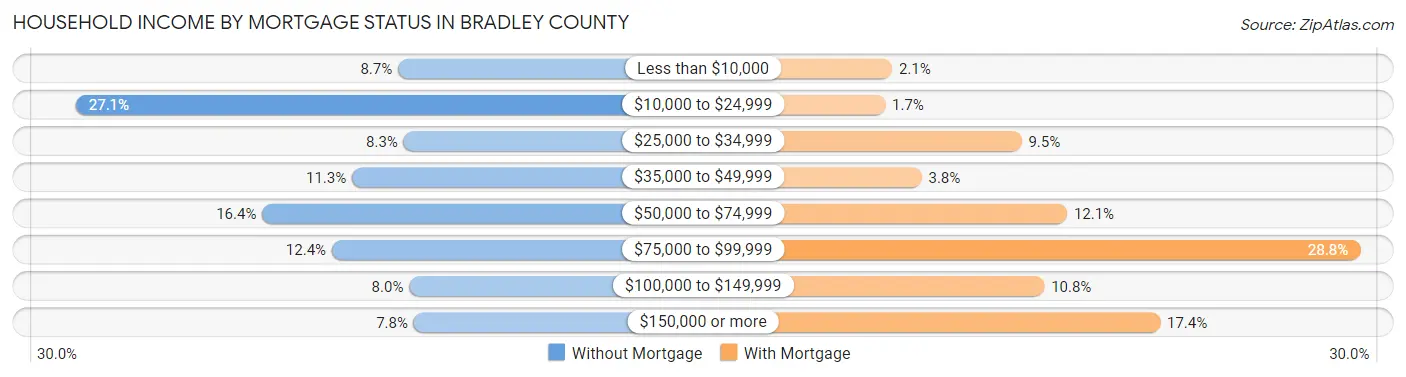
| Household Income | Without Mortgage | With Mortgage |
| Less than $10,000 | 135 (8.7%) | 16 (2.1%) |
| $10,000 to $24,999 | 422 (27.1%) | 13 (1.7%) |
| $25,000 to $34,999 | 130 (8.3%) | 73 (9.5%) |
| $35,000 to $49,999 | 176 (11.3%) | 29 (3.8%) |
| $50,000 to $74,999 | 256 (16.4%) | 93 (12.1%) |
| $75,000 to $99,999 | 194 (12.4%) | 222 (28.8%) |
| $100,000 to $149,999 | 125 (8.0%) | 83 (10.8%) |
| $150,000 or more | 121 (7.8%) | 134 (17.4%) |
| Total | 1,559 (100.0%) | 770 (100.0%) |
Property Value to Household Income Ratio in Bradley County
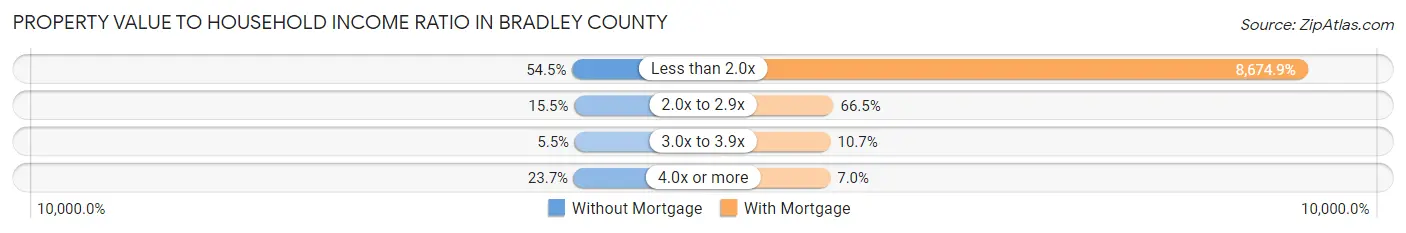
| Value-to-Income Ratio | Without Mortgage | With Mortgage |
| Less than 2.0x | 850 (54.5%) | 66,797 (8,674.9%) |
| 2.0x to 2.9x | 242 (15.5%) | 512 (66.5%) |
| 3.0x to 3.9x | 86 (5.5%) | 82 (10.6%) |
| 4.0x or more | 369 (23.7%) | 54 (7.0%) |
| Total | 1,559 (100.0%) | 770 (100.0%) |
Real Estate Taxes by Mortgage Status in Bradley County
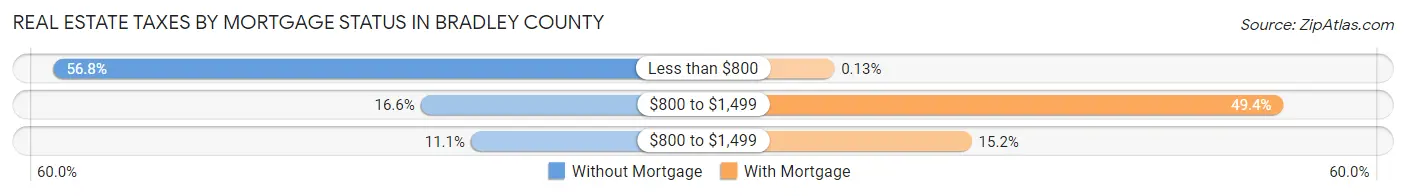
| Property Taxes | Without Mortgage | With Mortgage |
| Less than $800 | 886 (56.8%) | 1 (0.1%) |
| $800 to $1,499 | 259 (16.6%) | 380 (49.3%) |
| $800 to $1,499 | 173 (11.1%) | 117 (15.2%) |
| Total | 1,559 (100.0%) | 770 (100.0%) |
Health & Disability in Bradley County
Health Insurance Coverage by Age in Bradley County
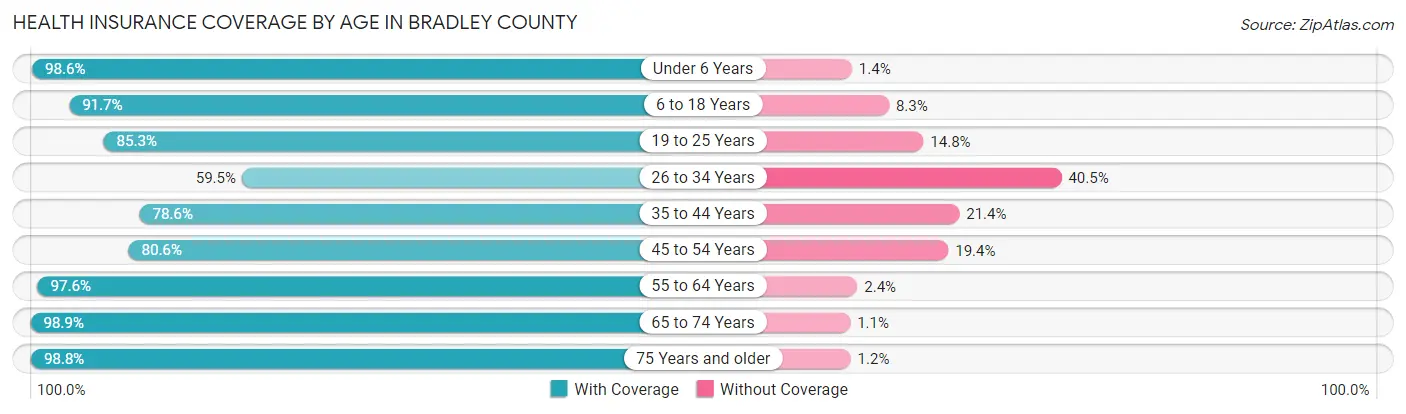
| Age Bracket | With Coverage | Without Coverage |
| Under 6 Years | 761 (98.6%) | 11 (1.4%) |
| 6 to 18 Years | 1,893 (91.7%) | 172 (8.3%) |
| 19 to 25 Years | 572 (85.3%) | 99 (14.7%) |
| 26 to 34 Years | 598 (59.5%) | 407 (40.5%) |
| 35 to 44 Years | 1,132 (78.6%) | 309 (21.4%) |
| 45 to 54 Years | 1,043 (80.6%) | 251 (19.4%) |
| 55 to 64 Years | 1,240 (97.6%) | 31 (2.4%) |
| 65 to 74 Years | 1,082 (98.9%) | 12 (1.1%) |
| 75 Years and older | 750 (98.8%) | 9 (1.2%) |
| Total | 9,071 (87.5%) | 1,301 (12.5%) |
Health Insurance Coverage by Citizenship Status in Bradley County
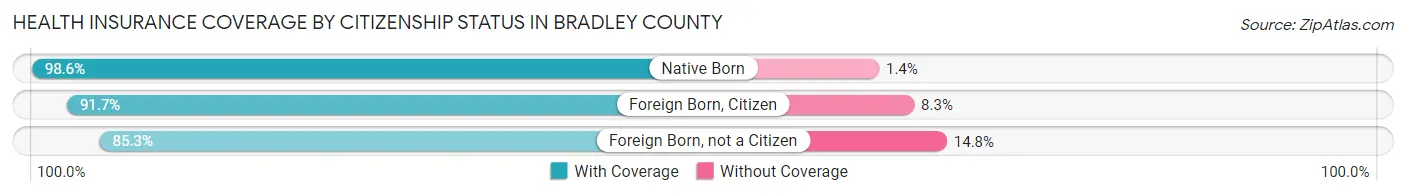
| Citizenship Status | With Coverage | Without Coverage |
| Native Born | 761 (98.6%) | 11 (1.4%) |
| Foreign Born, Citizen | 1,893 (91.7%) | 172 (8.3%) |
| Foreign Born, not a Citizen | 572 (85.3%) | 99 (14.7%) |
Health Insurance Coverage by Household Income in Bradley County
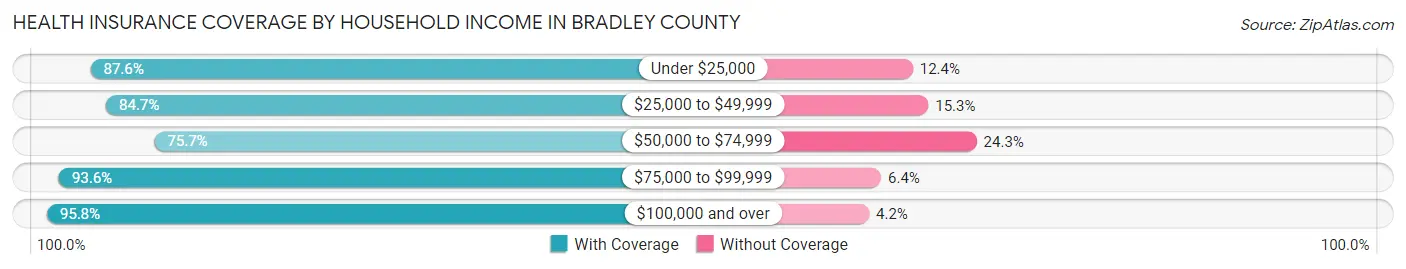
| Household Income | With Coverage | Without Coverage |
| Under $25,000 | 1,957 (87.6%) | 276 (12.4%) |
| $25,000 to $49,999 | 1,759 (84.7%) | 317 (15.3%) |
| $50,000 to $74,999 | 1,620 (75.7%) | 521 (24.3%) |
| $75,000 to $99,999 | 1,135 (93.6%) | 78 (6.4%) |
| $100,000 and over | 2,496 (95.8%) | 109 (4.2%) |
Public vs Private Health Insurance Coverage by Age in Bradley County
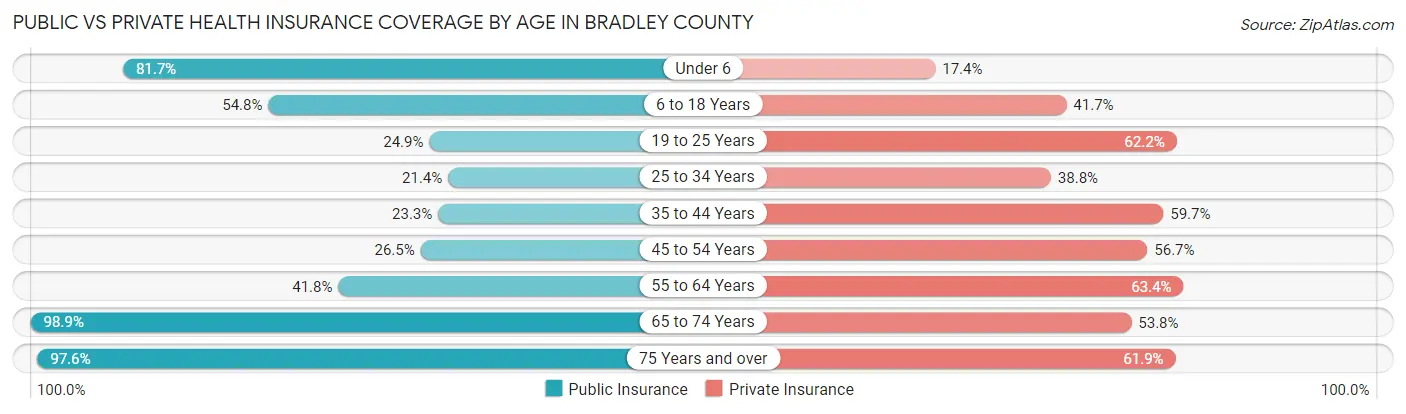
| Age Bracket | Public Insurance | Private Insurance |
| Under 6 | 631 (81.7%) | 134 (17.4%) |
| 6 to 18 Years | 1,131 (54.8%) | 861 (41.7%) |
| 19 to 25 Years | 167 (24.9%) | 417 (62.2%) |
| 25 to 34 Years | 215 (21.4%) | 390 (38.8%) |
| 35 to 44 Years | 335 (23.3%) | 860 (59.7%) |
| 45 to 54 Years | 343 (26.5%) | 734 (56.7%) |
| 55 to 64 Years | 531 (41.8%) | 806 (63.4%) |
| 65 to 74 Years | 1,082 (98.9%) | 588 (53.7%) |
| 75 Years and over | 741 (97.6%) | 470 (61.9%) |
| Total | 5,176 (49.9%) | 5,260 (50.7%) |
Disability Status by Sex by Age in Bradley County
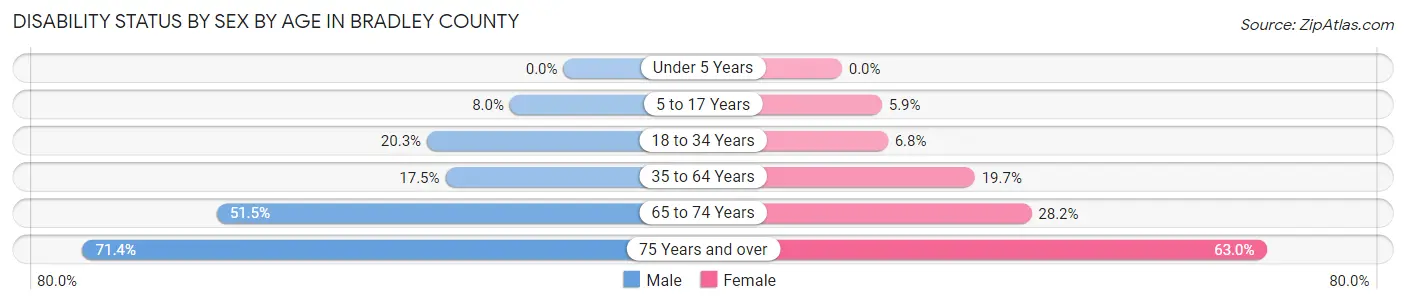
| Age Bracket | Male | Female |
| Under 5 Years | 0 (0.0%) | 0 (0.0%) |
| 5 to 17 Years | 82 (8.0%) | 52 (5.9%) |
| 18 to 34 Years | 188 (20.3%) | 70 (6.8%) |
| 35 to 64 Years | 329 (17.5%) | 420 (19.7%) |
| 65 to 74 Years | 265 (51.5%) | 163 (28.1%) |
| 75 Years and over | 202 (71.4%) | 300 (63.0%) |
Disability Class by Sex by Age in Bradley County
Disability Class: Hearing Difficulty
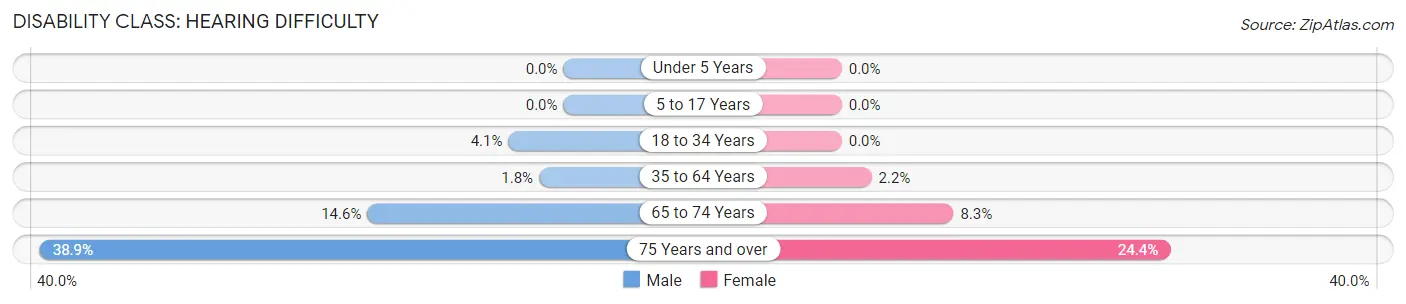
| Age Bracket | Male | Female |
| Under 5 Years | 0 (0.0%) | 0 (0.0%) |
| 5 to 17 Years | 0 (0.0%) | 0 (0.0%) |
| 18 to 34 Years | 38 (4.1%) | 0 (0.0%) |
| 35 to 64 Years | 34 (1.8%) | 47 (2.2%) |
| 65 to 74 Years | 75 (14.6%) | 48 (8.3%) |
| 75 Years and over | 110 (38.9%) | 116 (24.4%) |
Disability Class: Vision Difficulty
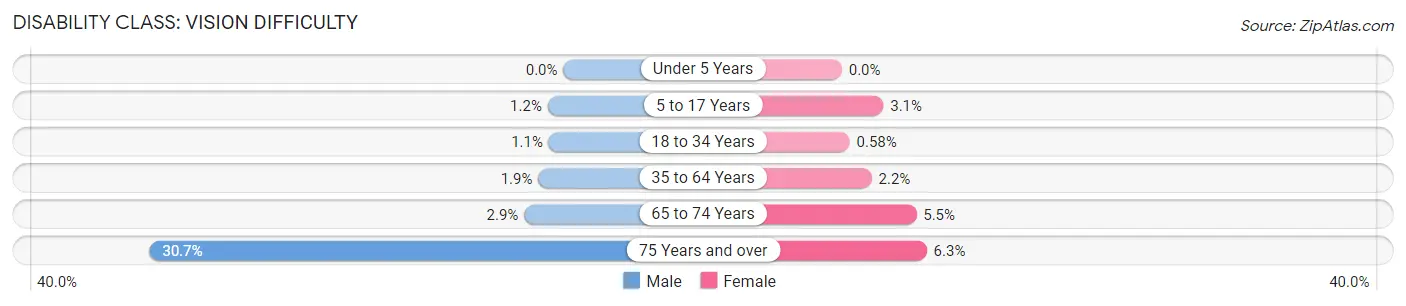
| Age Bracket | Male | Female |
| Under 5 Years | 0 (0.0%) | 0 (0.0%) |
| 5 to 17 Years | 12 (1.2%) | 27 (3.1%) |
| 18 to 34 Years | 10 (1.1%) | 6 (0.6%) |
| 35 to 64 Years | 35 (1.9%) | 47 (2.2%) |
| 65 to 74 Years | 15 (2.9%) | 32 (5.5%) |
| 75 Years and over | 87 (30.7%) | 30 (6.3%) |
Disability Class: Cognitive Difficulty
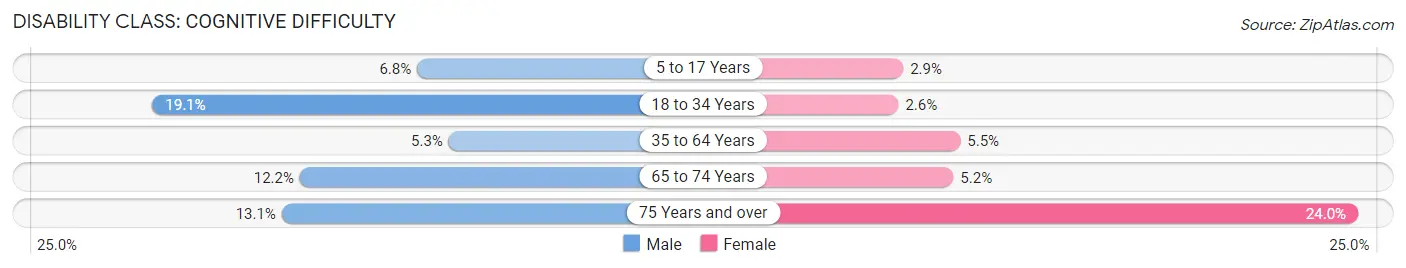
| Age Bracket | Male | Female |
| 5 to 17 Years | 70 (6.8%) | 25 (2.9%) |
| 18 to 34 Years | 177 (19.1%) | 27 (2.6%) |
| 35 to 64 Years | 100 (5.3%) | 117 (5.5%) |
| 65 to 74 Years | 63 (12.2%) | 30 (5.2%) |
| 75 Years and over | 37 (13.1%) | 114 (23.9%) |
Disability Class: Ambulatory Difficulty
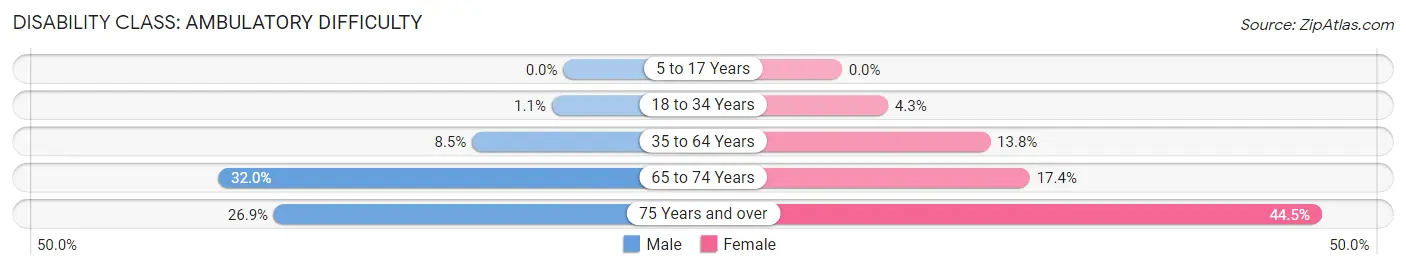
| Age Bracket | Male | Female |
| 5 to 17 Years | 0 (0.0%) | 0 (0.0%) |
| 18 to 34 Years | 10 (1.1%) | 44 (4.3%) |
| 35 to 64 Years | 159 (8.5%) | 293 (13.8%) |
| 65 to 74 Years | 165 (32.0%) | 101 (17.4%) |
| 75 Years and over | 76 (26.9%) | 212 (44.5%) |
Disability Class: Self-Care Difficulty
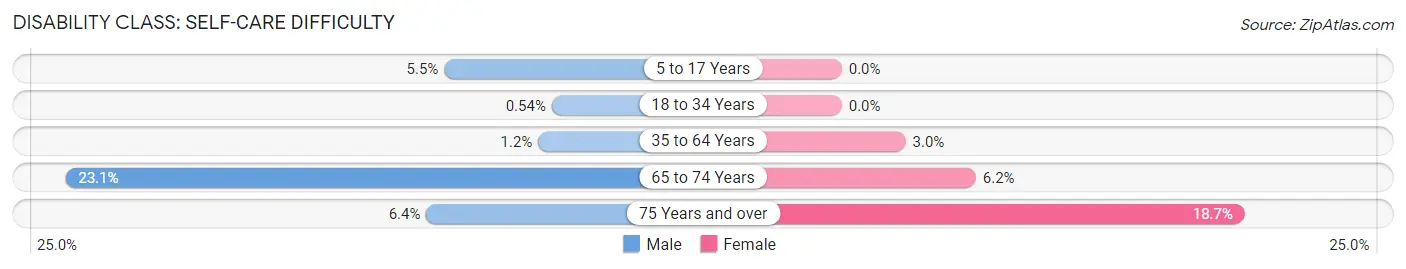
| Age Bracket | Male | Female |
| 5 to 17 Years | 57 (5.5%) | 0 (0.0%) |
| 18 to 34 Years | 5 (0.5%) | 0 (0.0%) |
| 35 to 64 Years | 22 (1.2%) | 63 (3.0%) |
| 65 to 74 Years | 119 (23.1%) | 36 (6.2%) |
| 75 Years and over | 18 (6.4%) | 89 (18.7%) |
Technology Access in Bradley County
Computing Device Access in Bradley County
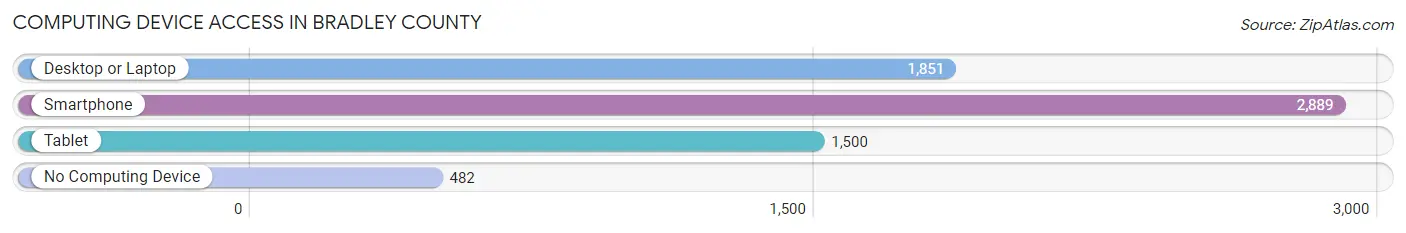
| Device Type | # Households | % Households |
| Desktop or Laptop | 1,851 | 51.6% |
| Smartphone | 2,889 | 80.5% |
| Tablet | 1,500 | 41.8% |
| No Computing Device | 482 | 13.4% |
| Total | 3,587 | 100.0% |
Internet Access in Bradley County
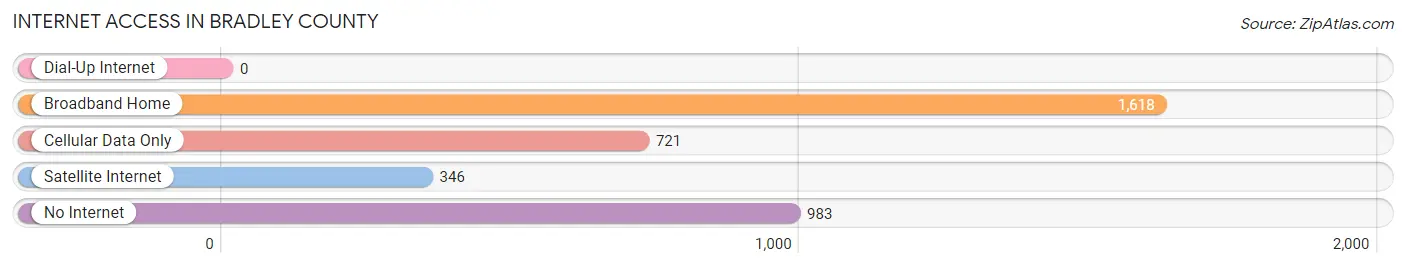
| Internet Type | # Households | % Households |
| Dial-Up Internet | 0 | 0.0% |
| Broadband Home | 1,618 | 45.1% |
| Cellular Data Only | 721 | 20.1% |
| Satellite Internet | 346 | 9.7% |
| No Internet | 983 | 27.4% |
| Total | 3,587 | 100.0% |
Bradley County Summary
Bradley County is located in the southeastern corner of Arkansas, and is part of the Delta region of the state. It is bordered by Drew County to the north, Ashley County to the east, Union County to the south, and Cleveland County to the west. The county seat is Warren, and the largest city is Hermitage.
History
Bradley County was established in 1838 and named for Captain Hugh Bradley, a veteran of the War of 1812. The county was originally part of Union County, but was split off in 1838. The first settlers in the area were mostly farmers, and the county was largely agricultural until the early 20th century.
In the early 1900s, the timber industry began to take off in the county, and the population began to grow. The timber industry was a major employer in the county for many years, and it was also a major source of revenue.
In the 1950s, the county began to diversify its economy, and the manufacturing industry began to take off. The county is now home to several major manufacturing companies, including Tyson Foods, which is the largest employer in the county.
Geography
Bradley County is located in the southeastern corner of Arkansas, and is part of the Delta region of the state. It is bordered by Drew County to the north, Ashley County to the east, Union County to the south, and Cleveland County to the west. The county has a total area of 590 square miles, of which 586 square miles is land and 4 square miles is water.
The terrain of the county is mostly flat, with some rolling hills in the northern part of the county. The county is drained by the Saline River, which flows through the county from north to south. The county is also home to several lakes, including Lake Monticello, Lake Erling, and Lake Wallace.
Economy
Bradley County has a diverse economy, with a mix of agriculture, manufacturing, and services. The county is home to several major manufacturing companies, including Tyson Foods, which is the largest employer in the county. Other major employers include the Warren School District, the Bradley County Medical Center, and the Bradley County Sheriff's Office.
Agriculture is also an important part of the county's economy. The county is home to several large farms, and the main crops grown in the county are cotton, soybeans, corn, and rice.
Demographics
As of the 2010 census, Bradley County had a population of 11,508. The racial makeup of the county was 75.3% White, 21.2% Black or African American, 0.4% Native American, 0.3% Asian, 0.1% Pacific Islander, 1.2% from other races, and 1.5% from two or more races. Hispanic or Latino of any race were 2.7% of the population.
The median income for a household in the county was $30,945, and the median income for a family was $37,917. The per capita income for the county was $15,945. About 17.2% of the population was below the poverty line.
Common Questions
What is Per Capita Income in Bradley County?
Per Capita income in Bradley County is $23,830.
What is the Median Family Income in Bradley County?
Median Family Income in Bradley County is $60,497.
What is the Median Household income in Bradley County?
Median Household Income in Bradley County is $43,688.
What is Income or Wage Gap in Bradley County?
Income or Wage Gap in Bradley County is 43.7%.
Women in Bradley County earn 56.3 cents for every dollar earned by a man.
What is Inequality or Gini Index in Bradley County?
Inequality or Gini Index in Bradley County is 0.47.
What is the Total Population of Bradley County?
Total Population of Bradley County is 10,461.
What is the Total Male Population of Bradley County?
Total Male Population of Bradley County is 5,058.
What is the Total Female Population of Bradley County?
Total Female Population of Bradley County is 5,403.
What is the Ratio of Males per 100 Females in Bradley County?
There are 93.61 Males per 100 Females in Bradley County.
What is the Ratio of Females per 100 Males in Bradley County?
There are 106.82 Females per 100 Males in Bradley County.
What is the Median Population Age in Bradley County?
Median Population Age in Bradley County is 40.2 Years.
What is the Average Family Size in Bradley County
Average Family Size in Bradley County is 4.0 People.
What is the Average Household Size in Bradley County
Average Household Size in Bradley County is 2.9 People.
How Large is the Labor Force in Bradley County?
There are 3,965 People in the Labor Forcein in Bradley County.
What is the Percentage of People in the Labor Force in Bradley County?
48.6% of People are in the Labor Force in Bradley County.
What is the Unemployment Rate in Bradley County?
Unemployment Rate in Bradley County is 5.6%.