Brookland, AR Map & Demographics
Brookland Map
Brookland Overview
$28,324
PER CAPITA INCOME
$85,746
AVG FAMILY INCOME
$65,688
AVG HOUSEHOLD INCOME
30.4%
WAGE / INCOME GAP [ % ]
69.6¢/ $1
WAGE / INCOME GAP [ $ ]
0.32
INEQUALITY / GINI INDEX
4,057
TOTAL POPULATION
2,067
MALE POPULATION
1,990
FEMALE POPULATION
103.87
MALES / 100 FEMALES
96.27
FEMALES / 100 MALES
26.8
MEDIAN AGE
3.1
AVG FAMILY SIZE
2.7
AVG HOUSEHOLD SIZE
2,404
LABOR FORCE [ PEOPLE ]
81.9%
PERCENT IN LABOR FORCE
5.8%
UNEMPLOYMENT RATE
Brookland Zip Codes
Brookland Area Codes
Income in Brookland
Income Overview in Brookland
Per Capita Income in Brookland is $28,324, while median incomes of families and households are $85,746 and $65,688 respectively.
| Characteristic | Number | Measure |
| Per Capita Income | 4,057 | $28,324 |
| Median Family Income | 1,128 | $85,746 |
| Mean Family Income | 1,128 | $85,352 |
| Median Household Income | 1,491 | $65,688 |
| Mean Household Income | 1,491 | $75,484 |
| Income Deficit | 1,128 | $0 |
| Wage / Income Gap (%) | 4,057 | 30.39% |
| Wage / Income Gap ($) | 4,057 | 69.61¢ per $1 |
| Gini / Inequality Index | 4,057 | 0.32 |
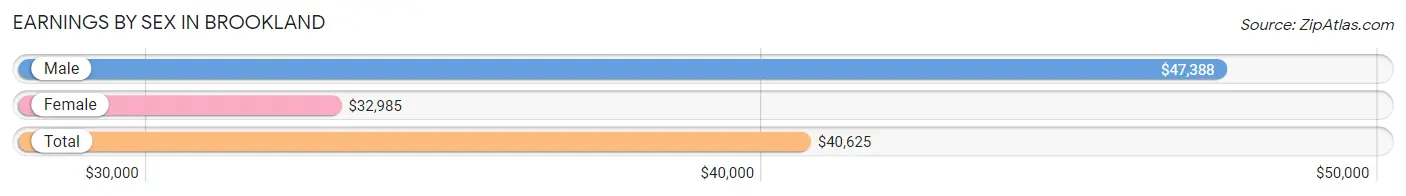
Earnings by Sex in Brookland
Average Earnings in Brookland are $40,625, $47,388 for men and $32,985 for women, a difference of 30.4%.
| Sex | Number | Average Earnings |
| Male | 1,315 (56.6%) | $47,388 |
| Female | 1,008 (43.4%) | $32,985 |
| Total | 2,323 (100.0%) | $40,625 |
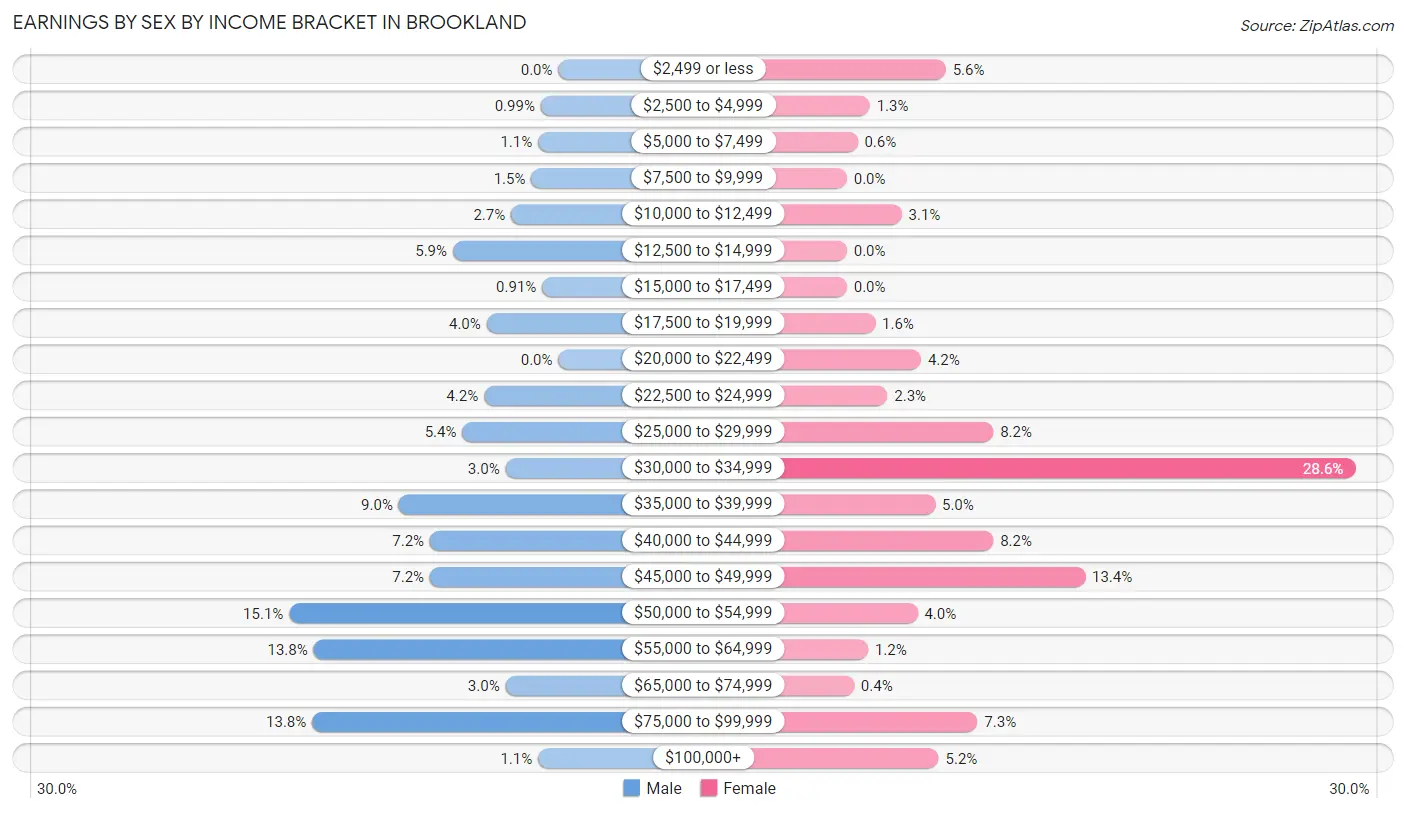
Earnings by Sex by Income Bracket in Brookland
The most common earnings brackets in Brookland are $50,000 to $54,999 for men (199 | 15.1%) and $30,000 to $34,999 for women (288 | 28.6%).
| Income | Male | Female |
| $2,499 or less | 0 (0.0%) | 56 (5.6%) |
| $2,500 to $4,999 | 13 (1.0%) | 13 (1.3%) |
| $5,000 to $7,499 | 15 (1.1%) | 6 (0.6%) |
| $7,500 to $9,999 | 20 (1.5%) | 0 (0.0%) |
| $10,000 to $12,499 | 35 (2.7%) | 31 (3.1%) |
| $12,500 to $14,999 | 78 (5.9%) | 0 (0.0%) |
| $15,000 to $17,499 | 12 (0.9%) | 0 (0.0%) |
| $17,500 to $19,999 | 53 (4.0%) | 16 (1.6%) |
| $20,000 to $22,499 | 0 (0.0%) | 42 (4.2%) |
| $22,500 to $24,999 | 55 (4.2%) | 23 (2.3%) |
| $25,000 to $29,999 | 71 (5.4%) | 83 (8.2%) |
| $30,000 to $34,999 | 39 (3.0%) | 288 (28.6%) |
| $35,000 to $39,999 | 118 (9.0%) | 50 (5.0%) |
| $40,000 to $44,999 | 95 (7.2%) | 83 (8.2%) |
| $45,000 to $49,999 | 95 (7.2%) | 135 (13.4%) |
| $50,000 to $54,999 | 199 (15.1%) | 40 (4.0%) |
| $55,000 to $64,999 | 181 (13.8%) | 12 (1.2%) |
| $65,000 to $74,999 | 39 (3.0%) | 4 (0.4%) |
| $75,000 to $99,999 | 182 (13.8%) | 74 (7.3%) |
| $100,000+ | 15 (1.1%) | 52 (5.2%) |
| Total | 1,315 (100.0%) | 1,008 (100.0%) |
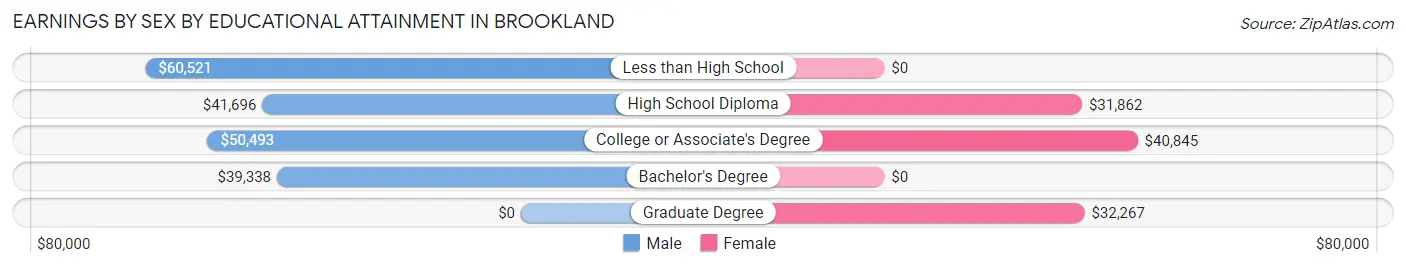
Earnings by Sex by Educational Attainment in Brookland
Average earnings in Brookland are $48,397 for men and $33,601 for women, a difference of 30.6%. Men with an educational attainment of less than high school enjoy the highest average annual earnings of $60,521, while those with bachelor's degree education earn the least with $39,338. Women with an educational attainment of college or associate's degree earn the most with the average annual earnings of $40,845, while those with high school diploma education have the smallest earnings of $31,862.
| Educational Attainment | Male Income | Female Income |
| Less than High School | $60,521 | $0 |
| High School Diploma | $41,696 | $31,862 |
| College or Associate's Degree | $50,493 | $40,845 |
| Bachelor's Degree | $39,338 | $0 |
| Graduate Degree | - | - |
| Total | $48,397 | $33,601 |
Family Income in Brookland
Family Income Brackets in Brookland
According to the Brookland family income data, there are 408 families falling into the $100,000 to $149,999 income range, which is the most common income bracket and makes up 36.2% of all families.
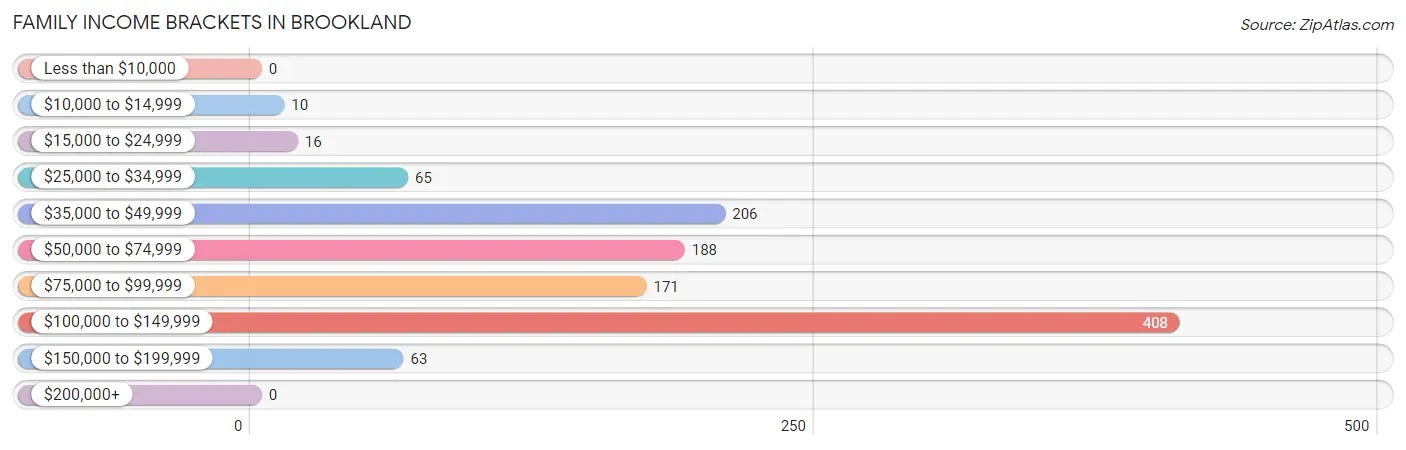
| Income Bracket | # Families | % Families |
| Less than $10,000 | 0 | 0.0% |
| $10,000 to $14,999 | 10 | 0.9% |
| $15,000 to $24,999 | 16 | 1.4% |
| $25,000 to $34,999 | 65 | 5.8% |
| $35,000 to $49,999 | 206 | 18.3% |
| $50,000 to $74,999 | 188 | 16.7% |
| $75,000 to $99,999 | 171 | 15.2% |
| $100,000 to $149,999 | 408 | 36.2% |
| $150,000 to $199,999 | 63 | 5.6% |
| $200,000+ | 0 | 0.0% |
Family Income by Famaliy Size in Brookland
4-person families (283 | 25.1%) account for the highest median family income in Brookland with $118,573 per family, while 4-person families (283 | 25.1%) have the highest median income of $29,643 per family member.
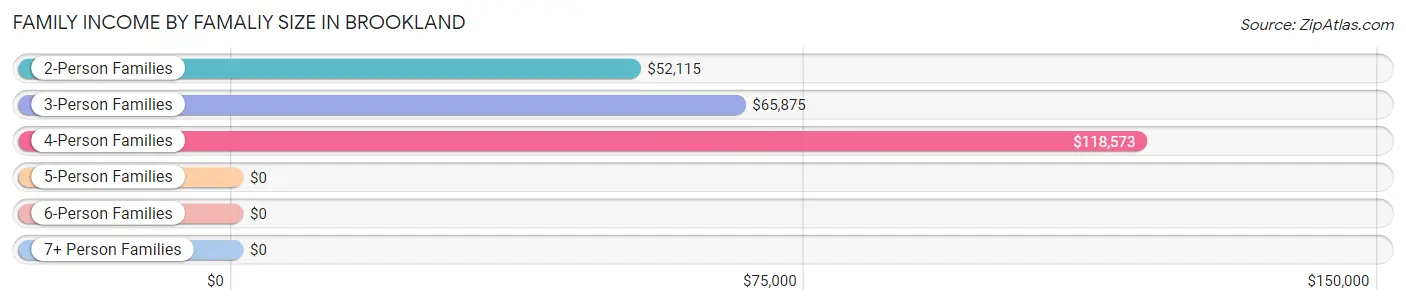
| Income Bracket | # Families | Median Income |
| 2-Person Families | 496 (44.0%) | $52,115 |
| 3-Person Families | 262 (23.2%) | $65,875 |
| 4-Person Families | 283 (25.1%) | $118,573 |
| 5-Person Families | 40 (3.5%) | $0 |
| 6-Person Families | 42 (3.7%) | $0 |
| 7+ Person Families | 5 (0.4%) | $0 |
| Total | 1,128 (100.0%) | $85,746 |
Family Income by Number of Earners in Brookland
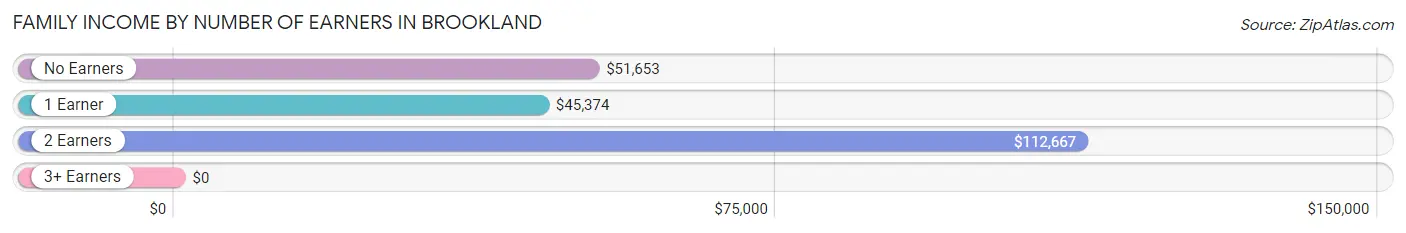
| Number of Earners | # Families | Median Income |
| No Earners | 61 (5.4%) | $51,653 |
| 1 Earner | 345 (30.6%) | $45,374 |
| 2 Earners | 698 (61.9%) | $112,667 |
| 3+ Earners | 24 (2.1%) | $0 |
| Total | 1,128 (100.0%) | $85,746 |
Household Income in Brookland
Household Income Brackets in Brookland
With 409 households falling in the category, the $100,000 to $149,999 income range is the most frequent in Brookland, accounting for 27.4% of all households.
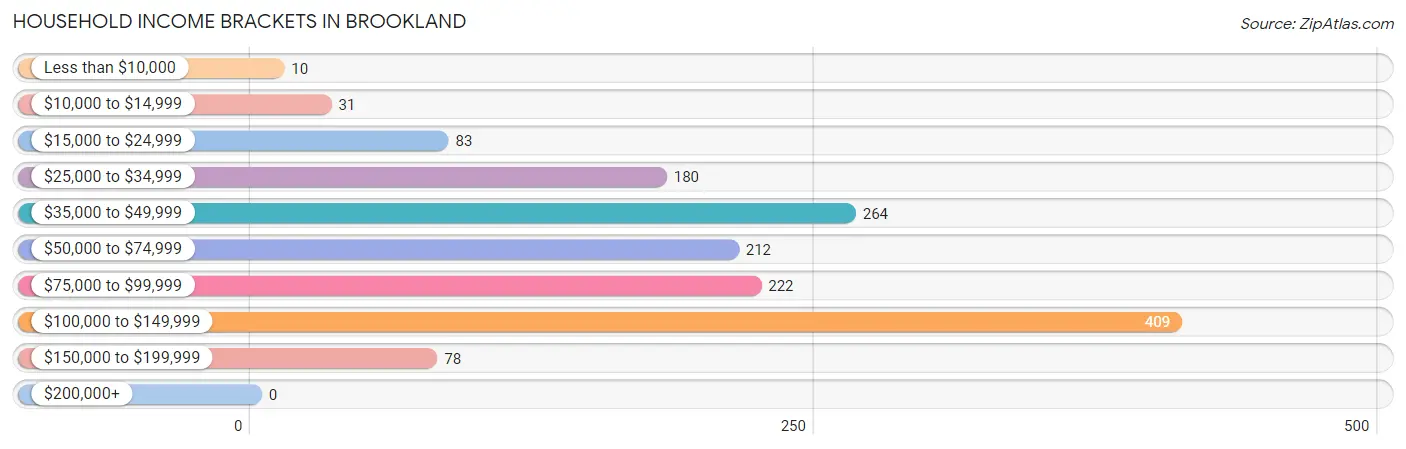
| Income Bracket | # Households | % Households |
| Less than $10,000 | 10 | 0.7% |
| $10,000 to $14,999 | 31 | 2.1% |
| $15,000 to $24,999 | 83 | 5.6% |
| $25,000 to $34,999 | 180 | 12.1% |
| $35,000 to $49,999 | 264 | 17.7% |
| $50,000 to $74,999 | 212 | 14.2% |
| $75,000 to $99,999 | 222 | 14.9% |
| $100,000 to $149,999 | 409 | 27.4% |
| $150,000 to $199,999 | 78 | 5.2% |
| $200,000+ | 0 | 0.0% |
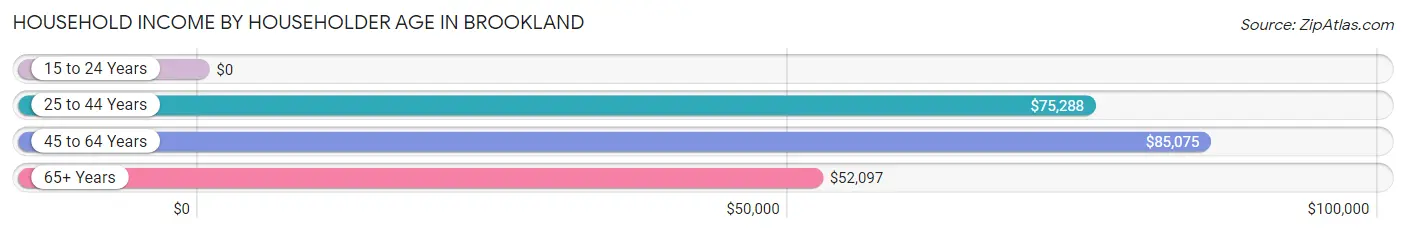
Household Income by Householder Age in Brookland
The median household income in Brookland is $65,688, with the highest median household income of $85,075 found in the 45 to 64 years age bracket for the primary householder. A total of 340 households (22.8%) fall into this category. Meanwhile, the 15 to 24 years age bracket for the primary householder has the lowest median household income of $0, with 85 households (5.7%) in this group.
| Income Bracket | # Households | Median Income |
| 15 to 24 Years | 85 (5.7%) | $0 |
| 25 to 44 Years | 900 (60.4%) | $75,288 |
| 45 to 64 Years | 340 (22.8%) | $85,075 |
| 65+ Years | 166 (11.1%) | $52,097 |
| Total | 1,491 (100.0%) | $65,688 |
Poverty in Brookland
Income Below Poverty by Sex and Age in Brookland
With 4.2% poverty level for males and 13.5% for females among the residents of Brookland, 12 to 14 year old males and 16 and 17 year old females are the most vulnerable to poverty, with 26 males (100.0%) and 20 females (55.6%) in their respective age groups living below the poverty level.
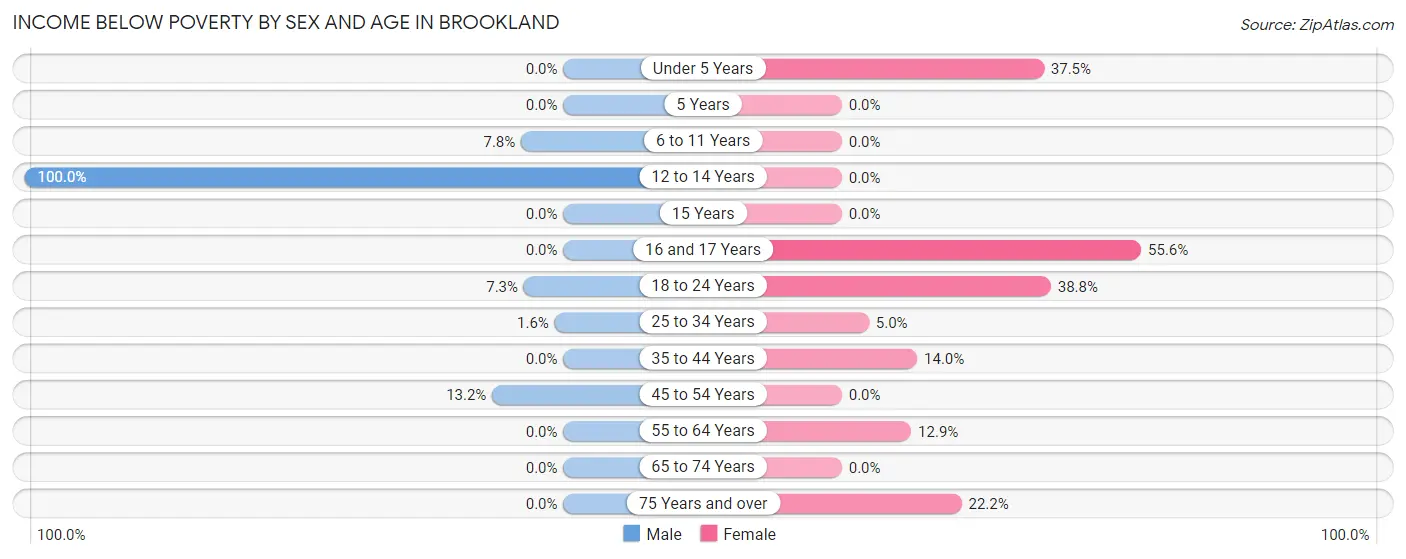
| Age Bracket | Male | Female |
| Under 5 Years | 0 (0.0%) | 120 (37.5%) |
| 5 Years | 0 (0.0%) | 0 (0.0%) |
| 6 to 11 Years | 16 (7.8%) | 0 (0.0%) |
| 12 to 14 Years | 26 (100.0%) | 0 (0.0%) |
| 15 Years | 0 (0.0%) | 0 (0.0%) |
| 16 and 17 Years | 0 (0.0%) | 20 (55.6%) |
| 18 to 24 Years | 14 (7.3%) | 45 (38.8%) |
| 25 to 34 Years | 10 (1.6%) | 26 (5.0%) |
| 35 to 44 Years | 0 (0.0%) | 26 (14.0%) |
| 45 to 54 Years | 21 (13.2%) | 0 (0.0%) |
| 55 to 64 Years | 0 (0.0%) | 22 (12.9%) |
| 65 to 74 Years | 0 (0.0%) | 0 (0.0%) |
| 75 Years and over | 0 (0.0%) | 10 (22.2%) |
| Total | 87 (4.2%) | 269 (13.5%) |
Income Above Poverty by Sex and Age in Brookland
According to the poverty statistics in Brookland, males aged under 5 years and females aged 5 years are the age groups that are most secure financially, with 100.0% of males and 100.0% of females in these age groups living above the poverty line.
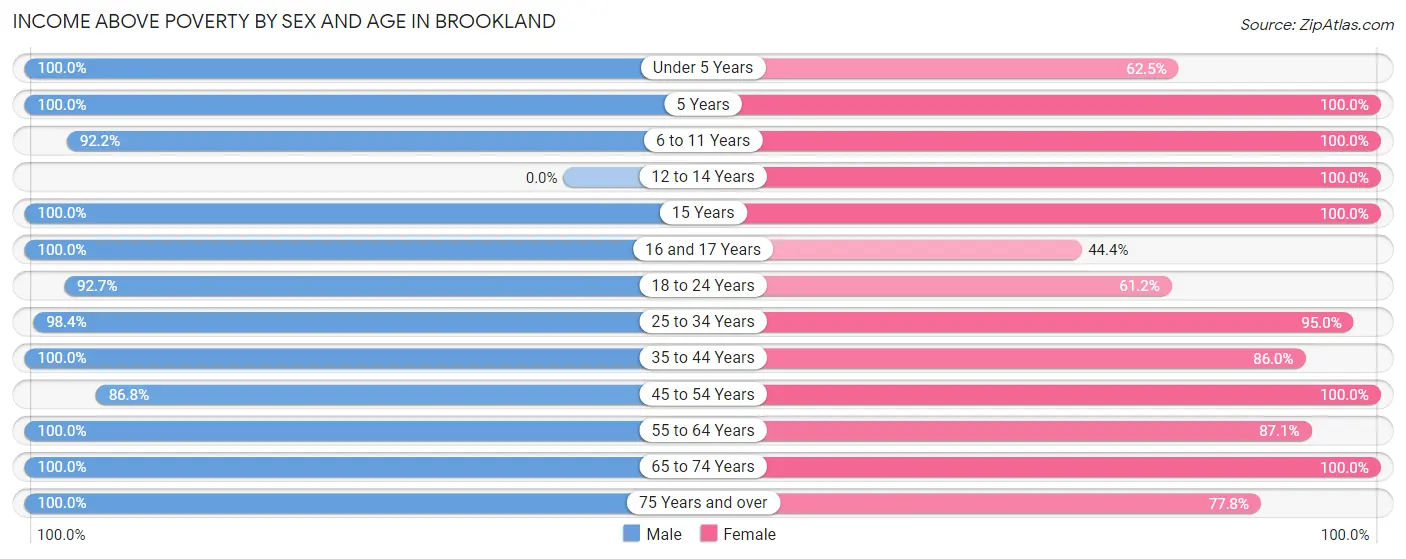
| Age Bracket | Male | Female |
| Under 5 Years | 87 (100.0%) | 200 (62.5%) |
| 5 Years | 116 (100.0%) | 41 (100.0%) |
| 6 to 11 Years | 188 (92.2%) | 212 (100.0%) |
| 12 to 14 Years | 0 (0.0%) | 59 (100.0%) |
| 15 Years | 11 (100.0%) | 46 (100.0%) |
| 16 and 17 Years | 49 (100.0%) | 16 (44.4%) |
| 18 to 24 Years | 177 (92.7%) | 71 (61.2%) |
| 25 to 34 Years | 611 (98.4%) | 492 (95.0%) |
| 35 to 44 Years | 271 (100.0%) | 160 (86.0%) |
| 45 to 54 Years | 138 (86.8%) | 165 (100.0%) |
| 55 to 64 Years | 219 (100.0%) | 149 (87.1%) |
| 65 to 74 Years | 47 (100.0%) | 75 (100.0%) |
| 75 Years and over | 66 (100.0%) | 35 (77.8%) |
| Total | 1,980 (95.8%) | 1,721 (86.5%) |
Income Below Poverty Among Married-Couple Families in Brookland
The poverty statistics for married-couple families in Brookland show that 2.0% or 15 of the total 735 families live below the poverty line. Families with 5 or more children have the highest poverty rate of 100.0%, comprising of 5 families. On the other hand, families with no children have the lowest poverty rate of 0.0%, which includes 0 families.
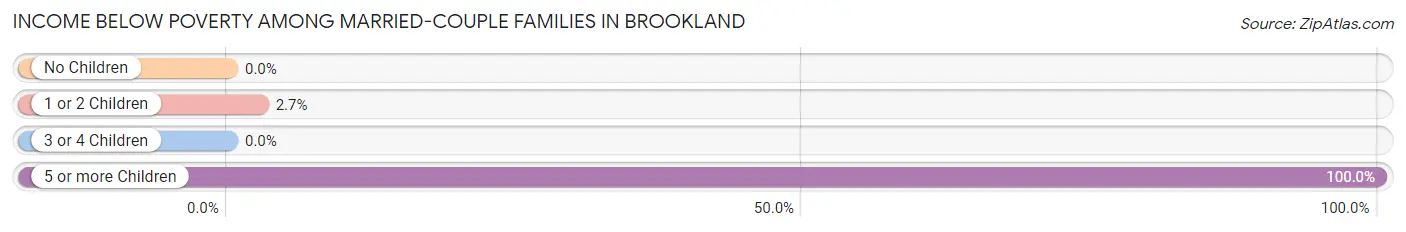
| Children | Above Poverty | Below Poverty |
| No Children | 274 (100.0%) | 0 (0.0%) |
| 1 or 2 Children | 364 (97.3%) | 10 (2.7%) |
| 3 or 4 Children | 82 (100.0%) | 0 (0.0%) |
| 5 or more Children | 0 (0.0%) | 5 (100.0%) |
| Total | 720 (98.0%) | 15 (2.0%) |
Income Below Poverty Among Single-Parent Households in Brookland
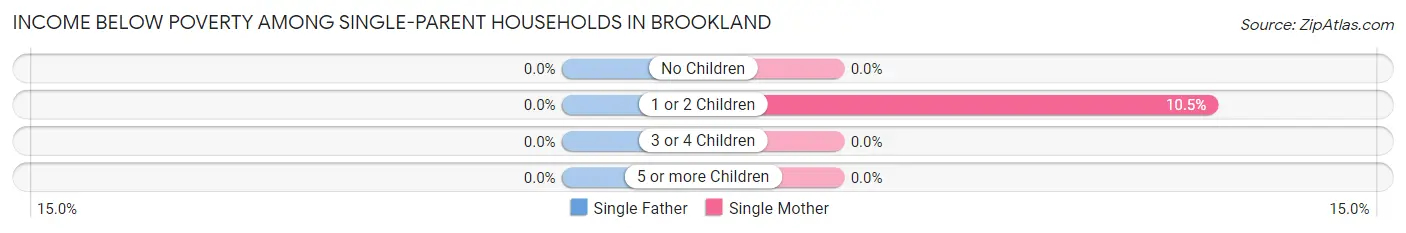
| Children | Single Father | Single Mother |
| No Children | 0 (0.0%) | 0 (0.0%) |
| 1 or 2 Children | 0 (0.0%) | 16 (10.5%) |
| 3 or 4 Children | 0 (0.0%) | 0 (0.0%) |
| 5 or more Children | 0 (0.0%) | 0 (0.0%) |
| Total | 0 (0.0%) | 16 (7.4%) |
Income Below Poverty Among Married-Couple vs Single-Parent Households in Brookland
The poverty data for Brookland shows that 15 of the married-couple family households (2.0%) and 16 of the single-parent households (4.1%) are living below the poverty level. Within the married-couple family households, those with 5 or more children have the highest poverty rate, with 5 households (100.0%) falling below the poverty line. Among the single-parent households, those with 1 or 2 children have the highest poverty rate, with 16 household (7.5%) living below poverty.
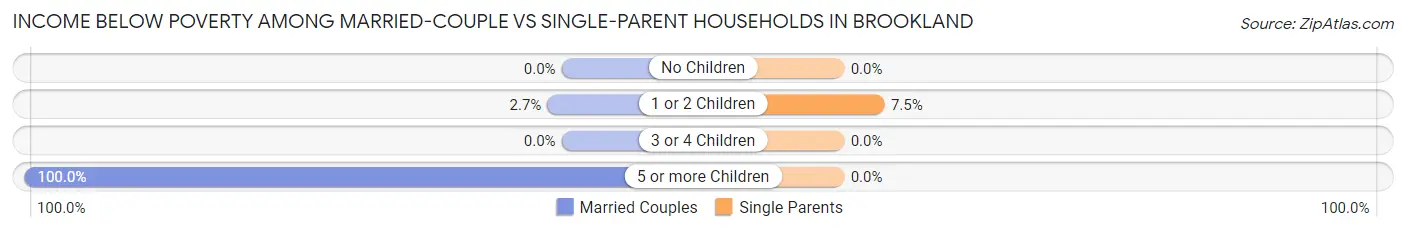
| Children | Married-Couple Families | Single-Parent Households |
| No Children | 0 (0.0%) | 0 (0.0%) |
| 1 or 2 Children | 10 (2.7%) | 16 (7.5%) |
| 3 or 4 Children | 0 (0.0%) | 0 (0.0%) |
| 5 or more Children | 5 (100.0%) | 0 (0.0%) |
| Total | 15 (2.0%) | 16 (4.1%) |
Race in Brookland
The most populous races in Brookland are White / Caucasian (3,770 | 92.9%), Two or more Races (171 | 4.2%), and Black / African American (77 | 1.9%).
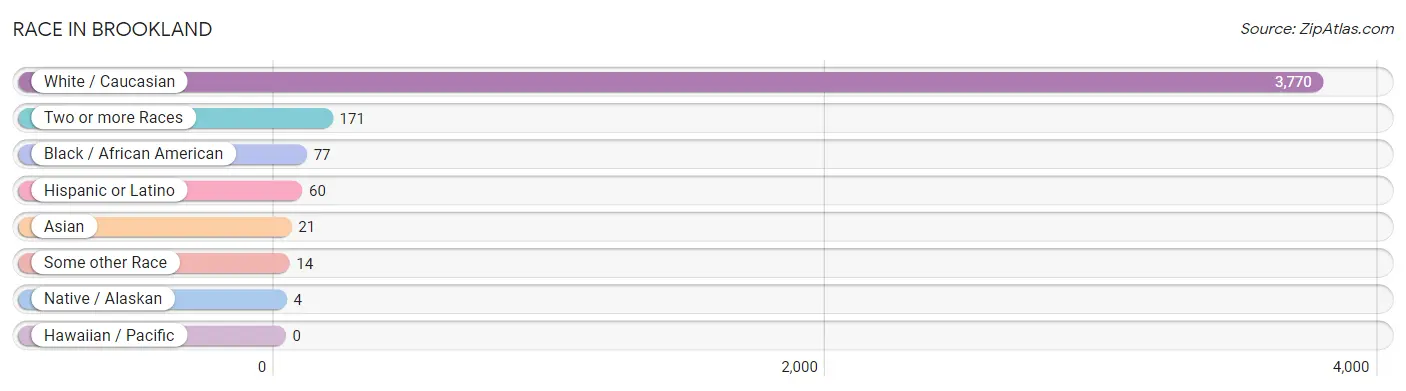
| Race | # Population | % Population |
| Asian | 21 | 0.5% |
| Black / African American | 77 | 1.9% |
| Hawaiian / Pacific | 0 | 0.0% |
| Hispanic or Latino | 60 | 1.5% |
| Native / Alaskan | 4 | 0.1% |
| White / Caucasian | 3,770 | 92.9% |
| Two or more Races | 171 | 4.2% |
| Some other Race | 14 | 0.4% |
| Total | 4,057 | 100.0% |
Ancestry in Brookland
The most populous ancestries reported in Brookland are German (426 | 10.5%), Irish (354 | 8.7%), English (287 | 7.1%), American (193 | 4.8%), and Welsh (189 | 4.7%), together accounting for 35.7% of all Brookland residents.
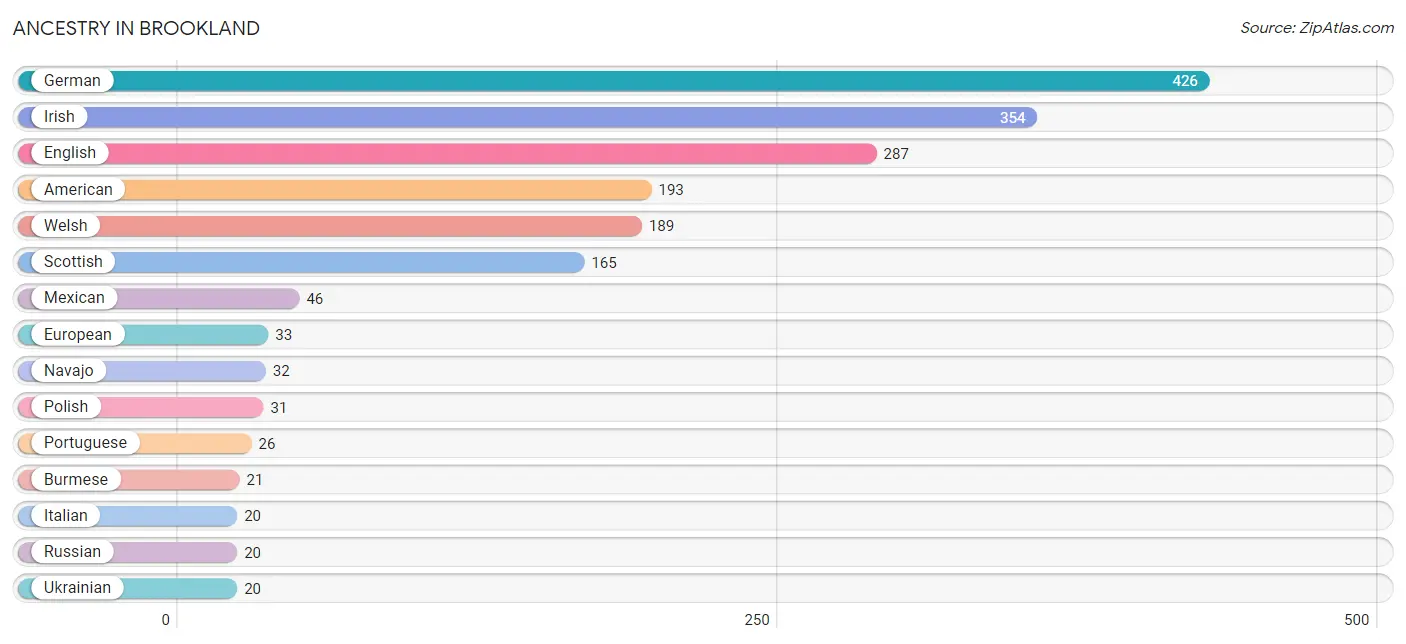
| Ancestry | # Population | % Population |
| American | 193 | 4.8% |
| Burmese | 21 | 0.5% |
| Central American | 14 | 0.4% |
| Cherokee | 4 | 0.1% |
| Dutch | 8 | 0.2% |
| Eastern European | 13 | 0.3% |
| English | 287 | 7.1% |
| European | 33 | 0.8% |
| French | 14 | 0.4% |
| French Canadian | 18 | 0.4% |
| German | 426 | 10.5% |
| German Russian | 14 | 0.4% |
| Guatemalan | 14 | 0.4% |
| Irish | 354 | 8.7% |
| Italian | 20 | 0.5% |
| Mexican | 46 | 1.1% |
| Navajo | 32 | 0.8% |
| Polish | 31 | 0.8% |
| Portuguese | 26 | 0.6% |
| Russian | 20 | 0.5% |
| Scottish | 165 | 4.1% |
| Ukrainian | 20 | 0.5% |
| Welsh | 189 | 4.7% | View All 23 Rows |
Immigrants in Brookland
The most numerous immigrant groups reported in Brookland came from Asia (21 | 0.5%), Eastern Asia (21 | 0.5%), Korea (21 | 0.5%), Central America (14 | 0.4%), and Guatemala (14 | 0.4%), together accounting for 2.3% of all Brookland residents.
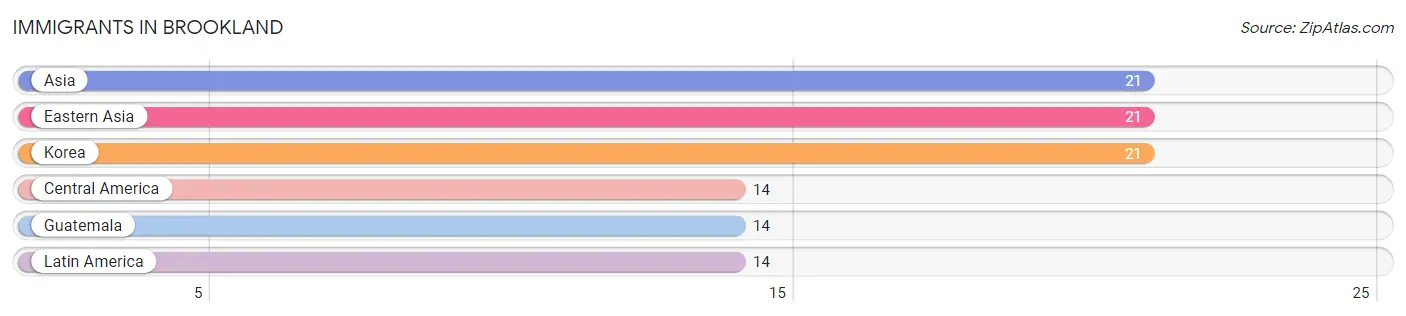
| Immigration Origin | # Population | % Population |
| Asia | 21 | 0.5% |
| Central America | 14 | 0.4% |
| Eastern Asia | 21 | 0.5% |
| Guatemala | 14 | 0.4% |
| Korea | 21 | 0.5% |
| Latin America | 14 | 0.4% | View All 6 Rows |
Sex and Age in Brookland
Sex and Age in Brookland
The most populous age groups in Brookland are 25 to 29 Years (453 | 21.9%) for men and 25 to 29 Years (435 | 21.9%) for women.
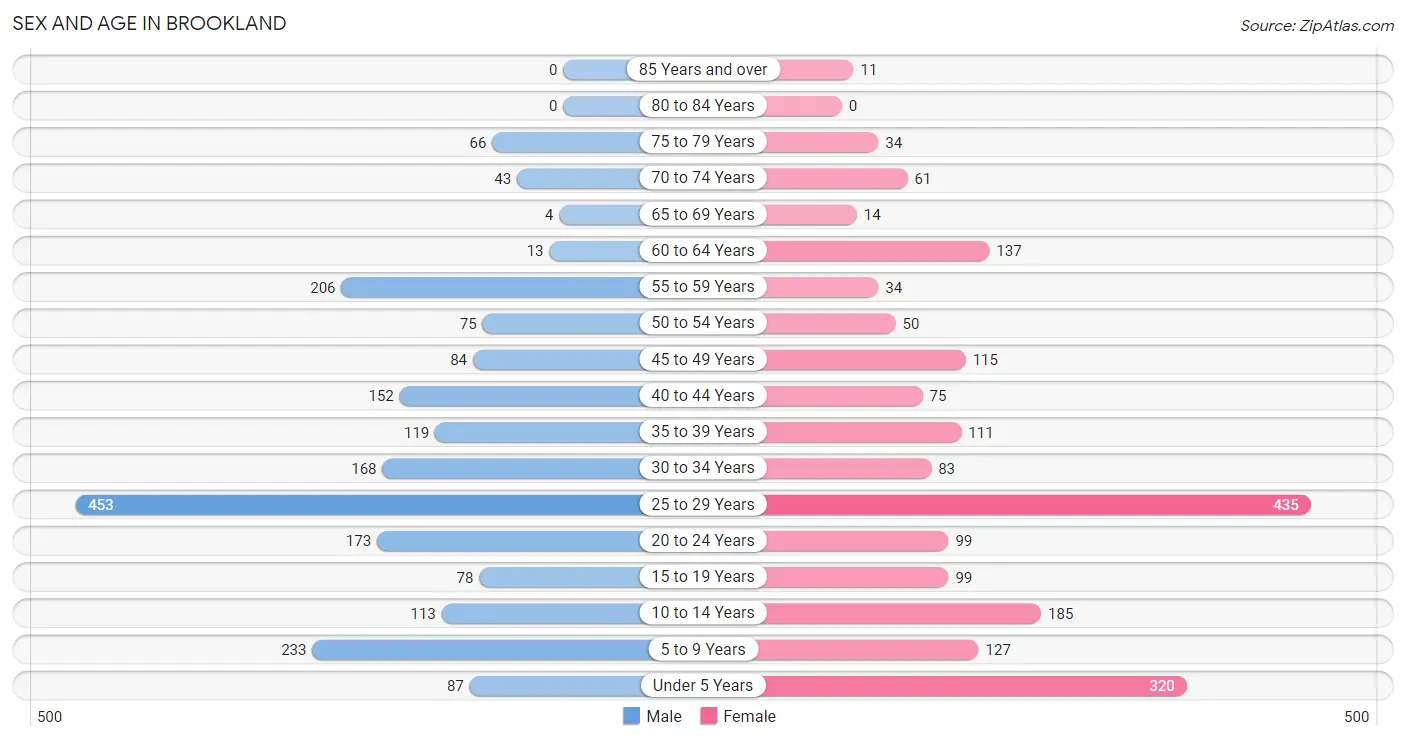
| Age Bracket | Male | Female |
| Under 5 Years | 87 (4.2%) | 320 (16.1%) |
| 5 to 9 Years | 233 (11.3%) | 127 (6.4%) |
| 10 to 14 Years | 113 (5.5%) | 185 (9.3%) |
| 15 to 19 Years | 78 (3.8%) | 99 (5.0%) |
| 20 to 24 Years | 173 (8.4%) | 99 (5.0%) |
| 25 to 29 Years | 453 (21.9%) | 435 (21.9%) |
| 30 to 34 Years | 168 (8.1%) | 83 (4.2%) |
| 35 to 39 Years | 119 (5.8%) | 111 (5.6%) |
| 40 to 44 Years | 152 (7.3%) | 75 (3.8%) |
| 45 to 49 Years | 84 (4.1%) | 115 (5.8%) |
| 50 to 54 Years | 75 (3.6%) | 50 (2.5%) |
| 55 to 59 Years | 206 (10.0%) | 34 (1.7%) |
| 60 to 64 Years | 13 (0.6%) | 137 (6.9%) |
| 65 to 69 Years | 4 (0.2%) | 14 (0.7%) |
| 70 to 74 Years | 43 (2.1%) | 61 (3.1%) |
| 75 to 79 Years | 66 (3.2%) | 34 (1.7%) |
| 80 to 84 Years | 0 (0.0%) | 0 (0.0%) |
| 85 Years and over | 0 (0.0%) | 11 (0.5%) |
| Total | 2,067 (100.0%) | 1,990 (100.0%) |
Families and Households in Brookland
Median Family Size in Brookland
The median family size in Brookland is 3.13 persons per family, with married-couple families (735 | 65.2%) accounting for the largest median family size of 3.38 persons per family. On the other hand, single female/mother families (215 | 19.1%) represent the smallest median family size with 2.45 persons per family.
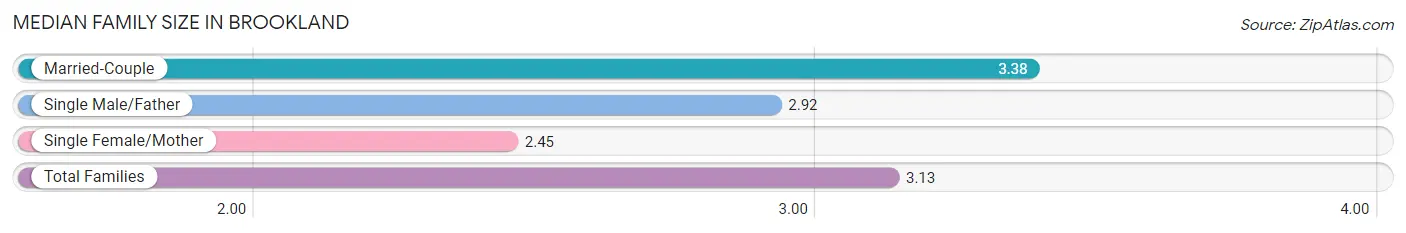
| Family Type | # Families | Family Size |
| Married-Couple | 735 (65.2%) | 3.38 |
| Single Male/Father | 178 (15.8%) | 2.92 |
| Single Female/Mother | 215 (19.1%) | 2.45 |
| Total Families | 1,128 (100.0%) | 3.13 |
Median Household Size in Brookland
The median household size in Brookland is 2.72 persons per household, with married-couple households (735 | 49.3%) accounting for the largest median household size of 3.38 persons per household. non-family households (363 | 24.3%) represent the smallest median household size with 1.41 persons per household.
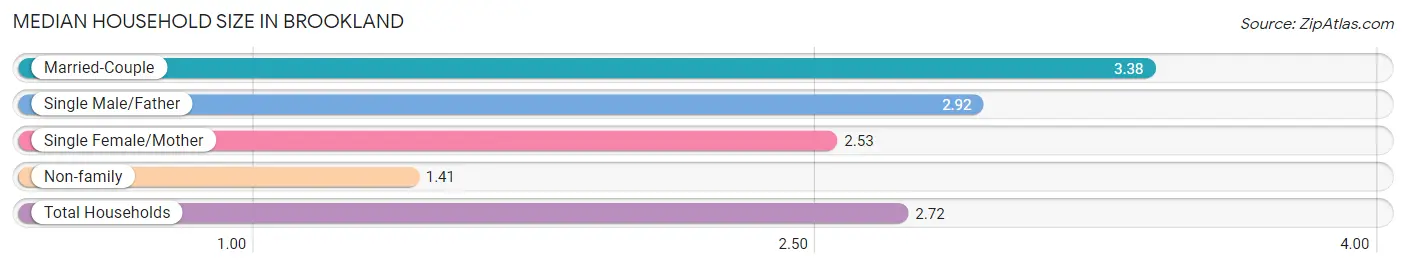
| Household Type | # Households | Household Size |
| Married-Couple | 735 (49.3%) | 3.38 |
| Single Male/Father | 178 (11.9%) | 2.92 |
| Single Female/Mother | 215 (14.4%) | 2.53 |
| Non-family | 363 (24.3%) | 1.41 |
| Total Households | 1,491 (100.0%) | 2.72 |
Household Size by Marriage Status in Brookland
Out of a total of 1,491 households in Brookland, 1,128 (75.6%) are family households, while 363 (24.3%) are nonfamily households. The most numerous type of family households are 2-person households, comprising 480, and the most common type of nonfamily households are 1-person households, comprising 249.
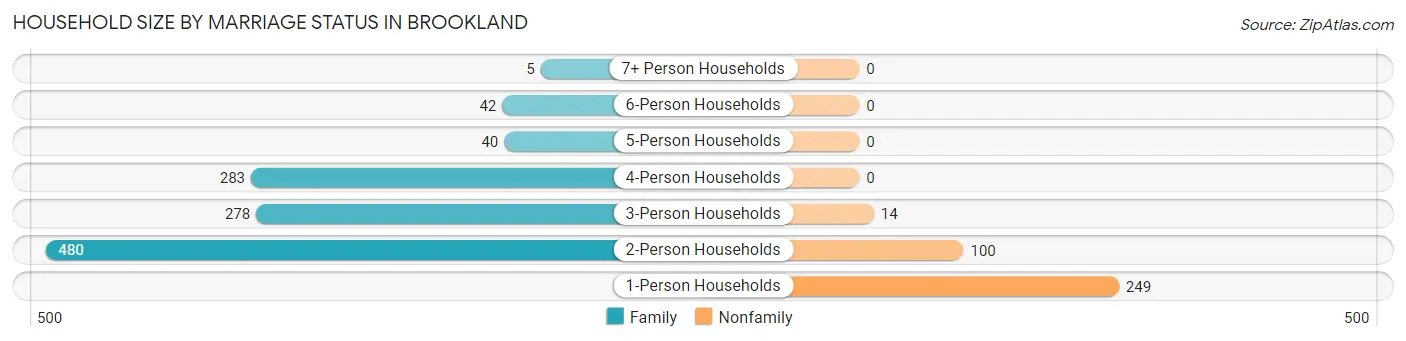
| Household Size | Family Households | Nonfamily Households |
| 1-Person Households | - | 249 (16.7%) |
| 2-Person Households | 480 (32.2%) | 100 (6.7%) |
| 3-Person Households | 278 (18.6%) | 14 (0.9%) |
| 4-Person Households | 283 (19.0%) | 0 (0.0%) |
| 5-Person Households | 40 (2.7%) | 0 (0.0%) |
| 6-Person Households | 42 (2.8%) | 0 (0.0%) |
| 7+ Person Households | 5 (0.3%) | 0 (0.0%) |
| Total | 1,128 (75.6%) | 363 (24.3%) |
Female Fertility in Brookland
Fertility by Age in Brookland
Average fertility rate in Brookland is 13.0 births per 1,000 women. Women in the age bracket of 20 to 34 years have the highest fertility rate with 21.0 births per 1,000 women. Women in the age bracket of 20 to 34 years acount for 100.0% of all women with births.
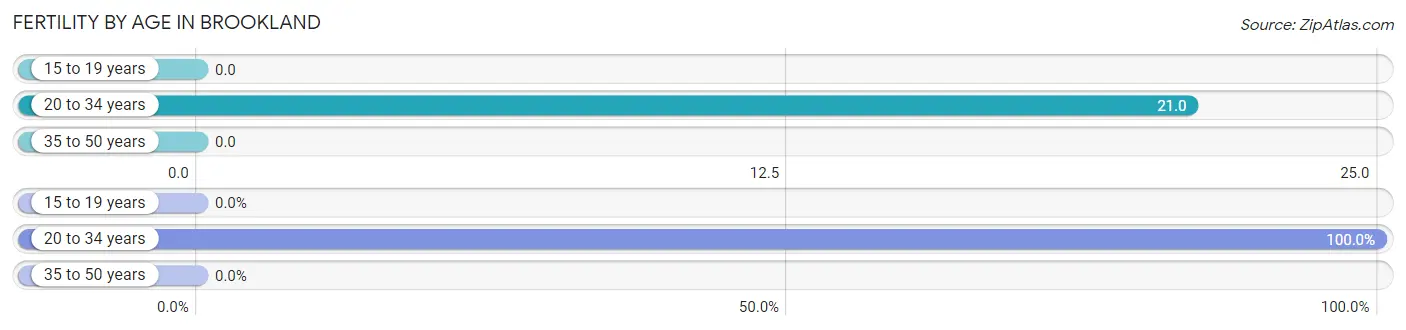
| Age Bracket | Women with Births | Births / 1,000 Women |
| 15 to 19 years | 0 (0.0%) | 0.0 |
| 20 to 34 years | 13 (100.0%) | 21.0 |
| 35 to 50 years | 0 (0.0%) | 0.0 |
| Total | 13 (100.0%) | 13.0 |
Fertility by Age by Marriage Status in Brookland
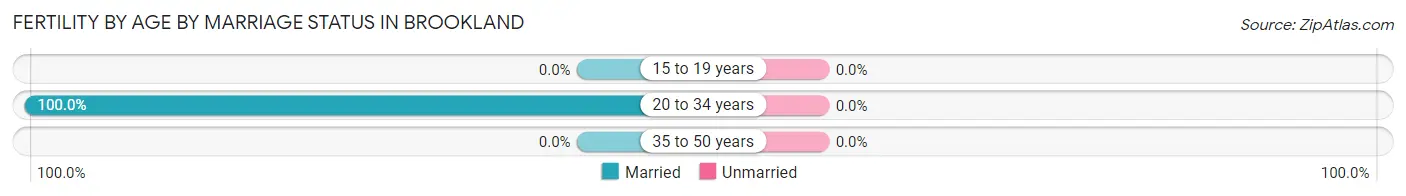
| Age Bracket | Married | Unmarried |
| 15 to 19 years | 0 (0.0%) | 0 (0.0%) |
| 20 to 34 years | 13 (100.0%) | 0 (0.0%) |
| 35 to 50 years | 0 (0.0%) | 0 (0.0%) |
| Total | 13 (100.0%) | 0 (0.0%) |
Fertility by Education in Brookland
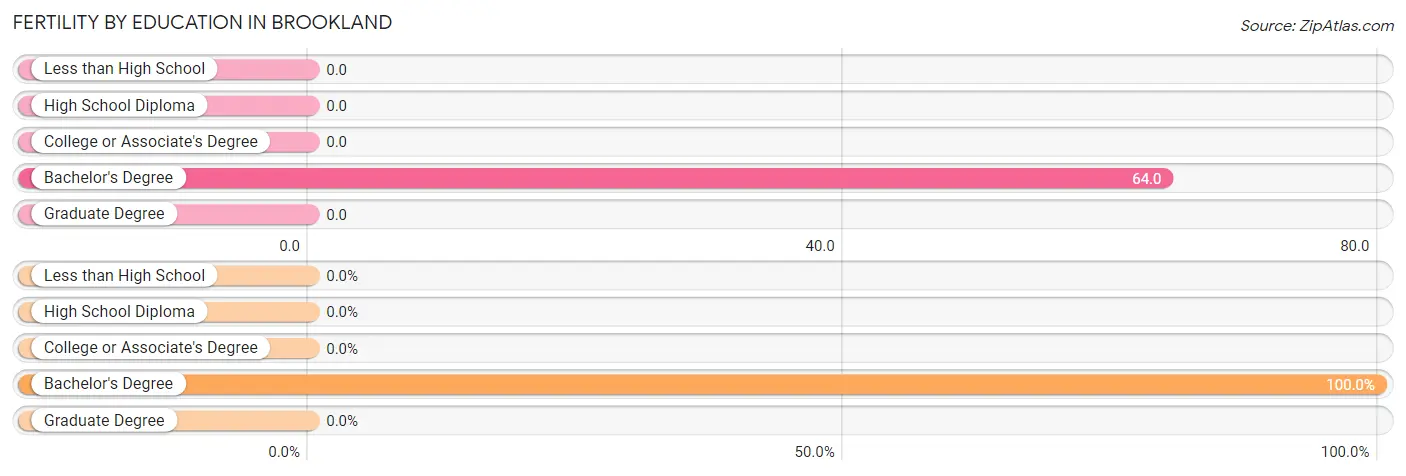
| Educational Attainment | Women with Births | Births / 1,000 Women |
| Less than High School | 0 (0.0%) | 0.0 |
| High School Diploma | 0 (0.0%) | 0.0 |
| College or Associate's Degree | 0 (0.0%) | 0.0 |
| Bachelor's Degree | 13 (100.0%) | 64.0 |
| Graduate Degree | 0 (0.0%) | 0.0 |
| Total | 13 (100.0%) | 13.0 |
Fertility by Education by Marriage Status in Brookland
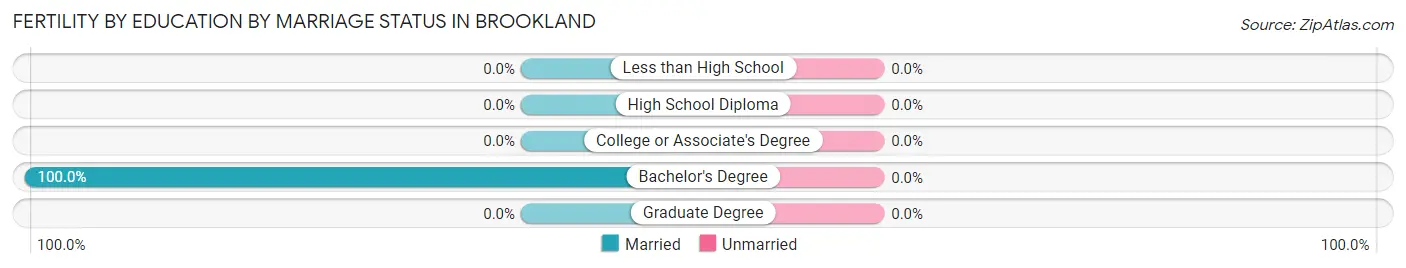
| Educational Attainment | Married | Unmarried |
| Less than High School | 0 (0.0%) | 0 (0.0%) |
| High School Diploma | 0 (0.0%) | 0 (0.0%) |
| College or Associate's Degree | 0 (0.0%) | 0 (0.0%) |
| Bachelor's Degree | 13 (100.0%) | 0 (0.0%) |
| Graduate Degree | 0 (0.0%) | 0 (0.0%) |
| Total | 13 (100.0%) | 0 (0.0%) |
Employment Characteristics in Brookland
Employment by Class of Employer in Brookland
Among the 2,253 employed individuals in Brookland, private company employees (1,629 | 72.3%), local government employees (195 | 8.7%), and state government employees (141 | 6.3%) make up the most common classes of employment.
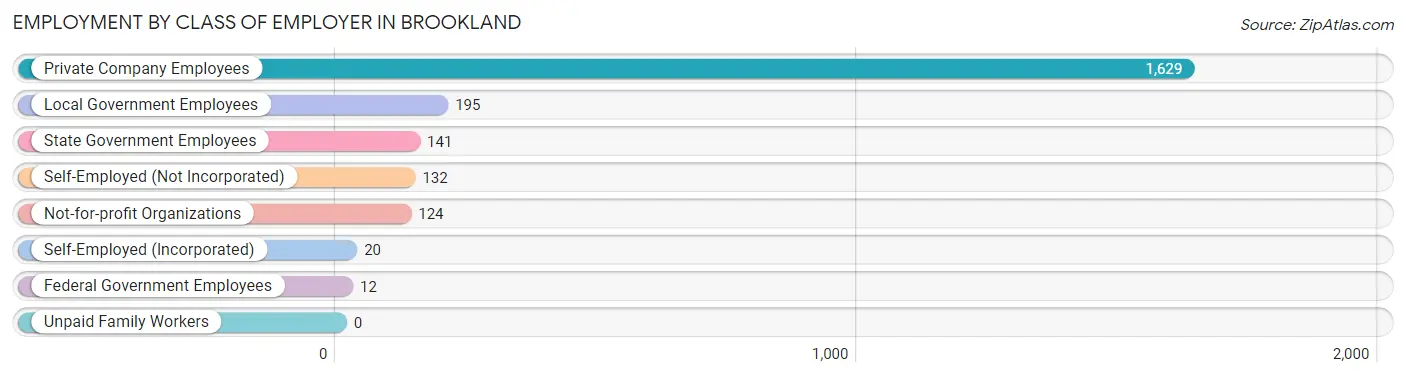
| Employer Class | # Employees | % Employees |
| Private Company Employees | 1,629 | 72.3% |
| Self-Employed (Incorporated) | 20 | 0.9% |
| Self-Employed (Not Incorporated) | 132 | 5.9% |
| Not-for-profit Organizations | 124 | 5.5% |
| Local Government Employees | 195 | 8.7% |
| State Government Employees | 141 | 6.3% |
| Federal Government Employees | 12 | 0.5% |
| Unpaid Family Workers | 0 | 0.0% |
| Total | 2,253 | 100.0% |
Employment Status by Age in Brookland
According to the labor force statistics for Brookland, out of the total population over 16 years of age (2,935), 81.9% or 2,404 individuals are in the labor force, with 5.8% or 139 of them unemployed. The age group with the highest labor force participation rate is 55 to 59 years, with 100.0% or 240 individuals in the labor force. Within the labor force, the 30 to 34 years age range has the highest percentage of unemployed individuals, with 15.6% or 33 of them being unemployed.
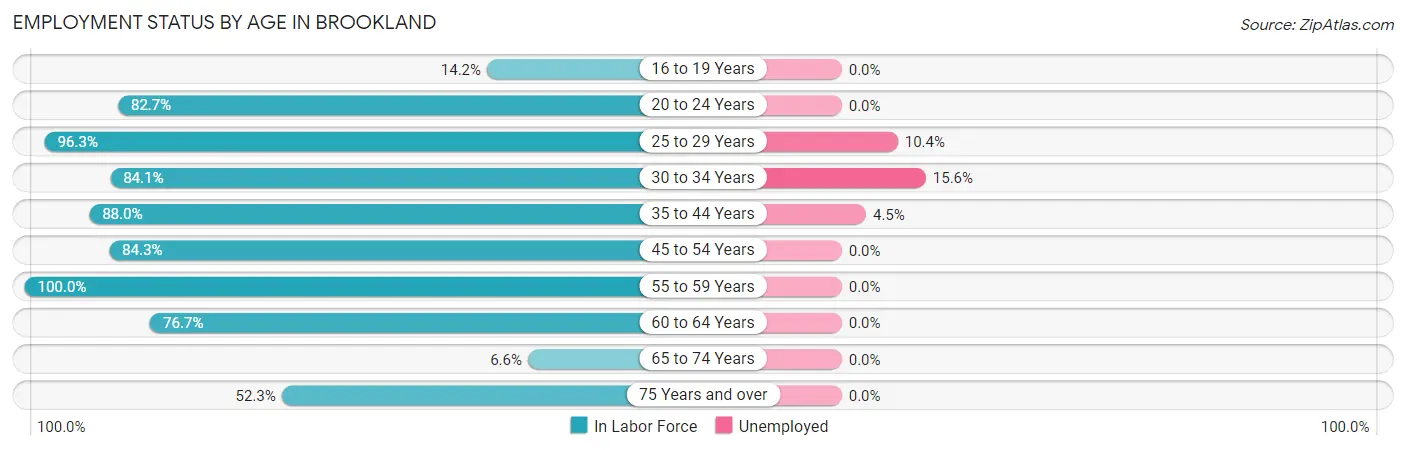
| Age Bracket | In Labor Force | Unemployed |
| 16 to 19 Years | 17 (14.2%) | 0 (0.0%) |
| 20 to 24 Years | 225 (82.7%) | 0 (0.0%) |
| 25 to 29 Years | 855 (96.3%) | 89 (10.4%) |
| 30 to 34 Years | 211 (84.1%) | 33 (15.6%) |
| 35 to 44 Years | 402 (88.0%) | 18 (4.5%) |
| 45 to 54 Years | 273 (84.3%) | 0 (0.0%) |
| 55 to 59 Years | 240 (100.0%) | 0 (0.0%) |
| 60 to 64 Years | 115 (76.7%) | 0 (0.0%) |
| 65 to 74 Years | 8 (6.6%) | 0 (0.0%) |
| 75 Years and over | 58 (52.3%) | 0 (0.0%) |
| Total | 2,404 (81.9%) | 139 (5.8%) |
Employment Status by Educational Attainment in Brookland
According to labor force statistics for Brookland, 90.7% of individuals (2,095) out of the total population between 25 and 64 years of age (2,310) are in the labor force, with 6.7% or 140 of them being unemployed. The group with the highest labor force participation rate are those with the educational attainment of less than high school, with 97.7% or 217 individuals in the labor force. Within the labor force, individuals with college / associate degree education have the highest percentage of unemployment, with 15.6% or 89 of them being unemployed.
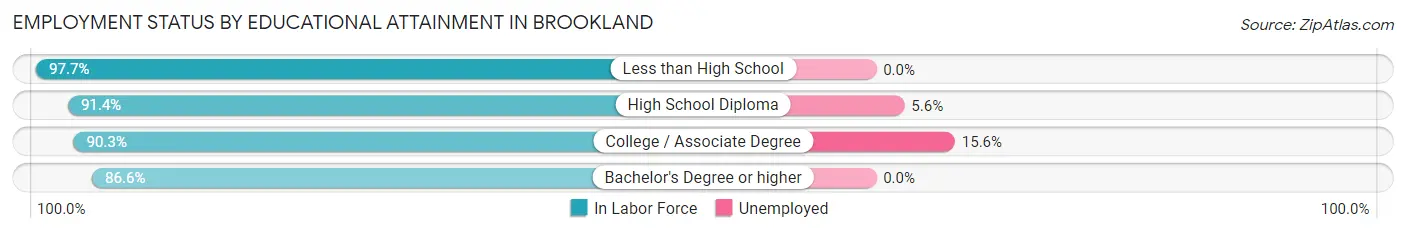
| Educational Attainment | In Labor Force | Unemployed |
| Less than High School | 217 (97.7%) | 0 (0.0%) |
| High School Diploma | 909 (91.4%) | 56 (5.6%) |
| College / Associate Degree | 569 (90.3%) | 98 (15.6%) |
| Bachelor's Degree or higher | 401 (86.6%) | 0 (0.0%) |
| Total | 2,095 (90.7%) | 155 (6.7%) |
Employment Occupations by Sex in Brookland
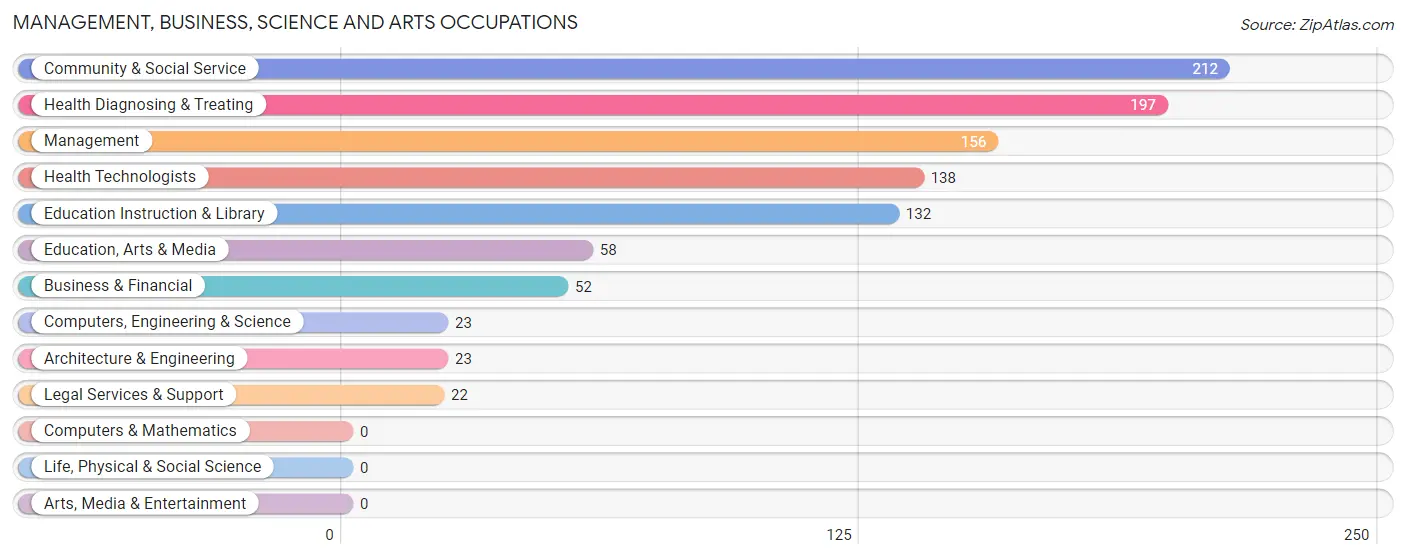
Management, Business, Science and Arts Occupations
The most common Management, Business, Science and Arts occupations in Brookland are Community & Social Service (212 | 9.4%), Health Diagnosing & Treating (197 | 8.7%), Management (156 | 6.9%), Health Technologists (138 | 6.1%), and Education Instruction & Library (132 | 5.8%).
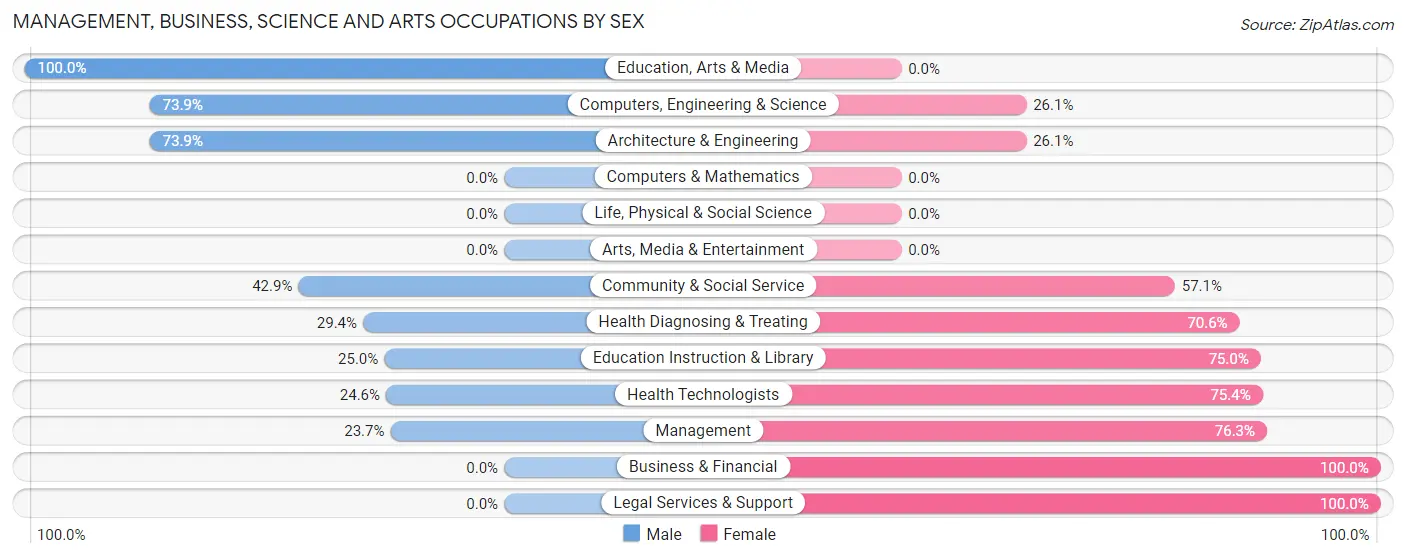
Management, Business, Science and Arts Occupations by Sex
Within the Management, Business, Science and Arts occupations in Brookland, the most male-oriented occupations are Education, Arts & Media (100.0%), Computers, Engineering & Science (73.9%), and Architecture & Engineering (73.9%), while the most female-oriented occupations are Business & Financial (100.0%), Legal Services & Support (100.0%), and Management (76.3%).
| Occupation | Male | Female |
| Management | 37 (23.7%) | 119 (76.3%) |
| Business & Financial | 0 (0.0%) | 52 (100.0%) |
| Computers, Engineering & Science | 17 (73.9%) | 6 (26.1%) |
| Computers & Mathematics | 0 (0.0%) | 0 (0.0%) |
| Architecture & Engineering | 17 (73.9%) | 6 (26.1%) |
| Life, Physical & Social Science | 0 (0.0%) | 0 (0.0%) |
| Community & Social Service | 91 (42.9%) | 121 (57.1%) |
| Education, Arts & Media | 58 (100.0%) | 0 (0.0%) |
| Legal Services & Support | 0 (0.0%) | 22 (100.0%) |
| Education Instruction & Library | 33 (25.0%) | 99 (75.0%) |
| Arts, Media & Entertainment | 0 (0.0%) | 0 (0.0%) |
| Health Diagnosing & Treating | 58 (29.4%) | 139 (70.6%) |
| Health Technologists | 34 (24.6%) | 104 (75.4%) |
| Total (Category) | 203 (31.7%) | 437 (68.3%) |
| Total (Overall) | 1,273 (56.2%) | 991 (43.8%) |
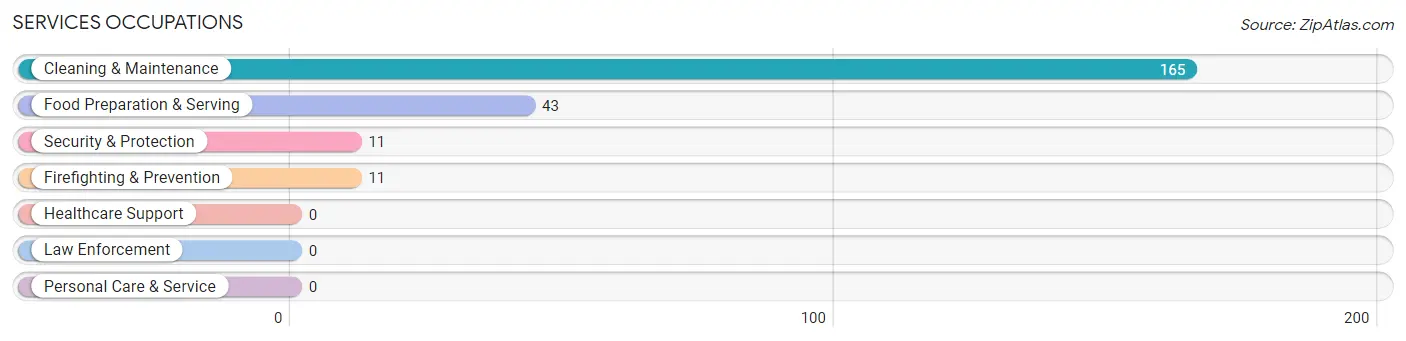
Services Occupations
The most common Services occupations in Brookland are Cleaning & Maintenance (165 | 7.3%), Food Preparation & Serving (43 | 1.9%), Security & Protection (11 | 0.5%), and Firefighting & Prevention (11 | 0.5%).
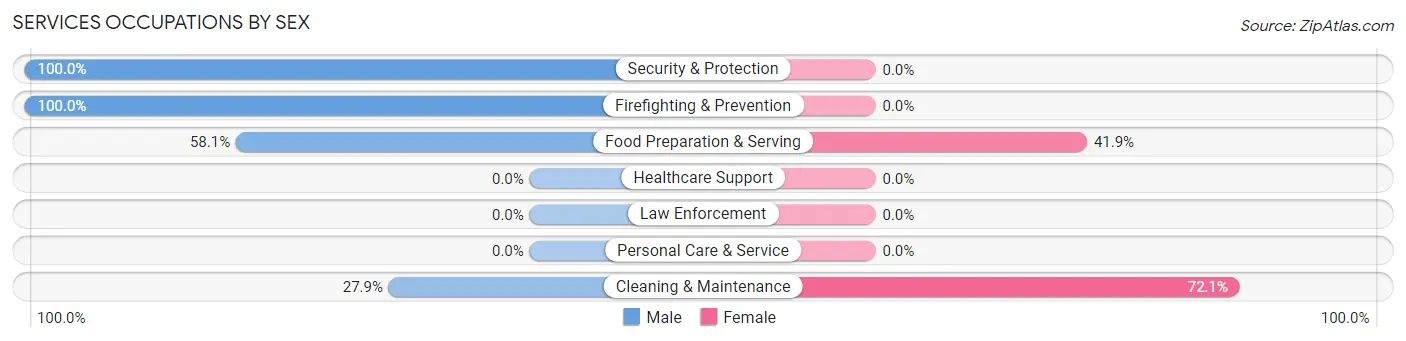
Services Occupations by Sex
Within the Services occupations in Brookland, the most male-oriented occupations are Security & Protection (100.0%), Firefighting & Prevention (100.0%), and Food Preparation & Serving (58.1%), while the most female-oriented occupations are Cleaning & Maintenance (72.1%), and Food Preparation & Serving (41.9%).
| Occupation | Male | Female |
| Healthcare Support | 0 (0.0%) | 0 (0.0%) |
| Security & Protection | 11 (100.0%) | 0 (0.0%) |
| Firefighting & Prevention | 11 (100.0%) | 0 (0.0%) |
| Law Enforcement | 0 (0.0%) | 0 (0.0%) |
| Food Preparation & Serving | 25 (58.1%) | 18 (41.9%) |
| Cleaning & Maintenance | 46 (27.9%) | 119 (72.1%) |
| Personal Care & Service | 0 (0.0%) | 0 (0.0%) |
| Total (Category) | 82 (37.4%) | 137 (62.6%) |
| Total (Overall) | 1,273 (56.2%) | 991 (43.8%) |
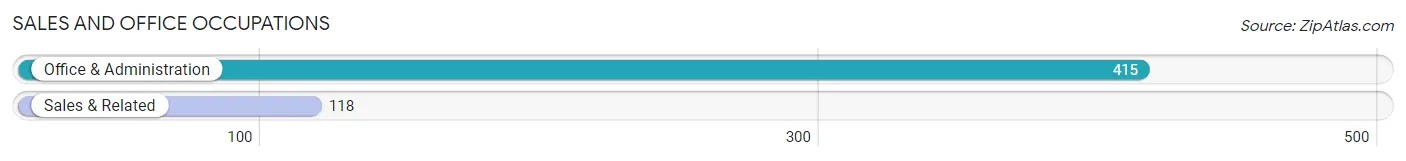
Sales and Office Occupations
The most common Sales and Office occupations in Brookland are Office & Administration (415 | 18.3%), and Sales & Related (118 | 5.2%).
Sales and Office Occupations by Sex
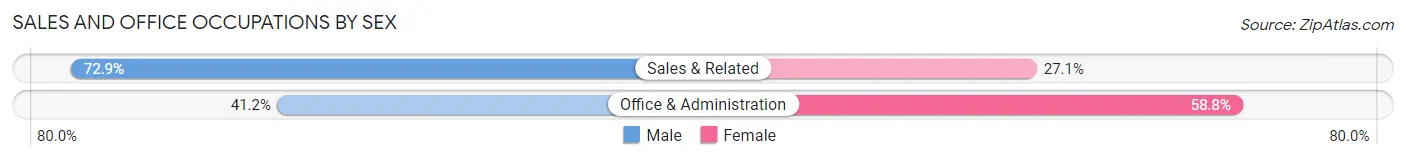
| Occupation | Male | Female |
| Sales & Related | 86 (72.9%) | 32 (27.1%) |
| Office & Administration | 171 (41.2%) | 244 (58.8%) |
| Total (Category) | 257 (48.2%) | 276 (51.8%) |
| Total (Overall) | 1,273 (56.2%) | 991 (43.8%) |
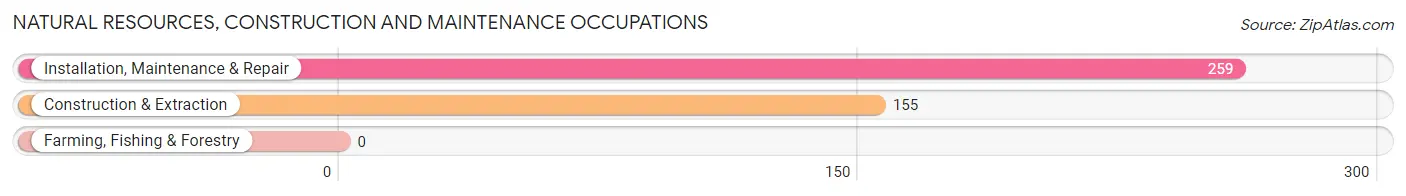
Natural Resources, Construction and Maintenance Occupations
The most common Natural Resources, Construction and Maintenance occupations in Brookland are Installation, Maintenance & Repair (259 | 11.4%), and Construction & Extraction (155 | 6.9%).
Natural Resources, Construction and Maintenance Occupations by Sex
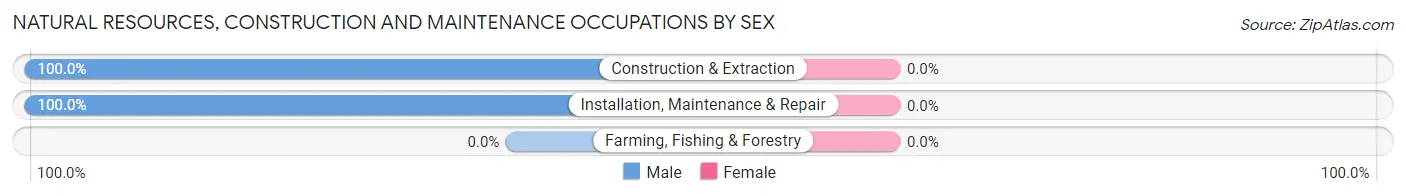
| Occupation | Male | Female |
| Farming, Fishing & Forestry | 0 (0.0%) | 0 (0.0%) |
| Construction & Extraction | 155 (100.0%) | 0 (0.0%) |
| Installation, Maintenance & Repair | 259 (100.0%) | 0 (0.0%) |
| Total (Category) | 414 (100.0%) | 0 (0.0%) |
| Total (Overall) | 1,273 (56.2%) | 991 (43.8%) |
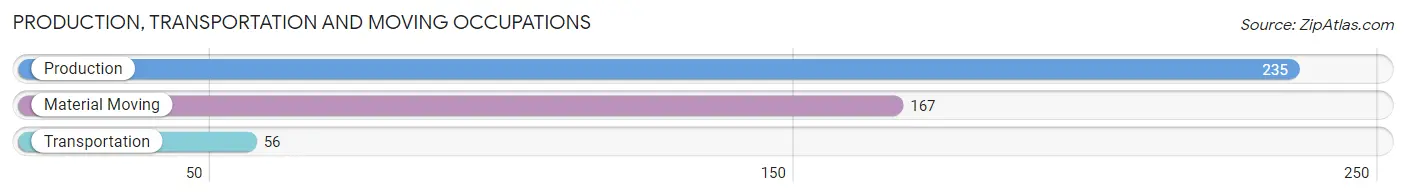
Production, Transportation and Moving Occupations
The most common Production, Transportation and Moving occupations in Brookland are Production (235 | 10.4%), Material Moving (167 | 7.4%), and Transportation (56 | 2.5%).
Production, Transportation and Moving Occupations by Sex
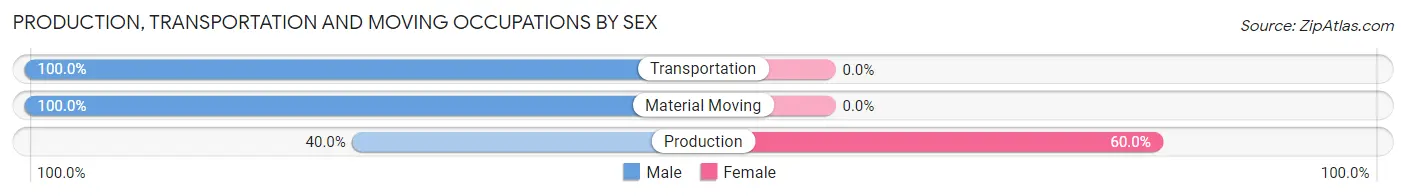
| Occupation | Male | Female |
| Production | 94 (40.0%) | 141 (60.0%) |
| Transportation | 56 (100.0%) | 0 (0.0%) |
| Material Moving | 167 (100.0%) | 0 (0.0%) |
| Total (Category) | 317 (69.2%) | 141 (30.8%) |
| Total (Overall) | 1,273 (56.2%) | 991 (43.8%) |
Employment Industries by Sex in Brookland
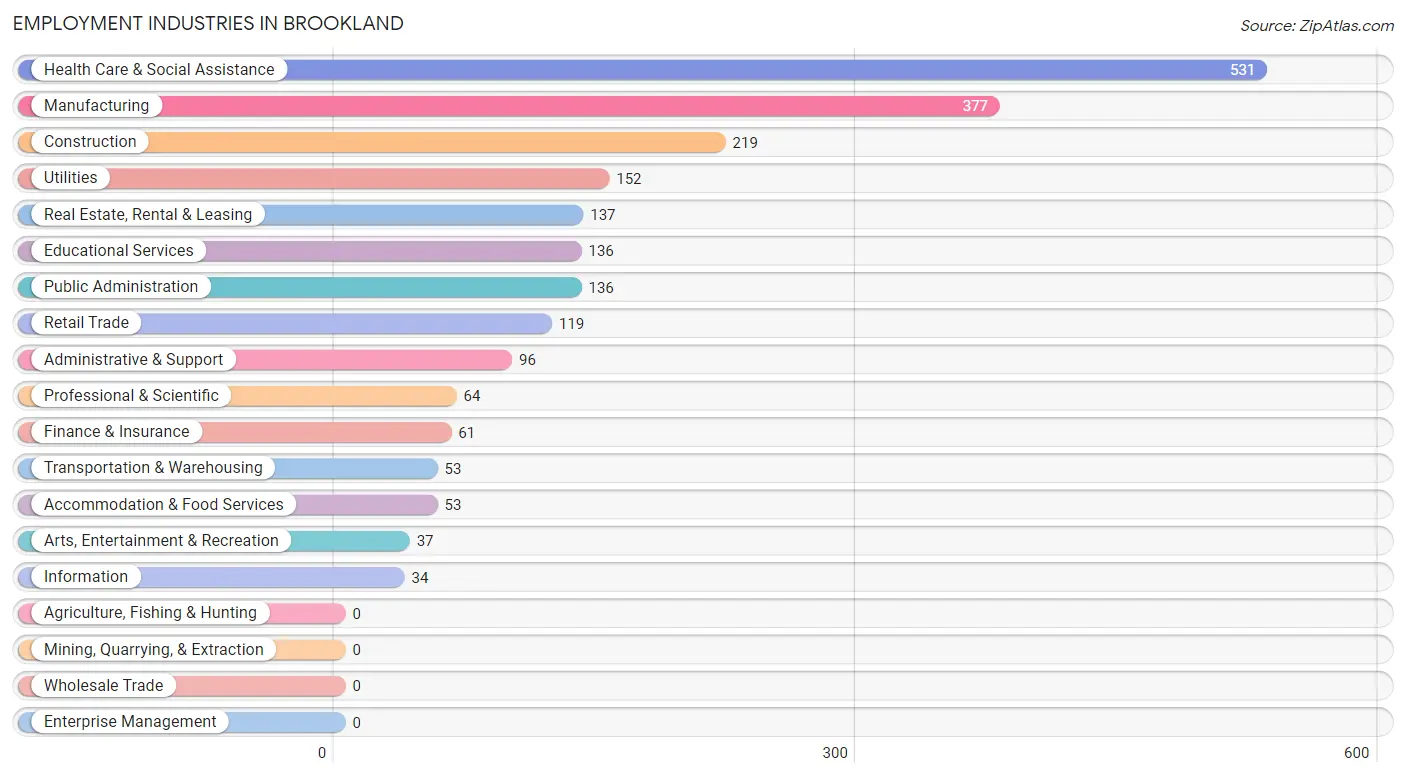
Employment Industries in Brookland
The major employment industries in Brookland include Health Care & Social Assistance (531 | 23.4%), Manufacturing (377 | 16.7%), Construction (219 | 9.7%), Utilities (152 | 6.7%), and Real Estate, Rental & Leasing (137 | 6.0%).
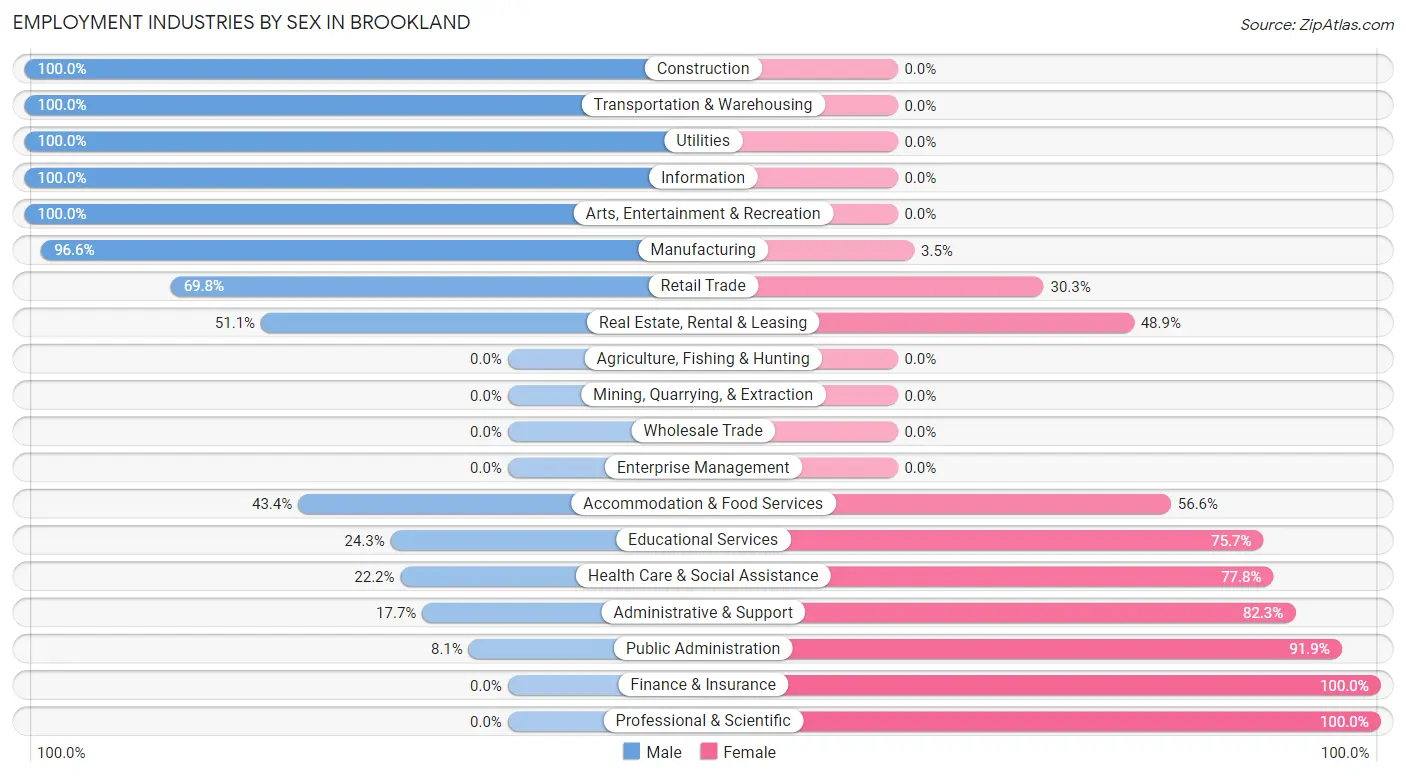
Employment Industries by Sex in Brookland
The Brookland industries that see more men than women are Construction (100.0%), Transportation & Warehousing (100.0%), and Utilities (100.0%), whereas the industries that tend to have a higher number of women are Finance & Insurance (100.0%), Professional & Scientific (100.0%), and Public Administration (91.9%).
| Industry | Male | Female |
| Agriculture, Fishing & Hunting | 0 (0.0%) | 0 (0.0%) |
| Mining, Quarrying, & Extraction | 0 (0.0%) | 0 (0.0%) |
| Construction | 219 (100.0%) | 0 (0.0%) |
| Manufacturing | 364 (96.6%) | 13 (3.5%) |
| Wholesale Trade | 0 (0.0%) | 0 (0.0%) |
| Retail Trade | 83 (69.8%) | 36 (30.2%) |
| Transportation & Warehousing | 53 (100.0%) | 0 (0.0%) |
| Utilities | 152 (100.0%) | 0 (0.0%) |
| Information | 34 (100.0%) | 0 (0.0%) |
| Finance & Insurance | 0 (0.0%) | 61 (100.0%) |
| Real Estate, Rental & Leasing | 70 (51.1%) | 67 (48.9%) |
| Professional & Scientific | 0 (0.0%) | 64 (100.0%) |
| Enterprise Management | 0 (0.0%) | 0 (0.0%) |
| Administrative & Support | 17 (17.7%) | 79 (82.3%) |
| Educational Services | 33 (24.3%) | 103 (75.7%) |
| Health Care & Social Assistance | 118 (22.2%) | 413 (77.8%) |
| Arts, Entertainment & Recreation | 37 (100.0%) | 0 (0.0%) |
| Accommodation & Food Services | 23 (43.4%) | 30 (56.6%) |
| Public Administration | 11 (8.1%) | 125 (91.9%) |
| Total | 1,273 (56.2%) | 991 (43.8%) |
Education in Brookland
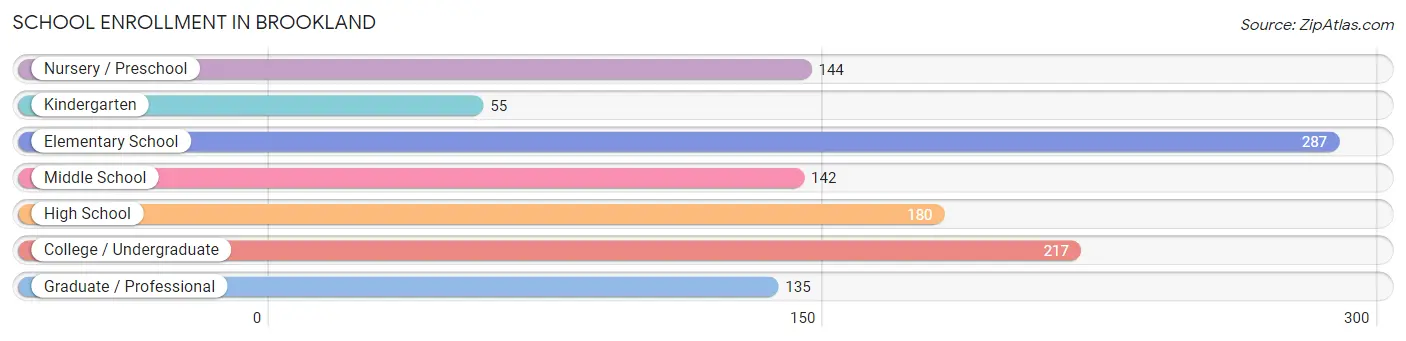
School Enrollment in Brookland
The most common levels of schooling among the 1,160 students in Brookland are elementary school (287 | 24.7%), college / undergraduate (217 | 18.7%), and high school (180 | 15.5%).
| School Level | # Students | % Students |
| Nursery / Preschool | 144 | 12.4% |
| Kindergarten | 55 | 4.7% |
| Elementary School | 287 | 24.7% |
| Middle School | 142 | 12.2% |
| High School | 180 | 15.5% |
| College / Undergraduate | 217 | 18.7% |
| Graduate / Professional | 135 | 11.6% |
| Total | 1,160 | 100.0% |
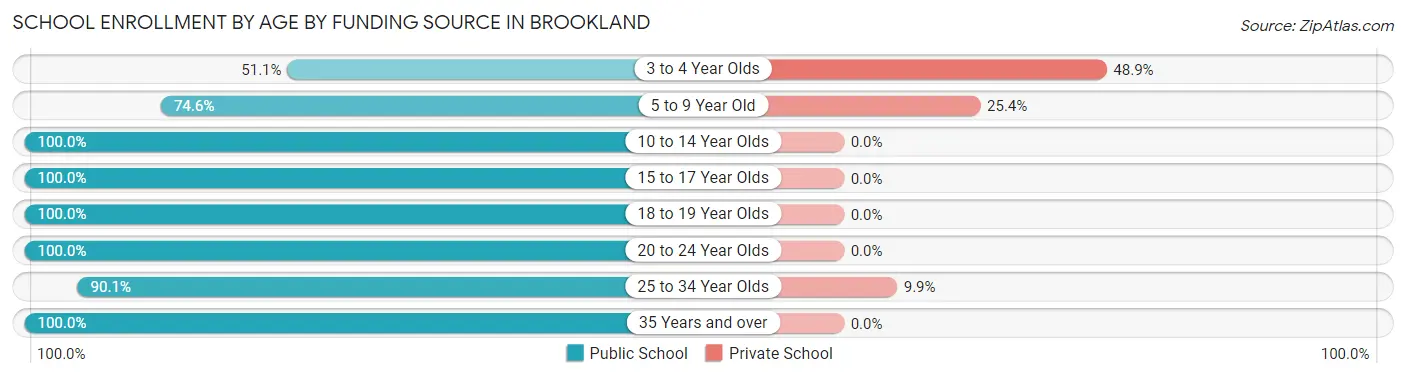
School Enrollment by Age by Funding Source in Brookland
Out of a total of 1,160 students who are enrolled in schools in Brookland, 128 (11.0%) attend a private institution, while the remaining 1,032 (89.0%) are enrolled in public schools. The age group of 3 to 4 year olds has the highest likelihood of being enrolled in private schools, with 23 (48.9% in the age bracket) enrolled. Conversely, the age group of 10 to 14 year olds has the lowest likelihood of being enrolled in a private school, with 278 (100.0% in the age bracket) attending a public institution.
| Age Bracket | Public School | Private School |
| 3 to 4 Year Olds | 24 (51.1%) | 23 (48.9%) |
| 5 to 9 Year Old | 226 (74.6%) | 77 (25.4%) |
| 10 to 14 Year Olds | 278 (100.0%) | 0 (0.0%) |
| 15 to 17 Year Olds | 142 (100.0%) | 0 (0.0%) |
| 18 to 19 Year Olds | 18 (100.0%) | 0 (0.0%) |
| 20 to 24 Year Olds | 73 (100.0%) | 0 (0.0%) |
| 25 to 34 Year Olds | 255 (90.1%) | 28 (9.9%) |
| 35 Years and over | 16 (100.0%) | 0 (0.0%) |
| Total | 1,032 (89.0%) | 128 (11.0%) |
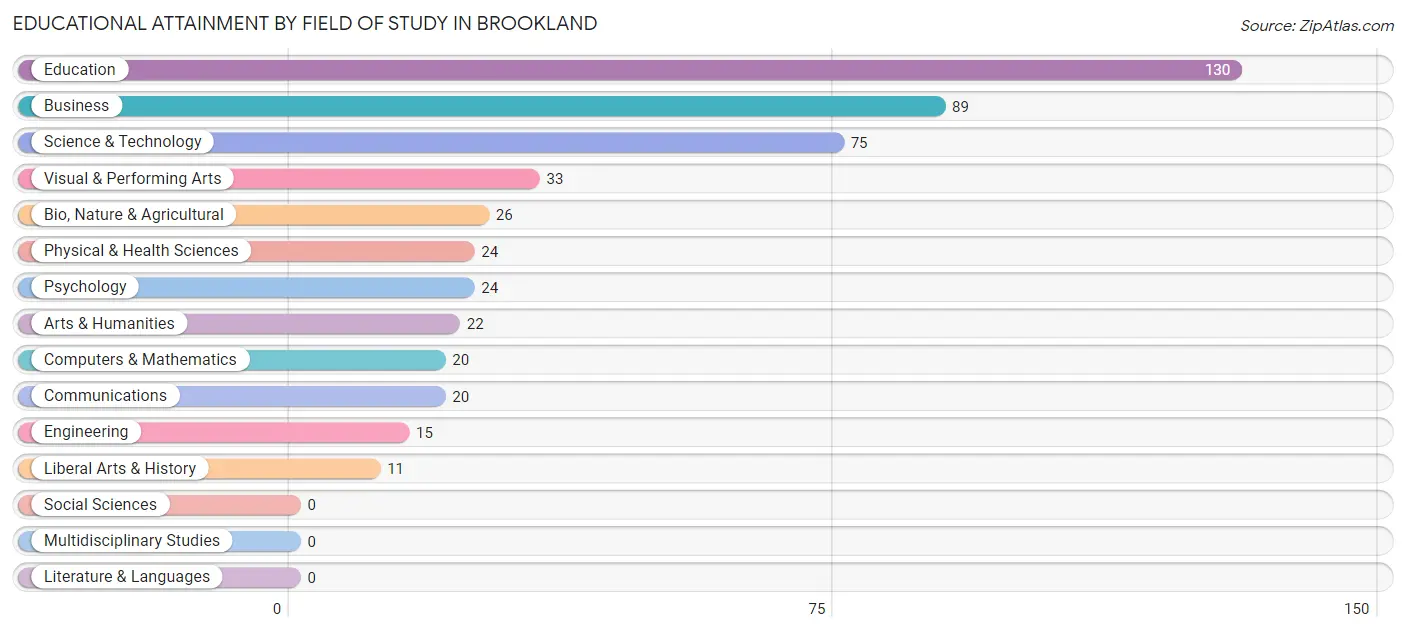
Educational Attainment by Field of Study in Brookland
Education (130 | 26.6%), business (89 | 18.2%), science & technology (75 | 15.3%), visual & performing arts (33 | 6.8%), and bio, nature & agricultural (26 | 5.3%) are the most common fields of study among 489 individuals in Brookland who have obtained a bachelor's degree or higher.
| Field of Study | # Graduates | % Graduates |
| Computers & Mathematics | 20 | 4.1% |
| Bio, Nature & Agricultural | 26 | 5.3% |
| Physical & Health Sciences | 24 | 4.9% |
| Psychology | 24 | 4.9% |
| Social Sciences | 0 | 0.0% |
| Engineering | 15 | 3.1% |
| Multidisciplinary Studies | 0 | 0.0% |
| Science & Technology | 75 | 15.3% |
| Business | 89 | 18.2% |
| Education | 130 | 26.6% |
| Literature & Languages | 0 | 0.0% |
| Liberal Arts & History | 11 | 2.2% |
| Visual & Performing Arts | 33 | 6.8% |
| Communications | 20 | 4.1% |
| Arts & Humanities | 22 | 4.5% |
| Total | 489 | 100.0% |
Transportation & Commute in Brookland
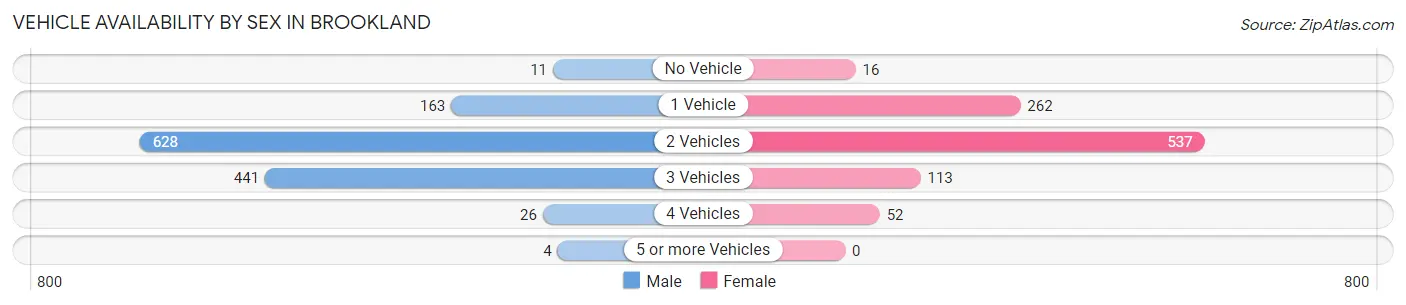
Vehicle Availability by Sex in Brookland
The most prevalent vehicle ownership categories in Brookland are males with 2 vehicles (628, accounting for 49.3%) and females with 2 vehicles (537, making up 64.1%).
| Vehicles Available | Male | Female |
| No Vehicle | 11 (0.9%) | 16 (1.6%) |
| 1 Vehicle | 163 (12.8%) | 262 (26.7%) |
| 2 Vehicles | 628 (49.3%) | 537 (54.8%) |
| 3 Vehicles | 441 (34.6%) | 113 (11.5%) |
| 4 Vehicles | 26 (2.0%) | 52 (5.3%) |
| 5 or more Vehicles | 4 (0.3%) | 0 (0.0%) |
| Total | 1,273 (100.0%) | 980 (100.0%) |
Commute Time in Brookland
The most frequently occuring commute durations in Brookland are 15 to 19 minutes (699 commuters, 31.8%), 20 to 24 minutes (532 commuters, 24.2%), and 25 to 29 minutes (299 commuters, 13.6%).
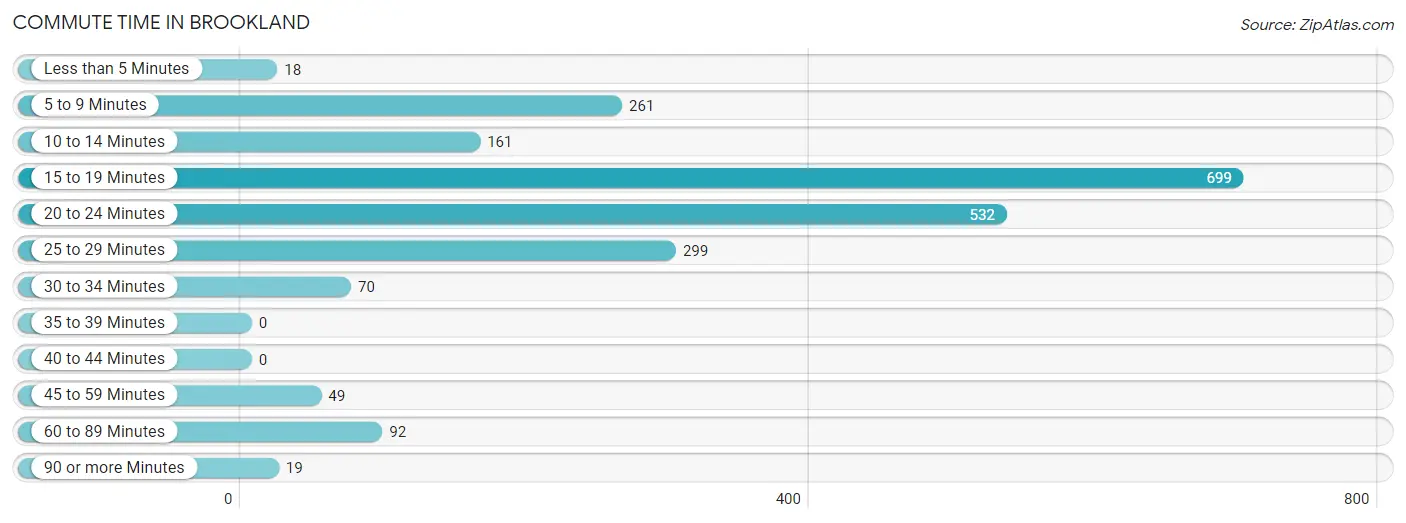
| Commute Time | # Commuters | % Commuters |
| Less than 5 Minutes | 18 | 0.8% |
| 5 to 9 Minutes | 261 | 11.9% |
| 10 to 14 Minutes | 161 | 7.3% |
| 15 to 19 Minutes | 699 | 31.8% |
| 20 to 24 Minutes | 532 | 24.2% |
| 25 to 29 Minutes | 299 | 13.6% |
| 30 to 34 Minutes | 70 | 3.2% |
| 35 to 39 Minutes | 0 | 0.0% |
| 40 to 44 Minutes | 0 | 0.0% |
| 45 to 59 Minutes | 49 | 2.2% |
| 60 to 89 Minutes | 92 | 4.2% |
| 90 or more Minutes | 19 | 0.9% |
Commute Time by Sex in Brookland
The most common commute times in Brookland are 15 to 19 minutes (469 commuters, 37.3%) for males and 25 to 29 minutes (291 commuters, 30.8%) for females.
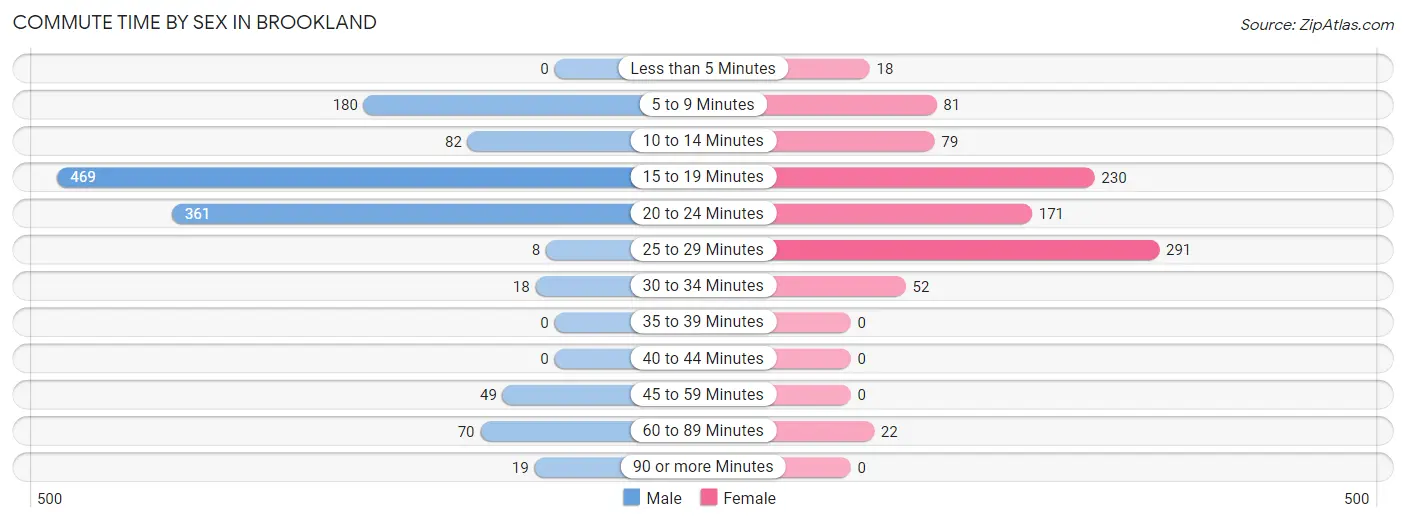
| Commute Time | Male | Female |
| Less than 5 Minutes | 0 (0.0%) | 18 (1.9%) |
| 5 to 9 Minutes | 180 (14.3%) | 81 (8.6%) |
| 10 to 14 Minutes | 82 (6.5%) | 79 (8.4%) |
| 15 to 19 Minutes | 469 (37.3%) | 230 (24.4%) |
| 20 to 24 Minutes | 361 (28.7%) | 171 (18.1%) |
| 25 to 29 Minutes | 8 (0.6%) | 291 (30.8%) |
| 30 to 34 Minutes | 18 (1.4%) | 52 (5.5%) |
| 35 to 39 Minutes | 0 (0.0%) | 0 (0.0%) |
| 40 to 44 Minutes | 0 (0.0%) | 0 (0.0%) |
| 45 to 59 Minutes | 49 (3.9%) | 0 (0.0%) |
| 60 to 89 Minutes | 70 (5.6%) | 22 (2.3%) |
| 90 or more Minutes | 19 (1.5%) | 0 (0.0%) |
Time of Departure to Work by Sex in Brookland
The most frequent times of departure to work in Brookland are 7:30 AM to 7:59 AM (352, 28.0%) for males and 7:00 AM to 7:29 AM (235, 24.9%) for females.
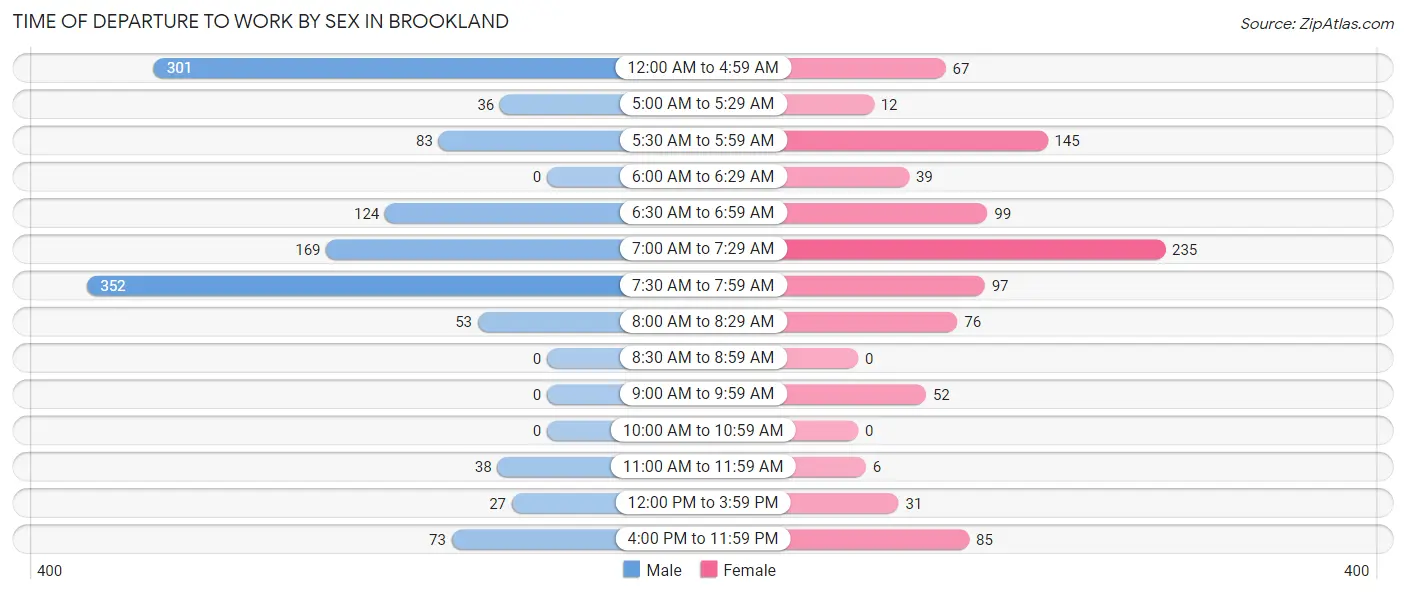
| Time of Departure | Male | Female |
| 12:00 AM to 4:59 AM | 301 (24.0%) | 67 (7.1%) |
| 5:00 AM to 5:29 AM | 36 (2.9%) | 12 (1.3%) |
| 5:30 AM to 5:59 AM | 83 (6.6%) | 145 (15.4%) |
| 6:00 AM to 6:29 AM | 0 (0.0%) | 39 (4.1%) |
| 6:30 AM to 6:59 AM | 124 (9.9%) | 99 (10.5%) |
| 7:00 AM to 7:29 AM | 169 (13.5%) | 235 (24.9%) |
| 7:30 AM to 7:59 AM | 352 (28.0%) | 97 (10.3%) |
| 8:00 AM to 8:29 AM | 53 (4.2%) | 76 (8.1%) |
| 8:30 AM to 8:59 AM | 0 (0.0%) | 0 (0.0%) |
| 9:00 AM to 9:59 AM | 0 (0.0%) | 52 (5.5%) |
| 10:00 AM to 10:59 AM | 0 (0.0%) | 0 (0.0%) |
| 11:00 AM to 11:59 AM | 38 (3.0%) | 6 (0.6%) |
| 12:00 PM to 3:59 PM | 27 (2.1%) | 31 (3.3%) |
| 4:00 PM to 11:59 PM | 73 (5.8%) | 85 (9.0%) |
| Total | 1,256 (100.0%) | 944 (100.0%) |
Housing Occupancy in Brookland
Occupancy by Ownership in Brookland
Of the total 1,491 dwellings in Brookland, owner-occupied units account for 756 (50.7%), while renter-occupied units make up 735 (49.3%).
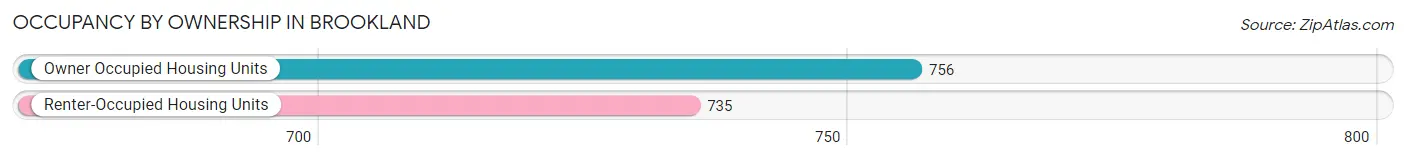
| Occupancy | # Housing Units | % Housing Units |
| Owner Occupied Housing Units | 756 | 50.7% |
| Renter-Occupied Housing Units | 735 | 49.3% |
| Total Occupied Housing Units | 1,491 | 100.0% |
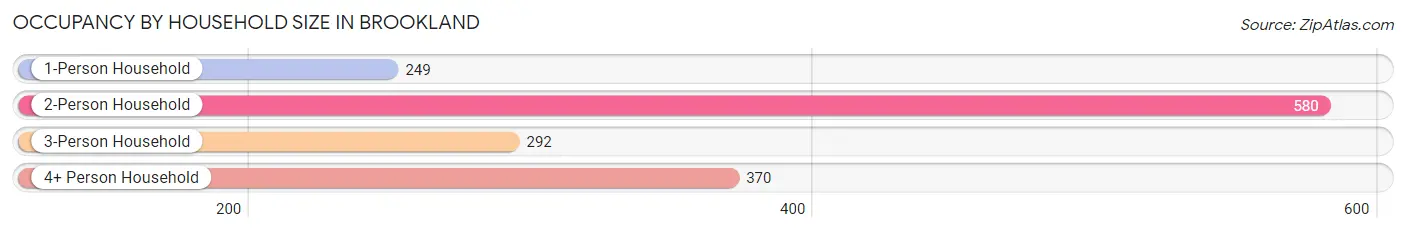
Occupancy by Household Size in Brookland
| Household Size | # Housing Units | % Housing Units |
| 1-Person Household | 249 | 16.7% |
| 2-Person Household | 580 | 38.9% |
| 3-Person Household | 292 | 19.6% |
| 4+ Person Household | 370 | 24.8% |
| Total Housing Units | 1,491 | 100.0% |
Occupancy by Ownership by Household Size in Brookland
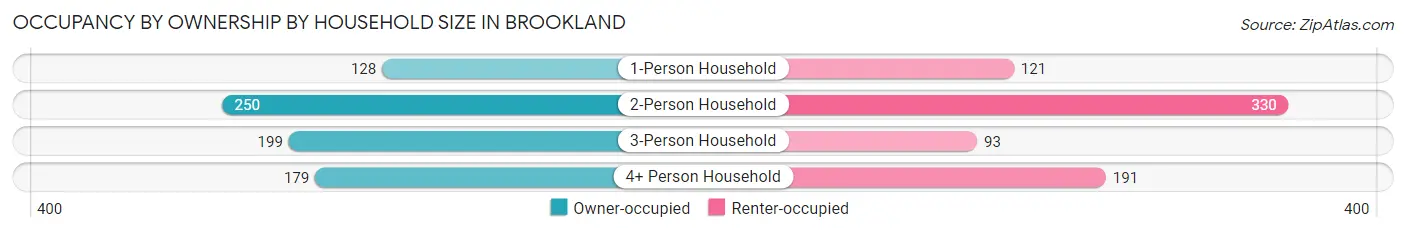
| Household Size | Owner-occupied | Renter-occupied |
| 1-Person Household | 128 (51.4%) | 121 (48.6%) |
| 2-Person Household | 250 (43.1%) | 330 (56.9%) |
| 3-Person Household | 199 (68.1%) | 93 (31.9%) |
| 4+ Person Household | 179 (48.4%) | 191 (51.6%) |
| Total Housing Units | 756 (50.7%) | 735 (49.3%) |
Occupancy by Educational Attainment in Brookland
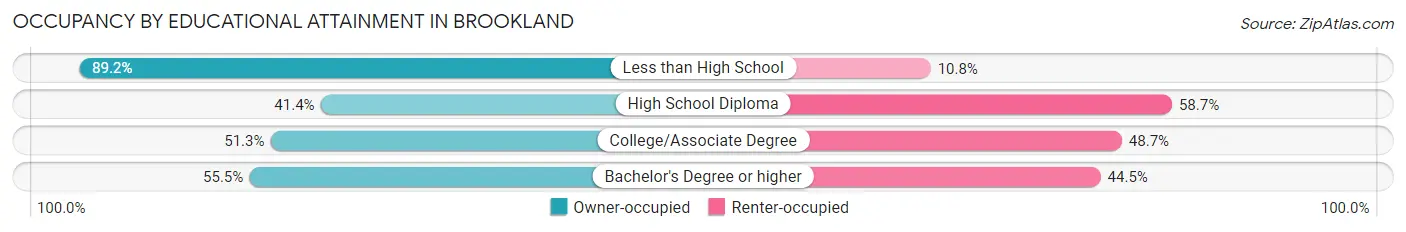
| Household Size | Owner-occupied | Renter-occupied |
| Less than High School | 99 (89.2%) | 12 (10.8%) |
| High School Diploma | 270 (41.3%) | 383 (58.7%) |
| College/Associate Degree | 200 (51.3%) | 190 (48.7%) |
| Bachelor's Degree or higher | 187 (55.5%) | 150 (44.5%) |
Occupancy by Age of Householder in Brookland
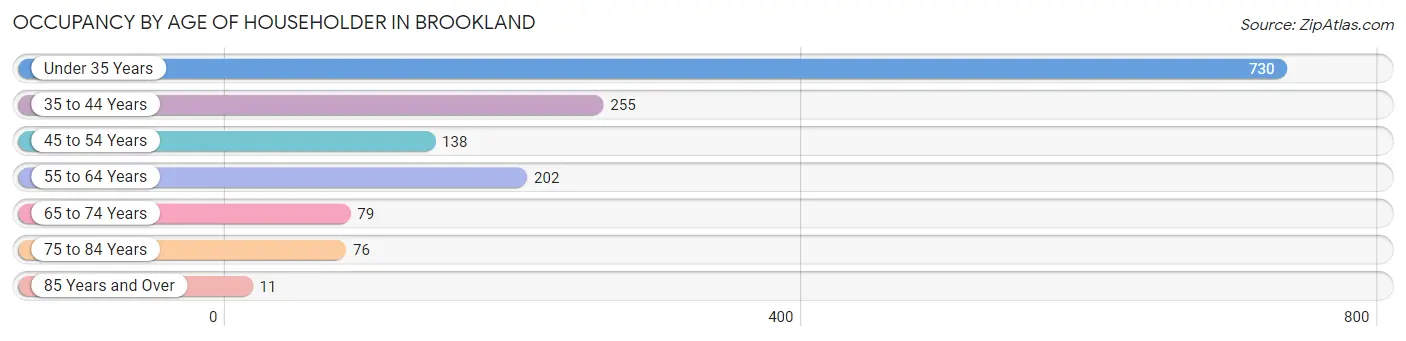
| Age Bracket | # Households | % Households |
| Under 35 Years | 730 | 49.0% |
| 35 to 44 Years | 255 | 17.1% |
| 45 to 54 Years | 138 | 9.3% |
| 55 to 64 Years | 202 | 13.6% |
| 65 to 74 Years | 79 | 5.3% |
| 75 to 84 Years | 76 | 5.1% |
| 85 Years and Over | 11 | 0.7% |
| Total | 1,491 | 100.0% |
Housing Finances in Brookland
Median Income by Occupancy in Brookland
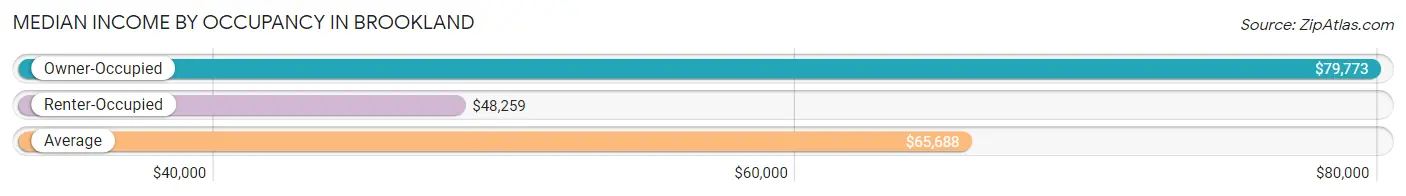
| Occupancy Type | # Households | Median Income |
| Owner-Occupied | 756 (50.7%) | $79,773 |
| Renter-Occupied | 735 (49.3%) | $48,259 |
| Average | 1,491 (100.0%) | $65,688 |
Occupancy by Householder Income Bracket in Brookland
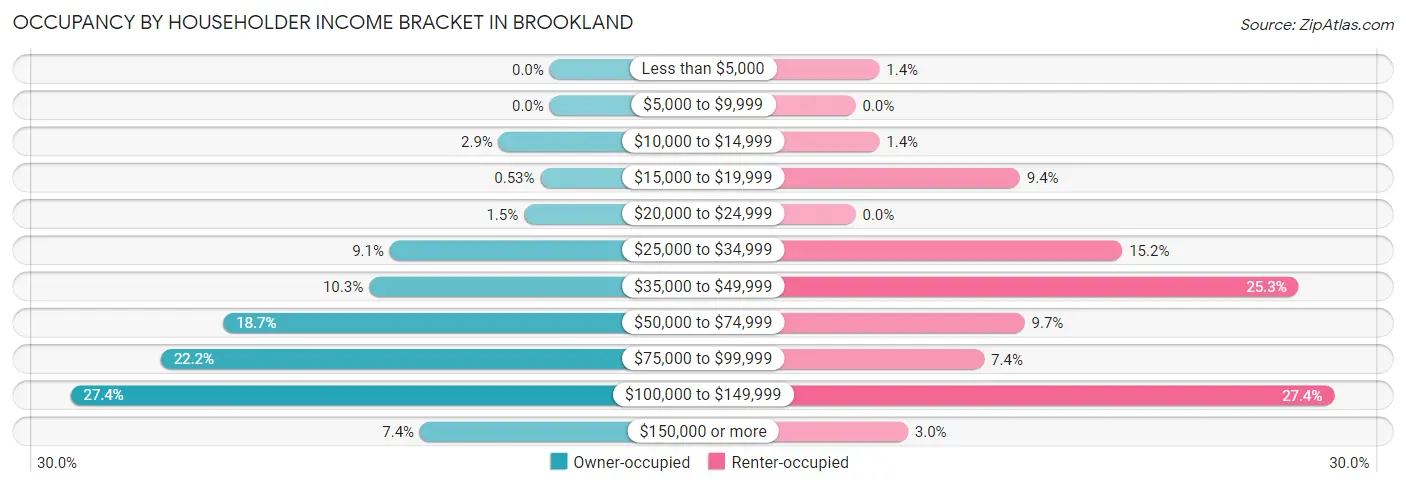
| Income Bracket | Owner-occupied | Renter-occupied |
| Less than $5,000 | 0 (0.0%) | 10 (1.4%) |
| $5,000 to $9,999 | 0 (0.0%) | 0 (0.0%) |
| $10,000 to $14,999 | 22 (2.9%) | 10 (1.4%) |
| $15,000 to $19,999 | 4 (0.5%) | 69 (9.4%) |
| $20,000 to $24,999 | 11 (1.5%) | 0 (0.0%) |
| $25,000 to $34,999 | 69 (9.1%) | 112 (15.2%) |
| $35,000 to $49,999 | 78 (10.3%) | 186 (25.3%) |
| $50,000 to $74,999 | 141 (18.6%) | 71 (9.7%) |
| $75,000 to $99,999 | 168 (22.2%) | 54 (7.3%) |
| $100,000 to $149,999 | 207 (27.4%) | 201 (27.4%) |
| $150,000 or more | 56 (7.4%) | 22 (3.0%) |
| Total | 756 (100.0%) | 735 (100.0%) |
Monthly Housing Cost Tiers in Brookland
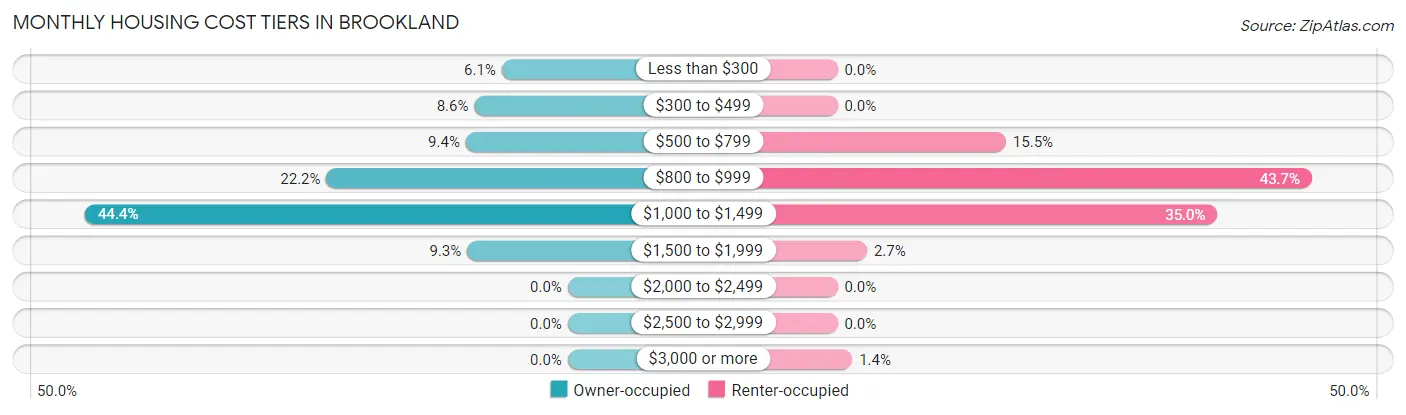
| Monthly Cost | Owner-occupied | Renter-occupied |
| Less than $300 | 46 (6.1%) | 0 (0.0%) |
| $300 to $499 | 65 (8.6%) | 0 (0.0%) |
| $500 to $799 | 71 (9.4%) | 114 (15.5%) |
| $800 to $999 | 168 (22.2%) | 321 (43.7%) |
| $1,000 to $1,499 | 336 (44.4%) | 257 (35.0%) |
| $1,500 to $1,999 | 70 (9.3%) | 20 (2.7%) |
| $2,000 to $2,499 | 0 (0.0%) | 0 (0.0%) |
| $2,500 to $2,999 | 0 (0.0%) | 0 (0.0%) |
| $3,000 or more | 0 (0.0%) | 10 (1.4%) |
| Total | 756 (100.0%) | 735 (100.0%) |
Physical Housing Characteristics in Brookland
Housing Structures in Brookland
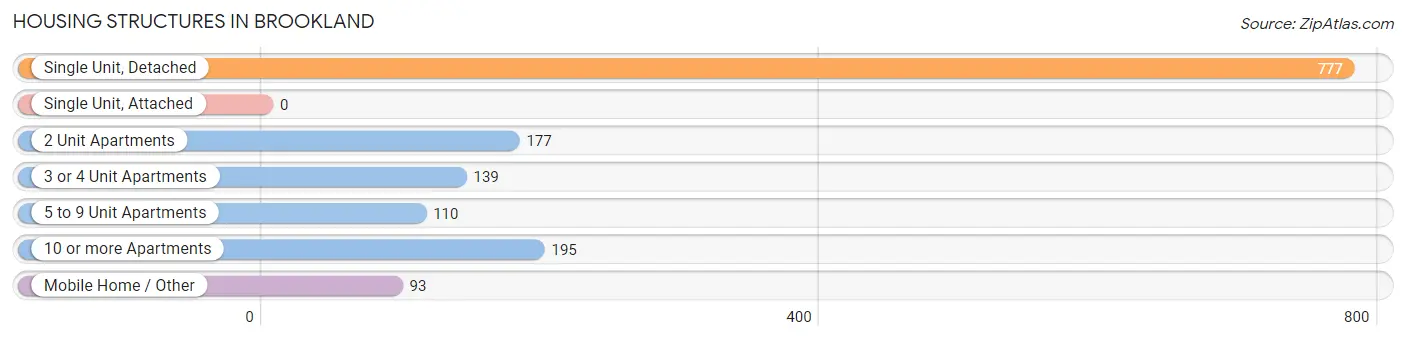
| Structure Type | # Housing Units | % Housing Units |
| Single Unit, Detached | 777 | 52.1% |
| Single Unit, Attached | 0 | 0.0% |
| 2 Unit Apartments | 177 | 11.9% |
| 3 or 4 Unit Apartments | 139 | 9.3% |
| 5 to 9 Unit Apartments | 110 | 7.4% |
| 10 or more Apartments | 195 | 13.1% |
| Mobile Home / Other | 93 | 6.2% |
| Total | 1,491 | 100.0% |
Housing Structures by Occupancy in Brookland
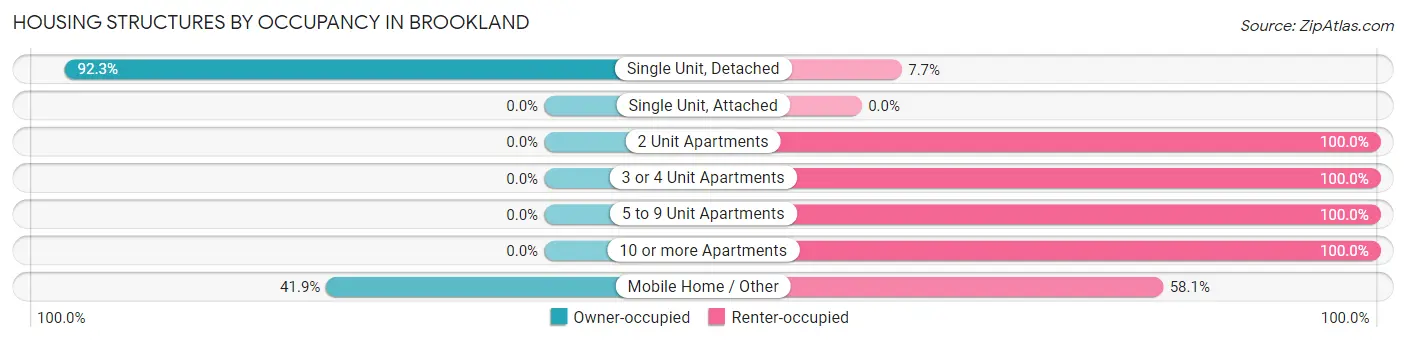
| Structure Type | Owner-occupied | Renter-occupied |
| Single Unit, Detached | 717 (92.3%) | 60 (7.7%) |
| Single Unit, Attached | 0 (0.0%) | 0 (0.0%) |
| 2 Unit Apartments | 0 (0.0%) | 177 (100.0%) |
| 3 or 4 Unit Apartments | 0 (0.0%) | 139 (100.0%) |
| 5 to 9 Unit Apartments | 0 (0.0%) | 110 (100.0%) |
| 10 or more Apartments | 0 (0.0%) | 195 (100.0%) |
| Mobile Home / Other | 39 (41.9%) | 54 (58.1%) |
| Total | 756 (50.7%) | 735 (49.3%) |
Housing Structures by Number of Rooms in Brookland
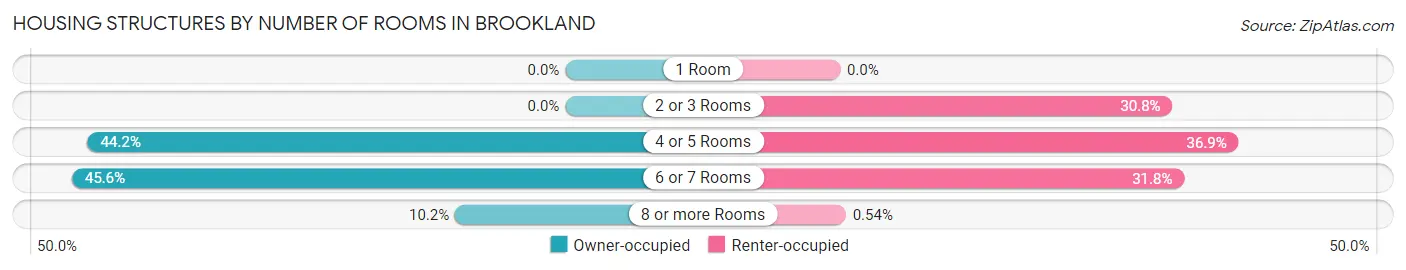
| Number of Rooms | Owner-occupied | Renter-occupied |
| 1 Room | 0 (0.0%) | 0 (0.0%) |
| 2 or 3 Rooms | 0 (0.0%) | 226 (30.7%) |
| 4 or 5 Rooms | 334 (44.2%) | 271 (36.9%) |
| 6 or 7 Rooms | 345 (45.6%) | 234 (31.8%) |
| 8 or more Rooms | 77 (10.2%) | 4 (0.5%) |
| Total | 756 (100.0%) | 735 (100.0%) |
Housing Structure by Heating Type in Brookland
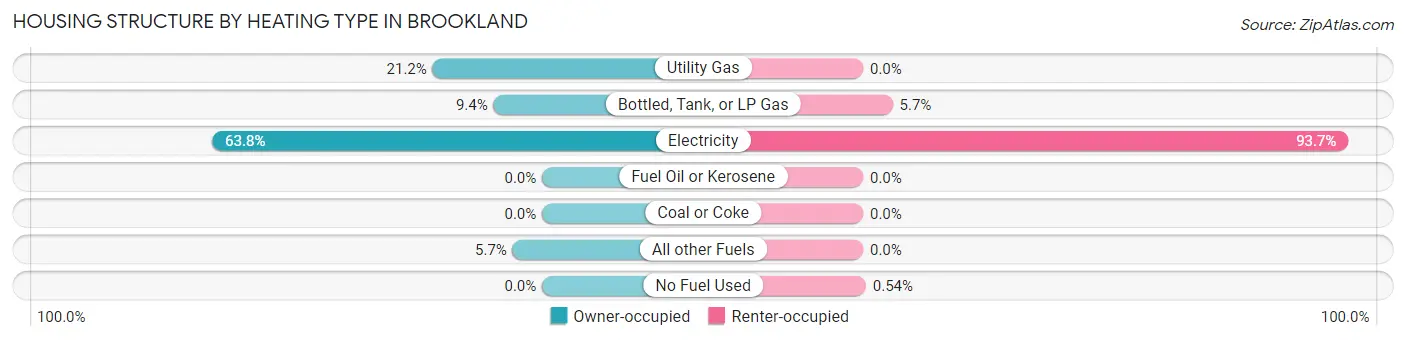
| Heating Type | Owner-occupied | Renter-occupied |
| Utility Gas | 160 (21.2%) | 0 (0.0%) |
| Bottled, Tank, or LP Gas | 71 (9.4%) | 42 (5.7%) |
| Electricity | 482 (63.8%) | 689 (93.7%) |
| Fuel Oil or Kerosene | 0 (0.0%) | 0 (0.0%) |
| Coal or Coke | 0 (0.0%) | 0 (0.0%) |
| All other Fuels | 43 (5.7%) | 0 (0.0%) |
| No Fuel Used | 0 (0.0%) | 4 (0.5%) |
| Total | 756 (100.0%) | 735 (100.0%) |
Household Vehicle Usage in Brookland
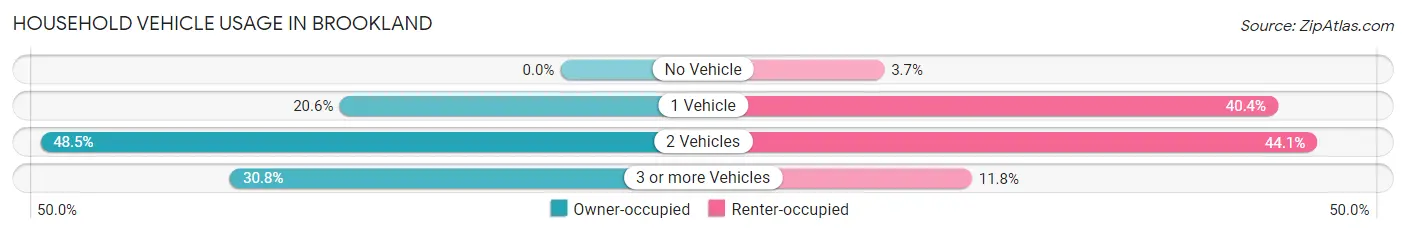
| Vehicles per Household | Owner-occupied | Renter-occupied |
| No Vehicle | 0 (0.0%) | 27 (3.7%) |
| 1 Vehicle | 156 (20.6%) | 297 (40.4%) |
| 2 Vehicles | 367 (48.5%) | 324 (44.1%) |
| 3 or more Vehicles | 233 (30.8%) | 87 (11.8%) |
| Total | 756 (100.0%) | 735 (100.0%) |
Real Estate & Mortgages in Brookland
Real Estate and Mortgage Overview in Brookland
| Characteristic | Without Mortgage | With Mortgage |
| Housing Units | 186 | 570 |
| Median Property Value | $98,600 | $153,500 |
| Median Household Income | $52,016 | $41 |
| Monthly Housing Costs | $447 | $0 |
| Real Estate Taxes | $633 | $15 |
Property Value by Mortgage Status in Brookland
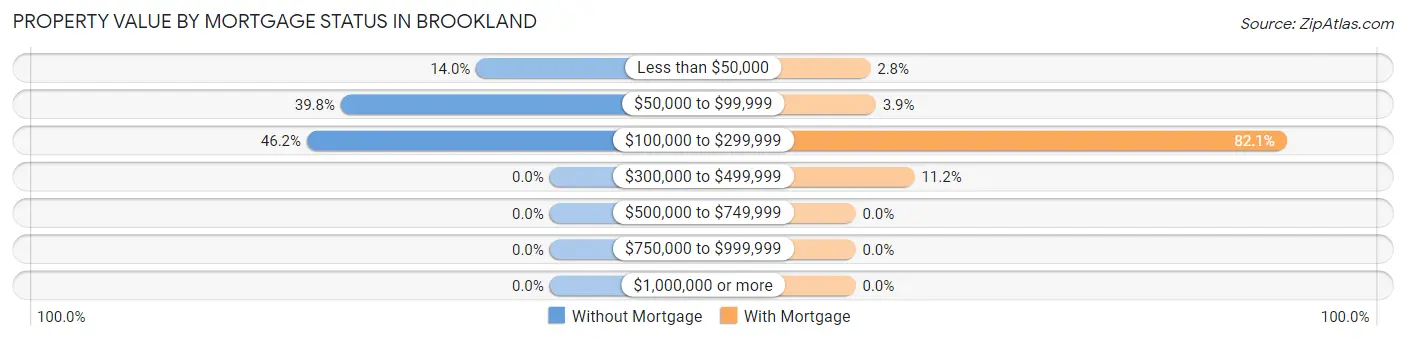
| Property Value | Without Mortgage | With Mortgage |
| Less than $50,000 | 26 (14.0%) | 16 (2.8%) |
| $50,000 to $99,999 | 74 (39.8%) | 22 (3.9%) |
| $100,000 to $299,999 | 86 (46.2%) | 468 (82.1%) |
| $300,000 to $499,999 | 0 (0.0%) | 64 (11.2%) |
| $500,000 to $749,999 | 0 (0.0%) | 0 (0.0%) |
| $750,000 to $999,999 | 0 (0.0%) | 0 (0.0%) |
| $1,000,000 or more | 0 (0.0%) | 0 (0.0%) |
| Total | 186 (100.0%) | 570 (100.0%) |
Household Income by Mortgage Status in Brookland
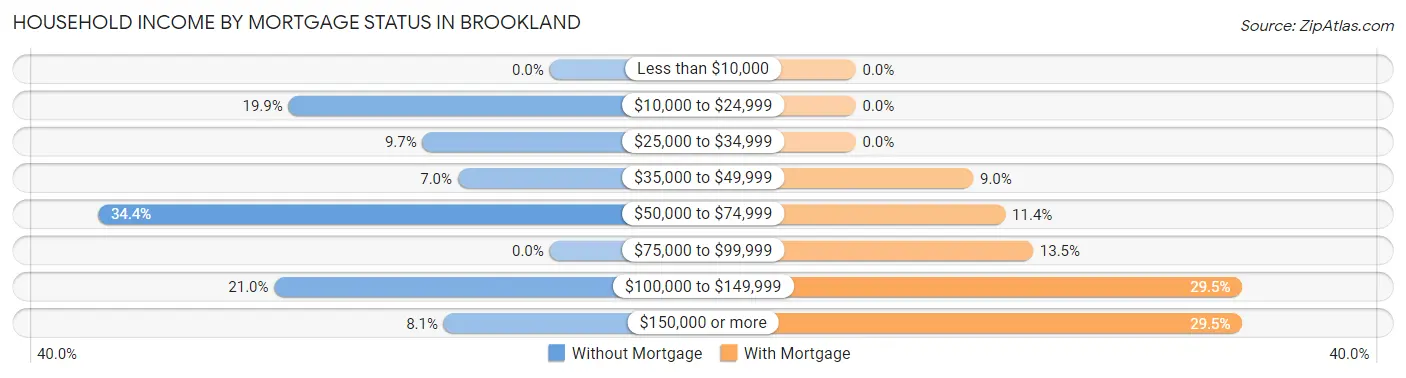
| Household Income | Without Mortgage | With Mortgage |
| Less than $10,000 | 0 (0.0%) | 0 (0.0%) |
| $10,000 to $24,999 | 37 (19.9%) | 0 (0.0%) |
| $25,000 to $34,999 | 18 (9.7%) | 0 (0.0%) |
| $35,000 to $49,999 | 13 (7.0%) | 51 (8.9%) |
| $50,000 to $74,999 | 64 (34.4%) | 65 (11.4%) |
| $75,000 to $99,999 | 0 (0.0%) | 77 (13.5%) |
| $100,000 to $149,999 | 39 (21.0%) | 168 (29.5%) |
| $150,000 or more | 15 (8.1%) | 168 (29.5%) |
| Total | 186 (100.0%) | 570 (100.0%) |
Property Value to Household Income Ratio in Brookland
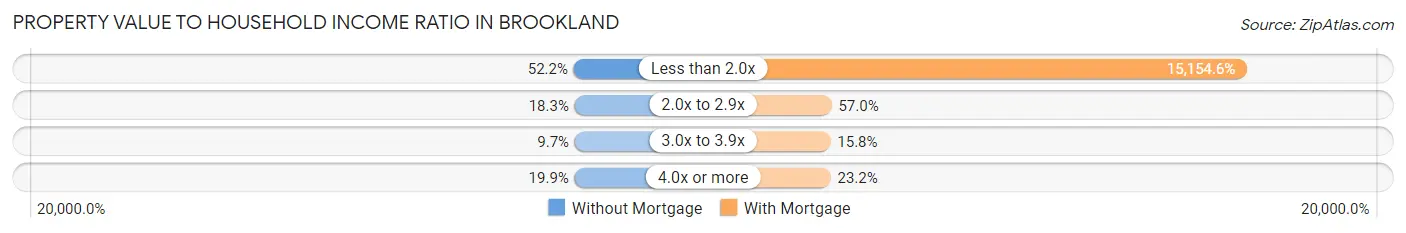
| Value-to-Income Ratio | Without Mortgage | With Mortgage |
| Less than 2.0x | 97 (52.1%) | 86,381 (15,154.6%) |
| 2.0x to 2.9x | 34 (18.3%) | 325 (57.0%) |
| 3.0x to 3.9x | 18 (9.7%) | 90 (15.8%) |
| 4.0x or more | 37 (19.9%) | 132 (23.2%) |
| Total | 186 (100.0%) | 570 (100.0%) |
Real Estate Taxes by Mortgage Status in Brookland
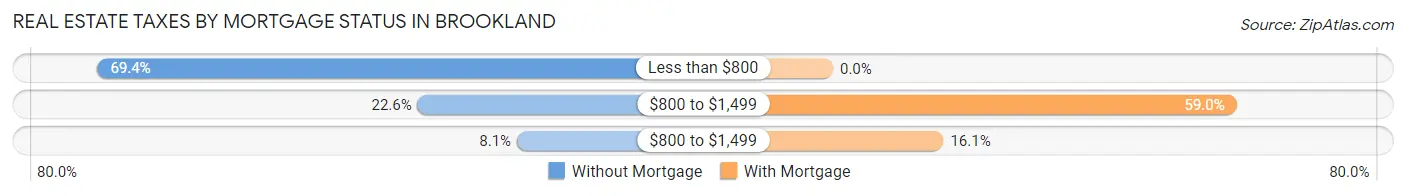
| Property Taxes | Without Mortgage | With Mortgage |
| Less than $800 | 129 (69.4%) | 0 (0.0%) |
| $800 to $1,499 | 42 (22.6%) | 336 (59.0%) |
| $800 to $1,499 | 15 (8.1%) | 92 (16.1%) |
| Total | 186 (100.0%) | 570 (100.0%) |
Health & Disability in Brookland
Health Insurance Coverage by Age in Brookland
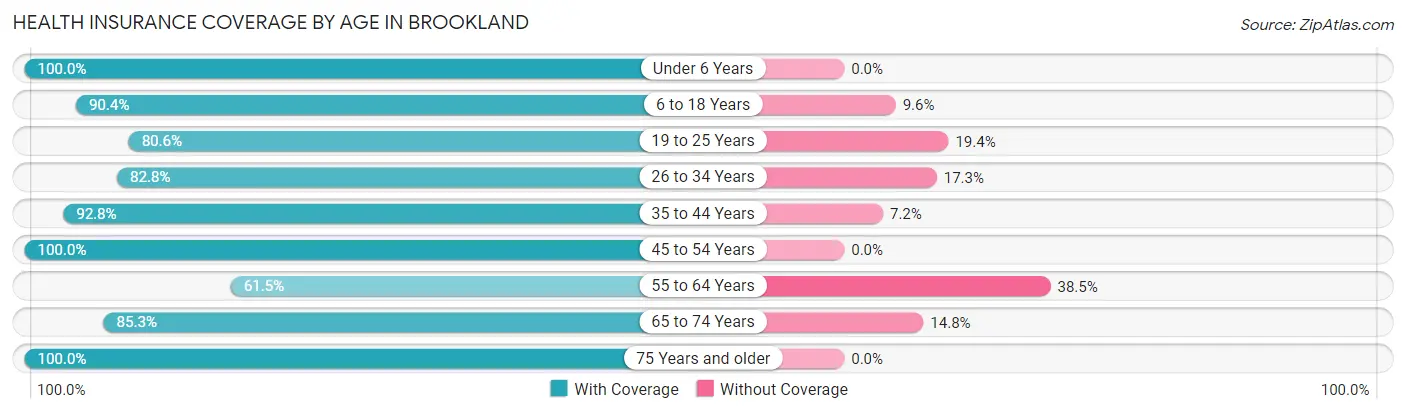
| Age Bracket | With Coverage | Without Coverage |
| Under 6 Years | 564 (100.0%) | 0 (0.0%) |
| 6 to 18 Years | 613 (90.4%) | 65 (9.6%) |
| 19 to 25 Years | 427 (80.6%) | 103 (19.4%) |
| 26 to 34 Years | 729 (82.8%) | 152 (17.2%) |
| 35 to 44 Years | 424 (92.8%) | 33 (7.2%) |
| 45 to 54 Years | 324 (100.0%) | 0 (0.0%) |
| 55 to 64 Years | 240 (61.5%) | 150 (38.5%) |
| 65 to 74 Years | 104 (85.3%) | 18 (14.7%) |
| 75 Years and older | 111 (100.0%) | 0 (0.0%) |
| Total | 3,536 (87.2%) | 521 (12.8%) |
Health Insurance Coverage by Citizenship Status in Brookland
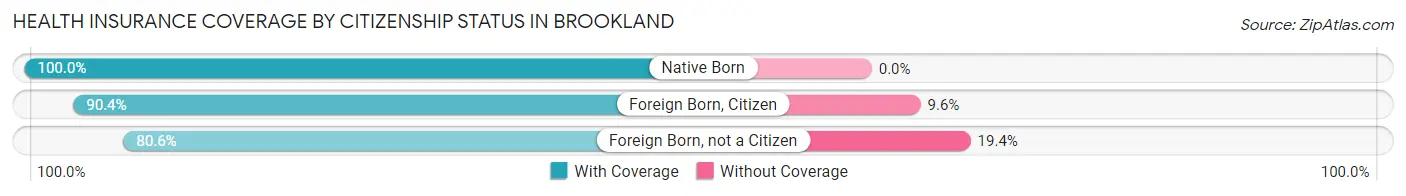
| Citizenship Status | With Coverage | Without Coverage |
| Native Born | 564 (100.0%) | 0 (0.0%) |
| Foreign Born, Citizen | 613 (90.4%) | 65 (9.6%) |
| Foreign Born, not a Citizen | 427 (80.6%) | 103 (19.4%) |
Health Insurance Coverage by Household Income in Brookland
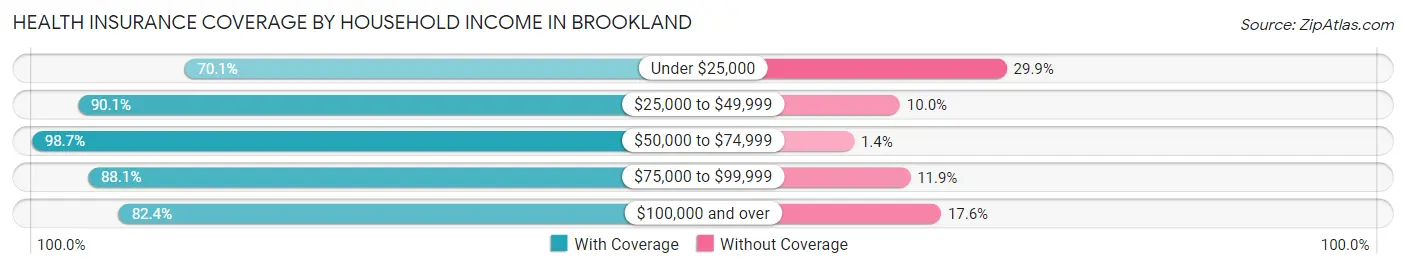
| Household Income | With Coverage | Without Coverage |
| Under $25,000 | 124 (70.1%) | 53 (29.9%) |
| $25,000 to $49,999 | 941 (90.0%) | 104 (10.0%) |
| $50,000 to $74,999 | 584 (98.7%) | 8 (1.3%) |
| $75,000 to $99,999 | 608 (88.1%) | 82 (11.9%) |
| $100,000 and over | 1,279 (82.4%) | 274 (17.6%) |
Public vs Private Health Insurance Coverage by Age in Brookland
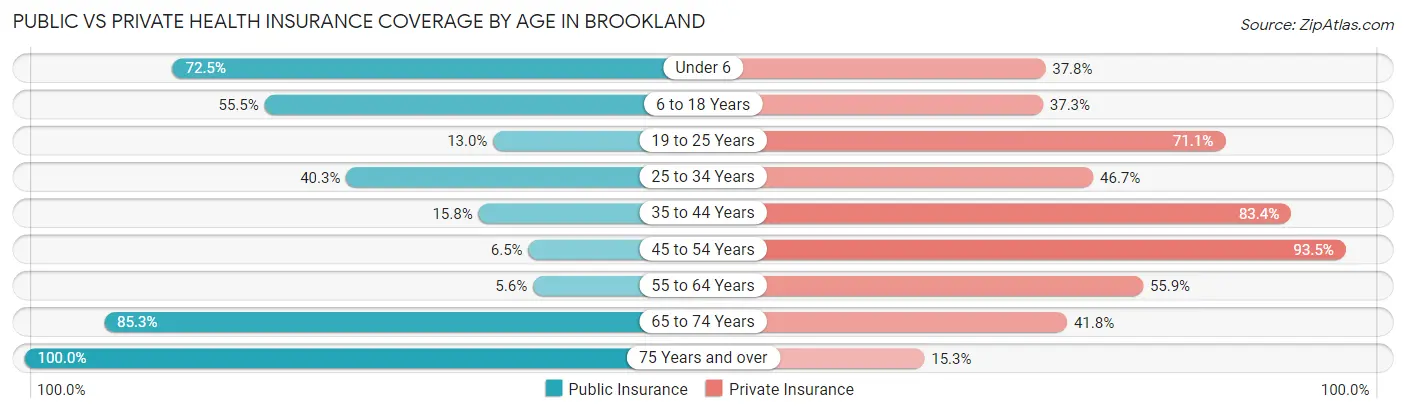
| Age Bracket | Public Insurance | Private Insurance |
| Under 6 | 409 (72.5%) | 213 (37.8%) |
| 6 to 18 Years | 376 (55.5%) | 253 (37.3%) |
| 19 to 25 Years | 69 (13.0%) | 377 (71.1%) |
| 25 to 34 Years | 355 (40.3%) | 411 (46.7%) |
| 35 to 44 Years | 72 (15.8%) | 381 (83.4%) |
| 45 to 54 Years | 21 (6.5%) | 303 (93.5%) |
| 55 to 64 Years | 22 (5.6%) | 218 (55.9%) |
| 65 to 74 Years | 104 (85.3%) | 51 (41.8%) |
| 75 Years and over | 111 (100.0%) | 17 (15.3%) |
| Total | 1,539 (37.9%) | 2,224 (54.8%) |
Disability Status by Sex by Age in Brookland
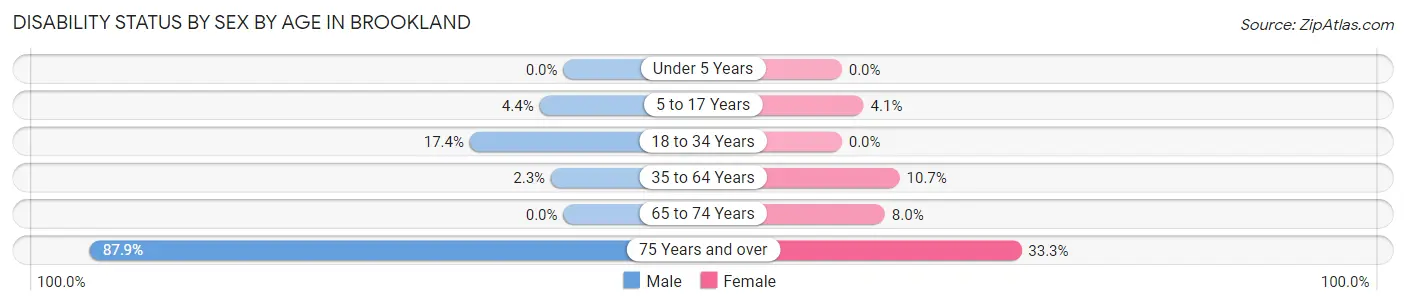
| Age Bracket | Male | Female |
| Under 5 Years | 0 (0.0%) | 0 (0.0%) |
| 5 to 17 Years | 18 (4.4%) | 16 (4.1%) |
| 18 to 34 Years | 141 (17.4%) | 0 (0.0%) |
| 35 to 64 Years | 15 (2.3%) | 56 (10.7%) |
| 65 to 74 Years | 0 (0.0%) | 6 (8.0%) |
| 75 Years and over | 58 (87.9%) | 15 (33.3%) |
Disability Class by Sex by Age in Brookland
Disability Class: Hearing Difficulty
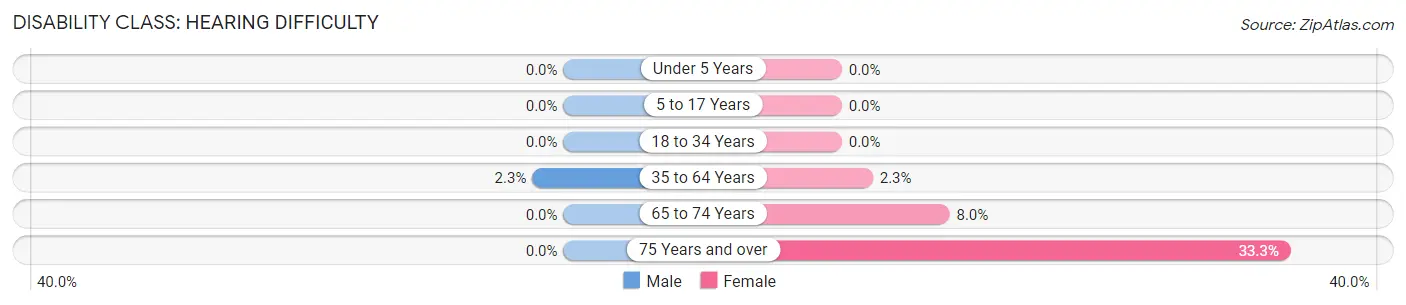
| Age Bracket | Male | Female |
| Under 5 Years | 0 (0.0%) | 0 (0.0%) |
| 5 to 17 Years | 0 (0.0%) | 0 (0.0%) |
| 18 to 34 Years | 0 (0.0%) | 0 (0.0%) |
| 35 to 64 Years | 15 (2.3%) | 12 (2.3%) |
| 65 to 74 Years | 0 (0.0%) | 6 (8.0%) |
| 75 Years and over | 0 (0.0%) | 15 (33.3%) |
Disability Class: Vision Difficulty
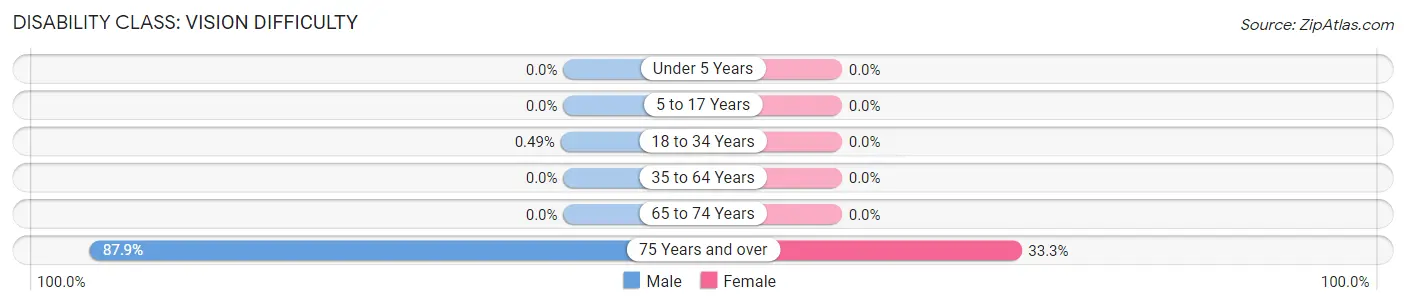
| Age Bracket | Male | Female |
| Under 5 Years | 0 (0.0%) | 0 (0.0%) |
| 5 to 17 Years | 0 (0.0%) | 0 (0.0%) |
| 18 to 34 Years | 4 (0.5%) | 0 (0.0%) |
| 35 to 64 Years | 0 (0.0%) | 0 (0.0%) |
| 65 to 74 Years | 0 (0.0%) | 0 (0.0%) |
| 75 Years and over | 58 (87.9%) | 15 (33.3%) |
Disability Class: Cognitive Difficulty
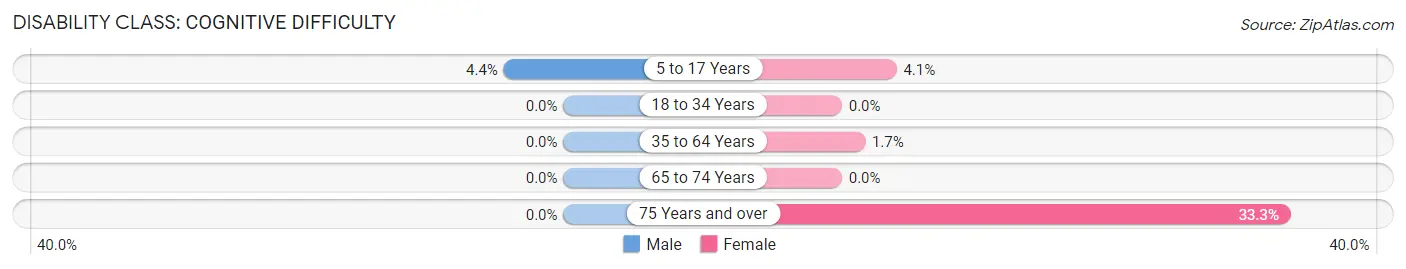
| Age Bracket | Male | Female |
| 5 to 17 Years | 18 (4.4%) | 16 (4.1%) |
| 18 to 34 Years | 0 (0.0%) | 0 (0.0%) |
| 35 to 64 Years | 0 (0.0%) | 9 (1.7%) |
| 65 to 74 Years | 0 (0.0%) | 0 (0.0%) |
| 75 Years and over | 0 (0.0%) | 15 (33.3%) |
Disability Class: Ambulatory Difficulty
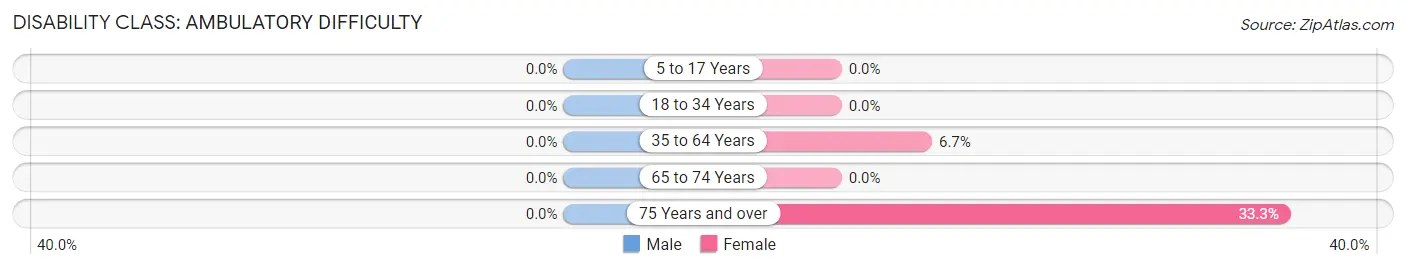
| Age Bracket | Male | Female |
| 5 to 17 Years | 0 (0.0%) | 0 (0.0%) |
| 18 to 34 Years | 0 (0.0%) | 0 (0.0%) |
| 35 to 64 Years | 0 (0.0%) | 35 (6.7%) |
| 65 to 74 Years | 0 (0.0%) | 0 (0.0%) |
| 75 Years and over | 0 (0.0%) | 15 (33.3%) |
Disability Class: Self-Care Difficulty
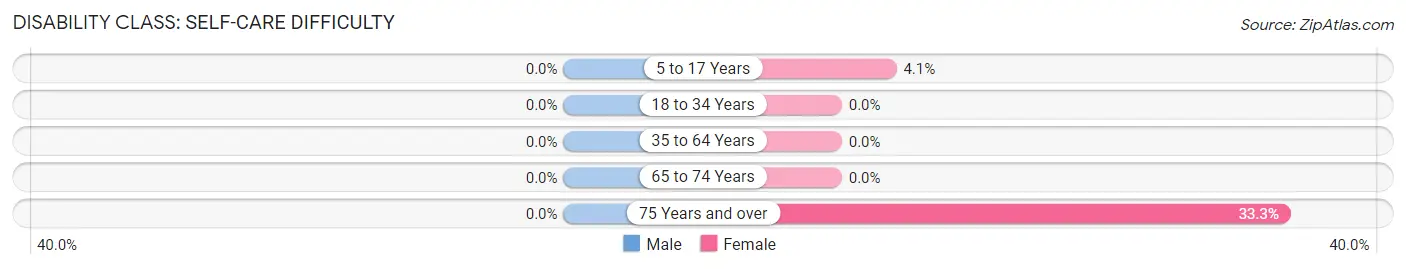
| Age Bracket | Male | Female |
| 5 to 17 Years | 0 (0.0%) | 16 (4.1%) |
| 18 to 34 Years | 0 (0.0%) | 0 (0.0%) |
| 35 to 64 Years | 0 (0.0%) | 0 (0.0%) |
| 65 to 74 Years | 0 (0.0%) | 0 (0.0%) |
| 75 Years and over | 0 (0.0%) | 15 (33.3%) |
Technology Access in Brookland
Computing Device Access in Brookland
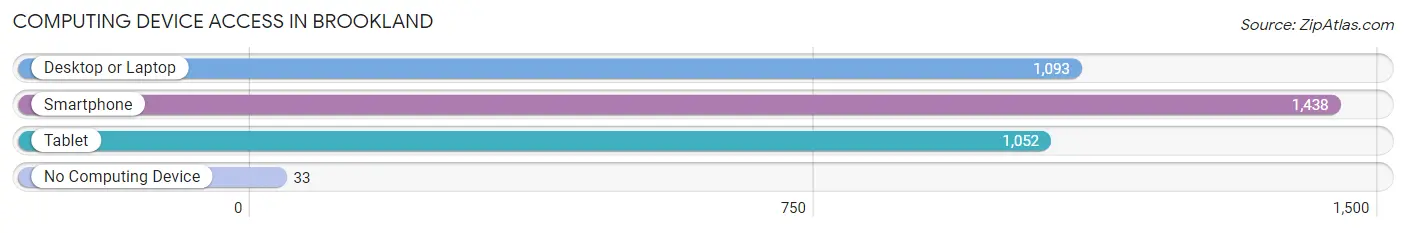
| Device Type | # Households | % Households |
| Desktop or Laptop | 1,093 | 73.3% |
| Smartphone | 1,438 | 96.5% |
| Tablet | 1,052 | 70.6% |
| No Computing Device | 33 | 2.2% |
| Total | 1,491 | 100.0% |
Internet Access in Brookland
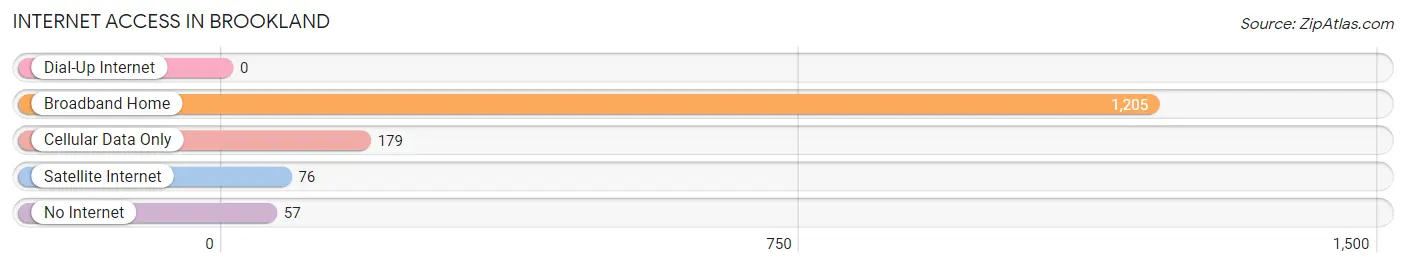
| Internet Type | # Households | % Households |
| Dial-Up Internet | 0 | 0.0% |
| Broadband Home | 1,205 | 80.8% |
| Cellular Data Only | 179 | 12.0% |
| Satellite Internet | 76 | 5.1% |
| No Internet | 57 | 3.8% |
| Total | 1,491 | 100.0% |
Brookland Summary
Brookland is a city located in Craighead County, Arkansas, United States. It is part of the Jonesboro, Arkansas Metropolitan Statistical Area. The population was 2,845 at the 2010 census.
History
The area that is now Brookland was first settled in the early 1800s. The town was originally known as "Hickory Ridge" and was located in Greene County. In 1883, the town was moved to its current location in Craighead County and renamed Brookland. The name was chosen to honor the many streams and creeks that ran through the area.
The first post office was established in 1884 and the town was incorporated in 1887. The first school was built in 1891 and the first church was built in 1895.
Geography
Brookland is located at 35°48'25" North, 90°37'45" West (35.806944, -90.629167). According to the United States Census Bureau, the city has a total area of 4.2 square miles (10.8 km2), all land.
Economy
The economy of Brookland is largely based on agriculture. The town is home to several farms and ranches, as well as a number of small businesses. The town is also home to a number of manufacturing companies, including a furniture factory and a plastics plant.
Demographics
As of the census of 2000, there were 2,845 people, 1,093 households, and 790 families residing in the city. The population density was 677.2 people per square mile (261.3/km2). There were 1,179 housing units at an average density of 281.2 per square mile (108.6/km2). The racial makeup of the city was 97.45% White, 0.53% Black or African American, 0.21% Native American, 0.39% Asian, 0.04% Pacific Islander, 0.53% from other races, and 0.84% from two or more races. 1.39% of the population were Hispanic or Latino of any race.
There were 1,093 households, out of which 34.2% had children under the age of 18 living with them, 57.2% were married couples living together, 11.2% had a female householder with no husband present, and 27.3% were non-families. 24.2% of all households were made up of individuals, and 11.2% had someone living alone who was 65 years of age or older. The average household size was 2.60 and the average family size was 3.09.
In the city, the population was spread out, with 27.2% under the age of 18, 8.7% from 18 to 24, 28.2% from 25 to 44, 22.2% from 45 to 64, and 13.7% who were 65 years of age or older. The median age was 36 years. For every 100 females, there were 92.2 males. For every 100 females age 18 and over, there were 87.7 males.
The median income for a household in the city was $30,938, and the median income for a family was $36,944. Males had a median income of $30,000 versus $20,938 for females. The per capita income for the city was $14,945. About 11.2% of families and 14.2% of the population were below the poverty line, including 17.2% of those under age 18 and 15.2% of those age 65 or over.
Common Questions
What is Per Capita Income in Brookland?
Per Capita income in Brookland is $28,324.
What is the Median Family Income in Brookland?
Median Family Income in Brookland is $85,746.
What is the Median Household income in Brookland?
Median Household Income in Brookland is $65,688.
What is Income or Wage Gap in Brookland?
Income or Wage Gap in Brookland is 30.4%.
Women in Brookland earn 69.6 cents for every dollar earned by a man.
What is Inequality or Gini Index in Brookland?
Inequality or Gini Index in Brookland is 0.32.
What is the Total Population of Brookland?
Total Population of Brookland is 4,057.
What is the Total Male Population of Brookland?
Total Male Population of Brookland is 2,067.
What is the Total Female Population of Brookland?
Total Female Population of Brookland is 1,990.
What is the Ratio of Males per 100 Females in Brookland?
There are 103.87 Males per 100 Females in Brookland.
What is the Ratio of Females per 100 Males in Brookland?
There are 96.27 Females per 100 Males in Brookland.
What is the Median Population Age in Brookland?
Median Population Age in Brookland is 26.8 Years.
What is the Average Family Size in Brookland
Average Family Size in Brookland is 3.1 People.
What is the Average Household Size in Brookland
Average Household Size in Brookland is 2.7 People.
How Large is the Labor Force in Brookland?
There are 2,404 People in the Labor Forcein in Brookland.
What is the Percentage of People in the Labor Force in Brookland?
81.9% of People are in the Labor Force in Brookland.
What is the Unemployment Rate in Brookland?
Unemployment Rate in Brookland is 5.8%.