Bluff City, AR Map & Demographics
Bluff City Map
Bluff City Overview
$14,066
PER CAPITA INCOME
23.0%
WAGE / INCOME GAP [ % ]
77.0¢/ $1
WAGE / INCOME GAP [ $ ]
0.54
INEQUALITY / GINI INDEX
283
TOTAL POPULATION
80
MALE POPULATION
203
FEMALE POPULATION
39.41
MALES / 100 FEMALES
253.75
FEMALES / 100 MALES
49.5
MEDIAN AGE
8.2
AVG FAMILY SIZE
6.2
AVG HOUSEHOLD SIZE
56
LABOR FORCE [ PEOPLE ]
22.1%
PERCENT IN LABOR FORCE
Bluff City Zip Codes
Income in Bluff City
Income Overview in Bluff City
| Characteristic | Number | Measure |
| Per Capita Income | 283 | $14,066 |
| Median Family Income | 33 | $0 |
| Mean Family Income | 33 | $71,876 |
| Median Household Income | 46 | $0 |
| Mean Household Income | 46 | $53,200 |
| Income Deficit | 33 | $0 |
| Wage / Income Gap (%) | 283 | 23.00% |
| Wage / Income Gap ($) | 283 | 77.00¢ per $1 |
| Gini / Inequality Index | 283 | 0.54 |
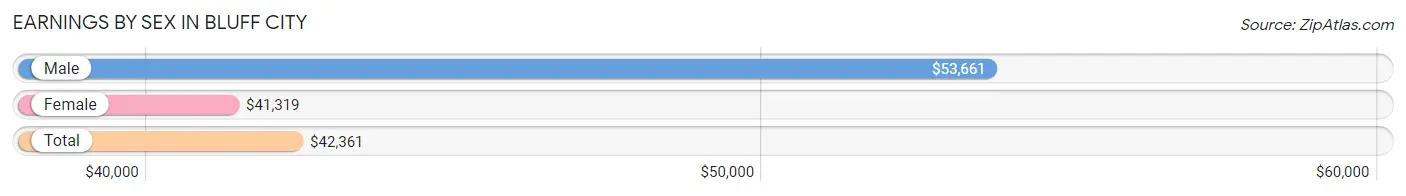
Earnings by Sex in Bluff City
Average Earnings in Bluff City are $42,361, $53,661 for men and $41,319 for women, a difference of 23.0%.
| Sex | Number | Average Earnings |
| Male | 27 (45.0%) | $53,661 |
| Female | 33 (55.0%) | $41,319 |
| Total | 60 (100.0%) | $42,361 |
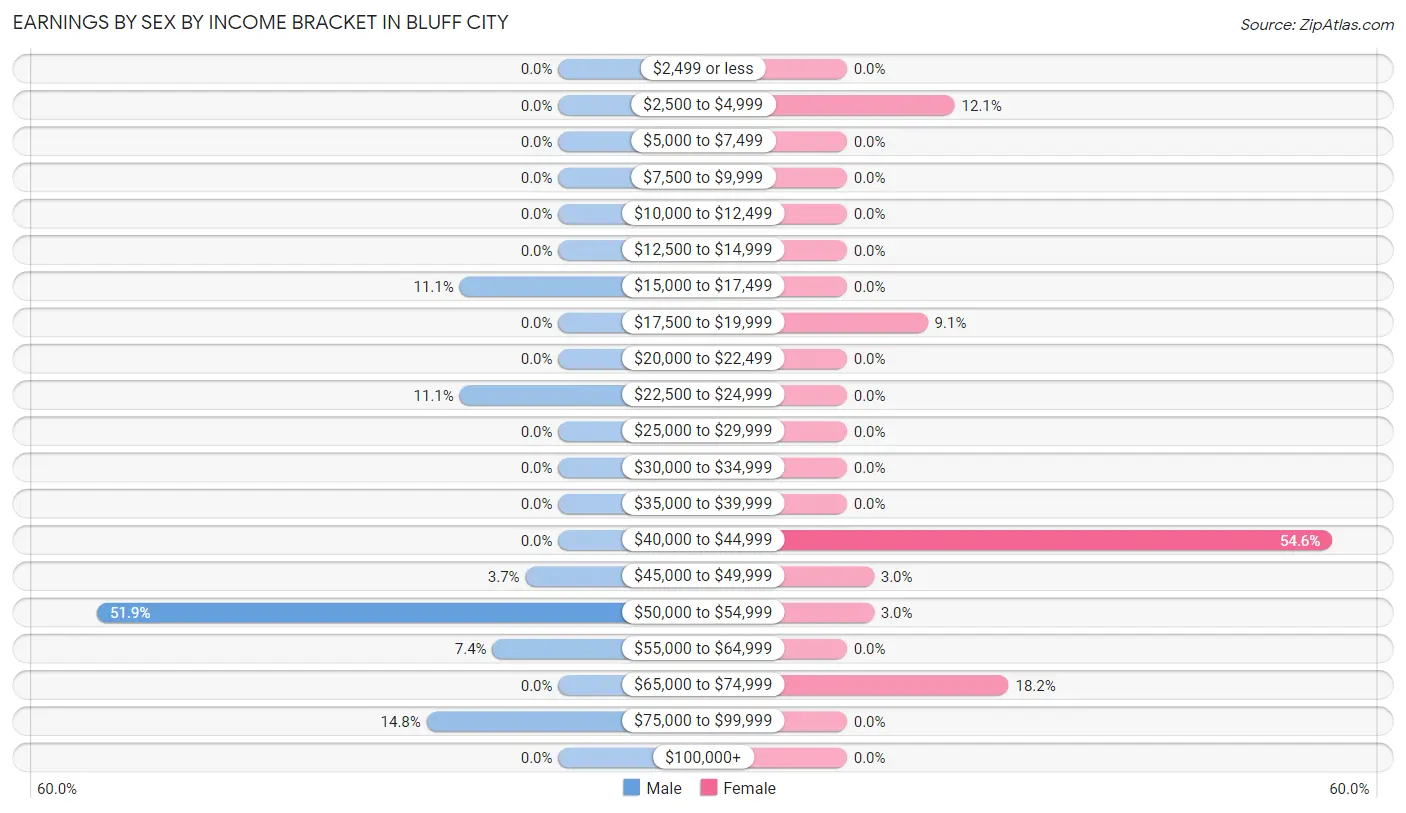
Earnings by Sex by Income Bracket in Bluff City
The most common earnings brackets in Bluff City are $50,000 to $54,999 for men (14 | 51.8%) and $40,000 to $44,999 for women (18 | 54.5%).
| Income | Male | Female |
| $2,499 or less | 0 (0.0%) | 0 (0.0%) |
| $2,500 to $4,999 | 0 (0.0%) | 4 (12.1%) |
| $5,000 to $7,499 | 0 (0.0%) | 0 (0.0%) |
| $7,500 to $9,999 | 0 (0.0%) | 0 (0.0%) |
| $10,000 to $12,499 | 0 (0.0%) | 0 (0.0%) |
| $12,500 to $14,999 | 0 (0.0%) | 0 (0.0%) |
| $15,000 to $17,499 | 3 (11.1%) | 0 (0.0%) |
| $17,500 to $19,999 | 0 (0.0%) | 3 (9.1%) |
| $20,000 to $22,499 | 0 (0.0%) | 0 (0.0%) |
| $22,500 to $24,999 | 3 (11.1%) | 0 (0.0%) |
| $25,000 to $29,999 | 0 (0.0%) | 0 (0.0%) |
| $30,000 to $34,999 | 0 (0.0%) | 0 (0.0%) |
| $35,000 to $39,999 | 0 (0.0%) | 0 (0.0%) |
| $40,000 to $44,999 | 0 (0.0%) | 18 (54.5%) |
| $45,000 to $49,999 | 1 (3.7%) | 1 (3.0%) |
| $50,000 to $54,999 | 14 (51.8%) | 1 (3.0%) |
| $55,000 to $64,999 | 2 (7.4%) | 0 (0.0%) |
| $65,000 to $74,999 | 0 (0.0%) | 6 (18.2%) |
| $75,000 to $99,999 | 4 (14.8%) | 0 (0.0%) |
| $100,000+ | 0 (0.0%) | 0 (0.0%) |
| Total | 27 (100.0%) | 33 (100.0%) |
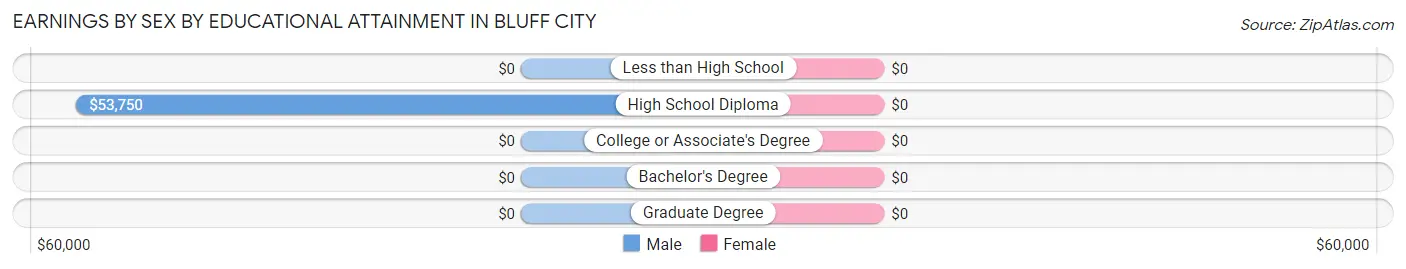
Earnings by Sex by Educational Attainment in Bluff City
| Educational Attainment | Male Income | Female Income |
| Less than High School | - | - |
| High School Diploma | $53,750 | $0 |
| College or Associate's Degree | - | - |
| Bachelor's Degree | - | - |
| Graduate Degree | - | - |
| Total | $53,929 | $41,319 |
Family Income in Bluff City
Family Income Brackets in Bluff City
According to the Bluff City family income data, there are 10 families falling into the $15,000 to $24,999 income range, which is the most common income bracket and makes up 30.3% of all families.
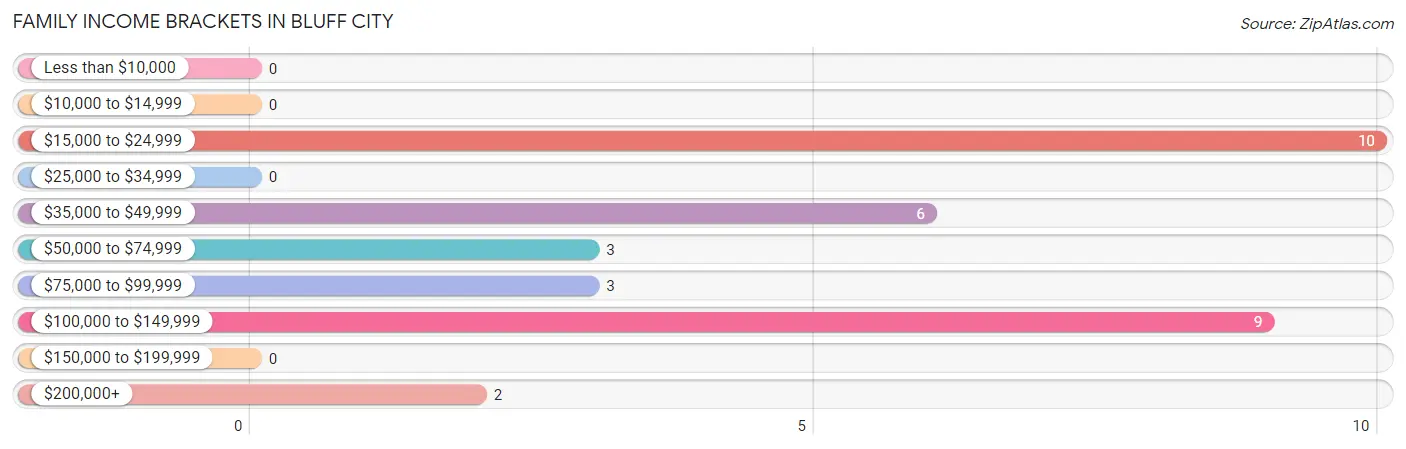
| Income Bracket | # Families | % Families |
| Less than $10,000 | 0 | 0.0% |
| $10,000 to $14,999 | 0 | 0.0% |
| $15,000 to $24,999 | 10 | 30.3% |
| $25,000 to $34,999 | 0 | 0.0% |
| $35,000 to $49,999 | 6 | 18.2% |
| $50,000 to $74,999 | 3 | 9.1% |
| $75,000 to $99,999 | 3 | 9.1% |
| $100,000 to $149,999 | 9 | 27.3% |
| $150,000 to $199,999 | 0 | 0.0% |
| $200,000+ | 2 | 6.1% |
Family Income by Famaliy Size in Bluff City
2-person families (11 | 33.3%) account for the highest median family income in Bluff City with $74,375 per family, while 2-person families (11 | 33.3%) have the highest median income of $37,188 per family member.
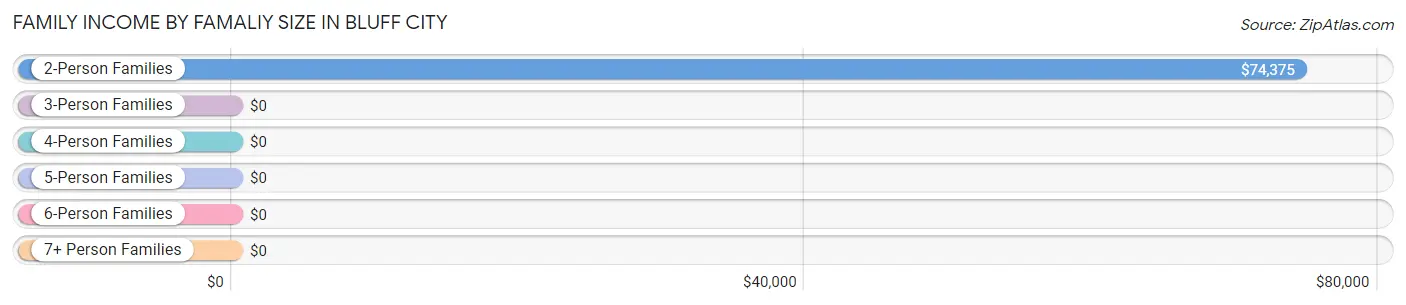
| Income Bracket | # Families | Median Income |
| 2-Person Families | 11 (33.3%) | $74,375 |
| 3-Person Families | 8 (24.2%) | $0 |
| 4-Person Families | 6 (18.2%) | $0 |
| 5-Person Families | 8 (24.2%) | $0 |
| 6-Person Families | 0 (0.0%) | $0 |
| 7+ Person Families | 0 (0.0%) | $0 |
| Total | 33 (100.0%) | $0 |
Family Income by Number of Earners in Bluff City
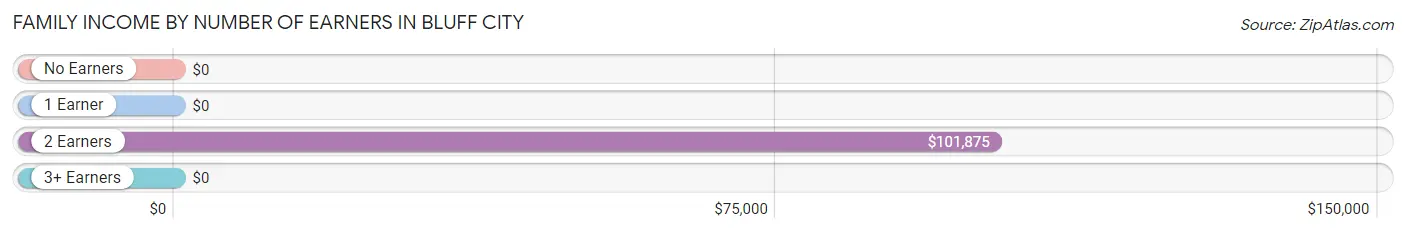
| Number of Earners | # Families | Median Income |
| No Earners | 13 (39.4%) | $0 |
| 1 Earner | 5 (15.1%) | $0 |
| 2 Earners | 15 (45.5%) | $101,875 |
| 3+ Earners | 0 (0.0%) | $0 |
| Total | 33 (100.0%) | $0 |
Household Income in Bluff City
Household Income Brackets in Bluff City
With 10 households falling in the category, the $15,000 to $24,999 income range is the most frequent in Bluff City, accounting for 21.7% of all households.
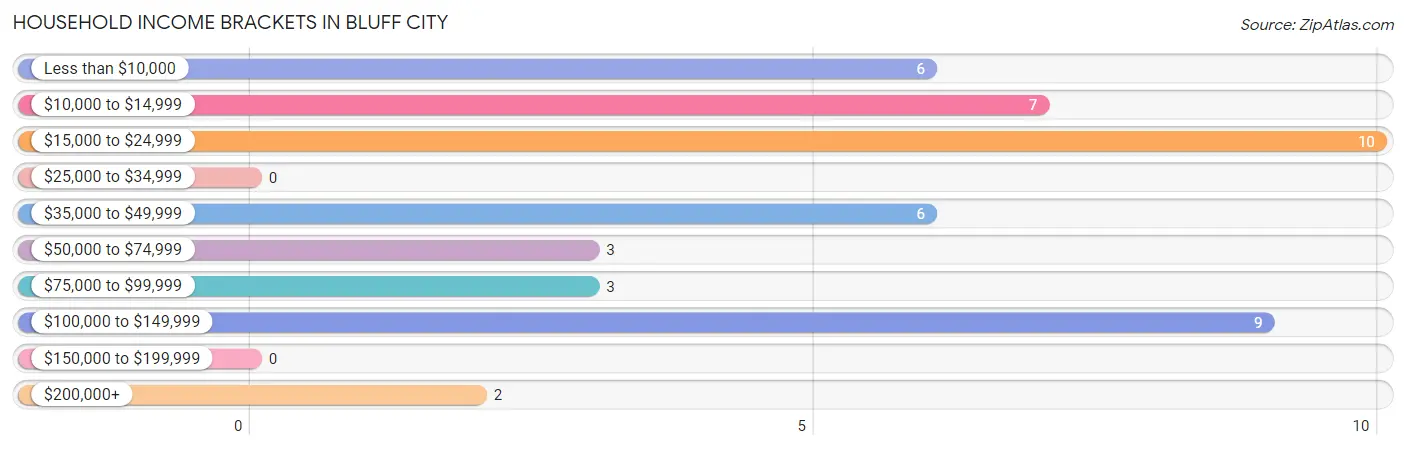
| Income Bracket | # Households | % Households |
| Less than $10,000 | 6 | 13.0% |
| $10,000 to $14,999 | 7 | 15.2% |
| $15,000 to $24,999 | 10 | 21.7% |
| $25,000 to $34,999 | 0 | 0.0% |
| $35,000 to $49,999 | 6 | 13.0% |
| $50,000 to $74,999 | 3 | 6.5% |
| $75,000 to $99,999 | 3 | 6.5% |
| $100,000 to $149,999 | 9 | 19.6% |
| $150,000 to $199,999 | 0 | 0.0% |
| $200,000+ | 2 | 4.3% |
Household Income by Householder Age in Bluff City
| Income Bracket | # Households | Median Income |
| 15 to 24 Years | 0 (0.0%) | $0 |
| 25 to 44 Years | 17 (37.0%) | $0 |
| 45 to 64 Years | 12 (26.1%) | $0 |
| 65+ Years | 17 (37.0%) | $0 |
| Total | 46 (100.0%) | $0 |
Poverty in Bluff City
Income Below Poverty by Sex and Age in Bluff City
With 48.7% poverty level for males and 7.4% for females among the residents of Bluff City, 6 to 11 year old males and 15 year old females are the most vulnerable to poverty, with 6 males (54.5%) and 7 females (100.0%) in their respective age groups living below the poverty level.
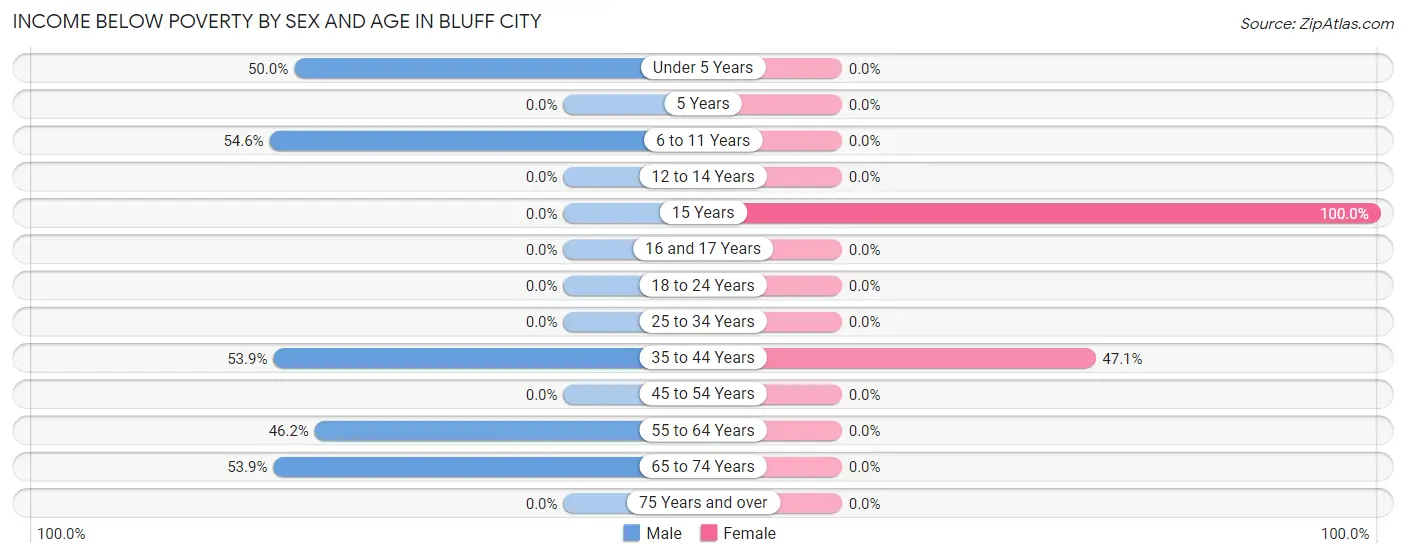
| Age Bracket | Male | Female |
| Under 5 Years | 6 (50.0%) | 0 (0.0%) |
| 5 Years | 0 (0.0%) | 0 (0.0%) |
| 6 to 11 Years | 6 (54.5%) | 0 (0.0%) |
| 12 to 14 Years | 0 (0.0%) | 0 (0.0%) |
| 15 Years | 0 (0.0%) | 7 (100.0%) |
| 16 and 17 Years | 0 (0.0%) | 0 (0.0%) |
| 18 to 24 Years | 0 (0.0%) | 0 (0.0%) |
| 25 to 34 Years | 0 (0.0%) | 0 (0.0%) |
| 35 to 44 Years | 14 (53.8%) | 8 (47.1%) |
| 45 to 54 Years | 0 (0.0%) | 0 (0.0%) |
| 55 to 64 Years | 6 (46.2%) | 0 (0.0%) |
| 65 to 74 Years | 7 (53.8%) | 0 (0.0%) |
| 75 Years and over | 0 (0.0%) | 0 (0.0%) |
| Total | 39 (48.7%) | 15 (7.4%) |
Income Above Poverty by Sex and Age in Bluff City
According to the poverty statistics in Bluff City, males aged 18 to 24 years and females aged 25 to 34 years are the age groups that are most secure financially, with 100.0% of males and 100.0% of females in these age groups living above the poverty line.
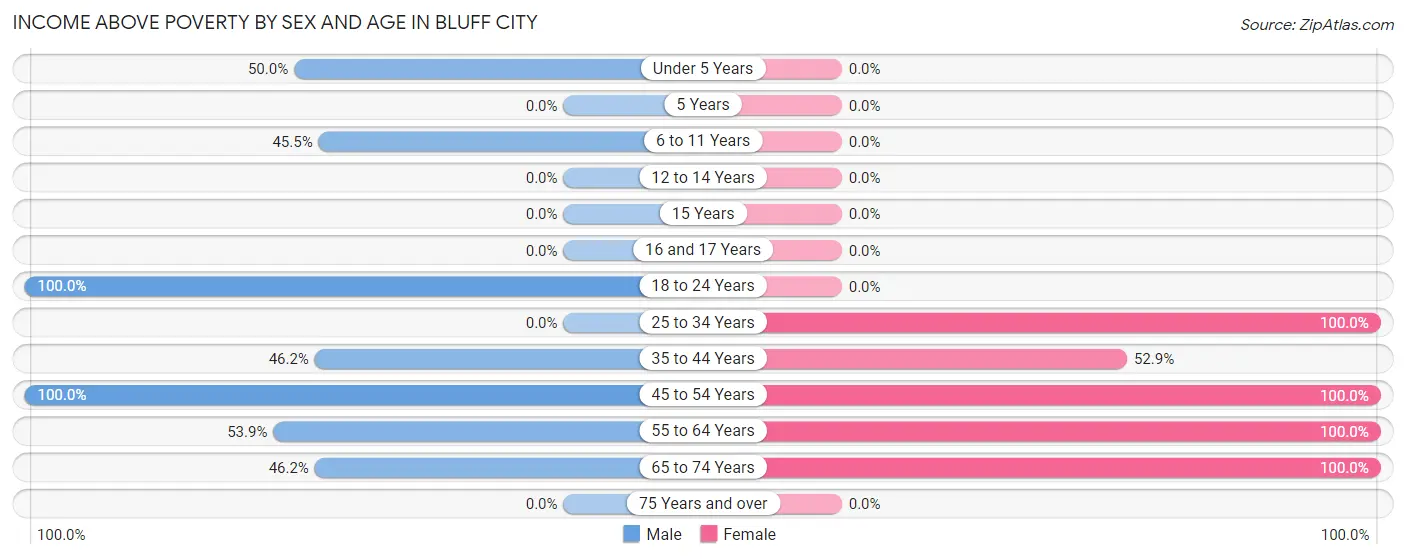
| Age Bracket | Male | Female |
| Under 5 Years | 6 (50.0%) | 0 (0.0%) |
| 5 Years | 0 (0.0%) | 0 (0.0%) |
| 6 to 11 Years | 5 (45.5%) | 0 (0.0%) |
| 12 to 14 Years | 0 (0.0%) | 0 (0.0%) |
| 15 Years | 0 (0.0%) | 0 (0.0%) |
| 16 and 17 Years | 0 (0.0%) | 0 (0.0%) |
| 18 to 24 Years | 3 (100.0%) | 0 (0.0%) |
| 25 to 34 Years | 0 (0.0%) | 2 (100.0%) |
| 35 to 44 Years | 12 (46.2%) | 9 (52.9%) |
| 45 to 54 Years | 2 (100.0%) | 134 (100.0%) |
| 55 to 64 Years | 7 (53.8%) | 26 (100.0%) |
| 65 to 74 Years | 6 (46.2%) | 17 (100.0%) |
| 75 Years and over | 0 (0.0%) | 0 (0.0%) |
| Total | 41 (51.2%) | 188 (92.6%) |
Income Below Poverty Among Married-Couple Families in Bluff City
The poverty statistics for married-couple families in Bluff City show that 30.8% or 8 of the total 26 families live below the poverty line. Families with 3 or 4 children have the highest poverty rate of 100.0%, comprising of 8 families. On the other hand, families with no children have the lowest poverty rate of 0.0%, which includes 0 families.
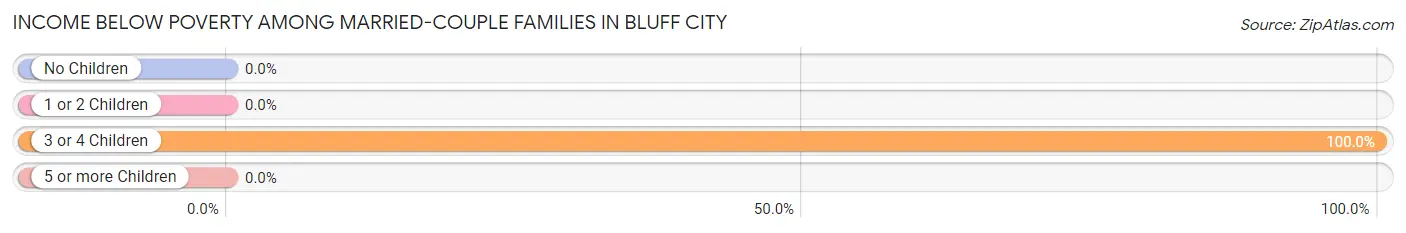
| Children | Above Poverty | Below Poverty |
| No Children | 12 (100.0%) | 0 (0.0%) |
| 1 or 2 Children | 6 (100.0%) | 0 (0.0%) |
| 3 or 4 Children | 0 (0.0%) | 8 (100.0%) |
| 5 or more Children | 0 (0.0%) | 0 (0.0%) |
| Total | 18 (69.2%) | 8 (30.8%) |
Income Below Poverty Among Single-Parent Households in Bluff City
| Children | Single Father | Single Mother |
| No Children | 0 (0.0%) | 0 (0.0%) |
| 1 or 2 Children | 0 (0.0%) | 0 (0.0%) |
| 3 or 4 Children | 0 (0.0%) | 0 (0.0%) |
| 5 or more Children | 0 (0.0%) | 0 (0.0%) |
| Total | 0 (0.0%) | 0 (0.0%) |
Income Below Poverty Among Married-Couple vs Single-Parent Households in Bluff City
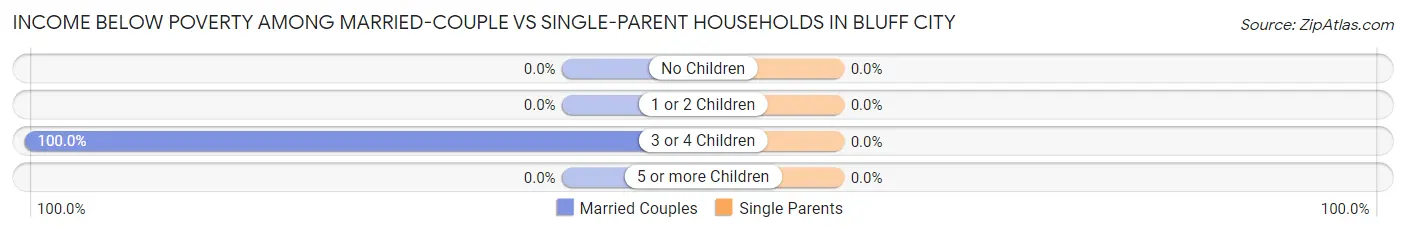
| Children | Married-Couple Families | Single-Parent Households |
| No Children | 0 (0.0%) | 0 (0.0%) |
| 1 or 2 Children | 0 (0.0%) | 0 (0.0%) |
| 3 or 4 Children | 8 (100.0%) | 0 (0.0%) |
| 5 or more Children | 0 (0.0%) | 0 (0.0%) |
| Total | 8 (30.8%) | 0 (0.0%) |
Race in Bluff City
The most populous races in Bluff City are Black / African American (276 | 97.5%), White / Caucasian (5 | 1.8%), and Some other Race (2 | 0.7%).
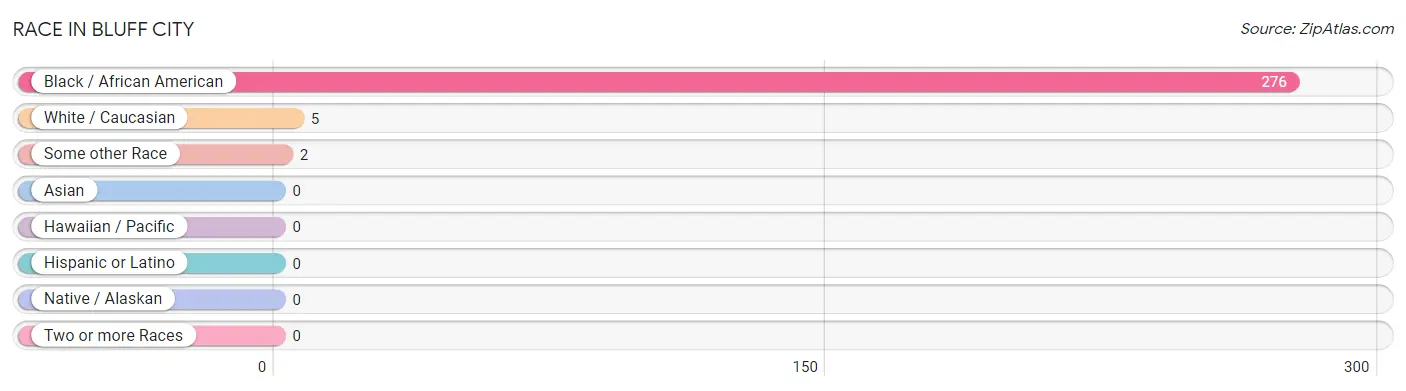
| Race | # Population | % Population |
| Asian | 0 | 0.0% |
| Black / African American | 276 | 97.5% |
| Hawaiian / Pacific | 0 | 0.0% |
| Hispanic or Latino | 0 | 0.0% |
| Native / Alaskan | 0 | 0.0% |
| White / Caucasian | 5 | 1.8% |
| Two or more Races | 0 | 0.0% |
| Some other Race | 2 | 0.7% |
| Total | 283 | 100.0% |
Ancestry in Bluff City
The most populous ancestries reported in Bluff City are Irish (2 | 0.7%), and English (1 | 0.4%), together accounting for 1.1% of all Bluff City residents.
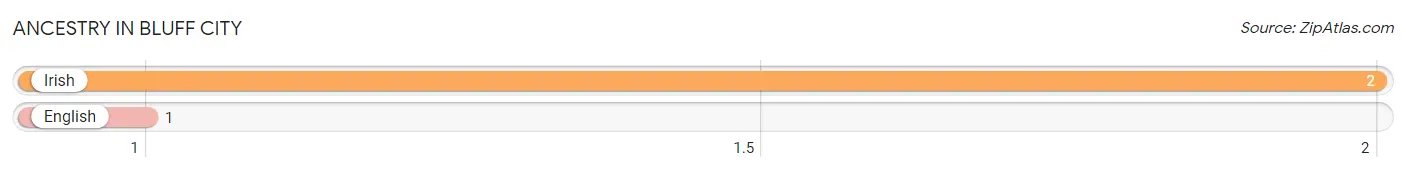
| Ancestry | # Population | % Population |
| English | 1 | 0.4% |
| Irish | 2 | 0.7% | View All 2 Rows |
Immigrants in Bluff City

| Immigration Origin | # Population | % Population | View All 0 Rows |
Sex and Age in Bluff City
Sex and Age in Bluff City
The most populous age groups in Bluff City are 40 to 44 Years (26 | 32.5%) for men and 45 to 49 Years (133 | 65.5%) for women.
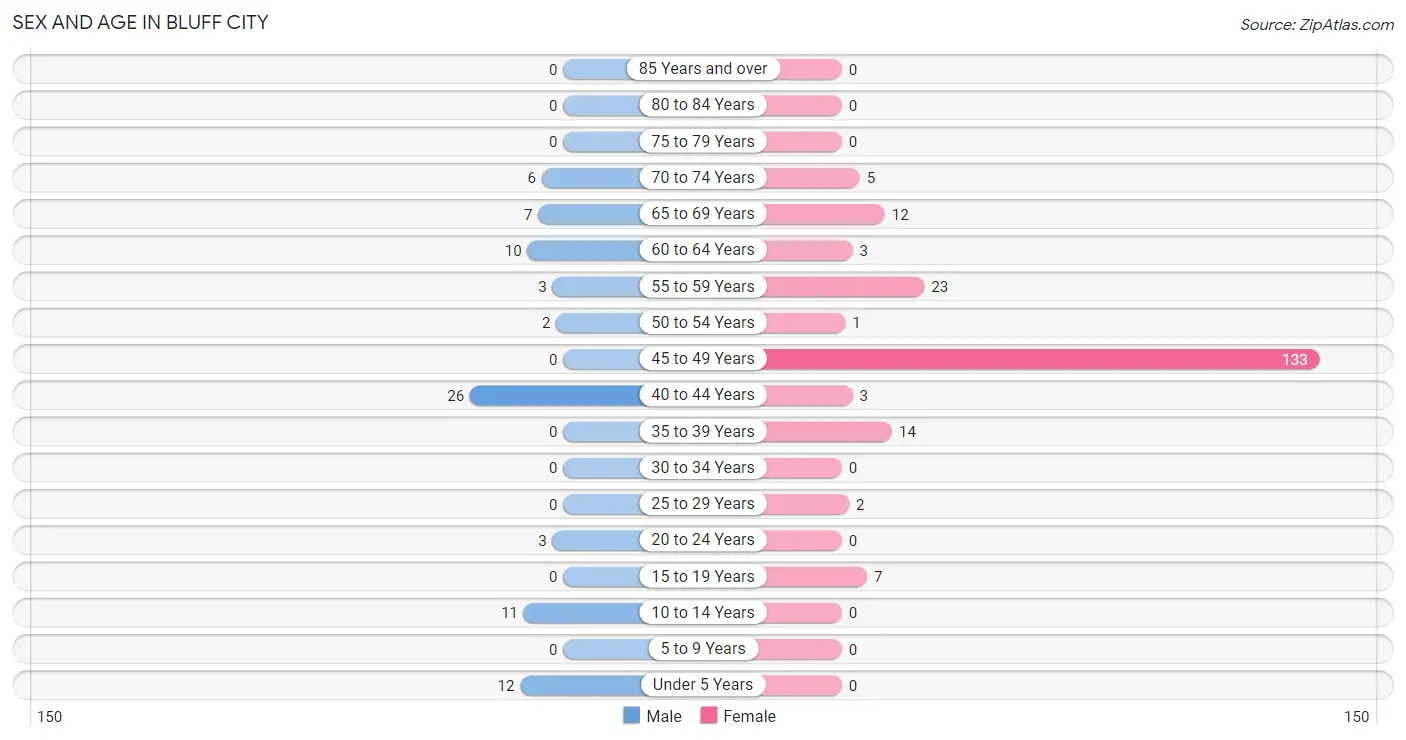
| Age Bracket | Male | Female |
| Under 5 Years | 12 (15.0%) | 0 (0.0%) |
| 5 to 9 Years | 0 (0.0%) | 0 (0.0%) |
| 10 to 14 Years | 11 (13.8%) | 0 (0.0%) |
| 15 to 19 Years | 0 (0.0%) | 7 (3.5%) |
| 20 to 24 Years | 3 (3.7%) | 0 (0.0%) |
| 25 to 29 Years | 0 (0.0%) | 2 (1.0%) |
| 30 to 34 Years | 0 (0.0%) | 0 (0.0%) |
| 35 to 39 Years | 0 (0.0%) | 14 (6.9%) |
| 40 to 44 Years | 26 (32.5%) | 3 (1.5%) |
| 45 to 49 Years | 0 (0.0%) | 133 (65.5%) |
| 50 to 54 Years | 2 (2.5%) | 1 (0.5%) |
| 55 to 59 Years | 3 (3.7%) | 23 (11.3%) |
| 60 to 64 Years | 10 (12.5%) | 3 (1.5%) |
| 65 to 69 Years | 7 (8.7%) | 12 (5.9%) |
| 70 to 74 Years | 6 (7.5%) | 5 (2.5%) |
| 75 to 79 Years | 0 (0.0%) | 0 (0.0%) |
| 80 to 84 Years | 0 (0.0%) | 0 (0.0%) |
| 85 Years and over | 0 (0.0%) | 0 (0.0%) |
| Total | 80 (100.0%) | 203 (100.0%) |
Families and Households in Bluff City
Median Family Size in Bluff City
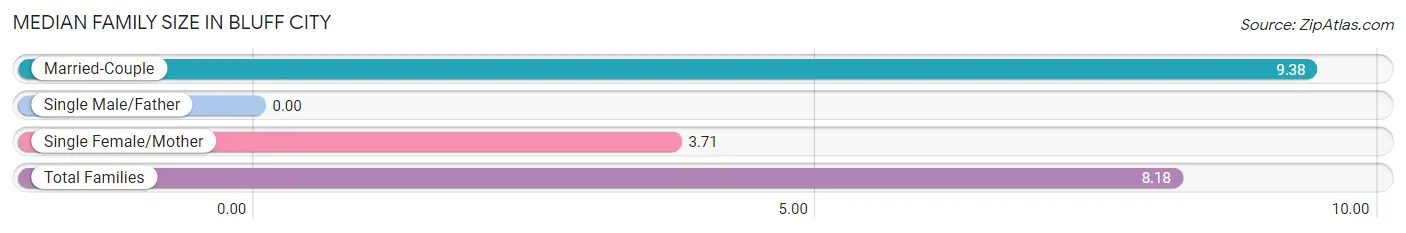
| Family Type | # Families | Family Size |
| Married-Couple | 26 (78.8%) | 9.38 |
| Single Male/Father | 0 (0.0%) | - |
| Single Female/Mother | 7 (21.2%) | 3.71 |
| Total Families | 33 (100.0%) | 8.18 |
Median Household Size in Bluff City
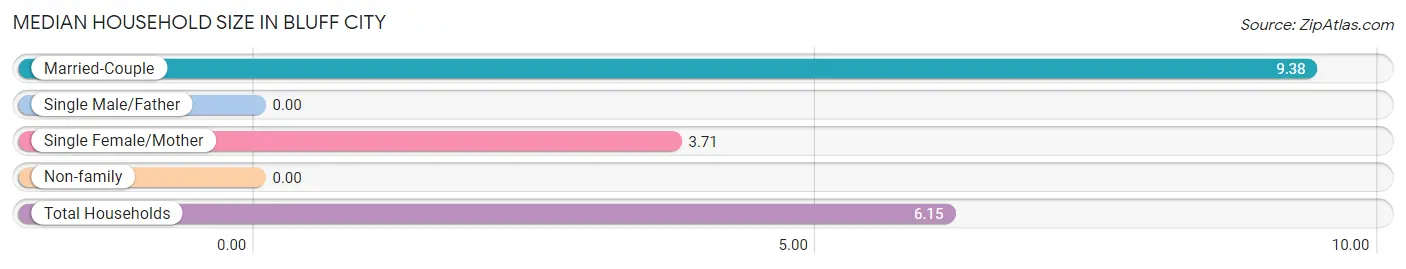
| Household Type | # Households | Household Size |
| Married-Couple | 26 (56.5%) | 9.38 |
| Single Male/Father | 0 (0.0%) | - |
| Single Female/Mother | 7 (15.2%) | 3.71 |
| Non-family | 13 (28.3%) | - |
| Total Households | 46 (100.0%) | 6.15 |
Household Size by Marriage Status in Bluff City
Out of a total of 46 households in Bluff City, 33 (71.7%) are family households, while 13 (28.3%) are nonfamily households. The most numerous type of family households are 2-person households, comprising 11, and the most common type of nonfamily households are 1-person households, comprising 13.
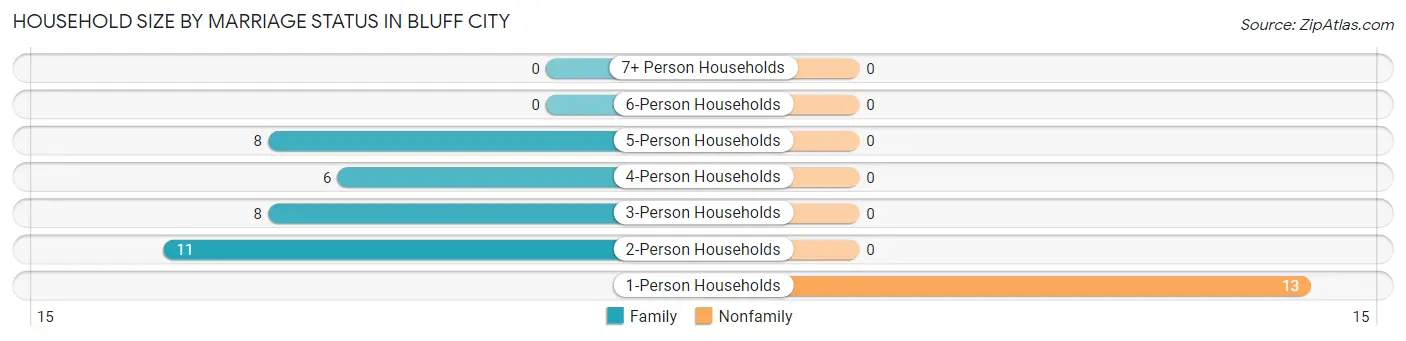
| Household Size | Family Households | Nonfamily Households |
| 1-Person Households | - | 13 (28.3%) |
| 2-Person Households | 11 (23.9%) | 0 (0.0%) |
| 3-Person Households | 8 (17.4%) | 0 (0.0%) |
| 4-Person Households | 6 (13.0%) | 0 (0.0%) |
| 5-Person Households | 8 (17.4%) | 0 (0.0%) |
| 6-Person Households | 0 (0.0%) | 0 (0.0%) |
| 7+ Person Households | 0 (0.0%) | 0 (0.0%) |
| Total | 33 (71.7%) | 13 (28.3%) |
Female Fertility in Bluff City
Fertility by Age in Bluff City
| Age Bracket | Women with Births | Births / 1,000 Women |
| 15 to 19 years | 0 (0.0%) | 0.0 |
| 20 to 34 years | 0 (0.0%) | 0.0 |
| 35 to 50 years | 0 (0.0%) | 0.0 |
| Total | 0 (0.0%) | 0.0 |
Fertility by Age by Marriage Status in Bluff City
| Age Bracket | Married | Unmarried |
| 15 to 19 years | 0 (0.0%) | 0 (0.0%) |
| 20 to 34 years | 0 (0.0%) | 0 (0.0%) |
| 35 to 50 years | 0 (0.0%) | 0 (0.0%) |
| Total | 0 (0.0%) | 0 (0.0%) |
Fertility by Education in Bluff City
| Educational Attainment | Women with Births | Births / 1,000 Women |
| Less than High School | 0 (0.0%) | 0.0 |
| High School Diploma | 0 (0.0%) | 0.0 |
| College or Associate's Degree | 0 (0.0%) | 0.0 |
| Bachelor's Degree | 0 (0.0%) | 0.0 |
| Graduate Degree | 0 (0.0%) | 0.0 |
| Total | 0 (0.0%) | 0.0 |
Fertility by Education by Marriage Status in Bluff City
| Educational Attainment | Married | Unmarried |
| Less than High School | 0 (0.0%) | 0 (0.0%) |
| High School Diploma | 0 (0.0%) | 0 (0.0%) |
| College or Associate's Degree | 0 (0.0%) | 0 (0.0%) |
| Bachelor's Degree | 0 (0.0%) | 0 (0.0%) |
| Graduate Degree | 0 (0.0%) | 0 (0.0%) |
| Total | 0 (0.0%) | 0 (0.0%) |
Employment Characteristics in Bluff City
Employment by Class of Employer in Bluff City
Among the 56 employed individuals in Bluff City, private company employees (47 | 83.9%), federal government employees (7 | 12.5%), and state government employees (2 | 3.6%) make up the most common classes of employment.
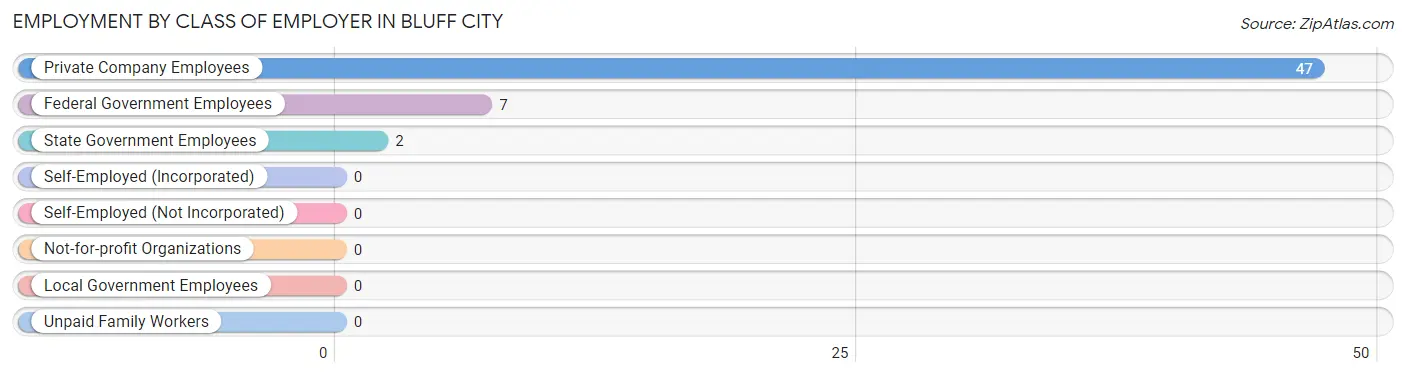
| Employer Class | # Employees | % Employees |
| Private Company Employees | 47 | 83.9% |
| Self-Employed (Incorporated) | 0 | 0.0% |
| Self-Employed (Not Incorporated) | 0 | 0.0% |
| Not-for-profit Organizations | 0 | 0.0% |
| Local Government Employees | 0 | 0.0% |
| State Government Employees | 2 | 3.6% |
| Federal Government Employees | 7 | 12.5% |
| Unpaid Family Workers | 0 | 0.0% |
| Total | 56 | 100.0% |
Employment Status by Age in Bluff City
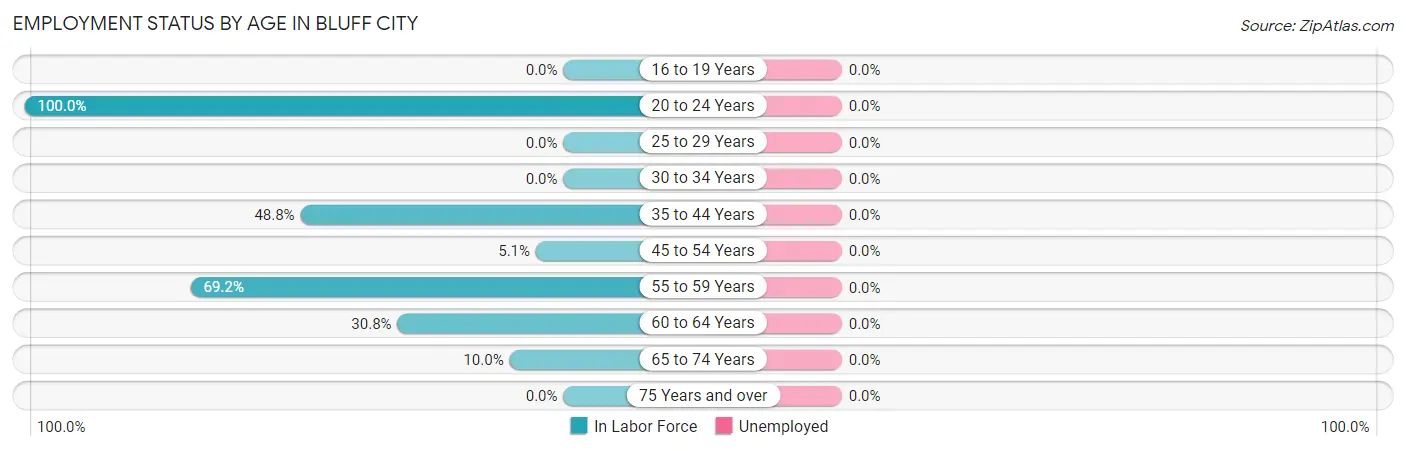
| Age Bracket | In Labor Force | Unemployed |
| 16 to 19 Years | 0 (0.0%) | 0 (0.0%) |
| 20 to 24 Years | 3 (100.0%) | 0 (0.0%) |
| 25 to 29 Years | 0 (0.0%) | 0 (0.0%) |
| 30 to 34 Years | 0 (0.0%) | 0 (0.0%) |
| 35 to 44 Years | 21 (48.8%) | 0 (0.0%) |
| 45 to 54 Years | 7 (5.1%) | 0 (0.0%) |
| 55 to 59 Years | 18 (69.2%) | 0 (0.0%) |
| 60 to 64 Years | 4 (30.8%) | 0 (0.0%) |
| 65 to 74 Years | 3 (10.0%) | 0 (0.0%) |
| 75 Years and over | 0 (0.0%) | 0 (0.0%) |
| Total | 56 (22.1%) | 0 (0.0%) |
Employment Status by Educational Attainment in Bluff City
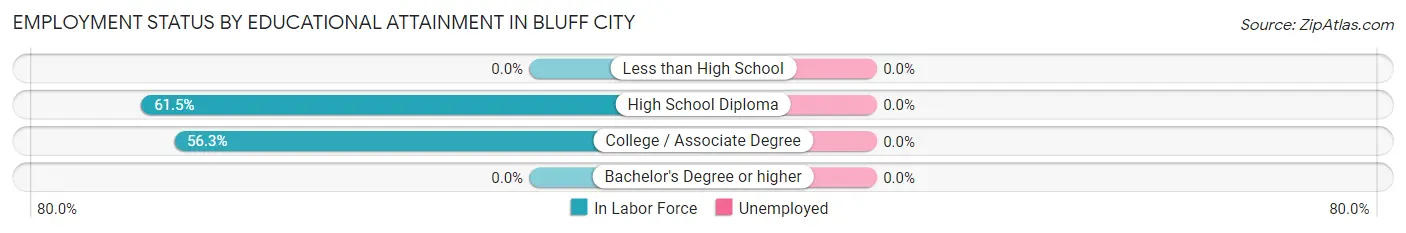
| Educational Attainment | In Labor Force | Unemployed |
| Less than High School | 0 (0.0%) | 0 (0.0%) |
| High School Diploma | 32 (61.5%) | 0 (0.0%) |
| College / Associate Degree | 18 (56.3%) | 0 (0.0%) |
| Bachelor's Degree or higher | 0 (0.0%) | 0 (0.0%) |
| Total | 50 (22.7%) | 0 (0.0%) |
Employment Occupations by Sex in Bluff City
Management, Business, Science and Arts Occupations
The most common Management, Business, Science and Arts occupations in Bluff City are Computers, Engineering & Science (2 | 3.6%), Architecture & Engineering (2 | 3.6%), Health Diagnosing & Treating (1 | 1.8%), and Health Technologists (1 | 1.8%).
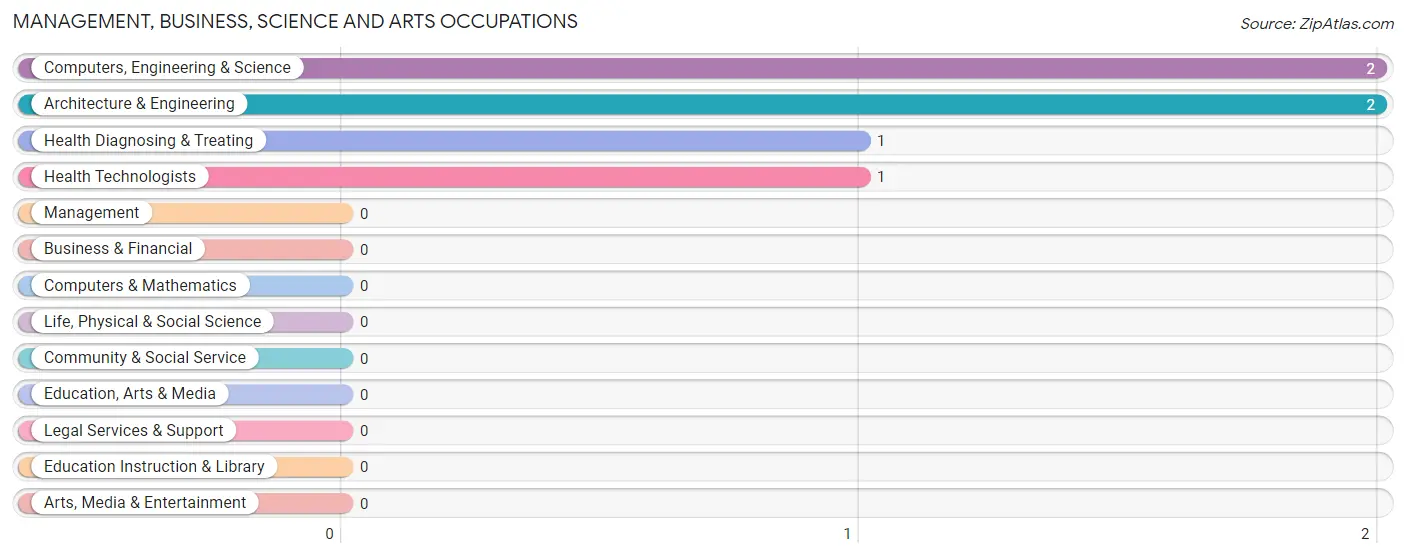
Management, Business, Science and Arts Occupations by Sex
Within the Management, Business, Science and Arts occupations in Bluff City, the most male-oriented occupations are Computers, Engineering & Science (100.0%), and Architecture & Engineering (100.0%), while the most female-oriented occupations are Health Diagnosing & Treating (100.0%), and Health Technologists (100.0%).
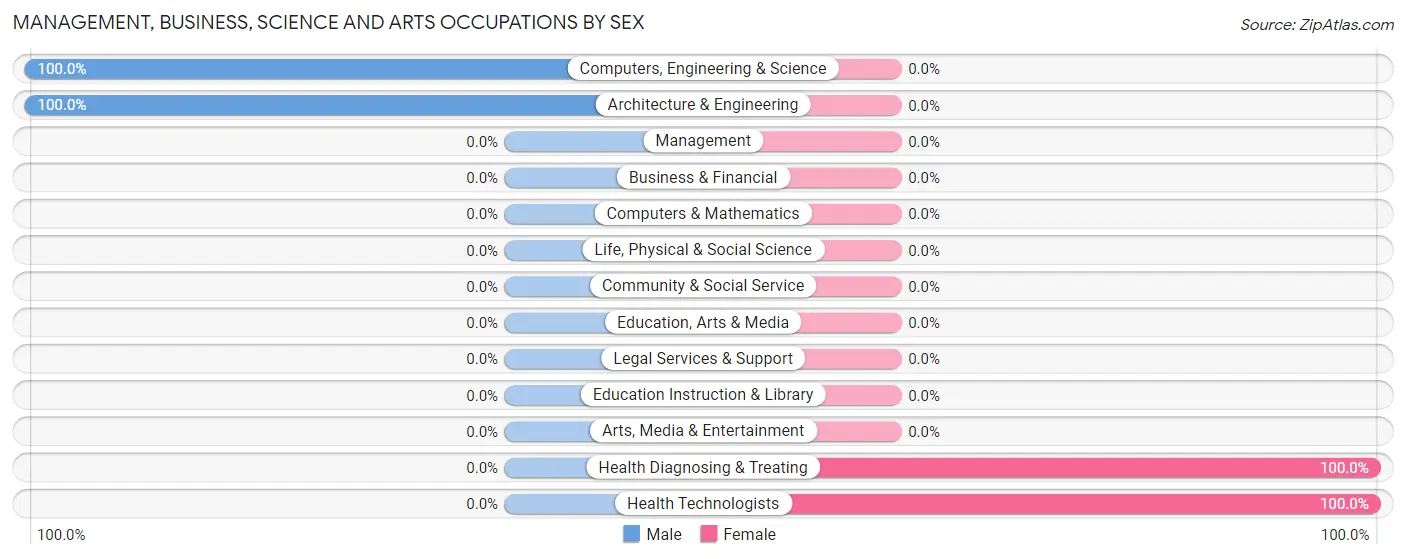
| Occupation | Male | Female |
| Management | 0 (0.0%) | 0 (0.0%) |
| Business & Financial | 0 (0.0%) | 0 (0.0%) |
| Computers, Engineering & Science | 2 (100.0%) | 0 (0.0%) |
| Computers & Mathematics | 0 (0.0%) | 0 (0.0%) |
| Architecture & Engineering | 2 (100.0%) | 0 (0.0%) |
| Life, Physical & Social Science | 0 (0.0%) | 0 (0.0%) |
| Community & Social Service | 0 (0.0%) | 0 (0.0%) |
| Education, Arts & Media | 0 (0.0%) | 0 (0.0%) |
| Legal Services & Support | 0 (0.0%) | 0 (0.0%) |
| Education Instruction & Library | 0 (0.0%) | 0 (0.0%) |
| Arts, Media & Entertainment | 0 (0.0%) | 0 (0.0%) |
| Health Diagnosing & Treating | 0 (0.0%) | 1 (100.0%) |
| Health Technologists | 0 (0.0%) | 1 (100.0%) |
| Total (Category) | 2 (66.7%) | 1 (33.3%) |
| Total (Overall) | 23 (41.1%) | 33 (58.9%) |
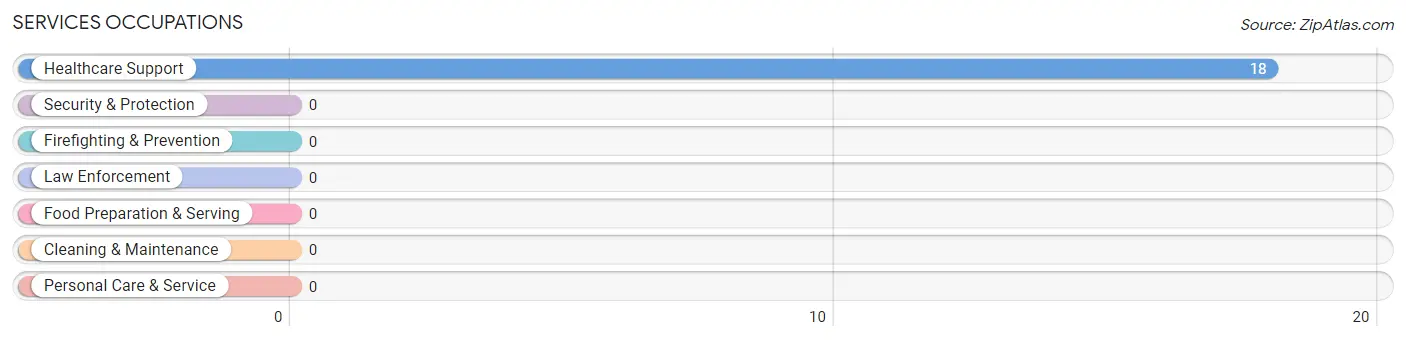
Services Occupations
The most common Services occupations in Bluff City are , and Healthcare Support (18 | 32.1%).
Services Occupations by Sex
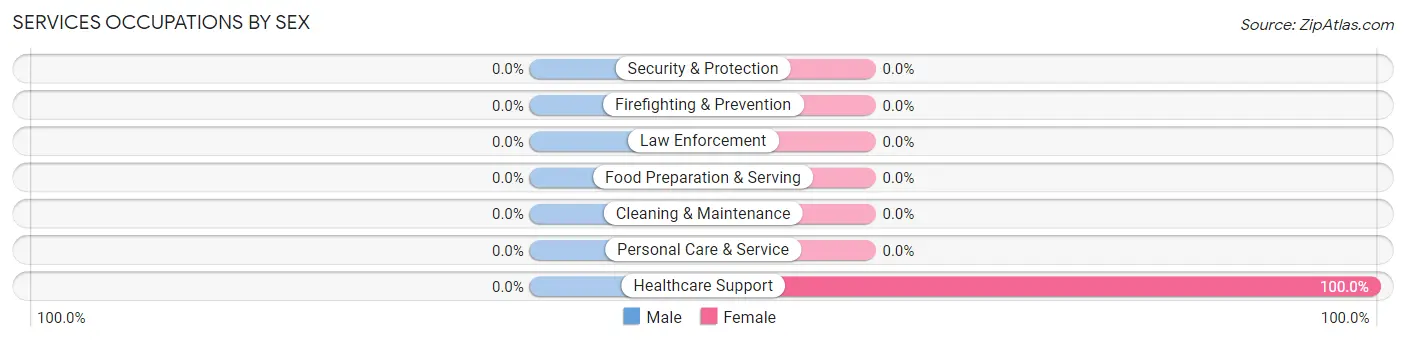
| Occupation | Male | Female |
| Healthcare Support | 0 (0.0%) | 18 (100.0%) |
| Security & Protection | 0 (0.0%) | 0 (0.0%) |
| Firefighting & Prevention | 0 (0.0%) | 0 (0.0%) |
| Law Enforcement | 0 (0.0%) | 0 (0.0%) |
| Food Preparation & Serving | 0 (0.0%) | 0 (0.0%) |
| Cleaning & Maintenance | 0 (0.0%) | 0 (0.0%) |
| Personal Care & Service | 0 (0.0%) | 0 (0.0%) |
| Total (Category) | 0 (0.0%) | 18 (100.0%) |
| Total (Overall) | 23 (41.1%) | 33 (58.9%) |
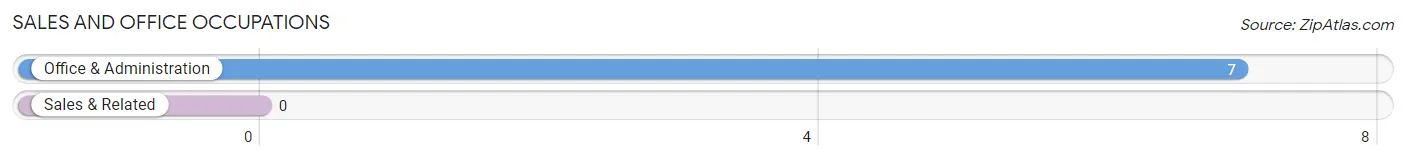
Sales and Office Occupations
The most common Sales and Office occupations in Bluff City are , and Office & Administration (7 | 12.5%).
Sales and Office Occupations by Sex
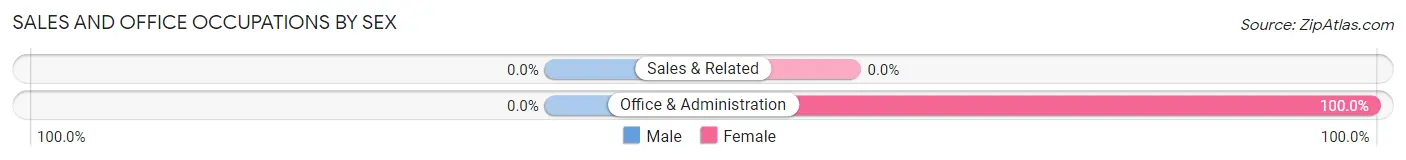
| Occupation | Male | Female |
| Sales & Related | 0 (0.0%) | 0 (0.0%) |
| Office & Administration | 0 (0.0%) | 7 (100.0%) |
| Total (Category) | 0 (0.0%) | 7 (100.0%) |
| Total (Overall) | 23 (41.1%) | 33 (58.9%) |
Natural Resources, Construction and Maintenance Occupations
The most common Natural Resources, Construction and Maintenance occupations in Bluff City are , and Installation, Maintenance & Repair (1 | 1.8%).
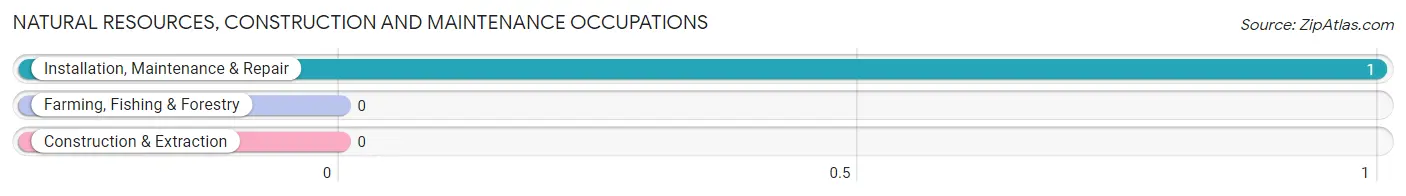
Natural Resources, Construction and Maintenance Occupations by Sex

| Occupation | Male | Female |
| Farming, Fishing & Forestry | 0 (0.0%) | 0 (0.0%) |
| Construction & Extraction | 0 (0.0%) | 0 (0.0%) |
| Installation, Maintenance & Repair | 1 (100.0%) | 0 (0.0%) |
| Total (Category) | 1 (100.0%) | 0 (0.0%) |
| Total (Overall) | 23 (41.1%) | 33 (58.9%) |
Production, Transportation and Moving Occupations
The most common Production, Transportation and Moving occupations in Bluff City are Production (21 | 37.5%), Transportation (3 | 5.4%), and Material Moving (3 | 5.4%).
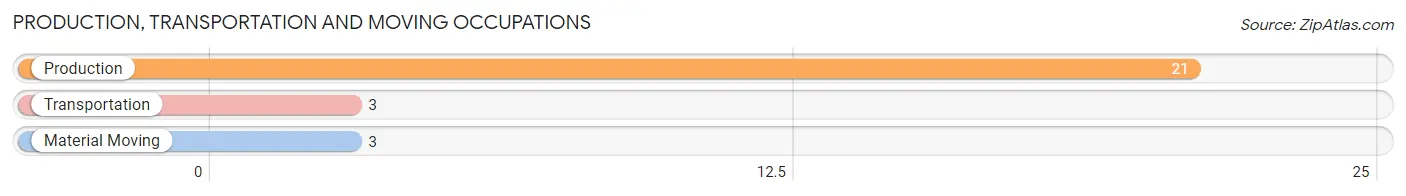
Production, Transportation and Moving Occupations by Sex
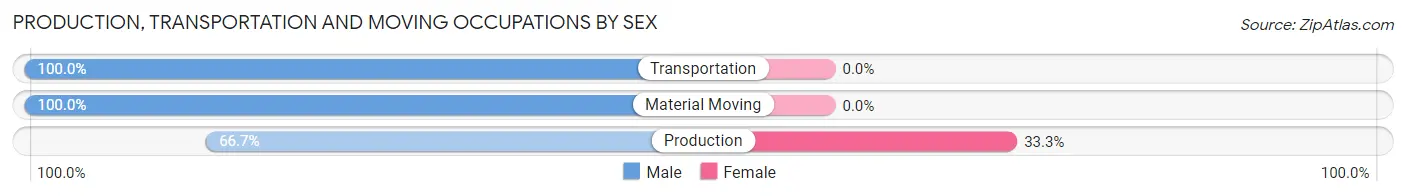
| Occupation | Male | Female |
| Production | 14 (66.7%) | 7 (33.3%) |
| Transportation | 3 (100.0%) | 0 (0.0%) |
| Material Moving | 3 (100.0%) | 0 (0.0%) |
| Total (Category) | 20 (74.1%) | 7 (25.9%) |
| Total (Overall) | 23 (41.1%) | 33 (58.9%) |
Employment Industries by Sex in Bluff City
Employment Industries in Bluff City
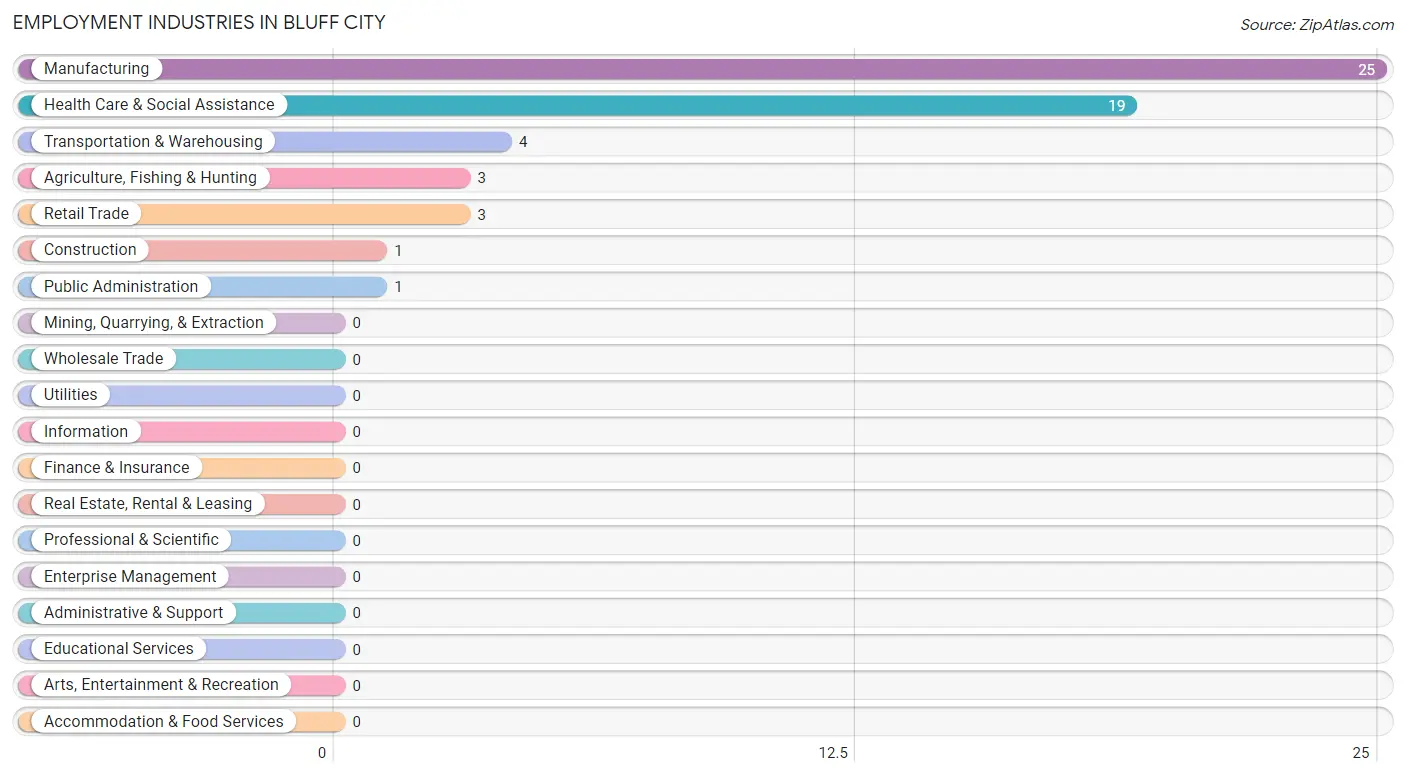
The major employment industries in Bluff City include Manufacturing (25 | 44.6%), Health Care & Social Assistance (19 | 33.9%), Transportation & Warehousing (4 | 7.1%), Agriculture, Fishing & Hunting (3 | 5.4%), and Retail Trade (3 | 5.4%).
Employment Industries by Sex in Bluff City
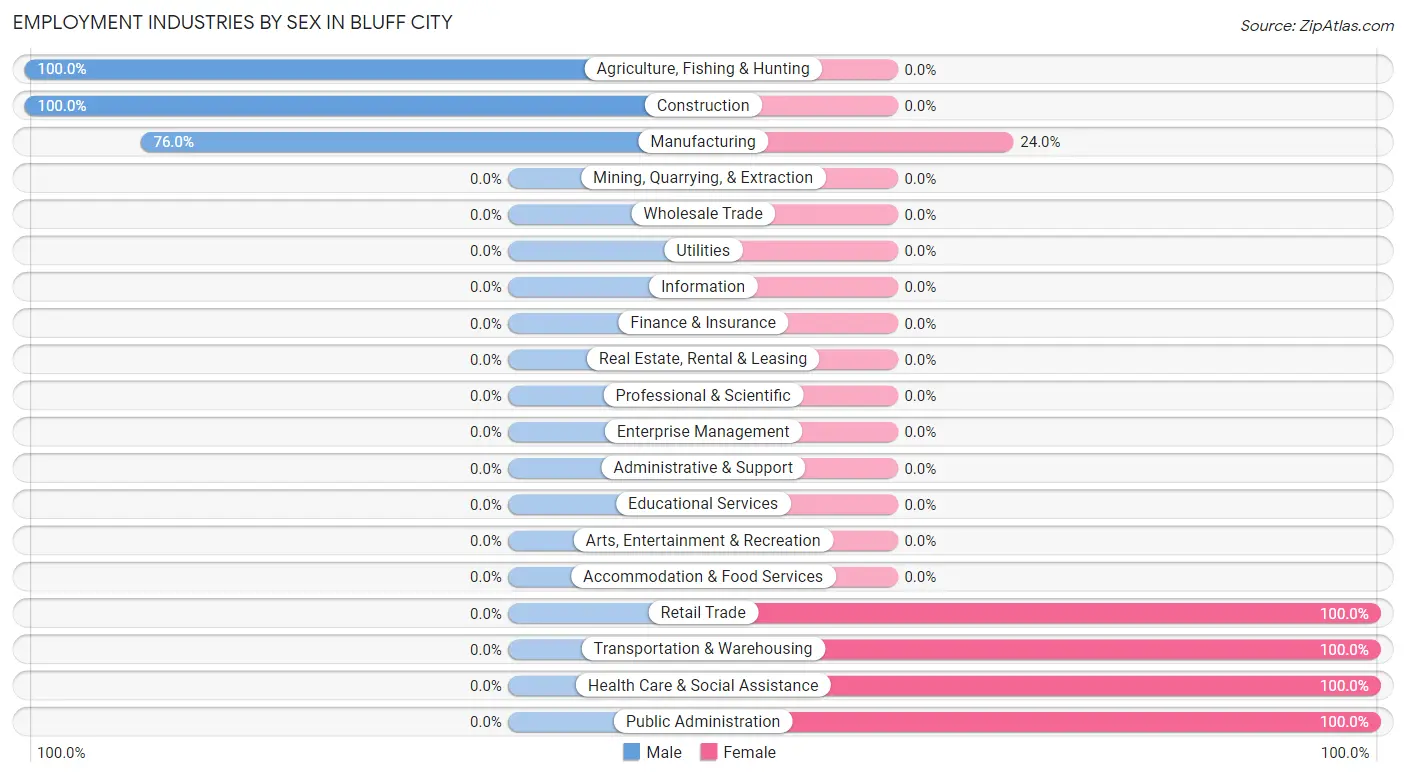
The Bluff City industries that see more men than women are Agriculture, Fishing & Hunting (100.0%), Construction (100.0%), and Manufacturing (76.0%), whereas the industries that tend to have a higher number of women are Retail Trade (100.0%), Transportation & Warehousing (100.0%), and Health Care & Social Assistance (100.0%).
| Industry | Male | Female |
| Agriculture, Fishing & Hunting | 3 (100.0%) | 0 (0.0%) |
| Mining, Quarrying, & Extraction | 0 (0.0%) | 0 (0.0%) |
| Construction | 1 (100.0%) | 0 (0.0%) |
| Manufacturing | 19 (76.0%) | 6 (24.0%) |
| Wholesale Trade | 0 (0.0%) | 0 (0.0%) |
| Retail Trade | 0 (0.0%) | 3 (100.0%) |
| Transportation & Warehousing | 0 (0.0%) | 4 (100.0%) |
| Utilities | 0 (0.0%) | 0 (0.0%) |
| Information | 0 (0.0%) | 0 (0.0%) |
| Finance & Insurance | 0 (0.0%) | 0 (0.0%) |
| Real Estate, Rental & Leasing | 0 (0.0%) | 0 (0.0%) |
| Professional & Scientific | 0 (0.0%) | 0 (0.0%) |
| Enterprise Management | 0 (0.0%) | 0 (0.0%) |
| Administrative & Support | 0 (0.0%) | 0 (0.0%) |
| Educational Services | 0 (0.0%) | 0 (0.0%) |
| Health Care & Social Assistance | 0 (0.0%) | 19 (100.0%) |
| Arts, Entertainment & Recreation | 0 (0.0%) | 0 (0.0%) |
| Accommodation & Food Services | 0 (0.0%) | 0 (0.0%) |
| Public Administration | 0 (0.0%) | 1 (100.0%) |
| Total | 23 (41.1%) | 33 (58.9%) |
Education in Bluff City
School Enrollment in Bluff City
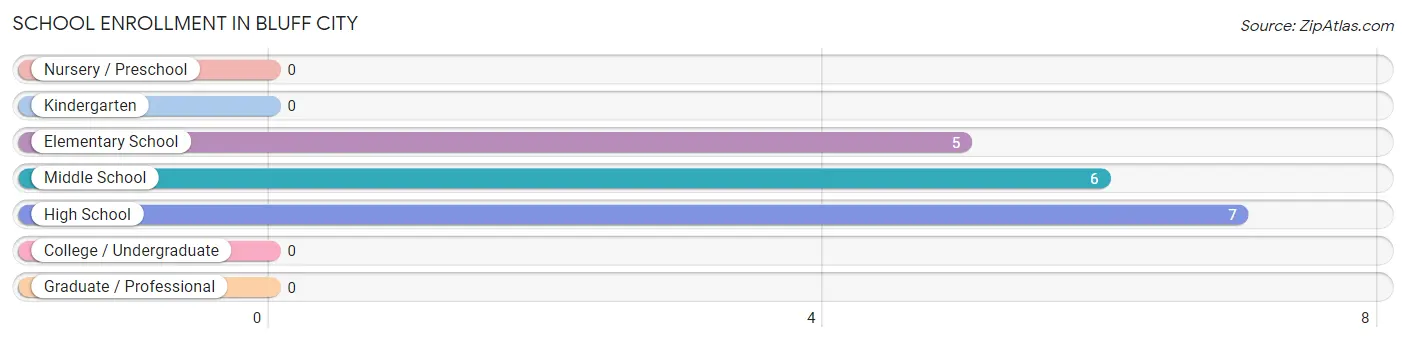
The most common levels of schooling among the 18 students in Bluff City are high school (7 | 38.9%), middle school (6 | 33.3%), and elementary school (5 | 27.8%).
| School Level | # Students | % Students |
| Nursery / Preschool | 0 | 0.0% |
| Kindergarten | 0 | 0.0% |
| Elementary School | 5 | 27.8% |
| Middle School | 6 | 33.3% |
| High School | 7 | 38.9% |
| College / Undergraduate | 0 | 0.0% |
| Graduate / Professional | 0 | 0.0% |
| Total | 18 | 100.0% |
School Enrollment by Age by Funding Source in Bluff City
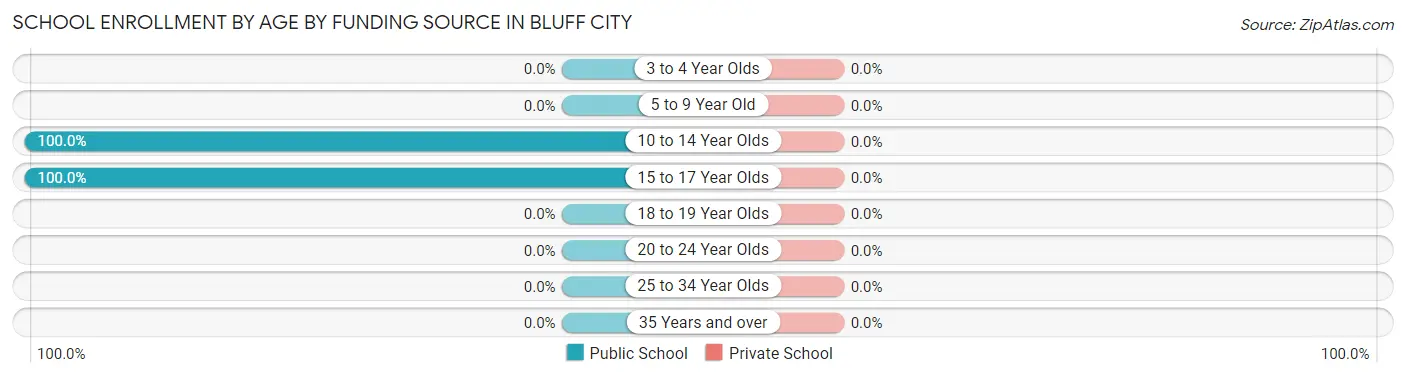
| Age Bracket | Public School | Private School |
| 3 to 4 Year Olds | 0 (0.0%) | 0 (0.0%) |
| 5 to 9 Year Old | 0 (0.0%) | 0 (0.0%) |
| 10 to 14 Year Olds | 11 (100.0%) | 0 (0.0%) |
| 15 to 17 Year Olds | 7 (100.0%) | 0 (0.0%) |
| 18 to 19 Year Olds | 0 (0.0%) | 0 (0.0%) |
| 20 to 24 Year Olds | 0 (0.0%) | 0 (0.0%) |
| 25 to 34 Year Olds | 0 (0.0%) | 0 (0.0%) |
| 35 Years and over | 0 (0.0%) | 0 (0.0%) |
| Total | 18 (100.0%) | 0 (0.0%) |
Educational Attainment by Field of Study in Bluff City
Science & technology (2 | 25.0%), business (2 | 25.0%), education (2 | 25.0%), and arts & humanities (2 | 25.0%) are the most common fields of study among 8 individuals in Bluff City who have obtained a bachelor's degree or higher.
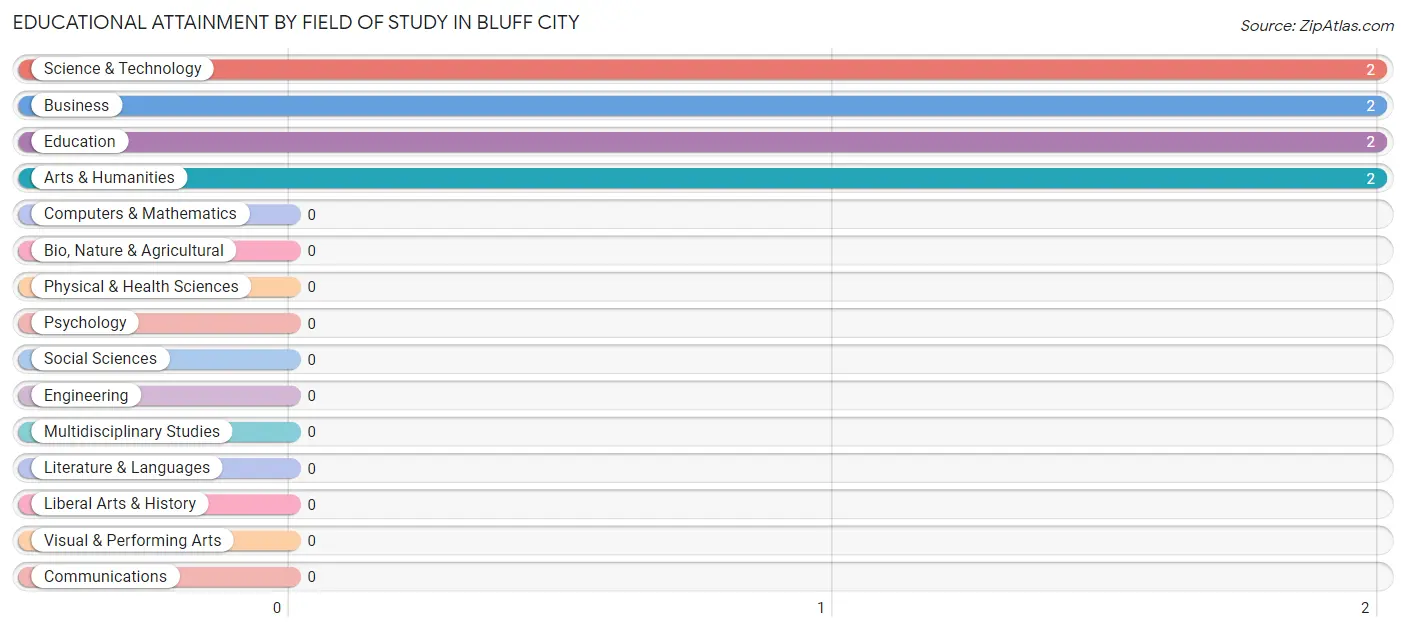
| Field of Study | # Graduates | % Graduates |
| Computers & Mathematics | 0 | 0.0% |
| Bio, Nature & Agricultural | 0 | 0.0% |
| Physical & Health Sciences | 0 | 0.0% |
| Psychology | 0 | 0.0% |
| Social Sciences | 0 | 0.0% |
| Engineering | 0 | 0.0% |
| Multidisciplinary Studies | 0 | 0.0% |
| Science & Technology | 2 | 25.0% |
| Business | 2 | 25.0% |
| Education | 2 | 25.0% |
| Literature & Languages | 0 | 0.0% |
| Liberal Arts & History | 0 | 0.0% |
| Visual & Performing Arts | 0 | 0.0% |
| Communications | 0 | 0.0% |
| Arts & Humanities | 2 | 25.0% |
| Total | 8 | 100.0% |
Transportation & Commute in Bluff City
Vehicle Availability by Sex in Bluff City
The most prevalent vehicle ownership categories in Bluff City are males with 3 vehicles (13, accounting for 56.5%) and females with 3 vehicles (6, making up 39.4%).
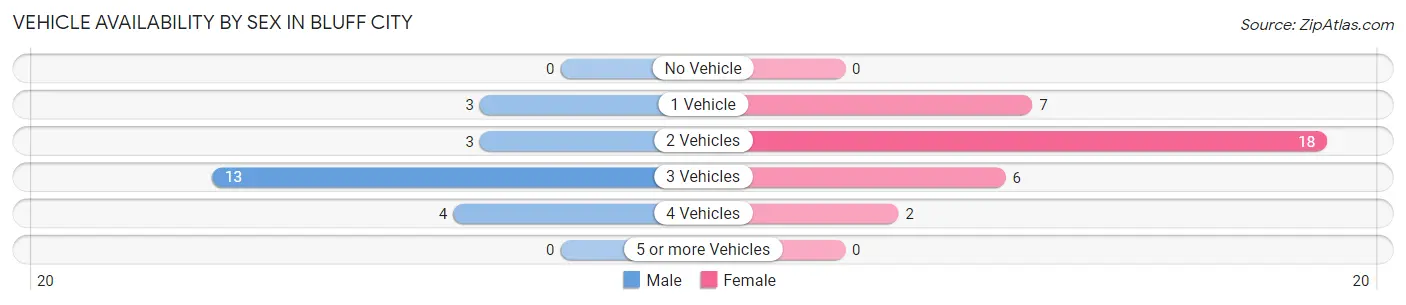
| Vehicles Available | Male | Female |
| No Vehicle | 0 (0.0%) | 0 (0.0%) |
| 1 Vehicle | 3 (13.0%) | 7 (21.2%) |
| 2 Vehicles | 3 (13.0%) | 18 (54.5%) |
| 3 Vehicles | 13 (56.5%) | 6 (18.2%) |
| 4 Vehicles | 4 (17.4%) | 2 (6.1%) |
| 5 or more Vehicles | 0 (0.0%) | 0 (0.0%) |
| Total | 23 (100.0%) | 33 (100.0%) |
Commute Time in Bluff City
The most frequently occuring commute durations in Bluff City are 35 to 39 minutes (21 commuters, 37.5%), 20 to 24 minutes (12 commuters, 21.4%), and 45 to 59 minutes (9 commuters, 16.1%).

| Commute Time | # Commuters | % Commuters |
| Less than 5 Minutes | 4 | 7.1% |
| 5 to 9 Minutes | 0 | 0.0% |
| 10 to 14 Minutes | 0 | 0.0% |
| 15 to 19 Minutes | 0 | 0.0% |
| 20 to 24 Minutes | 12 | 21.4% |
| 25 to 29 Minutes | 0 | 0.0% |
| 30 to 34 Minutes | 5 | 8.9% |
| 35 to 39 Minutes | 21 | 37.5% |
| 40 to 44 Minutes | 2 | 3.6% |
| 45 to 59 Minutes | 9 | 16.1% |
| 60 to 89 Minutes | 3 | 5.4% |
| 90 or more Minutes | 0 | 0.0% |
Commute Time by Sex in Bluff City
The most common commute times in Bluff City are 20 to 24 minutes (12 commuters, 52.2%) for males and 35 to 39 minutes (21 commuters, 63.6%) for females.
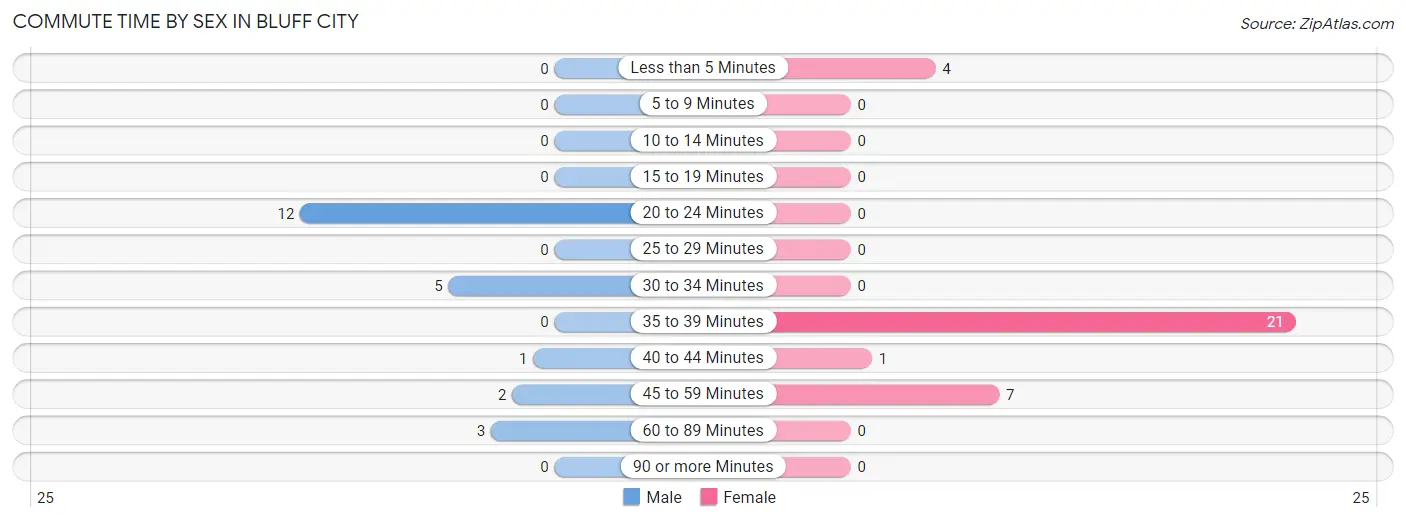
| Commute Time | Male | Female |
| Less than 5 Minutes | 0 (0.0%) | 4 (12.1%) |
| 5 to 9 Minutes | 0 (0.0%) | 0 (0.0%) |
| 10 to 14 Minutes | 0 (0.0%) | 0 (0.0%) |
| 15 to 19 Minutes | 0 (0.0%) | 0 (0.0%) |
| 20 to 24 Minutes | 12 (52.2%) | 0 (0.0%) |
| 25 to 29 Minutes | 0 (0.0%) | 0 (0.0%) |
| 30 to 34 Minutes | 5 (21.7%) | 0 (0.0%) |
| 35 to 39 Minutes | 0 (0.0%) | 21 (63.6%) |
| 40 to 44 Minutes | 1 (4.3%) | 1 (3.0%) |
| 45 to 59 Minutes | 2 (8.7%) | 7 (21.2%) |
| 60 to 89 Minutes | 3 (13.0%) | 0 (0.0%) |
| 90 or more Minutes | 0 (0.0%) | 0 (0.0%) |
Time of Departure to Work by Sex in Bluff City
The most frequent times of departure to work in Bluff City are 6:00 AM to 6:29 AM (20, 87.0%) for males and 6:00 AM to 6:29 AM (18, 54.5%) for females.
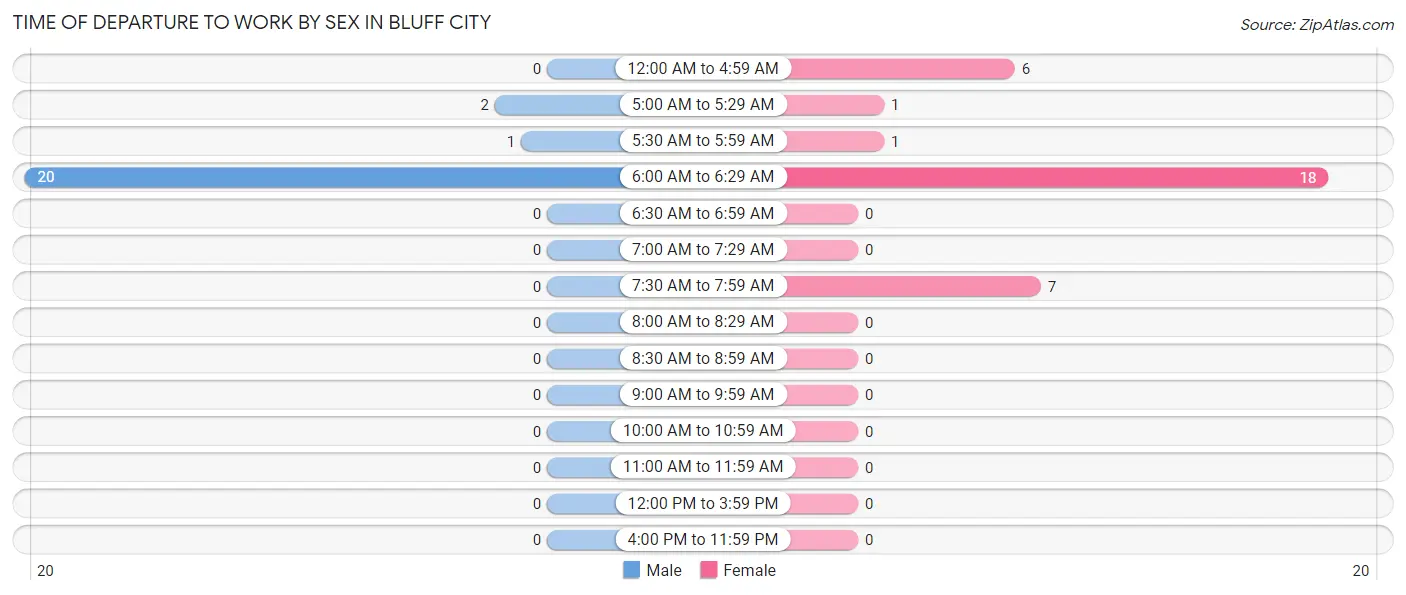
| Time of Departure | Male | Female |
| 12:00 AM to 4:59 AM | 0 (0.0%) | 6 (18.2%) |
| 5:00 AM to 5:29 AM | 2 (8.7%) | 1 (3.0%) |
| 5:30 AM to 5:59 AM | 1 (4.3%) | 1 (3.0%) |
| 6:00 AM to 6:29 AM | 20 (87.0%) | 18 (54.5%) |
| 6:30 AM to 6:59 AM | 0 (0.0%) | 0 (0.0%) |
| 7:00 AM to 7:29 AM | 0 (0.0%) | 0 (0.0%) |
| 7:30 AM to 7:59 AM | 0 (0.0%) | 7 (21.2%) |
| 8:00 AM to 8:29 AM | 0 (0.0%) | 0 (0.0%) |
| 8:30 AM to 8:59 AM | 0 (0.0%) | 0 (0.0%) |
| 9:00 AM to 9:59 AM | 0 (0.0%) | 0 (0.0%) |
| 10:00 AM to 10:59 AM | 0 (0.0%) | 0 (0.0%) |
| 11:00 AM to 11:59 AM | 0 (0.0%) | 0 (0.0%) |
| 12:00 PM to 3:59 PM | 0 (0.0%) | 0 (0.0%) |
| 4:00 PM to 11:59 PM | 0 (0.0%) | 0 (0.0%) |
| Total | 23 (100.0%) | 33 (100.0%) |
Housing Occupancy in Bluff City
Occupancy by Ownership in Bluff City
Of the total 46 dwellings in Bluff City, owner-occupied units account for 37 (80.4%), while renter-occupied units make up 9 (19.6%).
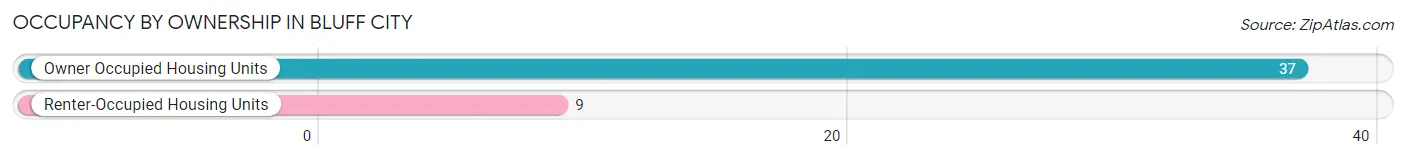
| Occupancy | # Housing Units | % Housing Units |
| Owner Occupied Housing Units | 37 | 80.4% |
| Renter-Occupied Housing Units | 9 | 19.6% |
| Total Occupied Housing Units | 46 | 100.0% |
Occupancy by Household Size in Bluff City
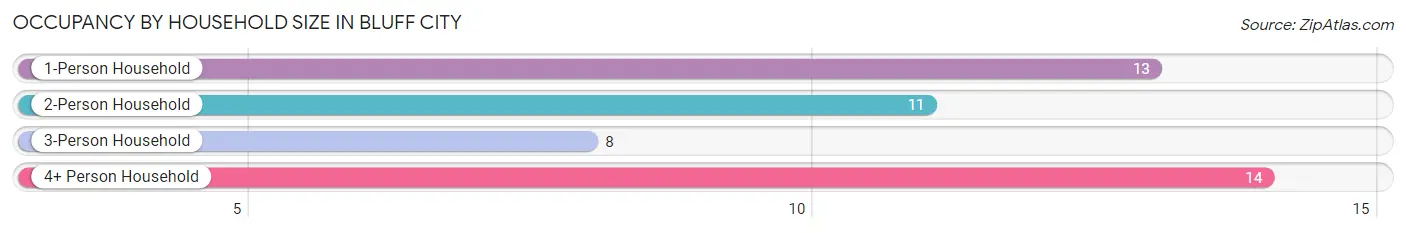
| Household Size | # Housing Units | % Housing Units |
| 1-Person Household | 13 | 28.3% |
| 2-Person Household | 11 | 23.9% |
| 3-Person Household | 8 | 17.4% |
| 4+ Person Household | 14 | 30.4% |
| Total Housing Units | 46 | 100.0% |
Occupancy by Ownership by Household Size in Bluff City
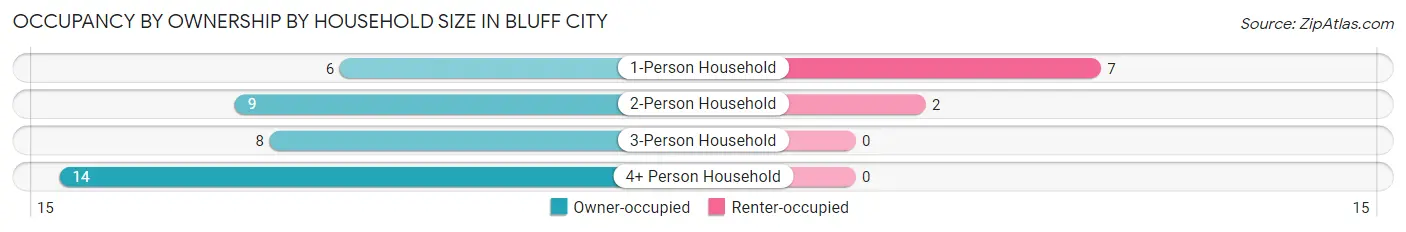
| Household Size | Owner-occupied | Renter-occupied |
| 1-Person Household | 6 (46.2%) | 7 (53.8%) |
| 2-Person Household | 9 (81.8%) | 2 (18.2%) |
| 3-Person Household | 8 (100.0%) | 0 (0.0%) |
| 4+ Person Household | 14 (100.0%) | 0 (0.0%) |
| Total Housing Units | 37 (80.4%) | 9 (19.6%) |
Occupancy by Educational Attainment in Bluff City
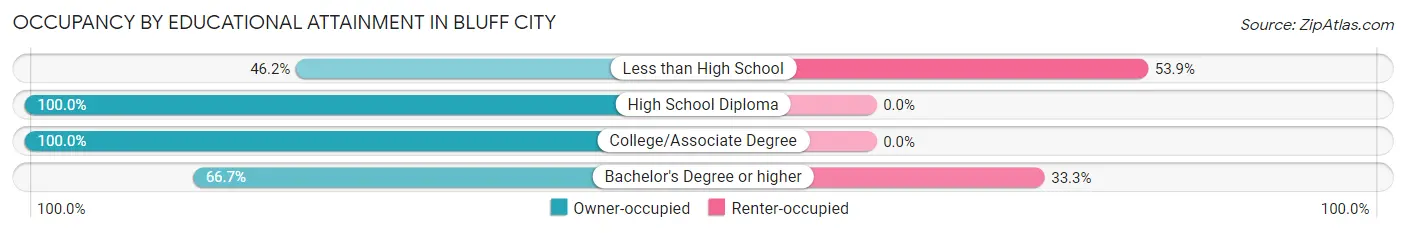
| Household Size | Owner-occupied | Renter-occupied |
| Less than High School | 6 (46.2%) | 7 (53.8%) |
| High School Diploma | 16 (100.0%) | 0 (0.0%) |
| College/Associate Degree | 11 (100.0%) | 0 (0.0%) |
| Bachelor's Degree or higher | 4 (66.7%) | 2 (33.3%) |
Occupancy by Age of Householder in Bluff City
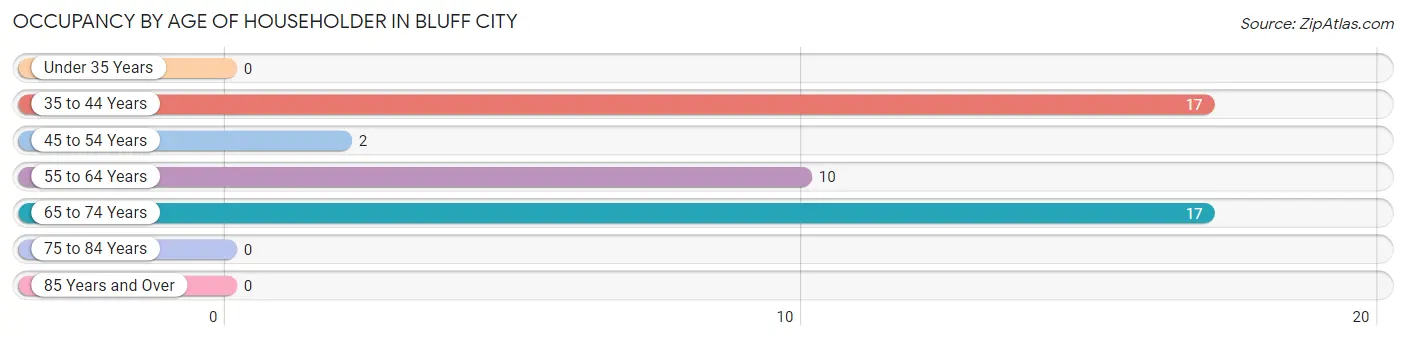
| Age Bracket | # Households | % Households |
| Under 35 Years | 0 | 0.0% |
| 35 to 44 Years | 17 | 37.0% |
| 45 to 54 Years | 2 | 4.3% |
| 55 to 64 Years | 10 | 21.7% |
| 65 to 74 Years | 17 | 37.0% |
| 75 to 84 Years | 0 | 0.0% |
| 85 Years and Over | 0 | 0.0% |
| Total | 46 | 100.0% |
Housing Finances in Bluff City
Median Income by Occupancy in Bluff City
| Occupancy Type | # Households | Median Income |
| Owner-Occupied | 37 (80.4%) | $0 |
| Renter-Occupied | 9 (19.6%) | $0 |
| Average | 46 (100.0%) | $0 |
Occupancy by Householder Income Bracket in Bluff City
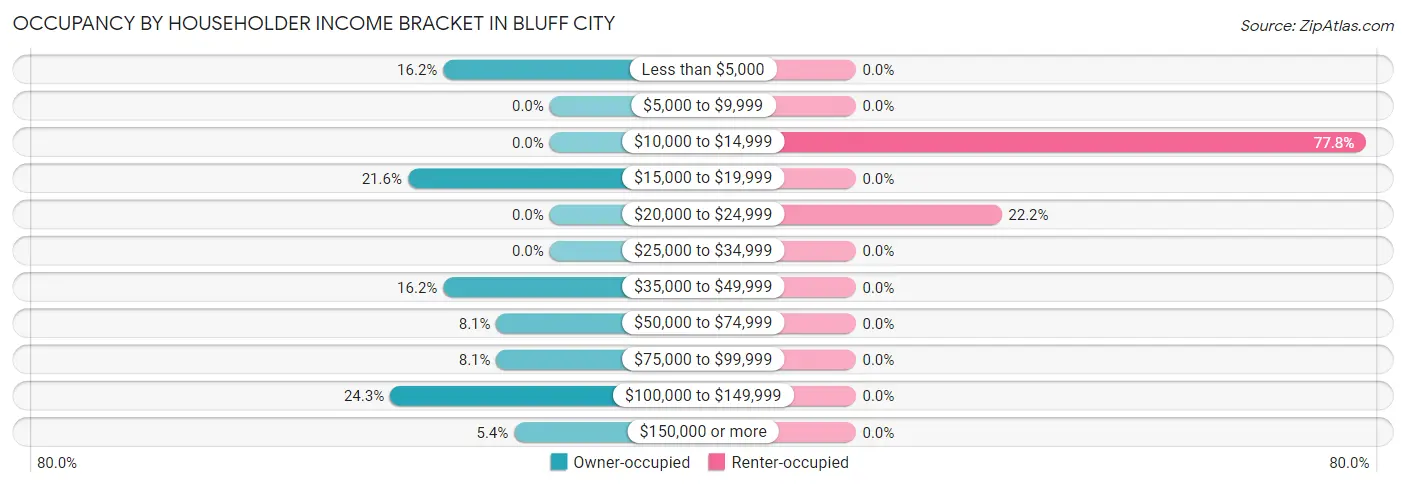
| Income Bracket | Owner-occupied | Renter-occupied |
| Less than $5,000 | 6 (16.2%) | 0 (0.0%) |
| $5,000 to $9,999 | 0 (0.0%) | 0 (0.0%) |
| $10,000 to $14,999 | 0 (0.0%) | 7 (77.8%) |
| $15,000 to $19,999 | 8 (21.6%) | 0 (0.0%) |
| $20,000 to $24,999 | 0 (0.0%) | 2 (22.2%) |
| $25,000 to $34,999 | 0 (0.0%) | 0 (0.0%) |
| $35,000 to $49,999 | 6 (16.2%) | 0 (0.0%) |
| $50,000 to $74,999 | 3 (8.1%) | 0 (0.0%) |
| $75,000 to $99,999 | 3 (8.1%) | 0 (0.0%) |
| $100,000 to $149,999 | 9 (24.3%) | 0 (0.0%) |
| $150,000 or more | 2 (5.4%) | 0 (0.0%) |
| Total | 37 (100.0%) | 9 (100.0%) |
Monthly Housing Cost Tiers in Bluff City
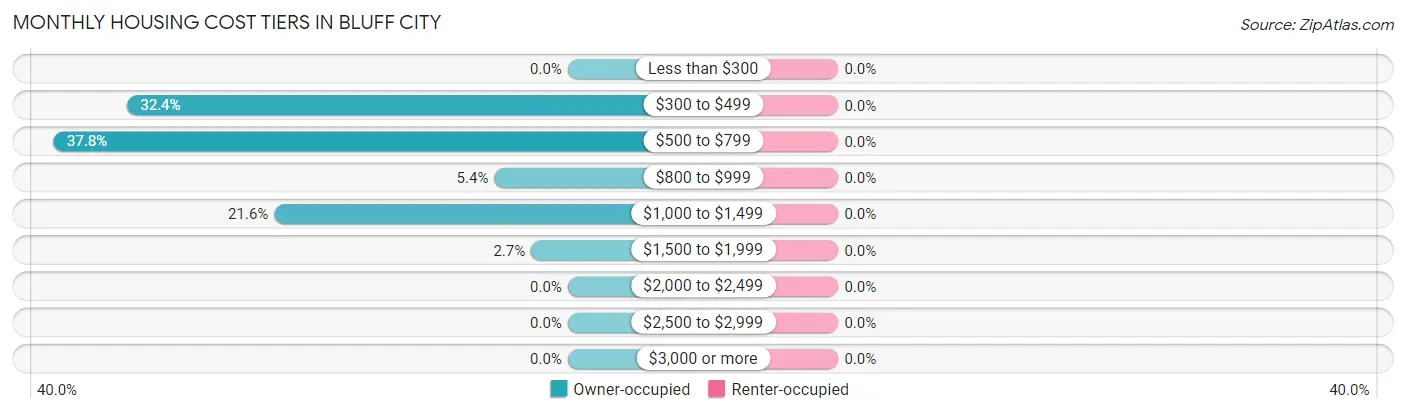
| Monthly Cost | Owner-occupied | Renter-occupied |
| Less than $300 | 0 (0.0%) | 0 (0.0%) |
| $300 to $499 | 12 (32.4%) | 0 (0.0%) |
| $500 to $799 | 14 (37.8%) | 0 (0.0%) |
| $800 to $999 | 2 (5.4%) | 0 (0.0%) |
| $1,000 to $1,499 | 8 (21.6%) | 0 (0.0%) |
| $1,500 to $1,999 | 1 (2.7%) | 0 (0.0%) |
| $2,000 to $2,499 | 0 (0.0%) | 0 (0.0%) |
| $2,500 to $2,999 | 0 (0.0%) | 0 (0.0%) |
| $3,000 or more | 0 (0.0%) | 0 (0.0%) |
| Total | 37 (100.0%) | 9 (100.0%) |
Physical Housing Characteristics in Bluff City
Housing Structures in Bluff City
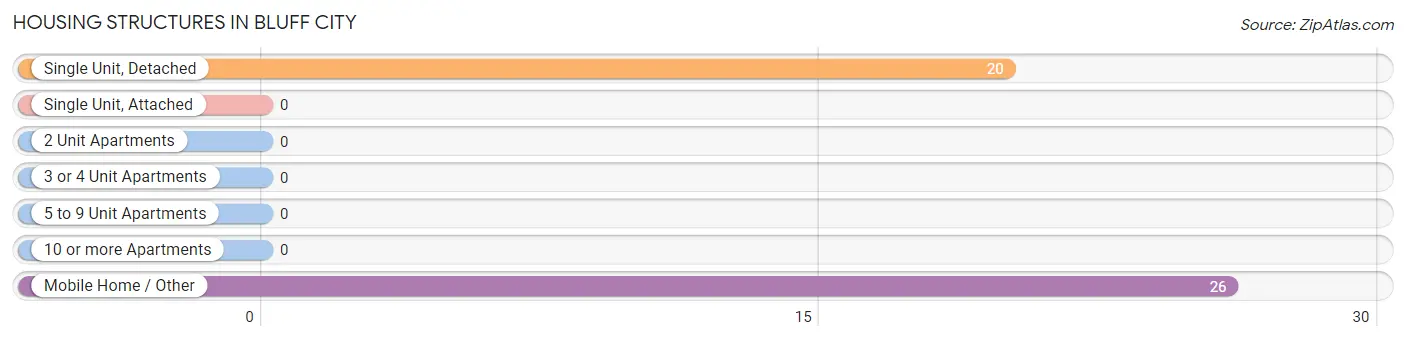
| Structure Type | # Housing Units | % Housing Units |
| Single Unit, Detached | 20 | 43.5% |
| Single Unit, Attached | 0 | 0.0% |
| 2 Unit Apartments | 0 | 0.0% |
| 3 or 4 Unit Apartments | 0 | 0.0% |
| 5 to 9 Unit Apartments | 0 | 0.0% |
| 10 or more Apartments | 0 | 0.0% |
| Mobile Home / Other | 26 | 56.5% |
| Total | 46 | 100.0% |
Housing Structures by Occupancy in Bluff City
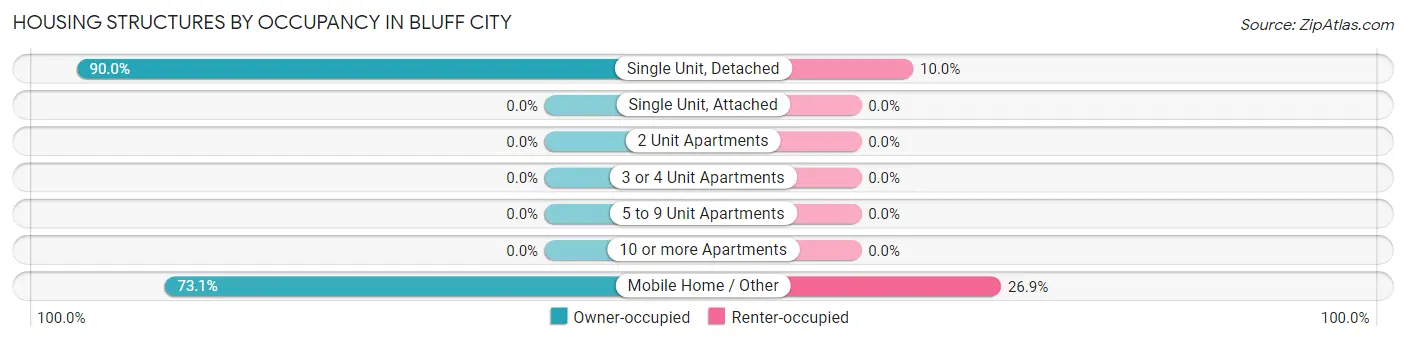
| Structure Type | Owner-occupied | Renter-occupied |
| Single Unit, Detached | 18 (90.0%) | 2 (10.0%) |
| Single Unit, Attached | 0 (0.0%) | 0 (0.0%) |
| 2 Unit Apartments | 0 (0.0%) | 0 (0.0%) |
| 3 or 4 Unit Apartments | 0 (0.0%) | 0 (0.0%) |
| 5 to 9 Unit Apartments | 0 (0.0%) | 0 (0.0%) |
| 10 or more Apartments | 0 (0.0%) | 0 (0.0%) |
| Mobile Home / Other | 19 (73.1%) | 7 (26.9%) |
| Total | 37 (80.4%) | 9 (19.6%) |
Housing Structures by Number of Rooms in Bluff City
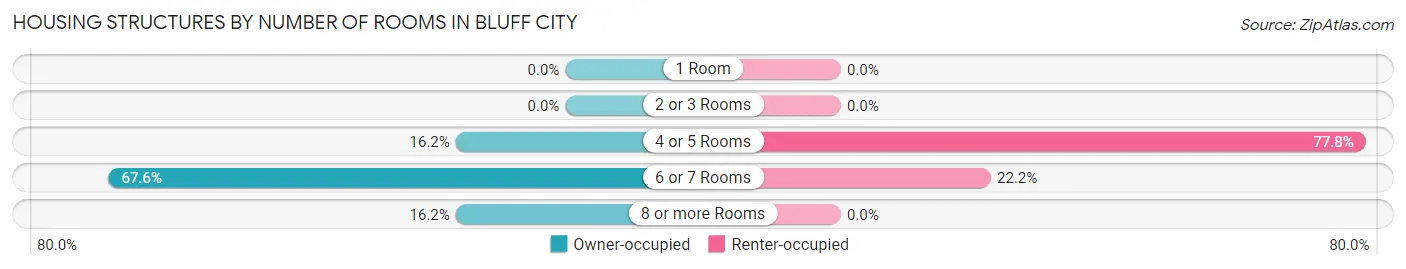
| Number of Rooms | Owner-occupied | Renter-occupied |
| 1 Room | 0 (0.0%) | 0 (0.0%) |
| 2 or 3 Rooms | 0 (0.0%) | 0 (0.0%) |
| 4 or 5 Rooms | 6 (16.2%) | 7 (77.8%) |
| 6 or 7 Rooms | 25 (67.6%) | 2 (22.2%) |
| 8 or more Rooms | 6 (16.2%) | 0 (0.0%) |
| Total | 37 (100.0%) | 9 (100.0%) |
Housing Structure by Heating Type in Bluff City
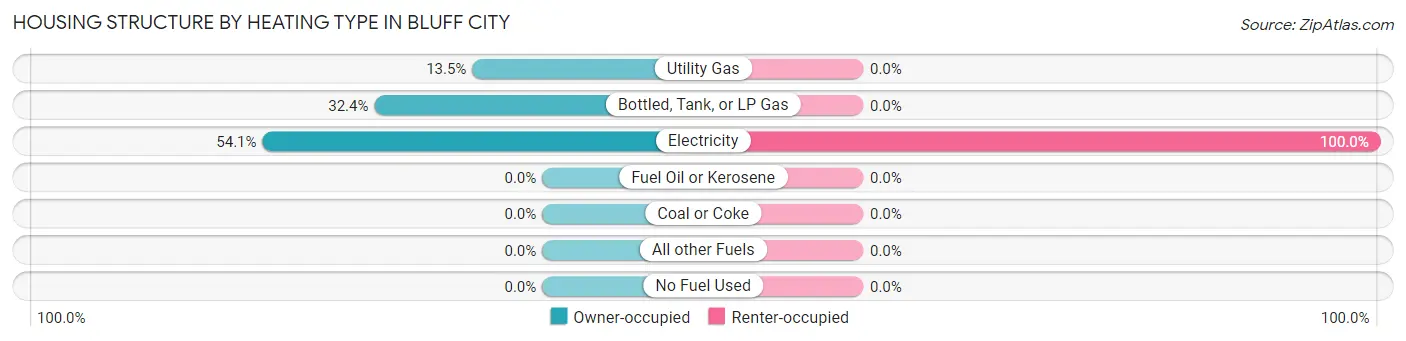
| Heating Type | Owner-occupied | Renter-occupied |
| Utility Gas | 5 (13.5%) | 0 (0.0%) |
| Bottled, Tank, or LP Gas | 12 (32.4%) | 0 (0.0%) |
| Electricity | 20 (54.0%) | 9 (100.0%) |
| Fuel Oil or Kerosene | 0 (0.0%) | 0 (0.0%) |
| Coal or Coke | 0 (0.0%) | 0 (0.0%) |
| All other Fuels | 0 (0.0%) | 0 (0.0%) |
| No Fuel Used | 0 (0.0%) | 0 (0.0%) |
| Total | 37 (100.0%) | 9 (100.0%) |
Household Vehicle Usage in Bluff City
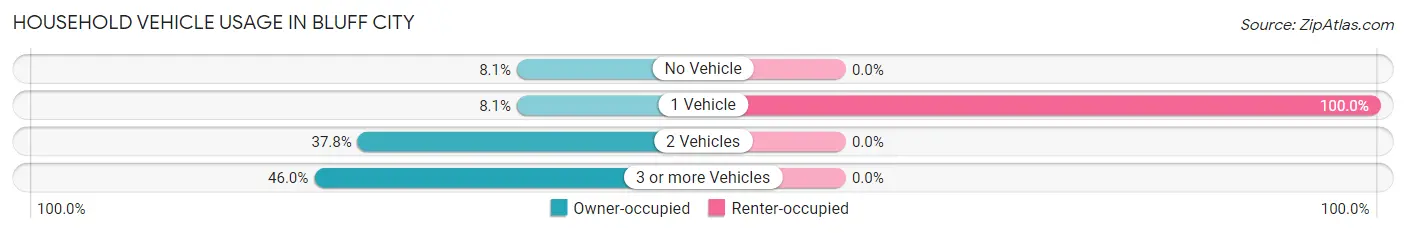
| Vehicles per Household | Owner-occupied | Renter-occupied |
| No Vehicle | 3 (8.1%) | 0 (0.0%) |
| 1 Vehicle | 3 (8.1%) | 9 (100.0%) |
| 2 Vehicles | 14 (37.8%) | 0 (0.0%) |
| 3 or more Vehicles | 17 (46.0%) | 0 (0.0%) |
| Total | 37 (100.0%) | 9 (100.0%) |
Real Estate & Mortgages in Bluff City
Real Estate and Mortgage Overview in Bluff City
| Characteristic | Without Mortgage | With Mortgage |
| Housing Units | 20 | 17 |
| Median Property Value | $55,000 | $86,100 |
| Median Household Income | - | - |
| Monthly Housing Costs | $471 | $0 |
| Real Estate Taxes | - | - |
Property Value by Mortgage Status in Bluff City
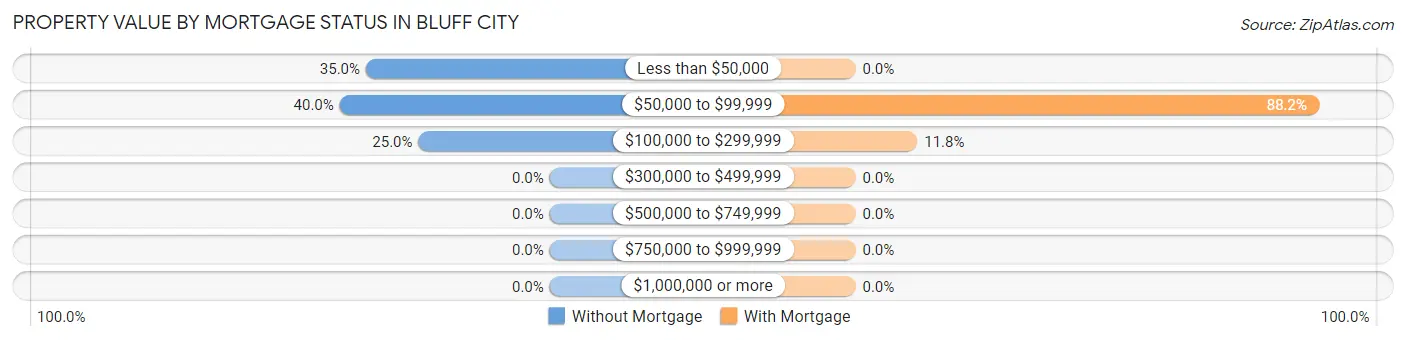
| Property Value | Without Mortgage | With Mortgage |
| Less than $50,000 | 7 (35.0%) | 0 (0.0%) |
| $50,000 to $99,999 | 8 (40.0%) | 15 (88.2%) |
| $100,000 to $299,999 | 5 (25.0%) | 2 (11.8%) |
| $300,000 to $499,999 | 0 (0.0%) | 0 (0.0%) |
| $500,000 to $749,999 | 0 (0.0%) | 0 (0.0%) |
| $750,000 to $999,999 | 0 (0.0%) | 0 (0.0%) |
| $1,000,000 or more | 0 (0.0%) | 0 (0.0%) |
| Total | 20 (100.0%) | 17 (100.0%) |
Household Income by Mortgage Status in Bluff City
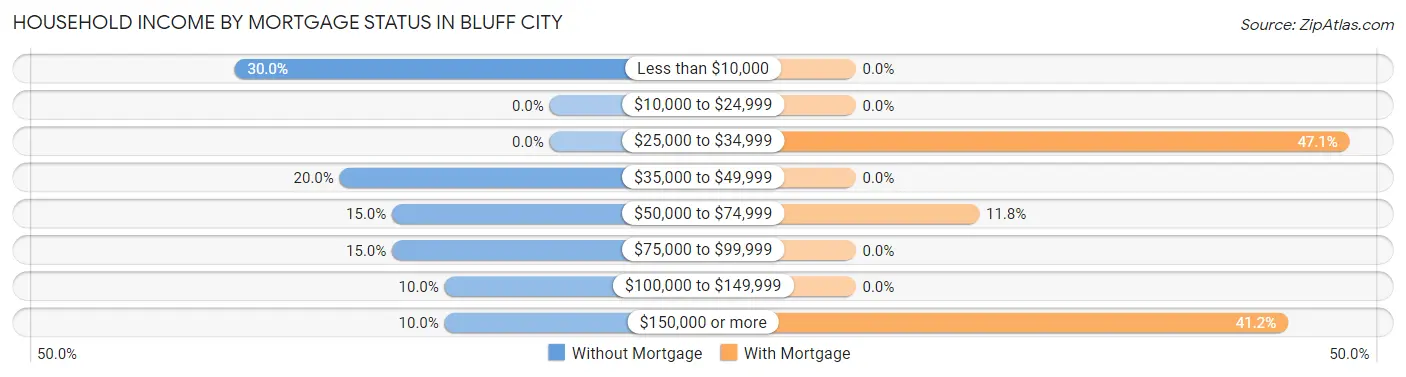
| Household Income | Without Mortgage | With Mortgage |
| Less than $10,000 | 6 (30.0%) | 0 (0.0%) |
| $10,000 to $24,999 | 0 (0.0%) | 0 (0.0%) |
| $25,000 to $34,999 | 0 (0.0%) | 8 (47.1%) |
| $35,000 to $49,999 | 4 (20.0%) | 0 (0.0%) |
| $50,000 to $74,999 | 3 (15.0%) | 2 (11.8%) |
| $75,000 to $99,999 | 3 (15.0%) | 0 (0.0%) |
| $100,000 to $149,999 | 2 (10.0%) | 0 (0.0%) |
| $150,000 or more | 2 (10.0%) | 7 (41.2%) |
| Total | 20 (100.0%) | 17 (100.0%) |
Property Value to Household Income Ratio in Bluff City
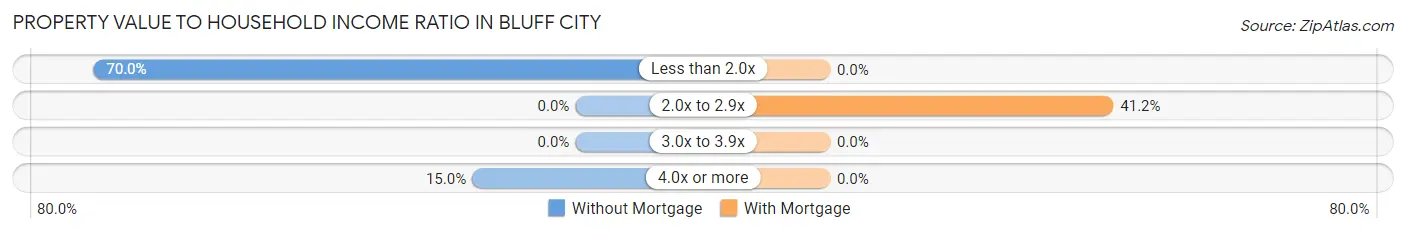
| Value-to-Income Ratio | Without Mortgage | With Mortgage |
| Less than 2.0x | 14 (70.0%) | 0 (0.0%) |
| 2.0x to 2.9x | 0 (0.0%) | 7 (41.2%) |
| 3.0x to 3.9x | 0 (0.0%) | 0 (0.0%) |
| 4.0x or more | 3 (15.0%) | 0 (0.0%) |
| Total | 20 (100.0%) | 17 (100.0%) |
Real Estate Taxes by Mortgage Status in Bluff City
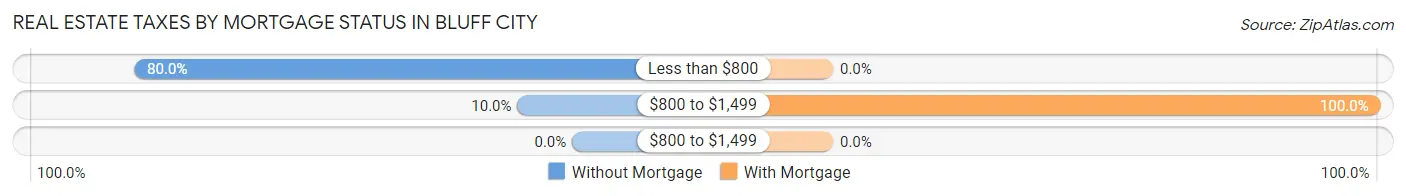
| Property Taxes | Without Mortgage | With Mortgage |
| Less than $800 | 16 (80.0%) | 0 (0.0%) |
| $800 to $1,499 | 2 (10.0%) | 17 (100.0%) |
| $800 to $1,499 | 0 (0.0%) | 0 (0.0%) |
| Total | 20 (100.0%) | 17 (100.0%) |
Health & Disability in Bluff City
Health Insurance Coverage by Age in Bluff City
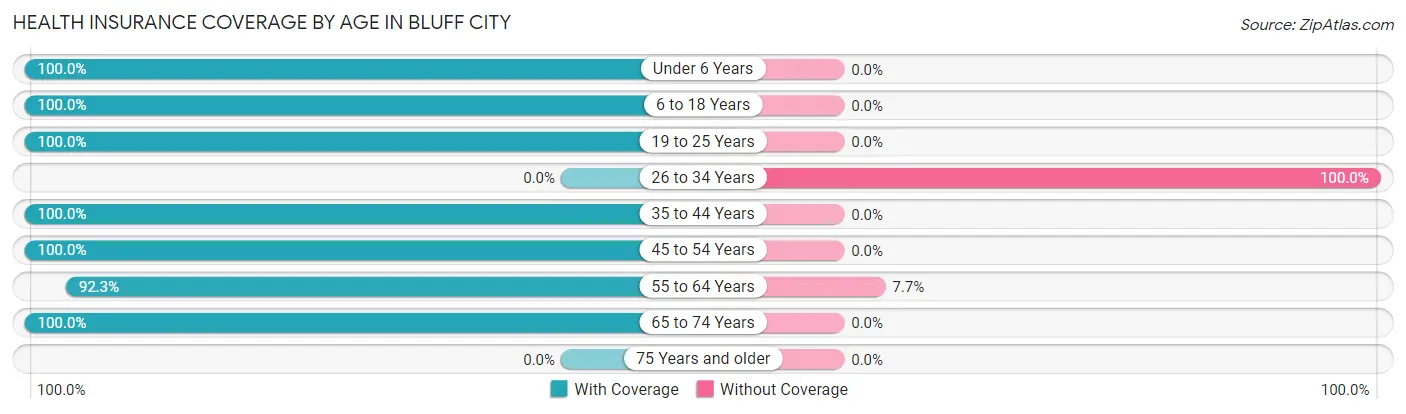
| Age Bracket | With Coverage | Without Coverage |
| Under 6 Years | 12 (100.0%) | 0 (0.0%) |
| 6 to 18 Years | 18 (100.0%) | 0 (0.0%) |
| 19 to 25 Years | 3 (100.0%) | 0 (0.0%) |
| 26 to 34 Years | 0 (0.0%) | 2 (100.0%) |
| 35 to 44 Years | 43 (100.0%) | 0 (0.0%) |
| 45 to 54 Years | 136 (100.0%) | 0 (0.0%) |
| 55 to 64 Years | 36 (92.3%) | 3 (7.7%) |
| 65 to 74 Years | 30 (100.0%) | 0 (0.0%) |
| 75 Years and older | 0 (0.0%) | 0 (0.0%) |
| Total | 278 (98.2%) | 5 (1.8%) |
Health Insurance Coverage by Citizenship Status in Bluff City
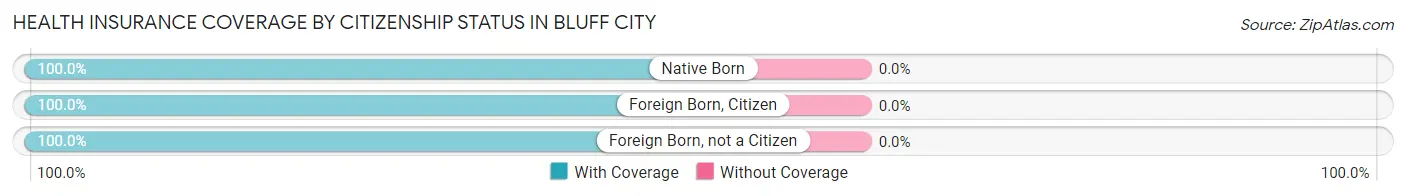
| Citizenship Status | With Coverage | Without Coverage |
| Native Born | 12 (100.0%) | 0 (0.0%) |
| Foreign Born, Citizen | 18 (100.0%) | 0 (0.0%) |
| Foreign Born, not a Citizen | 3 (100.0%) | 0 (0.0%) |
Health Insurance Coverage by Household Income in Bluff City
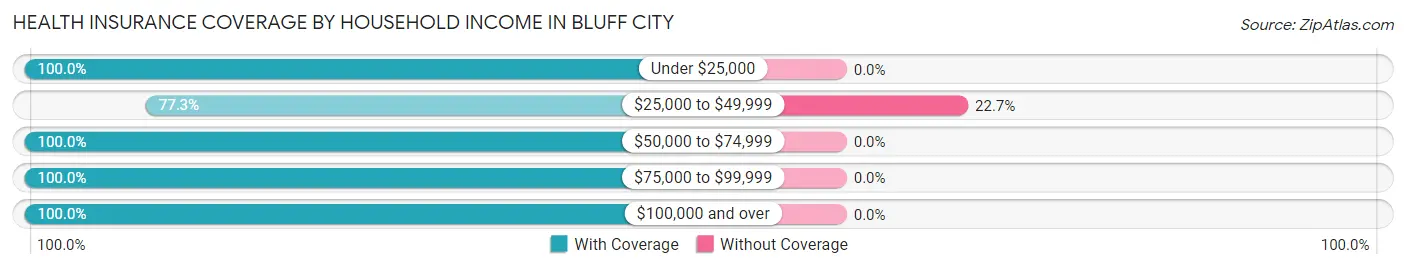
| Household Income | With Coverage | Without Coverage |
| Under $25,000 | 60 (100.0%) | 0 (0.0%) |
| $25,000 to $49,999 | 17 (77.3%) | 5 (22.7%) |
| $50,000 to $74,999 | 10 (100.0%) | 0 (0.0%) |
| $75,000 to $99,999 | 150 (100.0%) | 0 (0.0%) |
| $100,000 and over | 41 (100.0%) | 0 (0.0%) |
Public vs Private Health Insurance Coverage by Age in Bluff City
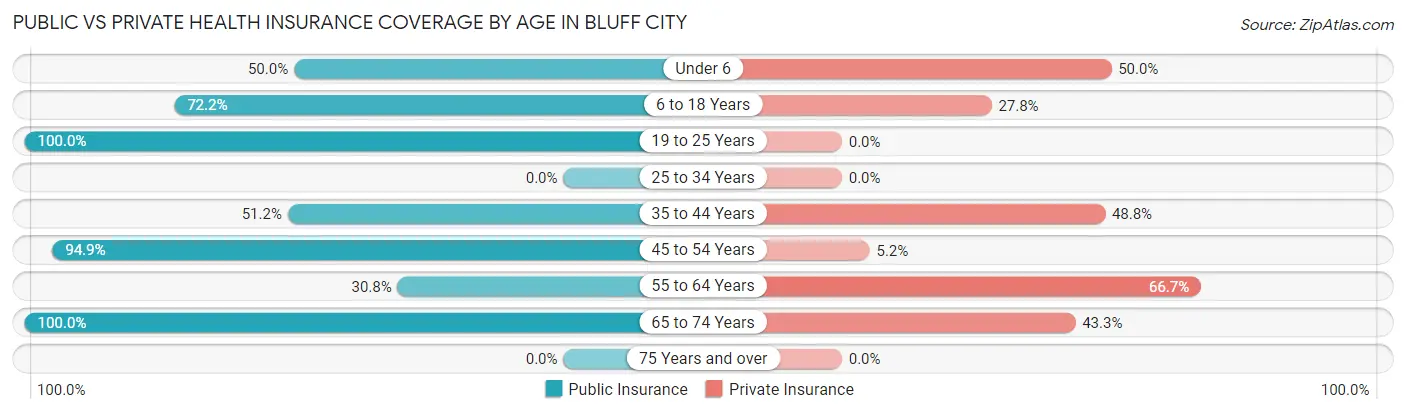
| Age Bracket | Public Insurance | Private Insurance |
| Under 6 | 6 (50.0%) | 6 (50.0%) |
| 6 to 18 Years | 13 (72.2%) | 5 (27.8%) |
| 19 to 25 Years | 3 (100.0%) | 0 (0.0%) |
| 25 to 34 Years | 0 (0.0%) | 0 (0.0%) |
| 35 to 44 Years | 22 (51.2%) | 21 (48.8%) |
| 45 to 54 Years | 129 (94.9%) | 7 (5.1%) |
| 55 to 64 Years | 12 (30.8%) | 26 (66.7%) |
| 65 to 74 Years | 30 (100.0%) | 13 (43.3%) |
| 75 Years and over | 0 (0.0%) | 0 (0.0%) |
| Total | 215 (76.0%) | 78 (27.6%) |
Disability Status by Sex by Age in Bluff City
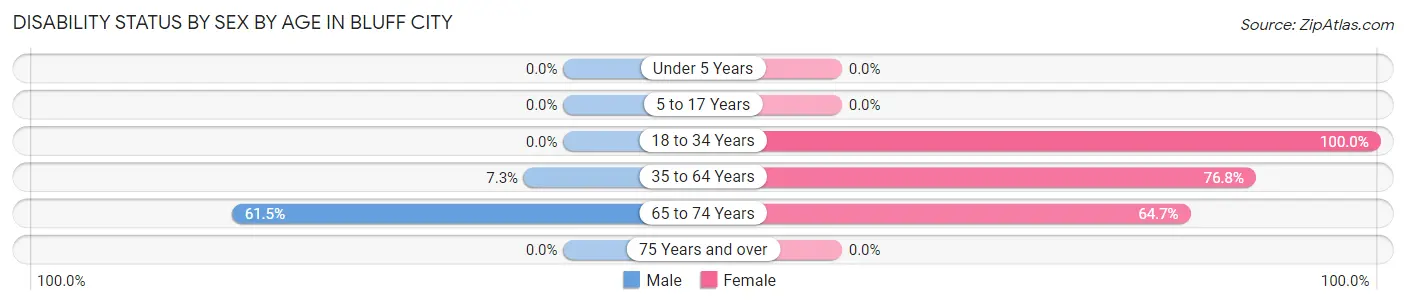
| Age Bracket | Male | Female |
| Under 5 Years | 0 (0.0%) | 0 (0.0%) |
| 5 to 17 Years | 0 (0.0%) | 0 (0.0%) |
| 18 to 34 Years | 0 (0.0%) | 2 (100.0%) |
| 35 to 64 Years | 3 (7.3%) | 136 (76.8%) |
| 65 to 74 Years | 8 (61.5%) | 11 (64.7%) |
| 75 Years and over | 0 (0.0%) | 0 (0.0%) |
Disability Class by Sex by Age in Bluff City
Disability Class: Hearing Difficulty
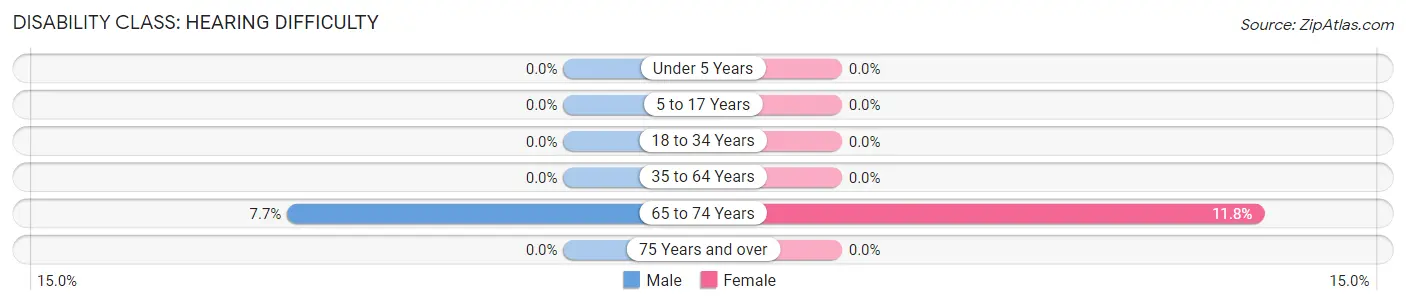
| Age Bracket | Male | Female |
| Under 5 Years | 0 (0.0%) | 0 (0.0%) |
| 5 to 17 Years | 0 (0.0%) | 0 (0.0%) |
| 18 to 34 Years | 0 (0.0%) | 0 (0.0%) |
| 35 to 64 Years | 0 (0.0%) | 0 (0.0%) |
| 65 to 74 Years | 1 (7.7%) | 2 (11.8%) |
| 75 Years and over | 0 (0.0%) | 0 (0.0%) |
Disability Class: Vision Difficulty
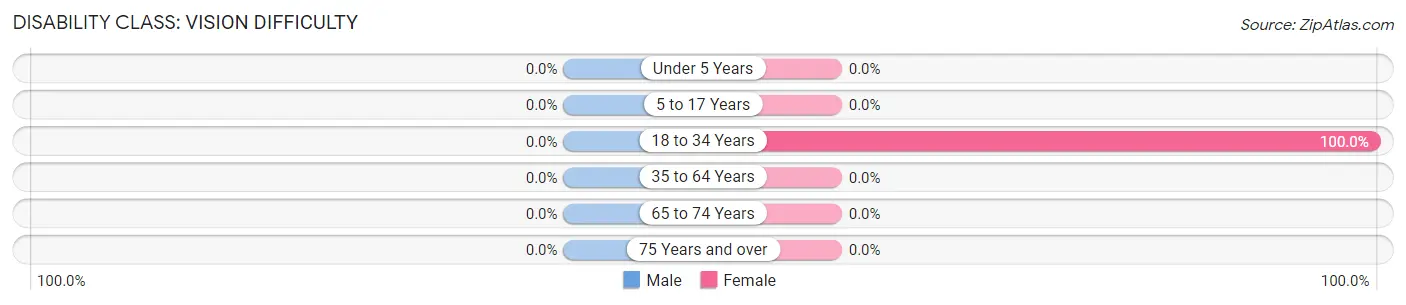
| Age Bracket | Male | Female |
| Under 5 Years | 0 (0.0%) | 0 (0.0%) |
| 5 to 17 Years | 0 (0.0%) | 0 (0.0%) |
| 18 to 34 Years | 0 (0.0%) | 2 (100.0%) |
| 35 to 64 Years | 0 (0.0%) | 0 (0.0%) |
| 65 to 74 Years | 0 (0.0%) | 0 (0.0%) |
| 75 Years and over | 0 (0.0%) | 0 (0.0%) |
Disability Class: Cognitive Difficulty
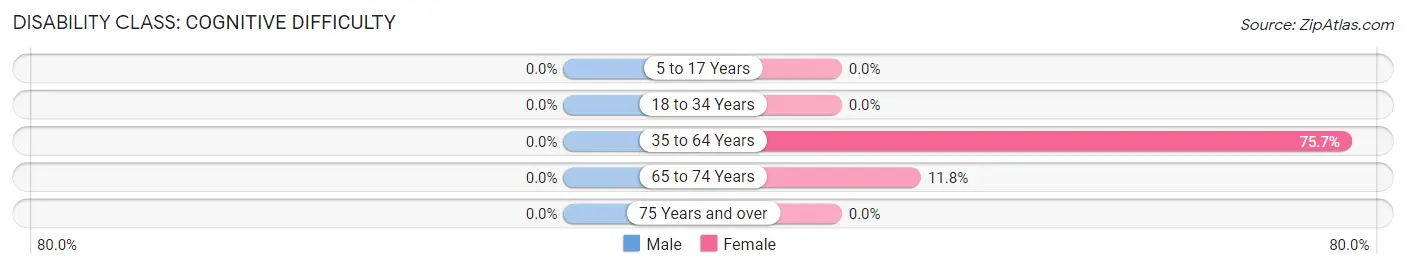
| Age Bracket | Male | Female |
| 5 to 17 Years | 0 (0.0%) | 0 (0.0%) |
| 18 to 34 Years | 0 (0.0%) | 0 (0.0%) |
| 35 to 64 Years | 0 (0.0%) | 134 (75.7%) |
| 65 to 74 Years | 0 (0.0%) | 2 (11.8%) |
| 75 Years and over | 0 (0.0%) | 0 (0.0%) |
Disability Class: Ambulatory Difficulty
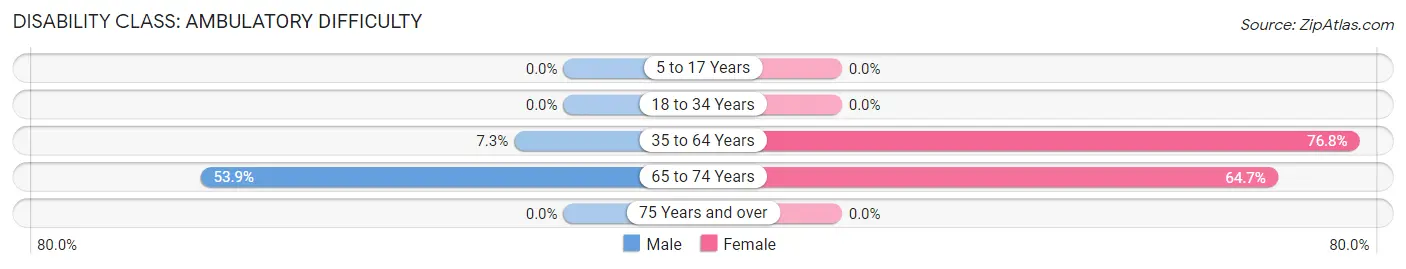
| Age Bracket | Male | Female |
| 5 to 17 Years | 0 (0.0%) | 0 (0.0%) |
| 18 to 34 Years | 0 (0.0%) | 0 (0.0%) |
| 35 to 64 Years | 3 (7.3%) | 136 (76.8%) |
| 65 to 74 Years | 7 (53.8%) | 11 (64.7%) |
| 75 Years and over | 0 (0.0%) | 0 (0.0%) |
Disability Class: Self-Care Difficulty
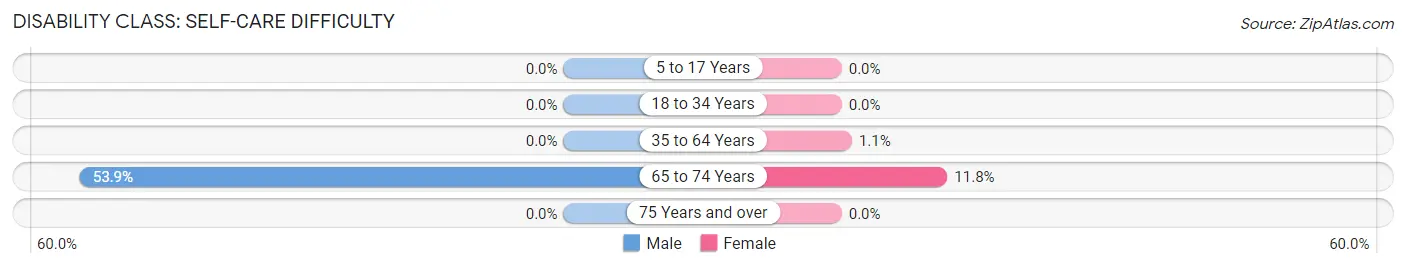
| Age Bracket | Male | Female |
| 5 to 17 Years | 0 (0.0%) | 0 (0.0%) |
| 18 to 34 Years | 0 (0.0%) | 0 (0.0%) |
| 35 to 64 Years | 0 (0.0%) | 2 (1.1%) |
| 65 to 74 Years | 7 (53.8%) | 2 (11.8%) |
| 75 Years and over | 0 (0.0%) | 0 (0.0%) |
Technology Access in Bluff City
Computing Device Access in Bluff City
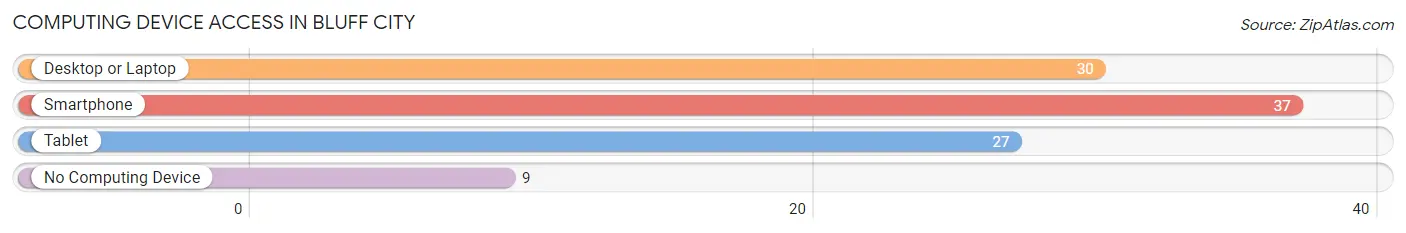
| Device Type | # Households | % Households |
| Desktop or Laptop | 30 | 65.2% |
| Smartphone | 37 | 80.4% |
| Tablet | 27 | 58.7% |
| No Computing Device | 9 | 19.6% |
| Total | 46 | 100.0% |
Internet Access in Bluff City
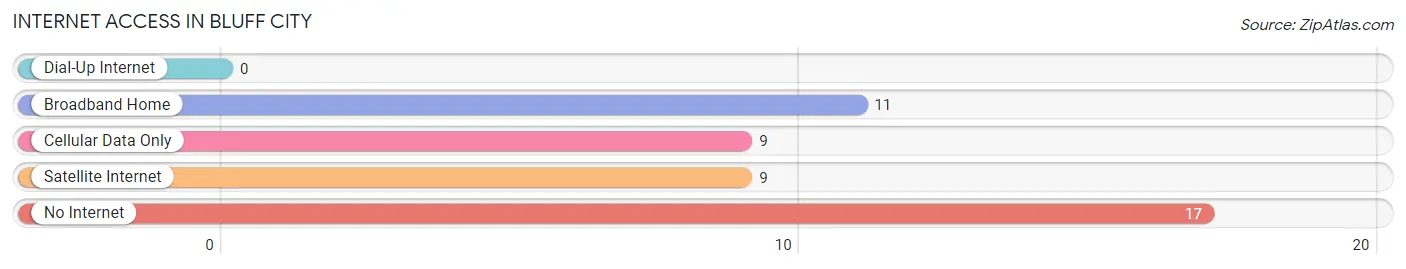
| Internet Type | # Households | % Households |
| Dial-Up Internet | 0 | 0.0% |
| Broadband Home | 11 | 23.9% |
| Cellular Data Only | 9 | 19.6% |
| Satellite Internet | 9 | 19.6% |
| No Internet | 17 | 37.0% |
| Total | 46 | 100.0% |
Bluff City Summary
Bluff City, Arkansas is a small town located in the northwest corner of the state, near the Oklahoma border. It is situated in the foothills of the Ozark Mountains and is part of the Ozark National Forest. The town has a population of just over 1,000 people and is the county seat of Johnson County.
Geography
Bluff City is located in the northwest corner of Arkansas, near the Oklahoma border. It is situated in the foothills of the Ozark Mountains and is part of the Ozark National Forest. The town is located on the banks of the Arkansas River, which provides a scenic backdrop to the town. The town is surrounded by rolling hills and lush forests, making it a popular destination for outdoor enthusiasts.
The climate in Bluff City is mild and humid, with hot summers and cold winters. The average temperature in the summer is around 80 degrees Fahrenheit, while the average temperature in the winter is around 40 degrees Fahrenheit. The town receives an average of 40 inches of rain per year, with most of the precipitation occurring in the spring and summer months.
Economy
The economy of Bluff City is largely based on agriculture and tourism. The town is home to several farms, which produce a variety of crops, including corn, soybeans, wheat, and hay. The town also has a thriving tourism industry, with visitors coming to enjoy the scenic beauty of the Ozark Mountains and the Arkansas River.
The town is also home to several small businesses, including restaurants, shops, and other services. The town is also home to a small manufacturing plant, which produces a variety of products, including furniture and clothing.
Demographics
As of the 2010 census, the population of Bluff City was 1,072. The racial makeup of the town was 95.3% White, 0.7% African American, 0.3% Native American, 0.2% Asian, 0.1% Pacific Islander, and 3.4% from other races. The median household income in Bluff City was $30,938, and the median family income was $37,813.
The town is home to a variety of religious denominations, including Baptist, Methodist, and Catholic. The town is also home to a variety of cultural and recreational activities, including festivals, concerts, and sporting events.
History
Bluff City was founded in 1872 by a group of settlers from Missouri. The town was originally known as “The Bluffs” due to its location on the banks of the Arkansas River. The town was officially incorporated in 1883 and was named after the nearby bluff.
The town grew steadily throughout the late 19th and early 20th centuries, and by the 1950s, it had become a thriving agricultural and tourist destination. The town has continued to grow and develop over the years, and today it is a popular destination for outdoor enthusiasts and tourists alike.
Common Questions
What is Per Capita Income in Bluff City?
Per Capita income in Bluff City is $14,066.
What is Income or Wage Gap in Bluff City?
Income or Wage Gap in Bluff City is 23.0%.
Women in Bluff City earn 77.0 cents for every dollar earned by a man.
What is Inequality or Gini Index in Bluff City?
Inequality or Gini Index in Bluff City is 0.54.
What is the Total Population of Bluff City?
Total Population of Bluff City is 283.
What is the Total Male Population of Bluff City?
Total Male Population of Bluff City is 80.
What is the Total Female Population of Bluff City?
Total Female Population of Bluff City is 203.
What is the Ratio of Males per 100 Females in Bluff City?
There are 39.41 Males per 100 Females in Bluff City.
What is the Ratio of Females per 100 Males in Bluff City?
There are 253.75 Females per 100 Males in Bluff City.
What is the Median Population Age in Bluff City?
Median Population Age in Bluff City is 49.5 Years.
What is the Average Family Size in Bluff City
Average Family Size in Bluff City is 8.2 People.
What is the Average Household Size in Bluff City
Average Household Size in Bluff City is 6.2 People.
How Large is the Labor Force in Bluff City?
There are 56 People in the Labor Forcein in Bluff City.
What is the Percentage of People in the Labor Force in Bluff City?
22.1% of People are in the Labor Force in Bluff City.