Blue Mountain, AR Map & Demographics
Blue Mountain Map
Blue Mountain Overview
$13,256
PER CAPITA INCOME
0.47
INEQUALITY / GINI INDEX
153
TOTAL POPULATION
74
MALE POPULATION
79
FEMALE POPULATION
93.67
MALES / 100 FEMALES
106.76
FEMALES / 100 MALES
24.6
MEDIAN AGE
4.8
AVG FAMILY SIZE
4.1
AVG HOUSEHOLD SIZE
43
LABOR FORCE [ PEOPLE ]
53.1%
PERCENT IN LABOR FORCE
7.0%
UNEMPLOYMENT RATE
Blue Mountain Zip Codes
Blue Mountain Area Codes
Income in Blue Mountain
Income Overview in Blue Mountain
| Characteristic | Number | Measure |
| Per Capita Income | 153 | $13,256 |
| Median Family Income | 28 | $0 |
| Mean Family Income | 28 | $42,646 |
| Median Household Income | 37 | $0 |
| Mean Household Income | 37 | $54,654 |
| Income Deficit | 28 | $0 |
| Wage / Income Gap (%) | 153 | 0.00% |
| Wage / Income Gap ($) | 153 | 100.00¢ per $1 |
| Gini / Inequality Index | 153 | 0.47 |
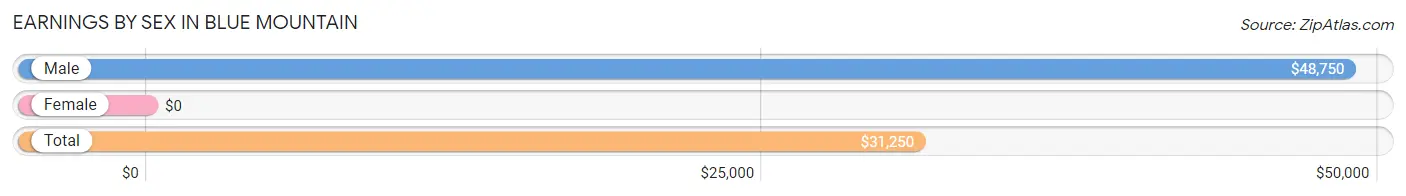
Earnings by Sex in Blue Mountain
| Sex | Number | Average Earnings |
| Male | 20 (46.5%) | $48,750 |
| Female | 23 (53.5%) | $0 |
| Total | 43 (100.0%) | $31,250 |
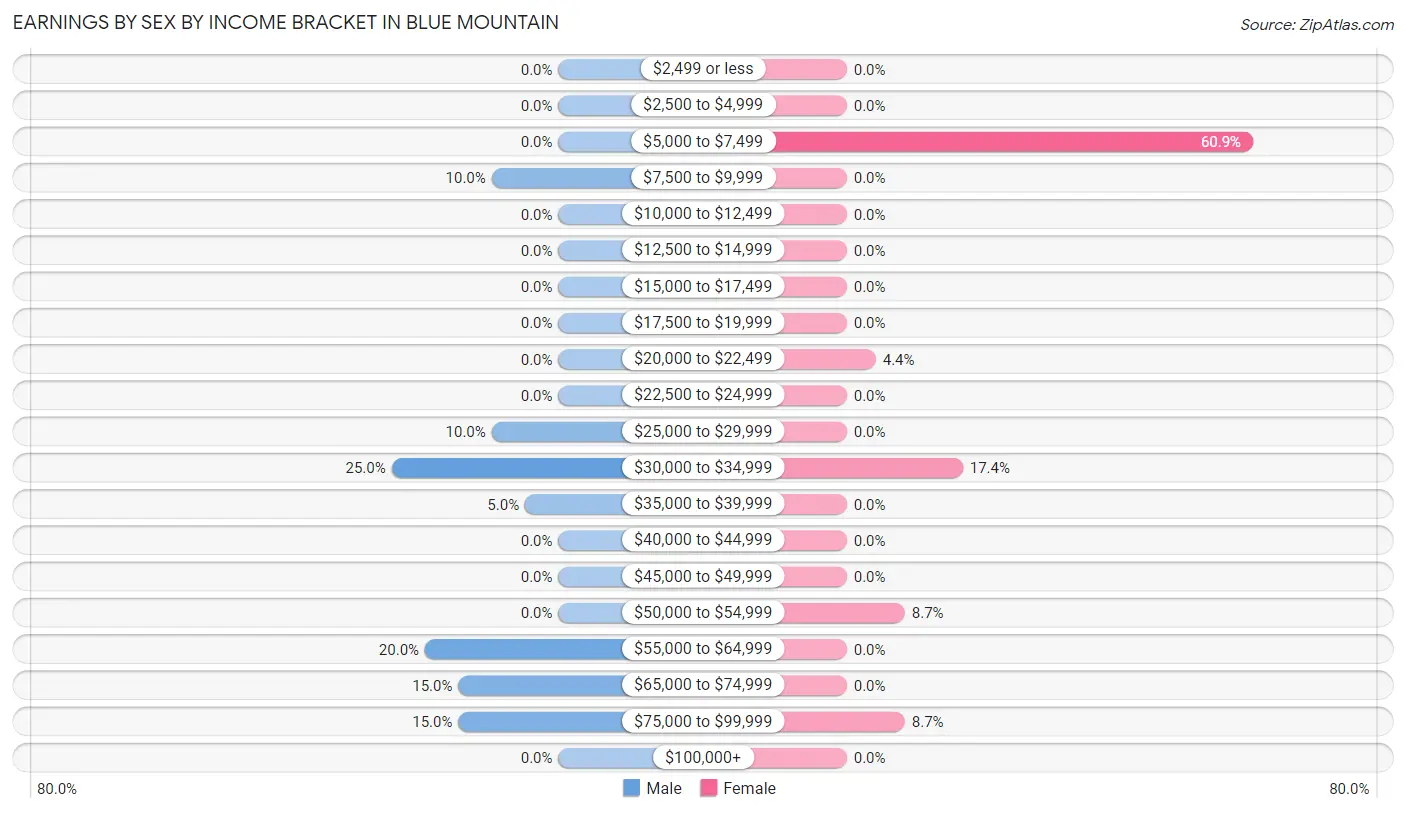
Earnings by Sex by Income Bracket in Blue Mountain
The most common earnings brackets in Blue Mountain are $30,000 to $34,999 for men (5 | 25.0%) and $5,000 to $7,499 for women (14 | 60.9%).
| Income | Male | Female |
| $2,499 or less | 0 (0.0%) | 0 (0.0%) |
| $2,500 to $4,999 | 0 (0.0%) | 0 (0.0%) |
| $5,000 to $7,499 | 0 (0.0%) | 14 (60.9%) |
| $7,500 to $9,999 | 2 (10.0%) | 0 (0.0%) |
| $10,000 to $12,499 | 0 (0.0%) | 0 (0.0%) |
| $12,500 to $14,999 | 0 (0.0%) | 0 (0.0%) |
| $15,000 to $17,499 | 0 (0.0%) | 0 (0.0%) |
| $17,500 to $19,999 | 0 (0.0%) | 0 (0.0%) |
| $20,000 to $22,499 | 0 (0.0%) | 1 (4.3%) |
| $22,500 to $24,999 | 0 (0.0%) | 0 (0.0%) |
| $25,000 to $29,999 | 2 (10.0%) | 0 (0.0%) |
| $30,000 to $34,999 | 5 (25.0%) | 4 (17.4%) |
| $35,000 to $39,999 | 1 (5.0%) | 0 (0.0%) |
| $40,000 to $44,999 | 0 (0.0%) | 0 (0.0%) |
| $45,000 to $49,999 | 0 (0.0%) | 0 (0.0%) |
| $50,000 to $54,999 | 0 (0.0%) | 2 (8.7%) |
| $55,000 to $64,999 | 4 (20.0%) | 0 (0.0%) |
| $65,000 to $74,999 | 3 (15.0%) | 0 (0.0%) |
| $75,000 to $99,999 | 3 (15.0%) | 2 (8.7%) |
| $100,000+ | 0 (0.0%) | 0 (0.0%) |
| Total | 20 (100.0%) | 23 (100.0%) |
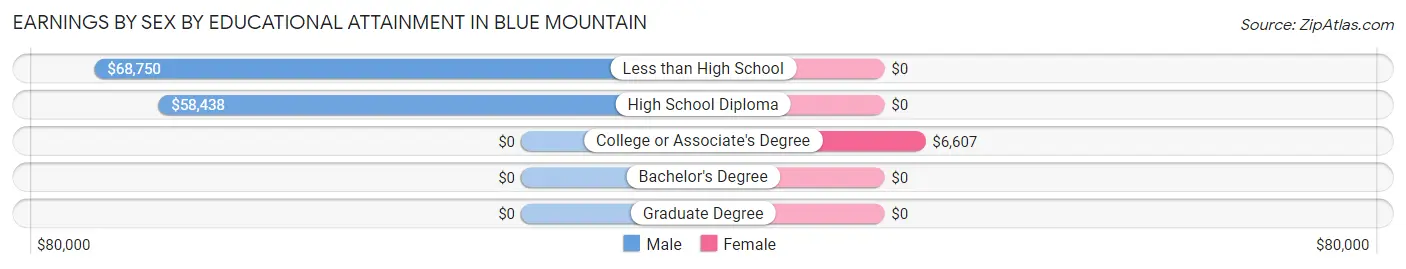
Earnings by Sex by Educational Attainment in Blue Mountain
| Educational Attainment | Male Income | Female Income |
| Less than High School | $68,750 | $0 |
| High School Diploma | $58,438 | $0 |
| College or Associate's Degree | - | - |
| Bachelor's Degree | - | - |
| Graduate Degree | - | - |
| Total | $58,750 | $0 |
Family Income in Blue Mountain
Family Income Brackets in Blue Mountain
According to the Blue Mountain family income data, there are 12 families falling into the $15,000 to $24,999 income range, which is the most common income bracket and makes up 42.9% of all families.
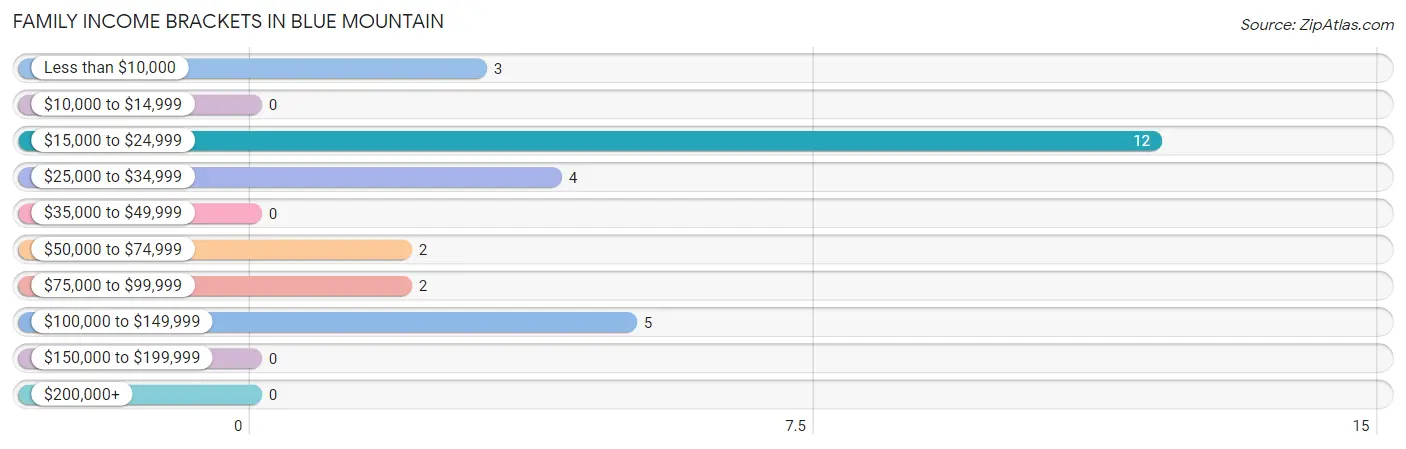
| Income Bracket | # Families | % Families |
| Less than $10,000 | 3 | 10.7% |
| $10,000 to $14,999 | 0 | 0.0% |
| $15,000 to $24,999 | 12 | 42.9% |
| $25,000 to $34,999 | 4 | 14.3% |
| $35,000 to $49,999 | 0 | 0.0% |
| $50,000 to $74,999 | 2 | 7.1% |
| $75,000 to $99,999 | 2 | 7.1% |
| $100,000 to $149,999 | 5 | 17.9% |
| $150,000 to $199,999 | 0 | 0.0% |
| $200,000+ | 0 | 0.0% |
Family Income by Famaliy Size in Blue Mountain
| Income Bracket | # Families | Median Income |
| 2-Person Families | 6 (21.4%) | $0 |
| 3-Person Families | 3 (10.7%) | $0 |
| 4-Person Families | 12 (42.9%) | $0 |
| 5-Person Families | 0 (0.0%) | $0 |
| 6-Person Families | 4 (14.3%) | $0 |
| 7+ Person Families | 3 (10.7%) | $0 |
| Total | 28 (100.0%) | $0 |
Family Income by Number of Earners in Blue Mountain
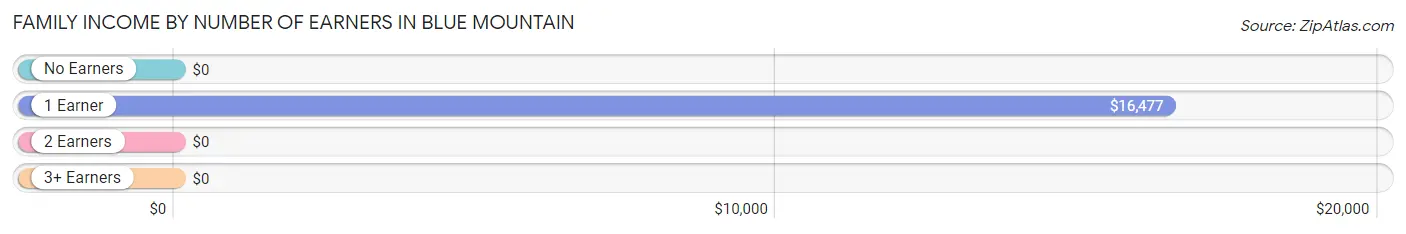
| Number of Earners | # Families | Median Income |
| No Earners | 8 (28.6%) | $0 |
| 1 Earner | 13 (46.4%) | $16,477 |
| 2 Earners | 3 (10.7%) | $0 |
| 3+ Earners | 4 (14.3%) | $0 |
| Total | 28 (100.0%) | $0 |
Household Income in Blue Mountain
Household Income Brackets in Blue Mountain
With 12 households falling in the category, the $15,000 to $24,999 income range is the most frequent in Blue Mountain, accounting for 32.4% of all households.
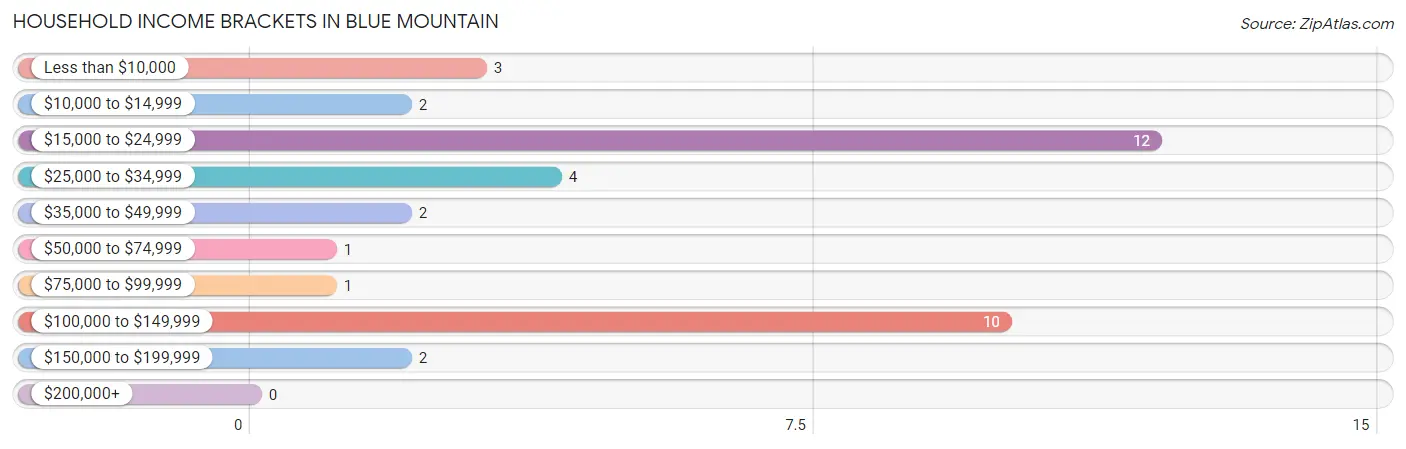
| Income Bracket | # Households | % Households |
| Less than $10,000 | 3 | 8.1% |
| $10,000 to $14,999 | 2 | 5.4% |
| $15,000 to $24,999 | 12 | 32.4% |
| $25,000 to $34,999 | 4 | 10.8% |
| $35,000 to $49,999 | 2 | 5.4% |
| $50,000 to $74,999 | 1 | 2.7% |
| $75,000 to $99,999 | 1 | 2.7% |
| $100,000 to $149,999 | 10 | 27.0% |
| $150,000 to $199,999 | 2 | 5.4% |
| $200,000+ | 0 | 0.0% |
Household Income by Householder Age in Blue Mountain
| Income Bracket | # Households | Median Income |
| 15 to 24 Years | 0 (0.0%) | $0 |
| 25 to 44 Years | 6 (16.2%) | $0 |
| 45 to 64 Years | 25 (67.6%) | $0 |
| 65+ Years | 6 (16.2%) | $0 |
| Total | 37 (100.0%) | $0 |
Poverty in Blue Mountain
Income Below Poverty by Sex and Age in Blue Mountain
With 62.2% poverty level for males and 68.3% for females among the residents of Blue Mountain, 6 to 11 year old males and 12 to 14 year old females are the most vulnerable to poverty, with 16 males (100.0%) and 5 females (100.0%) in their respective age groups living below the poverty level.
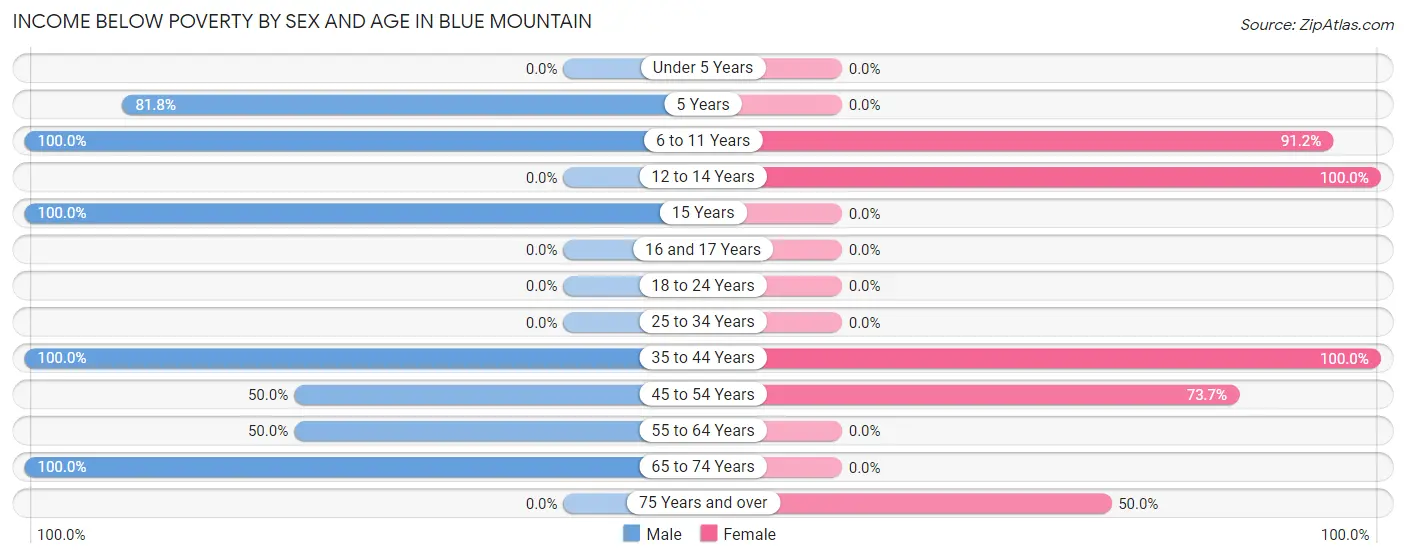
| Age Bracket | Male | Female |
| Under 5 Years | 0 (0.0%) | 0 (0.0%) |
| 5 Years | 9 (81.8%) | 0 (0.0%) |
| 6 to 11 Years | 16 (100.0%) | 31 (91.2%) |
| 12 to 14 Years | 0 (0.0%) | 5 (100.0%) |
| 15 Years | 3 (100.0%) | 0 (0.0%) |
| 16 and 17 Years | 0 (0.0%) | 0 (0.0%) |
| 18 to 24 Years | 0 (0.0%) | 0 (0.0%) |
| 25 to 34 Years | 0 (0.0%) | 0 (0.0%) |
| 35 to 44 Years | 3 (100.0%) | 3 (100.0%) |
| 45 to 54 Years | 6 (50.0%) | 14 (73.7%) |
| 55 to 64 Years | 7 (50.0%) | 0 (0.0%) |
| 65 to 74 Years | 2 (100.0%) | 0 (0.0%) |
| 75 Years and over | 0 (0.0%) | 1 (50.0%) |
| Total | 46 (62.2%) | 54 (68.3%) |
Income Above Poverty by Sex and Age in Blue Mountain
According to the poverty statistics in Blue Mountain, males aged 18 to 24 years and females aged under 5 years are the age groups that are most secure financially, with 100.0% of males and 100.0% of females in these age groups living above the poverty line.
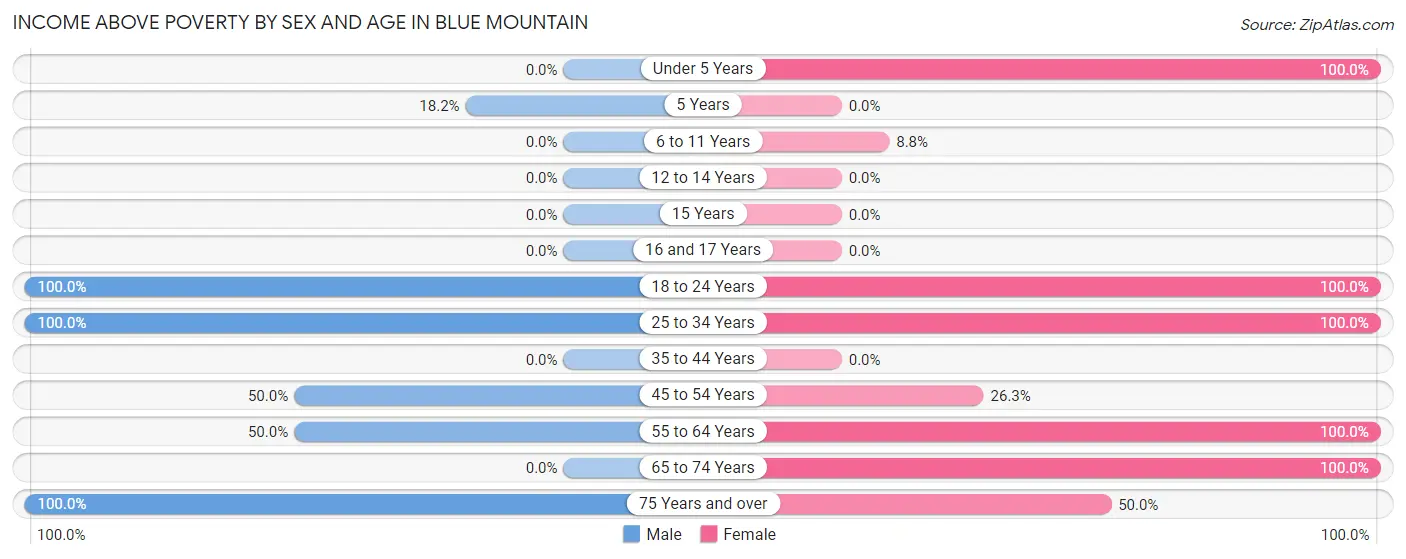
| Age Bracket | Male | Female |
| Under 5 Years | 0 (0.0%) | 3 (100.0%) |
| 5 Years | 2 (18.2%) | 0 (0.0%) |
| 6 to 11 Years | 0 (0.0%) | 3 (8.8%) |
| 12 to 14 Years | 0 (0.0%) | 0 (0.0%) |
| 15 Years | 0 (0.0%) | 0 (0.0%) |
| 16 and 17 Years | 0 (0.0%) | 0 (0.0%) |
| 18 to 24 Years | 4 (100.0%) | 3 (100.0%) |
| 25 to 34 Years | 8 (100.0%) | 4 (100.0%) |
| 35 to 44 Years | 0 (0.0%) | 0 (0.0%) |
| 45 to 54 Years | 6 (50.0%) | 5 (26.3%) |
| 55 to 64 Years | 7 (50.0%) | 4 (100.0%) |
| 65 to 74 Years | 0 (0.0%) | 2 (100.0%) |
| 75 Years and over | 1 (100.0%) | 1 (50.0%) |
| Total | 28 (37.8%) | 25 (31.7%) |
Income Below Poverty Among Married-Couple Families in Blue Mountain
The poverty statistics for married-couple families in Blue Mountain show that 66.7% or 14 of the total 21 families live below the poverty line. Families with 5 or more children have the highest poverty rate of 100.0%, comprising of 3 families. On the other hand, families with no children have the lowest poverty rate of 0.0%, which includes 0 families.
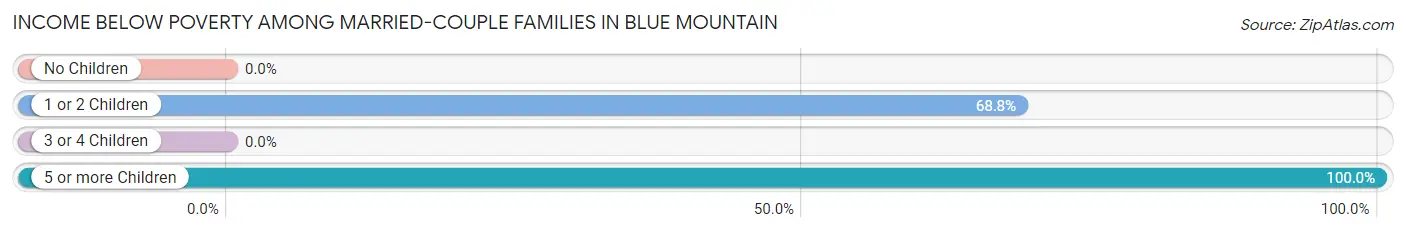
| Children | Above Poverty | Below Poverty |
| No Children | 2 (100.0%) | 0 (0.0%) |
| 1 or 2 Children | 5 (31.2%) | 11 (68.8%) |
| 3 or 4 Children | 0 (0.0%) | 0 (0.0%) |
| 5 or more Children | 0 (0.0%) | 3 (100.0%) |
| Total | 7 (33.3%) | 14 (66.7%) |
Income Below Poverty Among Single-Parent Households in Blue Mountain
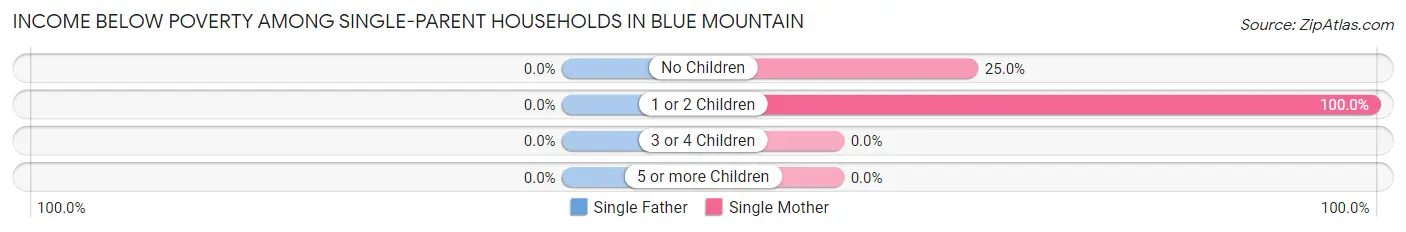
| Children | Single Father | Single Mother |
| No Children | 0 (0.0%) | 1 (25.0%) |
| 1 or 2 Children | 0 (0.0%) | 3 (100.0%) |
| 3 or 4 Children | 0 (0.0%) | 0 (0.0%) |
| 5 or more Children | 0 (0.0%) | 0 (0.0%) |
| Total | 0 (0.0%) | 4 (57.1%) |
Income Below Poverty Among Married-Couple vs Single-Parent Households in Blue Mountain
The poverty data for Blue Mountain shows that 14 of the married-couple family households (66.7%) and 4 of the single-parent households (57.1%) are living below the poverty level. Within the married-couple family households, those with 5 or more children have the highest poverty rate, with 3 households (100.0%) falling below the poverty line. Among the single-parent households, those with 1 or 2 children have the highest poverty rate, with 3 household (100.0%) living below poverty.
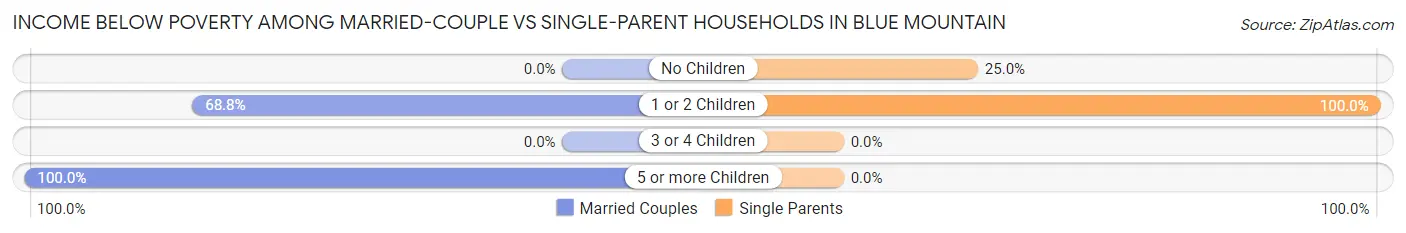
| Children | Married-Couple Families | Single-Parent Households |
| No Children | 0 (0.0%) | 1 (25.0%) |
| 1 or 2 Children | 11 (68.8%) | 3 (100.0%) |
| 3 or 4 Children | 0 (0.0%) | 0 (0.0%) |
| 5 or more Children | 3 (100.0%) | 0 (0.0%) |
| Total | 14 (66.7%) | 4 (57.1%) |
Race in Blue Mountain
The most populous races in Blue Mountain are White / Caucasian (88 | 57.5%), Two or more Races (31 | 20.3%), and Black / African American (28 | 18.3%).
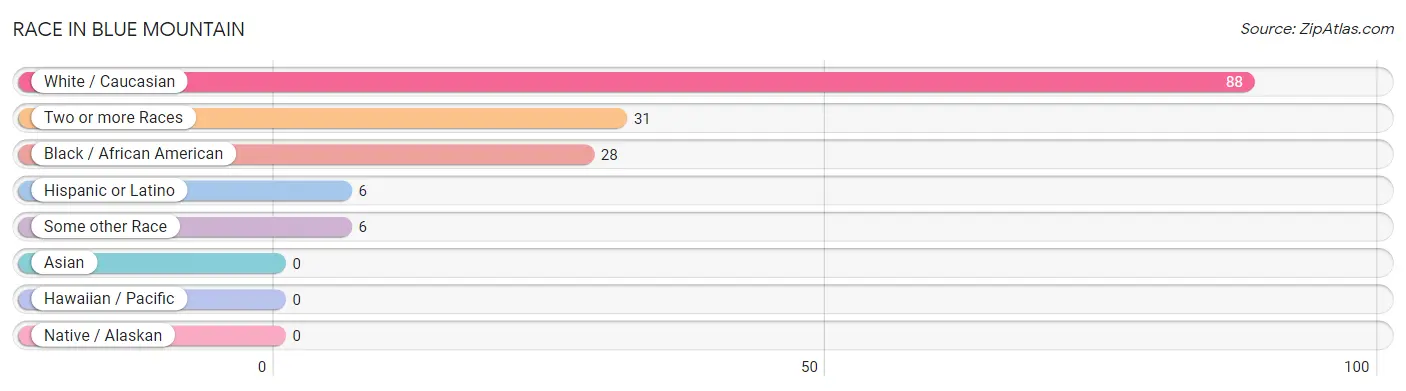
| Race | # Population | % Population |
| Asian | 0 | 0.0% |
| Black / African American | 28 | 18.3% |
| Hawaiian / Pacific | 0 | 0.0% |
| Hispanic or Latino | 6 | 3.9% |
| Native / Alaskan | 0 | 0.0% |
| White / Caucasian | 88 | 57.5% |
| Two or more Races | 31 | 20.3% |
| Some other Race | 6 | 3.9% |
| Total | 153 | 100.0% |
Ancestry in Blue Mountain
The most populous ancestries reported in Blue Mountain are American (17 | 11.1%), English (7 | 4.6%), German (6 | 3.9%), Mexican (6 | 3.9%), and Cherokee (3 | 2.0%), together accounting for 25.5% of all Blue Mountain residents.
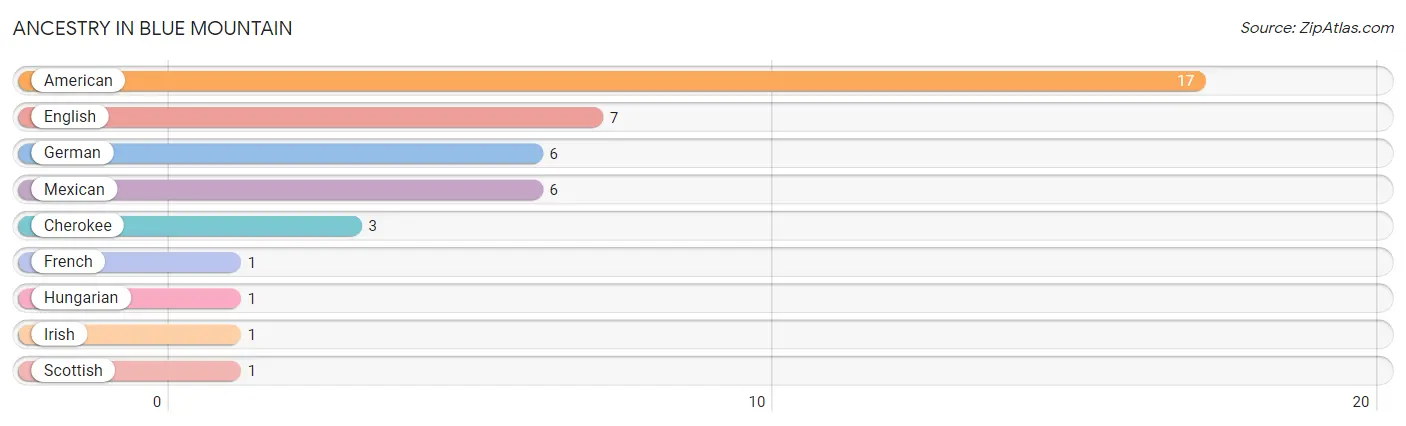
| Ancestry | # Population | % Population |
| American | 17 | 11.1% |
| Cherokee | 3 | 2.0% |
| English | 7 | 4.6% |
| French | 1 | 0.6% |
| German | 6 | 3.9% |
| Hungarian | 1 | 0.6% |
| Irish | 1 | 0.6% |
| Mexican | 6 | 3.9% |
| Scottish | 1 | 0.6% | View All 9 Rows |
Immigrants in Blue Mountain
The most numerous immigrant groups reported in Blue Mountain came from Central America (3 | 2.0%), Latin America (3 | 2.0%), and Mexico (3 | 2.0%), together accounting for 5.9% of all Blue Mountain residents.
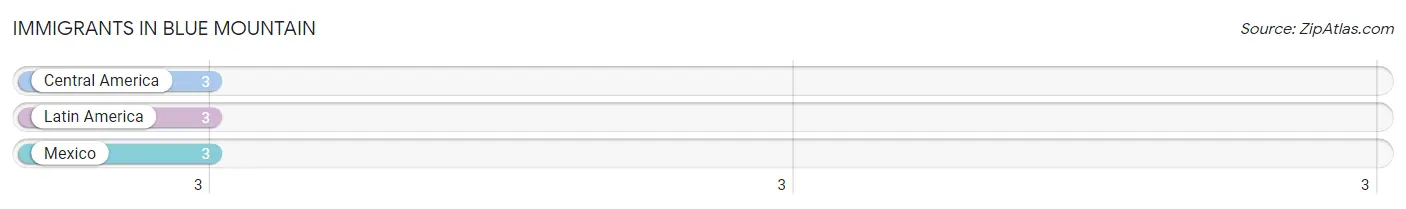
| Immigration Origin | # Population | % Population |
| Central America | 3 | 2.0% |
| Latin America | 3 | 2.0% |
| Mexico | 3 | 2.0% | View All 3 Rows |
Sex and Age in Blue Mountain
Sex and Age in Blue Mountain
The most populous age groups in Blue Mountain are 5 to 9 Years (24 | 32.4%) for men and 5 to 9 Years (34 | 43.0%) for women.
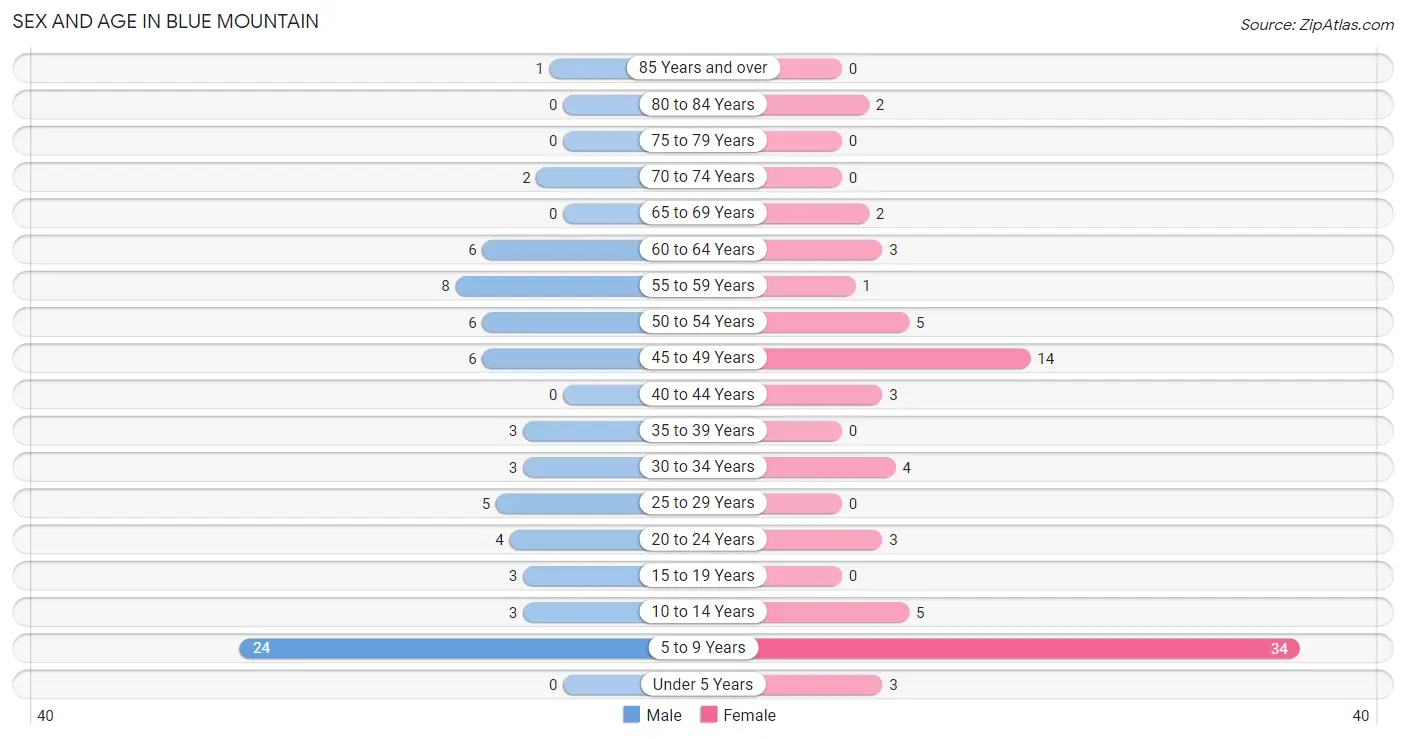
| Age Bracket | Male | Female |
| Under 5 Years | 0 (0.0%) | 3 (3.8%) |
| 5 to 9 Years | 24 (32.4%) | 34 (43.0%) |
| 10 to 14 Years | 3 (4.1%) | 5 (6.3%) |
| 15 to 19 Years | 3 (4.1%) | 0 (0.0%) |
| 20 to 24 Years | 4 (5.4%) | 3 (3.8%) |
| 25 to 29 Years | 5 (6.8%) | 0 (0.0%) |
| 30 to 34 Years | 3 (4.1%) | 4 (5.1%) |
| 35 to 39 Years | 3 (4.1%) | 0 (0.0%) |
| 40 to 44 Years | 0 (0.0%) | 3 (3.8%) |
| 45 to 49 Years | 6 (8.1%) | 14 (17.7%) |
| 50 to 54 Years | 6 (8.1%) | 5 (6.3%) |
| 55 to 59 Years | 8 (10.8%) | 1 (1.3%) |
| 60 to 64 Years | 6 (8.1%) | 3 (3.8%) |
| 65 to 69 Years | 0 (0.0%) | 2 (2.5%) |
| 70 to 74 Years | 2 (2.7%) | 0 (0.0%) |
| 75 to 79 Years | 0 (0.0%) | 0 (0.0%) |
| 80 to 84 Years | 0 (0.0%) | 2 (2.5%) |
| 85 Years and over | 1 (1.3%) | 0 (0.0%) |
| Total | 74 (100.0%) | 79 (100.0%) |
Families and Households in Blue Mountain
Median Family Size in Blue Mountain
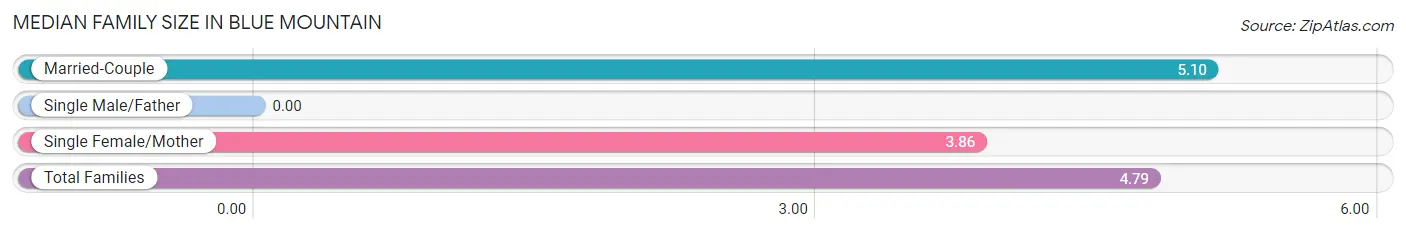
| Family Type | # Families | Family Size |
| Married-Couple | 21 (75.0%) | 5.10 |
| Single Male/Father | 0 (0.0%) | - |
| Single Female/Mother | 7 (25.0%) | 3.86 |
| Total Families | 28 (100.0%) | 4.79 |
Median Household Size in Blue Mountain
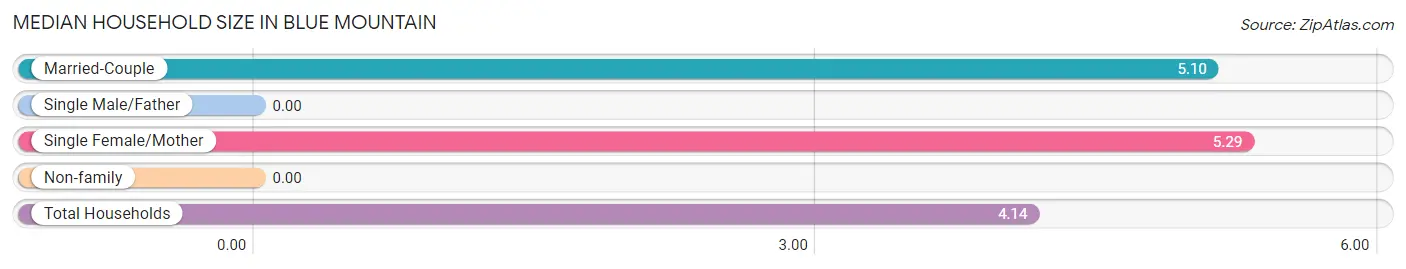
| Household Type | # Households | Household Size |
| Married-Couple | 21 (56.8%) | 5.10 |
| Single Male/Father | 0 (0.0%) | - |
| Single Female/Mother | 7 (18.9%) | 5.29 |
| Non-family | 9 (24.3%) | - |
| Total Households | 37 (100.0%) | 4.14 |
Household Size by Marriage Status in Blue Mountain
Out of a total of 37 households in Blue Mountain, 28 (75.7%) are family households, while 9 (24.3%) are nonfamily households. The most numerous type of family households are 4-person households, comprising 14, and the most common type of nonfamily households are 1-person households, comprising 9.
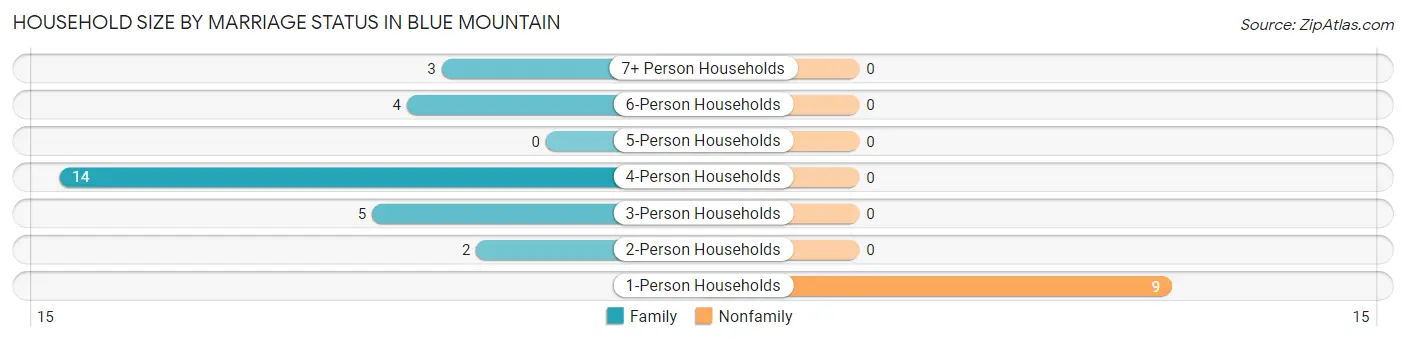
| Household Size | Family Households | Nonfamily Households |
| 1-Person Households | - | 9 (24.3%) |
| 2-Person Households | 2 (5.4%) | 0 (0.0%) |
| 3-Person Households | 5 (13.5%) | 0 (0.0%) |
| 4-Person Households | 14 (37.8%) | 0 (0.0%) |
| 5-Person Households | 0 (0.0%) | 0 (0.0%) |
| 6-Person Households | 4 (10.8%) | 0 (0.0%) |
| 7+ Person Households | 3 (8.1%) | 0 (0.0%) |
| Total | 28 (75.7%) | 9 (24.3%) |
Female Fertility in Blue Mountain
Fertility by Age in Blue Mountain
| Age Bracket | Women with Births | Births / 1,000 Women |
| 15 to 19 years | 0 (0.0%) | 0.0 |
| 20 to 34 years | 0 (0.0%) | 0.0 |
| 35 to 50 years | 0 (0.0%) | 0.0 |
| Total | 0 (0.0%) | 0.0 |
Fertility by Age by Marriage Status in Blue Mountain
| Age Bracket | Married | Unmarried |
| 15 to 19 years | 0 (0.0%) | 0 (0.0%) |
| 20 to 34 years | 0 (0.0%) | 0 (0.0%) |
| 35 to 50 years | 0 (0.0%) | 0 (0.0%) |
| Total | 0 (0.0%) | 0 (0.0%) |
Fertility by Education in Blue Mountain
| Educational Attainment | Women with Births | Births / 1,000 Women |
| Less than High School | 0 (0.0%) | 0.0 |
| High School Diploma | 0 (0.0%) | 0.0 |
| College or Associate's Degree | 0 (0.0%) | 0.0 |
| Bachelor's Degree | 0 (0.0%) | 0.0 |
| Graduate Degree | 0 (0.0%) | 0.0 |
| Total | 0 (0.0%) | 0.0 |
Fertility by Education by Marriage Status in Blue Mountain
| Educational Attainment | Married | Unmarried |
| Less than High School | 0 (0.0%) | 0 (0.0%) |
| High School Diploma | 0 (0.0%) | 0 (0.0%) |
| College or Associate's Degree | 0 (0.0%) | 0 (0.0%) |
| Bachelor's Degree | 0 (0.0%) | 0 (0.0%) |
| Graduate Degree | 0 (0.0%) | 0 (0.0%) |
| Total | 0 (0.0%) | 0 (0.0%) |
Employment Characteristics in Blue Mountain
Employment by Class of Employer in Blue Mountain
Among the 40 employed individuals in Blue Mountain, private company employees (28 | 70.0%), self-employed (not incorporated) (6 | 15.0%), and self-employed (incorporated) (4 | 10.0%) make up the most common classes of employment.
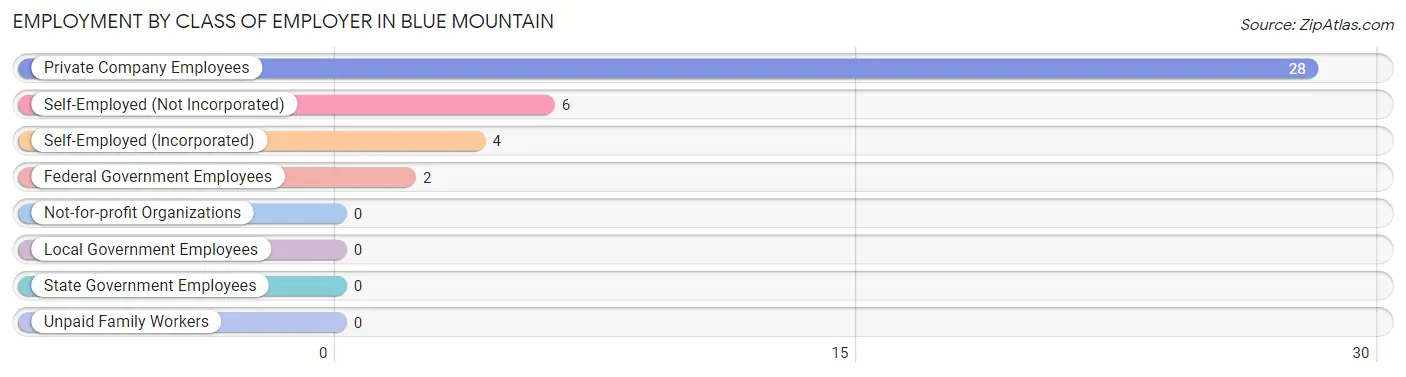
| Employer Class | # Employees | % Employees |
| Private Company Employees | 28 | 70.0% |
| Self-Employed (Incorporated) | 4 | 10.0% |
| Self-Employed (Not Incorporated) | 6 | 15.0% |
| Not-for-profit Organizations | 0 | 0.0% |
| Local Government Employees | 0 | 0.0% |
| State Government Employees | 0 | 0.0% |
| Federal Government Employees | 2 | 5.0% |
| Unpaid Family Workers | 0 | 0.0% |
| Total | 40 | 100.0% |
Employment Status by Age in Blue Mountain
According to the labor force statistics for Blue Mountain, out of the total population over 16 years of age (81), 53.1% or 43 individuals are in the labor force, with 7.0% or 3 of them unemployed. The age group with the highest labor force participation rate is 25 to 29 years, with 100.0% or 5 individuals in the labor force. Within the labor force, the 35 to 44 years age range has the highest percentage of unemployed individuals, with 100.0% or 3 of them being unemployed.
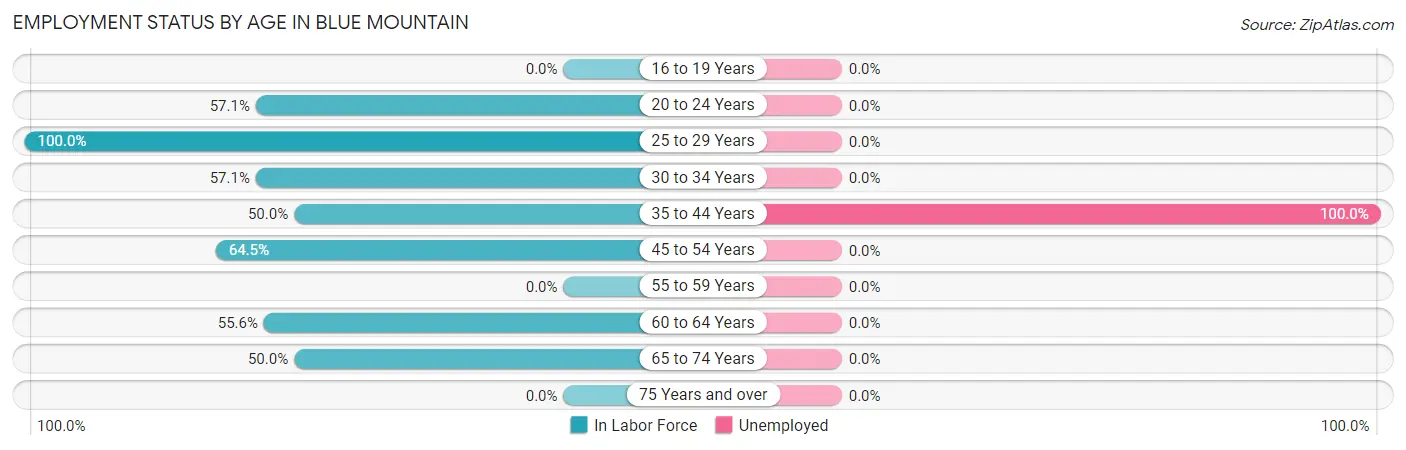
| Age Bracket | In Labor Force | Unemployed |
| 16 to 19 Years | 0 (0.0%) | 0 (0.0%) |
| 20 to 24 Years | 4 (57.1%) | 0 (0.0%) |
| 25 to 29 Years | 5 (100.0%) | 0 (0.0%) |
| 30 to 34 Years | 4 (57.1%) | 0 (0.0%) |
| 35 to 44 Years | 3 (50.0%) | 3 (100.0%) |
| 45 to 54 Years | 20 (64.5%) | 0 (0.0%) |
| 55 to 59 Years | 0 (0.0%) | 0 (0.0%) |
| 60 to 64 Years | 5 (55.6%) | 0 (0.0%) |
| 65 to 74 Years | 2 (50.0%) | 0 (0.0%) |
| 75 Years and over | 0 (0.0%) | 0 (0.0%) |
| Total | 43 (53.1%) | 3 (7.0%) |
Employment Status by Educational Attainment in Blue Mountain
According to labor force statistics for Blue Mountain, 55.2% of individuals (37) out of the total population between 25 and 64 years of age (67) are in the labor force, with 8.1% or 3 of them being unemployed. The group with the highest labor force participation rate are those with the educational attainment of high school diploma, with 81.8% or 9 individuals in the labor force. Within the labor force, individuals with college / associate degree education have the highest percentage of unemployment, with 13.0% or 3 of them being unemployed.
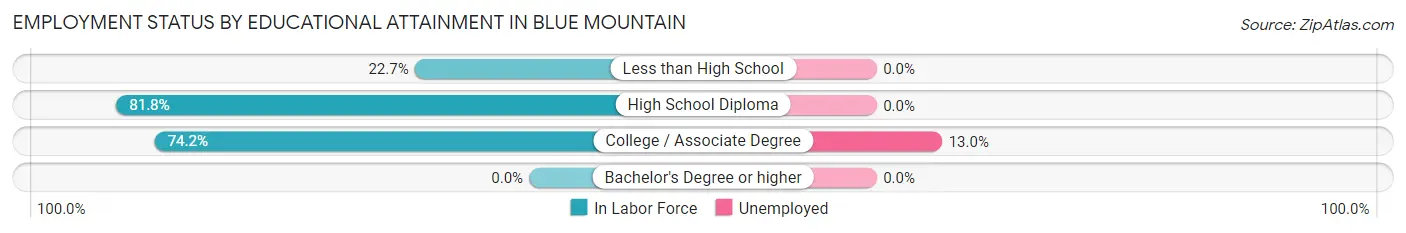
| Educational Attainment | In Labor Force | Unemployed |
| Less than High School | 5 (22.7%) | 0 (0.0%) |
| High School Diploma | 9 (81.8%) | 0 (0.0%) |
| College / Associate Degree | 23 (74.2%) | 4 (13.0%) |
| Bachelor's Degree or higher | 0 (0.0%) | 0 (0.0%) |
| Total | 37 (55.2%) | 5 (8.1%) |
Employment Occupations by Sex in Blue Mountain
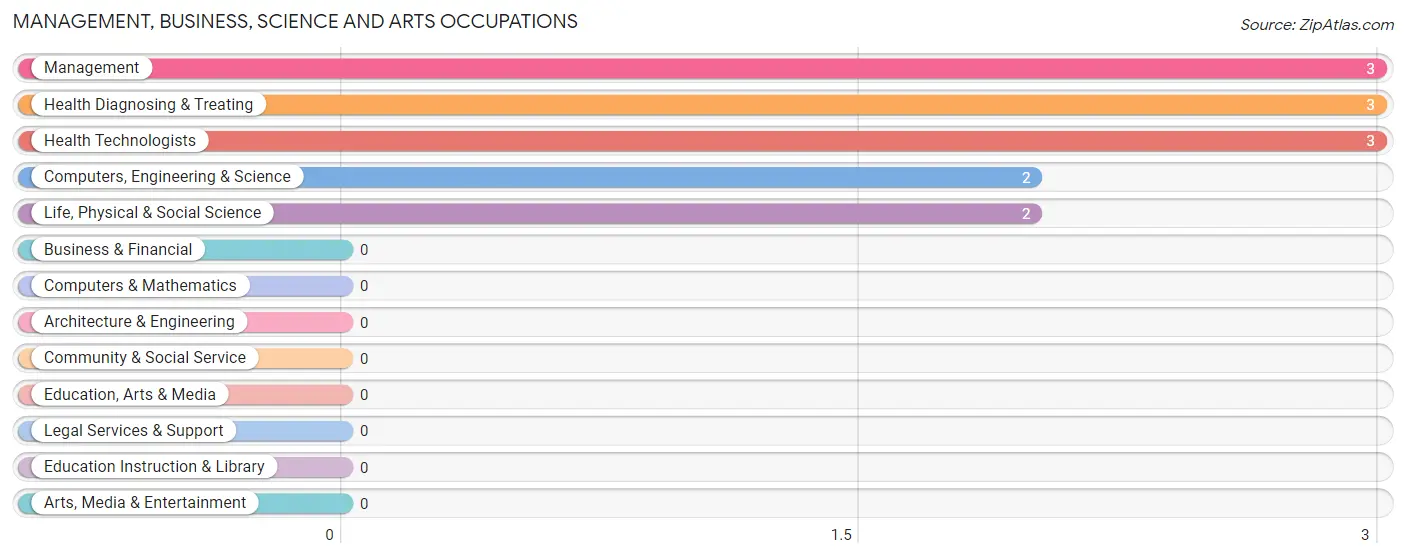
Management, Business, Science and Arts Occupations
The most common Management, Business, Science and Arts occupations in Blue Mountain are Management (3 | 7.5%), Health Diagnosing & Treating (3 | 7.5%), Health Technologists (3 | 7.5%), Computers, Engineering & Science (2 | 5.0%), and Life, Physical & Social Science (2 | 5.0%).
Management, Business, Science and Arts Occupations by Sex
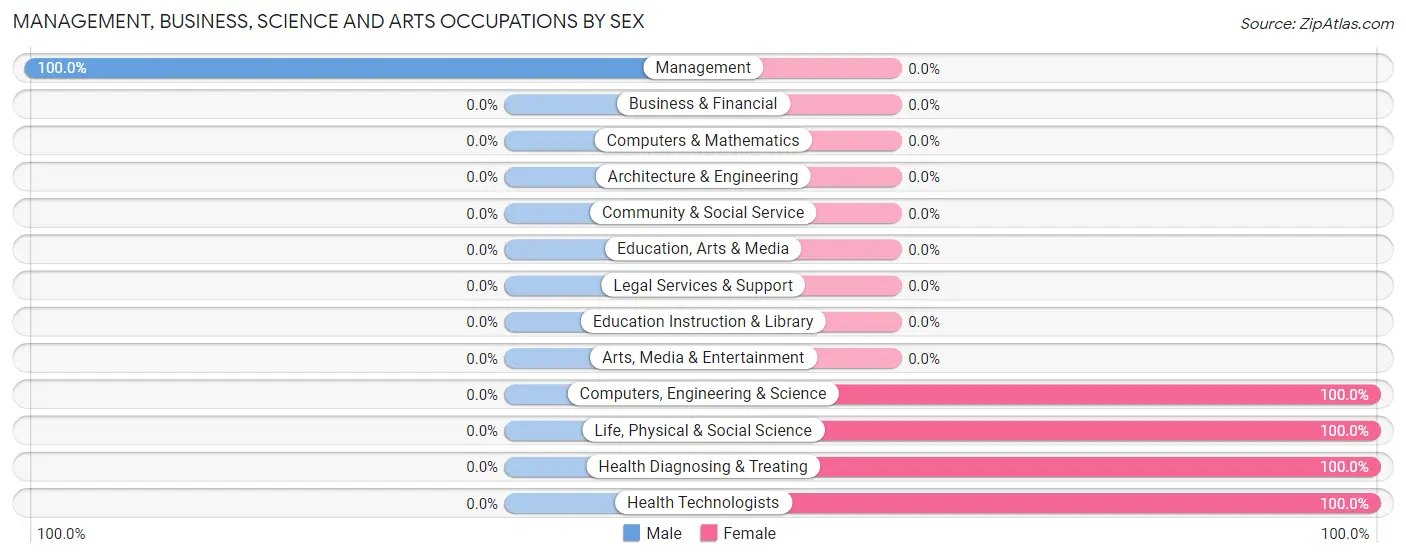
| Occupation | Male | Female |
| Management | 3 (100.0%) | 0 (0.0%) |
| Business & Financial | 0 (0.0%) | 0 (0.0%) |
| Computers, Engineering & Science | 0 (0.0%) | 2 (100.0%) |
| Computers & Mathematics | 0 (0.0%) | 0 (0.0%) |
| Architecture & Engineering | 0 (0.0%) | 0 (0.0%) |
| Life, Physical & Social Science | 0 (0.0%) | 2 (100.0%) |
| Community & Social Service | 0 (0.0%) | 0 (0.0%) |
| Education, Arts & Media | 0 (0.0%) | 0 (0.0%) |
| Legal Services & Support | 0 (0.0%) | 0 (0.0%) |
| Education Instruction & Library | 0 (0.0%) | 0 (0.0%) |
| Arts, Media & Entertainment | 0 (0.0%) | 0 (0.0%) |
| Health Diagnosing & Treating | 0 (0.0%) | 3 (100.0%) |
| Health Technologists | 0 (0.0%) | 3 (100.0%) |
| Total (Category) | 3 (37.5%) | 5 (62.5%) |
| Total (Overall) | 20 (50.0%) | 20 (50.0%) |
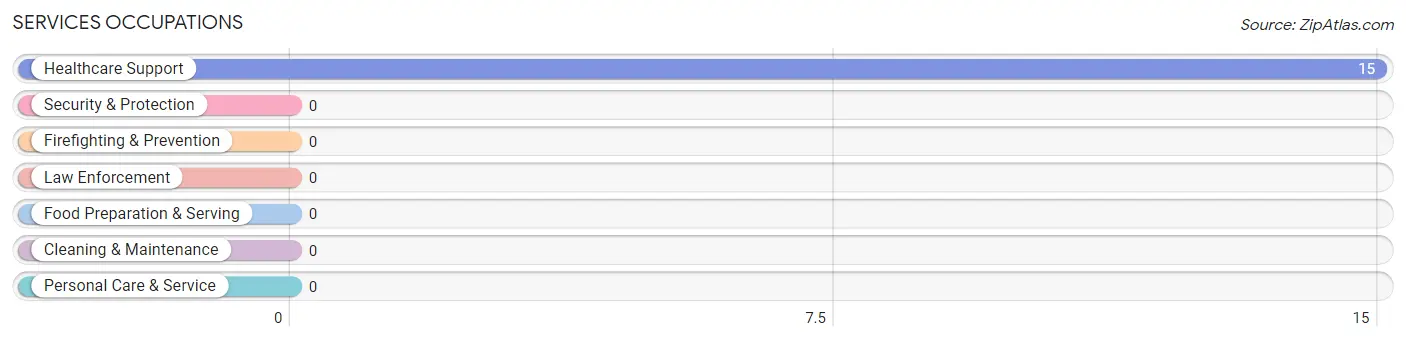
Services Occupations
The most common Services occupations in Blue Mountain are , and Healthcare Support (15 | 37.5%).
Services Occupations by Sex
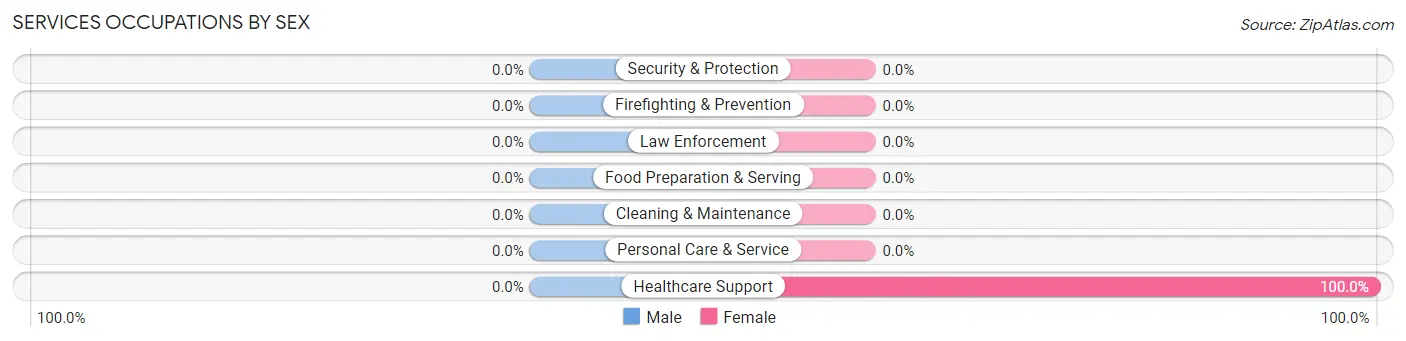
| Occupation | Male | Female |
| Healthcare Support | 0 (0.0%) | 15 (100.0%) |
| Security & Protection | 0 (0.0%) | 0 (0.0%) |
| Firefighting & Prevention | 0 (0.0%) | 0 (0.0%) |
| Law Enforcement | 0 (0.0%) | 0 (0.0%) |
| Food Preparation & Serving | 0 (0.0%) | 0 (0.0%) |
| Cleaning & Maintenance | 0 (0.0%) | 0 (0.0%) |
| Personal Care & Service | 0 (0.0%) | 0 (0.0%) |
| Total (Category) | 0 (0.0%) | 15 (100.0%) |
| Total (Overall) | 20 (50.0%) | 20 (50.0%) |
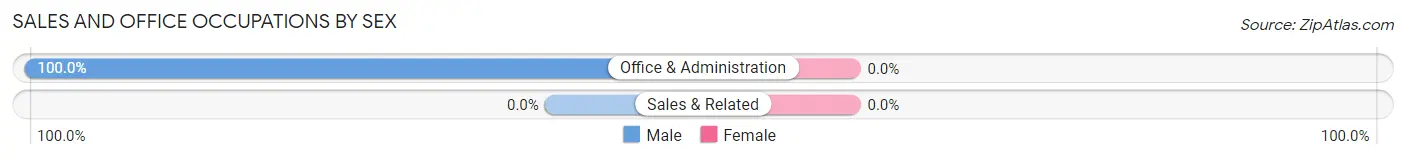
Sales and Office Occupations
The most common Sales and Office occupations in Blue Mountain are , and Office & Administration (1 | 2.5%).
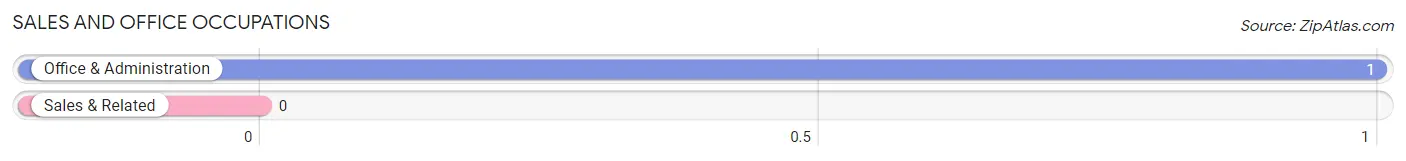
Sales and Office Occupations by Sex
| Occupation | Male | Female |
| Sales & Related | 0 (0.0%) | 0 (0.0%) |
| Office & Administration | 1 (100.0%) | 0 (0.0%) |
| Total (Category) | 1 (100.0%) | 0 (0.0%) |
| Total (Overall) | 20 (50.0%) | 20 (50.0%) |
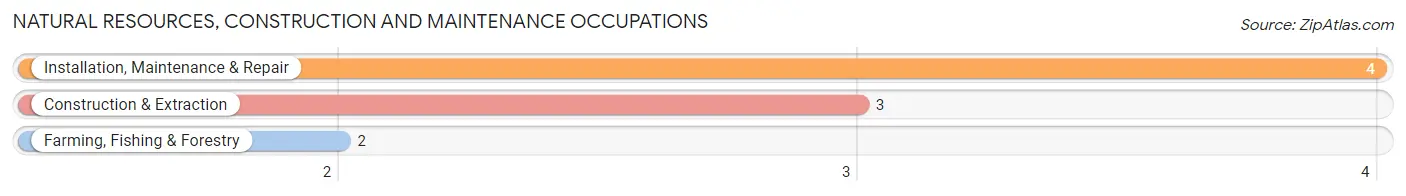
Natural Resources, Construction and Maintenance Occupations
The most common Natural Resources, Construction and Maintenance occupations in Blue Mountain are Installation, Maintenance & Repair (4 | 10.0%), Construction & Extraction (3 | 7.5%), and Farming, Fishing & Forestry (2 | 5.0%).
Natural Resources, Construction and Maintenance Occupations by Sex
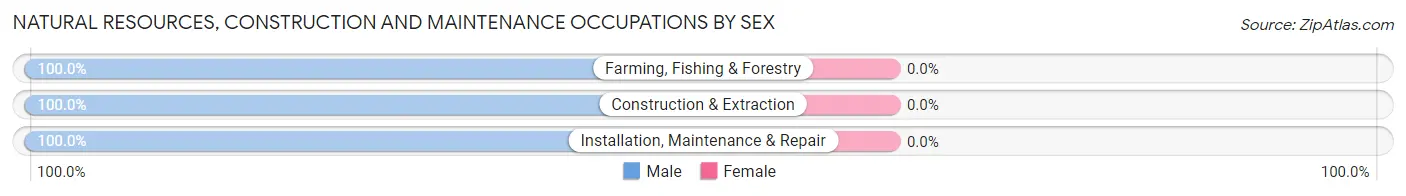
| Occupation | Male | Female |
| Farming, Fishing & Forestry | 2 (100.0%) | 0 (0.0%) |
| Construction & Extraction | 3 (100.0%) | 0 (0.0%) |
| Installation, Maintenance & Repair | 4 (100.0%) | 0 (0.0%) |
| Total (Category) | 9 (100.0%) | 0 (0.0%) |
| Total (Overall) | 20 (50.0%) | 20 (50.0%) |
Production, Transportation and Moving Occupations
The most common Production, Transportation and Moving occupations in Blue Mountain are , and Material Moving (7 | 17.5%).
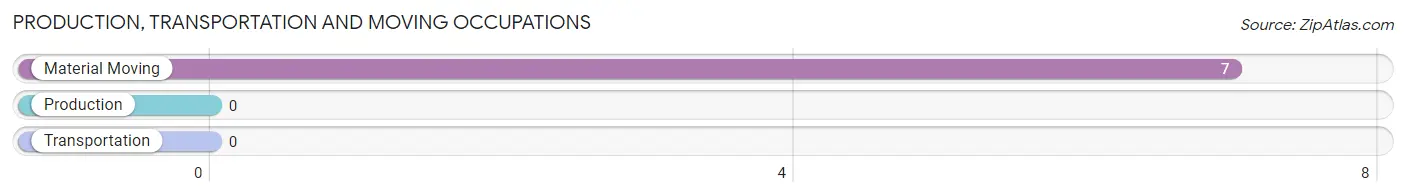
Production, Transportation and Moving Occupations by Sex
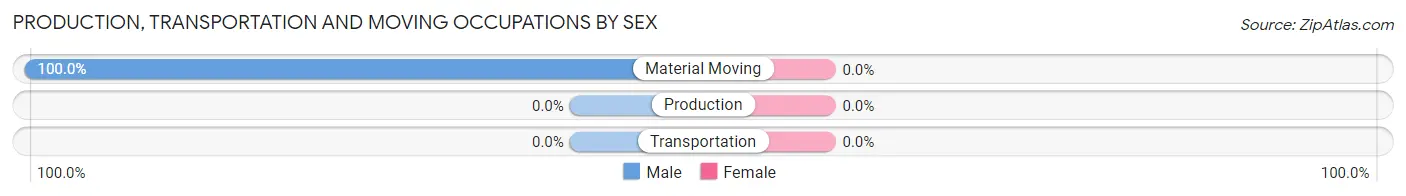
| Occupation | Male | Female |
| Production | 0 (0.0%) | 0 (0.0%) |
| Transportation | 0 (0.0%) | 0 (0.0%) |
| Material Moving | 7 (100.0%) | 0 (0.0%) |
| Total (Category) | 7 (100.0%) | 0 (0.0%) |
| Total (Overall) | 20 (50.0%) | 20 (50.0%) |
Employment Industries by Sex in Blue Mountain
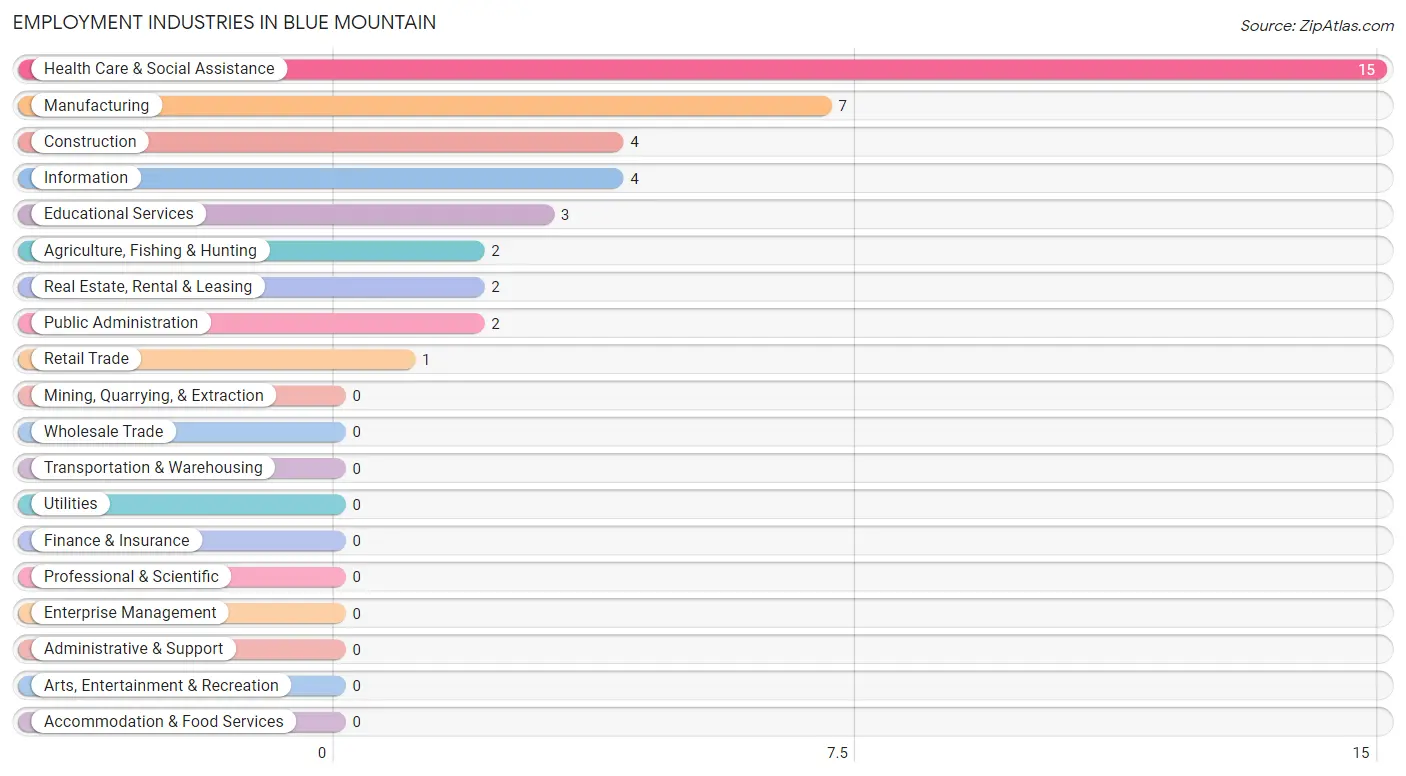
Employment Industries in Blue Mountain
The major employment industries in Blue Mountain include Health Care & Social Assistance (15 | 37.5%), Manufacturing (7 | 17.5%), Construction (4 | 10.0%), Information (4 | 10.0%), and Educational Services (3 | 7.5%).
Employment Industries by Sex in Blue Mountain
The Blue Mountain industries that see more men than women are Agriculture, Fishing & Hunting (100.0%), Construction (100.0%), and Manufacturing (100.0%), whereas the industries that tend to have a higher number of women are Educational Services (100.0%), Health Care & Social Assistance (100.0%), and Public Administration (100.0%).
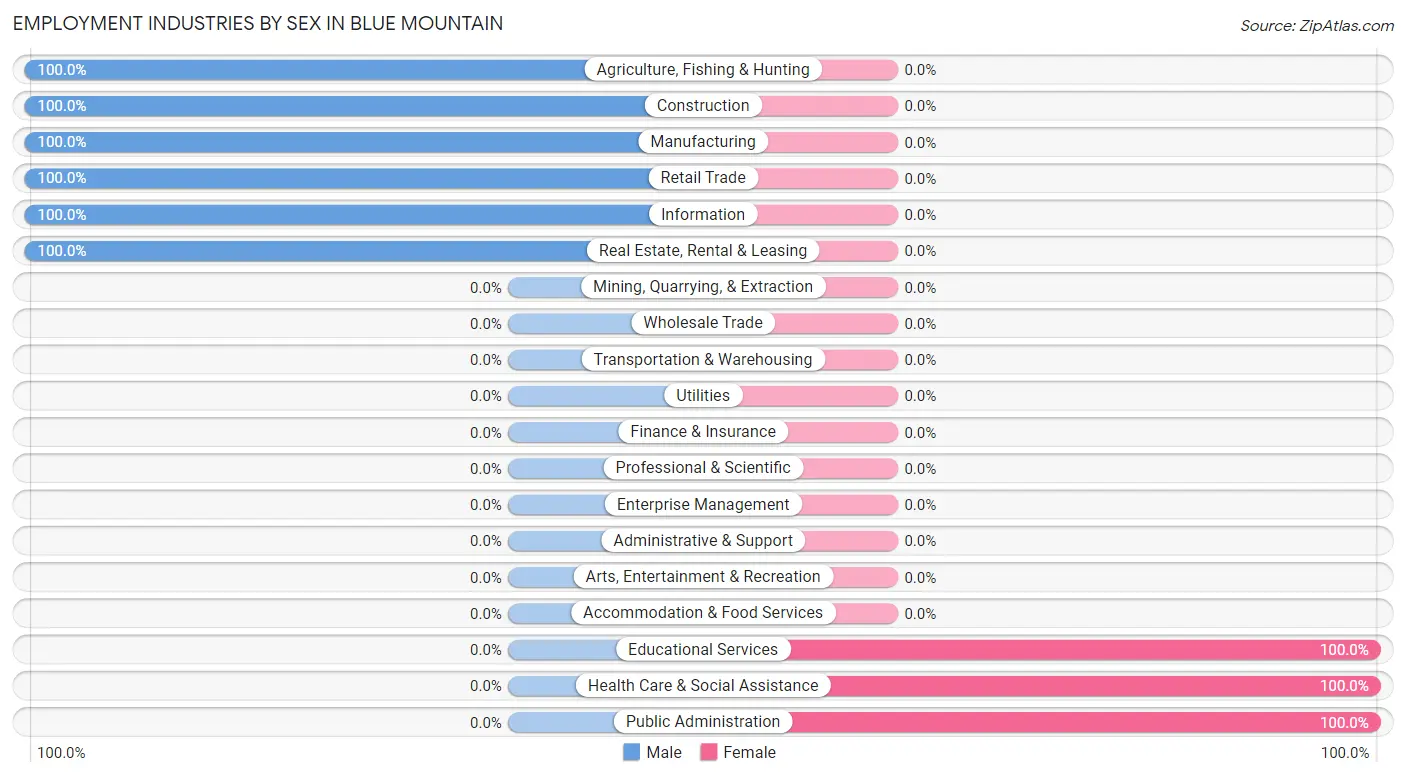
| Industry | Male | Female |
| Agriculture, Fishing & Hunting | 2 (100.0%) | 0 (0.0%) |
| Mining, Quarrying, & Extraction | 0 (0.0%) | 0 (0.0%) |
| Construction | 4 (100.0%) | 0 (0.0%) |
| Manufacturing | 7 (100.0%) | 0 (0.0%) |
| Wholesale Trade | 0 (0.0%) | 0 (0.0%) |
| Retail Trade | 1 (100.0%) | 0 (0.0%) |
| Transportation & Warehousing | 0 (0.0%) | 0 (0.0%) |
| Utilities | 0 (0.0%) | 0 (0.0%) |
| Information | 4 (100.0%) | 0 (0.0%) |
| Finance & Insurance | 0 (0.0%) | 0 (0.0%) |
| Real Estate, Rental & Leasing | 2 (100.0%) | 0 (0.0%) |
| Professional & Scientific | 0 (0.0%) | 0 (0.0%) |
| Enterprise Management | 0 (0.0%) | 0 (0.0%) |
| Administrative & Support | 0 (0.0%) | 0 (0.0%) |
| Educational Services | 0 (0.0%) | 3 (100.0%) |
| Health Care & Social Assistance | 0 (0.0%) | 15 (100.0%) |
| Arts, Entertainment & Recreation | 0 (0.0%) | 0 (0.0%) |
| Accommodation & Food Services | 0 (0.0%) | 0 (0.0%) |
| Public Administration | 0 (0.0%) | 2 (100.0%) |
| Total | 20 (50.0%) | 20 (50.0%) |
Education in Blue Mountain
School Enrollment in Blue Mountain
The most common levels of schooling among the 72 students in Blue Mountain are middle school (36 | 50.0%), elementary school (19 | 26.4%), and nursery / preschool (11 | 15.3%).
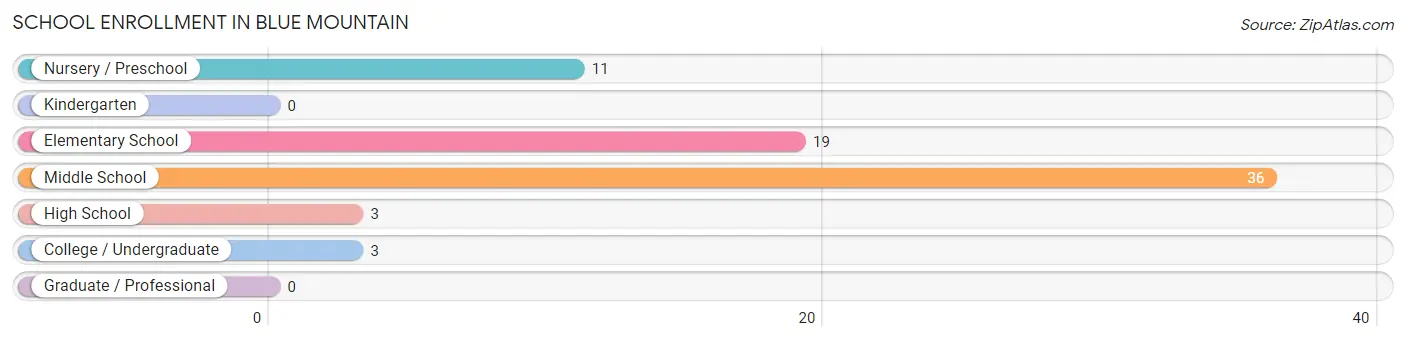
| School Level | # Students | % Students |
| Nursery / Preschool | 11 | 15.3% |
| Kindergarten | 0 | 0.0% |
| Elementary School | 19 | 26.4% |
| Middle School | 36 | 50.0% |
| High School | 3 | 4.2% |
| College / Undergraduate | 3 | 4.2% |
| Graduate / Professional | 0 | 0.0% |
| Total | 72 | 100.0% |
School Enrollment by Age by Funding Source in Blue Mountain
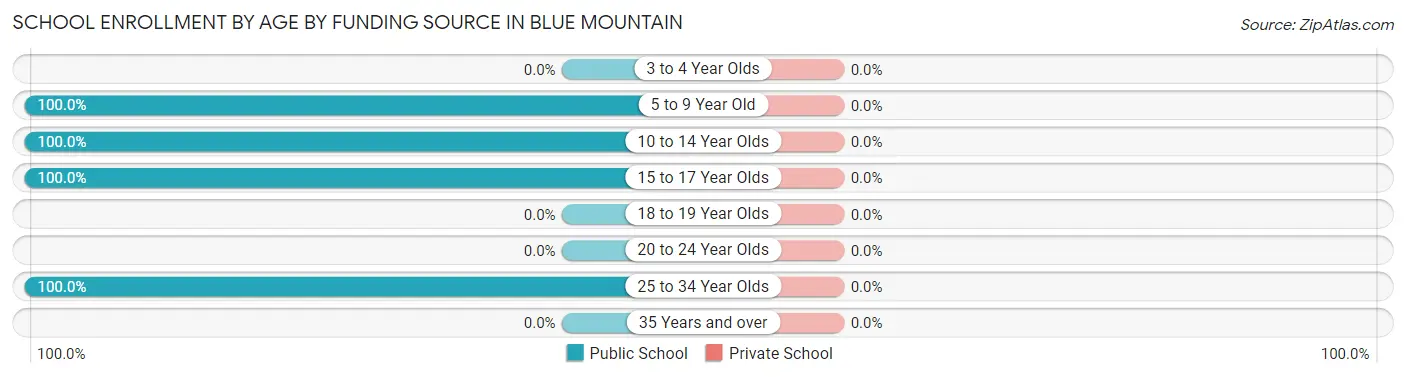
| Age Bracket | Public School | Private School |
| 3 to 4 Year Olds | 0 (0.0%) | 0 (0.0%) |
| 5 to 9 Year Old | 58 (100.0%) | 0 (0.0%) |
| 10 to 14 Year Olds | 8 (100.0%) | 0 (0.0%) |
| 15 to 17 Year Olds | 3 (100.0%) | 0 (0.0%) |
| 18 to 19 Year Olds | 0 (0.0%) | 0 (0.0%) |
| 20 to 24 Year Olds | 0 (0.0%) | 0 (0.0%) |
| 25 to 34 Year Olds | 3 (100.0%) | 0 (0.0%) |
| 35 Years and over | 0 (0.0%) | 0 (0.0%) |
| Total | 72 (100.0%) | 0 (0.0%) |
Educational Attainment by Field of Study in Blue Mountain
Computers & mathematics (3 | 60.0%), and bio, nature & agricultural (2 | 40.0%) are the most common fields of study among 5 individuals in Blue Mountain who have obtained a bachelor's degree or higher.
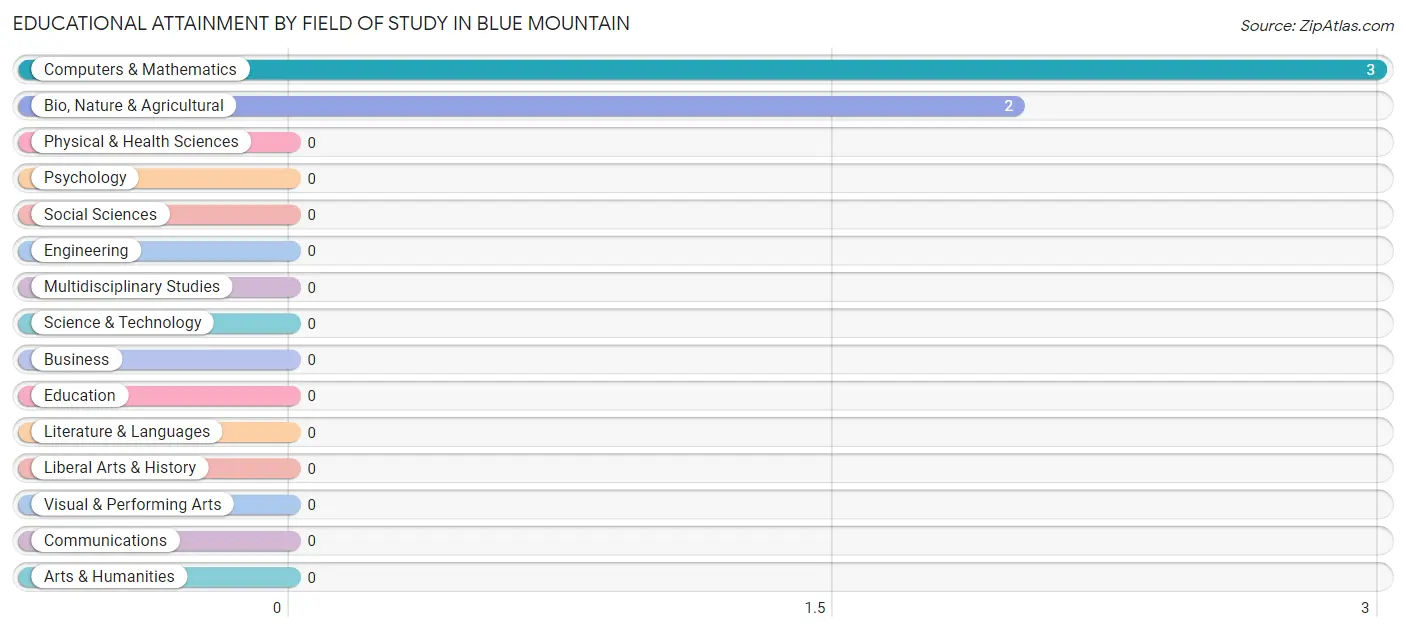
| Field of Study | # Graduates | % Graduates |
| Computers & Mathematics | 3 | 60.0% |
| Bio, Nature & Agricultural | 2 | 40.0% |
| Physical & Health Sciences | 0 | 0.0% |
| Psychology | 0 | 0.0% |
| Social Sciences | 0 | 0.0% |
| Engineering | 0 | 0.0% |
| Multidisciplinary Studies | 0 | 0.0% |
| Science & Technology | 0 | 0.0% |
| Business | 0 | 0.0% |
| Education | 0 | 0.0% |
| Literature & Languages | 0 | 0.0% |
| Liberal Arts & History | 0 | 0.0% |
| Visual & Performing Arts | 0 | 0.0% |
| Communications | 0 | 0.0% |
| Arts & Humanities | 0 | 0.0% |
| Total | 5 | 100.0% |
Transportation & Commute in Blue Mountain
Vehicle Availability by Sex in Blue Mountain
The most prevalent vehicle ownership categories in Blue Mountain are males with 4 vehicles (14, accounting for 70.0%) and females with 4 vehicles (7, making up 70.0%).
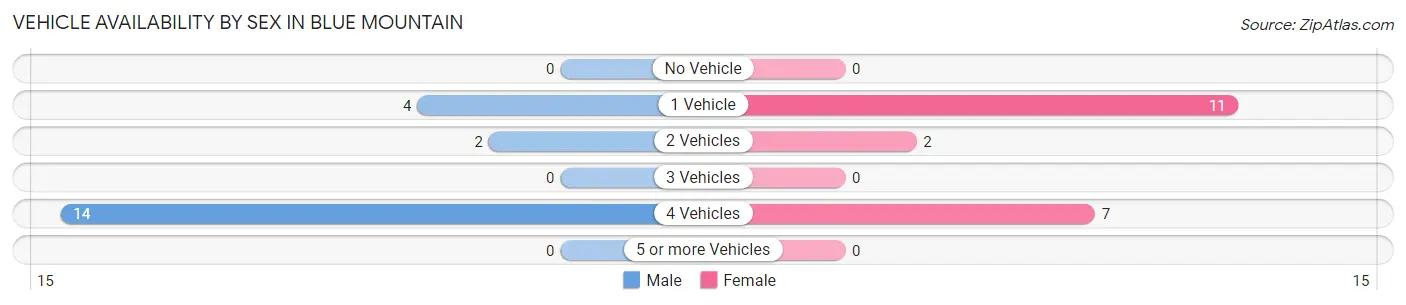
| Vehicles Available | Male | Female |
| No Vehicle | 0 (0.0%) | 0 (0.0%) |
| 1 Vehicle | 4 (20.0%) | 11 (55.0%) |
| 2 Vehicles | 2 (10.0%) | 2 (10.0%) |
| 3 Vehicles | 0 (0.0%) | 0 (0.0%) |
| 4 Vehicles | 14 (70.0%) | 7 (35.0%) |
| 5 or more Vehicles | 0 (0.0%) | 0 (0.0%) |
| Total | 20 (100.0%) | 20 (100.0%) |
Commute Time in Blue Mountain
The most frequently occuring commute durations in Blue Mountain are 15 to 19 minutes (20 commuters, 52.6%), 45 to 59 minutes (8 commuters, 21.0%), and 30 to 34 minutes (4 commuters, 10.5%).
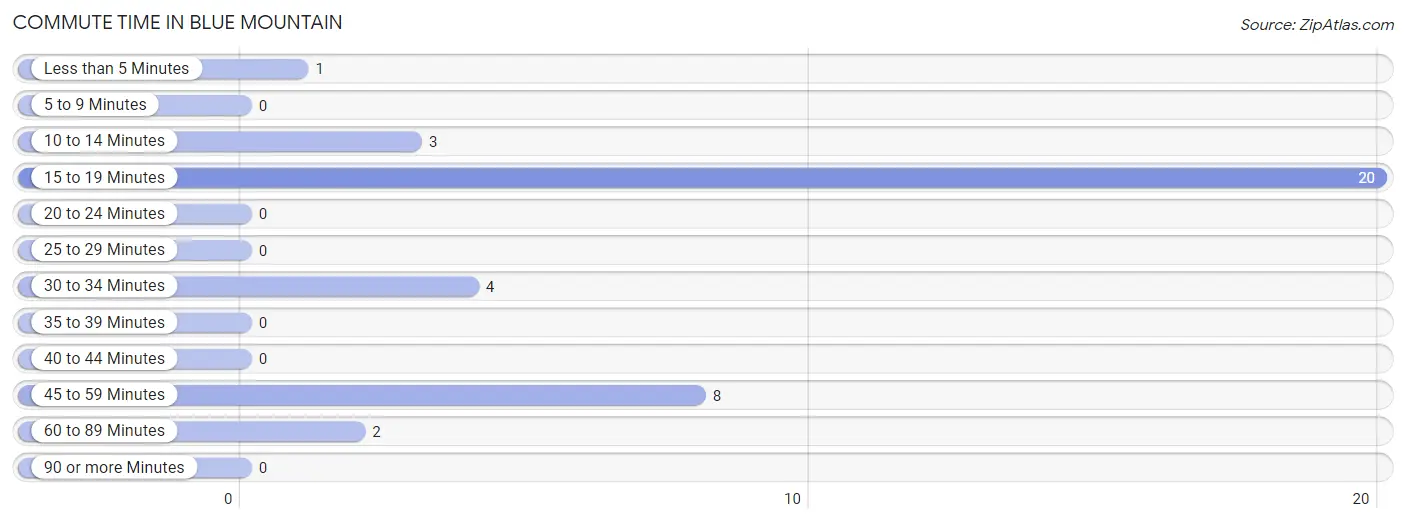
| Commute Time | # Commuters | % Commuters |
| Less than 5 Minutes | 1 | 2.6% |
| 5 to 9 Minutes | 0 | 0.0% |
| 10 to 14 Minutes | 3 | 7.9% |
| 15 to 19 Minutes | 20 | 52.6% |
| 20 to 24 Minutes | 0 | 0.0% |
| 25 to 29 Minutes | 0 | 0.0% |
| 30 to 34 Minutes | 4 | 10.5% |
| 35 to 39 Minutes | 0 | 0.0% |
| 40 to 44 Minutes | 0 | 0.0% |
| 45 to 59 Minutes | 8 | 21.0% |
| 60 to 89 Minutes | 2 | 5.3% |
| 90 or more Minutes | 0 | 0.0% |
Commute Time by Sex in Blue Mountain
The most common commute times in Blue Mountain are 45 to 59 minutes (8 commuters, 44.4%) for males and 15 to 19 minutes (20 commuters, 100.0%) for females.
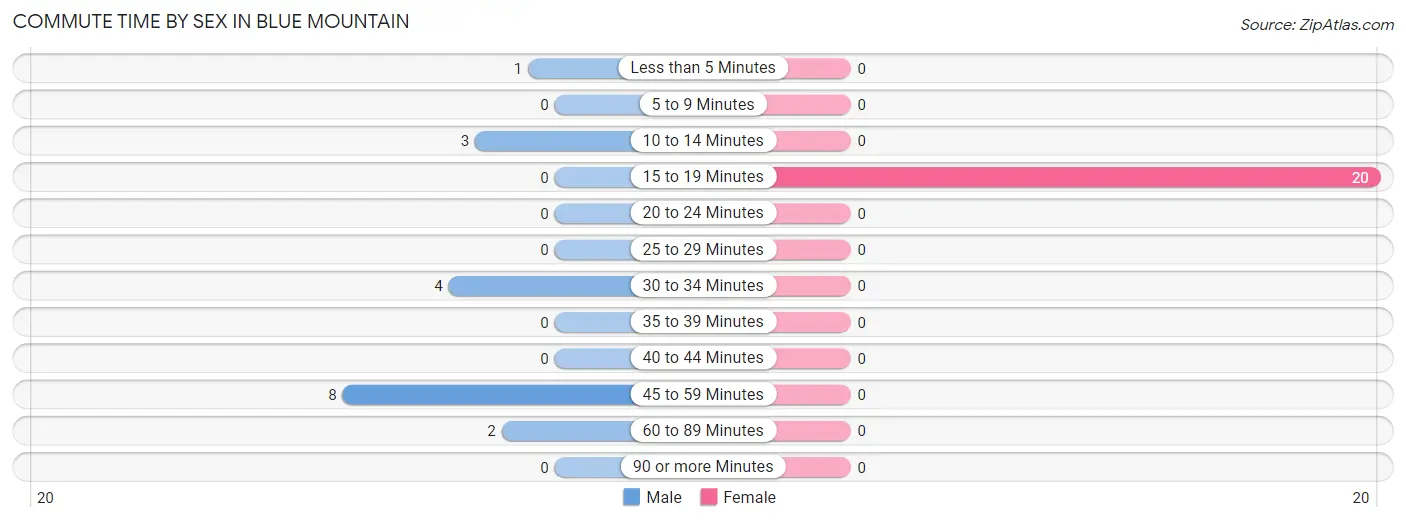
| Commute Time | Male | Female |
| Less than 5 Minutes | 1 (5.6%) | 0 (0.0%) |
| 5 to 9 Minutes | 0 (0.0%) | 0 (0.0%) |
| 10 to 14 Minutes | 3 (16.7%) | 0 (0.0%) |
| 15 to 19 Minutes | 0 (0.0%) | 20 (100.0%) |
| 20 to 24 Minutes | 0 (0.0%) | 0 (0.0%) |
| 25 to 29 Minutes | 0 (0.0%) | 0 (0.0%) |
| 30 to 34 Minutes | 4 (22.2%) | 0 (0.0%) |
| 35 to 39 Minutes | 0 (0.0%) | 0 (0.0%) |
| 40 to 44 Minutes | 0 (0.0%) | 0 (0.0%) |
| 45 to 59 Minutes | 8 (44.4%) | 0 (0.0%) |
| 60 to 89 Minutes | 2 (11.1%) | 0 (0.0%) |
| 90 or more Minutes | 0 (0.0%) | 0 (0.0%) |
Time of Departure to Work by Sex in Blue Mountain
The most frequent times of departure to work in Blue Mountain are 5:30 AM to 5:59 AM (6, 33.3%) for males and 12:00 PM to 3:59 PM (11, 55.0%) for females.
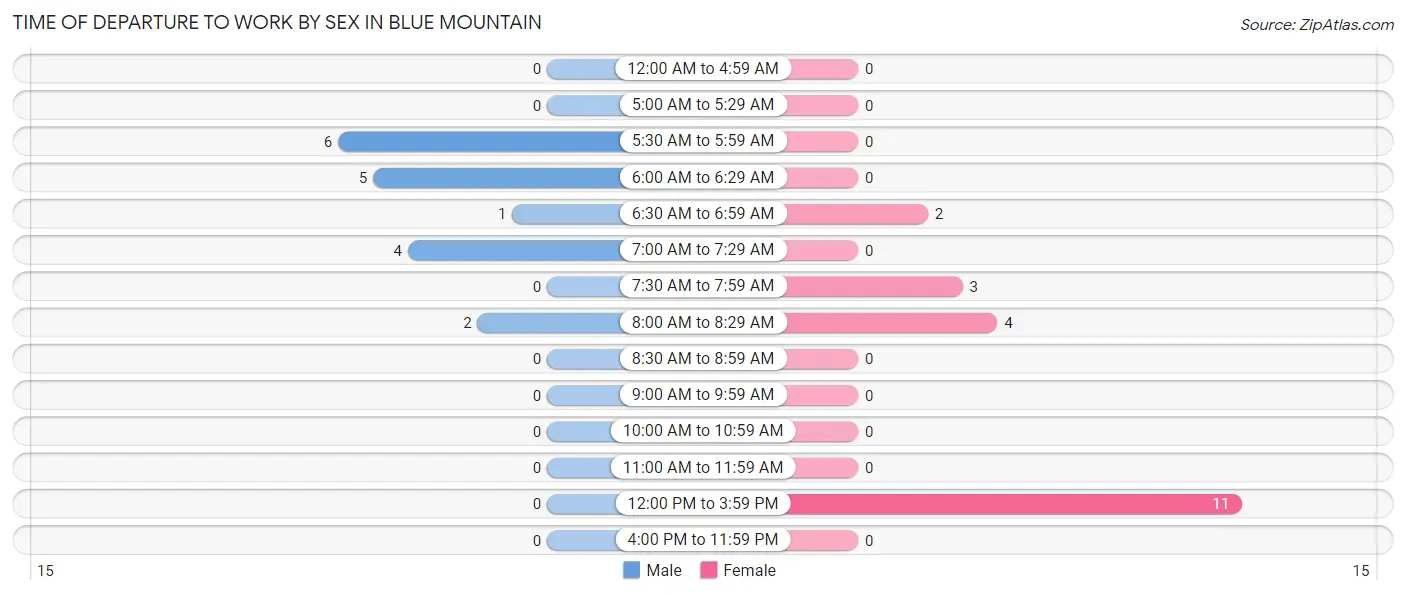
| Time of Departure | Male | Female |
| 12:00 AM to 4:59 AM | 0 (0.0%) | 0 (0.0%) |
| 5:00 AM to 5:29 AM | 0 (0.0%) | 0 (0.0%) |
| 5:30 AM to 5:59 AM | 6 (33.3%) | 0 (0.0%) |
| 6:00 AM to 6:29 AM | 5 (27.8%) | 0 (0.0%) |
| 6:30 AM to 6:59 AM | 1 (5.6%) | 2 (10.0%) |
| 7:00 AM to 7:29 AM | 4 (22.2%) | 0 (0.0%) |
| 7:30 AM to 7:59 AM | 0 (0.0%) | 3 (15.0%) |
| 8:00 AM to 8:29 AM | 2 (11.1%) | 4 (20.0%) |
| 8:30 AM to 8:59 AM | 0 (0.0%) | 0 (0.0%) |
| 9:00 AM to 9:59 AM | 0 (0.0%) | 0 (0.0%) |
| 10:00 AM to 10:59 AM | 0 (0.0%) | 0 (0.0%) |
| 11:00 AM to 11:59 AM | 0 (0.0%) | 0 (0.0%) |
| 12:00 PM to 3:59 PM | 0 (0.0%) | 11 (55.0%) |
| 4:00 PM to 11:59 PM | 0 (0.0%) | 0 (0.0%) |
| Total | 18 (100.0%) | 20 (100.0%) |
Housing Occupancy in Blue Mountain
Occupancy by Ownership in Blue Mountain
Of the total 37 dwellings in Blue Mountain, owner-occupied units account for 26 (70.3%), while renter-occupied units make up 11 (29.7%).
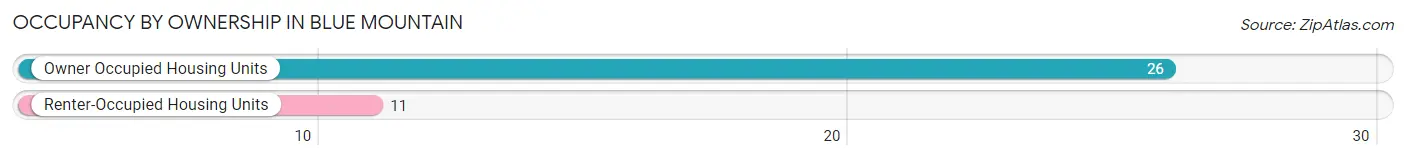
| Occupancy | # Housing Units | % Housing Units |
| Owner Occupied Housing Units | 26 | 70.3% |
| Renter-Occupied Housing Units | 11 | 29.7% |
| Total Occupied Housing Units | 37 | 100.0% |
Occupancy by Household Size in Blue Mountain
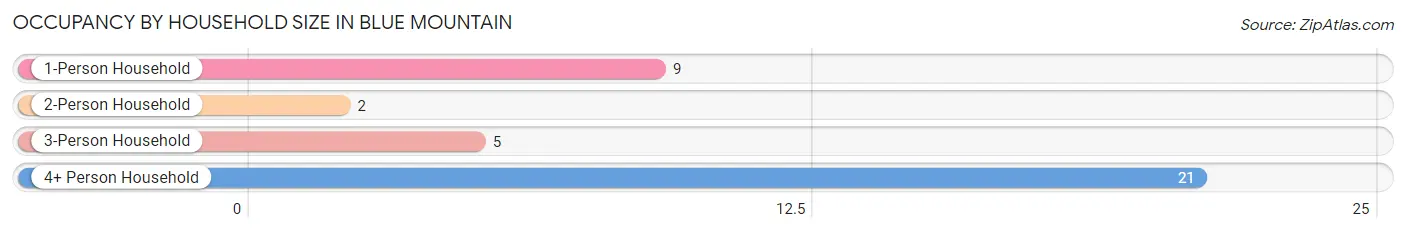
| Household Size | # Housing Units | % Housing Units |
| 1-Person Household | 9 | 24.3% |
| 2-Person Household | 2 | 5.4% |
| 3-Person Household | 5 | 13.5% |
| 4+ Person Household | 21 | 56.8% |
| Total Housing Units | 37 | 100.0% |
Occupancy by Ownership by Household Size in Blue Mountain
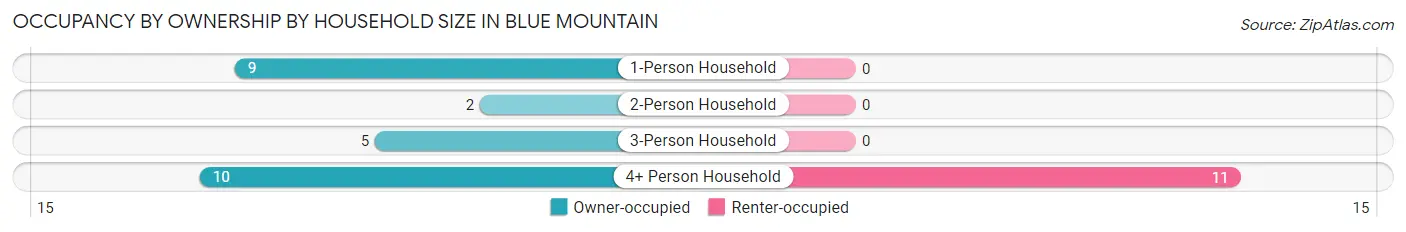
| Household Size | Owner-occupied | Renter-occupied |
| 1-Person Household | 9 (100.0%) | 0 (0.0%) |
| 2-Person Household | 2 (100.0%) | 0 (0.0%) |
| 3-Person Household | 5 (100.0%) | 0 (0.0%) |
| 4+ Person Household | 10 (47.6%) | 11 (52.4%) |
| Total Housing Units | 26 (70.3%) | 11 (29.7%) |
Occupancy by Educational Attainment in Blue Mountain
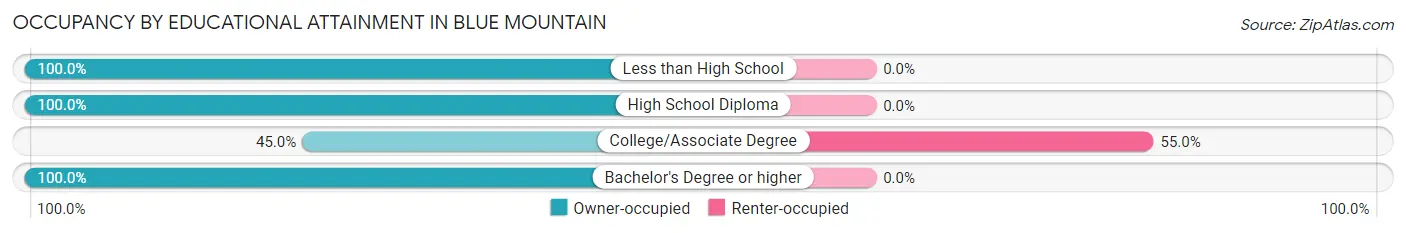
| Household Size | Owner-occupied | Renter-occupied |
| Less than High School | 5 (100.0%) | 0 (0.0%) |
| High School Diploma | 7 (100.0%) | 0 (0.0%) |
| College/Associate Degree | 9 (45.0%) | 11 (55.0%) |
| Bachelor's Degree or higher | 5 (100.0%) | 0 (0.0%) |
Occupancy by Age of Householder in Blue Mountain
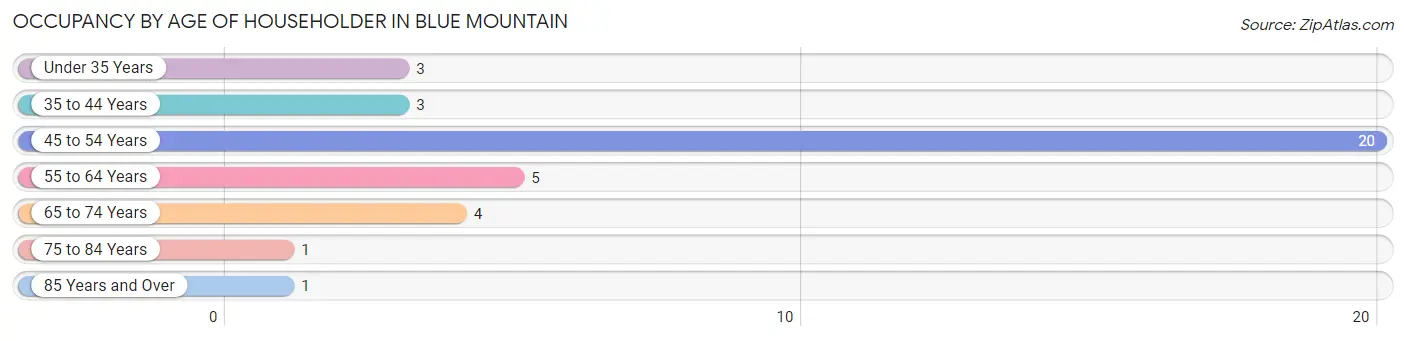
| Age Bracket | # Households | % Households |
| Under 35 Years | 3 | 8.1% |
| 35 to 44 Years | 3 | 8.1% |
| 45 to 54 Years | 20 | 54.0% |
| 55 to 64 Years | 5 | 13.5% |
| 65 to 74 Years | 4 | 10.8% |
| 75 to 84 Years | 1 | 2.7% |
| 85 Years and Over | 1 | 2.7% |
| Total | 37 | 100.0% |
Housing Finances in Blue Mountain
Median Income by Occupancy in Blue Mountain
| Occupancy Type | # Households | Median Income |
| Owner-Occupied | 26 (70.3%) | $0 |
| Renter-Occupied | 11 (29.7%) | $0 |
| Average | 37 (100.0%) | $0 |
Occupancy by Householder Income Bracket in Blue Mountain
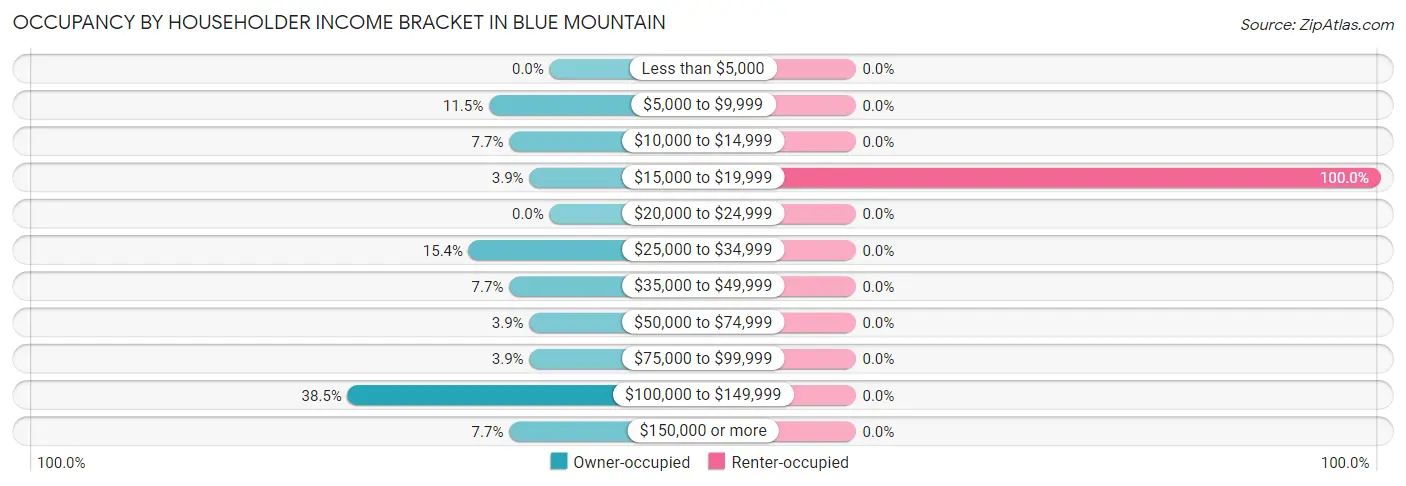
| Income Bracket | Owner-occupied | Renter-occupied |
| Less than $5,000 | 0 (0.0%) | 0 (0.0%) |
| $5,000 to $9,999 | 3 (11.5%) | 0 (0.0%) |
| $10,000 to $14,999 | 2 (7.7%) | 0 (0.0%) |
| $15,000 to $19,999 | 1 (3.8%) | 11 (100.0%) |
| $20,000 to $24,999 | 0 (0.0%) | 0 (0.0%) |
| $25,000 to $34,999 | 4 (15.4%) | 0 (0.0%) |
| $35,000 to $49,999 | 2 (7.7%) | 0 (0.0%) |
| $50,000 to $74,999 | 1 (3.8%) | 0 (0.0%) |
| $75,000 to $99,999 | 1 (3.8%) | 0 (0.0%) |
| $100,000 to $149,999 | 10 (38.5%) | 0 (0.0%) |
| $150,000 or more | 2 (7.7%) | 0 (0.0%) |
| Total | 26 (100.0%) | 11 (100.0%) |
Monthly Housing Cost Tiers in Blue Mountain
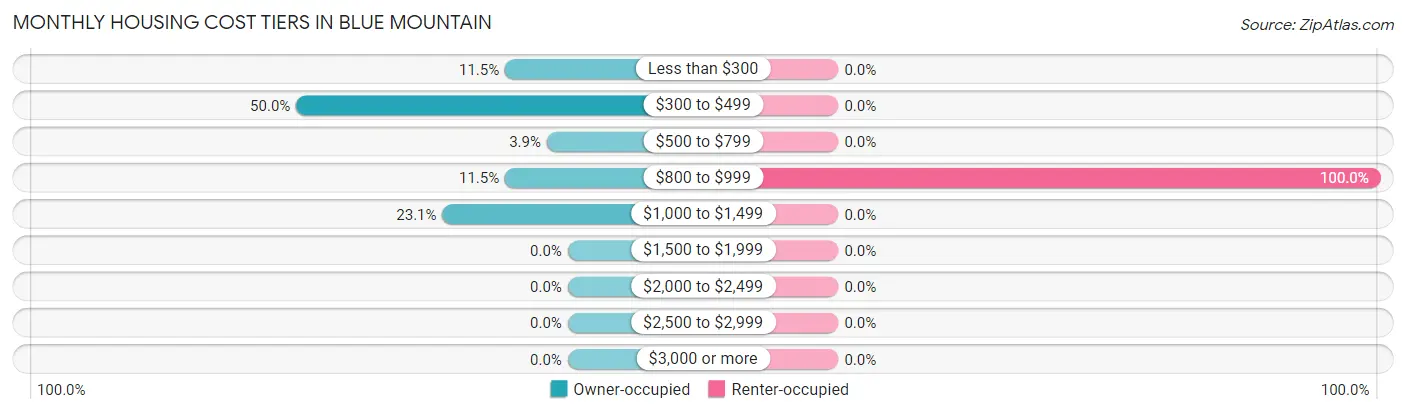
| Monthly Cost | Owner-occupied | Renter-occupied |
| Less than $300 | 3 (11.5%) | 0 (0.0%) |
| $300 to $499 | 13 (50.0%) | 0 (0.0%) |
| $500 to $799 | 1 (3.8%) | 0 (0.0%) |
| $800 to $999 | 3 (11.5%) | 11 (100.0%) |
| $1,000 to $1,499 | 6 (23.1%) | 0 (0.0%) |
| $1,500 to $1,999 | 0 (0.0%) | 0 (0.0%) |
| $2,000 to $2,499 | 0 (0.0%) | 0 (0.0%) |
| $2,500 to $2,999 | 0 (0.0%) | 0 (0.0%) |
| $3,000 or more | 0 (0.0%) | 0 (0.0%) |
| Total | 26 (100.0%) | 11 (100.0%) |
Physical Housing Characteristics in Blue Mountain
Housing Structures in Blue Mountain
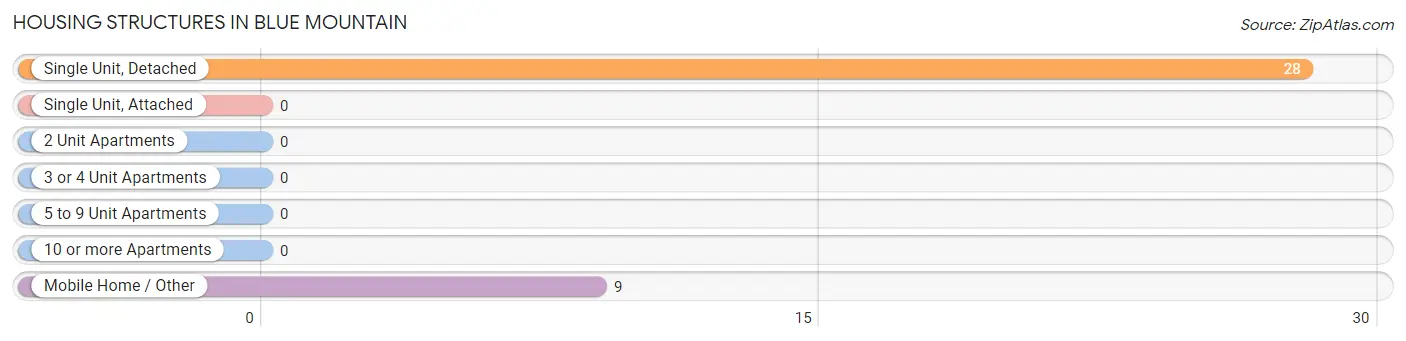
| Structure Type | # Housing Units | % Housing Units |
| Single Unit, Detached | 28 | 75.7% |
| Single Unit, Attached | 0 | 0.0% |
| 2 Unit Apartments | 0 | 0.0% |
| 3 or 4 Unit Apartments | 0 | 0.0% |
| 5 to 9 Unit Apartments | 0 | 0.0% |
| 10 or more Apartments | 0 | 0.0% |
| Mobile Home / Other | 9 | 24.3% |
| Total | 37 | 100.0% |
Housing Structures by Occupancy in Blue Mountain
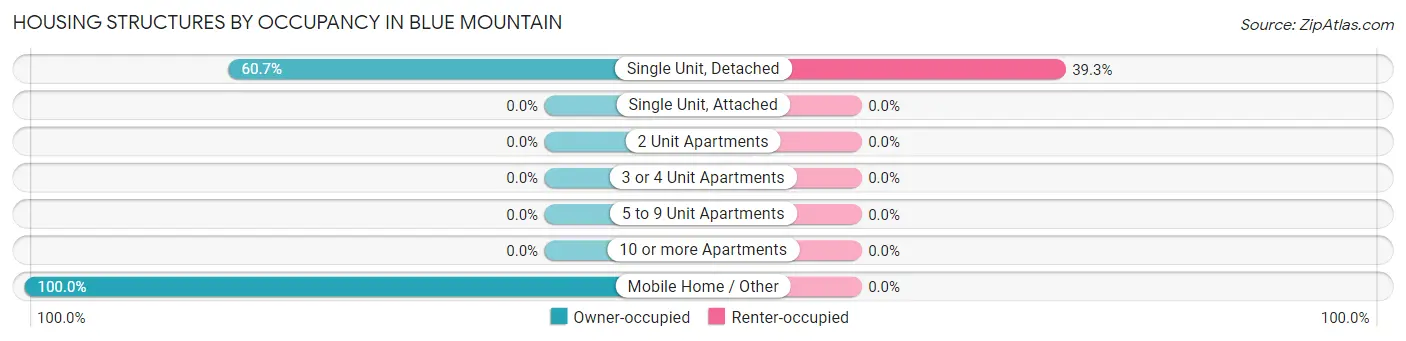
| Structure Type | Owner-occupied | Renter-occupied |
| Single Unit, Detached | 17 (60.7%) | 11 (39.3%) |
| Single Unit, Attached | 0 (0.0%) | 0 (0.0%) |
| 2 Unit Apartments | 0 (0.0%) | 0 (0.0%) |
| 3 or 4 Unit Apartments | 0 (0.0%) | 0 (0.0%) |
| 5 to 9 Unit Apartments | 0 (0.0%) | 0 (0.0%) |
| 10 or more Apartments | 0 (0.0%) | 0 (0.0%) |
| Mobile Home / Other | 9 (100.0%) | 0 (0.0%) |
| Total | 26 (70.3%) | 11 (29.7%) |
Housing Structures by Number of Rooms in Blue Mountain
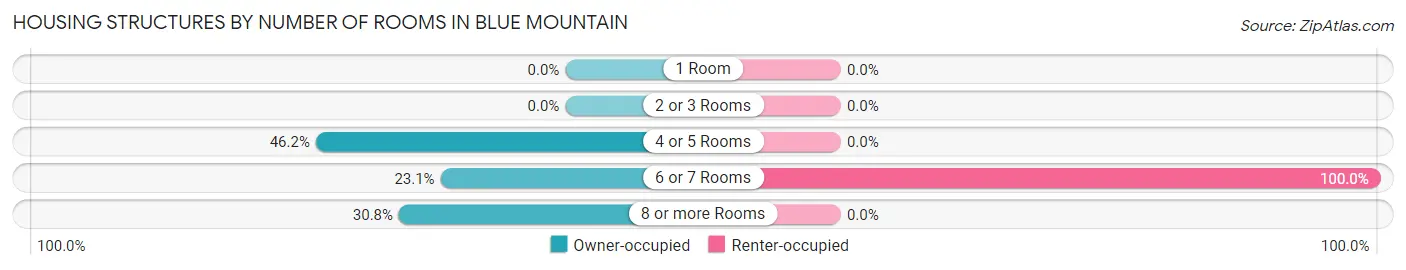
| Number of Rooms | Owner-occupied | Renter-occupied |
| 1 Room | 0 (0.0%) | 0 (0.0%) |
| 2 or 3 Rooms | 0 (0.0%) | 0 (0.0%) |
| 4 or 5 Rooms | 12 (46.2%) | 0 (0.0%) |
| 6 or 7 Rooms | 6 (23.1%) | 11 (100.0%) |
| 8 or more Rooms | 8 (30.8%) | 0 (0.0%) |
| Total | 26 (100.0%) | 11 (100.0%) |
Housing Structure by Heating Type in Blue Mountain
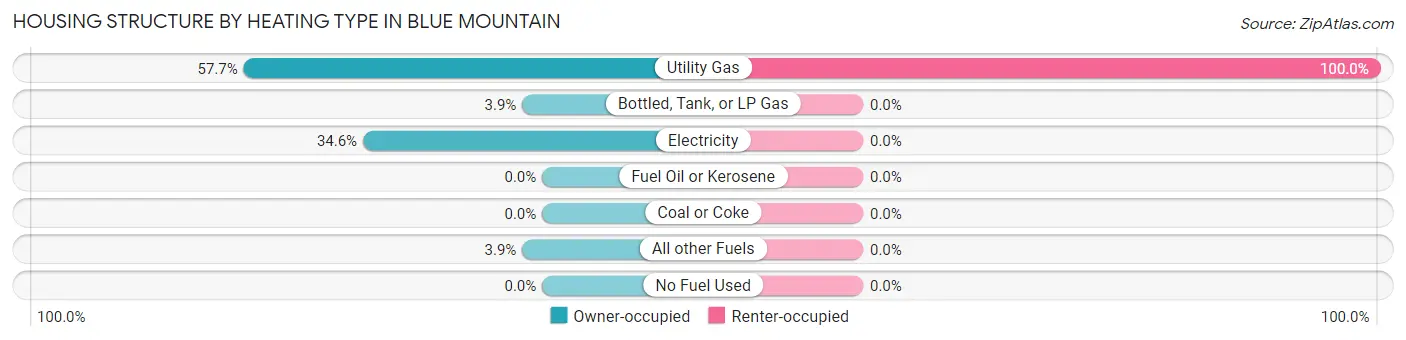
| Heating Type | Owner-occupied | Renter-occupied |
| Utility Gas | 15 (57.7%) | 11 (100.0%) |
| Bottled, Tank, or LP Gas | 1 (3.8%) | 0 (0.0%) |
| Electricity | 9 (34.6%) | 0 (0.0%) |
| Fuel Oil or Kerosene | 0 (0.0%) | 0 (0.0%) |
| Coal or Coke | 0 (0.0%) | 0 (0.0%) |
| All other Fuels | 1 (3.8%) | 0 (0.0%) |
| No Fuel Used | 0 (0.0%) | 0 (0.0%) |
| Total | 26 (100.0%) | 11 (100.0%) |
Household Vehicle Usage in Blue Mountain
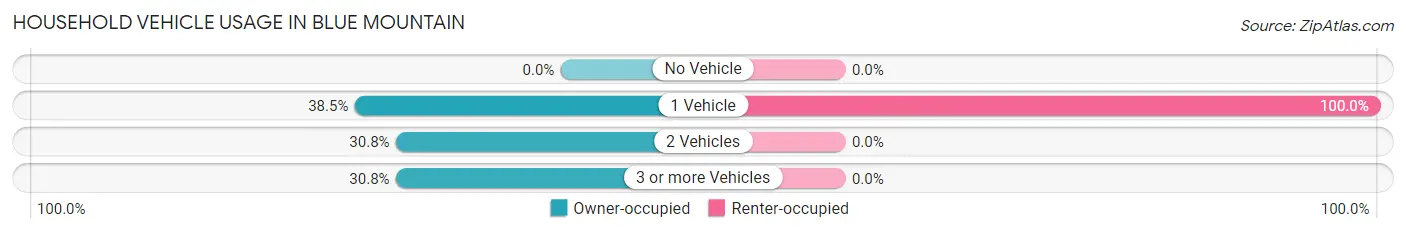
| Vehicles per Household | Owner-occupied | Renter-occupied |
| No Vehicle | 0 (0.0%) | 0 (0.0%) |
| 1 Vehicle | 10 (38.5%) | 11 (100.0%) |
| 2 Vehicles | 8 (30.8%) | 0 (0.0%) |
| 3 or more Vehicles | 8 (30.8%) | 0 (0.0%) |
| Total | 26 (100.0%) | 11 (100.0%) |
Real Estate & Mortgages in Blue Mountain
Real Estate and Mortgage Overview in Blue Mountain
| Characteristic | Without Mortgage | With Mortgage |
| Housing Units | 15 | 11 |
| Median Property Value | - | - |
| Median Household Income | $88,750 | $0 |
| Monthly Housing Costs | $428 | $0 |
| Real Estate Taxes | $280 | $0 |
Property Value by Mortgage Status in Blue Mountain
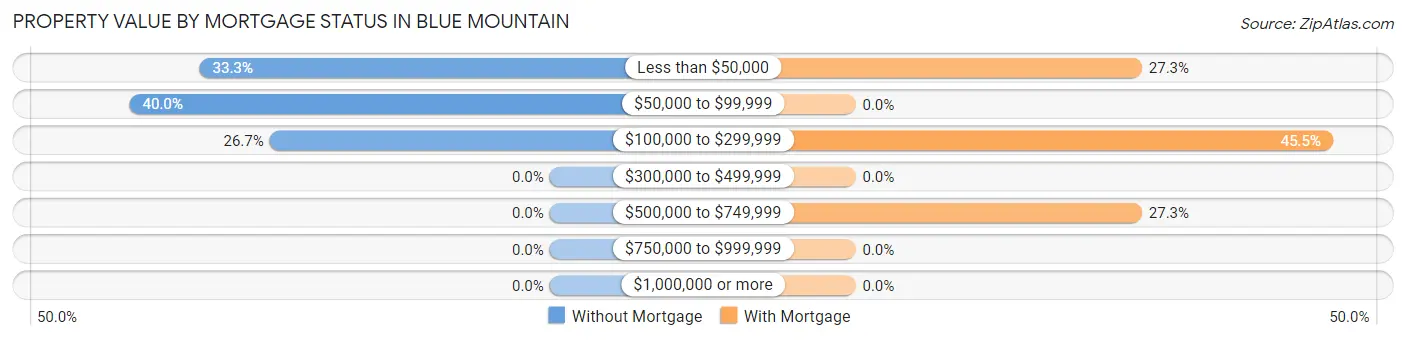
| Property Value | Without Mortgage | With Mortgage |
| Less than $50,000 | 5 (33.3%) | 3 (27.3%) |
| $50,000 to $99,999 | 6 (40.0%) | 0 (0.0%) |
| $100,000 to $299,999 | 4 (26.7%) | 5 (45.5%) |
| $300,000 to $499,999 | 0 (0.0%) | 0 (0.0%) |
| $500,000 to $749,999 | 0 (0.0%) | 3 (27.3%) |
| $750,000 to $999,999 | 0 (0.0%) | 0 (0.0%) |
| $1,000,000 or more | 0 (0.0%) | 0 (0.0%) |
| Total | 15 (100.0%) | 11 (100.0%) |
Household Income by Mortgage Status in Blue Mountain
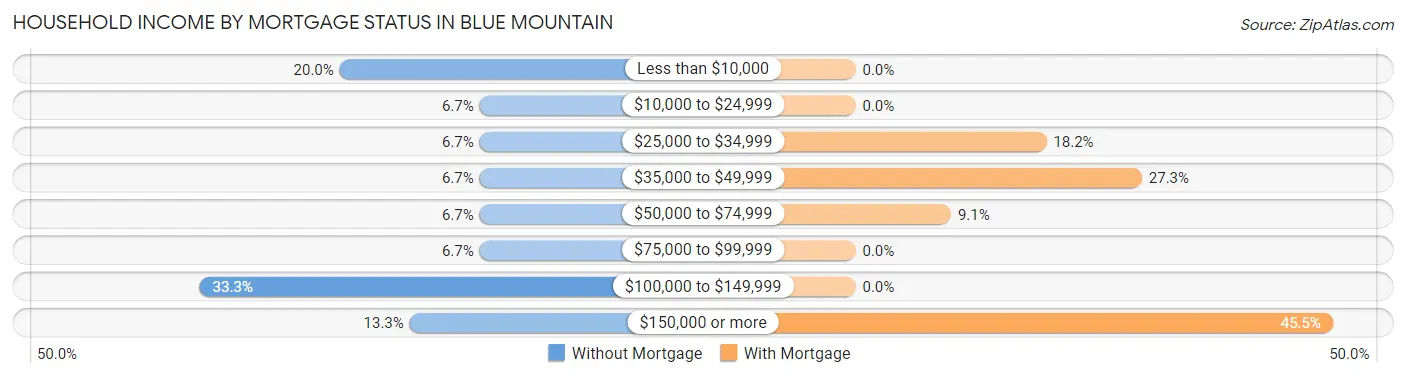
| Household Income | Without Mortgage | With Mortgage |
| Less than $10,000 | 3 (20.0%) | 0 (0.0%) |
| $10,000 to $24,999 | 1 (6.7%) | 0 (0.0%) |
| $25,000 to $34,999 | 1 (6.7%) | 2 (18.2%) |
| $35,000 to $49,999 | 1 (6.7%) | 3 (27.3%) |
| $50,000 to $74,999 | 1 (6.7%) | 1 (9.1%) |
| $75,000 to $99,999 | 1 (6.7%) | 0 (0.0%) |
| $100,000 to $149,999 | 5 (33.3%) | 0 (0.0%) |
| $150,000 or more | 2 (13.3%) | 5 (45.5%) |
| Total | 15 (100.0%) | 11 (100.0%) |
Property Value to Household Income Ratio in Blue Mountain
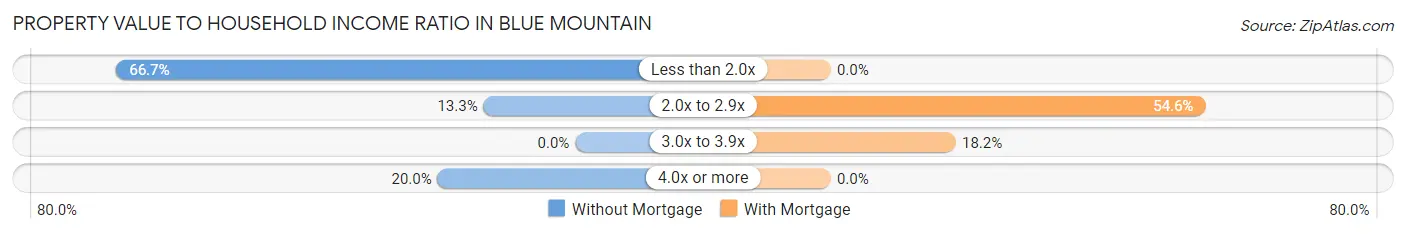
| Value-to-Income Ratio | Without Mortgage | With Mortgage |
| Less than 2.0x | 10 (66.7%) | 0 (0.0%) |
| 2.0x to 2.9x | 2 (13.3%) | 6 (54.5%) |
| 3.0x to 3.9x | 0 (0.0%) | 2 (18.2%) |
| 4.0x or more | 3 (20.0%) | 0 (0.0%) |
| Total | 15 (100.0%) | 11 (100.0%) |
Real Estate Taxes by Mortgage Status in Blue Mountain
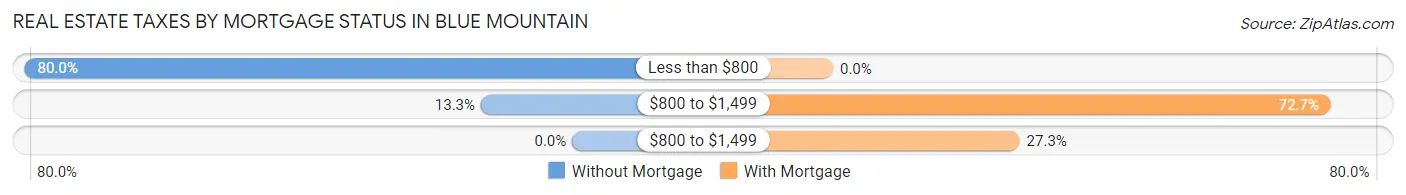
| Property Taxes | Without Mortgage | With Mortgage |
| Less than $800 | 12 (80.0%) | 0 (0.0%) |
| $800 to $1,499 | 2 (13.3%) | 8 (72.7%) |
| $800 to $1,499 | 0 (0.0%) | 3 (27.3%) |
| Total | 15 (100.0%) | 11 (100.0%) |
Health & Disability in Blue Mountain
Health Insurance Coverage by Age in Blue Mountain
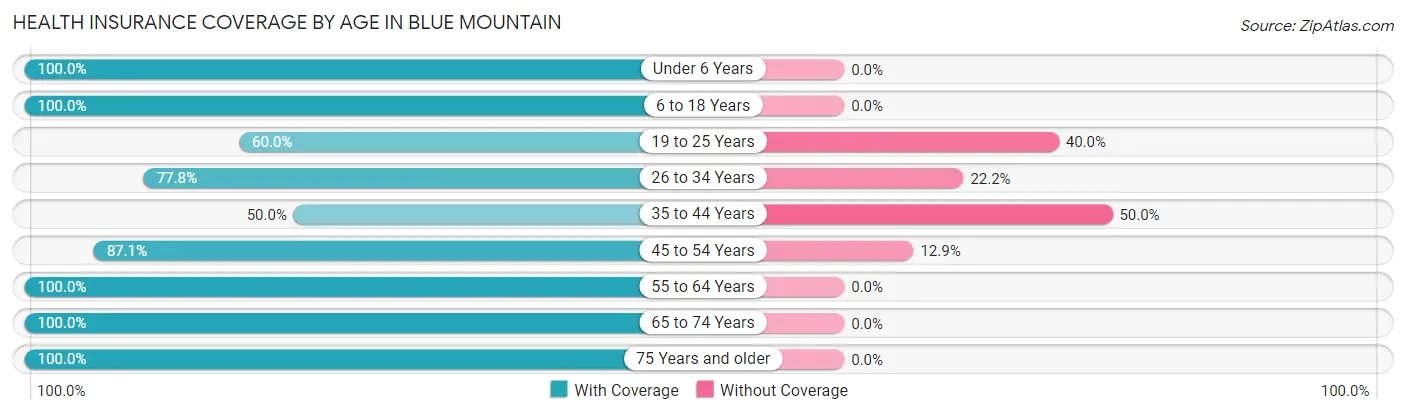
| Age Bracket | With Coverage | Without Coverage |
| Under 6 Years | 14 (100.0%) | 0 (0.0%) |
| 6 to 18 Years | 58 (100.0%) | 0 (0.0%) |
| 19 to 25 Years | 6 (60.0%) | 4 (40.0%) |
| 26 to 34 Years | 7 (77.8%) | 2 (22.2%) |
| 35 to 44 Years | 3 (50.0%) | 3 (50.0%) |
| 45 to 54 Years | 27 (87.1%) | 4 (12.9%) |
| 55 to 64 Years | 18 (100.0%) | 0 (0.0%) |
| 65 to 74 Years | 4 (100.0%) | 0 (0.0%) |
| 75 Years and older | 3 (100.0%) | 0 (0.0%) |
| Total | 140 (91.5%) | 13 (8.5%) |
Health Insurance Coverage by Citizenship Status in Blue Mountain
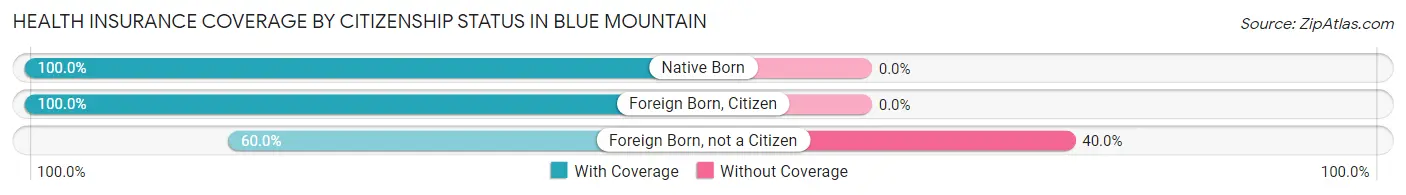
| Citizenship Status | With Coverage | Without Coverage |
| Native Born | 14 (100.0%) | 0 (0.0%) |
| Foreign Born, Citizen | 58 (100.0%) | 0 (0.0%) |
| Foreign Born, not a Citizen | 6 (60.0%) | 4 (40.0%) |
Health Insurance Coverage by Household Income in Blue Mountain
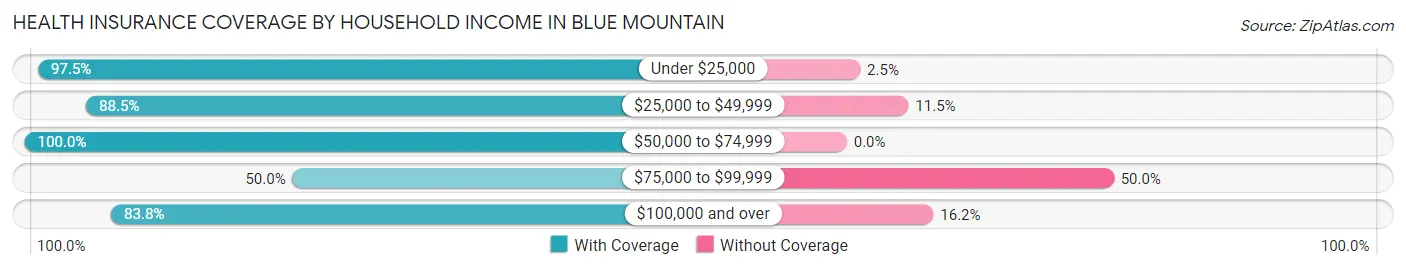
| Household Income | With Coverage | Without Coverage |
| Under $25,000 | 78 (97.5%) | 2 (2.5%) |
| $25,000 to $49,999 | 23 (88.5%) | 3 (11.5%) |
| $50,000 to $74,999 | 6 (100.0%) | 0 (0.0%) |
| $75,000 to $99,999 | 2 (50.0%) | 2 (50.0%) |
| $100,000 and over | 31 (83.8%) | 6 (16.2%) |
Public vs Private Health Insurance Coverage by Age in Blue Mountain
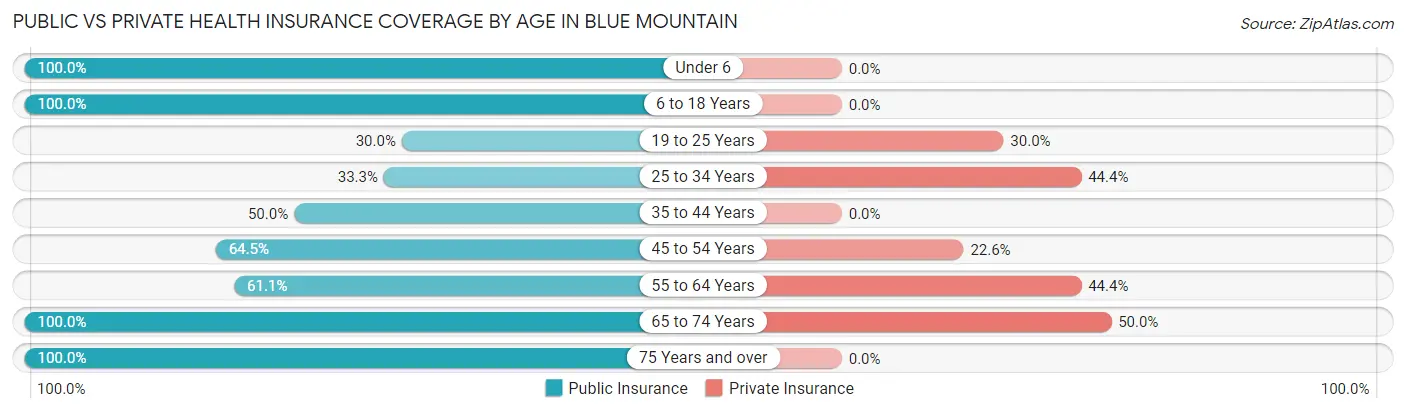
| Age Bracket | Public Insurance | Private Insurance |
| Under 6 | 14 (100.0%) | 0 (0.0%) |
| 6 to 18 Years | 58 (100.0%) | 0 (0.0%) |
| 19 to 25 Years | 3 (30.0%) | 3 (30.0%) |
| 25 to 34 Years | 3 (33.3%) | 4 (44.4%) |
| 35 to 44 Years | 3 (50.0%) | 0 (0.0%) |
| 45 to 54 Years | 20 (64.5%) | 7 (22.6%) |
| 55 to 64 Years | 11 (61.1%) | 8 (44.4%) |
| 65 to 74 Years | 4 (100.0%) | 2 (50.0%) |
| 75 Years and over | 3 (100.0%) | 0 (0.0%) |
| Total | 119 (77.8%) | 24 (15.7%) |
Disability Status by Sex by Age in Blue Mountain
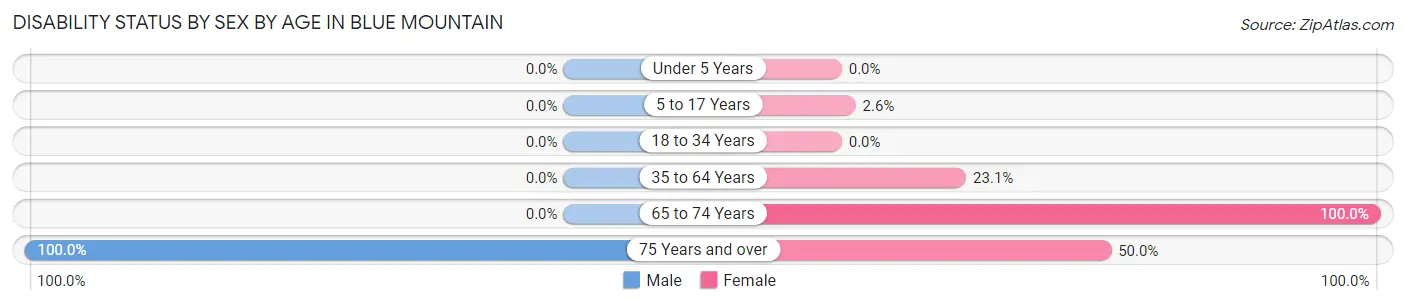
| Age Bracket | Male | Female |
| Under 5 Years | 0 (0.0%) | 0 (0.0%) |
| 5 to 17 Years | 0 (0.0%) | 1 (2.6%) |
| 18 to 34 Years | 0 (0.0%) | 0 (0.0%) |
| 35 to 64 Years | 0 (0.0%) | 6 (23.1%) |
| 65 to 74 Years | 0 (0.0%) | 2 (100.0%) |
| 75 Years and over | 1 (100.0%) | 1 (50.0%) |
Disability Class by Sex by Age in Blue Mountain
Disability Class: Hearing Difficulty
| Age Bracket | Male | Female |
| Under 5 Years | 0 (0.0%) | 0 (0.0%) |
| 5 to 17 Years | 0 (0.0%) | 0 (0.0%) |
| 18 to 34 Years | 0 (0.0%) | 0 (0.0%) |
| 35 to 64 Years | 0 (0.0%) | 0 (0.0%) |
| 65 to 74 Years | 0 (0.0%) | 0 (0.0%) |
| 75 Years and over | 0 (0.0%) | 0 (0.0%) |
Disability Class: Vision Difficulty
| Age Bracket | Male | Female |
| Under 5 Years | 0 (0.0%) | 0 (0.0%) |
| 5 to 17 Years | 0 (0.0%) | 0 (0.0%) |
| 18 to 34 Years | 0 (0.0%) | 0 (0.0%) |
| 35 to 64 Years | 0 (0.0%) | 0 (0.0%) |
| 65 to 74 Years | 0 (0.0%) | 0 (0.0%) |
| 75 Years and over | 0 (0.0%) | 0 (0.0%) |
Disability Class: Cognitive Difficulty
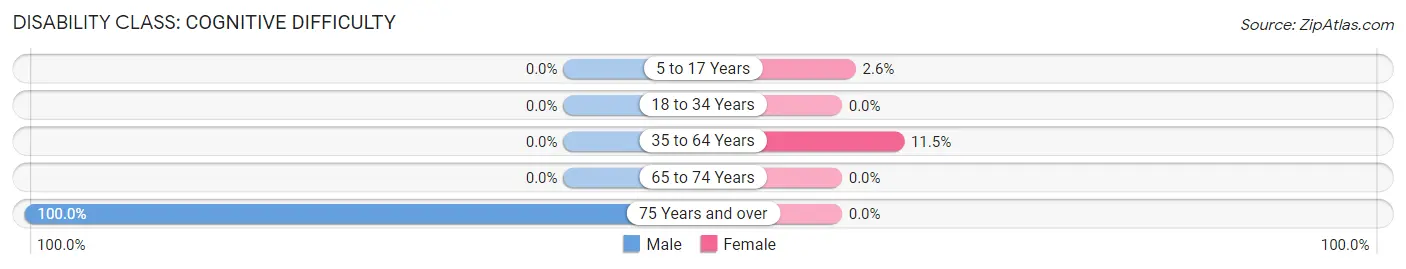
| Age Bracket | Male | Female |
| 5 to 17 Years | 0 (0.0%) | 1 (2.6%) |
| 18 to 34 Years | 0 (0.0%) | 0 (0.0%) |
| 35 to 64 Years | 0 (0.0%) | 3 (11.5%) |
| 65 to 74 Years | 0 (0.0%) | 0 (0.0%) |
| 75 Years and over | 1 (100.0%) | 0 (0.0%) |
Disability Class: Ambulatory Difficulty
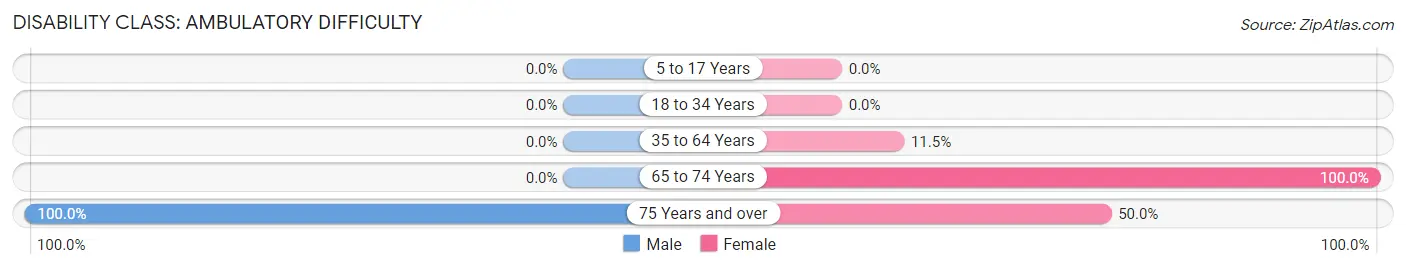
| Age Bracket | Male | Female |
| 5 to 17 Years | 0 (0.0%) | 0 (0.0%) |
| 18 to 34 Years | 0 (0.0%) | 0 (0.0%) |
| 35 to 64 Years | 0 (0.0%) | 3 (11.5%) |
| 65 to 74 Years | 0 (0.0%) | 2 (100.0%) |
| 75 Years and over | 1 (100.0%) | 1 (50.0%) |
Disability Class: Self-Care Difficulty
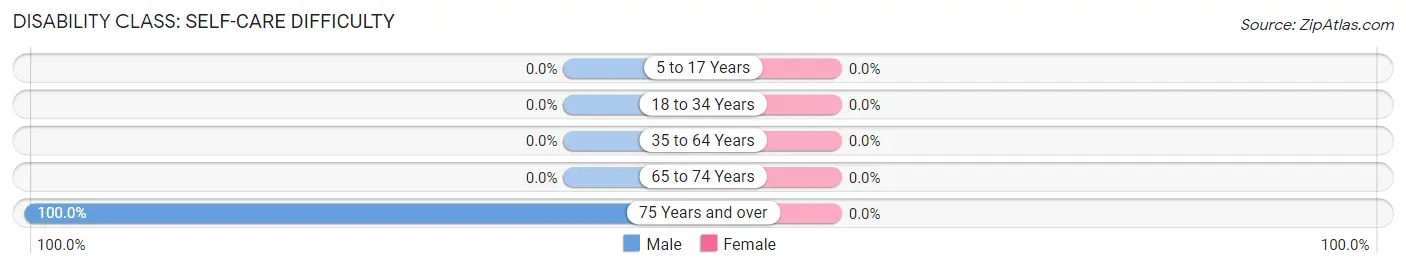
| Age Bracket | Male | Female |
| 5 to 17 Years | 0 (0.0%) | 0 (0.0%) |
| 18 to 34 Years | 0 (0.0%) | 0 (0.0%) |
| 35 to 64 Years | 0 (0.0%) | 0 (0.0%) |
| 65 to 74 Years | 0 (0.0%) | 0 (0.0%) |
| 75 Years and over | 1 (100.0%) | 0 (0.0%) |
Technology Access in Blue Mountain
Computing Device Access in Blue Mountain
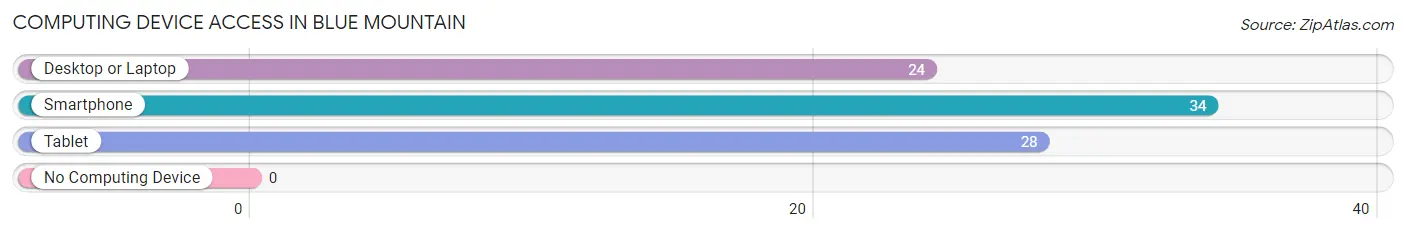
| Device Type | # Households | % Households |
| Desktop or Laptop | 24 | 64.9% |
| Smartphone | 34 | 91.9% |
| Tablet | 28 | 75.7% |
| No Computing Device | 0 | 0.0% |
| Total | 37 | 100.0% |
Internet Access in Blue Mountain
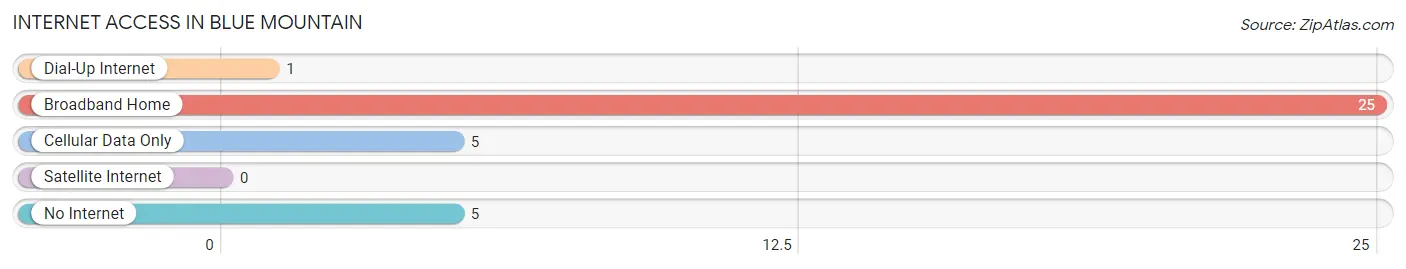
| Internet Type | # Households | % Households |
| Dial-Up Internet | 1 | 2.7% |
| Broadband Home | 25 | 67.6% |
| Cellular Data Only | 5 | 13.5% |
| Satellite Internet | 0 | 0.0% |
| No Internet | 5 | 13.5% |
| Total | 37 | 100.0% |
Blue Mountain Summary
Introduction
Blue Mountain is a small town located in the foothills of the Ozark Mountains in Arkansas. It is situated in the northern part of the state, about 30 miles from the state capital of Little Rock. The town has a population of just over 1,000 people and is known for its rural charm and scenic beauty. The town is home to a variety of businesses, including a few restaurants, a grocery store, and a few small shops. The town is also home to a number of churches, including the First Baptist Church of Blue Mountain.
History
Blue Mountain was first settled in the early 1800s by settlers from Tennessee and Kentucky. The town was originally known as “Blue Mountain Station” and was a stop on the stagecoach line that ran between Little Rock and Memphis. The town was officially incorporated in 1883 and was named after the nearby Blue Mountain range.
In the early 1900s, the town began to grow and prosper. The town was home to a variety of businesses, including a sawmill, a gristmill, a cotton gin, and a blacksmith shop. The town also had a post office, a bank, and a hotel.
In the 1950s, the town began to decline as the railroad line that ran through the town was abandoned. The town’s population began to decline as well, and by the 1970s, the town had a population of just over 500 people.
Geography
Blue Mountain is located in the foothills of the Ozark Mountains in northern Arkansas. The town is situated in the foothills of the Ozark Mountains, about 30 miles from the state capital of Little Rock. The town is located in the foothills of the Ozark Mountains, and the surrounding area is characterized by rolling hills and dense forests. The town is located in the White River Valley, and the White River runs through the town.
Economy
Blue Mountain’s economy is largely based on agriculture and tourism. The town is home to a variety of farms, including cattle, poultry, and vegetable farms. The town is also home to a number of small businesses, including restaurants, grocery stores, and a few small shops. The town is also home to a number of churches, including the First Baptist Church of Blue Mountain.
The town is also home to a number of tourist attractions, including the Ozark National Forest, the Buffalo National River, and the Blanchard Springs Caverns. The town is also home to a number of outdoor recreation activities, including fishing, hunting, and camping.
Demographics
As of the 2010 census, the town had a population of 1,072 people. The population is largely white (94.2%), with a small percentage of African Americans (3.2%) and Hispanics (2.6%). The median household income in the town is $35,000, and the median age is 44.
Conclusion
Blue Mountain is a small town located in the foothills of the Ozark Mountains in Arkansas. The town has a population of just over 1,000 people and is known for its rural charm and scenic beauty. The town is home to a variety of businesses, including a few restaurants, a grocery store, and a few small shops. The town is also home to a number of churches, including the First Baptist Church of Blue Mountain. The town’s economy is largely based on agriculture and tourism, and the town is home to a number of tourist attractions, including the Ozark National Forest, the Buffalo National River, and the Blanchard Springs Caverns. The town is also home to a number of outdoor recreation activities, including fishing, hunting, and camping.
Common Questions
What is Per Capita Income in Blue Mountain?
Per Capita income in Blue Mountain is $13,256.
What is Inequality or Gini Index in Blue Mountain?
Inequality or Gini Index in Blue Mountain is 0.47.
What is the Total Population of Blue Mountain?
Total Population of Blue Mountain is 153.
What is the Total Male Population of Blue Mountain?
Total Male Population of Blue Mountain is 74.
What is the Total Female Population of Blue Mountain?
Total Female Population of Blue Mountain is 79.
What is the Ratio of Males per 100 Females in Blue Mountain?
There are 93.67 Males per 100 Females in Blue Mountain.
What is the Ratio of Females per 100 Males in Blue Mountain?
There are 106.76 Females per 100 Males in Blue Mountain.
What is the Median Population Age in Blue Mountain?
Median Population Age in Blue Mountain is 24.6 Years.
What is the Average Family Size in Blue Mountain
Average Family Size in Blue Mountain is 4.8 People.
What is the Average Household Size in Blue Mountain
Average Household Size in Blue Mountain is 4.1 People.
How Large is the Labor Force in Blue Mountain?
There are 43 People in the Labor Forcein in Blue Mountain.
What is the Percentage of People in the Labor Force in Blue Mountain?
53.1% of People are in the Labor Force in Blue Mountain.
What is the Unemployment Rate in Blue Mountain?
Unemployment Rate in Blue Mountain is 7.0%.