Ben Lomond, AR Map & Demographics
Ben Lomond Map
Ben Lomond Overview
$13,810
PER CAPITA INCOME
$57,917
AVG FAMILY INCOME
$46,250
AVG HOUSEHOLD INCOME
0.29
INEQUALITY / GINI INDEX
218
TOTAL POPULATION
105
MALE POPULATION
113
FEMALE POPULATION
92.92
MALES / 100 FEMALES
107.62
FEMALES / 100 MALES
21.5
MEDIAN AGE
4.9
AVG FAMILY SIZE
4.1
AVG HOUSEHOLD SIZE
86
LABOR FORCE [ PEOPLE ]
52.8%
PERCENT IN LABOR FORCE
1.2%
UNEMPLOYMENT RATE
Ben Lomond Zip Codes
Ben Lomond Area Codes
Income in Ben Lomond
Income Overview in Ben Lomond
Per Capita Income in Ben Lomond is $13,810, while median incomes of families and households are $57,917 and $46,250 respectively.
| Characteristic | Number | Measure |
| Per Capita Income | 218 | $13,810 |
| Median Family Income | 41 | $57,917 |
| Mean Family Income | 41 | $55,483 |
| Median Household Income | 53 | $46,250 |
| Mean Household Income | 53 | $53,657 |
| Income Deficit | 41 | $0 |
| Wage / Income Gap (%) | 218 | 0.00% |
| Wage / Income Gap ($) | 218 | 100.00¢ per $1 |
| Gini / Inequality Index | 218 | 0.29 |
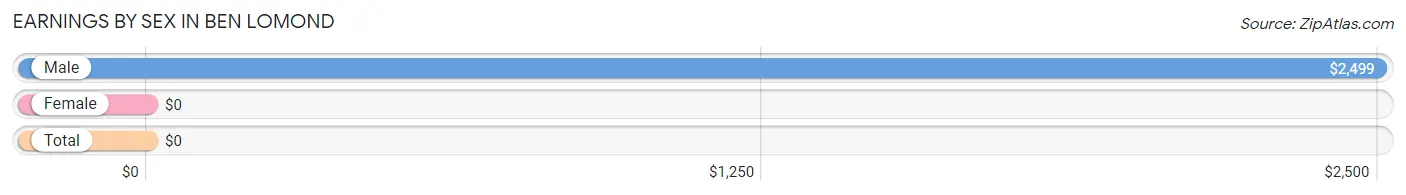
Earnings by Sex in Ben Lomond
| Sex | Number | Average Earnings |
| Male | 49 (55.7%) | $2,499 |
| Female | 39 (44.3%) | $0 |
| Total | 88 (100.0%) | $0 |
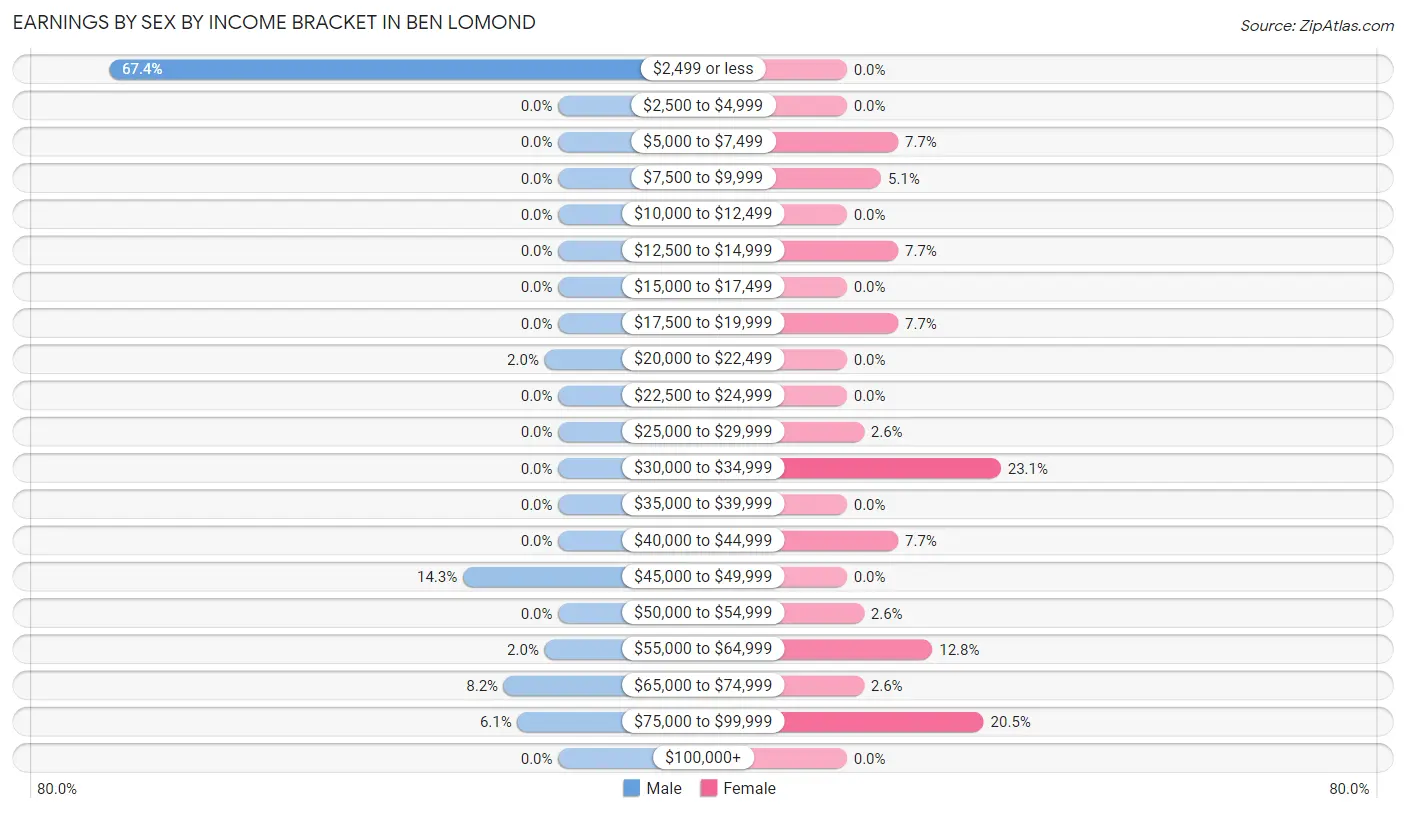
Earnings by Sex by Income Bracket in Ben Lomond
The most common earnings brackets in Ben Lomond are $2,499 or less for men (33 | 67.3%) and $30,000 to $34,999 for women (9 | 23.1%).
| Income | Male | Female |
| $2,499 or less | 33 (67.3%) | 0 (0.0%) |
| $2,500 to $4,999 | 0 (0.0%) | 0 (0.0%) |
| $5,000 to $7,499 | 0 (0.0%) | 3 (7.7%) |
| $7,500 to $9,999 | 0 (0.0%) | 2 (5.1%) |
| $10,000 to $12,499 | 0 (0.0%) | 0 (0.0%) |
| $12,500 to $14,999 | 0 (0.0%) | 3 (7.7%) |
| $15,000 to $17,499 | 0 (0.0%) | 0 (0.0%) |
| $17,500 to $19,999 | 0 (0.0%) | 3 (7.7%) |
| $20,000 to $22,499 | 1 (2.0%) | 0 (0.0%) |
| $22,500 to $24,999 | 0 (0.0%) | 0 (0.0%) |
| $25,000 to $29,999 | 0 (0.0%) | 1 (2.6%) |
| $30,000 to $34,999 | 0 (0.0%) | 9 (23.1%) |
| $35,000 to $39,999 | 0 (0.0%) | 0 (0.0%) |
| $40,000 to $44,999 | 0 (0.0%) | 3 (7.7%) |
| $45,000 to $49,999 | 7 (14.3%) | 0 (0.0%) |
| $50,000 to $54,999 | 0 (0.0%) | 1 (2.6%) |
| $55,000 to $64,999 | 1 (2.0%) | 5 (12.8%) |
| $65,000 to $74,999 | 4 (8.2%) | 1 (2.6%) |
| $75,000 to $99,999 | 3 (6.1%) | 8 (20.5%) |
| $100,000+ | 0 (0.0%) | 0 (0.0%) |
| Total | 49 (100.0%) | 39 (100.0%) |
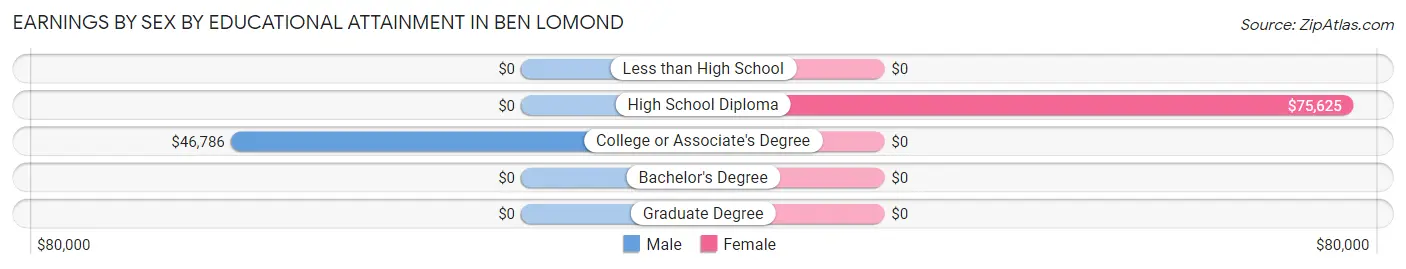
Earnings by Sex by Educational Attainment in Ben Lomond
| Educational Attainment | Male Income | Female Income |
| Less than High School | - | - |
| High School Diploma | - | - |
| College or Associate's Degree | $46,786 | $0 |
| Bachelor's Degree | - | - |
| Graduate Degree | - | - |
| Total | $53,750 | $0 |
Family Income in Ben Lomond
Family Income Brackets in Ben Lomond
According to the Ben Lomond family income data, there are 9 families falling into the $25,000 to $34,999 income range, which is the most common income bracket and makes up 22.0% of all families.
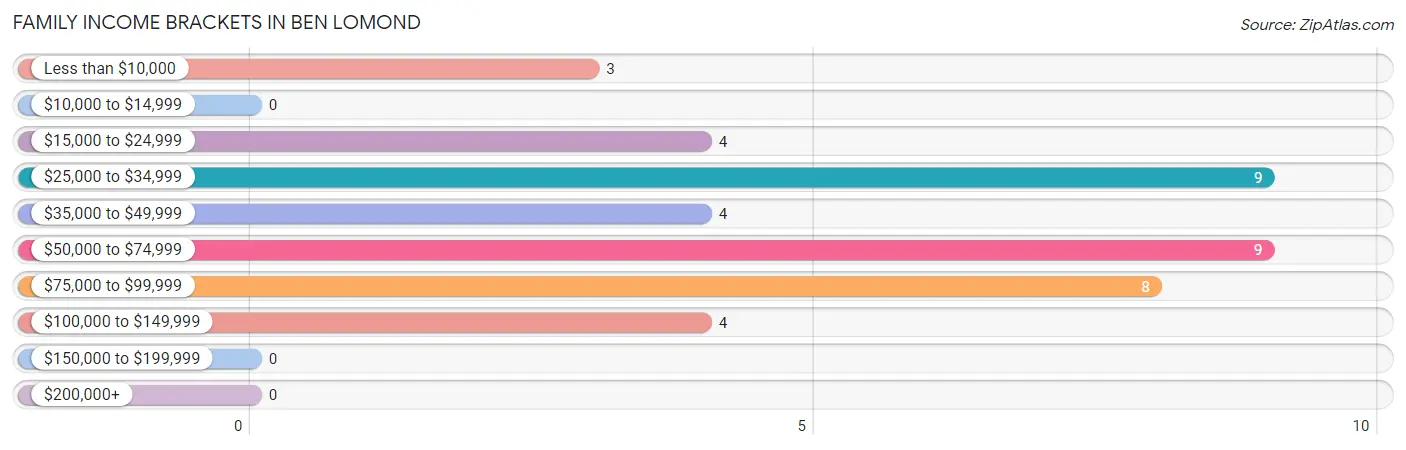
| Income Bracket | # Families | % Families |
| Less than $10,000 | 3 | 7.3% |
| $10,000 to $14,999 | 0 | 0.0% |
| $15,000 to $24,999 | 4 | 9.8% |
| $25,000 to $34,999 | 9 | 22.0% |
| $35,000 to $49,999 | 4 | 9.8% |
| $50,000 to $74,999 | 9 | 22.0% |
| $75,000 to $99,999 | 8 | 19.5% |
| $100,000 to $149,999 | 4 | 9.8% |
| $150,000 to $199,999 | 0 | 0.0% |
| $200,000+ | 0 | 0.0% |
Family Income by Famaliy Size in Ben Lomond
3-person families (14 | 34.2%) account for the highest median family income in Ben Lomond with $75,625 per family, while 3-person families (14 | 34.2%) have the highest median income of $25,208 per family member.
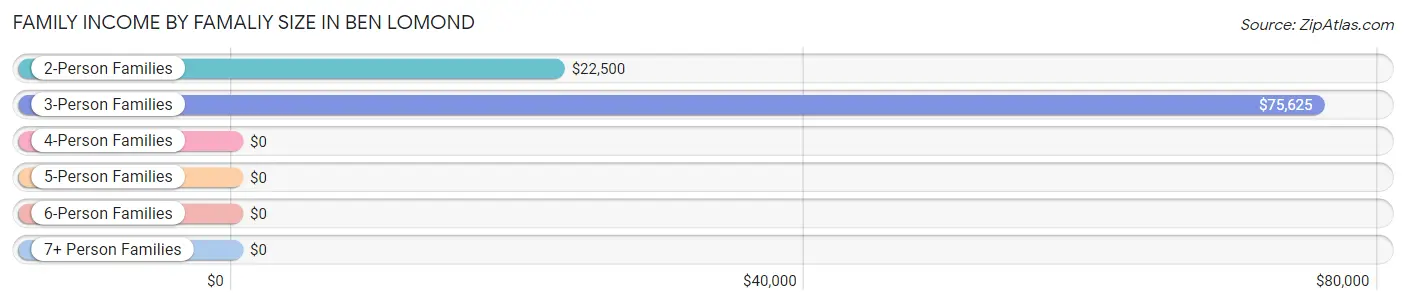
| Income Bracket | # Families | Median Income |
| 2-Person Families | 6 (14.6%) | $22,500 |
| 3-Person Families | 14 (34.2%) | $75,625 |
| 4-Person Families | 14 (34.2%) | $0 |
| 5-Person Families | 3 (7.3%) | $0 |
| 6-Person Families | 0 (0.0%) | $0 |
| 7+ Person Families | 4 (9.8%) | $0 |
| Total | 41 (100.0%) | $57,917 |
Family Income by Number of Earners in Ben Lomond
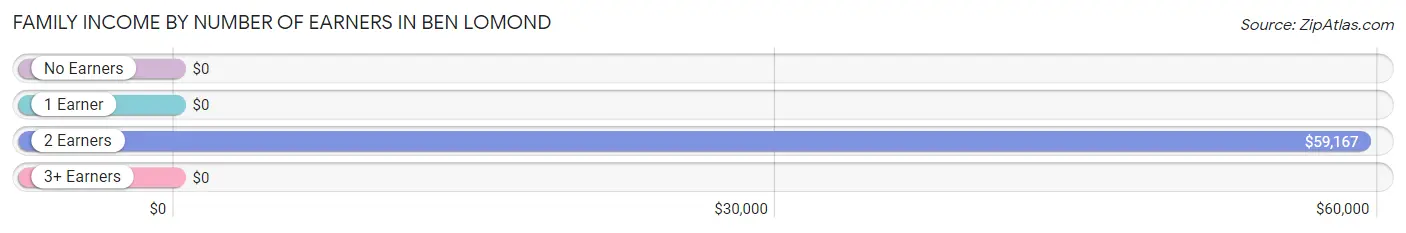
| Number of Earners | # Families | Median Income |
| No Earners | 7 (17.1%) | $0 |
| 1 Earner | 24 (58.5%) | $0 |
| 2 Earners | 10 (24.4%) | $59,167 |
| 3+ Earners | 0 (0.0%) | $0 |
| Total | 41 (100.0%) | $57,917 |
Household Income in Ben Lomond
Household Income Brackets in Ben Lomond
With 15 households falling in the category, the $25,000 to $34,999 income range is the most frequent in Ben Lomond, accounting for 28.3% of all households.
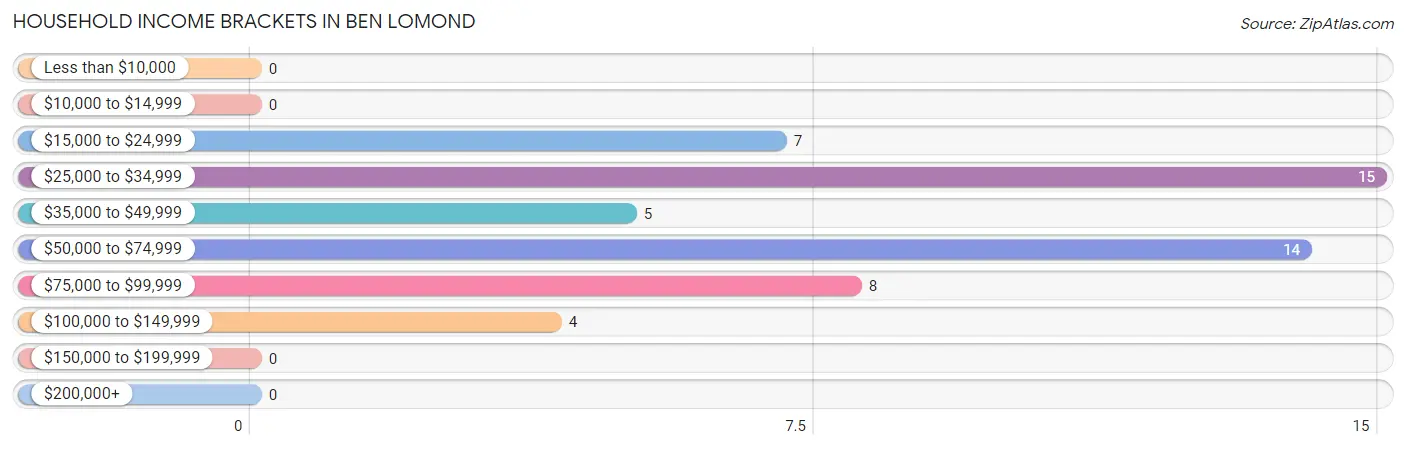
| Income Bracket | # Households | % Households |
| Less than $10,000 | 0 | 0.0% |
| $10,000 to $14,999 | 0 | 0.0% |
| $15,000 to $24,999 | 7 | 13.2% |
| $25,000 to $34,999 | 15 | 28.3% |
| $35,000 to $49,999 | 5 | 9.4% |
| $50,000 to $74,999 | 14 | 26.4% |
| $75,000 to $99,999 | 8 | 15.1% |
| $100,000 to $149,999 | 4 | 7.5% |
| $150,000 to $199,999 | 0 | 0.0% |
| $200,000+ | 0 | 0.0% |
Household Income by Householder Age in Ben Lomond
The median household income in Ben Lomond is $46,250, with the highest median household income of $75,781 found in the 45 to 64 years age bracket for the primary householder. A total of 13 households (24.5%) fall into this category.
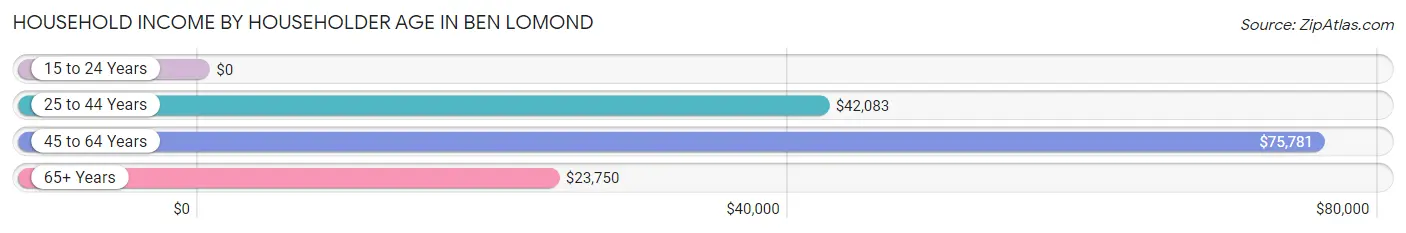
| Income Bracket | # Households | Median Income |
| 15 to 24 Years | 0 (0.0%) | $0 |
| 25 to 44 Years | 29 (54.7%) | $42,083 |
| 45 to 64 Years | 13 (24.5%) | $75,781 |
| 65+ Years | 11 (20.7%) | $23,750 |
| Total | 53 (100.0%) | $46,250 |
Poverty in Ben Lomond
Income Below Poverty by Sex and Age in Ben Lomond
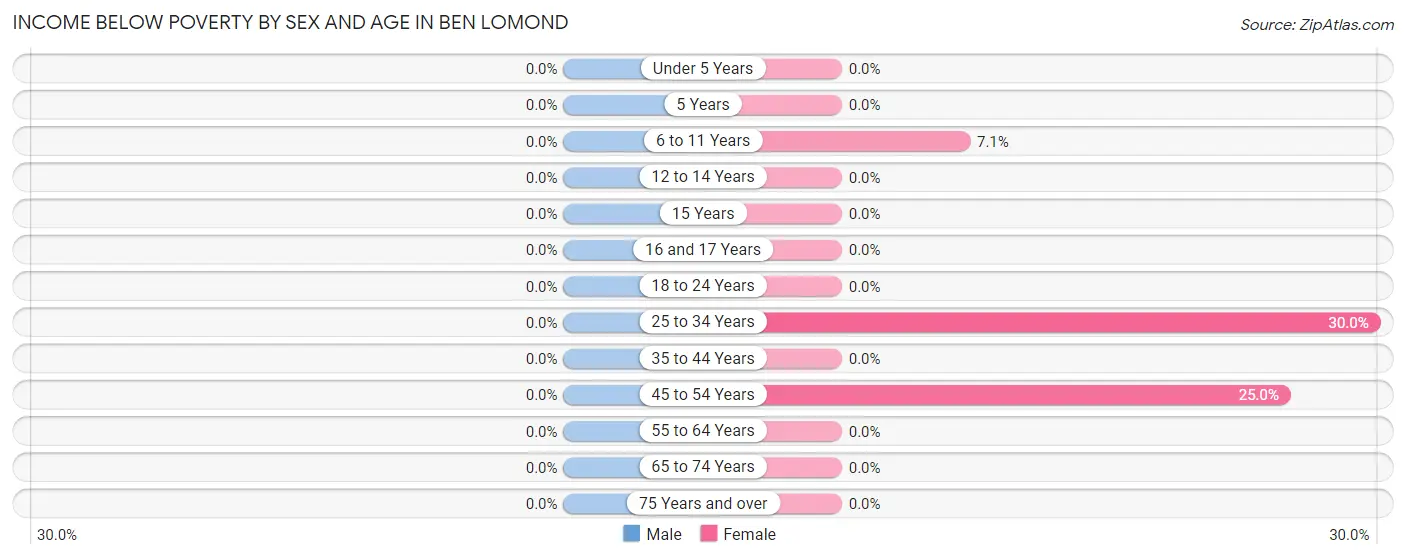
| Age Bracket | Male | Female |
| Under 5 Years | 0 (0.0%) | 0 (0.0%) |
| 5 Years | 0 (0.0%) | 0 (0.0%) |
| 6 to 11 Years | 0 (0.0%) | 1 (7.1%) |
| 12 to 14 Years | 0 (0.0%) | 0 (0.0%) |
| 15 Years | 0 (0.0%) | 0 (0.0%) |
| 16 and 17 Years | 0 (0.0%) | 0 (0.0%) |
| 18 to 24 Years | 0 (0.0%) | 0 (0.0%) |
| 25 to 34 Years | 0 (0.0%) | 3 (30.0%) |
| 35 to 44 Years | 0 (0.0%) | 0 (0.0%) |
| 45 to 54 Years | 0 (0.0%) | 1 (25.0%) |
| 55 to 64 Years | 0 (0.0%) | 0 (0.0%) |
| 65 to 74 Years | 0 (0.0%) | 0 (0.0%) |
| 75 Years and over | 0 (0.0%) | 0 (0.0%) |
| Total | 0 (0.0%) | 5 (4.5%) |
Income Above Poverty by Sex and Age in Ben Lomond
According to the poverty statistics in Ben Lomond, males aged 5 years and females aged under 5 years are the age groups that are most secure financially, with 100.0% of males and 100.0% of females in these age groups living above the poverty line.
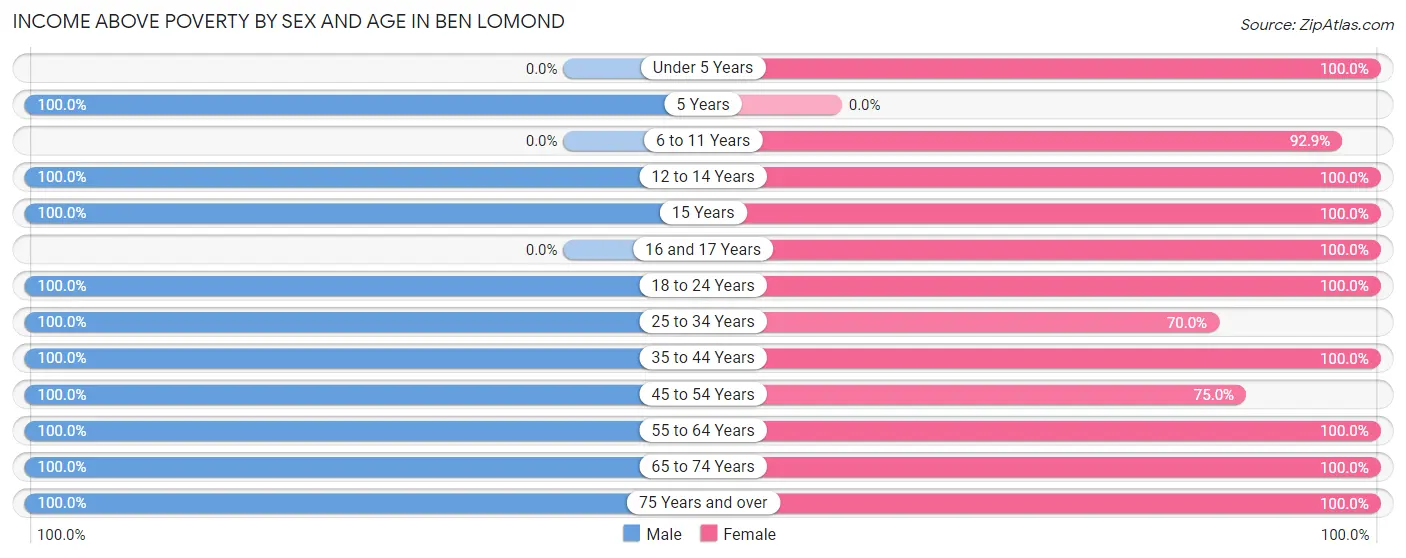
| Age Bracket | Male | Female |
| Under 5 Years | 0 (0.0%) | 19 (100.0%) |
| 5 Years | 8 (100.0%) | 0 (0.0%) |
| 6 to 11 Years | 0 (0.0%) | 13 (92.9%) |
| 12 to 14 Years | 2 (100.0%) | 5 (100.0%) |
| 15 Years | 2 (100.0%) | 2 (100.0%) |
| 16 and 17 Years | 0 (0.0%) | 7 (100.0%) |
| 18 to 24 Years | 69 (100.0%) | 7 (100.0%) |
| 25 to 34 Years | 7 (100.0%) | 7 (70.0%) |
| 35 to 44 Years | 7 (100.0%) | 22 (100.0%) |
| 45 to 54 Years | 2 (100.0%) | 3 (75.0%) |
| 55 to 64 Years | 2 (100.0%) | 11 (100.0%) |
| 65 to 74 Years | 1 (100.0%) | 7 (100.0%) |
| 75 Years and over | 4 (100.0%) | 3 (100.0%) |
| Total | 104 (100.0%) | 106 (95.5%) |
Income Below Poverty Among Married-Couple Families in Ben Lomond
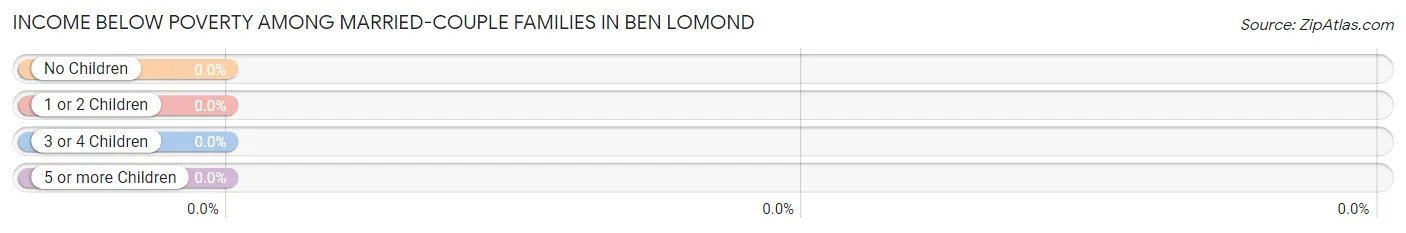
| Children | Above Poverty | Below Poverty |
| No Children | 4 (100.0%) | 0 (0.0%) |
| 1 or 2 Children | 11 (100.0%) | 0 (0.0%) |
| 3 or 4 Children | 4 (100.0%) | 0 (0.0%) |
| 5 or more Children | 0 (0.0%) | 0 (0.0%) |
| Total | 19 (100.0%) | 0 (0.0%) |
Income Below Poverty Among Single-Parent Households in Ben Lomond
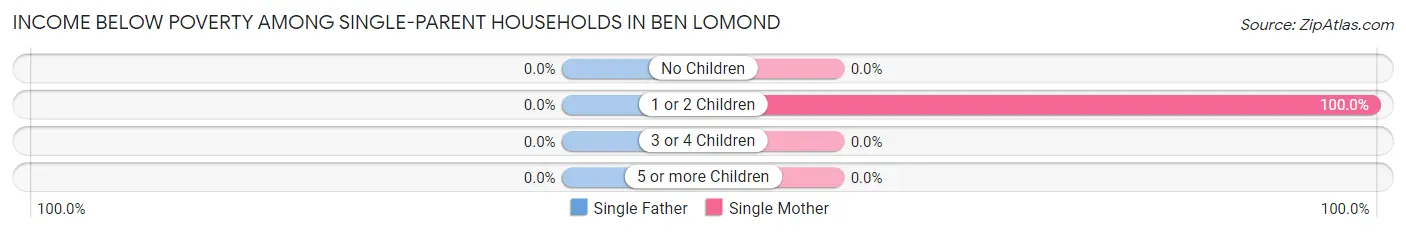
| Children | Single Father | Single Mother |
| No Children | 0 (0.0%) | 0 (0.0%) |
| 1 or 2 Children | 0 (0.0%) | 3 (100.0%) |
| 3 or 4 Children | 0 (0.0%) | 0 (0.0%) |
| 5 or more Children | 0 (0.0%) | 0 (0.0%) |
| Total | 0 (0.0%) | 3 (13.6%) |
Income Below Poverty Among Married-Couple vs Single-Parent Households in Ben Lomond
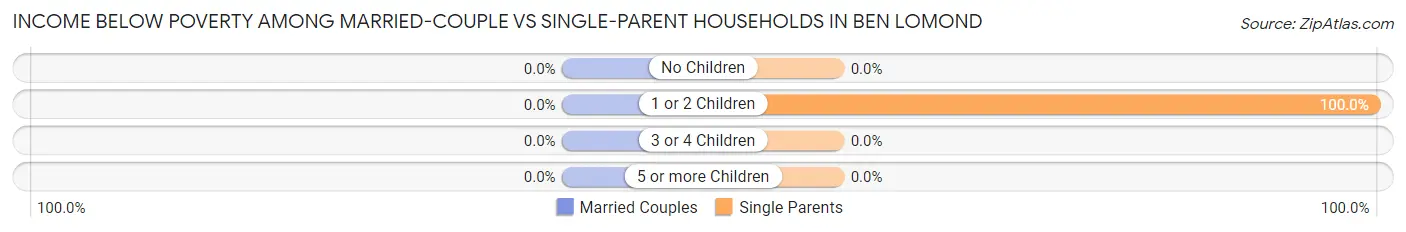
| Children | Married-Couple Families | Single-Parent Households |
| No Children | 0 (0.0%) | 0 (0.0%) |
| 1 or 2 Children | 0 (0.0%) | 3 (100.0%) |
| 3 or 4 Children | 0 (0.0%) | 0 (0.0%) |
| 5 or more Children | 0 (0.0%) | 0 (0.0%) |
| Total | 0 (0.0%) | 3 (13.6%) |
Race in Ben Lomond
The most populous races in Ben Lomond are White / Caucasian (186 | 85.3%), Hispanic or Latino (43 | 19.7%), and Native / Alaskan (25 | 11.5%).
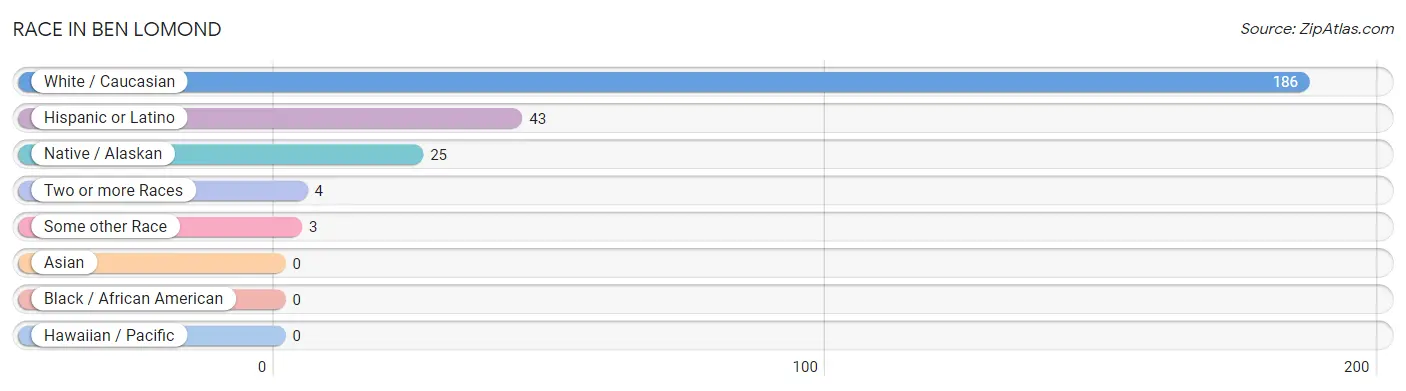
| Race | # Population | % Population |
| Asian | 0 | 0.0% |
| Black / African American | 0 | 0.0% |
| Hawaiian / Pacific | 0 | 0.0% |
| Hispanic or Latino | 43 | 19.7% |
| Native / Alaskan | 25 | 11.5% |
| White / Caucasian | 186 | 85.3% |
| Two or more Races | 4 | 1.8% |
| Some other Race | 3 | 1.4% |
| Total | 218 | 100.0% |
Ancestry in Ben Lomond
The most populous ancestries reported in Ben Lomond are Choctaw (25 | 11.5%), Irish (12 | 5.5%), Italian (9 | 4.1%), German (8 | 3.7%), and American (6 | 2.8%), together accounting for 27.5% of all Ben Lomond residents.
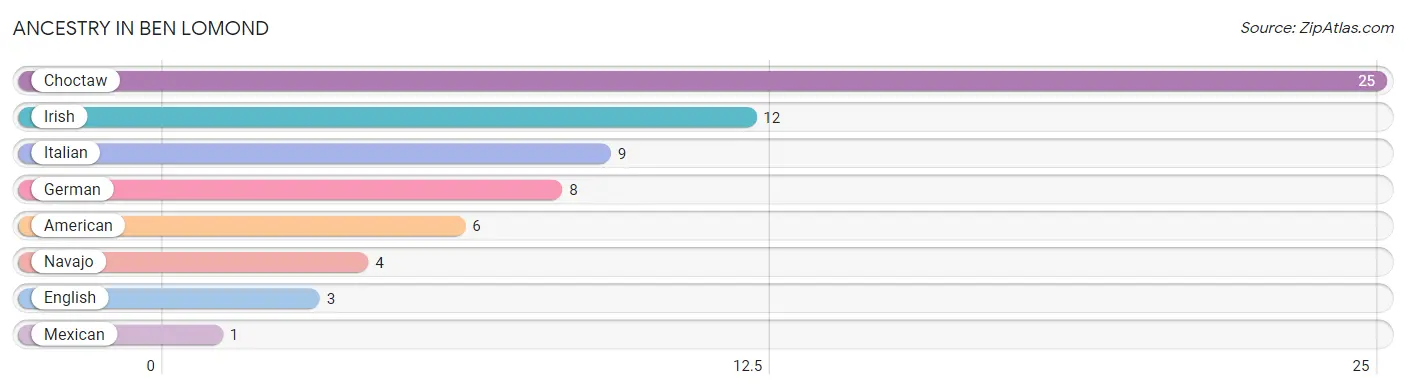
| Ancestry | # Population | % Population |
| American | 6 | 2.8% |
| Choctaw | 25 | 11.5% |
| English | 3 | 1.4% |
| German | 8 | 3.7% |
| Irish | 12 | 5.5% |
| Italian | 9 | 4.1% |
| Mexican | 1 | 0.5% |
| Navajo | 4 | 1.8% | View All 8 Rows |
Immigrants in Ben Lomond

| Immigration Origin | # Population | % Population | View All 0 Rows |
Sex and Age in Ben Lomond
Sex and Age in Ben Lomond
The most populous age groups in Ben Lomond are 20 to 24 Years (44 | 41.9%) for men and Under 5 Years (19 | 16.8%) for women.
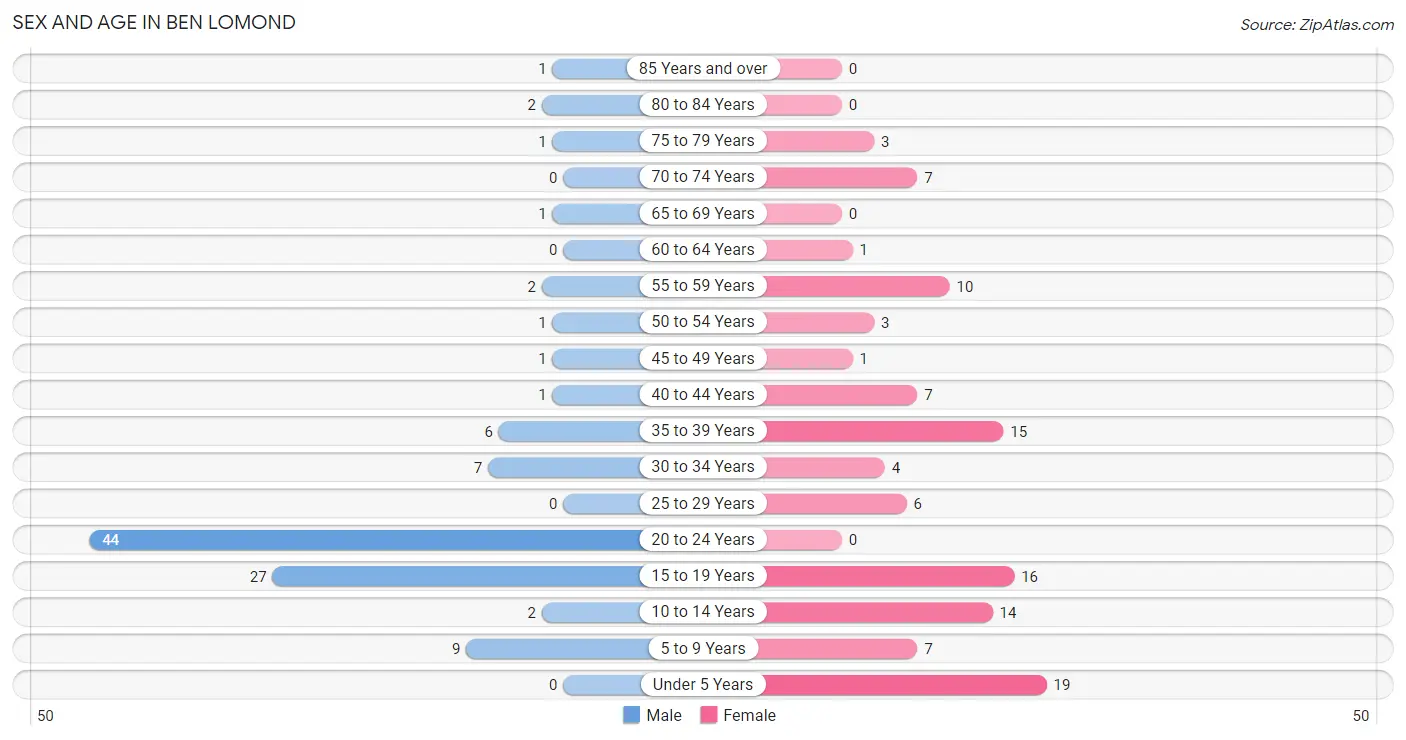
| Age Bracket | Male | Female |
| Under 5 Years | 0 (0.0%) | 19 (16.8%) |
| 5 to 9 Years | 9 (8.6%) | 7 (6.2%) |
| 10 to 14 Years | 2 (1.9%) | 14 (12.4%) |
| 15 to 19 Years | 27 (25.7%) | 16 (14.2%) |
| 20 to 24 Years | 44 (41.9%) | 0 (0.0%) |
| 25 to 29 Years | 0 (0.0%) | 6 (5.3%) |
| 30 to 34 Years | 7 (6.7%) | 4 (3.5%) |
| 35 to 39 Years | 6 (5.7%) | 15 (13.3%) |
| 40 to 44 Years | 1 (0.9%) | 7 (6.2%) |
| 45 to 49 Years | 1 (0.9%) | 1 (0.9%) |
| 50 to 54 Years | 1 (0.9%) | 3 (2.6%) |
| 55 to 59 Years | 2 (1.9%) | 10 (8.8%) |
| 60 to 64 Years | 0 (0.0%) | 1 (0.9%) |
| 65 to 69 Years | 1 (0.9%) | 0 (0.0%) |
| 70 to 74 Years | 0 (0.0%) | 7 (6.2%) |
| 75 to 79 Years | 1 (0.9%) | 3 (2.6%) |
| 80 to 84 Years | 2 (1.9%) | 0 (0.0%) |
| 85 Years and over | 1 (0.9%) | 0 (0.0%) |
| Total | 105 (100.0%) | 113 (100.0%) |
Families and Households in Ben Lomond
Median Family Size in Ben Lomond
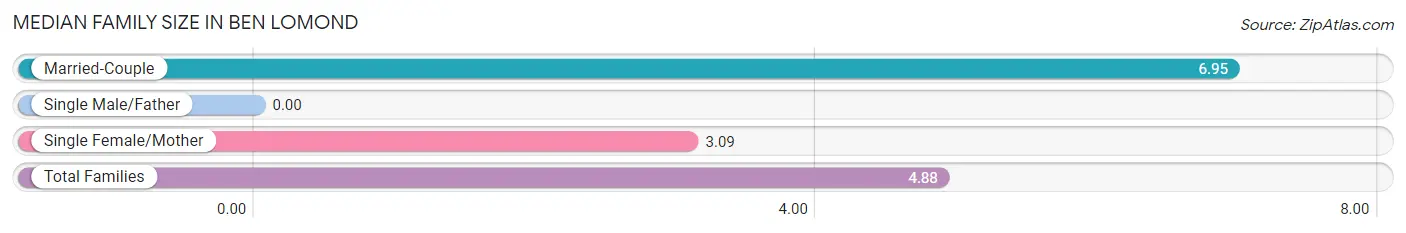
| Family Type | # Families | Family Size |
| Married-Couple | 19 (46.3%) | 6.95 |
| Single Male/Father | 0 (0.0%) | - |
| Single Female/Mother | 22 (53.7%) | 3.09 |
| Total Families | 41 (100.0%) | 4.88 |
Median Household Size in Ben Lomond
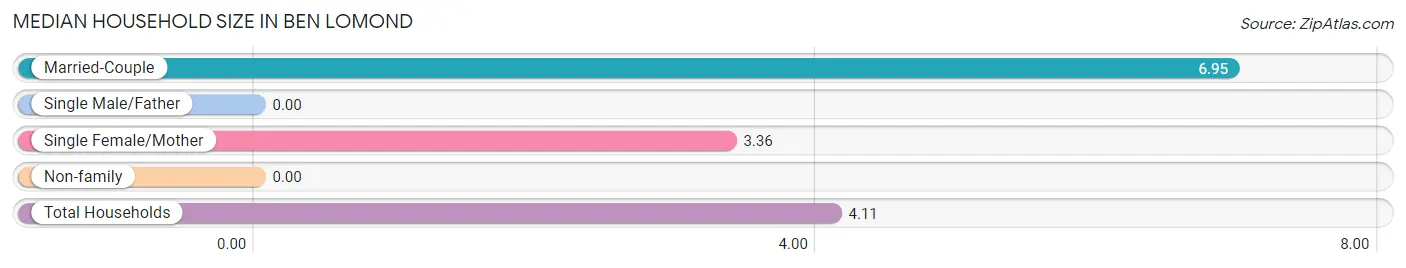
| Household Type | # Households | Household Size |
| Married-Couple | 19 (35.8%) | 6.95 |
| Single Male/Father | 0 (0.0%) | - |
| Single Female/Mother | 22 (41.5%) | 3.36 |
| Non-family | 12 (22.6%) | - |
| Total Households | 53 (100.0%) | 4.11 |
Household Size by Marriage Status in Ben Lomond
Out of a total of 53 households in Ben Lomond, 41 (77.4%) are family households, while 12 (22.6%) are nonfamily households. The most numerous type of family households are 4-person households, comprising 14, and the most common type of nonfamily households are 1-person households, comprising 12.
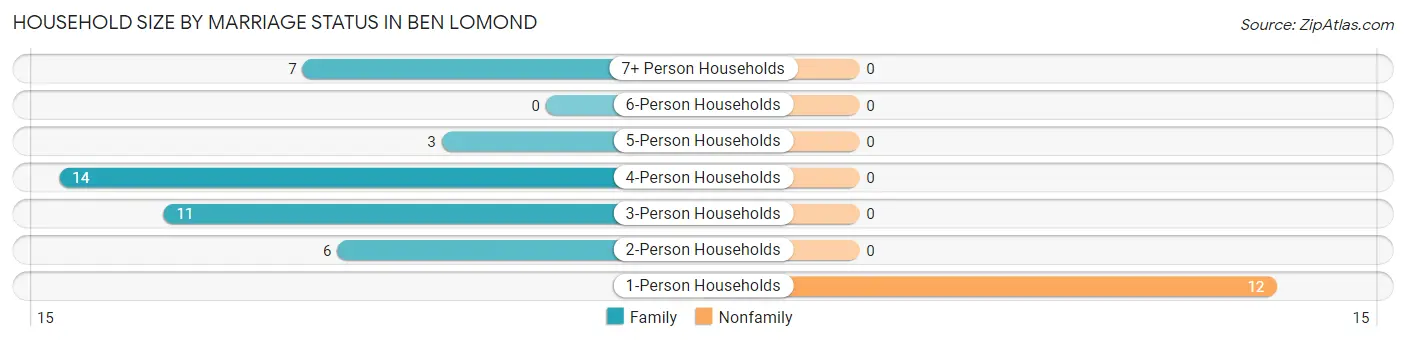
| Household Size | Family Households | Nonfamily Households |
| 1-Person Households | - | 12 (22.6%) |
| 2-Person Households | 6 (11.3%) | 0 (0.0%) |
| 3-Person Households | 11 (20.7%) | 0 (0.0%) |
| 4-Person Households | 14 (26.4%) | 0 (0.0%) |
| 5-Person Households | 3 (5.7%) | 0 (0.0%) |
| 6-Person Households | 0 (0.0%) | 0 (0.0%) |
| 7+ Person Households | 7 (13.2%) | 0 (0.0%) |
| Total | 41 (77.4%) | 12 (22.6%) |
Female Fertility in Ben Lomond
Fertility by Age in Ben Lomond
Average fertility rate in Ben Lomond is 20.0 births per 1,000 women. Women in the age bracket of 20 to 34 years have the highest fertility rate with 100.0 births per 1,000 women. Women in the age bracket of 20 to 34 years acount for 100.0% of all women with births.
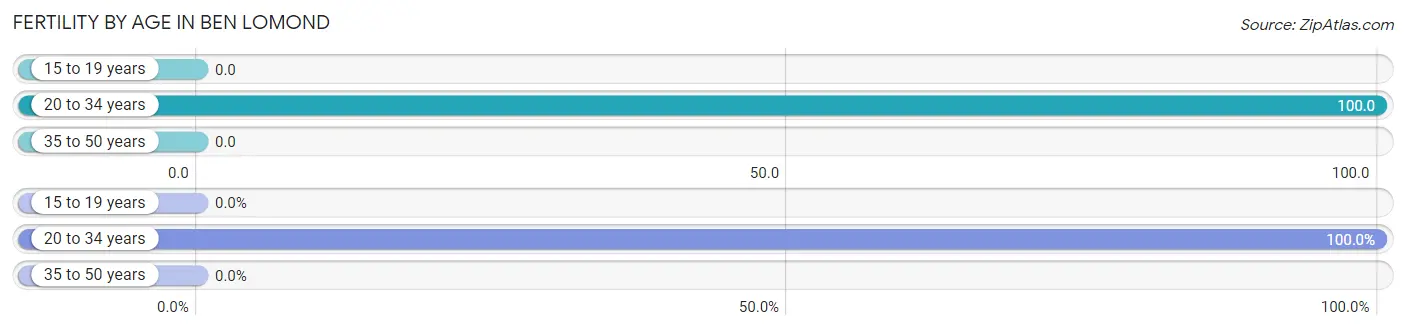
| Age Bracket | Women with Births | Births / 1,000 Women |
| 15 to 19 years | 0 (0.0%) | 0.0 |
| 20 to 34 years | 1 (100.0%) | 100.0 |
| 35 to 50 years | 0 (0.0%) | 0.0 |
| Total | 1 (100.0%) | 20.0 |
Fertility by Age by Marriage Status in Ben Lomond
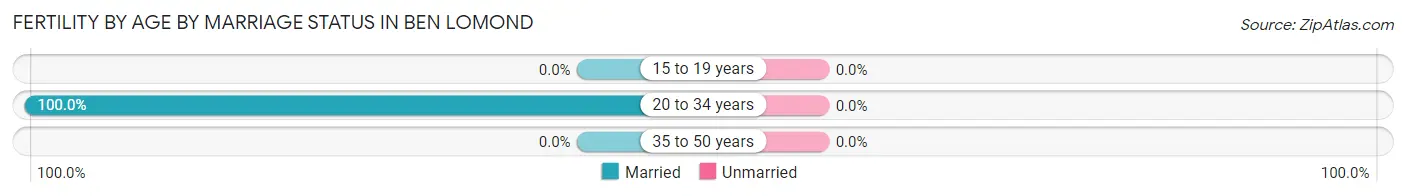
| Age Bracket | Married | Unmarried |
| 15 to 19 years | 0 (0.0%) | 0 (0.0%) |
| 20 to 34 years | 1 (100.0%) | 0 (0.0%) |
| 35 to 50 years | 0 (0.0%) | 0 (0.0%) |
| Total | 1 (100.0%) | 0 (0.0%) |
Fertility by Education in Ben Lomond
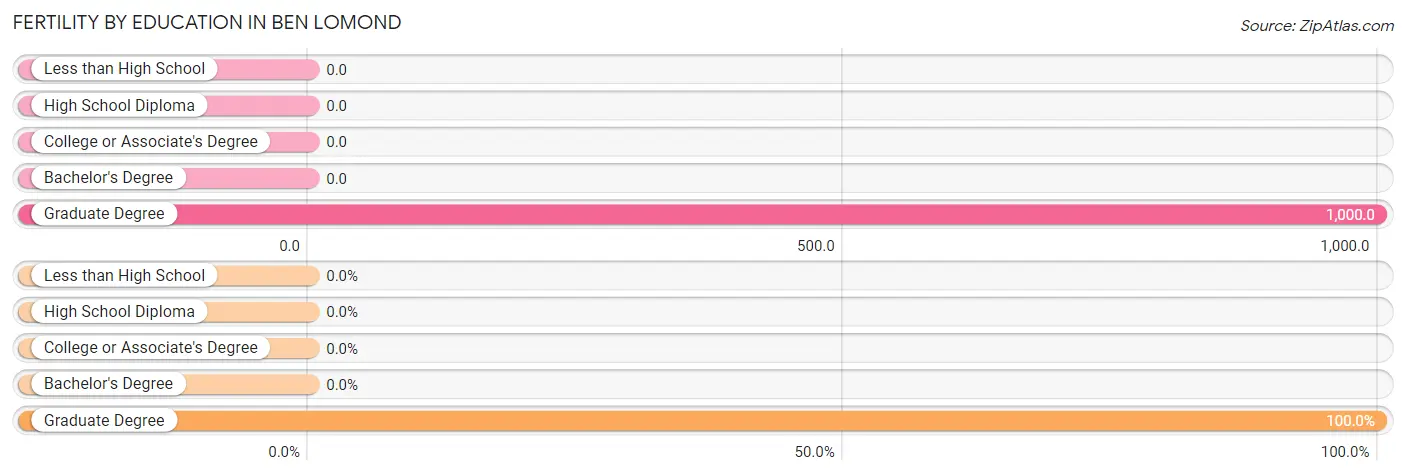
| Educational Attainment | Women with Births | Births / 1,000 Women |
| Less than High School | 0 (0.0%) | 0.0 |
| High School Diploma | 0 (0.0%) | 0.0 |
| College or Associate's Degree | 0 (0.0%) | 0.0 |
| Bachelor's Degree | 0 (0.0%) | 0.0 |
| Graduate Degree | 1 (100.0%) | 1,000.0 |
| Total | 1 (100.0%) | 20.0 |
Fertility by Education by Marriage Status in Ben Lomond
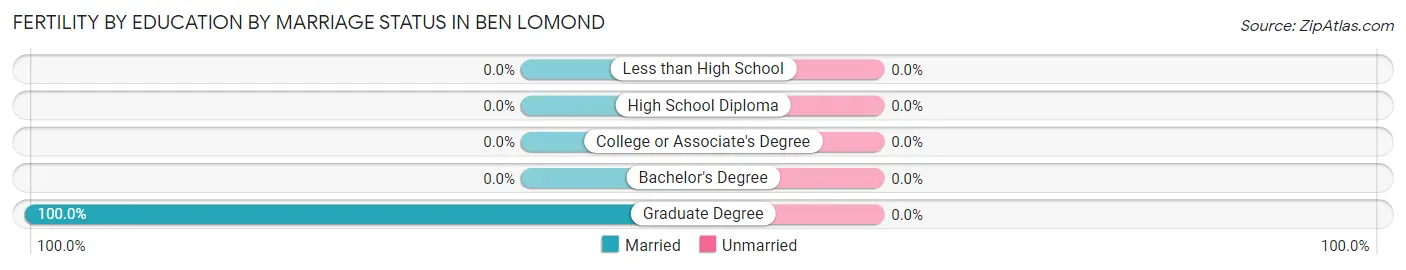
| Educational Attainment | Married | Unmarried |
| Less than High School | 0 (0.0%) | 0 (0.0%) |
| High School Diploma | 0 (0.0%) | 0 (0.0%) |
| College or Associate's Degree | 0 (0.0%) | 0 (0.0%) |
| Bachelor's Degree | 0 (0.0%) | 0 (0.0%) |
| Graduate Degree | 1 (100.0%) | 0 (0.0%) |
| Total | 1 (100.0%) | 0 (0.0%) |
Employment Characteristics in Ben Lomond
Employment by Class of Employer in Ben Lomond
Among the 78 employed individuals in Ben Lomond, private company employees (66 | 84.6%), state government employees (9 | 11.5%), and not-for-profit organizations (2 | 2.6%) make up the most common classes of employment.
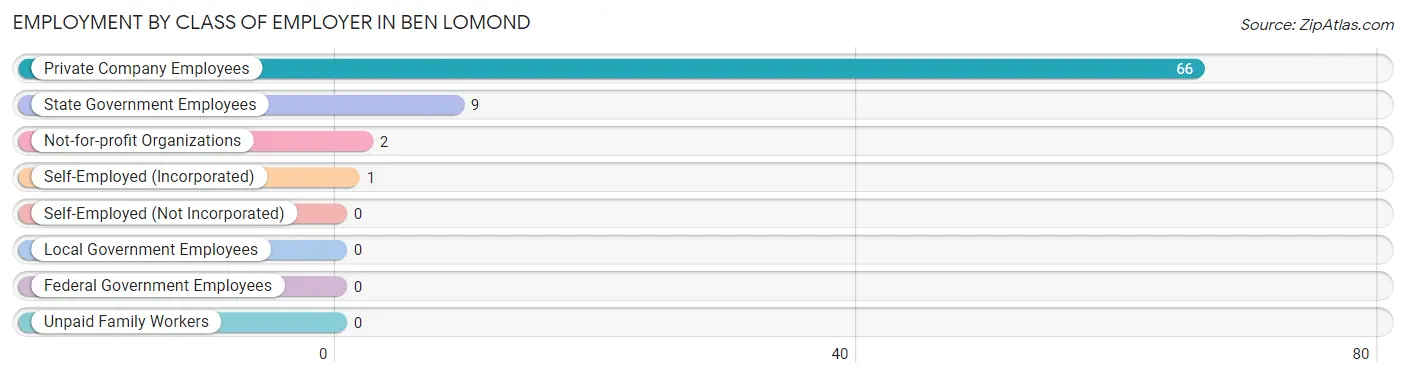
| Employer Class | # Employees | % Employees |
| Private Company Employees | 66 | 84.6% |
| Self-Employed (Incorporated) | 1 | 1.3% |
| Self-Employed (Not Incorporated) | 0 | 0.0% |
| Not-for-profit Organizations | 2 | 2.6% |
| Local Government Employees | 0 | 0.0% |
| State Government Employees | 9 | 11.5% |
| Federal Government Employees | 0 | 0.0% |
| Unpaid Family Workers | 0 | 0.0% |
| Total | 78 | 100.0% |
Employment Status by Age in Ben Lomond
According to the labor force statistics for Ben Lomond, out of the total population over 16 years of age (163), 52.8% or 86 individuals are in the labor force, with 1.2% or 1 of them unemployed. The age group with the highest labor force participation rate is 30 to 34 years, with 100.0% or 11 individuals in the labor force. Within the labor force, the 45 to 54 years age range has the highest percentage of unemployed individuals, with 33.3% or 1 of them being unemployed.
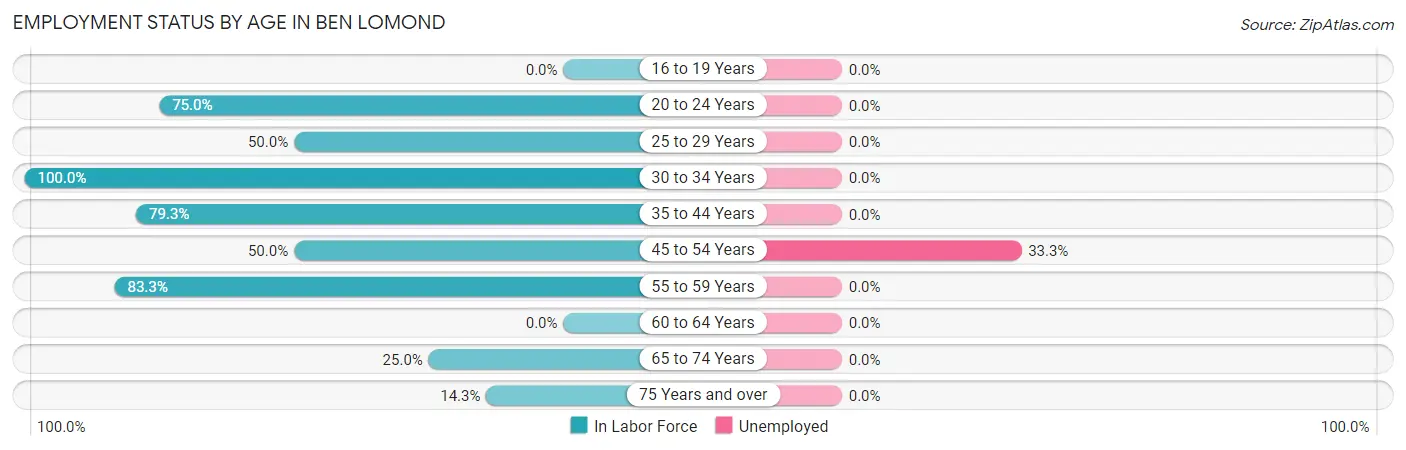
| Age Bracket | In Labor Force | Unemployed |
| 16 to 19 Years | 0 (0.0%) | 0 (0.0%) |
| 20 to 24 Years | 33 (75.0%) | 0 (0.0%) |
| 25 to 29 Years | 3 (50.0%) | 0 (0.0%) |
| 30 to 34 Years | 11 (100.0%) | 0 (0.0%) |
| 35 to 44 Years | 23 (79.3%) | 0 (0.0%) |
| 45 to 54 Years | 3 (50.0%) | 1 (33.3%) |
| 55 to 59 Years | 10 (83.3%) | 0 (0.0%) |
| 60 to 64 Years | 0 (0.0%) | 0 (0.0%) |
| 65 to 74 Years | 2 (25.0%) | 0 (0.0%) |
| 75 Years and over | 1 (14.3%) | 0 (0.0%) |
| Total | 86 (52.8%) | 1 (1.2%) |
Employment Status by Educational Attainment in Ben Lomond
According to labor force statistics for Ben Lomond, 76.9% of individuals (50) out of the total population between 25 and 64 years of age (65) are in the labor force, with 2.0% or 1 of them being unemployed. The group with the highest labor force participation rate are those with the educational attainment of bachelor's degree or higher, with 86.7% or 13 individuals in the labor force. Within the labor force, individuals with less than high school education have the highest percentage of unemployment, with 25.0% or 1 of them being unemployed.
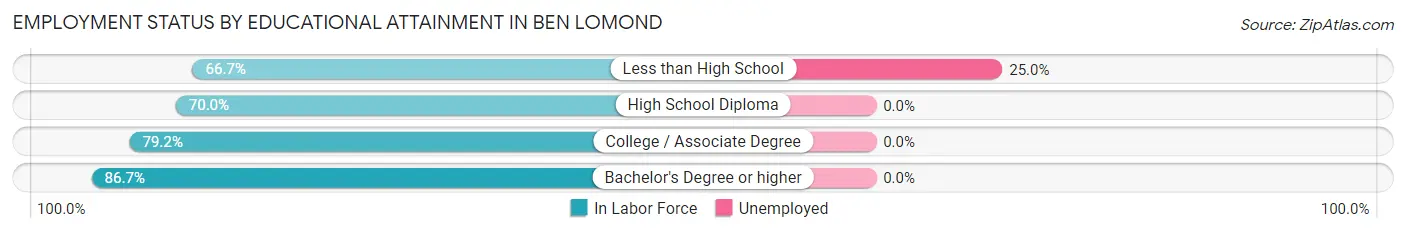
| Educational Attainment | In Labor Force | Unemployed |
| Less than High School | 4 (66.7%) | 2 (25.0%) |
| High School Diploma | 14 (70.0%) | 0 (0.0%) |
| College / Associate Degree | 19 (79.2%) | 0 (0.0%) |
| Bachelor's Degree or higher | 13 (86.7%) | 0 (0.0%) |
| Total | 50 (76.9%) | 1 (2.0%) |
Employment Occupations by Sex in Ben Lomond
Management, Business, Science and Arts Occupations
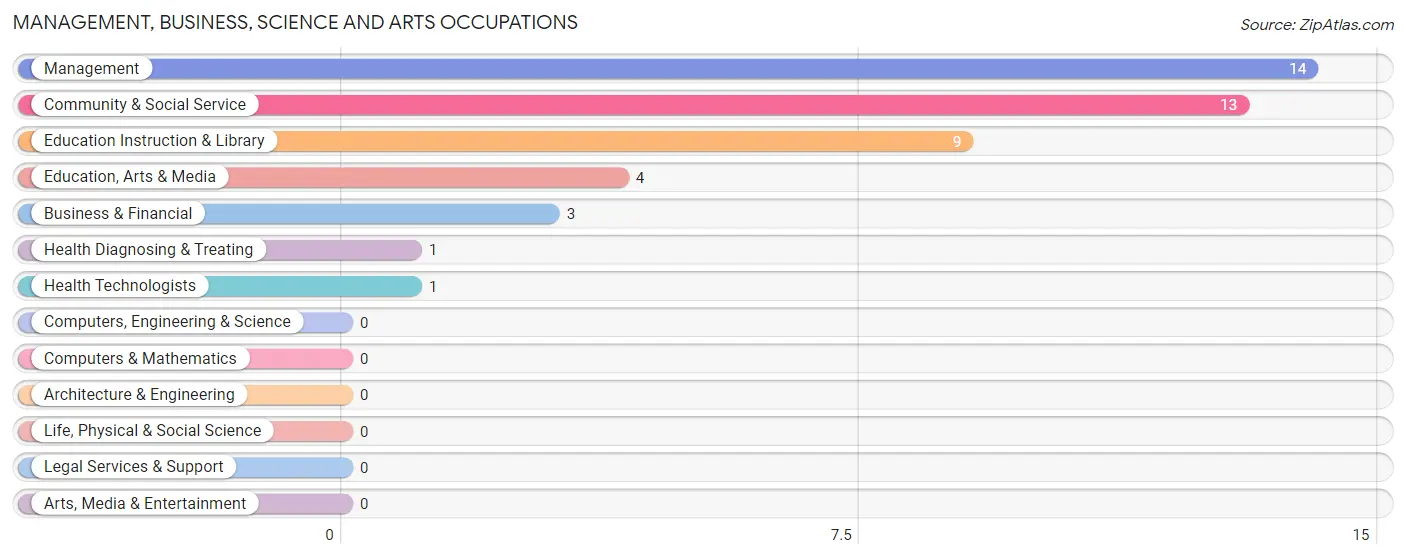
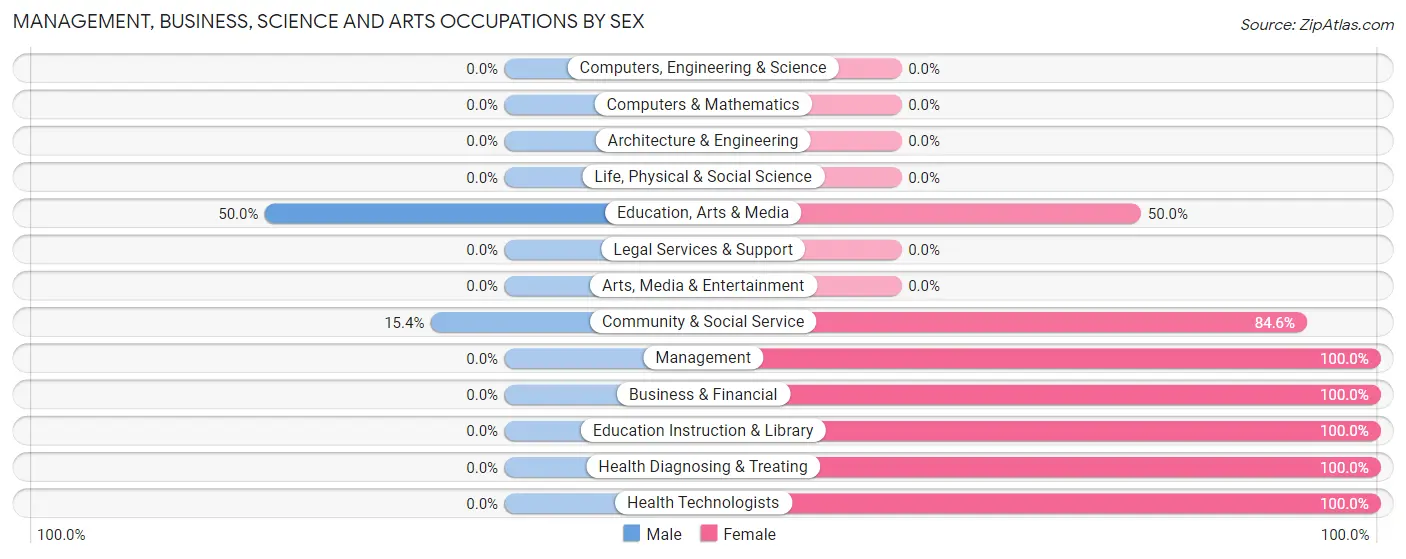
The most common Management, Business, Science and Arts occupations in Ben Lomond are Management (14 | 16.5%), Community & Social Service (13 | 15.3%), Education Instruction & Library (9 | 10.6%), Education, Arts & Media (4 | 4.7%), and Business & Financial (3 | 3.5%).
Management, Business, Science and Arts Occupations by Sex
Within the Management, Business, Science and Arts occupations in Ben Lomond, the most male-oriented occupations are Education, Arts & Media (50.0%), and Community & Social Service (15.4%), while the most female-oriented occupations are Management (100.0%), Business & Financial (100.0%), and Education Instruction & Library (100.0%).
| Occupation | Male | Female |
| Management | 0 (0.0%) | 14 (100.0%) |
| Business & Financial | 0 (0.0%) | 3 (100.0%) |
| Computers, Engineering & Science | 0 (0.0%) | 0 (0.0%) |
| Computers & Mathematics | 0 (0.0%) | 0 (0.0%) |
| Architecture & Engineering | 0 (0.0%) | 0 (0.0%) |
| Life, Physical & Social Science | 0 (0.0%) | 0 (0.0%) |
| Community & Social Service | 2 (15.4%) | 11 (84.6%) |
| Education, Arts & Media | 2 (50.0%) | 2 (50.0%) |
| Legal Services & Support | 0 (0.0%) | 0 (0.0%) |
| Education Instruction & Library | 0 (0.0%) | 9 (100.0%) |
| Arts, Media & Entertainment | 0 (0.0%) | 0 (0.0%) |
| Health Diagnosing & Treating | 0 (0.0%) | 1 (100.0%) |
| Health Technologists | 0 (0.0%) | 1 (100.0%) |
| Total (Category) | 2 (6.5%) | 29 (93.5%) |
| Total (Overall) | 49 (57.7%) | 36 (42.3%) |
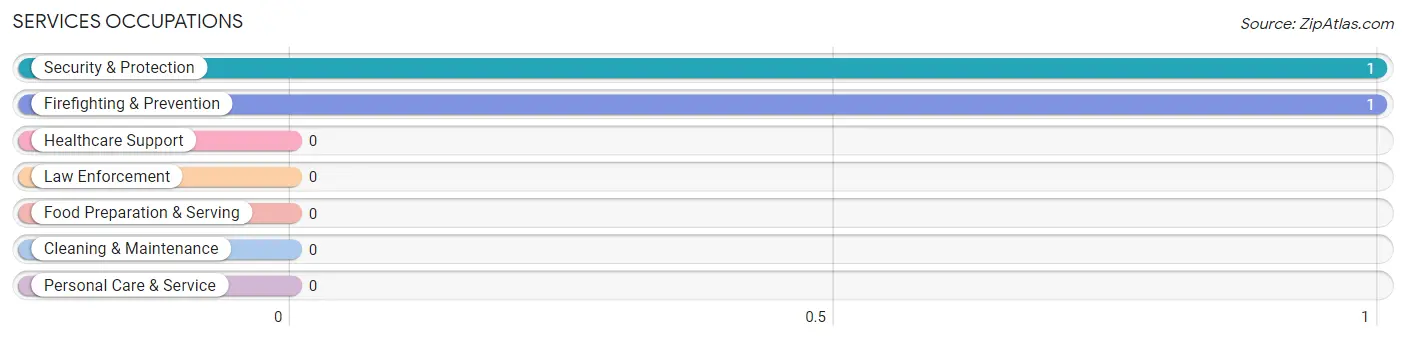
Services Occupations
The most common Services occupations in Ben Lomond are Security & Protection (1 | 1.2%), and Firefighting & Prevention (1 | 1.2%).
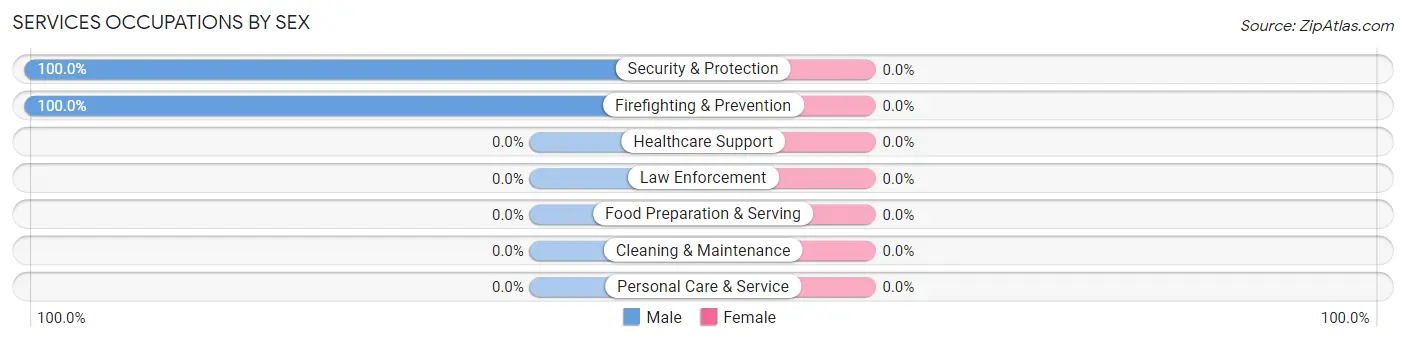
Services Occupations by Sex
| Occupation | Male | Female |
| Healthcare Support | 0 (0.0%) | 0 (0.0%) |
| Security & Protection | 1 (100.0%) | 0 (0.0%) |
| Firefighting & Prevention | 1 (100.0%) | 0 (0.0%) |
| Law Enforcement | 0 (0.0%) | 0 (0.0%) |
| Food Preparation & Serving | 0 (0.0%) | 0 (0.0%) |
| Cleaning & Maintenance | 0 (0.0%) | 0 (0.0%) |
| Personal Care & Service | 0 (0.0%) | 0 (0.0%) |
| Total (Category) | 1 (100.0%) | 0 (0.0%) |
| Total (Overall) | 49 (57.7%) | 36 (42.3%) |
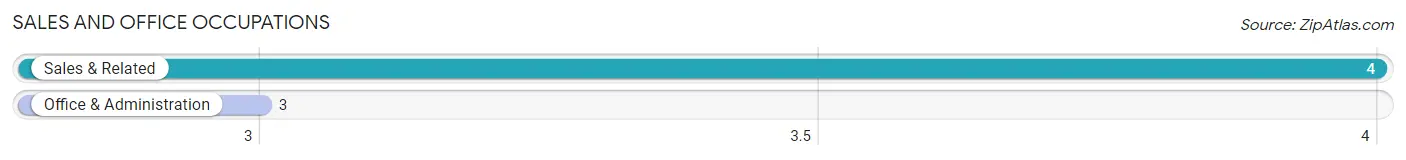
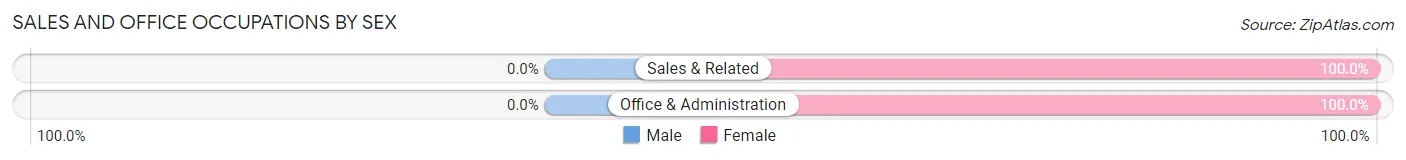
Sales and Office Occupations
The most common Sales and Office occupations in Ben Lomond are Sales & Related (4 | 4.7%), and Office & Administration (3 | 3.5%).
Sales and Office Occupations by Sex
| Occupation | Male | Female |
| Sales & Related | 0 (0.0%) | 4 (100.0%) |
| Office & Administration | 0 (0.0%) | 3 (100.0%) |
| Total (Category) | 0 (0.0%) | 7 (100.0%) |
| Total (Overall) | 49 (57.7%) | 36 (42.3%) |
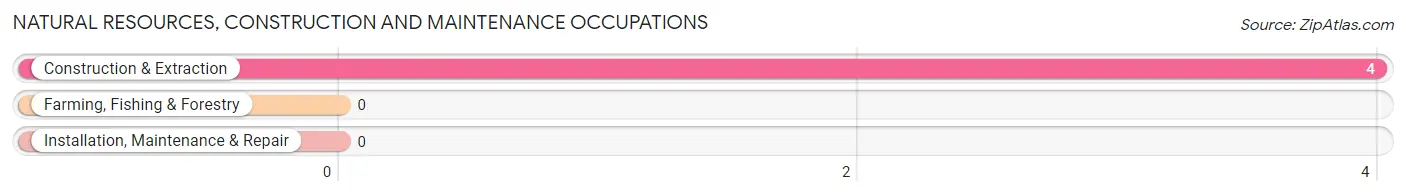
Natural Resources, Construction and Maintenance Occupations
The most common Natural Resources, Construction and Maintenance occupations in Ben Lomond are , and Construction & Extraction (4 | 4.7%).
Natural Resources, Construction and Maintenance Occupations by Sex
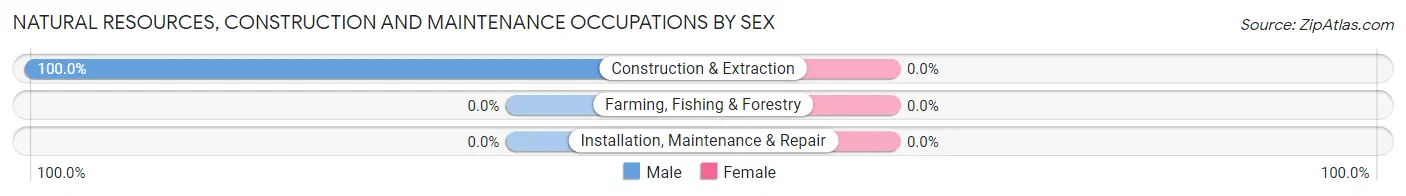
| Occupation | Male | Female |
| Farming, Fishing & Forestry | 0 (0.0%) | 0 (0.0%) |
| Construction & Extraction | 4 (100.0%) | 0 (0.0%) |
| Installation, Maintenance & Repair | 0 (0.0%) | 0 (0.0%) |
| Total (Category) | 4 (100.0%) | 0 (0.0%) |
| Total (Overall) | 49 (57.7%) | 36 (42.3%) |
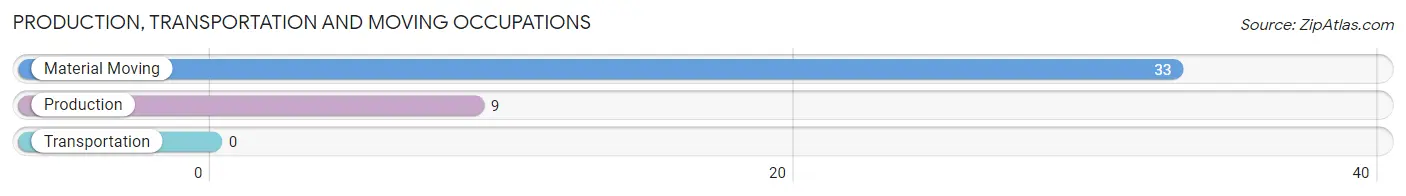
Production, Transportation and Moving Occupations
The most common Production, Transportation and Moving occupations in Ben Lomond are Material Moving (33 | 38.8%), and Production (9 | 10.6%).
Production, Transportation and Moving Occupations by Sex
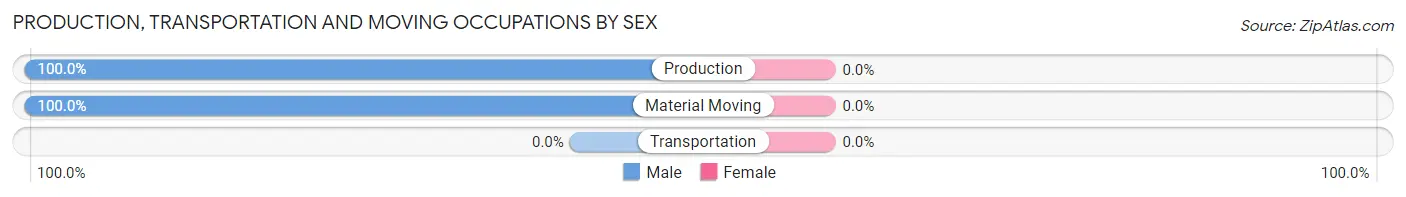
| Occupation | Male | Female |
| Production | 9 (100.0%) | 0 (0.0%) |
| Transportation | 0 (0.0%) | 0 (0.0%) |
| Material Moving | 33 (100.0%) | 0 (0.0%) |
| Total (Category) | 42 (100.0%) | 0 (0.0%) |
| Total (Overall) | 49 (57.7%) | 36 (42.3%) |
Employment Industries by Sex in Ben Lomond
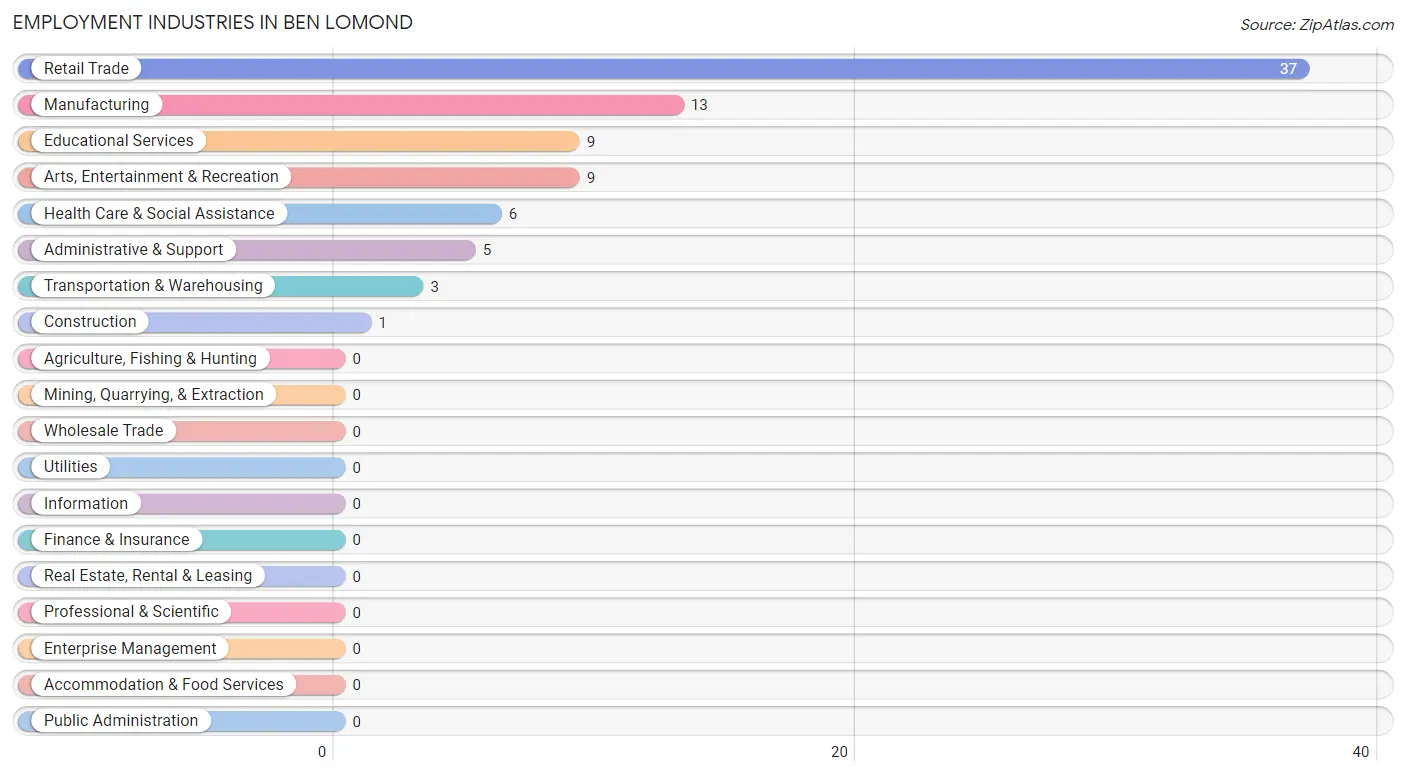
Employment Industries in Ben Lomond
The major employment industries in Ben Lomond include Retail Trade (37 | 43.5%), Manufacturing (13 | 15.3%), Educational Services (9 | 10.6%), Arts, Entertainment & Recreation (9 | 10.6%), and Health Care & Social Assistance (6 | 7.1%).
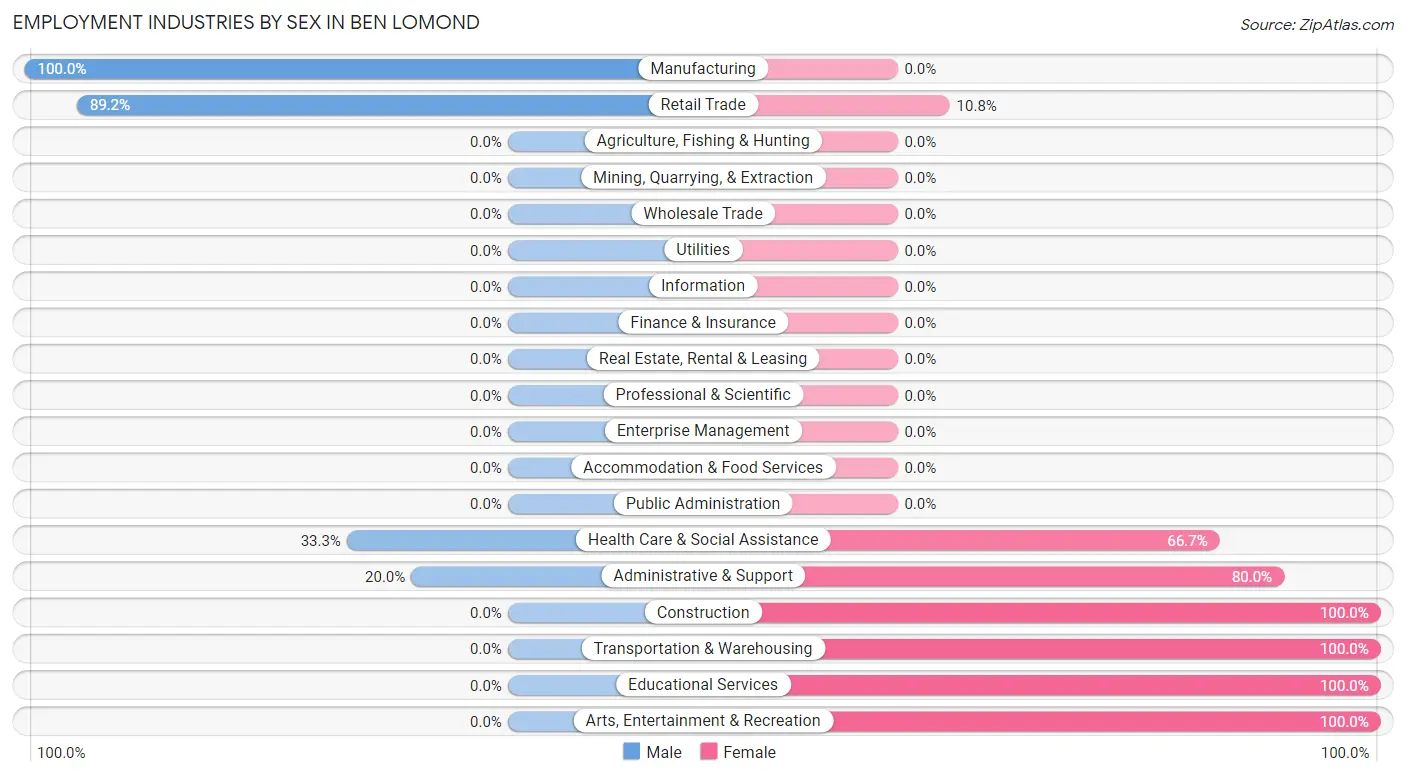
Employment Industries by Sex in Ben Lomond
The Ben Lomond industries that see more men than women are Manufacturing (100.0%), Retail Trade (89.2%), and Health Care & Social Assistance (33.3%), whereas the industries that tend to have a higher number of women are Construction (100.0%), Transportation & Warehousing (100.0%), and Educational Services (100.0%).
| Industry | Male | Female |
| Agriculture, Fishing & Hunting | 0 (0.0%) | 0 (0.0%) |
| Mining, Quarrying, & Extraction | 0 (0.0%) | 0 (0.0%) |
| Construction | 0 (0.0%) | 1 (100.0%) |
| Manufacturing | 13 (100.0%) | 0 (0.0%) |
| Wholesale Trade | 0 (0.0%) | 0 (0.0%) |
| Retail Trade | 33 (89.2%) | 4 (10.8%) |
| Transportation & Warehousing | 0 (0.0%) | 3 (100.0%) |
| Utilities | 0 (0.0%) | 0 (0.0%) |
| Information | 0 (0.0%) | 0 (0.0%) |
| Finance & Insurance | 0 (0.0%) | 0 (0.0%) |
| Real Estate, Rental & Leasing | 0 (0.0%) | 0 (0.0%) |
| Professional & Scientific | 0 (0.0%) | 0 (0.0%) |
| Enterprise Management | 0 (0.0%) | 0 (0.0%) |
| Administrative & Support | 1 (20.0%) | 4 (80.0%) |
| Educational Services | 0 (0.0%) | 9 (100.0%) |
| Health Care & Social Assistance | 2 (33.3%) | 4 (66.7%) |
| Arts, Entertainment & Recreation | 0 (0.0%) | 9 (100.0%) |
| Accommodation & Food Services | 0 (0.0%) | 0 (0.0%) |
| Public Administration | 0 (0.0%) | 0 (0.0%) |
| Total | 49 (57.7%) | 36 (42.3%) |
Education in Ben Lomond
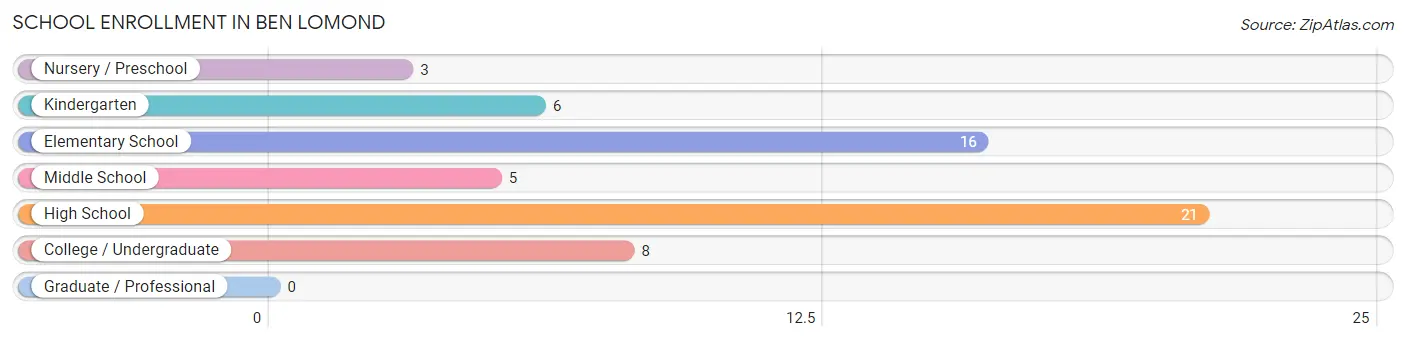
School Enrollment in Ben Lomond
The most common levels of schooling among the 59 students in Ben Lomond are high school (21 | 35.6%), elementary school (16 | 27.1%), and college / undergraduate (8 | 13.6%).
| School Level | # Students | % Students |
| Nursery / Preschool | 3 | 5.1% |
| Kindergarten | 6 | 10.2% |
| Elementary School | 16 | 27.1% |
| Middle School | 5 | 8.5% |
| High School | 21 | 35.6% |
| College / Undergraduate | 8 | 13.6% |
| Graduate / Professional | 0 | 0.0% |
| Total | 59 | 100.0% |
School Enrollment by Age by Funding Source in Ben Lomond
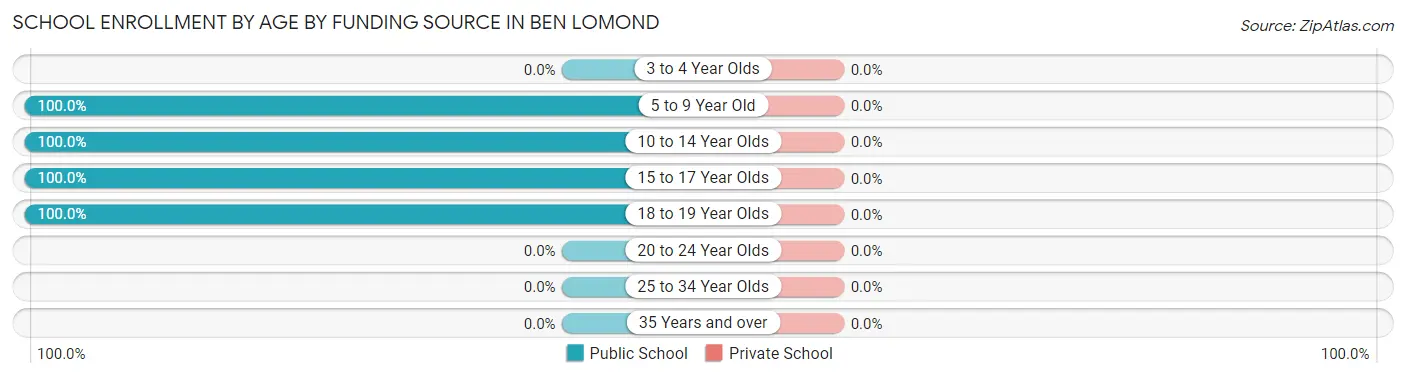
| Age Bracket | Public School | Private School |
| 3 to 4 Year Olds | 0 (0.0%) | 0 (0.0%) |
| 5 to 9 Year Old | 16 (100.0%) | 0 (0.0%) |
| 10 to 14 Year Olds | 16 (100.0%) | 0 (0.0%) |
| 15 to 17 Year Olds | 11 (100.0%) | 0 (0.0%) |
| 18 to 19 Year Olds | 16 (100.0%) | 0 (0.0%) |
| 20 to 24 Year Olds | 0 (0.0%) | 0 (0.0%) |
| 25 to 34 Year Olds | 0 (0.0%) | 0 (0.0%) |
| 35 Years and over | 0 (0.0%) | 0 (0.0%) |
| Total | 59 (100.0%) | 0 (0.0%) |
Educational Attainment by Field of Study in Ben Lomond
Arts & humanities (9 | 56.2%), science & technology (3 | 18.8%), physical & health sciences (2 | 12.5%), education (1 | 6.2%), and liberal arts & history (1 | 6.2%) are the most common fields of study among 16 individuals in Ben Lomond who have obtained a bachelor's degree or higher.
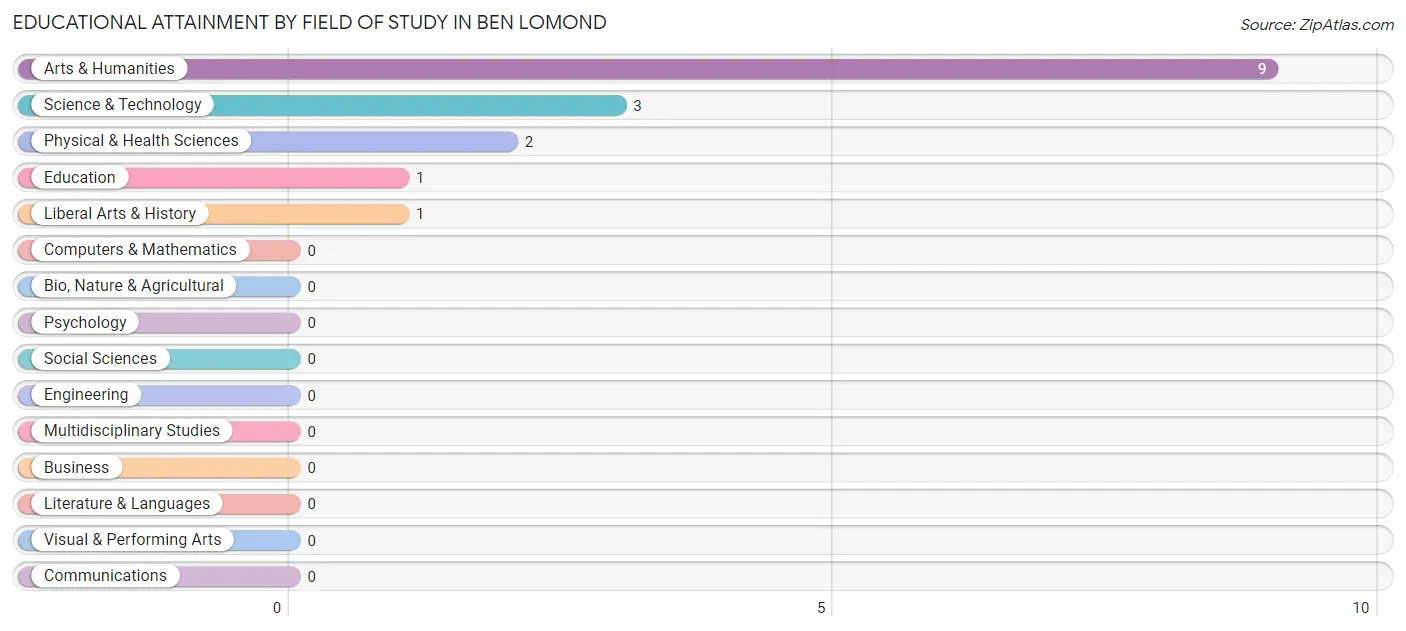
| Field of Study | # Graduates | % Graduates |
| Computers & Mathematics | 0 | 0.0% |
| Bio, Nature & Agricultural | 0 | 0.0% |
| Physical & Health Sciences | 2 | 12.5% |
| Psychology | 0 | 0.0% |
| Social Sciences | 0 | 0.0% |
| Engineering | 0 | 0.0% |
| Multidisciplinary Studies | 0 | 0.0% |
| Science & Technology | 3 | 18.8% |
| Business | 0 | 0.0% |
| Education | 1 | 6.2% |
| Literature & Languages | 0 | 0.0% |
| Liberal Arts & History | 1 | 6.2% |
| Visual & Performing Arts | 0 | 0.0% |
| Communications | 0 | 0.0% |
| Arts & Humanities | 9 | 56.2% |
| Total | 16 | 100.0% |
Transportation & Commute in Ben Lomond
Vehicle Availability by Sex in Ben Lomond
The most prevalent vehicle ownership categories in Ben Lomond are males with 3 vehicles (35, accounting for 83.3%) and females with 3 vehicles (5, making up 97.2%).
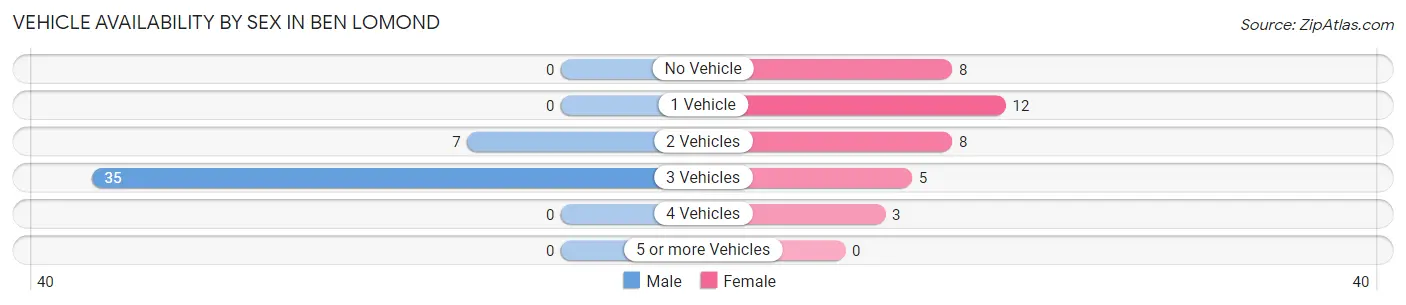
| Vehicles Available | Male | Female |
| No Vehicle | 0 (0.0%) | 8 (22.2%) |
| 1 Vehicle | 0 (0.0%) | 12 (33.3%) |
| 2 Vehicles | 7 (16.7%) | 8 (22.2%) |
| 3 Vehicles | 35 (83.3%) | 5 (13.9%) |
| 4 Vehicles | 0 (0.0%) | 3 (8.3%) |
| 5 or more Vehicles | 0 (0.0%) | 0 (0.0%) |
| Total | 42 (100.0%) | 36 (100.0%) |
Commute Time in Ben Lomond
The most frequently occuring commute durations in Ben Lomond are 30 to 34 minutes (39 commuters, 50.0%), 45 to 59 minutes (14 commuters, 17.9%), and 20 to 24 minutes (11 commuters, 14.1%).
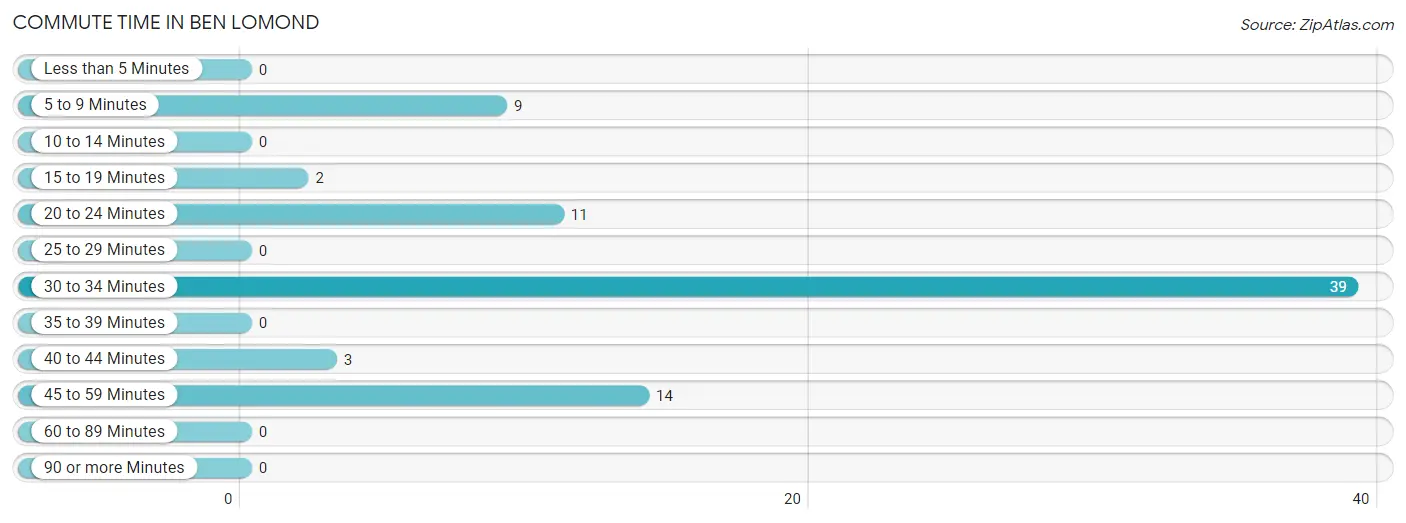
| Commute Time | # Commuters | % Commuters |
| Less than 5 Minutes | 0 | 0.0% |
| 5 to 9 Minutes | 9 | 11.5% |
| 10 to 14 Minutes | 0 | 0.0% |
| 15 to 19 Minutes | 2 | 2.6% |
| 20 to 24 Minutes | 11 | 14.1% |
| 25 to 29 Minutes | 0 | 0.0% |
| 30 to 34 Minutes | 39 | 50.0% |
| 35 to 39 Minutes | 0 | 0.0% |
| 40 to 44 Minutes | 3 | 3.8% |
| 45 to 59 Minutes | 14 | 17.9% |
| 60 to 89 Minutes | 0 | 0.0% |
| 90 or more Minutes | 0 | 0.0% |
Commute Time by Sex in Ben Lomond
The most common commute times in Ben Lomond are 30 to 34 minutes (34 commuters, 80.9%) for males and 20 to 24 minutes (11 commuters, 30.6%) for females.
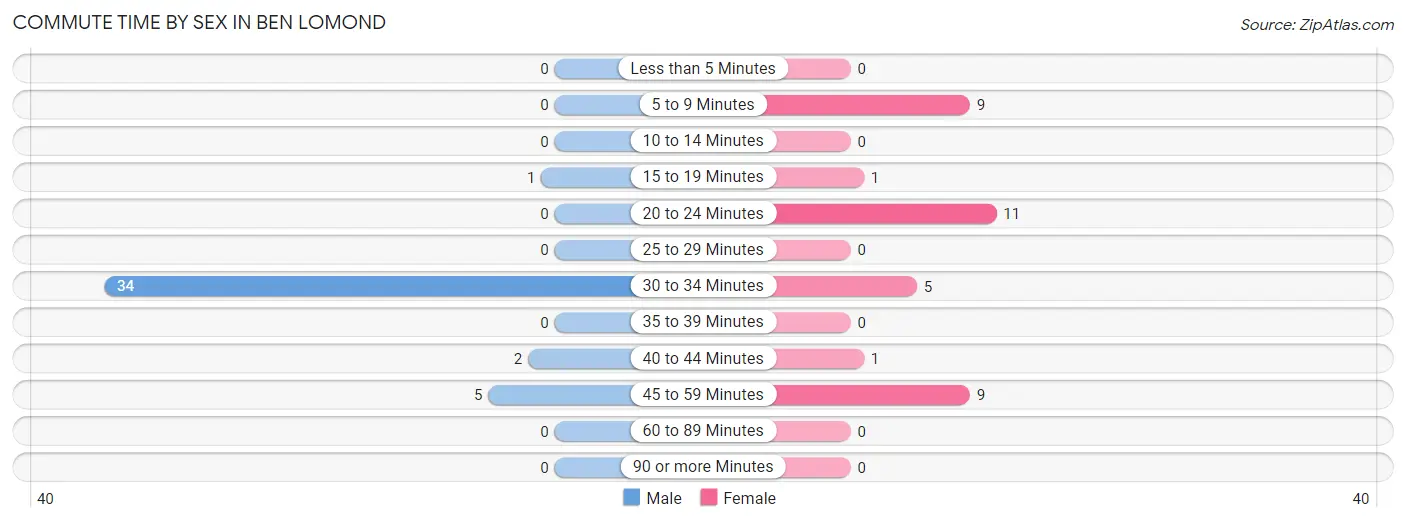
| Commute Time | Male | Female |
| Less than 5 Minutes | 0 (0.0%) | 0 (0.0%) |
| 5 to 9 Minutes | 0 (0.0%) | 9 (25.0%) |
| 10 to 14 Minutes | 0 (0.0%) | 0 (0.0%) |
| 15 to 19 Minutes | 1 (2.4%) | 1 (2.8%) |
| 20 to 24 Minutes | 0 (0.0%) | 11 (30.6%) |
| 25 to 29 Minutes | 0 (0.0%) | 0 (0.0%) |
| 30 to 34 Minutes | 34 (80.9%) | 5 (13.9%) |
| 35 to 39 Minutes | 0 (0.0%) | 0 (0.0%) |
| 40 to 44 Minutes | 2 (4.8%) | 1 (2.8%) |
| 45 to 59 Minutes | 5 (11.9%) | 9 (25.0%) |
| 60 to 89 Minutes | 0 (0.0%) | 0 (0.0%) |
| 90 or more Minutes | 0 (0.0%) | 0 (0.0%) |
Time of Departure to Work by Sex in Ben Lomond
The most frequent times of departure to work in Ben Lomond are 12:00 PM to 3:59 PM (34, 80.9%) for males and 6:30 AM to 6:59 AM (13, 36.1%) for females.
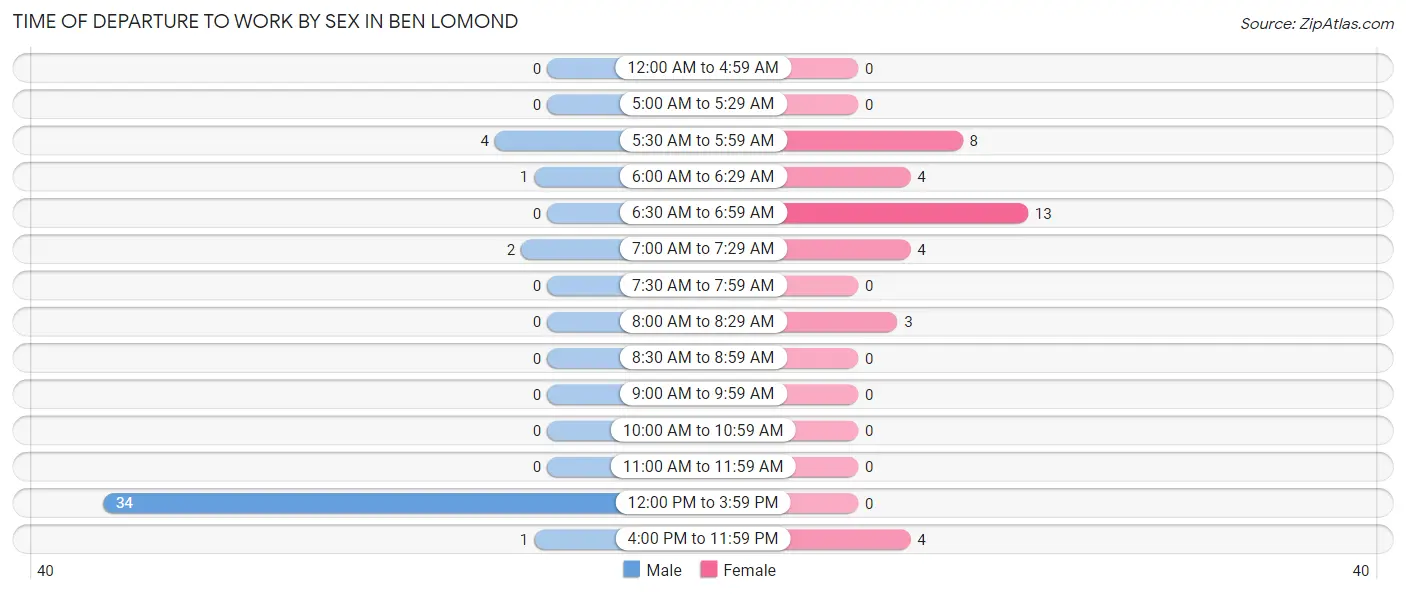
| Time of Departure | Male | Female |
| 12:00 AM to 4:59 AM | 0 (0.0%) | 0 (0.0%) |
| 5:00 AM to 5:29 AM | 0 (0.0%) | 0 (0.0%) |
| 5:30 AM to 5:59 AM | 4 (9.5%) | 8 (22.2%) |
| 6:00 AM to 6:29 AM | 1 (2.4%) | 4 (11.1%) |
| 6:30 AM to 6:59 AM | 0 (0.0%) | 13 (36.1%) |
| 7:00 AM to 7:29 AM | 2 (4.8%) | 4 (11.1%) |
| 7:30 AM to 7:59 AM | 0 (0.0%) | 0 (0.0%) |
| 8:00 AM to 8:29 AM | 0 (0.0%) | 3 (8.3%) |
| 8:30 AM to 8:59 AM | 0 (0.0%) | 0 (0.0%) |
| 9:00 AM to 9:59 AM | 0 (0.0%) | 0 (0.0%) |
| 10:00 AM to 10:59 AM | 0 (0.0%) | 0 (0.0%) |
| 11:00 AM to 11:59 AM | 0 (0.0%) | 0 (0.0%) |
| 12:00 PM to 3:59 PM | 34 (80.9%) | 0 (0.0%) |
| 4:00 PM to 11:59 PM | 1 (2.4%) | 4 (11.1%) |
| Total | 42 (100.0%) | 36 (100.0%) |
Housing Occupancy in Ben Lomond
Occupancy by Ownership in Ben Lomond
Of the total 53 dwellings in Ben Lomond, owner-occupied units account for 45 (84.9%), while renter-occupied units make up 8 (15.1%).
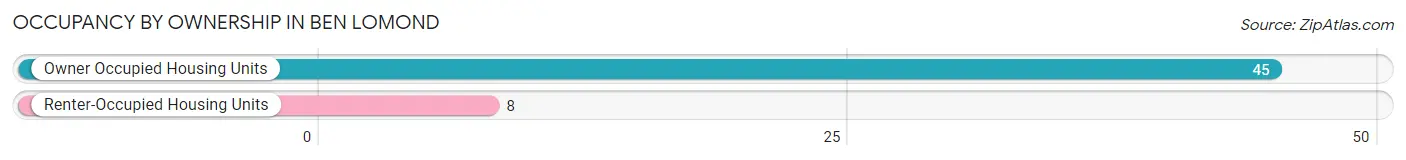
| Occupancy | # Housing Units | % Housing Units |
| Owner Occupied Housing Units | 45 | 84.9% |
| Renter-Occupied Housing Units | 8 | 15.1% |
| Total Occupied Housing Units | 53 | 100.0% |
Occupancy by Household Size in Ben Lomond
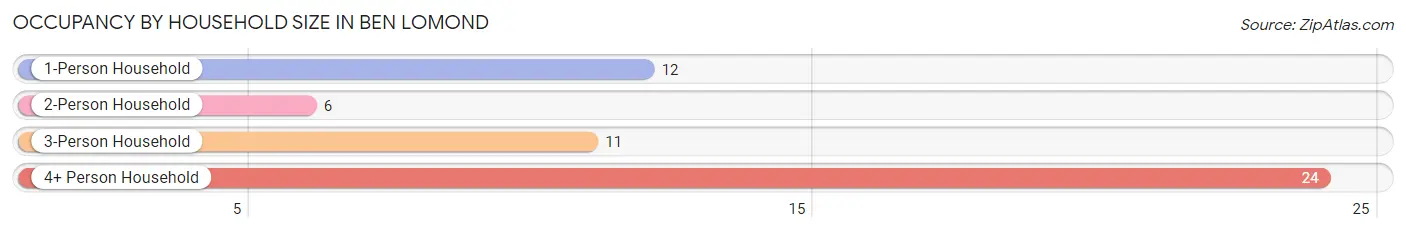
| Household Size | # Housing Units | % Housing Units |
| 1-Person Household | 12 | 22.6% |
| 2-Person Household | 6 | 11.3% |
| 3-Person Household | 11 | 20.7% |
| 4+ Person Household | 24 | 45.3% |
| Total Housing Units | 53 | 100.0% |
Occupancy by Ownership by Household Size in Ben Lomond
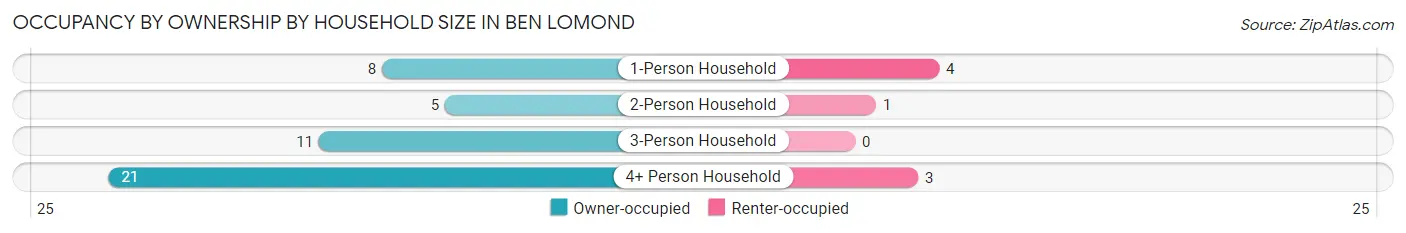
| Household Size | Owner-occupied | Renter-occupied |
| 1-Person Household | 8 (66.7%) | 4 (33.3%) |
| 2-Person Household | 5 (83.3%) | 1 (16.7%) |
| 3-Person Household | 11 (100.0%) | 0 (0.0%) |
| 4+ Person Household | 21 (87.5%) | 3 (12.5%) |
| Total Housing Units | 45 (84.9%) | 8 (15.1%) |
Occupancy by Educational Attainment in Ben Lomond
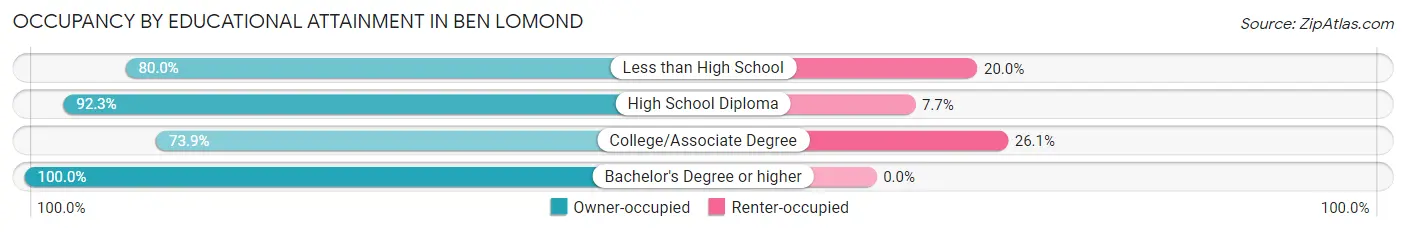
| Household Size | Owner-occupied | Renter-occupied |
| Less than High School | 4 (80.0%) | 1 (20.0%) |
| High School Diploma | 12 (92.3%) | 1 (7.7%) |
| College/Associate Degree | 17 (73.9%) | 6 (26.1%) |
| Bachelor's Degree or higher | 12 (100.0%) | 0 (0.0%) |
Occupancy by Age of Householder in Ben Lomond
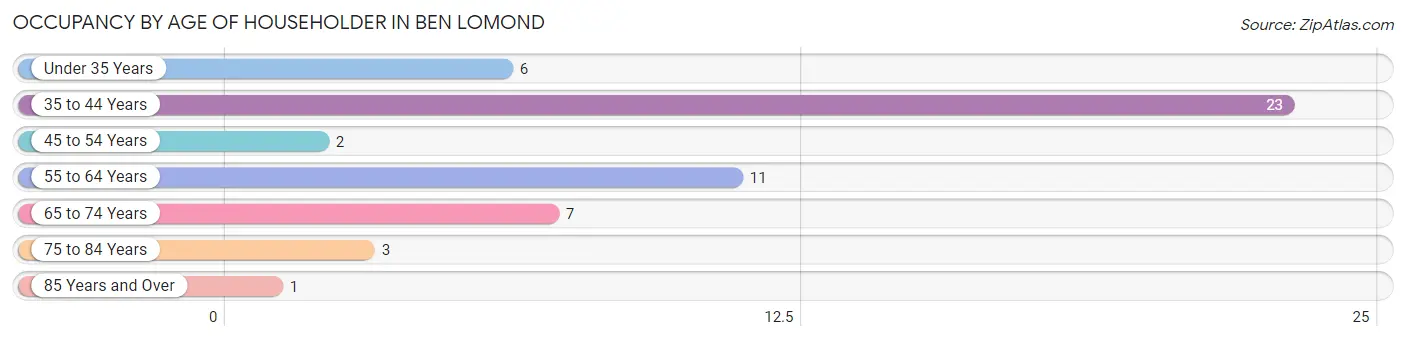
| Age Bracket | # Households | % Households |
| Under 35 Years | 6 | 11.3% |
| 35 to 44 Years | 23 | 43.4% |
| 45 to 54 Years | 2 | 3.8% |
| 55 to 64 Years | 11 | 20.7% |
| 65 to 74 Years | 7 | 13.2% |
| 75 to 84 Years | 3 | 5.7% |
| 85 Years and Over | 1 | 1.9% |
| Total | 53 | 100.0% |
Housing Finances in Ben Lomond
Median Income by Occupancy in Ben Lomond
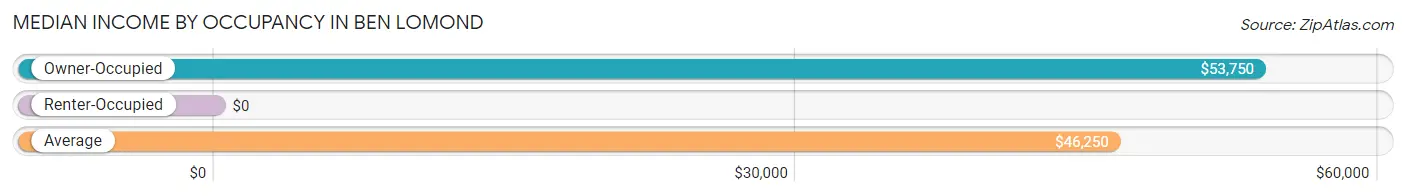
| Occupancy Type | # Households | Median Income |
| Owner-Occupied | 45 (84.9%) | $53,750 |
| Renter-Occupied | 8 (15.1%) | $0 |
| Average | 53 (100.0%) | $46,250 |
Occupancy by Householder Income Bracket in Ben Lomond
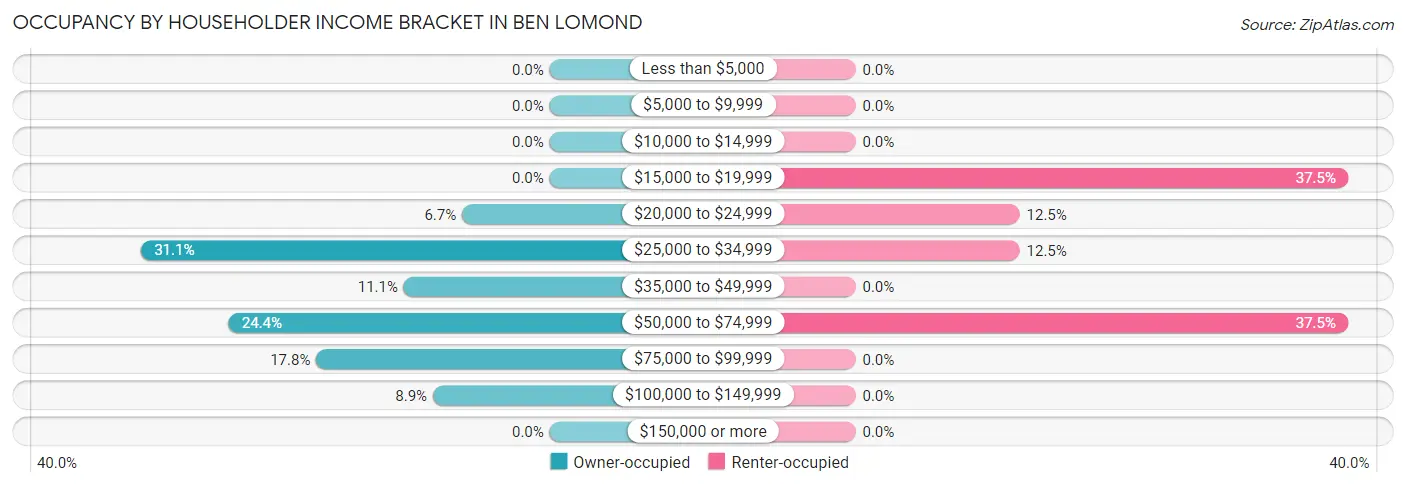
| Income Bracket | Owner-occupied | Renter-occupied |
| Less than $5,000 | 0 (0.0%) | 0 (0.0%) |
| $5,000 to $9,999 | 0 (0.0%) | 0 (0.0%) |
| $10,000 to $14,999 | 0 (0.0%) | 0 (0.0%) |
| $15,000 to $19,999 | 0 (0.0%) | 3 (37.5%) |
| $20,000 to $24,999 | 3 (6.7%) | 1 (12.5%) |
| $25,000 to $34,999 | 14 (31.1%) | 1 (12.5%) |
| $35,000 to $49,999 | 5 (11.1%) | 0 (0.0%) |
| $50,000 to $74,999 | 11 (24.4%) | 3 (37.5%) |
| $75,000 to $99,999 | 8 (17.8%) | 0 (0.0%) |
| $100,000 to $149,999 | 4 (8.9%) | 0 (0.0%) |
| $150,000 or more | 0 (0.0%) | 0 (0.0%) |
| Total | 45 (100.0%) | 8 (100.0%) |
Monthly Housing Cost Tiers in Ben Lomond
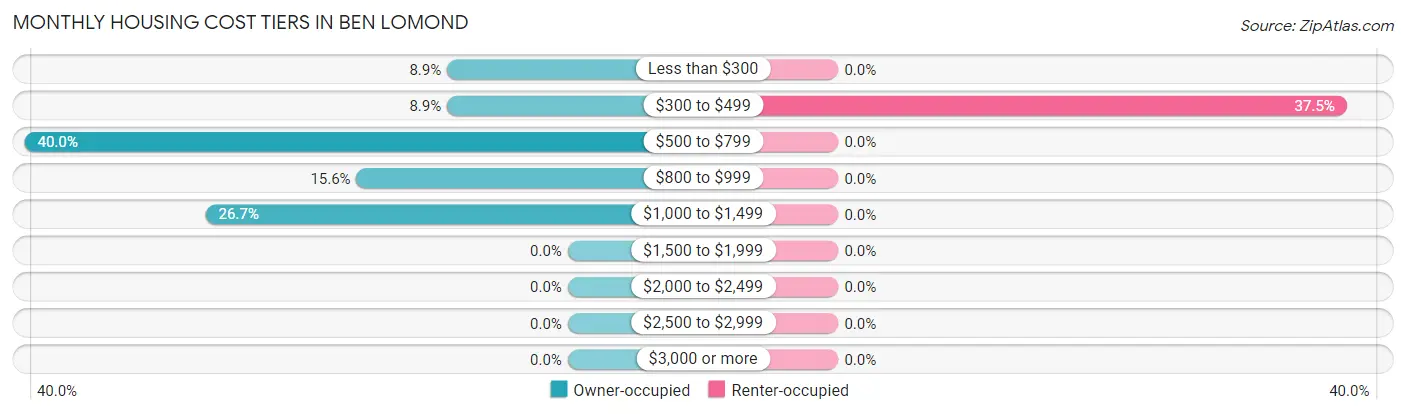
| Monthly Cost | Owner-occupied | Renter-occupied |
| Less than $300 | 4 (8.9%) | 0 (0.0%) |
| $300 to $499 | 4 (8.9%) | 3 (37.5%) |
| $500 to $799 | 18 (40.0%) | 0 (0.0%) |
| $800 to $999 | 7 (15.6%) | 0 (0.0%) |
| $1,000 to $1,499 | 12 (26.7%) | 0 (0.0%) |
| $1,500 to $1,999 | 0 (0.0%) | 0 (0.0%) |
| $2,000 to $2,499 | 0 (0.0%) | 0 (0.0%) |
| $2,500 to $2,999 | 0 (0.0%) | 0 (0.0%) |
| $3,000 or more | 0 (0.0%) | 0 (0.0%) |
| Total | 45 (100.0%) | 8 (100.0%) |
Physical Housing Characteristics in Ben Lomond
Housing Structures in Ben Lomond
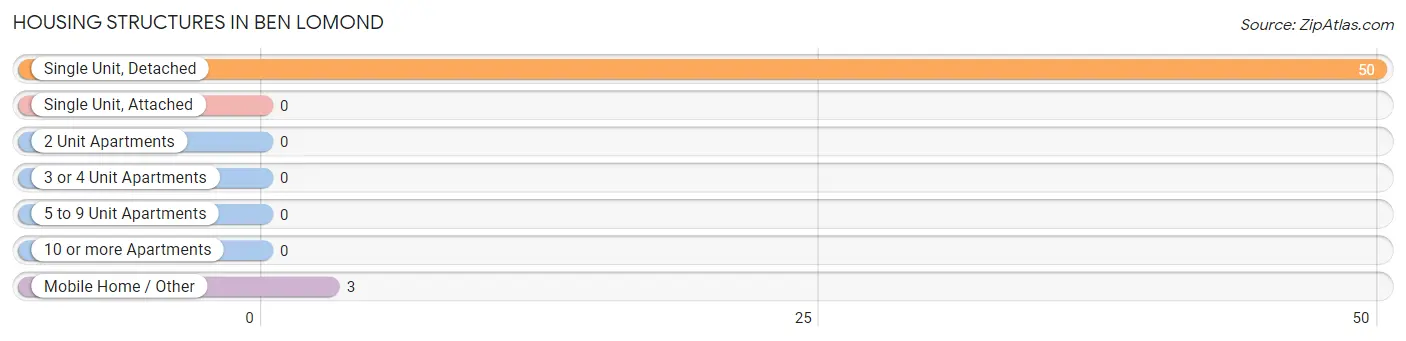
| Structure Type | # Housing Units | % Housing Units |
| Single Unit, Detached | 50 | 94.3% |
| Single Unit, Attached | 0 | 0.0% |
| 2 Unit Apartments | 0 | 0.0% |
| 3 or 4 Unit Apartments | 0 | 0.0% |
| 5 to 9 Unit Apartments | 0 | 0.0% |
| 10 or more Apartments | 0 | 0.0% |
| Mobile Home / Other | 3 | 5.7% |
| Total | 53 | 100.0% |
Housing Structures by Occupancy in Ben Lomond
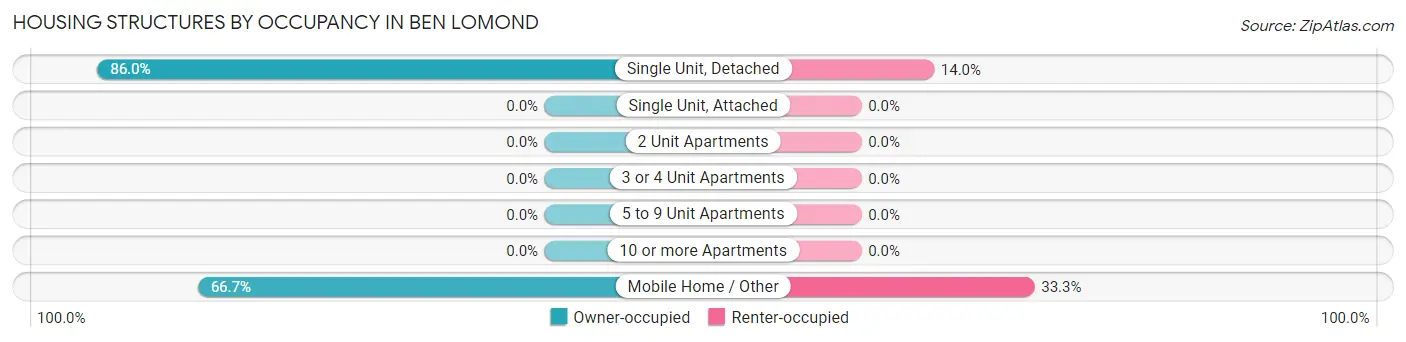
| Structure Type | Owner-occupied | Renter-occupied |
| Single Unit, Detached | 43 (86.0%) | 7 (14.0%) |
| Single Unit, Attached | 0 (0.0%) | 0 (0.0%) |
| 2 Unit Apartments | 0 (0.0%) | 0 (0.0%) |
| 3 or 4 Unit Apartments | 0 (0.0%) | 0 (0.0%) |
| 5 to 9 Unit Apartments | 0 (0.0%) | 0 (0.0%) |
| 10 or more Apartments | 0 (0.0%) | 0 (0.0%) |
| Mobile Home / Other | 2 (66.7%) | 1 (33.3%) |
| Total | 45 (84.9%) | 8 (15.1%) |
Housing Structures by Number of Rooms in Ben Lomond
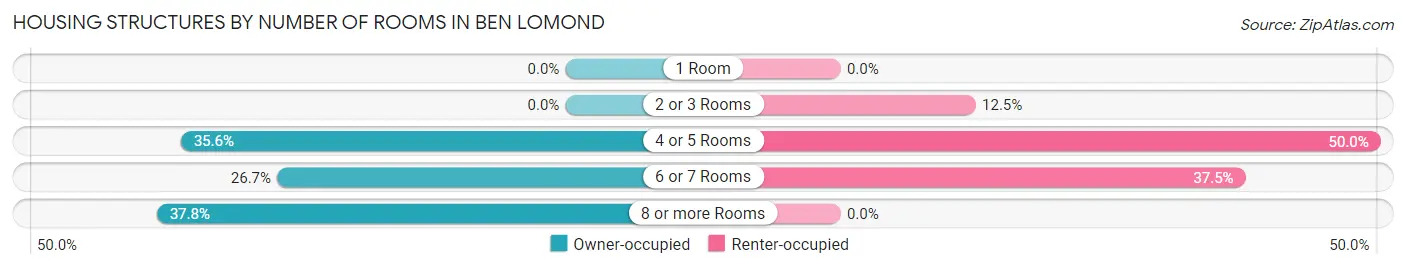
| Number of Rooms | Owner-occupied | Renter-occupied |
| 1 Room | 0 (0.0%) | 0 (0.0%) |
| 2 or 3 Rooms | 0 (0.0%) | 1 (12.5%) |
| 4 or 5 Rooms | 16 (35.6%) | 4 (50.0%) |
| 6 or 7 Rooms | 12 (26.7%) | 3 (37.5%) |
| 8 or more Rooms | 17 (37.8%) | 0 (0.0%) |
| Total | 45 (100.0%) | 8 (100.0%) |
Housing Structure by Heating Type in Ben Lomond
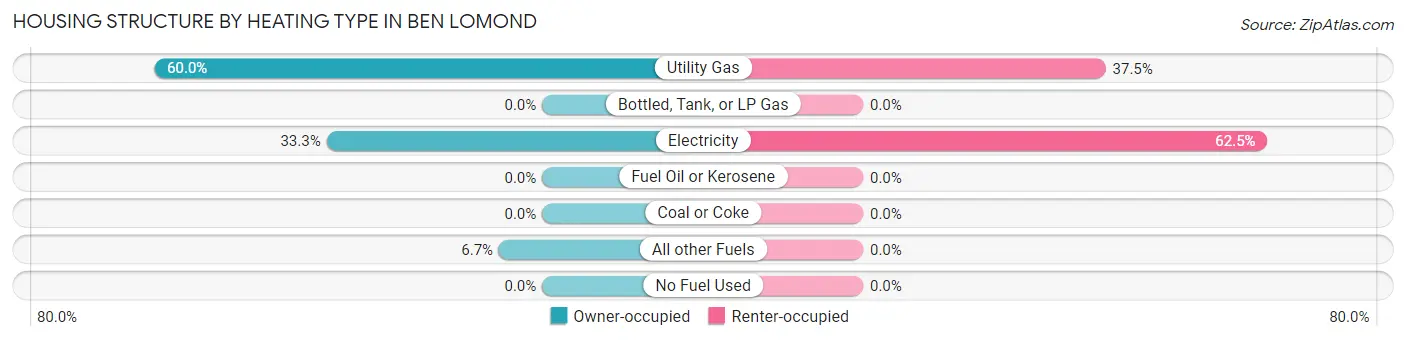
| Heating Type | Owner-occupied | Renter-occupied |
| Utility Gas | 27 (60.0%) | 3 (37.5%) |
| Bottled, Tank, or LP Gas | 0 (0.0%) | 0 (0.0%) |
| Electricity | 15 (33.3%) | 5 (62.5%) |
| Fuel Oil or Kerosene | 0 (0.0%) | 0 (0.0%) |
| Coal or Coke | 0 (0.0%) | 0 (0.0%) |
| All other Fuels | 3 (6.7%) | 0 (0.0%) |
| No Fuel Used | 0 (0.0%) | 0 (0.0%) |
| Total | 45 (100.0%) | 8 (100.0%) |
Household Vehicle Usage in Ben Lomond
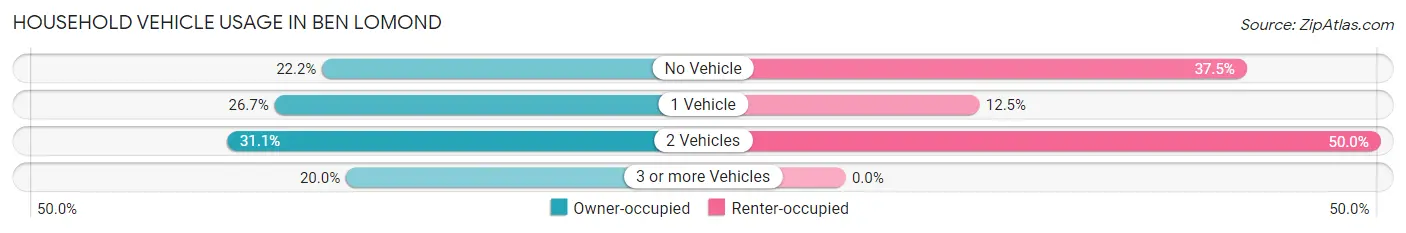
| Vehicles per Household | Owner-occupied | Renter-occupied |
| No Vehicle | 10 (22.2%) | 3 (37.5%) |
| 1 Vehicle | 12 (26.7%) | 1 (12.5%) |
| 2 Vehicles | 14 (31.1%) | 4 (50.0%) |
| 3 or more Vehicles | 9 (20.0%) | 0 (0.0%) |
| Total | 45 (100.0%) | 8 (100.0%) |
Real Estate & Mortgages in Ben Lomond
Real Estate and Mortgage Overview in Ben Lomond
| Characteristic | Without Mortgage | With Mortgage |
| Housing Units | 13 | 32 |
| Median Property Value | - | - |
| Median Household Income | - | - |
| Monthly Housing Costs | - | - |
| Real Estate Taxes | - | - |
Property Value by Mortgage Status in Ben Lomond
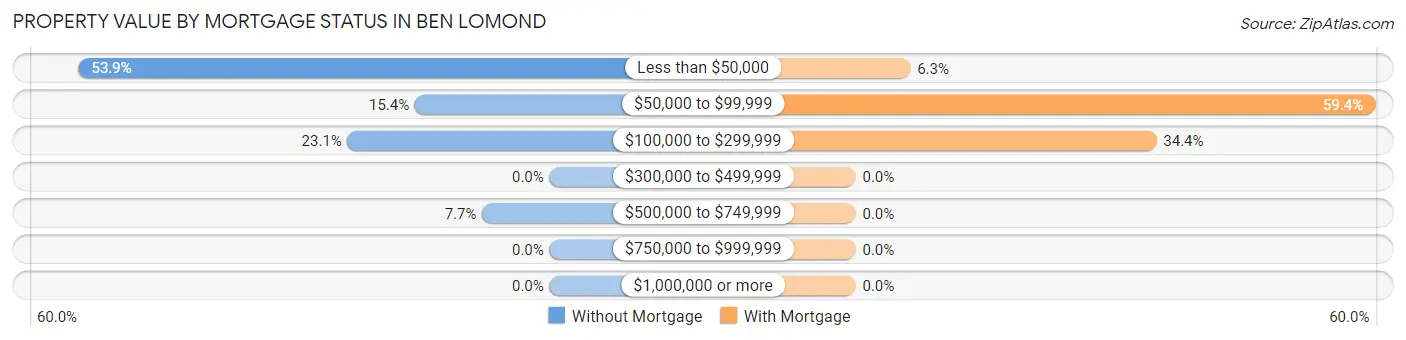
| Property Value | Without Mortgage | With Mortgage |
| Less than $50,000 | 7 (53.8%) | 2 (6.2%) |
| $50,000 to $99,999 | 2 (15.4%) | 19 (59.4%) |
| $100,000 to $299,999 | 3 (23.1%) | 11 (34.4%) |
| $300,000 to $499,999 | 0 (0.0%) | 0 (0.0%) |
| $500,000 to $749,999 | 1 (7.7%) | 0 (0.0%) |
| $750,000 to $999,999 | 0 (0.0%) | 0 (0.0%) |
| $1,000,000 or more | 0 (0.0%) | 0 (0.0%) |
| Total | 13 (100.0%) | 32 (100.0%) |
Household Income by Mortgage Status in Ben Lomond
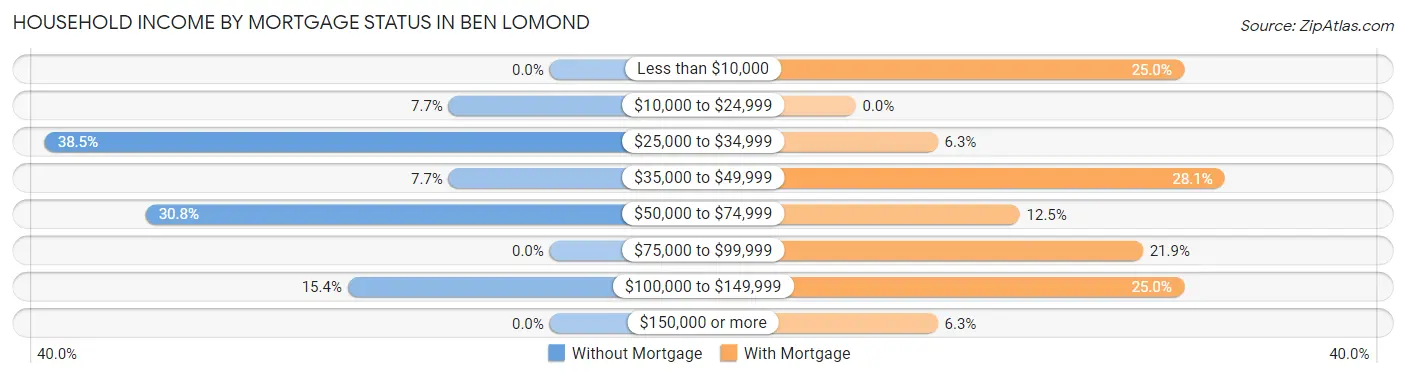
| Household Income | Without Mortgage | With Mortgage |
| Less than $10,000 | 0 (0.0%) | 8 (25.0%) |
| $10,000 to $24,999 | 1 (7.7%) | 0 (0.0%) |
| $25,000 to $34,999 | 5 (38.5%) | 2 (6.2%) |
| $35,000 to $49,999 | 1 (7.7%) | 9 (28.1%) |
| $50,000 to $74,999 | 4 (30.8%) | 4 (12.5%) |
| $75,000 to $99,999 | 0 (0.0%) | 7 (21.9%) |
| $100,000 to $149,999 | 2 (15.4%) | 8 (25.0%) |
| $150,000 or more | 0 (0.0%) | 2 (6.2%) |
| Total | 13 (100.0%) | 32 (100.0%) |
Property Value to Household Income Ratio in Ben Lomond
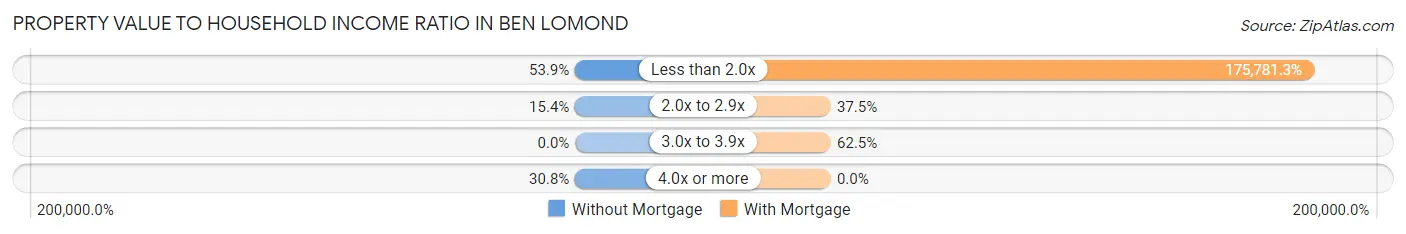
| Value-to-Income Ratio | Without Mortgage | With Mortgage |
| Less than 2.0x | 7 (53.8%) | 56,250 (175,781.2%) |
| 2.0x to 2.9x | 2 (15.4%) | 12 (37.5%) |
| 3.0x to 3.9x | 0 (0.0%) | 20 (62.5%) |
| 4.0x or more | 4 (30.8%) | 0 (0.0%) |
| Total | 13 (100.0%) | 32 (100.0%) |
Real Estate Taxes by Mortgage Status in Ben Lomond
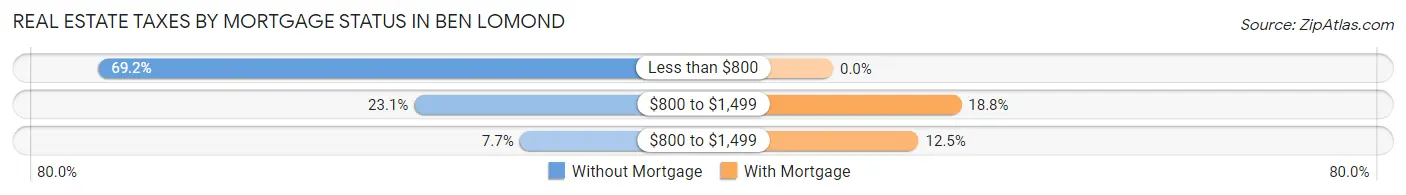
| Property Taxes | Without Mortgage | With Mortgage |
| Less than $800 | 9 (69.2%) | 0 (0.0%) |
| $800 to $1,499 | 3 (23.1%) | 6 (18.8%) |
| $800 to $1,499 | 1 (7.7%) | 4 (12.5%) |
| Total | 13 (100.0%) | 32 (100.0%) |
Health & Disability in Ben Lomond
Health Insurance Coverage by Age in Ben Lomond
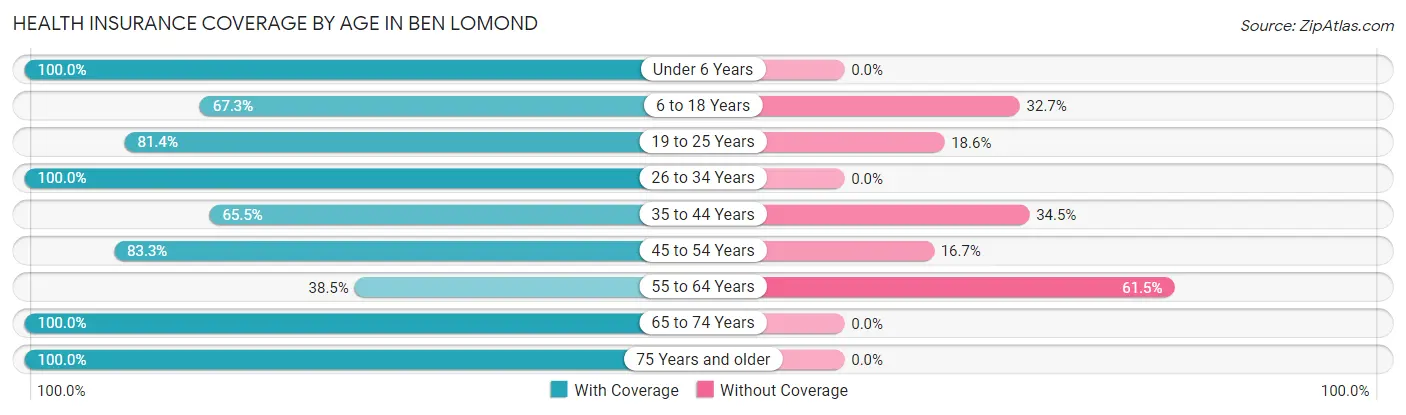
| Age Bracket | With Coverage | Without Coverage |
| Under 6 Years | 27 (100.0%) | 0 (0.0%) |
| 6 to 18 Years | 35 (67.3%) | 17 (32.7%) |
| 19 to 25 Years | 48 (81.4%) | 11 (18.6%) |
| 26 to 34 Years | 17 (100.0%) | 0 (0.0%) |
| 35 to 44 Years | 19 (65.5%) | 10 (34.5%) |
| 45 to 54 Years | 5 (83.3%) | 1 (16.7%) |
| 55 to 64 Years | 5 (38.5%) | 8 (61.5%) |
| 65 to 74 Years | 8 (100.0%) | 0 (0.0%) |
| 75 Years and older | 7 (100.0%) | 0 (0.0%) |
| Total | 171 (78.4%) | 47 (21.6%) |
Health Insurance Coverage by Citizenship Status in Ben Lomond
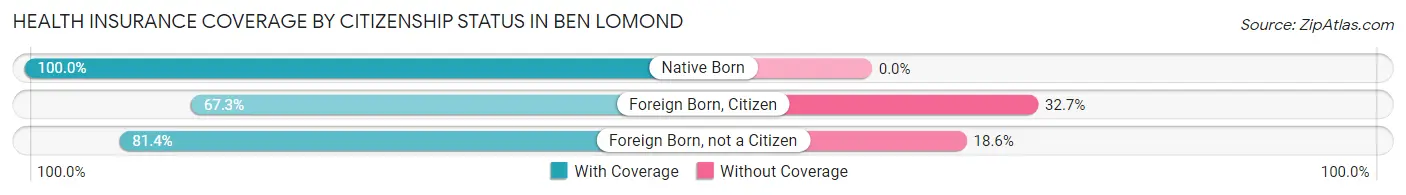
| Citizenship Status | With Coverage | Without Coverage |
| Native Born | 27 (100.0%) | 0 (0.0%) |
| Foreign Born, Citizen | 35 (67.3%) | 17 (32.7%) |
| Foreign Born, not a Citizen | 48 (81.4%) | 11 (18.6%) |
Health Insurance Coverage by Household Income in Ben Lomond
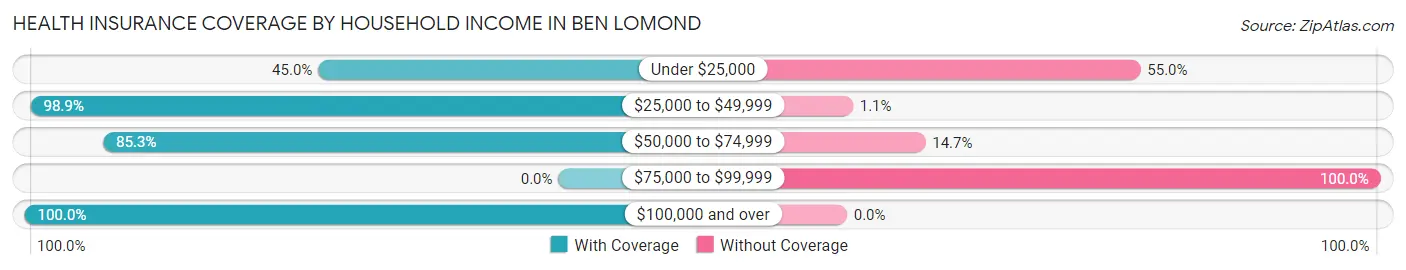
| Household Income | With Coverage | Without Coverage |
| Under $25,000 | 9 (45.0%) | 11 (55.0%) |
| $25,000 to $49,999 | 88 (98.9%) | 1 (1.1%) |
| $50,000 to $74,999 | 58 (85.3%) | 10 (14.7%) |
| $75,000 to $99,999 | 0 (0.0%) | 25 (100.0%) |
| $100,000 and over | 16 (100.0%) | 0 (0.0%) |
Public vs Private Health Insurance Coverage by Age in Ben Lomond
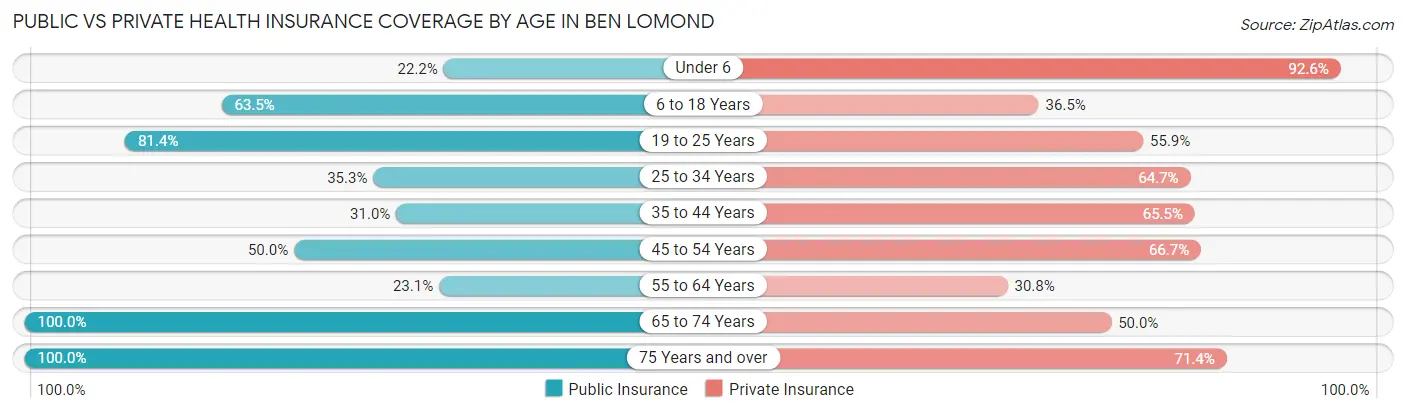
| Age Bracket | Public Insurance | Private Insurance |
| Under 6 | 6 (22.2%) | 25 (92.6%) |
| 6 to 18 Years | 33 (63.5%) | 19 (36.5%) |
| 19 to 25 Years | 48 (81.4%) | 33 (55.9%) |
| 25 to 34 Years | 6 (35.3%) | 11 (64.7%) |
| 35 to 44 Years | 9 (31.0%) | 19 (65.5%) |
| 45 to 54 Years | 3 (50.0%) | 4 (66.7%) |
| 55 to 64 Years | 3 (23.1%) | 4 (30.8%) |
| 65 to 74 Years | 8 (100.0%) | 4 (50.0%) |
| 75 Years and over | 7 (100.0%) | 5 (71.4%) |
| Total | 123 (56.4%) | 124 (56.9%) |
Disability Status by Sex by Age in Ben Lomond
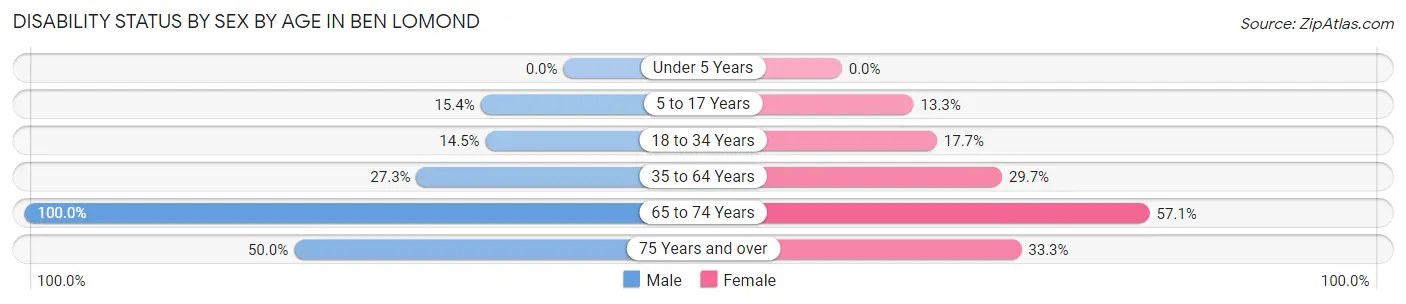
| Age Bracket | Male | Female |
| Under 5 Years | 0 (0.0%) | 0 (0.0%) |
| 5 to 17 Years | 2 (15.4%) | 4 (13.3%) |
| 18 to 34 Years | 11 (14.5%) | 3 (17.6%) |
| 35 to 64 Years | 3 (27.3%) | 11 (29.7%) |
| 65 to 74 Years | 1 (100.0%) | 4 (57.1%) |
| 75 Years and over | 2 (50.0%) | 1 (33.3%) |
Disability Class by Sex by Age in Ben Lomond
Disability Class: Hearing Difficulty
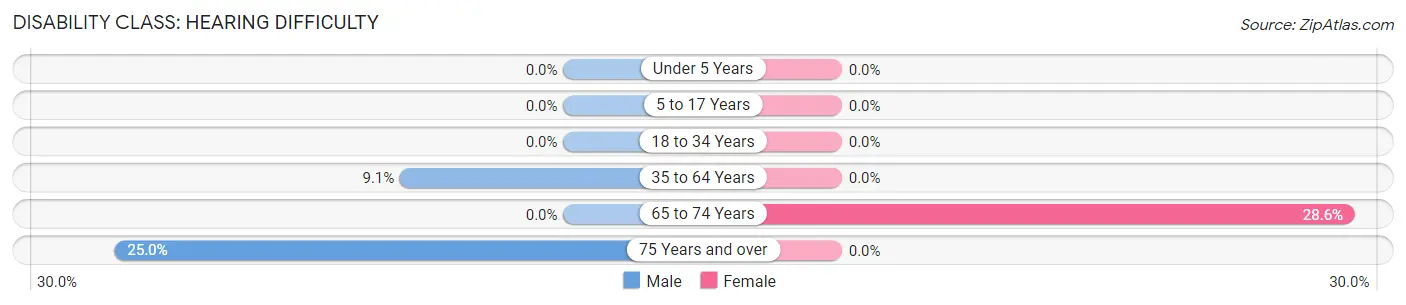
| Age Bracket | Male | Female |
| Under 5 Years | 0 (0.0%) | 0 (0.0%) |
| 5 to 17 Years | 0 (0.0%) | 0 (0.0%) |
| 18 to 34 Years | 0 (0.0%) | 0 (0.0%) |
| 35 to 64 Years | 1 (9.1%) | 0 (0.0%) |
| 65 to 74 Years | 0 (0.0%) | 2 (28.6%) |
| 75 Years and over | 1 (25.0%) | 0 (0.0%) |
Disability Class: Vision Difficulty
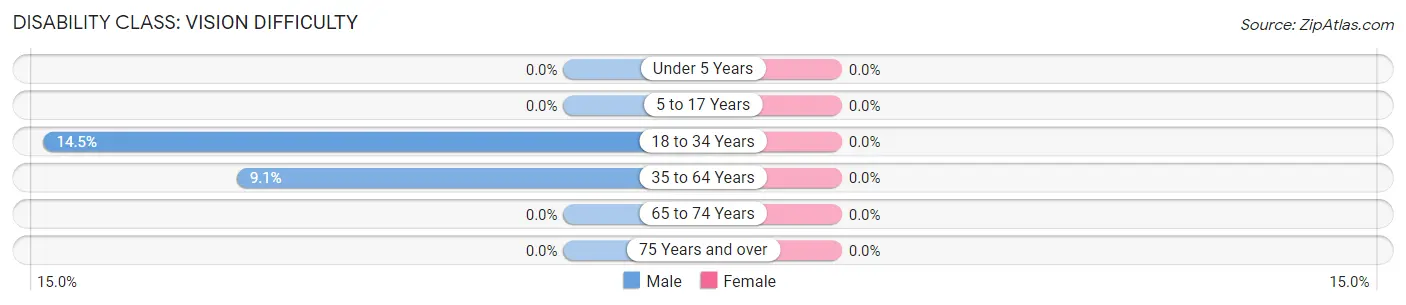
| Age Bracket | Male | Female |
| Under 5 Years | 0 (0.0%) | 0 (0.0%) |
| 5 to 17 Years | 0 (0.0%) | 0 (0.0%) |
| 18 to 34 Years | 11 (14.5%) | 0 (0.0%) |
| 35 to 64 Years | 1 (9.1%) | 0 (0.0%) |
| 65 to 74 Years | 0 (0.0%) | 0 (0.0%) |
| 75 Years and over | 0 (0.0%) | 0 (0.0%) |
Disability Class: Cognitive Difficulty
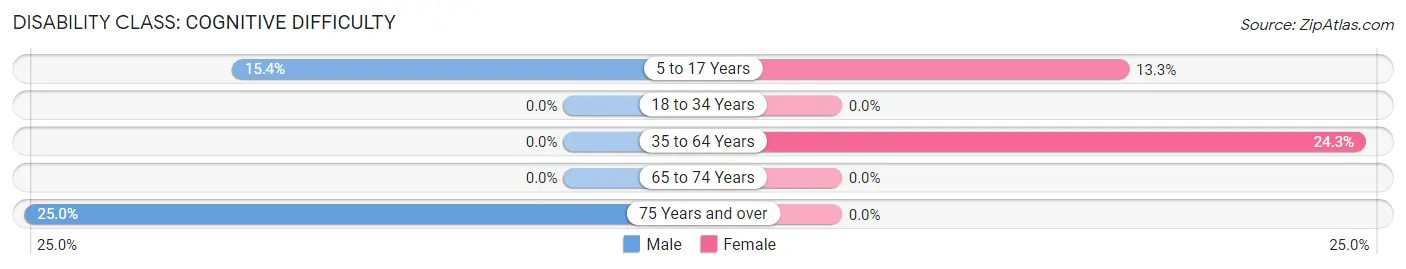
| Age Bracket | Male | Female |
| 5 to 17 Years | 2 (15.4%) | 4 (13.3%) |
| 18 to 34 Years | 0 (0.0%) | 0 (0.0%) |
| 35 to 64 Years | 0 (0.0%) | 9 (24.3%) |
| 65 to 74 Years | 0 (0.0%) | 0 (0.0%) |
| 75 Years and over | 1 (25.0%) | 0 (0.0%) |
Disability Class: Ambulatory Difficulty
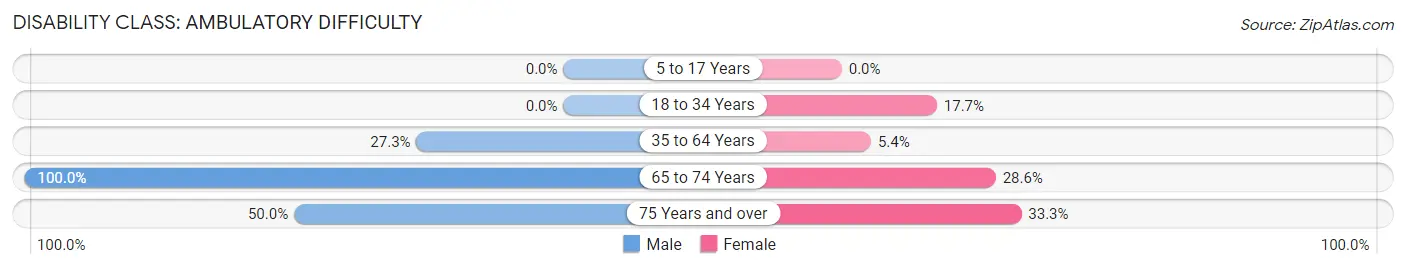
| Age Bracket | Male | Female |
| 5 to 17 Years | 0 (0.0%) | 0 (0.0%) |
| 18 to 34 Years | 0 (0.0%) | 3 (17.6%) |
| 35 to 64 Years | 3 (27.3%) | 2 (5.4%) |
| 65 to 74 Years | 1 (100.0%) | 2 (28.6%) |
| 75 Years and over | 2 (50.0%) | 1 (33.3%) |
Disability Class: Self-Care Difficulty
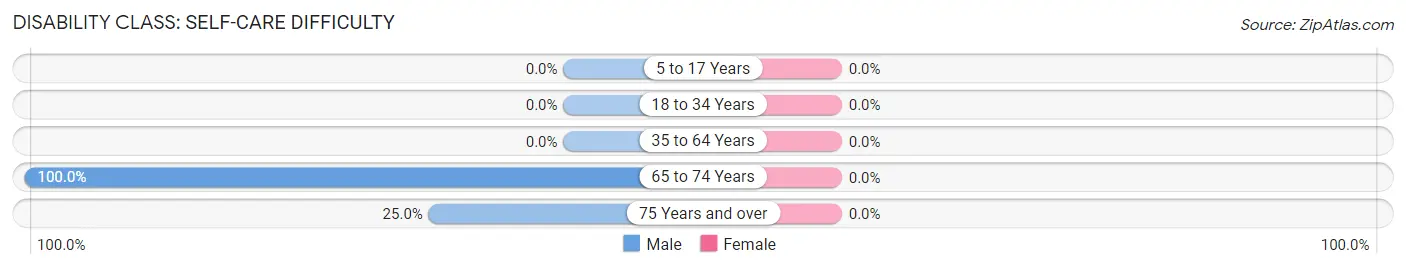
| Age Bracket | Male | Female |
| 5 to 17 Years | 0 (0.0%) | 0 (0.0%) |
| 18 to 34 Years | 0 (0.0%) | 0 (0.0%) |
| 35 to 64 Years | 0 (0.0%) | 0 (0.0%) |
| 65 to 74 Years | 1 (100.0%) | 0 (0.0%) |
| 75 Years and over | 1 (25.0%) | 0 (0.0%) |
Technology Access in Ben Lomond
Computing Device Access in Ben Lomond
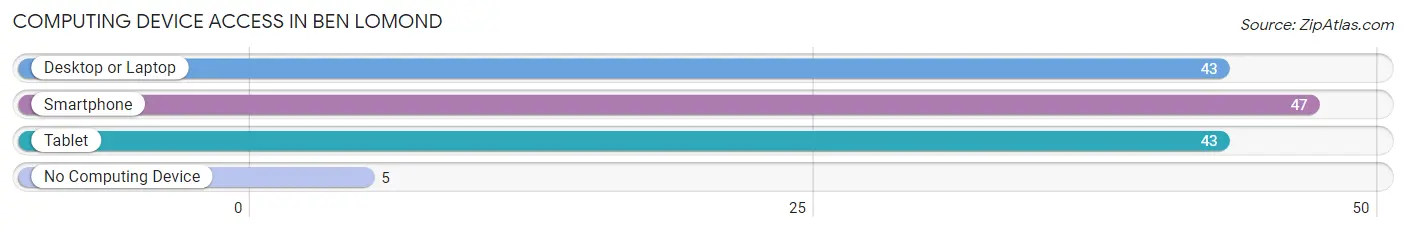
| Device Type | # Households | % Households |
| Desktop or Laptop | 43 | 81.1% |
| Smartphone | 47 | 88.7% |
| Tablet | 43 | 81.1% |
| No Computing Device | 5 | 9.4% |
| Total | 53 | 100.0% |
Internet Access in Ben Lomond
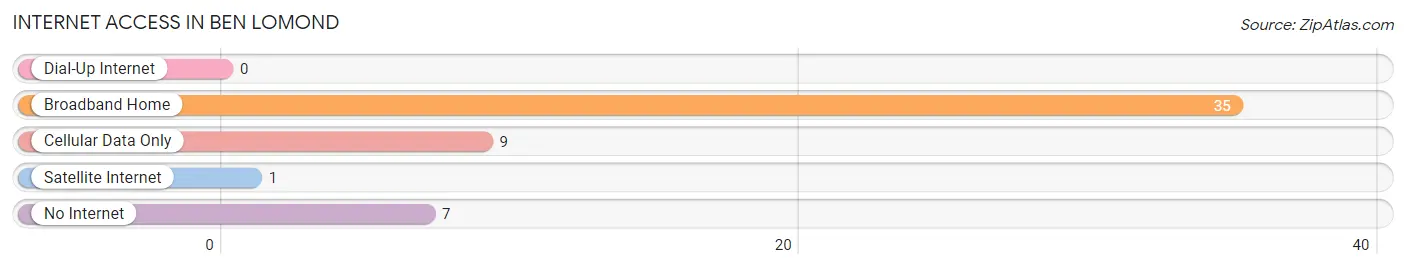
| Internet Type | # Households | % Households |
| Dial-Up Internet | 0 | 0.0% |
| Broadband Home | 35 | 66.0% |
| Cellular Data Only | 9 | 17.0% |
| Satellite Internet | 1 | 1.9% |
| No Internet | 7 | 13.2% |
| Total | 53 | 100.0% |
Ben Lomond Summary
Ben Lomond is a small unincorporated community located in the foothills of the Ouachita Mountains in the U.S. state of Arkansas. It is situated in the northern part of the state, in the county of Polk. The community is located approximately 20 miles south of Mena, the county seat, and is part of the Fort Smith metropolitan area.
History
Ben Lomond was first settled in the late 1800s by a group of settlers from the nearby town of Mena. The settlers were attracted to the area due to its abundance of natural resources, including timber and minerals. The town was named after the nearby Ben Lomond Mountain, which was named after the mountain of the same name in Scotland.
The town was officially established in 1891 and quickly grew to become a thriving community. The town was home to a variety of businesses, including a sawmill, a gristmill, a general store, and a post office. The town also had a school, a church, and a hotel.
In the early 1900s, the town began to decline due to the depletion of the local timber and mineral resources. The town's population began to decline as well, and by the mid-1900s, the town was nearly abandoned.
Geography
Ben Lomond is located in the northern part of the state, in the county of Polk. The town is situated in the foothills of the Ouachita Mountains, approximately 20 miles south of Mena, the county seat. The town is part of the Fort Smith metropolitan area.
The town is located at an elevation of 1,000 feet above sea level. The area is characterized by rolling hills and dense forests. The town is located near the Ouachita National Forest, which is home to a variety of wildlife, including deer, turkey, and black bear.
Economy
The economy of Ben Lomond is largely based on agriculture and forestry. The town is home to several farms, which produce a variety of crops, including corn, soybeans, and hay. The town is also home to several timber companies, which harvest timber from the nearby Ouachita National Forest.
The town is also home to several small businesses, including a general store, a post office, and a gas station. The town is also home to a variety of restaurants, including a pizza parlor and a Mexican restaurant.
Demographics
As of the 2010 census, the population of Ben Lomond was 1,072. The town is predominantly white, with a small minority population. The median household income in the town is $35,000, and the median home value is $90,000.
The town is served by the Mena School District, which includes two elementary schools, a middle school, and a high school. The town is also home to a branch of the University of Arkansas Community College at Morrilton.
Conclusion
Ben Lomond is a small unincorporated community located in the foothills of the Ouachita Mountains in the U.S. state of Arkansas. The town was first settled in the late 1800s and was home to a variety of businesses, including a sawmill, a gristmill, a general store, and a post office. The town's economy is largely based on agriculture and forestry, and the town is served by the Mena School District. As of the 2010 census, the population of Ben Lomond was 1,072.
Common Questions
What is Per Capita Income in Ben Lomond?
Per Capita income in Ben Lomond is $13,810.
What is the Median Family Income in Ben Lomond?
Median Family Income in Ben Lomond is $57,917.
What is the Median Household income in Ben Lomond?
Median Household Income in Ben Lomond is $46,250.
What is Inequality or Gini Index in Ben Lomond?
Inequality or Gini Index in Ben Lomond is 0.29.
What is the Total Population of Ben Lomond?
Total Population of Ben Lomond is 218.
What is the Total Male Population of Ben Lomond?
Total Male Population of Ben Lomond is 105.
What is the Total Female Population of Ben Lomond?
Total Female Population of Ben Lomond is 113.
What is the Ratio of Males per 100 Females in Ben Lomond?
There are 92.92 Males per 100 Females in Ben Lomond.
What is the Ratio of Females per 100 Males in Ben Lomond?
There are 107.62 Females per 100 Males in Ben Lomond.
What is the Median Population Age in Ben Lomond?
Median Population Age in Ben Lomond is 21.5 Years.
What is the Average Family Size in Ben Lomond
Average Family Size in Ben Lomond is 4.9 People.
What is the Average Household Size in Ben Lomond
Average Household Size in Ben Lomond is 4.1 People.
How Large is the Labor Force in Ben Lomond?
There are 86 People in the Labor Forcein in Ben Lomond.
What is the Percentage of People in the Labor Force in Ben Lomond?
52.8% of People are in the Labor Force in Ben Lomond.
What is the Unemployment Rate in Ben Lomond?
Unemployment Rate in Ben Lomond is 1.2%.