Beebe, AR Map & Demographics
Beebe Map
Beebe Overview
$27,111
PER CAPITA INCOME
$66,968
AVG FAMILY INCOME
$55,072
AVG HOUSEHOLD INCOME
46.0%
WAGE / INCOME GAP [ % ]
54.0¢/ $1
WAGE / INCOME GAP [ $ ]
0.44
INEQUALITY / GINI INDEX
8,447
TOTAL POPULATION
4,130
MALE POPULATION
4,317
FEMALE POPULATION
95.67
MALES / 100 FEMALES
104.53
FEMALES / 100 MALES
34.5
MEDIAN AGE
3.2
AVG FAMILY SIZE
2.7
AVG HOUSEHOLD SIZE
3,816
LABOR FORCE [ PEOPLE ]
60.1%
PERCENT IN LABOR FORCE
1.3%
UNEMPLOYMENT RATE
Beebe Zip Codes
Income in Beebe
Income Overview in Beebe
Per Capita Income in Beebe is $27,111, while median incomes of families and households are $66,968 and $55,072 respectively.
| Characteristic | Number | Measure |
| Per Capita Income | 8,447 | $27,111 |
| Median Family Income | 2,209 | $66,968 |
| Mean Family Income | 2,209 | $82,972 |
| Median Household Income | 3,043 | $55,072 |
| Mean Household Income | 3,043 | $73,854 |
| Income Deficit | 2,209 | $0 |
| Wage / Income Gap (%) | 8,447 | 45.96% |
| Wage / Income Gap ($) | 8,447 | 54.04¢ per $1 |
| Gini / Inequality Index | 8,447 | 0.44 |
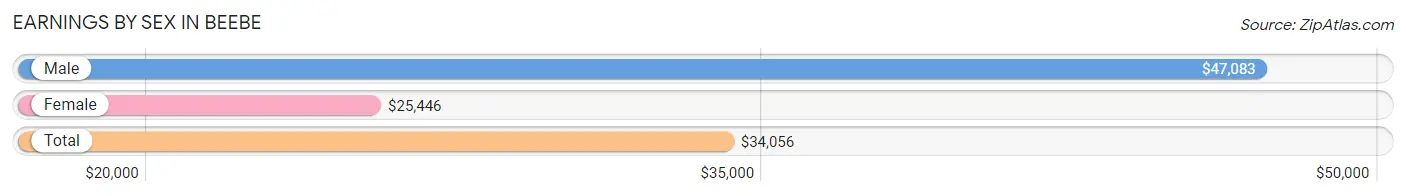
Earnings by Sex in Beebe
Average Earnings in Beebe are $34,056, $47,083 for men and $25,446 for women, a difference of 46.0%.
| Sex | Number | Average Earnings |
| Male | 2,108 (53.5%) | $47,083 |
| Female | 1,831 (46.5%) | $25,446 |
| Total | 3,939 (100.0%) | $34,056 |
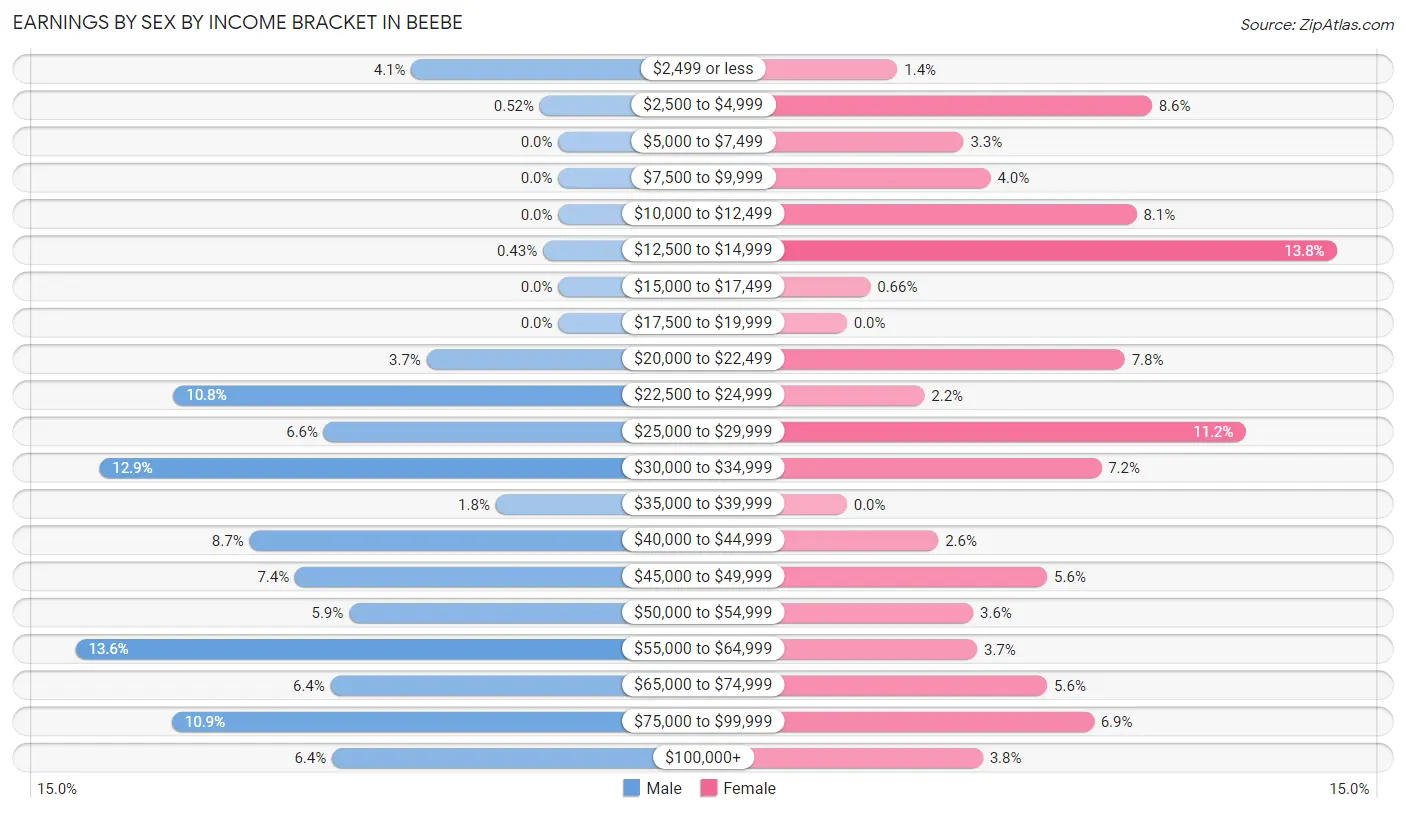
Earnings by Sex by Income Bracket in Beebe
The most common earnings brackets in Beebe are $55,000 to $64,999 for men (286 | 13.6%) and $12,500 to $14,999 for women (252 | 13.8%).
| Income | Male | Female |
| $2,499 or less | 87 (4.1%) | 26 (1.4%) |
| $2,500 to $4,999 | 11 (0.5%) | 157 (8.6%) |
| $5,000 to $7,499 | 0 (0.0%) | 60 (3.3%) |
| $7,500 to $9,999 | 0 (0.0%) | 74 (4.0%) |
| $10,000 to $12,499 | 0 (0.0%) | 149 (8.1%) |
| $12,500 to $14,999 | 9 (0.4%) | 252 (13.8%) |
| $15,000 to $17,499 | 0 (0.0%) | 12 (0.7%) |
| $17,500 to $19,999 | 0 (0.0%) | 0 (0.0%) |
| $20,000 to $22,499 | 78 (3.7%) | 143 (7.8%) |
| $22,500 to $24,999 | 228 (10.8%) | 40 (2.2%) |
| $25,000 to $29,999 | 139 (6.6%) | 205 (11.2%) |
| $30,000 to $34,999 | 272 (12.9%) | 131 (7.1%) |
| $35,000 to $39,999 | 37 (1.8%) | 0 (0.0%) |
| $40,000 to $44,999 | 183 (8.7%) | 47 (2.6%) |
| $45,000 to $49,999 | 156 (7.4%) | 103 (5.6%) |
| $50,000 to $54,999 | 124 (5.9%) | 65 (3.5%) |
| $55,000 to $64,999 | 286 (13.6%) | 67 (3.7%) |
| $65,000 to $74,999 | 135 (6.4%) | 103 (5.6%) |
| $75,000 to $99,999 | 229 (10.9%) | 127 (6.9%) |
| $100,000+ | 134 (6.4%) | 70 (3.8%) |
| Total | 2,108 (100.0%) | 1,831 (100.0%) |
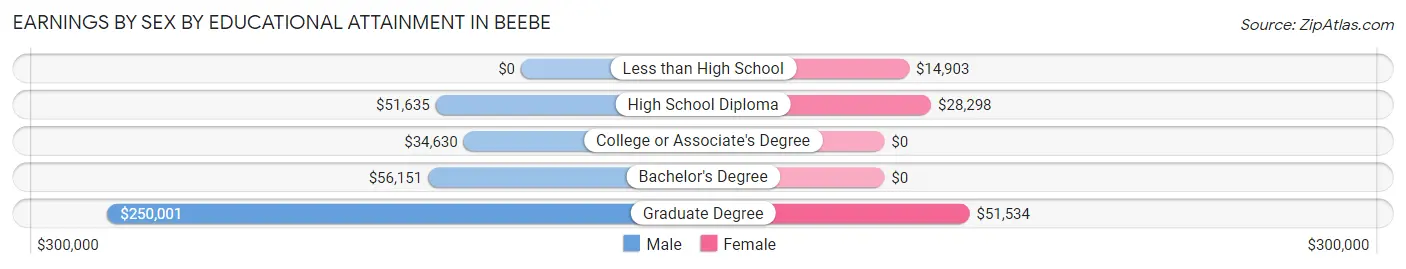
Earnings by Sex by Educational Attainment in Beebe
Average earnings in Beebe are $50,060 for men and $29,169 for women, a difference of 41.7%. Men with an educational attainment of graduate degree enjoy the highest average annual earnings of $250,001, while those with college or associate's degree education earn the least with $34,630. Women with an educational attainment of graduate degree earn the most with the average annual earnings of $51,534, while those with less than high school education have the smallest earnings of $14,903.
| Educational Attainment | Male Income | Female Income |
| Less than High School | - | - |
| High School Diploma | $51,635 | $28,298 |
| College or Associate's Degree | $34,630 | $0 |
| Bachelor's Degree | $56,151 | $0 |
| Graduate Degree | $250,001 | $51,534 |
| Total | $50,060 | $29,169 |
Family Income in Beebe
Family Income Brackets in Beebe
According to the Beebe family income data, there are 630 families falling into the $75,000 to $99,999 income range, which is the most common income bracket and makes up 28.5% of all families.
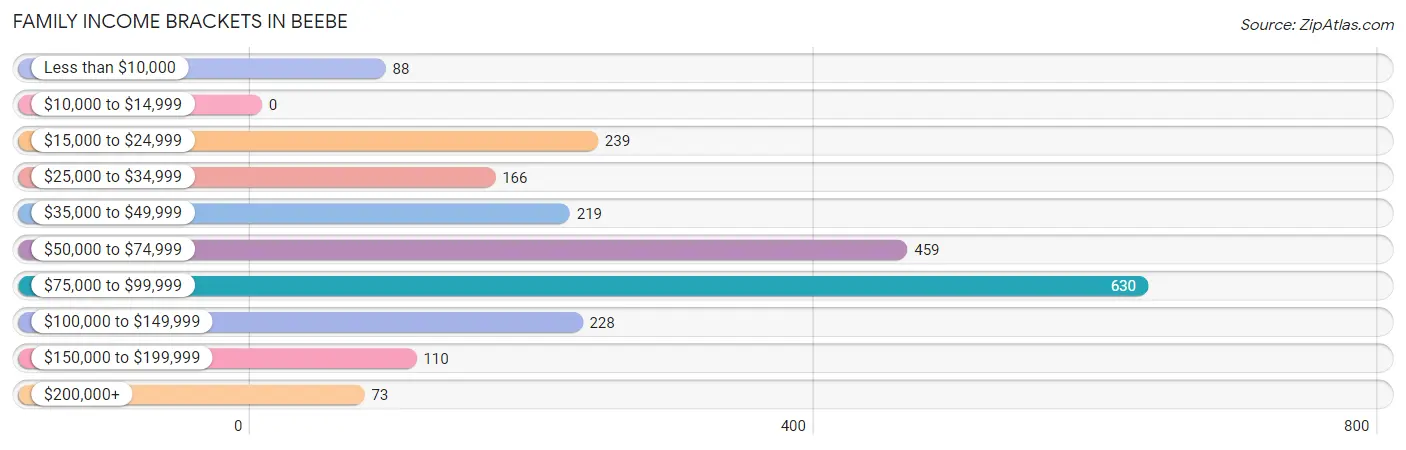
| Income Bracket | # Families | % Families |
| Less than $10,000 | 88 | 4.0% |
| $10,000 to $14,999 | 0 | 0.0% |
| $15,000 to $24,999 | 239 | 10.8% |
| $25,000 to $34,999 | 166 | 7.5% |
| $35,000 to $49,999 | 219 | 9.9% |
| $50,000 to $74,999 | 459 | 20.8% |
| $75,000 to $99,999 | 630 | 28.5% |
| $100,000 to $149,999 | 228 | 10.3% |
| $150,000 to $199,999 | 110 | 5.0% |
| $200,000+ | 73 | 3.3% |
Family Income by Famaliy Size in Beebe
4-person families (569 | 25.8%) account for the highest median family income in Beebe with $94,826 per family, while 2-person families (955 | 43.2%) have the highest median income of $26,338 per family member.
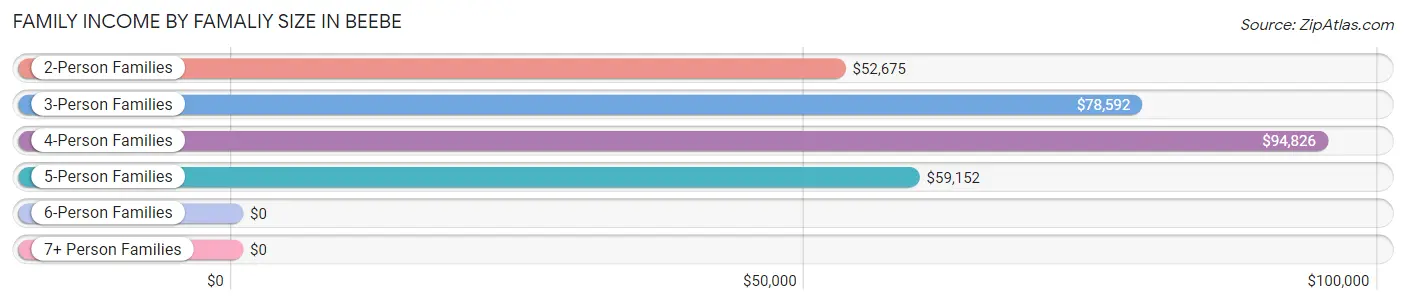
| Income Bracket | # Families | Median Income |
| 2-Person Families | 955 (43.2%) | $52,675 |
| 3-Person Families | 380 (17.2%) | $78,592 |
| 4-Person Families | 569 (25.8%) | $94,826 |
| 5-Person Families | 233 (10.5%) | $59,152 |
| 6-Person Families | 32 (1.5%) | $0 |
| 7+ Person Families | 40 (1.8%) | $0 |
| Total | 2,209 (100.0%) | $66,968 |
Family Income by Number of Earners in Beebe
The median family income in Beebe is $66,968, with families comprising 3+ earners (161) having the highest median family income of $94,363, while families with no earners (297) have the lowest median family income of $33,661, accounting for 7.3% and 13.4% of families, respectively.
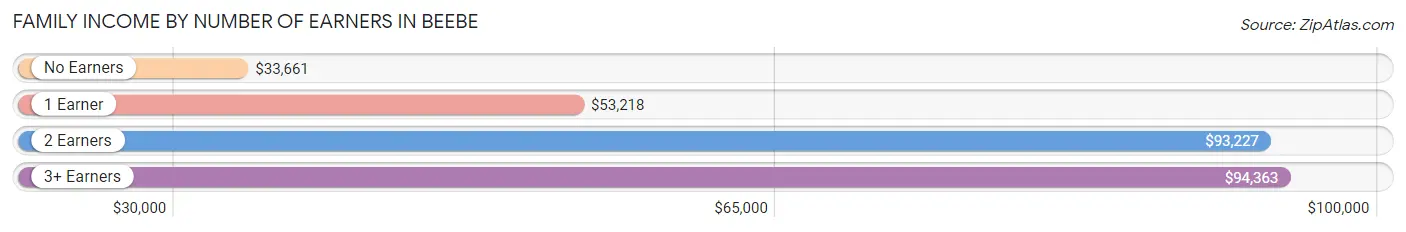
| Number of Earners | # Families | Median Income |
| No Earners | 297 (13.4%) | $33,661 |
| 1 Earner | 879 (39.8%) | $53,218 |
| 2 Earners | 872 (39.5%) | $93,227 |
| 3+ Earners | 161 (7.3%) | $94,363 |
| Total | 2,209 (100.0%) | $66,968 |
Household Income in Beebe
Household Income Brackets in Beebe
With 621 households falling in the category, the $75,000 to $99,999 income range is the most frequent in Beebe, accounting for 20.4% of all households. In contrast, only 103 households (3.4%) fall into the $200,000+ income bracket, making it the least populous group.
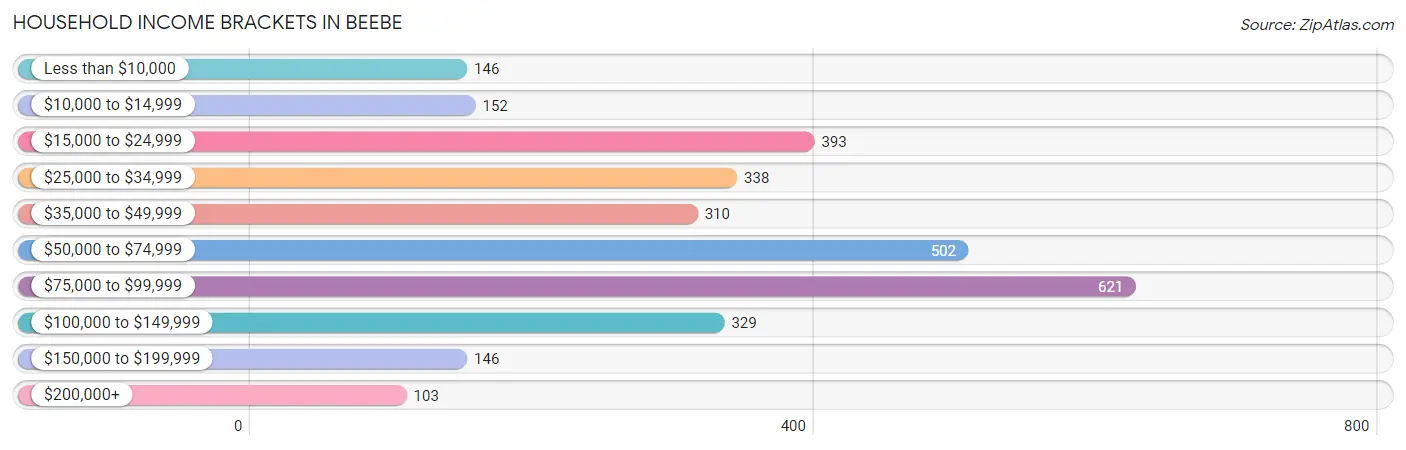
| Income Bracket | # Households | % Households |
| Less than $10,000 | 146 | 4.8% |
| $10,000 to $14,999 | 152 | 5.0% |
| $15,000 to $24,999 | 393 | 12.9% |
| $25,000 to $34,999 | 338 | 11.1% |
| $35,000 to $49,999 | 310 | 10.2% |
| $50,000 to $74,999 | 502 | 16.5% |
| $75,000 to $99,999 | 621 | 20.4% |
| $100,000 to $149,999 | 329 | 10.8% |
| $150,000 to $199,999 | 146 | 4.8% |
| $200,000+ | 103 | 3.4% |
Household Income by Householder Age in Beebe
The median household income in Beebe is $55,072, with the highest median household income of $75,791 found in the 25 to 44 years age bracket for the primary householder. A total of 1,505 households (49.5%) fall into this category. Meanwhile, the 15 to 24 years age bracket for the primary householder has the lowest median household income of $33,735, with 125 households (4.1%) in this group.
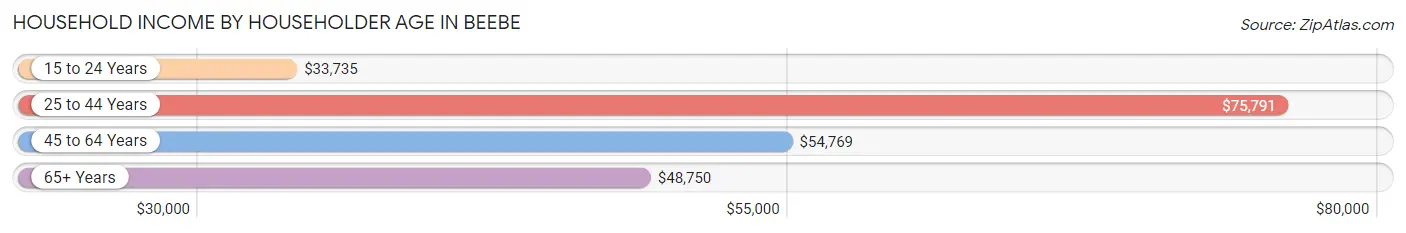
| Income Bracket | # Households | Median Income |
| 15 to 24 Years | 125 (4.1%) | $33,735 |
| 25 to 44 Years | 1,505 (49.5%) | $75,791 |
| 45 to 64 Years | 818 (26.9%) | $54,769 |
| 65+ Years | 595 (19.6%) | $48,750 |
| Total | 3,043 (100.0%) | $55,072 |
Poverty in Beebe
Income Below Poverty by Sex and Age in Beebe
With 8.8% poverty level for males and 15.4% for females among the residents of Beebe, 18 to 24 year old males and 18 to 24 year old females are the most vulnerable to poverty, with 109 males (32.7%) and 91 females (31.2%) in their respective age groups living below the poverty level.
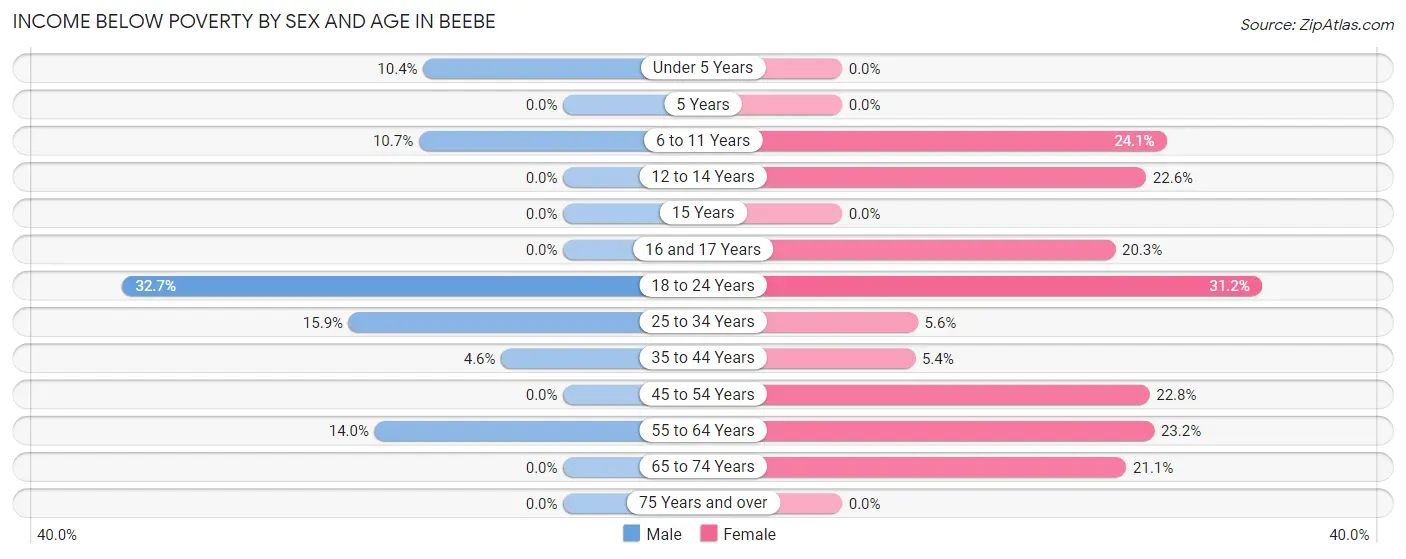
| Age Bracket | Male | Female |
| Under 5 Years | 48 (10.4%) | 0 (0.0%) |
| 5 Years | 0 (0.0%) | 0 (0.0%) |
| 6 to 11 Years | 40 (10.7%) | 87 (24.1%) |
| 12 to 14 Years | 0 (0.0%) | 84 (22.6%) |
| 15 Years | 0 (0.0%) | 0 (0.0%) |
| 16 and 17 Years | 0 (0.0%) | 42 (20.3%) |
| 18 to 24 Years | 109 (32.7%) | 91 (31.2%) |
| 25 to 34 Years | 78 (15.9%) | 38 (5.6%) |
| 35 to 44 Years | 41 (4.6%) | 40 (5.4%) |
| 45 to 54 Years | 0 (0.0%) | 100 (22.8%) |
| 55 to 64 Years | 49 (14.0%) | 70 (23.2%) |
| 65 to 74 Years | 0 (0.0%) | 95 (21.1%) |
| 75 Years and over | 0 (0.0%) | 0 (0.0%) |
| Total | 365 (8.8%) | 647 (15.4%) |
Income Above Poverty by Sex and Age in Beebe
According to the poverty statistics in Beebe, males aged 12 to 14 years and females aged under 5 years are the age groups that are most secure financially, with 100.0% of males and 100.0% of females in these age groups living above the poverty line.
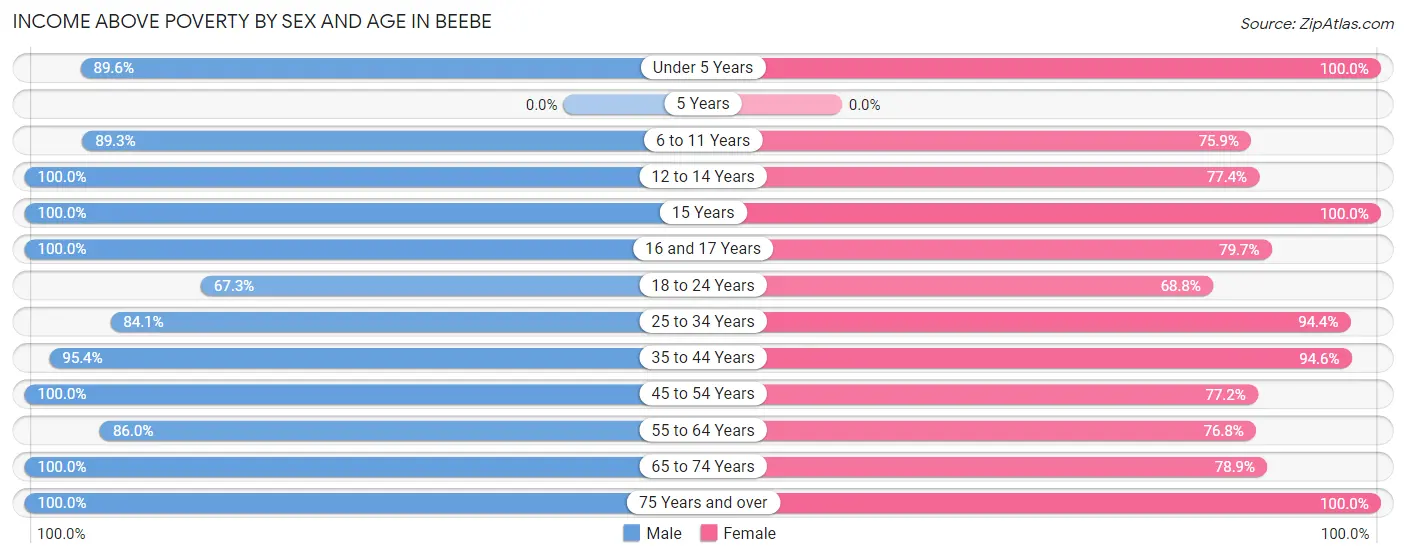
| Age Bracket | Male | Female |
| Under 5 Years | 414 (89.6%) | 177 (100.0%) |
| 5 Years | 0 (0.0%) | 0 (0.0%) |
| 6 to 11 Years | 333 (89.3%) | 274 (75.9%) |
| 12 to 14 Years | 183 (100.0%) | 288 (77.4%) |
| 15 Years | 122 (100.0%) | 47 (100.0%) |
| 16 and 17 Years | 78 (100.0%) | 165 (79.7%) |
| 18 to 24 Years | 224 (67.3%) | 201 (68.8%) |
| 25 to 34 Years | 412 (84.1%) | 637 (94.4%) |
| 35 to 44 Years | 851 (95.4%) | 697 (94.6%) |
| 45 to 54 Years | 454 (100.0%) | 338 (77.2%) |
| 55 to 64 Years | 301 (86.0%) | 232 (76.8%) |
| 65 to 74 Years | 300 (100.0%) | 355 (78.9%) |
| 75 Years and over | 93 (100.0%) | 132 (100.0%) |
| Total | 3,765 (91.2%) | 3,543 (84.6%) |
Income Below Poverty Among Married-Couple Families in Beebe
The poverty statistics for married-couple families in Beebe show that 2.2% or 32 of the total 1,460 families live below the poverty line. Families with no children have the highest poverty rate of 5.2%, comprising of 32 families. On the other hand, families with 1 or 2 children have the lowest poverty rate of 0.0%, which includes 0 families.
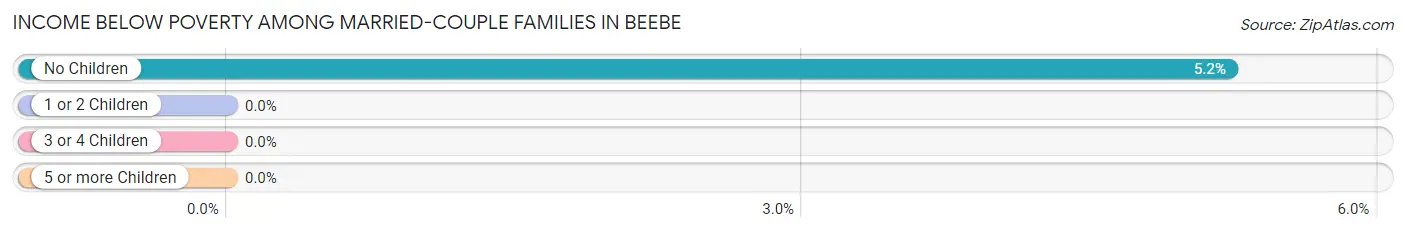
| Children | Above Poverty | Below Poverty |
| No Children | 581 (94.8%) | 32 (5.2%) |
| 1 or 2 Children | 612 (100.0%) | 0 (0.0%) |
| 3 or 4 Children | 195 (100.0%) | 0 (0.0%) |
| 5 or more Children | 40 (100.0%) | 0 (0.0%) |
| Total | 1,428 (97.8%) | 32 (2.2%) |
Income Below Poverty Among Single-Parent Households in Beebe
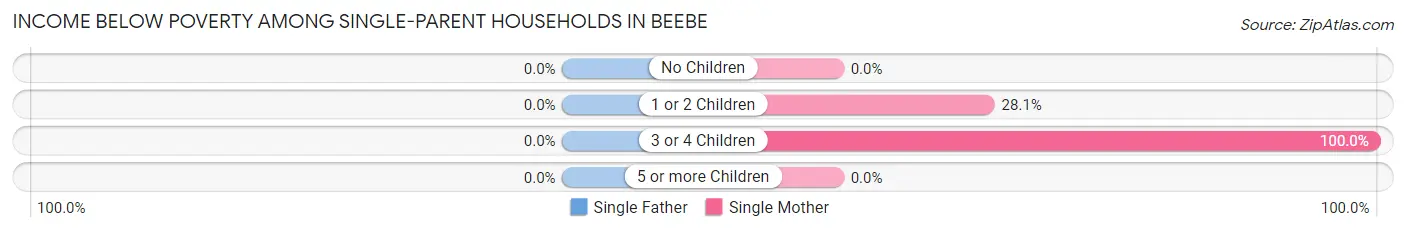
| Children | Single Father | Single Mother |
| No Children | 0 (0.0%) | 0 (0.0%) |
| 1 or 2 Children | 0 (0.0%) | 63 (28.1%) |
| 3 or 4 Children | 0 (0.0%) | 78 (100.0%) |
| 5 or more Children | 0 (0.0%) | 0 (0.0%) |
| Total | 0 (0.0%) | 141 (29.6%) |
Income Below Poverty Among Married-Couple vs Single-Parent Households in Beebe
The poverty data for Beebe shows that 32 of the married-couple family households (2.2%) and 141 of the single-parent households (18.8%) are living below the poverty level. Within the married-couple family households, those with no children have the highest poverty rate, with 32 households (5.2%) falling below the poverty line. Among the single-parent households, those with 3 or 4 children have the highest poverty rate, with 78 household (100.0%) living below poverty.
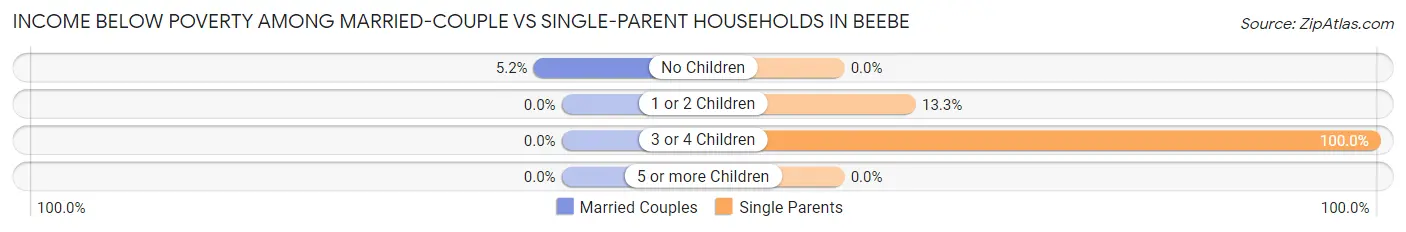
| Children | Married-Couple Families | Single-Parent Households |
| No Children | 32 (5.2%) | 0 (0.0%) |
| 1 or 2 Children | 0 (0.0%) | 63 (13.3%) |
| 3 or 4 Children | 0 (0.0%) | 78 (100.0%) |
| 5 or more Children | 0 (0.0%) | 0 (0.0%) |
| Total | 32 (2.2%) | 141 (18.8%) |
Race in Beebe
The most populous races in Beebe are White / Caucasian (7,862 | 93.1%), Two or more Races (389 | 4.6%), and Hispanic or Latino (257 | 3.0%).
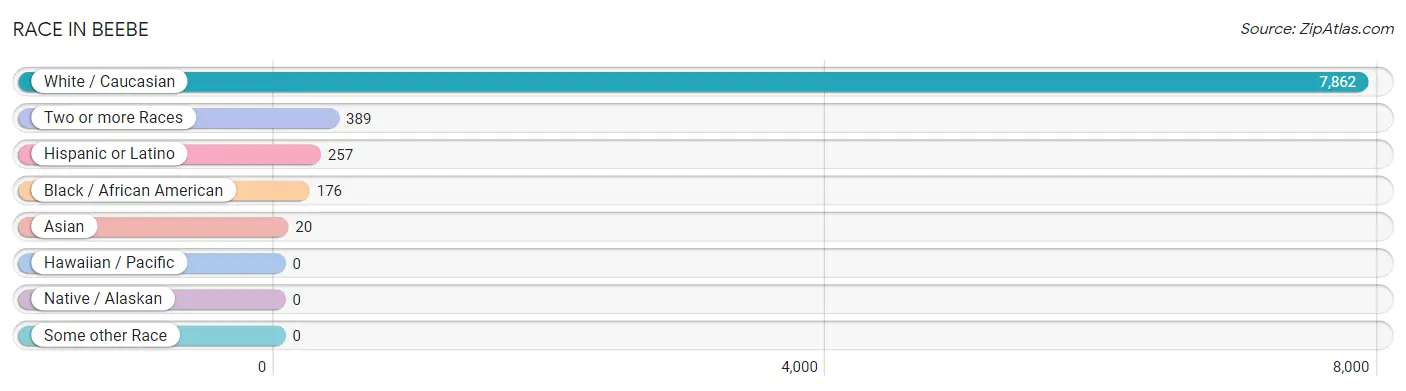
| Race | # Population | % Population |
| Asian | 20 | 0.2% |
| Black / African American | 176 | 2.1% |
| Hawaiian / Pacific | 0 | 0.0% |
| Hispanic or Latino | 257 | 3.0% |
| Native / Alaskan | 0 | 0.0% |
| White / Caucasian | 7,862 | 93.1% |
| Two or more Races | 389 | 4.6% |
| Some other Race | 0 | 0.0% |
| Total | 8,447 | 100.0% |
Ancestry in Beebe
The most populous ancestries reported in Beebe are American (1,158 | 13.7%), Irish (873 | 10.3%), English (657 | 7.8%), German (416 | 4.9%), and French (352 | 4.2%), together accounting for 40.9% of all Beebe residents.
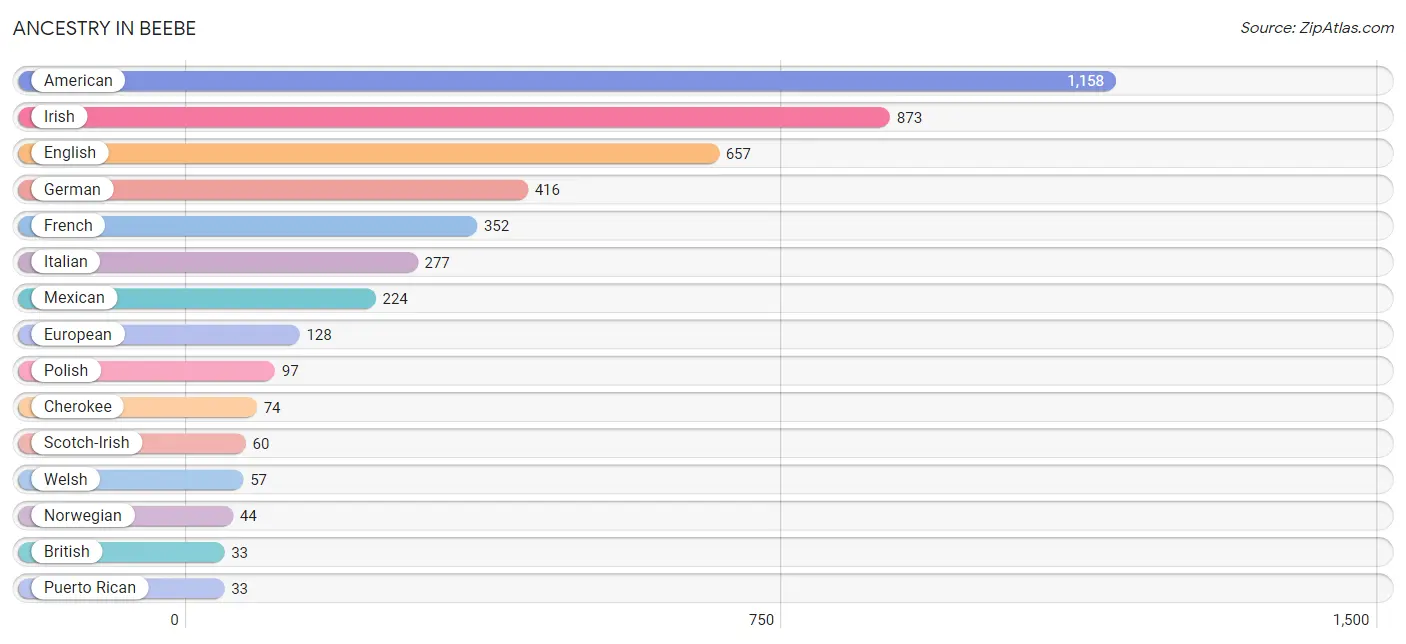
| Ancestry | # Population | % Population |
| American | 1,158 | 13.7% |
| Bhutanese | 20 | 0.2% |
| British | 33 | 0.4% |
| Cherokee | 74 | 0.9% |
| Danish | 22 | 0.3% |
| English | 657 | 7.8% |
| European | 128 | 1.5% |
| French | 352 | 4.2% |
| French Canadian | 25 | 0.3% |
| German | 416 | 4.9% |
| Irish | 873 | 10.3% |
| Israeli | 17 | 0.2% |
| Italian | 277 | 3.3% |
| Mexican | 224 | 2.6% |
| Norwegian | 44 | 0.5% |
| Polish | 97 | 1.1% |
| Puerto Rican | 33 | 0.4% |
| Scotch-Irish | 60 | 0.7% |
| Scottish | 18 | 0.2% |
| Swedish | 32 | 0.4% |
| Welsh | 57 | 0.7% | View All 21 Rows |
Immigrants in Beebe
The most numerous immigrant groups reported in Beebe came from Central America (106 | 1.3%), Latin America (106 | 1.3%), Mexico (106 | 1.3%), Asia (8 | 0.1%), and Eastern Asia (8 | 0.1%), together accounting for 3.9% of all Beebe residents.
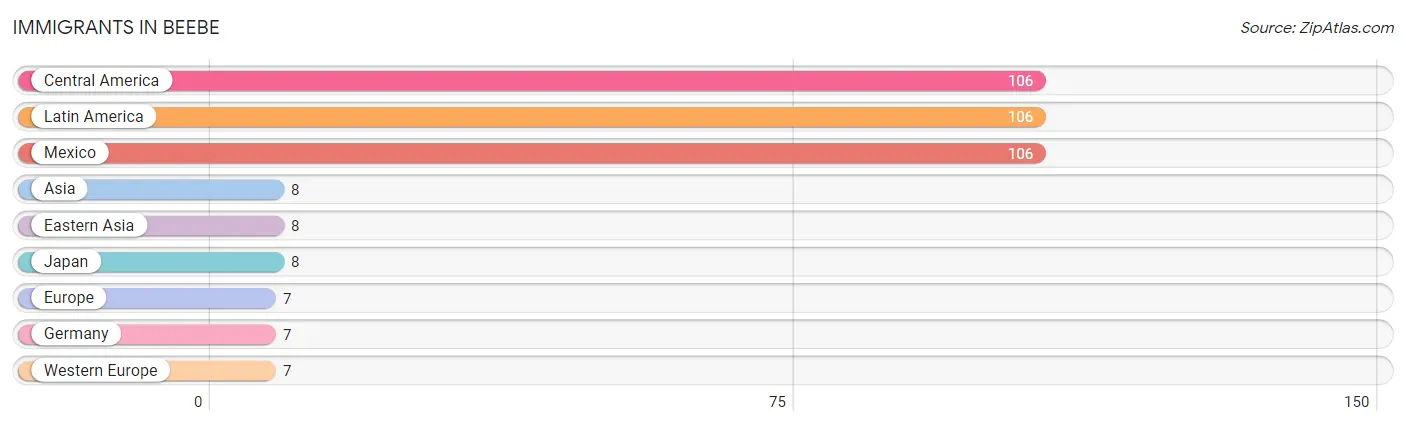
| Immigration Origin | # Population | % Population |
| Asia | 8 | 0.1% |
| Central America | 106 | 1.3% |
| Eastern Asia | 8 | 0.1% |
| Europe | 7 | 0.1% |
| Germany | 7 | 0.1% |
| Japan | 8 | 0.1% |
| Latin America | 106 | 1.3% |
| Mexico | 106 | 1.3% |
| Western Europe | 7 | 0.1% | View All 9 Rows |
Sex and Age in Beebe
Sex and Age in Beebe
The most populous age groups in Beebe are 40 to 44 Years (503 | 12.2%) for men and 10 to 14 Years (541 | 12.5%) for women.
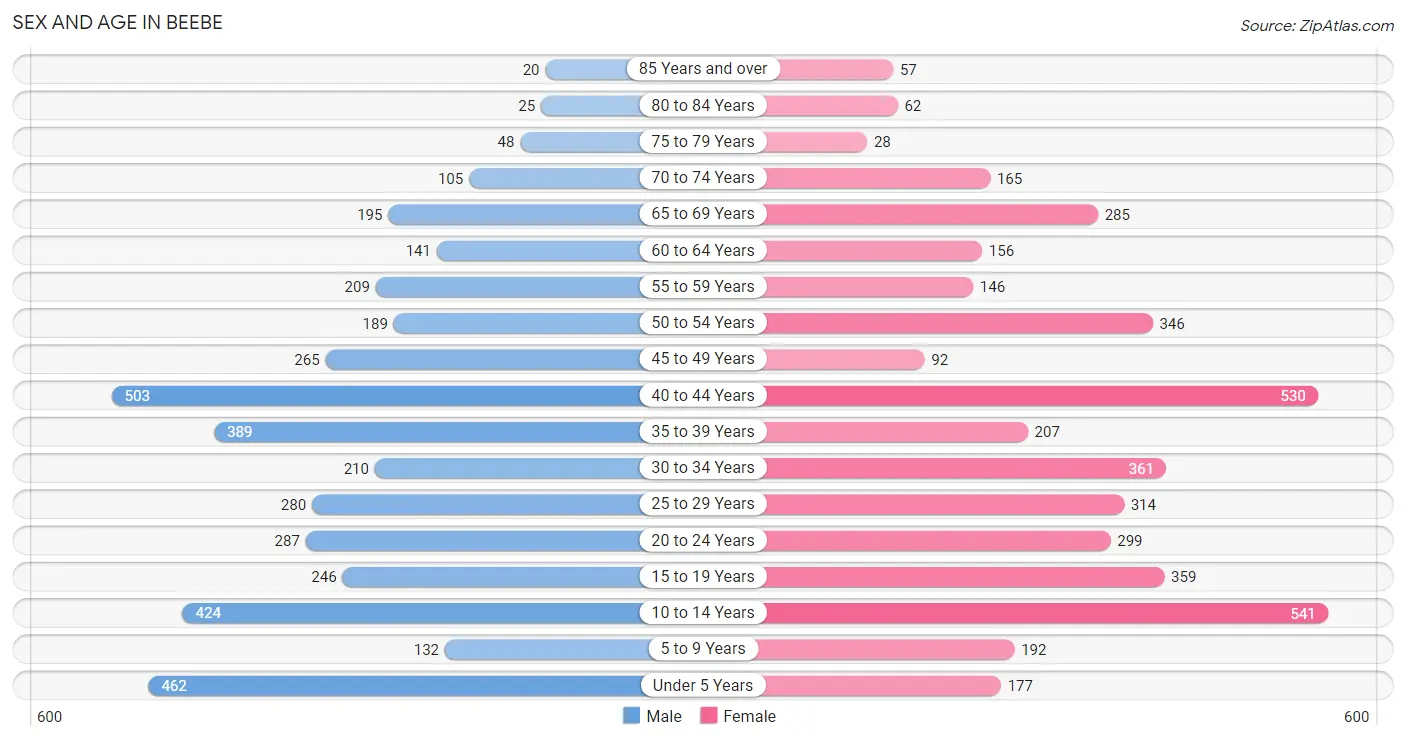
| Age Bracket | Male | Female |
| Under 5 Years | 462 (11.2%) | 177 (4.1%) |
| 5 to 9 Years | 132 (3.2%) | 192 (4.4%) |
| 10 to 14 Years | 424 (10.3%) | 541 (12.5%) |
| 15 to 19 Years | 246 (6.0%) | 359 (8.3%) |
| 20 to 24 Years | 287 (7.0%) | 299 (6.9%) |
| 25 to 29 Years | 280 (6.8%) | 314 (7.3%) |
| 30 to 34 Years | 210 (5.1%) | 361 (8.4%) |
| 35 to 39 Years | 389 (9.4%) | 207 (4.8%) |
| 40 to 44 Years | 503 (12.2%) | 530 (12.3%) |
| 45 to 49 Years | 265 (6.4%) | 92 (2.1%) |
| 50 to 54 Years | 189 (4.6%) | 346 (8.0%) |
| 55 to 59 Years | 209 (5.1%) | 146 (3.4%) |
| 60 to 64 Years | 141 (3.4%) | 156 (3.6%) |
| 65 to 69 Years | 195 (4.7%) | 285 (6.6%) |
| 70 to 74 Years | 105 (2.5%) | 165 (3.8%) |
| 75 to 79 Years | 48 (1.2%) | 28 (0.6%) |
| 80 to 84 Years | 25 (0.6%) | 62 (1.4%) |
| 85 Years and over | 20 (0.5%) | 57 (1.3%) |
| Total | 4,130 (100.0%) | 4,317 (100.0%) |
Families and Households in Beebe
Median Family Size in Beebe
The median family size in Beebe is 3.18 persons per family, with married-couple families (1,460 | 66.1%) accounting for the largest median family size of 3.35 persons per family. On the other hand, single female/mother families (477 | 21.6%) represent the smallest median family size with 2.63 persons per family.
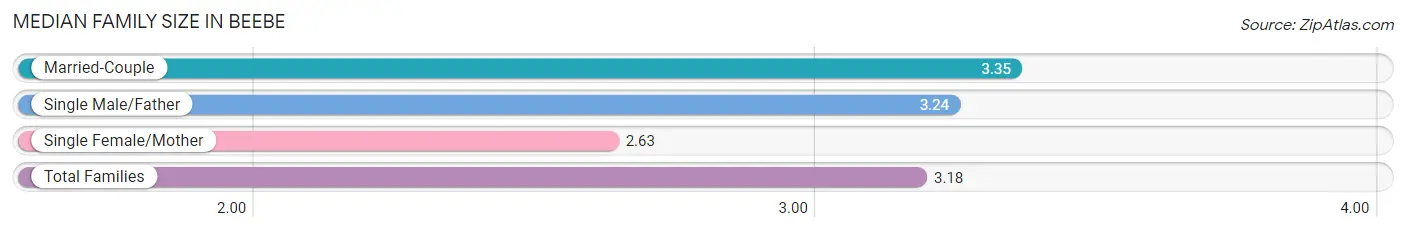
| Family Type | # Families | Family Size |
| Married-Couple | 1,460 (66.1%) | 3.35 |
| Single Male/Father | 272 (12.3%) | 3.24 |
| Single Female/Mother | 477 (21.6%) | 2.63 |
| Total Families | 2,209 (100.0%) | 3.18 |
Median Household Size in Beebe
The median household size in Beebe is 2.73 persons per household, with married-couple households (1,460 | 48.0%) accounting for the largest median household size of 3.35 persons per household. non-family households (834 | 27.4%) represent the smallest median household size with 1.19 persons per household.
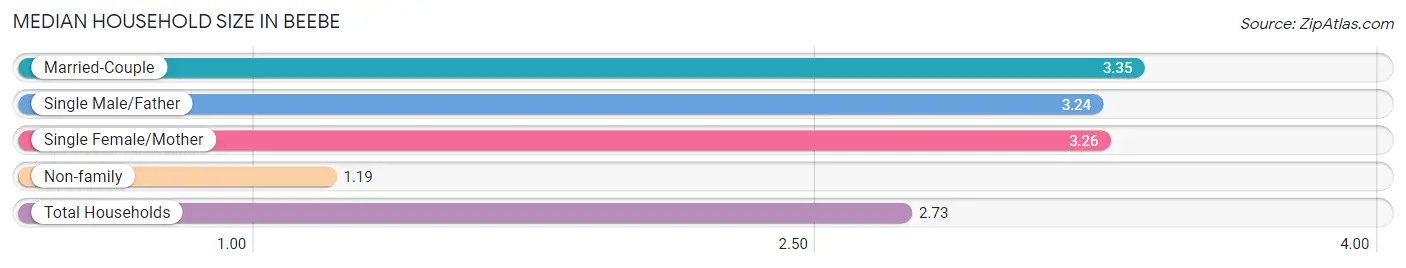
| Household Type | # Households | Household Size |
| Married-Couple | 1,460 (48.0%) | 3.35 |
| Single Male/Father | 272 (8.9%) | 3.24 |
| Single Female/Mother | 477 (15.7%) | 3.26 |
| Non-family | 834 (27.4%) | 1.19 |
| Total Households | 3,043 (100.0%) | 2.73 |
Household Size by Marriage Status in Beebe
Out of a total of 3,043 households in Beebe, 2,209 (72.6%) are family households, while 834 (27.4%) are nonfamily households. The most numerous type of family households are 2-person households, comprising 891, and the most common type of nonfamily households are 1-person households, comprising 719.
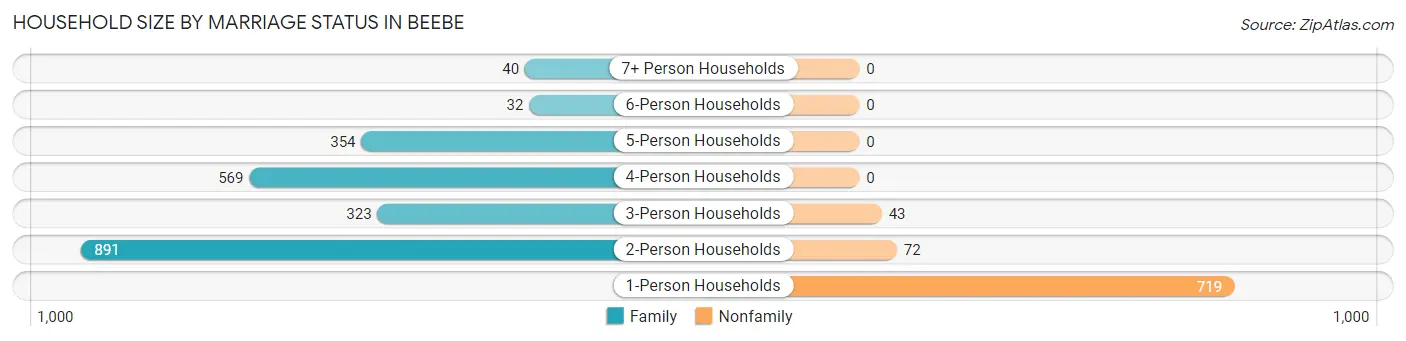
| Household Size | Family Households | Nonfamily Households |
| 1-Person Households | - | 719 (23.6%) |
| 2-Person Households | 891 (29.3%) | 72 (2.4%) |
| 3-Person Households | 323 (10.6%) | 43 (1.4%) |
| 4-Person Households | 569 (18.7%) | 0 (0.0%) |
| 5-Person Households | 354 (11.6%) | 0 (0.0%) |
| 6-Person Households | 32 (1.1%) | 0 (0.0%) |
| 7+ Person Households | 40 (1.3%) | 0 (0.0%) |
| Total | 2,209 (72.6%) | 834 (27.4%) |
Female Fertility in Beebe
Fertility by Age in Beebe
Average fertility rate in Beebe is 13.0 births per 1,000 women. Women in the age bracket of 20 to 34 years have the highest fertility rate with 29.0 births per 1,000 women. Women in the age bracket of 20 to 34 years acount for 100.0% of all women with births.
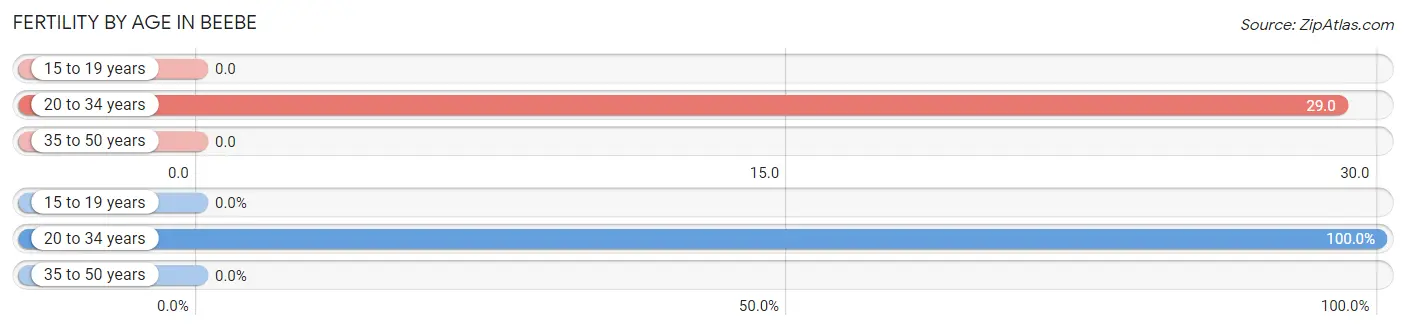
| Age Bracket | Women with Births | Births / 1,000 Women |
| 15 to 19 years | 0 (0.0%) | 0.0 |
| 20 to 34 years | 28 (100.0%) | 29.0 |
| 35 to 50 years | 0 (0.0%) | 0.0 |
| Total | 28 (100.0%) | 13.0 |
Fertility by Age by Marriage Status in Beebe
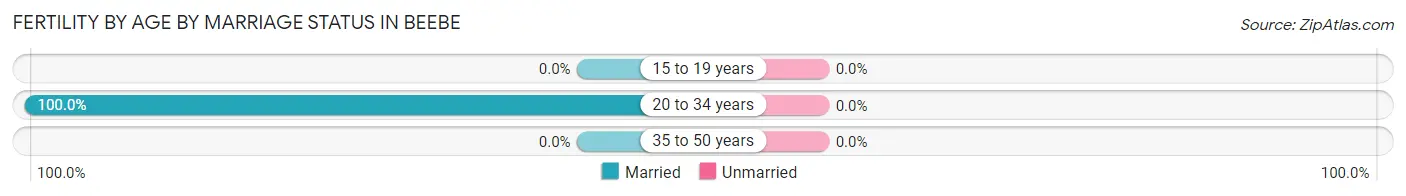
| Age Bracket | Married | Unmarried |
| 15 to 19 years | 0 (0.0%) | 0 (0.0%) |
| 20 to 34 years | 28 (100.0%) | 0 (0.0%) |
| 35 to 50 years | 0 (0.0%) | 0 (0.0%) |
| Total | 28 (100.0%) | 0 (0.0%) |
Fertility by Education in Beebe
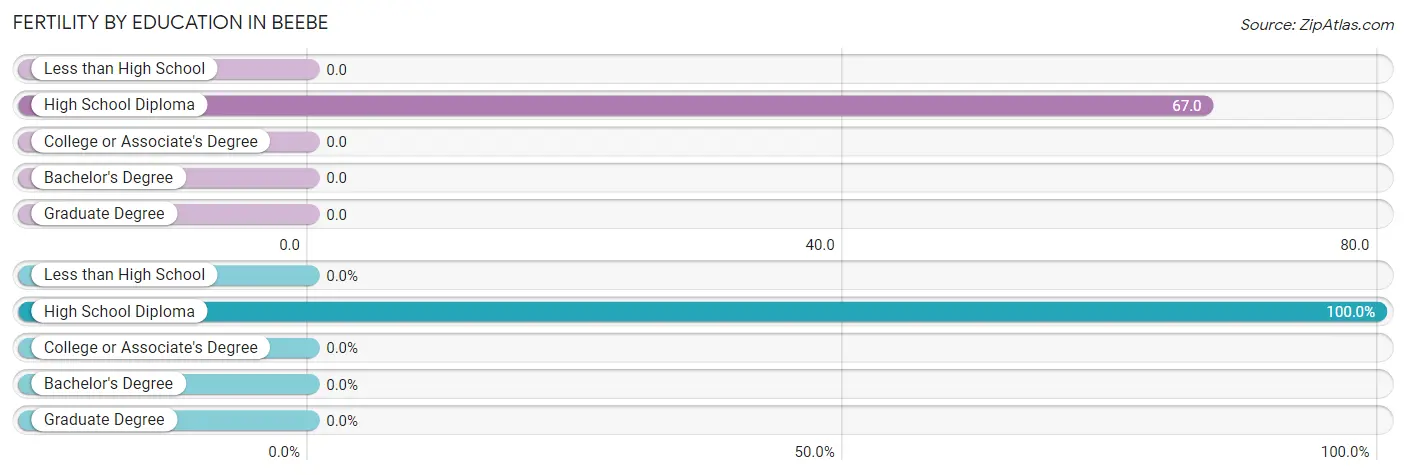
| Educational Attainment | Women with Births | Births / 1,000 Women |
| Less than High School | 0 (0.0%) | 0.0 |
| High School Diploma | 28 (100.0%) | 67.0 |
| College or Associate's Degree | 0 (0.0%) | 0.0 |
| Bachelor's Degree | 0 (0.0%) | 0.0 |
| Graduate Degree | 0 (0.0%) | 0.0 |
| Total | 28 (100.0%) | 13.0 |
Fertility by Education by Marriage Status in Beebe
| Educational Attainment | Married | Unmarried |
| Less than High School | 0 (0.0%) | 0 (0.0%) |
| High School Diploma | 28 (100.0%) | 0 (0.0%) |
| College or Associate's Degree | 0 (0.0%) | 0 (0.0%) |
| Bachelor's Degree | 0 (0.0%) | 0 (0.0%) |
| Graduate Degree | 0 (0.0%) | 0 (0.0%) |
| Total | 28 (100.0%) | 0 (0.0%) |
Employment Characteristics in Beebe
Employment by Class of Employer in Beebe
Among the 3,767 employed individuals in Beebe, private company employees (2,677 | 71.1%), self-employed (not incorporated) (328 | 8.7%), and not-for-profit organizations (199 | 5.3%) make up the most common classes of employment.
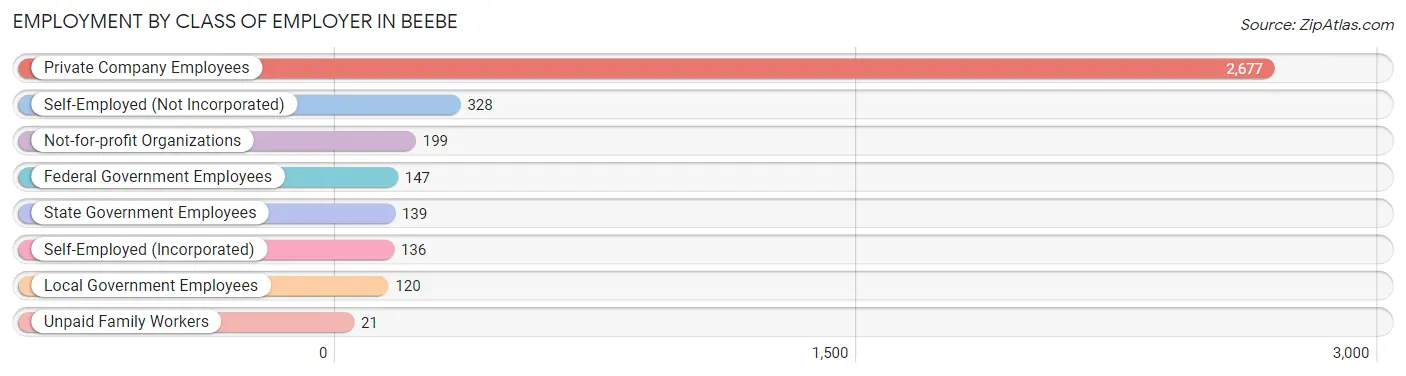
| Employer Class | # Employees | % Employees |
| Private Company Employees | 2,677 | 71.1% |
| Self-Employed (Incorporated) | 136 | 3.6% |
| Self-Employed (Not Incorporated) | 328 | 8.7% |
| Not-for-profit Organizations | 199 | 5.3% |
| Local Government Employees | 120 | 3.2% |
| State Government Employees | 139 | 3.7% |
| Federal Government Employees | 147 | 3.9% |
| Unpaid Family Workers | 21 | 0.6% |
| Total | 3,767 | 100.0% |
Employment Status by Age in Beebe
According to the labor force statistics for Beebe, out of the total population over 16 years of age (6,350), 60.1% or 3,816 individuals are in the labor force, with 1.3% or 50 of them unemployed. The age group with the highest labor force participation rate is 25 to 29 years, with 95.3% or 566 individuals in the labor force. Within the labor force, the 65 to 74 years age range has the highest percentage of unemployed individuals, with 10.8% or 32 of them being unemployed.
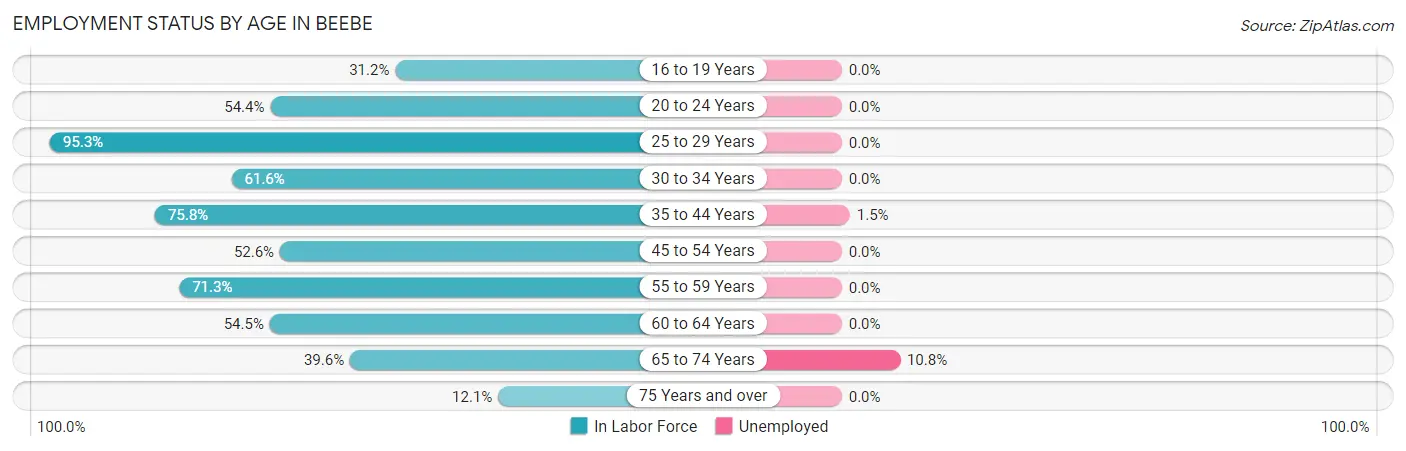
| Age Bracket | In Labor Force | Unemployed |
| 16 to 19 Years | 136 (31.2%) | 0 (0.0%) |
| 20 to 24 Years | 319 (54.4%) | 0 (0.0%) |
| 25 to 29 Years | 566 (95.3%) | 0 (0.0%) |
| 30 to 34 Years | 352 (61.6%) | 0 (0.0%) |
| 35 to 44 Years | 1,235 (75.8%) | 19 (1.5%) |
| 45 to 54 Years | 469 (52.6%) | 0 (0.0%) |
| 55 to 59 Years | 253 (71.3%) | 0 (0.0%) |
| 60 to 64 Years | 162 (54.5%) | 0 (0.0%) |
| 65 to 74 Years | 297 (39.6%) | 32 (10.8%) |
| 75 Years and over | 29 (12.1%) | 0 (0.0%) |
| Total | 3,816 (60.1%) | 50 (1.3%) |
Employment Status by Educational Attainment in Beebe
According to labor force statistics for Beebe, 70.0% of individuals (3,037) out of the total population between 25 and 64 years of age (4,338) are in the labor force, with 0.6% or 18 of them being unemployed. The group with the highest labor force participation rate are those with the educational attainment of bachelor's degree or higher, with 93.1% or 712 individuals in the labor force. Within the labor force, individuals with high school diploma education have the highest percentage of unemployment, with 1.6% or 18 of them being unemployed.
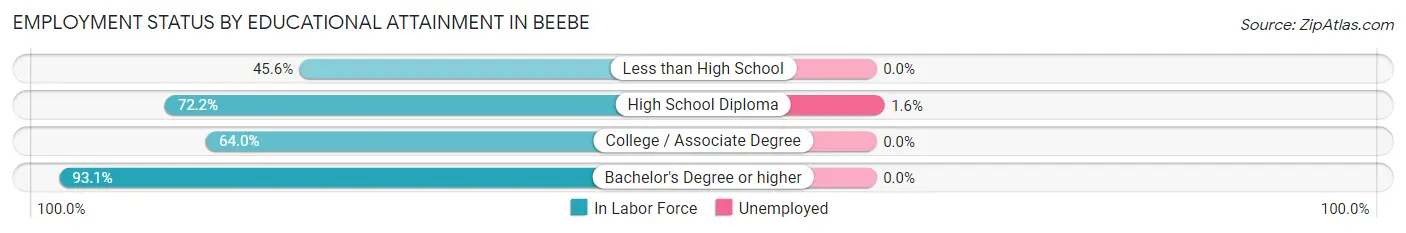
| Educational Attainment | In Labor Force | Unemployed |
| Less than High School | 231 (45.6%) | 0 (0.0%) |
| High School Diploma | 1,147 (72.2%) | 25 (1.6%) |
| College / Associate Degree | 946 (64.0%) | 0 (0.0%) |
| Bachelor's Degree or higher | 712 (93.1%) | 0 (0.0%) |
| Total | 3,037 (70.0%) | 26 (0.6%) |
Employment Occupations by Sex in Beebe
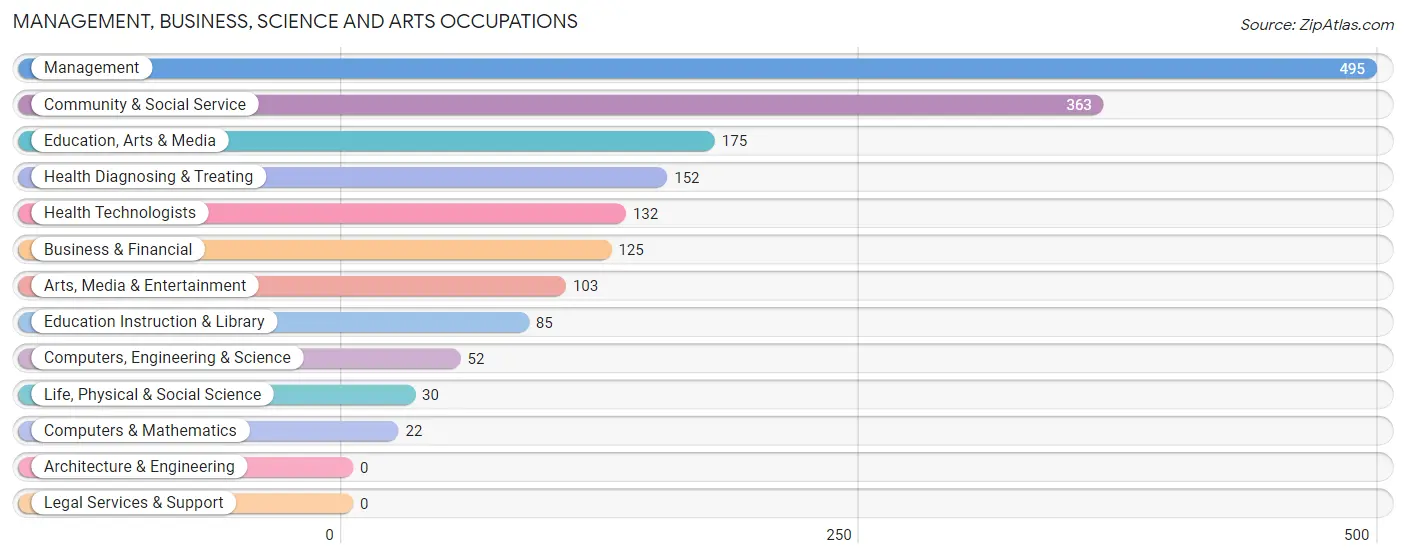
Management, Business, Science and Arts Occupations
The most common Management, Business, Science and Arts occupations in Beebe are Management (495 | 13.1%), Community & Social Service (363 | 9.6%), Education, Arts & Media (175 | 4.6%), Health Diagnosing & Treating (152 | 4.0%), and Health Technologists (132 | 3.5%).
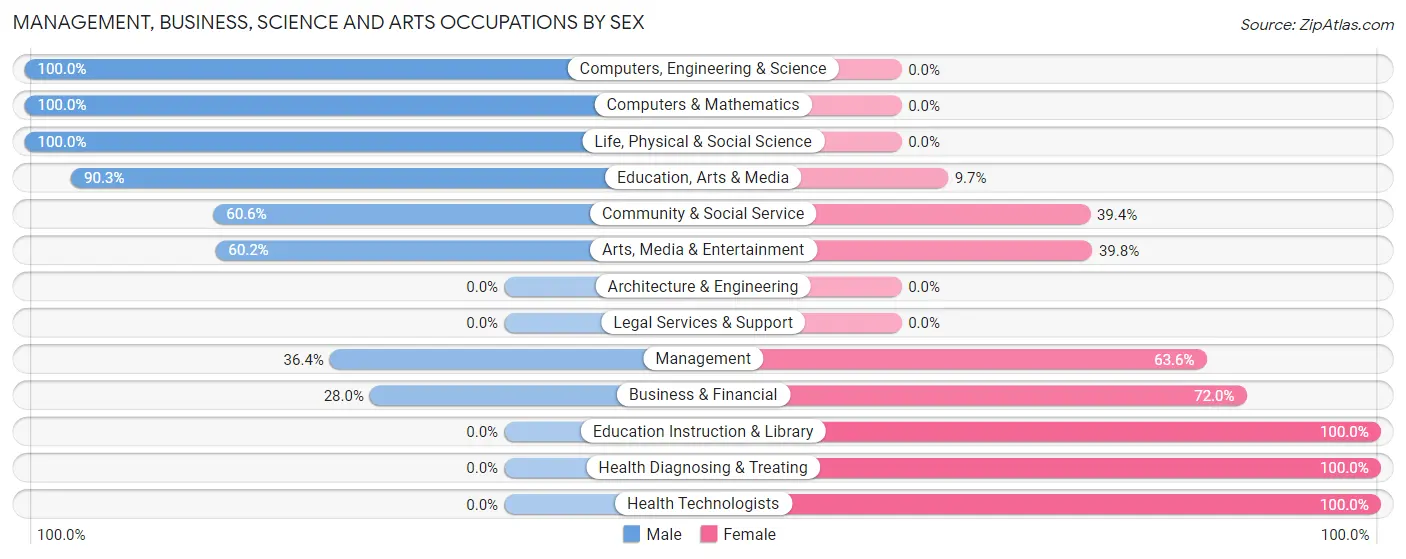
Management, Business, Science and Arts Occupations by Sex
Within the Management, Business, Science and Arts occupations in Beebe, the most male-oriented occupations are Computers, Engineering & Science (100.0%), Computers & Mathematics (100.0%), and Life, Physical & Social Science (100.0%), while the most female-oriented occupations are Education Instruction & Library (100.0%), Health Diagnosing & Treating (100.0%), and Health Technologists (100.0%).
| Occupation | Male | Female |
| Management | 180 (36.4%) | 315 (63.6%) |
| Business & Financial | 35 (28.0%) | 90 (72.0%) |
| Computers, Engineering & Science | 52 (100.0%) | 0 (0.0%) |
| Computers & Mathematics | 22 (100.0%) | 0 (0.0%) |
| Architecture & Engineering | 0 (0.0%) | 0 (0.0%) |
| Life, Physical & Social Science | 30 (100.0%) | 0 (0.0%) |
| Community & Social Service | 220 (60.6%) | 143 (39.4%) |
| Education, Arts & Media | 158 (90.3%) | 17 (9.7%) |
| Legal Services & Support | 0 (0.0%) | 0 (0.0%) |
| Education Instruction & Library | 0 (0.0%) | 85 (100.0%) |
| Arts, Media & Entertainment | 62 (60.2%) | 41 (39.8%) |
| Health Diagnosing & Treating | 0 (0.0%) | 152 (100.0%) |
| Health Technologists | 0 (0.0%) | 132 (100.0%) |
| Total (Category) | 487 (41.0%) | 700 (59.0%) |
| Total (Overall) | 1,998 (53.0%) | 1,769 (47.0%) |
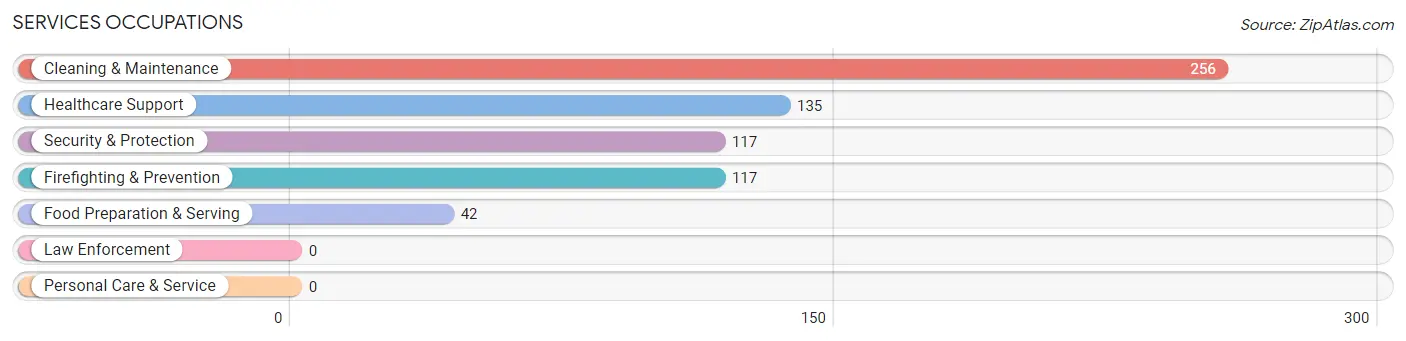
Services Occupations
The most common Services occupations in Beebe are Cleaning & Maintenance (256 | 6.8%), Healthcare Support (135 | 3.6%), Security & Protection (117 | 3.1%), Firefighting & Prevention (117 | 3.1%), and Food Preparation & Serving (42 | 1.1%).
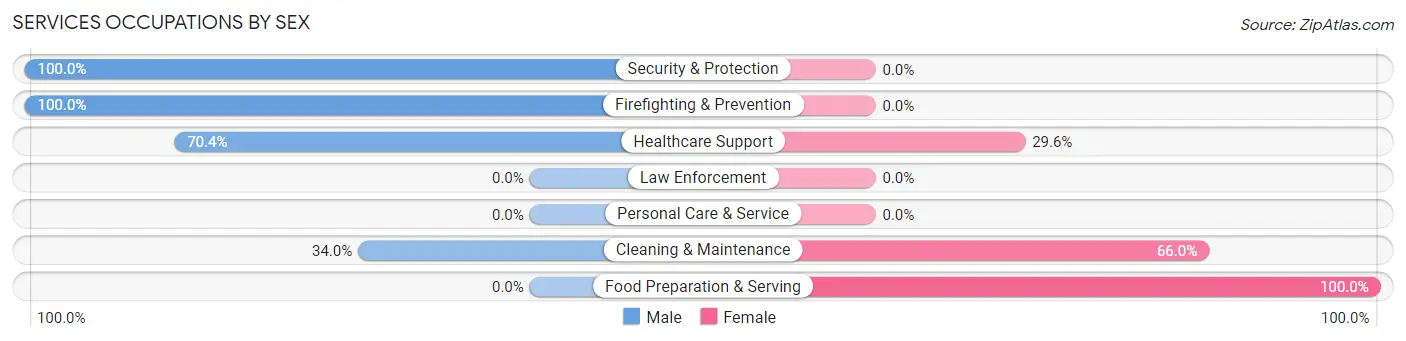
Services Occupations by Sex
Within the Services occupations in Beebe, the most male-oriented occupations are Security & Protection (100.0%), Firefighting & Prevention (100.0%), and Healthcare Support (70.4%), while the most female-oriented occupations are Food Preparation & Serving (100.0%), Cleaning & Maintenance (66.0%), and Healthcare Support (29.6%).
| Occupation | Male | Female |
| Healthcare Support | 95 (70.4%) | 40 (29.6%) |
| Security & Protection | 117 (100.0%) | 0 (0.0%) |
| Firefighting & Prevention | 117 (100.0%) | 0 (0.0%) |
| Law Enforcement | 0 (0.0%) | 0 (0.0%) |
| Food Preparation & Serving | 0 (0.0%) | 42 (100.0%) |
| Cleaning & Maintenance | 87 (34.0%) | 169 (66.0%) |
| Personal Care & Service | 0 (0.0%) | 0 (0.0%) |
| Total (Category) | 299 (54.4%) | 251 (45.6%) |
| Total (Overall) | 1,998 (53.0%) | 1,769 (47.0%) |
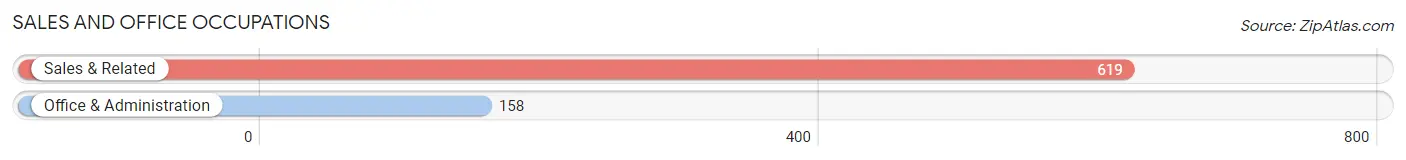
Sales and Office Occupations
The most common Sales and Office occupations in Beebe are Sales & Related (619 | 16.4%), and Office & Administration (158 | 4.2%).
Sales and Office Occupations by Sex
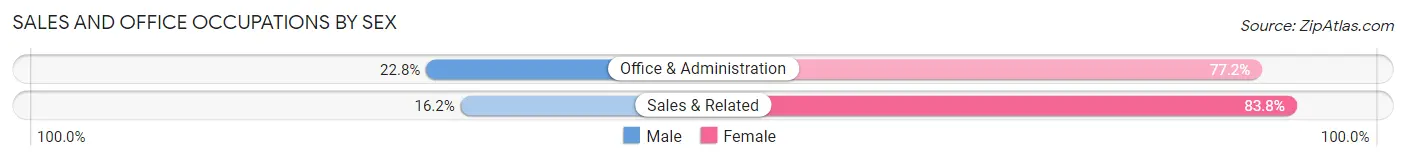
| Occupation | Male | Female |
| Sales & Related | 100 (16.2%) | 519 (83.8%) |
| Office & Administration | 36 (22.8%) | 122 (77.2%) |
| Total (Category) | 136 (17.5%) | 641 (82.5%) |
| Total (Overall) | 1,998 (53.0%) | 1,769 (47.0%) |
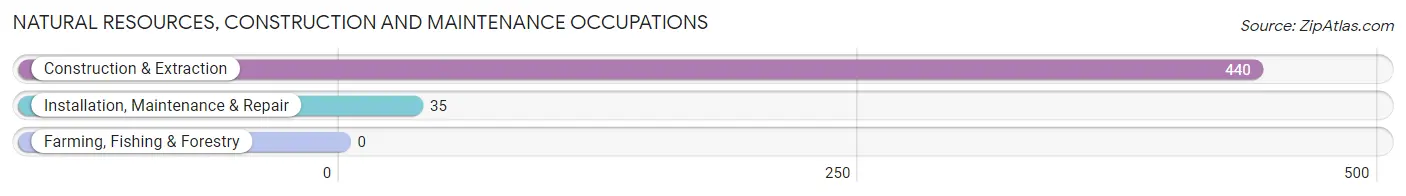
Natural Resources, Construction and Maintenance Occupations
The most common Natural Resources, Construction and Maintenance occupations in Beebe are Construction & Extraction (440 | 11.7%), and Installation, Maintenance & Repair (35 | 0.9%).
Natural Resources, Construction and Maintenance Occupations by Sex
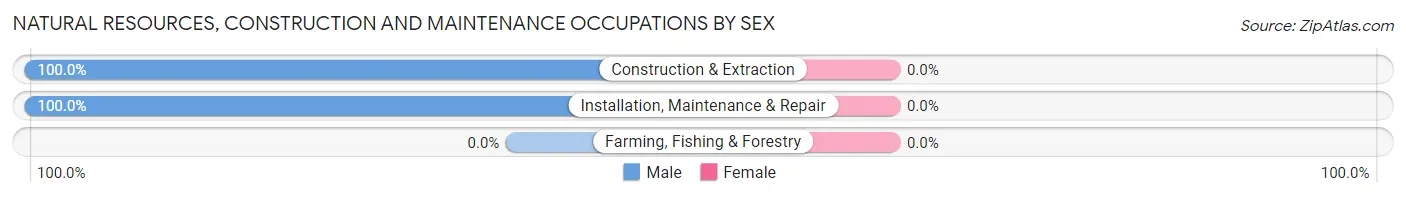
| Occupation | Male | Female |
| Farming, Fishing & Forestry | 0 (0.0%) | 0 (0.0%) |
| Construction & Extraction | 440 (100.0%) | 0 (0.0%) |
| Installation, Maintenance & Repair | 35 (100.0%) | 0 (0.0%) |
| Total (Category) | 475 (100.0%) | 0 (0.0%) |
| Total (Overall) | 1,998 (53.0%) | 1,769 (47.0%) |
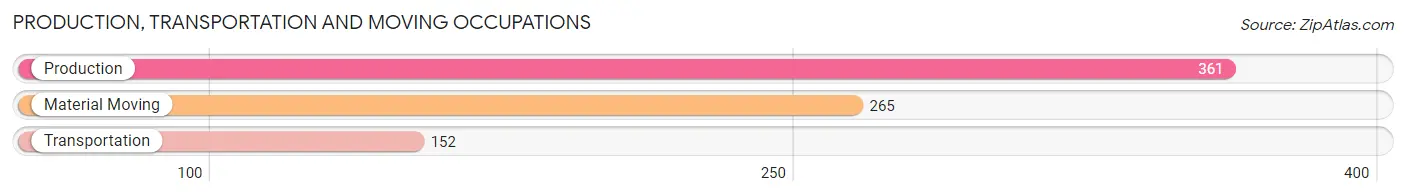
Production, Transportation and Moving Occupations
The most common Production, Transportation and Moving occupations in Beebe are Production (361 | 9.6%), Material Moving (265 | 7.0%), and Transportation (152 | 4.0%).
Production, Transportation and Moving Occupations by Sex
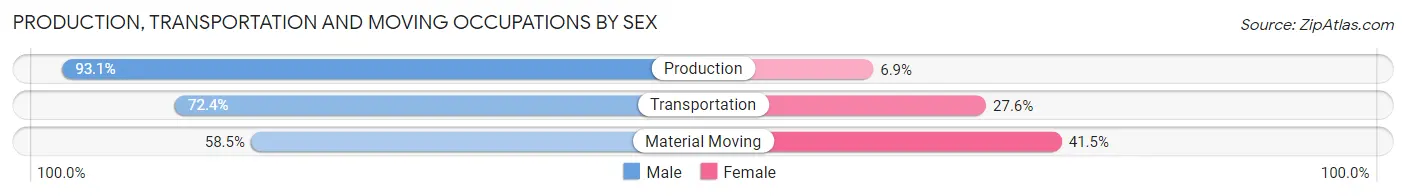
| Occupation | Male | Female |
| Production | 336 (93.1%) | 25 (6.9%) |
| Transportation | 110 (72.4%) | 42 (27.6%) |
| Material Moving | 155 (58.5%) | 110 (41.5%) |
| Total (Category) | 601 (77.2%) | 177 (22.8%) |
| Total (Overall) | 1,998 (53.0%) | 1,769 (47.0%) |
Employment Industries by Sex in Beebe
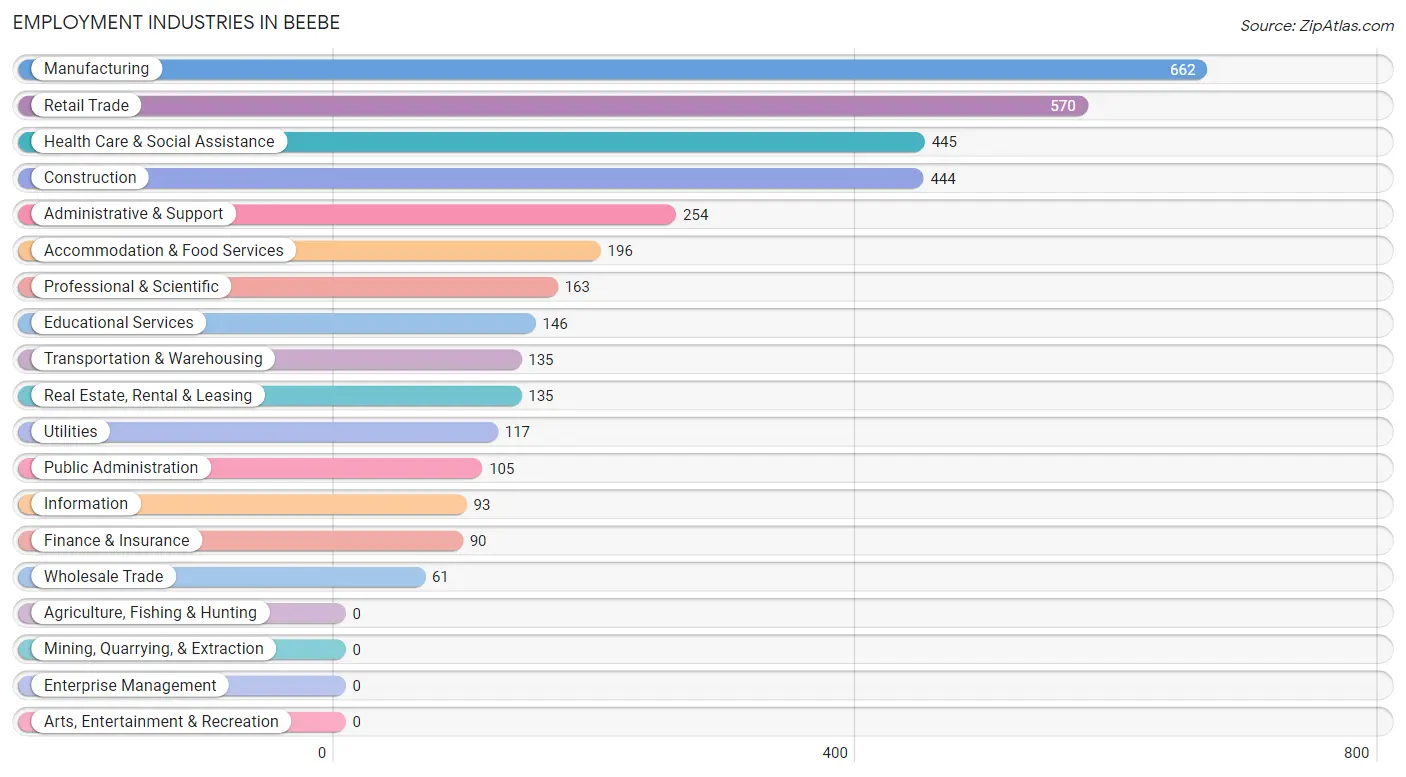
Employment Industries in Beebe
The major employment industries in Beebe include Manufacturing (662 | 17.6%), Retail Trade (570 | 15.1%), Health Care & Social Assistance (445 | 11.8%), Construction (444 | 11.8%), and Administrative & Support (254 | 6.7%).
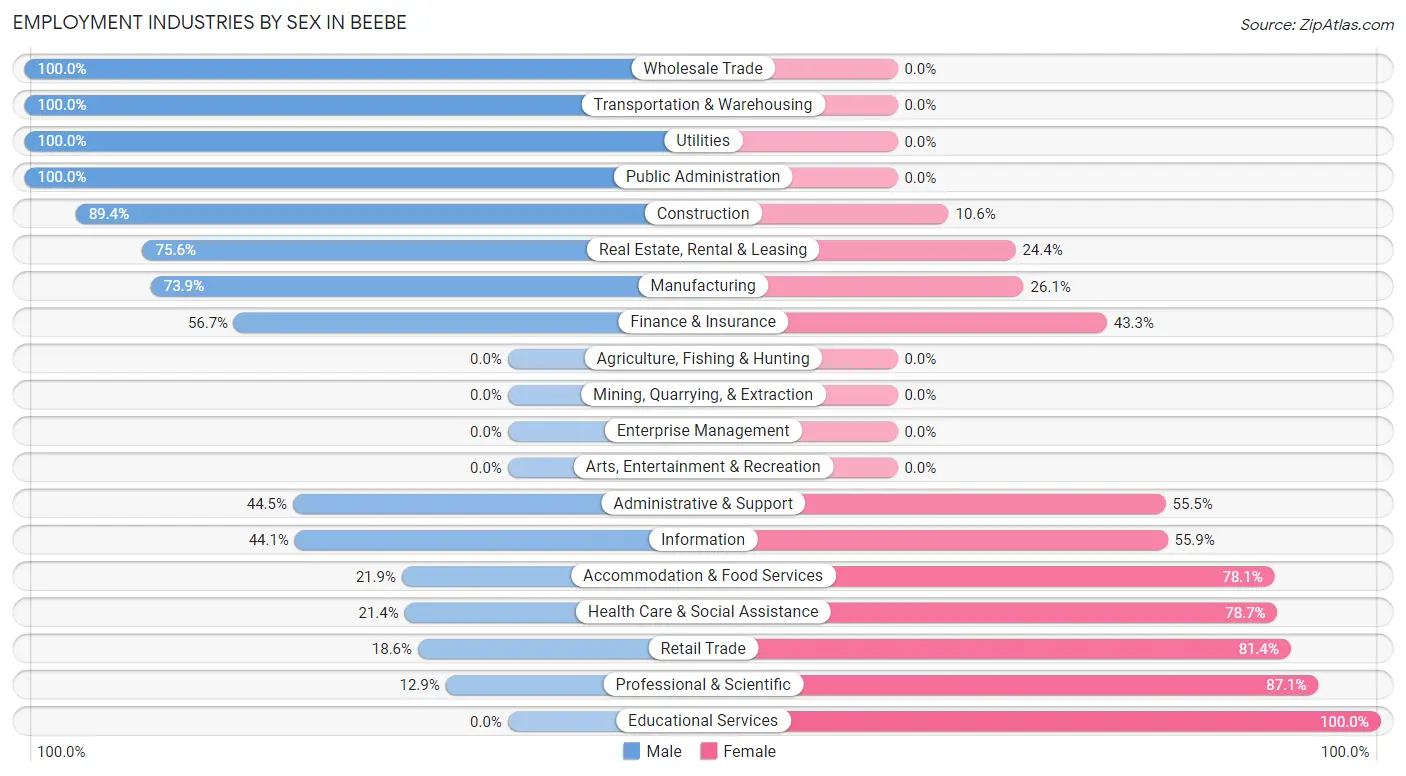
Employment Industries by Sex in Beebe
The Beebe industries that see more men than women are Wholesale Trade (100.0%), Transportation & Warehousing (100.0%), and Utilities (100.0%), whereas the industries that tend to have a higher number of women are Educational Services (100.0%), Professional & Scientific (87.1%), and Retail Trade (81.4%).
| Industry | Male | Female |
| Agriculture, Fishing & Hunting | 0 (0.0%) | 0 (0.0%) |
| Mining, Quarrying, & Extraction | 0 (0.0%) | 0 (0.0%) |
| Construction | 397 (89.4%) | 47 (10.6%) |
| Manufacturing | 489 (73.9%) | 173 (26.1%) |
| Wholesale Trade | 61 (100.0%) | 0 (0.0%) |
| Retail Trade | 106 (18.6%) | 464 (81.4%) |
| Transportation & Warehousing | 135 (100.0%) | 0 (0.0%) |
| Utilities | 117 (100.0%) | 0 (0.0%) |
| Information | 41 (44.1%) | 52 (55.9%) |
| Finance & Insurance | 51 (56.7%) | 39 (43.3%) |
| Real Estate, Rental & Leasing | 102 (75.6%) | 33 (24.4%) |
| Professional & Scientific | 21 (12.9%) | 142 (87.1%) |
| Enterprise Management | 0 (0.0%) | 0 (0.0%) |
| Administrative & Support | 113 (44.5%) | 141 (55.5%) |
| Educational Services | 0 (0.0%) | 146 (100.0%) |
| Health Care & Social Assistance | 95 (21.3%) | 350 (78.6%) |
| Arts, Entertainment & Recreation | 0 (0.0%) | 0 (0.0%) |
| Accommodation & Food Services | 43 (21.9%) | 153 (78.1%) |
| Public Administration | 105 (100.0%) | 0 (0.0%) |
| Total | 1,998 (53.0%) | 1,769 (47.0%) |
Education in Beebe
School Enrollment in Beebe
The most common levels of schooling among the 2,219 students in Beebe are middle school (649 | 29.2%), high school (519 | 23.4%), and elementary school (479 | 21.6%).
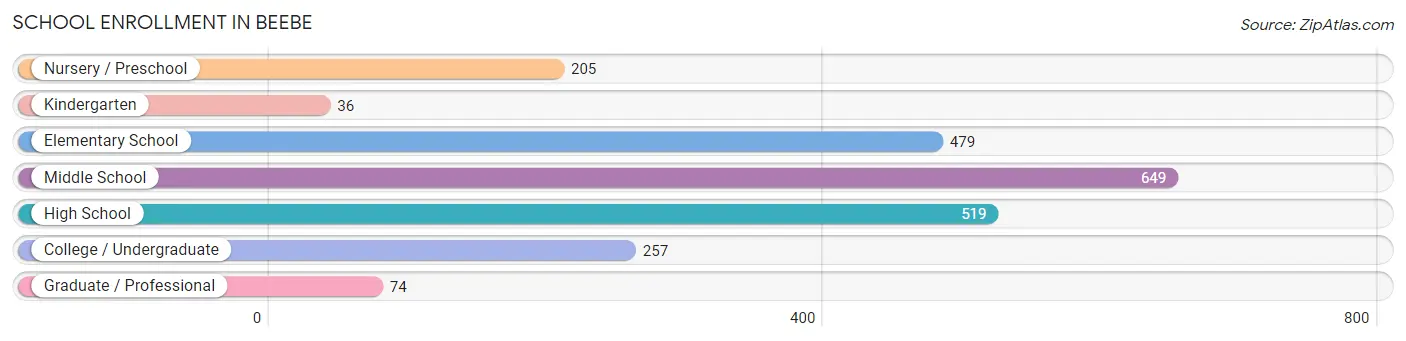
| School Level | # Students | % Students |
| Nursery / Preschool | 205 | 9.2% |
| Kindergarten | 36 | 1.6% |
| Elementary School | 479 | 21.6% |
| Middle School | 649 | 29.2% |
| High School | 519 | 23.4% |
| College / Undergraduate | 257 | 11.6% |
| Graduate / Professional | 74 | 3.3% |
| Total | 2,219 | 100.0% |
School Enrollment by Age by Funding Source in Beebe
Out of a total of 2,219 students who are enrolled in schools in Beebe, 135 (6.1%) attend a private institution, while the remaining 2,084 (93.9%) are enrolled in public schools. The age group of 18 to 19 year olds has the highest likelihood of being enrolled in private schools, with 91 (65.9% in the age bracket) enrolled. Conversely, the age group of 3 to 4 year olds has the lowest likelihood of being enrolled in a private school, with 205 (100.0% in the age bracket) attending a public institution.
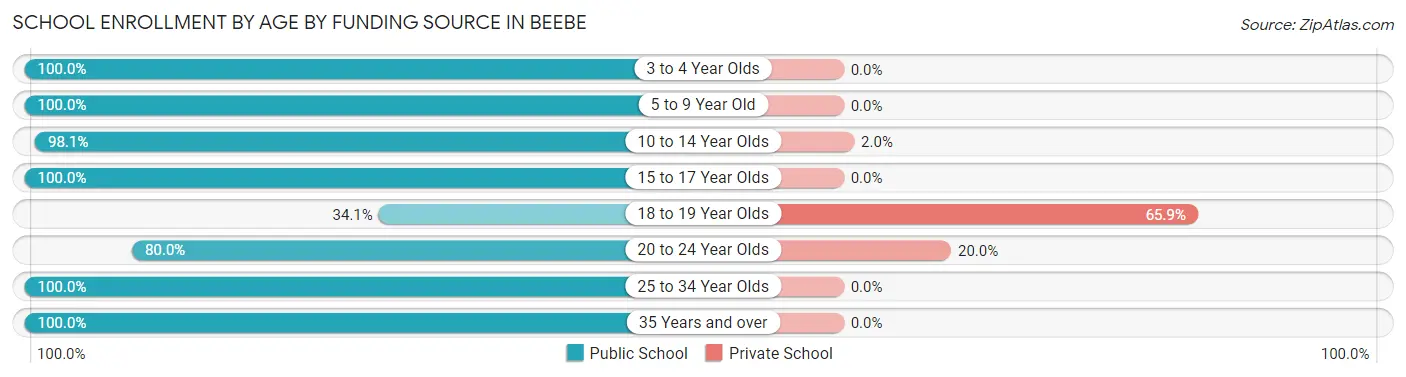
| Age Bracket | Public School | Private School |
| 3 to 4 Year Olds | 205 (100.0%) | 0 (0.0%) |
| 5 to 9 Year Old | 299 (100.0%) | 0 (0.0%) |
| 10 to 14 Year Olds | 903 (98.1%) | 18 (1.9%) |
| 15 to 17 Year Olds | 430 (100.0%) | 0 (0.0%) |
| 18 to 19 Year Olds | 47 (34.1%) | 91 (65.9%) |
| 20 to 24 Year Olds | 108 (80.0%) | 27 (20.0%) |
| 25 to 34 Year Olds | 74 (100.0%) | 0 (0.0%) |
| 35 Years and over | 17 (100.0%) | 0 (0.0%) |
| Total | 2,084 (93.9%) | 135 (6.1%) |
Educational Attainment by Field of Study in Beebe
Education (204 | 17.7%), business (152 | 13.2%), bio, nature & agricultural (149 | 13.0%), social sciences (144 | 12.5%), and science & technology (99 | 8.6%) are the most common fields of study among 1,151 individuals in Beebe who have obtained a bachelor's degree or higher.
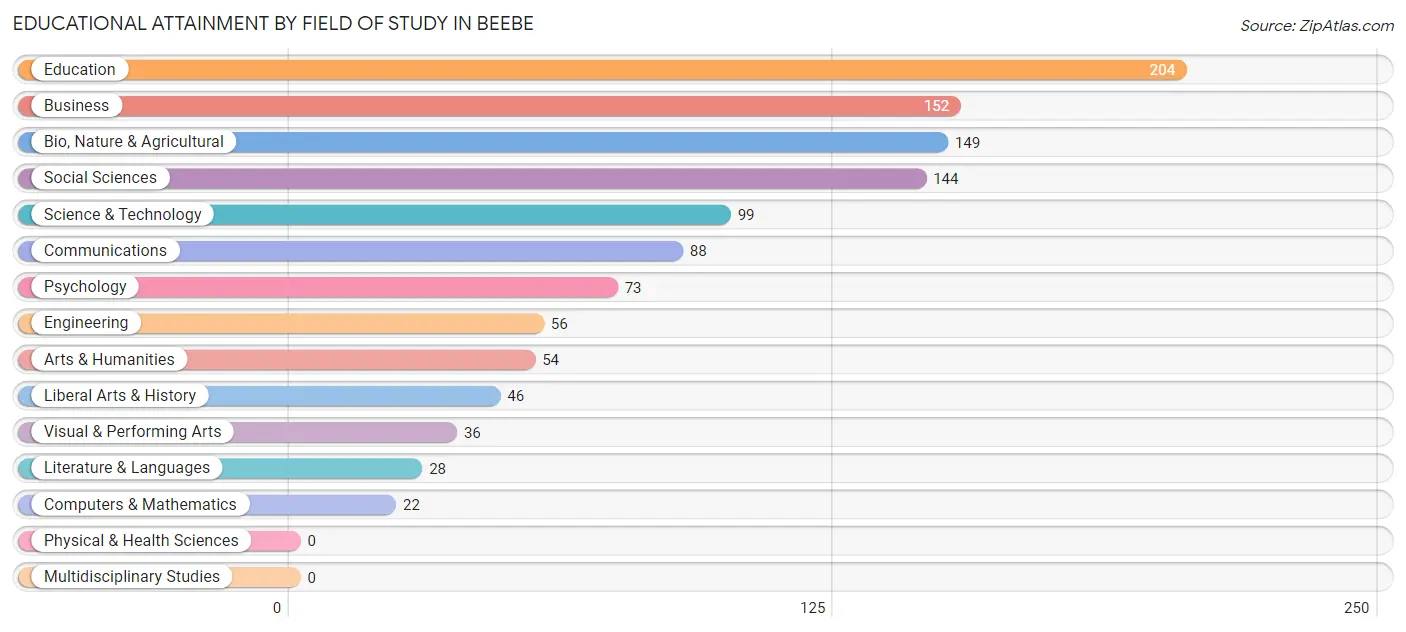
| Field of Study | # Graduates | % Graduates |
| Computers & Mathematics | 22 | 1.9% |
| Bio, Nature & Agricultural | 149 | 13.0% |
| Physical & Health Sciences | 0 | 0.0% |
| Psychology | 73 | 6.3% |
| Social Sciences | 144 | 12.5% |
| Engineering | 56 | 4.9% |
| Multidisciplinary Studies | 0 | 0.0% |
| Science & Technology | 99 | 8.6% |
| Business | 152 | 13.2% |
| Education | 204 | 17.7% |
| Literature & Languages | 28 | 2.4% |
| Liberal Arts & History | 46 | 4.0% |
| Visual & Performing Arts | 36 | 3.1% |
| Communications | 88 | 7.6% |
| Arts & Humanities | 54 | 4.7% |
| Total | 1,151 | 100.0% |
Transportation & Commute in Beebe
Vehicle Availability by Sex in Beebe
The most prevalent vehicle ownership categories in Beebe are males with 2 vehicles (829, accounting for 41.5%) and females with 2 vehicles (503, making up 47.2%).
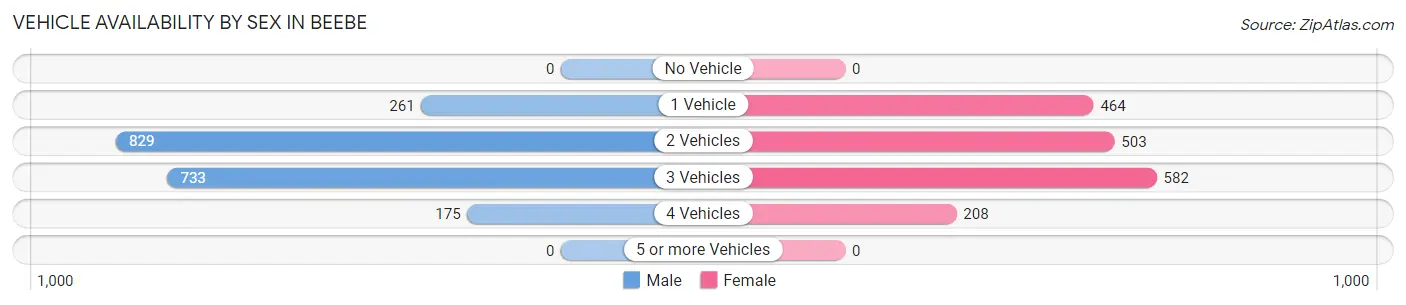
| Vehicles Available | Male | Female |
| No Vehicle | 0 (0.0%) | 0 (0.0%) |
| 1 Vehicle | 261 (13.1%) | 464 (26.4%) |
| 2 Vehicles | 829 (41.5%) | 503 (28.6%) |
| 3 Vehicles | 733 (36.7%) | 582 (33.1%) |
| 4 Vehicles | 175 (8.8%) | 208 (11.8%) |
| 5 or more Vehicles | 0 (0.0%) | 0 (0.0%) |
| Total | 1,998 (100.0%) | 1,757 (100.0%) |
Commute Time in Beebe
The most frequently occuring commute durations in Beebe are 15 to 19 minutes (692 commuters, 18.6%), 5 to 9 minutes (598 commuters, 16.0%), and 30 to 34 minutes (392 commuters, 10.5%).
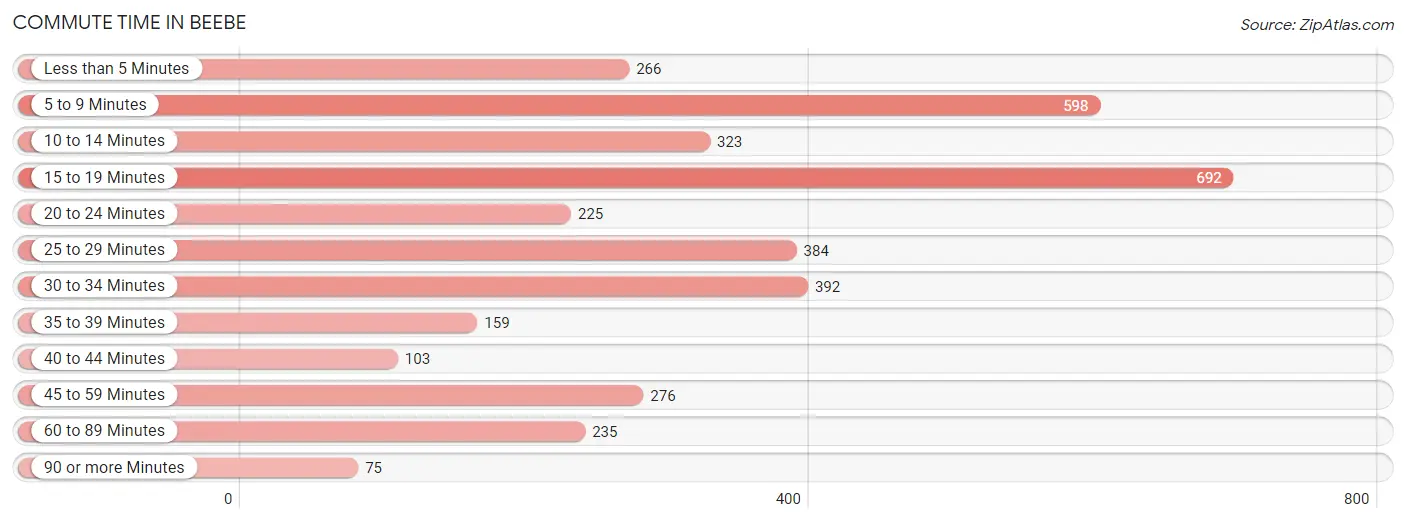
| Commute Time | # Commuters | % Commuters |
| Less than 5 Minutes | 266 | 7.1% |
| 5 to 9 Minutes | 598 | 16.0% |
| 10 to 14 Minutes | 323 | 8.7% |
| 15 to 19 Minutes | 692 | 18.6% |
| 20 to 24 Minutes | 225 | 6.0% |
| 25 to 29 Minutes | 384 | 10.3% |
| 30 to 34 Minutes | 392 | 10.5% |
| 35 to 39 Minutes | 159 | 4.3% |
| 40 to 44 Minutes | 103 | 2.8% |
| 45 to 59 Minutes | 276 | 7.4% |
| 60 to 89 Minutes | 235 | 6.3% |
| 90 or more Minutes | 75 | 2.0% |
Commute Time by Sex in Beebe
The most common commute times in Beebe are 15 to 19 minutes (385 commuters, 19.3%) for males and 15 to 19 minutes (307 commuters, 17.7%) for females.
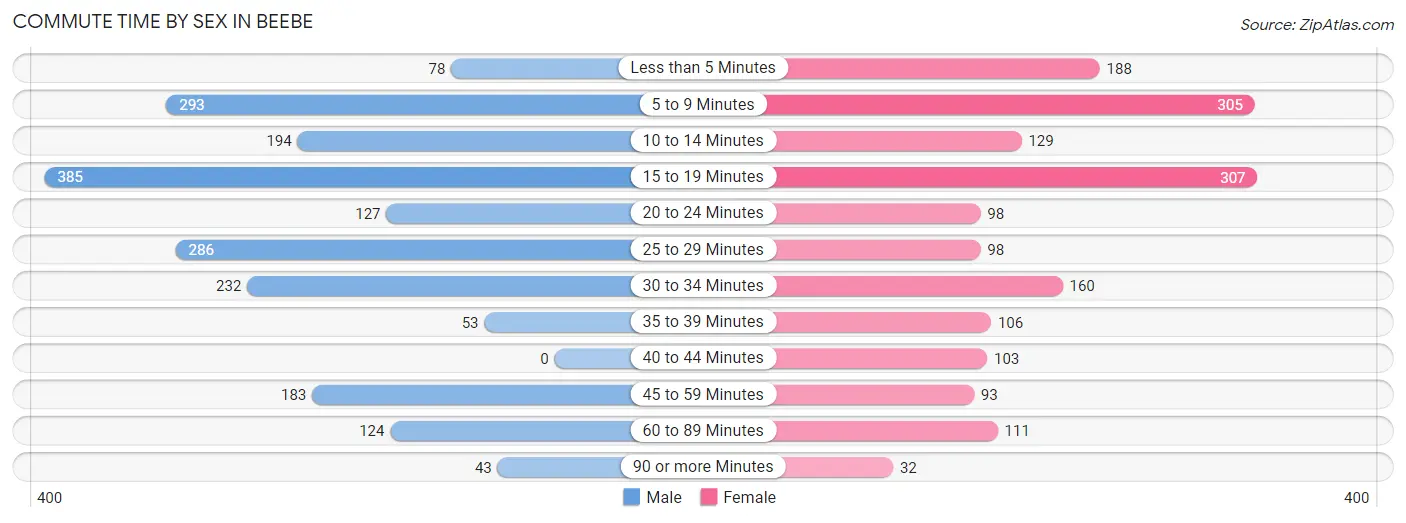
| Commute Time | Male | Female |
| Less than 5 Minutes | 78 (3.9%) | 188 (10.9%) |
| 5 to 9 Minutes | 293 (14.7%) | 305 (17.6%) |
| 10 to 14 Minutes | 194 (9.7%) | 129 (7.5%) |
| 15 to 19 Minutes | 385 (19.3%) | 307 (17.7%) |
| 20 to 24 Minutes | 127 (6.4%) | 98 (5.7%) |
| 25 to 29 Minutes | 286 (14.3%) | 98 (5.7%) |
| 30 to 34 Minutes | 232 (11.6%) | 160 (9.2%) |
| 35 to 39 Minutes | 53 (2.6%) | 106 (6.1%) |
| 40 to 44 Minutes | 0 (0.0%) | 103 (5.9%) |
| 45 to 59 Minutes | 183 (9.2%) | 93 (5.4%) |
| 60 to 89 Minutes | 124 (6.2%) | 111 (6.4%) |
| 90 or more Minutes | 43 (2.1%) | 32 (1.8%) |
Time of Departure to Work by Sex in Beebe
The most frequent times of departure to work in Beebe are 12:00 AM to 4:59 AM (354, 17.7%) for males and 7:00 AM to 7:29 AM (443, 25.6%) for females.
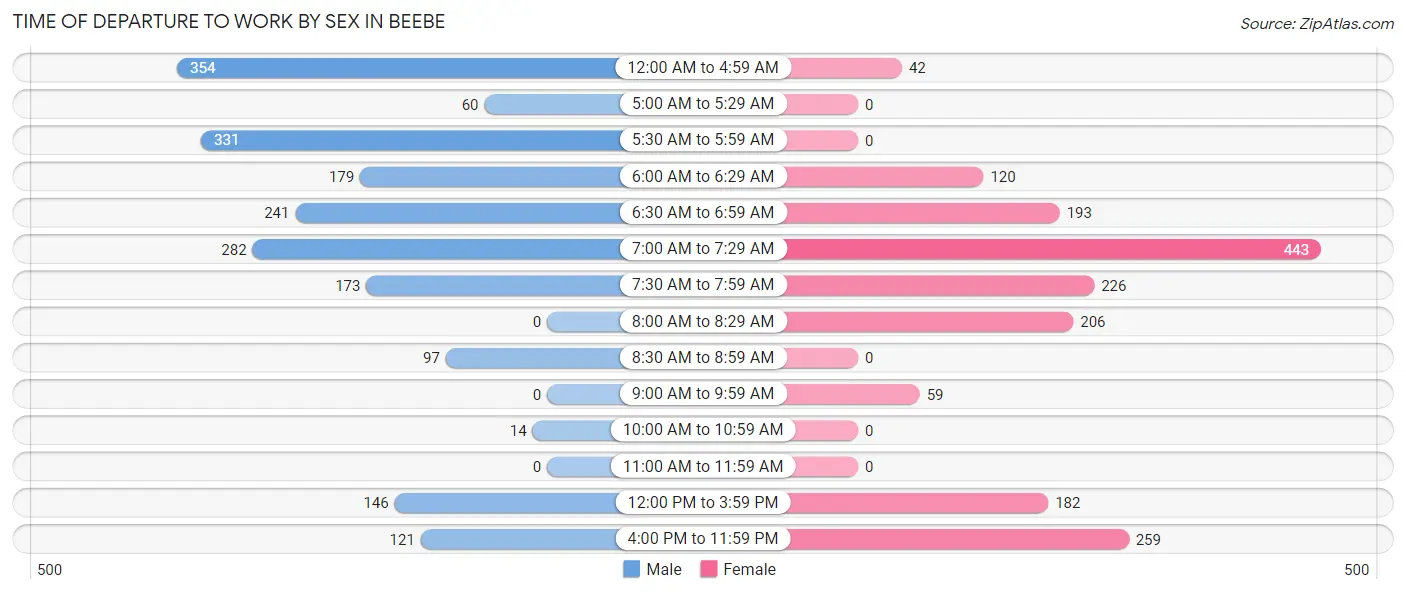
| Time of Departure | Male | Female |
| 12:00 AM to 4:59 AM | 354 (17.7%) | 42 (2.4%) |
| 5:00 AM to 5:29 AM | 60 (3.0%) | 0 (0.0%) |
| 5:30 AM to 5:59 AM | 331 (16.6%) | 0 (0.0%) |
| 6:00 AM to 6:29 AM | 179 (9.0%) | 120 (6.9%) |
| 6:30 AM to 6:59 AM | 241 (12.1%) | 193 (11.2%) |
| 7:00 AM to 7:29 AM | 282 (14.1%) | 443 (25.6%) |
| 7:30 AM to 7:59 AM | 173 (8.7%) | 226 (13.1%) |
| 8:00 AM to 8:29 AM | 0 (0.0%) | 206 (11.9%) |
| 8:30 AM to 8:59 AM | 97 (4.9%) | 0 (0.0%) |
| 9:00 AM to 9:59 AM | 0 (0.0%) | 59 (3.4%) |
| 10:00 AM to 10:59 AM | 14 (0.7%) | 0 (0.0%) |
| 11:00 AM to 11:59 AM | 0 (0.0%) | 0 (0.0%) |
| 12:00 PM to 3:59 PM | 146 (7.3%) | 182 (10.5%) |
| 4:00 PM to 11:59 PM | 121 (6.1%) | 259 (15.0%) |
| Total | 1,998 (100.0%) | 1,730 (100.0%) |
Housing Occupancy in Beebe
Occupancy by Ownership in Beebe
Of the total 3,043 dwellings in Beebe, owner-occupied units account for 1,762 (57.9%), while renter-occupied units make up 1,281 (42.1%).
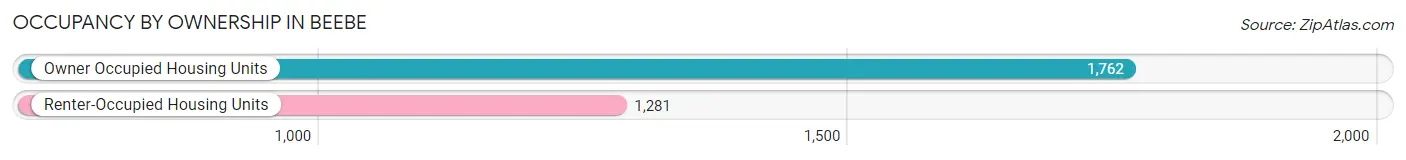
| Occupancy | # Housing Units | % Housing Units |
| Owner Occupied Housing Units | 1,762 | 57.9% |
| Renter-Occupied Housing Units | 1,281 | 42.1% |
| Total Occupied Housing Units | 3,043 | 100.0% |
Occupancy by Household Size in Beebe
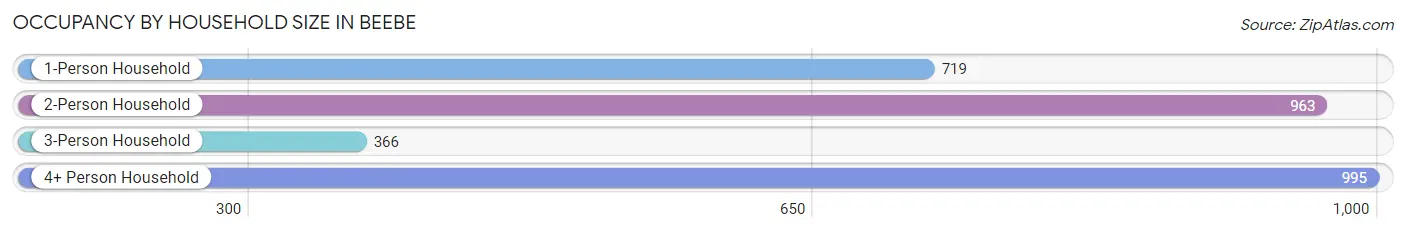
| Household Size | # Housing Units | % Housing Units |
| 1-Person Household | 719 | 23.6% |
| 2-Person Household | 963 | 31.7% |
| 3-Person Household | 366 | 12.0% |
| 4+ Person Household | 995 | 32.7% |
| Total Housing Units | 3,043 | 100.0% |
Occupancy by Ownership by Household Size in Beebe
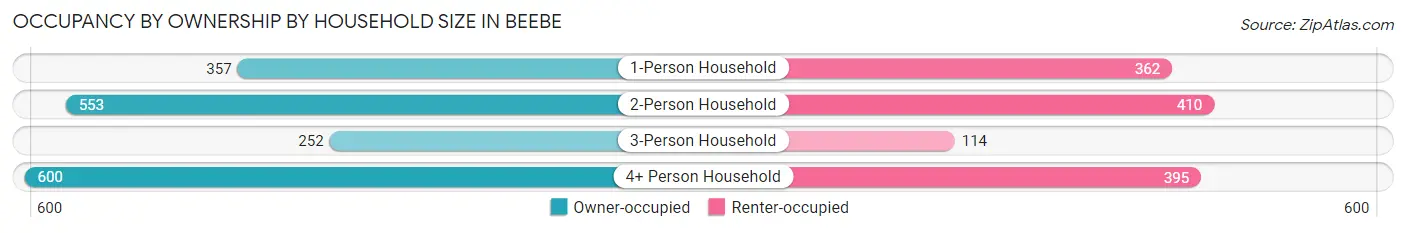
| Household Size | Owner-occupied | Renter-occupied |
| 1-Person Household | 357 (49.6%) | 362 (50.3%) |
| 2-Person Household | 553 (57.4%) | 410 (42.6%) |
| 3-Person Household | 252 (68.9%) | 114 (31.1%) |
| 4+ Person Household | 600 (60.3%) | 395 (39.7%) |
| Total Housing Units | 1,762 (57.9%) | 1,281 (42.1%) |
Occupancy by Educational Attainment in Beebe
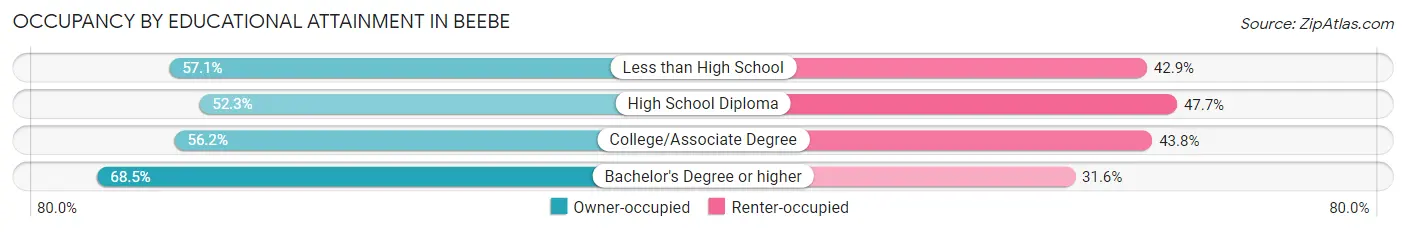
| Household Size | Owner-occupied | Renter-occupied |
| Less than High School | 190 (57.1%) | 143 (42.9%) |
| High School Diploma | 479 (52.3%) | 437 (47.7%) |
| College/Associate Degree | 620 (56.2%) | 483 (43.8%) |
| Bachelor's Degree or higher | 473 (68.4%) | 218 (31.6%) |
Occupancy by Age of Householder in Beebe
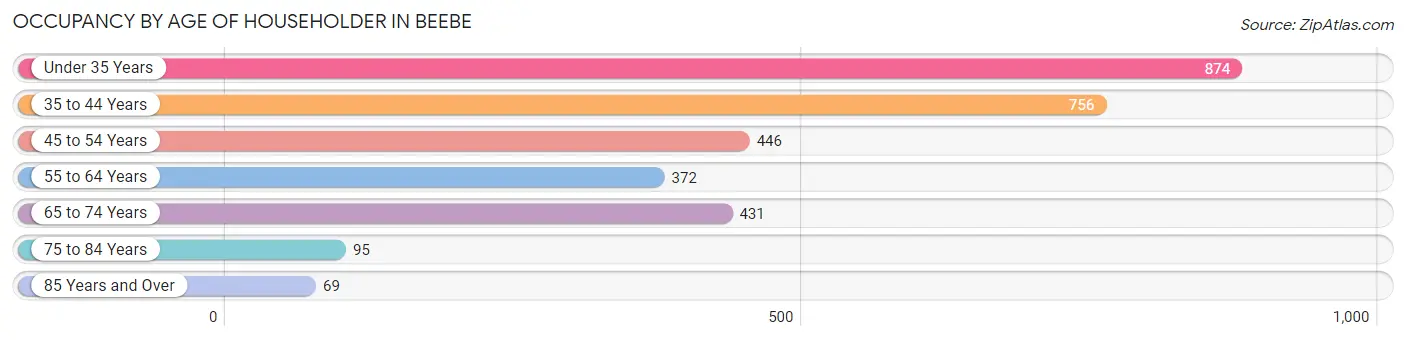
| Age Bracket | # Households | % Households |
| Under 35 Years | 874 | 28.7% |
| 35 to 44 Years | 756 | 24.8% |
| 45 to 54 Years | 446 | 14.7% |
| 55 to 64 Years | 372 | 12.2% |
| 65 to 74 Years | 431 | 14.2% |
| 75 to 84 Years | 95 | 3.1% |
| 85 Years and Over | 69 | 2.3% |
| Total | 3,043 | 100.0% |
Housing Finances in Beebe
Median Income by Occupancy in Beebe
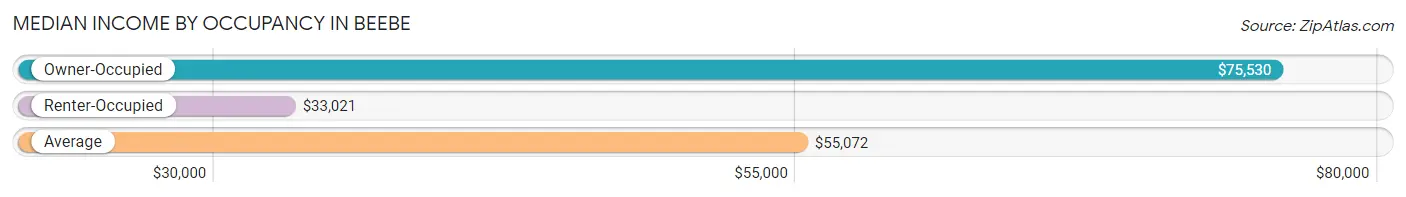
| Occupancy Type | # Households | Median Income |
| Owner-Occupied | 1,762 (57.9%) | $75,530 |
| Renter-Occupied | 1,281 (42.1%) | $33,021 |
| Average | 3,043 (100.0%) | $55,072 |
Occupancy by Householder Income Bracket in Beebe
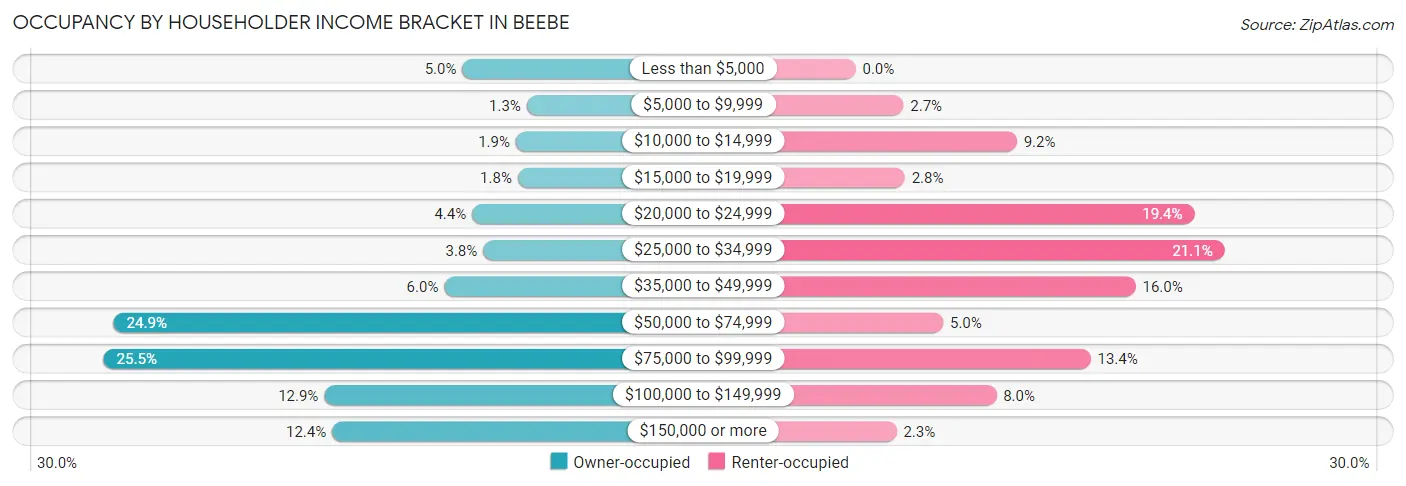
| Income Bracket | Owner-occupied | Renter-occupied |
| Less than $5,000 | 88 (5.0%) | 0 (0.0%) |
| $5,000 to $9,999 | 23 (1.3%) | 35 (2.7%) |
| $10,000 to $14,999 | 34 (1.9%) | 118 (9.2%) |
| $15,000 to $19,999 | 32 (1.8%) | 36 (2.8%) |
| $20,000 to $24,999 | 78 (4.4%) | 248 (19.4%) |
| $25,000 to $34,999 | 67 (3.8%) | 270 (21.1%) |
| $35,000 to $49,999 | 106 (6.0%) | 205 (16.0%) |
| $50,000 to $74,999 | 439 (24.9%) | 64 (5.0%) |
| $75,000 to $99,999 | 449 (25.5%) | 172 (13.4%) |
| $100,000 to $149,999 | 227 (12.9%) | 103 (8.0%) |
| $150,000 or more | 219 (12.4%) | 30 (2.3%) |
| Total | 1,762 (100.0%) | 1,281 (100.0%) |
Monthly Housing Cost Tiers in Beebe
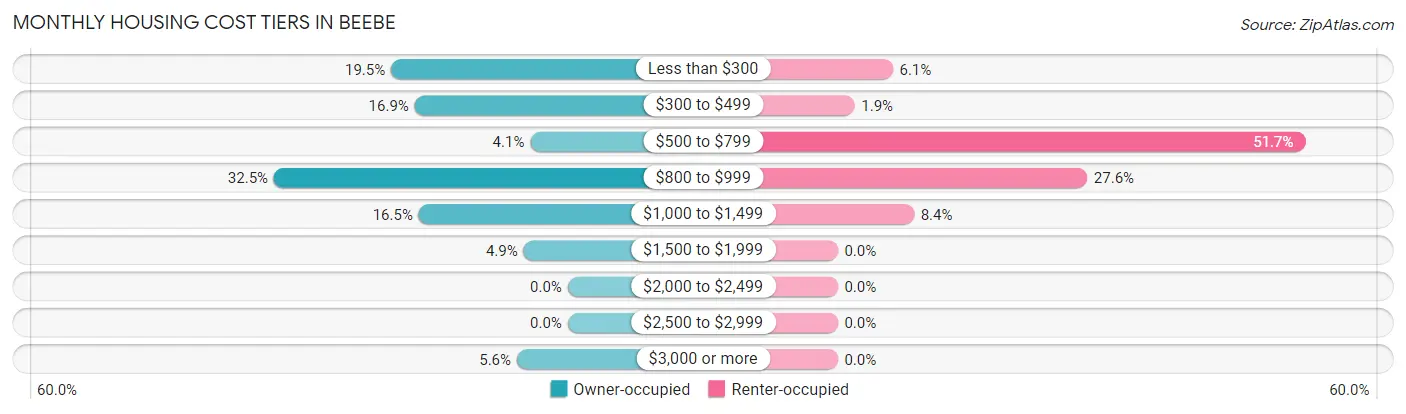
| Monthly Cost | Owner-occupied | Renter-occupied |
| Less than $300 | 344 (19.5%) | 78 (6.1%) |
| $300 to $499 | 298 (16.9%) | 24 (1.9%) |
| $500 to $799 | 73 (4.1%) | 662 (51.7%) |
| $800 to $999 | 572 (32.5%) | 353 (27.6%) |
| $1,000 to $1,499 | 290 (16.5%) | 108 (8.4%) |
| $1,500 to $1,999 | 86 (4.9%) | 0 (0.0%) |
| $2,000 to $2,499 | 0 (0.0%) | 0 (0.0%) |
| $2,500 to $2,999 | 0 (0.0%) | 0 (0.0%) |
| $3,000 or more | 99 (5.6%) | 0 (0.0%) |
| Total | 1,762 (100.0%) | 1,281 (100.0%) |
Physical Housing Characteristics in Beebe
Housing Structures in Beebe
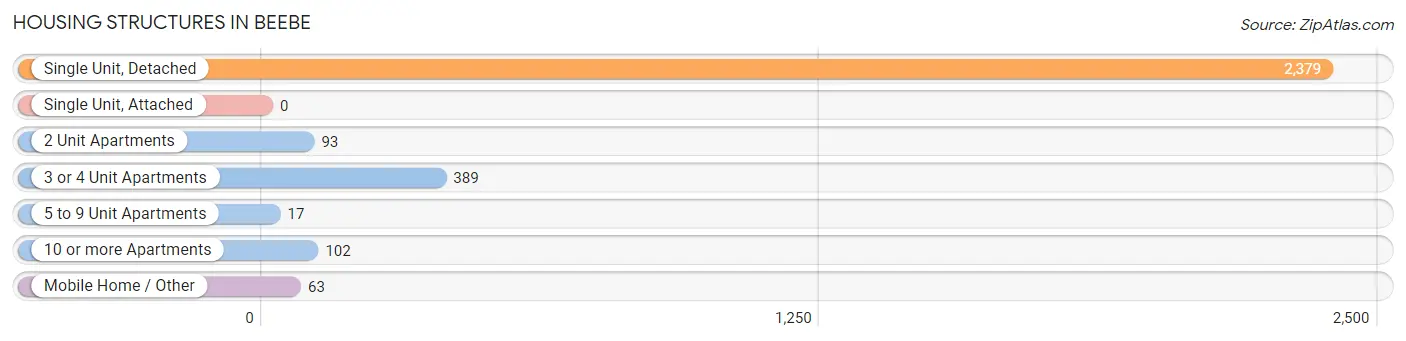
| Structure Type | # Housing Units | % Housing Units |
| Single Unit, Detached | 2,379 | 78.2% |
| Single Unit, Attached | 0 | 0.0% |
| 2 Unit Apartments | 93 | 3.1% |
| 3 or 4 Unit Apartments | 389 | 12.8% |
| 5 to 9 Unit Apartments | 17 | 0.6% |
| 10 or more Apartments | 102 | 3.4% |
| Mobile Home / Other | 63 | 2.1% |
| Total | 3,043 | 100.0% |
Housing Structures by Occupancy in Beebe
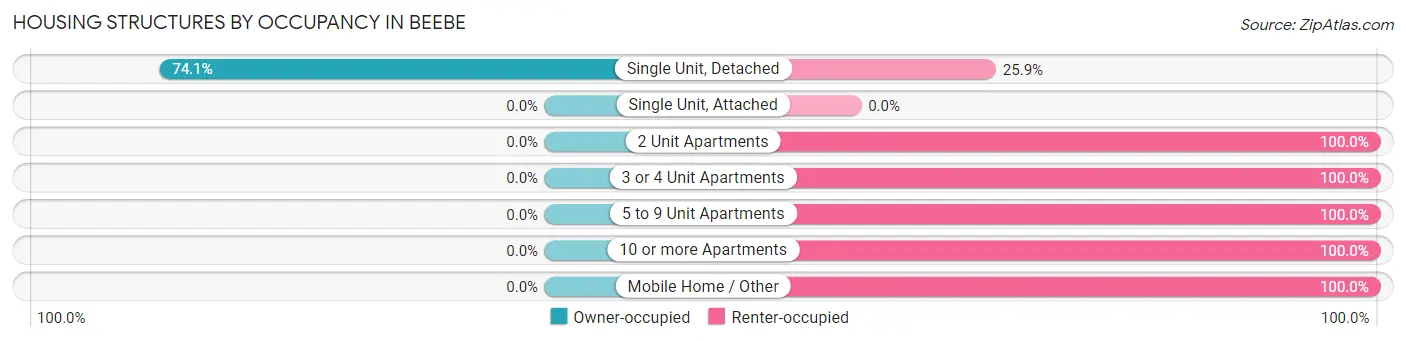
| Structure Type | Owner-occupied | Renter-occupied |
| Single Unit, Detached | 1,762 (74.1%) | 617 (25.9%) |
| Single Unit, Attached | 0 (0.0%) | 0 (0.0%) |
| 2 Unit Apartments | 0 (0.0%) | 93 (100.0%) |
| 3 or 4 Unit Apartments | 0 (0.0%) | 389 (100.0%) |
| 5 to 9 Unit Apartments | 0 (0.0%) | 17 (100.0%) |
| 10 or more Apartments | 0 (0.0%) | 102 (100.0%) |
| Mobile Home / Other | 0 (0.0%) | 63 (100.0%) |
| Total | 1,762 (57.9%) | 1,281 (42.1%) |
Housing Structures by Number of Rooms in Beebe
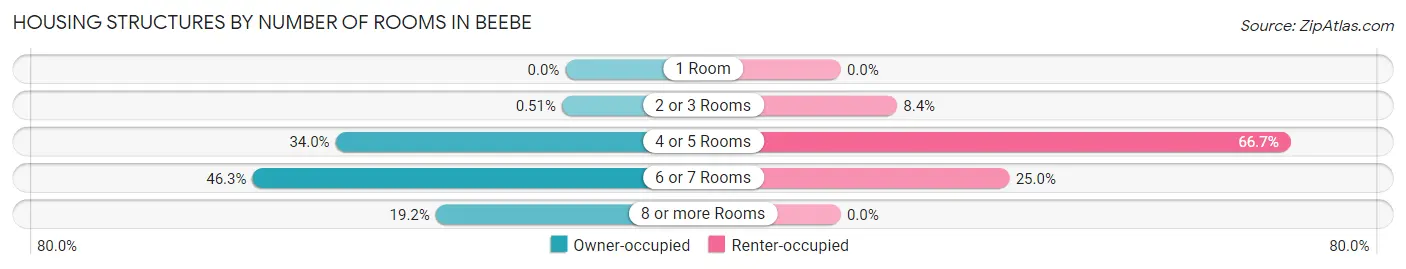
| Number of Rooms | Owner-occupied | Renter-occupied |
| 1 Room | 0 (0.0%) | 0 (0.0%) |
| 2 or 3 Rooms | 9 (0.5%) | 107 (8.4%) |
| 4 or 5 Rooms | 599 (34.0%) | 854 (66.7%) |
| 6 or 7 Rooms | 816 (46.3%) | 320 (25.0%) |
| 8 or more Rooms | 338 (19.2%) | 0 (0.0%) |
| Total | 1,762 (100.0%) | 1,281 (100.0%) |
Housing Structure by Heating Type in Beebe
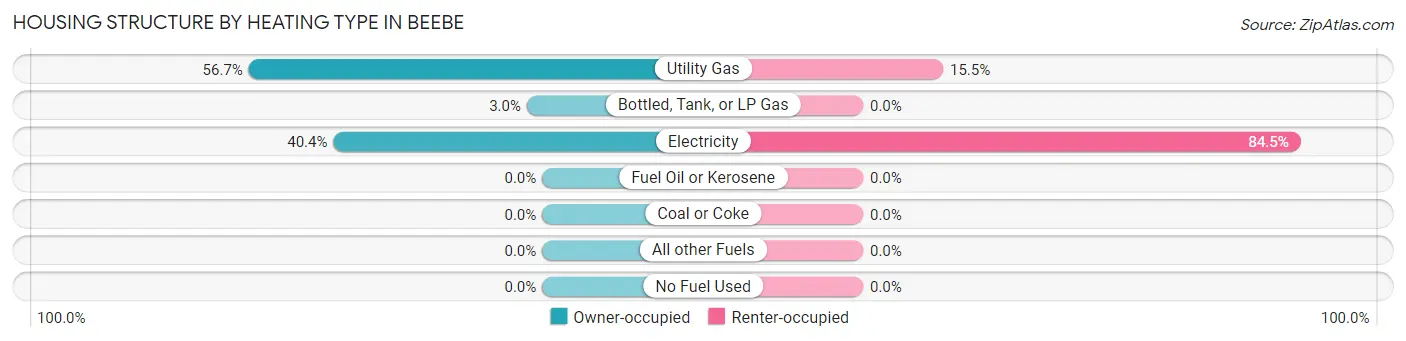
| Heating Type | Owner-occupied | Renter-occupied |
| Utility Gas | 999 (56.7%) | 198 (15.5%) |
| Bottled, Tank, or LP Gas | 52 (2.9%) | 0 (0.0%) |
| Electricity | 711 (40.4%) | 1,083 (84.5%) |
| Fuel Oil or Kerosene | 0 (0.0%) | 0 (0.0%) |
| Coal or Coke | 0 (0.0%) | 0 (0.0%) |
| All other Fuels | 0 (0.0%) | 0 (0.0%) |
| No Fuel Used | 0 (0.0%) | 0 (0.0%) |
| Total | 1,762 (100.0%) | 1,281 (100.0%) |
Household Vehicle Usage in Beebe
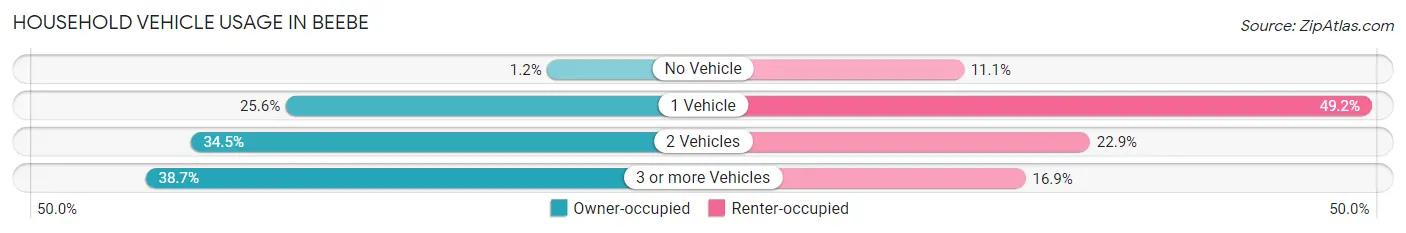
| Vehicles per Household | Owner-occupied | Renter-occupied |
| No Vehicle | 21 (1.2%) | 142 (11.1%) |
| 1 Vehicle | 451 (25.6%) | 630 (49.2%) |
| 2 Vehicles | 608 (34.5%) | 293 (22.9%) |
| 3 or more Vehicles | 682 (38.7%) | 216 (16.9%) |
| Total | 1,762 (100.0%) | 1,281 (100.0%) |
Real Estate & Mortgages in Beebe
Real Estate and Mortgage Overview in Beebe
| Characteristic | Without Mortgage | With Mortgage |
| Housing Units | 698 | 1,064 |
| Median Property Value | $98,900 | $155,200 |
| Median Household Income | $53,900 | $219 |
| Monthly Housing Costs | $305 | $99 |
| Real Estate Taxes | $581 | $23 |
Property Value by Mortgage Status in Beebe
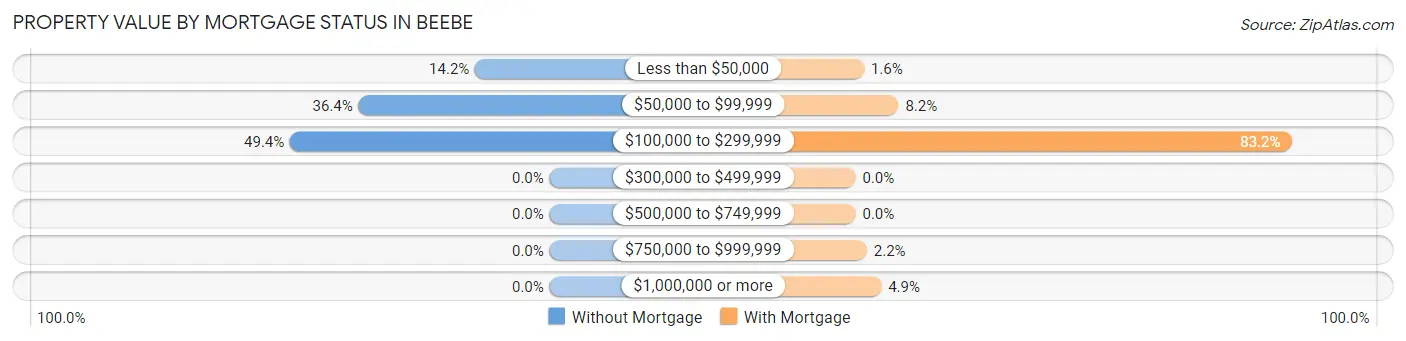
| Property Value | Without Mortgage | With Mortgage |
| Less than $50,000 | 99 (14.2%) | 17 (1.6%) |
| $50,000 to $99,999 | 254 (36.4%) | 87 (8.2%) |
| $100,000 to $299,999 | 345 (49.4%) | 885 (83.2%) |
| $300,000 to $499,999 | 0 (0.0%) | 0 (0.0%) |
| $500,000 to $749,999 | 0 (0.0%) | 0 (0.0%) |
| $750,000 to $999,999 | 0 (0.0%) | 23 (2.2%) |
| $1,000,000 or more | 0 (0.0%) | 52 (4.9%) |
| Total | 698 (100.0%) | 1,064 (100.0%) |
Household Income by Mortgage Status in Beebe
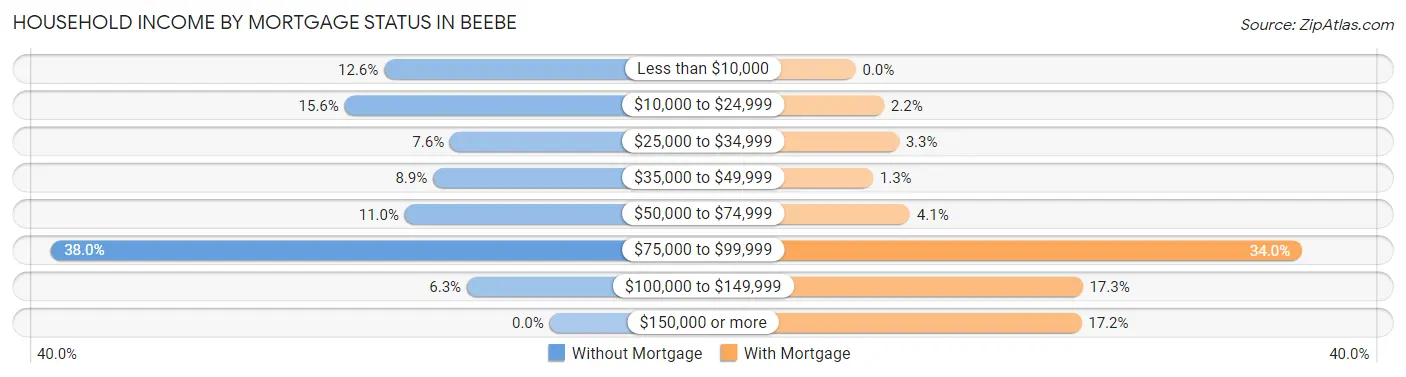
| Household Income | Without Mortgage | With Mortgage |
| Less than $10,000 | 88 (12.6%) | 0 (0.0%) |
| $10,000 to $24,999 | 109 (15.6%) | 23 (2.2%) |
| $25,000 to $34,999 | 53 (7.6%) | 35 (3.3%) |
| $35,000 to $49,999 | 62 (8.9%) | 14 (1.3%) |
| $50,000 to $74,999 | 77 (11.0%) | 44 (4.1%) |
| $75,000 to $99,999 | 265 (38.0%) | 362 (34.0%) |
| $100,000 to $149,999 | 44 (6.3%) | 184 (17.3%) |
| $150,000 or more | 0 (0.0%) | 183 (17.2%) |
| Total | 698 (100.0%) | 1,064 (100.0%) |
Property Value to Household Income Ratio in Beebe
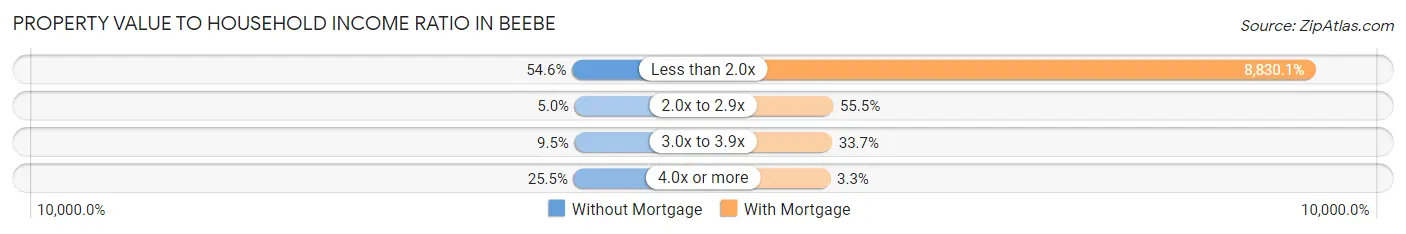
| Value-to-Income Ratio | Without Mortgage | With Mortgage |
| Less than 2.0x | 381 (54.6%) | 93,952 (8,830.1%) |
| 2.0x to 2.9x | 35 (5.0%) | 590 (55.4%) |
| 3.0x to 3.9x | 66 (9.5%) | 358 (33.7%) |
| 4.0x or more | 178 (25.5%) | 35 (3.3%) |
| Total | 698 (100.0%) | 1,064 (100.0%) |
Real Estate Taxes by Mortgage Status in Beebe
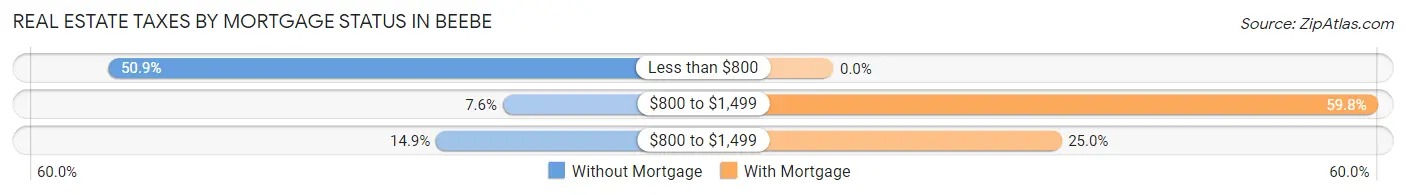
| Property Taxes | Without Mortgage | With Mortgage |
| Less than $800 | 355 (50.9%) | 0 (0.0%) |
| $800 to $1,499 | 53 (7.6%) | 636 (59.8%) |
| $800 to $1,499 | 104 (14.9%) | 266 (25.0%) |
| Total | 698 (100.0%) | 1,064 (100.0%) |
Health & Disability in Beebe
Health Insurance Coverage by Age in Beebe
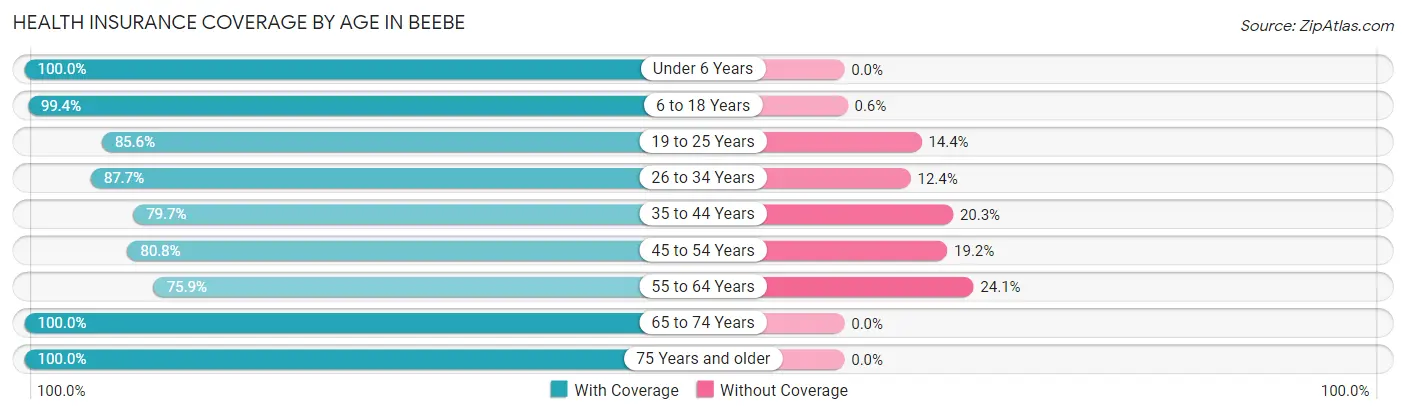
| Age Bracket | With Coverage | Without Coverage |
| Under 6 Years | 639 (100.0%) | 0 (0.0%) |
| 6 to 18 Years | 1,817 (99.4%) | 11 (0.6%) |
| 19 to 25 Years | 613 (85.6%) | 103 (14.4%) |
| 26 to 34 Years | 965 (87.6%) | 136 (12.3%) |
| 35 to 44 Years | 1,299 (79.7%) | 330 (20.3%) |
| 45 to 54 Years | 721 (80.8%) | 171 (19.2%) |
| 55 to 64 Years | 495 (75.9%) | 157 (24.1%) |
| 65 to 74 Years | 750 (100.0%) | 0 (0.0%) |
| 75 Years and older | 225 (100.0%) | 0 (0.0%) |
| Total | 7,524 (89.2%) | 908 (10.8%) |
Health Insurance Coverage by Citizenship Status in Beebe
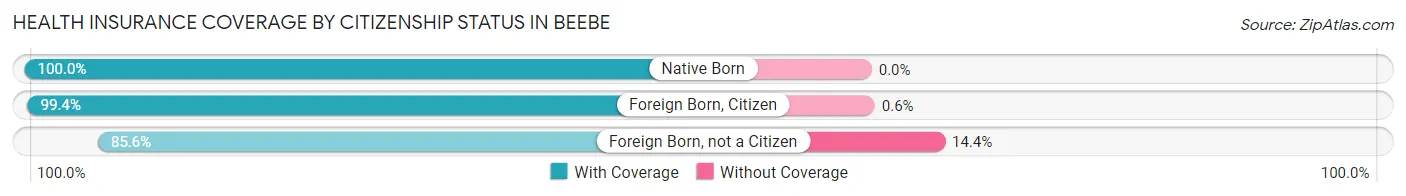
| Citizenship Status | With Coverage | Without Coverage |
| Native Born | 639 (100.0%) | 0 (0.0%) |
| Foreign Born, Citizen | 1,817 (99.4%) | 11 (0.6%) |
| Foreign Born, not a Citizen | 613 (85.6%) | 103 (14.4%) |
Health Insurance Coverage by Household Income in Beebe
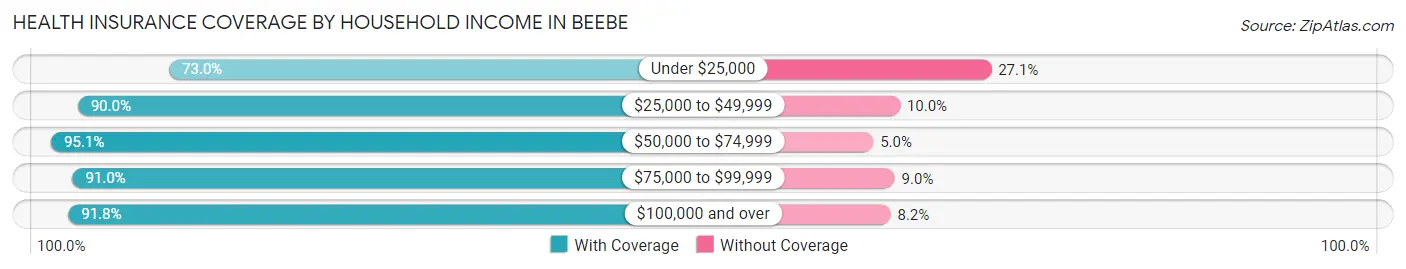
| Household Income | With Coverage | Without Coverage |
| Under $25,000 | 909 (73.0%) | 337 (27.1%) |
| $25,000 to $49,999 | 1,257 (90.0%) | 139 (10.0%) |
| $50,000 to $74,999 | 1,441 (95.1%) | 75 (5.0%) |
| $75,000 to $99,999 | 1,909 (91.0%) | 188 (9.0%) |
| $100,000 and over | 1,893 (91.8%) | 169 (8.2%) |
Public vs Private Health Insurance Coverage by Age in Beebe
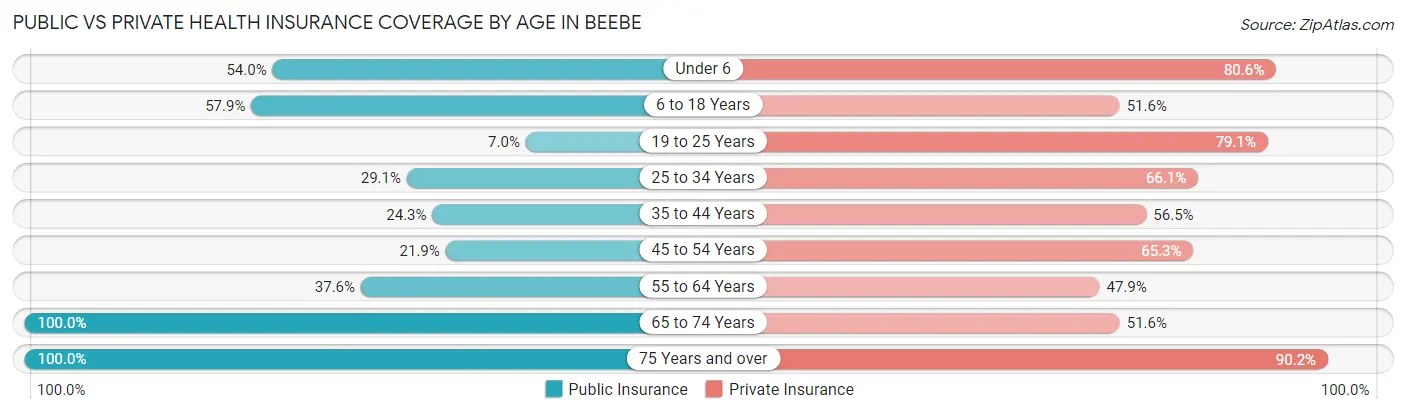
| Age Bracket | Public Insurance | Private Insurance |
| Under 6 | 345 (54.0%) | 515 (80.6%) |
| 6 to 18 Years | 1,059 (57.9%) | 943 (51.6%) |
| 19 to 25 Years | 50 (7.0%) | 566 (79.0%) |
| 25 to 34 Years | 320 (29.1%) | 728 (66.1%) |
| 35 to 44 Years | 396 (24.3%) | 921 (56.5%) |
| 45 to 54 Years | 195 (21.9%) | 582 (65.2%) |
| 55 to 64 Years | 245 (37.6%) | 312 (47.8%) |
| 65 to 74 Years | 750 (100.0%) | 387 (51.6%) |
| 75 Years and over | 225 (100.0%) | 203 (90.2%) |
| Total | 3,585 (42.5%) | 5,157 (61.2%) |
Disability Status by Sex by Age in Beebe
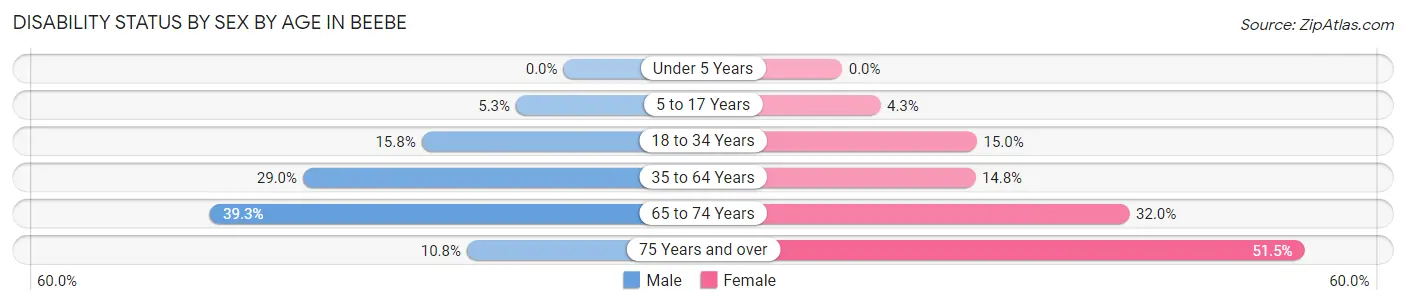
| Age Bracket | Male | Female |
| Under 5 Years | 0 (0.0%) | 0 (0.0%) |
| 5 to 17 Years | 40 (5.3%) | 42 (4.3%) |
| 18 to 34 Years | 130 (15.8%) | 162 (15.0%) |
| 35 to 64 Years | 492 (29.0%) | 219 (14.8%) |
| 65 to 74 Years | 118 (39.3%) | 144 (32.0%) |
| 75 Years and over | 10 (10.7%) | 68 (51.5%) |
Disability Class by Sex by Age in Beebe
Disability Class: Hearing Difficulty
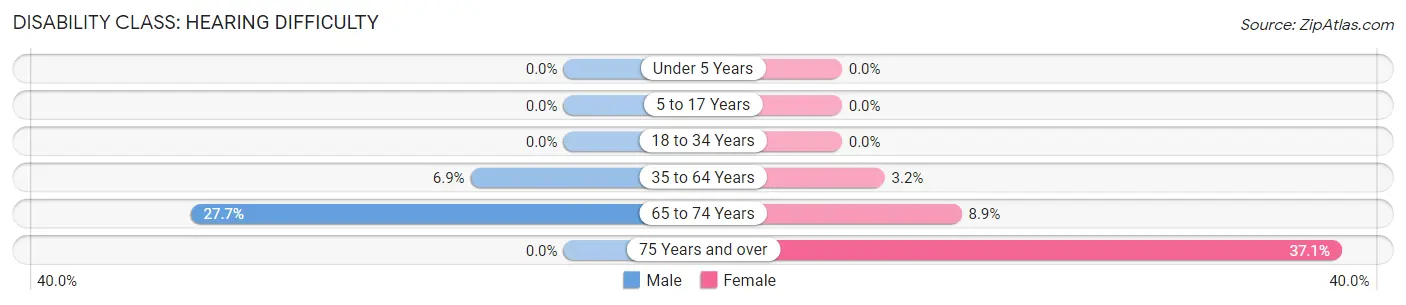
| Age Bracket | Male | Female |
| Under 5 Years | 0 (0.0%) | 0 (0.0%) |
| 5 to 17 Years | 0 (0.0%) | 0 (0.0%) |
| 18 to 34 Years | 0 (0.0%) | 0 (0.0%) |
| 35 to 64 Years | 117 (6.9%) | 47 (3.2%) |
| 65 to 74 Years | 83 (27.7%) | 40 (8.9%) |
| 75 Years and over | 0 (0.0%) | 49 (37.1%) |
Disability Class: Vision Difficulty
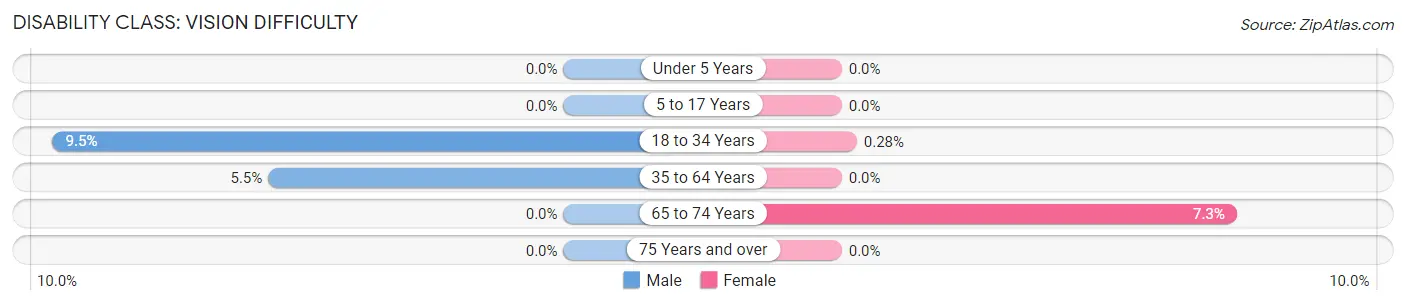
| Age Bracket | Male | Female |
| Under 5 Years | 0 (0.0%) | 0 (0.0%) |
| 5 to 17 Years | 0 (0.0%) | 0 (0.0%) |
| 18 to 34 Years | 78 (9.5%) | 3 (0.3%) |
| 35 to 64 Years | 93 (5.5%) | 0 (0.0%) |
| 65 to 74 Years | 0 (0.0%) | 33 (7.3%) |
| 75 Years and over | 0 (0.0%) | 0 (0.0%) |
Disability Class: Cognitive Difficulty
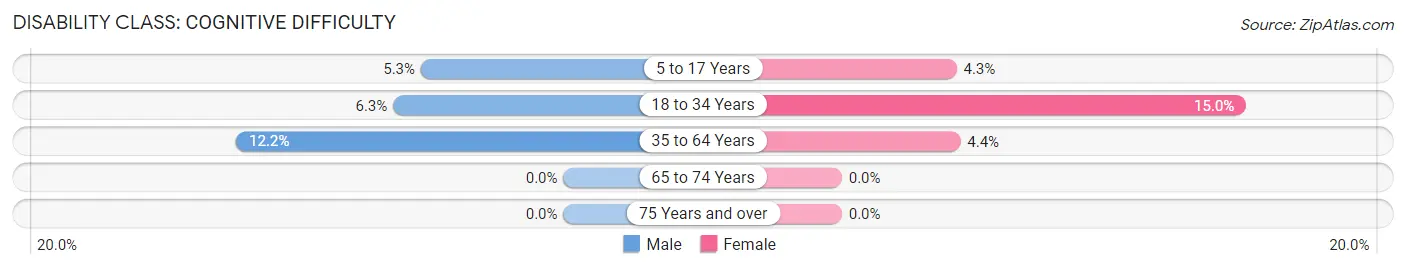
| Age Bracket | Male | Female |
| 5 to 17 Years | 40 (5.3%) | 42 (4.3%) |
| 18 to 34 Years | 52 (6.3%) | 162 (15.0%) |
| 35 to 64 Years | 206 (12.1%) | 65 (4.4%) |
| 65 to 74 Years | 0 (0.0%) | 0 (0.0%) |
| 75 Years and over | 0 (0.0%) | 0 (0.0%) |
Disability Class: Ambulatory Difficulty
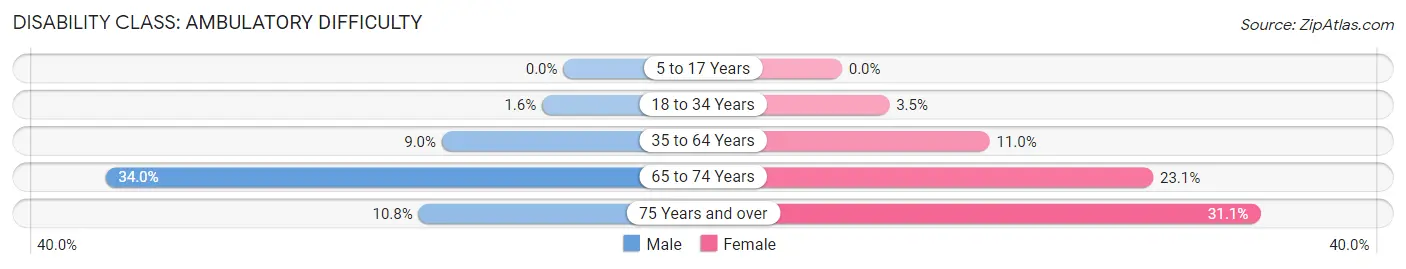
| Age Bracket | Male | Female |
| 5 to 17 Years | 0 (0.0%) | 0 (0.0%) |
| 18 to 34 Years | 13 (1.6%) | 38 (3.5%) |
| 35 to 64 Years | 153 (9.0%) | 162 (11.0%) |
| 65 to 74 Years | 102 (34.0%) | 104 (23.1%) |
| 75 Years and over | 10 (10.7%) | 41 (31.1%) |
Disability Class: Self-Care Difficulty
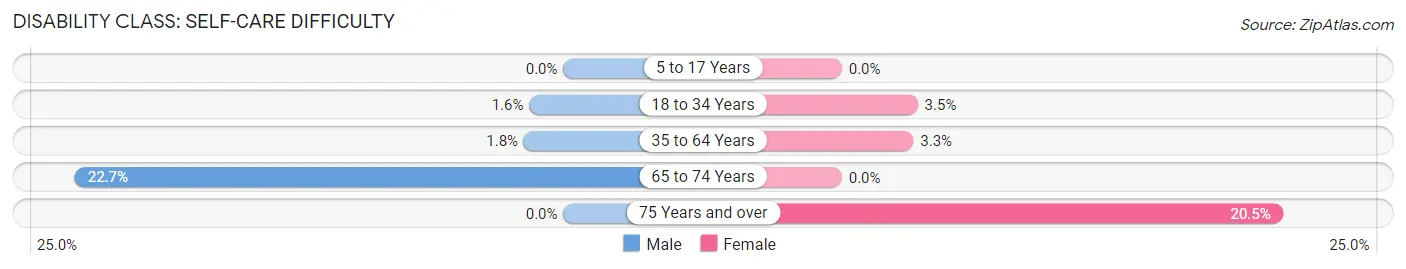
| Age Bracket | Male | Female |
| 5 to 17 Years | 0 (0.0%) | 0 (0.0%) |
| 18 to 34 Years | 13 (1.6%) | 38 (3.5%) |
| 35 to 64 Years | 31 (1.8%) | 49 (3.3%) |
| 65 to 74 Years | 68 (22.7%) | 0 (0.0%) |
| 75 Years and over | 0 (0.0%) | 27 (20.4%) |
Technology Access in Beebe
Computing Device Access in Beebe
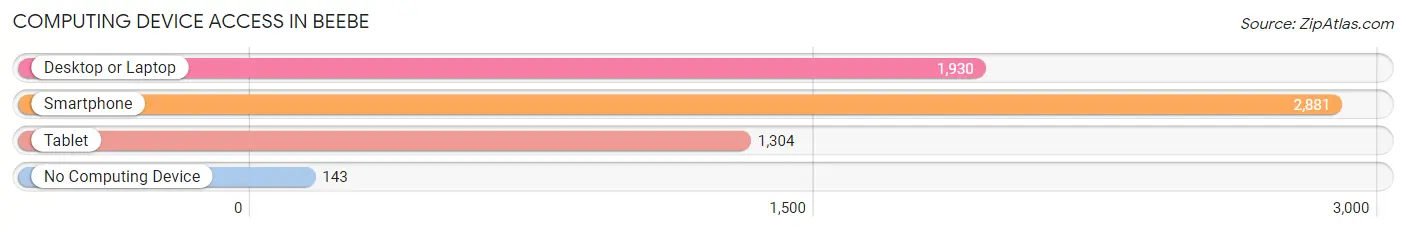
| Device Type | # Households | % Households |
| Desktop or Laptop | 1,930 | 63.4% |
| Smartphone | 2,881 | 94.7% |
| Tablet | 1,304 | 42.8% |
| No Computing Device | 143 | 4.7% |
| Total | 3,043 | 100.0% |
Internet Access in Beebe
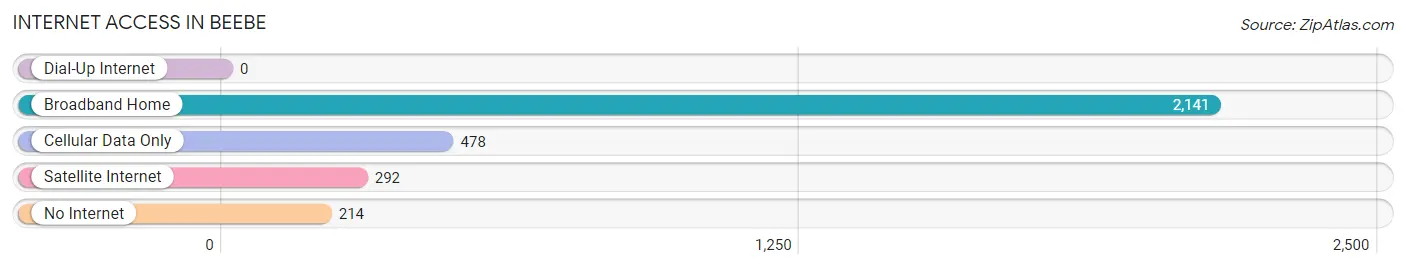
| Internet Type | # Households | % Households |
| Dial-Up Internet | 0 | 0.0% |
| Broadband Home | 2,141 | 70.4% |
| Cellular Data Only | 478 | 15.7% |
| Satellite Internet | 292 | 9.6% |
| No Internet | 214 | 7.0% |
| Total | 3,043 | 100.0% |
Beebe Summary
Beebe, Arkansas is a city located in White County, Arkansas, United States. It is situated in the foothills of the Ozark Mountains, approximately 40 miles northeast of Little Rock. The city has a population of approximately 7,400 people, according to the 2010 census.
History
Beebe was founded in 1875 by William A. Beebe, a former Confederate soldier. The city was originally known as Beebe’s Station, and was a stop on the St. Louis, Iron Mountain and Southern Railway. The city was incorporated in 1891, and the name was changed to Beebe in 1895.
In the early 1900s, Beebe was a thriving agricultural community, with cotton, corn, and wheat being the main crops. The city also had a thriving lumber industry, with several sawmills located in the area.
In the 1950s, Beebe began to experience a population boom, as many people moved to the city from other parts of the state. This growth was largely due to the city’s proximity to Little Rock, which was experiencing a population boom of its own.
Geography
Beebe is located in the foothills of the Ozark Mountains, approximately 40 miles northeast of Little Rock. The city is situated in White County, and is bordered by the cities of Searcy, Cabot, and Jacksonville.
The city has a total area of 8.3 square miles, of which 8.2 square miles is land and 0.1 square miles is water. The city is located at an elevation of 545 feet above sea level.
Economy
Beebe’s economy is largely based on agriculture and manufacturing. The city is home to several large poultry processing plants, as well as a number of smaller businesses.
The city is also home to several large retail stores including Walmart Lowe s and Home Depot
Demographics
According to the 2010 census, Beebe has a population of 7,400 people. The racial makeup of the city is 79.3% White, 17.2% African American, 0.7% Native American, 0.7% Asian, 0.2% Pacific Islander, and 1.9% from other races.
The median household income in Beebe is $37,941, and the median family income is $45,938. The per capita income in Beebe is $19,845.
Conclusion
Beebe, Arkansas is a city located in White County, Arkansas, United States. It is situated in the foothills of the Ozark Mountains, approximately 40 miles northeast of Little Rock. The city has a population of approximately 7,400 people, according to the 2010 census. Beebe’s economy is largely based on agriculture and manufacturing, and the city is home to several large retail stores. The racial makeup of the city is 79.3% White, 17.2% African American, 0.7% Native American, 0.7% Asian, 0.2% Pacific Islander, and 1.9% from other races. The median household income in Beebe is $37,941, and the median family income is $45,938.
Common Questions
What is Per Capita Income in Beebe?
Per Capita income in Beebe is $27,111.
What is the Median Family Income in Beebe?
Median Family Income in Beebe is $66,968.
What is the Median Household income in Beebe?
Median Household Income in Beebe is $55,072.
What is Income or Wage Gap in Beebe?
Income or Wage Gap in Beebe is 46.0%.
Women in Beebe earn 54.0 cents for every dollar earned by a man.
What is Inequality or Gini Index in Beebe?
Inequality or Gini Index in Beebe is 0.44.
What is the Total Population of Beebe?
Total Population of Beebe is 8,447.
What is the Total Male Population of Beebe?
Total Male Population of Beebe is 4,130.
What is the Total Female Population of Beebe?
Total Female Population of Beebe is 4,317.
What is the Ratio of Males per 100 Females in Beebe?
There are 95.67 Males per 100 Females in Beebe.
What is the Ratio of Females per 100 Males in Beebe?
There are 104.53 Females per 100 Males in Beebe.
What is the Median Population Age in Beebe?
Median Population Age in Beebe is 34.5 Years.
What is the Average Family Size in Beebe
Average Family Size in Beebe is 3.2 People.
What is the Average Household Size in Beebe
Average Household Size in Beebe is 2.7 People.
How Large is the Labor Force in Beebe?
There are 3,816 People in the Labor Forcein in Beebe.
What is the Percentage of People in the Labor Force in Beebe?
60.1% of People are in the Labor Force in Beebe.
What is the Unemployment Rate in Beebe?
Unemployment Rate in Beebe is 1.3%.