Bay, AR Map & Demographics
Bay Map
Bay Overview
$20,719
PER CAPITA INCOME
$61,911
AVG FAMILY INCOME
$58,036
AVG HOUSEHOLD INCOME
29.2%
WAGE / INCOME GAP [ % ]
70.8¢/ $1
WAGE / INCOME GAP [ $ ]
$9,820
FAMILY INCOME DEFICIT
0.36
INEQUALITY / GINI INDEX
2,392
TOTAL POPULATION
1,177
MALE POPULATION
1,215
FEMALE POPULATION
96.87
MALES / 100 FEMALES
103.23
FEMALES / 100 MALES
31.5
MEDIAN AGE
3.0
AVG FAMILY SIZE
2.8
AVG HOUSEHOLD SIZE
1,026
LABOR FORCE [ PEOPLE ]
62.2%
PERCENT IN LABOR FORCE
6.6%
UNEMPLOYMENT RATE
Bay Zip Codes
Bay Area Codes
Income in Bay
Income Overview in Bay
Per Capita Income in Bay is $20,719, while median incomes of families and households are $61,911 and $58,036 respectively.
| Characteristic | Number | Measure |
| Per Capita Income | 2,392 | $20,719 |
| Median Family Income | 681 | $61,911 |
| Mean Family Income | 681 | $65,939 |
| Median Household Income | 850 | $58,036 |
| Mean Household Income | 850 | $61,394 |
| Income Deficit | 681 | $9,820 |
| Wage / Income Gap (%) | 2,392 | 29.20% |
| Wage / Income Gap ($) | 2,392 | 70.80¢ per $1 |
| Gini / Inequality Index | 2,392 | 0.36 |
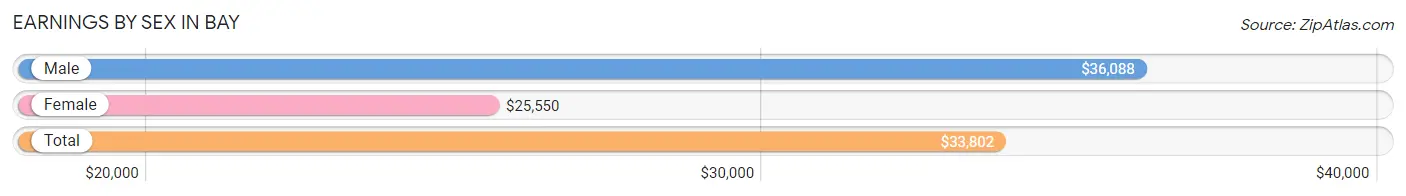
Earnings by Sex in Bay
Average Earnings in Bay are $33,802, $36,088 for men and $25,550 for women, a difference of 29.2%.
| Sex | Number | Average Earnings |
| Male | 543 (50.4%) | $36,088 |
| Female | 535 (49.6%) | $25,550 |
| Total | 1,078 (100.0%) | $33,802 |
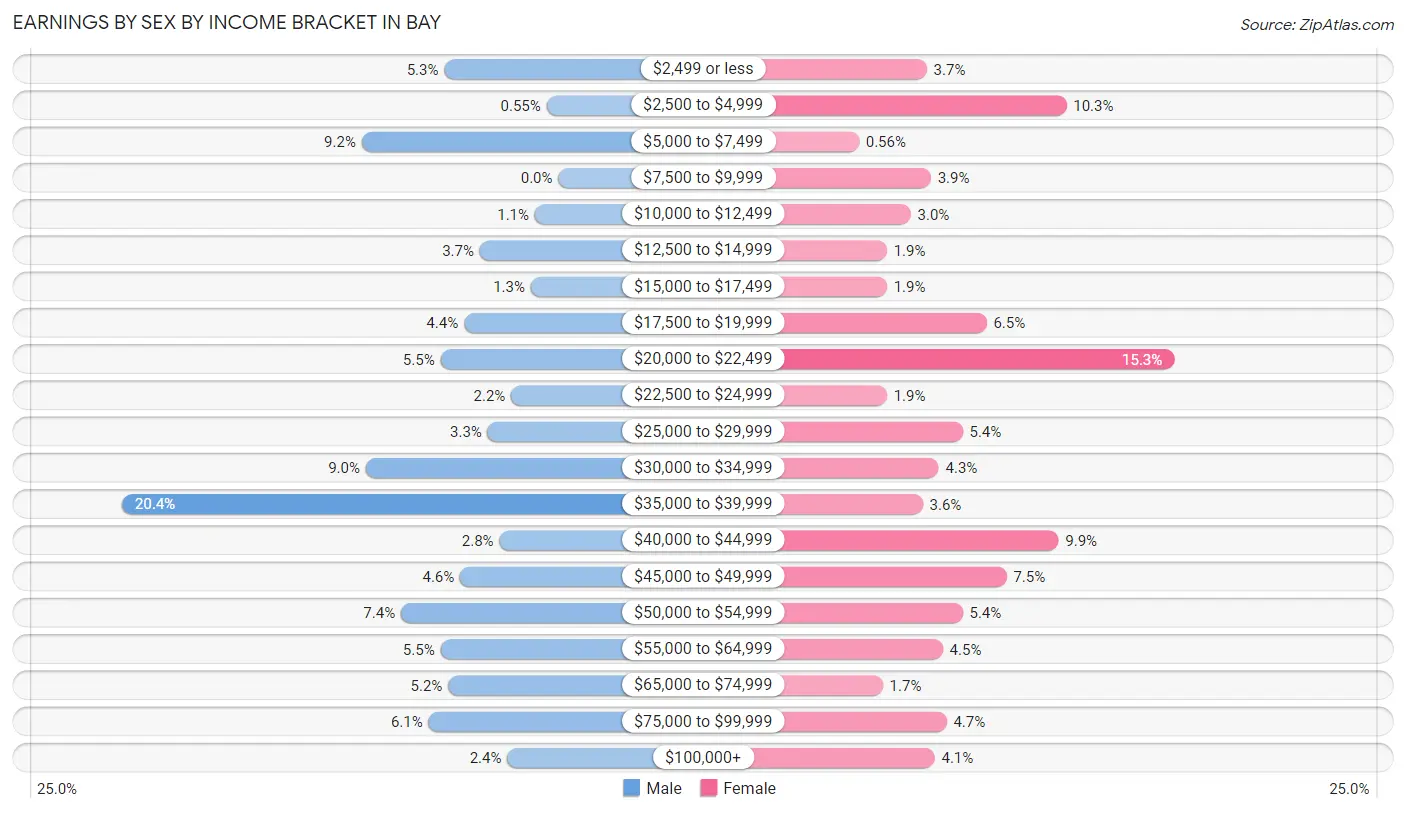
Earnings by Sex by Income Bracket in Bay
The most common earnings brackets in Bay are $35,000 to $39,999 for men (111 | 20.4%) and $20,000 to $22,499 for women (82 | 15.3%).
| Income | Male | Female |
| $2,499 or less | 29 (5.3%) | 20 (3.7%) |
| $2,500 to $4,999 | 3 (0.5%) | 55 (10.3%) |
| $5,000 to $7,499 | 50 (9.2%) | 3 (0.6%) |
| $7,500 to $9,999 | 0 (0.0%) | 21 (3.9%) |
| $10,000 to $12,499 | 6 (1.1%) | 16 (3.0%) |
| $12,500 to $14,999 | 20 (3.7%) | 10 (1.9%) |
| $15,000 to $17,499 | 7 (1.3%) | 10 (1.9%) |
| $17,500 to $19,999 | 24 (4.4%) | 35 (6.5%) |
| $20,000 to $22,499 | 30 (5.5%) | 82 (15.3%) |
| $22,500 to $24,999 | 12 (2.2%) | 10 (1.9%) |
| $25,000 to $29,999 | 18 (3.3%) | 29 (5.4%) |
| $30,000 to $34,999 | 49 (9.0%) | 23 (4.3%) |
| $35,000 to $39,999 | 111 (20.4%) | 19 (3.5%) |
| $40,000 to $44,999 | 15 (2.8%) | 53 (9.9%) |
| $45,000 to $49,999 | 25 (4.6%) | 40 (7.5%) |
| $50,000 to $54,999 | 40 (7.4%) | 29 (5.4%) |
| $55,000 to $64,999 | 30 (5.5%) | 24 (4.5%) |
| $65,000 to $74,999 | 28 (5.2%) | 9 (1.7%) |
| $75,000 to $99,999 | 33 (6.1%) | 25 (4.7%) |
| $100,000+ | 13 (2.4%) | 22 (4.1%) |
| Total | 543 (100.0%) | 535 (100.0%) |
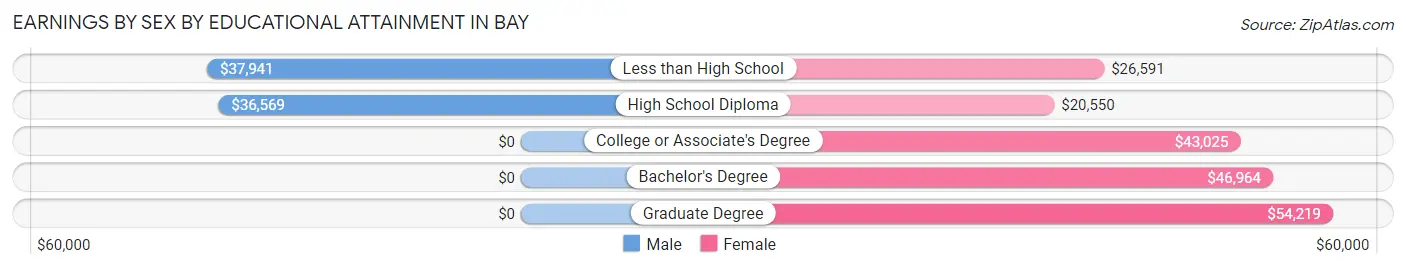
Earnings by Sex by Educational Attainment in Bay
Average earnings in Bay are $36,412 for men and $31,528 for women, a difference of 13.4%. Men with an educational attainment of less than high school enjoy the highest average annual earnings of $37,941, while those with high school diploma education earn the least with $36,569. Women with an educational attainment of graduate degree earn the most with the average annual earnings of $54,219, while those with high school diploma education have the smallest earnings of $20,550.
| Educational Attainment | Male Income | Female Income |
| Less than High School | $37,941 | $26,591 |
| High School Diploma | $36,569 | $20,550 |
| College or Associate's Degree | - | - |
| Bachelor's Degree | - | - |
| Graduate Degree | - | - |
| Total | $36,412 | $31,528 |
Family Income in Bay
Family Income Brackets in Bay
According to the Bay family income data, there are 162 families falling into the $75,000 to $99,999 income range, which is the most common income bracket and makes up 23.8% of all families.
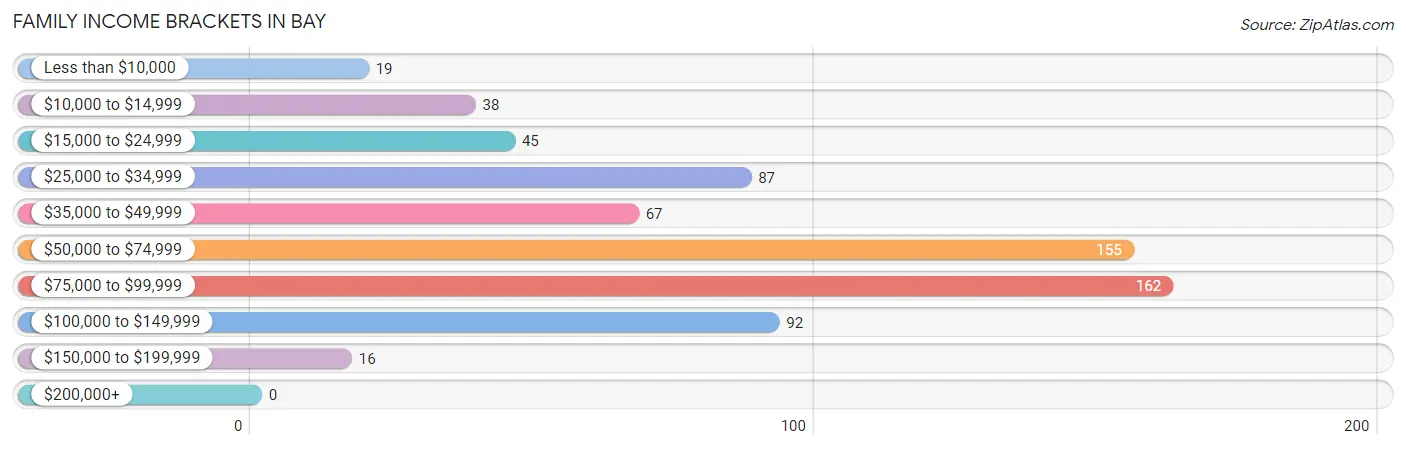
| Income Bracket | # Families | % Families |
| Less than $10,000 | 19 | 2.8% |
| $10,000 to $14,999 | 38 | 5.6% |
| $15,000 to $24,999 | 45 | 6.6% |
| $25,000 to $34,999 | 87 | 12.8% |
| $35,000 to $49,999 | 67 | 9.8% |
| $50,000 to $74,999 | 155 | 22.8% |
| $75,000 to $99,999 | 162 | 23.8% |
| $100,000 to $149,999 | 92 | 13.5% |
| $150,000 to $199,999 | 16 | 2.3% |
| $200,000+ | 0 | 0.0% |
Family Income by Famaliy Size in Bay
5-person families (52 | 7.6%) account for the highest median family income in Bay with $81,375 per family, while 2-person families (299 | 43.9%) have the highest median income of $30,512 per family member.
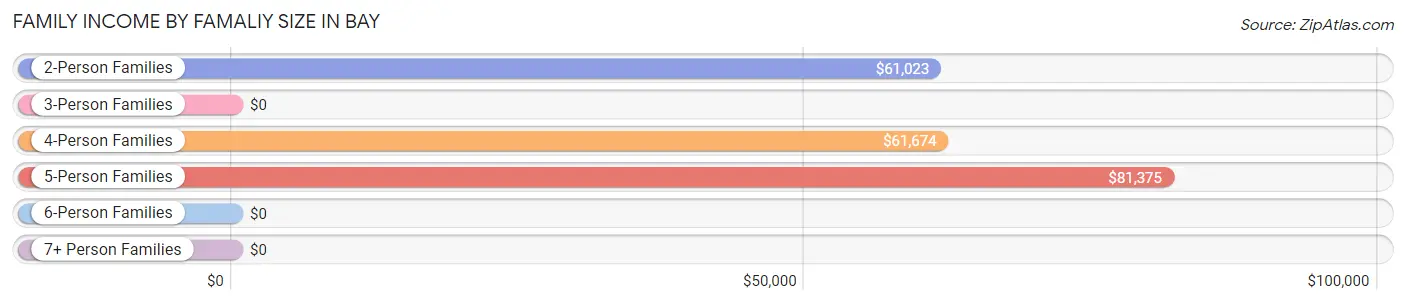
| Income Bracket | # Families | Median Income |
| 2-Person Families | 299 (43.9%) | $61,023 |
| 3-Person Families | 151 (22.2%) | $0 |
| 4-Person Families | 161 (23.6%) | $61,674 |
| 5-Person Families | 52 (7.6%) | $81,375 |
| 6-Person Families | 5 (0.7%) | $0 |
| 7+ Person Families | 13 (1.9%) | $0 |
| Total | 681 (100.0%) | $61,911 |
Family Income by Number of Earners in Bay
The median family income in Bay is $61,911, with families comprising 3+ earners (54) having the highest median family income of $97,778, while families with no earners (116) have the lowest median family income of $22,167, accounting for 7.9% and 17.0% of families, respectively.
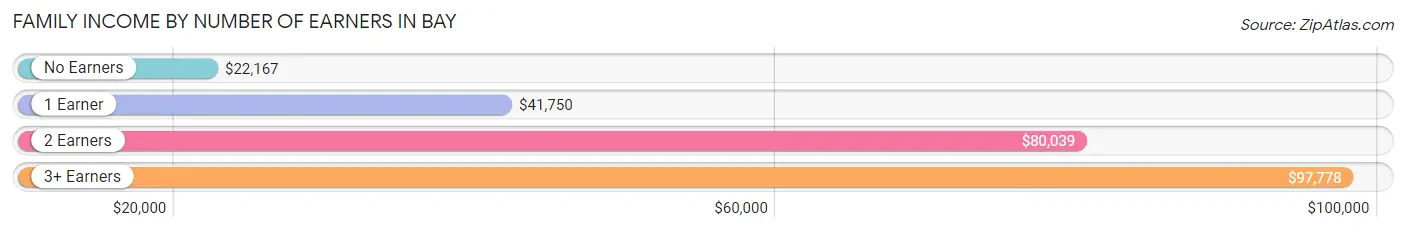
| Number of Earners | # Families | Median Income |
| No Earners | 116 (17.0%) | $22,167 |
| 1 Earner | 200 (29.4%) | $41,750 |
| 2 Earners | 311 (45.7%) | $80,039 |
| 3+ Earners | 54 (7.9%) | $97,778 |
| Total | 681 (100.0%) | $61,911 |
Household Income in Bay
Household Income Brackets in Bay
With 202 households falling in the category, the $50,000 to $74,999 income range is the most frequent in Bay, accounting for 23.8% of all households.
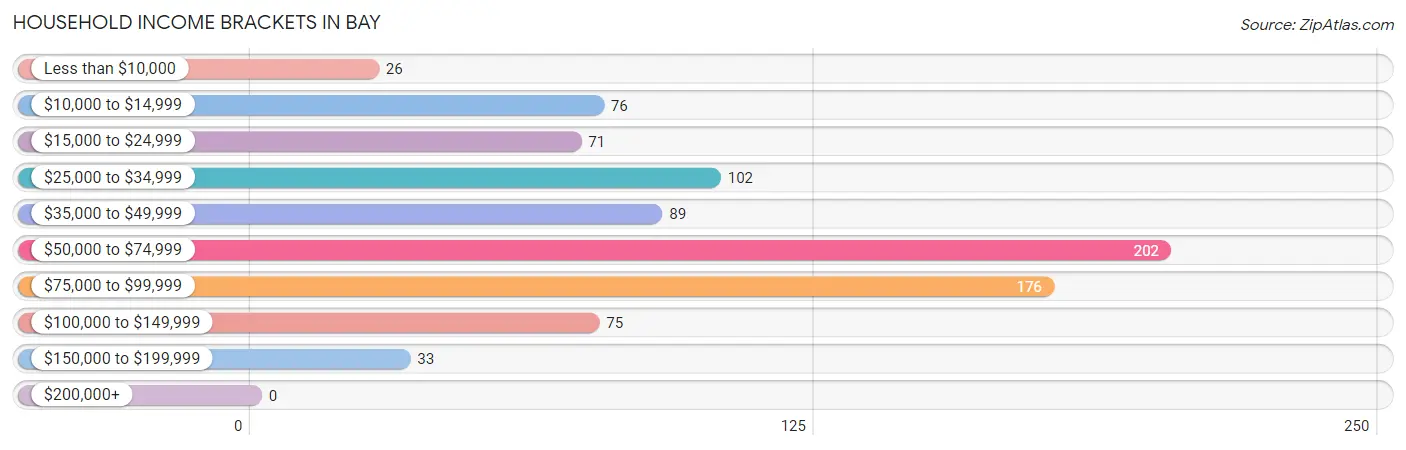
| Income Bracket | # Households | % Households |
| Less than $10,000 | 26 | 3.1% |
| $10,000 to $14,999 | 76 | 8.9% |
| $15,000 to $24,999 | 71 | 8.4% |
| $25,000 to $34,999 | 102 | 12.0% |
| $35,000 to $49,999 | 89 | 10.5% |
| $50,000 to $74,999 | 202 | 23.8% |
| $75,000 to $99,999 | 176 | 20.7% |
| $100,000 to $149,999 | 75 | 8.8% |
| $150,000 to $199,999 | 33 | 3.9% |
| $200,000+ | 0 | 0.0% |
Household Income by Householder Age in Bay
The median household income in Bay is $58,036, with the highest median household income of $74,688 found in the 45 to 64 years age bracket for the primary householder. A total of 353 households (41.5%) fall into this category. Meanwhile, the 15 to 24 years age bracket for the primary householder has the lowest median household income of $26,458, with 13 households (1.5%) in this group.
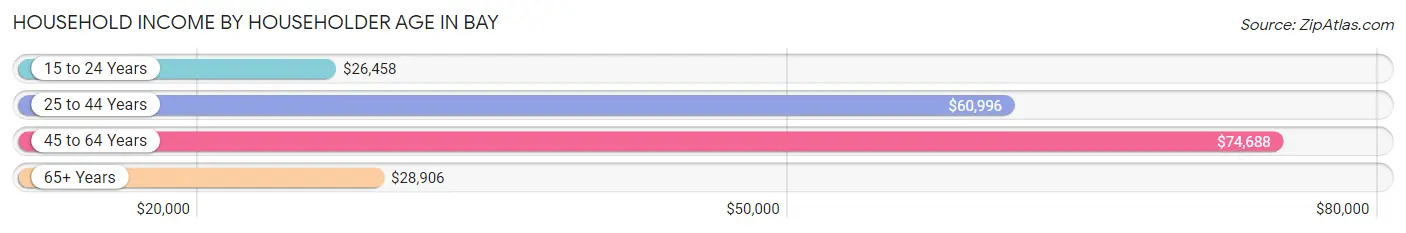
| Income Bracket | # Households | Median Income |
| 15 to 24 Years | 13 (1.5%) | $26,458 |
| 25 to 44 Years | 293 (34.5%) | $60,996 |
| 45 to 64 Years | 353 (41.5%) | $74,688 |
| 65+ Years | 191 (22.5%) | $28,906 |
| Total | 850 (100.0%) | $58,036 |
Poverty in Bay
Income Below Poverty by Sex and Age in Bay
With 14.6% poverty level for males and 22.2% for females among the residents of Bay, 16 and 17 year old males and 16 and 17 year old females are the most vulnerable to poverty, with 11 males (52.4%) and 18 females (66.7%) in their respective age groups living below the poverty level.
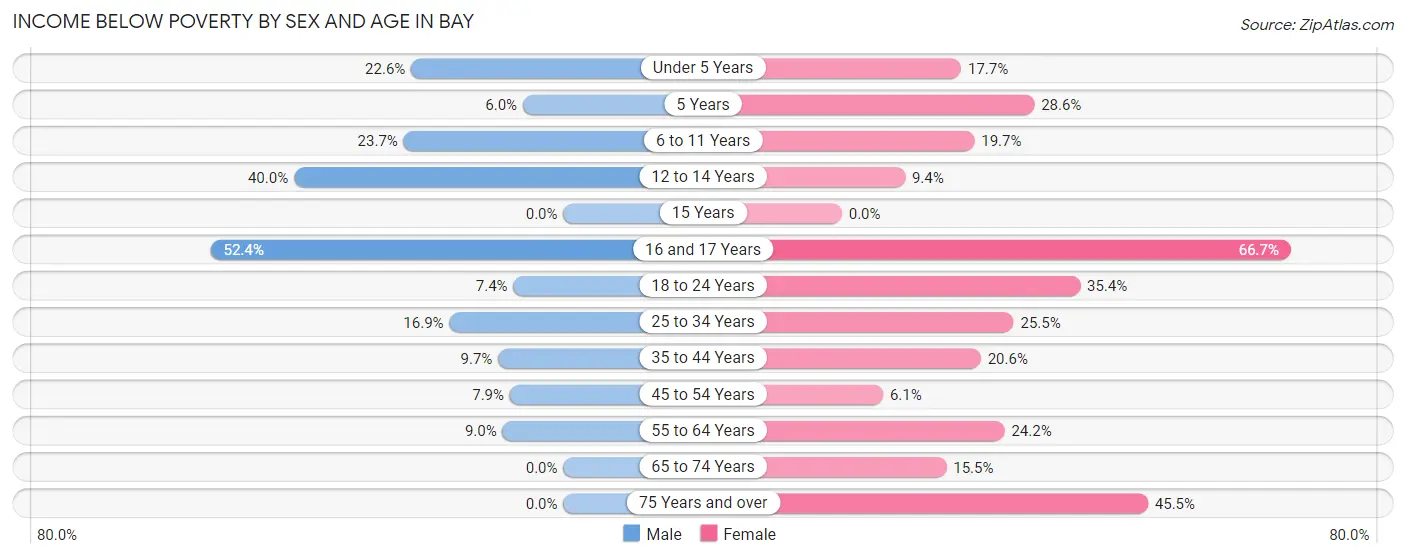
| Age Bracket | Male | Female |
| Under 5 Years | 47 (22.6%) | 17 (17.7%) |
| 5 Years | 3 (6.0%) | 2 (28.6%) |
| 6 to 11 Years | 23 (23.7%) | 24 (19.7%) |
| 12 to 14 Years | 16 (40.0%) | 3 (9.4%) |
| 15 Years | 0 (0.0%) | 0 (0.0%) |
| 16 and 17 Years | 11 (52.4%) | 18 (66.7%) |
| 18 to 24 Years | 4 (7.4%) | 23 (35.4%) |
| 25 to 34 Years | 33 (16.9%) | 50 (25.5%) |
| 35 to 44 Years | 9 (9.7%) | 26 (20.6%) |
| 45 to 54 Years | 10 (7.9%) | 8 (6.1%) |
| 55 to 64 Years | 14 (9.0%) | 43 (24.2%) |
| 65 to 74 Years | 0 (0.0%) | 18 (15.5%) |
| 75 Years and over | 0 (0.0%) | 25 (45.5%) |
| Total | 170 (14.6%) | 257 (22.2%) |
Income Above Poverty by Sex and Age in Bay
According to the poverty statistics in Bay, males aged 15 years and females aged 15 years are the age groups that are most secure financially, with 100.0% of males and 100.0% of females in these age groups living above the poverty line.
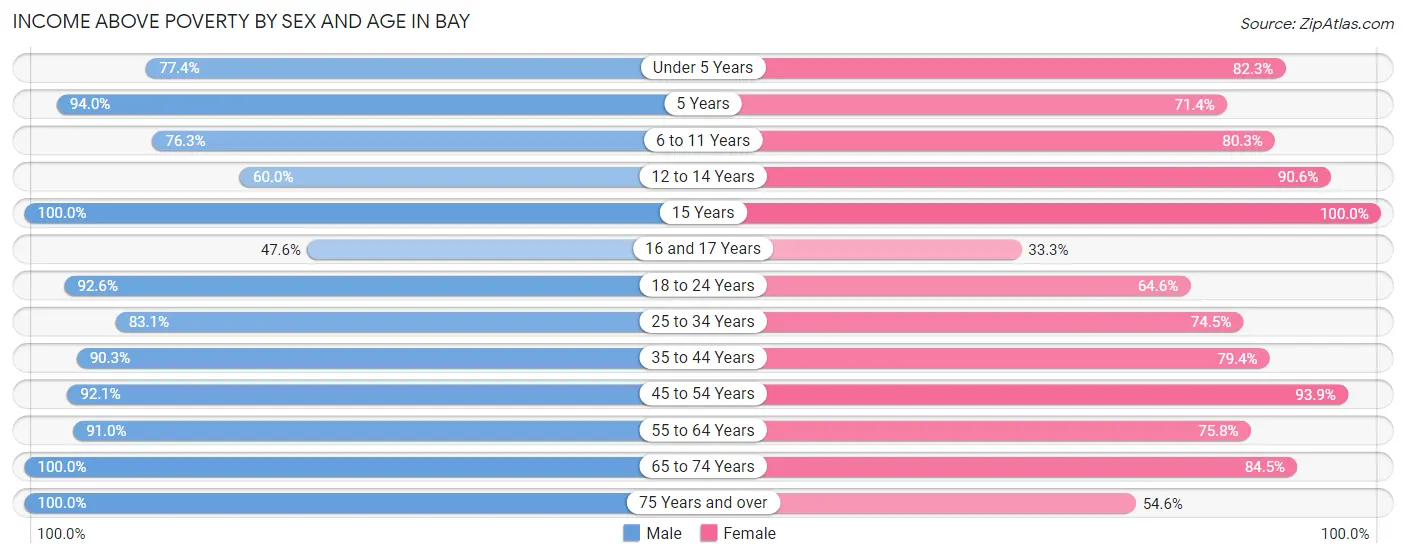
| Age Bracket | Male | Female |
| Under 5 Years | 161 (77.4%) | 79 (82.3%) |
| 5 Years | 47 (94.0%) | 5 (71.4%) |
| 6 to 11 Years | 74 (76.3%) | 98 (80.3%) |
| 12 to 14 Years | 24 (60.0%) | 29 (90.6%) |
| 15 Years | 11 (100.0%) | 9 (100.0%) |
| 16 and 17 Years | 10 (47.6%) | 9 (33.3%) |
| 18 to 24 Years | 50 (92.6%) | 42 (64.6%) |
| 25 to 34 Years | 162 (83.1%) | 146 (74.5%) |
| 35 to 44 Years | 84 (90.3%) | 100 (79.4%) |
| 45 to 54 Years | 116 (92.1%) | 123 (93.9%) |
| 55 to 64 Years | 141 (91.0%) | 135 (75.8%) |
| 65 to 74 Years | 70 (100.0%) | 98 (84.5%) |
| 75 Years and over | 42 (100.0%) | 30 (54.5%) |
| Total | 992 (85.4%) | 903 (77.8%) |
Income Below Poverty Among Married-Couple Families in Bay
The poverty statistics for married-couple families in Bay show that 4.9% or 23 of the total 469 families live below the poverty line. Families with 5 or more children have the highest poverty rate of 50.0%, comprising of 3 families. On the other hand, families with 1 or 2 children have the lowest poverty rate of 3.7%, which includes 6 families.
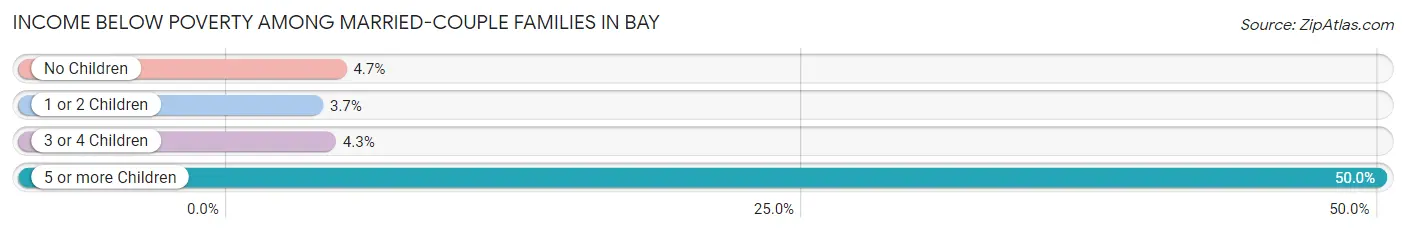
| Children | Above Poverty | Below Poverty |
| No Children | 242 (95.3%) | 12 (4.7%) |
| 1 or 2 Children | 156 (96.3%) | 6 (3.7%) |
| 3 or 4 Children | 45 (95.7%) | 2 (4.3%) |
| 5 or more Children | 3 (50.0%) | 3 (50.0%) |
| Total | 446 (95.1%) | 23 (4.9%) |
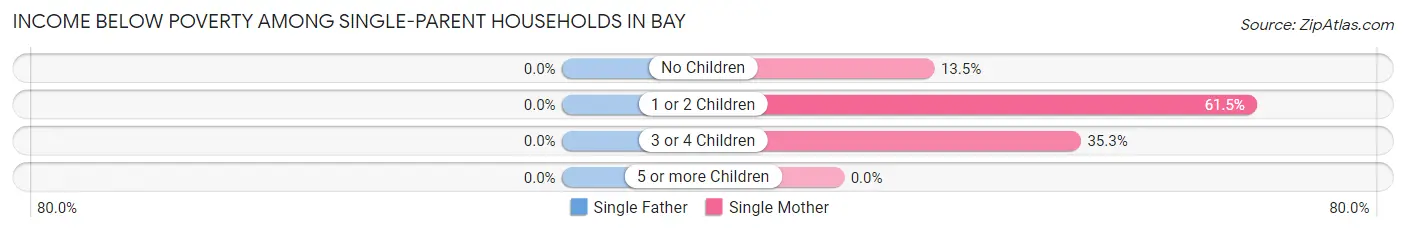
Income Below Poverty Among Single-Parent Households in Bay
| Children | Single Father | Single Mother |
| No Children | 0 (0.0%) | 7 (13.5%) |
| 1 or 2 Children | 0 (0.0%) | 56 (61.5%) |
| 3 or 4 Children | 0 (0.0%) | 6 (35.3%) |
| 5 or more Children | 0 (0.0%) | 0 (0.0%) |
| Total | 0 (0.0%) | 69 (43.1%) |
Income Below Poverty Among Married-Couple vs Single-Parent Households in Bay
The poverty data for Bay shows that 23 of the married-couple family households (4.9%) and 69 of the single-parent households (32.6%) are living below the poverty level. Within the married-couple family households, those with 5 or more children have the highest poverty rate, with 3 households (50.0%) falling below the poverty line. Among the single-parent households, those with 1 or 2 children have the highest poverty rate, with 56 household (47.9%) living below poverty.
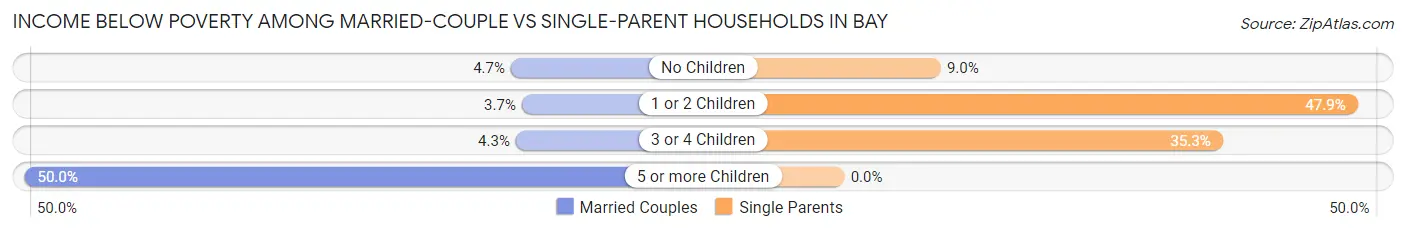
| Children | Married-Couple Families | Single-Parent Households |
| No Children | 12 (4.7%) | 7 (9.0%) |
| 1 or 2 Children | 6 (3.7%) | 56 (47.9%) |
| 3 or 4 Children | 2 (4.3%) | 6 (35.3%) |
| 5 or more Children | 3 (50.0%) | 0 (0.0%) |
| Total | 23 (4.9%) | 69 (32.6%) |
Race in Bay
The most populous races in Bay are White / Caucasian (2,273 | 95.0%), Two or more Races (80 | 3.3%), and Black / African American (36 | 1.5%).
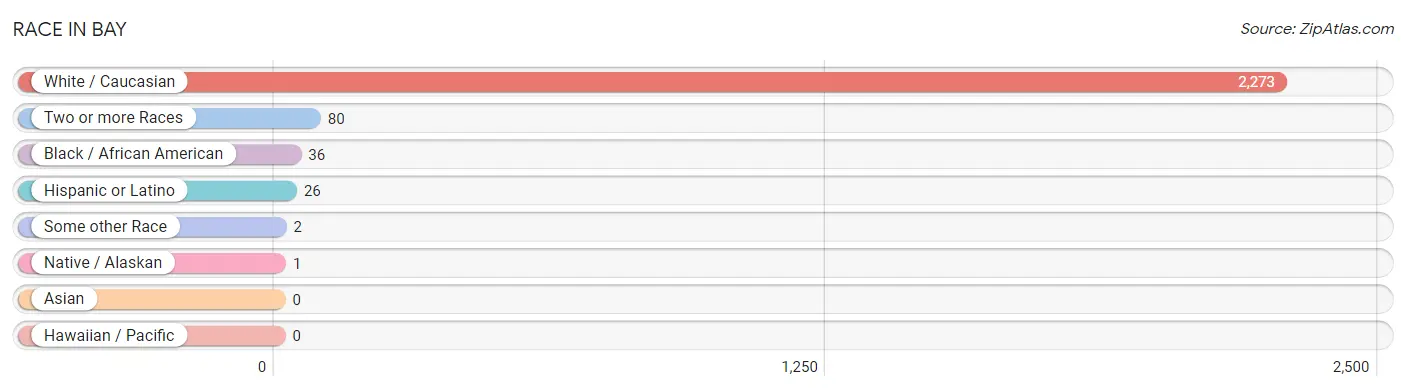
| Race | # Population | % Population |
| Asian | 0 | 0.0% |
| Black / African American | 36 | 1.5% |
| Hawaiian / Pacific | 0 | 0.0% |
| Hispanic or Latino | 26 | 1.1% |
| Native / Alaskan | 1 | 0.0% |
| White / Caucasian | 2,273 | 95.0% |
| Two or more Races | 80 | 3.3% |
| Some other Race | 2 | 0.1% |
| Total | 2,392 | 100.0% |
Ancestry in Bay
The most populous ancestries reported in Bay are German (474 | 19.8%), Irish (349 | 14.6%), American (314 | 13.1%), Scottish (250 | 10.4%), and English (242 | 10.1%), together accounting for 68.1% of all Bay residents.
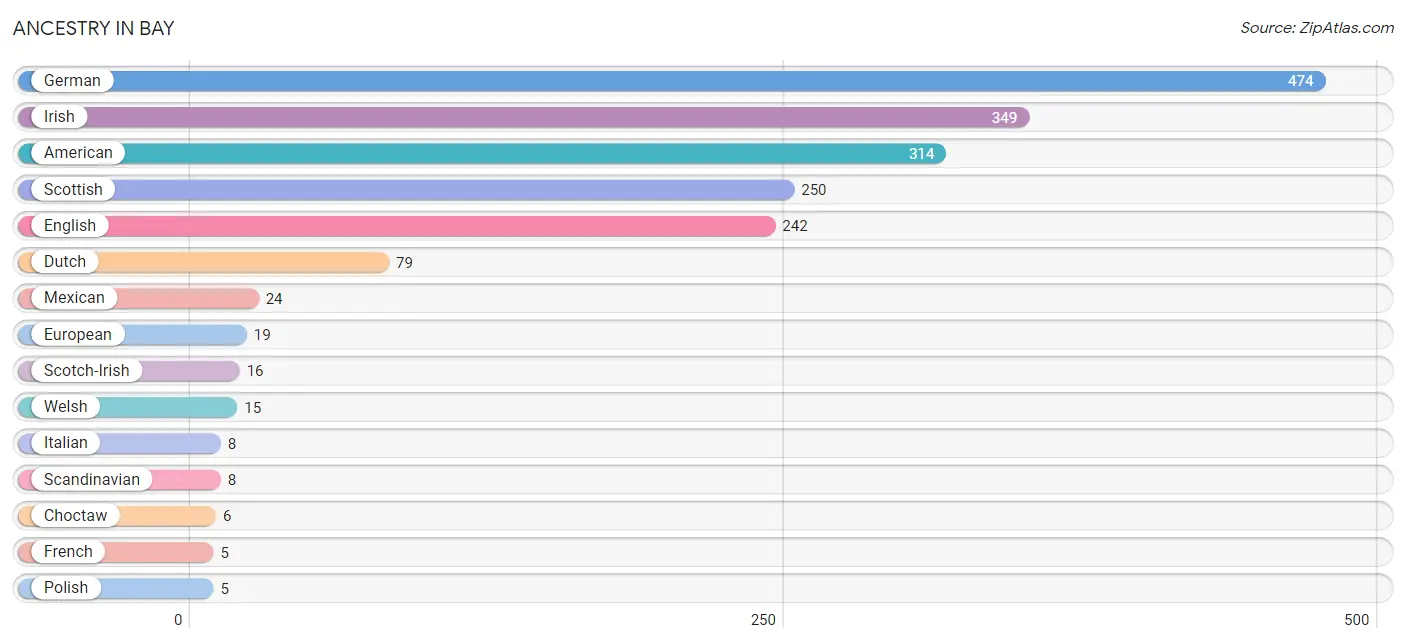
| Ancestry | # Population | % Population |
| American | 314 | 13.1% |
| Chickasaw | 1 | 0.0% |
| Choctaw | 6 | 0.3% |
| Dutch | 79 | 3.3% |
| Ecuadorian | 2 | 0.1% |
| English | 242 | 10.1% |
| European | 19 | 0.8% |
| Finnish | 2 | 0.1% |
| French | 5 | 0.2% |
| German | 474 | 19.8% |
| Irish | 349 | 14.6% |
| Italian | 8 | 0.3% |
| Mexican | 24 | 1.0% |
| Norwegian | 1 | 0.0% |
| Polish | 5 | 0.2% |
| Scandinavian | 8 | 0.3% |
| Scotch-Irish | 16 | 0.7% |
| Scottish | 250 | 10.4% |
| Slovene | 3 | 0.1% |
| South American | 2 | 0.1% |
| Welsh | 15 | 0.6% | View All 21 Rows |
Immigrants in Bay
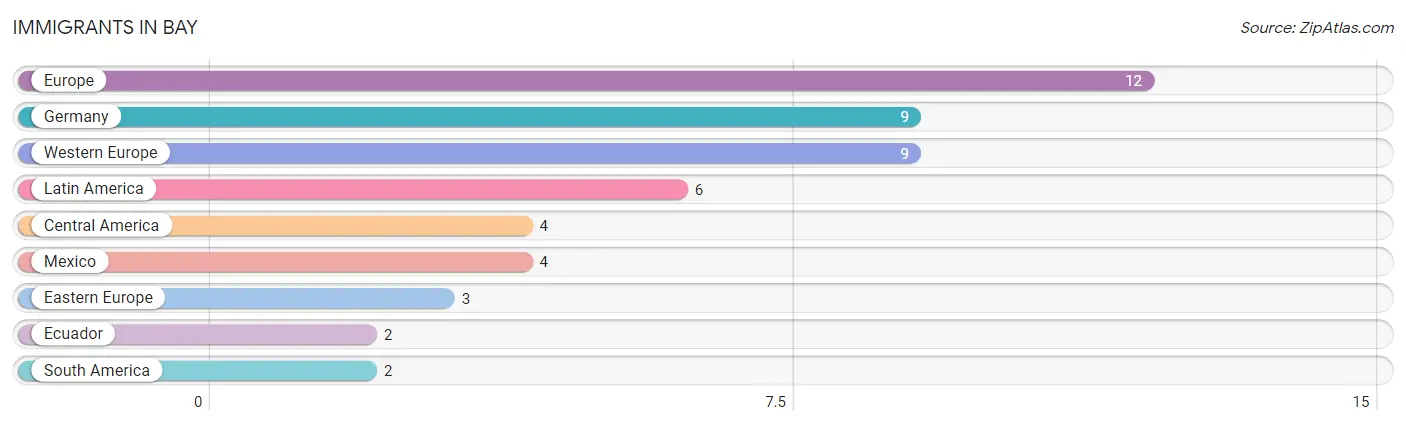
The most numerous immigrant groups reported in Bay came from Europe (12 | 0.5%), Germany (9 | 0.4%), Western Europe (9 | 0.4%), Latin America (6 | 0.3%), and Central America (4 | 0.2%), together accounting for 1.7% of all Bay residents.
| Immigration Origin | # Population | % Population |
| Central America | 4 | 0.2% |
| Eastern Europe | 3 | 0.1% |
| Ecuador | 2 | 0.1% |
| Europe | 12 | 0.5% |
| Germany | 9 | 0.4% |
| Latin America | 6 | 0.3% |
| Mexico | 4 | 0.2% |
| South America | 2 | 0.1% |
| Western Europe | 9 | 0.4% | View All 9 Rows |
Sex and Age in Bay
Sex and Age in Bay
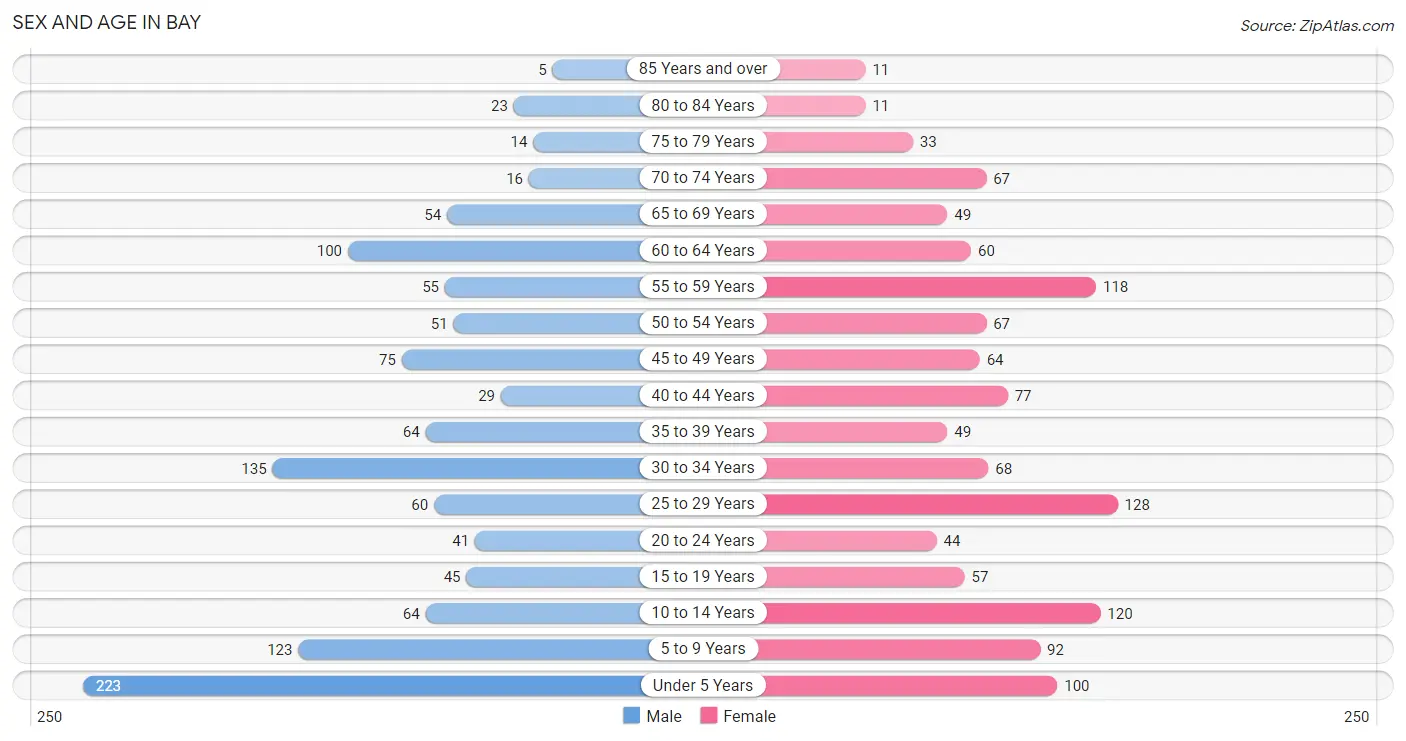
The most populous age groups in Bay are Under 5 Years (223 | 19.0%) for men and 25 to 29 Years (128 | 10.5%) for women.
| Age Bracket | Male | Female |
| Under 5 Years | 223 (19.0%) | 100 (8.2%) |
| 5 to 9 Years | 123 (10.4%) | 92 (7.6%) |
| 10 to 14 Years | 64 (5.4%) | 120 (9.9%) |
| 15 to 19 Years | 45 (3.8%) | 57 (4.7%) |
| 20 to 24 Years | 41 (3.5%) | 44 (3.6%) |
| 25 to 29 Years | 60 (5.1%) | 128 (10.5%) |
| 30 to 34 Years | 135 (11.5%) | 68 (5.6%) |
| 35 to 39 Years | 64 (5.4%) | 49 (4.0%) |
| 40 to 44 Years | 29 (2.5%) | 77 (6.3%) |
| 45 to 49 Years | 75 (6.4%) | 64 (5.3%) |
| 50 to 54 Years | 51 (4.3%) | 67 (5.5%) |
| 55 to 59 Years | 55 (4.7%) | 118 (9.7%) |
| 60 to 64 Years | 100 (8.5%) | 60 (4.9%) |
| 65 to 69 Years | 54 (4.6%) | 49 (4.0%) |
| 70 to 74 Years | 16 (1.4%) | 67 (5.5%) |
| 75 to 79 Years | 14 (1.2%) | 33 (2.7%) |
| 80 to 84 Years | 23 (1.9%) | 11 (0.9%) |
| 85 Years and over | 5 (0.4%) | 11 (0.9%) |
| Total | 1,177 (100.0%) | 1,215 (100.0%) |
Families and Households in Bay
Median Family Size in Bay
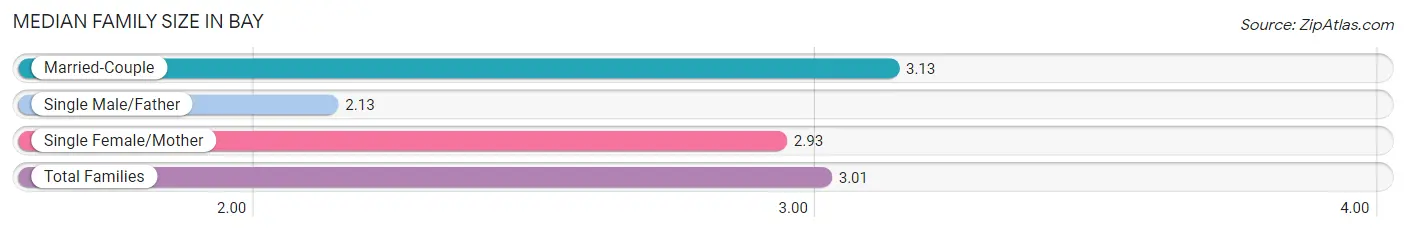
The median family size in Bay is 3.01 persons per family, with married-couple families (469 | 68.9%) accounting for the largest median family size of 3.13 persons per family. On the other hand, single male/father families (52 | 7.6%) represent the smallest median family size with 2.13 persons per family.
| Family Type | # Families | Family Size |
| Married-Couple | 469 (68.9%) | 3.13 |
| Single Male/Father | 52 (7.6%) | 2.13 |
| Single Female/Mother | 160 (23.5%) | 2.93 |
| Total Families | 681 (100.0%) | 3.01 |
Median Household Size in Bay
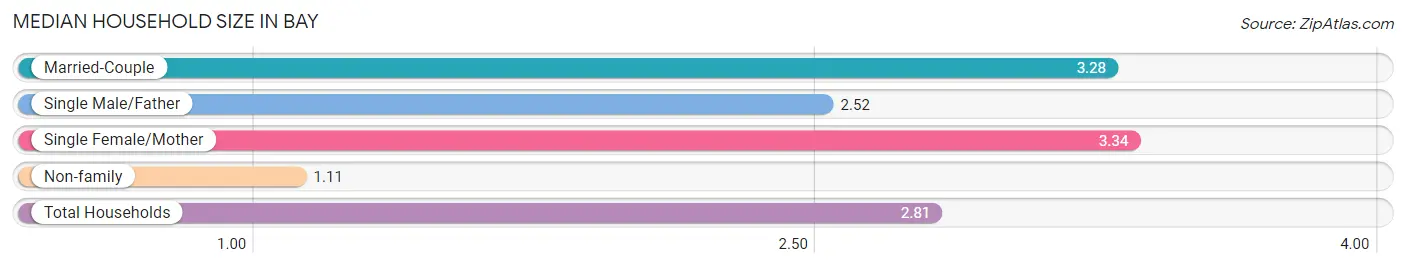
The median household size in Bay is 2.81 persons per household, with single female/mother households (160 | 18.8%) accounting for the largest median household size of 3.34 persons per household. non-family households (169 | 19.9%) represent the smallest median household size with 1.11 persons per household.
| Household Type | # Households | Household Size |
| Married-Couple | 469 (55.2%) | 3.28 |
| Single Male/Father | 52 (6.1%) | 2.52 |
| Single Female/Mother | 160 (18.8%) | 3.34 |
| Non-family | 169 (19.9%) | 1.11 |
| Total Households | 850 (100.0%) | 2.81 |
Household Size by Marriage Status in Bay
Out of a total of 850 households in Bay, 681 (80.1%) are family households, while 169 (19.9%) are nonfamily households. The most numerous type of family households are 2-person households, comprising 281, and the most common type of nonfamily households are 1-person households, comprising 160.
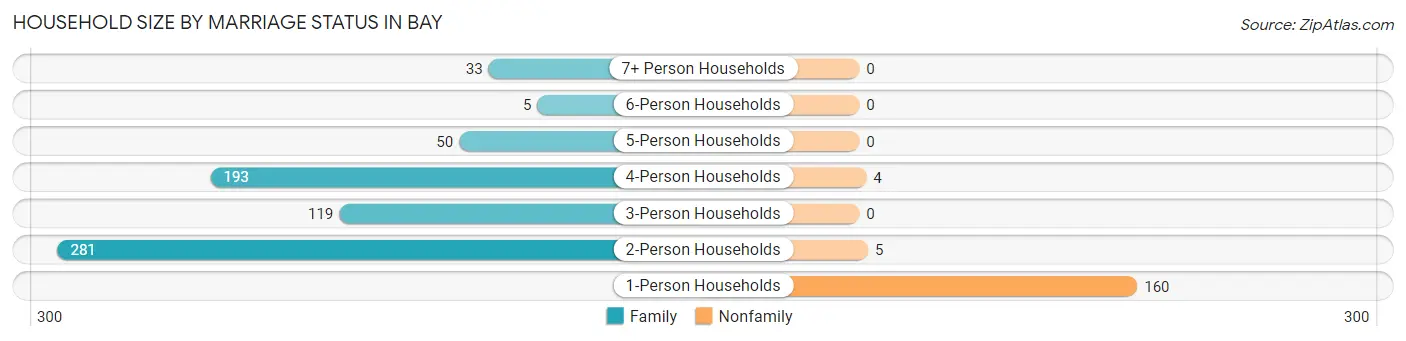
| Household Size | Family Households | Nonfamily Households |
| 1-Person Households | - | 160 (18.8%) |
| 2-Person Households | 281 (33.1%) | 5 (0.6%) |
| 3-Person Households | 119 (14.0%) | 0 (0.0%) |
| 4-Person Households | 193 (22.7%) | 4 (0.5%) |
| 5-Person Households | 50 (5.9%) | 0 (0.0%) |
| 6-Person Households | 5 (0.6%) | 0 (0.0%) |
| 7+ Person Households | 33 (3.9%) | 0 (0.0%) |
| Total | 681 (80.1%) | 169 (19.9%) |
Female Fertility in Bay
Fertility by Age in Bay
Average fertility rate in Bay is 77.0 births per 1,000 women. Women in the age bracket of 20 to 34 years have the highest fertility rate with 142.0 births per 1,000 women. Women in the age bracket of 20 to 34 years acount for 87.2% of all women with births.
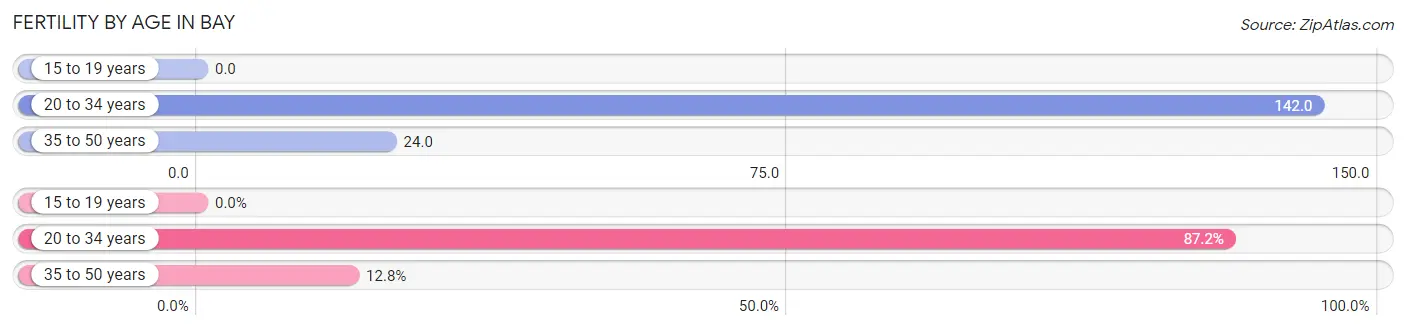
| Age Bracket | Women with Births | Births / 1,000 Women |
| 15 to 19 years | 0 (0.0%) | 0.0 |
| 20 to 34 years | 34 (87.2%) | 142.0 |
| 35 to 50 years | 5 (12.8%) | 24.0 |
| Total | 39 (100.0%) | 77.0 |
Fertility by Age by Marriage Status in Bay
79.5% of women with births (39) in Bay are married. The highest percentage of unmarried women with births falls into 20 to 34 years age bracket with 23.5% of them unmarried at the time of birth, while the lowest percentage of unmarried women with births belong to 35 to 50 years age bracket with 0.0% of them unmarried.
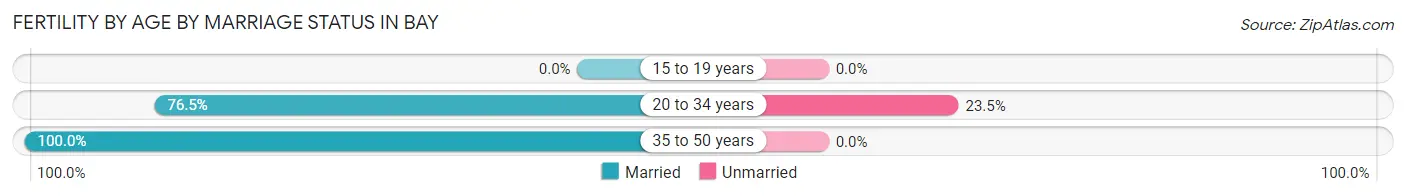
| Age Bracket | Married | Unmarried |
| 15 to 19 years | 0 (0.0%) | 0 (0.0%) |
| 20 to 34 years | 26 (76.5%) | 8 (23.5%) |
| 35 to 50 years | 5 (100.0%) | 0 (0.0%) |
| Total | 31 (79.5%) | 8 (20.5%) |
Fertility by Education in Bay
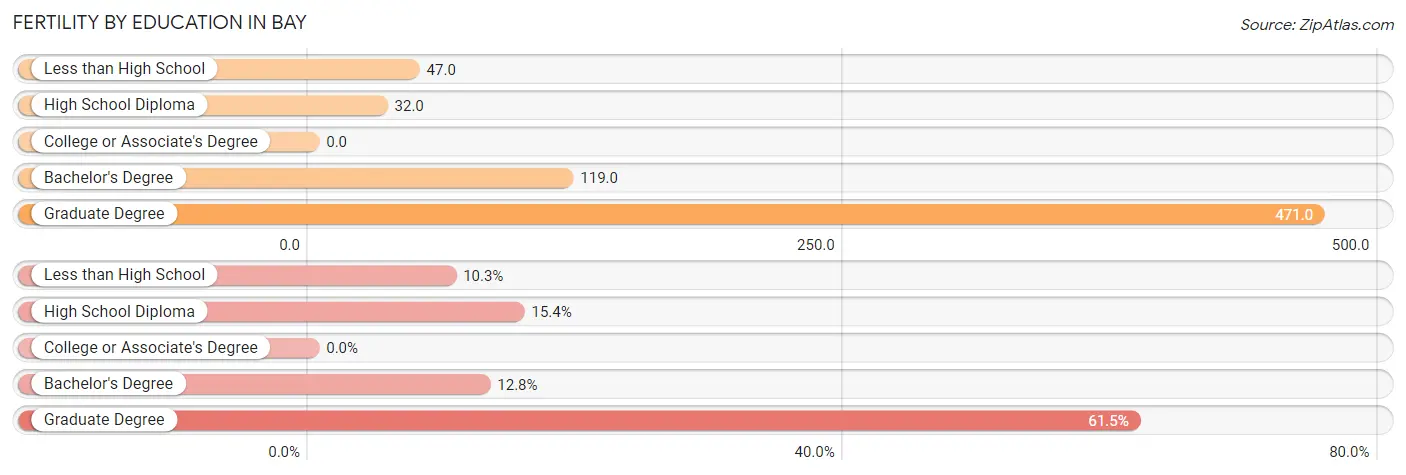
| Educational Attainment | Women with Births | Births / 1,000 Women |
| Less than High School | 4 (10.3%) | 47.0 |
| High School Diploma | 6 (15.4%) | 32.0 |
| College or Associate's Degree | 0 (0.0%) | 0.0 |
| Bachelor's Degree | 5 (12.8%) | 119.0 |
| Graduate Degree | 24 (61.5%) | 471.0 |
| Total | 39 (100.0%) | 77.0 |
Fertility by Education by Marriage Status in Bay
20.5% of women with births in Bay are unmarried. Women with the educational attainment of high school diploma are most likely to be married with 100.0% of them married at childbirth, while women with the educational attainment of less than high school are least likely to be married with 100.0% of them unmarried at childbirth.
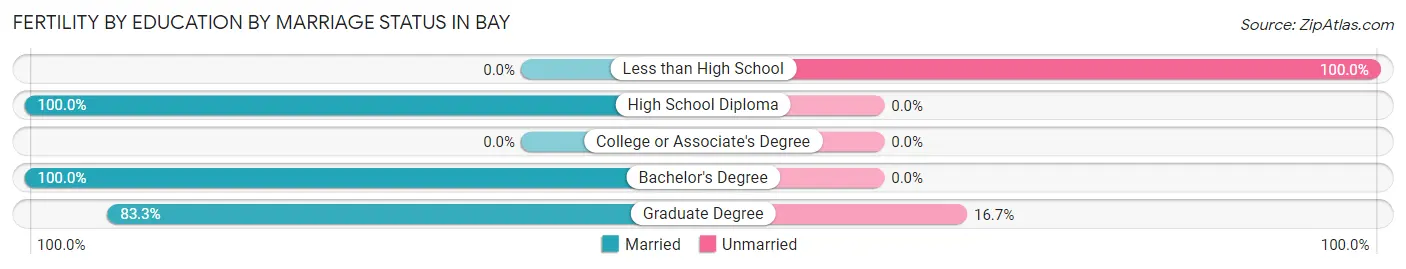
| Educational Attainment | Married | Unmarried |
| Less than High School | 0 (0.0%) | 4 (100.0%) |
| High School Diploma | 6 (100.0%) | 0 (0.0%) |
| College or Associate's Degree | 0 (0.0%) | 0 (0.0%) |
| Bachelor's Degree | 5 (100.0%) | 0 (0.0%) |
| Graduate Degree | 20 (83.3%) | 4 (16.7%) |
| Total | 31 (79.5%) | 8 (20.5%) |
Employment Characteristics in Bay
Employment by Class of Employer in Bay
Among the 927 employed individuals in Bay, private company employees (719 | 77.6%), local government employees (94 | 10.1%), and state government employees (32 | 3.5%) make up the most common classes of employment.
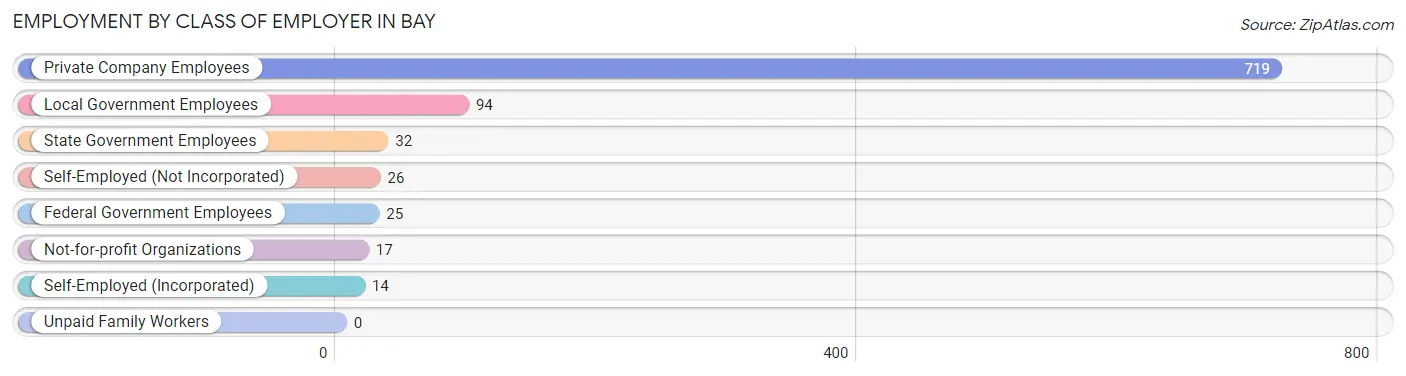
| Employer Class | # Employees | % Employees |
| Private Company Employees | 719 | 77.6% |
| Self-Employed (Incorporated) | 14 | 1.5% |
| Self-Employed (Not Incorporated) | 26 | 2.8% |
| Not-for-profit Organizations | 17 | 1.8% |
| Local Government Employees | 94 | 10.1% |
| State Government Employees | 32 | 3.5% |
| Federal Government Employees | 25 | 2.7% |
| Unpaid Family Workers | 0 | 0.0% |
| Total | 927 | 100.0% |
Employment Status by Age in Bay
According to the labor force statistics for Bay, out of the total population over 16 years of age (1,650), 62.2% or 1,026 individuals are in the labor force, with 6.6% or 68 of them unemployed. The age group with the highest labor force participation rate is 20 to 24 years, with 90.6% or 77 individuals in the labor force. Within the labor force, the 16 to 19 years age range has the highest percentage of unemployed individuals, with 34.6% or 9 of them being unemployed.
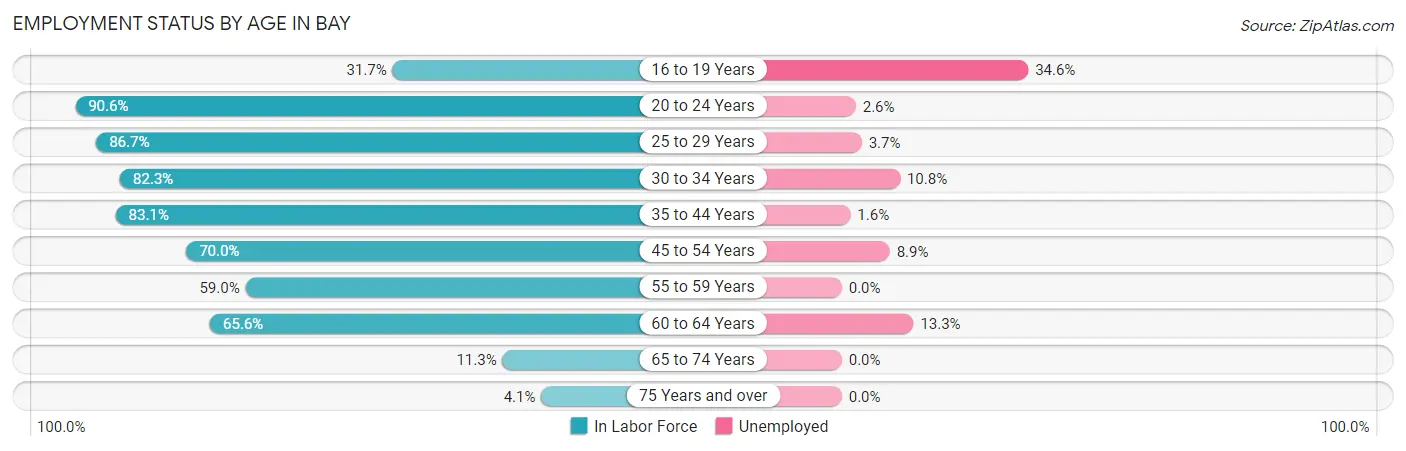
| Age Bracket | In Labor Force | Unemployed |
| 16 to 19 Years | 26 (31.7%) | 9 (34.6%) |
| 20 to 24 Years | 77 (90.6%) | 2 (2.6%) |
| 25 to 29 Years | 163 (86.7%) | 6 (3.7%) |
| 30 to 34 Years | 167 (82.3%) | 18 (10.8%) |
| 35 to 44 Years | 182 (83.1%) | 3 (1.6%) |
| 45 to 54 Years | 180 (70.0%) | 16 (8.9%) |
| 55 to 59 Years | 102 (59.0%) | 0 (0.0%) |
| 60 to 64 Years | 105 (65.6%) | 14 (13.3%) |
| 65 to 74 Years | 21 (11.3%) | 0 (0.0%) |
| 75 Years and over | 4 (4.1%) | 0 (0.0%) |
| Total | 1,026 (62.2%) | 68 (6.6%) |
Employment Status by Educational Attainment in Bay
According to labor force statistics for Bay, 74.9% of individuals (899) out of the total population between 25 and 64 years of age (1,200) are in the labor force, with 6.3% or 57 of them being unemployed. The group with the highest labor force participation rate are those with the educational attainment of bachelor's degree or higher, with 96.6% or 141 individuals in the labor force. Within the labor force, individuals with college / associate degree education have the highest percentage of unemployment, with 17.1% or 44 of them being unemployed.
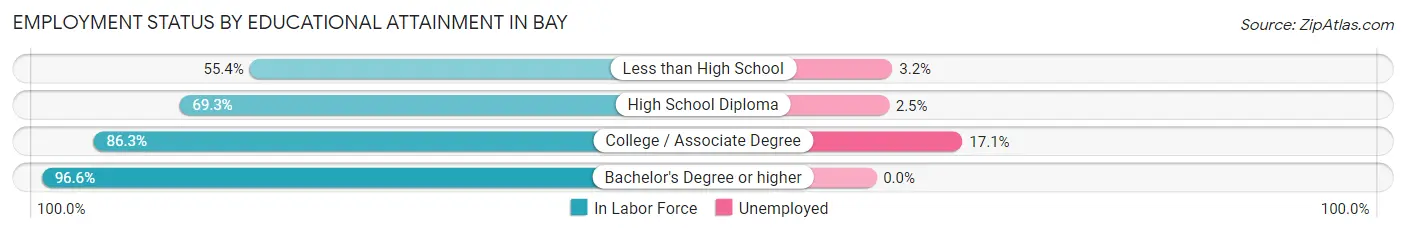
| Educational Attainment | In Labor Force | Unemployed |
| Less than High School | 93 (55.4%) | 5 (3.2%) |
| High School Diploma | 407 (69.3%) | 15 (2.5%) |
| College / Associate Degree | 258 (86.3%) | 51 (17.1%) |
| Bachelor's Degree or higher | 141 (96.6%) | 0 (0.0%) |
| Total | 899 (74.9%) | 76 (6.3%) |
Employment Occupations by Sex in Bay
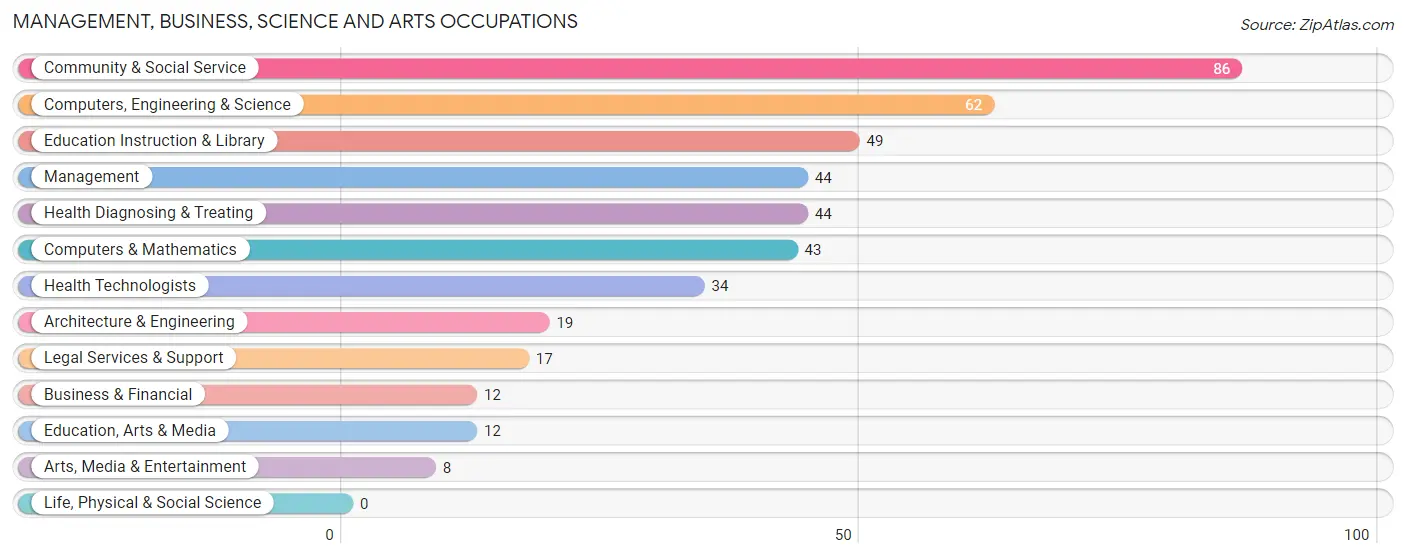
Management, Business, Science and Arts Occupations
The most common Management, Business, Science and Arts occupations in Bay are Community & Social Service (86 | 9.0%), Computers, Engineering & Science (62 | 6.5%), Education Instruction & Library (49 | 5.1%), Management (44 | 4.6%), and Health Diagnosing & Treating (44 | 4.6%).
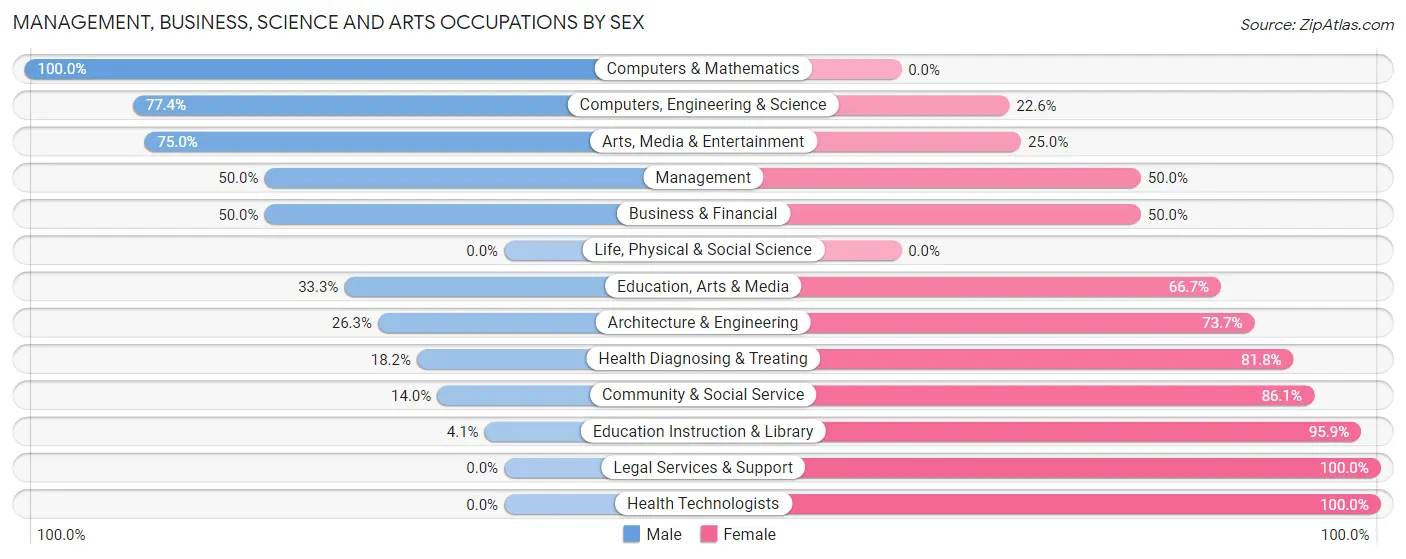
Management, Business, Science and Arts Occupations by Sex
Within the Management, Business, Science and Arts occupations in Bay, the most male-oriented occupations are Computers & Mathematics (100.0%), Computers, Engineering & Science (77.4%), and Arts, Media & Entertainment (75.0%), while the most female-oriented occupations are Legal Services & Support (100.0%), Health Technologists (100.0%), and Education Instruction & Library (95.9%).
| Occupation | Male | Female |
| Management | 22 (50.0%) | 22 (50.0%) |
| Business & Financial | 6 (50.0%) | 6 (50.0%) |
| Computers, Engineering & Science | 48 (77.4%) | 14 (22.6%) |
| Computers & Mathematics | 43 (100.0%) | 0 (0.0%) |
| Architecture & Engineering | 5 (26.3%) | 14 (73.7%) |
| Life, Physical & Social Science | 0 (0.0%) | 0 (0.0%) |
| Community & Social Service | 12 (14.0%) | 74 (86.1%) |
| Education, Arts & Media | 4 (33.3%) | 8 (66.7%) |
| Legal Services & Support | 0 (0.0%) | 17 (100.0%) |
| Education Instruction & Library | 2 (4.1%) | 47 (95.9%) |
| Arts, Media & Entertainment | 6 (75.0%) | 2 (25.0%) |
| Health Diagnosing & Treating | 8 (18.2%) | 36 (81.8%) |
| Health Technologists | 0 (0.0%) | 34 (100.0%) |
| Total (Category) | 96 (38.7%) | 152 (61.3%) |
| Total (Overall) | 502 (52.3%) | 457 (47.6%) |
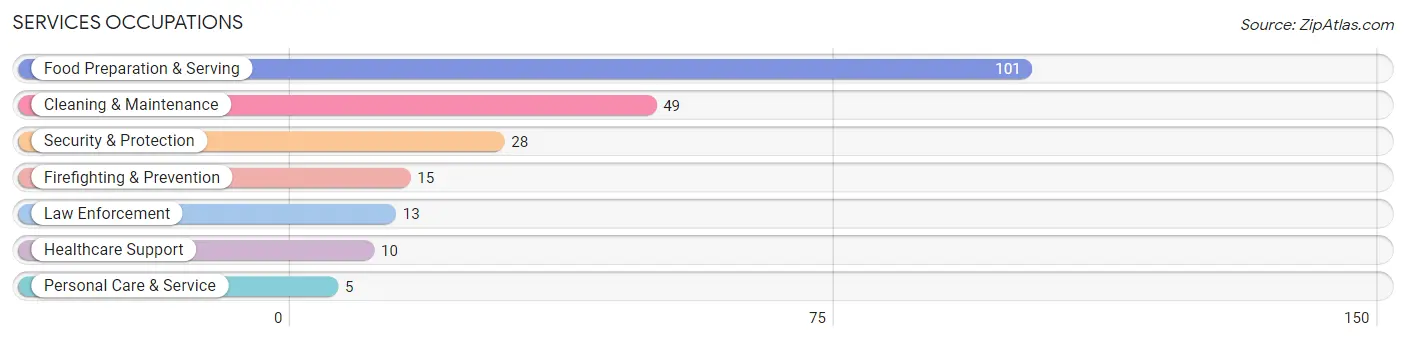
Services Occupations
The most common Services occupations in Bay are Food Preparation & Serving (101 | 10.5%), Cleaning & Maintenance (49 | 5.1%), Security & Protection (28 | 2.9%), Firefighting & Prevention (15 | 1.6%), and Law Enforcement (13 | 1.4%).
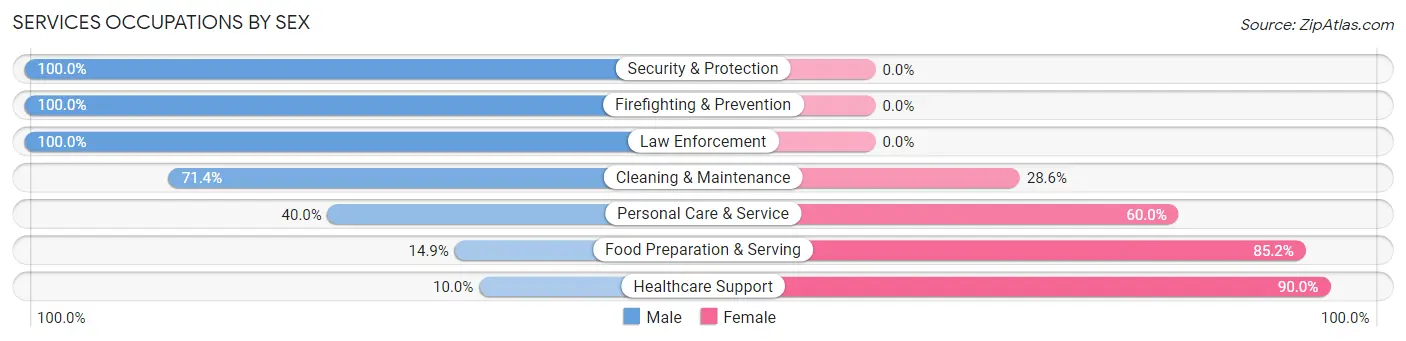
Services Occupations by Sex
Within the Services occupations in Bay, the most male-oriented occupations are Security & Protection (100.0%), Firefighting & Prevention (100.0%), and Law Enforcement (100.0%), while the most female-oriented occupations are Healthcare Support (90.0%), Food Preparation & Serving (85.2%), and Personal Care & Service (60.0%).
| Occupation | Male | Female |
| Healthcare Support | 1 (10.0%) | 9 (90.0%) |
| Security & Protection | 28 (100.0%) | 0 (0.0%) |
| Firefighting & Prevention | 15 (100.0%) | 0 (0.0%) |
| Law Enforcement | 13 (100.0%) | 0 (0.0%) |
| Food Preparation & Serving | 15 (14.8%) | 86 (85.2%) |
| Cleaning & Maintenance | 35 (71.4%) | 14 (28.6%) |
| Personal Care & Service | 2 (40.0%) | 3 (60.0%) |
| Total (Category) | 81 (42.0%) | 112 (58.0%) |
| Total (Overall) | 502 (52.3%) | 457 (47.6%) |
Sales and Office Occupations
The most common Sales and Office occupations in Bay are Sales & Related (105 | 11.0%), and Office & Administration (77 | 8.0%).
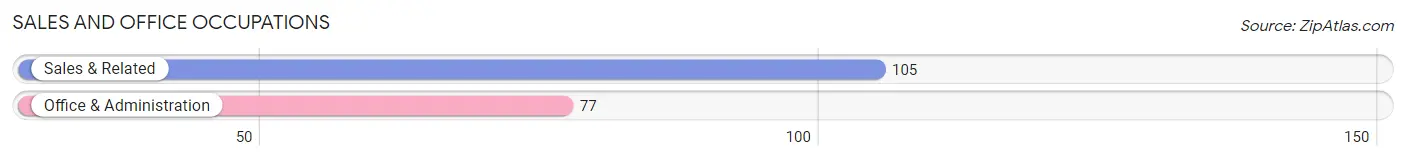
Sales and Office Occupations by Sex
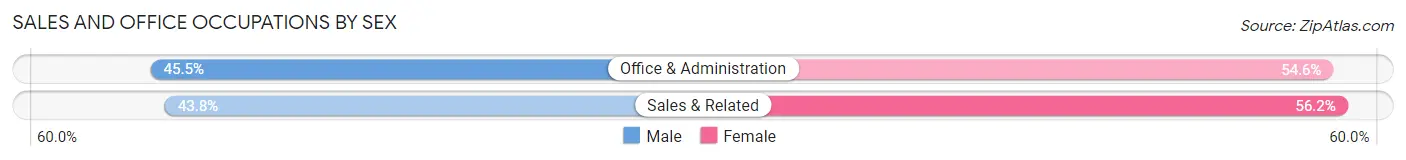
| Occupation | Male | Female |
| Sales & Related | 46 (43.8%) | 59 (56.2%) |
| Office & Administration | 35 (45.5%) | 42 (54.5%) |
| Total (Category) | 81 (44.5%) | 101 (55.5%) |
| Total (Overall) | 502 (52.3%) | 457 (47.6%) |
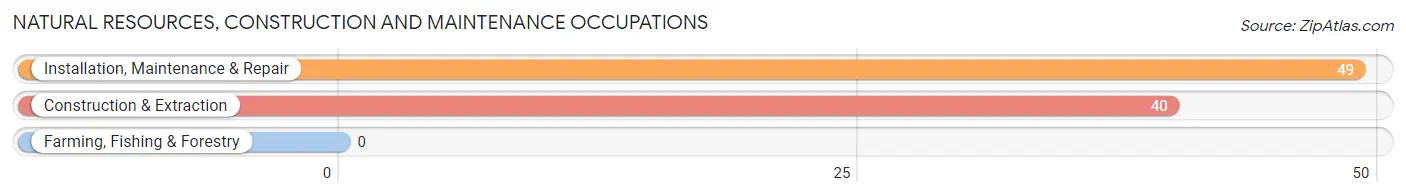
Natural Resources, Construction and Maintenance Occupations
The most common Natural Resources, Construction and Maintenance occupations in Bay are Installation, Maintenance & Repair (49 | 5.1%), and Construction & Extraction (40 | 4.2%).
Natural Resources, Construction and Maintenance Occupations by Sex
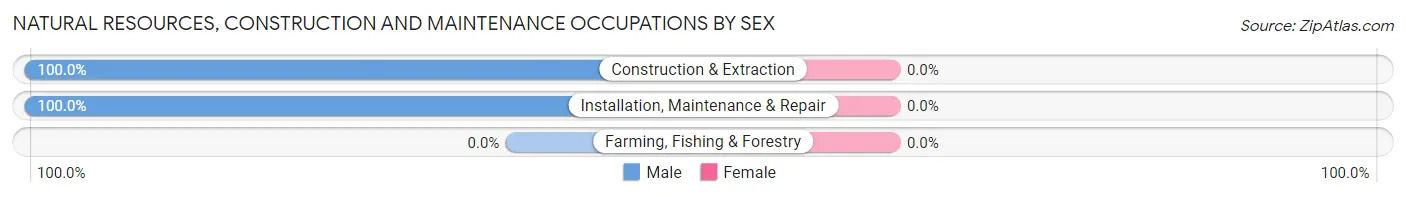
| Occupation | Male | Female |
| Farming, Fishing & Forestry | 0 (0.0%) | 0 (0.0%) |
| Construction & Extraction | 40 (100.0%) | 0 (0.0%) |
| Installation, Maintenance & Repair | 49 (100.0%) | 0 (0.0%) |
| Total (Category) | 89 (100.0%) | 0 (0.0%) |
| Total (Overall) | 502 (52.3%) | 457 (47.6%) |
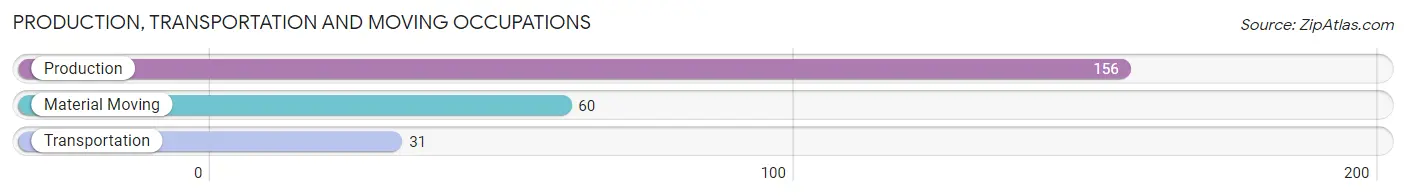
Production, Transportation and Moving Occupations
The most common Production, Transportation and Moving occupations in Bay are Production (156 | 16.3%), Material Moving (60 | 6.3%), and Transportation (31 | 3.2%).
Production, Transportation and Moving Occupations by Sex
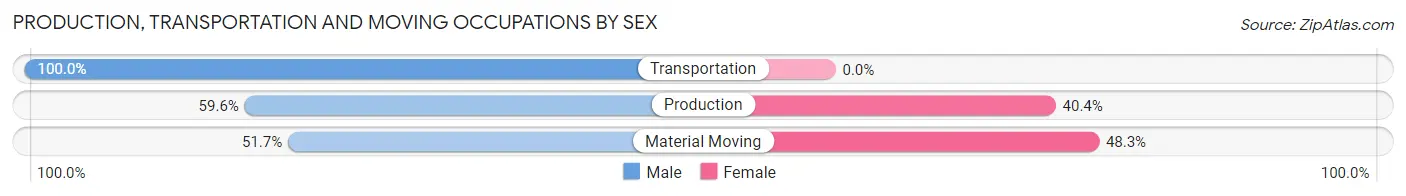
| Occupation | Male | Female |
| Production | 93 (59.6%) | 63 (40.4%) |
| Transportation | 31 (100.0%) | 0 (0.0%) |
| Material Moving | 31 (51.7%) | 29 (48.3%) |
| Total (Category) | 155 (62.7%) | 92 (37.2%) |
| Total (Overall) | 502 (52.3%) | 457 (47.6%) |
Employment Industries by Sex in Bay
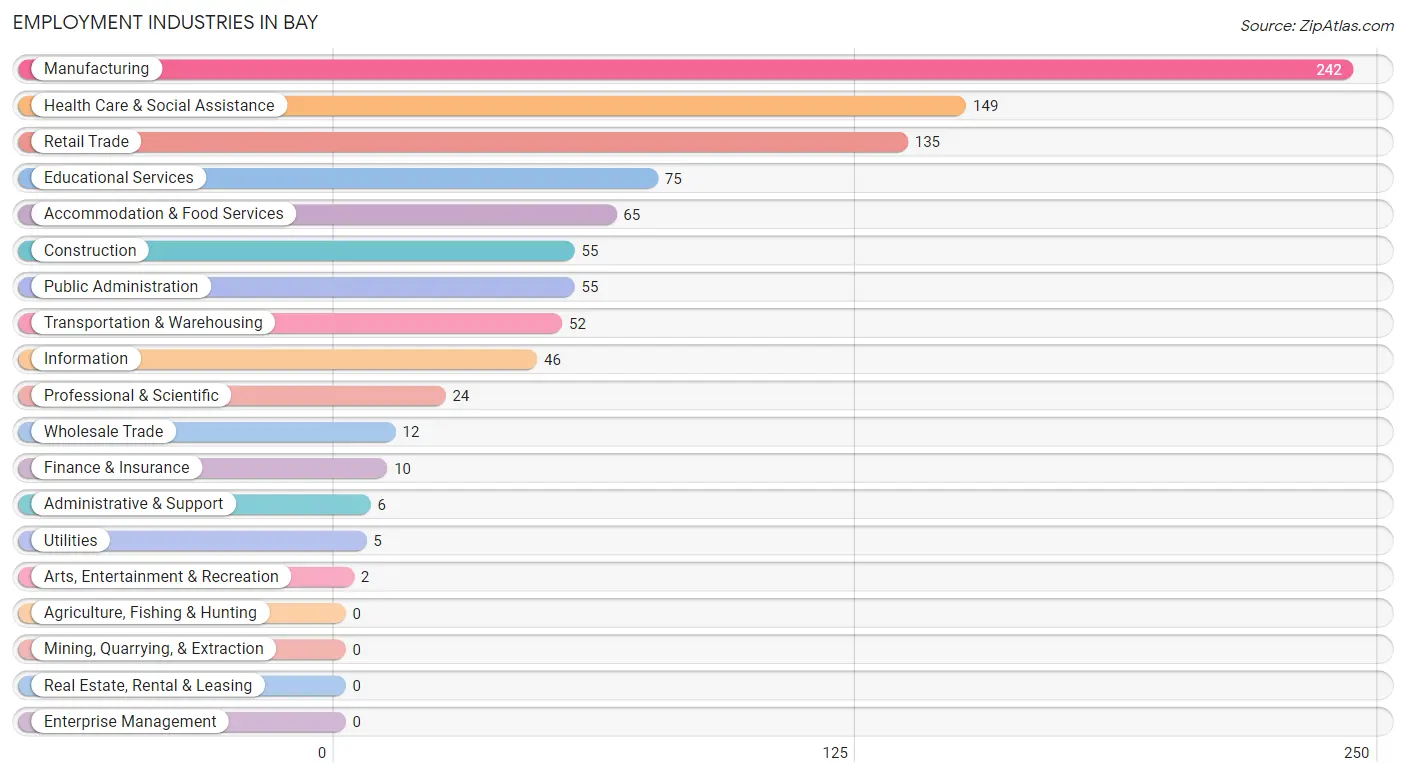
Employment Industries in Bay
The major employment industries in Bay include Manufacturing (242 | 25.2%), Health Care & Social Assistance (149 | 15.5%), Retail Trade (135 | 14.1%), Educational Services (75 | 7.8%), and Accommodation & Food Services (65 | 6.8%).
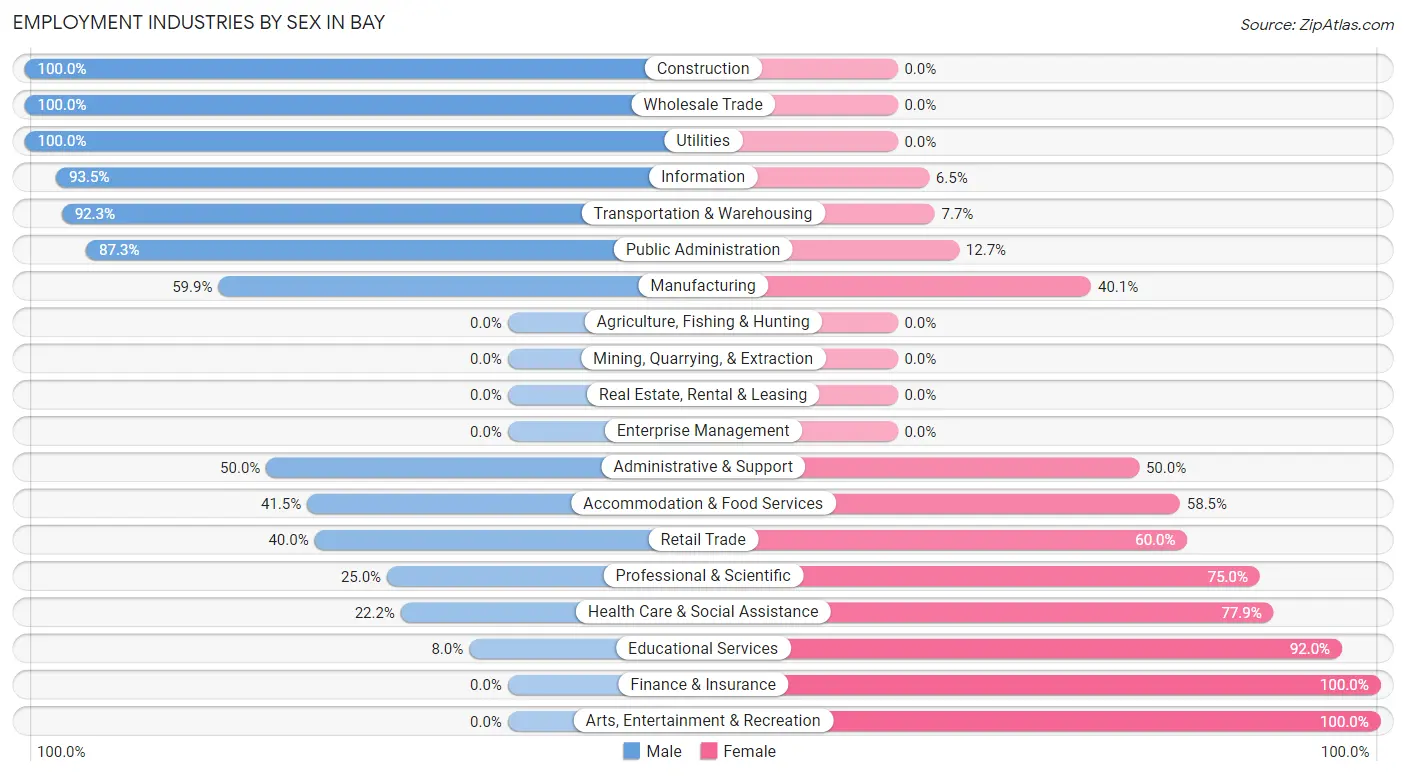
Employment Industries by Sex in Bay
The Bay industries that see more men than women are Construction (100.0%), Wholesale Trade (100.0%), and Utilities (100.0%), whereas the industries that tend to have a higher number of women are Finance & Insurance (100.0%), Arts, Entertainment & Recreation (100.0%), and Educational Services (92.0%).
| Industry | Male | Female |
| Agriculture, Fishing & Hunting | 0 (0.0%) | 0 (0.0%) |
| Mining, Quarrying, & Extraction | 0 (0.0%) | 0 (0.0%) |
| Construction | 55 (100.0%) | 0 (0.0%) |
| Manufacturing | 145 (59.9%) | 97 (40.1%) |
| Wholesale Trade | 12 (100.0%) | 0 (0.0%) |
| Retail Trade | 54 (40.0%) | 81 (60.0%) |
| Transportation & Warehousing | 48 (92.3%) | 4 (7.7%) |
| Utilities | 5 (100.0%) | 0 (0.0%) |
| Information | 43 (93.5%) | 3 (6.5%) |
| Finance & Insurance | 0 (0.0%) | 10 (100.0%) |
| Real Estate, Rental & Leasing | 0 (0.0%) | 0 (0.0%) |
| Professional & Scientific | 6 (25.0%) | 18 (75.0%) |
| Enterprise Management | 0 (0.0%) | 0 (0.0%) |
| Administrative & Support | 3 (50.0%) | 3 (50.0%) |
| Educational Services | 6 (8.0%) | 69 (92.0%) |
| Health Care & Social Assistance | 33 (22.2%) | 116 (77.8%) |
| Arts, Entertainment & Recreation | 0 (0.0%) | 2 (100.0%) |
| Accommodation & Food Services | 27 (41.5%) | 38 (58.5%) |
| Public Administration | 48 (87.3%) | 7 (12.7%) |
| Total | 502 (52.3%) | 457 (47.6%) |
Education in Bay
School Enrollment in Bay
The most common levels of schooling among the 559 students in Bay are elementary school (131 | 23.4%), nursery / preschool (129 | 23.1%), and middle school (126 | 22.5%).
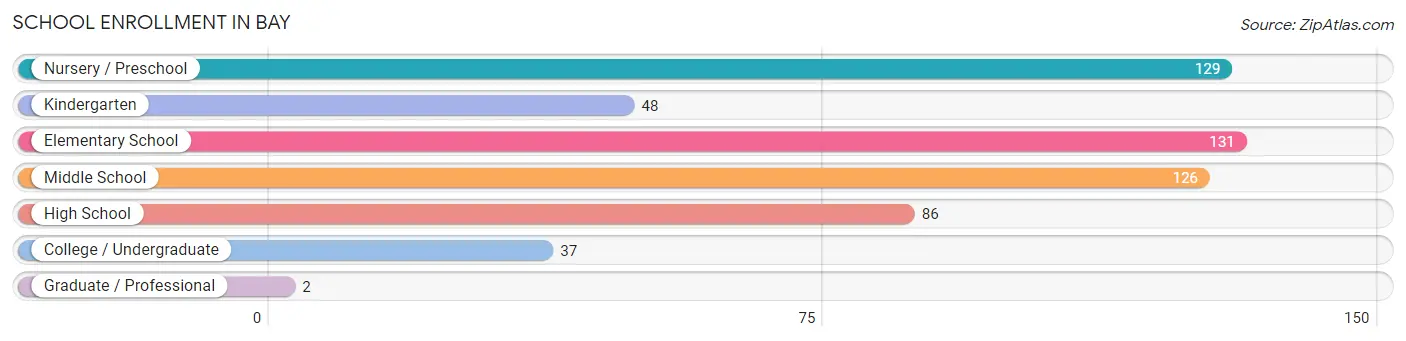
| School Level | # Students | % Students |
| Nursery / Preschool | 129 | 23.1% |
| Kindergarten | 48 | 8.6% |
| Elementary School | 131 | 23.4% |
| Middle School | 126 | 22.5% |
| High School | 86 | 15.4% |
| College / Undergraduate | 37 | 6.6% |
| Graduate / Professional | 2 | 0.4% |
| Total | 559 | 100.0% |
School Enrollment by Age by Funding Source in Bay
Out of a total of 559 students who are enrolled in schools in Bay, 67 (12.0%) attend a private institution, while the remaining 492 (88.0%) are enrolled in public schools. The age group of 3 to 4 year olds has the highest likelihood of being enrolled in private schools, with 19 (32.2% in the age bracket) enrolled. Conversely, the age group of 20 to 24 year olds has the lowest likelihood of being enrolled in a private school, with 23 (100.0% in the age bracket) attending a public institution.
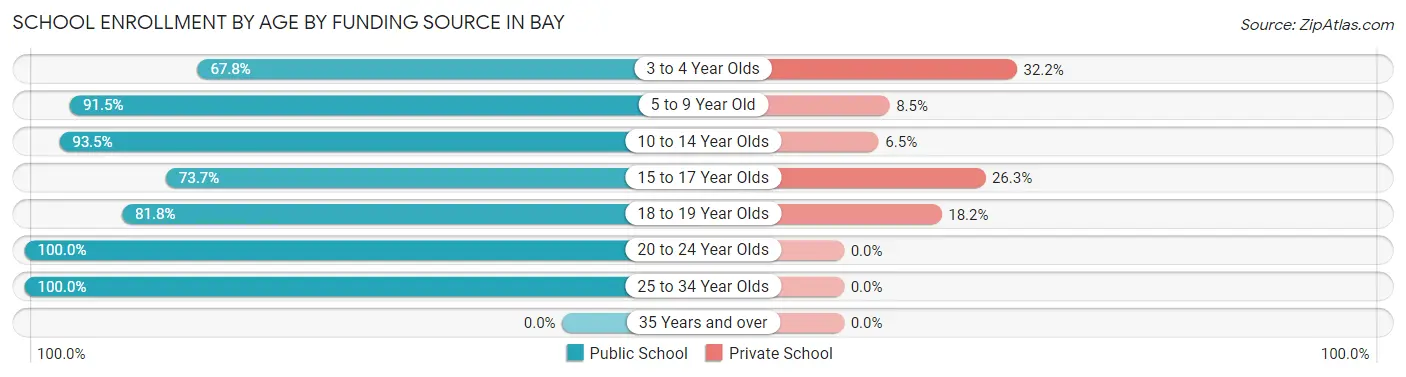
| Age Bracket | Public School | Private School |
| 3 to 4 Year Olds | 40 (67.8%) | 19 (32.2%) |
| 5 to 9 Year Old | 194 (91.5%) | 18 (8.5%) |
| 10 to 14 Year Olds | 159 (93.5%) | 11 (6.5%) |
| 15 to 17 Year Olds | 42 (73.7%) | 15 (26.3%) |
| 18 to 19 Year Olds | 18 (81.8%) | 4 (18.2%) |
| 20 to 24 Year Olds | 23 (100.0%) | 0 (0.0%) |
| 25 to 34 Year Olds | 16 (100.0%) | 0 (0.0%) |
| 35 Years and over | 0 (0.0%) | 0 (0.0%) |
| Total | 492 (88.0%) | 67 (12.0%) |
Educational Attainment by Field of Study in Bay
Education (87 | 45.6%), science & technology (22 | 11.5%), business (17 | 8.9%), communications (14 | 7.3%), and arts & humanities (12 | 6.3%) are the most common fields of study among 191 individuals in Bay who have obtained a bachelor's degree or higher.
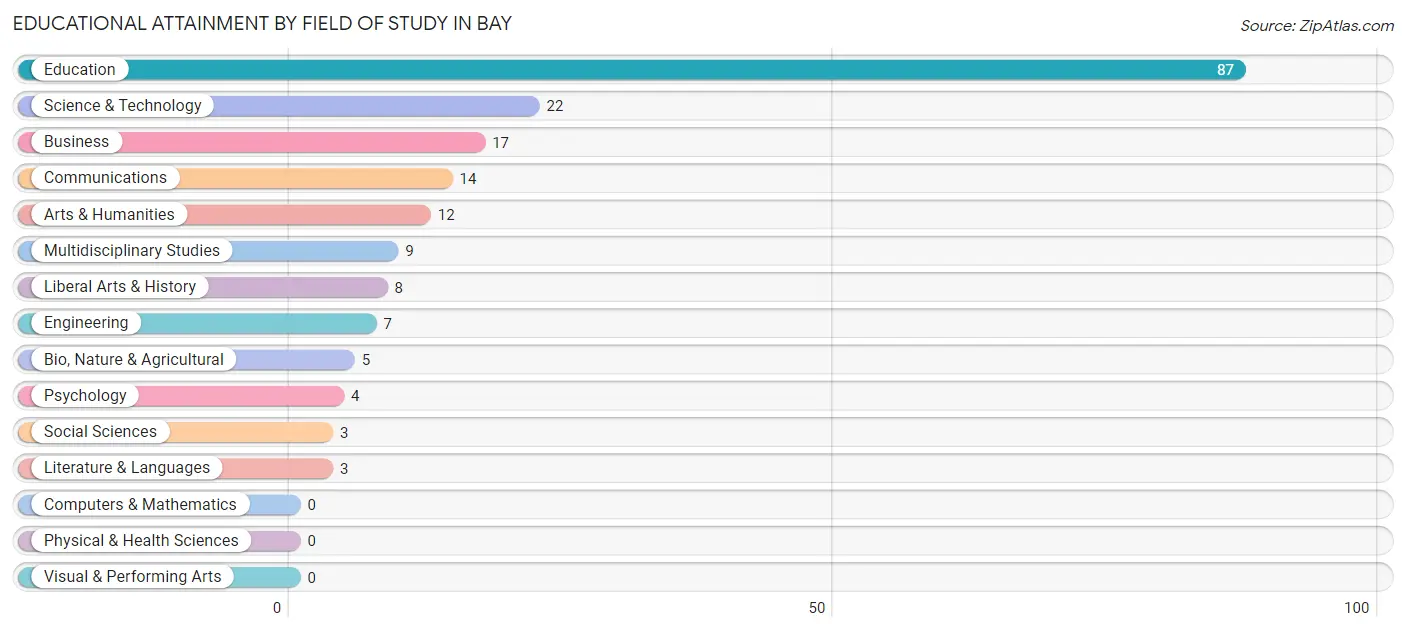
| Field of Study | # Graduates | % Graduates |
| Computers & Mathematics | 0 | 0.0% |
| Bio, Nature & Agricultural | 5 | 2.6% |
| Physical & Health Sciences | 0 | 0.0% |
| Psychology | 4 | 2.1% |
| Social Sciences | 3 | 1.6% |
| Engineering | 7 | 3.7% |
| Multidisciplinary Studies | 9 | 4.7% |
| Science & Technology | 22 | 11.5% |
| Business | 17 | 8.9% |
| Education | 87 | 45.6% |
| Literature & Languages | 3 | 1.6% |
| Liberal Arts & History | 8 | 4.2% |
| Visual & Performing Arts | 0 | 0.0% |
| Communications | 14 | 7.3% |
| Arts & Humanities | 12 | 6.3% |
| Total | 191 | 100.0% |
Transportation & Commute in Bay
Vehicle Availability by Sex in Bay
The most prevalent vehicle ownership categories in Bay are males with 2 vehicles (220, accounting for 45.4%) and females with 2 vehicles (219, making up 49.8%).
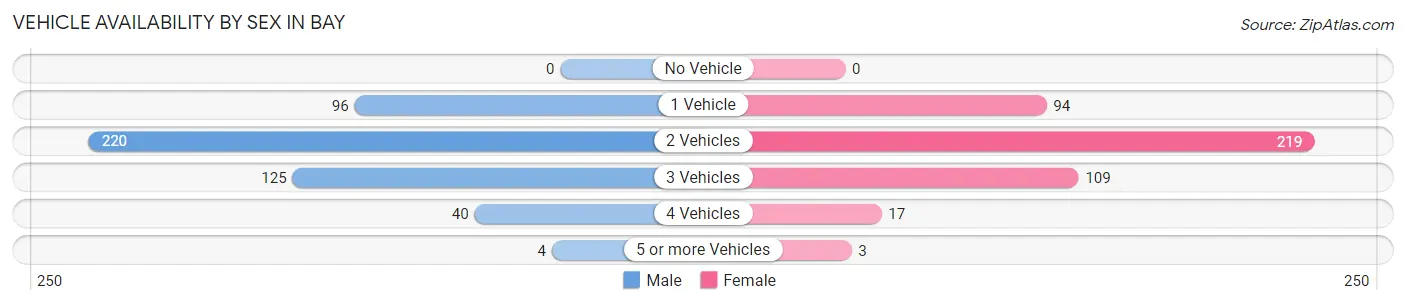
| Vehicles Available | Male | Female |
| No Vehicle | 0 (0.0%) | 0 (0.0%) |
| 1 Vehicle | 96 (19.8%) | 94 (21.3%) |
| 2 Vehicles | 220 (45.4%) | 219 (49.5%) |
| 3 Vehicles | 125 (25.8%) | 109 (24.7%) |
| 4 Vehicles | 40 (8.3%) | 17 (3.8%) |
| 5 or more Vehicles | 4 (0.8%) | 3 (0.7%) |
| Total | 485 (100.0%) | 442 (100.0%) |
Commute Time in Bay
The most frequently occuring commute durations in Bay are 10 to 14 minutes (173 commuters, 20.1%), 15 to 19 minutes (166 commuters, 19.2%), and 5 to 9 minutes (144 commuters, 16.7%).
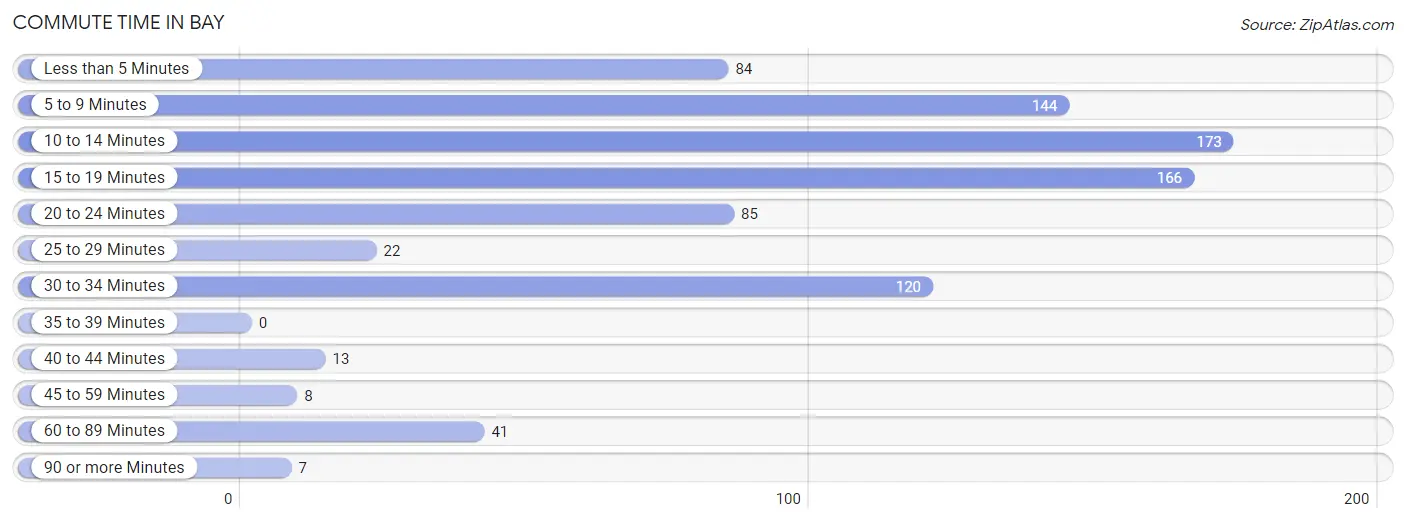
| Commute Time | # Commuters | % Commuters |
| Less than 5 Minutes | 84 | 9.7% |
| 5 to 9 Minutes | 144 | 16.7% |
| 10 to 14 Minutes | 173 | 20.1% |
| 15 to 19 Minutes | 166 | 19.2% |
| 20 to 24 Minutes | 85 | 9.9% |
| 25 to 29 Minutes | 22 | 2.5% |
| 30 to 34 Minutes | 120 | 13.9% |
| 35 to 39 Minutes | 0 | 0.0% |
| 40 to 44 Minutes | 13 | 1.5% |
| 45 to 59 Minutes | 8 | 0.9% |
| 60 to 89 Minutes | 41 | 4.8% |
| 90 or more Minutes | 7 | 0.8% |
Commute Time by Sex in Bay
The most common commute times in Bay are 10 to 14 minutes (127 commuters, 28.7%) for males and 5 to 9 minutes (111 commuters, 26.4%) for females.
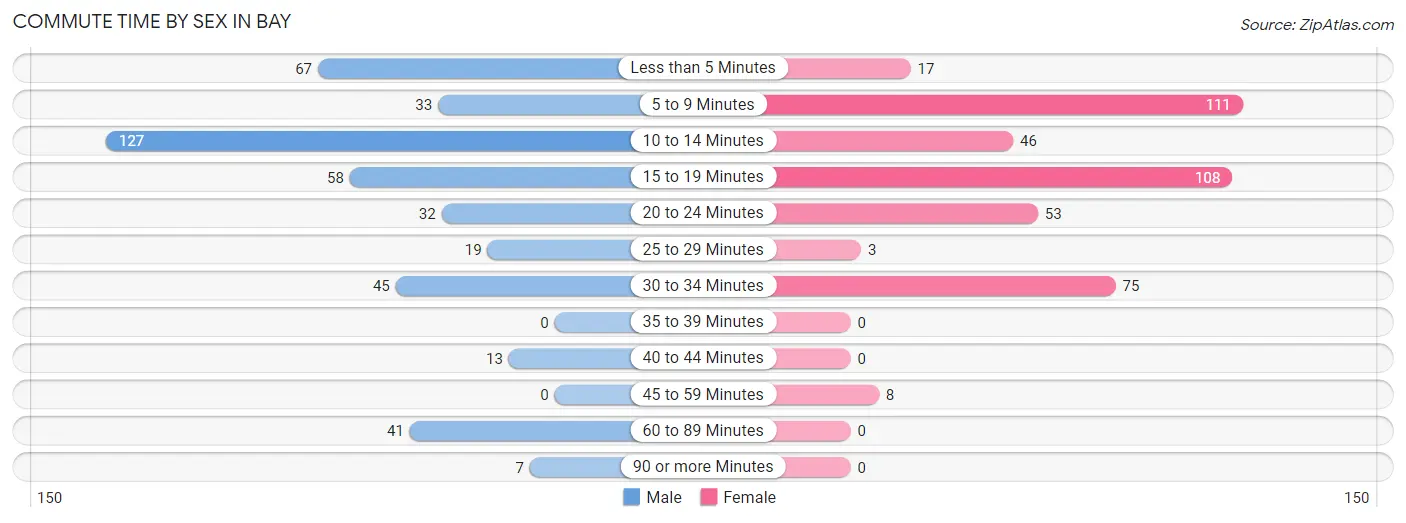
| Commute Time | Male | Female |
| Less than 5 Minutes | 67 (15.2%) | 17 (4.0%) |
| 5 to 9 Minutes | 33 (7.5%) | 111 (26.4%) |
| 10 to 14 Minutes | 127 (28.7%) | 46 (10.9%) |
| 15 to 19 Minutes | 58 (13.1%) | 108 (25.7%) |
| 20 to 24 Minutes | 32 (7.2%) | 53 (12.6%) |
| 25 to 29 Minutes | 19 (4.3%) | 3 (0.7%) |
| 30 to 34 Minutes | 45 (10.2%) | 75 (17.8%) |
| 35 to 39 Minutes | 0 (0.0%) | 0 (0.0%) |
| 40 to 44 Minutes | 13 (2.9%) | 0 (0.0%) |
| 45 to 59 Minutes | 0 (0.0%) | 8 (1.9%) |
| 60 to 89 Minutes | 41 (9.3%) | 0 (0.0%) |
| 90 or more Minutes | 7 (1.6%) | 0 (0.0%) |
Time of Departure to Work by Sex in Bay
The most frequent times of departure to work in Bay are 6:30 AM to 6:59 AM (111, 25.1%) for males and 5:00 AM to 5:29 AM (130, 30.9%) for females.
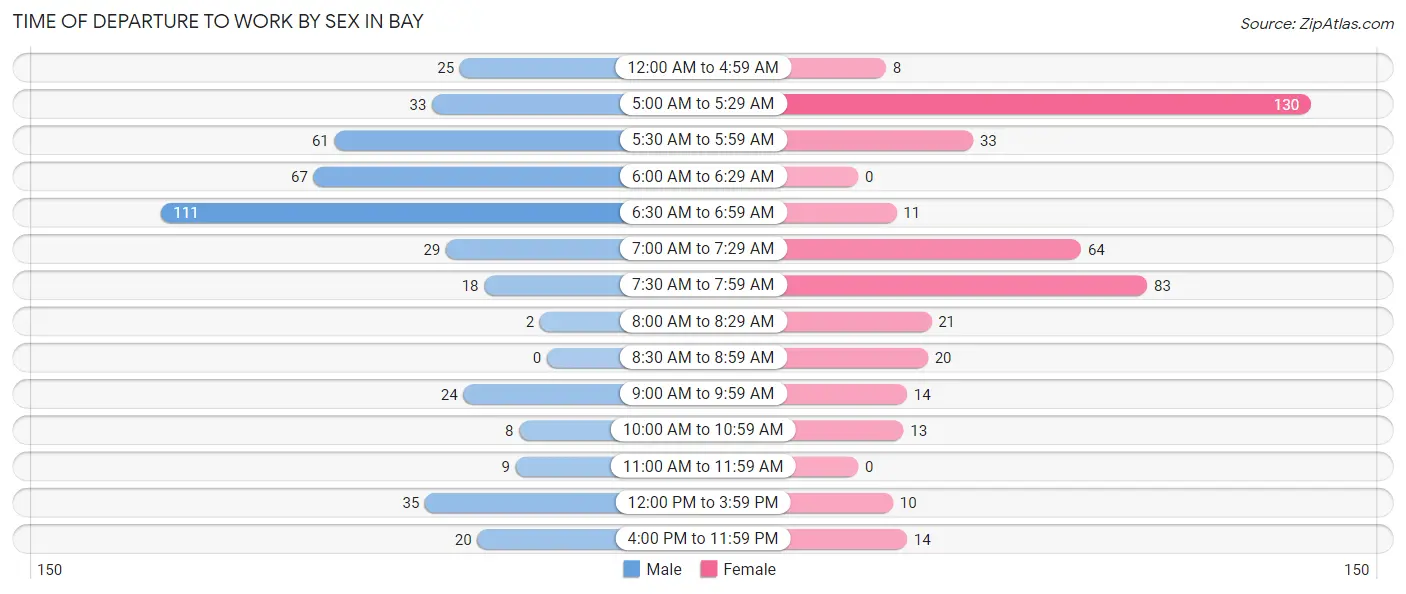
| Time of Departure | Male | Female |
| 12:00 AM to 4:59 AM | 25 (5.7%) | 8 (1.9%) |
| 5:00 AM to 5:29 AM | 33 (7.5%) | 130 (30.9%) |
| 5:30 AM to 5:59 AM | 61 (13.8%) | 33 (7.8%) |
| 6:00 AM to 6:29 AM | 67 (15.2%) | 0 (0.0%) |
| 6:30 AM to 6:59 AM | 111 (25.1%) | 11 (2.6%) |
| 7:00 AM to 7:29 AM | 29 (6.6%) | 64 (15.2%) |
| 7:30 AM to 7:59 AM | 18 (4.1%) | 83 (19.7%) |
| 8:00 AM to 8:29 AM | 2 (0.4%) | 21 (5.0%) |
| 8:30 AM to 8:59 AM | 0 (0.0%) | 20 (4.8%) |
| 9:00 AM to 9:59 AM | 24 (5.4%) | 14 (3.3%) |
| 10:00 AM to 10:59 AM | 8 (1.8%) | 13 (3.1%) |
| 11:00 AM to 11:59 AM | 9 (2.0%) | 0 (0.0%) |
| 12:00 PM to 3:59 PM | 35 (7.9%) | 10 (2.4%) |
| 4:00 PM to 11:59 PM | 20 (4.5%) | 14 (3.3%) |
| Total | 442 (100.0%) | 421 (100.0%) |
Housing Occupancy in Bay
Occupancy by Ownership in Bay
Of the total 850 dwellings in Bay, owner-occupied units account for 376 (44.2%), while renter-occupied units make up 474 (55.8%).
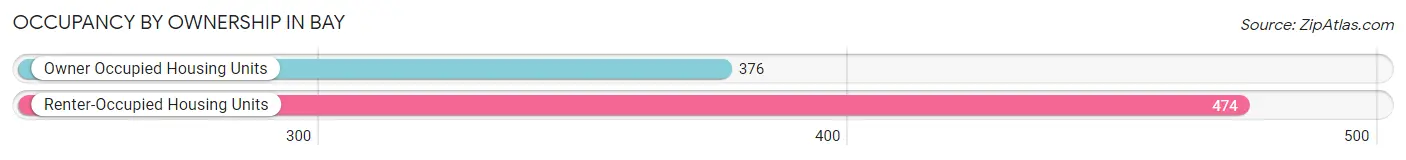
| Occupancy | # Housing Units | % Housing Units |
| Owner Occupied Housing Units | 376 | 44.2% |
| Renter-Occupied Housing Units | 474 | 55.8% |
| Total Occupied Housing Units | 850 | 100.0% |
Occupancy by Household Size in Bay
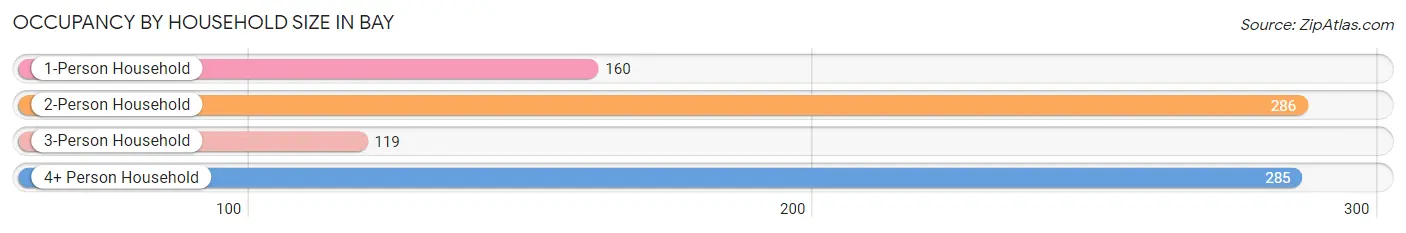
| Household Size | # Housing Units | % Housing Units |
| 1-Person Household | 160 | 18.8% |
| 2-Person Household | 286 | 33.7% |
| 3-Person Household | 119 | 14.0% |
| 4+ Person Household | 285 | 33.5% |
| Total Housing Units | 850 | 100.0% |
Occupancy by Ownership by Household Size in Bay
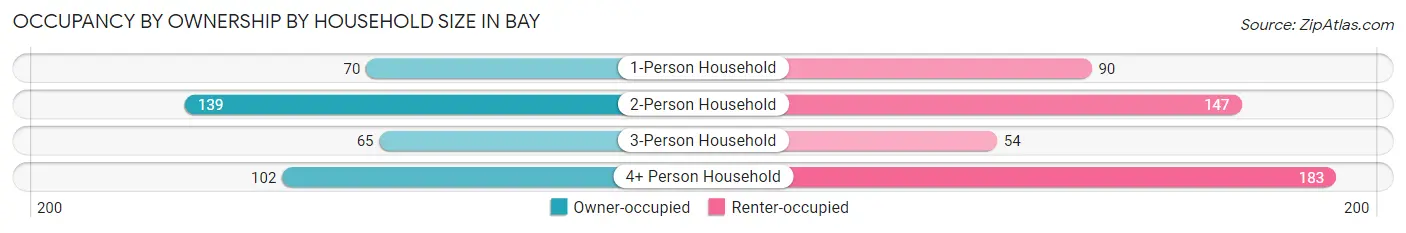
| Household Size | Owner-occupied | Renter-occupied |
| 1-Person Household | 70 (43.8%) | 90 (56.2%) |
| 2-Person Household | 139 (48.6%) | 147 (51.4%) |
| 3-Person Household | 65 (54.6%) | 54 (45.4%) |
| 4+ Person Household | 102 (35.8%) | 183 (64.2%) |
| Total Housing Units | 376 (44.2%) | 474 (55.8%) |
Occupancy by Educational Attainment in Bay
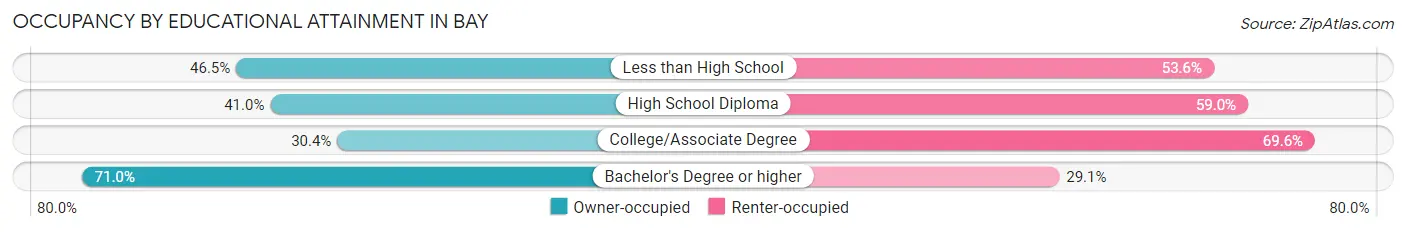
| Household Size | Owner-occupied | Renter-occupied |
| Less than High School | 72 (46.5%) | 83 (53.5%) |
| High School Diploma | 126 (41.0%) | 181 (59.0%) |
| College/Associate Degree | 73 (30.4%) | 167 (69.6%) |
| Bachelor's Degree or higher | 105 (71.0%) | 43 (29.0%) |
Occupancy by Age of Householder in Bay
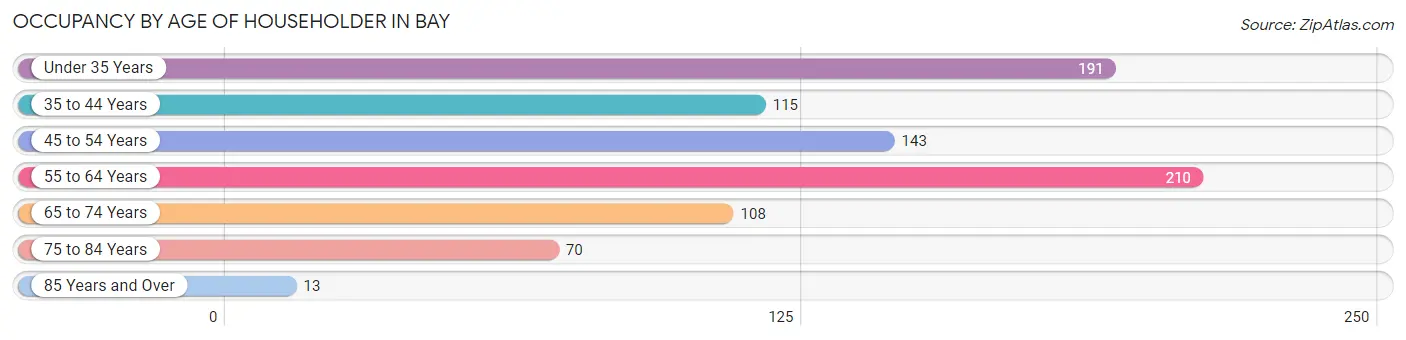
| Age Bracket | # Households | % Households |
| Under 35 Years | 191 | 22.5% |
| 35 to 44 Years | 115 | 13.5% |
| 45 to 54 Years | 143 | 16.8% |
| 55 to 64 Years | 210 | 24.7% |
| 65 to 74 Years | 108 | 12.7% |
| 75 to 84 Years | 70 | 8.2% |
| 85 Years and Over | 13 | 1.5% |
| Total | 850 | 100.0% |
Housing Finances in Bay
Median Income by Occupancy in Bay
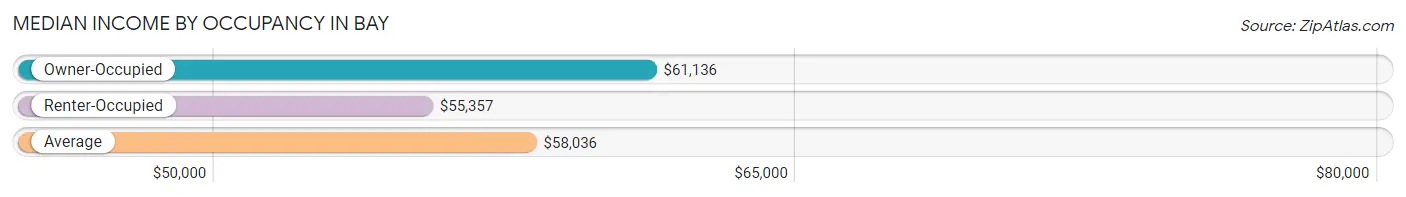
| Occupancy Type | # Households | Median Income |
| Owner-Occupied | 376 (44.2%) | $61,136 |
| Renter-Occupied | 474 (55.8%) | $55,357 |
| Average | 850 (100.0%) | $58,036 |
Occupancy by Householder Income Bracket in Bay
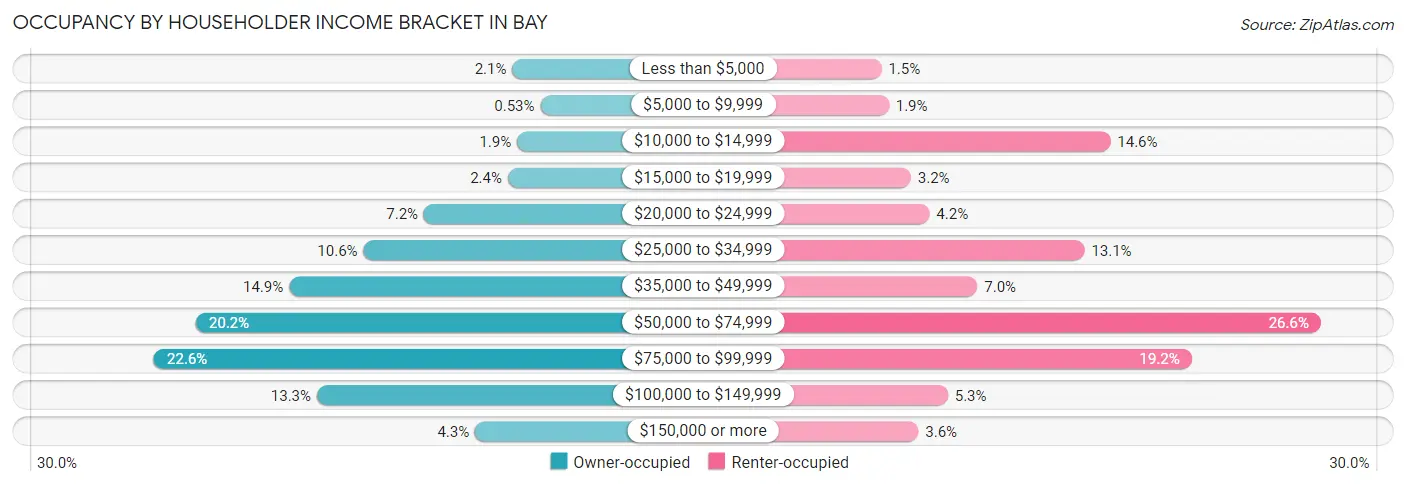
| Income Bracket | Owner-occupied | Renter-occupied |
| Less than $5,000 | 8 (2.1%) | 7 (1.5%) |
| $5,000 to $9,999 | 2 (0.5%) | 9 (1.9%) |
| $10,000 to $14,999 | 7 (1.9%) | 69 (14.6%) |
| $15,000 to $19,999 | 9 (2.4%) | 15 (3.2%) |
| $20,000 to $24,999 | 27 (7.2%) | 20 (4.2%) |
| $25,000 to $34,999 | 40 (10.6%) | 62 (13.1%) |
| $35,000 to $49,999 | 56 (14.9%) | 33 (7.0%) |
| $50,000 to $74,999 | 76 (20.2%) | 126 (26.6%) |
| $75,000 to $99,999 | 85 (22.6%) | 91 (19.2%) |
| $100,000 to $149,999 | 50 (13.3%) | 25 (5.3%) |
| $150,000 or more | 16 (4.3%) | 17 (3.6%) |
| Total | 376 (100.0%) | 474 (100.0%) |
Monthly Housing Cost Tiers in Bay
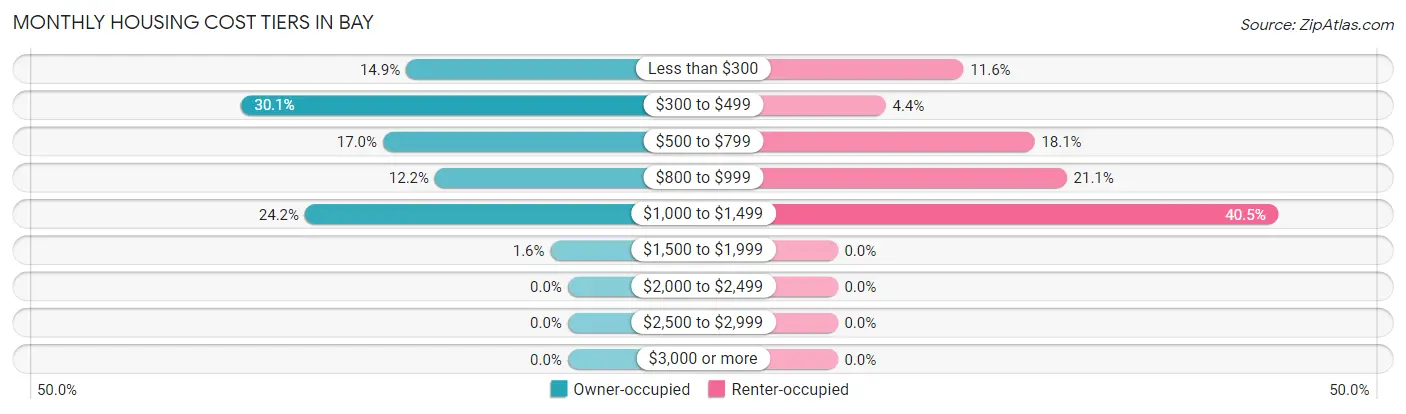
| Monthly Cost | Owner-occupied | Renter-occupied |
| Less than $300 | 56 (14.9%) | 55 (11.6%) |
| $300 to $499 | 113 (30.0%) | 21 (4.4%) |
| $500 to $799 | 64 (17.0%) | 86 (18.1%) |
| $800 to $999 | 46 (12.2%) | 100 (21.1%) |
| $1,000 to $1,499 | 91 (24.2%) | 192 (40.5%) |
| $1,500 to $1,999 | 6 (1.6%) | 0 (0.0%) |
| $2,000 to $2,499 | 0 (0.0%) | 0 (0.0%) |
| $2,500 to $2,999 | 0 (0.0%) | 0 (0.0%) |
| $3,000 or more | 0 (0.0%) | 0 (0.0%) |
| Total | 376 (100.0%) | 474 (100.0%) |
Physical Housing Characteristics in Bay
Housing Structures in Bay
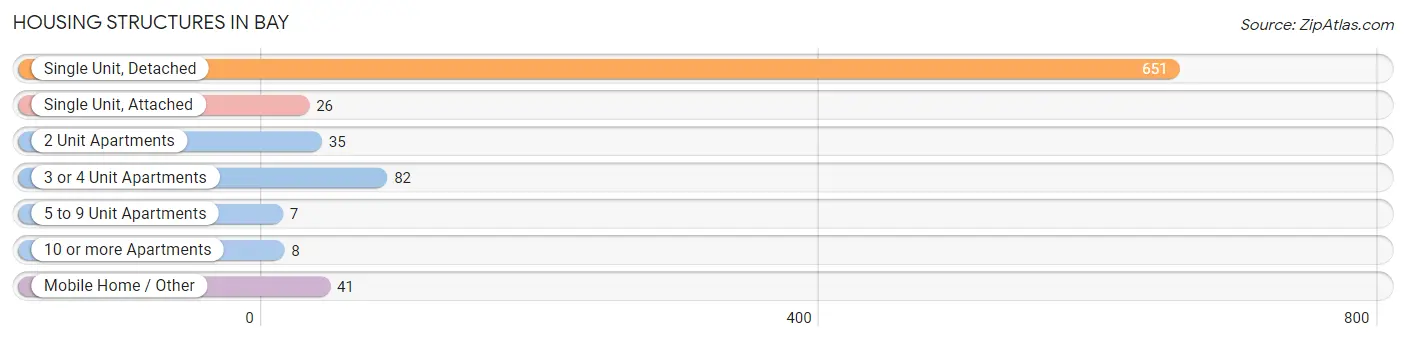
| Structure Type | # Housing Units | % Housing Units |
| Single Unit, Detached | 651 | 76.6% |
| Single Unit, Attached | 26 | 3.1% |
| 2 Unit Apartments | 35 | 4.1% |
| 3 or 4 Unit Apartments | 82 | 9.7% |
| 5 to 9 Unit Apartments | 7 | 0.8% |
| 10 or more Apartments | 8 | 0.9% |
| Mobile Home / Other | 41 | 4.8% |
| Total | 850 | 100.0% |
Housing Structures by Occupancy in Bay
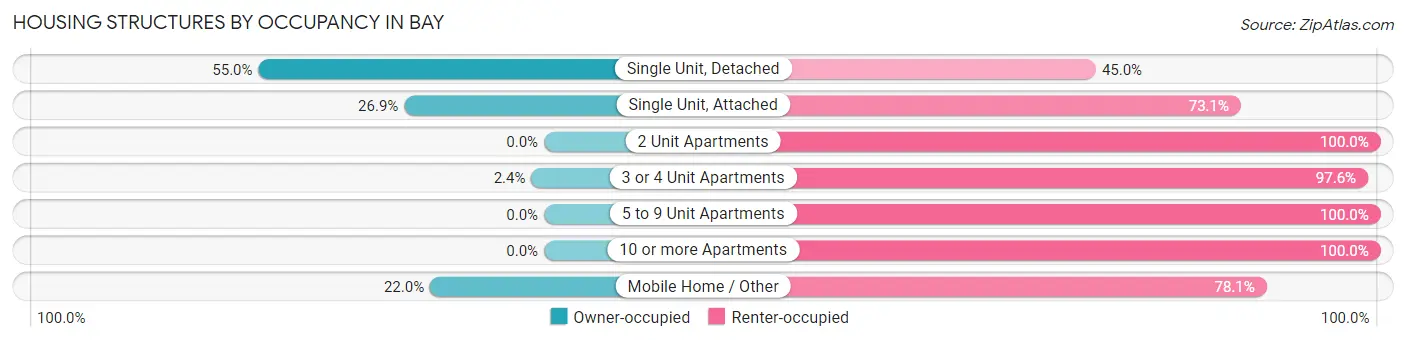
| Structure Type | Owner-occupied | Renter-occupied |
| Single Unit, Detached | 358 (55.0%) | 293 (45.0%) |
| Single Unit, Attached | 7 (26.9%) | 19 (73.1%) |
| 2 Unit Apartments | 0 (0.0%) | 35 (100.0%) |
| 3 or 4 Unit Apartments | 2 (2.4%) | 80 (97.6%) |
| 5 to 9 Unit Apartments | 0 (0.0%) | 7 (100.0%) |
| 10 or more Apartments | 0 (0.0%) | 8 (100.0%) |
| Mobile Home / Other | 9 (22.0%) | 32 (78.0%) |
| Total | 376 (44.2%) | 474 (55.8%) |
Housing Structures by Number of Rooms in Bay
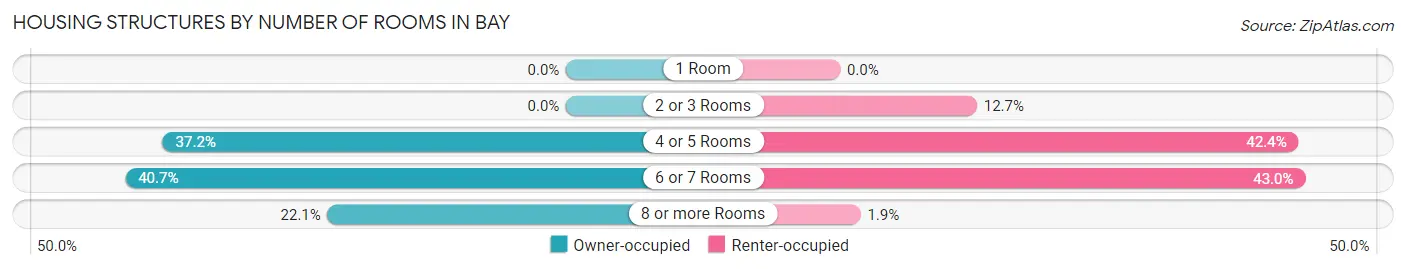
| Number of Rooms | Owner-occupied | Renter-occupied |
| 1 Room | 0 (0.0%) | 0 (0.0%) |
| 2 or 3 Rooms | 0 (0.0%) | 60 (12.7%) |
| 4 or 5 Rooms | 140 (37.2%) | 201 (42.4%) |
| 6 or 7 Rooms | 153 (40.7%) | 204 (43.0%) |
| 8 or more Rooms | 83 (22.1%) | 9 (1.9%) |
| Total | 376 (100.0%) | 474 (100.0%) |
Housing Structure by Heating Type in Bay
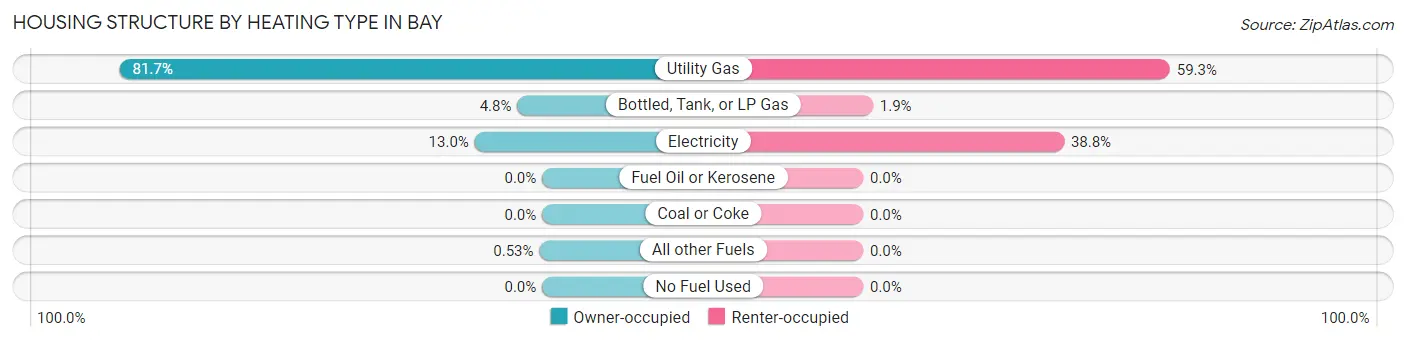
| Heating Type | Owner-occupied | Renter-occupied |
| Utility Gas | 307 (81.7%) | 281 (59.3%) |
| Bottled, Tank, or LP Gas | 18 (4.8%) | 9 (1.9%) |
| Electricity | 49 (13.0%) | 184 (38.8%) |
| Fuel Oil or Kerosene | 0 (0.0%) | 0 (0.0%) |
| Coal or Coke | 0 (0.0%) | 0 (0.0%) |
| All other Fuels | 2 (0.5%) | 0 (0.0%) |
| No Fuel Used | 0 (0.0%) | 0 (0.0%) |
| Total | 376 (100.0%) | 474 (100.0%) |
Household Vehicle Usage in Bay
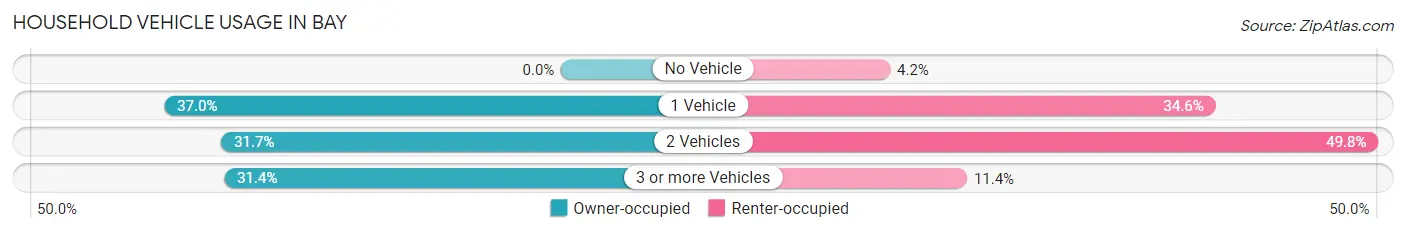
| Vehicles per Household | Owner-occupied | Renter-occupied |
| No Vehicle | 0 (0.0%) | 20 (4.2%) |
| 1 Vehicle | 139 (37.0%) | 164 (34.6%) |
| 2 Vehicles | 119 (31.7%) | 236 (49.8%) |
| 3 or more Vehicles | 118 (31.4%) | 54 (11.4%) |
| Total | 376 (100.0%) | 474 (100.0%) |
Real Estate & Mortgages in Bay
Real Estate and Mortgage Overview in Bay
| Characteristic | Without Mortgage | With Mortgage |
| Housing Units | 204 | 172 |
| Median Property Value | $92,300 | $108,500 |
| Median Household Income | $47,500 | $8 |
| Monthly Housing Costs | $370 | $0 |
| Real Estate Taxes | $471 | $3 |
Property Value by Mortgage Status in Bay
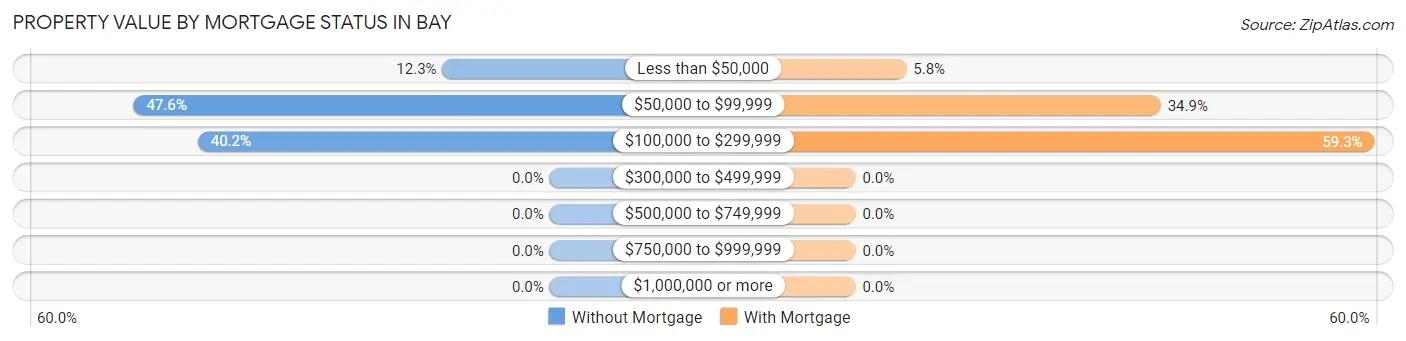
| Property Value | Without Mortgage | With Mortgage |
| Less than $50,000 | 25 (12.2%) | 10 (5.8%) |
| $50,000 to $99,999 | 97 (47.5%) | 60 (34.9%) |
| $100,000 to $299,999 | 82 (40.2%) | 102 (59.3%) |
| $300,000 to $499,999 | 0 (0.0%) | 0 (0.0%) |
| $500,000 to $749,999 | 0 (0.0%) | 0 (0.0%) |
| $750,000 to $999,999 | 0 (0.0%) | 0 (0.0%) |
| $1,000,000 or more | 0 (0.0%) | 0 (0.0%) |
| Total | 204 (100.0%) | 172 (100.0%) |
Household Income by Mortgage Status in Bay
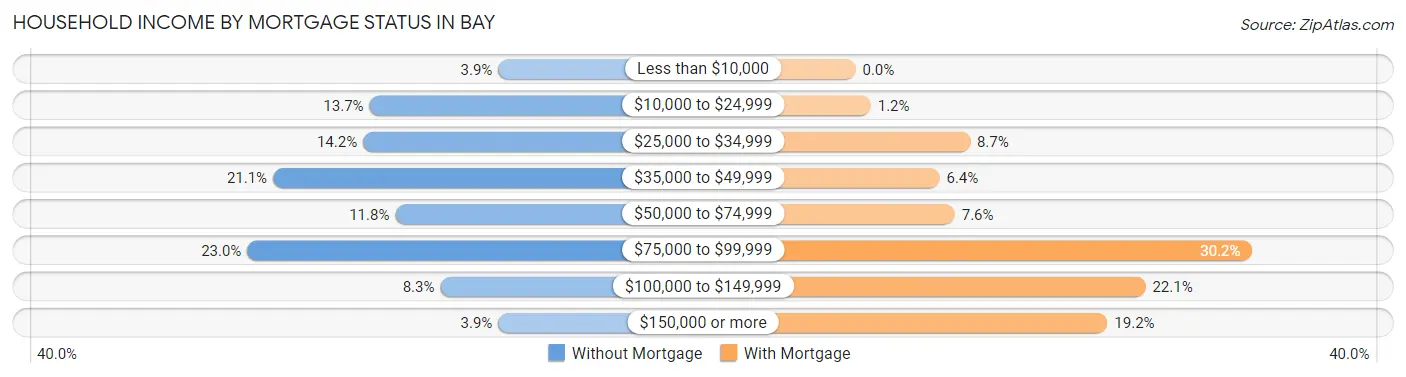
| Household Income | Without Mortgage | With Mortgage |
| Less than $10,000 | 8 (3.9%) | 0 (0.0%) |
| $10,000 to $24,999 | 28 (13.7%) | 2 (1.2%) |
| $25,000 to $34,999 | 29 (14.2%) | 15 (8.7%) |
| $35,000 to $49,999 | 43 (21.1%) | 11 (6.4%) |
| $50,000 to $74,999 | 24 (11.8%) | 13 (7.6%) |
| $75,000 to $99,999 | 47 (23.0%) | 52 (30.2%) |
| $100,000 to $149,999 | 17 (8.3%) | 38 (22.1%) |
| $150,000 or more | 8 (3.9%) | 33 (19.2%) |
| Total | 204 (100.0%) | 172 (100.0%) |
Property Value to Household Income Ratio in Bay
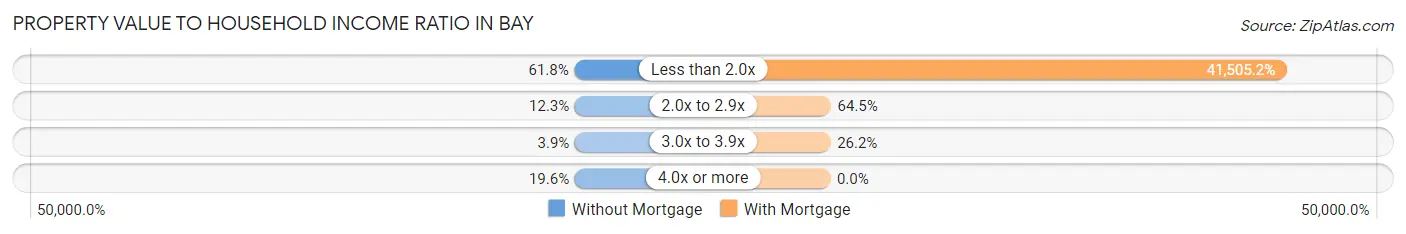
| Value-to-Income Ratio | Without Mortgage | With Mortgage |
| Less than 2.0x | 126 (61.8%) | 71,389 (41,505.2%) |
| 2.0x to 2.9x | 25 (12.2%) | 111 (64.5%) |
| 3.0x to 3.9x | 8 (3.9%) | 45 (26.2%) |
| 4.0x or more | 40 (19.6%) | 0 (0.0%) |
| Total | 204 (100.0%) | 172 (100.0%) |
Real Estate Taxes by Mortgage Status in Bay
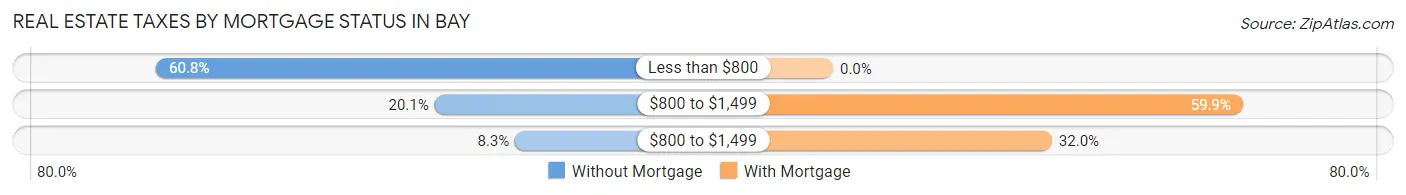
| Property Taxes | Without Mortgage | With Mortgage |
| Less than $800 | 124 (60.8%) | 0 (0.0%) |
| $800 to $1,499 | 41 (20.1%) | 103 (59.9%) |
| $800 to $1,499 | 17 (8.3%) | 55 (32.0%) |
| Total | 204 (100.0%) | 172 (100.0%) |
Health & Disability in Bay
Health Insurance Coverage by Age in Bay
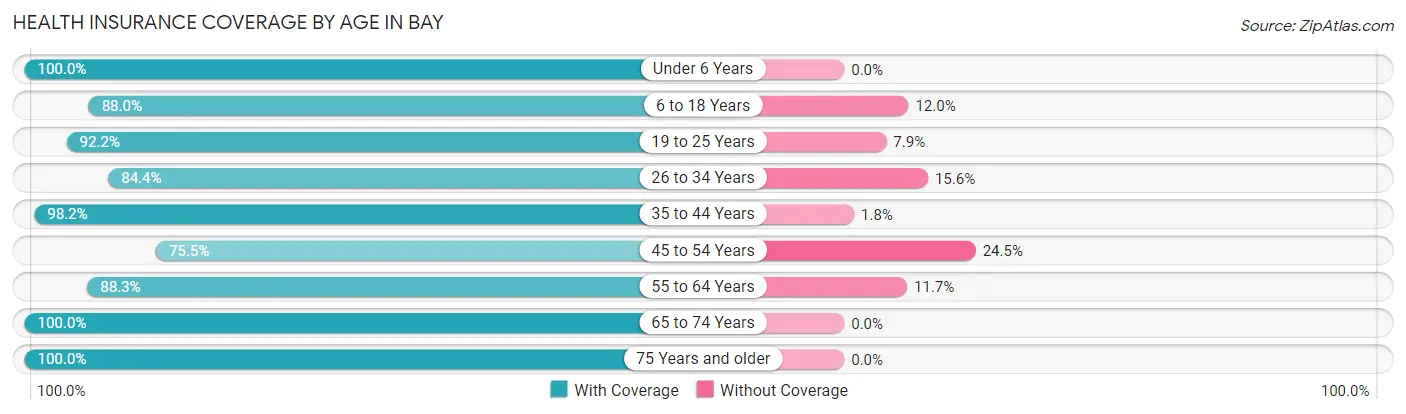
| Age Bracket | With Coverage | Without Coverage |
| Under 6 Years | 407 (100.0%) | 0 (0.0%) |
| 6 to 18 Years | 353 (88.0%) | 48 (12.0%) |
| 19 to 25 Years | 176 (92.1%) | 15 (7.9%) |
| 26 to 34 Years | 254 (84.4%) | 47 (15.6%) |
| 35 to 44 Years | 215 (98.2%) | 4 (1.8%) |
| 45 to 54 Years | 194 (75.5%) | 63 (24.5%) |
| 55 to 64 Years | 294 (88.3%) | 39 (11.7%) |
| 65 to 74 Years | 186 (100.0%) | 0 (0.0%) |
| 75 Years and older | 97 (100.0%) | 0 (0.0%) |
| Total | 2,176 (91.0%) | 216 (9.0%) |
Health Insurance Coverage by Citizenship Status in Bay
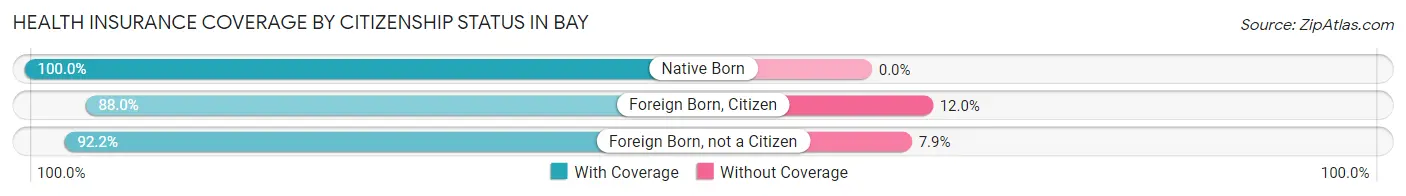
| Citizenship Status | With Coverage | Without Coverage |
| Native Born | 407 (100.0%) | 0 (0.0%) |
| Foreign Born, Citizen | 353 (88.0%) | 48 (12.0%) |
| Foreign Born, not a Citizen | 176 (92.1%) | 15 (7.9%) |
Health Insurance Coverage by Household Income in Bay
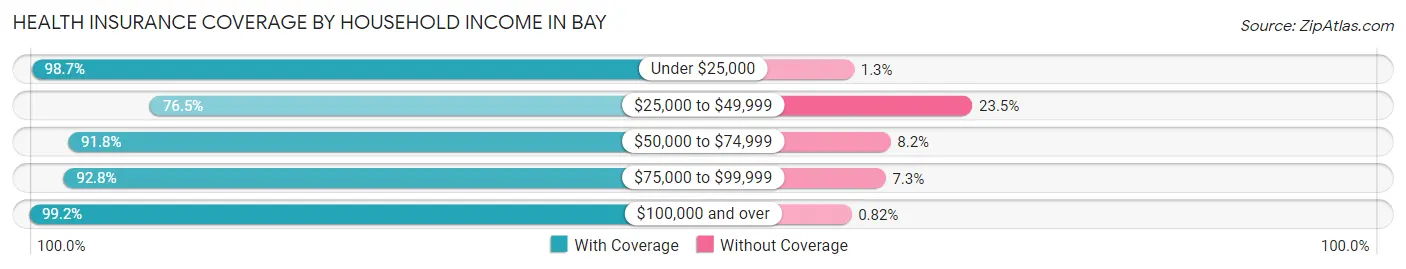
| Household Income | With Coverage | Without Coverage |
| Under $25,000 | 377 (98.7%) | 5 (1.3%) |
| $25,000 to $49,999 | 391 (76.5%) | 120 (23.5%) |
| $50,000 to $74,999 | 574 (91.8%) | 51 (8.2%) |
| $75,000 to $99,999 | 473 (92.7%) | 37 (7.2%) |
| $100,000 and over | 361 (99.2%) | 3 (0.8%) |
Public vs Private Health Insurance Coverage by Age in Bay
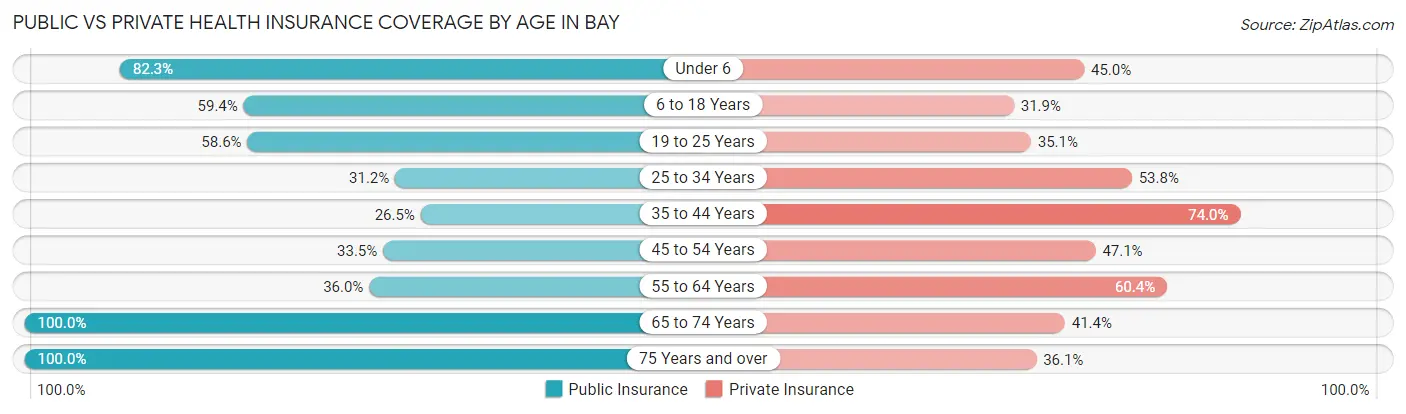
| Age Bracket | Public Insurance | Private Insurance |
| Under 6 | 335 (82.3%) | 183 (45.0%) |
| 6 to 18 Years | 238 (59.4%) | 128 (31.9%) |
| 19 to 25 Years | 112 (58.6%) | 67 (35.1%) |
| 25 to 34 Years | 94 (31.2%) | 162 (53.8%) |
| 35 to 44 Years | 58 (26.5%) | 162 (74.0%) |
| 45 to 54 Years | 86 (33.5%) | 121 (47.1%) |
| 55 to 64 Years | 120 (36.0%) | 201 (60.4%) |
| 65 to 74 Years | 186 (100.0%) | 77 (41.4%) |
| 75 Years and over | 97 (100.0%) | 35 (36.1%) |
| Total | 1,326 (55.4%) | 1,136 (47.5%) |
Disability Status by Sex by Age in Bay
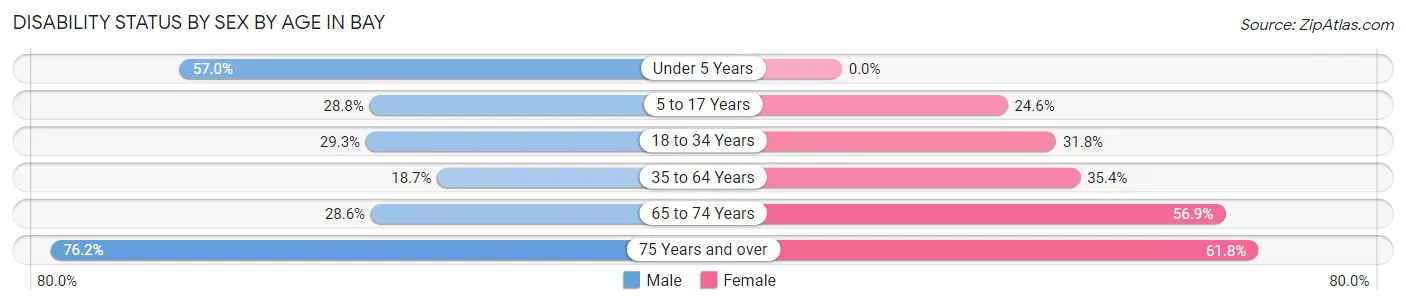
| Age Bracket | Male | Female |
| Under 5 Years | 127 (57.0%) | 0 (0.0%) |
| 5 to 17 Years | 63 (28.8%) | 61 (24.6%) |
| 18 to 34 Years | 73 (29.3%) | 83 (31.8%) |
| 35 to 64 Years | 70 (18.7%) | 154 (35.4%) |
| 65 to 74 Years | 20 (28.6%) | 66 (56.9%) |
| 75 Years and over | 32 (76.2%) | 34 (61.8%) |
Disability Class by Sex by Age in Bay
Disability Class: Hearing Difficulty
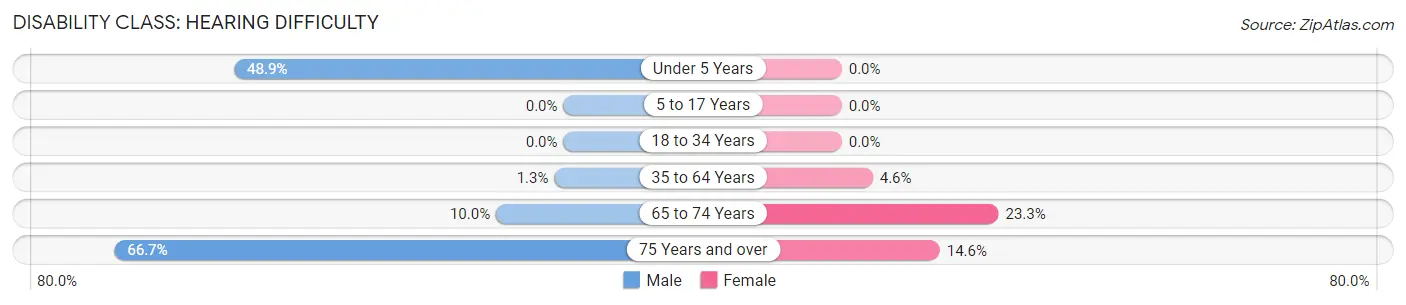
| Age Bracket | Male | Female |
| Under 5 Years | 109 (48.9%) | 0 (0.0%) |
| 5 to 17 Years | 0 (0.0%) | 0 (0.0%) |
| 18 to 34 Years | 0 (0.0%) | 0 (0.0%) |
| 35 to 64 Years | 5 (1.3%) | 20 (4.6%) |
| 65 to 74 Years | 7 (10.0%) | 27 (23.3%) |
| 75 Years and over | 28 (66.7%) | 8 (14.5%) |
Disability Class: Vision Difficulty
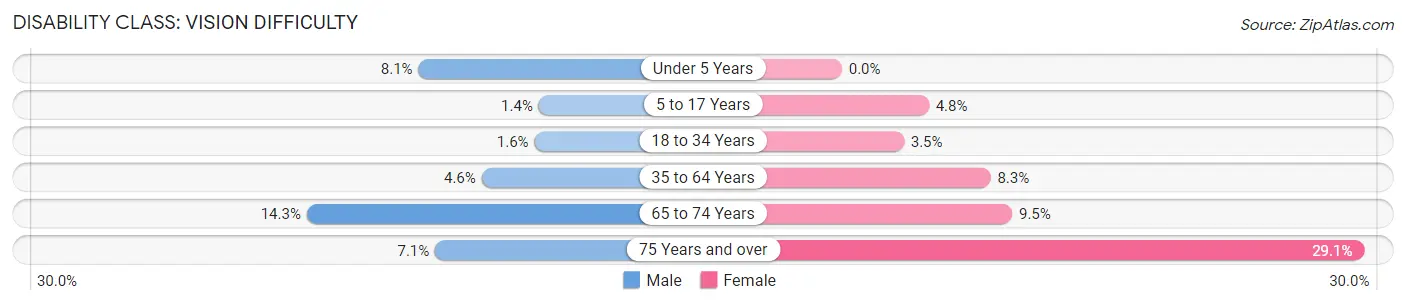
| Age Bracket | Male | Female |
| Under 5 Years | 18 (8.1%) | 0 (0.0%) |
| 5 to 17 Years | 3 (1.4%) | 12 (4.8%) |
| 18 to 34 Years | 4 (1.6%) | 9 (3.5%) |
| 35 to 64 Years | 17 (4.5%) | 36 (8.3%) |
| 65 to 74 Years | 10 (14.3%) | 11 (9.5%) |
| 75 Years and over | 3 (7.1%) | 16 (29.1%) |
Disability Class: Cognitive Difficulty
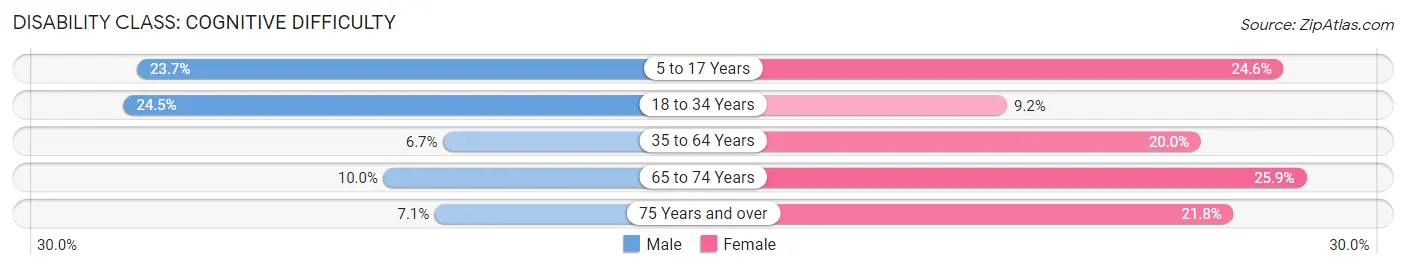
| Age Bracket | Male | Female |
| 5 to 17 Years | 52 (23.7%) | 61 (24.6%) |
| 18 to 34 Years | 61 (24.5%) | 24 (9.2%) |
| 35 to 64 Years | 25 (6.7%) | 87 (20.0%) |
| 65 to 74 Years | 7 (10.0%) | 30 (25.9%) |
| 75 Years and over | 3 (7.1%) | 12 (21.8%) |
Disability Class: Ambulatory Difficulty
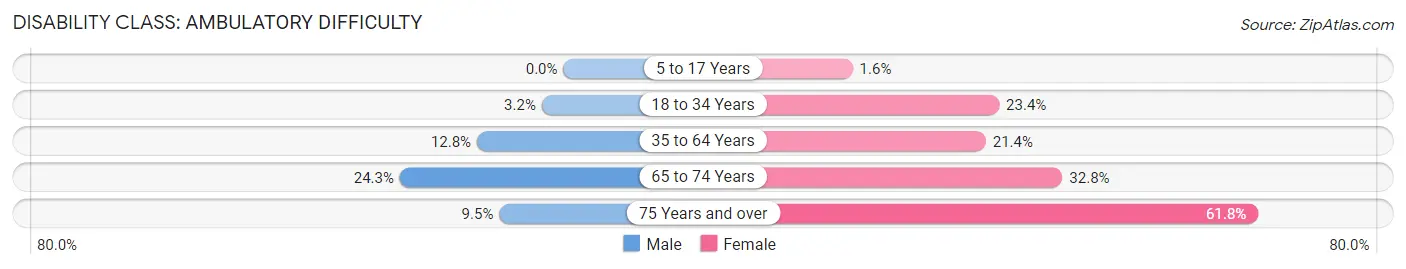
| Age Bracket | Male | Female |
| 5 to 17 Years | 0 (0.0%) | 4 (1.6%) |
| 18 to 34 Years | 8 (3.2%) | 61 (23.4%) |
| 35 to 64 Years | 48 (12.8%) | 93 (21.4%) |
| 65 to 74 Years | 17 (24.3%) | 38 (32.8%) |
| 75 Years and over | 4 (9.5%) | 34 (61.8%) |
Disability Class: Self-Care Difficulty
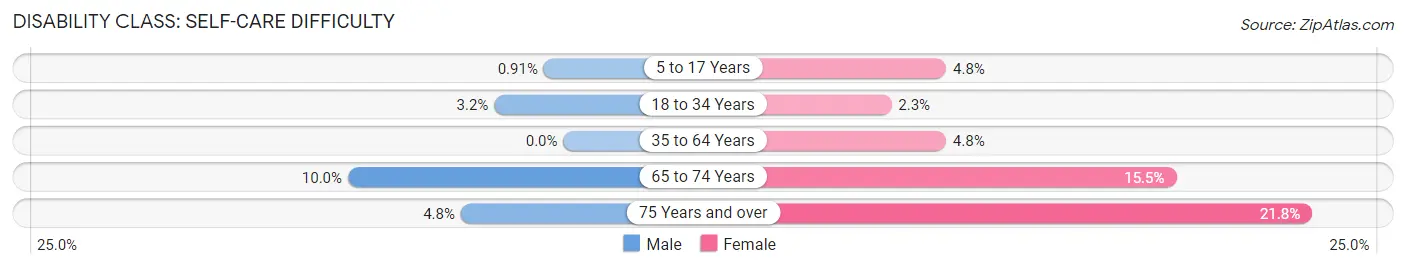
| Age Bracket | Male | Female |
| 5 to 17 Years | 2 (0.9%) | 12 (4.8%) |
| 18 to 34 Years | 8 (3.2%) | 6 (2.3%) |
| 35 to 64 Years | 0 (0.0%) | 21 (4.8%) |
| 65 to 74 Years | 7 (10.0%) | 18 (15.5%) |
| 75 Years and over | 2 (4.8%) | 12 (21.8%) |
Technology Access in Bay
Computing Device Access in Bay
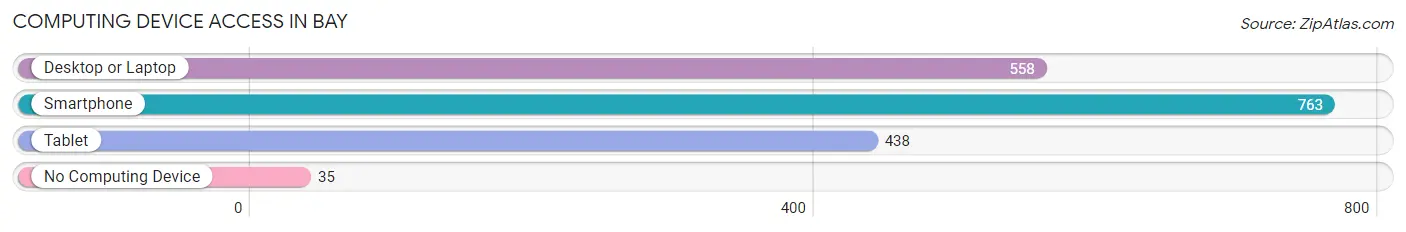
| Device Type | # Households | % Households |
| Desktop or Laptop | 558 | 65.6% |
| Smartphone | 763 | 89.8% |
| Tablet | 438 | 51.5% |
| No Computing Device | 35 | 4.1% |
| Total | 850 | 100.0% |
Internet Access in Bay
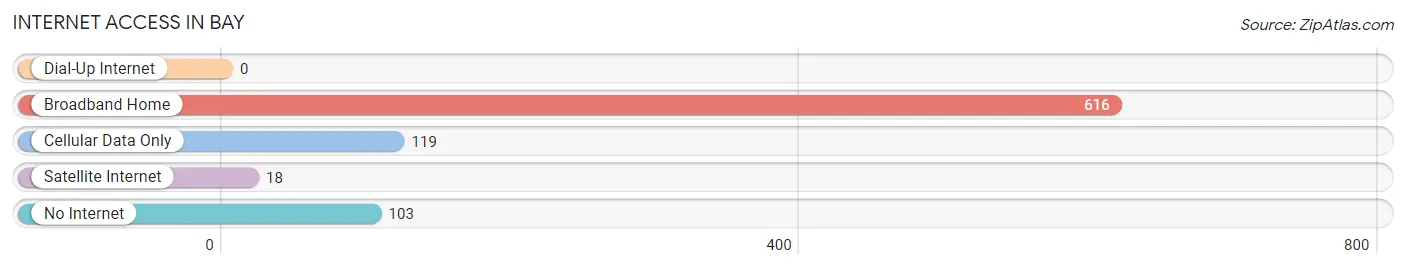
| Internet Type | # Households | % Households |
| Dial-Up Internet | 0 | 0.0% |
| Broadband Home | 616 | 72.5% |
| Cellular Data Only | 119 | 14.0% |
| Satellite Internet | 18 | 2.1% |
| No Internet | 103 | 12.1% |
| Total | 850 | 100.0% |
Bay Summary
Bay, Arkansas is a small town located in the northeastern corner of the state, in the foothills of the Ozark Mountains. It is situated in the Arkansas Delta region, which is known for its rich agricultural heritage. The town is located in Craighead County, and is part of the Jonesboro Metropolitan Statistical Area. As of the 2010 census, the population of Bay was 1,845.
Geography
Bay is located at 35°51'25" North, 90°37'45" West (35.857, -90.629). It is situated in the Arkansas Delta region, which is known for its rich agricultural heritage. The town is located in Craighead County, and is part of the Jonesboro Metropolitan Statistical Area. The town is situated on the banks of the St. Francis River, and is surrounded by rolling hills and woodlands.
The town has a total area of 1.3 square miles, all of which is land. The climate is humid subtropical, with hot, humid summers and mild winters. The average annual temperature is 64.3°F, and the average annual precipitation is 48.3 inches.
Economy
The economy of Bay is largely based on agriculture. The town is home to several large farms, which produce a variety of crops, including cotton, soybeans, corn, and wheat. The town is also home to several small businesses, including restaurants, retail stores, and service providers.
Demographics
As of the 2010 census, the population of Bay was 1,845. The racial makeup of the town was 79.2% White, 18.2% African American, 0.3% Native American, 0.2% Asian, 0.1% Pacific Islander, 0.7% from other races, and 1.4% from two or more races. Hispanic or Latino of any race were 1.7% of the population.
The median income for a household in the town was $30,938, and the median income for a family was $37,917. The per capita income for the town was $15,945. About 17.2% of families and 20.2% of the population were below the poverty line, including 28.3% of those under age 18 and 15.2% of those age 65 or over.
Education
Bay is served by the Bay School District, which operates one elementary school, one middle school, and one high school. The town is also home to a branch of Arkansas State University, which offers a variety of undergraduate and graduate degree programs.
Conclusion
Bay, Arkansas is a small town located in the northeastern corner of the state, in the foothills of the Ozark Mountains. It is situated in the Arkansas Delta region, which is known for its rich agricultural heritage. The town is home to several large farms, which produce a variety of crops, and is also home to several small businesses. The population of Bay was 1,845 as of the 2010 census, and the median income for a household was $30,938. The town is served by the Bay School District, and is also home to a branch of Arkansas State University.
Common Questions
What is Per Capita Income in Bay?
Per Capita income in Bay is $20,719.
What is the Median Family Income in Bay?
Median Family Income in Bay is $61,911.
What is the Median Household income in Bay?
Median Household Income in Bay is $58,036.
What is Income or Wage Gap in Bay?
Income or Wage Gap in Bay is 29.2%.
Women in Bay earn 70.8 cents for every dollar earned by a man.
What is Family Income Deficit in Bay?
Family Income Deficit in Bay is $9,820.
Families that are below poverty line in Bay earn $9,820 less on average than the poverty threshold level.
What is Inequality or Gini Index in Bay?
Inequality or Gini Index in Bay is 0.36.
What is the Total Population of Bay?
Total Population of Bay is 2,392.
What is the Total Male Population of Bay?
Total Male Population of Bay is 1,177.
What is the Total Female Population of Bay?
Total Female Population of Bay is 1,215.
What is the Ratio of Males per 100 Females in Bay?
There are 96.87 Males per 100 Females in Bay.
What is the Ratio of Females per 100 Males in Bay?
There are 103.23 Females per 100 Males in Bay.
What is the Median Population Age in Bay?
Median Population Age in Bay is 31.5 Years.
What is the Average Family Size in Bay
Average Family Size in Bay is 3.0 People.
What is the Average Household Size in Bay
Average Household Size in Bay is 2.8 People.
How Large is the Labor Force in Bay?
There are 1,026 People in the Labor Forcein in Bay.
What is the Percentage of People in the Labor Force in Bay?
62.2% of People are in the Labor Force in Bay.
What is the Unemployment Rate in Bay?
Unemployment Rate in Bay is 6.6%.