Bauxite, AR Map & Demographics
Bauxite Map
Bauxite Overview
$24,036
PER CAPITA INCOME
$67,266
AVG FAMILY INCOME
$68,125
AVG HOUSEHOLD INCOME
36.1%
WAGE / INCOME GAP [ % ]
63.9¢/ $1
WAGE / INCOME GAP [ $ ]
0.36
INEQUALITY / GINI INDEX
961
TOTAL POPULATION
394
MALE POPULATION
567
FEMALE POPULATION
69.49
MALES / 100 FEMALES
143.91
FEMALES / 100 MALES
32.4
MEDIAN AGE
3.0
AVG FAMILY SIZE
2.9
AVG HOUSEHOLD SIZE
382
LABOR FORCE [ PEOPLE ]
56.0%
PERCENT IN LABOR FORCE
4.0%
UNEMPLOYMENT RATE
Bauxite Zip Codes
Bauxite Area Codes
Income in Bauxite
Income Overview in Bauxite
Per Capita Income in Bauxite is $24,036, while median incomes of families and households are $67,266 and $68,125 respectively.
| Characteristic | Number | Measure |
| Per Capita Income | 961 | $24,036 |
| Median Family Income | 264 | $67,266 |
| Mean Family Income | 264 | $74,159 |
| Median Household Income | 327 | $68,125 |
| Mean Household Income | 327 | $71,050 |
| Income Deficit | 264 | $0 |
| Wage / Income Gap (%) | 961 | 36.09% |
| Wage / Income Gap ($) | 961 | 63.91¢ per $1 |
| Gini / Inequality Index | 961 | 0.36 |
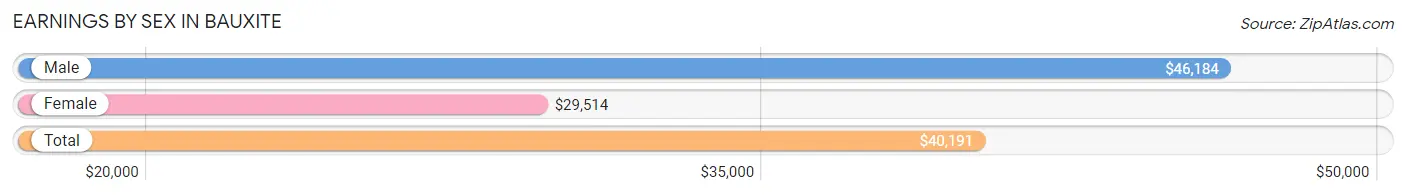
Earnings by Sex in Bauxite
Average Earnings in Bauxite are $40,191, $46,184 for men and $29,514 for women, a difference of 36.1%.
| Sex | Number | Average Earnings |
| Male | 200 (48.0%) | $46,184 |
| Female | 217 (52.0%) | $29,514 |
| Total | 417 (100.0%) | $40,191 |
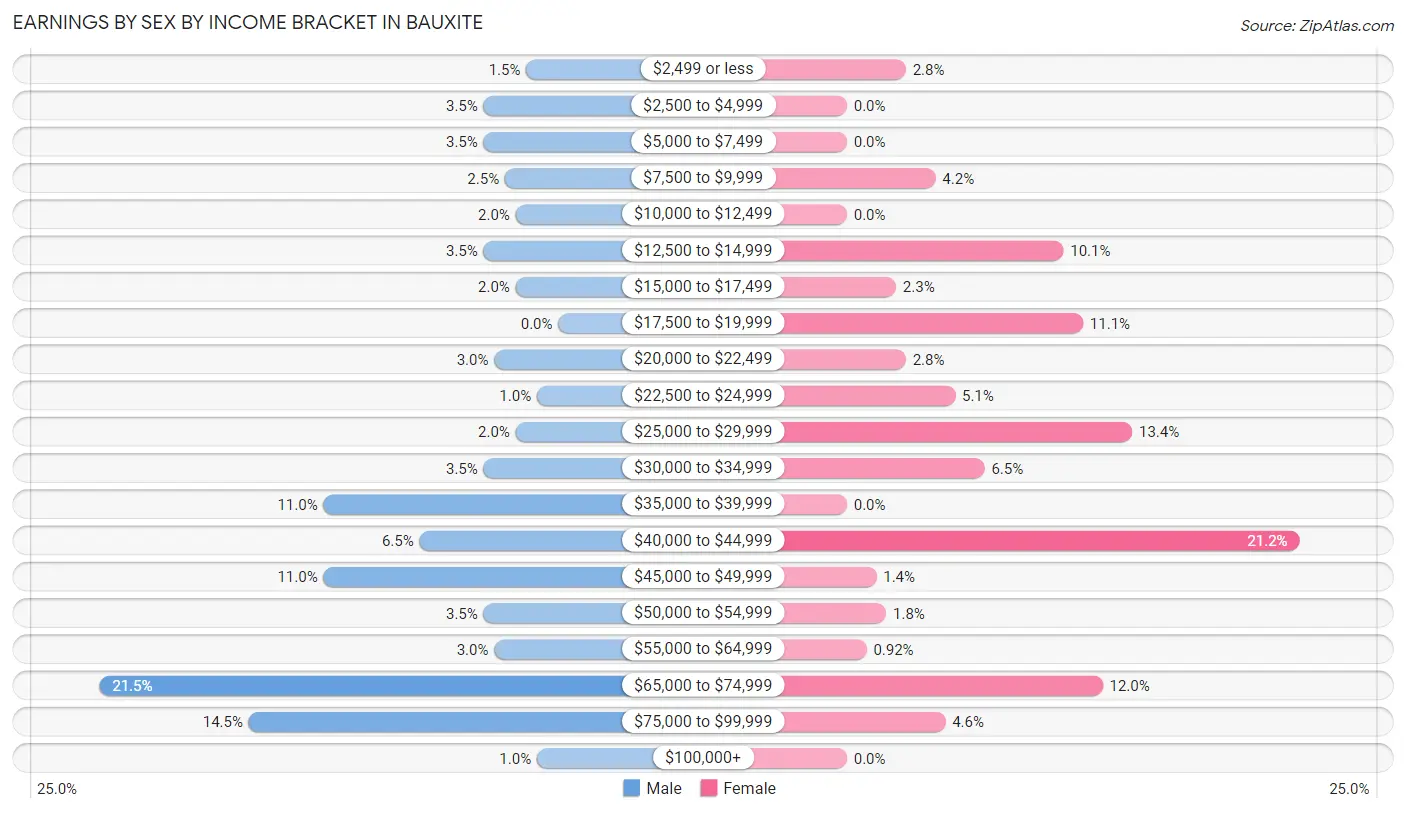
Earnings by Sex by Income Bracket in Bauxite
The most common earnings brackets in Bauxite are $65,000 to $74,999 for men (43 | 21.5%) and $40,000 to $44,999 for women (46 | 21.2%).
| Income | Male | Female |
| $2,499 or less | 3 (1.5%) | 6 (2.8%) |
| $2,500 to $4,999 | 7 (3.5%) | 0 (0.0%) |
| $5,000 to $7,499 | 7 (3.5%) | 0 (0.0%) |
| $7,500 to $9,999 | 5 (2.5%) | 9 (4.2%) |
| $10,000 to $12,499 | 4 (2.0%) | 0 (0.0%) |
| $12,500 to $14,999 | 7 (3.5%) | 22 (10.1%) |
| $15,000 to $17,499 | 4 (2.0%) | 5 (2.3%) |
| $17,500 to $19,999 | 0 (0.0%) | 24 (11.1%) |
| $20,000 to $22,499 | 6 (3.0%) | 6 (2.8%) |
| $22,500 to $24,999 | 2 (1.0%) | 11 (5.1%) |
| $25,000 to $29,999 | 4 (2.0%) | 29 (13.4%) |
| $30,000 to $34,999 | 7 (3.5%) | 14 (6.5%) |
| $35,000 to $39,999 | 22 (11.0%) | 0 (0.0%) |
| $40,000 to $44,999 | 13 (6.5%) | 46 (21.2%) |
| $45,000 to $49,999 | 22 (11.0%) | 3 (1.4%) |
| $50,000 to $54,999 | 7 (3.5%) | 4 (1.8%) |
| $55,000 to $64,999 | 6 (3.0%) | 2 (0.9%) |
| $65,000 to $74,999 | 43 (21.5%) | 26 (12.0%) |
| $75,000 to $99,999 | 29 (14.5%) | 10 (4.6%) |
| $100,000+ | 2 (1.0%) | 0 (0.0%) |
| Total | 200 (100.0%) | 217 (100.0%) |
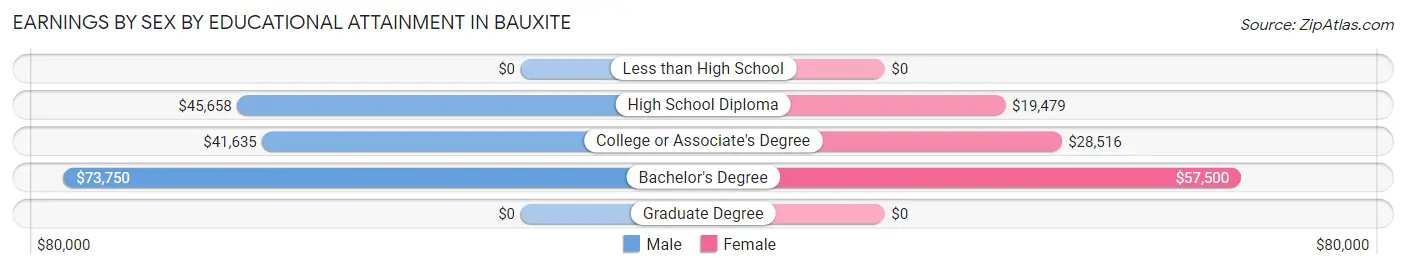
Earnings by Sex by Educational Attainment in Bauxite
Average earnings in Bauxite are $42,212 for men and $27,708 for women, a difference of 34.4%. Men with an educational attainment of bachelor's degree enjoy the highest average annual earnings of $73,750, while those with college or associate's degree education earn the least with $41,635. Women with an educational attainment of bachelor's degree earn the most with the average annual earnings of $57,500, while those with high school diploma education have the smallest earnings of $19,479.
| Educational Attainment | Male Income | Female Income |
| Less than High School | - | - |
| High School Diploma | $45,658 | $19,479 |
| College or Associate's Degree | $41,635 | $28,516 |
| Bachelor's Degree | $73,750 | $57,500 |
| Graduate Degree | - | - |
| Total | $42,212 | $27,708 |
Family Income in Bauxite
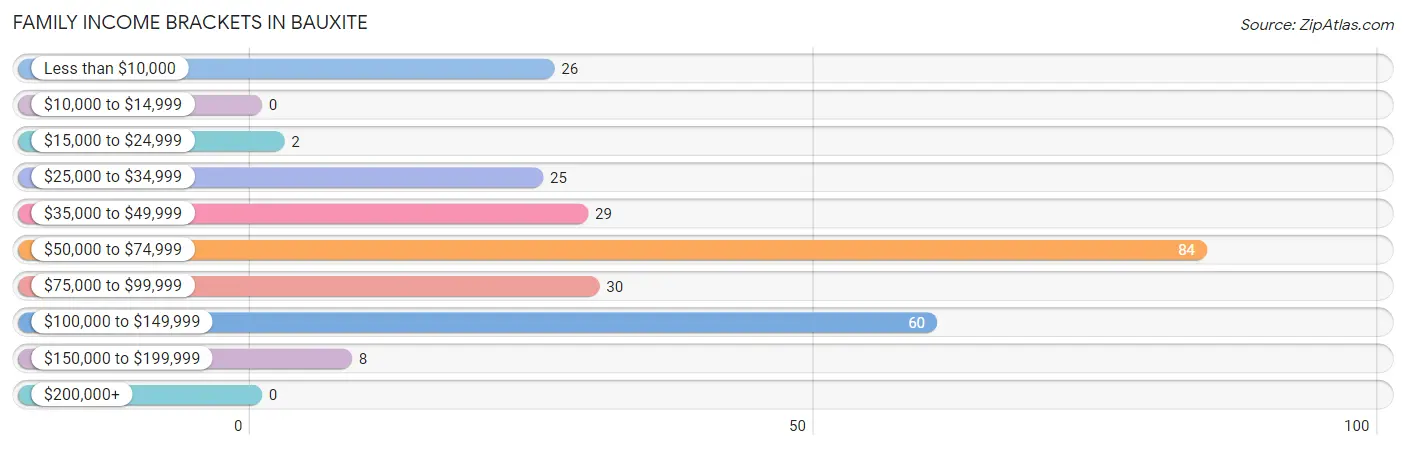
Family Income Brackets in Bauxite
According to the Bauxite family income data, there are 84 families falling into the $50,000 to $74,999 income range, which is the most common income bracket and makes up 31.8% of all families.
| Income Bracket | # Families | % Families |
| Less than $10,000 | 26 | 9.8% |
| $10,000 to $14,999 | 0 | 0.0% |
| $15,000 to $24,999 | 2 | 0.8% |
| $25,000 to $34,999 | 25 | 9.5% |
| $35,000 to $49,999 | 29 | 11.0% |
| $50,000 to $74,999 | 84 | 31.8% |
| $75,000 to $99,999 | 30 | 11.4% |
| $100,000 to $149,999 | 60 | 22.7% |
| $150,000 to $199,999 | 8 | 3.0% |
| $200,000+ | 0 | 0.0% |
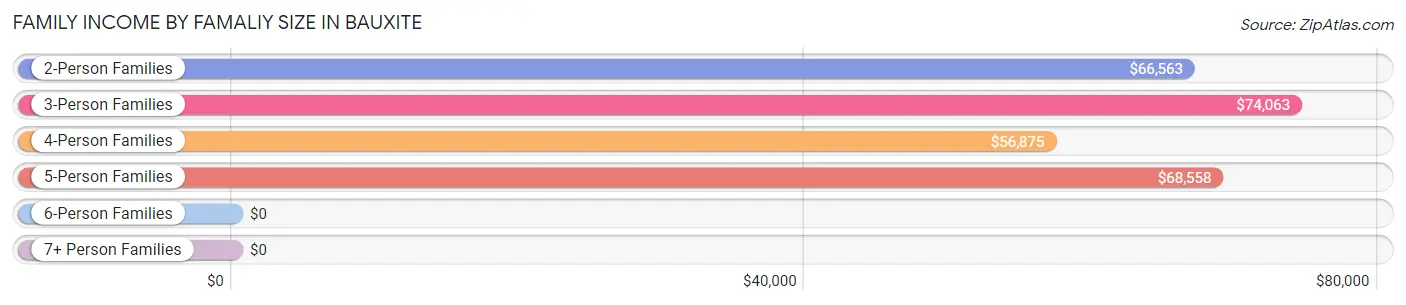
Family Income by Famaliy Size in Bauxite
3-person families (45 | 17.1%) account for the highest median family income in Bauxite with $74,063 per family, while 2-person families (152 | 57.6%) have the highest median income of $33,282 per family member.
| Income Bracket | # Families | Median Income |
| 2-Person Families | 152 (57.6%) | $66,563 |
| 3-Person Families | 45 (17.1%) | $74,063 |
| 4-Person Families | 13 (4.9%) | $56,875 |
| 5-Person Families | 35 (13.3%) | $68,558 |
| 6-Person Families | 10 (3.8%) | $0 |
| 7+ Person Families | 9 (3.4%) | $0 |
| Total | 264 (100.0%) | $67,266 |
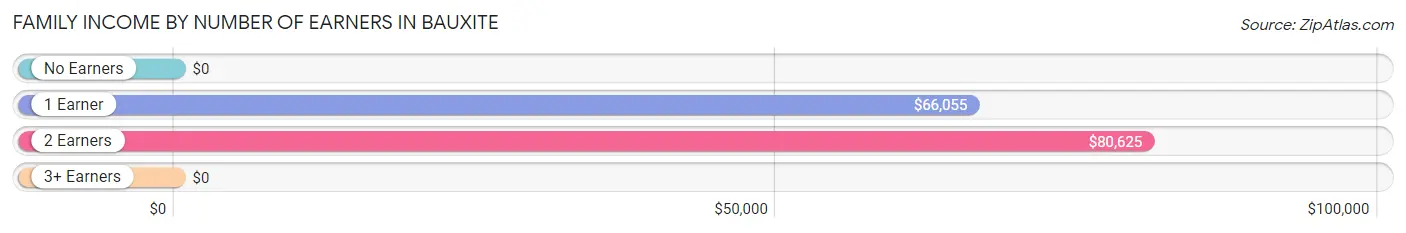
Family Income by Number of Earners in Bauxite
| Number of Earners | # Families | Median Income |
| No Earners | 27 (10.2%) | $0 |
| 1 Earner | 153 (58.0%) | $66,055 |
| 2 Earners | 84 (31.8%) | $80,625 |
| 3+ Earners | 0 (0.0%) | $0 |
| Total | 264 (100.0%) | $67,266 |
Household Income in Bauxite
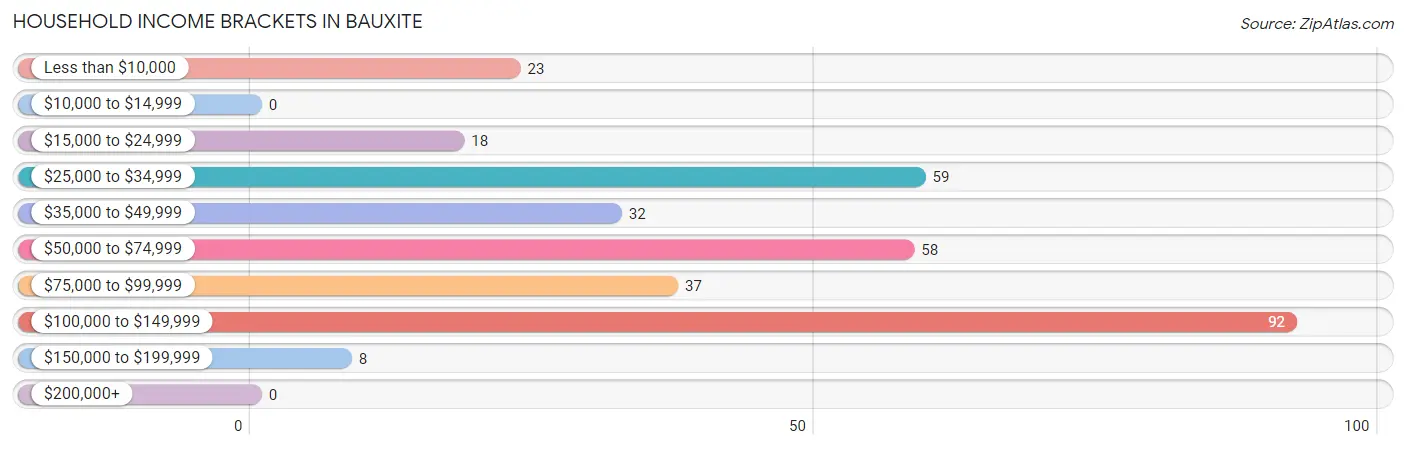
Household Income Brackets in Bauxite
With 92 households falling in the category, the $100,000 to $149,999 income range is the most frequent in Bauxite, accounting for 28.1% of all households.
| Income Bracket | # Households | % Households |
| Less than $10,000 | 23 | 7.0% |
| $10,000 to $14,999 | 0 | 0.0% |
| $15,000 to $24,999 | 18 | 5.5% |
| $25,000 to $34,999 | 59 | 18.0% |
| $35,000 to $49,999 | 32 | 9.8% |
| $50,000 to $74,999 | 58 | 17.7% |
| $75,000 to $99,999 | 37 | 11.3% |
| $100,000 to $149,999 | 92 | 28.1% |
| $150,000 to $199,999 | 8 | 2.4% |
| $200,000+ | 0 | 0.0% |
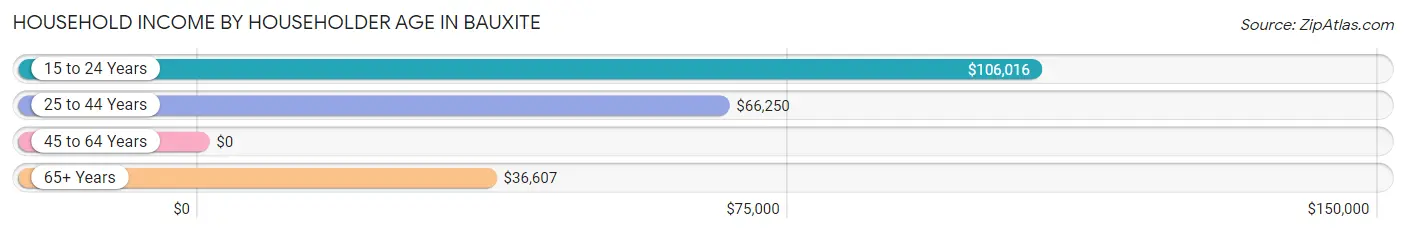
Household Income by Householder Age in Bauxite
The median household income in Bauxite is $68,125, with the highest median household income of $106,016 found in the 15 to 24 years age bracket for the primary householder. A total of 38 households (11.6%) fall into this category. Meanwhile, the 45 to 64 years age bracket for the primary householder has the lowest median household income of $0, with 95 households (29.0%) in this group.
| Income Bracket | # Households | Median Income |
| 15 to 24 Years | 38 (11.6%) | $106,016 |
| 25 to 44 Years | 95 (29.0%) | $66,250 |
| 45 to 64 Years | 95 (29.0%) | $0 |
| 65+ Years | 99 (30.3%) | $36,607 |
| Total | 327 (100.0%) | $68,125 |
Poverty in Bauxite
Income Below Poverty by Sex and Age in Bauxite
With 7.9% poverty level for males and 14.1% for females among the residents of Bauxite, under 5 year old males and 15 year old females are the most vulnerable to poverty, with 9 males (31.0%) and 8 females (100.0%) in their respective age groups living below the poverty level.
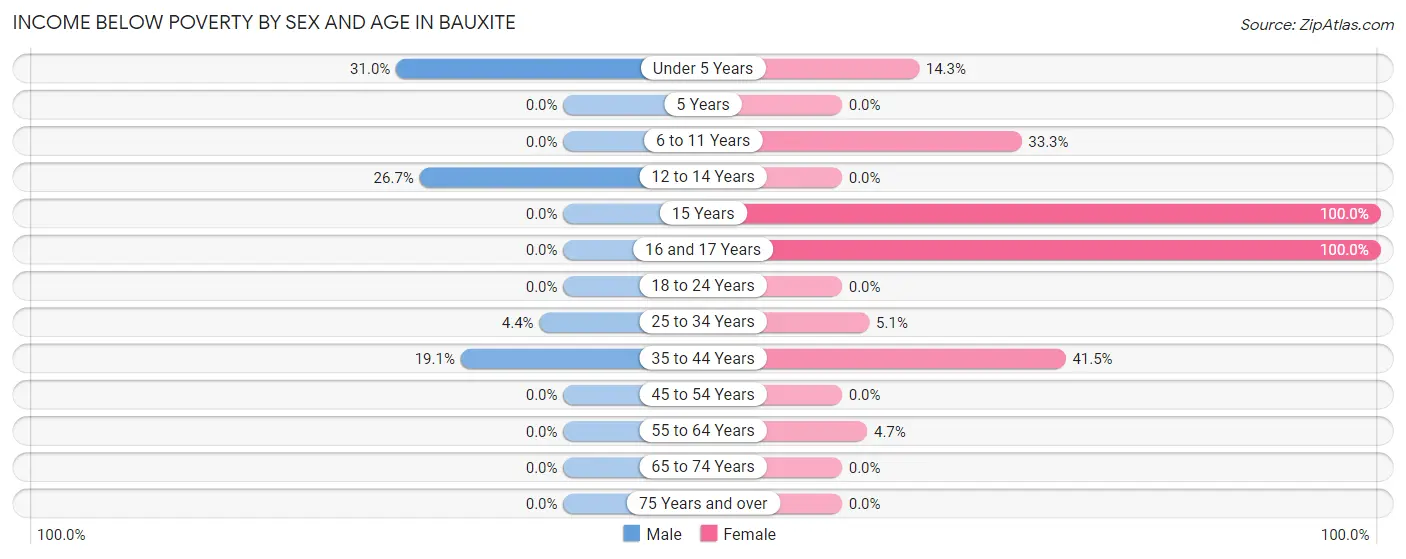
| Age Bracket | Male | Female |
| Under 5 Years | 9 (31.0%) | 6 (14.3%) |
| 5 Years | 0 (0.0%) | 0 (0.0%) |
| 6 to 11 Years | 0 (0.0%) | 21 (33.3%) |
| 12 to 14 Years | 8 (26.7%) | 0 (0.0%) |
| 15 Years | 0 (0.0%) | 8 (100.0%) |
| 16 and 17 Years | 0 (0.0%) | 9 (100.0%) |
| 18 to 24 Years | 0 (0.0%) | 0 (0.0%) |
| 25 to 34 Years | 2 (4.4%) | 3 (5.1%) |
| 35 to 44 Years | 12 (19.1%) | 22 (41.5%) |
| 45 to 54 Years | 0 (0.0%) | 0 (0.0%) |
| 55 to 64 Years | 0 (0.0%) | 3 (4.7%) |
| 65 to 74 Years | 0 (0.0%) | 0 (0.0%) |
| 75 Years and over | 0 (0.0%) | 0 (0.0%) |
| Total | 31 (7.9%) | 72 (14.1%) |
Income Above Poverty by Sex and Age in Bauxite
According to the poverty statistics in Bauxite, males aged 6 to 11 years and females aged 12 to 14 years are the age groups that are most secure financially, with 100.0% of males and 100.0% of females in these age groups living above the poverty line.
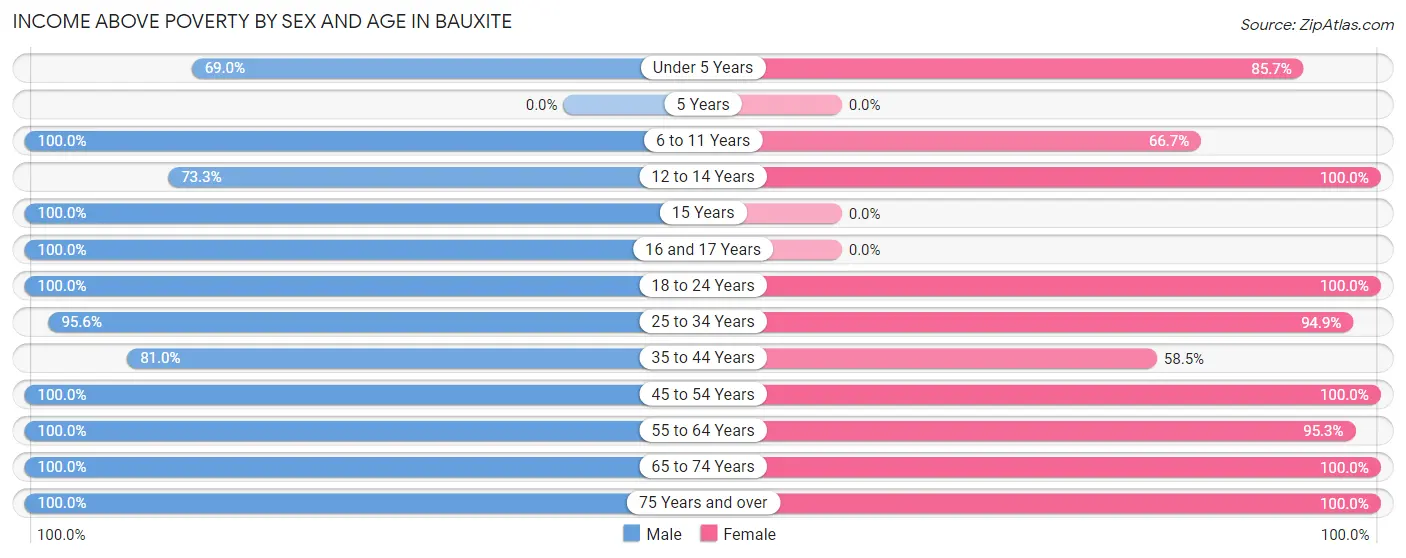
| Age Bracket | Male | Female |
| Under 5 Years | 20 (69.0%) | 36 (85.7%) |
| 5 Years | 0 (0.0%) | 0 (0.0%) |
| 6 to 11 Years | 17 (100.0%) | 42 (66.7%) |
| 12 to 14 Years | 22 (73.3%) | 28 (100.0%) |
| 15 Years | 7 (100.0%) | 0 (0.0%) |
| 16 and 17 Years | 5 (100.0%) | 0 (0.0%) |
| 18 to 24 Years | 57 (100.0%) | 57 (100.0%) |
| 25 to 34 Years | 43 (95.6%) | 56 (94.9%) |
| 35 to 44 Years | 51 (80.9%) | 31 (58.5%) |
| 45 to 54 Years | 29 (100.0%) | 35 (100.0%) |
| 55 to 64 Years | 54 (100.0%) | 61 (95.3%) |
| 65 to 74 Years | 39 (100.0%) | 56 (100.0%) |
| 75 Years and over | 19 (100.0%) | 38 (100.0%) |
| Total | 363 (92.1%) | 440 (85.9%) |
Income Below Poverty Among Married-Couple Families in Bauxite
The poverty statistics for married-couple families in Bauxite show that 6.4% or 11 of the total 173 families live below the poverty line. Families with 5 or more children have the highest poverty rate of 100.0%, comprising of 9 families. On the other hand, families with no children have the lowest poverty rate of 0.0%, which includes 0 families.
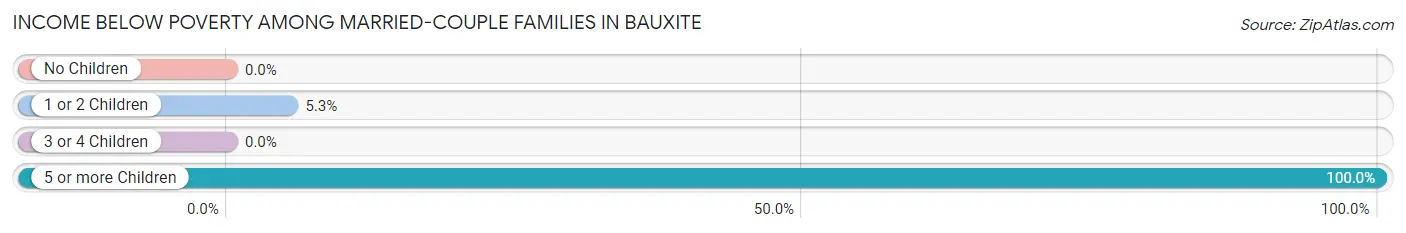
| Children | Above Poverty | Below Poverty |
| No Children | 100 (100.0%) | 0 (0.0%) |
| 1 or 2 Children | 36 (94.7%) | 2 (5.3%) |
| 3 or 4 Children | 26 (100.0%) | 0 (0.0%) |
| 5 or more Children | 0 (0.0%) | 9 (100.0%) |
| Total | 162 (93.6%) | 11 (6.4%) |
Income Below Poverty Among Single-Parent Households in Bauxite
According to the poverty data in Bauxite, 7.3% or 3 single-father households and 28.0% or 14 single-mother households are living below the poverty line. Among single-father households, those with 1 or 2 children have the highest poverty rate, with 3 households (8.6%) experiencing poverty. Likewise, among single-mother households, those with 1 or 2 children have the highest poverty rate, with 14 households (40.0%) falling below the poverty line.
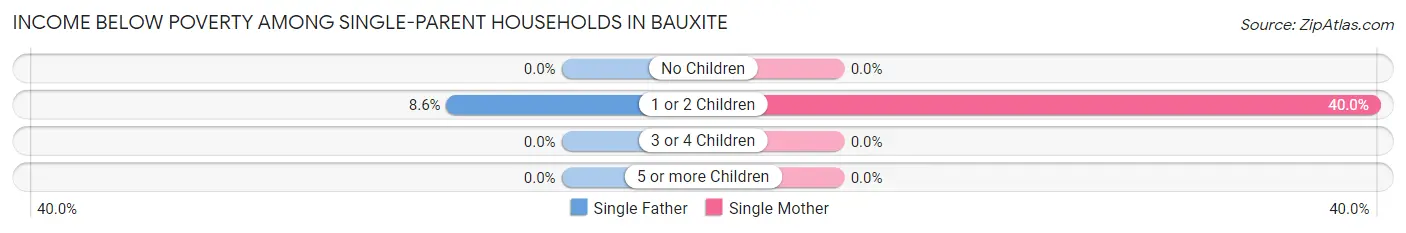
| Children | Single Father | Single Mother |
| No Children | 0 (0.0%) | 0 (0.0%) |
| 1 or 2 Children | 3 (8.6%) | 14 (40.0%) |
| 3 or 4 Children | 0 (0.0%) | 0 (0.0%) |
| 5 or more Children | 0 (0.0%) | 0 (0.0%) |
| Total | 3 (7.3%) | 14 (28.0%) |
Income Below Poverty Among Married-Couple vs Single-Parent Households in Bauxite
The poverty data for Bauxite shows that 11 of the married-couple family households (6.4%) and 17 of the single-parent households (18.7%) are living below the poverty level. Within the married-couple family households, those with 5 or more children have the highest poverty rate, with 9 households (100.0%) falling below the poverty line. Among the single-parent households, those with 1 or 2 children have the highest poverty rate, with 17 household (24.3%) living below poverty.
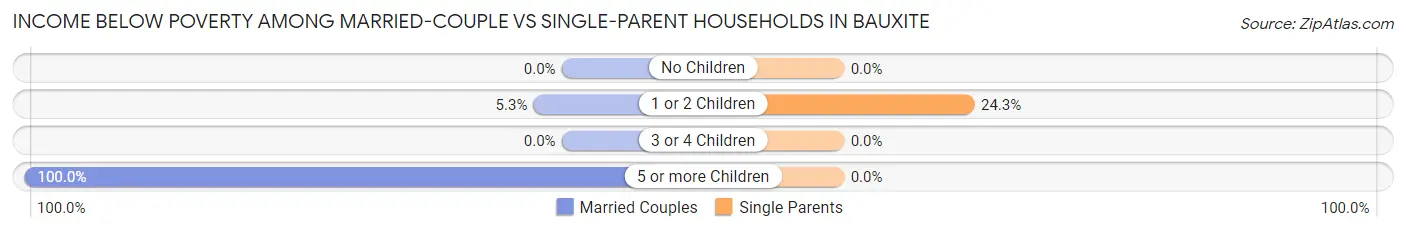
| Children | Married-Couple Families | Single-Parent Households |
| No Children | 0 (0.0%) | 0 (0.0%) |
| 1 or 2 Children | 2 (5.3%) | 17 (24.3%) |
| 3 or 4 Children | 0 (0.0%) | 0 (0.0%) |
| 5 or more Children | 9 (100.0%) | 0 (0.0%) |
| Total | 11 (6.4%) | 17 (18.7%) |
Race in Bauxite
The most populous races in Bauxite are White / Caucasian (902 | 93.9%), Black / African American (33 | 3.4%), and Two or more Races (26 | 2.7%).
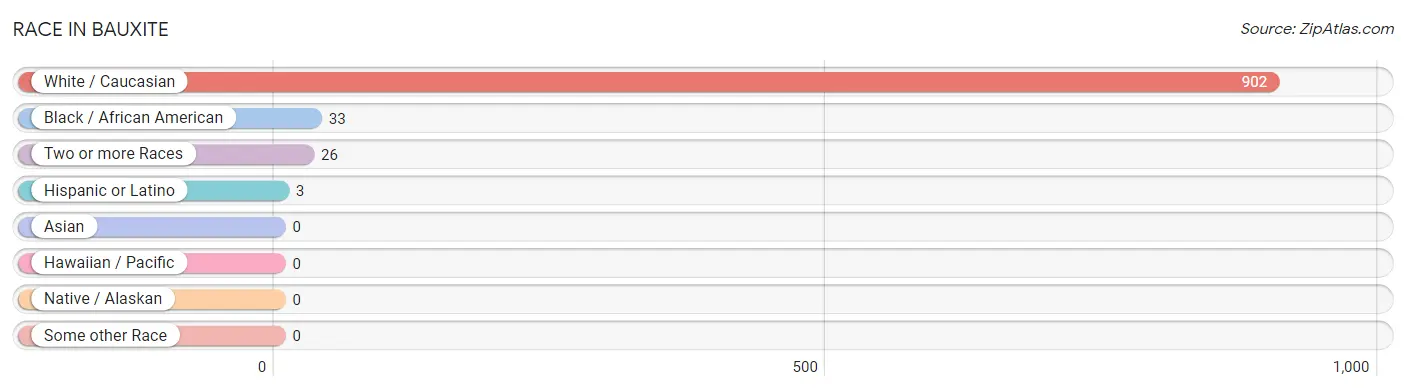
| Race | # Population | % Population |
| Asian | 0 | 0.0% |
| Black / African American | 33 | 3.4% |
| Hawaiian / Pacific | 0 | 0.0% |
| Hispanic or Latino | 3 | 0.3% |
| Native / Alaskan | 0 | 0.0% |
| White / Caucasian | 902 | 93.9% |
| Two or more Races | 26 | 2.7% |
| Some other Race | 0 | 0.0% |
| Total | 961 | 100.0% |
Ancestry in Bauxite
The most populous ancestries reported in Bauxite are Irish (177 | 18.4%), American (81 | 8.4%), English (57 | 5.9%), German (34 | 3.5%), and Scottish (27 | 2.8%), together accounting for 39.1% of all Bauxite residents.
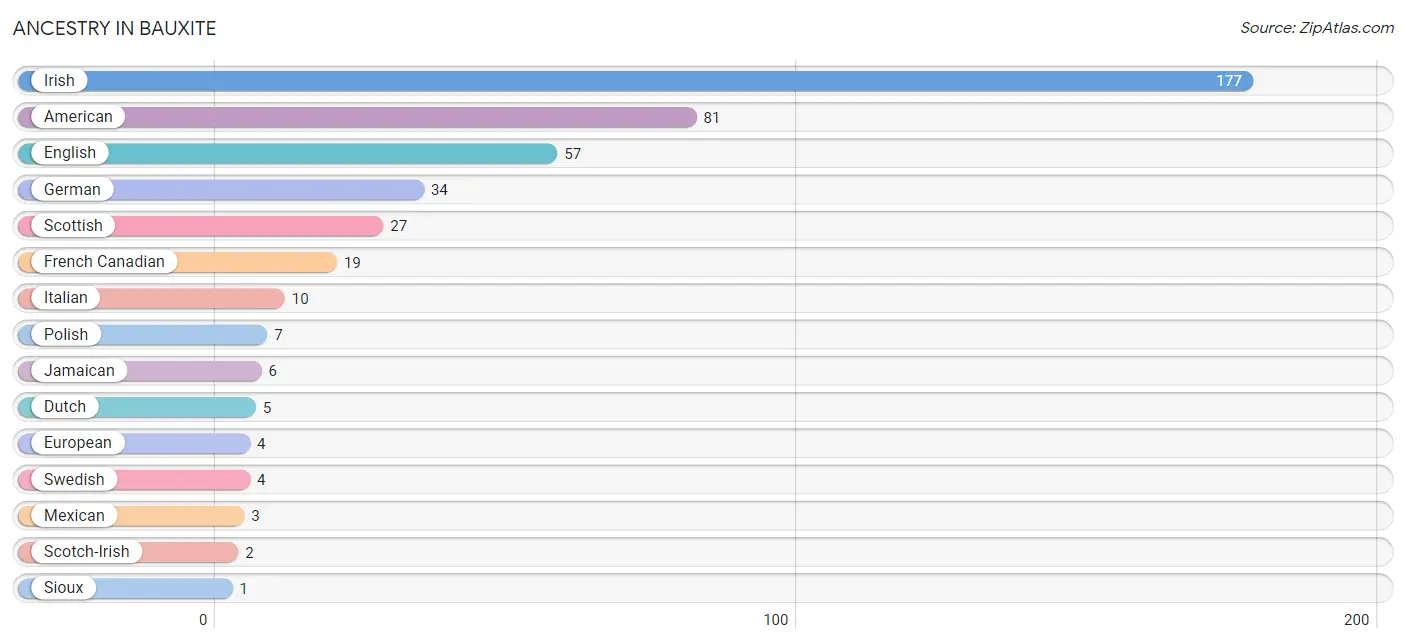
| Ancestry | # Population | % Population |
| American | 81 | 8.4% |
| Dutch | 5 | 0.5% |
| English | 57 | 5.9% |
| European | 4 | 0.4% |
| French Canadian | 19 | 2.0% |
| German | 34 | 3.5% |
| Irish | 177 | 18.4% |
| Italian | 10 | 1.0% |
| Jamaican | 6 | 0.6% |
| Mexican | 3 | 0.3% |
| Polish | 7 | 0.7% |
| Scotch-Irish | 2 | 0.2% |
| Scottish | 27 | 2.8% |
| Sioux | 1 | 0.1% |
| Swedish | 4 | 0.4% | View All 15 Rows |
Immigrants in Bauxite
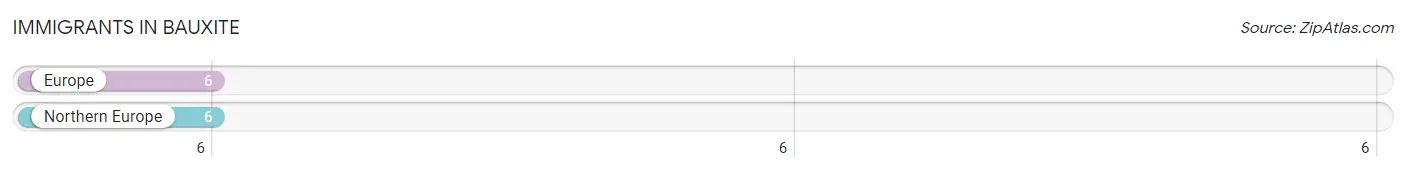
The most numerous immigrant groups reported in Bauxite came from Europe (6 | 0.6%), and Northern Europe (6 | 0.6%), together accounting for 1.2% of all Bauxite residents.
| Immigration Origin | # Population | % Population |
| Europe | 6 | 0.6% |
| Northern Europe | 6 | 0.6% | View All 2 Rows |
Sex and Age in Bauxite
Sex and Age in Bauxite
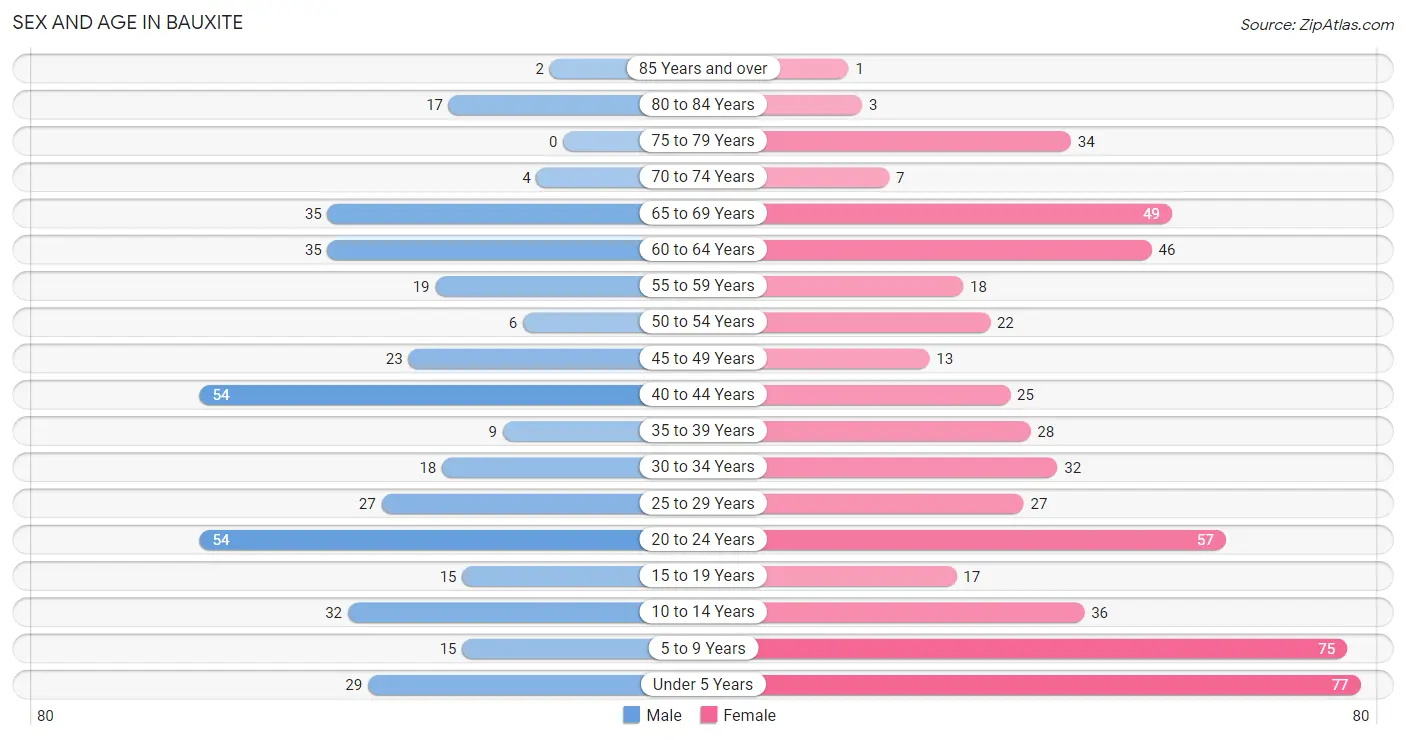
The most populous age groups in Bauxite are 20 to 24 Years (54 | 13.7%) for men and Under 5 Years (77 | 13.6%) for women.
| Age Bracket | Male | Female |
| Under 5 Years | 29 (7.4%) | 77 (13.6%) |
| 5 to 9 Years | 15 (3.8%) | 75 (13.2%) |
| 10 to 14 Years | 32 (8.1%) | 36 (6.4%) |
| 15 to 19 Years | 15 (3.8%) | 17 (3.0%) |
| 20 to 24 Years | 54 (13.7%) | 57 (10.1%) |
| 25 to 29 Years | 27 (6.9%) | 27 (4.8%) |
| 30 to 34 Years | 18 (4.6%) | 32 (5.6%) |
| 35 to 39 Years | 9 (2.3%) | 28 (4.9%) |
| 40 to 44 Years | 54 (13.7%) | 25 (4.4%) |
| 45 to 49 Years | 23 (5.8%) | 13 (2.3%) |
| 50 to 54 Years | 6 (1.5%) | 22 (3.9%) |
| 55 to 59 Years | 19 (4.8%) | 18 (3.2%) |
| 60 to 64 Years | 35 (8.9%) | 46 (8.1%) |
| 65 to 69 Years | 35 (8.9%) | 49 (8.6%) |
| 70 to 74 Years | 4 (1.0%) | 7 (1.2%) |
| 75 to 79 Years | 0 (0.0%) | 34 (6.0%) |
| 80 to 84 Years | 17 (4.3%) | 3 (0.5%) |
| 85 Years and over | 2 (0.5%) | 1 (0.2%) |
| Total | 394 (100.0%) | 567 (100.0%) |
Families and Households in Bauxite
Median Family Size in Bauxite
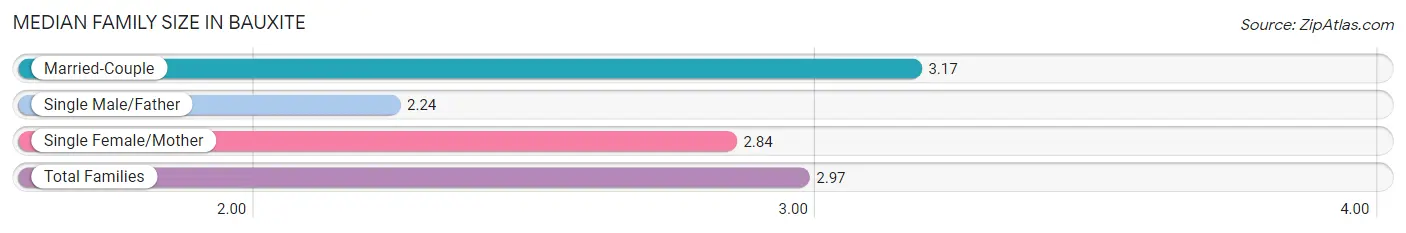
The median family size in Bauxite is 2.97 persons per family, with married-couple families (173 | 65.5%) accounting for the largest median family size of 3.17 persons per family. On the other hand, single male/father families (41 | 15.5%) represent the smallest median family size with 2.24 persons per family.
| Family Type | # Families | Family Size |
| Married-Couple | 173 (65.5%) | 3.17 |
| Single Male/Father | 41 (15.5%) | 2.24 |
| Single Female/Mother | 50 (18.9%) | 2.84 |
| Total Families | 264 (100.0%) | 2.97 |
Median Household Size in Bauxite
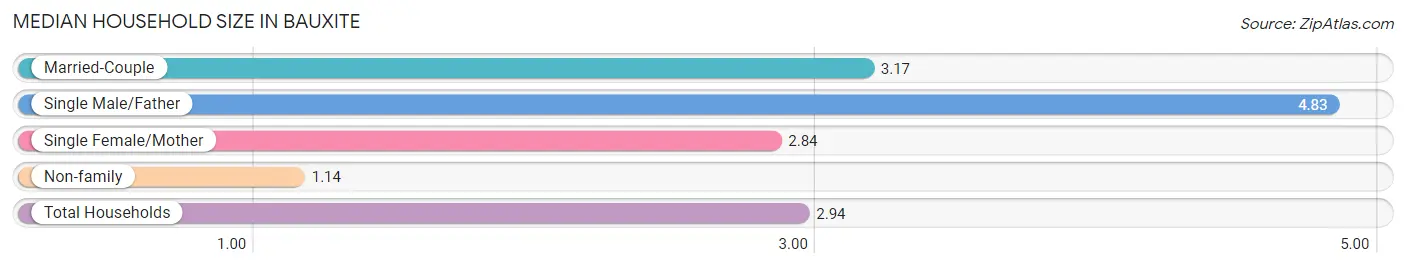
The median household size in Bauxite is 2.94 persons per household, with single male/father households (41 | 12.5%) accounting for the largest median household size of 4.83 persons per household. non-family households (63 | 19.3%) represent the smallest median household size with 1.14 persons per household.
| Household Type | # Households | Household Size |
| Married-Couple | 173 (52.9%) | 3.17 |
| Single Male/Father | 41 (12.5%) | 4.83 |
| Single Female/Mother | 50 (15.3%) | 2.84 |
| Non-family | 63 (19.3%) | 1.14 |
| Total Households | 327 (100.0%) | 2.94 |
Household Size by Marriage Status in Bauxite
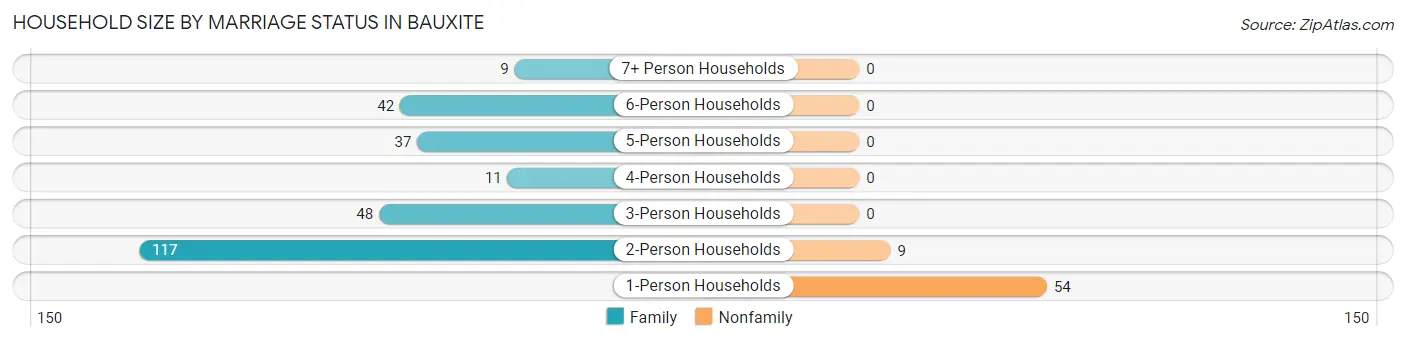
Out of a total of 327 households in Bauxite, 264 (80.7%) are family households, while 63 (19.3%) are nonfamily households. The most numerous type of family households are 2-person households, comprising 117, and the most common type of nonfamily households are 1-person households, comprising 54.
| Household Size | Family Households | Nonfamily Households |
| 1-Person Households | - | 54 (16.5%) |
| 2-Person Households | 117 (35.8%) | 9 (2.8%) |
| 3-Person Households | 48 (14.7%) | 0 (0.0%) |
| 4-Person Households | 11 (3.4%) | 0 (0.0%) |
| 5-Person Households | 37 (11.3%) | 0 (0.0%) |
| 6-Person Households | 42 (12.8%) | 0 (0.0%) |
| 7+ Person Households | 9 (2.8%) | 0 (0.0%) |
| Total | 264 (80.7%) | 63 (19.3%) |
Female Fertility in Bauxite
Fertility by Age in Bauxite
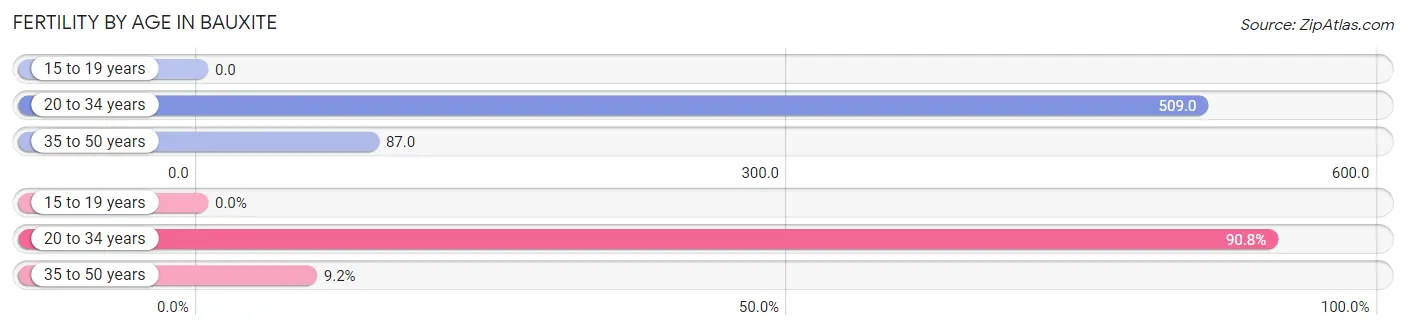
Average fertility rate in Bauxite is 322.0 births per 1,000 women. Women in the age bracket of 20 to 34 years have the highest fertility rate with 509.0 births per 1,000 women. Women in the age bracket of 20 to 34 years acount for 90.8% of all women with births.
| Age Bracket | Women with Births | Births / 1,000 Women |
| 15 to 19 years | 0 (0.0%) | 0.0 |
| 20 to 34 years | 59 (90.8%) | 509.0 |
| 35 to 50 years | 6 (9.2%) | 87.0 |
| Total | 65 (100.0%) | 322.0 |
Fertility by Age by Marriage Status in Bauxite
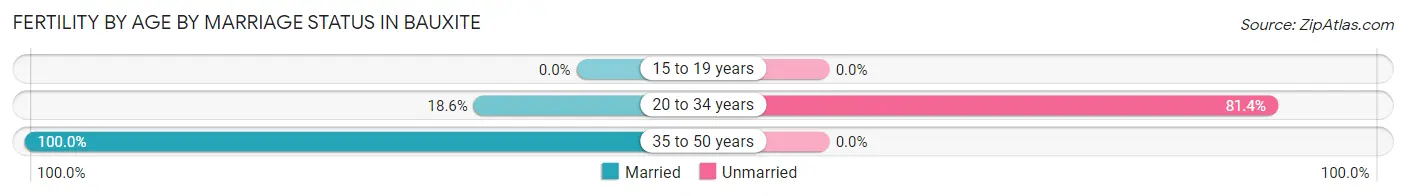
26.2% of women with births (65) in Bauxite are married. The highest percentage of unmarried women with births falls into 20 to 34 years age bracket with 81.4% of them unmarried at the time of birth, while the lowest percentage of unmarried women with births belong to 35 to 50 years age bracket with 0.0% of them unmarried.
| Age Bracket | Married | Unmarried |
| 15 to 19 years | 0 (0.0%) | 0 (0.0%) |
| 20 to 34 years | 11 (18.6%) | 48 (81.4%) |
| 35 to 50 years | 6 (100.0%) | 0 (0.0%) |
| Total | 17 (26.2%) | 48 (73.9%) |
Fertility by Education in Bauxite
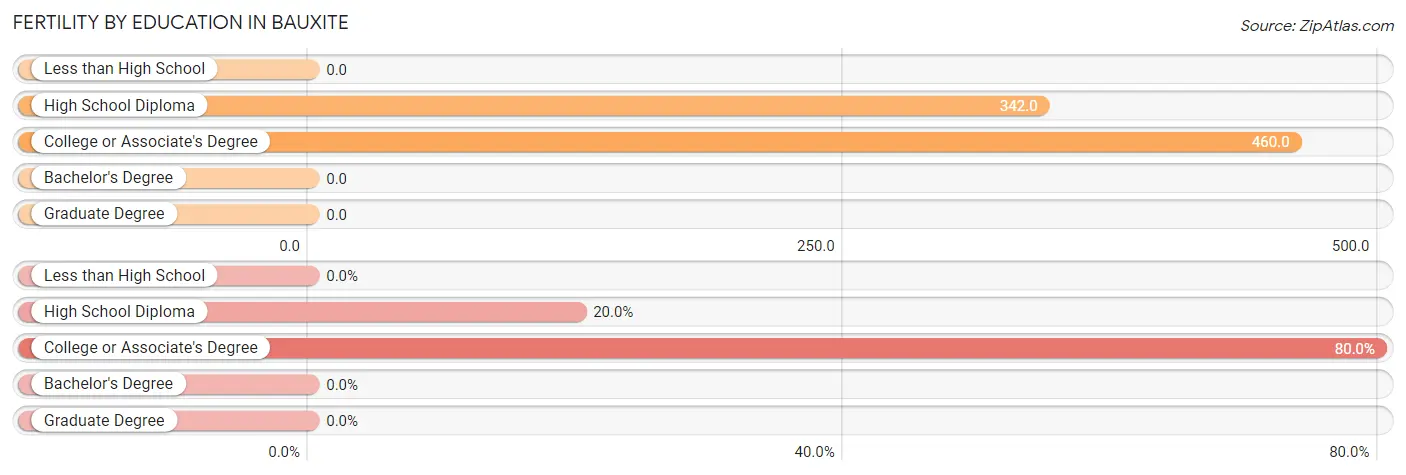
| Educational Attainment | Women with Births | Births / 1,000 Women |
| Less than High School | 0 (0.0%) | 0.0 |
| High School Diploma | 13 (20.0%) | 342.0 |
| College or Associate's Degree | 52 (80.0%) | 460.0 |
| Bachelor's Degree | 0 (0.0%) | 0.0 |
| Graduate Degree | 0 (0.0%) | 0.0 |
| Total | 65 (100.0%) | 322.0 |
Fertility by Education by Marriage Status in Bauxite
73.9% of women with births in Bauxite are unmarried. Women with the educational attainment of high school diploma are most likely to be married with 84.6% of them married at childbirth, while women with the educational attainment of college or associate's degree are least likely to be married with 88.5% of them unmarried at childbirth.
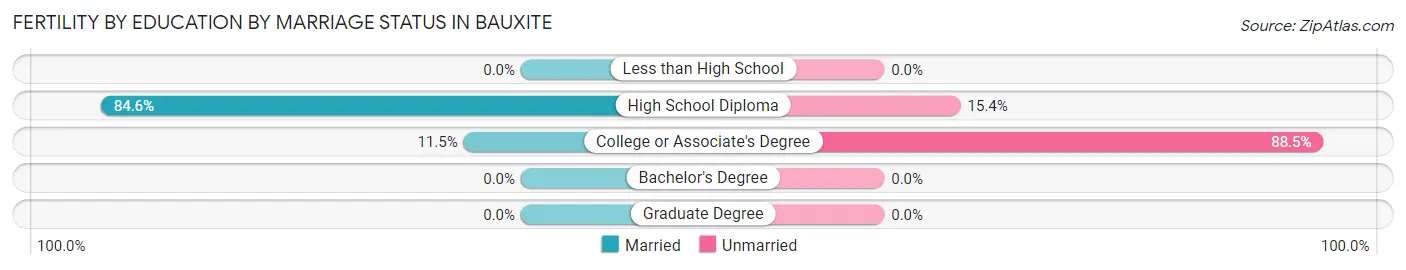
| Educational Attainment | Married | Unmarried |
| Less than High School | 0 (0.0%) | 0 (0.0%) |
| High School Diploma | 11 (84.6%) | 2 (15.4%) |
| College or Associate's Degree | 6 (11.5%) | 46 (88.5%) |
| Bachelor's Degree | 0 (0.0%) | 0 (0.0%) |
| Graduate Degree | 0 (0.0%) | 0 (0.0%) |
| Total | 17 (26.2%) | 48 (73.9%) |
Employment Characteristics in Bauxite
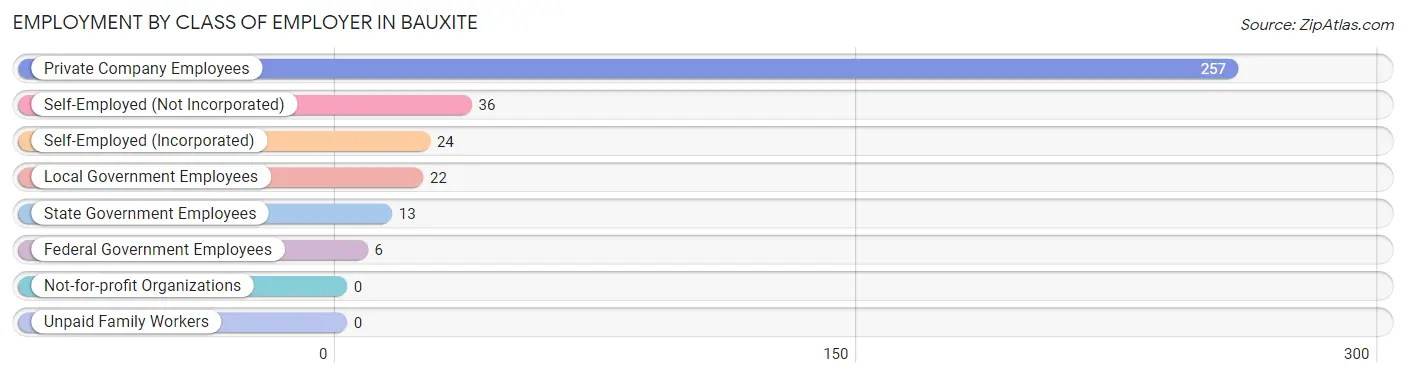
Employment by Class of Employer in Bauxite
Among the 358 employed individuals in Bauxite, private company employees (257 | 71.8%), self-employed (not incorporated) (36 | 10.1%), and self-employed (incorporated) (24 | 6.7%) make up the most common classes of employment.
| Employer Class | # Employees | % Employees |
| Private Company Employees | 257 | 71.8% |
| Self-Employed (Incorporated) | 24 | 6.7% |
| Self-Employed (Not Incorporated) | 36 | 10.1% |
| Not-for-profit Organizations | 0 | 0.0% |
| Local Government Employees | 22 | 6.1% |
| State Government Employees | 13 | 3.6% |
| Federal Government Employees | 6 | 1.7% |
| Unpaid Family Workers | 0 | 0.0% |
| Total | 358 | 100.0% |
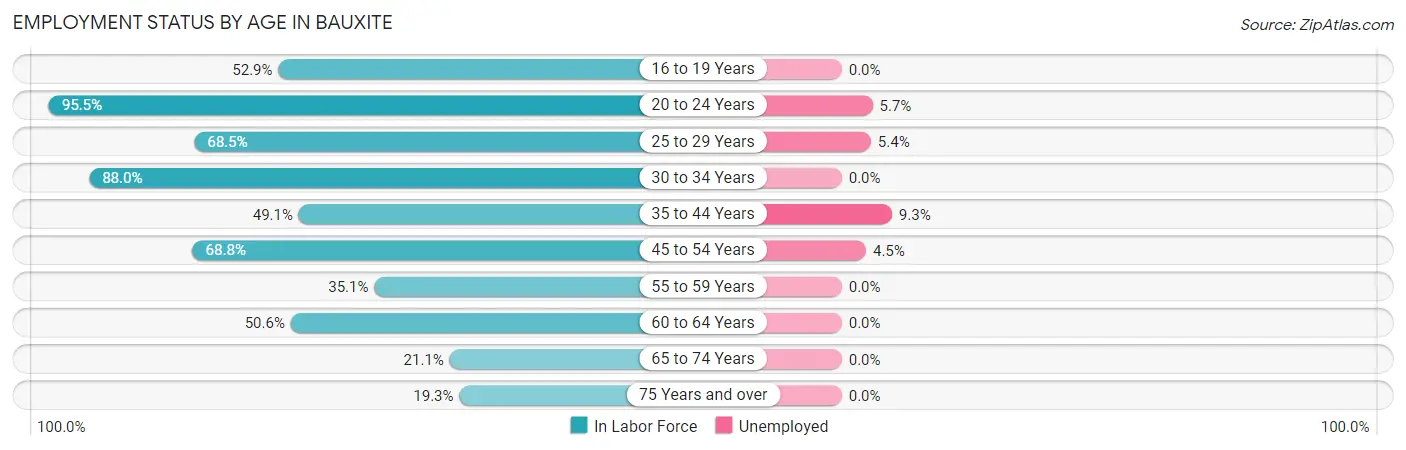
Employment Status by Age in Bauxite
According to the labor force statistics for Bauxite, out of the total population over 16 years of age (682), 56.0% or 382 individuals are in the labor force, with 4.0% or 15 of them unemployed. The age group with the highest labor force participation rate is 20 to 24 years, with 95.5% or 106 individuals in the labor force. Within the labor force, the 35 to 44 years age range has the highest percentage of unemployed individuals, with 9.3% or 5 of them being unemployed.
| Age Bracket | In Labor Force | Unemployed |
| 16 to 19 Years | 9 (52.9%) | 0 (0.0%) |
| 20 to 24 Years | 106 (95.5%) | 6 (5.7%) |
| 25 to 29 Years | 37 (68.5%) | 2 (5.4%) |
| 30 to 34 Years | 44 (88.0%) | 0 (0.0%) |
| 35 to 44 Years | 57 (49.1%) | 5 (9.3%) |
| 45 to 54 Years | 44 (68.8%) | 2 (4.5%) |
| 55 to 59 Years | 13 (35.1%) | 0 (0.0%) |
| 60 to 64 Years | 41 (50.6%) | 0 (0.0%) |
| 65 to 74 Years | 20 (21.1%) | 0 (0.0%) |
| 75 Years and over | 11 (19.3%) | 0 (0.0%) |
| Total | 382 (56.0%) | 15 (4.0%) |
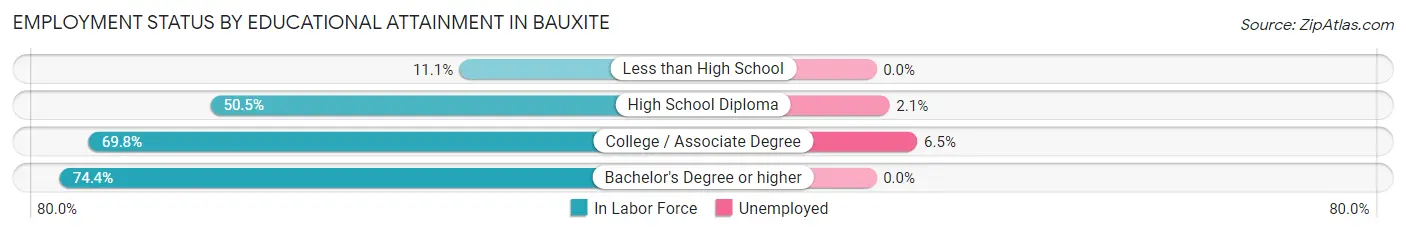
Employment Status by Educational Attainment in Bauxite
According to labor force statistics for Bauxite, 58.7% of individuals (236) out of the total population between 25 and 64 years of age (402) are in the labor force, with 3.9% or 9 of them being unemployed. The group with the highest labor force participation rate are those with the educational attainment of bachelor's degree or higher, with 74.4% or 29 individuals in the labor force. Within the labor force, individuals with college / associate degree education have the highest percentage of unemployment, with 6.5% or 7 of them being unemployed.
| Educational Attainment | In Labor Force | Unemployed |
| Less than High School | 2 (11.1%) | 0 (0.0%) |
| High School Diploma | 94 (50.5%) | 4 (2.1%) |
| College / Associate Degree | 111 (69.8%) | 10 (6.5%) |
| Bachelor's Degree or higher | 29 (74.4%) | 0 (0.0%) |
| Total | 236 (58.7%) | 16 (3.9%) |
Employment Occupations by Sex in Bauxite
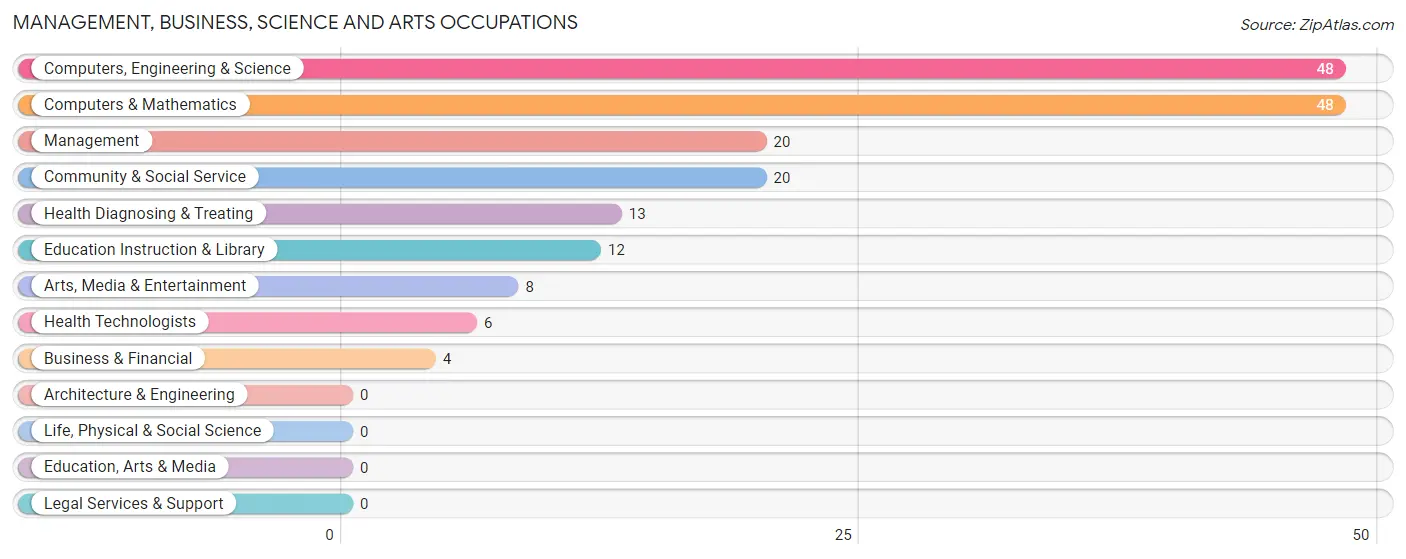
Management, Business, Science and Arts Occupations
The most common Management, Business, Science and Arts occupations in Bauxite are Computers, Engineering & Science (48 | 13.2%), Computers & Mathematics (48 | 13.2%), Management (20 | 5.5%), Community & Social Service (20 | 5.5%), and Health Diagnosing & Treating (13 | 3.6%).
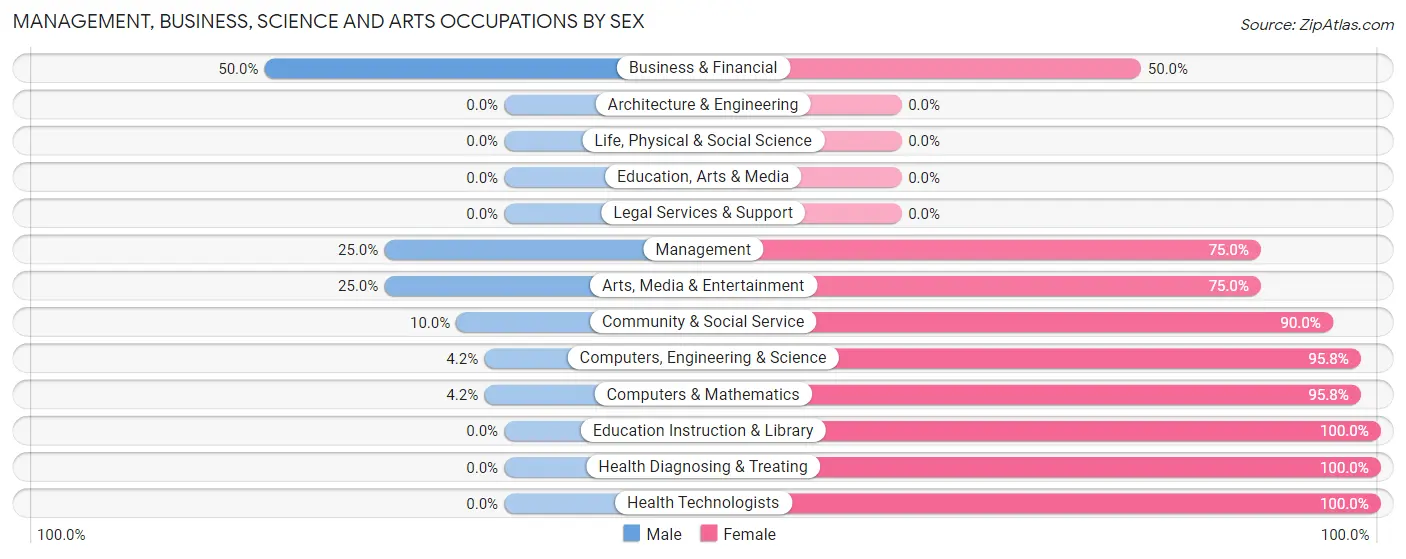
Management, Business, Science and Arts Occupations by Sex
Within the Management, Business, Science and Arts occupations in Bauxite, the most male-oriented occupations are Business & Financial (50.0%), Management (25.0%), and Arts, Media & Entertainment (25.0%), while the most female-oriented occupations are Education Instruction & Library (100.0%), Health Diagnosing & Treating (100.0%), and Health Technologists (100.0%).
| Occupation | Male | Female |
| Management | 5 (25.0%) | 15 (75.0%) |
| Business & Financial | 2 (50.0%) | 2 (50.0%) |
| Computers, Engineering & Science | 2 (4.2%) | 46 (95.8%) |
| Computers & Mathematics | 2 (4.2%) | 46 (95.8%) |
| Architecture & Engineering | 0 (0.0%) | 0 (0.0%) |
| Life, Physical & Social Science | 0 (0.0%) | 0 (0.0%) |
| Community & Social Service | 2 (10.0%) | 18 (90.0%) |
| Education, Arts & Media | 0 (0.0%) | 0 (0.0%) |
| Legal Services & Support | 0 (0.0%) | 0 (0.0%) |
| Education Instruction & Library | 0 (0.0%) | 12 (100.0%) |
| Arts, Media & Entertainment | 2 (25.0%) | 6 (75.0%) |
| Health Diagnosing & Treating | 0 (0.0%) | 13 (100.0%) |
| Health Technologists | 0 (0.0%) | 6 (100.0%) |
| Total (Category) | 11 (10.5%) | 94 (89.5%) |
| Total (Overall) | 192 (52.7%) | 172 (47.2%) |
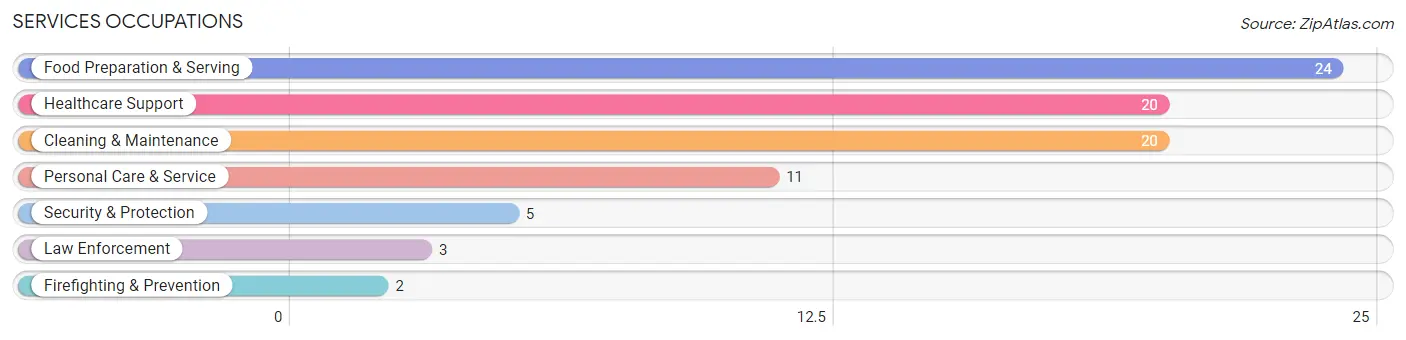
Services Occupations
The most common Services occupations in Bauxite are Food Preparation & Serving (24 | 6.6%), Healthcare Support (20 | 5.5%), Cleaning & Maintenance (20 | 5.5%), Personal Care & Service (11 | 3.0%), and Security & Protection (5 | 1.4%).
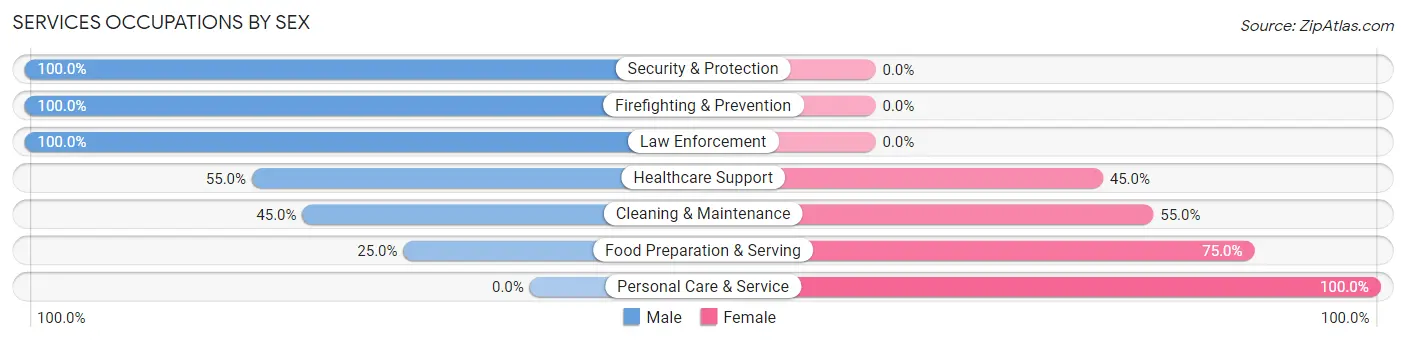
Services Occupations by Sex
Within the Services occupations in Bauxite, the most male-oriented occupations are Security & Protection (100.0%), Firefighting & Prevention (100.0%), and Law Enforcement (100.0%), while the most female-oriented occupations are Personal Care & Service (100.0%), Food Preparation & Serving (75.0%), and Cleaning & Maintenance (55.0%).
| Occupation | Male | Female |
| Healthcare Support | 11 (55.0%) | 9 (45.0%) |
| Security & Protection | 5 (100.0%) | 0 (0.0%) |
| Firefighting & Prevention | 2 (100.0%) | 0 (0.0%) |
| Law Enforcement | 3 (100.0%) | 0 (0.0%) |
| Food Preparation & Serving | 6 (25.0%) | 18 (75.0%) |
| Cleaning & Maintenance | 9 (45.0%) | 11 (55.0%) |
| Personal Care & Service | 0 (0.0%) | 11 (100.0%) |
| Total (Category) | 31 (38.8%) | 49 (61.3%) |
| Total (Overall) | 192 (52.7%) | 172 (47.2%) |
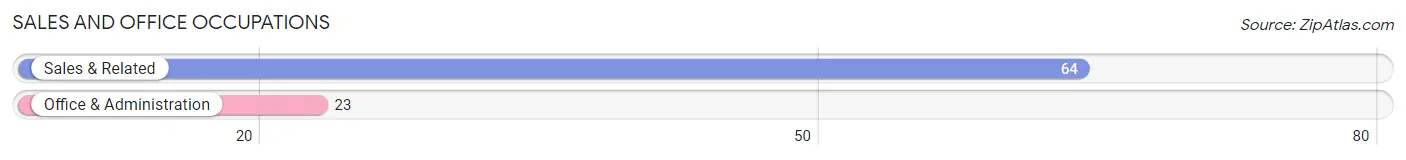
Sales and Office Occupations
The most common Sales and Office occupations in Bauxite are Sales & Related (64 | 17.6%), and Office & Administration (23 | 6.3%).
Sales and Office Occupations by Sex
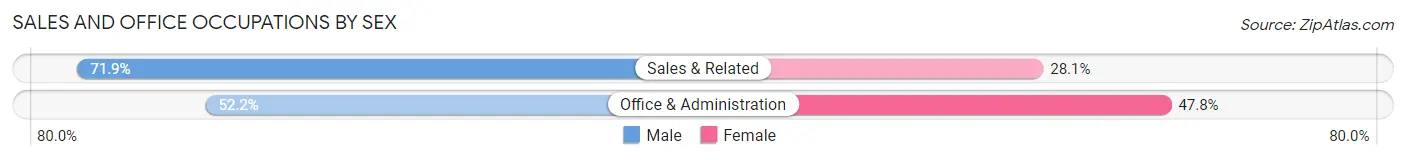
| Occupation | Male | Female |
| Sales & Related | 46 (71.9%) | 18 (28.1%) |
| Office & Administration | 12 (52.2%) | 11 (47.8%) |
| Total (Category) | 58 (66.7%) | 29 (33.3%) |
| Total (Overall) | 192 (52.7%) | 172 (47.2%) |
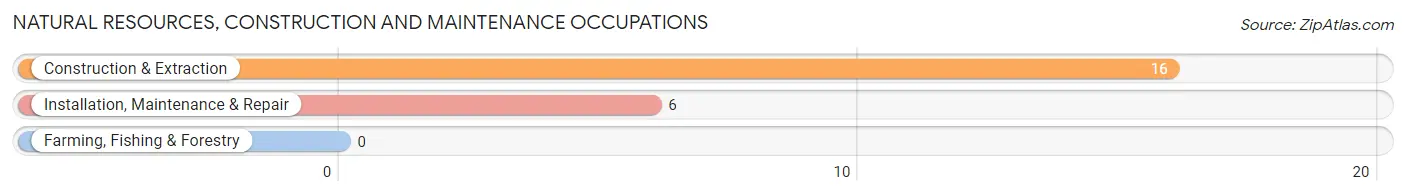
Natural Resources, Construction and Maintenance Occupations
The most common Natural Resources, Construction and Maintenance occupations in Bauxite are Construction & Extraction (16 | 4.4%), and Installation, Maintenance & Repair (6 | 1.7%).
Natural Resources, Construction and Maintenance Occupations by Sex
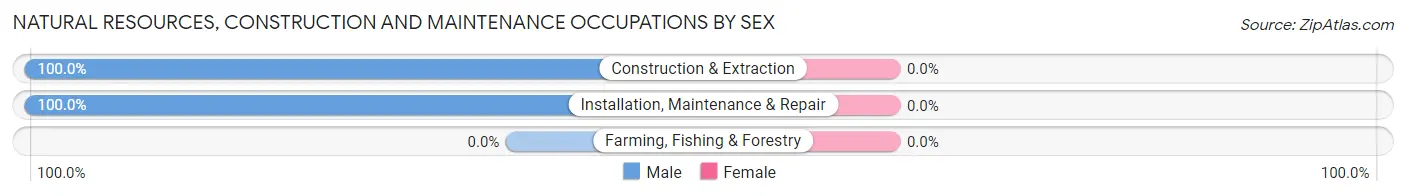
| Occupation | Male | Female |
| Farming, Fishing & Forestry | 0 (0.0%) | 0 (0.0%) |
| Construction & Extraction | 16 (100.0%) | 0 (0.0%) |
| Installation, Maintenance & Repair | 6 (100.0%) | 0 (0.0%) |
| Total (Category) | 22 (100.0%) | 0 (0.0%) |
| Total (Overall) | 192 (52.7%) | 172 (47.2%) |
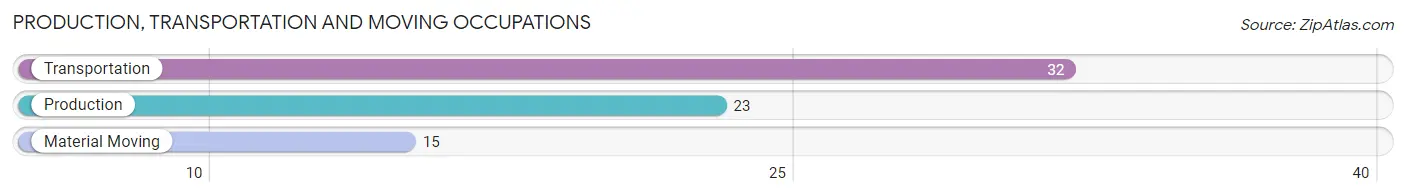
Production, Transportation and Moving Occupations
The most common Production, Transportation and Moving occupations in Bauxite are Transportation (32 | 8.8%), Production (23 | 6.3%), and Material Moving (15 | 4.1%).
Production, Transportation and Moving Occupations by Sex
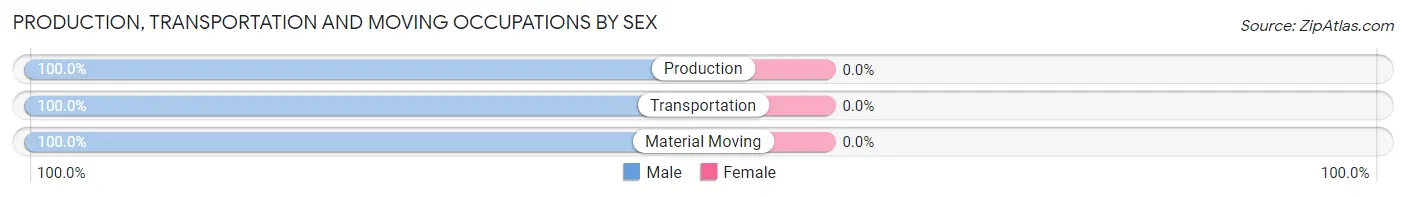
| Occupation | Male | Female |
| Production | 23 (100.0%) | 0 (0.0%) |
| Transportation | 32 (100.0%) | 0 (0.0%) |
| Material Moving | 15 (100.0%) | 0 (0.0%) |
| Total (Category) | 70 (100.0%) | 0 (0.0%) |
| Total (Overall) | 192 (52.7%) | 172 (47.2%) |
Employment Industries by Sex in Bauxite
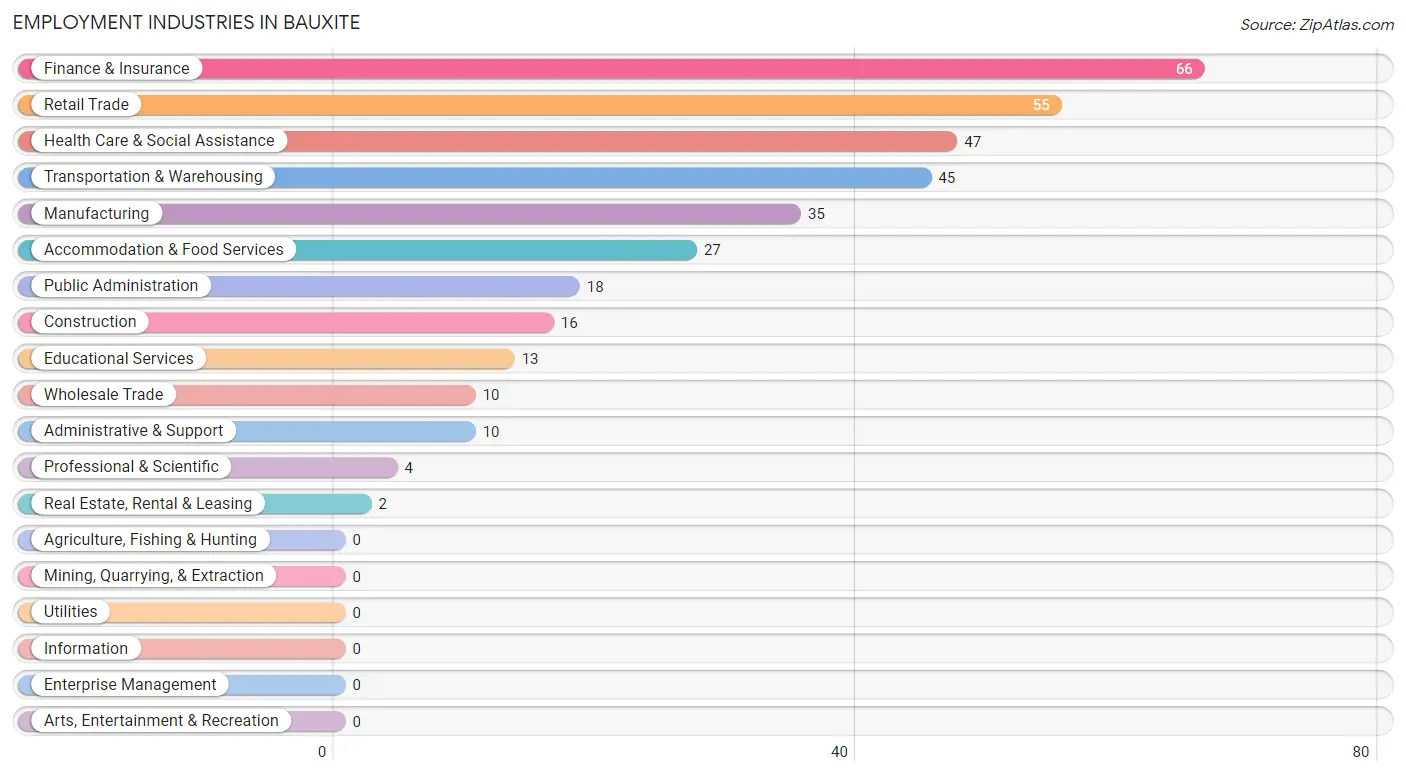
Employment Industries in Bauxite
The major employment industries in Bauxite include Finance & Insurance (66 | 18.1%), Retail Trade (55 | 15.1%), Health Care & Social Assistance (47 | 12.9%), Transportation & Warehousing (45 | 12.4%), and Manufacturing (35 | 9.6%).
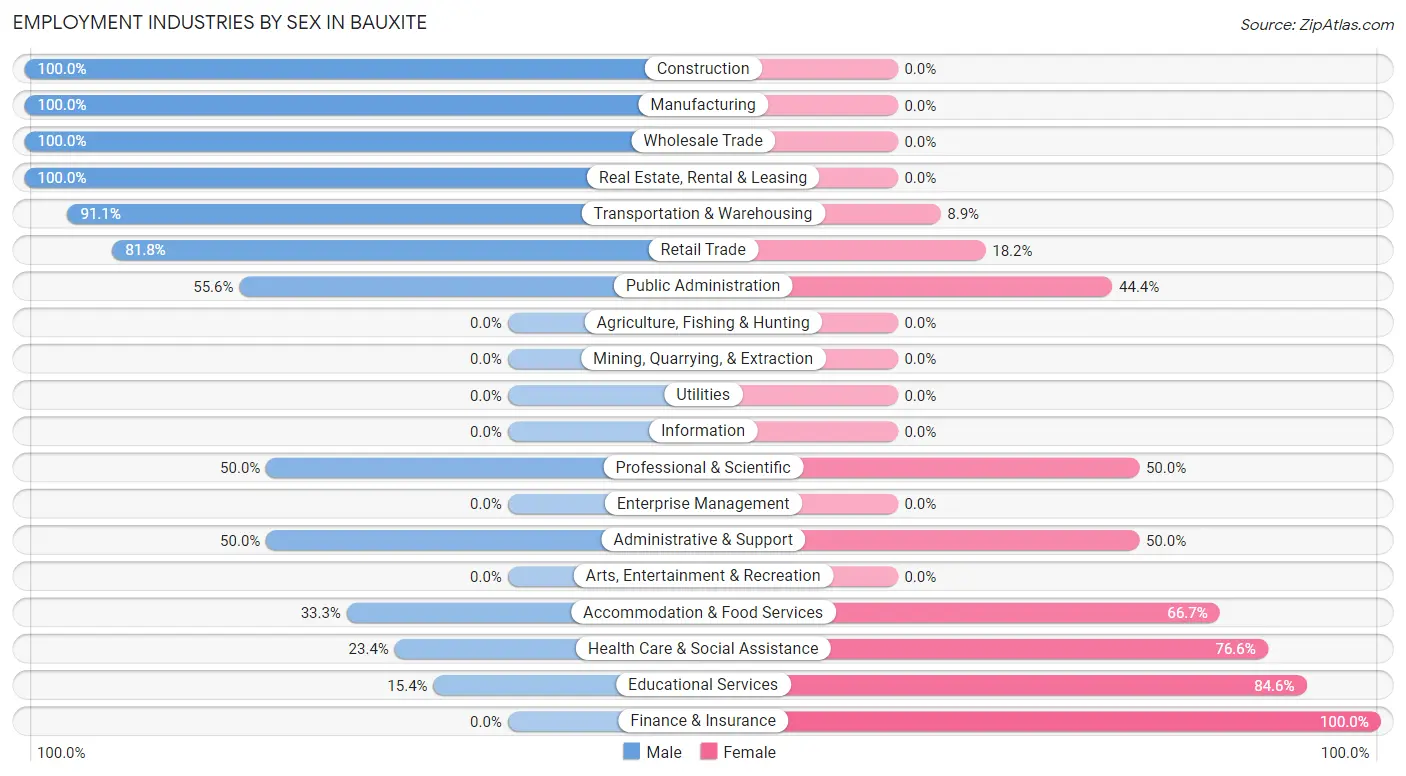
Employment Industries by Sex in Bauxite
The Bauxite industries that see more men than women are Construction (100.0%), Manufacturing (100.0%), and Wholesale Trade (100.0%), whereas the industries that tend to have a higher number of women are Finance & Insurance (100.0%), Educational Services (84.6%), and Health Care & Social Assistance (76.6%).
| Industry | Male | Female |
| Agriculture, Fishing & Hunting | 0 (0.0%) | 0 (0.0%) |
| Mining, Quarrying, & Extraction | 0 (0.0%) | 0 (0.0%) |
| Construction | 16 (100.0%) | 0 (0.0%) |
| Manufacturing | 35 (100.0%) | 0 (0.0%) |
| Wholesale Trade | 10 (100.0%) | 0 (0.0%) |
| Retail Trade | 45 (81.8%) | 10 (18.2%) |
| Transportation & Warehousing | 41 (91.1%) | 4 (8.9%) |
| Utilities | 0 (0.0%) | 0 (0.0%) |
| Information | 0 (0.0%) | 0 (0.0%) |
| Finance & Insurance | 0 (0.0%) | 66 (100.0%) |
| Real Estate, Rental & Leasing | 2 (100.0%) | 0 (0.0%) |
| Professional & Scientific | 2 (50.0%) | 2 (50.0%) |
| Enterprise Management | 0 (0.0%) | 0 (0.0%) |
| Administrative & Support | 5 (50.0%) | 5 (50.0%) |
| Educational Services | 2 (15.4%) | 11 (84.6%) |
| Health Care & Social Assistance | 11 (23.4%) | 36 (76.6%) |
| Arts, Entertainment & Recreation | 0 (0.0%) | 0 (0.0%) |
| Accommodation & Food Services | 9 (33.3%) | 18 (66.7%) |
| Public Administration | 10 (55.6%) | 8 (44.4%) |
| Total | 192 (52.7%) | 172 (47.2%) |
Education in Bauxite
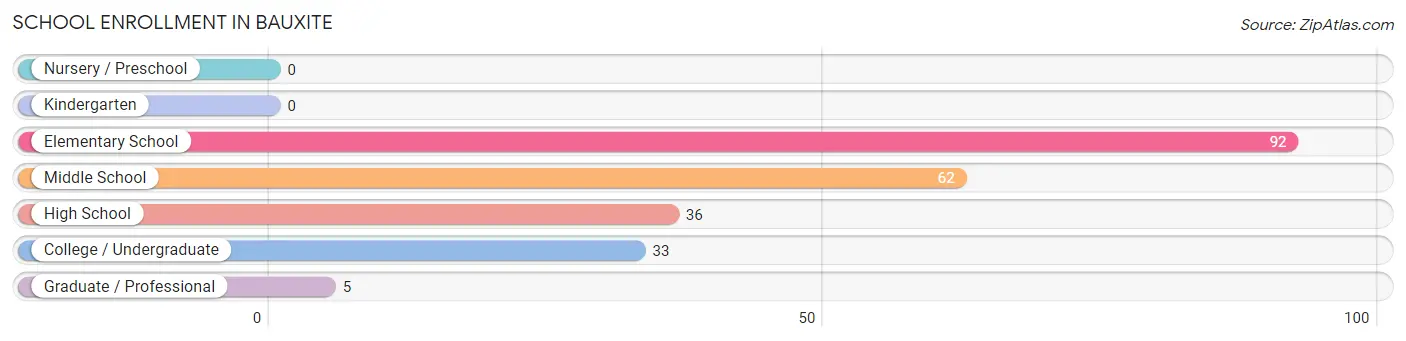
School Enrollment in Bauxite
The most common levels of schooling among the 228 students in Bauxite are elementary school (92 | 40.4%), middle school (62 | 27.2%), and high school (36 | 15.8%).
| School Level | # Students | % Students |
| Nursery / Preschool | 0 | 0.0% |
| Kindergarten | 0 | 0.0% |
| Elementary School | 92 | 40.4% |
| Middle School | 62 | 27.2% |
| High School | 36 | 15.8% |
| College / Undergraduate | 33 | 14.5% |
| Graduate / Professional | 5 | 2.2% |
| Total | 228 | 100.0% |
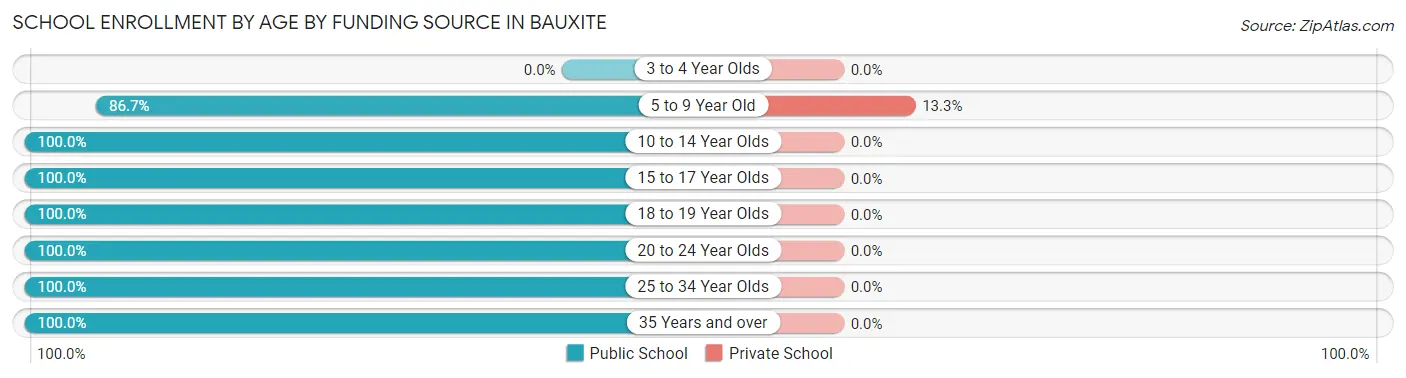
School Enrollment by Age by Funding Source in Bauxite
Out of a total of 228 students who are enrolled in schools in Bauxite, 12 (5.3%) attend a private institution, while the remaining 216 (94.7%) are enrolled in public schools. The age group of 5 to 9 year old has the highest likelihood of being enrolled in private schools, with 12 (13.3% in the age bracket) enrolled. Conversely, the age group of 10 to 14 year olds has the lowest likelihood of being enrolled in a private school, with 68 (100.0% in the age bracket) attending a public institution.
| Age Bracket | Public School | Private School |
| 3 to 4 Year Olds | 0 (0.0%) | 0 (0.0%) |
| 5 to 9 Year Old | 78 (86.7%) | 12 (13.3%) |
| 10 to 14 Year Olds | 68 (100.0%) | 0 (0.0%) |
| 15 to 17 Year Olds | 29 (100.0%) | 0 (0.0%) |
| 18 to 19 Year Olds | 3 (100.0%) | 0 (0.0%) |
| 20 to 24 Year Olds | 15 (100.0%) | 0 (0.0%) |
| 25 to 34 Year Olds | 2 (100.0%) | 0 (0.0%) |
| 35 Years and over | 21 (100.0%) | 0 (0.0%) |
| Total | 216 (94.7%) | 12 (5.3%) |
Educational Attainment by Field of Study in Bauxite
Business (12 | 28.6%), bio, nature & agricultural (9 | 21.4%), social sciences (6 | 14.3%), education (4 | 9.5%), and science & technology (3 | 7.1%) are the most common fields of study among 42 individuals in Bauxite who have obtained a bachelor's degree or higher.
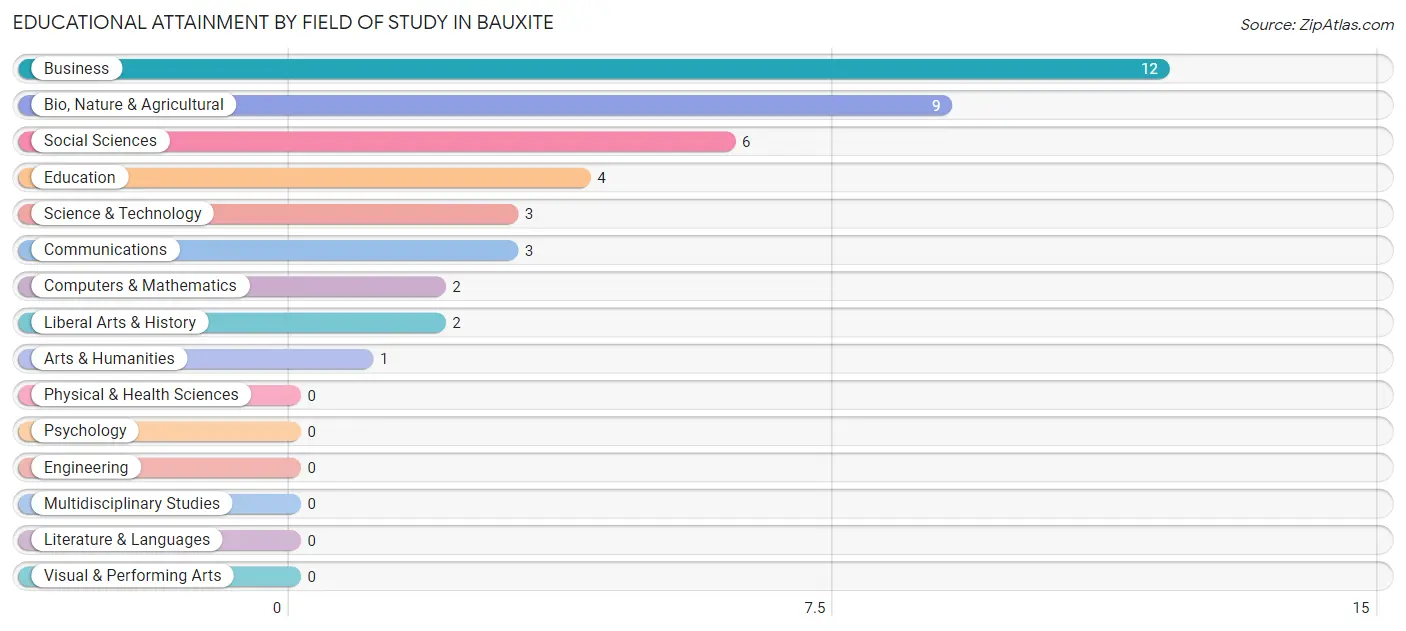
| Field of Study | # Graduates | % Graduates |
| Computers & Mathematics | 2 | 4.8% |
| Bio, Nature & Agricultural | 9 | 21.4% |
| Physical & Health Sciences | 0 | 0.0% |
| Psychology | 0 | 0.0% |
| Social Sciences | 6 | 14.3% |
| Engineering | 0 | 0.0% |
| Multidisciplinary Studies | 0 | 0.0% |
| Science & Technology | 3 | 7.1% |
| Business | 12 | 28.6% |
| Education | 4 | 9.5% |
| Literature & Languages | 0 | 0.0% |
| Liberal Arts & History | 2 | 4.8% |
| Visual & Performing Arts | 0 | 0.0% |
| Communications | 3 | 7.1% |
| Arts & Humanities | 1 | 2.4% |
| Total | 42 | 100.0% |
Transportation & Commute in Bauxite
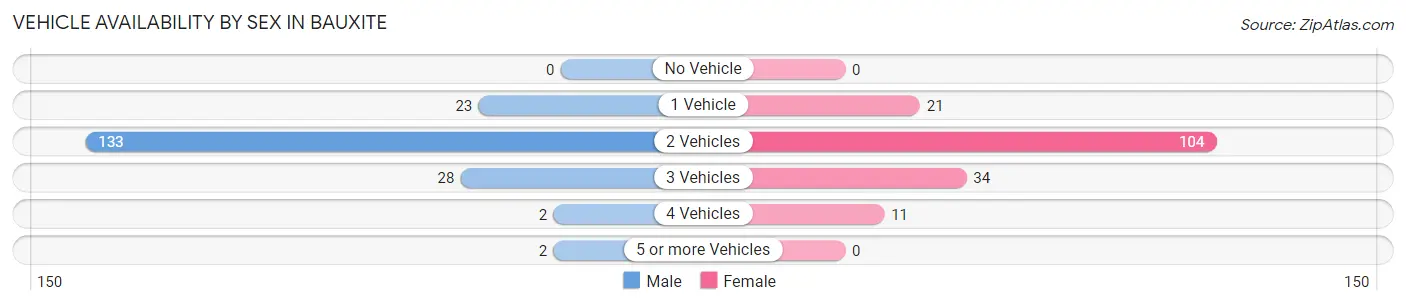
Vehicle Availability by Sex in Bauxite
The most prevalent vehicle ownership categories in Bauxite are males with 2 vehicles (133, accounting for 70.7%) and females with 2 vehicles (104, making up 78.2%).
| Vehicles Available | Male | Female |
| No Vehicle | 0 (0.0%) | 0 (0.0%) |
| 1 Vehicle | 23 (12.2%) | 21 (12.3%) |
| 2 Vehicles | 133 (70.7%) | 104 (61.2%) |
| 3 Vehicles | 28 (14.9%) | 34 (20.0%) |
| 4 Vehicles | 2 (1.1%) | 11 (6.5%) |
| 5 or more Vehicles | 2 (1.1%) | 0 (0.0%) |
| Total | 188 (100.0%) | 170 (100.0%) |
Commute Time in Bauxite
The most frequently occuring commute durations in Bauxite are 30 to 34 minutes (92 commuters, 27.1%), 15 to 19 minutes (69 commuters, 20.3%), and 10 to 14 minutes (42 commuters, 12.4%).
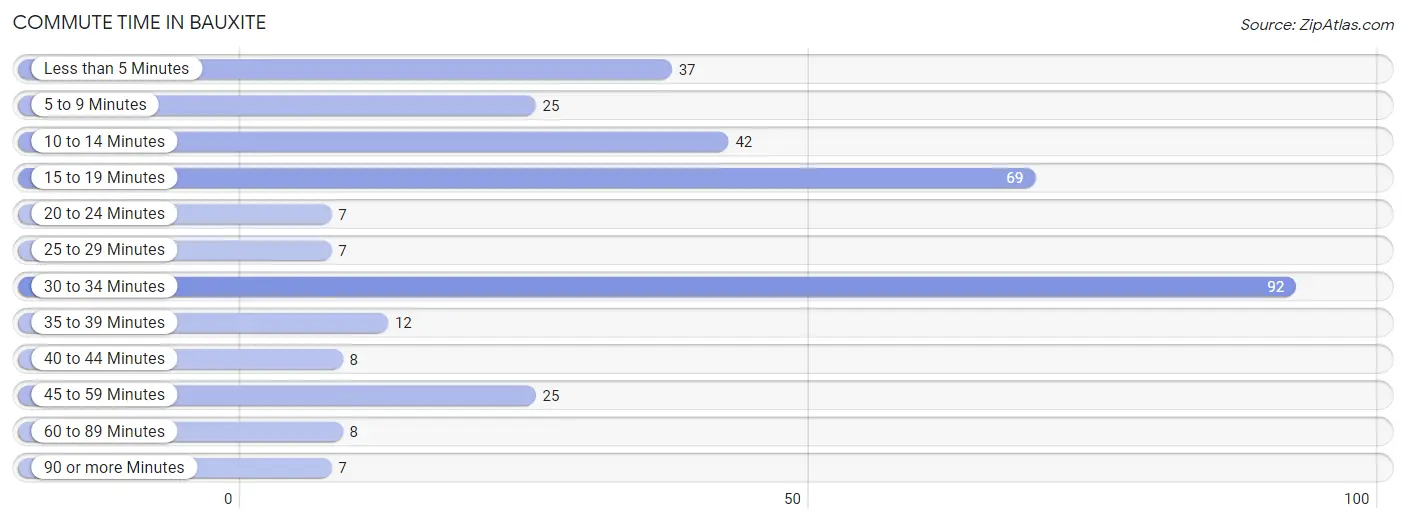
| Commute Time | # Commuters | % Commuters |
| Less than 5 Minutes | 37 | 10.9% |
| 5 to 9 Minutes | 25 | 7.4% |
| 10 to 14 Minutes | 42 | 12.4% |
| 15 to 19 Minutes | 69 | 20.3% |
| 20 to 24 Minutes | 7 | 2.1% |
| 25 to 29 Minutes | 7 | 2.1% |
| 30 to 34 Minutes | 92 | 27.1% |
| 35 to 39 Minutes | 12 | 3.5% |
| 40 to 44 Minutes | 8 | 2.4% |
| 45 to 59 Minutes | 25 | 7.4% |
| 60 to 89 Minutes | 8 | 2.4% |
| 90 or more Minutes | 7 | 2.1% |
Commute Time by Sex in Bauxite
The most common commute times in Bauxite are 15 to 19 minutes (45 commuters, 24.7%) for males and 30 to 34 minutes (65 commuters, 41.4%) for females.

| Commute Time | Male | Female |
| Less than 5 Minutes | 22 (12.1%) | 15 (9.6%) |
| 5 to 9 Minutes | 18 (9.9%) | 7 (4.5%) |
| 10 to 14 Minutes | 33 (18.1%) | 9 (5.7%) |
| 15 to 19 Minutes | 45 (24.7%) | 24 (15.3%) |
| 20 to 24 Minutes | 0 (0.0%) | 7 (4.5%) |
| 25 to 29 Minutes | 2 (1.1%) | 5 (3.2%) |
| 30 to 34 Minutes | 27 (14.8%) | 65 (41.4%) |
| 35 to 39 Minutes | 3 (1.7%) | 9 (5.7%) |
| 40 to 44 Minutes | 3 (1.7%) | 5 (3.2%) |
| 45 to 59 Minutes | 17 (9.3%) | 8 (5.1%) |
| 60 to 89 Minutes | 5 (2.8%) | 3 (1.9%) |
| 90 or more Minutes | 7 (3.8%) | 0 (0.0%) |
Time of Departure to Work by Sex in Bauxite
The most frequent times of departure to work in Bauxite are 7:00 AM to 7:29 AM (44, 24.2%) for males and 6:00 AM to 6:29 AM (63, 40.1%) for females.
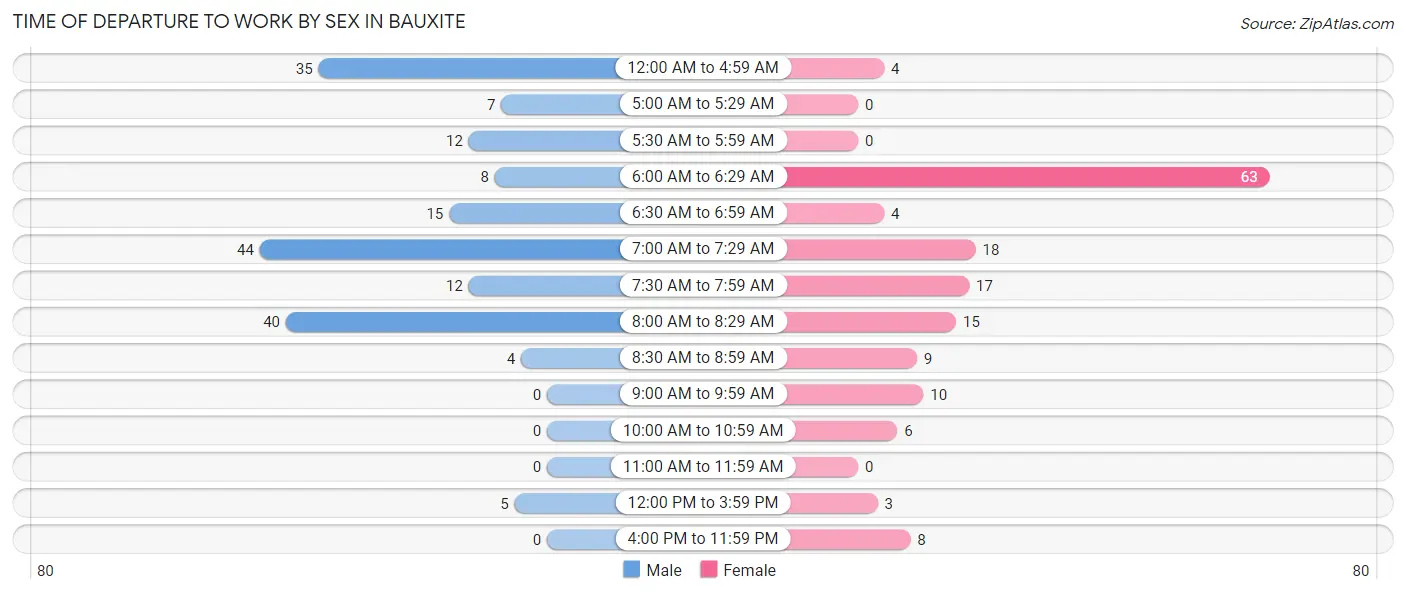
| Time of Departure | Male | Female |
| 12:00 AM to 4:59 AM | 35 (19.2%) | 4 (2.5%) |
| 5:00 AM to 5:29 AM | 7 (3.8%) | 0 (0.0%) |
| 5:30 AM to 5:59 AM | 12 (6.6%) | 0 (0.0%) |
| 6:00 AM to 6:29 AM | 8 (4.4%) | 63 (40.1%) |
| 6:30 AM to 6:59 AM | 15 (8.2%) | 4 (2.5%) |
| 7:00 AM to 7:29 AM | 44 (24.2%) | 18 (11.5%) |
| 7:30 AM to 7:59 AM | 12 (6.6%) | 17 (10.8%) |
| 8:00 AM to 8:29 AM | 40 (22.0%) | 15 (9.6%) |
| 8:30 AM to 8:59 AM | 4 (2.2%) | 9 (5.7%) |
| 9:00 AM to 9:59 AM | 0 (0.0%) | 10 (6.4%) |
| 10:00 AM to 10:59 AM | 0 (0.0%) | 6 (3.8%) |
| 11:00 AM to 11:59 AM | 0 (0.0%) | 0 (0.0%) |
| 12:00 PM to 3:59 PM | 5 (2.8%) | 3 (1.9%) |
| 4:00 PM to 11:59 PM | 0 (0.0%) | 8 (5.1%) |
| Total | 182 (100.0%) | 157 (100.0%) |
Housing Occupancy in Bauxite
Occupancy by Ownership in Bauxite
Of the total 327 dwellings in Bauxite, owner-occupied units account for 218 (66.7%), while renter-occupied units make up 109 (33.3%).
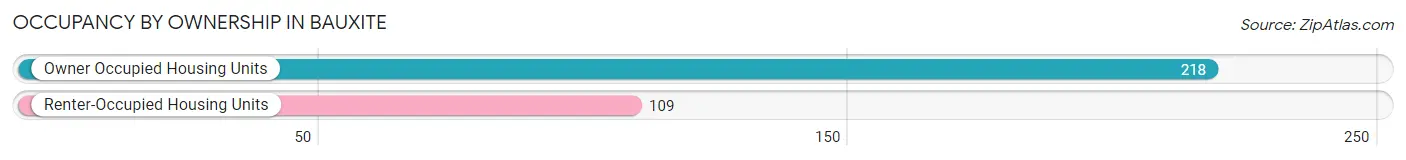
| Occupancy | # Housing Units | % Housing Units |
| Owner Occupied Housing Units | 218 | 66.7% |
| Renter-Occupied Housing Units | 109 | 33.3% |
| Total Occupied Housing Units | 327 | 100.0% |
Occupancy by Household Size in Bauxite
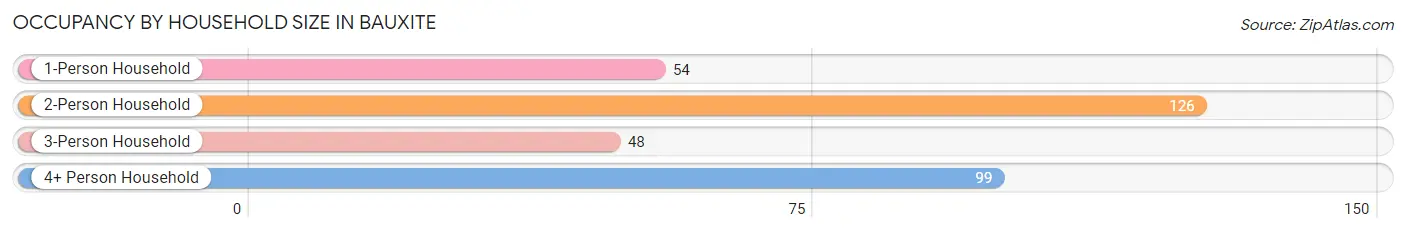
| Household Size | # Housing Units | % Housing Units |
| 1-Person Household | 54 | 16.5% |
| 2-Person Household | 126 | 38.5% |
| 3-Person Household | 48 | 14.7% |
| 4+ Person Household | 99 | 30.3% |
| Total Housing Units | 327 | 100.0% |
Occupancy by Ownership by Household Size in Bauxite
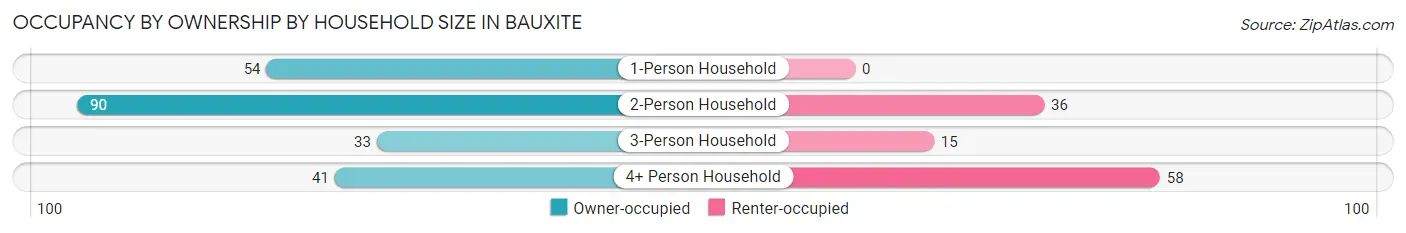
| Household Size | Owner-occupied | Renter-occupied |
| 1-Person Household | 54 (100.0%) | 0 (0.0%) |
| 2-Person Household | 90 (71.4%) | 36 (28.6%) |
| 3-Person Household | 33 (68.8%) | 15 (31.2%) |
| 4+ Person Household | 41 (41.4%) | 58 (58.6%) |
| Total Housing Units | 218 (66.7%) | 109 (33.3%) |
Occupancy by Educational Attainment in Bauxite
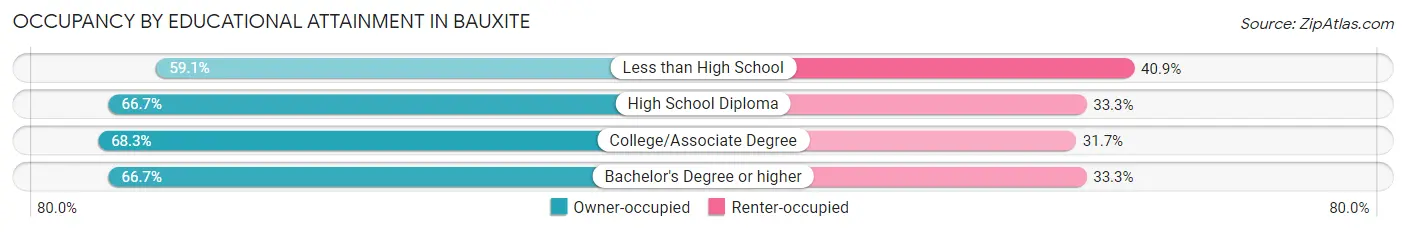
| Household Size | Owner-occupied | Renter-occupied |
| Less than High School | 13 (59.1%) | 9 (40.9%) |
| High School Diploma | 126 (66.7%) | 63 (33.3%) |
| College/Associate Degree | 69 (68.3%) | 32 (31.7%) |
| Bachelor's Degree or higher | 10 (66.7%) | 5 (33.3%) |
Occupancy by Age of Householder in Bauxite
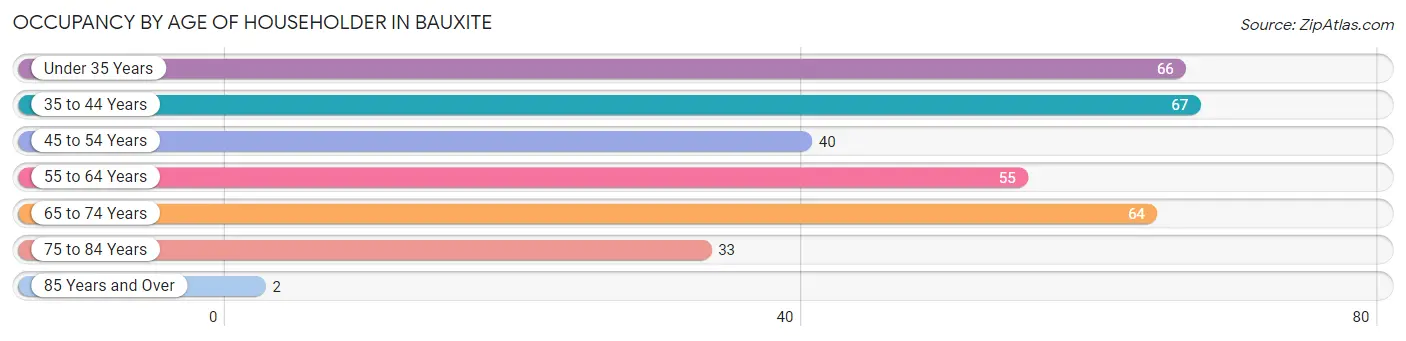
| Age Bracket | # Households | % Households |
| Under 35 Years | 66 | 20.2% |
| 35 to 44 Years | 67 | 20.5% |
| 45 to 54 Years | 40 | 12.2% |
| 55 to 64 Years | 55 | 16.8% |
| 65 to 74 Years | 64 | 19.6% |
| 75 to 84 Years | 33 | 10.1% |
| 85 Years and Over | 2 | 0.6% |
| Total | 327 | 100.0% |
Housing Finances in Bauxite
Median Income by Occupancy in Bauxite
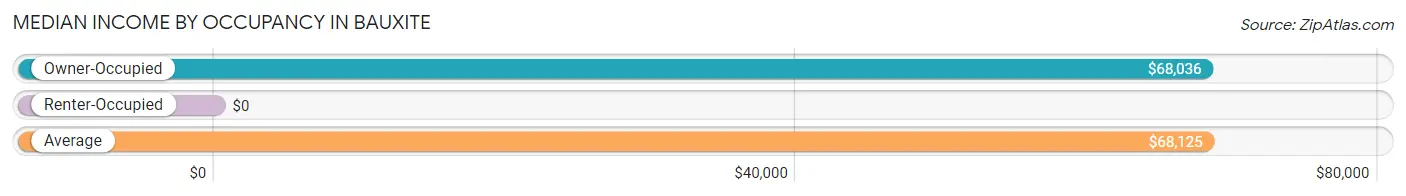
| Occupancy Type | # Households | Median Income |
| Owner-Occupied | 218 (66.7%) | $68,036 |
| Renter-Occupied | 109 (33.3%) | $0 |
| Average | 327 (100.0%) | $68,125 |
Occupancy by Householder Income Bracket in Bauxite
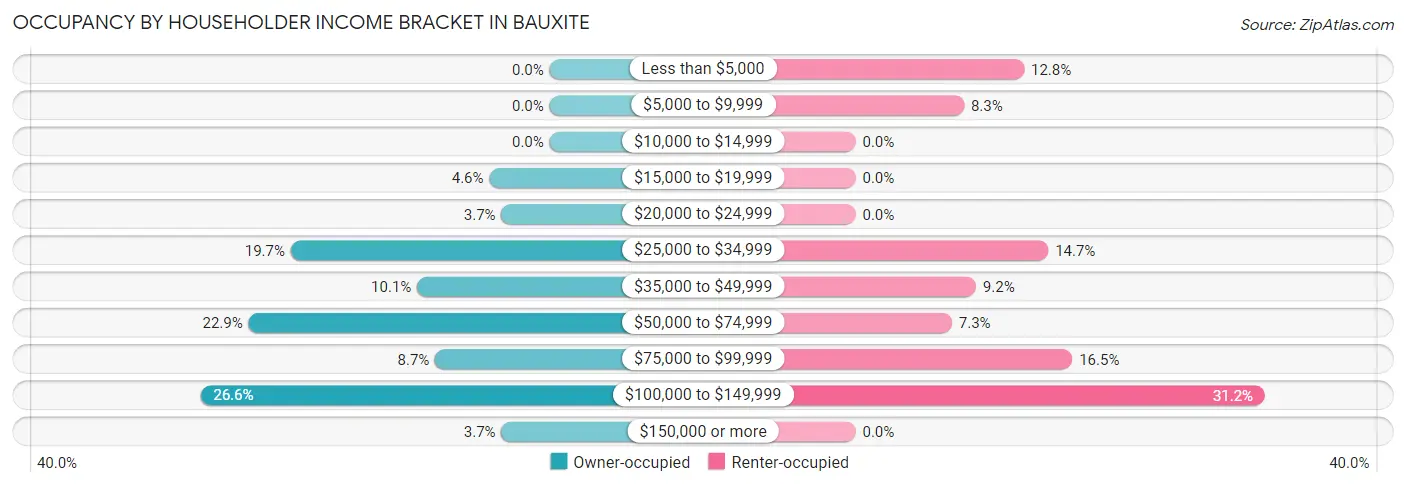
| Income Bracket | Owner-occupied | Renter-occupied |
| Less than $5,000 | 0 (0.0%) | 14 (12.8%) |
| $5,000 to $9,999 | 0 (0.0%) | 9 (8.3%) |
| $10,000 to $14,999 | 0 (0.0%) | 0 (0.0%) |
| $15,000 to $19,999 | 10 (4.6%) | 0 (0.0%) |
| $20,000 to $24,999 | 8 (3.7%) | 0 (0.0%) |
| $25,000 to $34,999 | 43 (19.7%) | 16 (14.7%) |
| $35,000 to $49,999 | 22 (10.1%) | 10 (9.2%) |
| $50,000 to $74,999 | 50 (22.9%) | 8 (7.3%) |
| $75,000 to $99,999 | 19 (8.7%) | 18 (16.5%) |
| $100,000 to $149,999 | 58 (26.6%) | 34 (31.2%) |
| $150,000 or more | 8 (3.7%) | 0 (0.0%) |
| Total | 218 (100.0%) | 109 (100.0%) |
Monthly Housing Cost Tiers in Bauxite
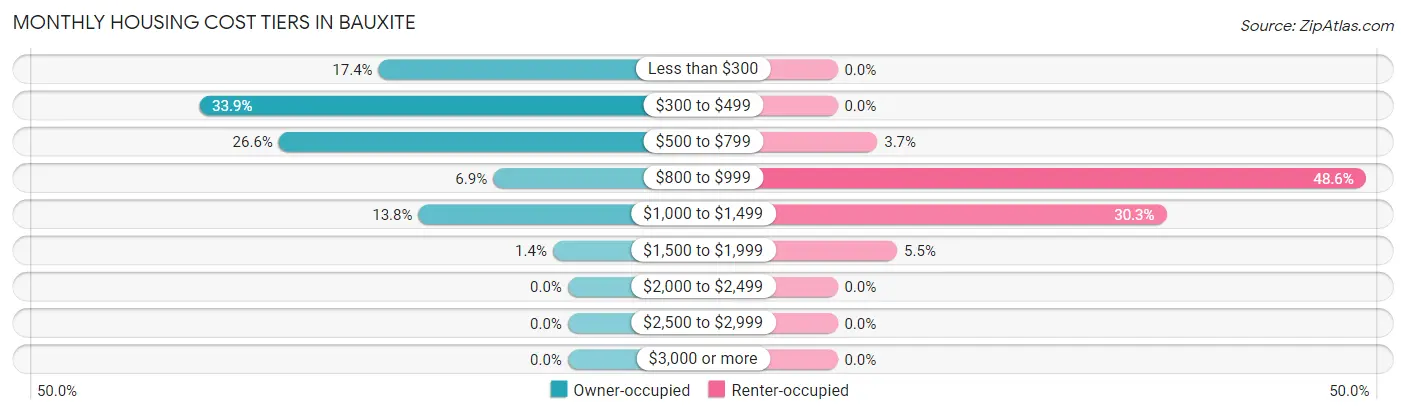
| Monthly Cost | Owner-occupied | Renter-occupied |
| Less than $300 | 38 (17.4%) | 0 (0.0%) |
| $300 to $499 | 74 (33.9%) | 0 (0.0%) |
| $500 to $799 | 58 (26.6%) | 4 (3.7%) |
| $800 to $999 | 15 (6.9%) | 53 (48.6%) |
| $1,000 to $1,499 | 30 (13.8%) | 33 (30.3%) |
| $1,500 to $1,999 | 3 (1.4%) | 6 (5.5%) |
| $2,000 to $2,499 | 0 (0.0%) | 0 (0.0%) |
| $2,500 to $2,999 | 0 (0.0%) | 0 (0.0%) |
| $3,000 or more | 0 (0.0%) | 0 (0.0%) |
| Total | 218 (100.0%) | 109 (100.0%) |
Physical Housing Characteristics in Bauxite
Housing Structures in Bauxite
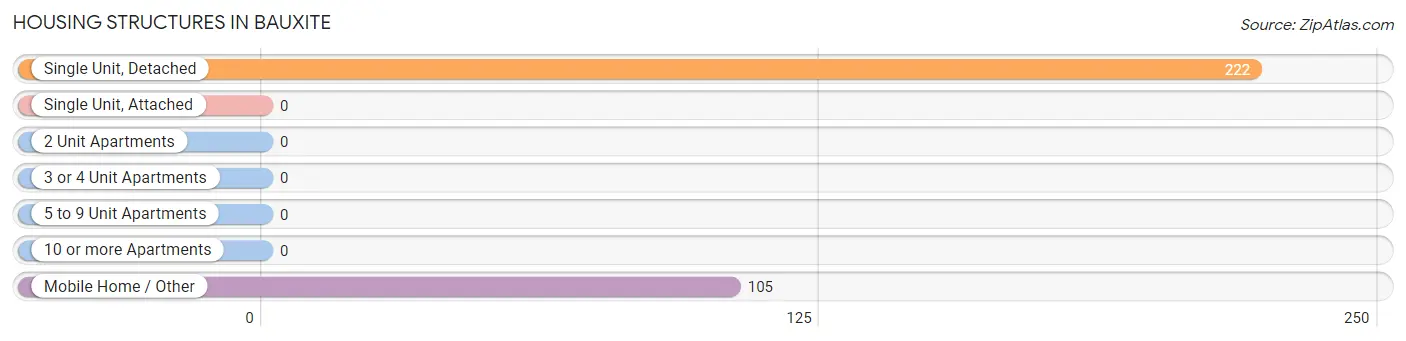
| Structure Type | # Housing Units | % Housing Units |
| Single Unit, Detached | 222 | 67.9% |
| Single Unit, Attached | 0 | 0.0% |
| 2 Unit Apartments | 0 | 0.0% |
| 3 or 4 Unit Apartments | 0 | 0.0% |
| 5 to 9 Unit Apartments | 0 | 0.0% |
| 10 or more Apartments | 0 | 0.0% |
| Mobile Home / Other | 105 | 32.1% |
| Total | 327 | 100.0% |
Housing Structures by Occupancy in Bauxite
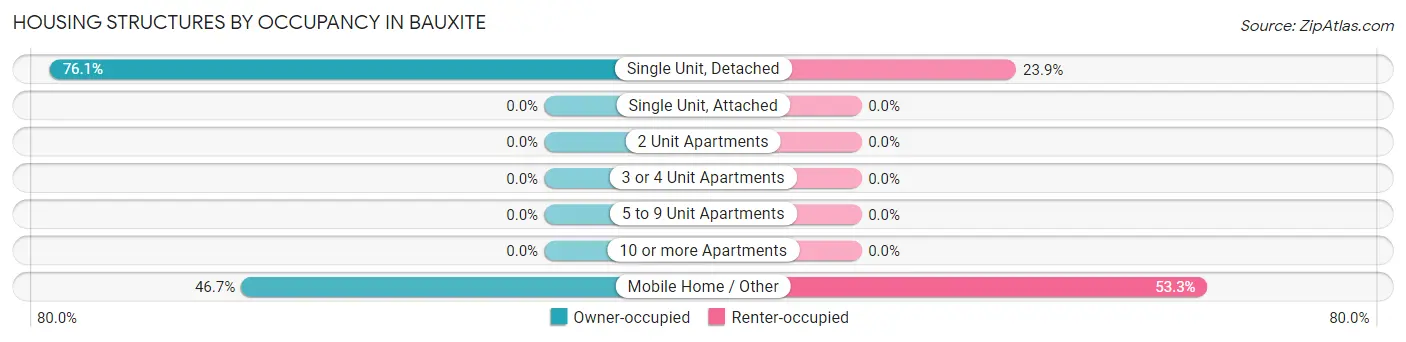
| Structure Type | Owner-occupied | Renter-occupied |
| Single Unit, Detached | 169 (76.1%) | 53 (23.9%) |
| Single Unit, Attached | 0 (0.0%) | 0 (0.0%) |
| 2 Unit Apartments | 0 (0.0%) | 0 (0.0%) |
| 3 or 4 Unit Apartments | 0 (0.0%) | 0 (0.0%) |
| 5 to 9 Unit Apartments | 0 (0.0%) | 0 (0.0%) |
| 10 or more Apartments | 0 (0.0%) | 0 (0.0%) |
| Mobile Home / Other | 49 (46.7%) | 56 (53.3%) |
| Total | 218 (66.7%) | 109 (33.3%) |
Housing Structures by Number of Rooms in Bauxite
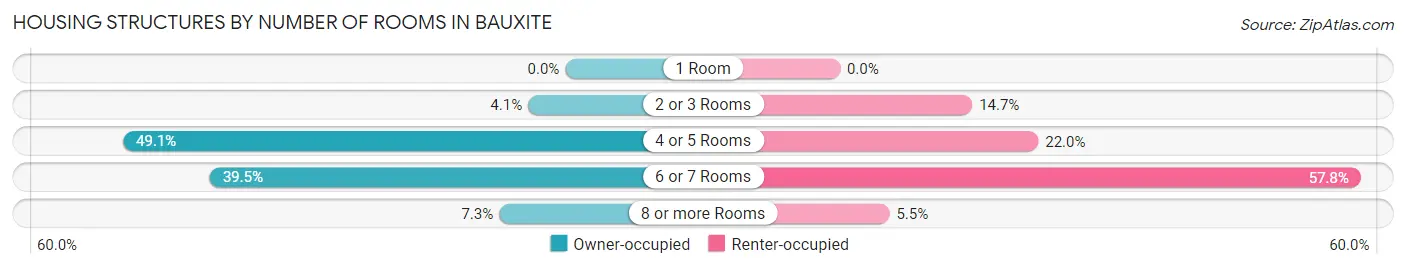
| Number of Rooms | Owner-occupied | Renter-occupied |
| 1 Room | 0 (0.0%) | 0 (0.0%) |
| 2 or 3 Rooms | 9 (4.1%) | 16 (14.7%) |
| 4 or 5 Rooms | 107 (49.1%) | 24 (22.0%) |
| 6 or 7 Rooms | 86 (39.5%) | 63 (57.8%) |
| 8 or more Rooms | 16 (7.3%) | 6 (5.5%) |
| Total | 218 (100.0%) | 109 (100.0%) |
Housing Structure by Heating Type in Bauxite
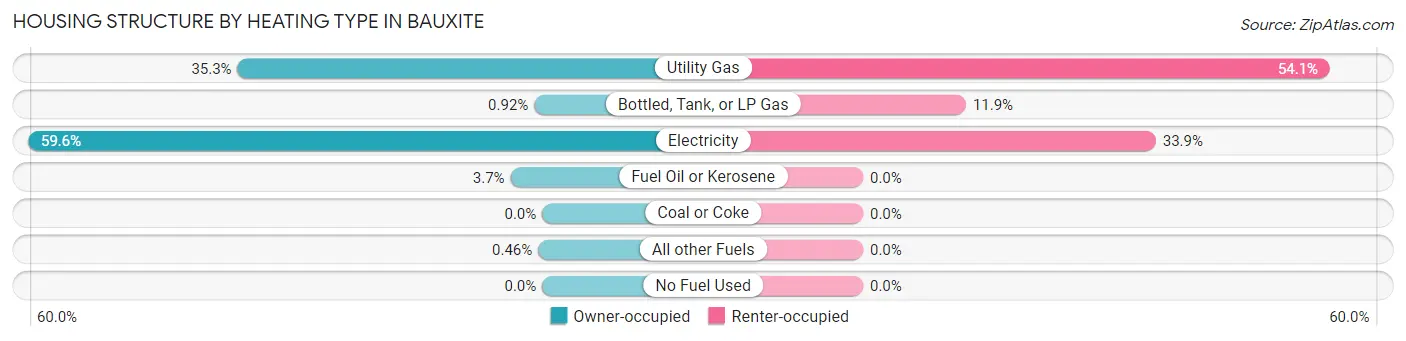
| Heating Type | Owner-occupied | Renter-occupied |
| Utility Gas | 77 (35.3%) | 59 (54.1%) |
| Bottled, Tank, or LP Gas | 2 (0.9%) | 13 (11.9%) |
| Electricity | 130 (59.6%) | 37 (33.9%) |
| Fuel Oil or Kerosene | 8 (3.7%) | 0 (0.0%) |
| Coal or Coke | 0 (0.0%) | 0 (0.0%) |
| All other Fuels | 1 (0.5%) | 0 (0.0%) |
| No Fuel Used | 0 (0.0%) | 0 (0.0%) |
| Total | 218 (100.0%) | 109 (100.0%) |
Household Vehicle Usage in Bauxite
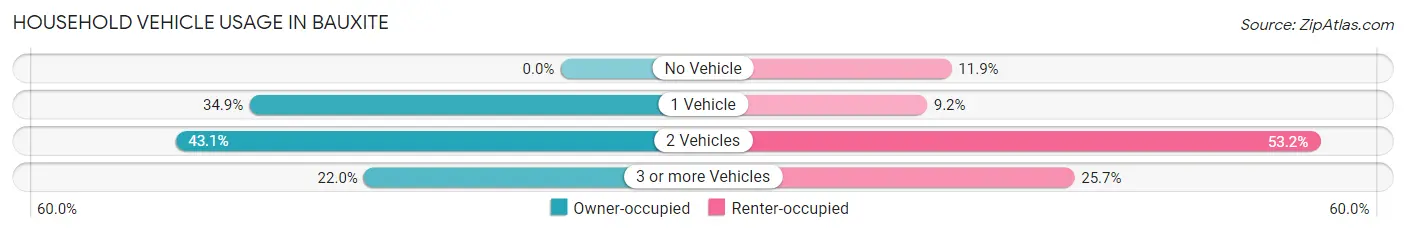
| Vehicles per Household | Owner-occupied | Renter-occupied |
| No Vehicle | 0 (0.0%) | 13 (11.9%) |
| 1 Vehicle | 76 (34.9%) | 10 (9.2%) |
| 2 Vehicles | 94 (43.1%) | 58 (53.2%) |
| 3 or more Vehicles | 48 (22.0%) | 28 (25.7%) |
| Total | 218 (100.0%) | 109 (100.0%) |
Real Estate & Mortgages in Bauxite
Real Estate and Mortgage Overview in Bauxite
| Characteristic | Without Mortgage | With Mortgage |
| Housing Units | 140 | 78 |
| Median Property Value | $202,100 | $0 |
| Median Household Income | $71,389 | $2 |
| Monthly Housing Costs | $336 | $0 |
| Real Estate Taxes | $1,553 | $0 |
Property Value by Mortgage Status in Bauxite
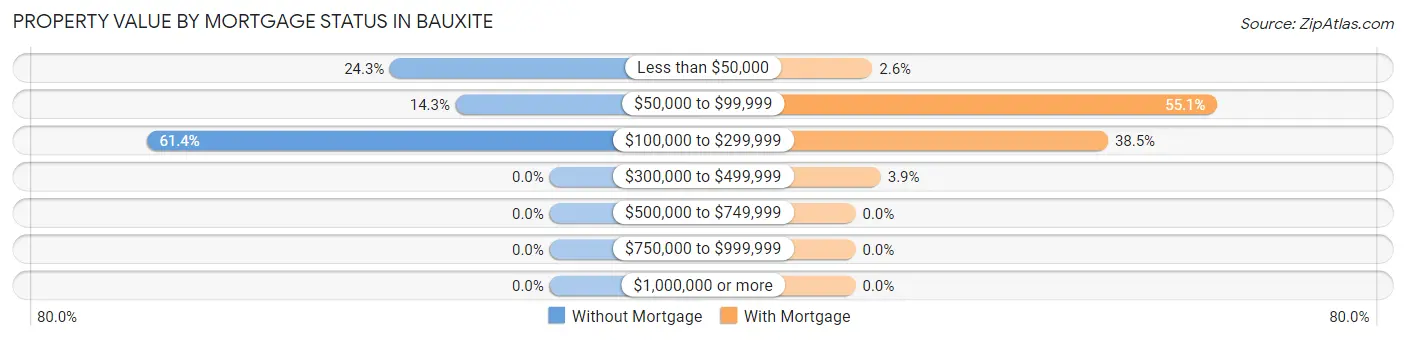
| Property Value | Without Mortgage | With Mortgage |
| Less than $50,000 | 34 (24.3%) | 2 (2.6%) |
| $50,000 to $99,999 | 20 (14.3%) | 43 (55.1%) |
| $100,000 to $299,999 | 86 (61.4%) | 30 (38.5%) |
| $300,000 to $499,999 | 0 (0.0%) | 3 (3.8%) |
| $500,000 to $749,999 | 0 (0.0%) | 0 (0.0%) |
| $750,000 to $999,999 | 0 (0.0%) | 0 (0.0%) |
| $1,000,000 or more | 0 (0.0%) | 0 (0.0%) |
| Total | 140 (100.0%) | 78 (100.0%) |
Household Income by Mortgage Status in Bauxite
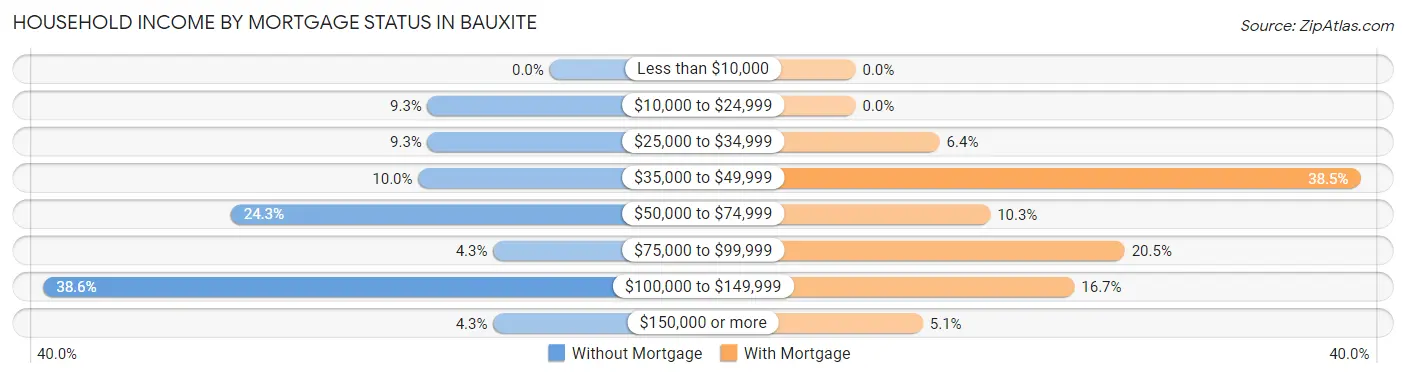
| Household Income | Without Mortgage | With Mortgage |
| Less than $10,000 | 0 (0.0%) | 0 (0.0%) |
| $10,000 to $24,999 | 13 (9.3%) | 0 (0.0%) |
| $25,000 to $34,999 | 13 (9.3%) | 5 (6.4%) |
| $35,000 to $49,999 | 14 (10.0%) | 30 (38.5%) |
| $50,000 to $74,999 | 34 (24.3%) | 8 (10.3%) |
| $75,000 to $99,999 | 6 (4.3%) | 16 (20.5%) |
| $100,000 to $149,999 | 54 (38.6%) | 13 (16.7%) |
| $150,000 or more | 6 (4.3%) | 4 (5.1%) |
| Total | 140 (100.0%) | 78 (100.0%) |
Property Value to Household Income Ratio in Bauxite
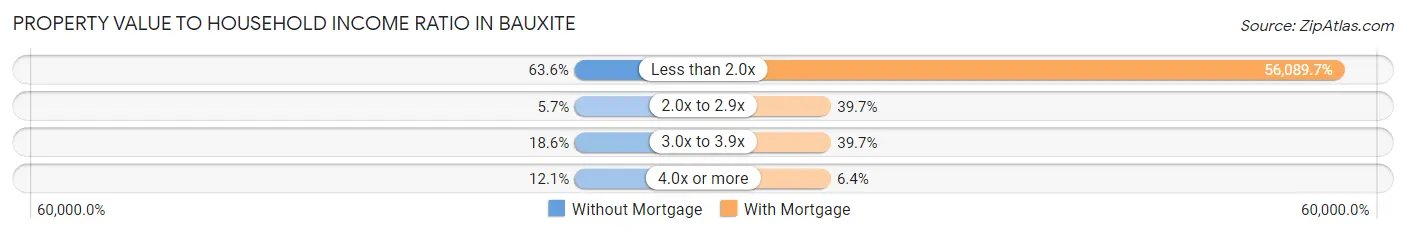
| Value-to-Income Ratio | Without Mortgage | With Mortgage |
| Less than 2.0x | 89 (63.6%) | 43,750 (56,089.7%) |
| 2.0x to 2.9x | 8 (5.7%) | 31 (39.7%) |
| 3.0x to 3.9x | 26 (18.6%) | 31 (39.7%) |
| 4.0x or more | 17 (12.1%) | 5 (6.4%) |
| Total | 140 (100.0%) | 78 (100.0%) |
Real Estate Taxes by Mortgage Status in Bauxite
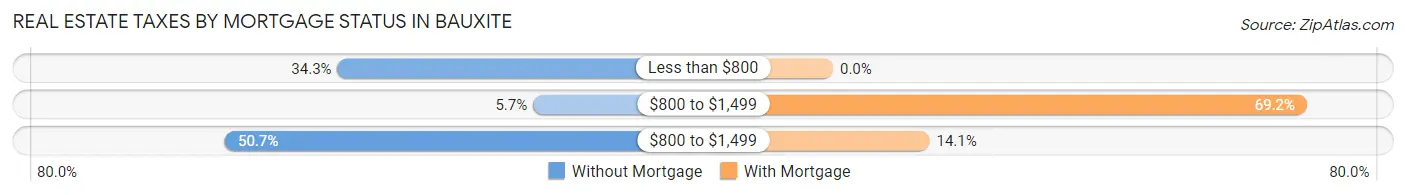
| Property Taxes | Without Mortgage | With Mortgage |
| Less than $800 | 48 (34.3%) | 0 (0.0%) |
| $800 to $1,499 | 8 (5.7%) | 54 (69.2%) |
| $800 to $1,499 | 71 (50.7%) | 11 (14.1%) |
| Total | 140 (100.0%) | 78 (100.0%) |
Health & Disability in Bauxite
Health Insurance Coverage by Age in Bauxite

| Age Bracket | With Coverage | Without Coverage |
| Under 6 Years | 106 (100.0%) | 0 (0.0%) |
| 6 to 18 Years | 188 (99.0%) | 2 (1.1%) |
| 19 to 25 Years | 107 (94.7%) | 6 (5.3%) |
| 26 to 34 Years | 100 (98.0%) | 2 (2.0%) |
| 35 to 44 Years | 106 (93.8%) | 7 (6.2%) |
| 45 to 54 Years | 55 (85.9%) | 9 (14.1%) |
| 55 to 64 Years | 116 (98.3%) | 2 (1.7%) |
| 65 to 74 Years | 95 (100.0%) | 0 (0.0%) |
| 75 Years and older | 57 (100.0%) | 0 (0.0%) |
| Total | 930 (97.1%) | 28 (2.9%) |
Health Insurance Coverage by Citizenship Status in Bauxite
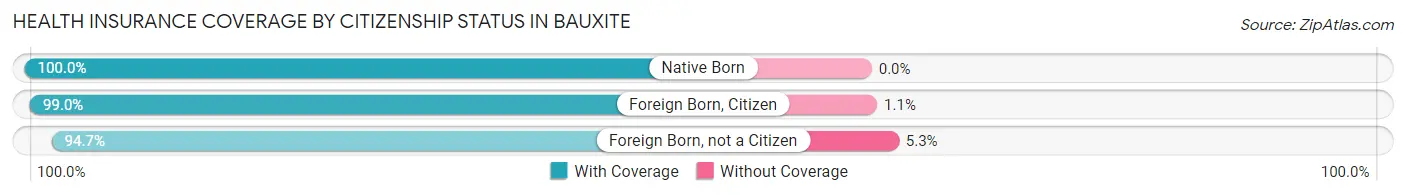
| Citizenship Status | With Coverage | Without Coverage |
| Native Born | 106 (100.0%) | 0 (0.0%) |
| Foreign Born, Citizen | 188 (99.0%) | 2 (1.1%) |
| Foreign Born, not a Citizen | 107 (94.7%) | 6 (5.3%) |
Health Insurance Coverage by Household Income in Bauxite
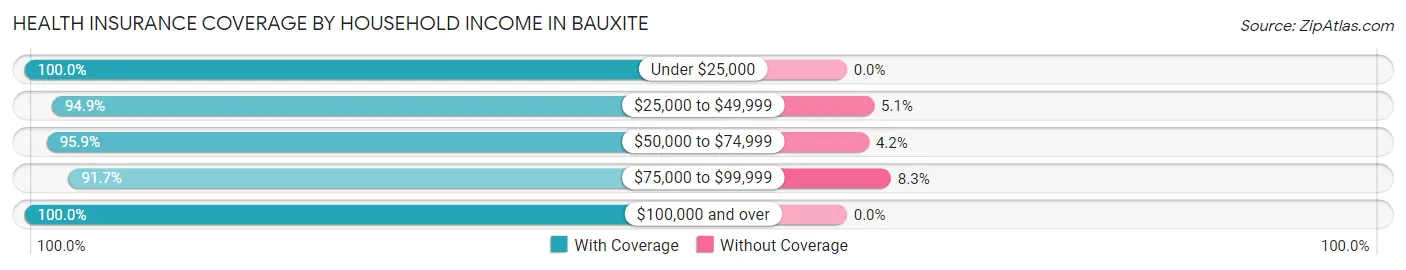
| Household Income | With Coverage | Without Coverage |
| Under $25,000 | 110 (100.0%) | 0 (0.0%) |
| $25,000 to $49,999 | 185 (94.9%) | 10 (5.1%) |
| $50,000 to $74,999 | 208 (95.9%) | 9 (4.2%) |
| $75,000 to $99,999 | 100 (91.7%) | 9 (8.3%) |
| $100,000 and over | 327 (100.0%) | 0 (0.0%) |
Public vs Private Health Insurance Coverage by Age in Bauxite
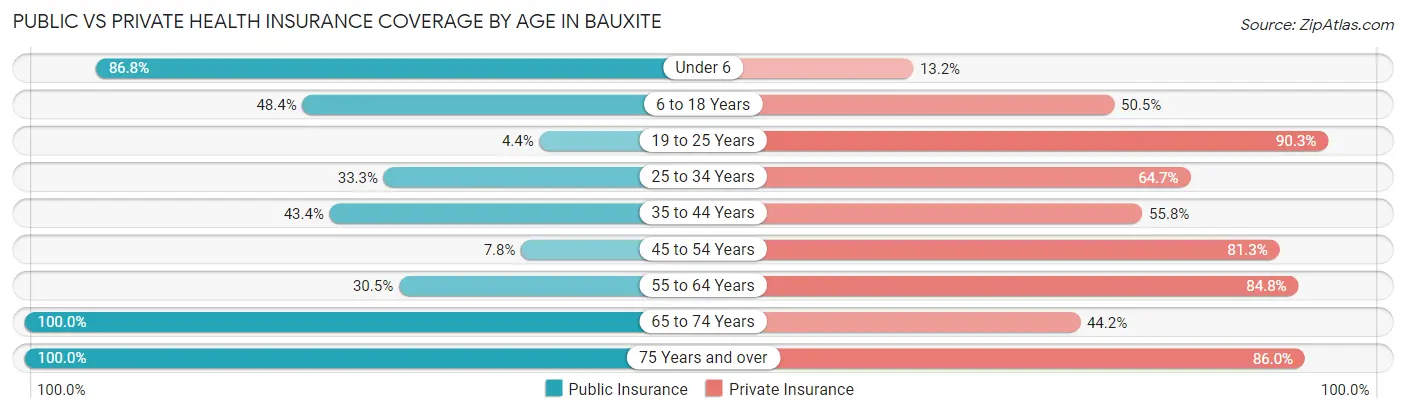
| Age Bracket | Public Insurance | Private Insurance |
| Under 6 | 92 (86.8%) | 14 (13.2%) |
| 6 to 18 Years | 92 (48.4%) | 96 (50.5%) |
| 19 to 25 Years | 5 (4.4%) | 102 (90.3%) |
| 25 to 34 Years | 34 (33.3%) | 66 (64.7%) |
| 35 to 44 Years | 49 (43.4%) | 63 (55.7%) |
| 45 to 54 Years | 5 (7.8%) | 52 (81.2%) |
| 55 to 64 Years | 36 (30.5%) | 100 (84.8%) |
| 65 to 74 Years | 95 (100.0%) | 42 (44.2%) |
| 75 Years and over | 57 (100.0%) | 49 (86.0%) |
| Total | 465 (48.5%) | 584 (61.0%) |
Disability Status by Sex by Age in Bauxite
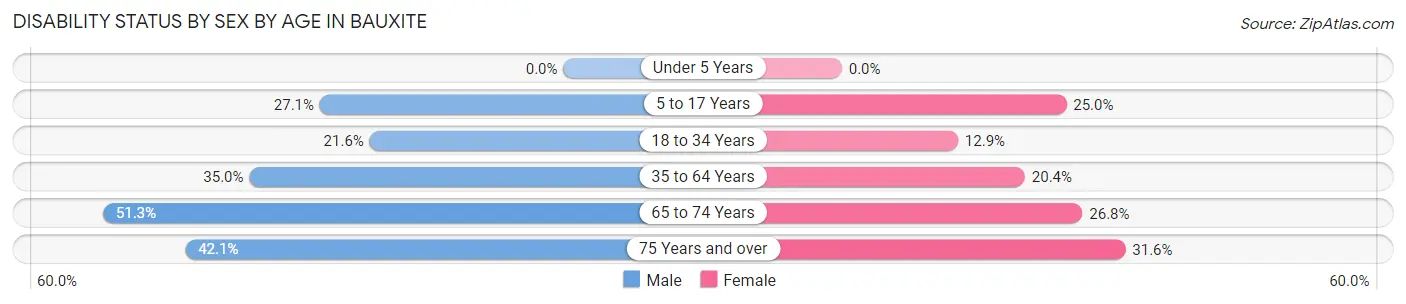
| Age Bracket | Male | Female |
| Under 5 Years | 0 (0.0%) | 0 (0.0%) |
| 5 to 17 Years | 16 (27.1%) | 32 (25.0%) |
| 18 to 34 Years | 22 (21.6%) | 15 (12.9%) |
| 35 to 64 Years | 50 (35.0%) | 31 (20.4%) |
| 65 to 74 Years | 20 (51.3%) | 15 (26.8%) |
| 75 Years and over | 8 (42.1%) | 12 (31.6%) |
Disability Class by Sex by Age in Bauxite
Disability Class: Hearing Difficulty
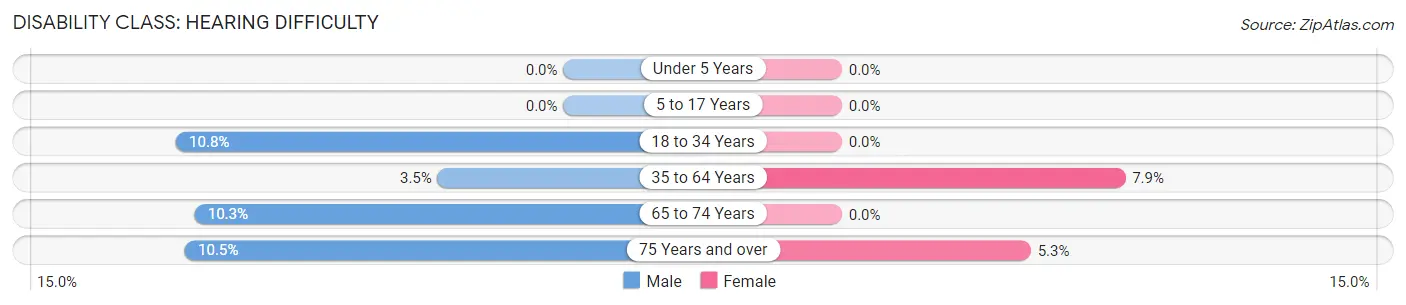
| Age Bracket | Male | Female |
| Under 5 Years | 0 (0.0%) | 0 (0.0%) |
| 5 to 17 Years | 0 (0.0%) | 0 (0.0%) |
| 18 to 34 Years | 11 (10.8%) | 0 (0.0%) |
| 35 to 64 Years | 5 (3.5%) | 12 (7.9%) |
| 65 to 74 Years | 4 (10.3%) | 0 (0.0%) |
| 75 Years and over | 2 (10.5%) | 2 (5.3%) |
Disability Class: Vision Difficulty
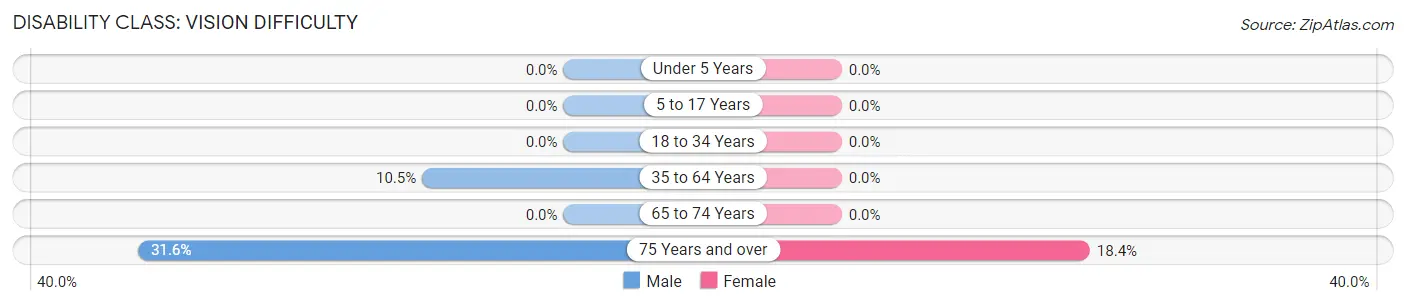
| Age Bracket | Male | Female |
| Under 5 Years | 0 (0.0%) | 0 (0.0%) |
| 5 to 17 Years | 0 (0.0%) | 0 (0.0%) |
| 18 to 34 Years | 0 (0.0%) | 0 (0.0%) |
| 35 to 64 Years | 15 (10.5%) | 0 (0.0%) |
| 65 to 74 Years | 0 (0.0%) | 0 (0.0%) |
| 75 Years and over | 6 (31.6%) | 7 (18.4%) |
Disability Class: Cognitive Difficulty
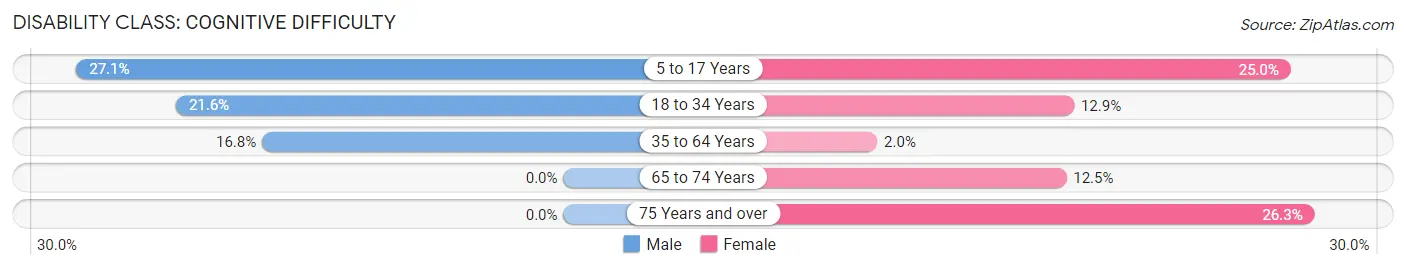
| Age Bracket | Male | Female |
| 5 to 17 Years | 16 (27.1%) | 32 (25.0%) |
| 18 to 34 Years | 22 (21.6%) | 15 (12.9%) |
| 35 to 64 Years | 24 (16.8%) | 3 (2.0%) |
| 65 to 74 Years | 0 (0.0%) | 7 (12.5%) |
| 75 Years and over | 0 (0.0%) | 10 (26.3%) |
Disability Class: Ambulatory Difficulty
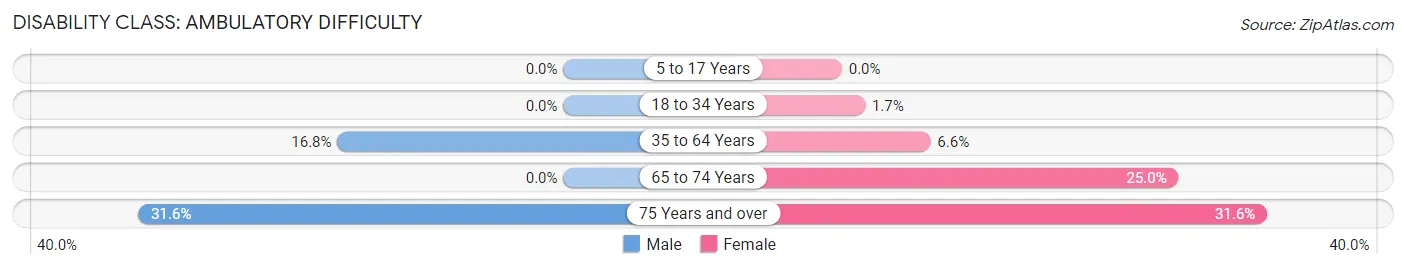
| Age Bracket | Male | Female |
| 5 to 17 Years | 0 (0.0%) | 0 (0.0%) |
| 18 to 34 Years | 0 (0.0%) | 2 (1.7%) |
| 35 to 64 Years | 24 (16.8%) | 10 (6.6%) |
| 65 to 74 Years | 0 (0.0%) | 14 (25.0%) |
| 75 Years and over | 6 (31.6%) | 12 (31.6%) |
Disability Class: Self-Care Difficulty
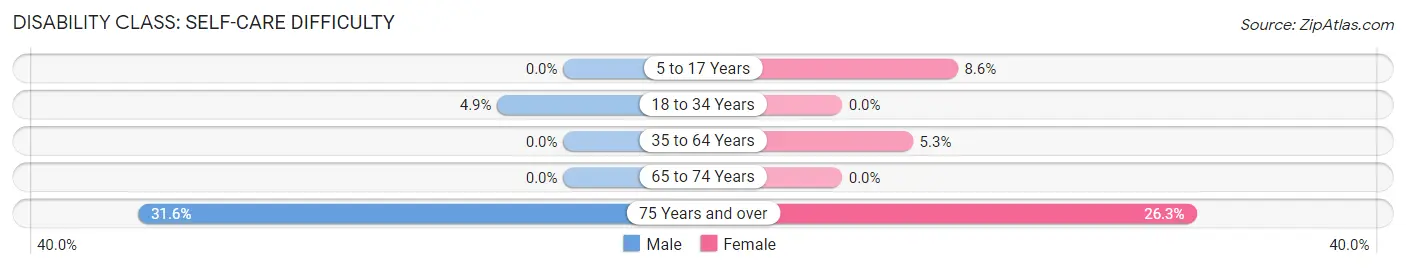
| Age Bracket | Male | Female |
| 5 to 17 Years | 0 (0.0%) | 11 (8.6%) |
| 18 to 34 Years | 5 (4.9%) | 0 (0.0%) |
| 35 to 64 Years | 0 (0.0%) | 8 (5.3%) |
| 65 to 74 Years | 0 (0.0%) | 0 (0.0%) |
| 75 Years and over | 6 (31.6%) | 10 (26.3%) |
Technology Access in Bauxite
Computing Device Access in Bauxite
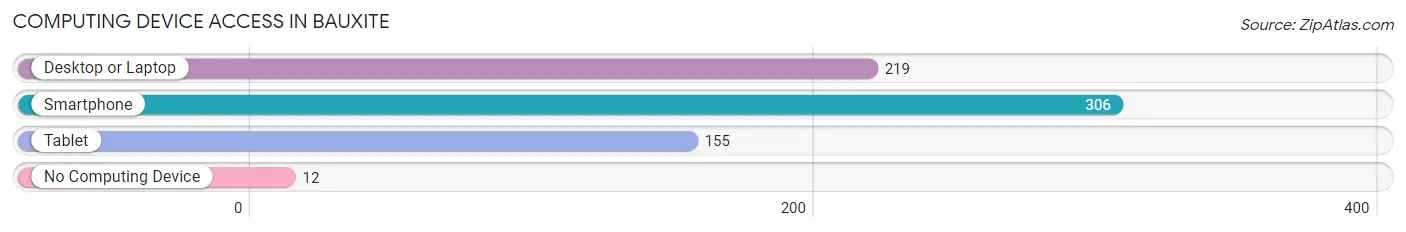
| Device Type | # Households | % Households |
| Desktop or Laptop | 219 | 67.0% |
| Smartphone | 306 | 93.6% |
| Tablet | 155 | 47.4% |
| No Computing Device | 12 | 3.7% |
| Total | 327 | 100.0% |
Internet Access in Bauxite
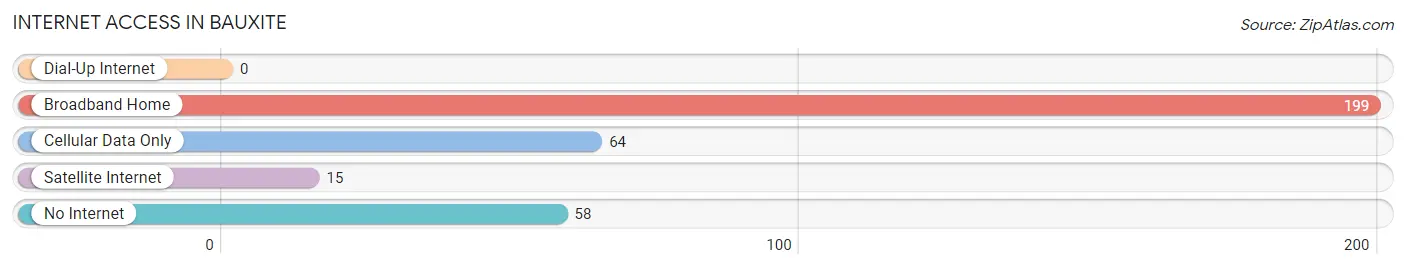
| Internet Type | # Households | % Households |
| Dial-Up Internet | 0 | 0.0% |
| Broadband Home | 199 | 60.9% |
| Cellular Data Only | 64 | 19.6% |
| Satellite Internet | 15 | 4.6% |
| No Internet | 58 | 17.7% |
| Total | 327 | 100.0% |
Bauxite Summary
Bauxite, Arkansas is a small town located in Saline County, Arkansas. It is situated about 20 miles south of Little Rock, the state capital. The town was founded in 1887 and was named after the mineral bauxite, which was discovered in the area in 1887. The town was incorporated in 1901 and has a population of about 500 people.
Geography
Bauxite is located in the Ouachita Mountains of Central Arkansas. The town is situated on the Saline River, which is a tributary of the Arkansas River. The town is surrounded by rolling hills and forests, and is located in a region of the state known for its natural beauty. The climate in Bauxite is humid subtropical, with hot summers and mild winters.
Economy
Bauxite has a small but diverse economy. The town is home to several small businesses, including a grocery store, a hardware store, a restaurant, and a few other small shops. The town is also home to a number of manufacturing companies, including a steel mill, a paper mill, and a chemical plant. The town is also home to a number of mining companies, which extract bauxite, a mineral used in the production of aluminum.
Demographics
As of the 2010 census, the population of Bauxite was 553. The racial makeup of the town was 97.3% White, 0.7% African American, 0.2% Native American, 0.2% Asian, 0.2% from other races, and 1.4% from two or more races. Hispanic or Latino of any race were 1.1% of the population.
The median income for a household in Bauxite was $37,500, and the median income for a family was $45,000. The per capita income for the town was $18,000. About 11.2% of families and 14.2% of the population were below the poverty line, including 18.2% of those under age 18 and 8.3% of those age 65 or over.
History
Bauxite was founded in 1887 when the mineral bauxite was discovered in the area. The town was named after the mineral, and the first bauxite mine was opened in 1888. The town was incorporated in 1901, and the first post office was established in 1902.
In the early 1900s, the town was home to several large bauxite mining companies, and the town grew rapidly. By the 1920s, the town had a population of over 1,000 people. The town was also home to several other industries, including a steel mill, a paper mill, and a chemical plant.
In the 1950s, the bauxite mining industry began to decline, and the town's population began to decline as well. By the 1970s, the population had dropped to just over 500 people. In recent years, the town has seen a resurgence in population, and the population has grown to over 500 people.
Today, Bauxite is a small but vibrant town. The town is home to several small businesses, and the town is also home to a number of manufacturing companies. The town is also home to a number of mining companies, which extract bauxite, a mineral used in the production of aluminum. The town is also home to a number of recreational activities, including fishing, camping, and hiking.
Common Questions
What is Per Capita Income in Bauxite?
Per Capita income in Bauxite is $24,036.
What is the Median Family Income in Bauxite?
Median Family Income in Bauxite is $67,266.
What is the Median Household income in Bauxite?
Median Household Income in Bauxite is $68,125.
What is Income or Wage Gap in Bauxite?
Income or Wage Gap in Bauxite is 36.1%.
Women in Bauxite earn 63.9 cents for every dollar earned by a man.
What is Inequality or Gini Index in Bauxite?
Inequality or Gini Index in Bauxite is 0.36.
What is the Total Population of Bauxite?
Total Population of Bauxite is 961.
What is the Total Male Population of Bauxite?
Total Male Population of Bauxite is 394.
What is the Total Female Population of Bauxite?
Total Female Population of Bauxite is 567.
What is the Ratio of Males per 100 Females in Bauxite?
There are 69.49 Males per 100 Females in Bauxite.
What is the Ratio of Females per 100 Males in Bauxite?
There are 143.91 Females per 100 Males in Bauxite.
What is the Median Population Age in Bauxite?
Median Population Age in Bauxite is 32.4 Years.
What is the Average Family Size in Bauxite
Average Family Size in Bauxite is 3.0 People.
What is the Average Household Size in Bauxite
Average Household Size in Bauxite is 2.9 People.
How Large is the Labor Force in Bauxite?
There are 382 People in the Labor Forcein in Bauxite.
What is the Percentage of People in the Labor Force in Bauxite?
56.0% of People are in the Labor Force in Bauxite.
What is the Unemployment Rate in Bauxite?
Unemployment Rate in Bauxite is 4.0%.