Austin, AR Map & Demographics
Austin Map
Austin Overview
$35,561
PER CAPITA INCOME
$106,335
AVG FAMILY INCOME
$93,929
AVG HOUSEHOLD INCOME
35.0%
WAGE / INCOME GAP [ % ]
65.0¢/ $1
WAGE / INCOME GAP [ $ ]
0.35
INEQUALITY / GINI INDEX
3,659
TOTAL POPULATION
1,795
MALE POPULATION
1,864
FEMALE POPULATION
96.30
MALES / 100 FEMALES
103.84
FEMALES / 100 MALES
30.6
MEDIAN AGE
3.1
AVG FAMILY SIZE
2.7
AVG HOUSEHOLD SIZE
2,011
LABOR FORCE [ PEOPLE ]
77.6%
PERCENT IN LABOR FORCE
2.2%
UNEMPLOYMENT RATE
Austin Zip Codes
Income in Austin
Income Overview in Austin
Per Capita Income in Austin is $35,561, while median incomes of families and households are $106,335 and $93,929 respectively.
| Characteristic | Number | Measure |
| Per Capita Income | 3,659 | $35,561 |
| Median Family Income | 1,061 | $106,335 |
| Mean Family Income | 1,061 | $113,620 |
| Median Household Income | 1,360 | $93,929 |
| Mean Household Income | 1,360 | $100,517 |
| Income Deficit | 1,061 | $0 |
| Wage / Income Gap (%) | 3,659 | 35.01% |
| Wage / Income Gap ($) | 3,659 | 64.99¢ per $1 |
| Gini / Inequality Index | 3,659 | 0.35 |
Earnings by Sex in Austin
Average Earnings in Austin are $50,588, $63,469 for men and $41,250 for women, a difference of 35.0%.
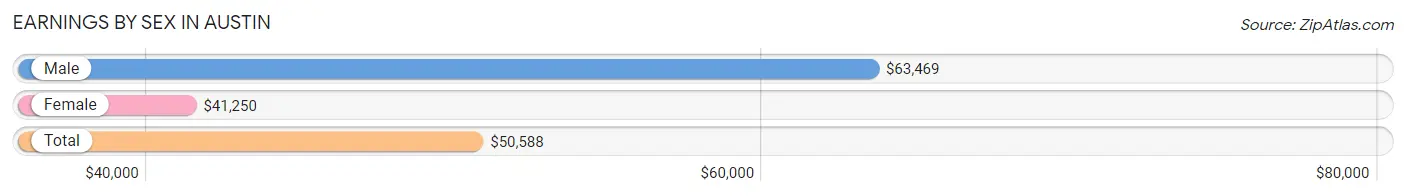
| Sex | Number | Average Earnings |
| Male | 1,080 (53.2%) | $63,469 |
| Female | 948 (46.8%) | $41,250 |
| Total | 2,028 (100.0%) | $50,588 |
Earnings by Sex by Income Bracket in Austin
The most common earnings brackets in Austin are $100,000+ for men (260 | 24.1%) and $75,000 to $99,999 for women (124 | 13.1%).
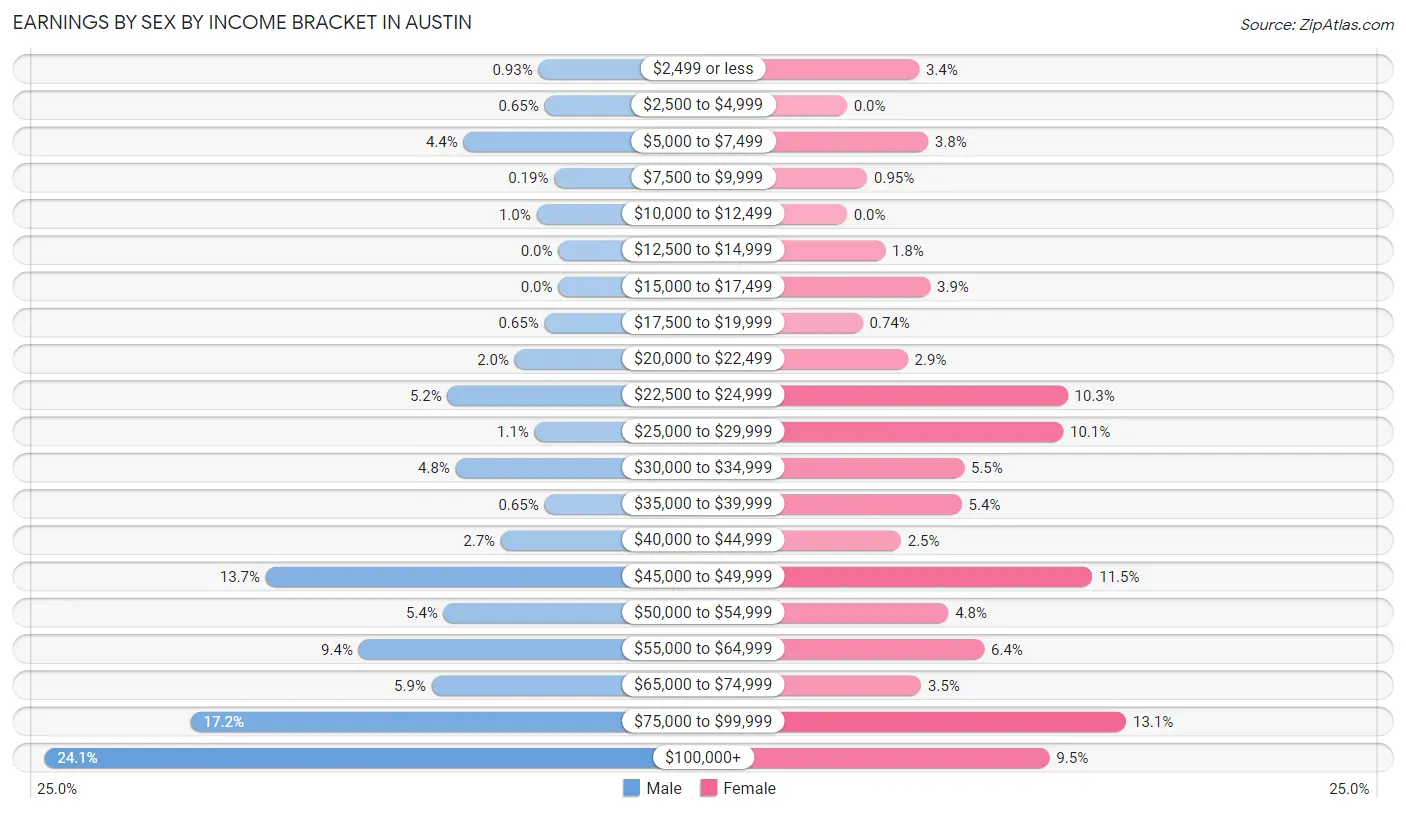
| Income | Male | Female |
| $2,499 or less | 10 (0.9%) | 32 (3.4%) |
| $2,500 to $4,999 | 7 (0.6%) | 0 (0.0%) |
| $5,000 to $7,499 | 48 (4.4%) | 36 (3.8%) |
| $7,500 to $9,999 | 2 (0.2%) | 9 (0.9%) |
| $10,000 to $12,499 | 11 (1.0%) | 0 (0.0%) |
| $12,500 to $14,999 | 0 (0.0%) | 17 (1.8%) |
| $15,000 to $17,499 | 0 (0.0%) | 37 (3.9%) |
| $17,500 to $19,999 | 7 (0.6%) | 7 (0.7%) |
| $20,000 to $22,499 | 22 (2.0%) | 27 (2.9%) |
| $22,500 to $24,999 | 56 (5.2%) | 98 (10.3%) |
| $25,000 to $29,999 | 12 (1.1%) | 96 (10.1%) |
| $30,000 to $34,999 | 52 (4.8%) | 52 (5.5%) |
| $35,000 to $39,999 | 7 (0.6%) | 51 (5.4%) |
| $40,000 to $44,999 | 29 (2.7%) | 24 (2.5%) |
| $45,000 to $49,999 | 148 (13.7%) | 109 (11.5%) |
| $50,000 to $54,999 | 58 (5.4%) | 45 (4.8%) |
| $55,000 to $64,999 | 101 (9.3%) | 61 (6.4%) |
| $65,000 to $74,999 | 64 (5.9%) | 33 (3.5%) |
| $75,000 to $99,999 | 186 (17.2%) | 124 (13.1%) |
| $100,000+ | 260 (24.1%) | 90 (9.5%) |
| Total | 1,080 (100.0%) | 948 (100.0%) |
Earnings by Sex by Educational Attainment in Austin
Average earnings in Austin are $64,668 for men and $45,981 for women, a difference of 28.9%. Men with an educational attainment of graduate degree enjoy the highest average annual earnings of $105,492, while those with high school diploma education earn the least with $49,679. Women with an educational attainment of bachelor's degree earn the most with the average annual earnings of $77,762, while those with less than high school education have the smallest earnings of $17,381.
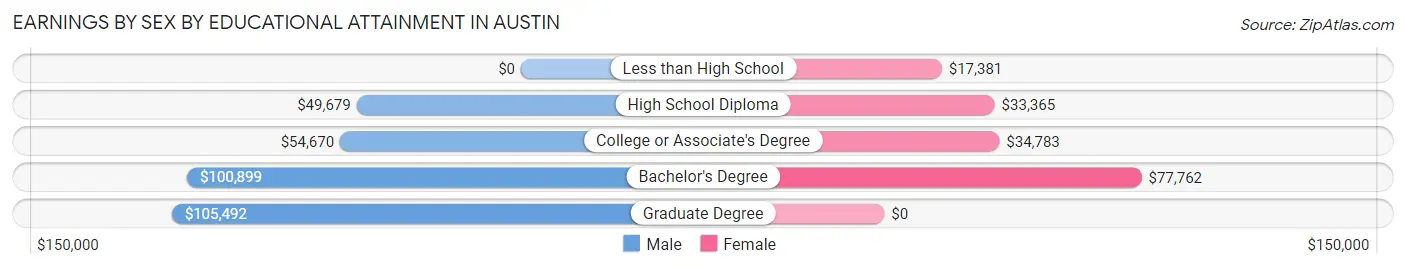
| Educational Attainment | Male Income | Female Income |
| Less than High School | - | - |
| High School Diploma | $49,679 | $33,365 |
| College or Associate's Degree | $54,670 | $34,783 |
| Bachelor's Degree | $100,899 | $77,762 |
| Graduate Degree | $105,492 | $0 |
| Total | $64,668 | $45,981 |
Family Income in Austin
Family Income Brackets in Austin
According to the Austin family income data, there are 312 families falling into the $100,000 to $149,999 income range, which is the most common income bracket and makes up 29.4% of all families. Conversely, the $10,000 to $14,999 income bracket is the least frequent group with only 6 families (0.6%) belonging to this category.
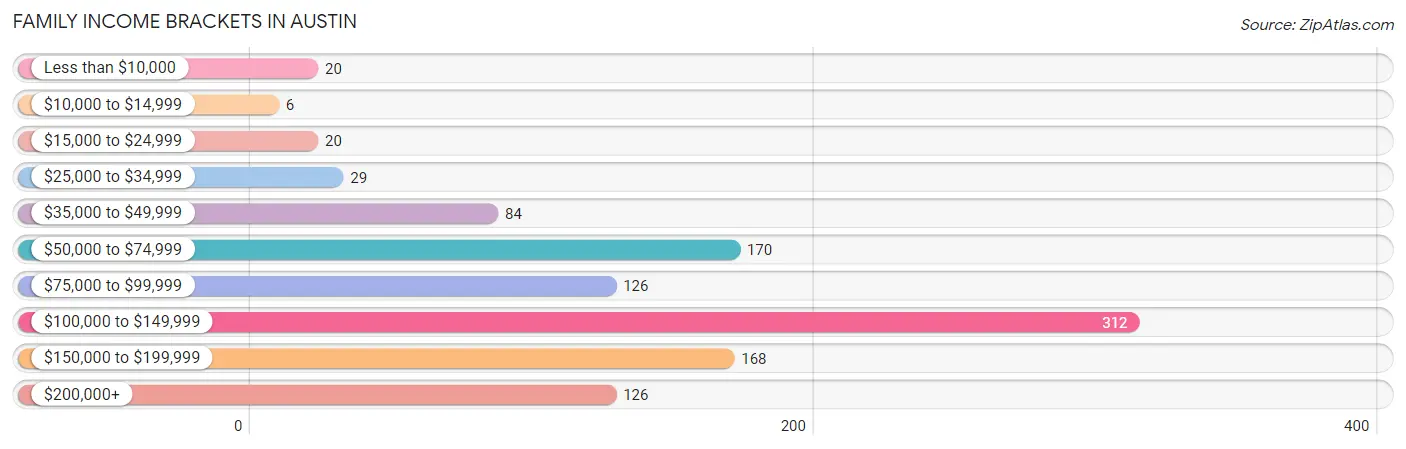
| Income Bracket | # Families | % Families |
| Less than $10,000 | 20 | 1.9% |
| $10,000 to $14,999 | 6 | 0.6% |
| $15,000 to $24,999 | 20 | 1.9% |
| $25,000 to $34,999 | 29 | 2.7% |
| $35,000 to $49,999 | 84 | 7.9% |
| $50,000 to $74,999 | 170 | 16.0% |
| $75,000 to $99,999 | 126 | 11.9% |
| $100,000 to $149,999 | 312 | 29.4% |
| $150,000 to $199,999 | 168 | 15.8% |
| $200,000+ | 126 | 11.9% |
Family Income by Famaliy Size in Austin
5-person families (111 | 10.5%) account for the highest median family income in Austin with $178,308 per family, while 2-person families (395 | 37.2%) have the highest median income of $47,076 per family member.
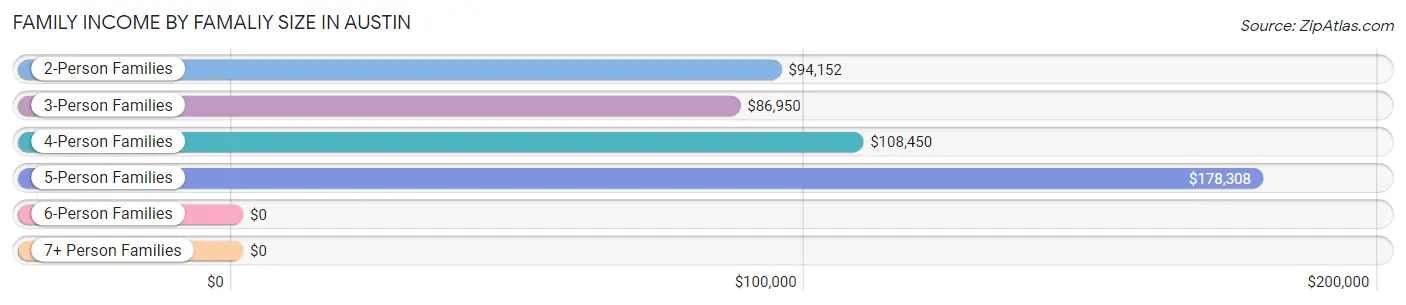
| Income Bracket | # Families | Median Income |
| 2-Person Families | 395 (37.2%) | $94,152 |
| 3-Person Families | 173 (16.3%) | $86,950 |
| 4-Person Families | 363 (34.2%) | $108,450 |
| 5-Person Families | 111 (10.5%) | $178,308 |
| 6-Person Families | 19 (1.8%) | $0 |
| 7+ Person Families | 0 (0.0%) | $0 |
| Total | 1,061 (100.0%) | $106,335 |
Family Income by Number of Earners in Austin
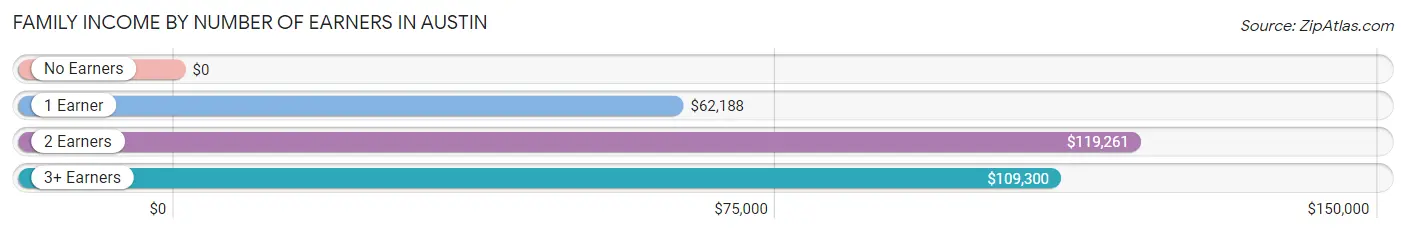
| Number of Earners | # Families | Median Income |
| No Earners | 55 (5.2%) | $0 |
| 1 Earner | 313 (29.5%) | $62,188 |
| 2 Earners | 639 (60.2%) | $119,261 |
| 3+ Earners | 54 (5.1%) | $109,300 |
| Total | 1,061 (100.0%) | $106,335 |
Household Income in Austin
Household Income Brackets in Austin
With 358 households falling in the category, the $100,000 to $149,999 income range is the most frequent in Austin, accounting for 26.3% of all households. In contrast, only 20 households (1.5%) fall into the less than $10,000 income bracket, making it the least populous group.
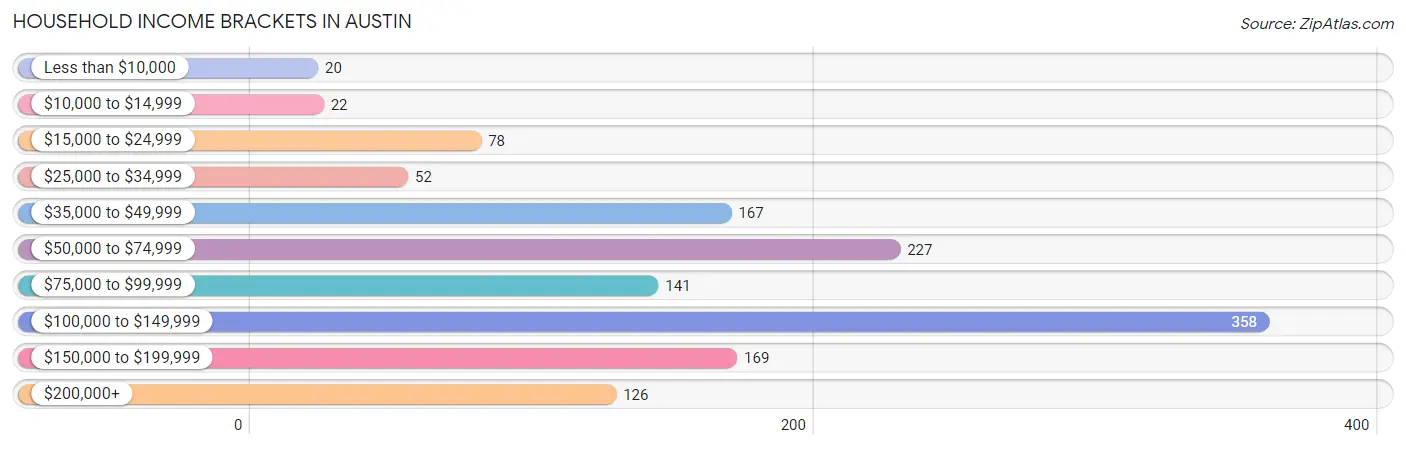
| Income Bracket | # Households | % Households |
| Less than $10,000 | 20 | 1.5% |
| $10,000 to $14,999 | 22 | 1.6% |
| $15,000 to $24,999 | 78 | 5.7% |
| $25,000 to $34,999 | 52 | 3.8% |
| $35,000 to $49,999 | 167 | 12.3% |
| $50,000 to $74,999 | 227 | 16.7% |
| $75,000 to $99,999 | 141 | 10.4% |
| $100,000 to $149,999 | 358 | 26.3% |
| $150,000 to $199,999 | 169 | 12.4% |
| $200,000+ | 126 | 9.3% |
Household Income by Householder Age in Austin
The median household income in Austin is $93,929, with the highest median household income of $104,107 found in the 45 to 64 years age bracket for the primary householder. A total of 397 households (29.2%) fall into this category. Meanwhile, the 65+ years age bracket for the primary householder has the lowest median household income of $0, with 78 households (5.7%) in this group.
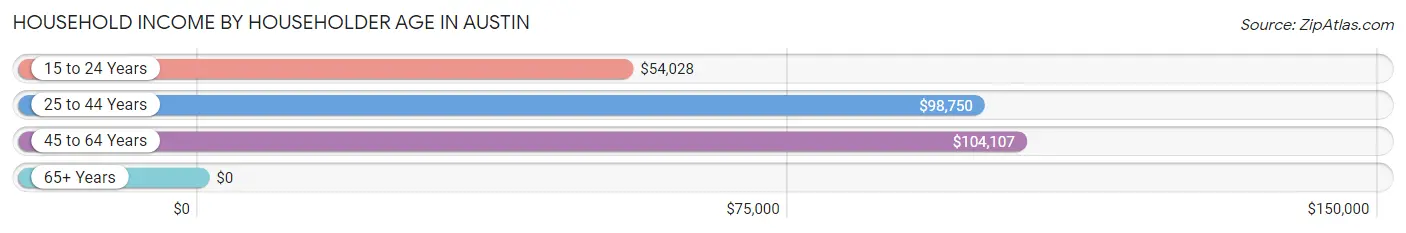
| Income Bracket | # Households | Median Income |
| 15 to 24 Years | 51 (3.7%) | $54,028 |
| 25 to 44 Years | 834 (61.3%) | $98,750 |
| 45 to 64 Years | 397 (29.2%) | $104,107 |
| 65+ Years | 78 (5.7%) | $0 |
| Total | 1,360 (100.0%) | $93,929 |
Poverty in Austin
Income Below Poverty by Sex and Age in Austin
With 2.2% poverty level for males and 3.2% for females among the residents of Austin, 55 to 64 year old males and 12 to 14 year old females are the most vulnerable to poverty, with 29 males (17.9%) and 7 females (8.3%) in their respective age groups living below the poverty level.
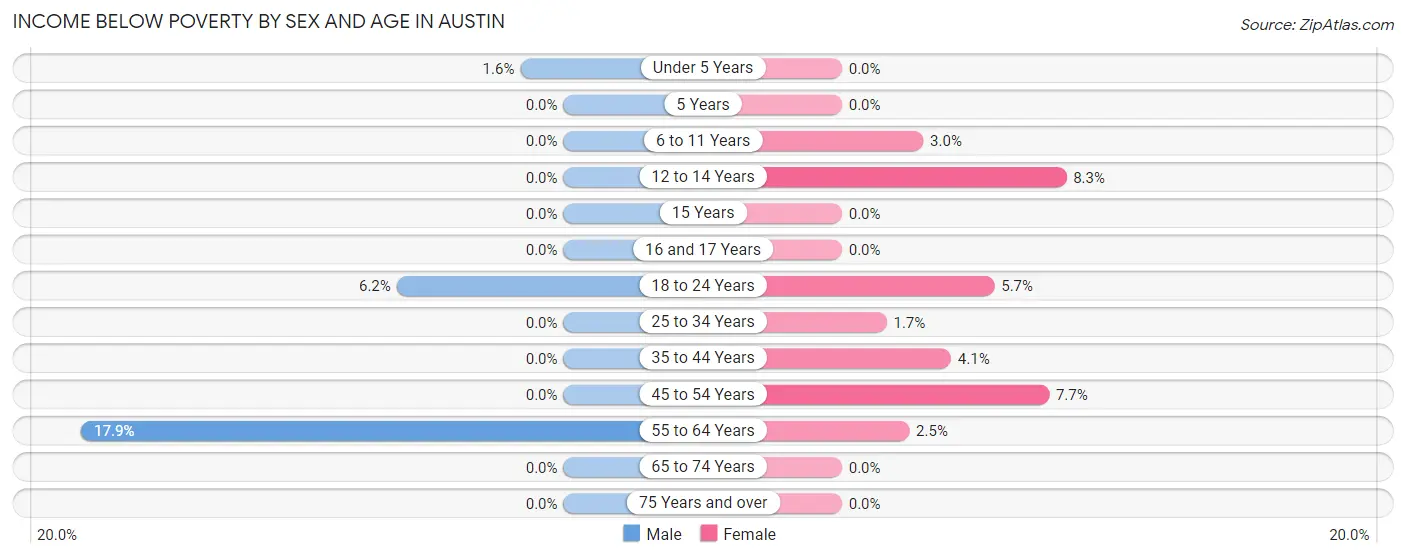
| Age Bracket | Male | Female |
| Under 5 Years | 5 (1.6%) | 0 (0.0%) |
| 5 Years | 0 (0.0%) | 0 (0.0%) |
| 6 to 11 Years | 0 (0.0%) | 8 (3.0%) |
| 12 to 14 Years | 0 (0.0%) | 7 (8.3%) |
| 15 Years | 0 (0.0%) | 0 (0.0%) |
| 16 and 17 Years | 0 (0.0%) | 0 (0.0%) |
| 18 to 24 Years | 6 (6.2%) | 6 (5.7%) |
| 25 to 34 Years | 0 (0.0%) | 6 (1.7%) |
| 35 to 44 Years | 0 (0.0%) | 16 (4.1%) |
| 45 to 54 Years | 0 (0.0%) | 11 (7.7%) |
| 55 to 64 Years | 29 (17.9%) | 5 (2.5%) |
| 65 to 74 Years | 0 (0.0%) | 0 (0.0%) |
| 75 Years and over | 0 (0.0%) | 0 (0.0%) |
| Total | 40 (2.2%) | 59 (3.2%) |
Income Above Poverty by Sex and Age in Austin
According to the poverty statistics in Austin, males aged 6 to 11 years and females aged under 5 years are the age groups that are most secure financially, with 100.0% of males and 100.0% of females in these age groups living above the poverty line.
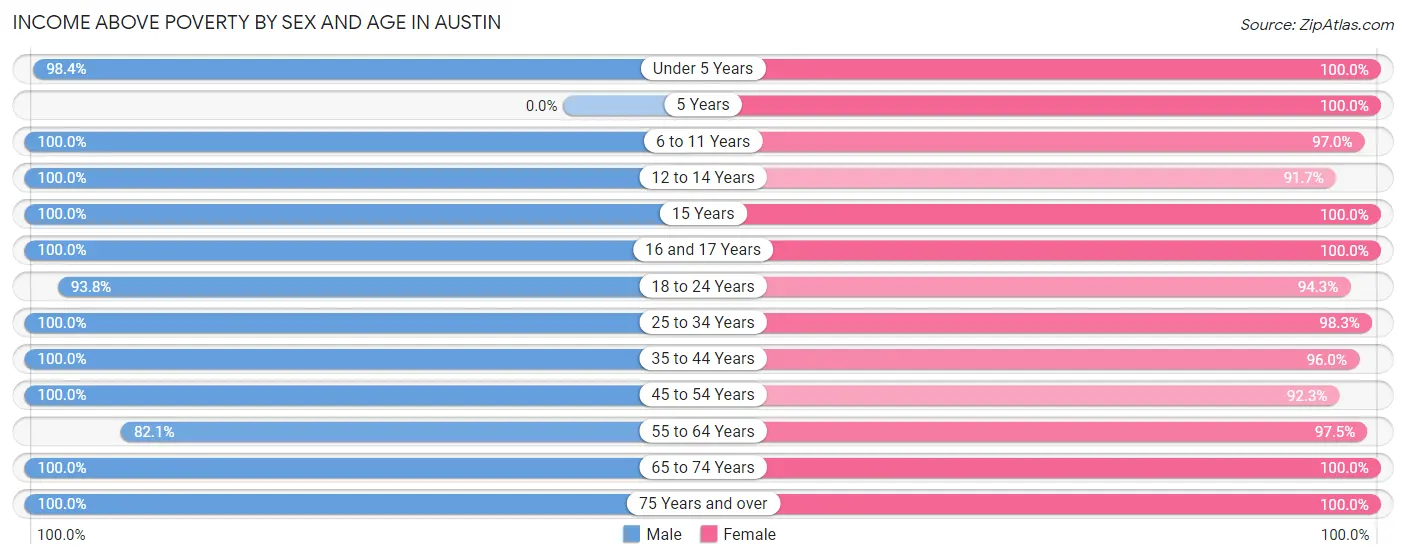
| Age Bracket | Male | Female |
| Under 5 Years | 308 (98.4%) | 95 (100.0%) |
| 5 Years | 0 (0.0%) | 66 (100.0%) |
| 6 to 11 Years | 122 (100.0%) | 257 (97.0%) |
| 12 to 14 Years | 109 (100.0%) | 77 (91.7%) |
| 15 Years | 8 (100.0%) | 6 (100.0%) |
| 16 and 17 Years | 18 (100.0%) | 68 (100.0%) |
| 18 to 24 Years | 91 (93.8%) | 100 (94.3%) |
| 25 to 34 Years | 427 (100.0%) | 355 (98.3%) |
| 35 to 44 Years | 312 (100.0%) | 379 (96.0%) |
| 45 to 54 Years | 173 (100.0%) | 132 (92.3%) |
| 55 to 64 Years | 133 (82.1%) | 195 (97.5%) |
| 65 to 74 Years | 38 (100.0%) | 43 (100.0%) |
| 75 Years and over | 16 (100.0%) | 32 (100.0%) |
| Total | 1,755 (97.8%) | 1,805 (96.8%) |
Income Below Poverty Among Married-Couple Families in Austin
The poverty statistics for married-couple families in Austin show that 0.8% or 7 of the total 899 families live below the poverty line. Families with no children have the highest poverty rate of 2.0%, comprising of 7 families. On the other hand, families with 1 or 2 children have the lowest poverty rate of 0.0%, which includes 0 families.
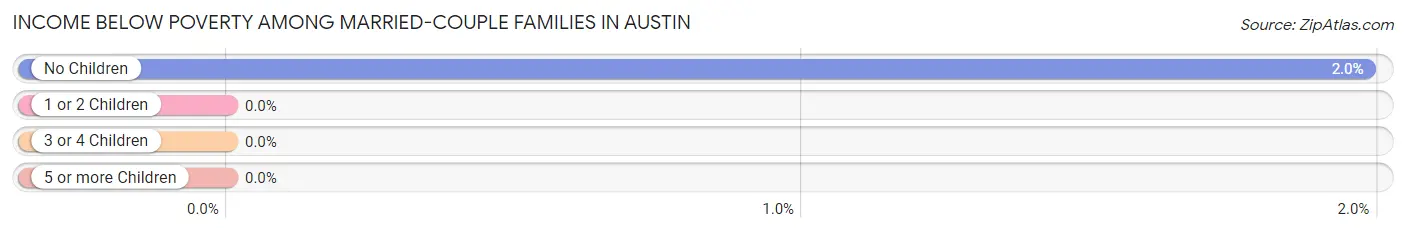
| Children | Above Poverty | Below Poverty |
| No Children | 347 (98.0%) | 7 (2.0%) |
| 1 or 2 Children | 431 (100.0%) | 0 (0.0%) |
| 3 or 4 Children | 114 (100.0%) | 0 (0.0%) |
| 5 or more Children | 0 (0.0%) | 0 (0.0%) |
| Total | 892 (99.2%) | 7 (0.8%) |
Income Below Poverty Among Single-Parent Households in Austin
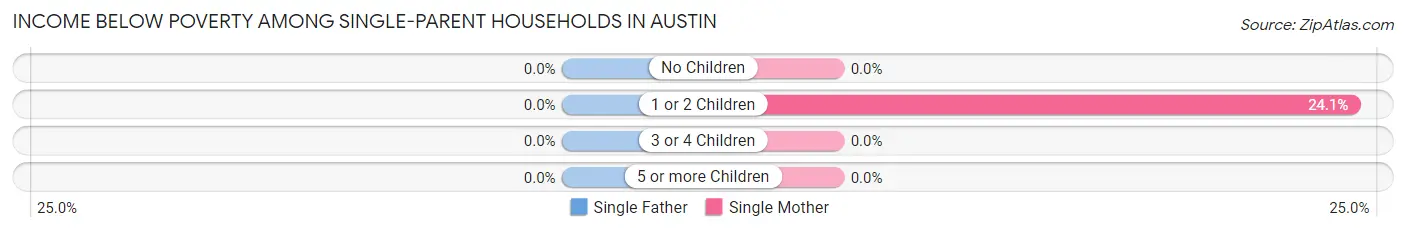
| Children | Single Father | Single Mother |
| No Children | 0 (0.0%) | 0 (0.0%) |
| 1 or 2 Children | 0 (0.0%) | 19 (24.0%) |
| 3 or 4 Children | 0 (0.0%) | 0 (0.0%) |
| 5 or more Children | 0 (0.0%) | 0 (0.0%) |
| Total | 0 (0.0%) | 19 (15.6%) |
Income Below Poverty Among Married-Couple vs Single-Parent Households in Austin
The poverty data for Austin shows that 7 of the married-couple family households (0.8%) and 19 of the single-parent households (11.7%) are living below the poverty level. Within the married-couple family households, those with no children have the highest poverty rate, with 7 households (2.0%) falling below the poverty line. Among the single-parent households, those with 1 or 2 children have the highest poverty rate, with 19 household (17.1%) living below poverty.
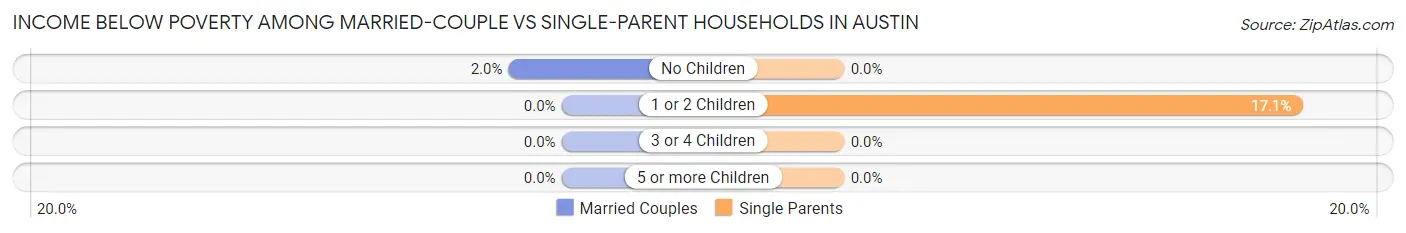
| Children | Married-Couple Families | Single-Parent Households |
| No Children | 7 (2.0%) | 0 (0.0%) |
| 1 or 2 Children | 0 (0.0%) | 19 (17.1%) |
| 3 or 4 Children | 0 (0.0%) | 0 (0.0%) |
| 5 or more Children | 0 (0.0%) | 0 (0.0%) |
| Total | 7 (0.8%) | 19 (11.7%) |
Race in Austin
The most populous races in Austin are White / Caucasian (3,327 | 90.9%), Hispanic or Latino (379 | 10.4%), and Asian (118 | 3.2%).
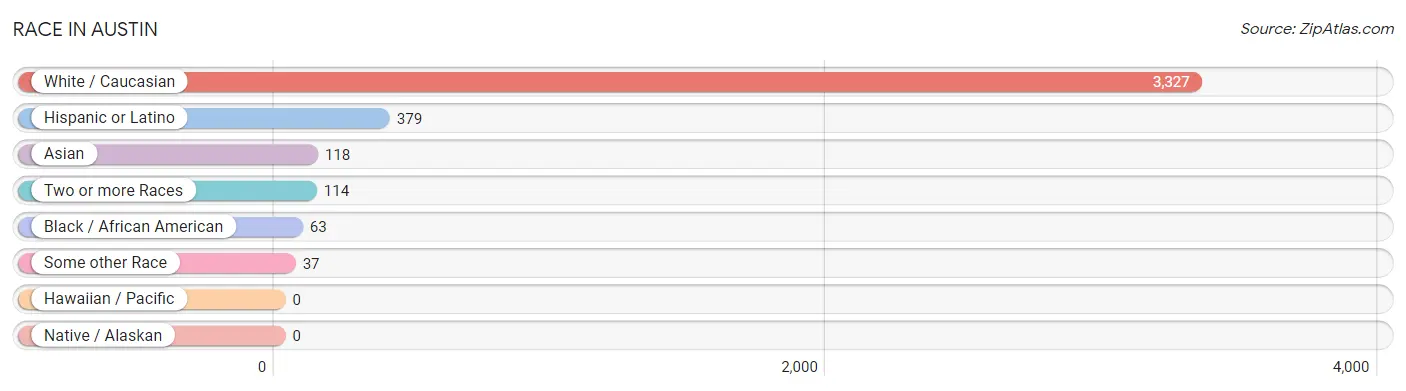
| Race | # Population | % Population |
| Asian | 118 | 3.2% |
| Black / African American | 63 | 1.7% |
| Hawaiian / Pacific | 0 | 0.0% |
| Hispanic or Latino | 379 | 10.4% |
| Native / Alaskan | 0 | 0.0% |
| White / Caucasian | 3,327 | 90.9% |
| Two or more Races | 114 | 3.1% |
| Some other Race | 37 | 1.0% |
| Total | 3,659 | 100.0% |
Ancestry in Austin
The most populous ancestries reported in Austin are English (744 | 20.3%), German (626 | 17.1%), American (428 | 11.7%), Irish (385 | 10.5%), and Mexican (286 | 7.8%), together accounting for 67.5% of all Austin residents.
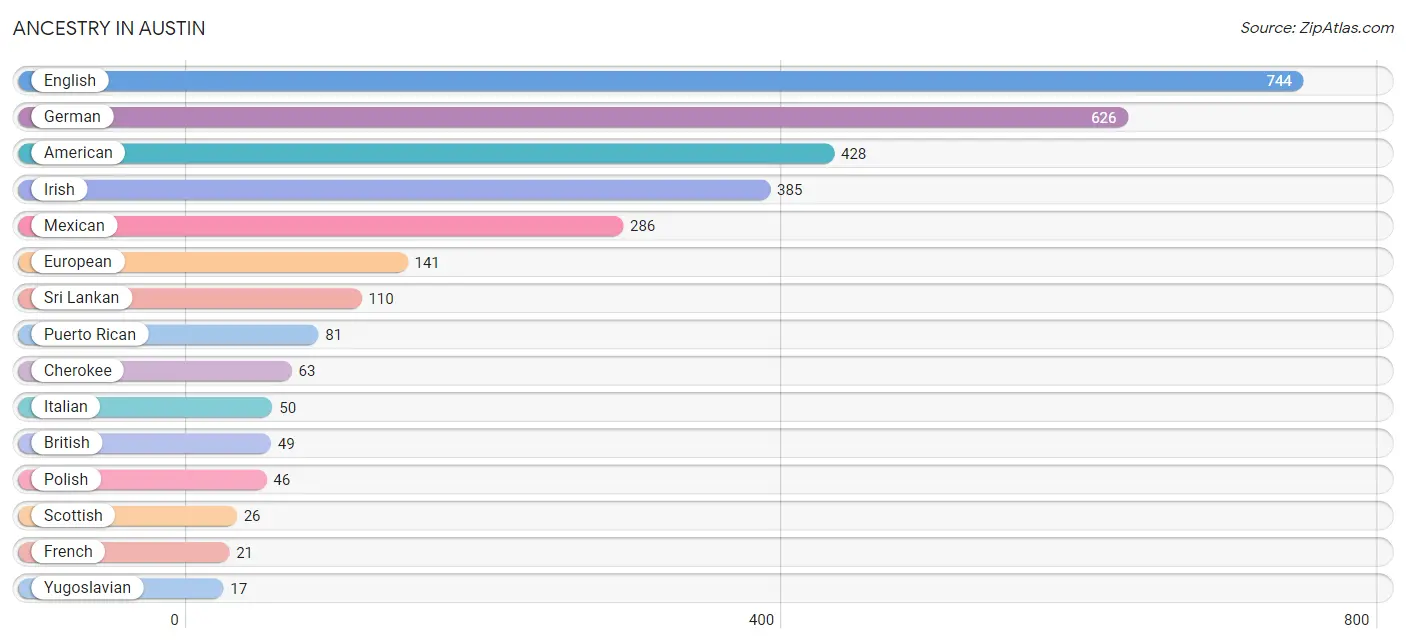
| Ancestry | # Population | % Population |
| American | 428 | 11.7% |
| Bhutanese | 8 | 0.2% |
| British | 49 | 1.3% |
| Cherokee | 63 | 1.7% |
| Czechoslovakian | 3 | 0.1% |
| English | 744 | 20.3% |
| European | 141 | 3.8% |
| French | 21 | 0.6% |
| French Canadian | 3 | 0.1% |
| German | 626 | 17.1% |
| Greek | 5 | 0.1% |
| Hungarian | 7 | 0.2% |
| Irish | 385 | 10.5% |
| Italian | 50 | 1.4% |
| Lithuanian | 8 | 0.2% |
| Mexican | 286 | 7.8% |
| Norwegian | 8 | 0.2% |
| Polish | 46 | 1.3% |
| Puerto Rican | 81 | 2.2% |
| Scottish | 26 | 0.7% |
| Sri Lankan | 110 | 3.0% |
| Welsh | 8 | 0.2% |
| Yugoslavian | 17 | 0.5% | View All 23 Rows |
Immigrants in Austin
The most numerous immigrant groups reported in Austin came from Asia (78 | 2.1%), South Eastern Asia (67 | 1.8%), Vietnam (67 | 1.8%), Europe (43 | 1.2%), and Northern Europe (43 | 1.2%), together accounting for 8.2% of all Austin residents.
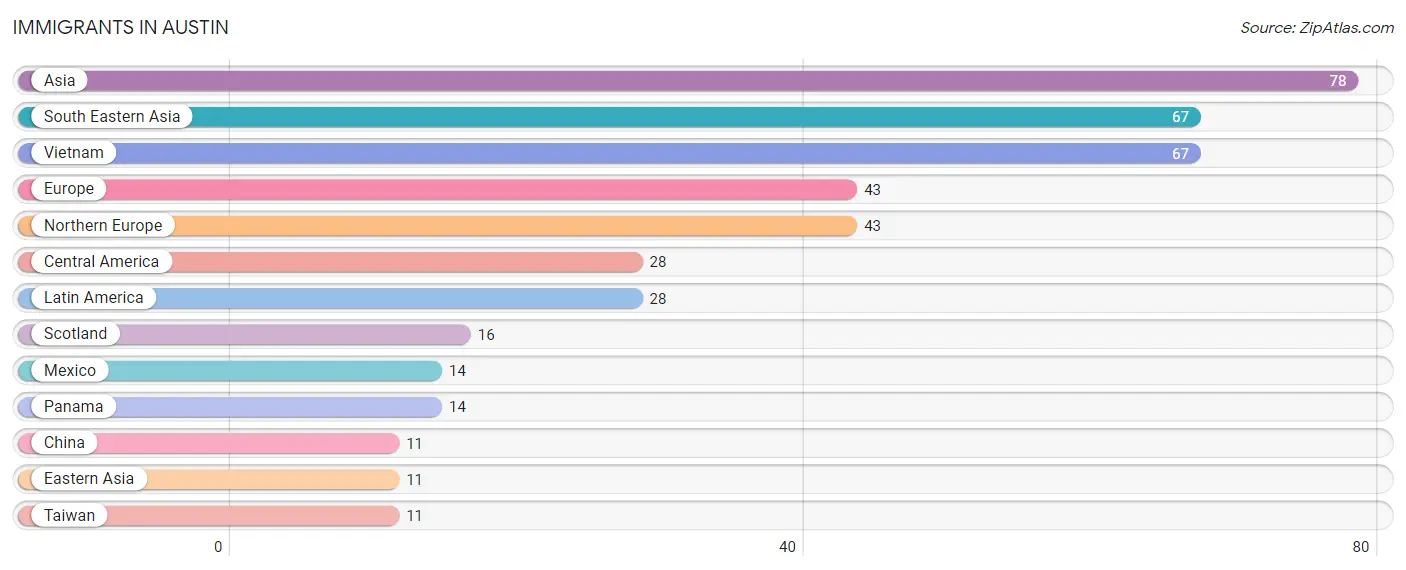
| Immigration Origin | # Population | % Population |
| Asia | 78 | 2.1% |
| Central America | 28 | 0.8% |
| China | 11 | 0.3% |
| Eastern Asia | 11 | 0.3% |
| Europe | 43 | 1.2% |
| Latin America | 28 | 0.8% |
| Mexico | 14 | 0.4% |
| Northern Europe | 43 | 1.2% |
| Panama | 14 | 0.4% |
| Scotland | 16 | 0.4% |
| South Eastern Asia | 67 | 1.8% |
| Taiwan | 11 | 0.3% |
| Vietnam | 67 | 1.8% | View All 13 Rows |
Sex and Age in Austin
Sex and Age in Austin
The most populous age groups in Austin are Under 5 Years (313 | 17.4%) for men and 35 to 39 Years (227 | 12.2%) for women.
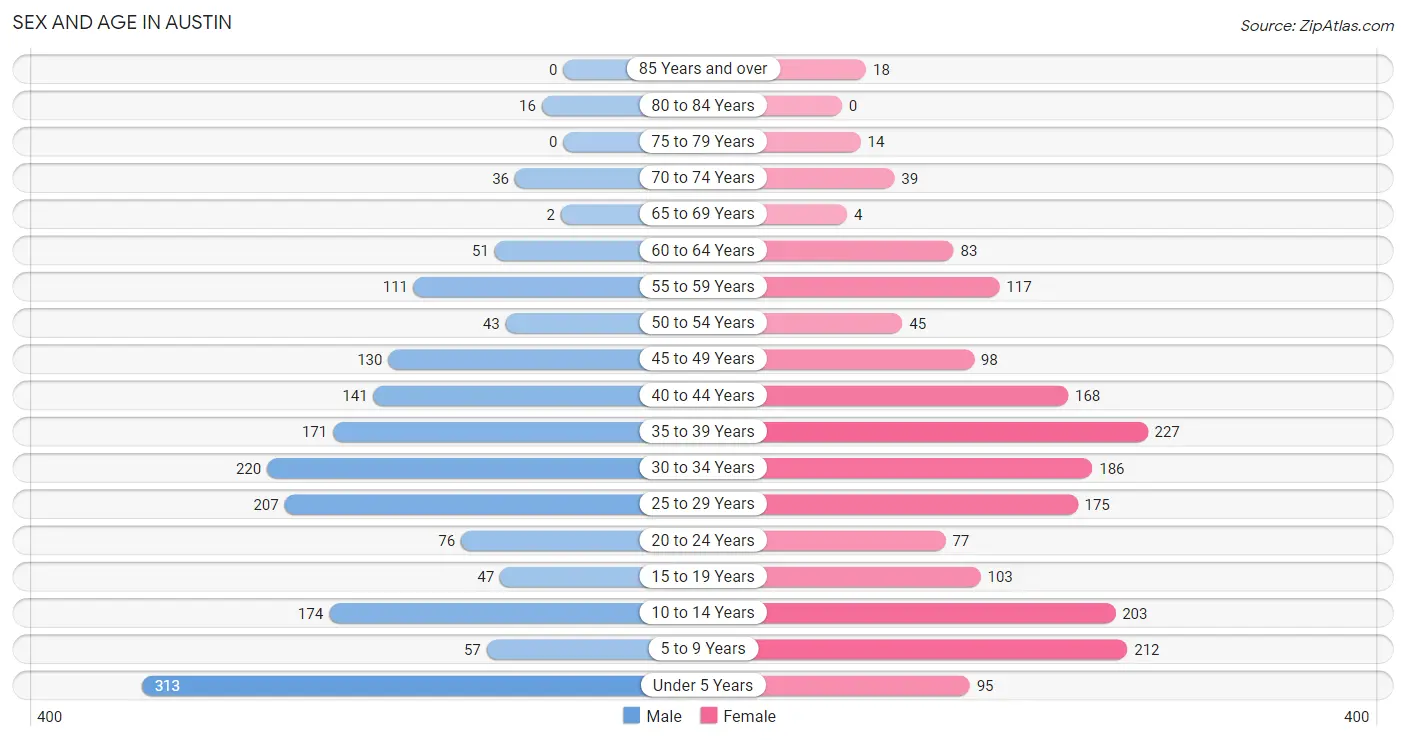
| Age Bracket | Male | Female |
| Under 5 Years | 313 (17.4%) | 95 (5.1%) |
| 5 to 9 Years | 57 (3.2%) | 212 (11.4%) |
| 10 to 14 Years | 174 (9.7%) | 203 (10.9%) |
| 15 to 19 Years | 47 (2.6%) | 103 (5.5%) |
| 20 to 24 Years | 76 (4.2%) | 77 (4.1%) |
| 25 to 29 Years | 207 (11.5%) | 175 (9.4%) |
| 30 to 34 Years | 220 (12.3%) | 186 (10.0%) |
| 35 to 39 Years | 171 (9.5%) | 227 (12.2%) |
| 40 to 44 Years | 141 (7.9%) | 168 (9.0%) |
| 45 to 49 Years | 130 (7.2%) | 98 (5.3%) |
| 50 to 54 Years | 43 (2.4%) | 45 (2.4%) |
| 55 to 59 Years | 111 (6.2%) | 117 (6.3%) |
| 60 to 64 Years | 51 (2.8%) | 83 (4.4%) |
| 65 to 69 Years | 2 (0.1%) | 4 (0.2%) |
| 70 to 74 Years | 36 (2.0%) | 39 (2.1%) |
| 75 to 79 Years | 0 (0.0%) | 14 (0.7%) |
| 80 to 84 Years | 16 (0.9%) | 0 (0.0%) |
| 85 Years and over | 0 (0.0%) | 18 (1.0%) |
| Total | 1,795 (100.0%) | 1,864 (100.0%) |
Families and Households in Austin
Median Family Size in Austin
The median family size in Austin is 3.12 persons per family, with single male/father families (40 | 3.8%) accounting for the largest median family size of 3.33 persons per family. On the other hand, single female/mother families (122 | 11.5%) represent the smallest median family size with 2.37 persons per family.
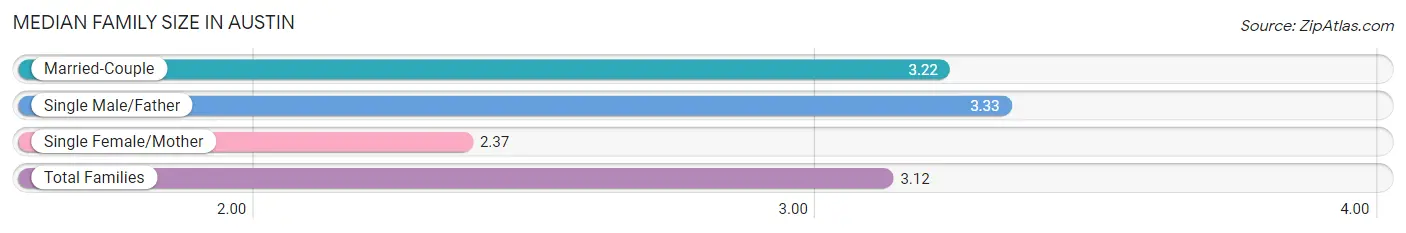
| Family Type | # Families | Family Size |
| Married-Couple | 899 (84.7%) | 3.22 |
| Single Male/Father | 40 (3.8%) | 3.33 |
| Single Female/Mother | 122 (11.5%) | 2.37 |
| Total Families | 1,061 (100.0%) | 3.12 |
Median Household Size in Austin
The median household size in Austin is 2.69 persons per household, with single male/father households (40 | 2.9%) accounting for the largest median household size of 3.5 persons per household. non-family households (299 | 22.0%) represent the smallest median household size with 1.13 persons per household.
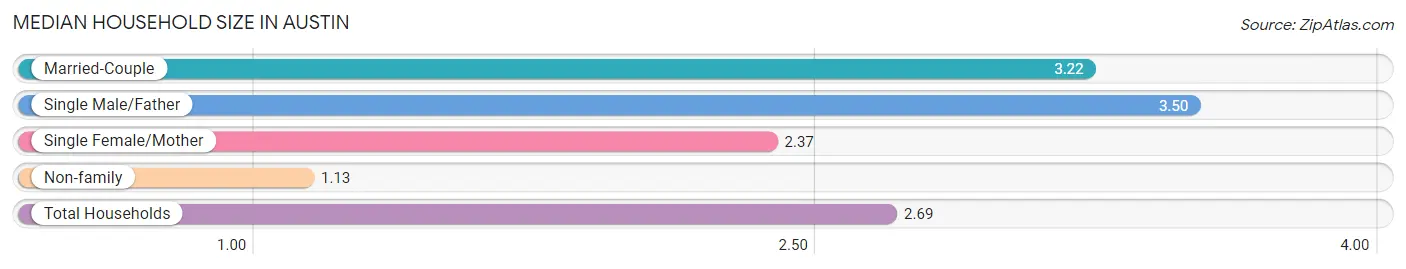
| Household Type | # Households | Household Size |
| Married-Couple | 899 (66.1%) | 3.22 |
| Single Male/Father | 40 (2.9%) | 3.50 |
| Single Female/Mother | 122 (9.0%) | 2.37 |
| Non-family | 299 (22.0%) | 1.13 |
| Total Households | 1,360 (100.0%) | 2.69 |
Household Size by Marriage Status in Austin
Out of a total of 1,360 households in Austin, 1,061 (78.0%) are family households, while 299 (22.0%) are nonfamily households. The most numerous type of family households are 2-person households, comprising 395, and the most common type of nonfamily households are 1-person households, comprising 254.
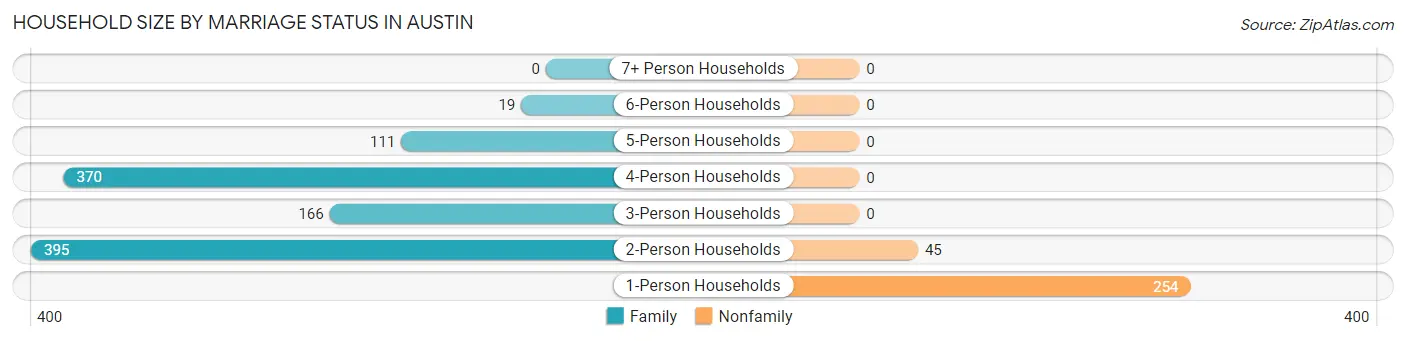
| Household Size | Family Households | Nonfamily Households |
| 1-Person Households | - | 254 (18.7%) |
| 2-Person Households | 395 (29.0%) | 45 (3.3%) |
| 3-Person Households | 166 (12.2%) | 0 (0.0%) |
| 4-Person Households | 370 (27.2%) | 0 (0.0%) |
| 5-Person Households | 111 (8.2%) | 0 (0.0%) |
| 6-Person Households | 19 (1.4%) | 0 (0.0%) |
| 7+ Person Households | 0 (0.0%) | 0 (0.0%) |
| Total | 1,061 (78.0%) | 299 (22.0%) |
Female Fertility in Austin
Fertility by Age in Austin
Average fertility rate in Austin is 81.0 births per 1,000 women. Women in the age bracket of 35 to 50 years have the highest fertility rate with 92.0 births per 1,000 women. Women in the age bracket of 35 to 50 years acount for 54.8% of all women with births.
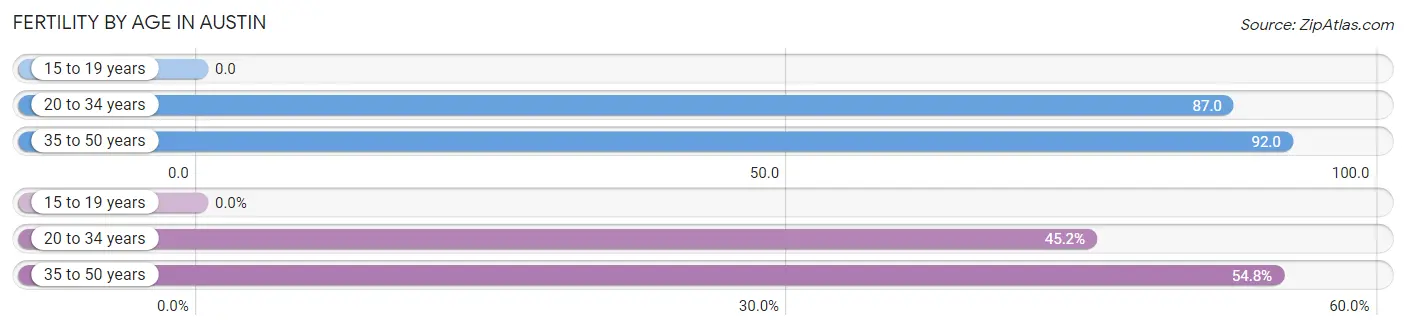
| Age Bracket | Women with Births | Births / 1,000 Women |
| 15 to 19 years | 0 (0.0%) | 0.0 |
| 20 to 34 years | 38 (45.2%) | 87.0 |
| 35 to 50 years | 46 (54.8%) | 92.0 |
| Total | 84 (100.0%) | 81.0 |
Fertility by Age by Marriage Status in Austin
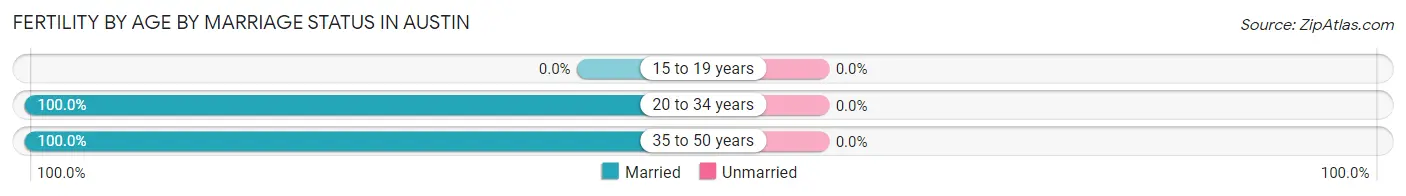
| Age Bracket | Married | Unmarried |
| 15 to 19 years | 0 (0.0%) | 0 (0.0%) |
| 20 to 34 years | 38 (100.0%) | 0 (0.0%) |
| 35 to 50 years | 46 (100.0%) | 0 (0.0%) |
| Total | 84 (100.0%) | 0 (0.0%) |
Fertility by Education in Austin
Average fertility rate in Austin is 81.0 births per 1,000 women. Women with the education attainment of less than high school have the highest fertility rate of 159.0 births per 1,000 women, while women with the education attainment of college or associate's degree have the lowest fertility at 34.0 births per 1,000 women. Women with the education attainment of bachelor's degree represent 32.1% of all women with births.
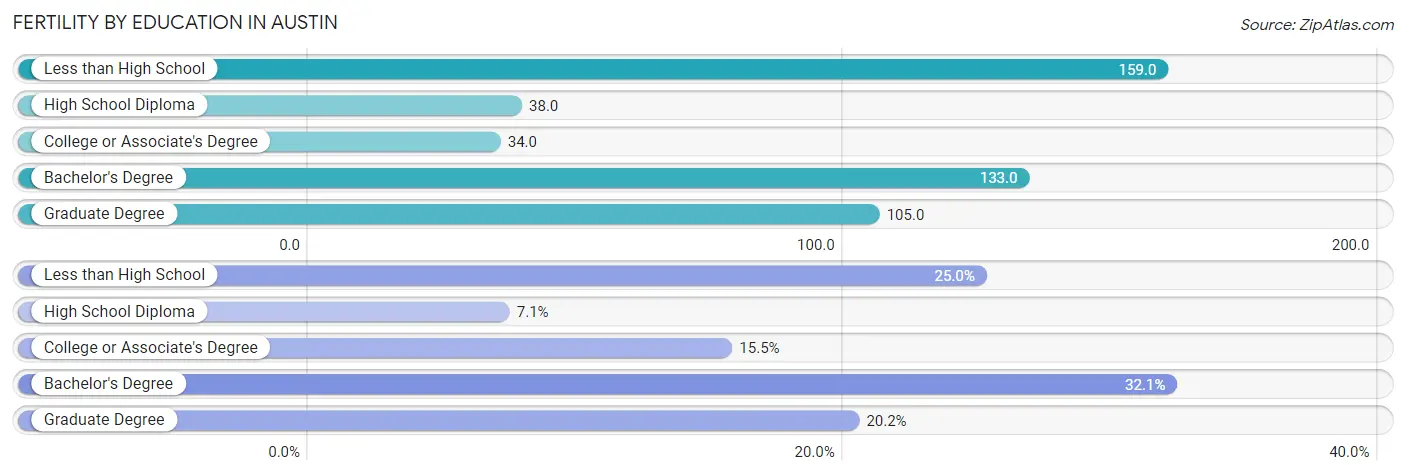
| Educational Attainment | Women with Births | Births / 1,000 Women |
| Less than High School | 21 (25.0%) | 159.0 |
| High School Diploma | 6 (7.1%) | 38.0 |
| College or Associate's Degree | 13 (15.5%) | 34.0 |
| Bachelor's Degree | 27 (32.1%) | 133.0 |
| Graduate Degree | 17 (20.2%) | 105.0 |
| Total | 84 (100.0%) | 81.0 |
Fertility by Education by Marriage Status in Austin
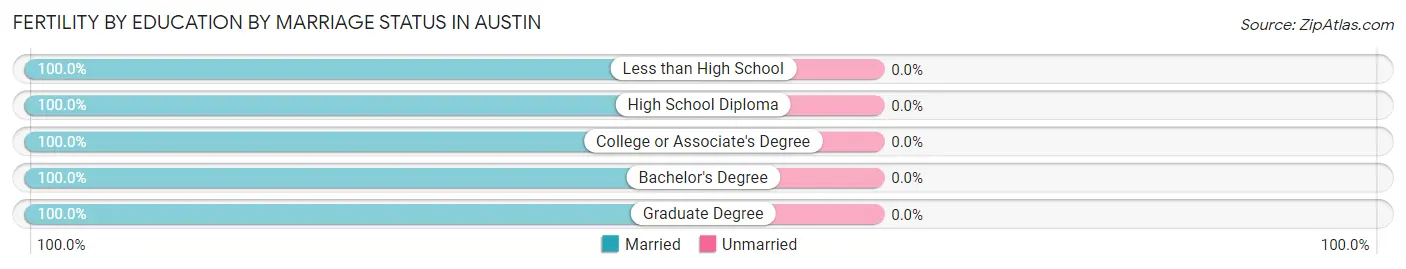
| Educational Attainment | Married | Unmarried |
| Less than High School | 21 (100.0%) | 0 (0.0%) |
| High School Diploma | 6 (100.0%) | 0 (0.0%) |
| College or Associate's Degree | 13 (100.0%) | 0 (0.0%) |
| Bachelor's Degree | 27 (100.0%) | 0 (0.0%) |
| Graduate Degree | 17 (100.0%) | 0 (0.0%) |
| Total | 84 (100.0%) | 0 (0.0%) |
Employment Characteristics in Austin
Employment by Class of Employer in Austin
Among the 1,971 employed individuals in Austin, private company employees (980 | 49.7%), federal government employees (403 | 20.4%), and local government employees (204 | 10.3%) make up the most common classes of employment.
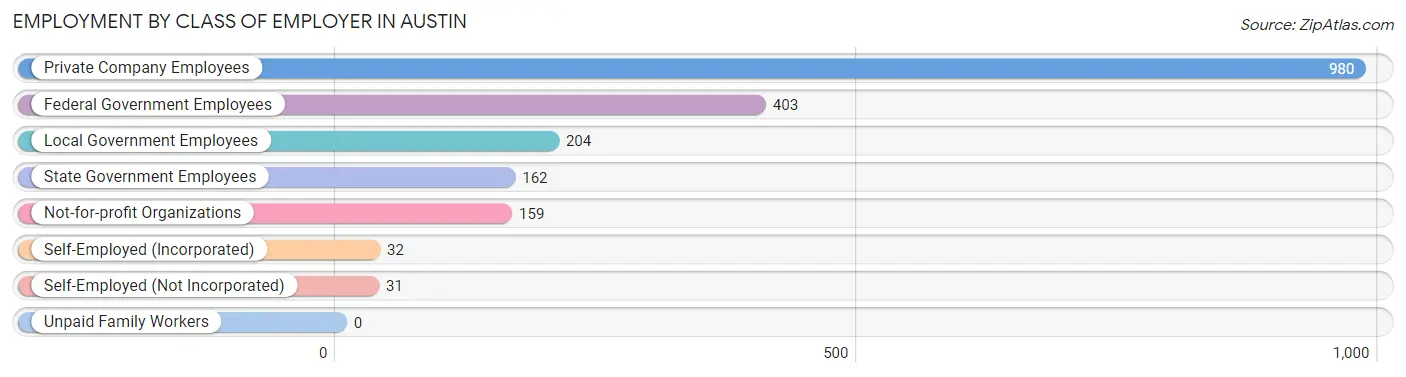
| Employer Class | # Employees | % Employees |
| Private Company Employees | 980 | 49.7% |
| Self-Employed (Incorporated) | 32 | 1.6% |
| Self-Employed (Not Incorporated) | 31 | 1.6% |
| Not-for-profit Organizations | 159 | 8.1% |
| Local Government Employees | 204 | 10.3% |
| State Government Employees | 162 | 8.2% |
| Federal Government Employees | 403 | 20.4% |
| Unpaid Family Workers | 0 | 0.0% |
| Total | 1,971 | 100.0% |
Employment Status by Age in Austin
According to the labor force statistics for Austin, out of the total population over 16 years of age (2,591), 77.6% or 2,011 individuals are in the labor force, with 2.2% or 44 of them unemployed. The age group with the highest labor force participation rate is 30 to 34 years, with 97.5% or 396 individuals in the labor force. Within the labor force, the 16 to 19 years age range has the highest percentage of unemployed individuals, with 64.3% or 27 of them being unemployed.
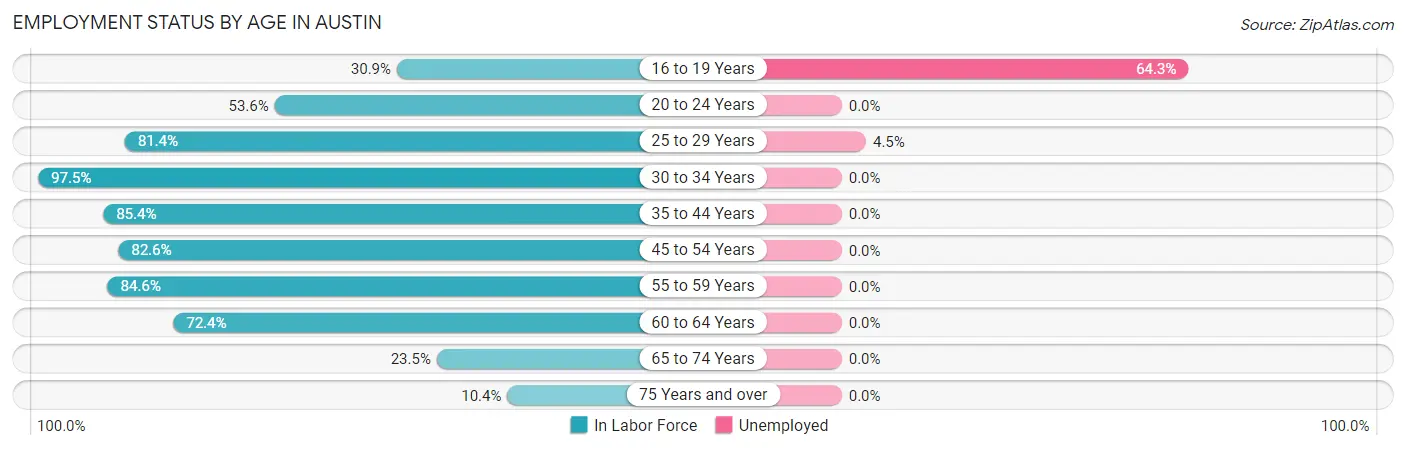
| Age Bracket | In Labor Force | Unemployed |
| 16 to 19 Years | 42 (30.9%) | 27 (64.3%) |
| 20 to 24 Years | 82 (53.6%) | 0 (0.0%) |
| 25 to 29 Years | 311 (81.4%) | 14 (4.5%) |
| 30 to 34 Years | 396 (97.5%) | 0 (0.0%) |
| 35 to 44 Years | 604 (85.4%) | 0 (0.0%) |
| 45 to 54 Years | 261 (82.6%) | 0 (0.0%) |
| 55 to 59 Years | 193 (84.6%) | 0 (0.0%) |
| 60 to 64 Years | 97 (72.4%) | 0 (0.0%) |
| 65 to 74 Years | 19 (23.5%) | 0 (0.0%) |
| 75 Years and over | 5 (10.4%) | 0 (0.0%) |
| Total | 2,011 (77.6%) | 44 (2.2%) |
Employment Status by Educational Attainment in Austin
According to labor force statistics for Austin, 85.7% of individuals (1,862) out of the total population between 25 and 64 years of age (2,173) are in the labor force, with 0.7% or 13 of them being unemployed. The group with the highest labor force participation rate are those with the educational attainment of college / associate degree, with 89.1% or 706 individuals in the labor force. Within the labor force, individuals with college / associate degree education have the highest percentage of unemployment, with 1.2% or 8 of them being unemployed.
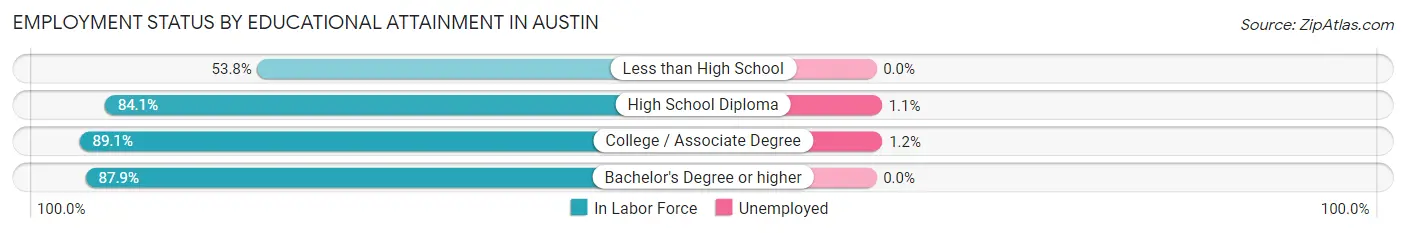
| Educational Attainment | In Labor Force | Unemployed |
| Less than High School | 63 (53.8%) | 0 (0.0%) |
| High School Diploma | 408 (84.1%) | 5 (1.1%) |
| College / Associate Degree | 706 (89.1%) | 10 (1.2%) |
| Bachelor's Degree or higher | 685 (87.9%) | 0 (0.0%) |
| Total | 1,862 (85.7%) | 15 (0.7%) |
Employment Occupations by Sex in Austin
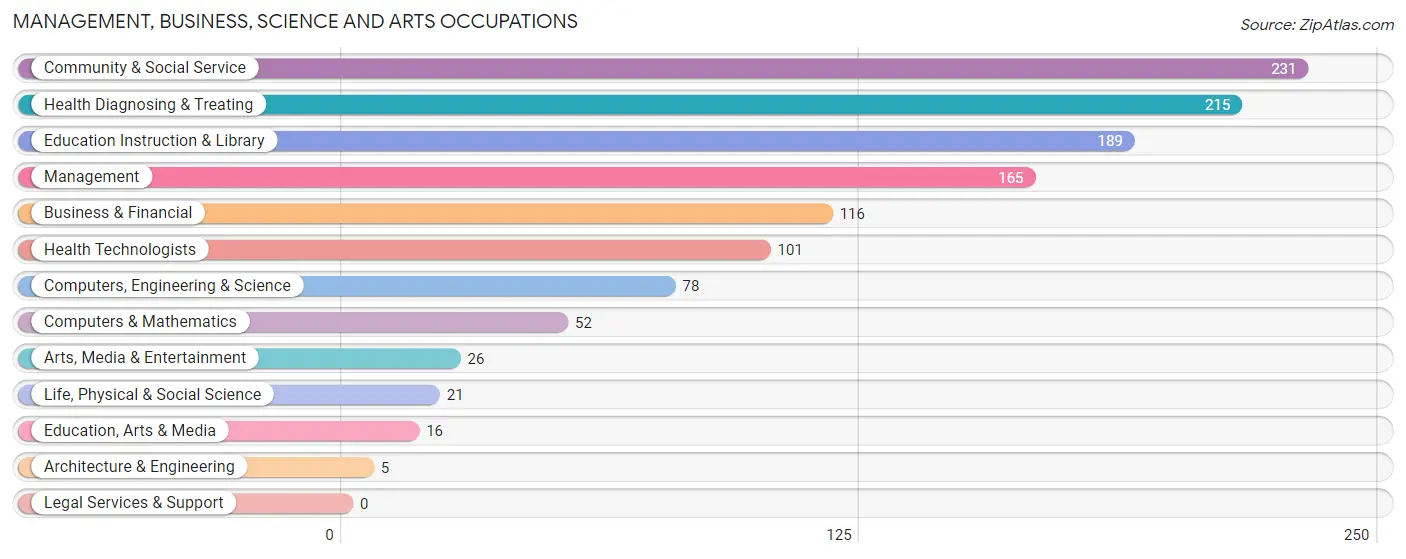
Management, Business, Science and Arts Occupations
The most common Management, Business, Science and Arts occupations in Austin are Community & Social Service (231 | 13.1%), Health Diagnosing & Treating (215 | 12.2%), Education Instruction & Library (189 | 10.7%), Management (165 | 9.3%), and Business & Financial (116 | 6.6%).
Management, Business, Science and Arts Occupations by Sex
Within the Management, Business, Science and Arts occupations in Austin, the most male-oriented occupations are Computers & Mathematics (100.0%), Architecture & Engineering (100.0%), and Computers, Engineering & Science (91.0%), while the most female-oriented occupations are Education, Arts & Media (100.0%), Health Technologists (100.0%), and Health Diagnosing & Treating (96.3%).
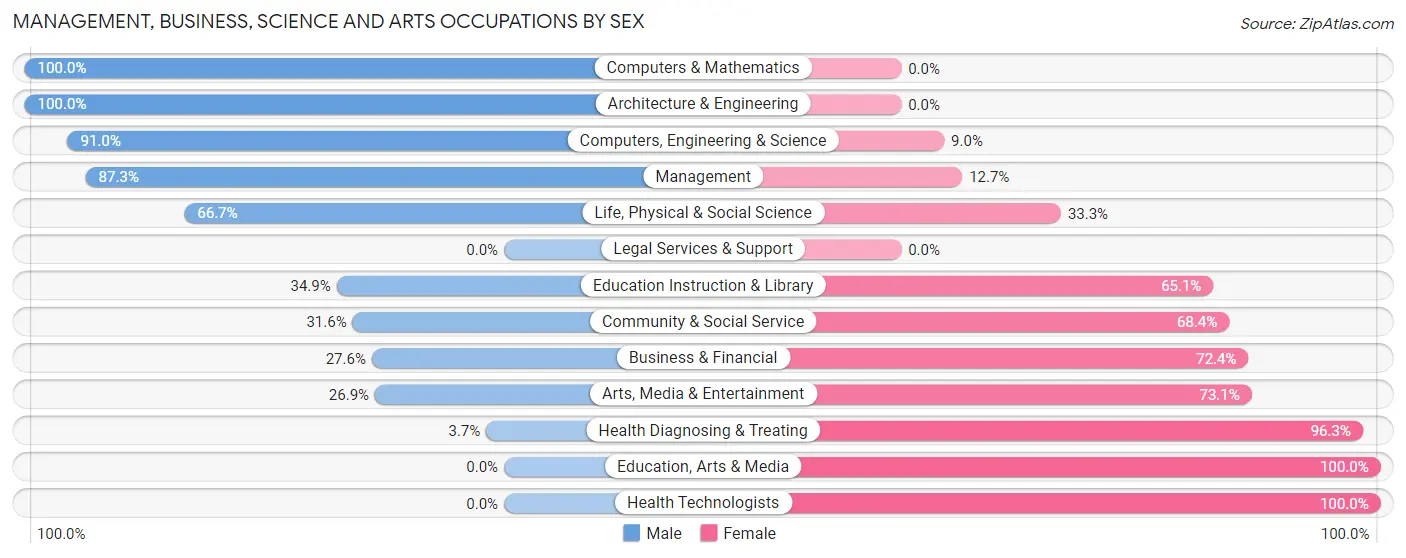
| Occupation | Male | Female |
| Management | 144 (87.3%) | 21 (12.7%) |
| Business & Financial | 32 (27.6%) | 84 (72.4%) |
| Computers, Engineering & Science | 71 (91.0%) | 7 (9.0%) |
| Computers & Mathematics | 52 (100.0%) | 0 (0.0%) |
| Architecture & Engineering | 5 (100.0%) | 0 (0.0%) |
| Life, Physical & Social Science | 14 (66.7%) | 7 (33.3%) |
| Community & Social Service | 73 (31.6%) | 158 (68.4%) |
| Education, Arts & Media | 0 (0.0%) | 16 (100.0%) |
| Legal Services & Support | 0 (0.0%) | 0 (0.0%) |
| Education Instruction & Library | 66 (34.9%) | 123 (65.1%) |
| Arts, Media & Entertainment | 7 (26.9%) | 19 (73.1%) |
| Health Diagnosing & Treating | 8 (3.7%) | 207 (96.3%) |
| Health Technologists | 0 (0.0%) | 101 (100.0%) |
| Total (Category) | 328 (40.7%) | 477 (59.3%) |
| Total (Overall) | 920 (52.1%) | 846 (47.9%) |
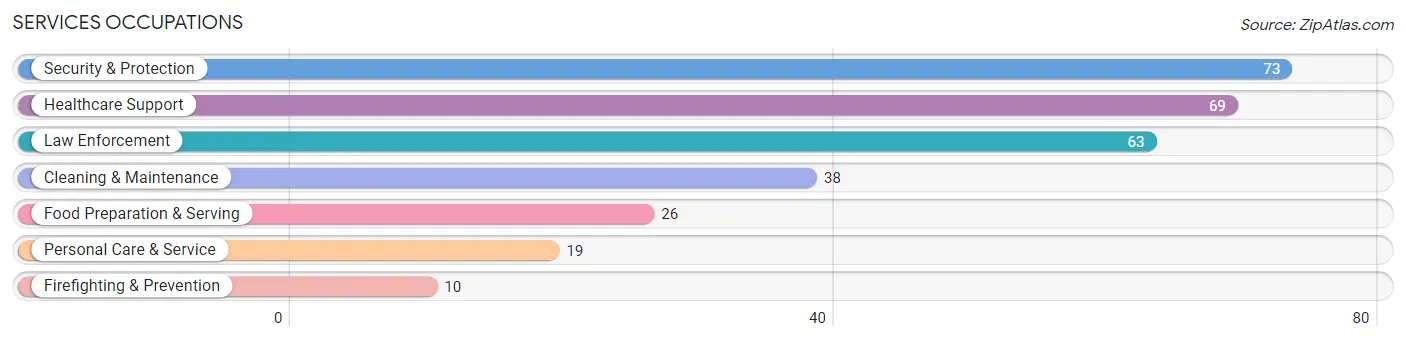
Services Occupations
The most common Services occupations in Austin are Security & Protection (73 | 4.1%), Healthcare Support (69 | 3.9%), Law Enforcement (63 | 3.6%), Cleaning & Maintenance (38 | 2.1%), and Food Preparation & Serving (26 | 1.5%).
Services Occupations by Sex
Within the Services occupations in Austin, the most male-oriented occupations are Firefighting & Prevention (100.0%), Cleaning & Maintenance (89.5%), and Security & Protection (86.3%), while the most female-oriented occupations are Healthcare Support (100.0%), Food Preparation & Serving (88.5%), and Personal Care & Service (36.8%).
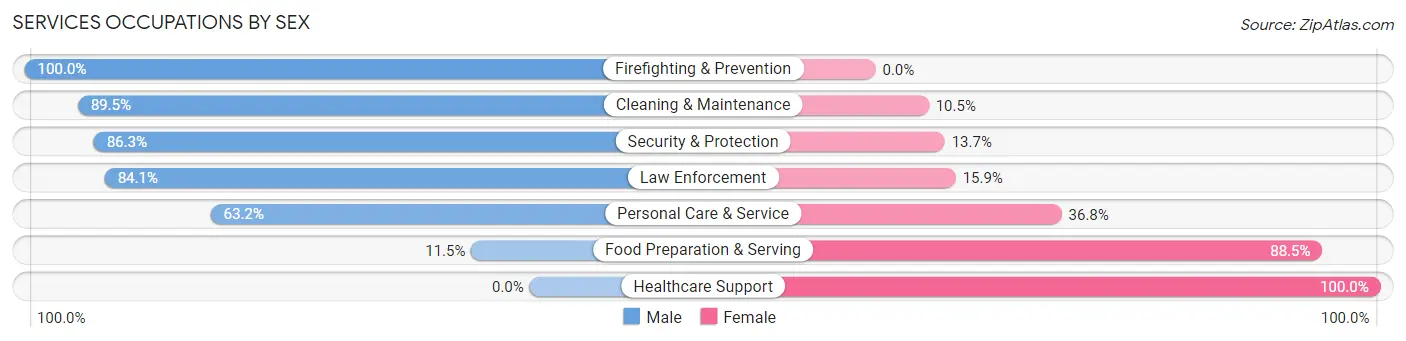
| Occupation | Male | Female |
| Healthcare Support | 0 (0.0%) | 69 (100.0%) |
| Security & Protection | 63 (86.3%) | 10 (13.7%) |
| Firefighting & Prevention | 10 (100.0%) | 0 (0.0%) |
| Law Enforcement | 53 (84.1%) | 10 (15.9%) |
| Food Preparation & Serving | 3 (11.5%) | 23 (88.5%) |
| Cleaning & Maintenance | 34 (89.5%) | 4 (10.5%) |
| Personal Care & Service | 12 (63.2%) | 7 (36.8%) |
| Total (Category) | 112 (49.8%) | 113 (50.2%) |
| Total (Overall) | 920 (52.1%) | 846 (47.9%) |
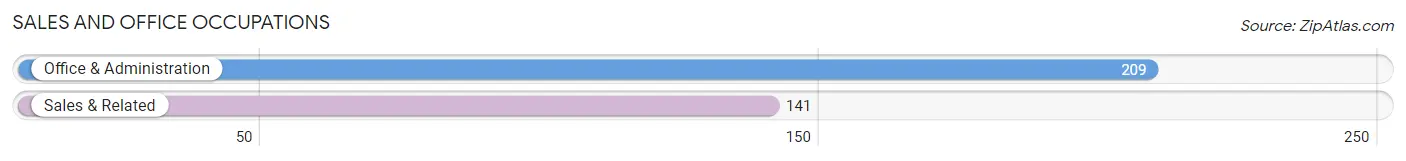
Sales and Office Occupations
The most common Sales and Office occupations in Austin are Office & Administration (209 | 11.8%), and Sales & Related (141 | 8.0%).
Sales and Office Occupations by Sex
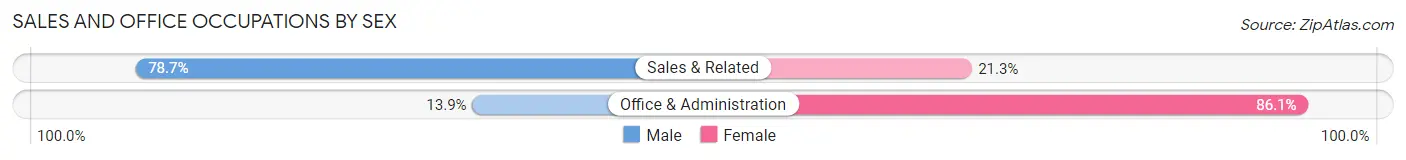
| Occupation | Male | Female |
| Sales & Related | 111 (78.7%) | 30 (21.3%) |
| Office & Administration | 29 (13.9%) | 180 (86.1%) |
| Total (Category) | 140 (40.0%) | 210 (60.0%) |
| Total (Overall) | 920 (52.1%) | 846 (47.9%) |
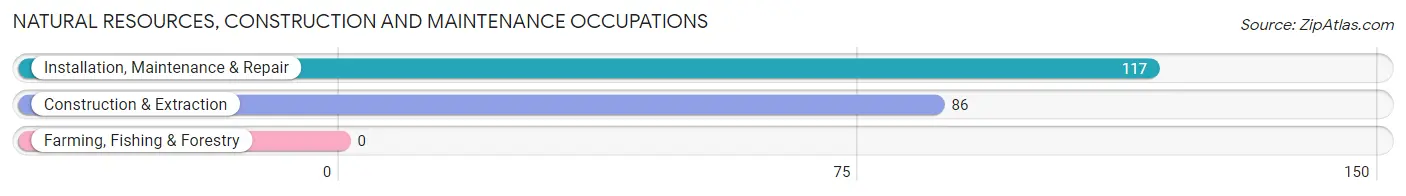
Natural Resources, Construction and Maintenance Occupations
The most common Natural Resources, Construction and Maintenance occupations in Austin are Installation, Maintenance & Repair (117 | 6.6%), and Construction & Extraction (86 | 4.9%).
Natural Resources, Construction and Maintenance Occupations by Sex
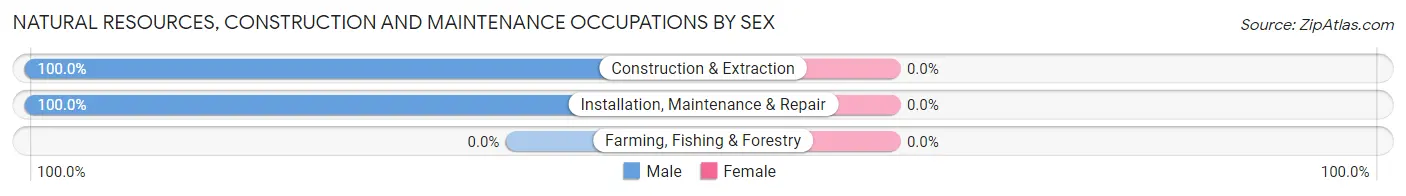
| Occupation | Male | Female |
| Farming, Fishing & Forestry | 0 (0.0%) | 0 (0.0%) |
| Construction & Extraction | 86 (100.0%) | 0 (0.0%) |
| Installation, Maintenance & Repair | 117 (100.0%) | 0 (0.0%) |
| Total (Category) | 203 (100.0%) | 0 (0.0%) |
| Total (Overall) | 920 (52.1%) | 846 (47.9%) |
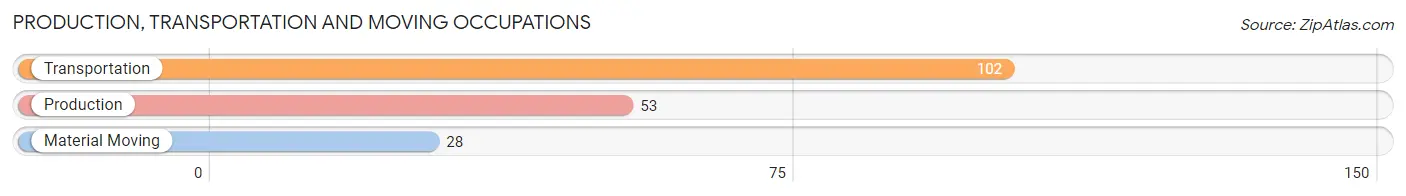
Production, Transportation and Moving Occupations
The most common Production, Transportation and Moving occupations in Austin are Transportation (102 | 5.8%), Production (53 | 3.0%), and Material Moving (28 | 1.6%).
Production, Transportation and Moving Occupations by Sex
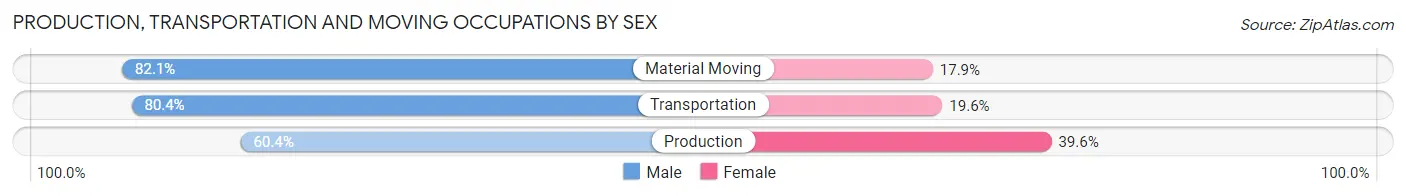
| Occupation | Male | Female |
| Production | 32 (60.4%) | 21 (39.6%) |
| Transportation | 82 (80.4%) | 20 (19.6%) |
| Material Moving | 23 (82.1%) | 5 (17.9%) |
| Total (Category) | 137 (74.9%) | 46 (25.1%) |
| Total (Overall) | 920 (52.1%) | 846 (47.9%) |
Employment Industries by Sex in Austin
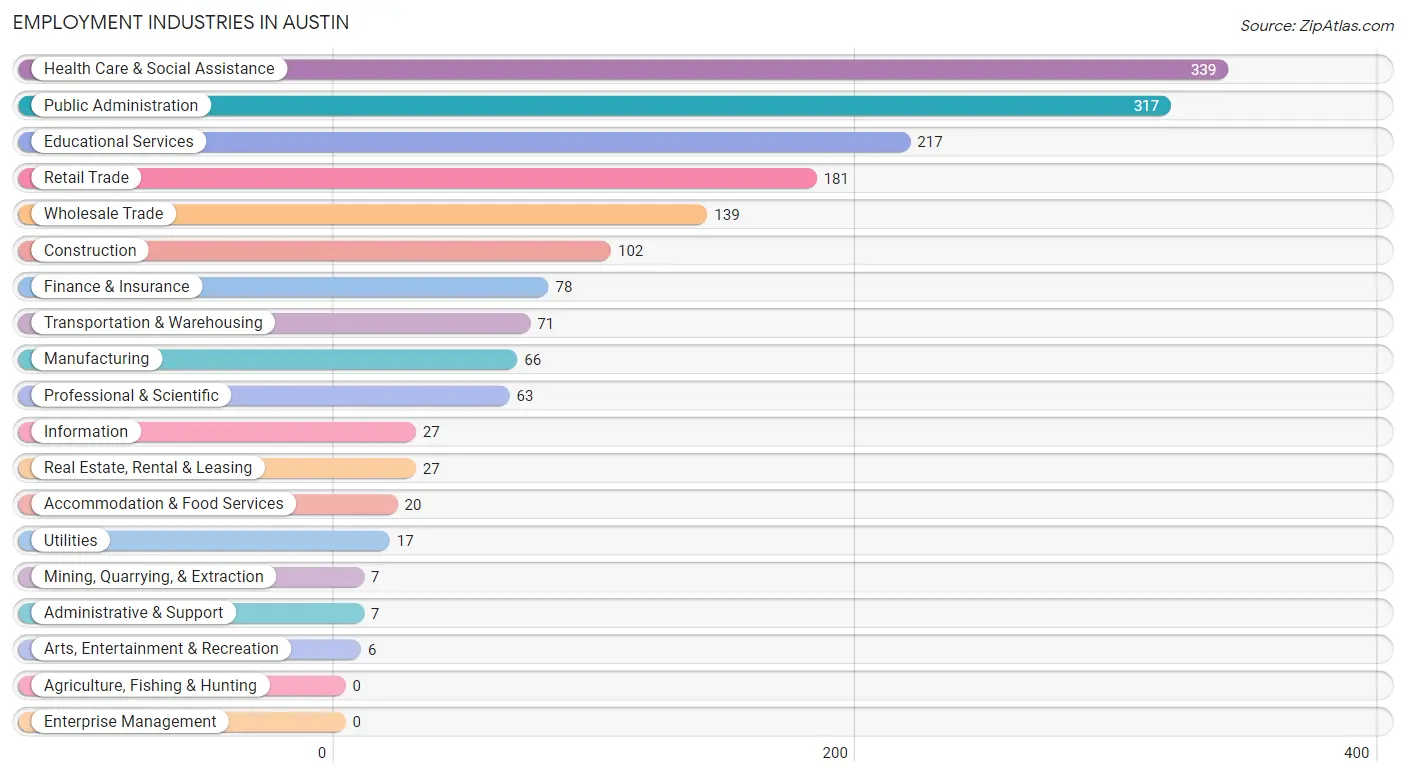
Employment Industries in Austin
The major employment industries in Austin include Health Care & Social Assistance (339 | 19.2%), Public Administration (317 | 17.9%), Educational Services (217 | 12.3%), Retail Trade (181 | 10.2%), and Wholesale Trade (139 | 7.9%).
Employment Industries by Sex in Austin
The Austin industries that see more men than women are Mining, Quarrying, & Extraction (100.0%), Utilities (100.0%), and Accommodation & Food Services (100.0%), whereas the industries that tend to have a higher number of women are Administrative & Support (100.0%), Health Care & Social Assistance (100.0%), and Arts, Entertainment & Recreation (100.0%).
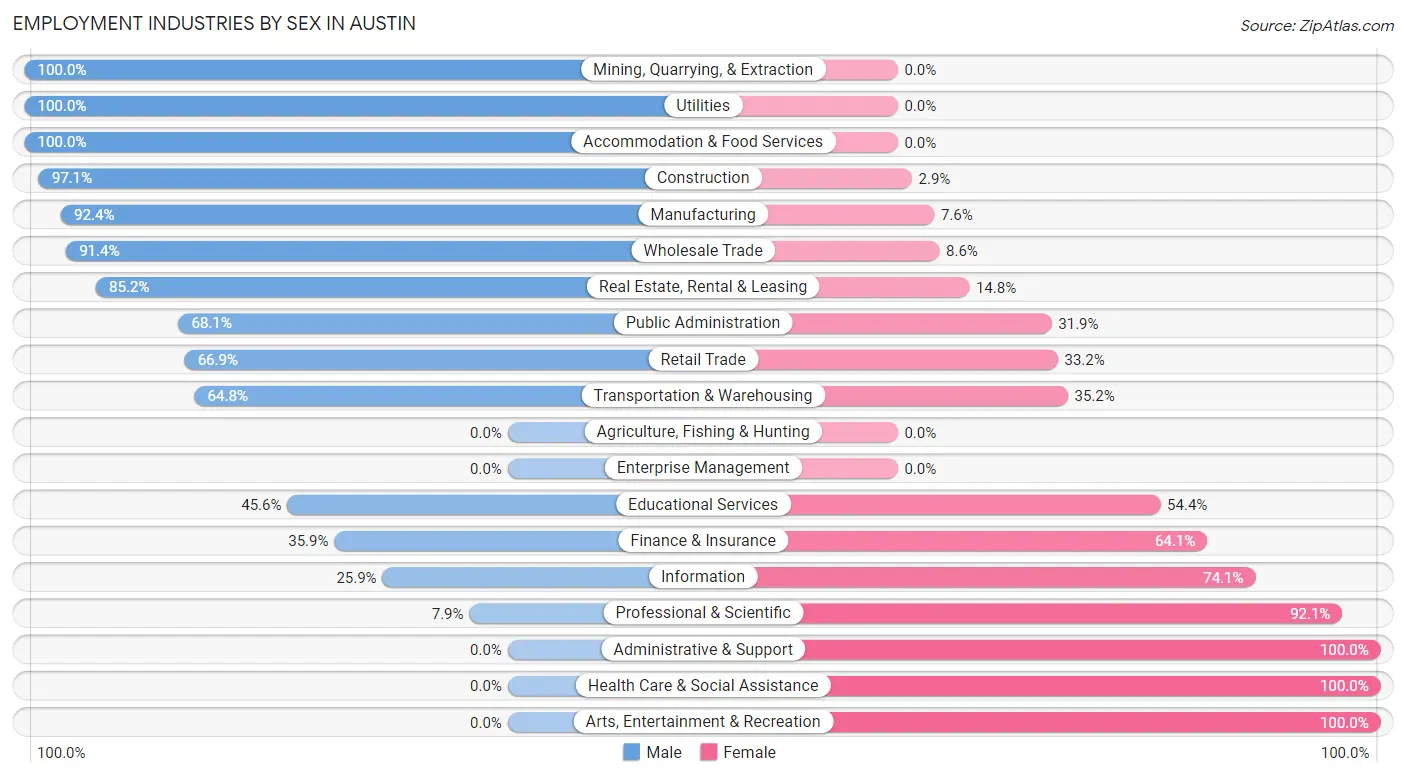
| Industry | Male | Female |
| Agriculture, Fishing & Hunting | 0 (0.0%) | 0 (0.0%) |
| Mining, Quarrying, & Extraction | 7 (100.0%) | 0 (0.0%) |
| Construction | 99 (97.1%) | 3 (2.9%) |
| Manufacturing | 61 (92.4%) | 5 (7.6%) |
| Wholesale Trade | 127 (91.4%) | 12 (8.6%) |
| Retail Trade | 121 (66.8%) | 60 (33.2%) |
| Transportation & Warehousing | 46 (64.8%) | 25 (35.2%) |
| Utilities | 17 (100.0%) | 0 (0.0%) |
| Information | 7 (25.9%) | 20 (74.1%) |
| Finance & Insurance | 28 (35.9%) | 50 (64.1%) |
| Real Estate, Rental & Leasing | 23 (85.2%) | 4 (14.8%) |
| Professional & Scientific | 5 (7.9%) | 58 (92.1%) |
| Enterprise Management | 0 (0.0%) | 0 (0.0%) |
| Administrative & Support | 0 (0.0%) | 7 (100.0%) |
| Educational Services | 99 (45.6%) | 118 (54.4%) |
| Health Care & Social Assistance | 0 (0.0%) | 339 (100.0%) |
| Arts, Entertainment & Recreation | 0 (0.0%) | 6 (100.0%) |
| Accommodation & Food Services | 20 (100.0%) | 0 (0.0%) |
| Public Administration | 216 (68.1%) | 101 (31.9%) |
| Total | 920 (52.1%) | 846 (47.9%) |
Education in Austin
School Enrollment in Austin
The most common levels of schooling among the 949 students in Austin are middle school (300 | 31.6%), elementary school (204 | 21.5%), and high school (182 | 19.2%).
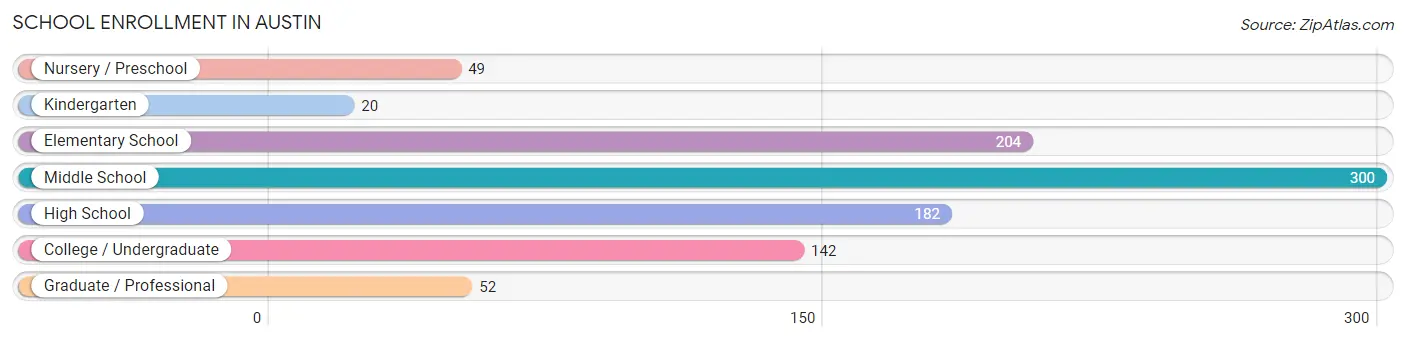
| School Level | # Students | % Students |
| Nursery / Preschool | 49 | 5.2% |
| Kindergarten | 20 | 2.1% |
| Elementary School | 204 | 21.5% |
| Middle School | 300 | 31.6% |
| High School | 182 | 19.2% |
| College / Undergraduate | 142 | 15.0% |
| Graduate / Professional | 52 | 5.5% |
| Total | 949 | 100.0% |
School Enrollment by Age by Funding Source in Austin
Out of a total of 949 students who are enrolled in schools in Austin, 163 (17.2%) attend a private institution, while the remaining 786 (82.8%) are enrolled in public schools. The age group of 3 to 4 year olds has the highest likelihood of being enrolled in private schools, with 32 (65.3% in the age bracket) enrolled. Conversely, the age group of 15 to 17 year olds has the lowest likelihood of being enrolled in a private school, with 100 (100.0% in the age bracket) attending a public institution.
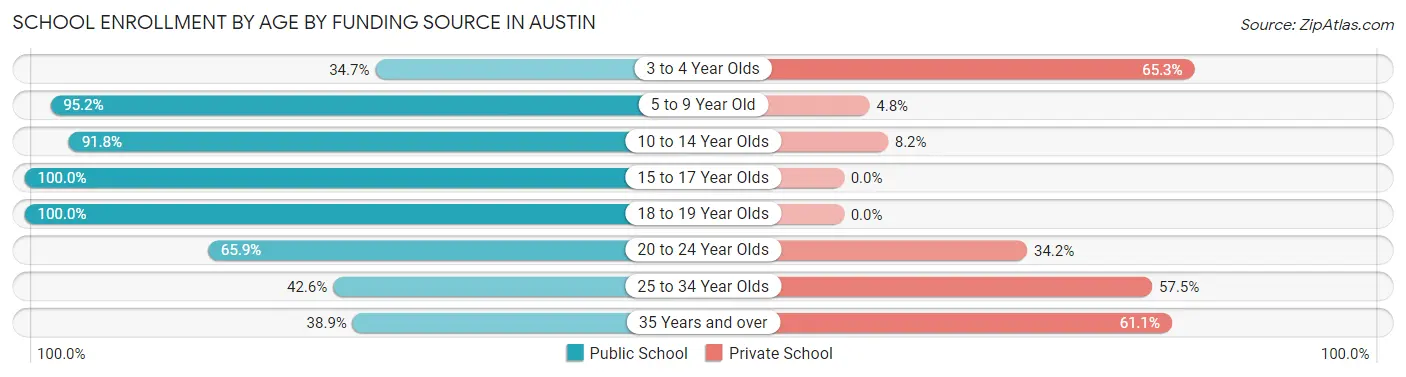
| Age Bracket | Public School | Private School |
| 3 to 4 Year Olds | 17 (34.7%) | 32 (65.3%) |
| 5 to 9 Year Old | 199 (95.2%) | 10 (4.8%) |
| 10 to 14 Year Olds | 346 (91.8%) | 31 (8.2%) |
| 15 to 17 Year Olds | 100 (100.0%) | 0 (0.0%) |
| 18 to 19 Year Olds | 43 (100.0%) | 0 (0.0%) |
| 20 to 24 Year Olds | 27 (65.8%) | 14 (34.2%) |
| 25 to 34 Year Olds | 40 (42.5%) | 54 (57.5%) |
| 35 Years and over | 14 (38.9%) | 22 (61.1%) |
| Total | 786 (82.8%) | 163 (17.2%) |
Educational Attainment by Field of Study in Austin
Arts & humanities (208 | 25.3%), psychology (147 | 17.9%), business (146 | 17.8%), education (130 | 15.8%), and bio, nature & agricultural (103 | 12.6%) are the most common fields of study among 821 individuals in Austin who have obtained a bachelor's degree or higher.
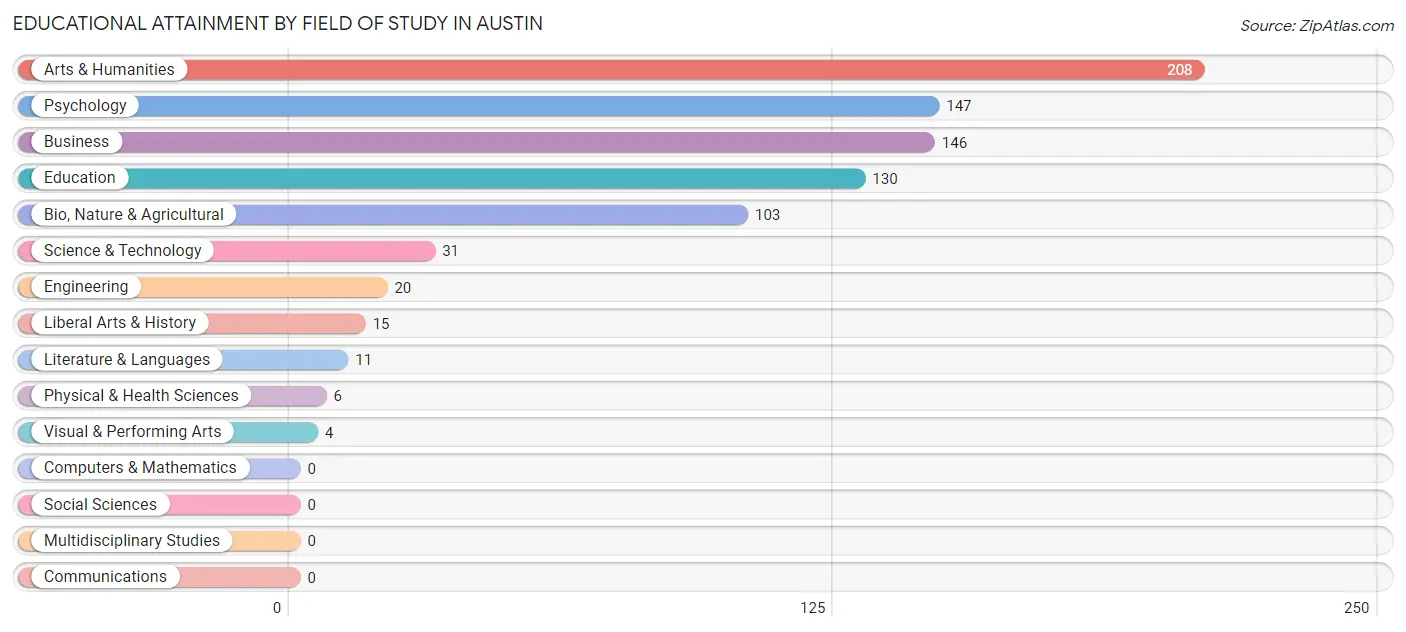
| Field of Study | # Graduates | % Graduates |
| Computers & Mathematics | 0 | 0.0% |
| Bio, Nature & Agricultural | 103 | 12.6% |
| Physical & Health Sciences | 6 | 0.7% |
| Psychology | 147 | 17.9% |
| Social Sciences | 0 | 0.0% |
| Engineering | 20 | 2.4% |
| Multidisciplinary Studies | 0 | 0.0% |
| Science & Technology | 31 | 3.8% |
| Business | 146 | 17.8% |
| Education | 130 | 15.8% |
| Literature & Languages | 11 | 1.3% |
| Liberal Arts & History | 15 | 1.8% |
| Visual & Performing Arts | 4 | 0.5% |
| Communications | 0 | 0.0% |
| Arts & Humanities | 208 | 25.3% |
| Total | 821 | 100.0% |
Transportation & Commute in Austin
Vehicle Availability by Sex in Austin
The most prevalent vehicle ownership categories in Austin are males with 2 vehicles (594, accounting for 55.4%) and females with 2 vehicles (478, making up 66.1%).
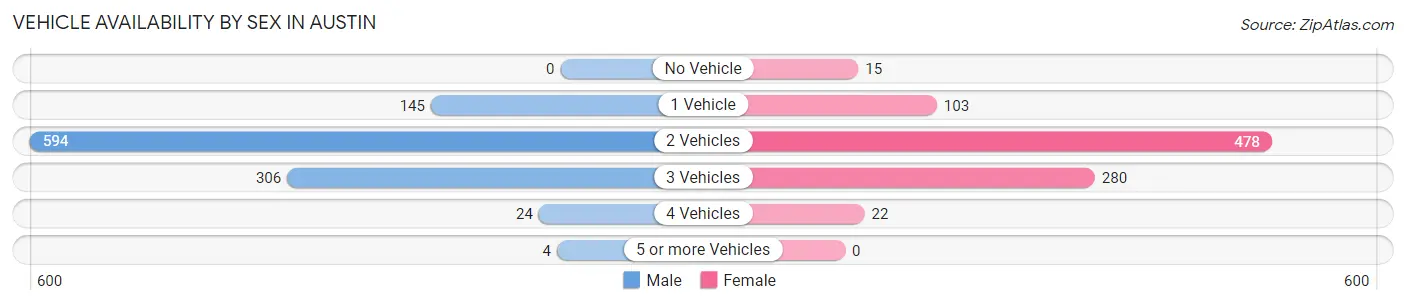
| Vehicles Available | Male | Female |
| No Vehicle | 0 (0.0%) | 15 (1.7%) |
| 1 Vehicle | 145 (13.5%) | 103 (11.5%) |
| 2 Vehicles | 594 (55.4%) | 478 (53.2%) |
| 3 Vehicles | 306 (28.5%) | 280 (31.2%) |
| 4 Vehicles | 24 (2.2%) | 22 (2.5%) |
| 5 or more Vehicles | 4 (0.4%) | 0 (0.0%) |
| Total | 1,073 (100.0%) | 898 (100.0%) |
Commute Time in Austin
The most frequently occuring commute durations in Austin are 25 to 29 minutes (351 commuters, 18.2%), 30 to 34 minutes (336 commuters, 17.4%), and 20 to 24 minutes (282 commuters, 14.6%).
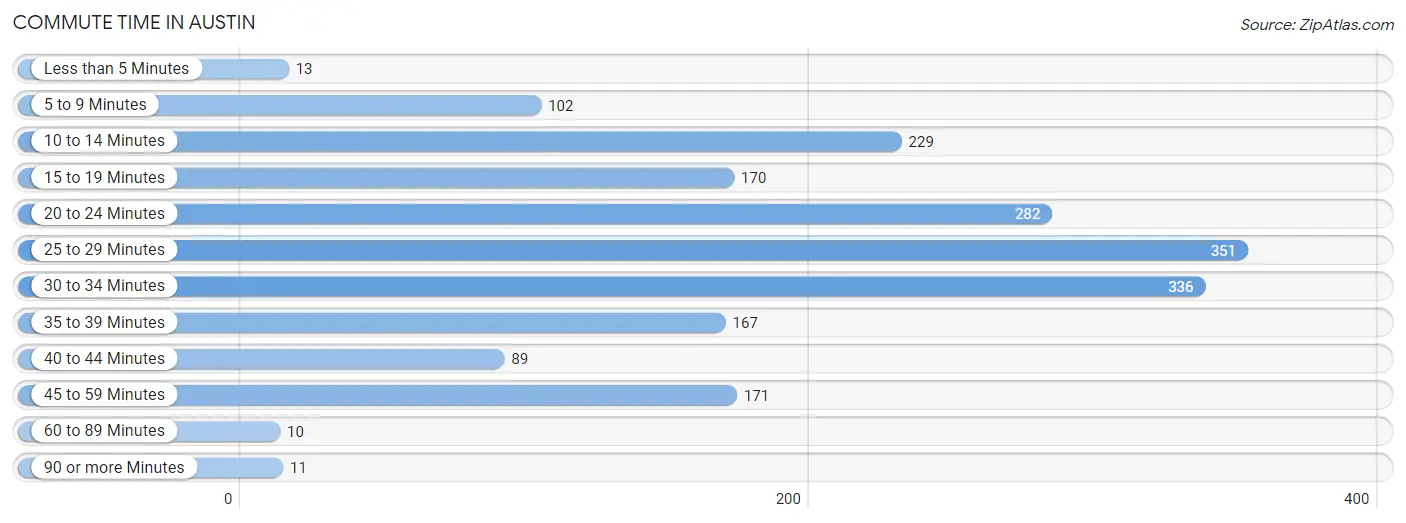
| Commute Time | # Commuters | % Commuters |
| Less than 5 Minutes | 13 | 0.7% |
| 5 to 9 Minutes | 102 | 5.3% |
| 10 to 14 Minutes | 229 | 11.9% |
| 15 to 19 Minutes | 170 | 8.8% |
| 20 to 24 Minutes | 282 | 14.6% |
| 25 to 29 Minutes | 351 | 18.2% |
| 30 to 34 Minutes | 336 | 17.4% |
| 35 to 39 Minutes | 167 | 8.6% |
| 40 to 44 Minutes | 89 | 4.6% |
| 45 to 59 Minutes | 171 | 8.9% |
| 60 to 89 Minutes | 10 | 0.5% |
| 90 or more Minutes | 11 | 0.6% |
Commute Time by Sex in Austin
The most common commute times in Austin are 30 to 34 minutes (219 commuters, 20.8%) for males and 25 to 29 minutes (203 commuters, 23.1%) for females.
| Commute Time | Male | Female |
| Less than 5 Minutes | 0 (0.0%) | 13 (1.5%) |
| 5 to 9 Minutes | 54 (5.1%) | 48 (5.5%) |
| 10 to 14 Minutes | 134 (12.7%) | 95 (10.8%) |
| 15 to 19 Minutes | 95 (9.0%) | 75 (8.5%) |
| 20 to 24 Minutes | 151 (14.3%) | 131 (14.9%) |
| 25 to 29 Minutes | 148 (14.1%) | 203 (23.1%) |
| 30 to 34 Minutes | 219 (20.8%) | 117 (13.3%) |
| 35 to 39 Minutes | 46 (4.4%) | 121 (13.8%) |
| 40 to 44 Minutes | 57 (5.4%) | 32 (3.6%) |
| 45 to 59 Minutes | 134 (12.7%) | 37 (4.2%) |
| 60 to 89 Minutes | 7 (0.7%) | 3 (0.3%) |
| 90 or more Minutes | 7 (0.7%) | 4 (0.5%) |
Time of Departure to Work by Sex in Austin
The most frequent times of departure to work in Austin are 7:00 AM to 7:29 AM (254, 24.1%) for males and 6:30 AM to 6:59 AM (241, 27.4%) for females.
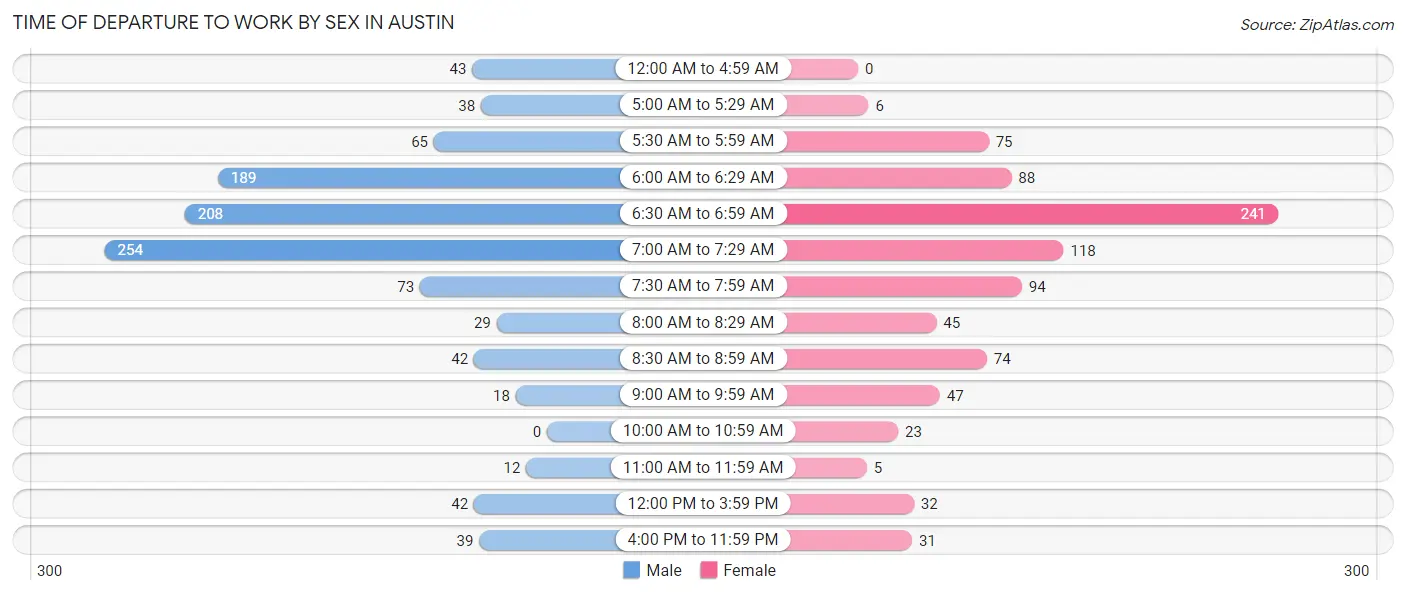
| Time of Departure | Male | Female |
| 12:00 AM to 4:59 AM | 43 (4.1%) | 0 (0.0%) |
| 5:00 AM to 5:29 AM | 38 (3.6%) | 6 (0.7%) |
| 5:30 AM to 5:59 AM | 65 (6.2%) | 75 (8.5%) |
| 6:00 AM to 6:29 AM | 189 (18.0%) | 88 (10.0%) |
| 6:30 AM to 6:59 AM | 208 (19.8%) | 241 (27.4%) |
| 7:00 AM to 7:29 AM | 254 (24.1%) | 118 (13.4%) |
| 7:30 AM to 7:59 AM | 73 (6.9%) | 94 (10.7%) |
| 8:00 AM to 8:29 AM | 29 (2.8%) | 45 (5.1%) |
| 8:30 AM to 8:59 AM | 42 (4.0%) | 74 (8.4%) |
| 9:00 AM to 9:59 AM | 18 (1.7%) | 47 (5.3%) |
| 10:00 AM to 10:59 AM | 0 (0.0%) | 23 (2.6%) |
| 11:00 AM to 11:59 AM | 12 (1.1%) | 5 (0.6%) |
| 12:00 PM to 3:59 PM | 42 (4.0%) | 32 (3.6%) |
| 4:00 PM to 11:59 PM | 39 (3.7%) | 31 (3.5%) |
| Total | 1,052 (100.0%) | 879 (100.0%) |
Housing Occupancy in Austin
Occupancy by Ownership in Austin
Of the total 1,360 dwellings in Austin, owner-occupied units account for 1,061 (78.0%), while renter-occupied units make up 299 (22.0%).
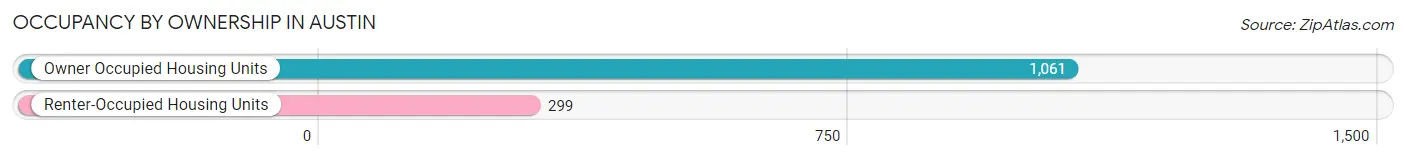
| Occupancy | # Housing Units | % Housing Units |
| Owner Occupied Housing Units | 1,061 | 78.0% |
| Renter-Occupied Housing Units | 299 | 22.0% |
| Total Occupied Housing Units | 1,360 | 100.0% |
Occupancy by Household Size in Austin
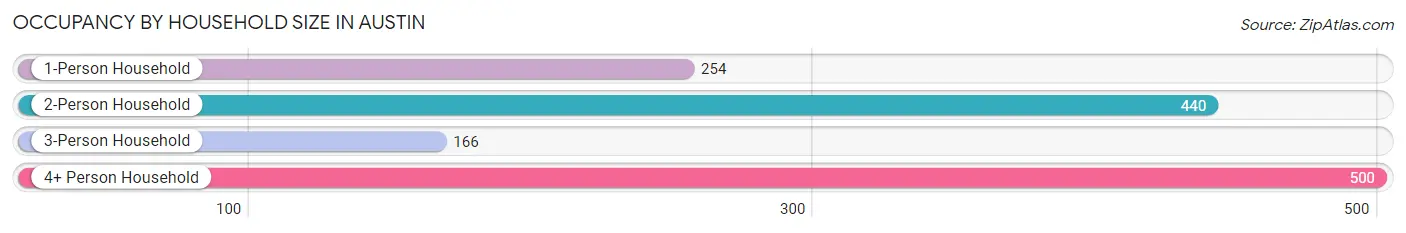
| Household Size | # Housing Units | % Housing Units |
| 1-Person Household | 254 | 18.7% |
| 2-Person Household | 440 | 32.4% |
| 3-Person Household | 166 | 12.2% |
| 4+ Person Household | 500 | 36.8% |
| Total Housing Units | 1,360 | 100.0% |
Occupancy by Ownership by Household Size in Austin
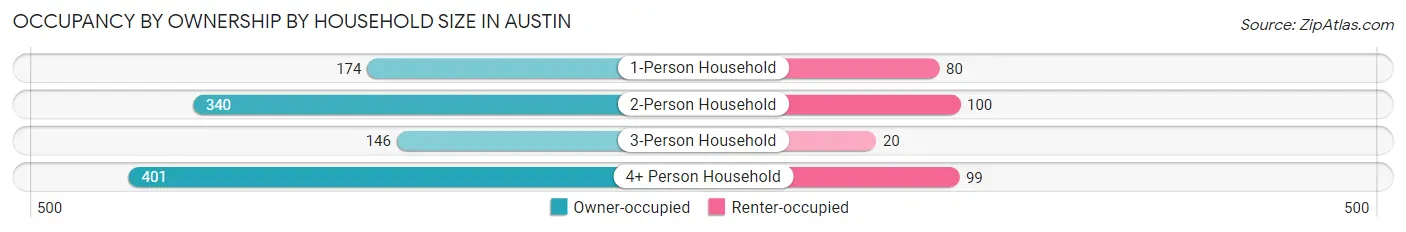
| Household Size | Owner-occupied | Renter-occupied |
| 1-Person Household | 174 (68.5%) | 80 (31.5%) |
| 2-Person Household | 340 (77.3%) | 100 (22.7%) |
| 3-Person Household | 146 (87.9%) | 20 (12.0%) |
| 4+ Person Household | 401 (80.2%) | 99 (19.8%) |
| Total Housing Units | 1,061 (78.0%) | 299 (22.0%) |
Occupancy by Educational Attainment in Austin
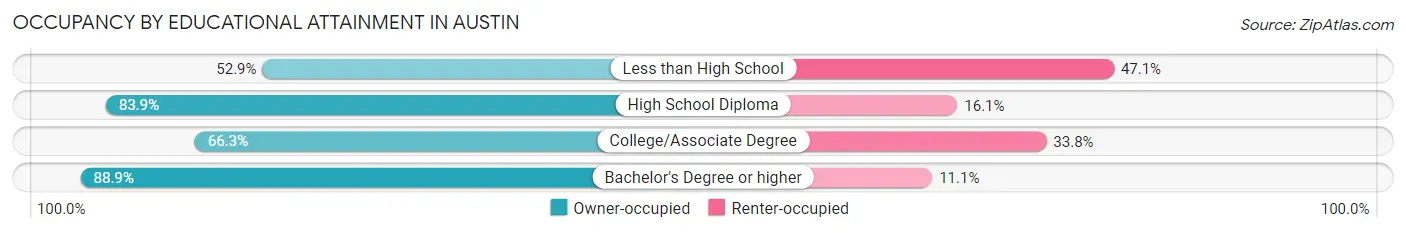
| Household Size | Owner-occupied | Renter-occupied |
| Less than High School | 37 (52.9%) | 33 (47.1%) |
| High School Diploma | 224 (83.9%) | 43 (16.1%) |
| College/Associate Degree | 320 (66.2%) | 163 (33.8%) |
| Bachelor's Degree or higher | 480 (88.9%) | 60 (11.1%) |
Occupancy by Age of Householder in Austin
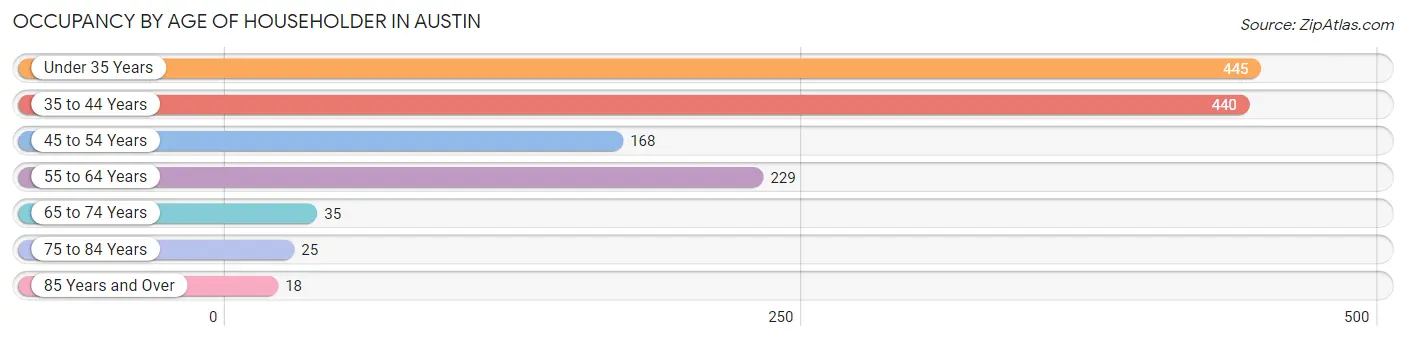
| Age Bracket | # Households | % Households |
| Under 35 Years | 445 | 32.7% |
| 35 to 44 Years | 440 | 32.4% |
| 45 to 54 Years | 168 | 12.3% |
| 55 to 64 Years | 229 | 16.8% |
| 65 to 74 Years | 35 | 2.6% |
| 75 to 84 Years | 25 | 1.8% |
| 85 Years and Over | 18 | 1.3% |
| Total | 1,360 | 100.0% |
Housing Finances in Austin
Median Income by Occupancy in Austin
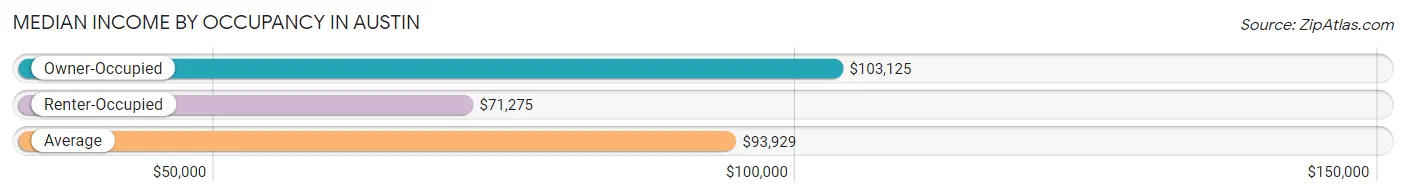
| Occupancy Type | # Households | Median Income |
| Owner-Occupied | 1,061 (78.0%) | $103,125 |
| Renter-Occupied | 299 (22.0%) | $71,275 |
| Average | 1,360 (100.0%) | $93,929 |
Occupancy by Householder Income Bracket in Austin
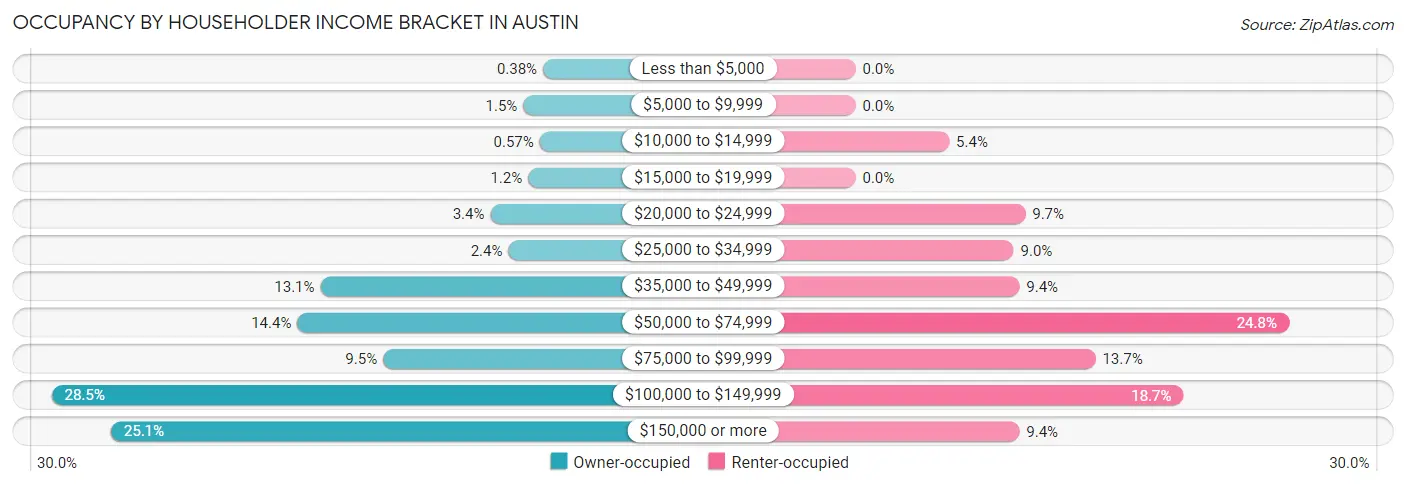
| Income Bracket | Owner-occupied | Renter-occupied |
| Less than $5,000 | 4 (0.4%) | 0 (0.0%) |
| $5,000 to $9,999 | 16 (1.5%) | 0 (0.0%) |
| $10,000 to $14,999 | 6 (0.6%) | 16 (5.3%) |
| $15,000 to $19,999 | 13 (1.2%) | 0 (0.0%) |
| $20,000 to $24,999 | 36 (3.4%) | 29 (9.7%) |
| $25,000 to $34,999 | 25 (2.4%) | 27 (9.0%) |
| $35,000 to $49,999 | 139 (13.1%) | 28 (9.4%) |
| $50,000 to $74,999 | 153 (14.4%) | 74 (24.7%) |
| $75,000 to $99,999 | 101 (9.5%) | 41 (13.7%) |
| $100,000 to $149,999 | 302 (28.5%) | 56 (18.7%) |
| $150,000 or more | 266 (25.1%) | 28 (9.4%) |
| Total | 1,061 (100.0%) | 299 (100.0%) |
Monthly Housing Cost Tiers in Austin
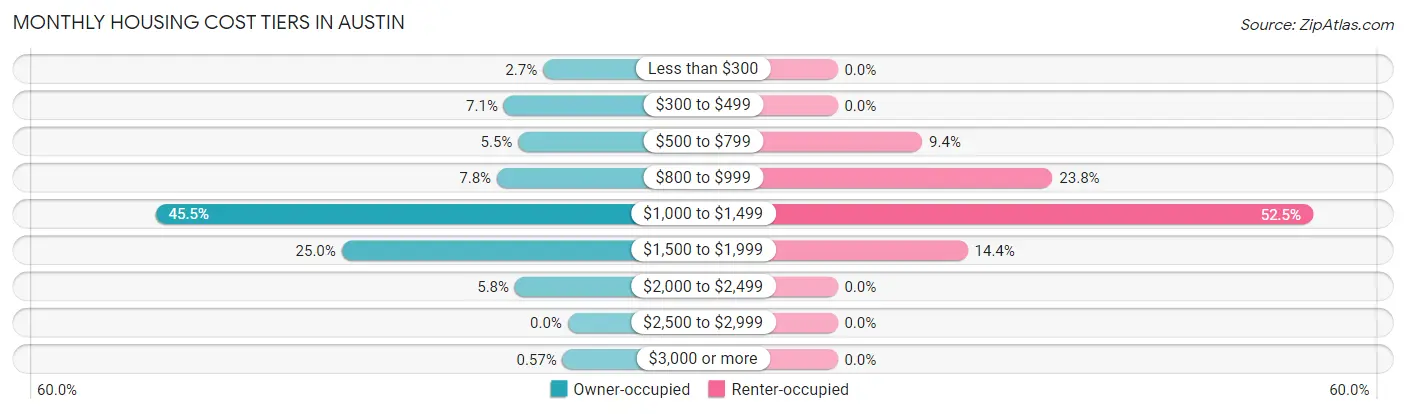
| Monthly Cost | Owner-occupied | Renter-occupied |
| Less than $300 | 29 (2.7%) | 0 (0.0%) |
| $300 to $499 | 75 (7.1%) | 0 (0.0%) |
| $500 to $799 | 58 (5.5%) | 28 (9.4%) |
| $800 to $999 | 83 (7.8%) | 71 (23.7%) |
| $1,000 to $1,499 | 483 (45.5%) | 157 (52.5%) |
| $1,500 to $1,999 | 265 (25.0%) | 43 (14.4%) |
| $2,000 to $2,499 | 62 (5.8%) | 0 (0.0%) |
| $2,500 to $2,999 | 0 (0.0%) | 0 (0.0%) |
| $3,000 or more | 6 (0.6%) | 0 (0.0%) |
| Total | 1,061 (100.0%) | 299 (100.0%) |
Physical Housing Characteristics in Austin
Housing Structures in Austin
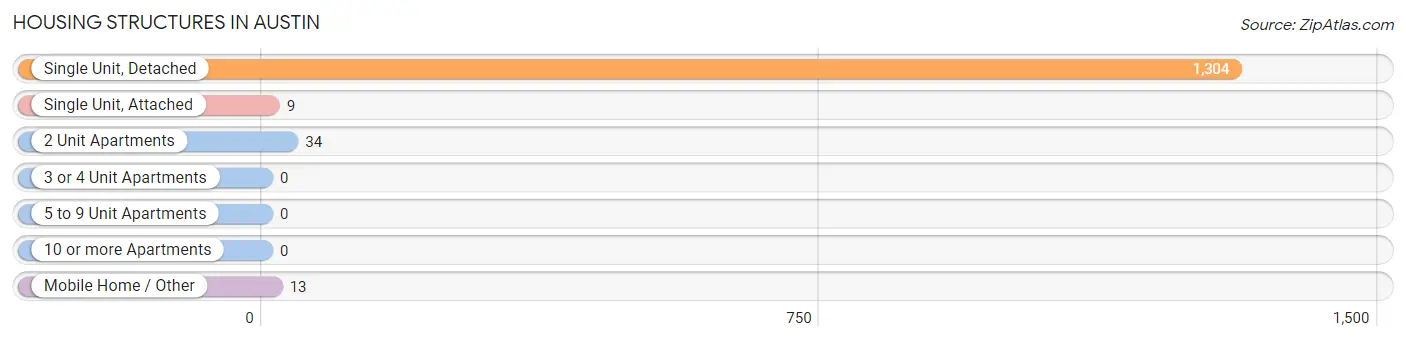
| Structure Type | # Housing Units | % Housing Units |
| Single Unit, Detached | 1,304 | 95.9% |
| Single Unit, Attached | 9 | 0.7% |
| 2 Unit Apartments | 34 | 2.5% |
| 3 or 4 Unit Apartments | 0 | 0.0% |
| 5 to 9 Unit Apartments | 0 | 0.0% |
| 10 or more Apartments | 0 | 0.0% |
| Mobile Home / Other | 13 | 1.0% |
| Total | 1,360 | 100.0% |
Housing Structures by Occupancy in Austin
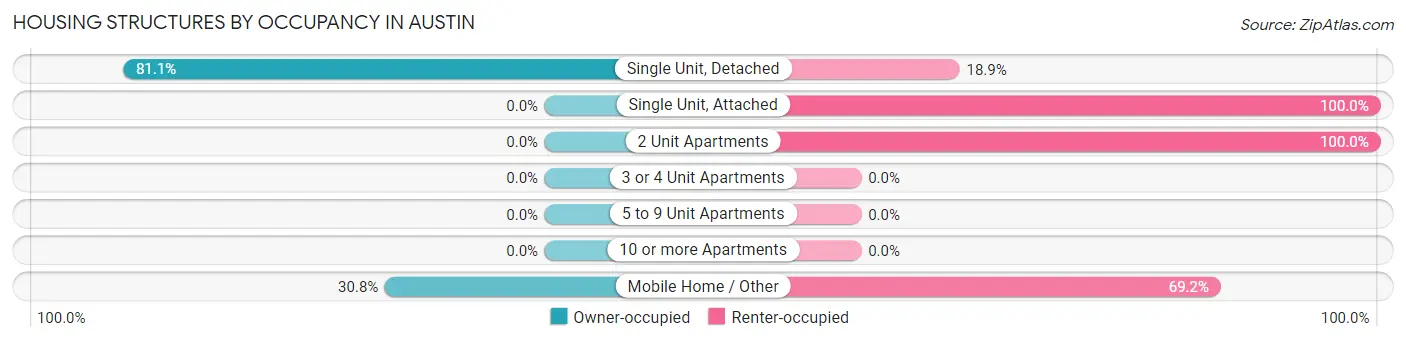
| Structure Type | Owner-occupied | Renter-occupied |
| Single Unit, Detached | 1,057 (81.1%) | 247 (18.9%) |
| Single Unit, Attached | 0 (0.0%) | 9 (100.0%) |
| 2 Unit Apartments | 0 (0.0%) | 34 (100.0%) |
| 3 or 4 Unit Apartments | 0 (0.0%) | 0 (0.0%) |
| 5 to 9 Unit Apartments | 0 (0.0%) | 0 (0.0%) |
| 10 or more Apartments | 0 (0.0%) | 0 (0.0%) |
| Mobile Home / Other | 4 (30.8%) | 9 (69.2%) |
| Total | 1,061 (78.0%) | 299 (22.0%) |
Housing Structures by Number of Rooms in Austin
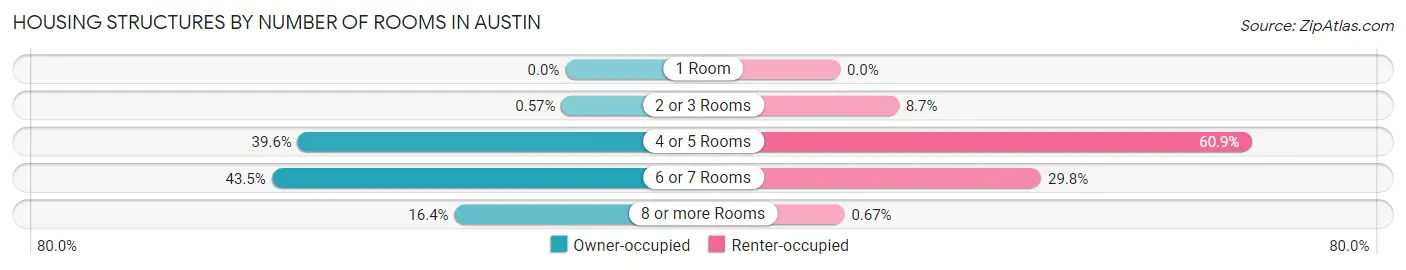
| Number of Rooms | Owner-occupied | Renter-occupied |
| 1 Room | 0 (0.0%) | 0 (0.0%) |
| 2 or 3 Rooms | 6 (0.6%) | 26 (8.7%) |
| 4 or 5 Rooms | 420 (39.6%) | 182 (60.9%) |
| 6 or 7 Rooms | 461 (43.4%) | 89 (29.8%) |
| 8 or more Rooms | 174 (16.4%) | 2 (0.7%) |
| Total | 1,061 (100.0%) | 299 (100.0%) |
Housing Structure by Heating Type in Austin
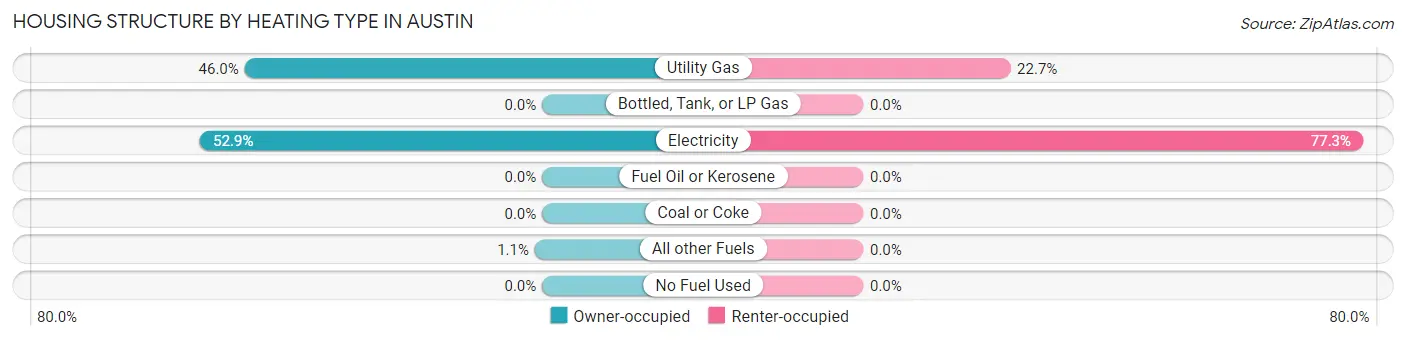
| Heating Type | Owner-occupied | Renter-occupied |
| Utility Gas | 488 (46.0%) | 68 (22.7%) |
| Bottled, Tank, or LP Gas | 0 (0.0%) | 0 (0.0%) |
| Electricity | 561 (52.9%) | 231 (77.3%) |
| Fuel Oil or Kerosene | 0 (0.0%) | 0 (0.0%) |
| Coal or Coke | 0 (0.0%) | 0 (0.0%) |
| All other Fuels | 12 (1.1%) | 0 (0.0%) |
| No Fuel Used | 0 (0.0%) | 0 (0.0%) |
| Total | 1,061 (100.0%) | 299 (100.0%) |
Household Vehicle Usage in Austin
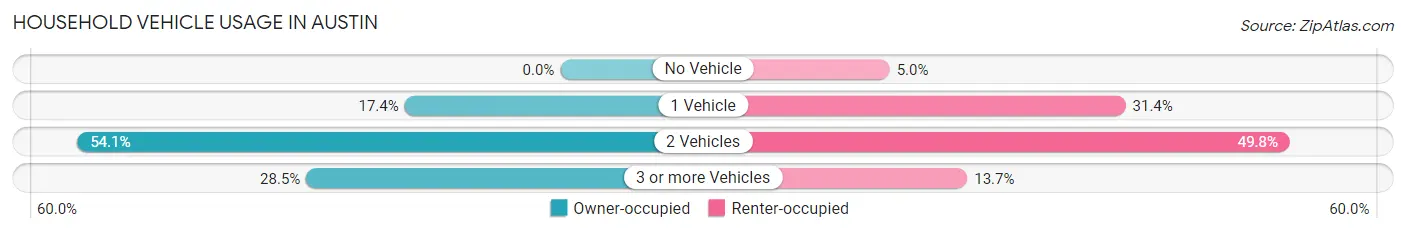
| Vehicles per Household | Owner-occupied | Renter-occupied |
| No Vehicle | 0 (0.0%) | 15 (5.0%) |
| 1 Vehicle | 185 (17.4%) | 94 (31.4%) |
| 2 Vehicles | 574 (54.1%) | 149 (49.8%) |
| 3 or more Vehicles | 302 (28.5%) | 41 (13.7%) |
| Total | 1,061 (100.0%) | 299 (100.0%) |
Real Estate & Mortgages in Austin
Real Estate and Mortgage Overview in Austin
| Characteristic | Without Mortgage | With Mortgage |
| Housing Units | 141 | 920 |
| Median Property Value | $211,600 | $174,800 |
| Median Household Income | $85,750 | $252 |
| Monthly Housing Costs | $430 | $6 |
| Real Estate Taxes | $1,745 | $90 |
Property Value by Mortgage Status in Austin
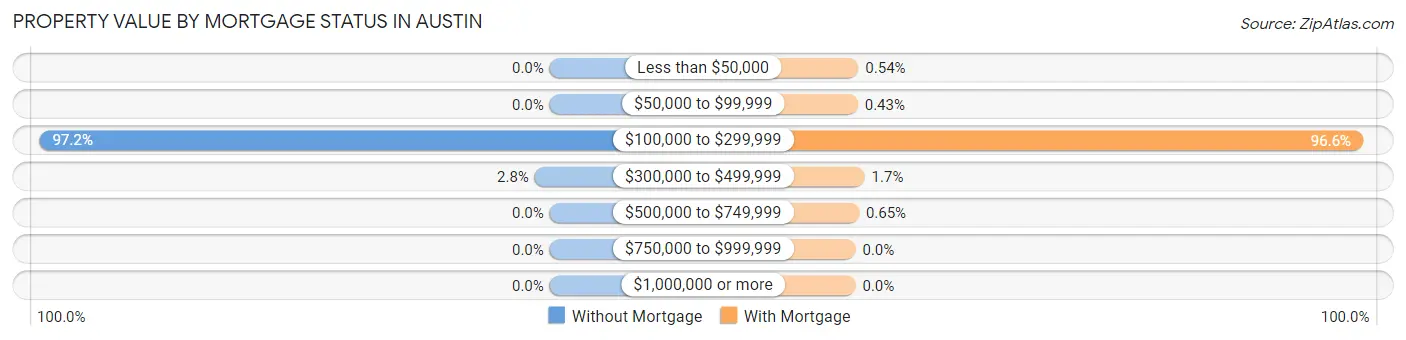
| Property Value | Without Mortgage | With Mortgage |
| Less than $50,000 | 0 (0.0%) | 5 (0.5%) |
| $50,000 to $99,999 | 0 (0.0%) | 4 (0.4%) |
| $100,000 to $299,999 | 137 (97.2%) | 889 (96.6%) |
| $300,000 to $499,999 | 4 (2.8%) | 16 (1.7%) |
| $500,000 to $749,999 | 0 (0.0%) | 6 (0.6%) |
| $750,000 to $999,999 | 0 (0.0%) | 0 (0.0%) |
| $1,000,000 or more | 0 (0.0%) | 0 (0.0%) |
| Total | 141 (100.0%) | 920 (100.0%) |
Household Income by Mortgage Status in Austin
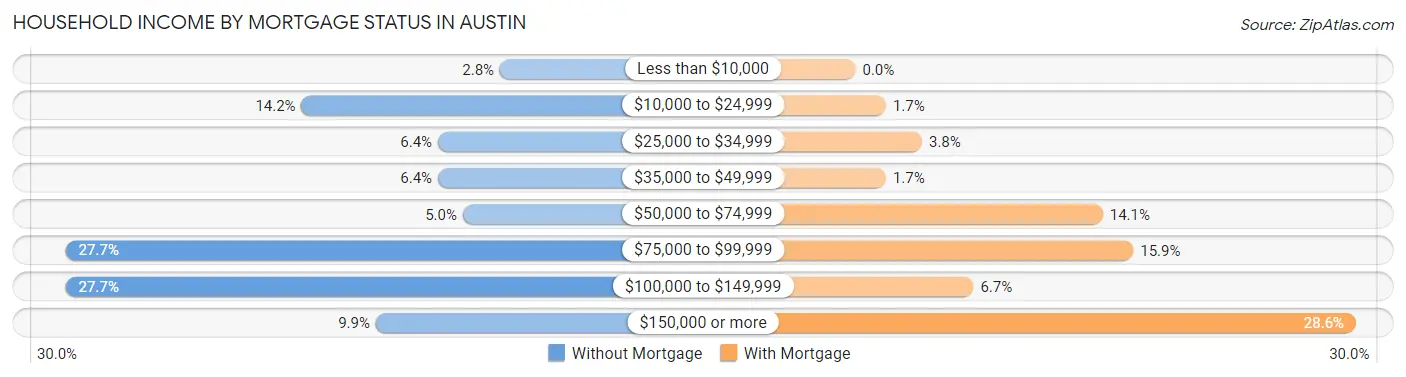
| Household Income | Without Mortgage | With Mortgage |
| Less than $10,000 | 4 (2.8%) | 0 (0.0%) |
| $10,000 to $24,999 | 20 (14.2%) | 16 (1.7%) |
| $25,000 to $34,999 | 9 (6.4%) | 35 (3.8%) |
| $35,000 to $49,999 | 9 (6.4%) | 16 (1.7%) |
| $50,000 to $74,999 | 7 (5.0%) | 130 (14.1%) |
| $75,000 to $99,999 | 39 (27.7%) | 146 (15.9%) |
| $100,000 to $149,999 | 39 (27.7%) | 62 (6.7%) |
| $150,000 or more | 14 (9.9%) | 263 (28.6%) |
| Total | 141 (100.0%) | 920 (100.0%) |
Property Value to Household Income Ratio in Austin
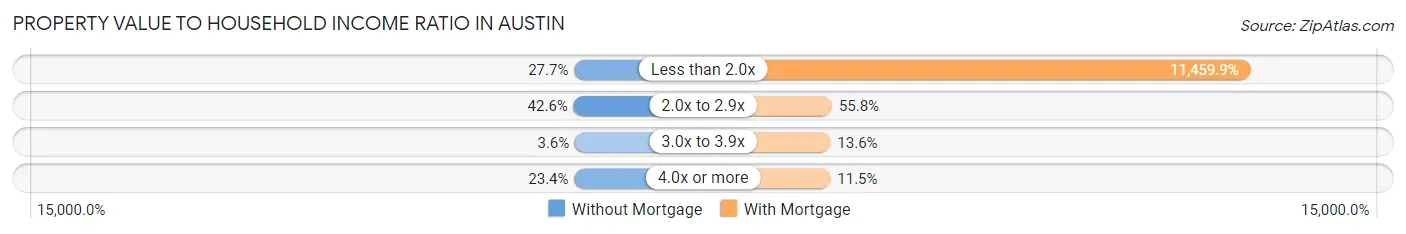
| Value-to-Income Ratio | Without Mortgage | With Mortgage |
| Less than 2.0x | 39 (27.7%) | 105,431 (11,459.9%) |
| 2.0x to 2.9x | 60 (42.5%) | 513 (55.8%) |
| 3.0x to 3.9x | 5 (3.5%) | 125 (13.6%) |
| 4.0x or more | 33 (23.4%) | 106 (11.5%) |
| Total | 141 (100.0%) | 920 (100.0%) |
Real Estate Taxes by Mortgage Status in Austin
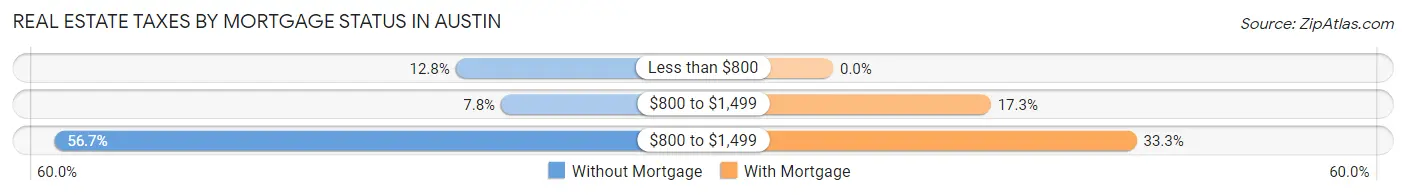
| Property Taxes | Without Mortgage | With Mortgage |
| Less than $800 | 18 (12.8%) | 0 (0.0%) |
| $800 to $1,499 | 11 (7.8%) | 159 (17.3%) |
| $800 to $1,499 | 80 (56.7%) | 306 (33.3%) |
| Total | 141 (100.0%) | 920 (100.0%) |
Health & Disability in Austin
Health Insurance Coverage by Age in Austin
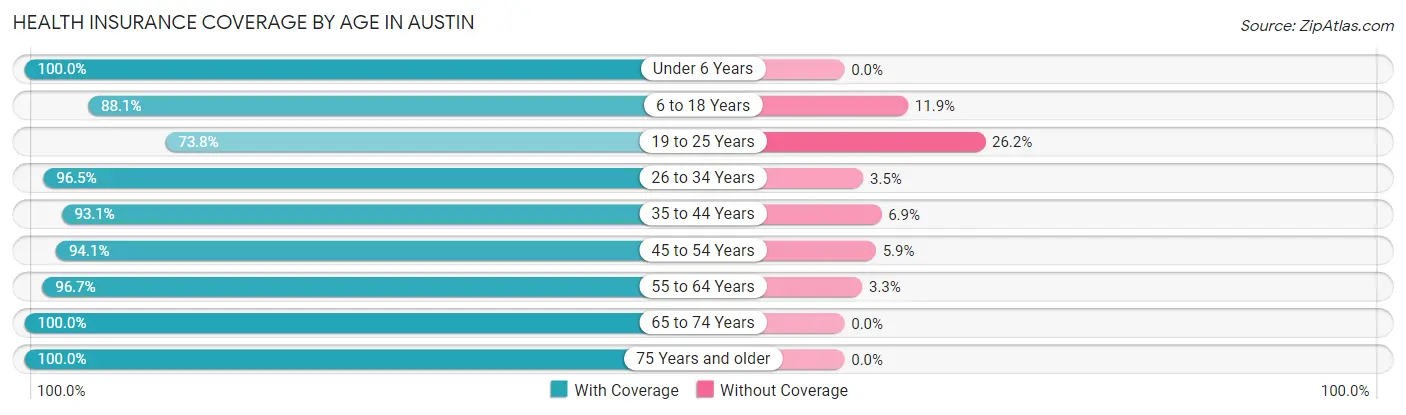
| Age Bracket | With Coverage | Without Coverage |
| Under 6 Years | 474 (100.0%) | 0 (0.0%) |
| 6 to 18 Years | 617 (88.1%) | 83 (11.9%) |
| 19 to 25 Years | 149 (73.8%) | 53 (26.2%) |
| 26 to 34 Years | 688 (96.5%) | 25 (3.5%) |
| 35 to 44 Years | 528 (93.1%) | 39 (6.9%) |
| 45 to 54 Years | 289 (94.1%) | 18 (5.9%) |
| 55 to 64 Years | 350 (96.7%) | 12 (3.3%) |
| 65 to 74 Years | 81 (100.0%) | 0 (0.0%) |
| 75 Years and older | 48 (100.0%) | 0 (0.0%) |
| Total | 3,224 (93.3%) | 230 (6.7%) |
Health Insurance Coverage by Citizenship Status in Austin
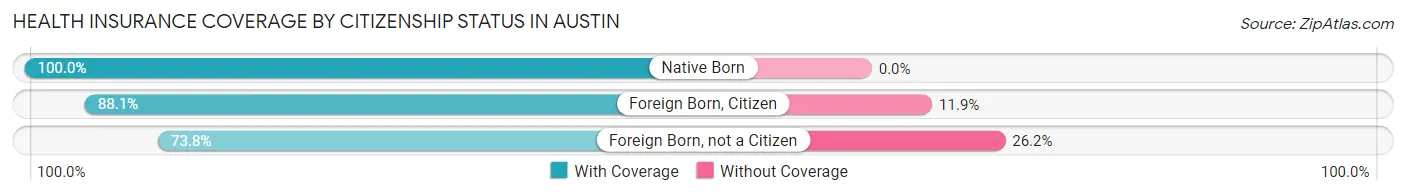
| Citizenship Status | With Coverage | Without Coverage |
| Native Born | 474 (100.0%) | 0 (0.0%) |
| Foreign Born, Citizen | 617 (88.1%) | 83 (11.9%) |
| Foreign Born, not a Citizen | 149 (73.8%) | 53 (26.2%) |
Health Insurance Coverage by Household Income in Austin
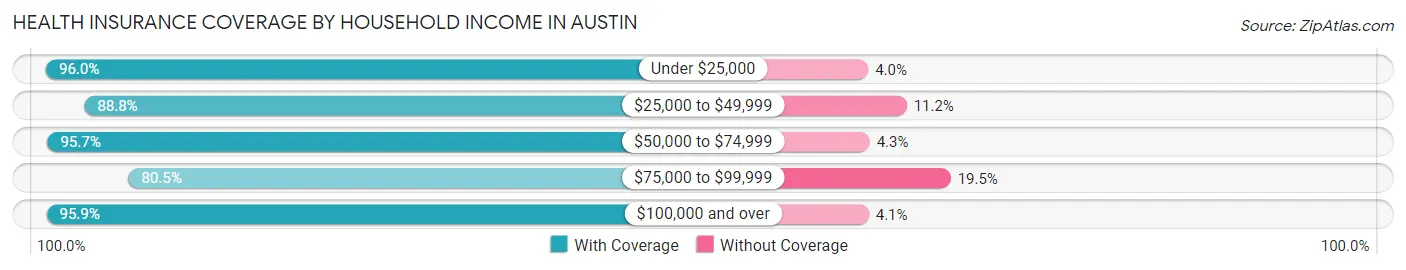
| Household Income | With Coverage | Without Coverage |
| Under $25,000 | 167 (96.0%) | 7 (4.0%) |
| $25,000 to $49,999 | 356 (88.8%) | 45 (11.2%) |
| $50,000 to $74,999 | 580 (95.7%) | 26 (4.3%) |
| $75,000 to $99,999 | 306 (80.5%) | 74 (19.5%) |
| $100,000 and over | 1,815 (95.9%) | 78 (4.1%) |
Public vs Private Health Insurance Coverage by Age in Austin
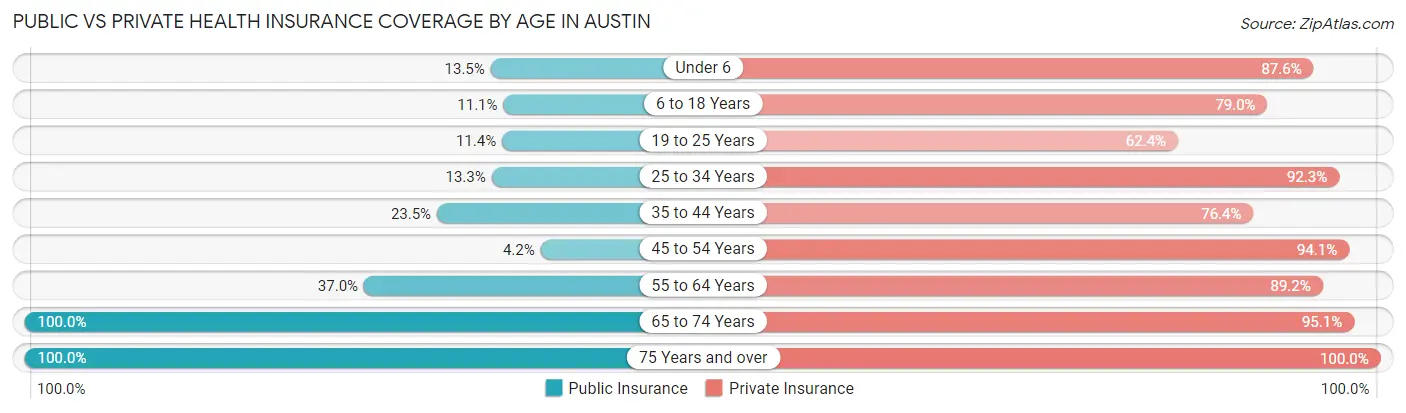
| Age Bracket | Public Insurance | Private Insurance |
| Under 6 | 64 (13.5%) | 415 (87.5%) |
| 6 to 18 Years | 78 (11.1%) | 553 (79.0%) |
| 19 to 25 Years | 23 (11.4%) | 126 (62.4%) |
| 25 to 34 Years | 95 (13.3%) | 658 (92.3%) |
| 35 to 44 Years | 133 (23.5%) | 433 (76.4%) |
| 45 to 54 Years | 13 (4.2%) | 289 (94.1%) |
| 55 to 64 Years | 134 (37.0%) | 323 (89.2%) |
| 65 to 74 Years | 81 (100.0%) | 77 (95.1%) |
| 75 Years and over | 48 (100.0%) | 48 (100.0%) |
| Total | 669 (19.4%) | 2,922 (84.6%) |
Disability Status by Sex by Age in Austin
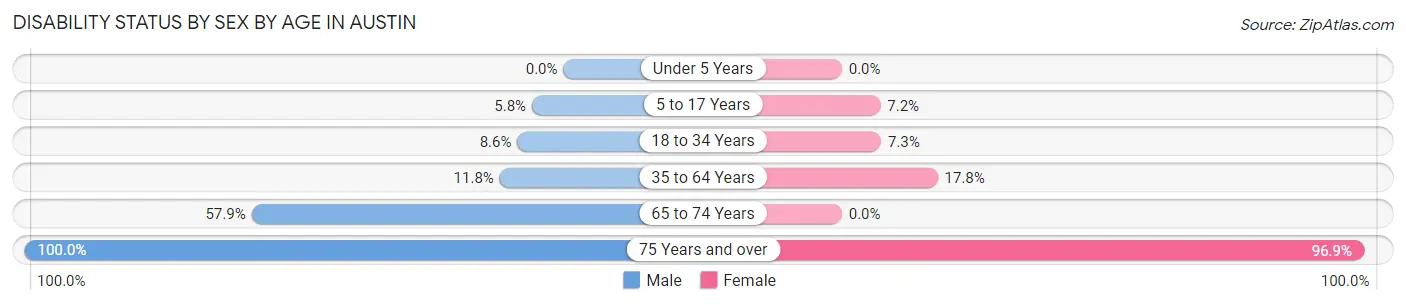
| Age Bracket | Male | Female |
| Under 5 Years | 0 (0.0%) | 0 (0.0%) |
| 5 to 17 Years | 15 (5.8%) | 35 (7.2%) |
| 18 to 34 Years | 40 (8.6%) | 34 (7.3%) |
| 35 to 64 Years | 65 (11.8%) | 122 (17.8%) |
| 65 to 74 Years | 22 (57.9%) | 0 (0.0%) |
| 75 Years and over | 16 (100.0%) | 31 (96.9%) |
Disability Class by Sex by Age in Austin
Disability Class: Hearing Difficulty
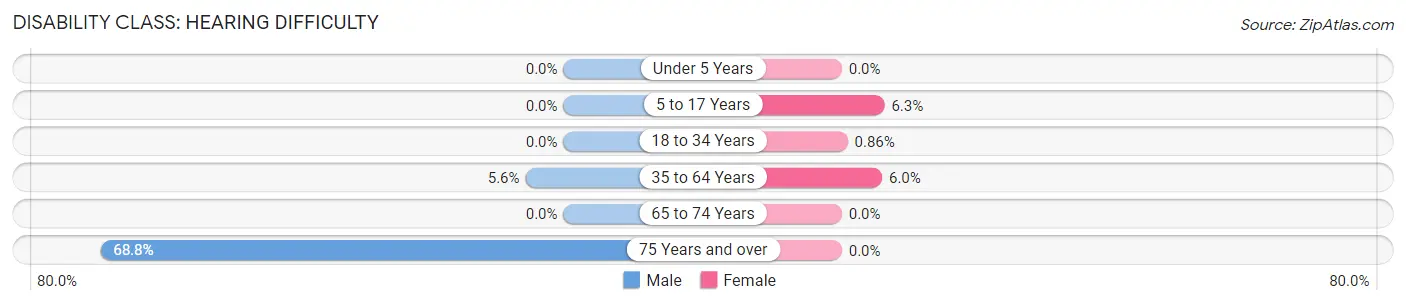
| Age Bracket | Male | Female |
| Under 5 Years | 0 (0.0%) | 0 (0.0%) |
| 5 to 17 Years | 0 (0.0%) | 31 (6.3%) |
| 18 to 34 Years | 0 (0.0%) | 4 (0.9%) |
| 35 to 64 Years | 31 (5.6%) | 41 (6.0%) |
| 65 to 74 Years | 0 (0.0%) | 0 (0.0%) |
| 75 Years and over | 11 (68.8%) | 0 (0.0%) |
Disability Class: Vision Difficulty
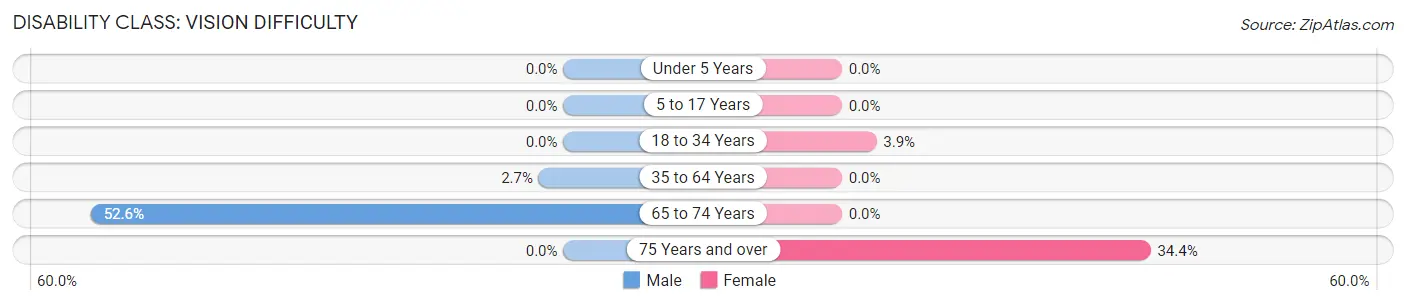
| Age Bracket | Male | Female |
| Under 5 Years | 0 (0.0%) | 0 (0.0%) |
| 5 to 17 Years | 0 (0.0%) | 0 (0.0%) |
| 18 to 34 Years | 0 (0.0%) | 18 (3.8%) |
| 35 to 64 Years | 15 (2.7%) | 0 (0.0%) |
| 65 to 74 Years | 20 (52.6%) | 0 (0.0%) |
| 75 Years and over | 0 (0.0%) | 11 (34.4%) |
Disability Class: Cognitive Difficulty
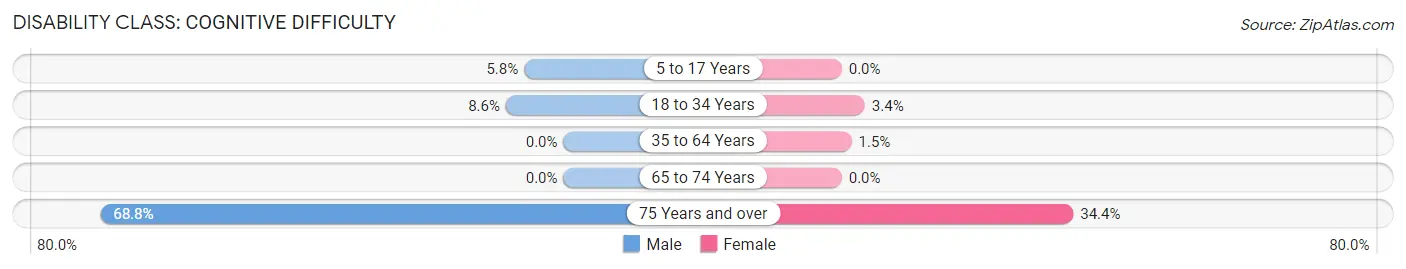
| Age Bracket | Male | Female |
| 5 to 17 Years | 15 (5.8%) | 0 (0.0%) |
| 18 to 34 Years | 40 (8.6%) | 16 (3.4%) |
| 35 to 64 Years | 0 (0.0%) | 10 (1.5%) |
| 65 to 74 Years | 0 (0.0%) | 0 (0.0%) |
| 75 Years and over | 11 (68.8%) | 11 (34.4%) |
Disability Class: Ambulatory Difficulty
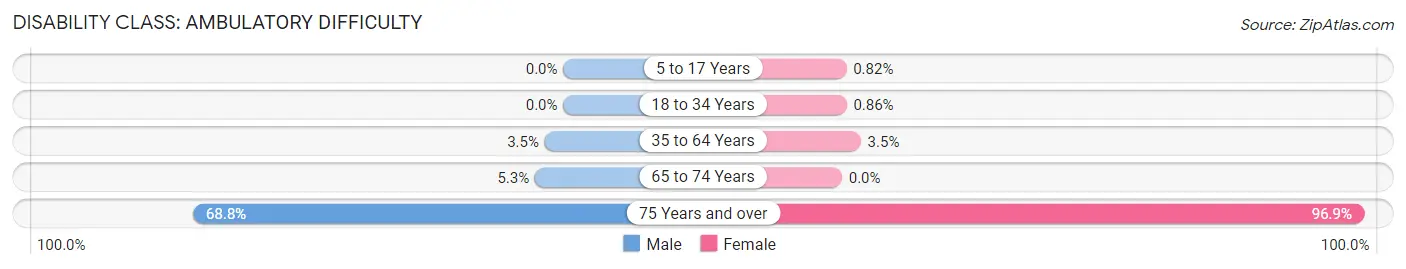
| Age Bracket | Male | Female |
| 5 to 17 Years | 0 (0.0%) | 4 (0.8%) |
| 18 to 34 Years | 0 (0.0%) | 4 (0.9%) |
| 35 to 64 Years | 19 (3.5%) | 24 (3.5%) |
| 65 to 74 Years | 2 (5.3%) | 0 (0.0%) |
| 75 Years and over | 11 (68.8%) | 31 (96.9%) |
Disability Class: Self-Care Difficulty
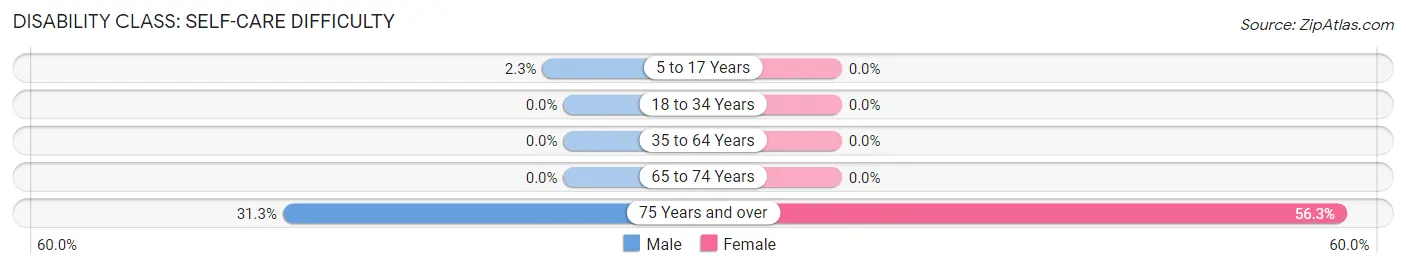
| Age Bracket | Male | Female |
| 5 to 17 Years | 6 (2.3%) | 0 (0.0%) |
| 18 to 34 Years | 0 (0.0%) | 0 (0.0%) |
| 35 to 64 Years | 0 (0.0%) | 0 (0.0%) |
| 65 to 74 Years | 0 (0.0%) | 0 (0.0%) |
| 75 Years and over | 5 (31.2%) | 18 (56.2%) |
Technology Access in Austin
Computing Device Access in Austin
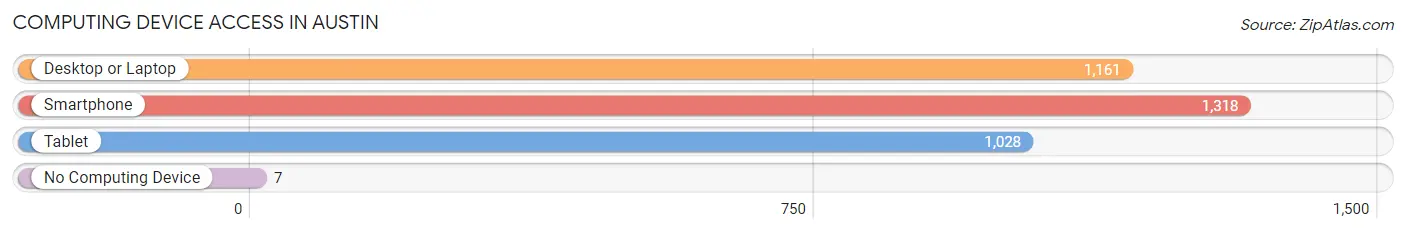
| Device Type | # Households | % Households |
| Desktop or Laptop | 1,161 | 85.4% |
| Smartphone | 1,318 | 96.9% |
| Tablet | 1,028 | 75.6% |
| No Computing Device | 7 | 0.5% |
| Total | 1,360 | 100.0% |
Internet Access in Austin
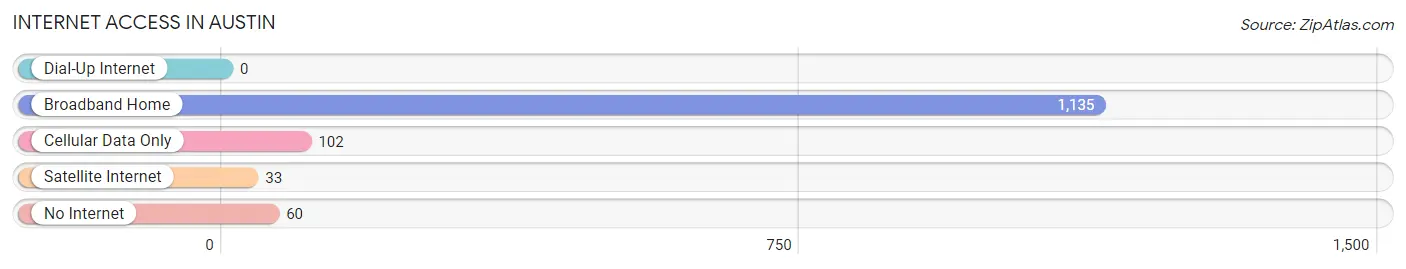
| Internet Type | # Households | % Households |
| Dial-Up Internet | 0 | 0.0% |
| Broadband Home | 1,135 | 83.5% |
| Cellular Data Only | 102 | 7.5% |
| Satellite Internet | 33 | 2.4% |
| No Internet | 60 | 4.4% |
| Total | 1,360 | 100.0% |
Austin Summary
Austin, Arkansas is a city located in the northern part of Lonoke County in the U.S. state of Arkansas. It is situated along the Arkansas River, approximately 25 miles east of Little Rock. The city has a population of approximately 2,000 people and is the county seat of Lonoke County.
History
The area that is now Austin was first settled in the early 1800s by settlers from the nearby town of Cabot. The town was originally known as Austin Station, named after the nearby Austin Station on the Little Rock and Memphis Railroad. The town was officially incorporated in 1876 and was named after Stephen F. Austin, the founder of the Republic of Texas.
In the late 1800s, Austin was a thriving agricultural center, with cotton, corn, and other crops being grown in the area. The town also had a number of businesses, including a cotton gin, a grist mill, and a sawmill.
In the early 1900s, Austin began to experience a period of growth and development. The town was connected to the rest of the state by the Little Rock and Memphis Railroad, and the town's population began to grow. By the mid-1900s, Austin had become a major center for the cotton industry, with several cotton gins and warehouses located in the town.
Geography
Austin is located in the northern part of Lonoke County, approximately 25 miles east of Little Rock. The city is situated along the Arkansas River, and is surrounded by rolling hills and farmland. The city has a total area of 2.2 square miles, all of which is land.
Economy
The economy of Austin is largely based on agriculture. The city is home to several cotton gins and warehouses, as well as a number of other agricultural businesses. The city also has a number of retail stores and restaurants.
Demographics
As of the 2010 census, Austin had a population of 2,000 people. The racial makeup of the city was 79.2% White, 17.2% African American, 0.7% Native American, 0.3% Asian, 0.1% Pacific Islander, and 2.5% from other races. Hispanic or Latino of any race were 2.7% of the population.
The median income for a household in Austin was $31,250, and the median income for a family was $37,500. The per capita income for the city was $15,945. About 17.2% of families and 20.2% of the population were below the poverty line, including 28.3% of those under age 18 and 15.2% of those age 65 or over.
Common Questions
What is Per Capita Income in Austin?
Per Capita income in Austin is $35,561.
What is the Median Family Income in Austin?
Median Family Income in Austin is $106,335.
What is the Median Household income in Austin?
Median Household Income in Austin is $93,929.
What is Income or Wage Gap in Austin?
Income or Wage Gap in Austin is 35.0%.
Women in Austin earn 65.0 cents for every dollar earned by a man.
What is Inequality or Gini Index in Austin?
Inequality or Gini Index in Austin is 0.35.
What is the Total Population of Austin?
Total Population of Austin is 3,659.
What is the Total Male Population of Austin?
Total Male Population of Austin is 1,795.
What is the Total Female Population of Austin?
Total Female Population of Austin is 1,864.
What is the Ratio of Males per 100 Females in Austin?
There are 96.30 Males per 100 Females in Austin.
What is the Ratio of Females per 100 Males in Austin?
There are 103.84 Females per 100 Males in Austin.
What is the Median Population Age in Austin?
Median Population Age in Austin is 30.6 Years.
What is the Average Family Size in Austin
Average Family Size in Austin is 3.1 People.
What is the Average Household Size in Austin
Average Household Size in Austin is 2.7 People.
How Large is the Labor Force in Austin?
There are 2,011 People in the Labor Forcein in Austin.
What is the Percentage of People in the Labor Force in Austin?
77.6% of People are in the Labor Force in Austin.
What is the Unemployment Rate in Austin?
Unemployment Rate in Austin is 2.2%.