Augusta, AR Map & Demographics
Augusta Map
Augusta Overview
$27,993
PER CAPITA INCOME
$60,625
AVG FAMILY INCOME
$51,535
AVG HOUSEHOLD INCOME
35.7%
WAGE / INCOME GAP [ % ]
64.3¢/ $1
WAGE / INCOME GAP [ $ ]
0.43
INEQUALITY / GINI INDEX
1,995
TOTAL POPULATION
984
MALE POPULATION
1,011
FEMALE POPULATION
97.33
MALES / 100 FEMALES
102.74
FEMALES / 100 MALES
44.1
MEDIAN AGE
3.0
AVG FAMILY SIZE
2.4
AVG HOUSEHOLD SIZE
897
LABOR FORCE [ PEOPLE ]
54.4%
PERCENT IN LABOR FORCE
6.0%
UNEMPLOYMENT RATE
Augusta Zip Codes
Augusta Area Codes
Income in Augusta
Income Overview in Augusta
Per Capita Income in Augusta is $27,993, while median incomes of families and households are $60,625 and $51,535 respectively.
| Characteristic | Number | Measure |
| Per Capita Income | 1,995 | $27,993 |
| Median Family Income | 521 | $60,625 |
| Mean Family Income | 521 | $83,355 |
| Median Household Income | 834 | $51,535 |
| Mean Household Income | 834 | $67,312 |
| Income Deficit | 521 | $0 |
| Wage / Income Gap (%) | 1,995 | 35.73% |
| Wage / Income Gap ($) | 1,995 | 64.27¢ per $1 |
| Gini / Inequality Index | 1,995 | 0.43 |
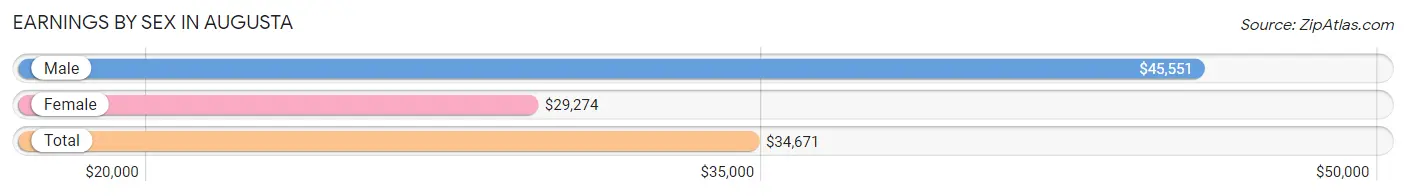
Earnings by Sex in Augusta
Average Earnings in Augusta are $34,671, $45,551 for men and $29,274 for women, a difference of 35.7%.
| Sex | Number | Average Earnings |
| Male | 434 (47.6%) | $45,551 |
| Female | 478 (52.4%) | $29,274 |
| Total | 912 (100.0%) | $34,671 |
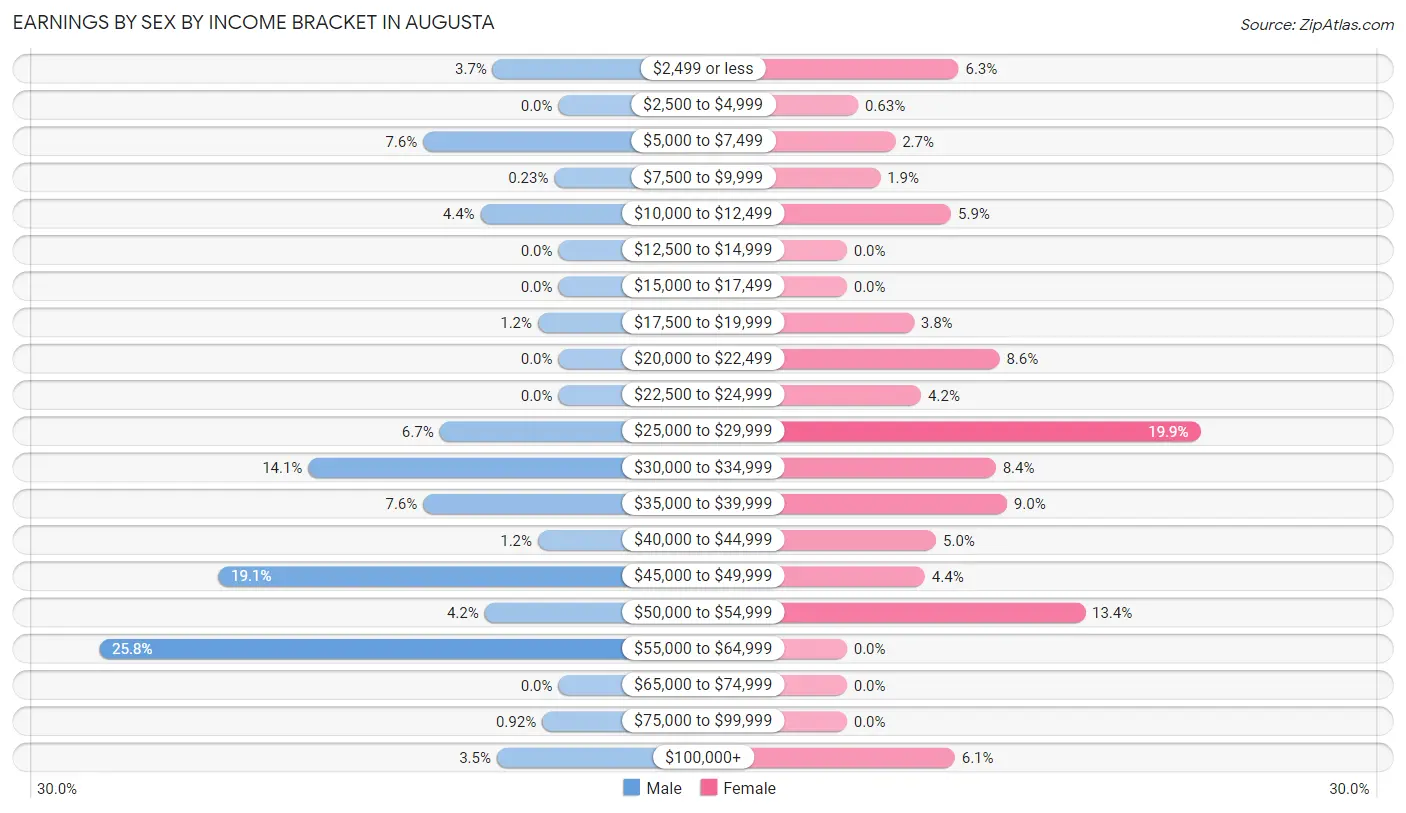
Earnings by Sex by Income Bracket in Augusta
The most common earnings brackets in Augusta are $55,000 to $64,999 for men (112 | 25.8%) and $25,000 to $29,999 for women (95 | 19.9%).
| Income | Male | Female |
| $2,499 or less | 16 (3.7%) | 30 (6.3%) |
| $2,500 to $4,999 | 0 (0.0%) | 3 (0.6%) |
| $5,000 to $7,499 | 33 (7.6%) | 13 (2.7%) |
| $7,500 to $9,999 | 1 (0.2%) | 9 (1.9%) |
| $10,000 to $12,499 | 19 (4.4%) | 28 (5.9%) |
| $12,500 to $14,999 | 0 (0.0%) | 0 (0.0%) |
| $15,000 to $17,499 | 0 (0.0%) | 0 (0.0%) |
| $17,500 to $19,999 | 5 (1.1%) | 18 (3.8%) |
| $20,000 to $22,499 | 0 (0.0%) | 41 (8.6%) |
| $22,500 to $24,999 | 0 (0.0%) | 20 (4.2%) |
| $25,000 to $29,999 | 29 (6.7%) | 95 (19.9%) |
| $30,000 to $34,999 | 61 (14.1%) | 40 (8.4%) |
| $35,000 to $39,999 | 33 (7.6%) | 43 (9.0%) |
| $40,000 to $44,999 | 5 (1.1%) | 24 (5.0%) |
| $45,000 to $49,999 | 83 (19.1%) | 21 (4.4%) |
| $50,000 to $54,999 | 18 (4.2%) | 64 (13.4%) |
| $55,000 to $64,999 | 112 (25.8%) | 0 (0.0%) |
| $65,000 to $74,999 | 0 (0.0%) | 0 (0.0%) |
| $75,000 to $99,999 | 4 (0.9%) | 0 (0.0%) |
| $100,000+ | 15 (3.5%) | 29 (6.1%) |
| Total | 434 (100.0%) | 478 (100.0%) |
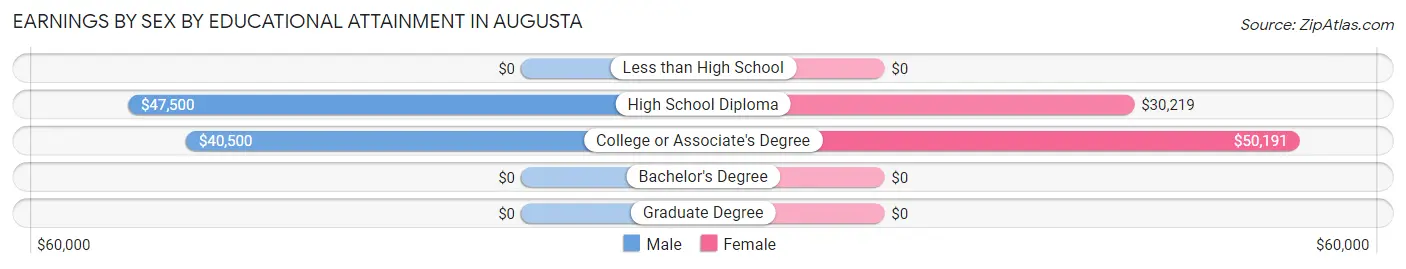
Earnings by Sex by Educational Attainment in Augusta
Average earnings in Augusta are $45,901 for men and $35,262 for women, a difference of 23.2%. Men with an educational attainment of high school diploma enjoy the highest average annual earnings of $47,500, while those with college or associate's degree education earn the least with $40,500. Women with an educational attainment of college or associate's degree earn the most with the average annual earnings of $50,191, while those with high school diploma education have the smallest earnings of $30,219.
| Educational Attainment | Male Income | Female Income |
| Less than High School | - | - |
| High School Diploma | $47,500 | $30,219 |
| College or Associate's Degree | $40,500 | $50,191 |
| Bachelor's Degree | - | - |
| Graduate Degree | - | - |
| Total | $45,901 | $35,262 |
Family Income in Augusta
Family Income Brackets in Augusta
According to the Augusta family income data, there are 150 families falling into the $75,000 to $99,999 income range, which is the most common income bracket and makes up 28.8% of all families. Conversely, the $150,000 to $199,999 income bracket is the least frequent group with only 4 families (0.8%) belonging to this category.
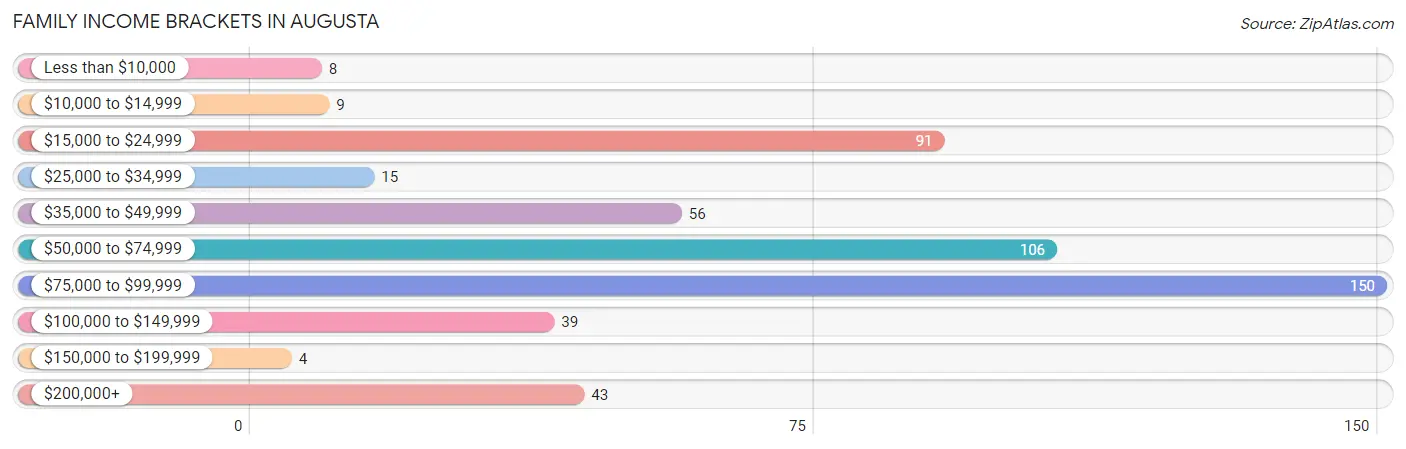
| Income Bracket | # Families | % Families |
| Less than $10,000 | 8 | 1.5% |
| $10,000 to $14,999 | 9 | 1.7% |
| $15,000 to $24,999 | 91 | 17.5% |
| $25,000 to $34,999 | 15 | 2.9% |
| $35,000 to $49,999 | 56 | 10.7% |
| $50,000 to $74,999 | 106 | 20.3% |
| $75,000 to $99,999 | 150 | 28.8% |
| $100,000 to $149,999 | 39 | 7.5% |
| $150,000 to $199,999 | 4 | 0.8% |
| $200,000+ | 43 | 8.3% |
Family Income by Famaliy Size in Augusta
2-person families (291 | 55.8%) account for the highest median family income in Augusta with $75,052 per family, while 2-person families (291 | 55.8%) have the highest median income of $37,526 per family member.
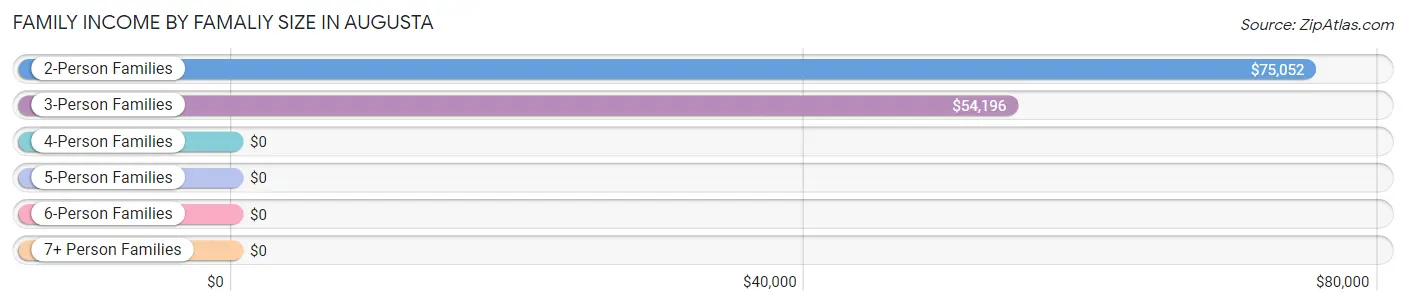
| Income Bracket | # Families | Median Income |
| 2-Person Families | 291 (55.8%) | $75,052 |
| 3-Person Families | 111 (21.3%) | $54,196 |
| 4-Person Families | 111 (21.3%) | $0 |
| 5-Person Families | 0 (0.0%) | $0 |
| 6-Person Families | 0 (0.0%) | $0 |
| 7+ Person Families | 8 (1.5%) | $0 |
| Total | 521 (100.0%) | $60,625 |
Family Income by Number of Earners in Augusta
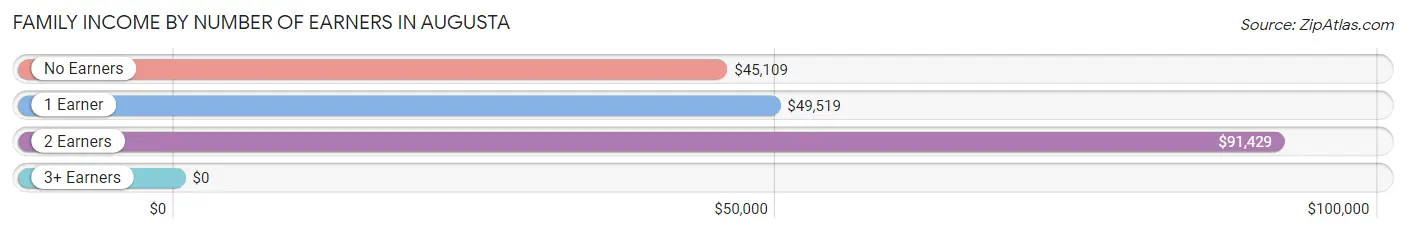
| Number of Earners | # Families | Median Income |
| No Earners | 144 (27.6%) | $45,109 |
| 1 Earner | 147 (28.2%) | $49,519 |
| 2 Earners | 222 (42.6%) | $91,429 |
| 3+ Earners | 8 (1.5%) | $0 |
| Total | 521 (100.0%) | $60,625 |
Household Income in Augusta
Household Income Brackets in Augusta
With 187 households falling in the category, the $50,000 to $74,999 income range is the most frequent in Augusta, accounting for 22.4% of all households. In contrast, only 4 households (0.5%) fall into the $150,000 to $199,999 income bracket, making it the least populous group.
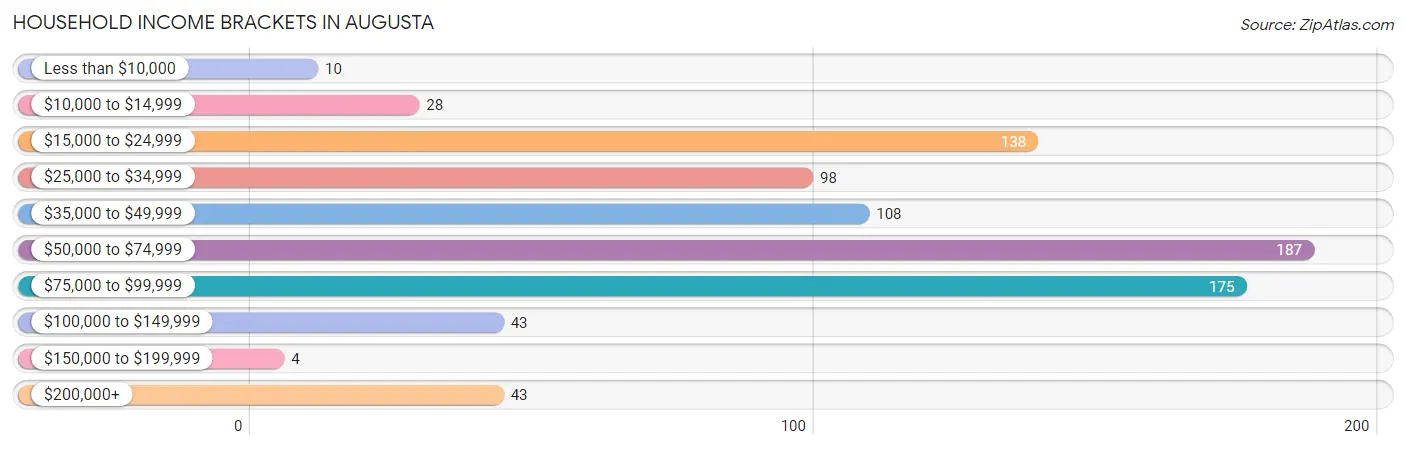
| Income Bracket | # Households | % Households |
| Less than $10,000 | 10 | 1.2% |
| $10,000 to $14,999 | 28 | 3.4% |
| $15,000 to $24,999 | 138 | 16.5% |
| $25,000 to $34,999 | 98 | 11.8% |
| $35,000 to $49,999 | 108 | 12.9% |
| $50,000 to $74,999 | 187 | 22.4% |
| $75,000 to $99,999 | 175 | 21.0% |
| $100,000 to $149,999 | 43 | 5.2% |
| $150,000 to $199,999 | 4 | 0.5% |
| $200,000+ | 43 | 5.2% |
Household Income by Householder Age in Augusta
The median household income in Augusta is $51,535, with the highest median household income of $76,250 found in the 45 to 64 years age bracket for the primary householder. A total of 312 households (37.4%) fall into this category. Meanwhile, the 65+ years age bracket for the primary householder has the lowest median household income of $0, with 359 households (43.0%) in this group.
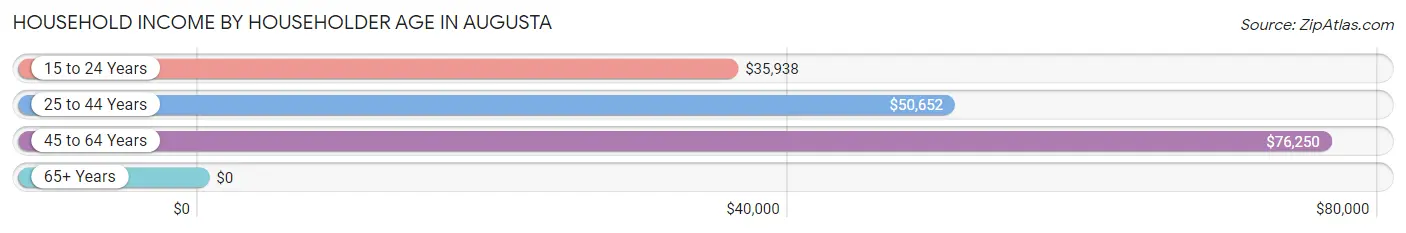
| Income Bracket | # Households | Median Income |
| 15 to 24 Years | 53 (6.4%) | $35,938 |
| 25 to 44 Years | 110 (13.2%) | $50,652 |
| 45 to 64 Years | 312 (37.4%) | $76,250 |
| 65+ Years | 359 (43.0%) | $0 |
| Total | 834 (100.0%) | $51,535 |
Poverty in Augusta
Income Below Poverty by Sex and Age in Augusta
With 15.7% poverty level for males and 17.0% for females among the residents of Augusta, 5 year old males and 6 to 11 year old females are the most vulnerable to poverty, with 12 males (100.0%) and 19 females (52.8%) in their respective age groups living below the poverty level.
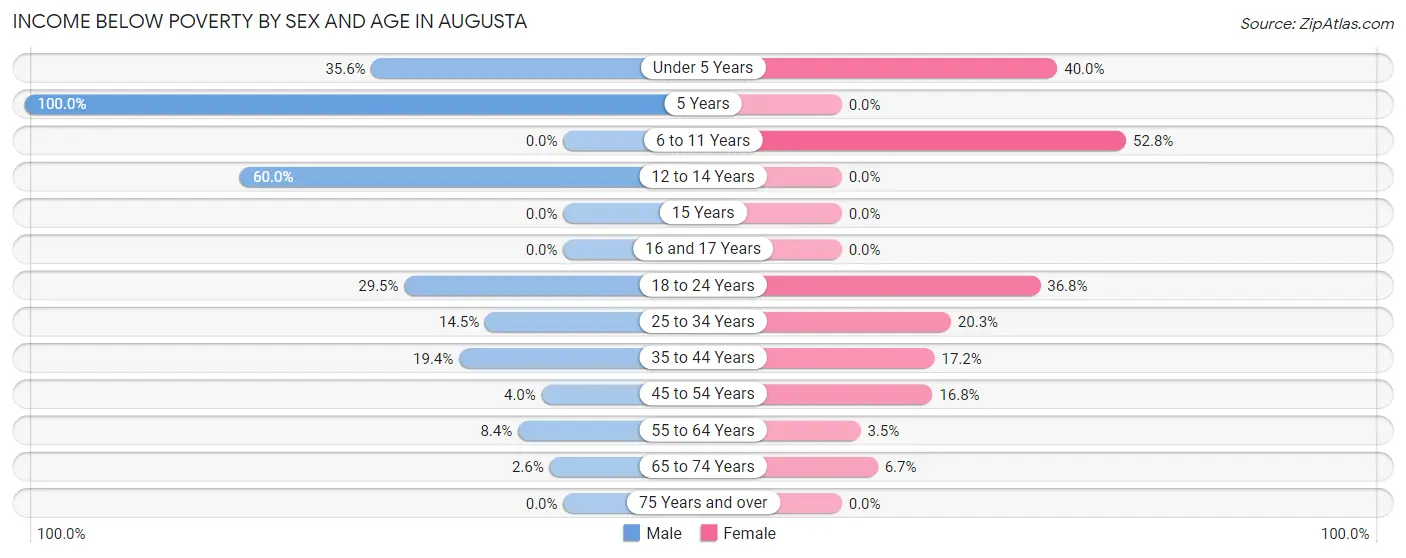
| Age Bracket | Male | Female |
| Under 5 Years | 52 (35.6%) | 14 (40.0%) |
| 5 Years | 12 (100.0%) | 0 (0.0%) |
| 6 to 11 Years | 0 (0.0%) | 19 (52.8%) |
| 12 to 14 Years | 24 (60.0%) | 0 (0.0%) |
| 15 Years | 0 (0.0%) | 0 (0.0%) |
| 16 and 17 Years | 0 (0.0%) | 0 (0.0%) |
| 18 to 24 Years | 18 (29.5%) | 70 (36.8%) |
| 25 to 34 Years | 9 (14.5%) | 16 (20.3%) |
| 35 to 44 Years | 18 (19.4%) | 21 (17.2%) |
| 45 to 54 Years | 5 (4.0%) | 18 (16.8%) |
| 55 to 64 Years | 11 (8.4%) | 4 (3.5%) |
| 65 to 74 Years | 4 (2.6%) | 9 (6.7%) |
| 75 Years and over | 0 (0.0%) | 0 (0.0%) |
| Total | 153 (15.7%) | 171 (17.0%) |
Income Above Poverty by Sex and Age in Augusta
According to the poverty statistics in Augusta, males aged 6 to 11 years and females aged 12 to 14 years are the age groups that are most secure financially, with 100.0% of males and 100.0% of females in these age groups living above the poverty line.
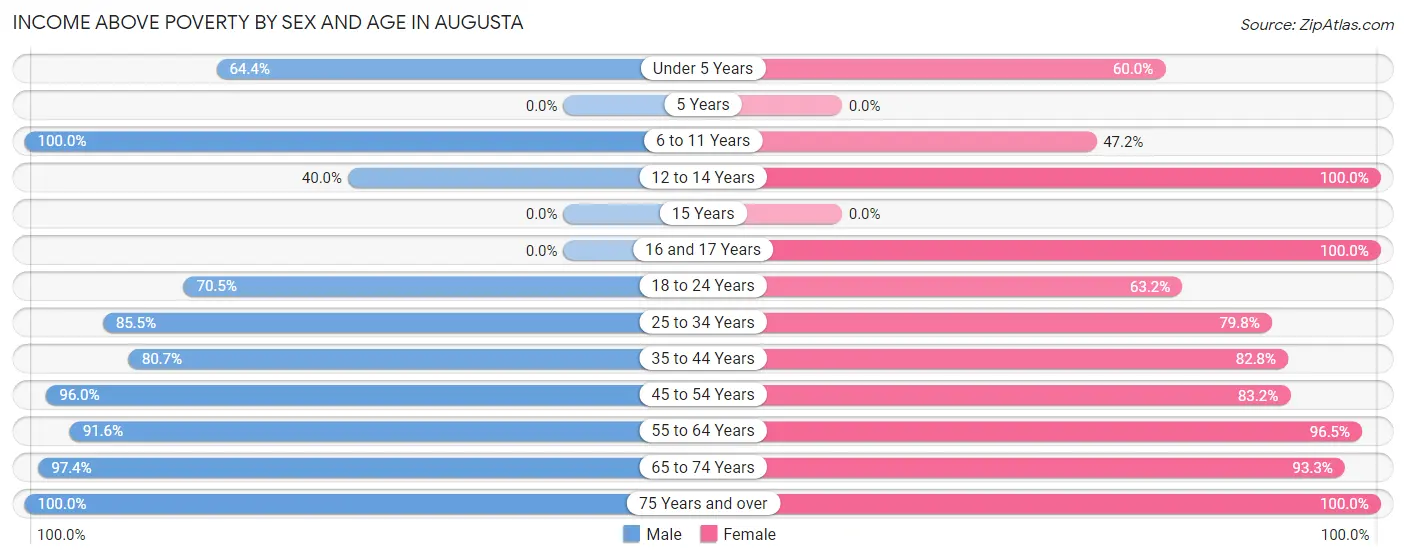
| Age Bracket | Male | Female |
| Under 5 Years | 94 (64.4%) | 21 (60.0%) |
| 5 Years | 0 (0.0%) | 0 (0.0%) |
| 6 to 11 Years | 69 (100.0%) | 17 (47.2%) |
| 12 to 14 Years | 16 (40.0%) | 8 (100.0%) |
| 15 Years | 0 (0.0%) | 0 (0.0%) |
| 16 and 17 Years | 0 (0.0%) | 76 (100.0%) |
| 18 to 24 Years | 43 (70.5%) | 120 (63.2%) |
| 25 to 34 Years | 53 (85.5%) | 63 (79.7%) |
| 35 to 44 Years | 75 (80.6%) | 101 (82.8%) |
| 45 to 54 Years | 119 (96.0%) | 89 (83.2%) |
| 55 to 64 Years | 120 (91.6%) | 111 (96.5%) |
| 65 to 74 Years | 152 (97.4%) | 126 (93.3%) |
| 75 Years and over | 83 (100.0%) | 106 (100.0%) |
| Total | 824 (84.3%) | 838 (83.1%) |
Income Below Poverty Among Married-Couple Families in Augusta
The poverty statistics for married-couple families in Augusta show that 1.3% or 5 of the total 390 families live below the poverty line. Families with no children have the highest poverty rate of 1.9%, comprising of 5 families. On the other hand, families with 1 or 2 children have the lowest poverty rate of 0.0%, which includes 0 families.
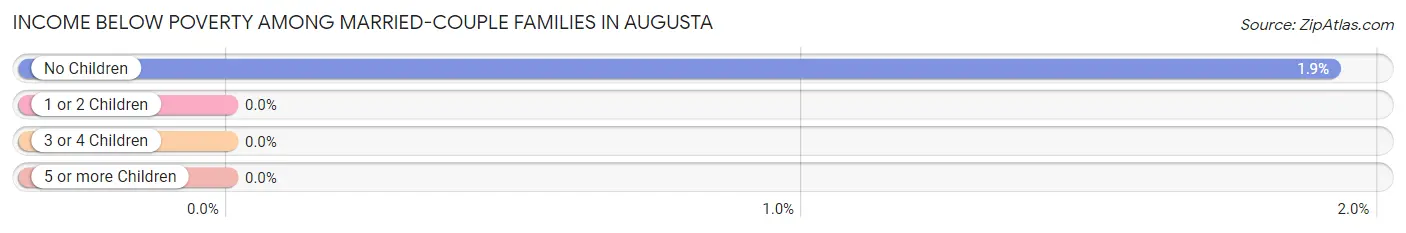
| Children | Above Poverty | Below Poverty |
| No Children | 255 (98.1%) | 5 (1.9%) |
| 1 or 2 Children | 130 (100.0%) | 0 (0.0%) |
| 3 or 4 Children | 0 (0.0%) | 0 (0.0%) |
| 5 or more Children | 0 (0.0%) | 0 (0.0%) |
| Total | 385 (98.7%) | 5 (1.3%) |
Income Below Poverty Among Single-Parent Households in Augusta
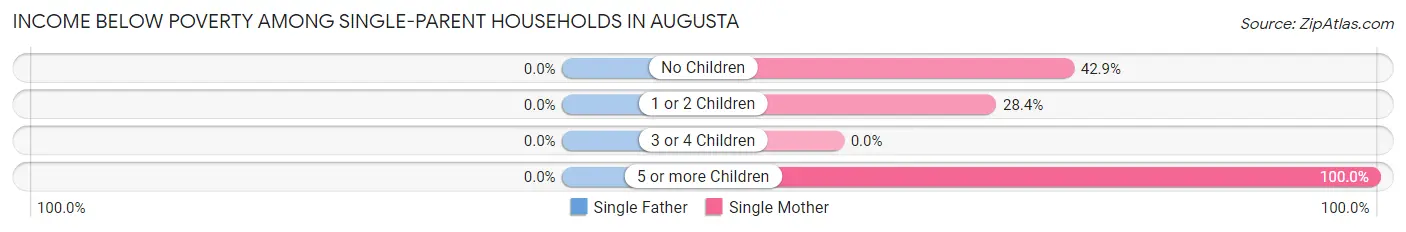
| Children | Single Father | Single Mother |
| No Children | 0 (0.0%) | 15 (42.9%) |
| 1 or 2 Children | 0 (0.0%) | 21 (28.4%) |
| 3 or 4 Children | 0 (0.0%) | 0 (0.0%) |
| 5 or more Children | 0 (0.0%) | 8 (100.0%) |
| Total | 0 (0.0%) | 44 (37.6%) |
Income Below Poverty Among Married-Couple vs Single-Parent Households in Augusta
The poverty data for Augusta shows that 5 of the married-couple family households (1.3%) and 44 of the single-parent households (33.6%) are living below the poverty level. Within the married-couple family households, those with no children have the highest poverty rate, with 5 households (1.9%) falling below the poverty line. Among the single-parent households, those with 5 or more children have the highest poverty rate, with 8 household (100.0%) living below poverty.
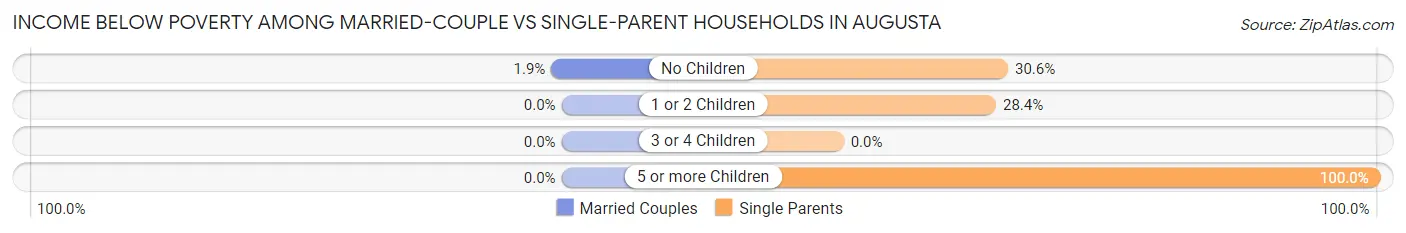
| Children | Married-Couple Families | Single-Parent Households |
| No Children | 5 (1.9%) | 15 (30.6%) |
| 1 or 2 Children | 0 (0.0%) | 21 (28.4%) |
| 3 or 4 Children | 0 (0.0%) | 0 (0.0%) |
| 5 or more Children | 0 (0.0%) | 8 (100.0%) |
| Total | 5 (1.3%) | 44 (33.6%) |
Race in Augusta
The most populous races in Augusta are White / Caucasian (1,124 | 56.3%), Black / African American (806 | 40.4%), and Two or more Races (46 | 2.3%).
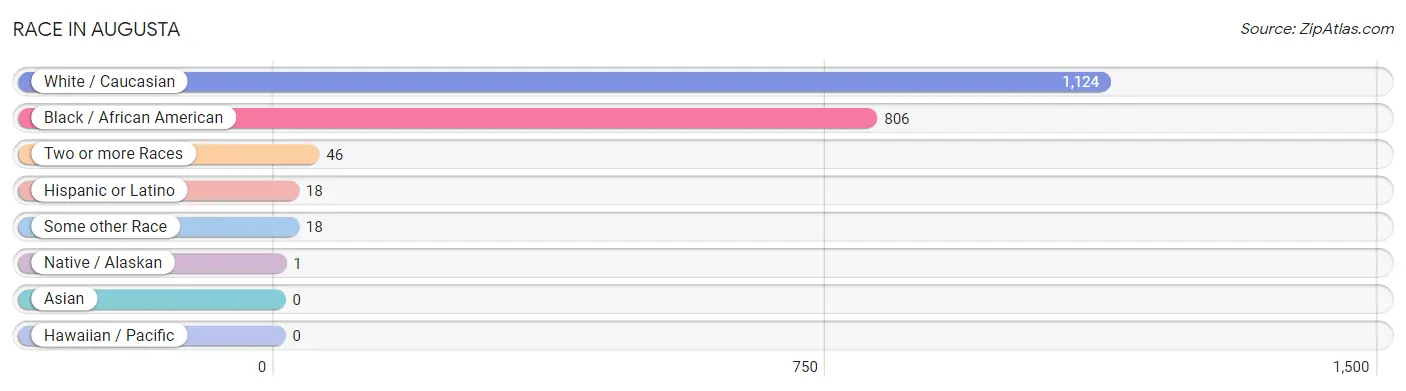
| Race | # Population | % Population |
| Asian | 0 | 0.0% |
| Black / African American | 806 | 40.4% |
| Hawaiian / Pacific | 0 | 0.0% |
| Hispanic or Latino | 18 | 0.9% |
| Native / Alaskan | 1 | 0.1% |
| White / Caucasian | 1,124 | 56.3% |
| Two or more Races | 46 | 2.3% |
| Some other Race | 18 | 0.9% |
| Total | 1,995 | 100.0% |
Ancestry in Augusta
The most populous ancestries reported in Augusta are Irish (250 | 12.5%), American (144 | 7.2%), German (109 | 5.5%), English (65 | 3.3%), and African (36 | 1.8%), together accounting for 30.3% of all Augusta residents.
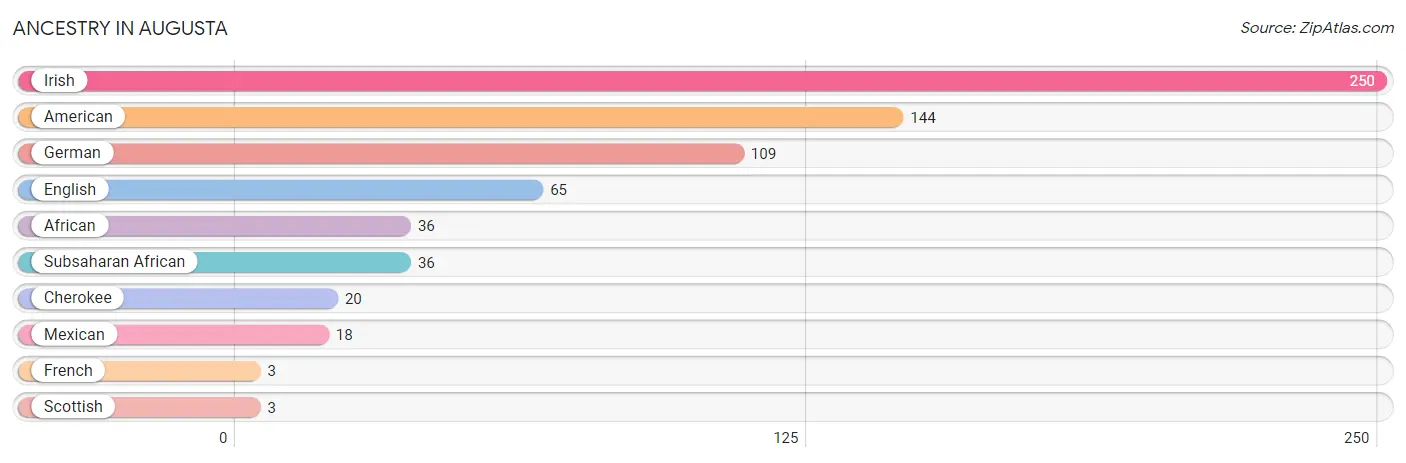
| Ancestry | # Population | % Population |
| African | 36 | 1.8% |
| American | 144 | 7.2% |
| Cherokee | 20 | 1.0% |
| English | 65 | 3.3% |
| French | 3 | 0.2% |
| German | 109 | 5.5% |
| Irish | 250 | 12.5% |
| Mexican | 18 | 0.9% |
| Scottish | 3 | 0.2% |
| Subsaharan African | 36 | 1.8% | View All 10 Rows |
Immigrants in Augusta

| Immigration Origin | # Population | % Population | View All 0 Rows |
Sex and Age in Augusta
Sex and Age in Augusta
The most populous age groups in Augusta are Under 5 Years (146 | 14.8%) for men and 20 to 24 Years (171 | 16.9%) for women.
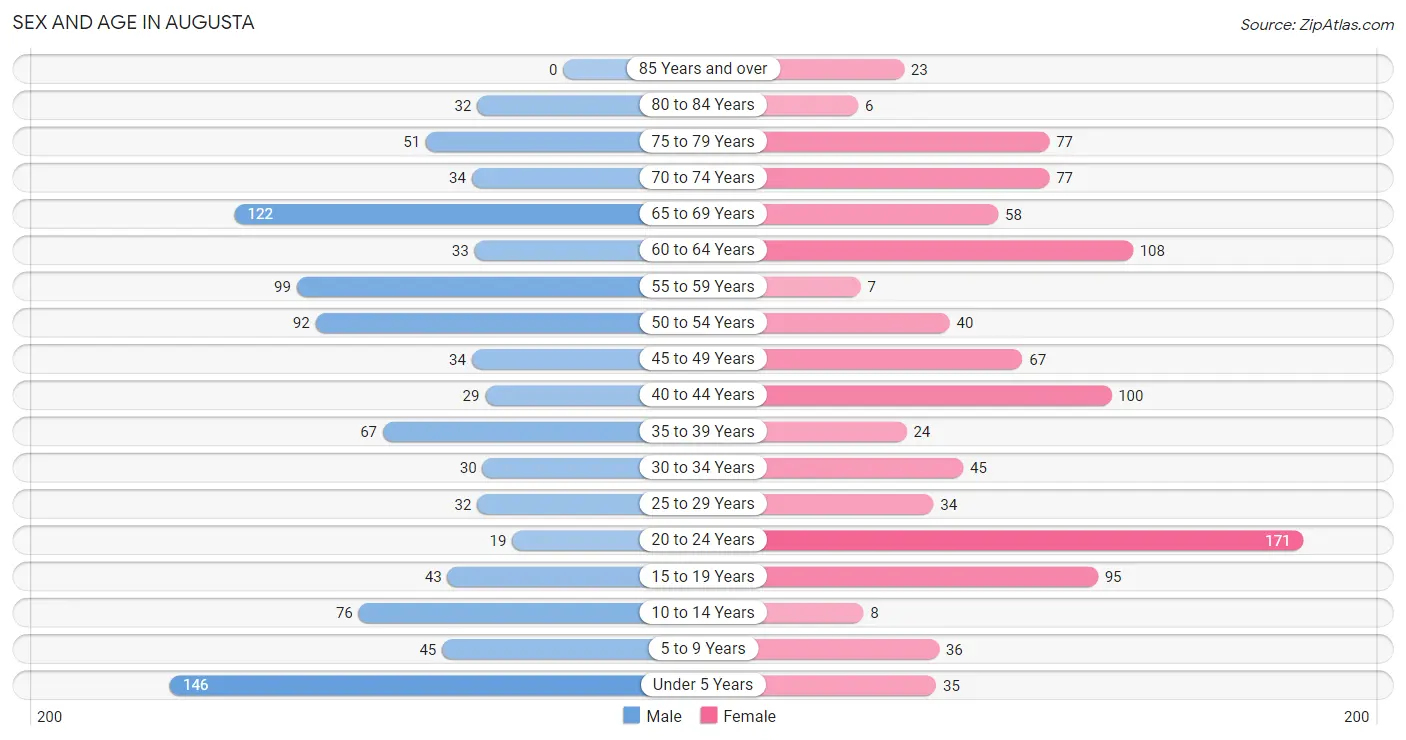
| Age Bracket | Male | Female |
| Under 5 Years | 146 (14.8%) | 35 (3.5%) |
| 5 to 9 Years | 45 (4.6%) | 36 (3.6%) |
| 10 to 14 Years | 76 (7.7%) | 8 (0.8%) |
| 15 to 19 Years | 43 (4.4%) | 95 (9.4%) |
| 20 to 24 Years | 19 (1.9%) | 171 (16.9%) |
| 25 to 29 Years | 32 (3.3%) | 34 (3.4%) |
| 30 to 34 Years | 30 (3.0%) | 45 (4.4%) |
| 35 to 39 Years | 67 (6.8%) | 24 (2.4%) |
| 40 to 44 Years | 29 (2.9%) | 100 (9.9%) |
| 45 to 49 Years | 34 (3.5%) | 67 (6.6%) |
| 50 to 54 Years | 92 (9.3%) | 40 (4.0%) |
| 55 to 59 Years | 99 (10.1%) | 7 (0.7%) |
| 60 to 64 Years | 33 (3.4%) | 108 (10.7%) |
| 65 to 69 Years | 122 (12.4%) | 58 (5.7%) |
| 70 to 74 Years | 34 (3.5%) | 77 (7.6%) |
| 75 to 79 Years | 51 (5.2%) | 77 (7.6%) |
| 80 to 84 Years | 32 (3.3%) | 6 (0.6%) |
| 85 Years and over | 0 (0.0%) | 23 (2.3%) |
| Total | 984 (100.0%) | 1,011 (100.0%) |
Families and Households in Augusta
Median Family Size in Augusta
The median family size in Augusta is 3.02 persons per family, with single female/mother families (117 | 22.5%) accounting for the largest median family size of 3.88 persons per family. On the other hand, single male/father families (14 | 2.7%) represent the smallest median family size with 2.07 persons per family.
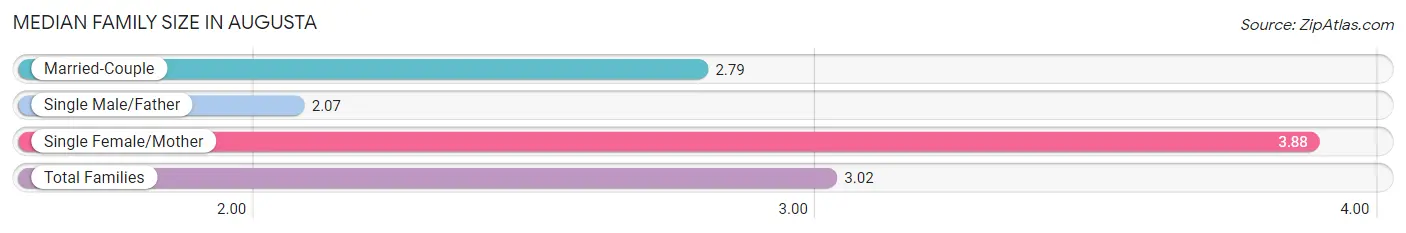
| Family Type | # Families | Family Size |
| Married-Couple | 390 (74.9%) | 2.79 |
| Single Male/Father | 14 (2.7%) | 2.07 |
| Single Female/Mother | 117 (22.5%) | 3.88 |
| Total Families | 521 (100.0%) | 3.02 |
Median Household Size in Augusta
The median household size in Augusta is 2.38 persons per household, with single female/mother households (117 | 14.0%) accounting for the largest median household size of 4.26 persons per household. non-family households (313 | 37.5%) represent the smallest median household size with 1.19 persons per household.
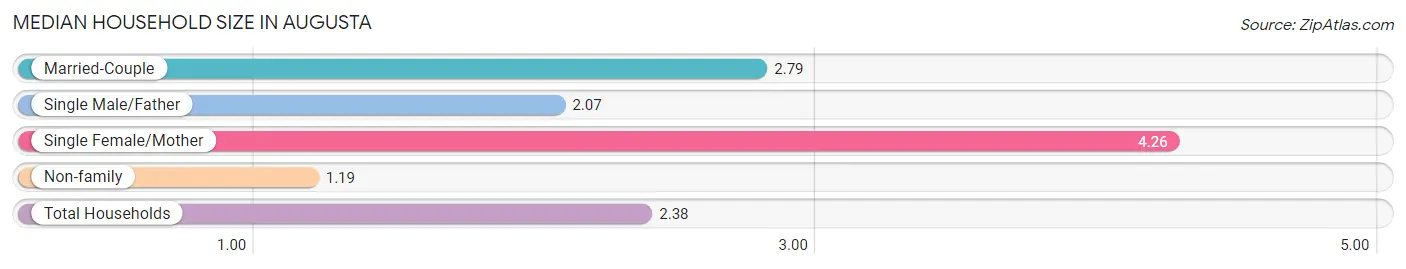
| Household Type | # Households | Household Size |
| Married-Couple | 390 (46.8%) | 2.79 |
| Single Male/Father | 14 (1.7%) | 2.07 |
| Single Female/Mother | 117 (14.0%) | 4.26 |
| Non-family | 313 (37.5%) | 1.19 |
| Total Households | 834 (100.0%) | 2.38 |
Household Size by Marriage Status in Augusta
Out of a total of 834 households in Augusta, 521 (62.5%) are family households, while 313 (37.5%) are nonfamily households. The most numerous type of family households are 2-person households, comprising 270, and the most common type of nonfamily households are 1-person households, comprising 266.
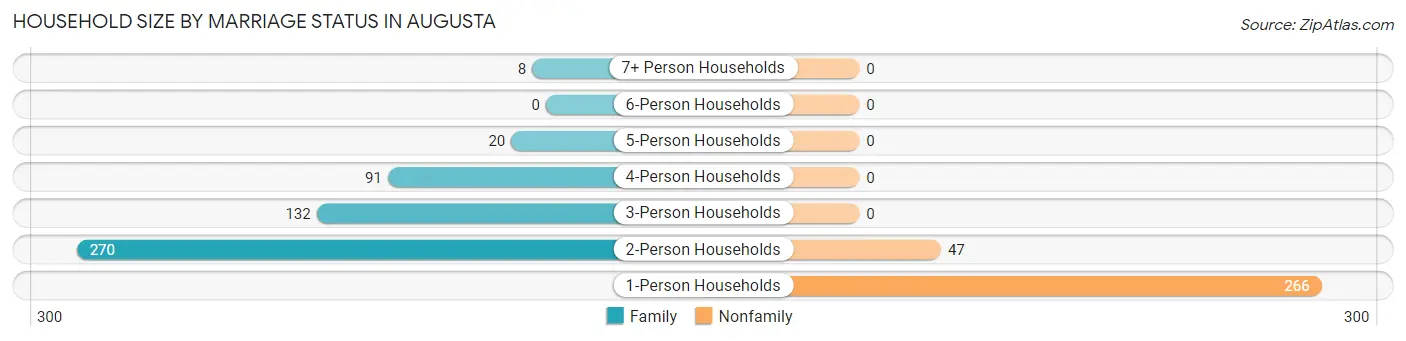
| Household Size | Family Households | Nonfamily Households |
| 1-Person Households | - | 266 (31.9%) |
| 2-Person Households | 270 (32.4%) | 47 (5.6%) |
| 3-Person Households | 132 (15.8%) | 0 (0.0%) |
| 4-Person Households | 91 (10.9%) | 0 (0.0%) |
| 5-Person Households | 20 (2.4%) | 0 (0.0%) |
| 6-Person Households | 0 (0.0%) | 0 (0.0%) |
| 7+ Person Households | 8 (1.0%) | 0 (0.0%) |
| Total | 521 (62.5%) | 313 (37.5%) |
Female Fertility in Augusta
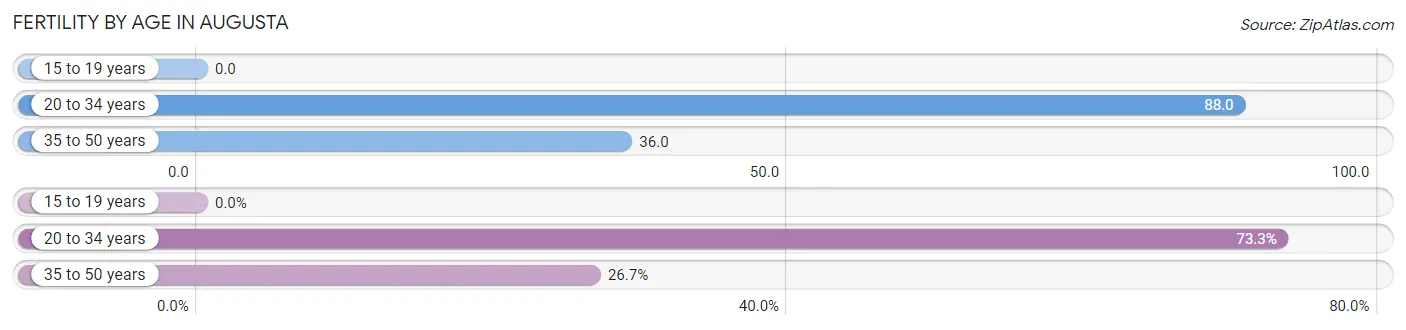
Fertility by Age in Augusta
Average fertility rate in Augusta is 53.0 births per 1,000 women. Women in the age bracket of 20 to 34 years have the highest fertility rate with 88.0 births per 1,000 women. Women in the age bracket of 20 to 34 years acount for 73.3% of all women with births.
| Age Bracket | Women with Births | Births / 1,000 Women |
| 15 to 19 years | 0 (0.0%) | 0.0 |
| 20 to 34 years | 22 (73.3%) | 88.0 |
| 35 to 50 years | 8 (26.7%) | 36.0 |
| Total | 30 (100.0%) | 53.0 |
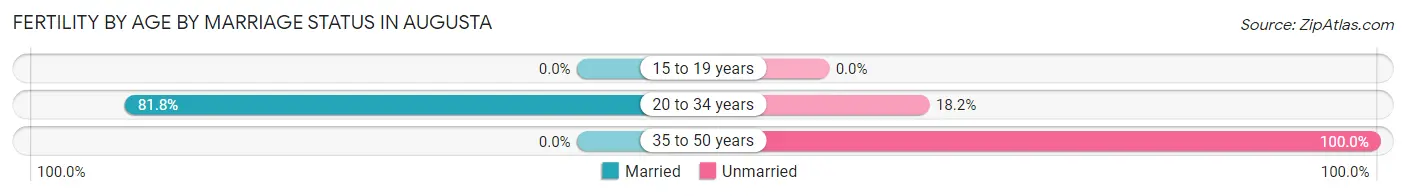
Fertility by Age by Marriage Status in Augusta
60.0% of women with births (30) in Augusta are married. The highest percentage of unmarried women with births falls into 35 to 50 years age bracket with 100.0% of them unmarried at the time of birth, while the lowest percentage of unmarried women with births belong to 20 to 34 years age bracket with 18.2% of them unmarried.
| Age Bracket | Married | Unmarried |
| 15 to 19 years | 0 (0.0%) | 0 (0.0%) |
| 20 to 34 years | 18 (81.8%) | 4 (18.2%) |
| 35 to 50 years | 0 (0.0%) | 8 (100.0%) |
| Total | 18 (60.0%) | 12 (40.0%) |
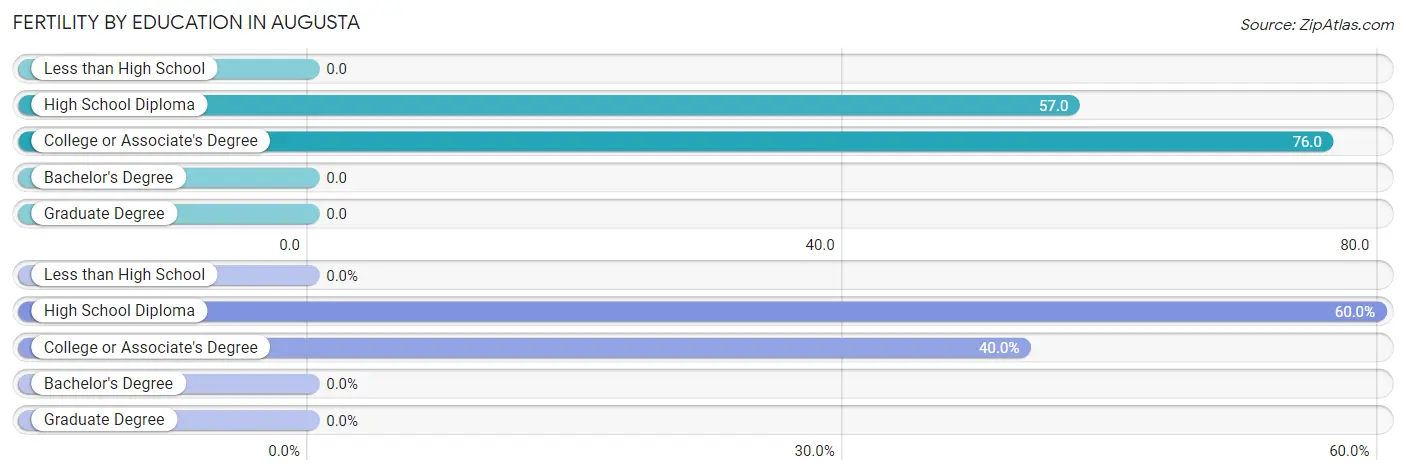
Fertility by Education in Augusta
| Educational Attainment | Women with Births | Births / 1,000 Women |
| Less than High School | 0 (0.0%) | 0.0 |
| High School Diploma | 18 (60.0%) | 57.0 |
| College or Associate's Degree | 12 (40.0%) | 76.0 |
| Bachelor's Degree | 0 (0.0%) | 0.0 |
| Graduate Degree | 0 (0.0%) | 0.0 |
| Total | 30 (100.0%) | 53.0 |
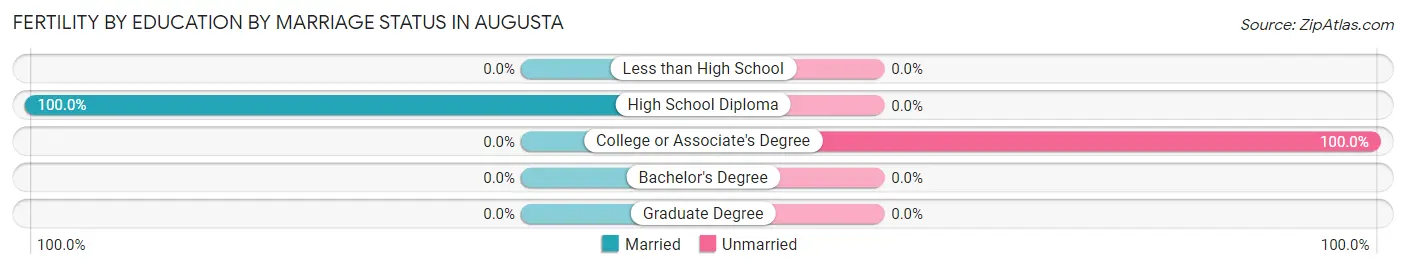
Fertility by Education by Marriage Status in Augusta
40.0% of women with births in Augusta are unmarried. Women with the educational attainment of high school diploma are most likely to be married with 100.0% of them married at childbirth, while women with the educational attainment of college or associate's degree are least likely to be married with 100.0% of them unmarried at childbirth.
| Educational Attainment | Married | Unmarried |
| Less than High School | 0 (0.0%) | 0 (0.0%) |
| High School Diploma | 18 (100.0%) | 0 (0.0%) |
| College or Associate's Degree | 0 (0.0%) | 12 (100.0%) |
| Bachelor's Degree | 0 (0.0%) | 0 (0.0%) |
| Graduate Degree | 0 (0.0%) | 0 (0.0%) |
| Total | 18 (60.0%) | 12 (40.0%) |
Employment Characteristics in Augusta
Employment by Class of Employer in Augusta
Among the 843 employed individuals in Augusta, private company employees (521 | 61.8%), local government employees (103 | 12.2%), and self-employed (not incorporated) (87 | 10.3%) make up the most common classes of employment.
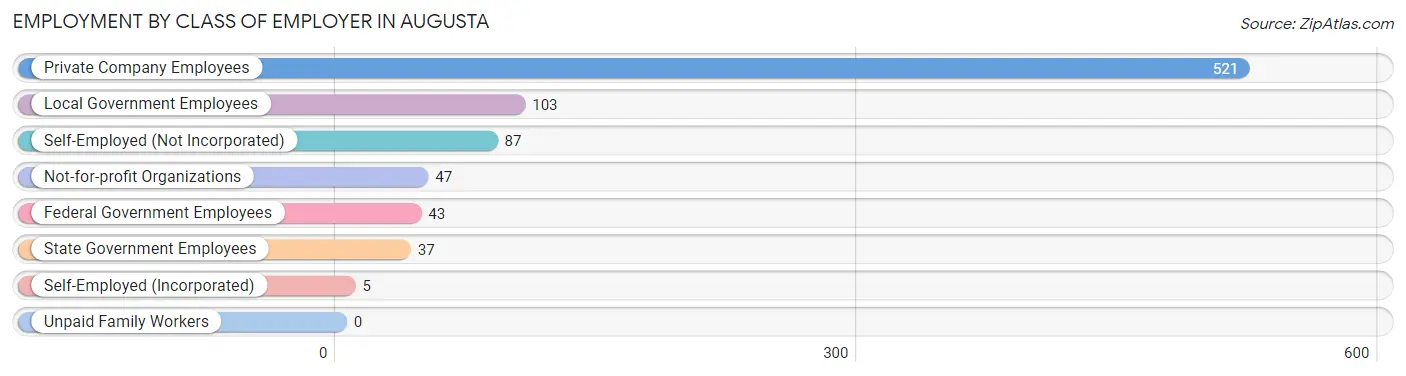
| Employer Class | # Employees | % Employees |
| Private Company Employees | 521 | 61.8% |
| Self-Employed (Incorporated) | 5 | 0.6% |
| Self-Employed (Not Incorporated) | 87 | 10.3% |
| Not-for-profit Organizations | 47 | 5.6% |
| Local Government Employees | 103 | 12.2% |
| State Government Employees | 37 | 4.4% |
| Federal Government Employees | 43 | 5.1% |
| Unpaid Family Workers | 0 | 0.0% |
| Total | 843 | 100.0% |
Employment Status by Age in Augusta
According to the labor force statistics for Augusta, out of the total population over 16 years of age (1,649), 54.4% or 897 individuals are in the labor force, with 6.0% or 54 of them unemployed. The age group with the highest labor force participation rate is 30 to 34 years, with 100.0% or 75 individuals in the labor force. Within the labor force, the 20 to 24 years age range has the highest percentage of unemployed individuals, with 20.0% or 31 of them being unemployed.
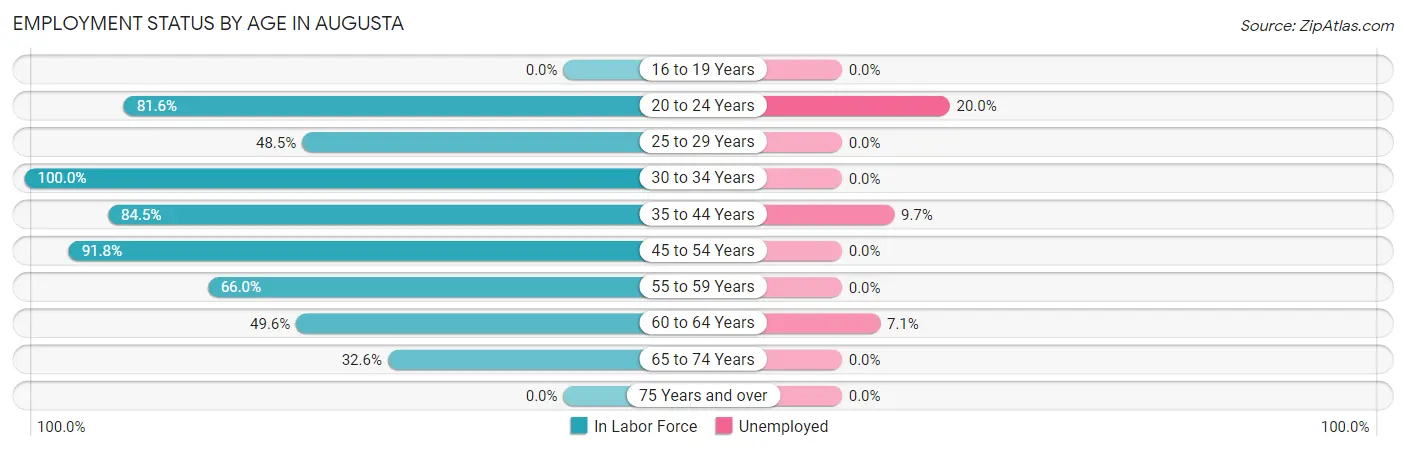
| Age Bracket | In Labor Force | Unemployed |
| 16 to 19 Years | 0 (0.0%) | 0 (0.0%) |
| 20 to 24 Years | 155 (81.6%) | 31 (20.0%) |
| 25 to 29 Years | 32 (48.5%) | 0 (0.0%) |
| 30 to 34 Years | 75 (100.0%) | 0 (0.0%) |
| 35 to 44 Years | 186 (84.5%) | 18 (9.7%) |
| 45 to 54 Years | 214 (91.8%) | 0 (0.0%) |
| 55 to 59 Years | 70 (66.0%) | 0 (0.0%) |
| 60 to 64 Years | 70 (49.6%) | 5 (7.1%) |
| 65 to 74 Years | 95 (32.6%) | 0 (0.0%) |
| 75 Years and over | 0 (0.0%) | 0 (0.0%) |
| Total | 897 (54.4%) | 54 (6.0%) |
Employment Status by Educational Attainment in Augusta
According to labor force statistics for Augusta, 76.9% of individuals (647) out of the total population between 25 and 64 years of age (841) are in the labor force, with 3.6% or 23 of them being unemployed. The group with the highest labor force participation rate are those with the educational attainment of college / associate degree, with 92.0% or 150 individuals in the labor force. Within the labor force, individuals with high school diploma education have the highest percentage of unemployment, with 3.7% or 18 of them being unemployed.
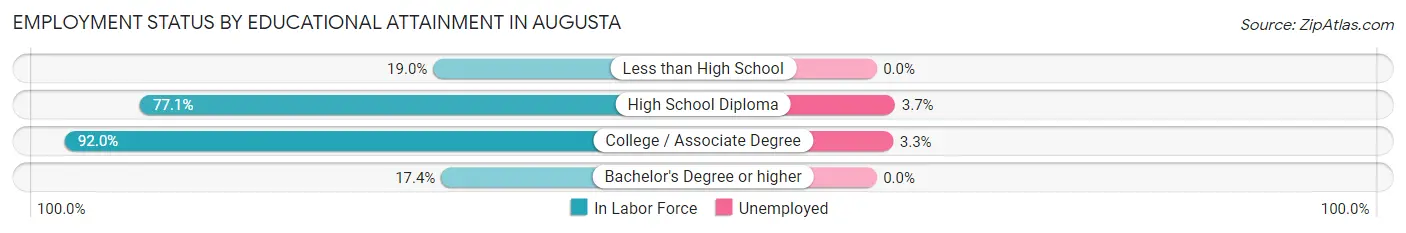
| Educational Attainment | In Labor Force | Unemployed |
| Less than High School | 4 (19.0%) | 0 (0.0%) |
| High School Diploma | 489 (77.1%) | 23 (3.7%) |
| College / Associate Degree | 150 (92.0%) | 5 (3.3%) |
| Bachelor's Degree or higher | 4 (17.4%) | 0 (0.0%) |
| Total | 647 (76.9%) | 30 (3.6%) |
Employment Occupations by Sex in Augusta
Management, Business, Science and Arts Occupations
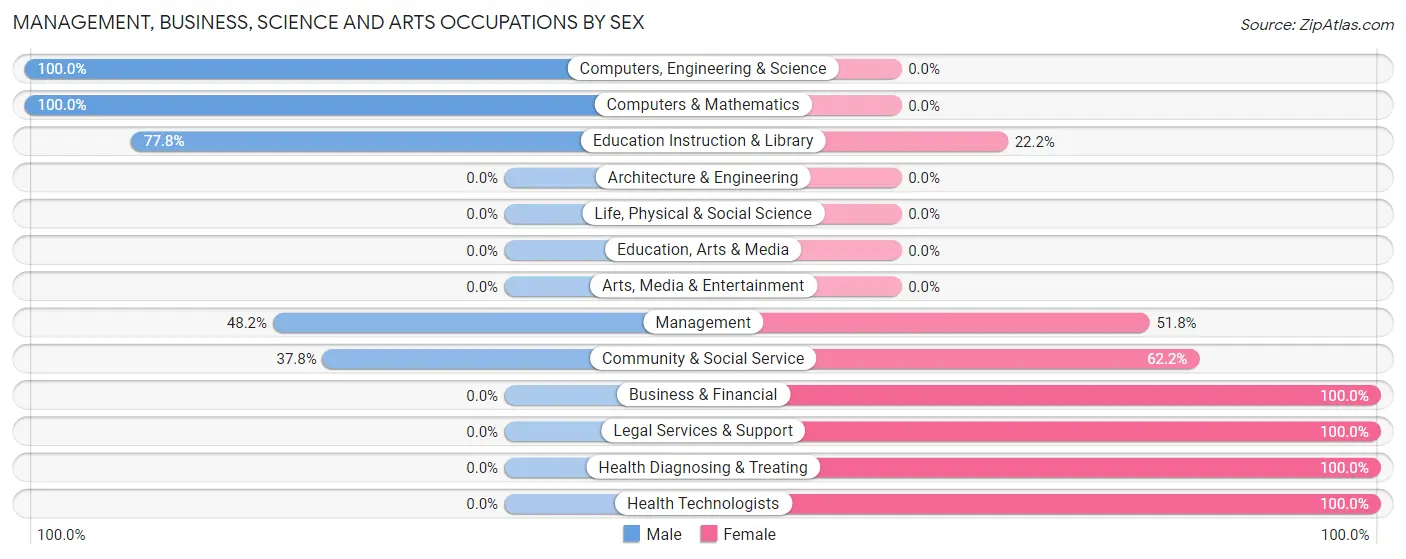
The most common Management, Business, Science and Arts occupations in Augusta are Health Diagnosing & Treating (92 | 10.9%), Management (56 | 6.6%), Health Technologists (39 | 4.6%), Community & Social Service (37 | 4.4%), and Business & Financial (21 | 2.5%).
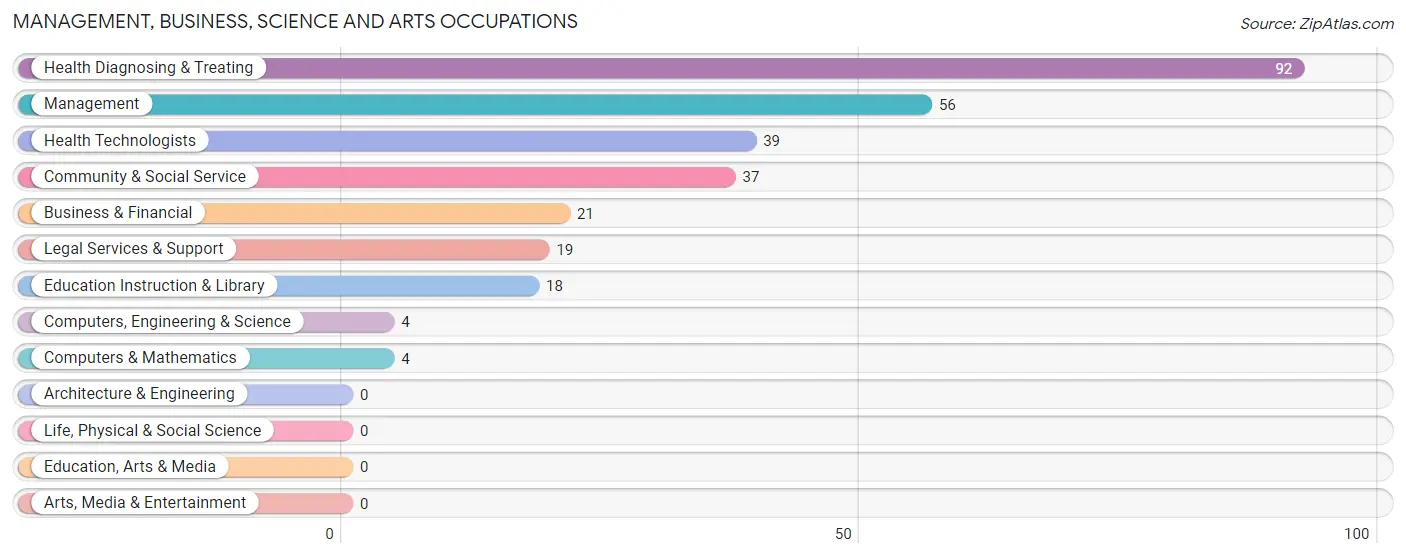
Management, Business, Science and Arts Occupations by Sex
Within the Management, Business, Science and Arts occupations in Augusta, the most male-oriented occupations are Computers, Engineering & Science (100.0%), Computers & Mathematics (100.0%), and Education Instruction & Library (77.8%), while the most female-oriented occupations are Business & Financial (100.0%), Legal Services & Support (100.0%), and Health Diagnosing & Treating (100.0%).
| Occupation | Male | Female |
| Management | 27 (48.2%) | 29 (51.8%) |
| Business & Financial | 0 (0.0%) | 21 (100.0%) |
| Computers, Engineering & Science | 4 (100.0%) | 0 (0.0%) |
| Computers & Mathematics | 4 (100.0%) | 0 (0.0%) |
| Architecture & Engineering | 0 (0.0%) | 0 (0.0%) |
| Life, Physical & Social Science | 0 (0.0%) | 0 (0.0%) |
| Community & Social Service | 14 (37.8%) | 23 (62.2%) |
| Education, Arts & Media | 0 (0.0%) | 0 (0.0%) |
| Legal Services & Support | 0 (0.0%) | 19 (100.0%) |
| Education Instruction & Library | 14 (77.8%) | 4 (22.2%) |
| Arts, Media & Entertainment | 0 (0.0%) | 0 (0.0%) |
| Health Diagnosing & Treating | 0 (0.0%) | 92 (100.0%) |
| Health Technologists | 0 (0.0%) | 39 (100.0%) |
| Total (Category) | 45 (21.4%) | 165 (78.6%) |
| Total (Overall) | 394 (46.7%) | 449 (53.3%) |
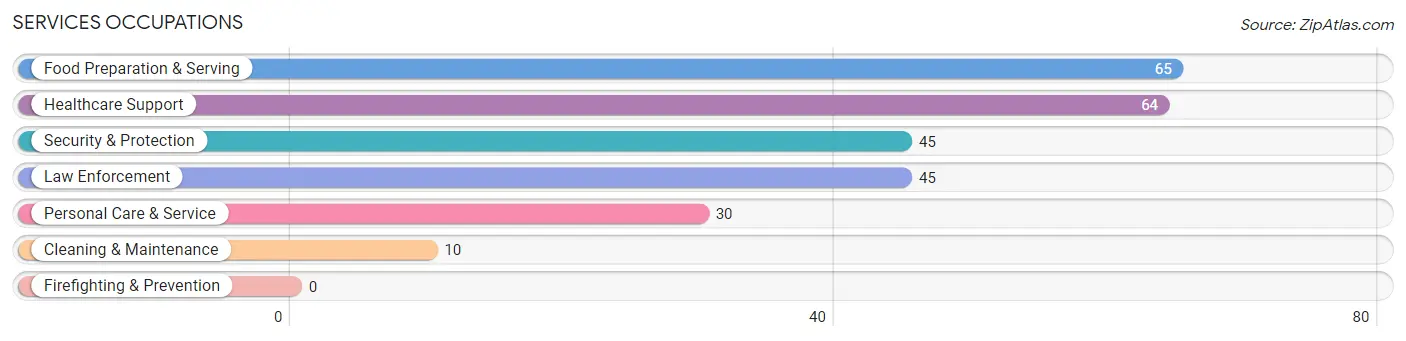
Services Occupations
The most common Services occupations in Augusta are Food Preparation & Serving (65 | 7.7%), Healthcare Support (64 | 7.6%), Security & Protection (45 | 5.3%), Law Enforcement (45 | 5.3%), and Personal Care & Service (30 | 3.6%).
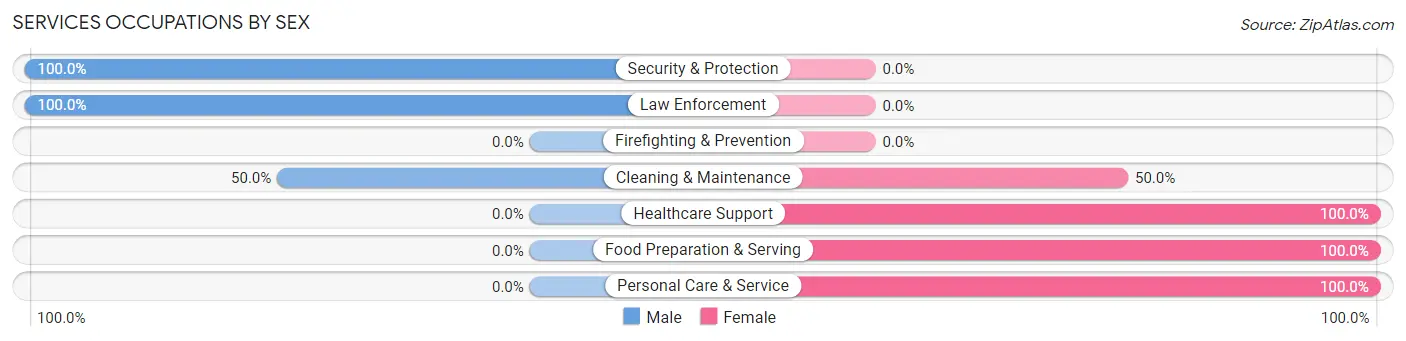
Services Occupations by Sex
Within the Services occupations in Augusta, the most male-oriented occupations are Security & Protection (100.0%), Law Enforcement (100.0%), and Cleaning & Maintenance (50.0%), while the most female-oriented occupations are Healthcare Support (100.0%), Food Preparation & Serving (100.0%), and Personal Care & Service (100.0%).
| Occupation | Male | Female |
| Healthcare Support | 0 (0.0%) | 64 (100.0%) |
| Security & Protection | 45 (100.0%) | 0 (0.0%) |
| Firefighting & Prevention | 0 (0.0%) | 0 (0.0%) |
| Law Enforcement | 45 (100.0%) | 0 (0.0%) |
| Food Preparation & Serving | 0 (0.0%) | 65 (100.0%) |
| Cleaning & Maintenance | 5 (50.0%) | 5 (50.0%) |
| Personal Care & Service | 0 (0.0%) | 30 (100.0%) |
| Total (Category) | 50 (23.4%) | 164 (76.6%) |
| Total (Overall) | 394 (46.7%) | 449 (53.3%) |
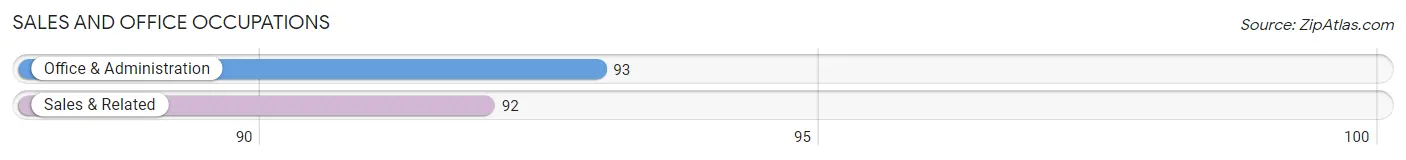
Sales and Office Occupations
The most common Sales and Office occupations in Augusta are Office & Administration (93 | 11.0%), and Sales & Related (92 | 10.9%).
Sales and Office Occupations by Sex
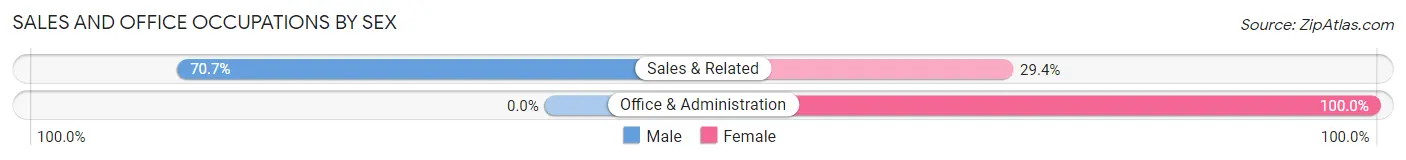
| Occupation | Male | Female |
| Sales & Related | 65 (70.7%) | 27 (29.3%) |
| Office & Administration | 0 (0.0%) | 93 (100.0%) |
| Total (Category) | 65 (35.1%) | 120 (64.9%) |
| Total (Overall) | 394 (46.7%) | 449 (53.3%) |
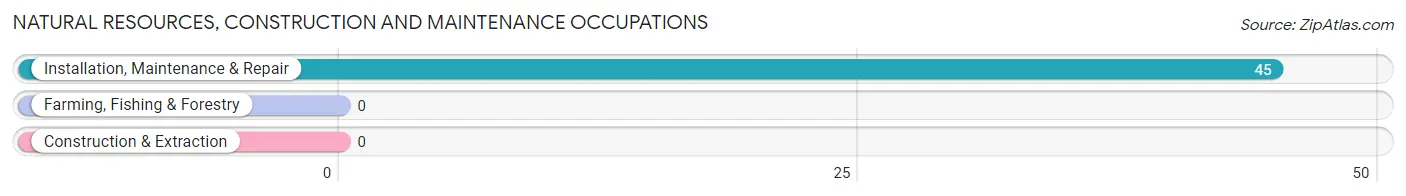
Natural Resources, Construction and Maintenance Occupations
The most common Natural Resources, Construction and Maintenance occupations in Augusta are , and Installation, Maintenance & Repair (45 | 5.3%).
Natural Resources, Construction and Maintenance Occupations by Sex
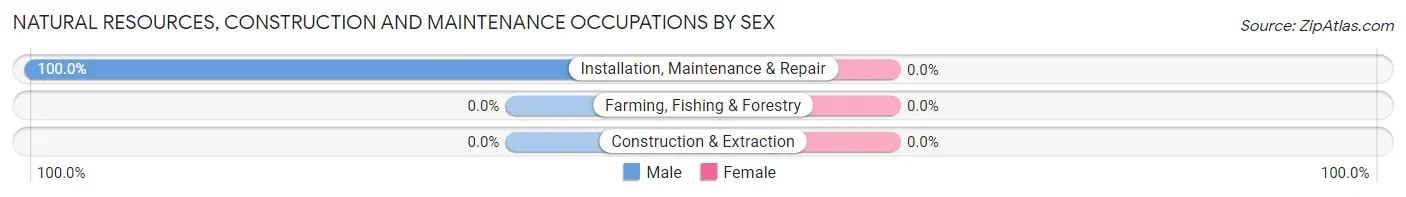
| Occupation | Male | Female |
| Farming, Fishing & Forestry | 0 (0.0%) | 0 (0.0%) |
| Construction & Extraction | 0 (0.0%) | 0 (0.0%) |
| Installation, Maintenance & Repair | 45 (100.0%) | 0 (0.0%) |
| Total (Category) | 45 (100.0%) | 0 (0.0%) |
| Total (Overall) | 394 (46.7%) | 449 (53.3%) |
Production, Transportation and Moving Occupations
The most common Production, Transportation and Moving occupations in Augusta are Production (133 | 15.8%), Material Moving (46 | 5.5%), and Transportation (10 | 1.2%).
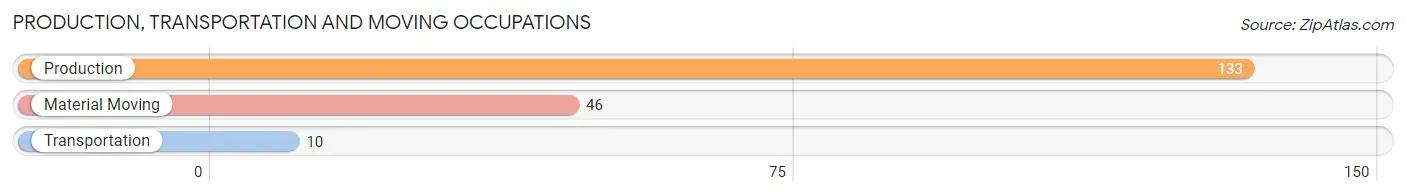
Production, Transportation and Moving Occupations by Sex
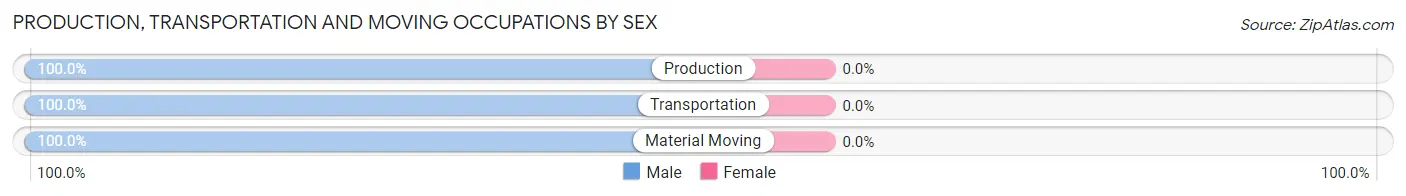
| Occupation | Male | Female |
| Production | 133 (100.0%) | 0 (0.0%) |
| Transportation | 10 (100.0%) | 0 (0.0%) |
| Material Moving | 46 (100.0%) | 0 (0.0%) |
| Total (Category) | 189 (100.0%) | 0 (0.0%) |
| Total (Overall) | 394 (46.7%) | 449 (53.3%) |
Employment Industries by Sex in Augusta
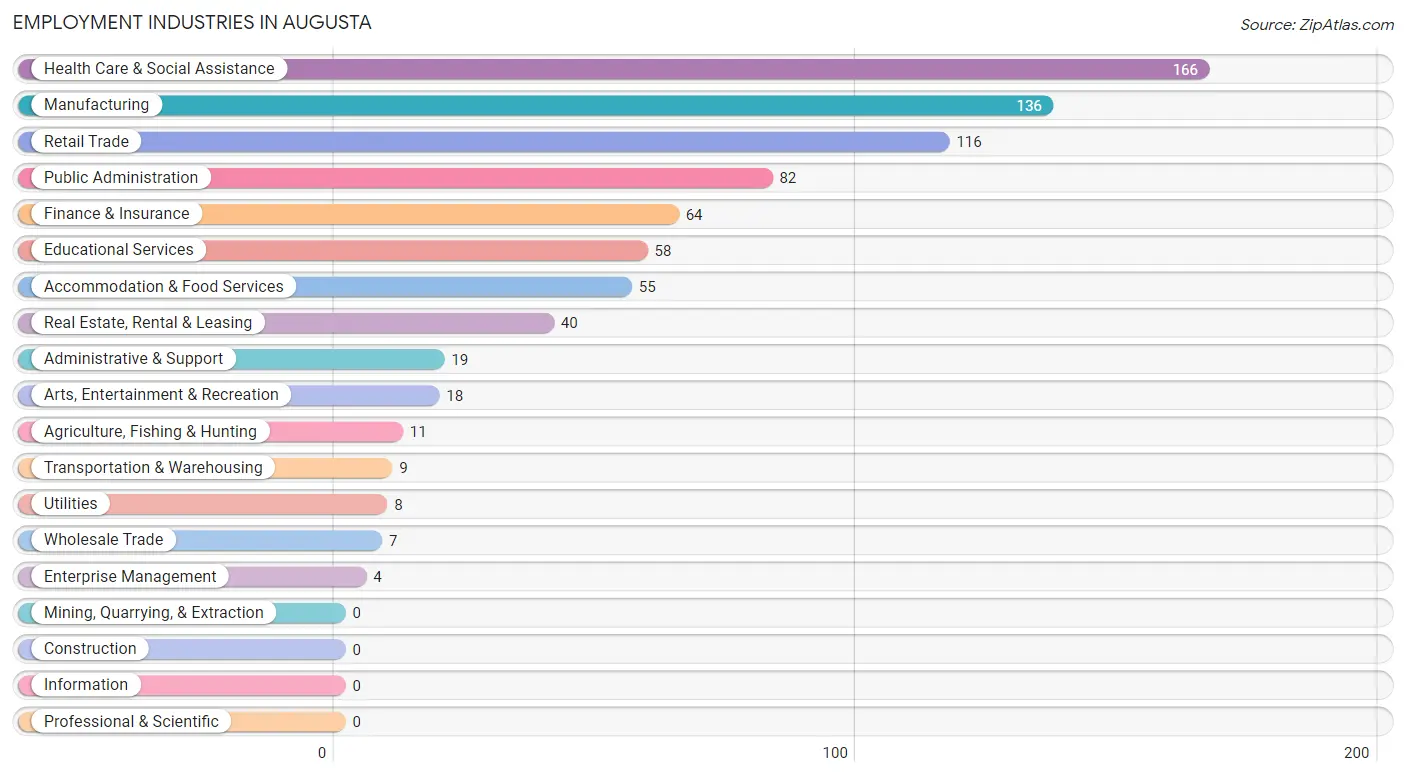
Employment Industries in Augusta
The major employment industries in Augusta include Health Care & Social Assistance (166 | 19.7%), Manufacturing (136 | 16.1%), Retail Trade (116 | 13.8%), Public Administration (82 | 9.7%), and Finance & Insurance (64 | 7.6%).
Employment Industries by Sex in Augusta
The Augusta industries that see more men than women are Agriculture, Fishing & Hunting (100.0%), Manufacturing (100.0%), and Wholesale Trade (100.0%), whereas the industries that tend to have a higher number of women are Real Estate, Rental & Leasing (100.0%), Enterprise Management (100.0%), and Administrative & Support (100.0%).
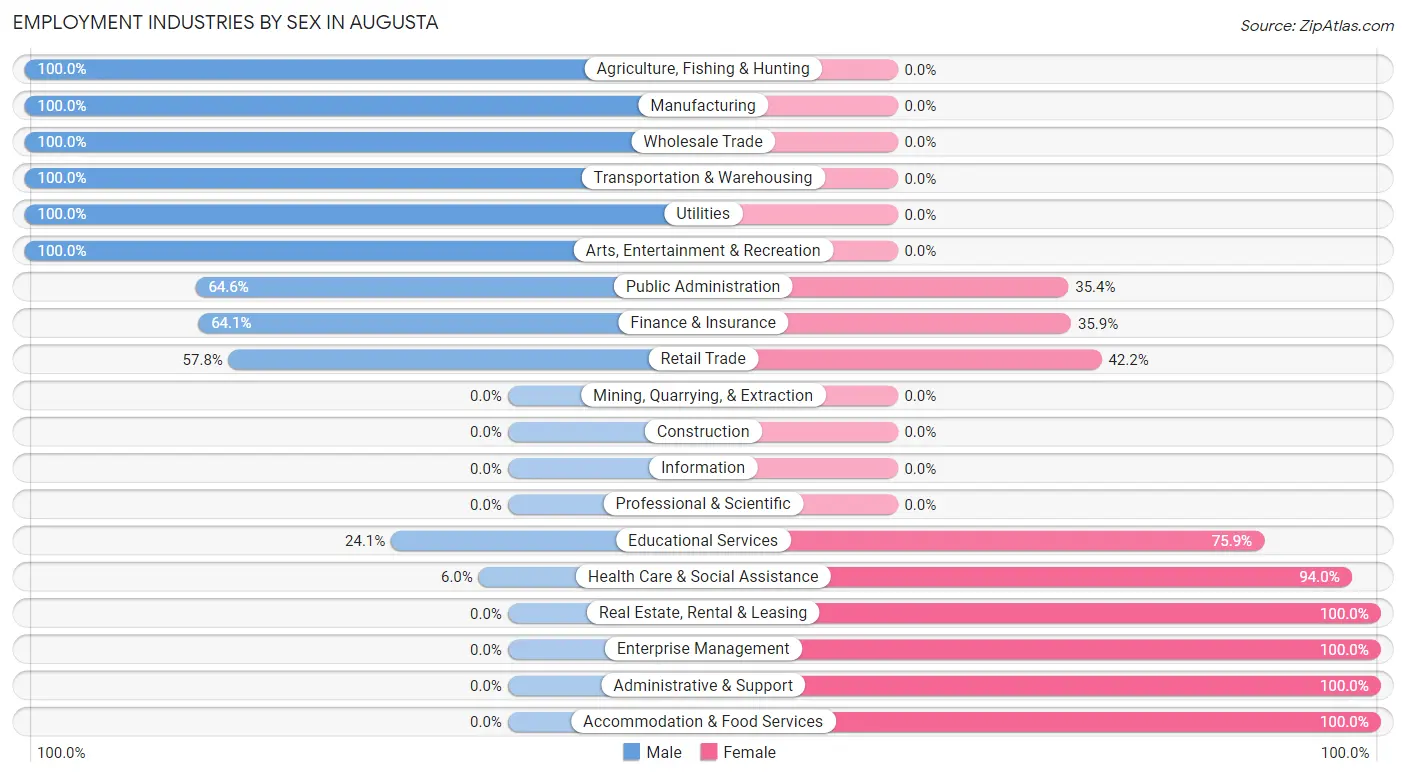
| Industry | Male | Female |
| Agriculture, Fishing & Hunting | 11 (100.0%) | 0 (0.0%) |
| Mining, Quarrying, & Extraction | 0 (0.0%) | 0 (0.0%) |
| Construction | 0 (0.0%) | 0 (0.0%) |
| Manufacturing | 136 (100.0%) | 0 (0.0%) |
| Wholesale Trade | 7 (100.0%) | 0 (0.0%) |
| Retail Trade | 67 (57.8%) | 49 (42.2%) |
| Transportation & Warehousing | 9 (100.0%) | 0 (0.0%) |
| Utilities | 8 (100.0%) | 0 (0.0%) |
| Information | 0 (0.0%) | 0 (0.0%) |
| Finance & Insurance | 41 (64.1%) | 23 (35.9%) |
| Real Estate, Rental & Leasing | 0 (0.0%) | 40 (100.0%) |
| Professional & Scientific | 0 (0.0%) | 0 (0.0%) |
| Enterprise Management | 0 (0.0%) | 4 (100.0%) |
| Administrative & Support | 0 (0.0%) | 19 (100.0%) |
| Educational Services | 14 (24.1%) | 44 (75.9%) |
| Health Care & Social Assistance | 10 (6.0%) | 156 (94.0%) |
| Arts, Entertainment & Recreation | 18 (100.0%) | 0 (0.0%) |
| Accommodation & Food Services | 0 (0.0%) | 55 (100.0%) |
| Public Administration | 53 (64.6%) | 29 (35.4%) |
| Total | 394 (46.7%) | 449 (53.3%) |
Education in Augusta
School Enrollment in Augusta
The most common levels of schooling among the 387 students in Augusta are high school (131 | 33.9%), college / undergraduate (89 | 23.0%), and middle school (72 | 18.6%).
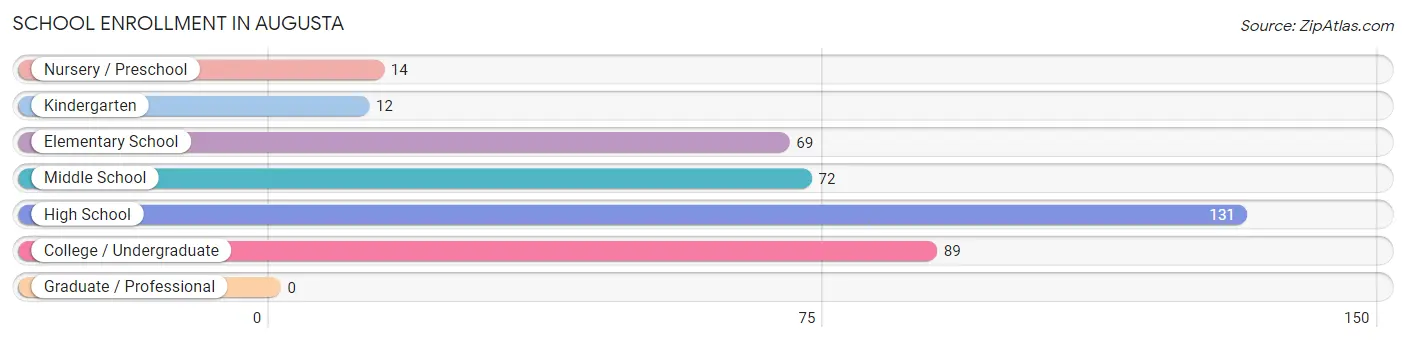
| School Level | # Students | % Students |
| Nursery / Preschool | 14 | 3.6% |
| Kindergarten | 12 | 3.1% |
| Elementary School | 69 | 17.8% |
| Middle School | 72 | 18.6% |
| High School | 131 | 33.9% |
| College / Undergraduate | 89 | 23.0% |
| Graduate / Professional | 0 | 0.0% |
| Total | 387 | 100.0% |
School Enrollment by Age by Funding Source in Augusta
Out of a total of 387 students who are enrolled in schools in Augusta, 52 (13.4%) attend a private institution, while the remaining 335 (86.6%) are enrolled in public schools. The age group of 20 to 24 year olds has the highest likelihood of being enrolled in private schools, with 52 (65.0% in the age bracket) enrolled. Conversely, the age group of 3 to 4 year olds has the lowest likelihood of being enrolled in a private school, with 14 (100.0% in the age bracket) attending a public institution.
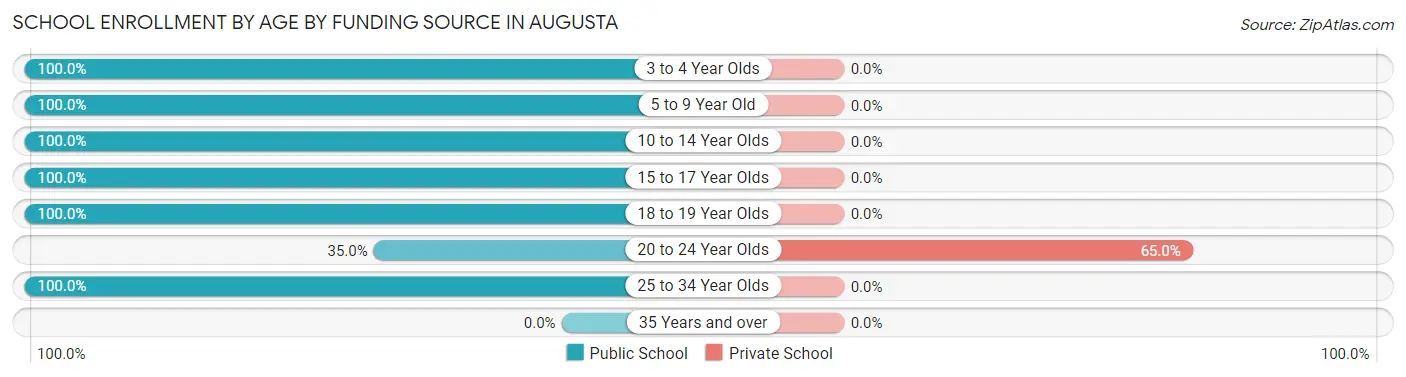
| Age Bracket | Public School | Private School |
| 3 to 4 Year Olds | 14 (100.0%) | 0 (0.0%) |
| 5 to 9 Year Old | 81 (100.0%) | 0 (0.0%) |
| 10 to 14 Year Olds | 84 (100.0%) | 0 (0.0%) |
| 15 to 17 Year Olds | 76 (100.0%) | 0 (0.0%) |
| 18 to 19 Year Olds | 43 (100.0%) | 0 (0.0%) |
| 20 to 24 Year Olds | 28 (35.0%) | 52 (65.0%) |
| 25 to 34 Year Olds | 9 (100.0%) | 0 (0.0%) |
| 35 Years and over | 0 (0.0%) | 0 (0.0%) |
| Total | 335 (86.6%) | 52 (13.4%) |
Educational Attainment by Field of Study in Augusta
Education (86 | 63.2%), business (30 | 22.1%), science & technology (8 | 5.9%), arts & humanities (7 | 5.1%), and bio, nature & agricultural (5 | 3.7%) are the most common fields of study among 136 individuals in Augusta who have obtained a bachelor's degree or higher.
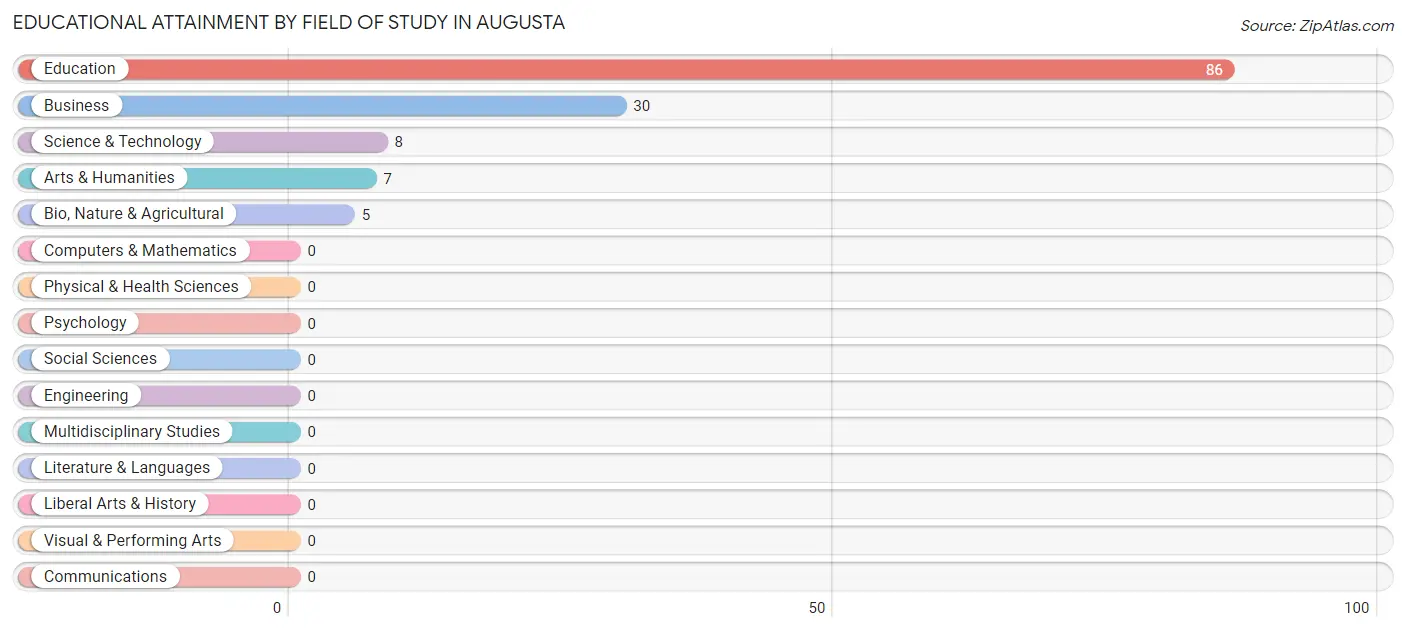
| Field of Study | # Graduates | % Graduates |
| Computers & Mathematics | 0 | 0.0% |
| Bio, Nature & Agricultural | 5 | 3.7% |
| Physical & Health Sciences | 0 | 0.0% |
| Psychology | 0 | 0.0% |
| Social Sciences | 0 | 0.0% |
| Engineering | 0 | 0.0% |
| Multidisciplinary Studies | 0 | 0.0% |
| Science & Technology | 8 | 5.9% |
| Business | 30 | 22.1% |
| Education | 86 | 63.2% |
| Literature & Languages | 0 | 0.0% |
| Liberal Arts & History | 0 | 0.0% |
| Visual & Performing Arts | 0 | 0.0% |
| Communications | 0 | 0.0% |
| Arts & Humanities | 7 | 5.1% |
| Total | 136 | 100.0% |
Transportation & Commute in Augusta
Vehicle Availability by Sex in Augusta
The most prevalent vehicle ownership categories in Augusta are males with 2 vehicles (220, accounting for 55.8%) and females with 2 vehicles (201, making up 49.0%).
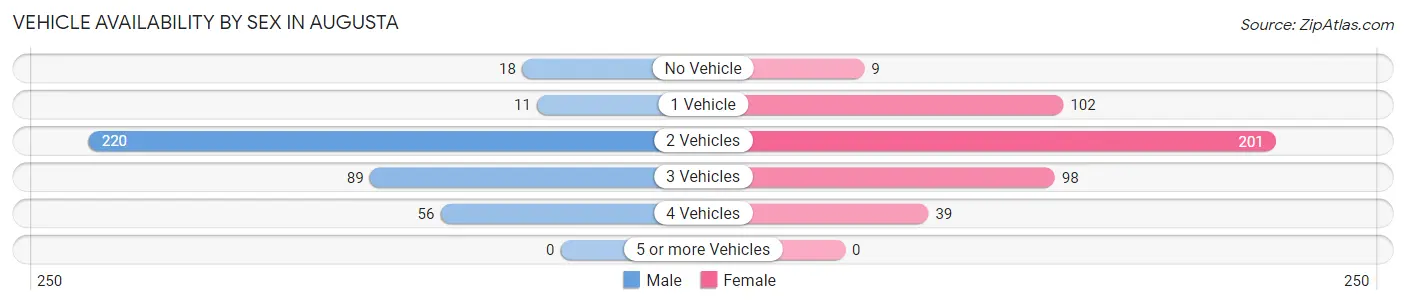
| Vehicles Available | Male | Female |
| No Vehicle | 18 (4.6%) | 9 (2.0%) |
| 1 Vehicle | 11 (2.8%) | 102 (22.7%) |
| 2 Vehicles | 220 (55.8%) | 201 (44.8%) |
| 3 Vehicles | 89 (22.6%) | 98 (21.8%) |
| 4 Vehicles | 56 (14.2%) | 39 (8.7%) |
| 5 or more Vehicles | 0 (0.0%) | 0 (0.0%) |
| Total | 394 (100.0%) | 449 (100.0%) |
Commute Time in Augusta
The most frequently occuring commute durations in Augusta are less than 5 minutes (229 commuters, 27.5%), 5 to 9 minutes (153 commuters, 18.4%), and 10 to 14 minutes (125 commuters, 15.0%).
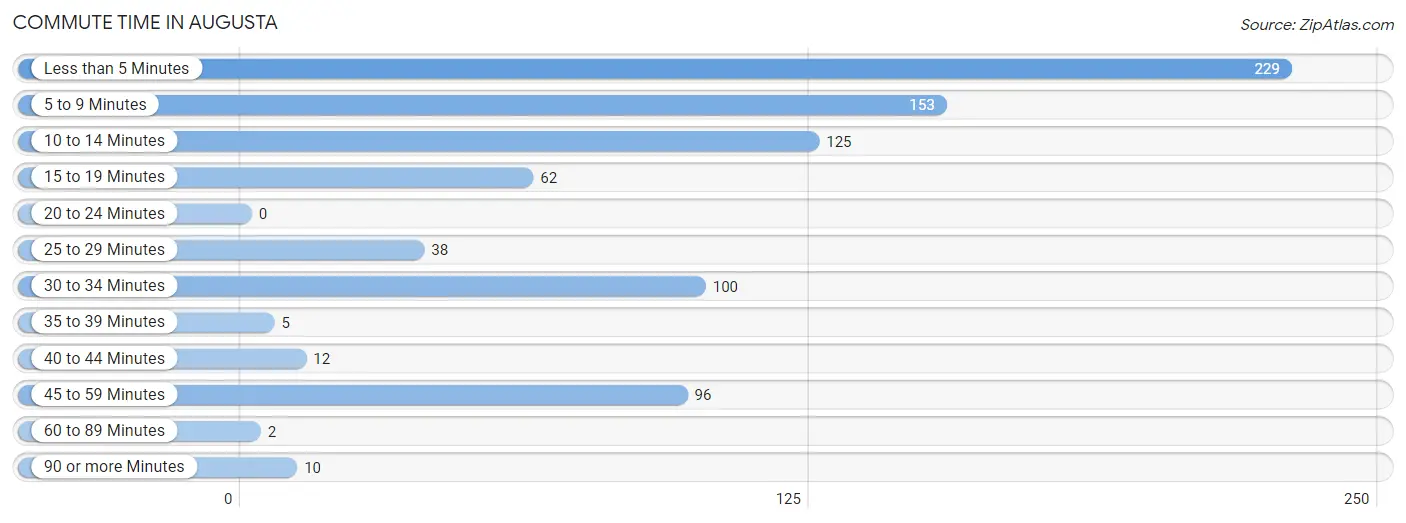
| Commute Time | # Commuters | % Commuters |
| Less than 5 Minutes | 229 | 27.5% |
| 5 to 9 Minutes | 153 | 18.4% |
| 10 to 14 Minutes | 125 | 15.0% |
| 15 to 19 Minutes | 62 | 7.4% |
| 20 to 24 Minutes | 0 | 0.0% |
| 25 to 29 Minutes | 38 | 4.6% |
| 30 to 34 Minutes | 100 | 12.0% |
| 35 to 39 Minutes | 5 | 0.6% |
| 40 to 44 Minutes | 12 | 1.4% |
| 45 to 59 Minutes | 96 | 11.5% |
| 60 to 89 Minutes | 2 | 0.2% |
| 90 or more Minutes | 10 | 1.2% |
Commute Time by Sex in Augusta
The most common commute times in Augusta are less than 5 minutes (103 commuters, 26.9%) for males and less than 5 minutes (126 commuters, 28.1%) for females.
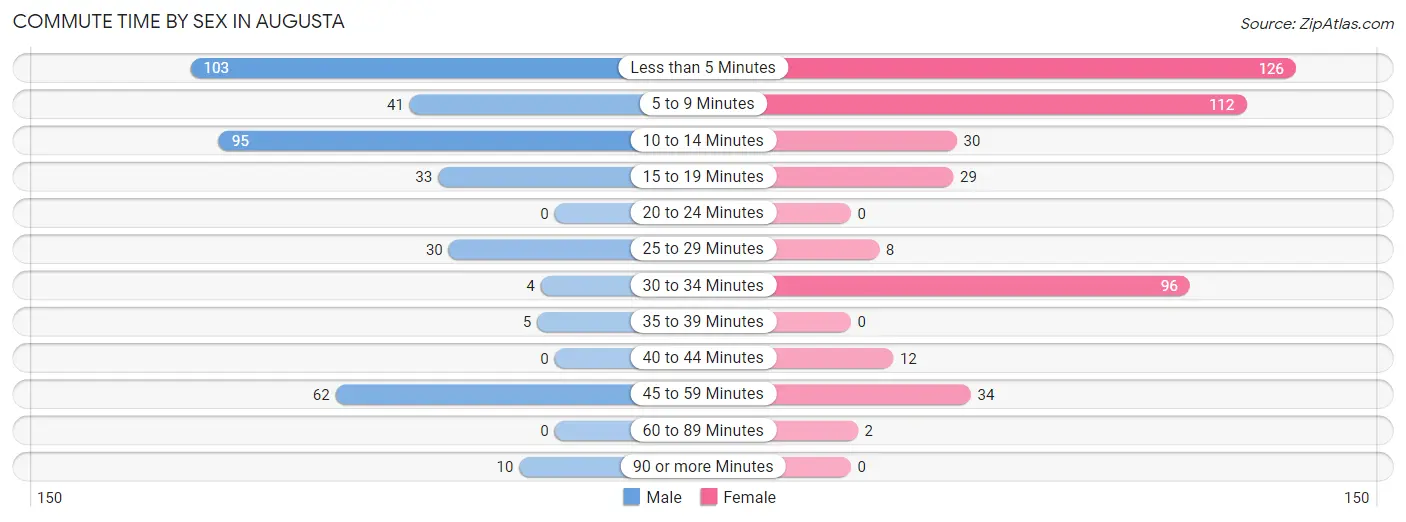
| Commute Time | Male | Female |
| Less than 5 Minutes | 103 (26.9%) | 126 (28.1%) |
| 5 to 9 Minutes | 41 (10.7%) | 112 (24.9%) |
| 10 to 14 Minutes | 95 (24.8%) | 30 (6.7%) |
| 15 to 19 Minutes | 33 (8.6%) | 29 (6.5%) |
| 20 to 24 Minutes | 0 (0.0%) | 0 (0.0%) |
| 25 to 29 Minutes | 30 (7.8%) | 8 (1.8%) |
| 30 to 34 Minutes | 4 (1.0%) | 96 (21.4%) |
| 35 to 39 Minutes | 5 (1.3%) | 0 (0.0%) |
| 40 to 44 Minutes | 0 (0.0%) | 12 (2.7%) |
| 45 to 59 Minutes | 62 (16.2%) | 34 (7.6%) |
| 60 to 89 Minutes | 0 (0.0%) | 2 (0.4%) |
| 90 or more Minutes | 10 (2.6%) | 0 (0.0%) |
Time of Departure to Work by Sex in Augusta
The most frequent times of departure to work in Augusta are 12:00 AM to 4:59 AM (106, 27.7%) for males and 7:30 AM to 7:59 AM (118, 26.3%) for females.
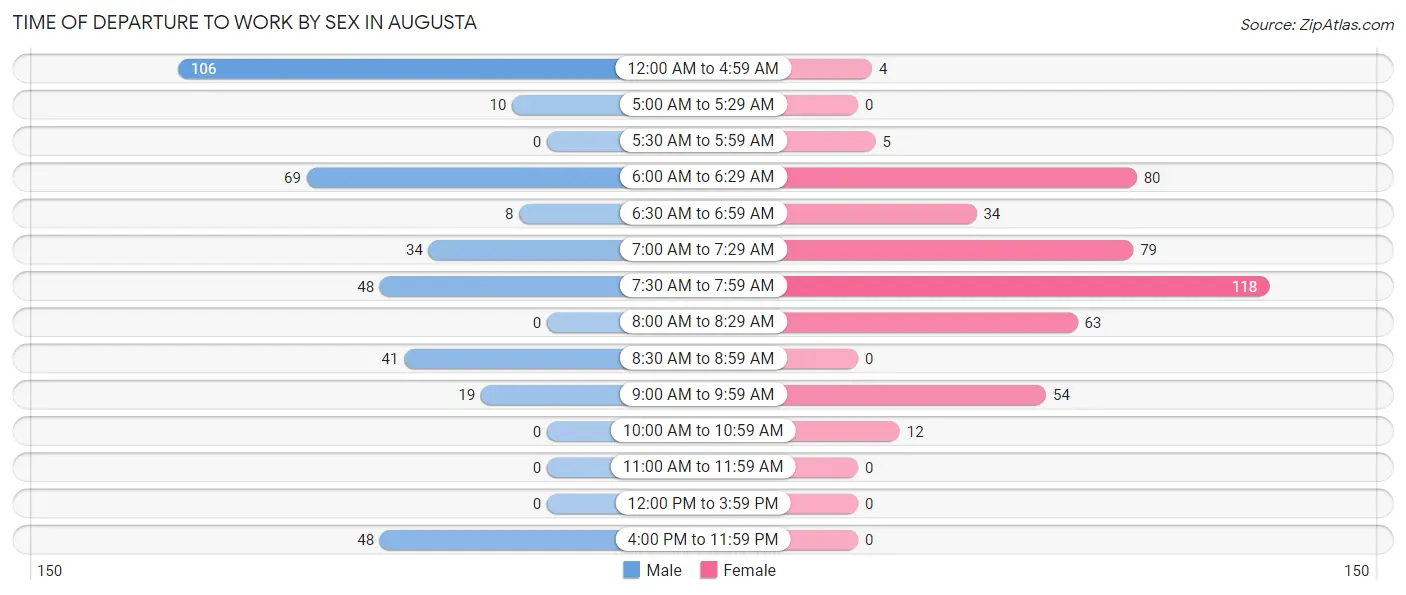
| Time of Departure | Male | Female |
| 12:00 AM to 4:59 AM | 106 (27.7%) | 4 (0.9%) |
| 5:00 AM to 5:29 AM | 10 (2.6%) | 0 (0.0%) |
| 5:30 AM to 5:59 AM | 0 (0.0%) | 5 (1.1%) |
| 6:00 AM to 6:29 AM | 69 (18.0%) | 80 (17.8%) |
| 6:30 AM to 6:59 AM | 8 (2.1%) | 34 (7.6%) |
| 7:00 AM to 7:29 AM | 34 (8.9%) | 79 (17.6%) |
| 7:30 AM to 7:59 AM | 48 (12.5%) | 118 (26.3%) |
| 8:00 AM to 8:29 AM | 0 (0.0%) | 63 (14.0%) |
| 8:30 AM to 8:59 AM | 41 (10.7%) | 0 (0.0%) |
| 9:00 AM to 9:59 AM | 19 (5.0%) | 54 (12.0%) |
| 10:00 AM to 10:59 AM | 0 (0.0%) | 12 (2.7%) |
| 11:00 AM to 11:59 AM | 0 (0.0%) | 0 (0.0%) |
| 12:00 PM to 3:59 PM | 0 (0.0%) | 0 (0.0%) |
| 4:00 PM to 11:59 PM | 48 (12.5%) | 0 (0.0%) |
| Total | 383 (100.0%) | 449 (100.0%) |
Housing Occupancy in Augusta
Occupancy by Ownership in Augusta
Of the total 834 dwellings in Augusta, owner-occupied units account for 562 (67.4%), while renter-occupied units make up 272 (32.6%).
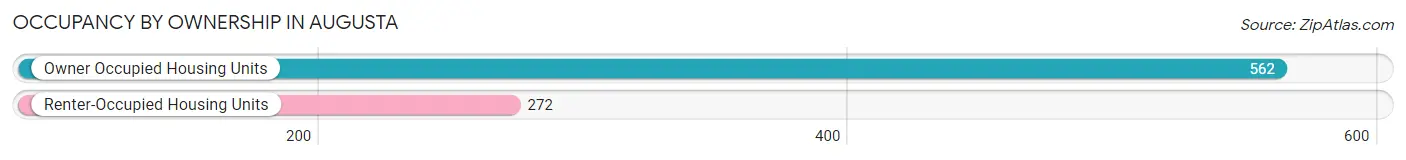
| Occupancy | # Housing Units | % Housing Units |
| Owner Occupied Housing Units | 562 | 67.4% |
| Renter-Occupied Housing Units | 272 | 32.6% |
| Total Occupied Housing Units | 834 | 100.0% |
Occupancy by Household Size in Augusta
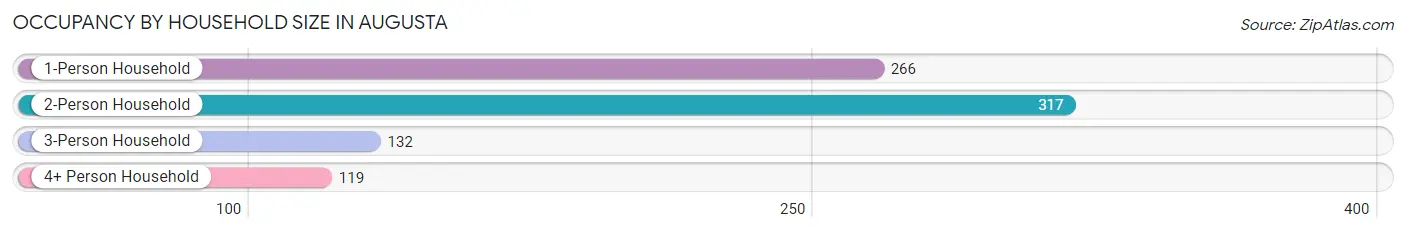
| Household Size | # Housing Units | % Housing Units |
| 1-Person Household | 266 | 31.9% |
| 2-Person Household | 317 | 38.0% |
| 3-Person Household | 132 | 15.8% |
| 4+ Person Household | 119 | 14.3% |
| Total Housing Units | 834 | 100.0% |
Occupancy by Ownership by Household Size in Augusta
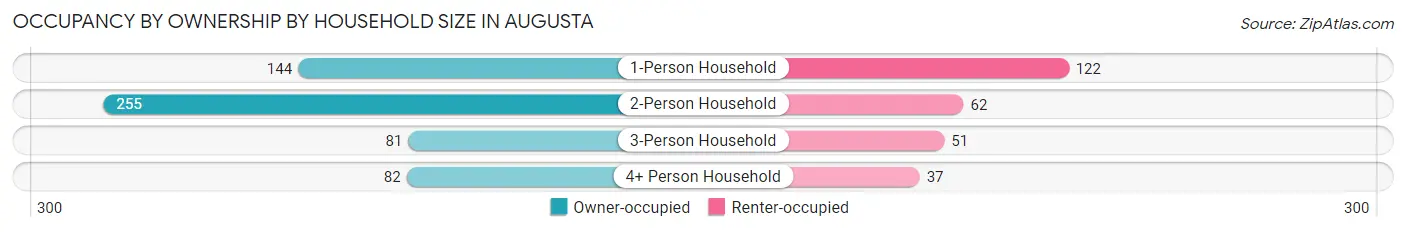
| Household Size | Owner-occupied | Renter-occupied |
| 1-Person Household | 144 (54.1%) | 122 (45.9%) |
| 2-Person Household | 255 (80.4%) | 62 (19.6%) |
| 3-Person Household | 81 (61.4%) | 51 (38.6%) |
| 4+ Person Household | 82 (68.9%) | 37 (31.1%) |
| Total Housing Units | 562 (67.4%) | 272 (32.6%) |
Occupancy by Educational Attainment in Augusta
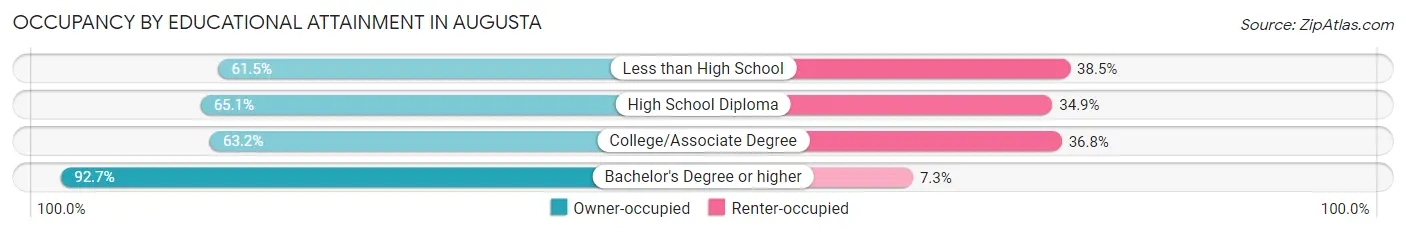
| Household Size | Owner-occupied | Renter-occupied |
| Less than High School | 48 (61.5%) | 30 (38.5%) |
| High School Diploma | 272 (65.1%) | 146 (34.9%) |
| College/Associate Degree | 153 (63.2%) | 89 (36.8%) |
| Bachelor's Degree or higher | 89 (92.7%) | 7 (7.3%) |
Occupancy by Age of Householder in Augusta
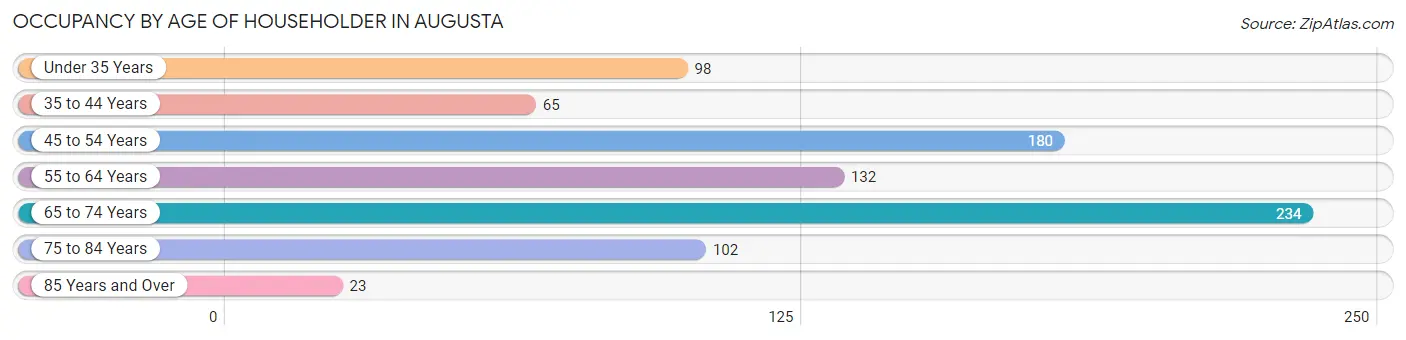
| Age Bracket | # Households | % Households |
| Under 35 Years | 98 | 11.7% |
| 35 to 44 Years | 65 | 7.8% |
| 45 to 54 Years | 180 | 21.6% |
| 55 to 64 Years | 132 | 15.8% |
| 65 to 74 Years | 234 | 28.1% |
| 75 to 84 Years | 102 | 12.2% |
| 85 Years and Over | 23 | 2.8% |
| Total | 834 | 100.0% |
Housing Finances in Augusta
Median Income by Occupancy in Augusta
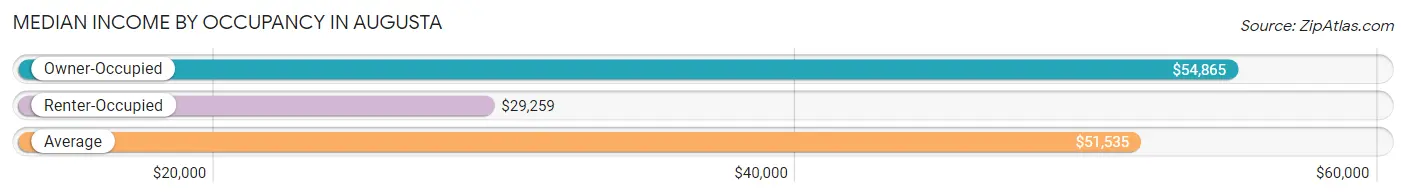
| Occupancy Type | # Households | Median Income |
| Owner-Occupied | 562 (67.4%) | $54,865 |
| Renter-Occupied | 272 (32.6%) | $29,259 |
| Average | 834 (100.0%) | $51,535 |
Occupancy by Householder Income Bracket in Augusta
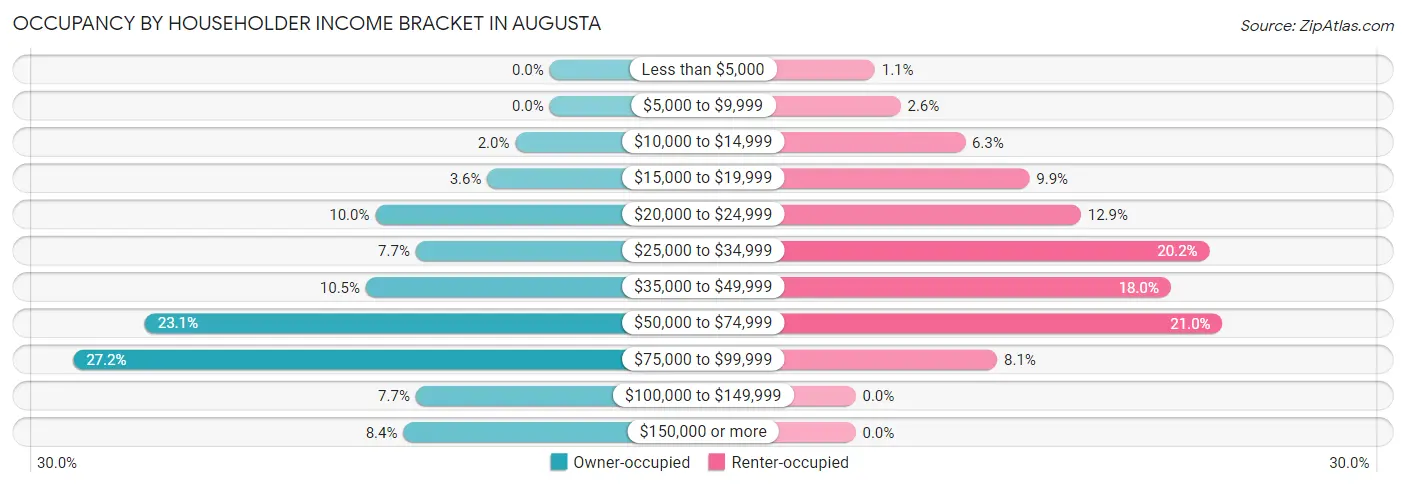
| Income Bracket | Owner-occupied | Renter-occupied |
| Less than $5,000 | 0 (0.0%) | 3 (1.1%) |
| $5,000 to $9,999 | 0 (0.0%) | 7 (2.6%) |
| $10,000 to $14,999 | 11 (2.0%) | 17 (6.2%) |
| $15,000 to $19,999 | 20 (3.6%) | 27 (9.9%) |
| $20,000 to $24,999 | 56 (10.0%) | 35 (12.9%) |
| $25,000 to $34,999 | 43 (7.6%) | 55 (20.2%) |
| $35,000 to $49,999 | 59 (10.5%) | 49 (18.0%) |
| $50,000 to $74,999 | 130 (23.1%) | 57 (21.0%) |
| $75,000 to $99,999 | 153 (27.2%) | 22 (8.1%) |
| $100,000 to $149,999 | 43 (7.6%) | 0 (0.0%) |
| $150,000 or more | 47 (8.4%) | 0 (0.0%) |
| Total | 562 (100.0%) | 272 (100.0%) |
Monthly Housing Cost Tiers in Augusta
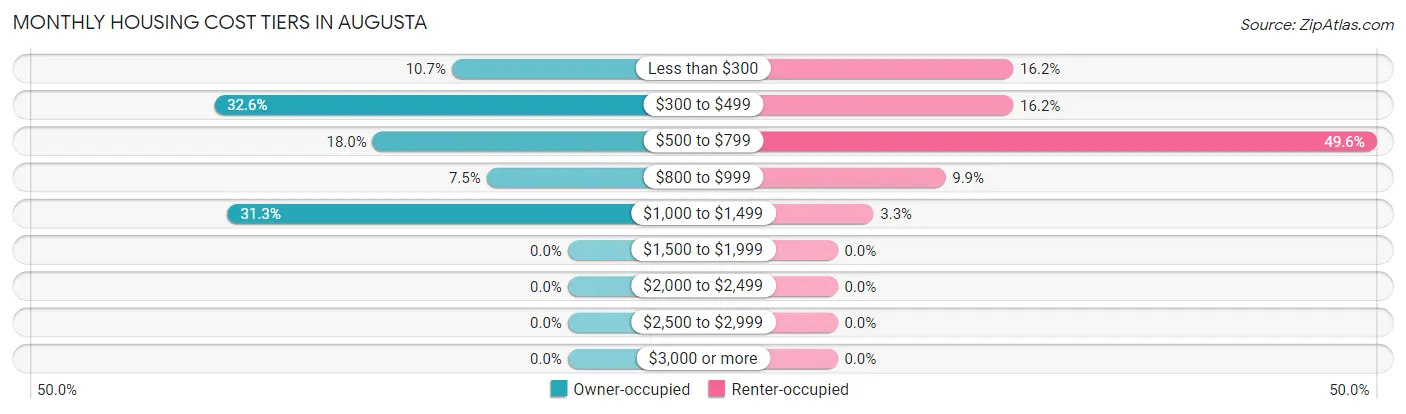
| Monthly Cost | Owner-occupied | Renter-occupied |
| Less than $300 | 60 (10.7%) | 44 (16.2%) |
| $300 to $499 | 183 (32.6%) | 44 (16.2%) |
| $500 to $799 | 101 (18.0%) | 135 (49.6%) |
| $800 to $999 | 42 (7.5%) | 27 (9.9%) |
| $1,000 to $1,499 | 176 (31.3%) | 9 (3.3%) |
| $1,500 to $1,999 | 0 (0.0%) | 0 (0.0%) |
| $2,000 to $2,499 | 0 (0.0%) | 0 (0.0%) |
| $2,500 to $2,999 | 0 (0.0%) | 0 (0.0%) |
| $3,000 or more | 0 (0.0%) | 0 (0.0%) |
| Total | 562 (100.0%) | 272 (100.0%) |
Physical Housing Characteristics in Augusta
Housing Structures in Augusta
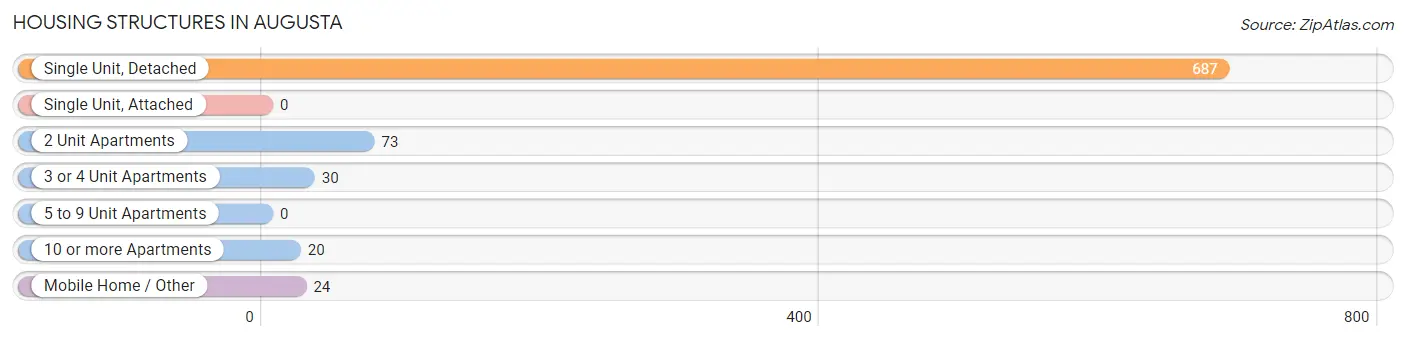
| Structure Type | # Housing Units | % Housing Units |
| Single Unit, Detached | 687 | 82.4% |
| Single Unit, Attached | 0 | 0.0% |
| 2 Unit Apartments | 73 | 8.7% |
| 3 or 4 Unit Apartments | 30 | 3.6% |
| 5 to 9 Unit Apartments | 0 | 0.0% |
| 10 or more Apartments | 20 | 2.4% |
| Mobile Home / Other | 24 | 2.9% |
| Total | 834 | 100.0% |
Housing Structures by Occupancy in Augusta
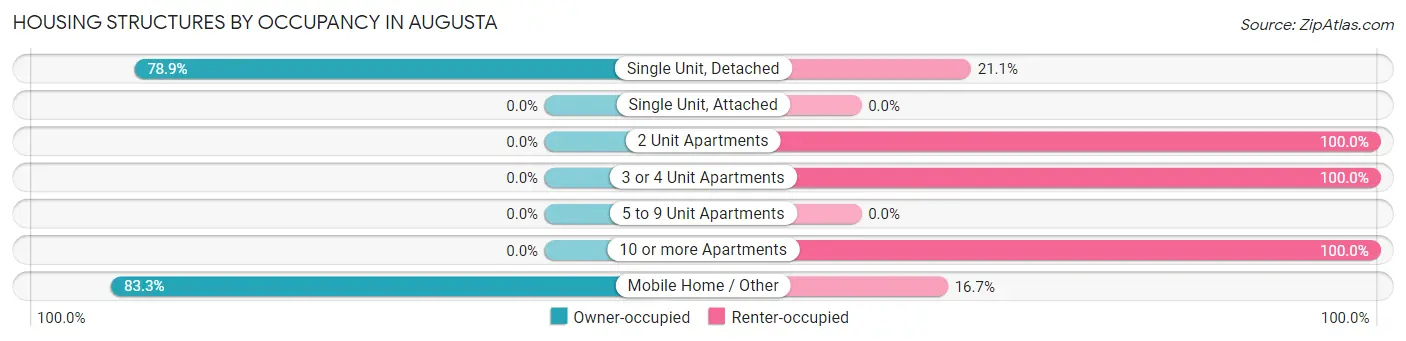
| Structure Type | Owner-occupied | Renter-occupied |
| Single Unit, Detached | 542 (78.9%) | 145 (21.1%) |
| Single Unit, Attached | 0 (0.0%) | 0 (0.0%) |
| 2 Unit Apartments | 0 (0.0%) | 73 (100.0%) |
| 3 or 4 Unit Apartments | 0 (0.0%) | 30 (100.0%) |
| 5 to 9 Unit Apartments | 0 (0.0%) | 0 (0.0%) |
| 10 or more Apartments | 0 (0.0%) | 20 (100.0%) |
| Mobile Home / Other | 20 (83.3%) | 4 (16.7%) |
| Total | 562 (67.4%) | 272 (32.6%) |
Housing Structures by Number of Rooms in Augusta
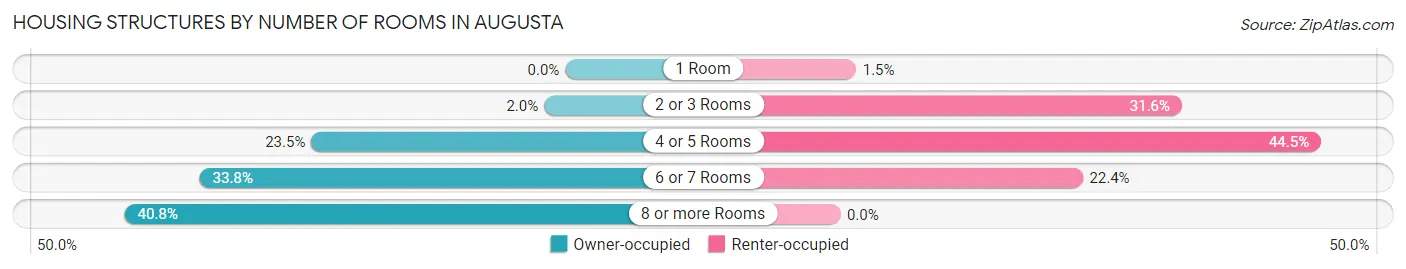
| Number of Rooms | Owner-occupied | Renter-occupied |
| 1 Room | 0 (0.0%) | 4 (1.5%) |
| 2 or 3 Rooms | 11 (2.0%) | 86 (31.6%) |
| 4 or 5 Rooms | 132 (23.5%) | 121 (44.5%) |
| 6 or 7 Rooms | 190 (33.8%) | 61 (22.4%) |
| 8 or more Rooms | 229 (40.7%) | 0 (0.0%) |
| Total | 562 (100.0%) | 272 (100.0%) |
Housing Structure by Heating Type in Augusta
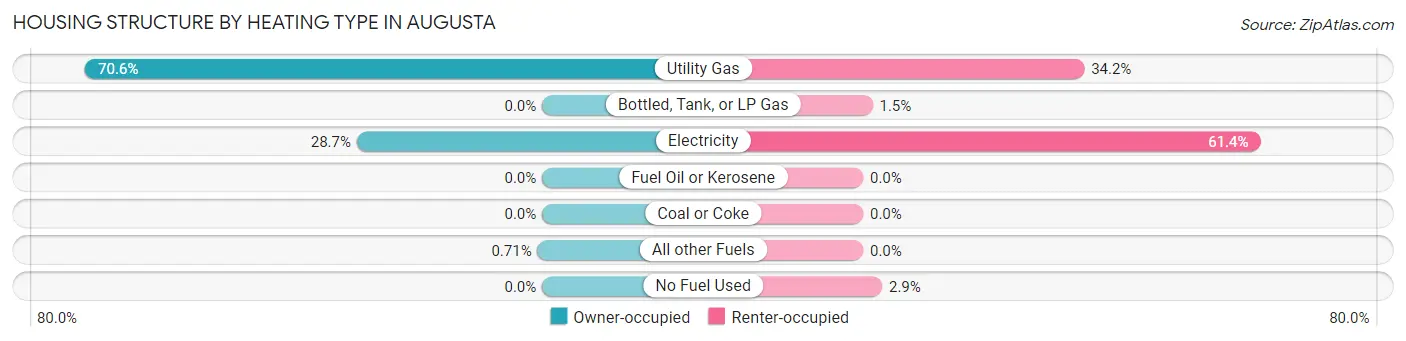
| Heating Type | Owner-occupied | Renter-occupied |
| Utility Gas | 397 (70.6%) | 93 (34.2%) |
| Bottled, Tank, or LP Gas | 0 (0.0%) | 4 (1.5%) |
| Electricity | 161 (28.6%) | 167 (61.4%) |
| Fuel Oil or Kerosene | 0 (0.0%) | 0 (0.0%) |
| Coal or Coke | 0 (0.0%) | 0 (0.0%) |
| All other Fuels | 4 (0.7%) | 0 (0.0%) |
| No Fuel Used | 0 (0.0%) | 8 (2.9%) |
| Total | 562 (100.0%) | 272 (100.0%) |
Household Vehicle Usage in Augusta
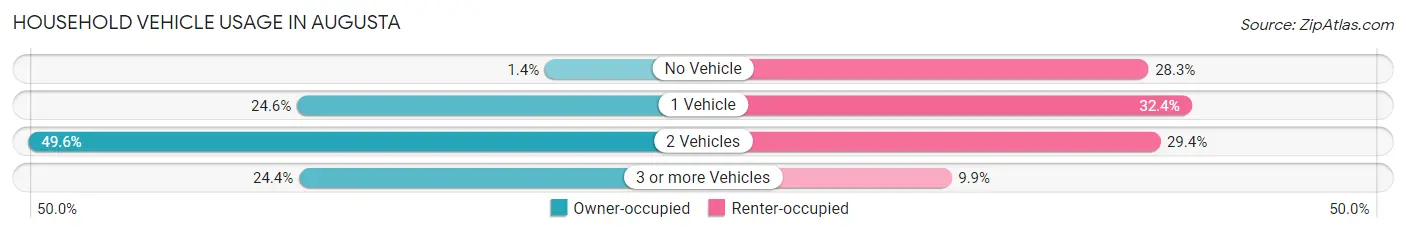
| Vehicles per Household | Owner-occupied | Renter-occupied |
| No Vehicle | 8 (1.4%) | 77 (28.3%) |
| 1 Vehicle | 138 (24.6%) | 88 (32.4%) |
| 2 Vehicles | 279 (49.6%) | 80 (29.4%) |
| 3 or more Vehicles | 137 (24.4%) | 27 (9.9%) |
| Total | 562 (100.0%) | 272 (100.0%) |
Real Estate & Mortgages in Augusta
Real Estate and Mortgage Overview in Augusta
| Characteristic | Without Mortgage | With Mortgage |
| Housing Units | 336 | 226 |
| Median Property Value | $132,000 | $150,500 |
| Median Household Income | $52,500 | $36 |
| Monthly Housing Costs | $369 | $0 |
| Real Estate Taxes | $897 | $0 |
Property Value by Mortgage Status in Augusta
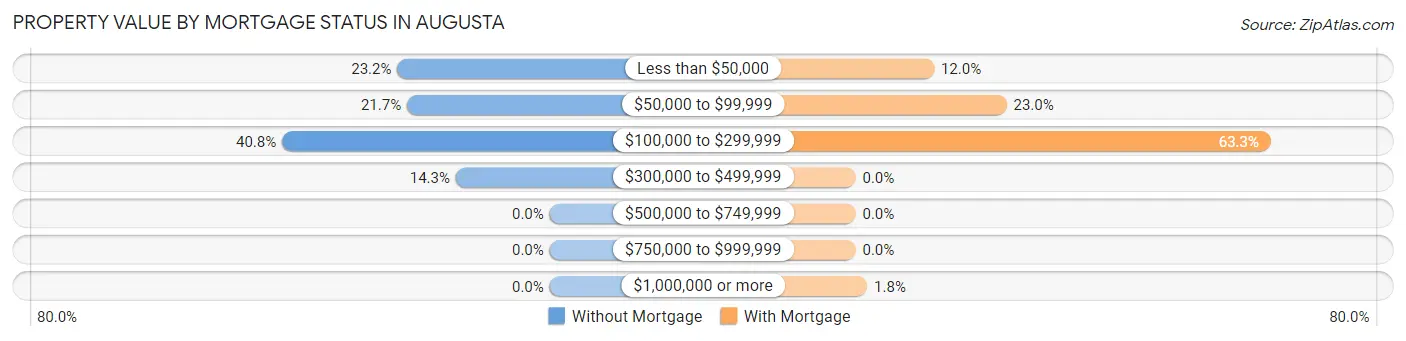
| Property Value | Without Mortgage | With Mortgage |
| Less than $50,000 | 78 (23.2%) | 27 (11.9%) |
| $50,000 to $99,999 | 73 (21.7%) | 52 (23.0%) |
| $100,000 to $299,999 | 137 (40.8%) | 143 (63.3%) |
| $300,000 to $499,999 | 48 (14.3%) | 0 (0.0%) |
| $500,000 to $749,999 | 0 (0.0%) | 0 (0.0%) |
| $750,000 to $999,999 | 0 (0.0%) | 0 (0.0%) |
| $1,000,000 or more | 0 (0.0%) | 4 (1.8%) |
| Total | 336 (100.0%) | 226 (100.0%) |
Household Income by Mortgage Status in Augusta
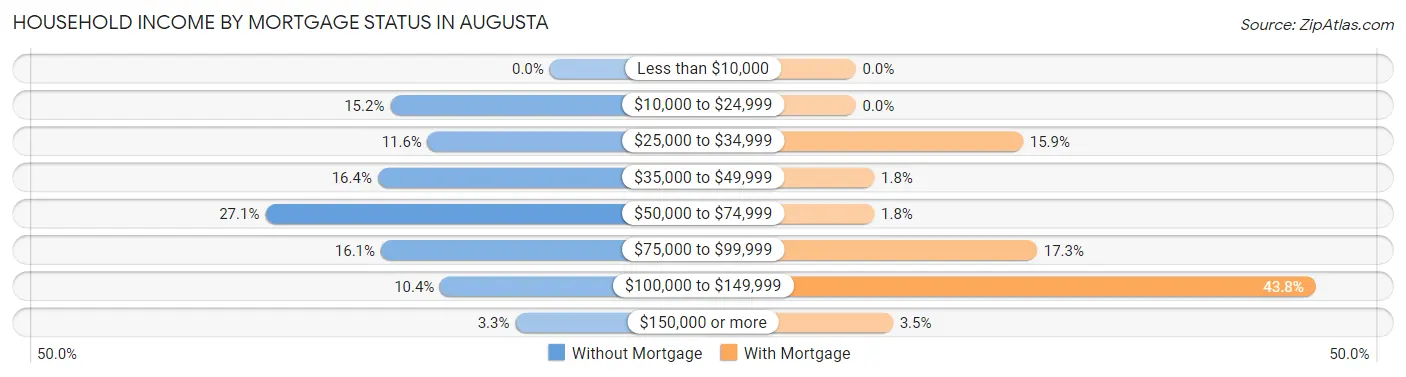
| Household Income | Without Mortgage | With Mortgage |
| Less than $10,000 | 0 (0.0%) | 0 (0.0%) |
| $10,000 to $24,999 | 51 (15.2%) | 0 (0.0%) |
| $25,000 to $34,999 | 39 (11.6%) | 36 (15.9%) |
| $35,000 to $49,999 | 55 (16.4%) | 4 (1.8%) |
| $50,000 to $74,999 | 91 (27.1%) | 4 (1.8%) |
| $75,000 to $99,999 | 54 (16.1%) | 39 (17.3%) |
| $100,000 to $149,999 | 35 (10.4%) | 99 (43.8%) |
| $150,000 or more | 11 (3.3%) | 8 (3.5%) |
| Total | 336 (100.0%) | 226 (100.0%) |
Property Value to Household Income Ratio in Augusta
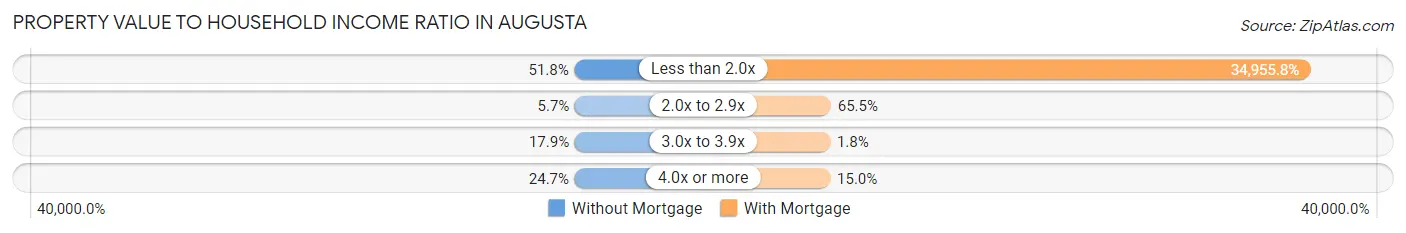
| Value-to-Income Ratio | Without Mortgage | With Mortgage |
| Less than 2.0x | 174 (51.8%) | 79,000 (34,955.8%) |
| 2.0x to 2.9x | 19 (5.7%) | 148 (65.5%) |
| 3.0x to 3.9x | 60 (17.9%) | 4 (1.8%) |
| 4.0x or more | 83 (24.7%) | 34 (15.0%) |
| Total | 336 (100.0%) | 226 (100.0%) |
Real Estate Taxes by Mortgage Status in Augusta
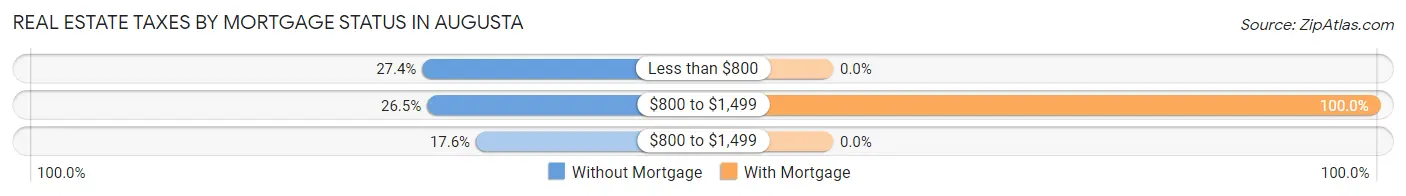
| Property Taxes | Without Mortgage | With Mortgage |
| Less than $800 | 92 (27.4%) | 0 (0.0%) |
| $800 to $1,499 | 89 (26.5%) | 226 (100.0%) |
| $800 to $1,499 | 59 (17.6%) | 0 (0.0%) |
| Total | 336 (100.0%) | 226 (100.0%) |
Health & Disability in Augusta
Health Insurance Coverage by Age in Augusta
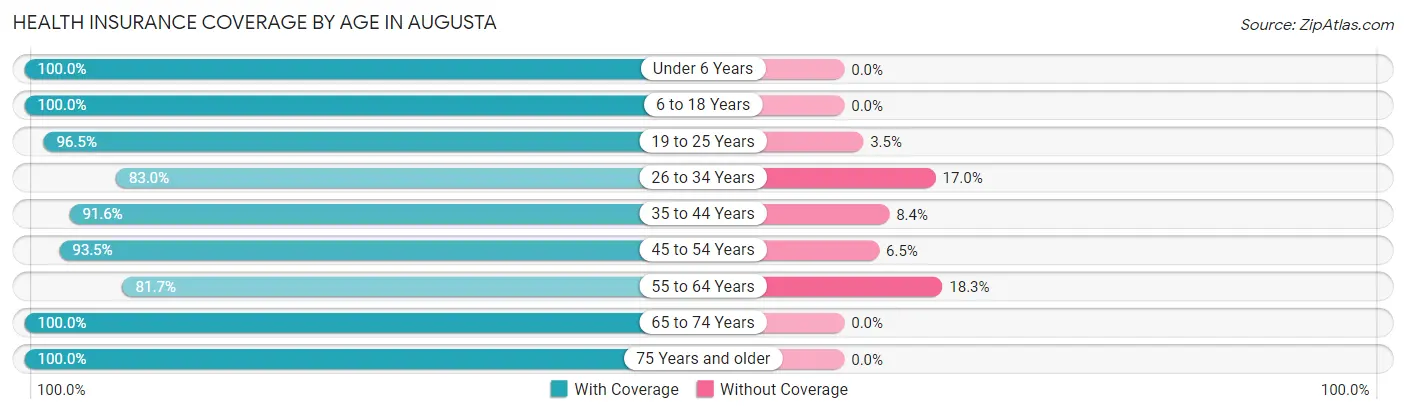
| Age Bracket | With Coverage | Without Coverage |
| Under 6 Years | 193 (100.0%) | 0 (0.0%) |
| 6 to 18 Years | 272 (100.0%) | 0 (0.0%) |
| 19 to 25 Years | 246 (96.5%) | 9 (3.5%) |
| 26 to 34 Years | 78 (83.0%) | 16 (17.0%) |
| 35 to 44 Years | 197 (91.6%) | 18 (8.4%) |
| 45 to 54 Years | 216 (93.5%) | 15 (6.5%) |
| 55 to 64 Years | 201 (81.7%) | 45 (18.3%) |
| 65 to 74 Years | 291 (100.0%) | 0 (0.0%) |
| 75 Years and older | 189 (100.0%) | 0 (0.0%) |
| Total | 1,883 (94.8%) | 103 (5.2%) |
Health Insurance Coverage by Citizenship Status in Augusta
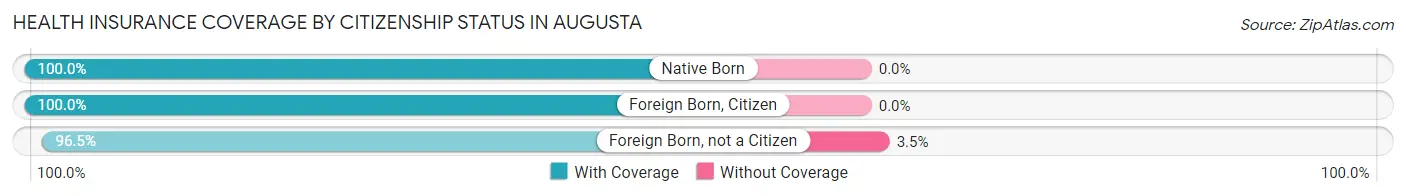
| Citizenship Status | With Coverage | Without Coverage |
| Native Born | 193 (100.0%) | 0 (0.0%) |
| Foreign Born, Citizen | 272 (100.0%) | 0 (0.0%) |
| Foreign Born, not a Citizen | 246 (96.5%) | 9 (3.5%) |
Health Insurance Coverage by Household Income in Augusta
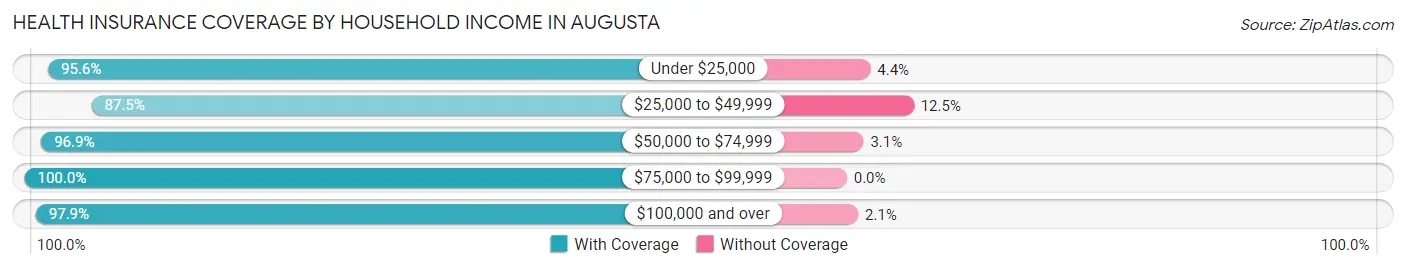
| Household Income | With Coverage | Without Coverage |
| Under $25,000 | 260 (95.6%) | 12 (4.4%) |
| $25,000 to $49,999 | 488 (87.5%) | 70 (12.5%) |
| $50,000 to $74,999 | 497 (96.9%) | 16 (3.1%) |
| $75,000 to $99,999 | 407 (100.0%) | 0 (0.0%) |
| $100,000 and over | 231 (97.9%) | 5 (2.1%) |
Public vs Private Health Insurance Coverage by Age in Augusta
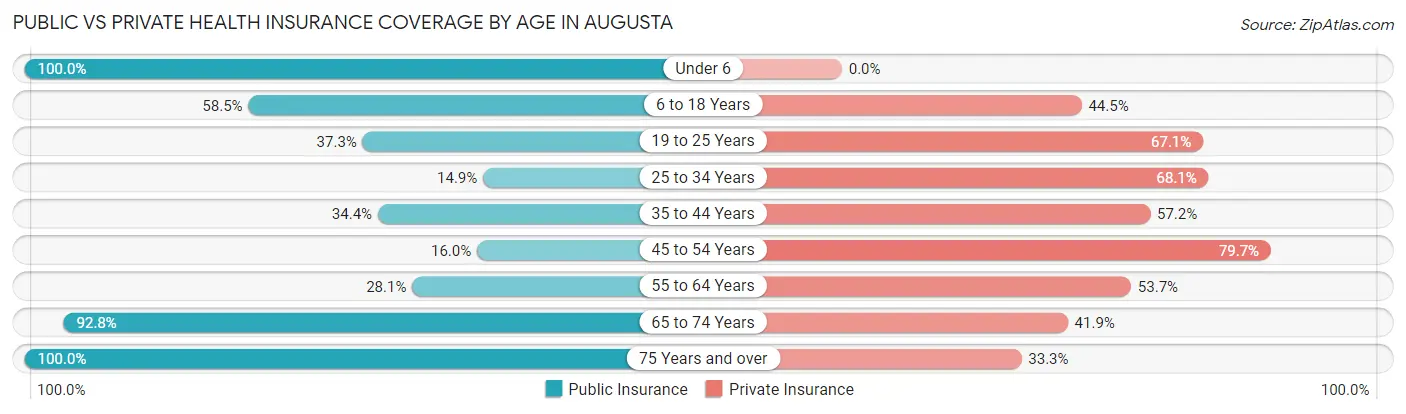
| Age Bracket | Public Insurance | Private Insurance |
| Under 6 | 193 (100.0%) | 0 (0.0%) |
| 6 to 18 Years | 159 (58.5%) | 121 (44.5%) |
| 19 to 25 Years | 95 (37.2%) | 171 (67.1%) |
| 25 to 34 Years | 14 (14.9%) | 64 (68.1%) |
| 35 to 44 Years | 74 (34.4%) | 123 (57.2%) |
| 45 to 54 Years | 37 (16.0%) | 184 (79.6%) |
| 55 to 64 Years | 69 (28.1%) | 132 (53.7%) |
| 65 to 74 Years | 270 (92.8%) | 122 (41.9%) |
| 75 Years and over | 189 (100.0%) | 63 (33.3%) |
| Total | 1,100 (55.4%) | 980 (49.3%) |
Disability Status by Sex by Age in Augusta
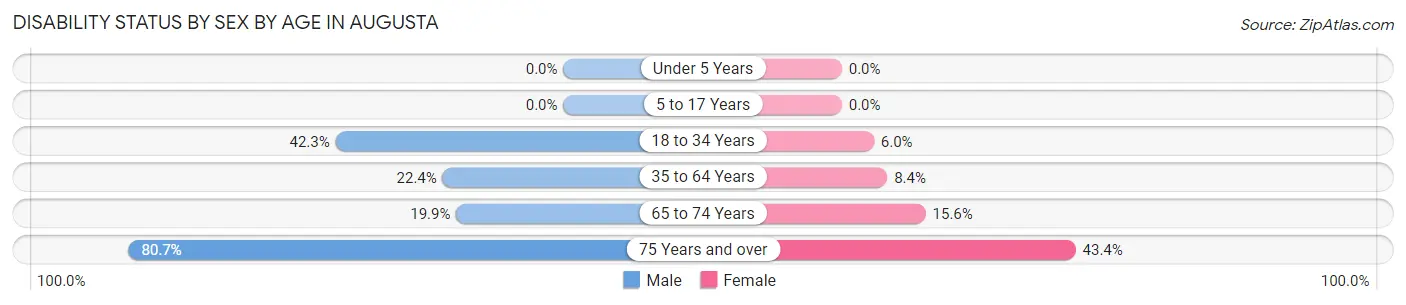
| Age Bracket | Male | Female |
| Under 5 Years | 0 (0.0%) | 0 (0.0%) |
| 5 to 17 Years | 0 (0.0%) | 0 (0.0%) |
| 18 to 34 Years | 52 (42.3%) | 16 (5.9%) |
| 35 to 64 Years | 78 (22.4%) | 29 (8.4%) |
| 65 to 74 Years | 31 (19.9%) | 21 (15.6%) |
| 75 Years and over | 67 (80.7%) | 46 (43.4%) |
Disability Class by Sex by Age in Augusta
Disability Class: Hearing Difficulty
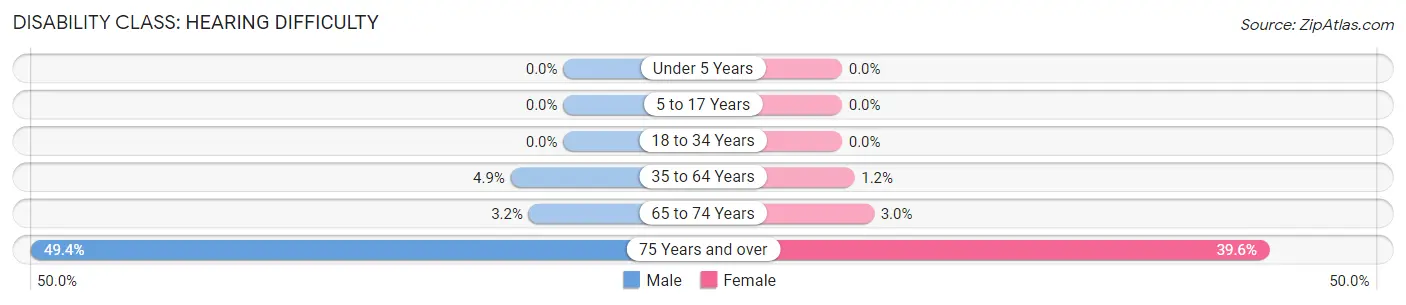
| Age Bracket | Male | Female |
| Under 5 Years | 0 (0.0%) | 0 (0.0%) |
| 5 to 17 Years | 0 (0.0%) | 0 (0.0%) |
| 18 to 34 Years | 0 (0.0%) | 0 (0.0%) |
| 35 to 64 Years | 17 (4.9%) | 4 (1.2%) |
| 65 to 74 Years | 5 (3.2%) | 4 (3.0%) |
| 75 Years and over | 41 (49.4%) | 42 (39.6%) |
Disability Class: Vision Difficulty
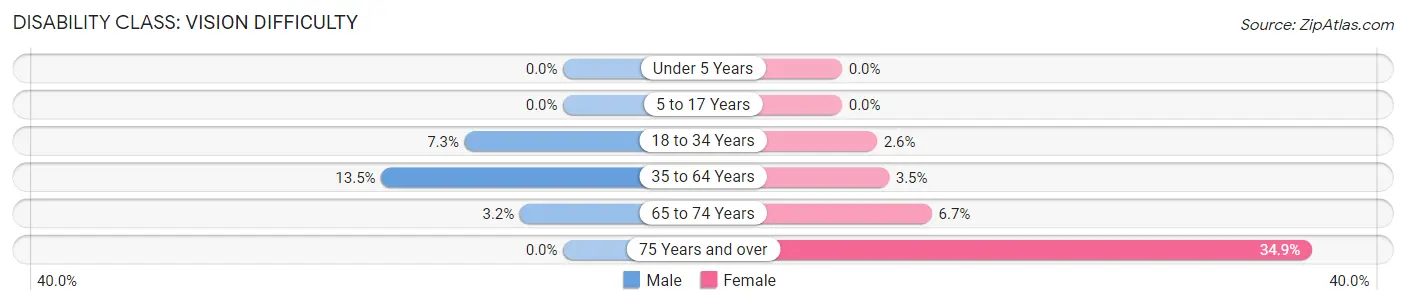
| Age Bracket | Male | Female |
| Under 5 Years | 0 (0.0%) | 0 (0.0%) |
| 5 to 17 Years | 0 (0.0%) | 0 (0.0%) |
| 18 to 34 Years | 9 (7.3%) | 7 (2.6%) |
| 35 to 64 Years | 47 (13.5%) | 12 (3.5%) |
| 65 to 74 Years | 5 (3.2%) | 9 (6.7%) |
| 75 Years and over | 0 (0.0%) | 37 (34.9%) |
Disability Class: Cognitive Difficulty
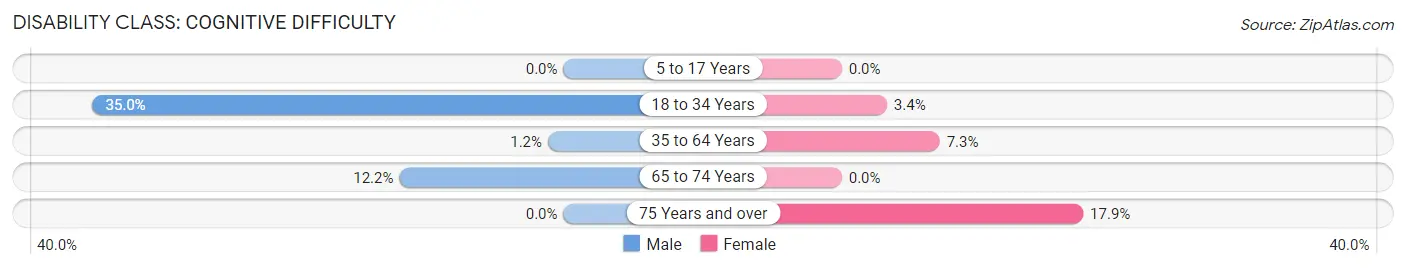
| Age Bracket | Male | Female |
| 5 to 17 Years | 0 (0.0%) | 0 (0.0%) |
| 18 to 34 Years | 43 (35.0%) | 9 (3.4%) |
| 35 to 64 Years | 4 (1.1%) | 25 (7.3%) |
| 65 to 74 Years | 19 (12.2%) | 0 (0.0%) |
| 75 Years and over | 0 (0.0%) | 19 (17.9%) |
Disability Class: Ambulatory Difficulty
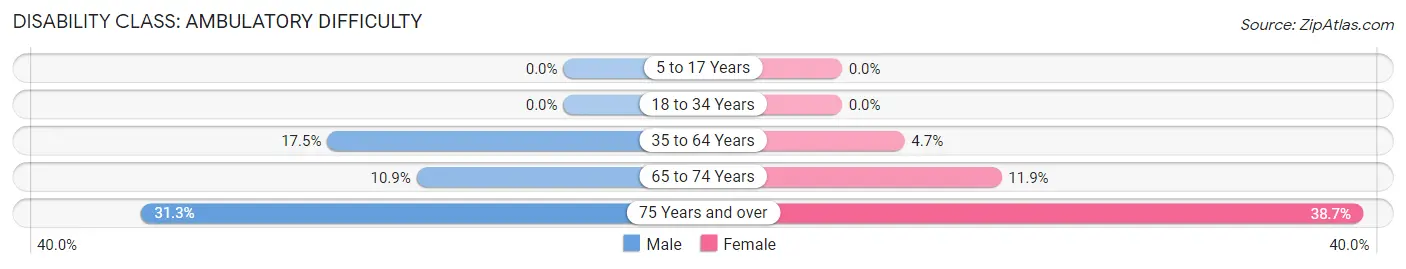
| Age Bracket | Male | Female |
| 5 to 17 Years | 0 (0.0%) | 0 (0.0%) |
| 18 to 34 Years | 0 (0.0%) | 0 (0.0%) |
| 35 to 64 Years | 61 (17.5%) | 16 (4.6%) |
| 65 to 74 Years | 17 (10.9%) | 16 (11.8%) |
| 75 Years and over | 26 (31.3%) | 41 (38.7%) |
Disability Class: Self-Care Difficulty
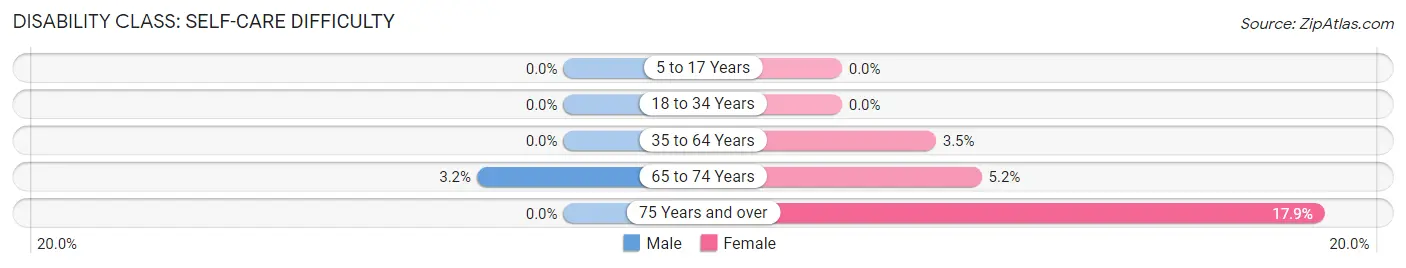
| Age Bracket | Male | Female |
| 5 to 17 Years | 0 (0.0%) | 0 (0.0%) |
| 18 to 34 Years | 0 (0.0%) | 0 (0.0%) |
| 35 to 64 Years | 0 (0.0%) | 12 (3.5%) |
| 65 to 74 Years | 5 (3.2%) | 7 (5.2%) |
| 75 Years and over | 0 (0.0%) | 19 (17.9%) |
Technology Access in Augusta
Computing Device Access in Augusta
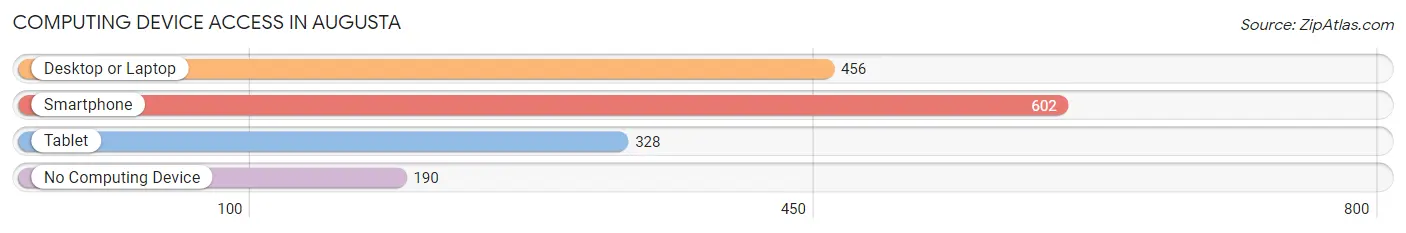
| Device Type | # Households | % Households |
| Desktop or Laptop | 456 | 54.7% |
| Smartphone | 602 | 72.2% |
| Tablet | 328 | 39.3% |
| No Computing Device | 190 | 22.8% |
| Total | 834 | 100.0% |
Internet Access in Augusta
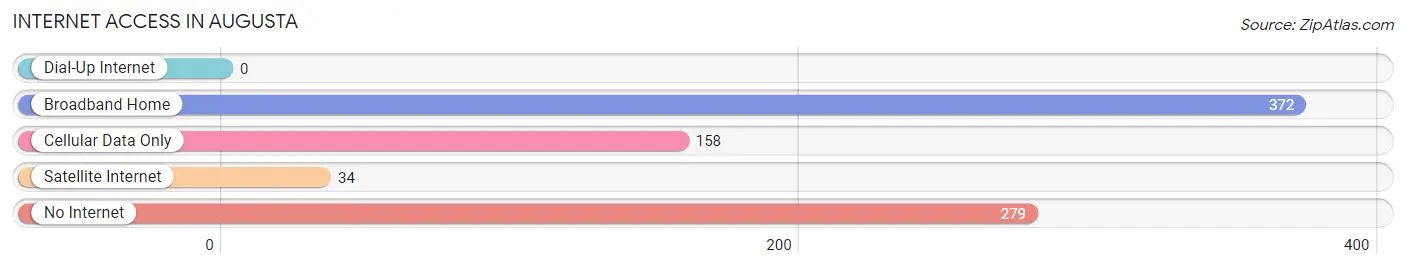
| Internet Type | # Households | % Households |
| Dial-Up Internet | 0 | 0.0% |
| Broadband Home | 372 | 44.6% |
| Cellular Data Only | 158 | 18.9% |
| Satellite Internet | 34 | 4.1% |
| No Internet | 279 | 33.5% |
| Total | 834 | 100.0% |
Augusta Summary
Augusta, Arkansas is a small town located in Woodruff County in the northeast corner of the state. It is situated on the banks of the White River, and is the county seat of Woodruff County. The town was founded in 1871 and has a population of approximately 1,000 people.
Augusta is located in the Arkansas Delta, a region of the state known for its rich agricultural heritage. The town is situated on the banks of the White River, which provides a source of irrigation for the surrounding farmland. The town is also located near the St. Francis National Forest, which provides a variety of recreational activities for residents and visitors alike.
Augusta has a rich history that dates back to the early 1800s. The town was originally settled by Native Americans, who used the area for hunting and fishing. In 1871, the town was officially founded and named after Augusta, Georgia. The town quickly grew and became a center of commerce for the surrounding area.
Augusta's economy is largely based on agriculture. The town is home to several large farms, which produce a variety of crops, including cotton, soybeans, corn, and wheat. The town also has a number of small businesses, including restaurants, retail stores, and service providers.
Augusta is served by the Augusta School District, which includes two elementary schools, one middle school, and one high school. The town also has a library, a post office, and a number of churches.
Augusta has a diverse population, with a mix of races and ethnicities. According to the 2010 census, the town's population was approximately 1,000 people, with a median age of 37. The town is predominantly white, with African Americans making up about 10% of the population. The town also has a small Hispanic population, as well as a small Asian population.
Augusta is a small town with a rich history and a diverse population. The town is home to a variety of businesses and industries, and is a great place to live and work. The town is also home to a number of recreational activities, including fishing, hunting, and camping. Augusta is a great place to visit and explore, and is a great place to call home.
Common Questions
What is Per Capita Income in Augusta?
Per Capita income in Augusta is $27,993.
What is the Median Family Income in Augusta?
Median Family Income in Augusta is $60,625.
What is the Median Household income in Augusta?
Median Household Income in Augusta is $51,535.
What is Income or Wage Gap in Augusta?
Income or Wage Gap in Augusta is 35.7%.
Women in Augusta earn 64.3 cents for every dollar earned by a man.
What is Inequality or Gini Index in Augusta?
Inequality or Gini Index in Augusta is 0.43.
What is the Total Population of Augusta?
Total Population of Augusta is 1,995.
What is the Total Male Population of Augusta?
Total Male Population of Augusta is 984.
What is the Total Female Population of Augusta?
Total Female Population of Augusta is 1,011.
What is the Ratio of Males per 100 Females in Augusta?
There are 97.33 Males per 100 Females in Augusta.
What is the Ratio of Females per 100 Males in Augusta?
There are 102.74 Females per 100 Males in Augusta.
What is the Median Population Age in Augusta?
Median Population Age in Augusta is 44.1 Years.
What is the Average Family Size in Augusta
Average Family Size in Augusta is 3.0 People.
What is the Average Household Size in Augusta
Average Household Size in Augusta is 2.4 People.
How Large is the Labor Force in Augusta?
There are 897 People in the Labor Forcein in Augusta.
What is the Percentage of People in the Labor Force in Augusta?
54.4% of People are in the Labor Force in Augusta.
What is the Unemployment Rate in Augusta?
Unemployment Rate in Augusta is 6.0%.