Arkadelphia, AR Map & Demographics
Arkadelphia Map
Arkadelphia Overview
$20,130
PER CAPITA INCOME
$60,761
AVG FAMILY INCOME
$37,634
AVG HOUSEHOLD INCOME
33.9%
WAGE / INCOME GAP [ % ]
66.1¢/ $1
WAGE / INCOME GAP [ $ ]
0.47
INEQUALITY / GINI INDEX
10,354
TOTAL POPULATION
4,673
MALE POPULATION
5,681
FEMALE POPULATION
82.26
MALES / 100 FEMALES
121.57
FEMALES / 100 MALES
23.3
MEDIAN AGE
3.1
AVG FAMILY SIZE
2.2
AVG HOUSEHOLD SIZE
4,822
LABOR FORCE [ PEOPLE ]
55.2%
PERCENT IN LABOR FORCE
3.6%
UNEMPLOYMENT RATE
Arkadelphia Area Codes
Income in Arkadelphia
Income Overview in Arkadelphia
Per Capita Income in Arkadelphia is $20,130, while median incomes of families and households are $60,761 and $37,634 respectively.
| Characteristic | Number | Measure |
| Per Capita Income | 10,354 | $20,130 |
| Median Family Income | 1,840 | $60,761 |
| Mean Family Income | 1,840 | $72,136 |
| Median Household Income | 3,562 | $37,634 |
| Mean Household Income | 3,562 | $54,234 |
| Income Deficit | 1,840 | $0 |
| Wage / Income Gap (%) | 10,354 | 33.85% |
| Wage / Income Gap ($) | 10,354 | 66.15¢ per $1 |
| Gini / Inequality Index | 10,354 | 0.47 |
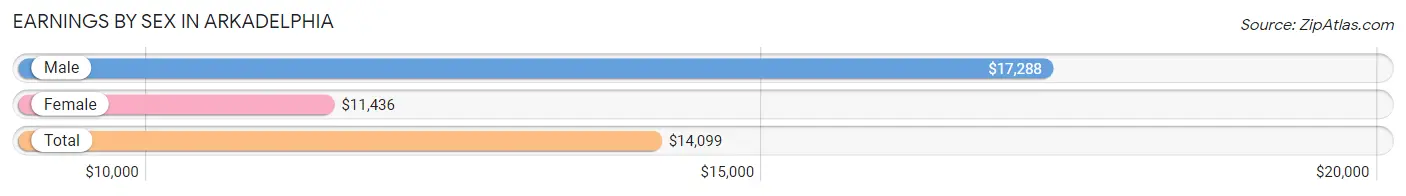
Earnings by Sex in Arkadelphia
Average Earnings in Arkadelphia are $14,099, $17,288 for men and $11,436 for women, a difference of 33.9%.
| Sex | Number | Average Earnings |
| Male | 2,805 (46.9%) | $17,288 |
| Female | 3,176 (53.1%) | $11,436 |
| Total | 5,981 (100.0%) | $14,099 |
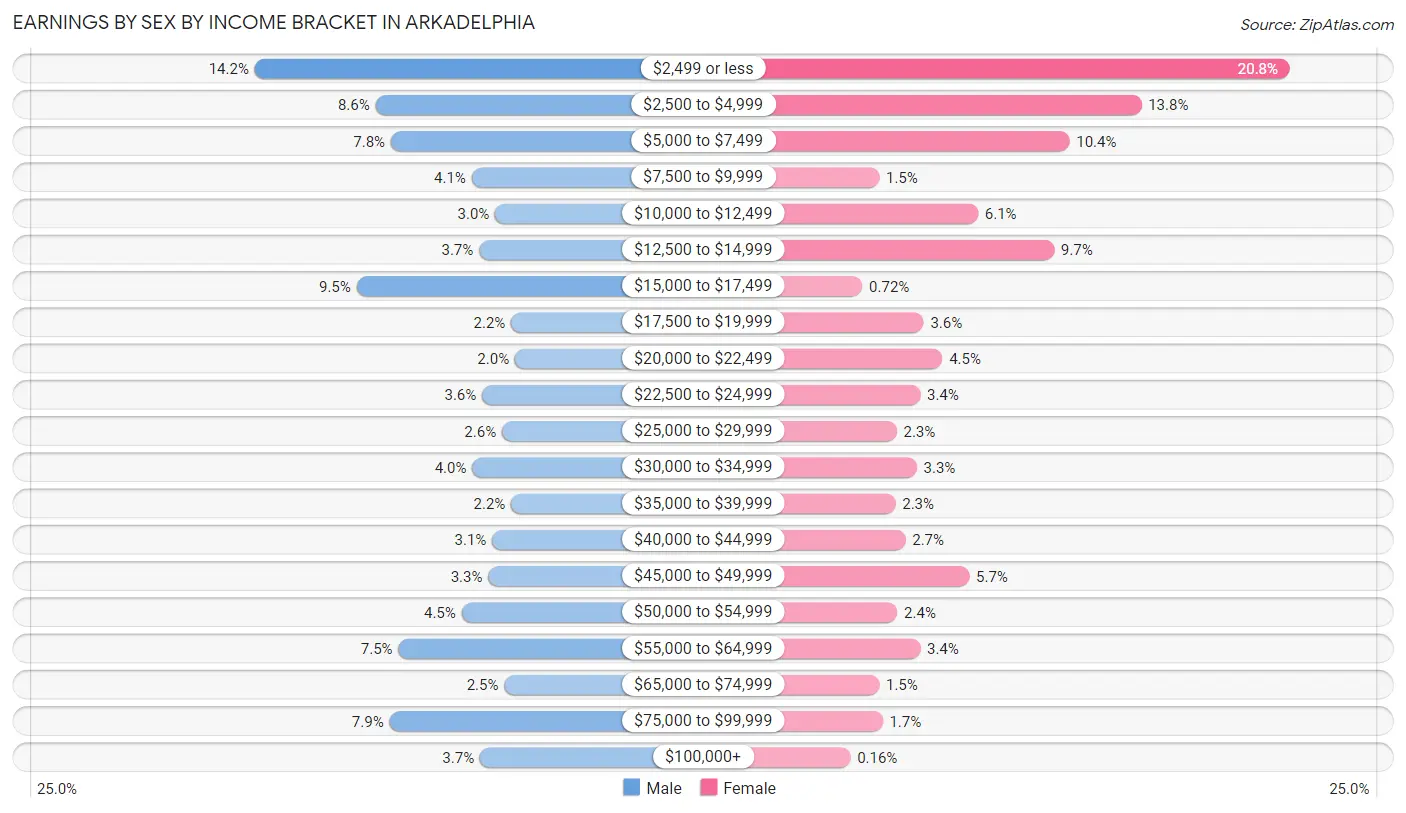
Earnings by Sex by Income Bracket in Arkadelphia
The most common earnings brackets in Arkadelphia are $2,499 or less for men (399 | 14.2%) and $2,499 or less for women (659 | 20.7%).
| Income | Male | Female |
| $2,499 or less | 399 (14.2%) | 659 (20.7%) |
| $2,500 to $4,999 | 240 (8.6%) | 438 (13.8%) |
| $5,000 to $7,499 | 220 (7.8%) | 331 (10.4%) |
| $7,500 to $9,999 | 114 (4.1%) | 48 (1.5%) |
| $10,000 to $12,499 | 83 (3.0%) | 195 (6.1%) |
| $12,500 to $14,999 | 104 (3.7%) | 308 (9.7%) |
| $15,000 to $17,499 | 265 (9.5%) | 23 (0.7%) |
| $17,500 to $19,999 | 62 (2.2%) | 114 (3.6%) |
| $20,000 to $22,499 | 57 (2.0%) | 142 (4.5%) |
| $22,500 to $24,999 | 100 (3.6%) | 109 (3.4%) |
| $25,000 to $29,999 | 74 (2.6%) | 74 (2.3%) |
| $30,000 to $34,999 | 113 (4.0%) | 104 (3.3%) |
| $35,000 to $39,999 | 62 (2.2%) | 72 (2.3%) |
| $40,000 to $44,999 | 87 (3.1%) | 87 (2.7%) |
| $45,000 to $49,999 | 92 (3.3%) | 182 (5.7%) |
| $50,000 to $54,999 | 127 (4.5%) | 75 (2.4%) |
| $55,000 to $64,999 | 210 (7.5%) | 109 (3.4%) |
| $65,000 to $74,999 | 71 (2.5%) | 48 (1.5%) |
| $75,000 to $99,999 | 222 (7.9%) | 53 (1.7%) |
| $100,000+ | 103 (3.7%) | 5 (0.2%) |
| Total | 2,805 (100.0%) | 3,176 (100.0%) |
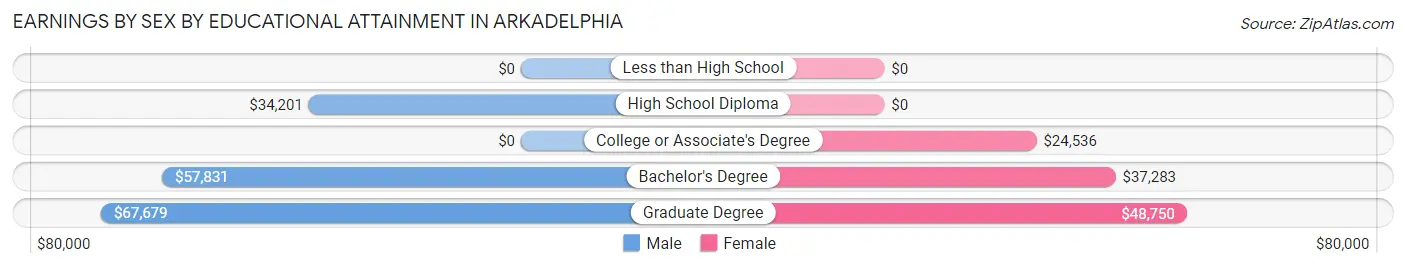
Earnings by Sex by Educational Attainment in Arkadelphia
Average earnings in Arkadelphia are $43,516 for men and $27,179 for women, a difference of 37.5%. Men with an educational attainment of graduate degree enjoy the highest average annual earnings of $67,679, while those with high school diploma education earn the least with $34,201. Women with an educational attainment of graduate degree earn the most with the average annual earnings of $48,750, while those with college or associate's degree education have the smallest earnings of $24,536.
| Educational Attainment | Male Income | Female Income |
| Less than High School | - | - |
| High School Diploma | $34,201 | $0 |
| College or Associate's Degree | - | - |
| Bachelor's Degree | $57,831 | $37,283 |
| Graduate Degree | $67,679 | $48,750 |
| Total | $43,516 | $27,179 |
Family Income in Arkadelphia
Family Income Brackets in Arkadelphia
According to the Arkadelphia family income data, there are 372 families falling into the $75,000 to $99,999 income range, which is the most common income bracket and makes up 20.2% of all families. Conversely, the $150,000 to $199,999 income bracket is the least frequent group with only 53 families (2.9%) belonging to this category.
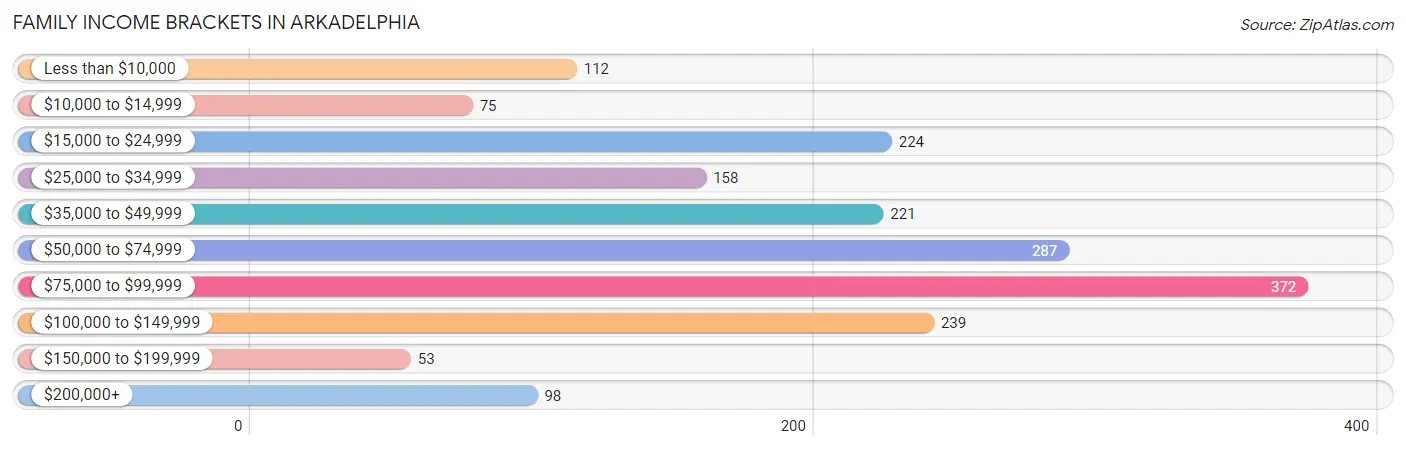
| Income Bracket | # Families | % Families |
| Less than $10,000 | 112 | 6.1% |
| $10,000 to $14,999 | 75 | 4.1% |
| $15,000 to $24,999 | 224 | 12.2% |
| $25,000 to $34,999 | 158 | 8.6% |
| $35,000 to $49,999 | 221 | 12.0% |
| $50,000 to $74,999 | 287 | 15.6% |
| $75,000 to $99,999 | 372 | 20.2% |
| $100,000 to $149,999 | 239 | 13.0% |
| $150,000 to $199,999 | 53 | 2.9% |
| $200,000+ | 98 | 5.3% |
Family Income by Famaliy Size in Arkadelphia
5-person families (135 | 7.3%) account for the highest median family income in Arkadelphia with $103,780 per family, while 2-person families (1,062 | 57.7%) have the highest median income of $28,106 per family member.
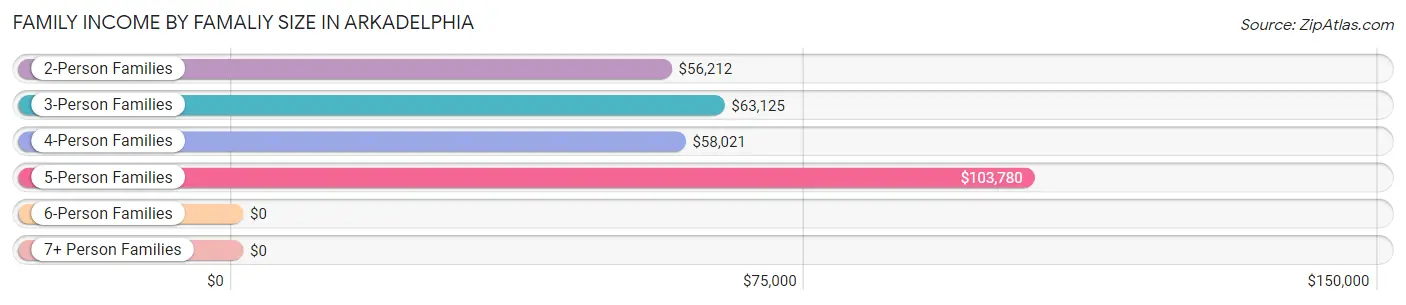
| Income Bracket | # Families | Median Income |
| 2-Person Families | 1,062 (57.7%) | $56,212 |
| 3-Person Families | 300 (16.3%) | $63,125 |
| 4-Person Families | 249 (13.5%) | $58,021 |
| 5-Person Families | 135 (7.3%) | $103,780 |
| 6-Person Families | 30 (1.6%) | $0 |
| 7+ Person Families | 64 (3.5%) | $0 |
| Total | 1,840 (100.0%) | $60,761 |
Family Income by Number of Earners in Arkadelphia
The median family income in Arkadelphia is $60,761, with families comprising 2 earners (600) having the highest median family income of $94,290, while families with no earners (330) have the lowest median family income of $34,936, accounting for 32.6% and 17.9% of families, respectively.
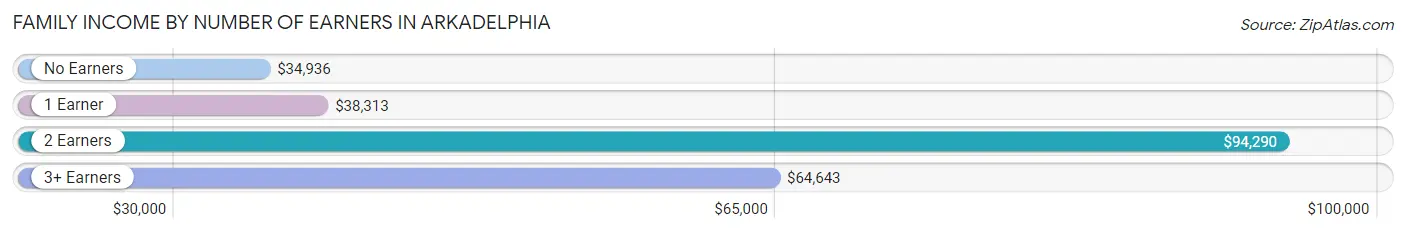
| Number of Earners | # Families | Median Income |
| No Earners | 330 (17.9%) | $34,936 |
| 1 Earner | 804 (43.7%) | $38,313 |
| 2 Earners | 600 (32.6%) | $94,290 |
| 3+ Earners | 106 (5.8%) | $64,643 |
| Total | 1,840 (100.0%) | $60,761 |
Household Income in Arkadelphia
Household Income Brackets in Arkadelphia
With 573 households falling in the category, the $15,000 to $24,999 income range is the most frequent in Arkadelphia, accounting for 16.1% of all households. In contrast, only 53 households (1.5%) fall into the $150,000 to $199,999 income bracket, making it the least populous group.
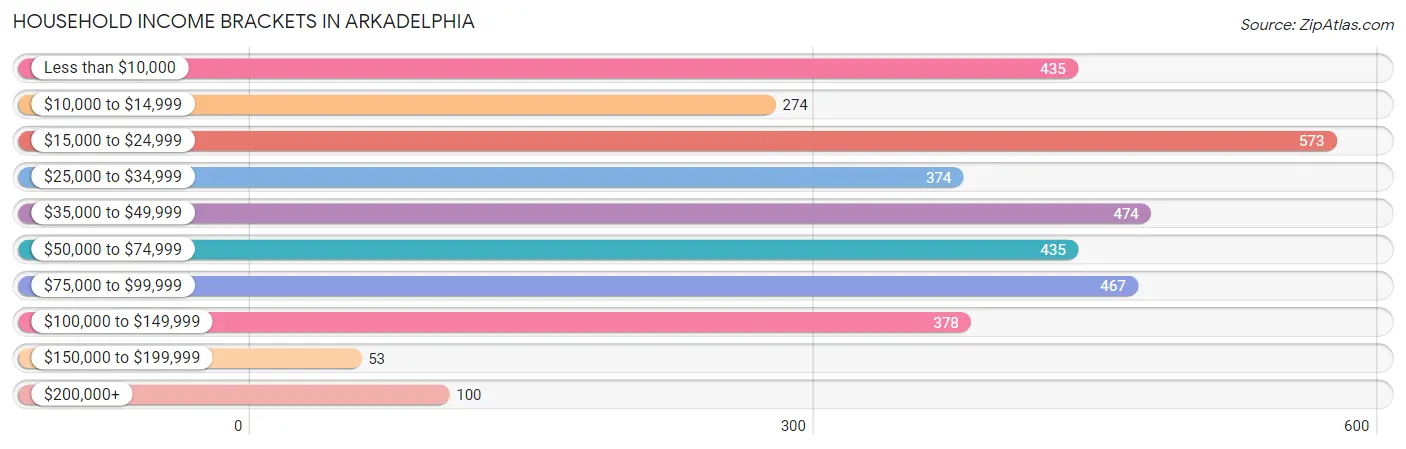
| Income Bracket | # Households | % Households |
| Less than $10,000 | 435 | 12.2% |
| $10,000 to $14,999 | 274 | 7.7% |
| $15,000 to $24,999 | 573 | 16.1% |
| $25,000 to $34,999 | 374 | 10.5% |
| $35,000 to $49,999 | 474 | 13.3% |
| $50,000 to $74,999 | 435 | 12.2% |
| $75,000 to $99,999 | 467 | 13.1% |
| $100,000 to $149,999 | 378 | 10.6% |
| $150,000 to $199,999 | 53 | 1.5% |
| $200,000+ | 100 | 2.8% |
Household Income by Householder Age in Arkadelphia
The median household income in Arkadelphia is $37,634, with the highest median household income of $49,359 found in the 45 to 64 years age bracket for the primary householder. A total of 843 households (23.7%) fall into this category. Meanwhile, the 15 to 24 years age bracket for the primary householder has the lowest median household income of $23,239, with 733 households (20.6%) in this group.
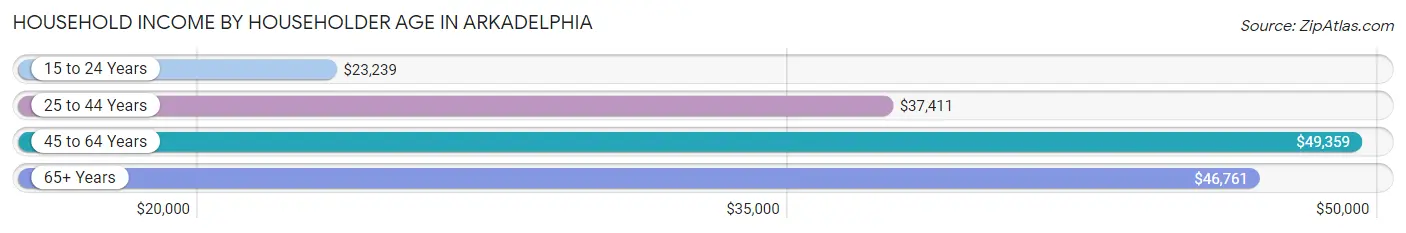
| Income Bracket | # Households | Median Income |
| 15 to 24 Years | 733 (20.6%) | $23,239 |
| 25 to 44 Years | 1,068 (30.0%) | $37,411 |
| 45 to 64 Years | 843 (23.7%) | $49,359 |
| 65+ Years | 918 (25.8%) | $46,761 |
| Total | 3,562 (100.0%) | $37,634 |
Poverty in Arkadelphia
Income Below Poverty by Sex and Age in Arkadelphia
With 23.9% poverty level for males and 29.2% for females among the residents of Arkadelphia, 18 to 24 year old males and 5 year old females are the most vulnerable to poverty, with 520 males (55.2%) and 3 females (100.0%) in their respective age groups living below the poverty level.
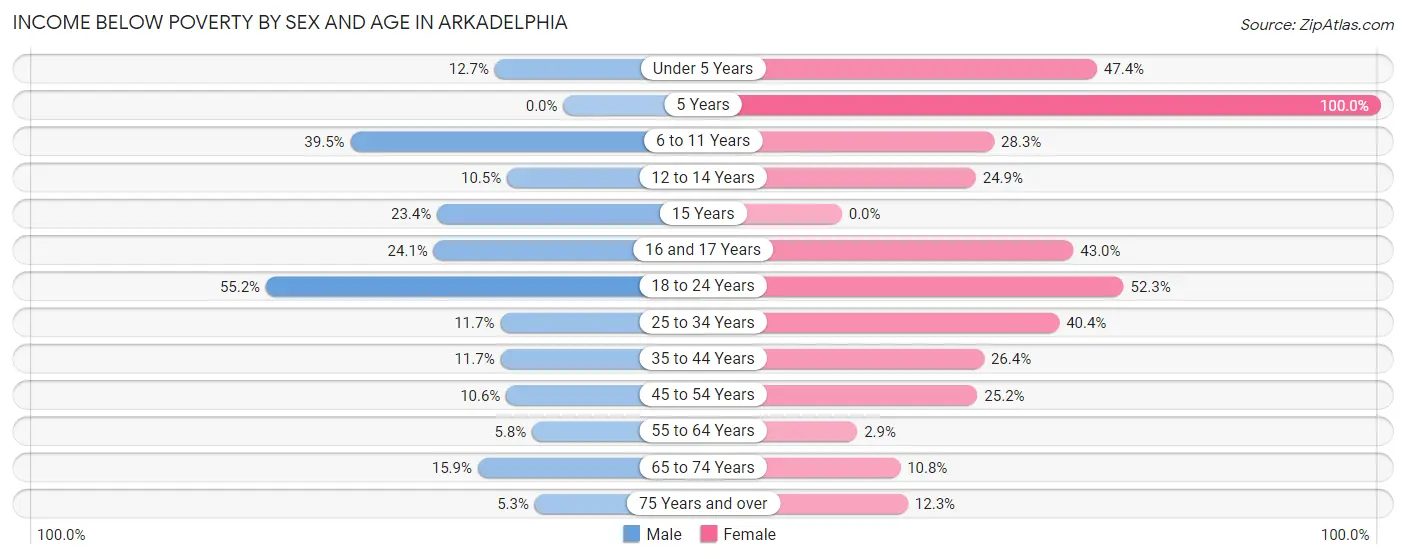
| Age Bracket | Male | Female |
| Under 5 Years | 34 (12.7%) | 170 (47.3%) |
| 5 Years | 0 (0.0%) | 3 (100.0%) |
| 6 to 11 Years | 85 (39.5%) | 56 (28.3%) |
| 12 to 14 Years | 28 (10.4%) | 54 (24.9%) |
| 15 Years | 15 (23.4%) | 0 (0.0%) |
| 16 and 17 Years | 13 (24.1%) | 52 (43.0%) |
| 18 to 24 Years | 520 (55.2%) | 375 (52.3%) |
| 25 to 34 Years | 85 (11.7%) | 186 (40.4%) |
| 35 to 44 Years | 28 (11.7%) | 147 (26.4%) |
| 45 to 54 Years | 35 (10.6%) | 72 (25.2%) |
| 55 to 64 Years | 17 (5.8%) | 12 (2.9%) |
| 65 to 74 Years | 37 (15.9%) | 53 (10.8%) |
| 75 Years and over | 8 (5.3%) | 40 (12.3%) |
| Total | 905 (23.9%) | 1,220 (29.2%) |
Income Above Poverty by Sex and Age in Arkadelphia
According to the poverty statistics in Arkadelphia, males aged 5 years and females aged 15 years are the age groups that are most secure financially, with 100.0% of males and 100.0% of females in these age groups living above the poverty line.
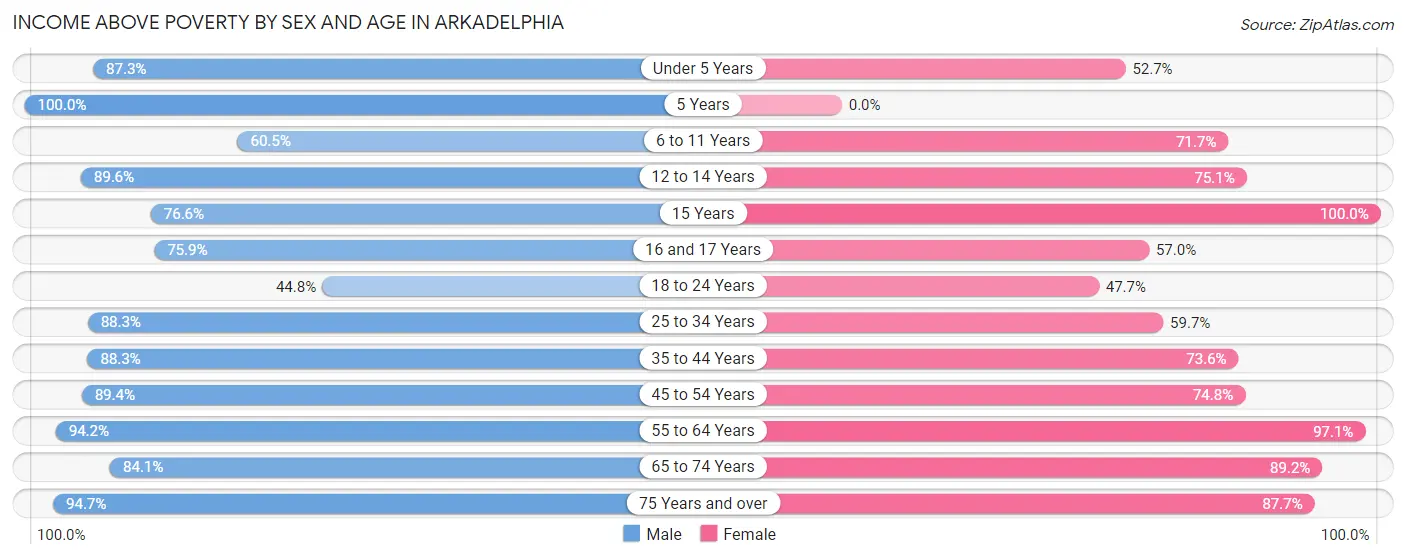
| Age Bracket | Male | Female |
| Under 5 Years | 233 (87.3%) | 189 (52.6%) |
| 5 Years | 7 (100.0%) | 0 (0.0%) |
| 6 to 11 Years | 130 (60.5%) | 142 (71.7%) |
| 12 to 14 Years | 240 (89.5%) | 163 (75.1%) |
| 15 Years | 49 (76.6%) | 21 (100.0%) |
| 16 and 17 Years | 41 (75.9%) | 69 (57.0%) |
| 18 to 24 Years | 422 (44.8%) | 342 (47.7%) |
| 25 to 34 Years | 640 (88.3%) | 275 (59.7%) |
| 35 to 44 Years | 212 (88.3%) | 410 (73.6%) |
| 45 to 54 Years | 295 (89.4%) | 214 (74.8%) |
| 55 to 64 Years | 276 (94.2%) | 408 (97.1%) |
| 65 to 74 Years | 196 (84.1%) | 436 (89.2%) |
| 75 Years and over | 143 (94.7%) | 286 (87.7%) |
| Total | 2,884 (76.1%) | 2,955 (70.8%) |
Income Below Poverty Among Married-Couple Families in Arkadelphia
The poverty statistics for married-couple families in Arkadelphia show that 4.7% or 52 of the total 1,101 families live below the poverty line. Families with 1 or 2 children have the highest poverty rate of 9.3%, comprising of 22 families. On the other hand, families with 3 or 4 children have the lowest poverty rate of 0.0%, which includes 0 families.
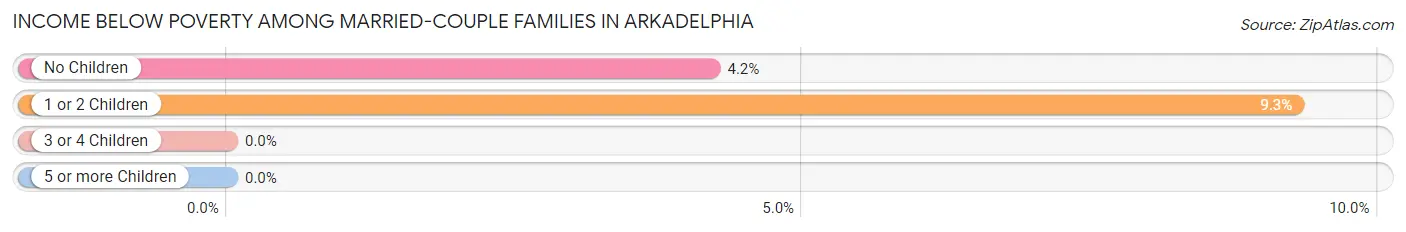
| Children | Above Poverty | Below Poverty |
| No Children | 684 (95.8%) | 30 (4.2%) |
| 1 or 2 Children | 215 (90.7%) | 22 (9.3%) |
| 3 or 4 Children | 91 (100.0%) | 0 (0.0%) |
| 5 or more Children | 59 (100.0%) | 0 (0.0%) |
| Total | 1,049 (95.3%) | 52 (4.7%) |
Income Below Poverty Among Single-Parent Households in Arkadelphia
According to the poverty data in Arkadelphia, 13.0% or 16 single-father households and 39.0% or 240 single-mother households are living below the poverty line. Among single-father households, those with no children have the highest poverty rate, with 16 households (20.8%) experiencing poverty. Likewise, among single-mother households, those with 3 or 4 children have the highest poverty rate, with 66 households (80.5%) falling below the poverty line.
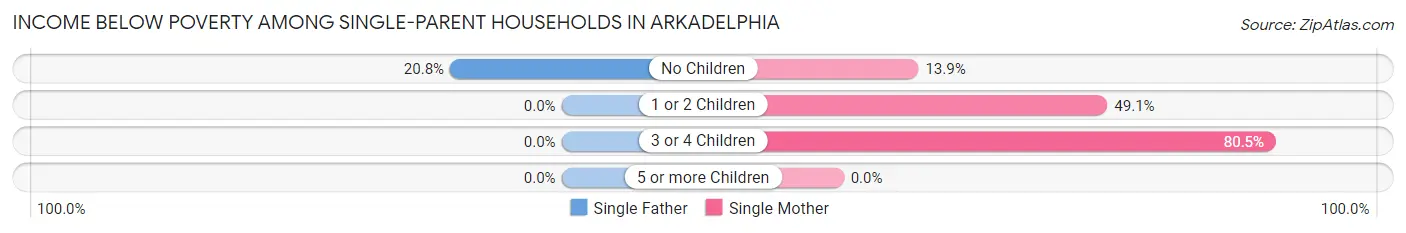
| Children | Single Father | Single Mother |
| No Children | 16 (20.8%) | 35 (13.9%) |
| 1 or 2 Children | 0 (0.0%) | 139 (49.1%) |
| 3 or 4 Children | 0 (0.0%) | 66 (80.5%) |
| 5 or more Children | 0 (0.0%) | 0 (0.0%) |
| Total | 16 (13.0%) | 240 (39.0%) |
Income Below Poverty Among Married-Couple vs Single-Parent Households in Arkadelphia
The poverty data for Arkadelphia shows that 52 of the married-couple family households (4.7%) and 256 of the single-parent households (34.6%) are living below the poverty level. Within the married-couple family households, those with 1 or 2 children have the highest poverty rate, with 22 households (9.3%) falling below the poverty line. Among the single-parent households, those with 3 or 4 children have the highest poverty rate, with 66 household (80.5%) living below poverty.
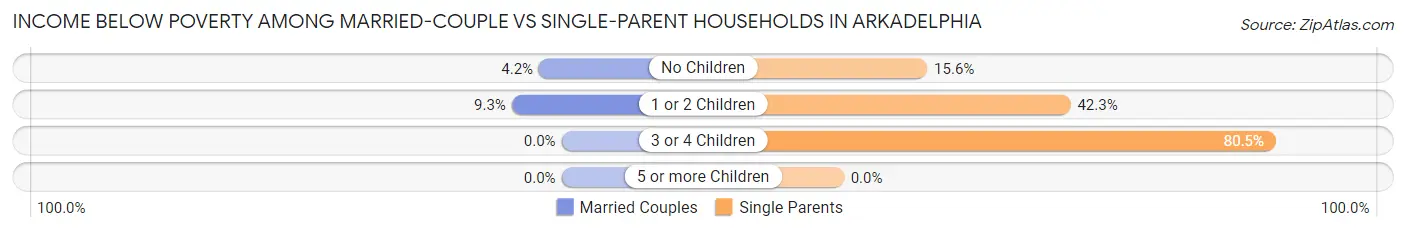
| Children | Married-Couple Families | Single-Parent Households |
| No Children | 30 (4.2%) | 51 (15.5%) |
| 1 or 2 Children | 22 (9.3%) | 139 (42.2%) |
| 3 or 4 Children | 0 (0.0%) | 66 (80.5%) |
| 5 or more Children | 0 (0.0%) | 0 (0.0%) |
| Total | 52 (4.7%) | 256 (34.6%) |
Race in Arkadelphia
The most populous races in Arkadelphia are White / Caucasian (6,307 | 60.9%), Black / African American (3,129 | 30.2%), and Hispanic or Latino (596 | 5.8%).
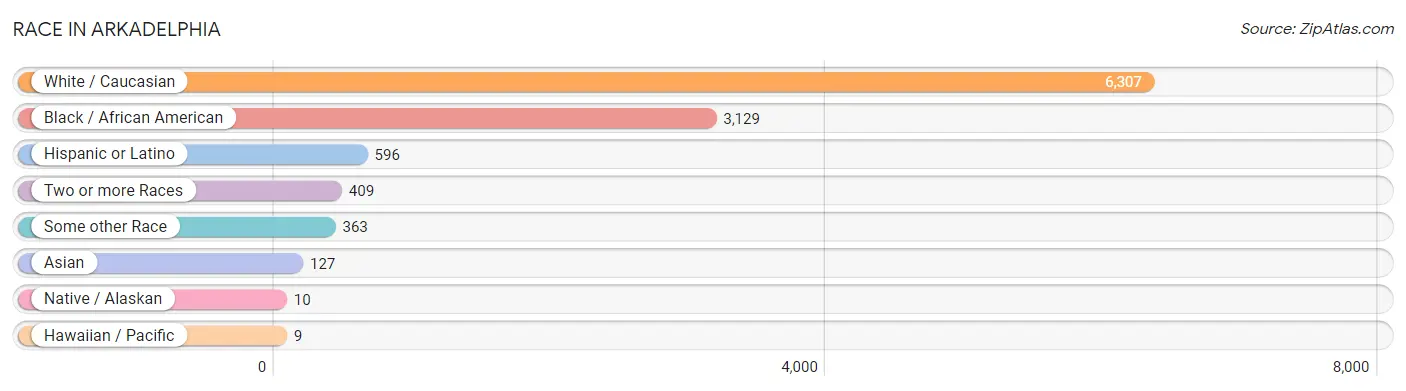
| Race | # Population | % Population |
| Asian | 127 | 1.2% |
| Black / African American | 3,129 | 30.2% |
| Hawaiian / Pacific | 9 | 0.1% |
| Hispanic or Latino | 596 | 5.8% |
| Native / Alaskan | 10 | 0.1% |
| White / Caucasian | 6,307 | 60.9% |
| Two or more Races | 409 | 4.0% |
| Some other Race | 363 | 3.5% |
| Total | 10,354 | 100.0% |
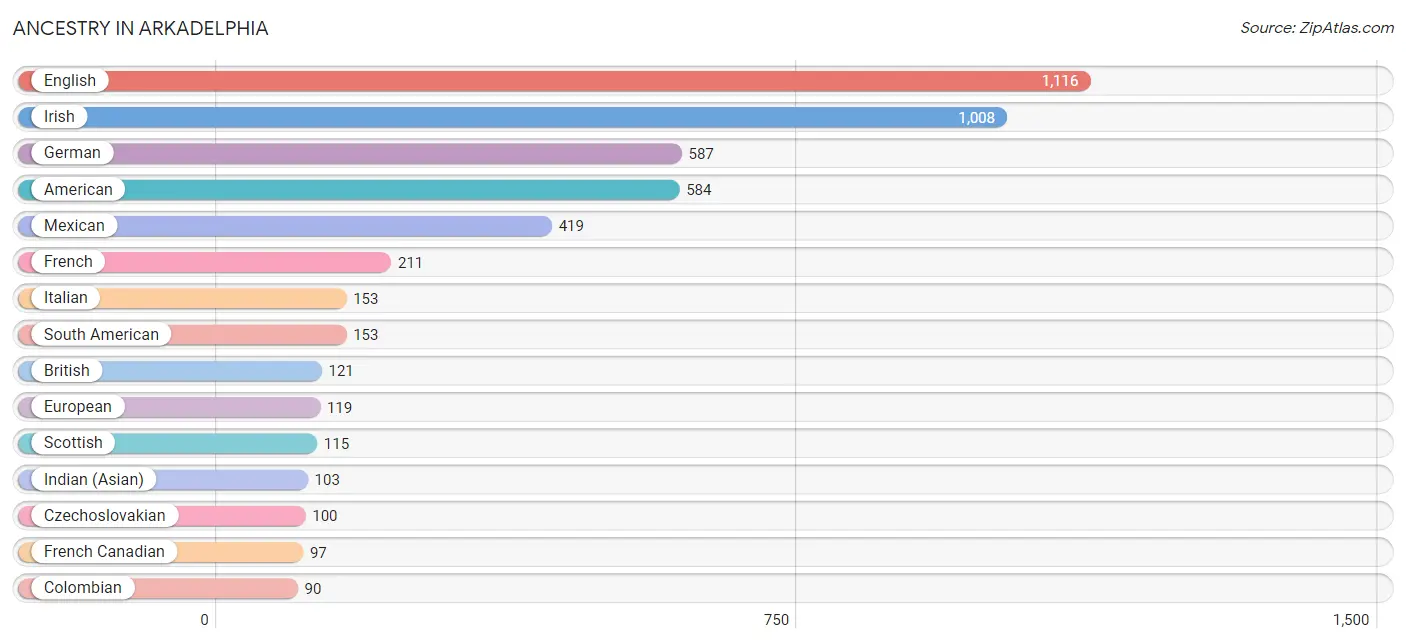
Ancestry in Arkadelphia
The most populous ancestries reported in Arkadelphia are English (1,116 | 10.8%), Irish (1,008 | 9.7%), German (587 | 5.7%), American (584 | 5.6%), and Mexican (419 | 4.1%), together accounting for 35.9% of all Arkadelphia residents.
| Ancestry | # Population | % Population |
| African | 14 | 0.1% |
| American | 584 | 5.6% |
| Belgian | 7 | 0.1% |
| Bhutanese | 26 | 0.3% |
| British | 121 | 1.2% |
| Burmese | 13 | 0.1% |
| Canadian | 4 | 0.0% |
| Central American | 17 | 0.2% |
| Cherokee | 14 | 0.1% |
| Chickasaw | 3 | 0.0% |
| Chilean | 3 | 0.0% |
| Choctaw | 3 | 0.0% |
| Colombian | 90 | 0.9% |
| Costa Rican | 13 | 0.1% |
| Creek | 15 | 0.1% |
| Czech | 9 | 0.1% |
| Czechoslovakian | 100 | 1.0% |
| Danish | 3 | 0.0% |
| Dutch | 68 | 0.7% |
| Ecuadorian | 12 | 0.1% |
| English | 1,116 | 10.8% |
| European | 119 | 1.1% |
| French | 211 | 2.0% |
| French Canadian | 97 | 0.9% |
| German | 587 | 5.7% |
| Ghanaian | 6 | 0.1% |
| Greek | 3 | 0.0% |
| Hungarian | 22 | 0.2% |
| Indian (Asian) | 103 | 1.0% |
| Irish | 1,008 | 9.7% |
| Italian | 153 | 1.5% |
| Korean | 4 | 0.0% |
| Mexican | 419 | 4.1% |
| Native Hawaiian | 3 | 0.0% |
| Northern European | 9 | 0.1% |
| Norwegian | 22 | 0.2% |
| Peruvian | 36 | 0.4% |
| Polish | 5 | 0.1% |
| Puerto Rican | 7 | 0.1% |
| Romanian | 8 | 0.1% |
| Russian | 10 | 0.1% |
| Salvadoran | 4 | 0.0% |
| Scandinavian | 14 | 0.1% |
| Scotch-Irish | 83 | 0.8% |
| Scottish | 115 | 1.1% |
| Slovak | 4 | 0.0% |
| South American | 153 | 1.5% |
| Sri Lankan | 8 | 0.1% |
| Subsaharan African | 23 | 0.2% |
| Swedish | 26 | 0.3% |
| Thai | 21 | 0.2% |
| Ukrainian | 2 | 0.0% |
| Uruguayan | 12 | 0.1% |
| Welsh | 20 | 0.2% | View All 54 Rows |
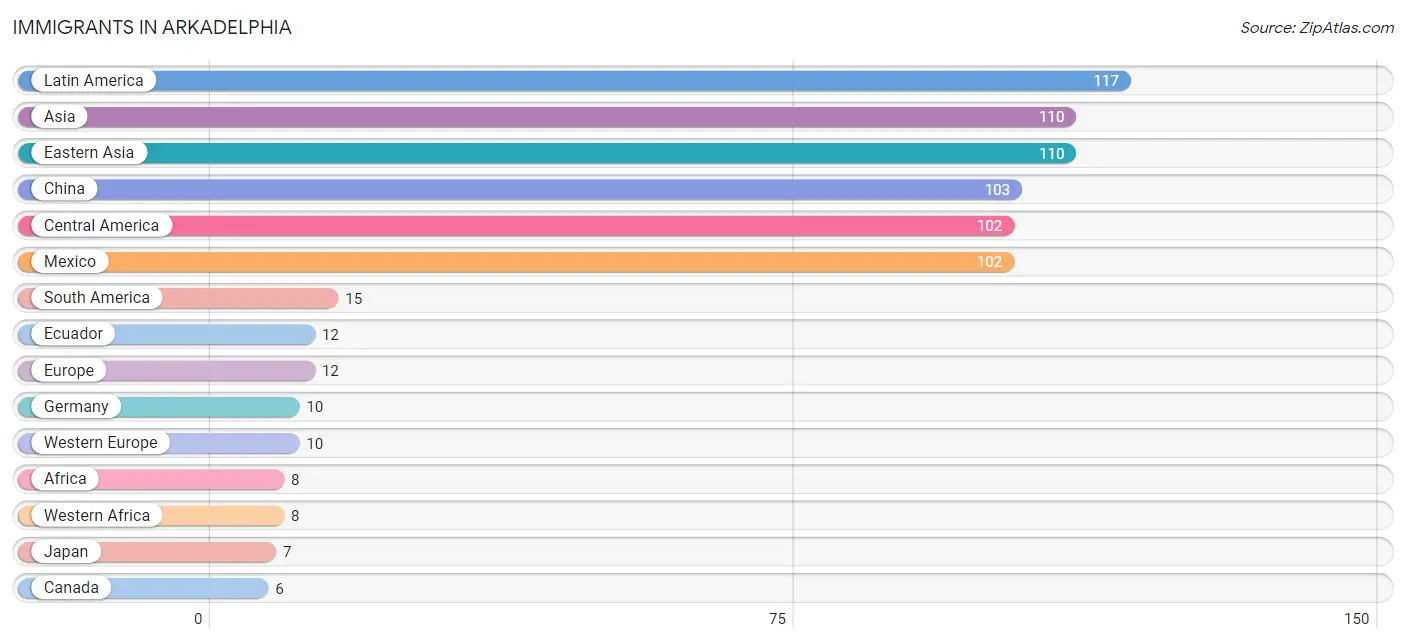
Immigrants in Arkadelphia
The most numerous immigrant groups reported in Arkadelphia came from Latin America (117 | 1.1%), Asia (110 | 1.1%), Eastern Asia (110 | 1.1%), China (103 | 1.0%), and Central America (102 | 1.0%), together accounting for 5.2% of all Arkadelphia residents.
| Immigration Origin | # Population | % Population |
| Africa | 8 | 0.1% |
| Asia | 110 | 1.1% |
| Canada | 6 | 0.1% |
| Central America | 102 | 1.0% |
| Chile | 3 | 0.0% |
| China | 103 | 1.0% |
| Eastern Asia | 110 | 1.1% |
| Eastern Europe | 2 | 0.0% |
| Ecuador | 12 | 0.1% |
| Europe | 12 | 0.1% |
| Fiji | 6 | 0.1% |
| Germany | 10 | 0.1% |
| Ghana | 6 | 0.1% |
| Japan | 7 | 0.1% |
| Latin America | 117 | 1.1% |
| Mexico | 102 | 1.0% |
| Oceania | 6 | 0.1% |
| South America | 15 | 0.1% |
| Ukraine | 2 | 0.0% |
| Western Africa | 8 | 0.1% |
| Western Europe | 10 | 0.1% | View All 21 Rows |
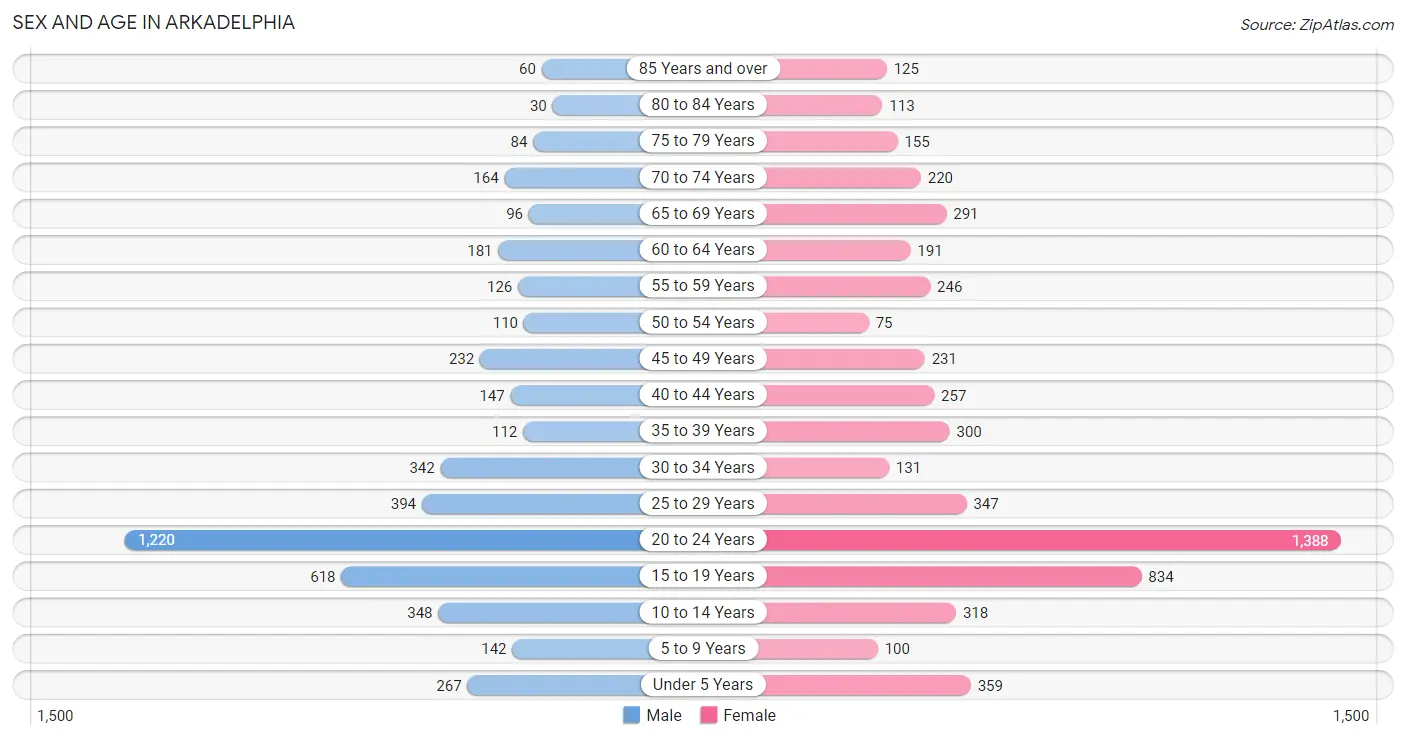
Sex and Age in Arkadelphia
Sex and Age in Arkadelphia
The most populous age groups in Arkadelphia are 20 to 24 Years (1,220 | 26.1%) for men and 20 to 24 Years (1,388 | 24.4%) for women.
| Age Bracket | Male | Female |
| Under 5 Years | 267 (5.7%) | 359 (6.3%) |
| 5 to 9 Years | 142 (3.0%) | 100 (1.8%) |
| 10 to 14 Years | 348 (7.4%) | 318 (5.6%) |
| 15 to 19 Years | 618 (13.2%) | 834 (14.7%) |
| 20 to 24 Years | 1,220 (26.1%) | 1,388 (24.4%) |
| 25 to 29 Years | 394 (8.4%) | 347 (6.1%) |
| 30 to 34 Years | 342 (7.3%) | 131 (2.3%) |
| 35 to 39 Years | 112 (2.4%) | 300 (5.3%) |
| 40 to 44 Years | 147 (3.2%) | 257 (4.5%) |
| 45 to 49 Years | 232 (5.0%) | 231 (4.1%) |
| 50 to 54 Years | 110 (2.4%) | 75 (1.3%) |
| 55 to 59 Years | 126 (2.7%) | 246 (4.3%) |
| 60 to 64 Years | 181 (3.9%) | 191 (3.4%) |
| 65 to 69 Years | 96 (2.1%) | 291 (5.1%) |
| 70 to 74 Years | 164 (3.5%) | 220 (3.9%) |
| 75 to 79 Years | 84 (1.8%) | 155 (2.7%) |
| 80 to 84 Years | 30 (0.6%) | 113 (2.0%) |
| 85 Years and over | 60 (1.3%) | 125 (2.2%) |
| Total | 4,673 (100.0%) | 5,681 (100.0%) |
Families and Households in Arkadelphia
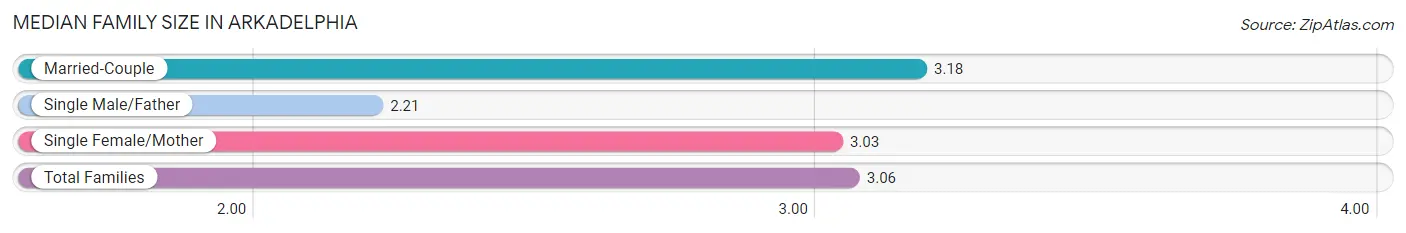
Median Family Size in Arkadelphia
The median family size in Arkadelphia is 3.06 persons per family, with married-couple families (1,101 | 59.8%) accounting for the largest median family size of 3.18 persons per family. On the other hand, single male/father families (123 | 6.7%) represent the smallest median family size with 2.21 persons per family.
| Family Type | # Families | Family Size |
| Married-Couple | 1,101 (59.8%) | 3.18 |
| Single Male/Father | 123 (6.7%) | 2.21 |
| Single Female/Mother | 616 (33.5%) | 3.03 |
| Total Families | 1,840 (100.0%) | 3.06 |
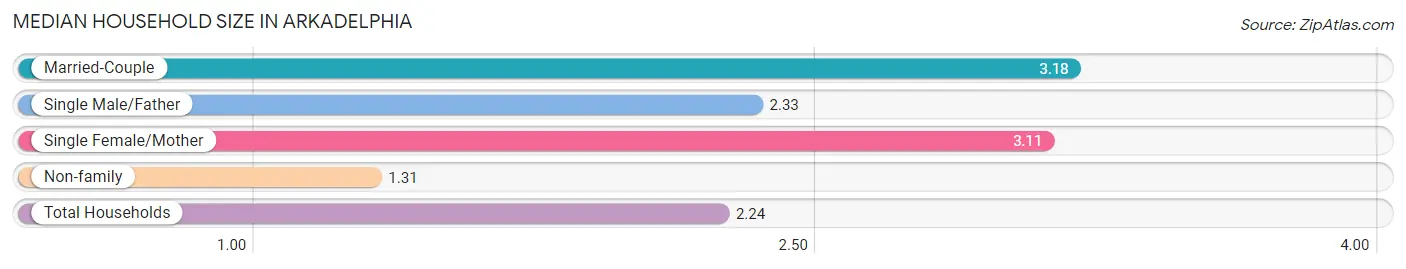
Median Household Size in Arkadelphia
The median household size in Arkadelphia is 2.24 persons per household, with married-couple households (1,101 | 30.9%) accounting for the largest median household size of 3.18 persons per household. non-family households (1,722 | 48.3%) represent the smallest median household size with 1.31 persons per household.
| Household Type | # Households | Household Size |
| Married-Couple | 1,101 (30.9%) | 3.18 |
| Single Male/Father | 123 (3.5%) | 2.33 |
| Single Female/Mother | 616 (17.3%) | 3.11 |
| Non-family | 1,722 (48.3%) | 1.31 |
| Total Households | 3,562 (100.0%) | 2.24 |
Household Size by Marriage Status in Arkadelphia
Out of a total of 3,562 households in Arkadelphia, 1,840 (51.7%) are family households, while 1,722 (48.3%) are nonfamily households. The most numerous type of family households are 2-person households, comprising 1,027, and the most common type of nonfamily households are 1-person households, comprising 1,266.
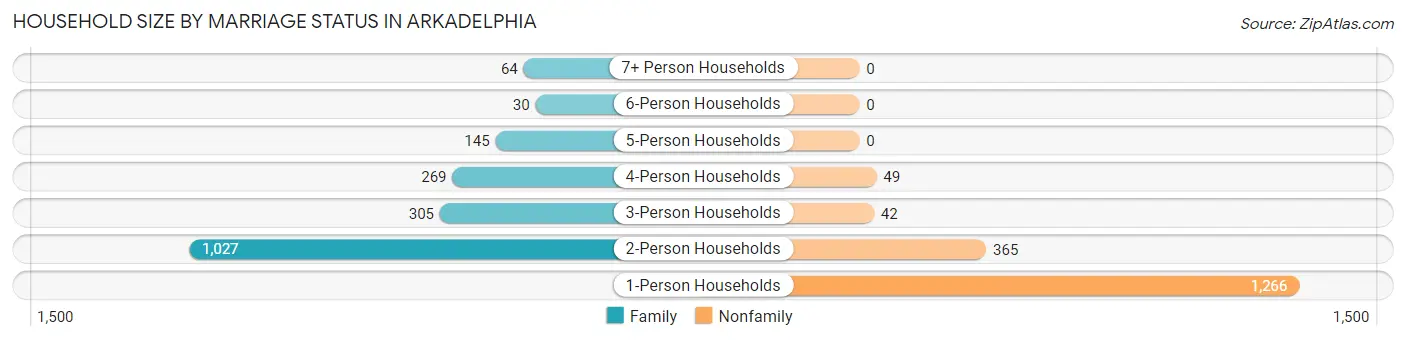
| Household Size | Family Households | Nonfamily Households |
| 1-Person Households | - | 1,266 (35.5%) |
| 2-Person Households | 1,027 (28.8%) | 365 (10.2%) |
| 3-Person Households | 305 (8.6%) | 42 (1.2%) |
| 4-Person Households | 269 (7.5%) | 49 (1.4%) |
| 5-Person Households | 145 (4.1%) | 0 (0.0%) |
| 6-Person Households | 30 (0.8%) | 0 (0.0%) |
| 7+ Person Households | 64 (1.8%) | 0 (0.0%) |
| Total | 1,840 (51.7%) | 1,722 (48.3%) |
Female Fertility in Arkadelphia
Fertility by Age in Arkadelphia
Average fertility rate in Arkadelphia is 21.0 births per 1,000 women. Women in the age bracket of 20 to 34 years have the highest fertility rate with 30.0 births per 1,000 women. Women in the age bracket of 20 to 34 years acount for 77.8% of all women with births.
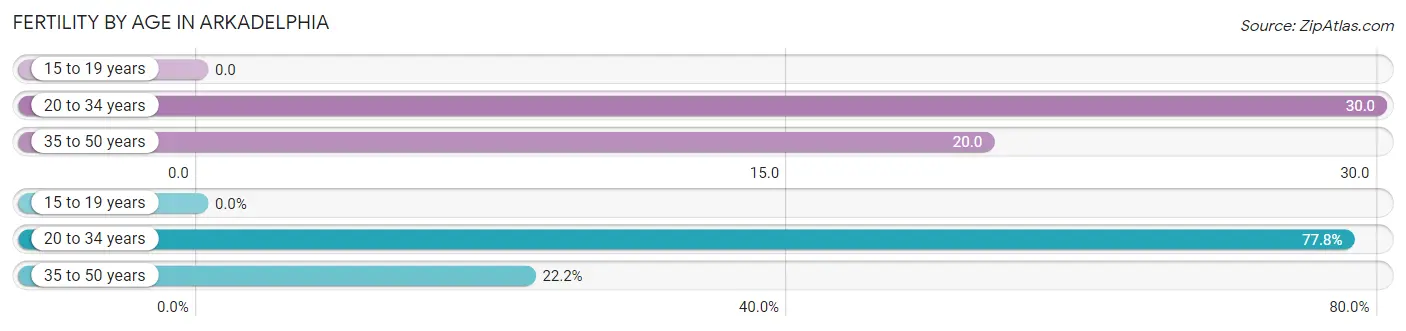
| Age Bracket | Women with Births | Births / 1,000 Women |
| 15 to 19 years | 0 (0.0%) | 0.0 |
| 20 to 34 years | 56 (77.8%) | 30.0 |
| 35 to 50 years | 16 (22.2%) | 20.0 |
| Total | 72 (100.0%) | 21.0 |
Fertility by Age by Marriage Status in Arkadelphia
29.2% of women with births (72) in Arkadelphia are married. The highest percentage of unmarried women with births falls into 35 to 50 years age bracket with 100.0% of them unmarried at the time of birth, while the lowest percentage of unmarried women with births belong to 20 to 34 years age bracket with 62.5% of them unmarried.
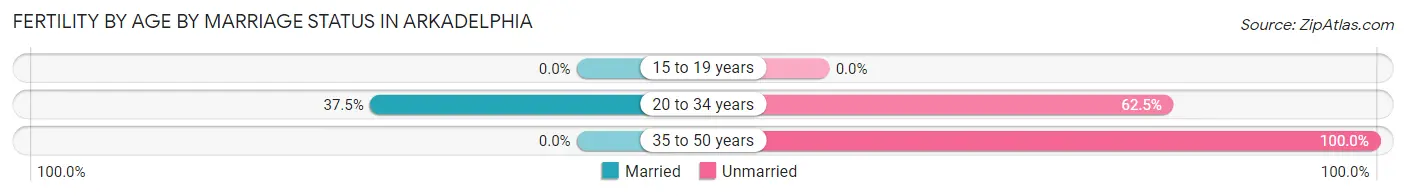
| Age Bracket | Married | Unmarried |
| 15 to 19 years | 0 (0.0%) | 0 (0.0%) |
| 20 to 34 years | 21 (37.5%) | 35 (62.5%) |
| 35 to 50 years | 0 (0.0%) | 16 (100.0%) |
| Total | 21 (29.2%) | 51 (70.8%) |
Fertility by Education in Arkadelphia
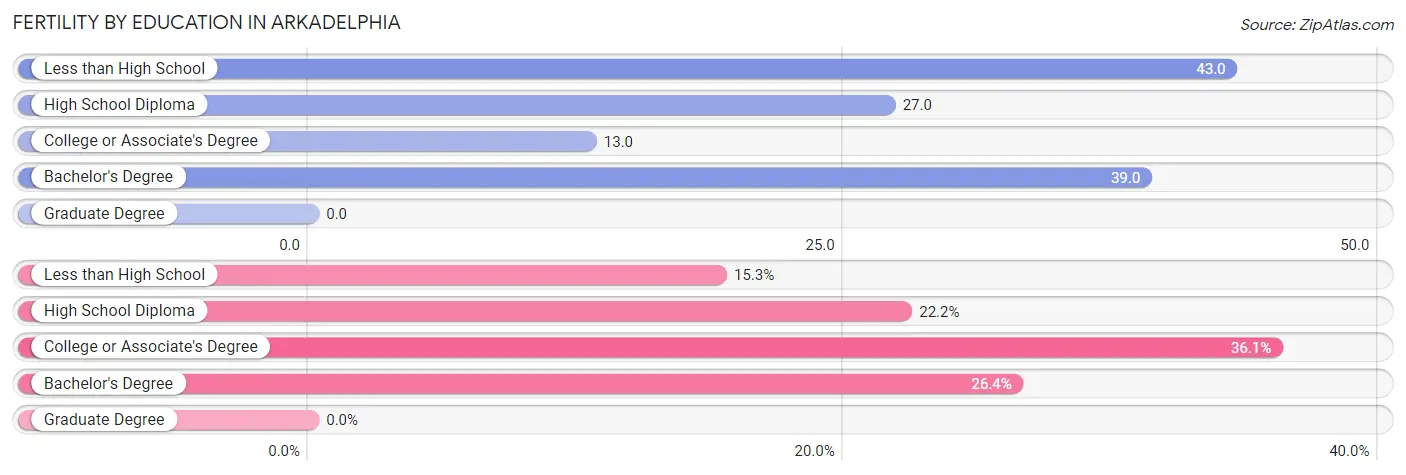
| Educational Attainment | Women with Births | Births / 1,000 Women |
| Less than High School | 11 (15.3%) | 43.0 |
| High School Diploma | 16 (22.2%) | 27.0 |
| College or Associate's Degree | 26 (36.1%) | 13.0 |
| Bachelor's Degree | 19 (26.4%) | 39.0 |
| Graduate Degree | 0 (0.0%) | 0.0 |
| Total | 72 (100.0%) | 21.0 |
Fertility by Education by Marriage Status in Arkadelphia
70.8% of women with births in Arkadelphia are unmarried. Women with the educational attainment of less than high school are most likely to be married with 100.0% of them married at childbirth, while women with the educational attainment of high school diploma are least likely to be married with 100.0% of them unmarried at childbirth.
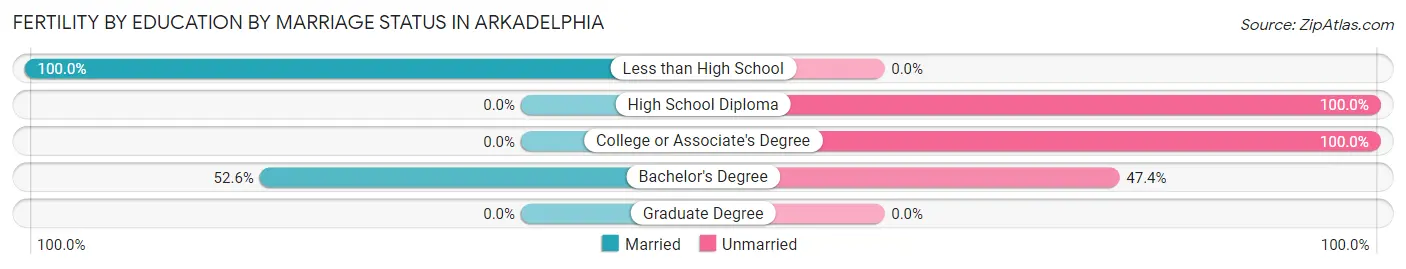
| Educational Attainment | Married | Unmarried |
| Less than High School | 11 (100.0%) | 0 (0.0%) |
| High School Diploma | 0 (0.0%) | 16 (100.0%) |
| College or Associate's Degree | 0 (0.0%) | 26 (100.0%) |
| Bachelor's Degree | 10 (52.6%) | 9 (47.4%) |
| Graduate Degree | 0 (0.0%) | 0 (0.0%) |
| Total | 21 (29.2%) | 51 (70.8%) |
Employment Characteristics in Arkadelphia
Employment by Class of Employer in Arkadelphia
Among the 4,611 employed individuals in Arkadelphia, private company employees (3,414 | 74.0%), state government employees (503 | 10.9%), and not-for-profit organizations (321 | 7.0%) make up the most common classes of employment.
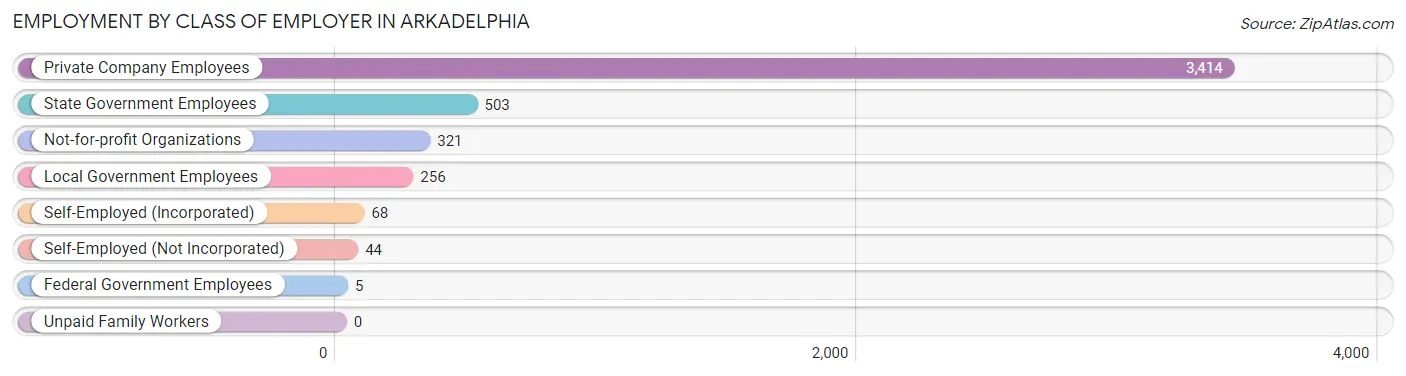
| Employer Class | # Employees | % Employees |
| Private Company Employees | 3,414 | 74.0% |
| Self-Employed (Incorporated) | 68 | 1.5% |
| Self-Employed (Not Incorporated) | 44 | 0.9% |
| Not-for-profit Organizations | 321 | 7.0% |
| Local Government Employees | 256 | 5.6% |
| State Government Employees | 503 | 10.9% |
| Federal Government Employees | 5 | 0.1% |
| Unpaid Family Workers | 0 | 0.0% |
| Total | 4,611 | 100.0% |
Employment Status by Age in Arkadelphia
According to the labor force statistics for Arkadelphia, out of the total population over 16 years of age (8,735), 55.2% or 4,822 individuals are in the labor force, with 3.6% or 174 of them unemployed. The age group with the highest labor force participation rate is 30 to 34 years, with 87.5% or 414 individuals in the labor force. Within the labor force, the 35 to 44 years age range has the highest percentage of unemployed individuals, with 9.5% or 59 of them being unemployed.
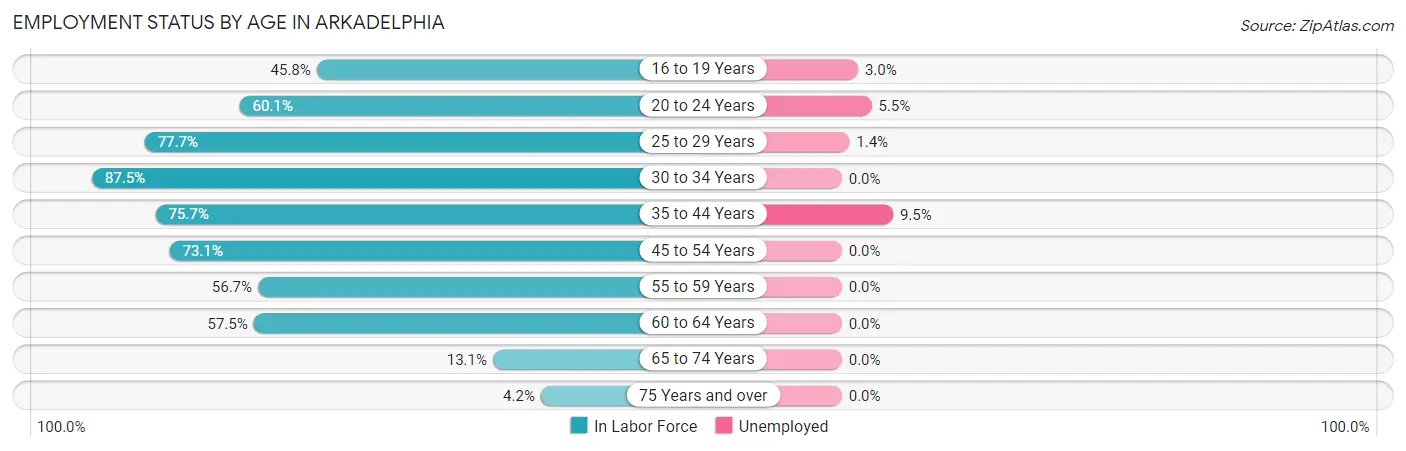
| Age Bracket | In Labor Force | Unemployed |
| 16 to 19 Years | 626 (45.8%) | 19 (3.0%) |
| 20 to 24 Years | 1,567 (60.1%) | 86 (5.5%) |
| 25 to 29 Years | 576 (77.7%) | 8 (1.4%) |
| 30 to 34 Years | 414 (87.5%) | 0 (0.0%) |
| 35 to 44 Years | 618 (75.7%) | 59 (9.5%) |
| 45 to 54 Years | 474 (73.1%) | 0 (0.0%) |
| 55 to 59 Years | 211 (56.7%) | 0 (0.0%) |
| 60 to 64 Years | 214 (57.5%) | 0 (0.0%) |
| 65 to 74 Years | 101 (13.1%) | 0 (0.0%) |
| 75 Years and over | 24 (4.2%) | 0 (0.0%) |
| Total | 4,822 (55.2%) | 174 (3.6%) |
Employment Status by Educational Attainment in Arkadelphia
According to labor force statistics for Arkadelphia, 73.3% of individuals (2,508) out of the total population between 25 and 64 years of age (3,422) are in the labor force, with 2.7% or 68 of them being unemployed. The group with the highest labor force participation rate are those with the educational attainment of bachelor's degree or higher, with 80.3% or 1,019 individuals in the labor force. Within the labor force, individuals with college / associate degree education have the highest percentage of unemployment, with 6.4% or 49 of them being unemployed.
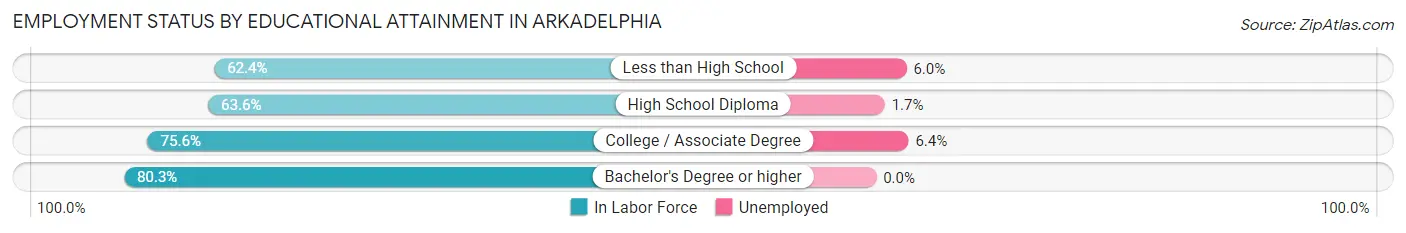
| Educational Attainment | In Labor Force | Unemployed |
| Less than High School | 133 (62.4%) | 13 (6.0%) |
| High School Diploma | 590 (63.6%) | 16 (1.7%) |
| College / Associate Degree | 765 (75.6%) | 65 (6.4%) |
| Bachelor's Degree or higher | 1,019 (80.3%) | 0 (0.0%) |
| Total | 2,508 (73.3%) | 92 (2.7%) |
Employment Occupations by Sex in Arkadelphia
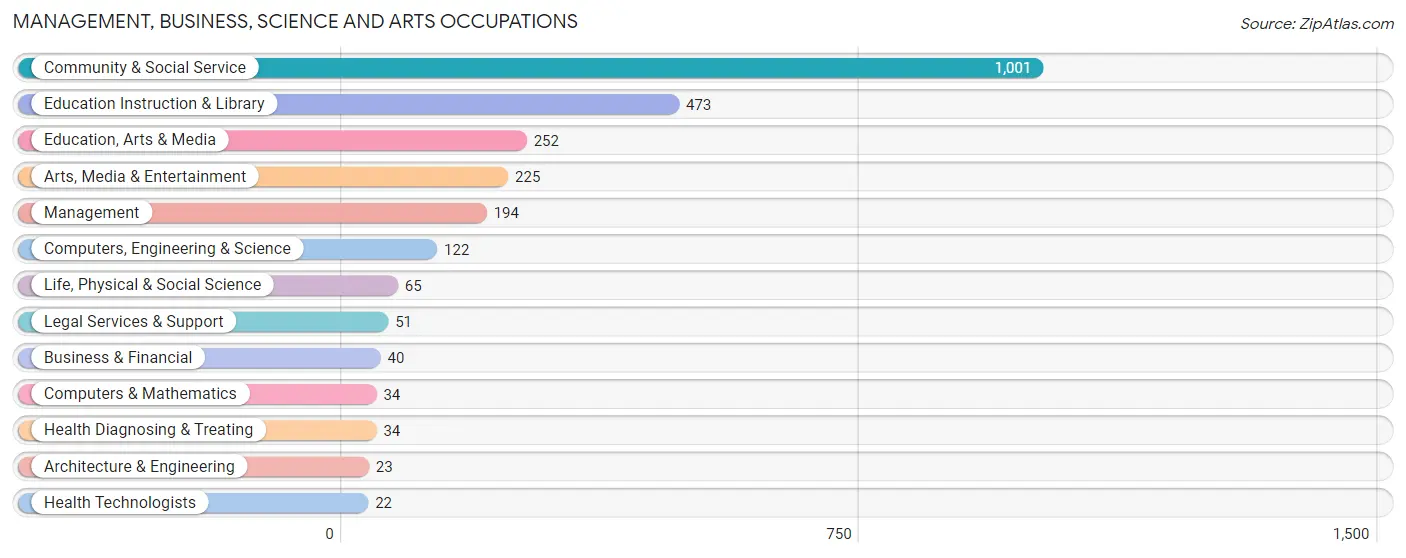
Management, Business, Science and Arts Occupations
The most common Management, Business, Science and Arts occupations in Arkadelphia are Community & Social Service (1,001 | 21.5%), Education Instruction & Library (473 | 10.2%), Education, Arts & Media (252 | 5.4%), Arts, Media & Entertainment (225 | 4.8%), and Management (194 | 4.2%).
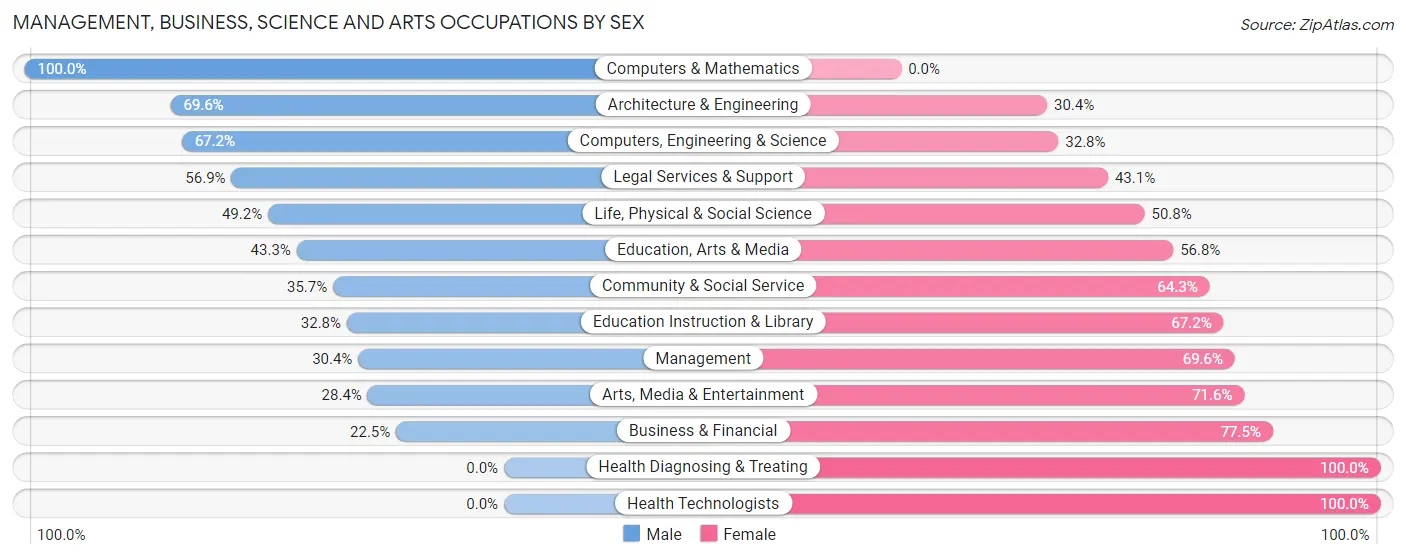
Management, Business, Science and Arts Occupations by Sex
Within the Management, Business, Science and Arts occupations in Arkadelphia, the most male-oriented occupations are Computers & Mathematics (100.0%), Architecture & Engineering (69.6%), and Computers, Engineering & Science (67.2%), while the most female-oriented occupations are Health Diagnosing & Treating (100.0%), Health Technologists (100.0%), and Business & Financial (77.5%).
| Occupation | Male | Female |
| Management | 59 (30.4%) | 135 (69.6%) |
| Business & Financial | 9 (22.5%) | 31 (77.5%) |
| Computers, Engineering & Science | 82 (67.2%) | 40 (32.8%) |
| Computers & Mathematics | 34 (100.0%) | 0 (0.0%) |
| Architecture & Engineering | 16 (69.6%) | 7 (30.4%) |
| Life, Physical & Social Science | 32 (49.2%) | 33 (50.8%) |
| Community & Social Service | 357 (35.7%) | 644 (64.3%) |
| Education, Arts & Media | 109 (43.2%) | 143 (56.8%) |
| Legal Services & Support | 29 (56.9%) | 22 (43.1%) |
| Education Instruction & Library | 155 (32.8%) | 318 (67.2%) |
| Arts, Media & Entertainment | 64 (28.4%) | 161 (71.6%) |
| Health Diagnosing & Treating | 0 (0.0%) | 34 (100.0%) |
| Health Technologists | 0 (0.0%) | 22 (100.0%) |
| Total (Category) | 507 (36.4%) | 884 (63.5%) |
| Total (Overall) | 2,220 (47.7%) | 2,433 (52.3%) |
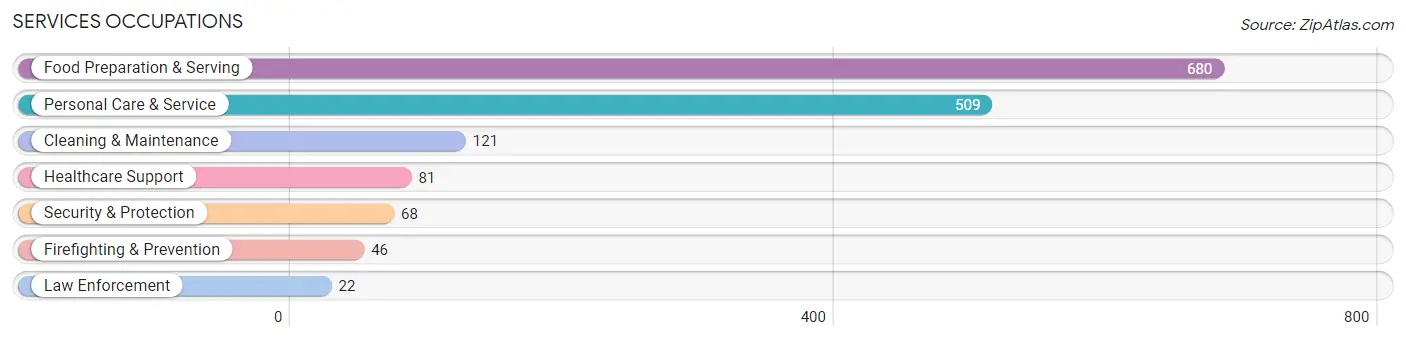
Services Occupations
The most common Services occupations in Arkadelphia are Food Preparation & Serving (680 | 14.6%), Personal Care & Service (509 | 10.9%), Cleaning & Maintenance (121 | 2.6%), Healthcare Support (81 | 1.7%), and Security & Protection (68 | 1.5%).
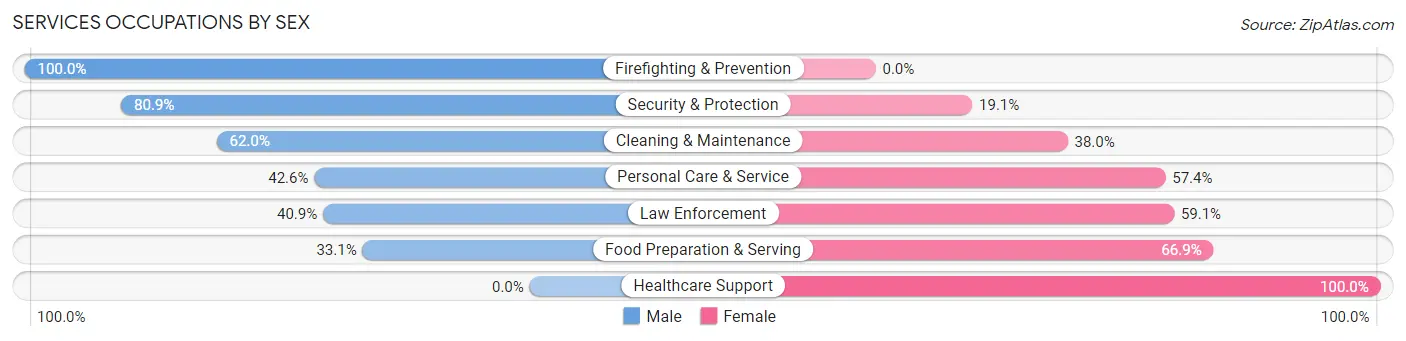
Services Occupations by Sex
Within the Services occupations in Arkadelphia, the most male-oriented occupations are Firefighting & Prevention (100.0%), Security & Protection (80.9%), and Cleaning & Maintenance (62.0%), while the most female-oriented occupations are Healthcare Support (100.0%), Food Preparation & Serving (66.9%), and Law Enforcement (59.1%).
| Occupation | Male | Female |
| Healthcare Support | 0 (0.0%) | 81 (100.0%) |
| Security & Protection | 55 (80.9%) | 13 (19.1%) |
| Firefighting & Prevention | 46 (100.0%) | 0 (0.0%) |
| Law Enforcement | 9 (40.9%) | 13 (59.1%) |
| Food Preparation & Serving | 225 (33.1%) | 455 (66.9%) |
| Cleaning & Maintenance | 75 (62.0%) | 46 (38.0%) |
| Personal Care & Service | 217 (42.6%) | 292 (57.4%) |
| Total (Category) | 572 (39.2%) | 887 (60.8%) |
| Total (Overall) | 2,220 (47.7%) | 2,433 (52.3%) |
Sales and Office Occupations
The most common Sales and Office occupations in Arkadelphia are Sales & Related (521 | 11.2%), and Office & Administration (375 | 8.1%).

Sales and Office Occupations by Sex
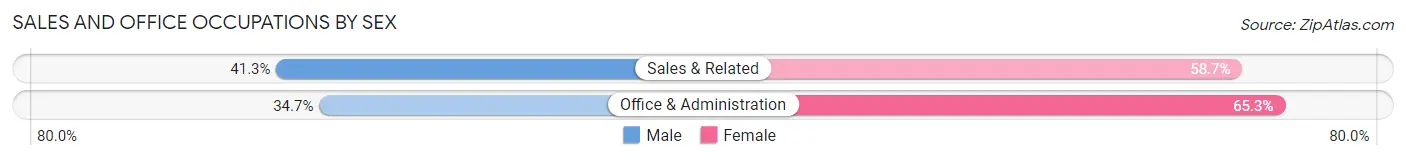
| Occupation | Male | Female |
| Sales & Related | 215 (41.3%) | 306 (58.7%) |
| Office & Administration | 130 (34.7%) | 245 (65.3%) |
| Total (Category) | 345 (38.5%) | 551 (61.5%) |
| Total (Overall) | 2,220 (47.7%) | 2,433 (52.3%) |
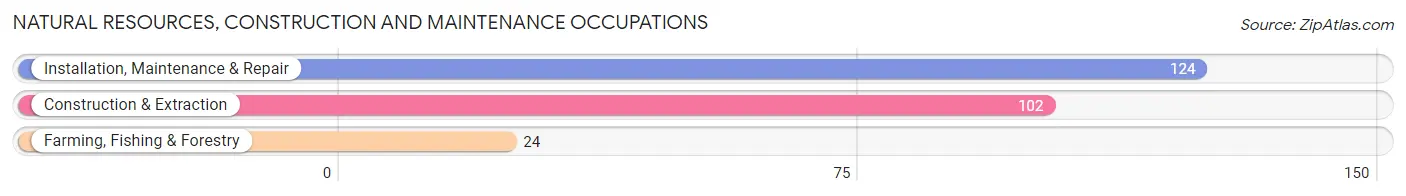
Natural Resources, Construction and Maintenance Occupations
The most common Natural Resources, Construction and Maintenance occupations in Arkadelphia are Installation, Maintenance & Repair (124 | 2.7%), Construction & Extraction (102 | 2.2%), and Farming, Fishing & Forestry (24 | 0.5%).
Natural Resources, Construction and Maintenance Occupations by Sex
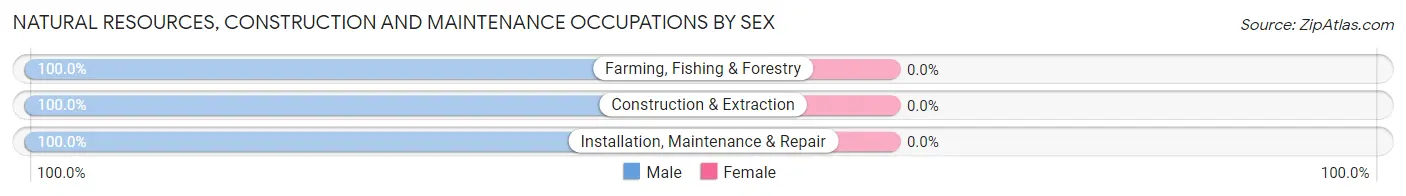
| Occupation | Male | Female |
| Farming, Fishing & Forestry | 24 (100.0%) | 0 (0.0%) |
| Construction & Extraction | 102 (100.0%) | 0 (0.0%) |
| Installation, Maintenance & Repair | 124 (100.0%) | 0 (0.0%) |
| Total (Category) | 250 (100.0%) | 0 (0.0%) |
| Total (Overall) | 2,220 (47.7%) | 2,433 (52.3%) |
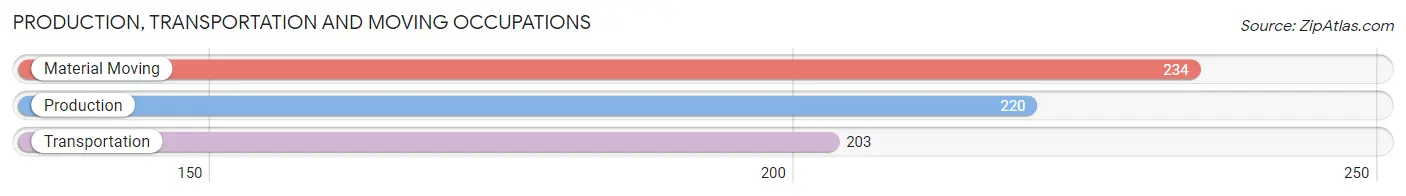
Production, Transportation and Moving Occupations
The most common Production, Transportation and Moving occupations in Arkadelphia are Material Moving (234 | 5.0%), Production (220 | 4.7%), and Transportation (203 | 4.4%).
Production, Transportation and Moving Occupations by Sex
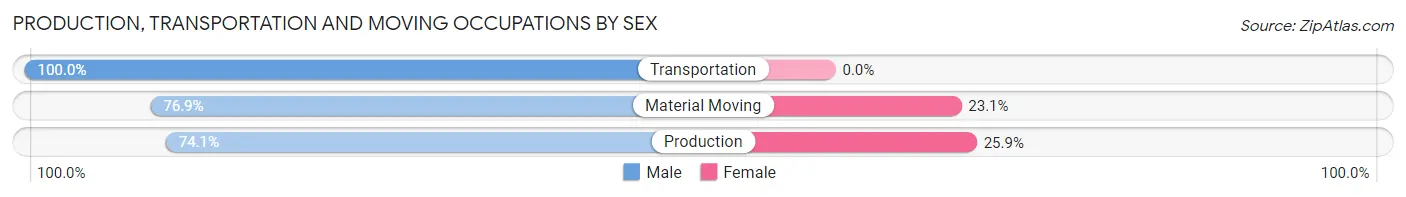
| Occupation | Male | Female |
| Production | 163 (74.1%) | 57 (25.9%) |
| Transportation | 203 (100.0%) | 0 (0.0%) |
| Material Moving | 180 (76.9%) | 54 (23.1%) |
| Total (Category) | 546 (83.1%) | 111 (16.9%) |
| Total (Overall) | 2,220 (47.7%) | 2,433 (52.3%) |
Employment Industries by Sex in Arkadelphia
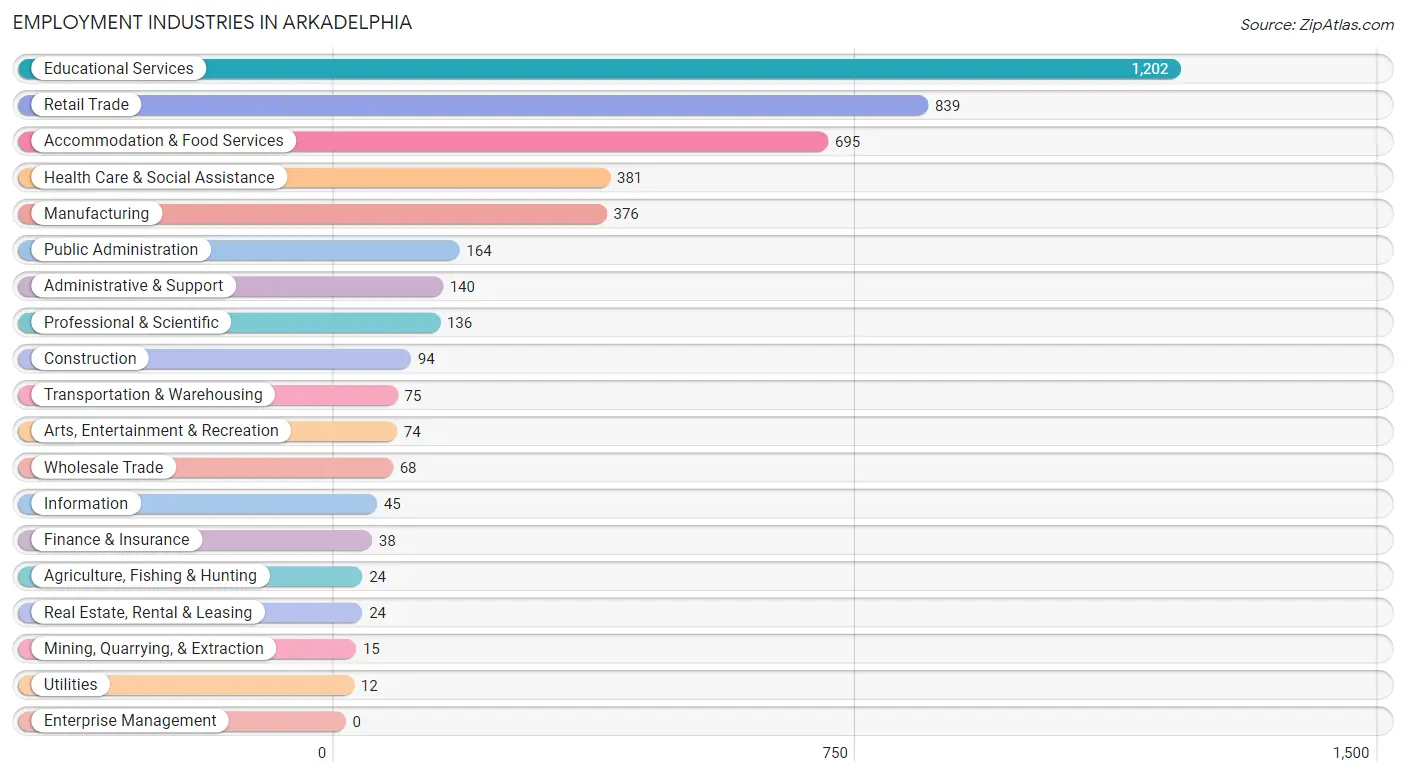
Employment Industries in Arkadelphia
The major employment industries in Arkadelphia include Educational Services (1,202 | 25.8%), Retail Trade (839 | 18.0%), Accommodation & Food Services (695 | 14.9%), Health Care & Social Assistance (381 | 8.2%), and Manufacturing (376 | 8.1%).
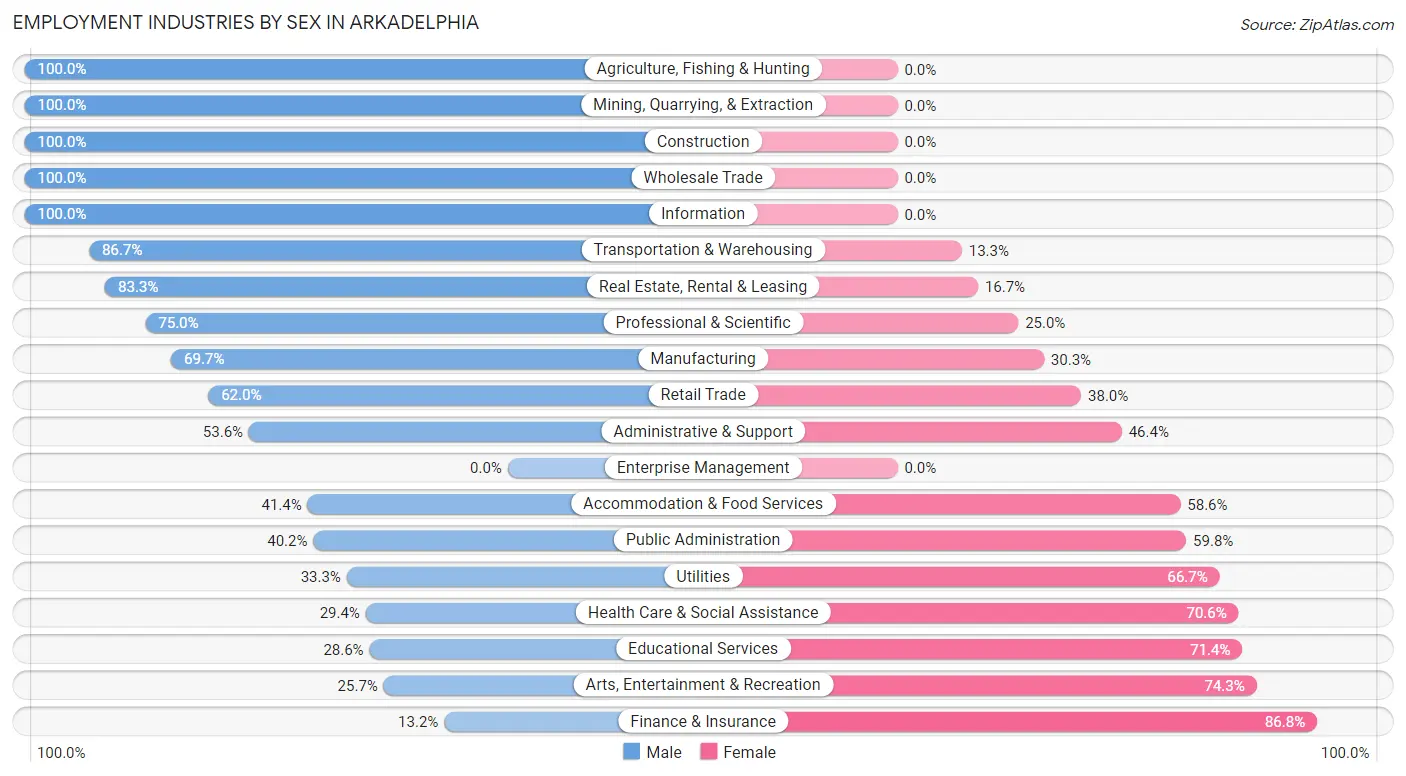
Employment Industries by Sex in Arkadelphia
The Arkadelphia industries that see more men than women are Agriculture, Fishing & Hunting (100.0%), Mining, Quarrying, & Extraction (100.0%), and Construction (100.0%), whereas the industries that tend to have a higher number of women are Finance & Insurance (86.8%), Arts, Entertainment & Recreation (74.3%), and Educational Services (71.4%).
| Industry | Male | Female |
| Agriculture, Fishing & Hunting | 24 (100.0%) | 0 (0.0%) |
| Mining, Quarrying, & Extraction | 15 (100.0%) | 0 (0.0%) |
| Construction | 94 (100.0%) | 0 (0.0%) |
| Manufacturing | 262 (69.7%) | 114 (30.3%) |
| Wholesale Trade | 68 (100.0%) | 0 (0.0%) |
| Retail Trade | 520 (62.0%) | 319 (38.0%) |
| Transportation & Warehousing | 65 (86.7%) | 10 (13.3%) |
| Utilities | 4 (33.3%) | 8 (66.7%) |
| Information | 45 (100.0%) | 0 (0.0%) |
| Finance & Insurance | 5 (13.2%) | 33 (86.8%) |
| Real Estate, Rental & Leasing | 20 (83.3%) | 4 (16.7%) |
| Professional & Scientific | 102 (75.0%) | 34 (25.0%) |
| Enterprise Management | 0 (0.0%) | 0 (0.0%) |
| Administrative & Support | 75 (53.6%) | 65 (46.4%) |
| Educational Services | 344 (28.6%) | 858 (71.4%) |
| Health Care & Social Assistance | 112 (29.4%) | 269 (70.6%) |
| Arts, Entertainment & Recreation | 19 (25.7%) | 55 (74.3%) |
| Accommodation & Food Services | 288 (41.4%) | 407 (58.6%) |
| Public Administration | 66 (40.2%) | 98 (59.8%) |
| Total | 2,220 (47.7%) | 2,433 (52.3%) |
Education in Arkadelphia
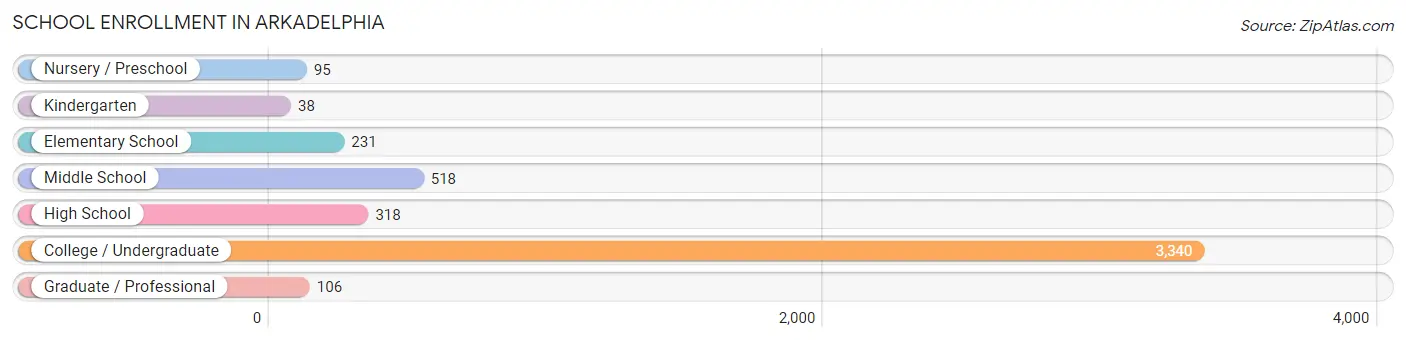
School Enrollment in Arkadelphia
The most common levels of schooling among the 4,646 students in Arkadelphia are college / undergraduate (3,340 | 71.9%), middle school (518 | 11.2%), and high school (318 | 6.8%).
| School Level | # Students | % Students |
| Nursery / Preschool | 95 | 2.0% |
| Kindergarten | 38 | 0.8% |
| Elementary School | 231 | 5.0% |
| Middle School | 518 | 11.2% |
| High School | 318 | 6.8% |
| College / Undergraduate | 3,340 | 71.9% |
| Graduate / Professional | 106 | 2.3% |
| Total | 4,646 | 100.0% |
School Enrollment by Age by Funding Source in Arkadelphia
Out of a total of 4,646 students who are enrolled in schools in Arkadelphia, 846 (18.2%) attend a private institution, while the remaining 3,800 (81.8%) are enrolled in public schools. The age group of 18 to 19 year olds has the highest likelihood of being enrolled in private schools, with 308 (27.6% in the age bracket) enrolled. Conversely, the age group of 10 to 14 year olds has the lowest likelihood of being enrolled in a private school, with 588 (100.0% in the age bracket) attending a public institution.
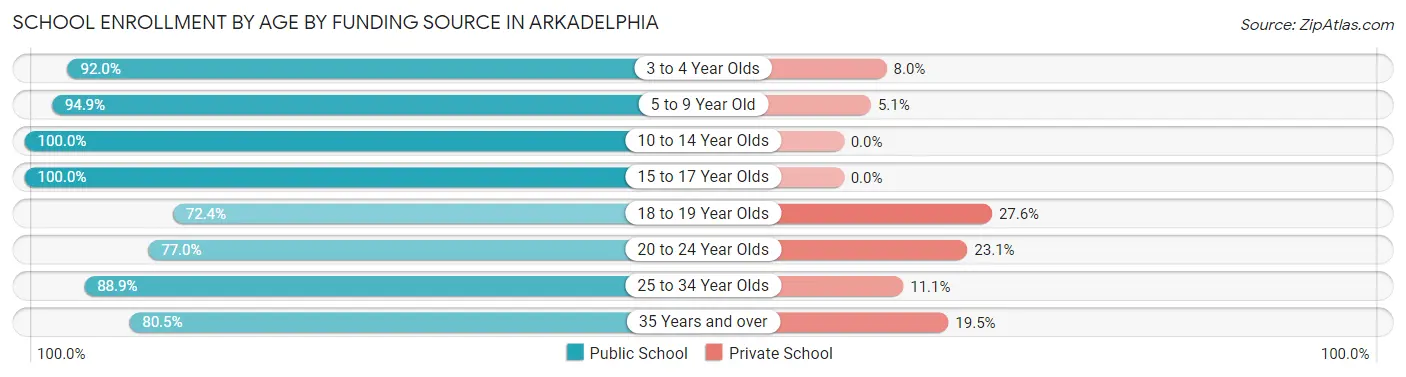
| Age Bracket | Public School | Private School |
| 3 to 4 Year Olds | 69 (92.0%) | 6 (8.0%) |
| 5 to 9 Year Old | 224 (94.9%) | 12 (5.1%) |
| 10 to 14 Year Olds | 588 (100.0%) | 0 (0.0%) |
| 15 to 17 Year Olds | 265 (100.0%) | 0 (0.0%) |
| 18 to 19 Year Olds | 807 (72.4%) | 308 (27.6%) |
| 20 to 24 Year Olds | 1,599 (76.9%) | 479 (23.1%) |
| 25 to 34 Year Olds | 184 (88.9%) | 23 (11.1%) |
| 35 Years and over | 66 (80.5%) | 16 (19.5%) |
| Total | 3,800 (81.8%) | 846 (18.2%) |
Educational Attainment by Field of Study in Arkadelphia
Education (411 | 23.6%), business (306 | 17.5%), social sciences (192 | 11.0%), liberal arts & history (163 | 9.3%), and arts & humanities (157 | 9.0%) are the most common fields of study among 1,744 individuals in Arkadelphia who have obtained a bachelor's degree or higher.
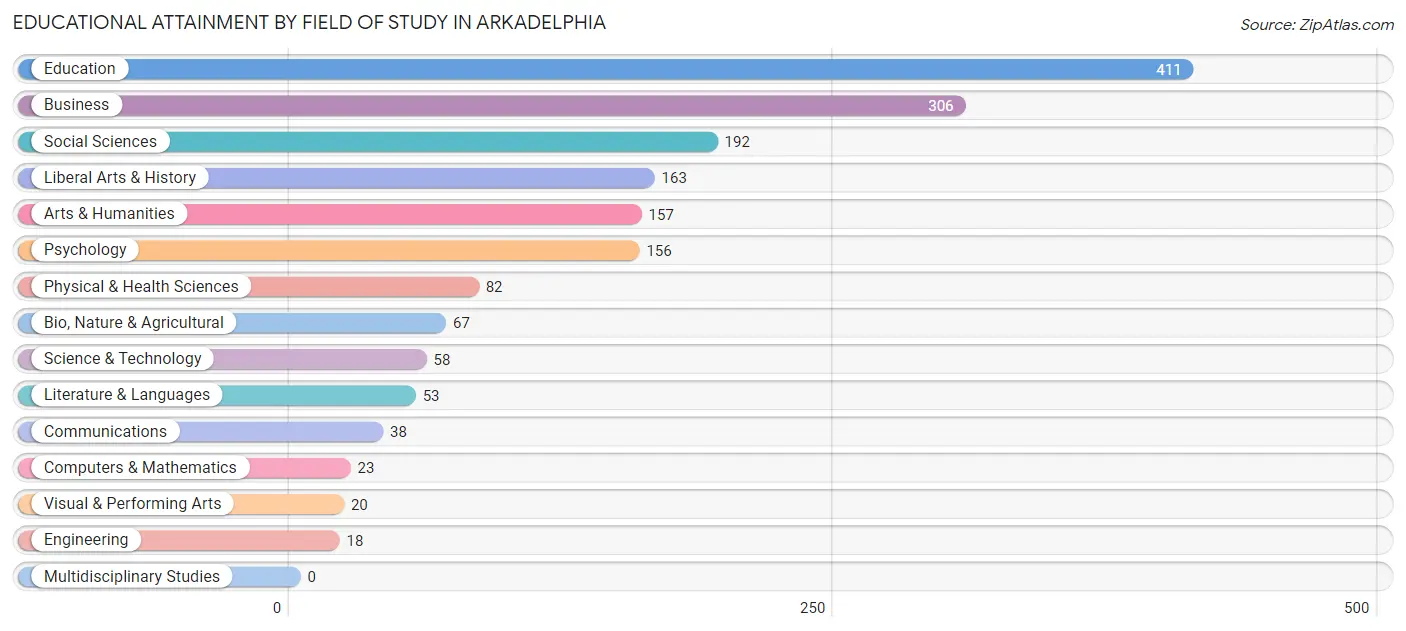
| Field of Study | # Graduates | % Graduates |
| Computers & Mathematics | 23 | 1.3% |
| Bio, Nature & Agricultural | 67 | 3.8% |
| Physical & Health Sciences | 82 | 4.7% |
| Psychology | 156 | 8.9% |
| Social Sciences | 192 | 11.0% |
| Engineering | 18 | 1.0% |
| Multidisciplinary Studies | 0 | 0.0% |
| Science & Technology | 58 | 3.3% |
| Business | 306 | 17.5% |
| Education | 411 | 23.6% |
| Literature & Languages | 53 | 3.0% |
| Liberal Arts & History | 163 | 9.3% |
| Visual & Performing Arts | 20 | 1.1% |
| Communications | 38 | 2.2% |
| Arts & Humanities | 157 | 9.0% |
| Total | 1,744 | 100.0% |
Transportation & Commute in Arkadelphia
Vehicle Availability by Sex in Arkadelphia
The most prevalent vehicle ownership categories in Arkadelphia are males with 2 vehicles (685, accounting for 37.1%) and females with 2 vehicles (827, making up 42.3%).
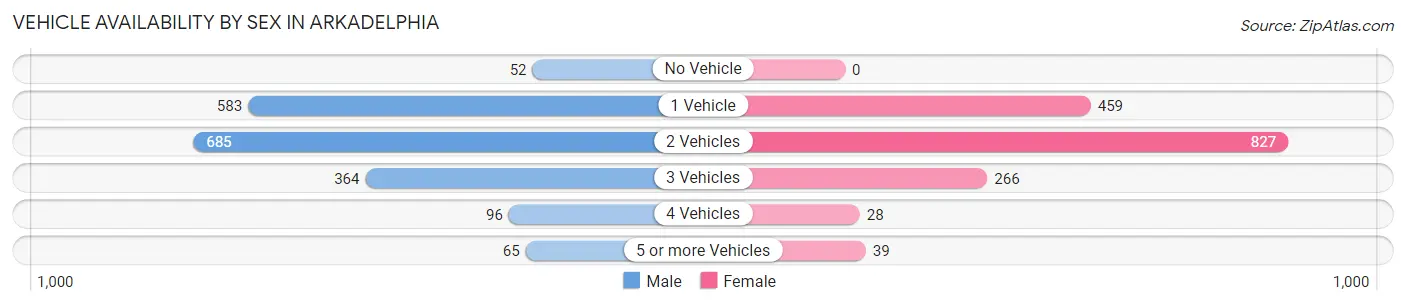
| Vehicles Available | Male | Female |
| No Vehicle | 52 (2.8%) | 0 (0.0%) |
| 1 Vehicle | 583 (31.6%) | 459 (28.3%) |
| 2 Vehicles | 685 (37.1%) | 827 (51.1%) |
| 3 Vehicles | 364 (19.7%) | 266 (16.4%) |
| 4 Vehicles | 96 (5.2%) | 28 (1.7%) |
| 5 or more Vehicles | 65 (3.5%) | 39 (2.4%) |
| Total | 1,845 (100.0%) | 1,619 (100.0%) |
Commute Time in Arkadelphia
The most frequently occuring commute durations in Arkadelphia are 5 to 9 minutes (1,632 commuters, 37.6%), 10 to 14 minutes (1,061 commuters, 24.4%), and less than 5 minutes (446 commuters, 10.3%).
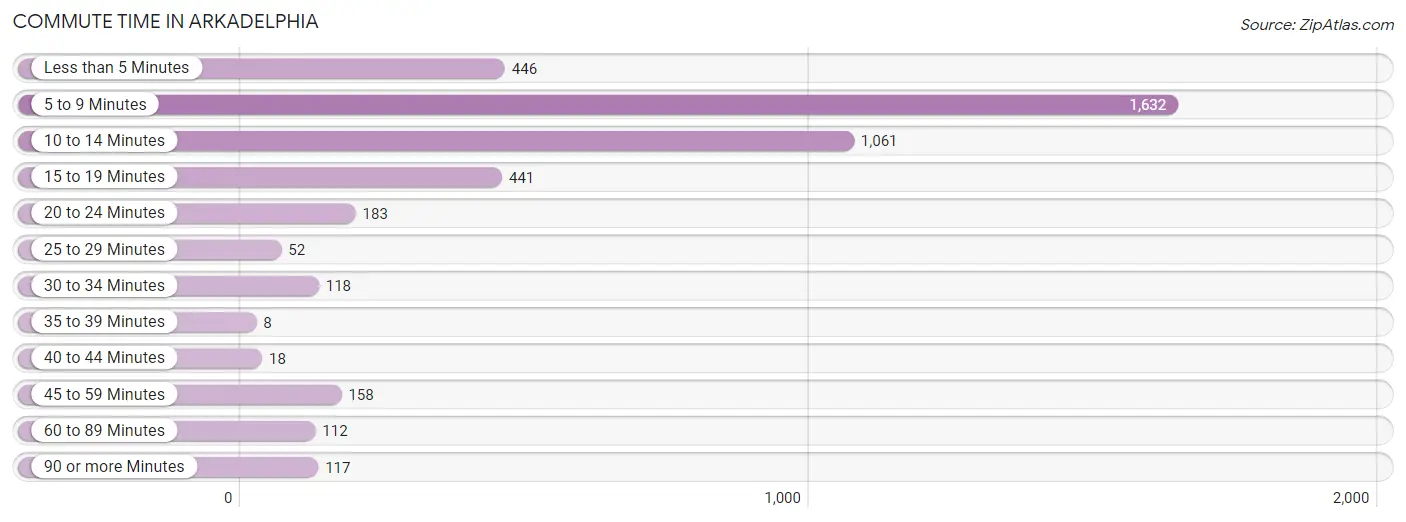
| Commute Time | # Commuters | % Commuters |
| Less than 5 Minutes | 446 | 10.3% |
| 5 to 9 Minutes | 1,632 | 37.6% |
| 10 to 14 Minutes | 1,061 | 24.4% |
| 15 to 19 Minutes | 441 | 10.2% |
| 20 to 24 Minutes | 183 | 4.2% |
| 25 to 29 Minutes | 52 | 1.2% |
| 30 to 34 Minutes | 118 | 2.7% |
| 35 to 39 Minutes | 8 | 0.2% |
| 40 to 44 Minutes | 18 | 0.4% |
| 45 to 59 Minutes | 158 | 3.6% |
| 60 to 89 Minutes | 112 | 2.6% |
| 90 or more Minutes | 117 | 2.7% |
Commute Time by Sex in Arkadelphia
The most common commute times in Arkadelphia are 5 to 9 minutes (710 commuters, 33.2%) for males and 5 to 9 minutes (922 commuters, 41.8%) for females.
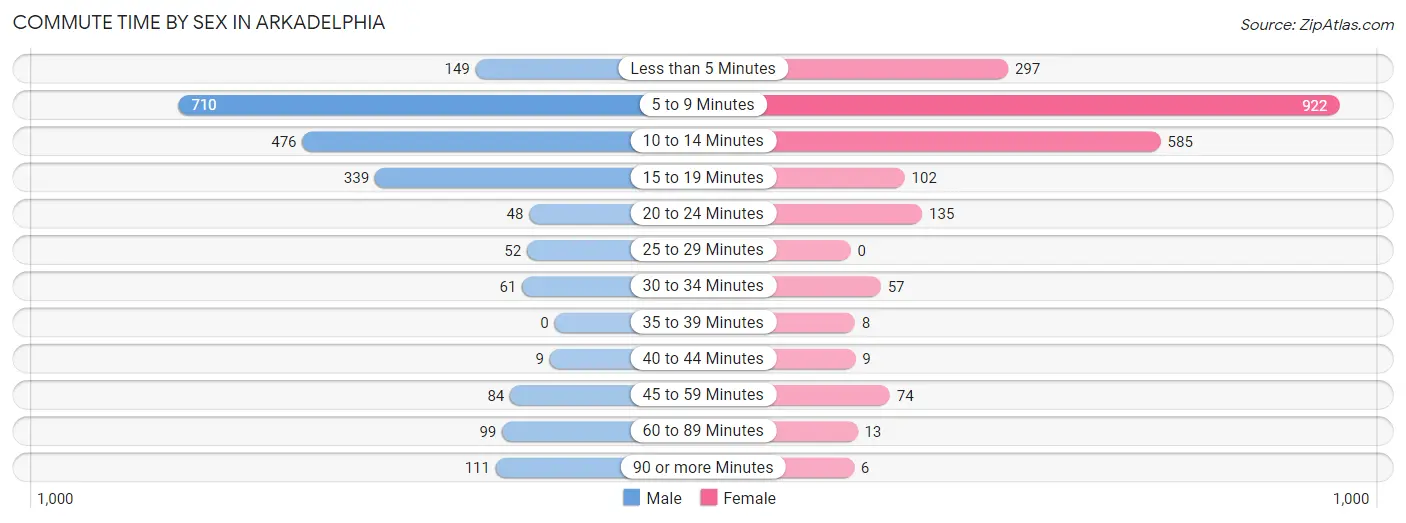
| Commute Time | Male | Female |
| Less than 5 Minutes | 149 (7.0%) | 297 (13.5%) |
| 5 to 9 Minutes | 710 (33.2%) | 922 (41.8%) |
| 10 to 14 Minutes | 476 (22.3%) | 585 (26.5%) |
| 15 to 19 Minutes | 339 (15.9%) | 102 (4.6%) |
| 20 to 24 Minutes | 48 (2.2%) | 135 (6.1%) |
| 25 to 29 Minutes | 52 (2.4%) | 0 (0.0%) |
| 30 to 34 Minutes | 61 (2.9%) | 57 (2.6%) |
| 35 to 39 Minutes | 0 (0.0%) | 8 (0.4%) |
| 40 to 44 Minutes | 9 (0.4%) | 9 (0.4%) |
| 45 to 59 Minutes | 84 (3.9%) | 74 (3.4%) |
| 60 to 89 Minutes | 99 (4.6%) | 13 (0.6%) |
| 90 or more Minutes | 111 (5.2%) | 6 (0.3%) |
Time of Departure to Work by Sex in Arkadelphia
The most frequent times of departure to work in Arkadelphia are 12:00 PM to 3:59 PM (506, 23.7%) for males and 7:30 AM to 7:59 AM (341, 15.4%) for females.
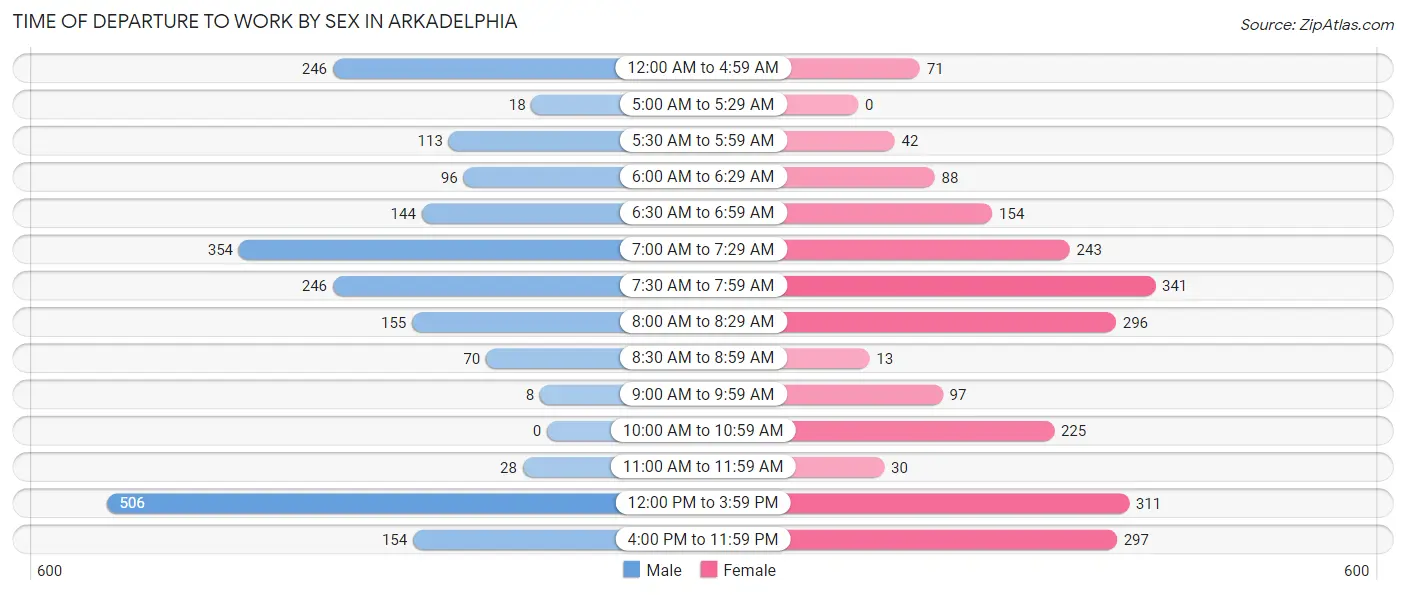
| Time of Departure | Male | Female |
| 12:00 AM to 4:59 AM | 246 (11.5%) | 71 (3.2%) |
| 5:00 AM to 5:29 AM | 18 (0.8%) | 0 (0.0%) |
| 5:30 AM to 5:59 AM | 113 (5.3%) | 42 (1.9%) |
| 6:00 AM to 6:29 AM | 96 (4.5%) | 88 (4.0%) |
| 6:30 AM to 6:59 AM | 144 (6.7%) | 154 (7.0%) |
| 7:00 AM to 7:29 AM | 354 (16.6%) | 243 (11.0%) |
| 7:30 AM to 7:59 AM | 246 (11.5%) | 341 (15.4%) |
| 8:00 AM to 8:29 AM | 155 (7.2%) | 296 (13.4%) |
| 8:30 AM to 8:59 AM | 70 (3.3%) | 13 (0.6%) |
| 9:00 AM to 9:59 AM | 8 (0.4%) | 97 (4.4%) |
| 10:00 AM to 10:59 AM | 0 (0.0%) | 225 (10.2%) |
| 11:00 AM to 11:59 AM | 28 (1.3%) | 30 (1.4%) |
| 12:00 PM to 3:59 PM | 506 (23.7%) | 311 (14.1%) |
| 4:00 PM to 11:59 PM | 154 (7.2%) | 297 (13.5%) |
| Total | 2,138 (100.0%) | 2,208 (100.0%) |
Housing Occupancy in Arkadelphia
Occupancy by Ownership in Arkadelphia
Of the total 3,562 dwellings in Arkadelphia, owner-occupied units account for 1,463 (41.1%), while renter-occupied units make up 2,099 (58.9%).
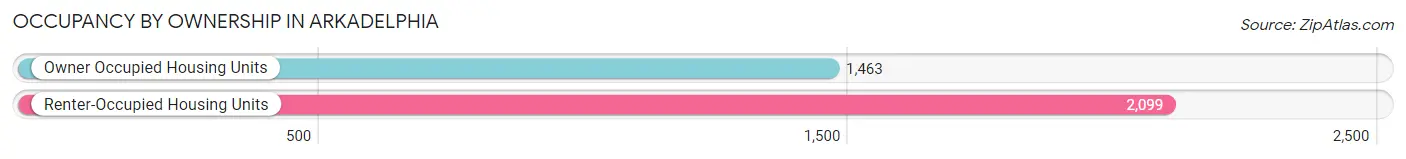
| Occupancy | # Housing Units | % Housing Units |
| Owner Occupied Housing Units | 1,463 | 41.1% |
| Renter-Occupied Housing Units | 2,099 | 58.9% |
| Total Occupied Housing Units | 3,562 | 100.0% |
Occupancy by Household Size in Arkadelphia
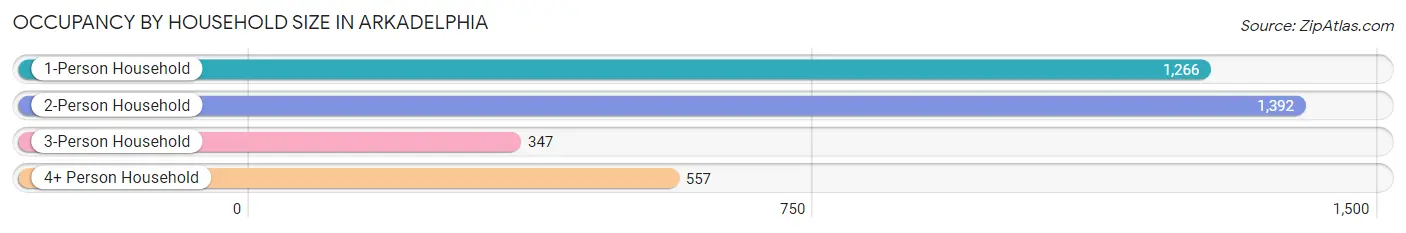
| Household Size | # Housing Units | % Housing Units |
| 1-Person Household | 1,266 | 35.5% |
| 2-Person Household | 1,392 | 39.1% |
| 3-Person Household | 347 | 9.7% |
| 4+ Person Household | 557 | 15.6% |
| Total Housing Units | 3,562 | 100.0% |
Occupancy by Ownership by Household Size in Arkadelphia
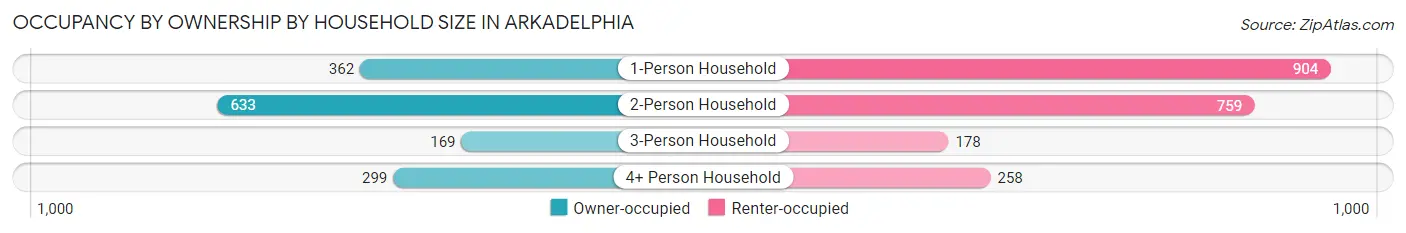
| Household Size | Owner-occupied | Renter-occupied |
| 1-Person Household | 362 (28.6%) | 904 (71.4%) |
| 2-Person Household | 633 (45.5%) | 759 (54.5%) |
| 3-Person Household | 169 (48.7%) | 178 (51.3%) |
| 4+ Person Household | 299 (53.7%) | 258 (46.3%) |
| Total Housing Units | 1,463 (41.1%) | 2,099 (58.9%) |
Occupancy by Educational Attainment in Arkadelphia
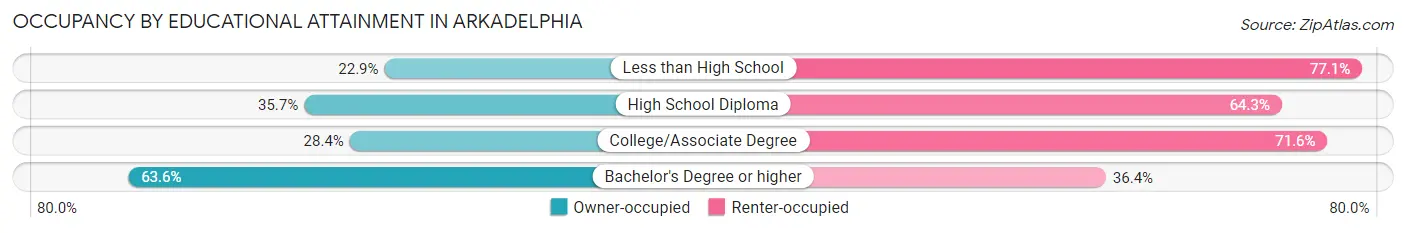
| Household Size | Owner-occupied | Renter-occupied |
| Less than High School | 50 (22.9%) | 168 (77.1%) |
| High School Diploma | 324 (35.7%) | 584 (64.3%) |
| College/Associate Degree | 372 (28.4%) | 936 (71.6%) |
| Bachelor's Degree or higher | 717 (63.6%) | 411 (36.4%) |
Occupancy by Age of Householder in Arkadelphia
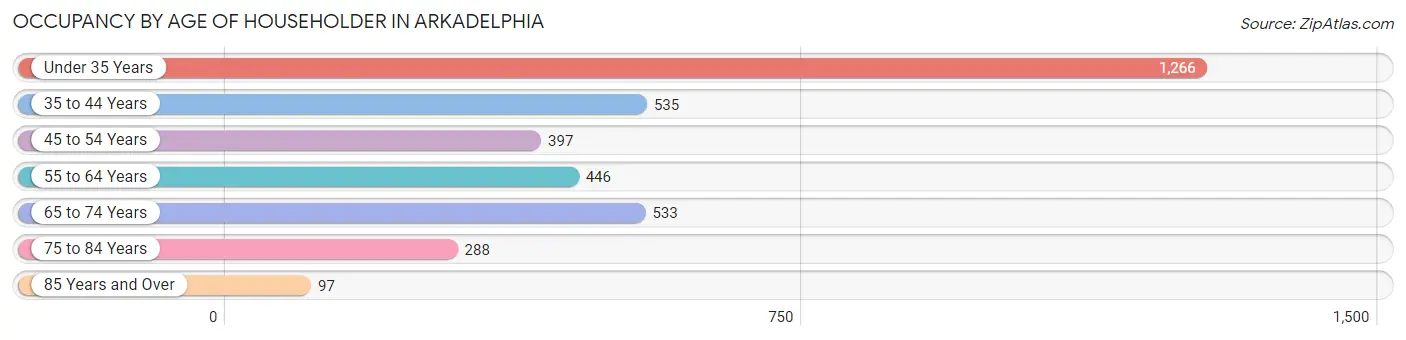
| Age Bracket | # Households | % Households |
| Under 35 Years | 1,266 | 35.5% |
| 35 to 44 Years | 535 | 15.0% |
| 45 to 54 Years | 397 | 11.2% |
| 55 to 64 Years | 446 | 12.5% |
| 65 to 74 Years | 533 | 15.0% |
| 75 to 84 Years | 288 | 8.1% |
| 85 Years and Over | 97 | 2.7% |
| Total | 3,562 | 100.0% |
Housing Finances in Arkadelphia
Median Income by Occupancy in Arkadelphia
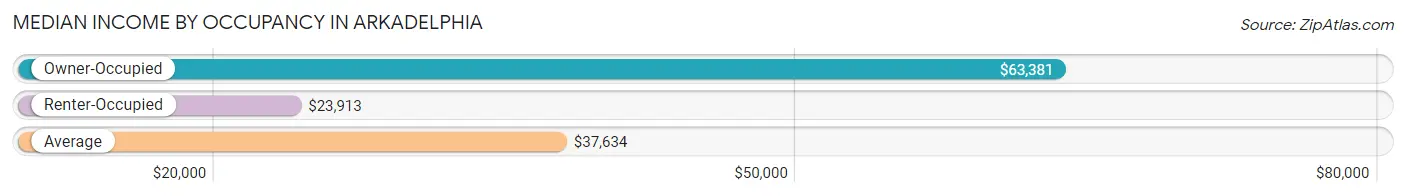
| Occupancy Type | # Households | Median Income |
| Owner-Occupied | 1,463 (41.1%) | $63,381 |
| Renter-Occupied | 2,099 (58.9%) | $23,913 |
| Average | 3,562 (100.0%) | $37,634 |
Occupancy by Householder Income Bracket in Arkadelphia
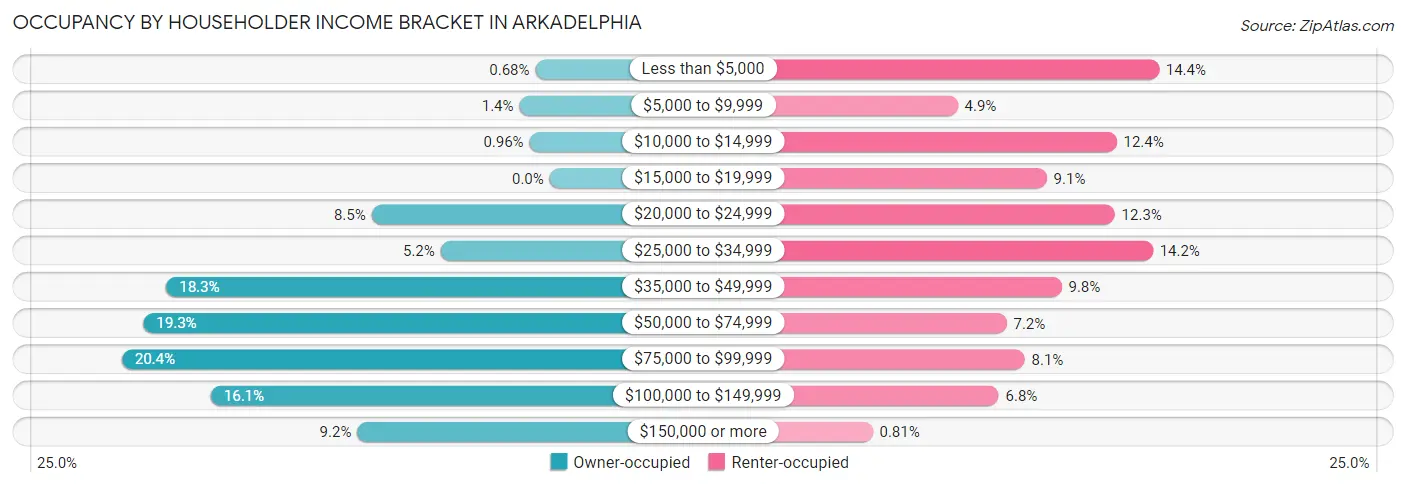
| Income Bracket | Owner-occupied | Renter-occupied |
| Less than $5,000 | 10 (0.7%) | 303 (14.4%) |
| $5,000 to $9,999 | 21 (1.4%) | 102 (4.9%) |
| $10,000 to $14,999 | 14 (1.0%) | 261 (12.4%) |
| $15,000 to $19,999 | 0 (0.0%) | 191 (9.1%) |
| $20,000 to $24,999 | 124 (8.5%) | 259 (12.3%) |
| $25,000 to $34,999 | 76 (5.2%) | 297 (14.1%) |
| $35,000 to $49,999 | 267 (18.2%) | 206 (9.8%) |
| $50,000 to $74,999 | 283 (19.3%) | 151 (7.2%) |
| $75,000 to $99,999 | 298 (20.4%) | 169 (8.1%) |
| $100,000 to $149,999 | 236 (16.1%) | 143 (6.8%) |
| $150,000 or more | 134 (9.2%) | 17 (0.8%) |
| Total | 1,463 (100.0%) | 2,099 (100.0%) |
Monthly Housing Cost Tiers in Arkadelphia
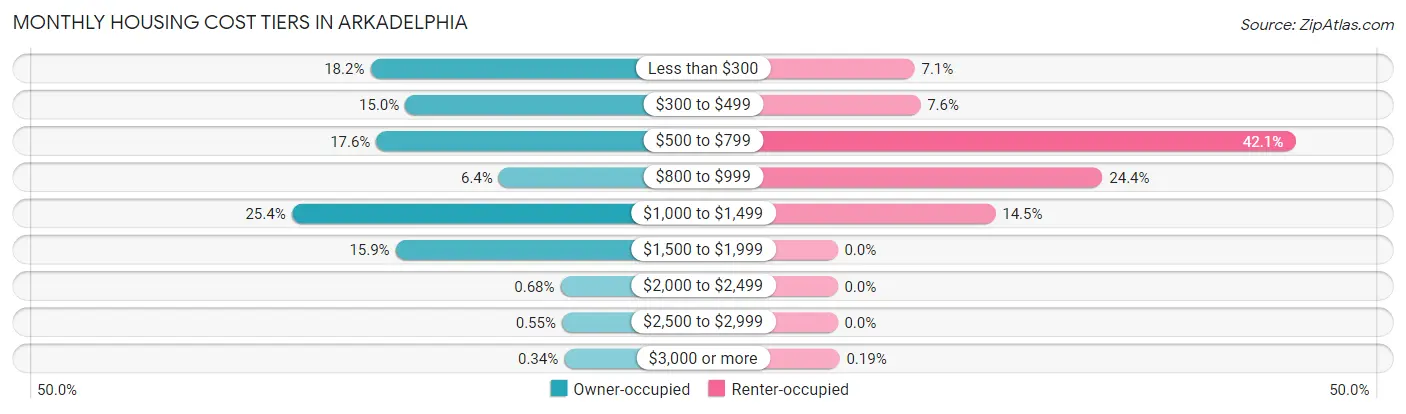
| Monthly Cost | Owner-occupied | Renter-occupied |
| Less than $300 | 266 (18.2%) | 149 (7.1%) |
| $300 to $499 | 219 (15.0%) | 160 (7.6%) |
| $500 to $799 | 258 (17.6%) | 884 (42.1%) |
| $800 to $999 | 93 (6.4%) | 512 (24.4%) |
| $1,000 to $1,499 | 372 (25.4%) | 305 (14.5%) |
| $1,500 to $1,999 | 232 (15.9%) | 0 (0.0%) |
| $2,000 to $2,499 | 10 (0.7%) | 0 (0.0%) |
| $2,500 to $2,999 | 8 (0.5%) | 0 (0.0%) |
| $3,000 or more | 5 (0.3%) | 4 (0.2%) |
| Total | 1,463 (100.0%) | 2,099 (100.0%) |
Physical Housing Characteristics in Arkadelphia
Housing Structures in Arkadelphia
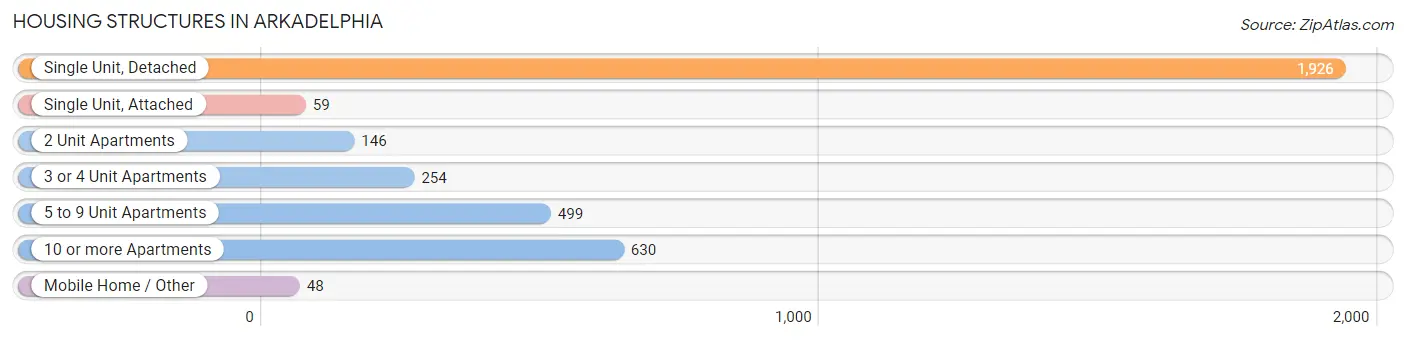
| Structure Type | # Housing Units | % Housing Units |
| Single Unit, Detached | 1,926 | 54.1% |
| Single Unit, Attached | 59 | 1.7% |
| 2 Unit Apartments | 146 | 4.1% |
| 3 or 4 Unit Apartments | 254 | 7.1% |
| 5 to 9 Unit Apartments | 499 | 14.0% |
| 10 or more Apartments | 630 | 17.7% |
| Mobile Home / Other | 48 | 1.3% |
| Total | 3,562 | 100.0% |
Housing Structures by Occupancy in Arkadelphia
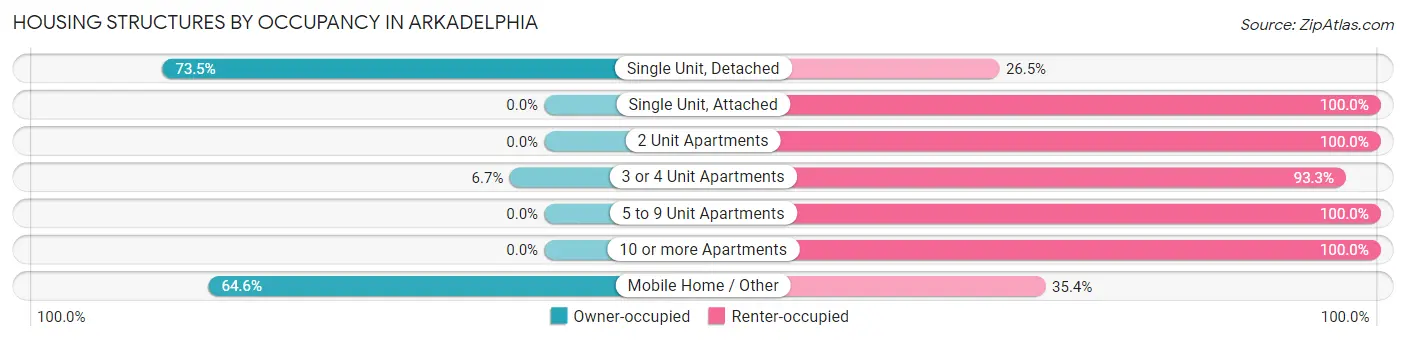
| Structure Type | Owner-occupied | Renter-occupied |
| Single Unit, Detached | 1,415 (73.5%) | 511 (26.5%) |
| Single Unit, Attached | 0 (0.0%) | 59 (100.0%) |
| 2 Unit Apartments | 0 (0.0%) | 146 (100.0%) |
| 3 or 4 Unit Apartments | 17 (6.7%) | 237 (93.3%) |
| 5 to 9 Unit Apartments | 0 (0.0%) | 499 (100.0%) |
| 10 or more Apartments | 0 (0.0%) | 630 (100.0%) |
| Mobile Home / Other | 31 (64.6%) | 17 (35.4%) |
| Total | 1,463 (41.1%) | 2,099 (58.9%) |
Housing Structures by Number of Rooms in Arkadelphia
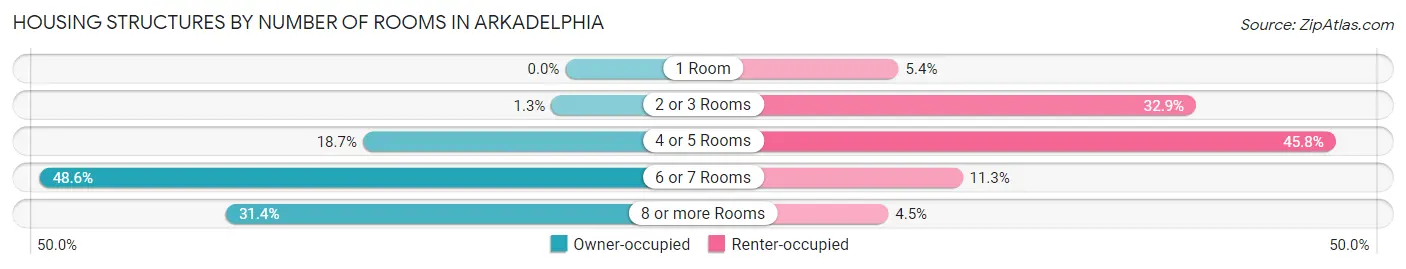
| Number of Rooms | Owner-occupied | Renter-occupied |
| 1 Room | 0 (0.0%) | 114 (5.4%) |
| 2 or 3 Rooms | 19 (1.3%) | 691 (32.9%) |
| 4 or 5 Rooms | 274 (18.7%) | 962 (45.8%) |
| 6 or 7 Rooms | 711 (48.6%) | 238 (11.3%) |
| 8 or more Rooms | 459 (31.4%) | 94 (4.5%) |
| Total | 1,463 (100.0%) | 2,099 (100.0%) |
Housing Structure by Heating Type in Arkadelphia
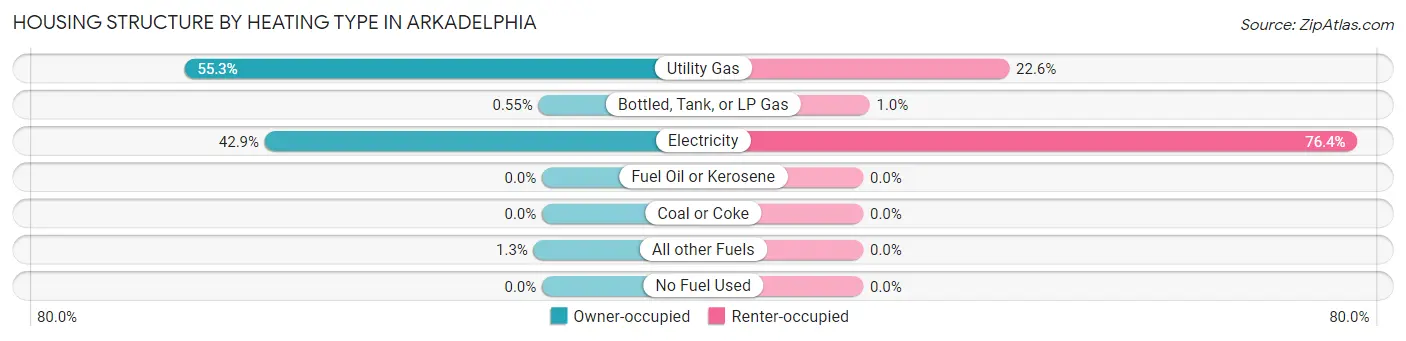
| Heating Type | Owner-occupied | Renter-occupied |
| Utility Gas | 809 (55.3%) | 474 (22.6%) |
| Bottled, Tank, or LP Gas | 8 (0.5%) | 21 (1.0%) |
| Electricity | 627 (42.9%) | 1,604 (76.4%) |
| Fuel Oil or Kerosene | 0 (0.0%) | 0 (0.0%) |
| Coal or Coke | 0 (0.0%) | 0 (0.0%) |
| All other Fuels | 19 (1.3%) | 0 (0.0%) |
| No Fuel Used | 0 (0.0%) | 0 (0.0%) |
| Total | 1,463 (100.0%) | 2,099 (100.0%) |
Household Vehicle Usage in Arkadelphia
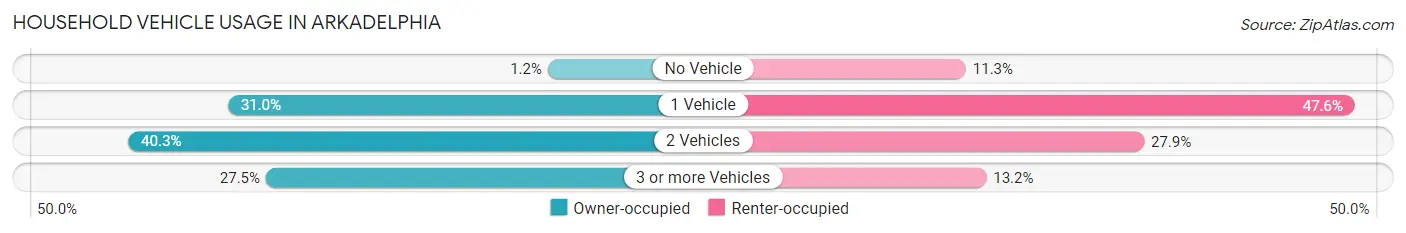
| Vehicles per Household | Owner-occupied | Renter-occupied |
| No Vehicle | 17 (1.2%) | 237 (11.3%) |
| 1 Vehicle | 454 (31.0%) | 999 (47.6%) |
| 2 Vehicles | 590 (40.3%) | 586 (27.9%) |
| 3 or more Vehicles | 402 (27.5%) | 277 (13.2%) |
| Total | 1,463 (100.0%) | 2,099 (100.0%) |
Real Estate & Mortgages in Arkadelphia
Real Estate and Mortgage Overview in Arkadelphia
| Characteristic | Without Mortgage | With Mortgage |
| Housing Units | 625 | 838 |
| Median Property Value | $148,800 | $160,300 |
| Median Household Income | $57,625 | $106 |
| Monthly Housing Costs | $347 | $5 |
| Real Estate Taxes | $942 | $26 |
Property Value by Mortgage Status in Arkadelphia
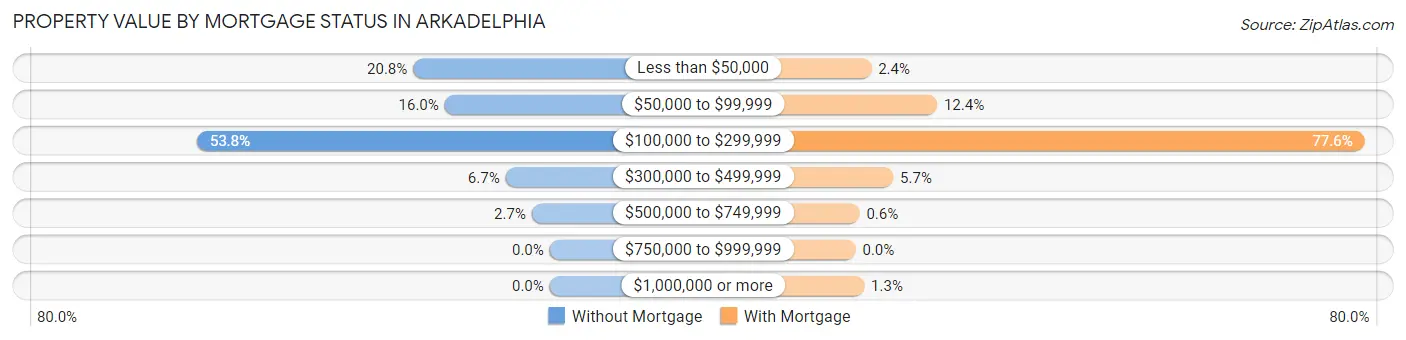
| Property Value | Without Mortgage | With Mortgage |
| Less than $50,000 | 130 (20.8%) | 20 (2.4%) |
| $50,000 to $99,999 | 100 (16.0%) | 104 (12.4%) |
| $100,000 to $299,999 | 336 (53.8%) | 650 (77.6%) |
| $300,000 to $499,999 | 42 (6.7%) | 48 (5.7%) |
| $500,000 to $749,999 | 17 (2.7%) | 5 (0.6%) |
| $750,000 to $999,999 | 0 (0.0%) | 0 (0.0%) |
| $1,000,000 or more | 0 (0.0%) | 11 (1.3%) |
| Total | 625 (100.0%) | 838 (100.0%) |
Household Income by Mortgage Status in Arkadelphia
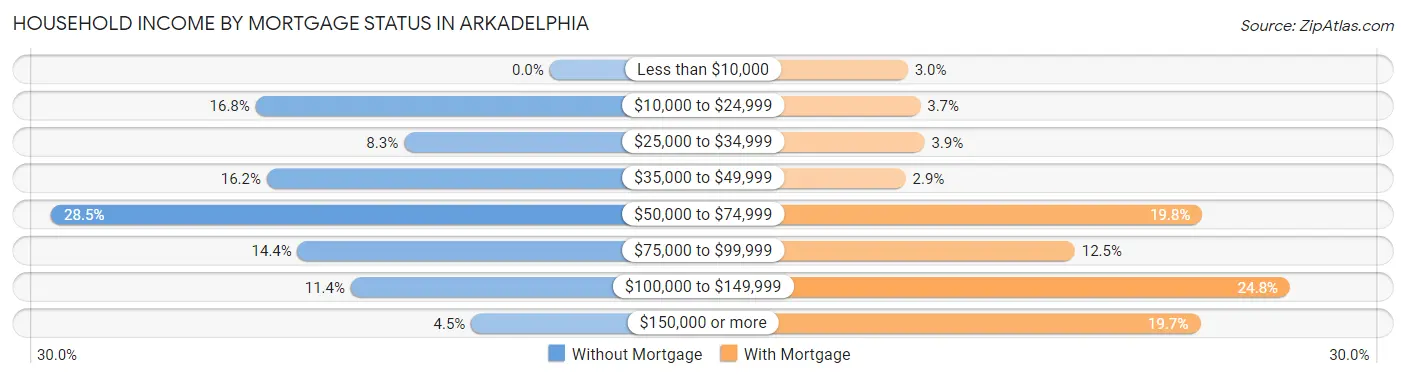
| Household Income | Without Mortgage | With Mortgage |
| Less than $10,000 | 0 (0.0%) | 25 (3.0%) |
| $10,000 to $24,999 | 105 (16.8%) | 31 (3.7%) |
| $25,000 to $34,999 | 52 (8.3%) | 33 (3.9%) |
| $35,000 to $49,999 | 101 (16.2%) | 24 (2.9%) |
| $50,000 to $74,999 | 178 (28.5%) | 166 (19.8%) |
| $75,000 to $99,999 | 90 (14.4%) | 105 (12.5%) |
| $100,000 to $149,999 | 71 (11.4%) | 208 (24.8%) |
| $150,000 or more | 28 (4.5%) | 165 (19.7%) |
| Total | 625 (100.0%) | 838 (100.0%) |
Property Value to Household Income Ratio in Arkadelphia
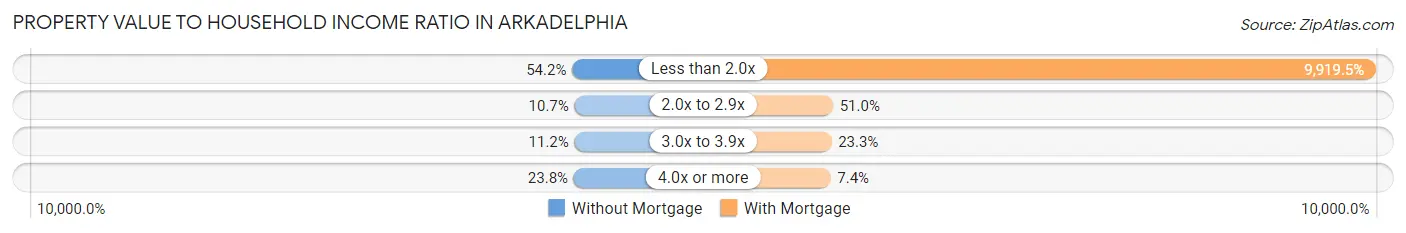
| Value-to-Income Ratio | Without Mortgage | With Mortgage |
| Less than 2.0x | 339 (54.2%) | 83,125 (9,919.5%) |
| 2.0x to 2.9x | 67 (10.7%) | 427 (50.9%) |
| 3.0x to 3.9x | 70 (11.2%) | 195 (23.3%) |
| 4.0x or more | 149 (23.8%) | 62 (7.4%) |
| Total | 625 (100.0%) | 838 (100.0%) |
Real Estate Taxes by Mortgage Status in Arkadelphia
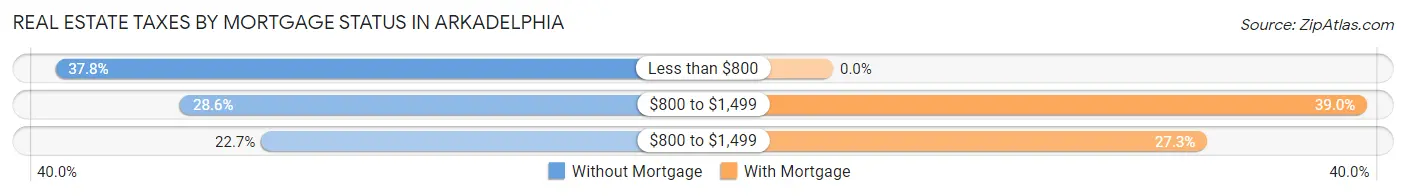
| Property Taxes | Without Mortgage | With Mortgage |
| Less than $800 | 236 (37.8%) | 0 (0.0%) |
| $800 to $1,499 | 179 (28.6%) | 327 (39.0%) |
| $800 to $1,499 | 142 (22.7%) | 229 (27.3%) |
| Total | 625 (100.0%) | 838 (100.0%) |
Health & Disability in Arkadelphia
Health Insurance Coverage by Age in Arkadelphia
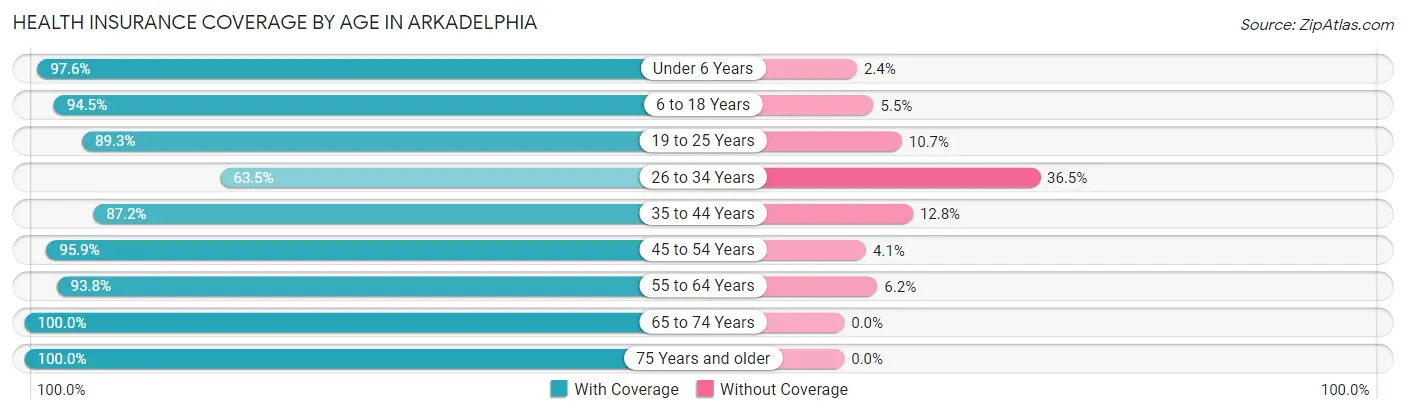
| Age Bracket | With Coverage | Without Coverage |
| Under 6 Years | 621 (97.6%) | 15 (2.4%) |
| 6 to 18 Years | 1,436 (94.5%) | 83 (5.5%) |
| 19 to 25 Years | 3,195 (89.3%) | 384 (10.7%) |
| 26 to 34 Years | 675 (63.5%) | 388 (36.5%) |
| 35 to 44 Years | 695 (87.2%) | 102 (12.8%) |
| 45 to 54 Years | 591 (95.9%) | 25 (4.1%) |
| 55 to 64 Years | 669 (93.8%) | 44 (6.2%) |
| 65 to 74 Years | 722 (100.0%) | 0 (0.0%) |
| 75 Years and older | 477 (100.0%) | 0 (0.0%) |
| Total | 9,081 (89.7%) | 1,041 (10.3%) |
Health Insurance Coverage by Citizenship Status in Arkadelphia
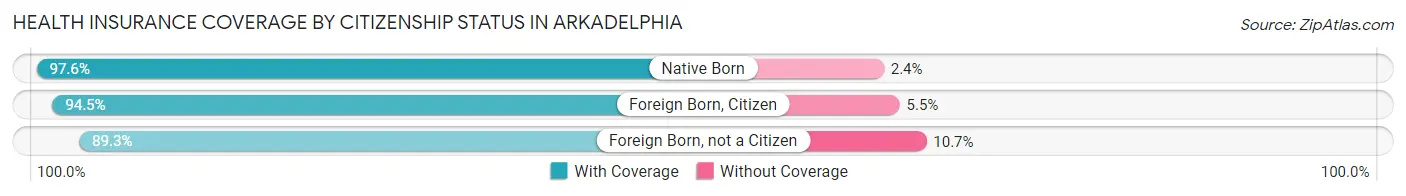
| Citizenship Status | With Coverage | Without Coverage |
| Native Born | 621 (97.6%) | 15 (2.4%) |
| Foreign Born, Citizen | 1,436 (94.5%) | 83 (5.5%) |
| Foreign Born, not a Citizen | 3,195 (89.3%) | 384 (10.7%) |
Health Insurance Coverage by Household Income in Arkadelphia
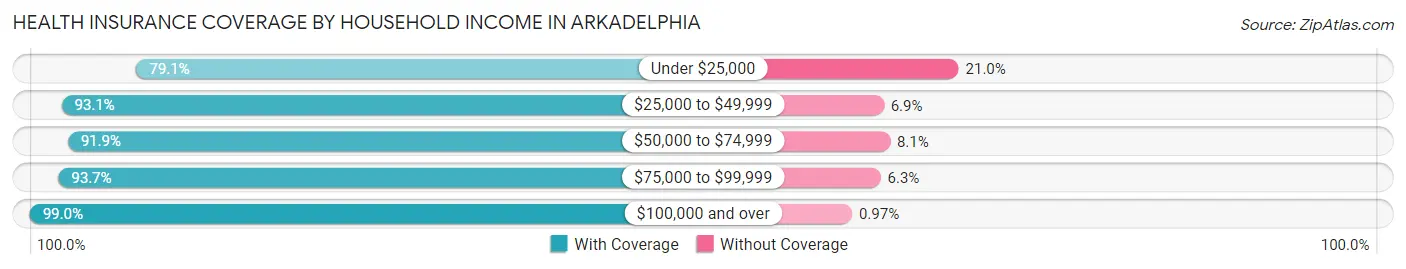
| Household Income | With Coverage | Without Coverage |
| Under $25,000 | 1,962 (79.0%) | 520 (20.9%) |
| $25,000 to $49,999 | 1,427 (93.1%) | 106 (6.9%) |
| $50,000 to $74,999 | 728 (91.9%) | 64 (8.1%) |
| $75,000 to $99,999 | 1,316 (93.7%) | 89 (6.3%) |
| $100,000 and over | 1,735 (99.0%) | 17 (1.0%) |
Public vs Private Health Insurance Coverage by Age in Arkadelphia
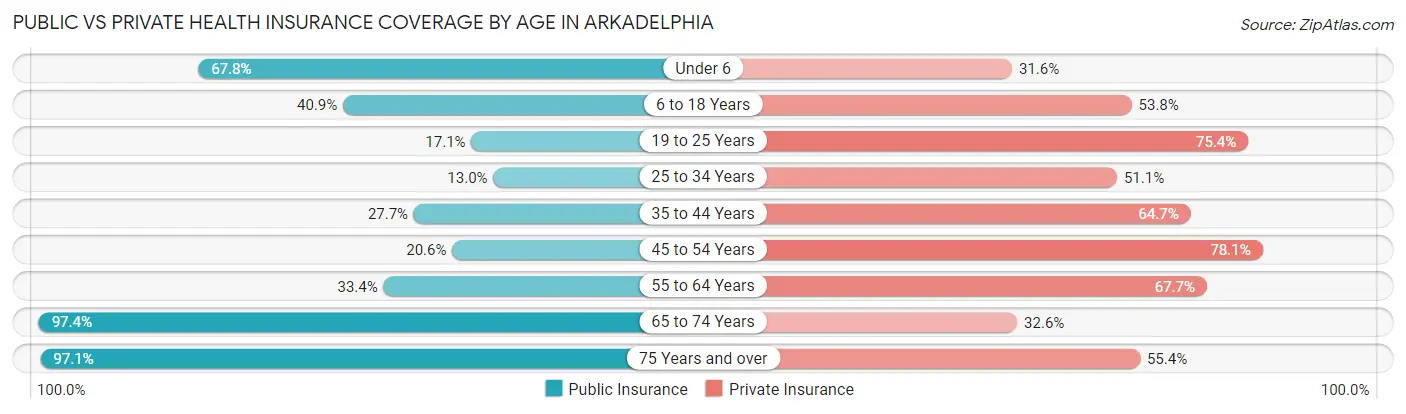
| Age Bracket | Public Insurance | Private Insurance |
| Under 6 | 431 (67.8%) | 201 (31.6%) |
| 6 to 18 Years | 621 (40.9%) | 817 (53.8%) |
| 19 to 25 Years | 611 (17.1%) | 2,699 (75.4%) |
| 25 to 34 Years | 138 (13.0%) | 543 (51.1%) |
| 35 to 44 Years | 221 (27.7%) | 516 (64.7%) |
| 45 to 54 Years | 127 (20.6%) | 481 (78.1%) |
| 55 to 64 Years | 238 (33.4%) | 483 (67.7%) |
| 65 to 74 Years | 703 (97.4%) | 235 (32.6%) |
| 75 Years and over | 463 (97.1%) | 264 (55.3%) |
| Total | 3,553 (35.1%) | 6,239 (61.6%) |
Disability Status by Sex by Age in Arkadelphia
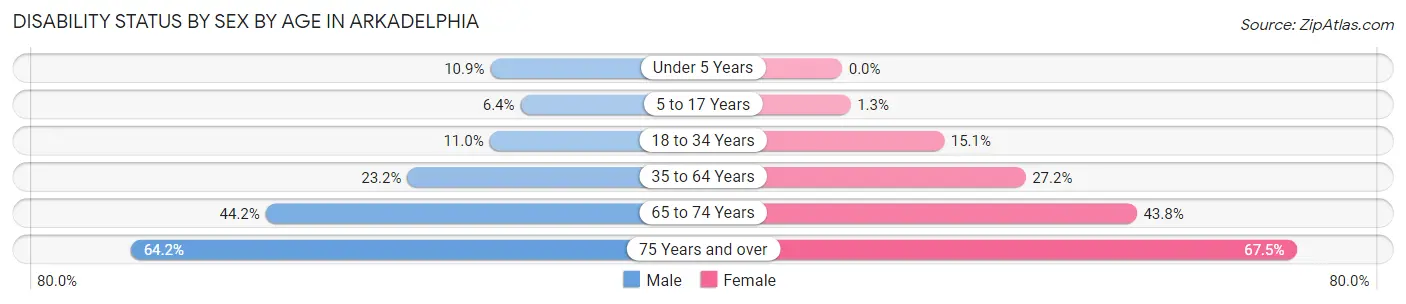
| Age Bracket | Male | Female |
| Under 5 Years | 29 (10.9%) | 0 (0.0%) |
| 5 to 17 Years | 39 (6.4%) | 7 (1.3%) |
| 18 to 34 Years | 268 (11.0%) | 387 (15.1%) |
| 35 to 64 Years | 200 (23.2%) | 344 (27.2%) |
| 65 to 74 Years | 103 (44.2%) | 214 (43.8%) |
| 75 Years and over | 97 (64.2%) | 220 (67.5%) |
Disability Class by Sex by Age in Arkadelphia
Disability Class: Hearing Difficulty
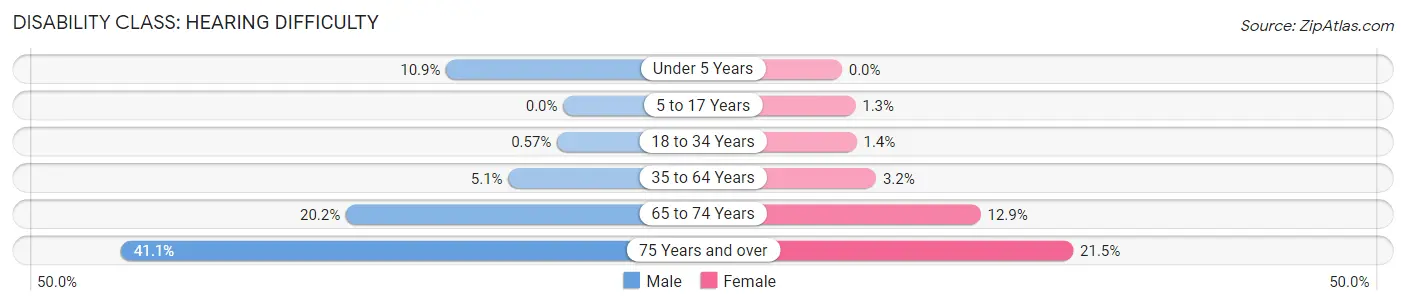
| Age Bracket | Male | Female |
| Under 5 Years | 29 (10.9%) | 0 (0.0%) |
| 5 to 17 Years | 0 (0.0%) | 7 (1.3%) |
| 18 to 34 Years | 14 (0.6%) | 35 (1.4%) |
| 35 to 64 Years | 44 (5.1%) | 40 (3.2%) |
| 65 to 74 Years | 47 (20.2%) | 63 (12.9%) |
| 75 Years and over | 62 (41.1%) | 70 (21.5%) |
Disability Class: Vision Difficulty
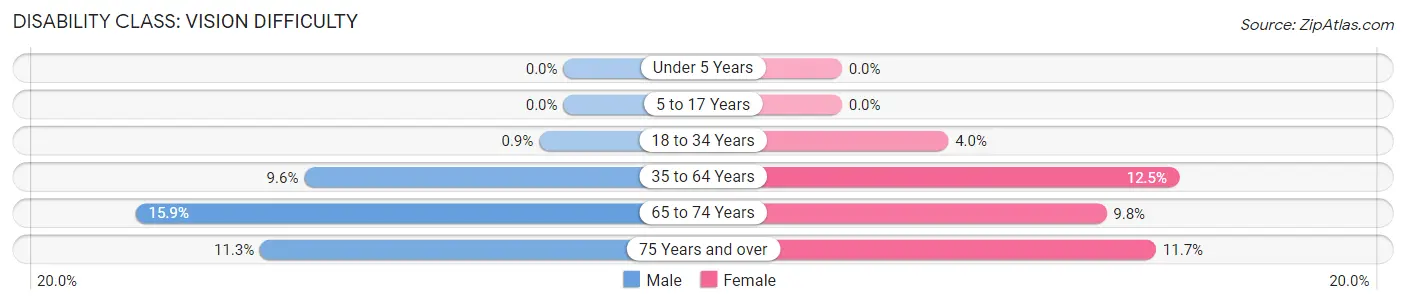
| Age Bracket | Male | Female |
| Under 5 Years | 0 (0.0%) | 0 (0.0%) |
| 5 to 17 Years | 0 (0.0%) | 0 (0.0%) |
| 18 to 34 Years | 22 (0.9%) | 101 (4.0%) |
| 35 to 64 Years | 83 (9.6%) | 158 (12.5%) |
| 65 to 74 Years | 37 (15.9%) | 48 (9.8%) |
| 75 Years and over | 17 (11.3%) | 38 (11.7%) |
Disability Class: Cognitive Difficulty
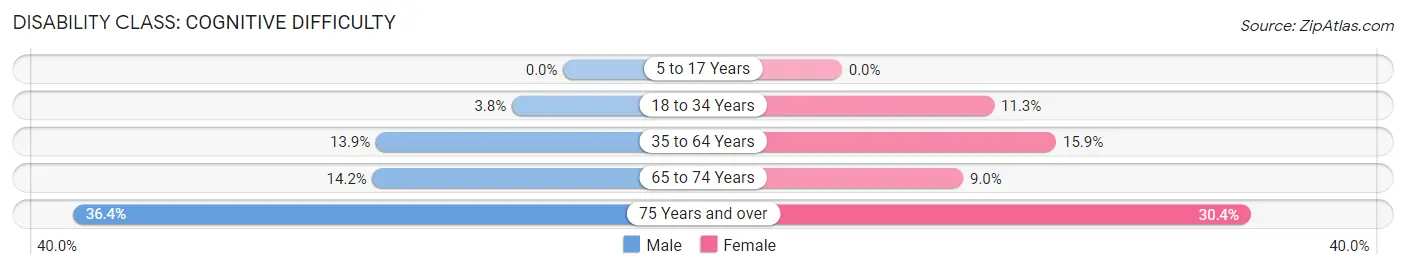
| Age Bracket | Male | Female |
| 5 to 17 Years | 0 (0.0%) | 0 (0.0%) |
| 18 to 34 Years | 93 (3.8%) | 289 (11.3%) |
| 35 to 64 Years | 120 (13.9%) | 201 (15.9%) |
| 65 to 74 Years | 33 (14.2%) | 44 (9.0%) |
| 75 Years and over | 55 (36.4%) | 99 (30.4%) |
Disability Class: Ambulatory Difficulty
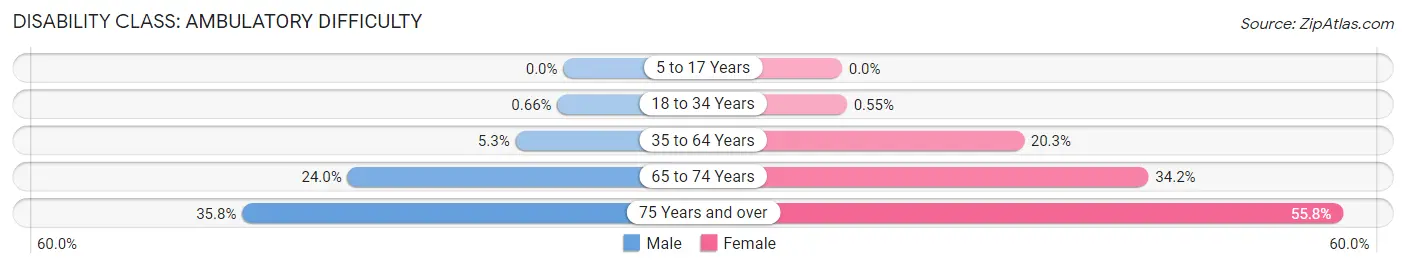
| Age Bracket | Male | Female |
| 5 to 17 Years | 0 (0.0%) | 0 (0.0%) |
| 18 to 34 Years | 16 (0.7%) | 14 (0.5%) |
| 35 to 64 Years | 46 (5.3%) | 256 (20.3%) |
| 65 to 74 Years | 56 (24.0%) | 167 (34.2%) |
| 75 Years and over | 54 (35.8%) | 182 (55.8%) |
Disability Class: Self-Care Difficulty
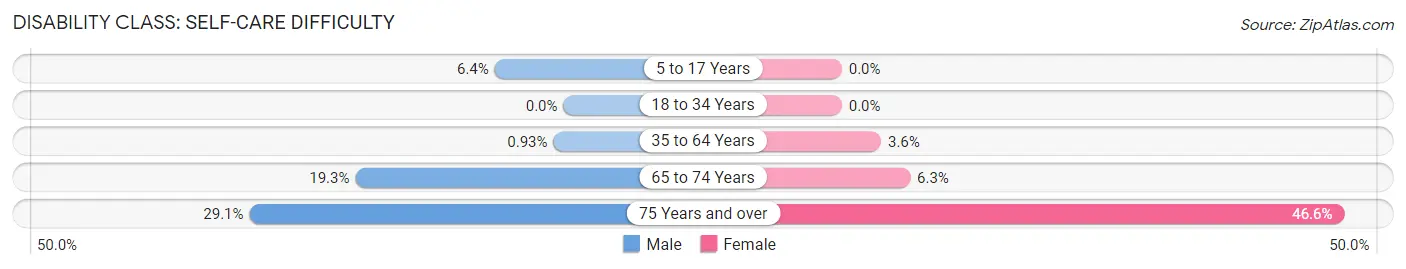
| Age Bracket | Male | Female |
| 5 to 17 Years | 39 (6.4%) | 0 (0.0%) |
| 18 to 34 Years | 0 (0.0%) | 0 (0.0%) |
| 35 to 64 Years | 8 (0.9%) | 46 (3.6%) |
| 65 to 74 Years | 45 (19.3%) | 31 (6.3%) |
| 75 Years and over | 44 (29.1%) | 152 (46.6%) |
Technology Access in Arkadelphia
Computing Device Access in Arkadelphia
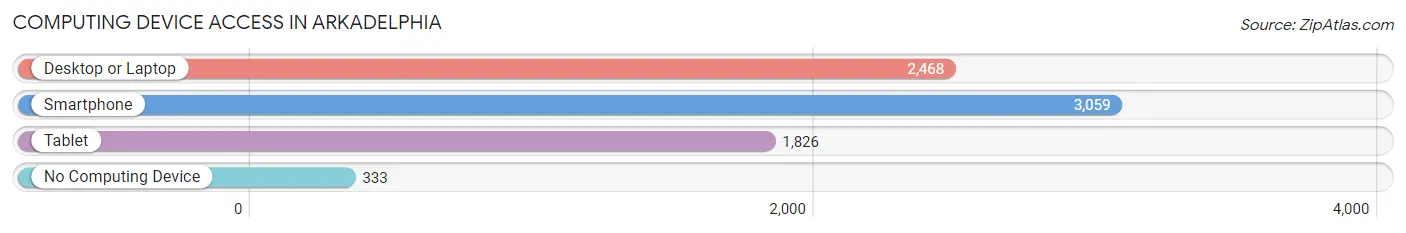
| Device Type | # Households | % Households |
| Desktop or Laptop | 2,468 | 69.3% |
| Smartphone | 3,059 | 85.9% |
| Tablet | 1,826 | 51.3% |
| No Computing Device | 333 | 9.3% |
| Total | 3,562 | 100.0% |
Internet Access in Arkadelphia
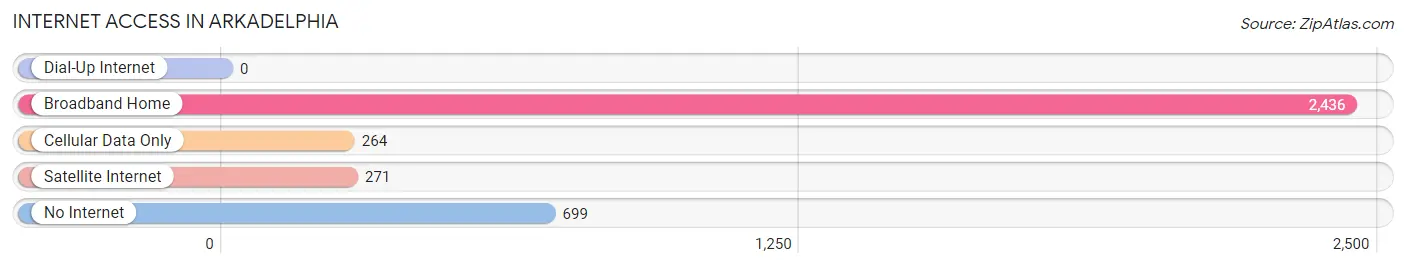
| Internet Type | # Households | % Households |
| Dial-Up Internet | 0 | 0.0% |
| Broadband Home | 2,436 | 68.4% |
| Cellular Data Only | 264 | 7.4% |
| Satellite Internet | 271 | 7.6% |
| No Internet | 699 | 19.6% |
| Total | 3,562 | 100.0% |
Arkadelphia Summary
Arkadelphia is a city located in Clark County, Arkansas, United States. It is situated in the foothills of the Ouachita Mountains, about 30 miles south of Hot Springs National Park and about 130 miles southwest of Little Rock, the state capital. The population was 10,714 at the 2010 census, making it the tenth-largest city in Arkansas.
History
The area around Arkadelphia was first settled in the early 19th century by the Caddo Indians. The first European settlers arrived in the area in 1810, and the city was officially founded in 1816. The city was named after Arkadelphia, a settlement in the state of Georgia.
In 1842, the city was incorporated and the first post office was established. During the Civil War, the city was the site of several battles, including the Battle of Arkadelphia in 1863. After the war, the city experienced a period of growth and prosperity, and by the early 20th century, it had become a major center for timber and cotton production.
Geography
Arkadelphia is located in the Ouachita Mountains of south-central Arkansas. It is situated at the confluence of the Ouachita and Caddo Rivers, about 30 miles south of Hot Springs National Park and about 130 miles southwest of Little Rock, the state capital.
The city has a total area of 10.3 square miles, of which 10.2 square miles is land and 0.1 square miles is water. The city is located in the Central Arkansas region and is part of the Little Rock–North Little Rock–Conway Metropolitan Statistical Area.
Economy
Arkadelphia is a major center for timber and cotton production. The city is home to several large manufacturing companies, including Georgia-Pacific, International Paper, and Tyson Foods. The city is also home to Henderson State University, which is the second-oldest public university in the state.
The city's economy is also supported by tourism, with visitors coming to the city to visit the Ouachita National Forest, Hot Springs National Park, and other attractions.
Demographics
As of the 2010 census, there were 10,714 people, 4,072 households, and 2,541 families residing in the city. The population density was 1,051.2 people per square mile. The racial makeup of the city was 73.3% White, 21.2% African American, 0.5% Native American, 1.2% Asian, 0.1% Pacific Islander, 1.3% from other races, and 2.5% from two or more races. Hispanic or Latino of any race were 3.3% of the population.
The median income for a household in the city was $30,945, and the median income for a family was $41,945. The per capita income for the city was $17,845. About 17.2% of families and 22.2% of the population were below the poverty line, including 33.3% of those under age 18 and 11.2% of those age 65 or over.
Common Questions
What is Per Capita Income in Arkadelphia?
Per Capita income in Arkadelphia is $20,130.
What is the Median Family Income in Arkadelphia?
Median Family Income in Arkadelphia is $60,761.
What is the Median Household income in Arkadelphia?
Median Household Income in Arkadelphia is $37,634.
What is Income or Wage Gap in Arkadelphia?
Income or Wage Gap in Arkadelphia is 33.9%.
Women in Arkadelphia earn 66.1 cents for every dollar earned by a man.
What is Inequality or Gini Index in Arkadelphia?
Inequality or Gini Index in Arkadelphia is 0.47.
What is the Total Population of Arkadelphia?
Total Population of Arkadelphia is 10,354.
What is the Total Male Population of Arkadelphia?
Total Male Population of Arkadelphia is 4,673.
What is the Total Female Population of Arkadelphia?
Total Female Population of Arkadelphia is 5,681.
What is the Ratio of Males per 100 Females in Arkadelphia?
There are 82.26 Males per 100 Females in Arkadelphia.
What is the Ratio of Females per 100 Males in Arkadelphia?
There are 121.57 Females per 100 Males in Arkadelphia.
What is the Median Population Age in Arkadelphia?
Median Population Age in Arkadelphia is 23.3 Years.
What is the Average Family Size in Arkadelphia
Average Family Size in Arkadelphia is 3.1 People.
What is the Average Household Size in Arkadelphia
Average Household Size in Arkadelphia is 2.2 People.
How Large is the Labor Force in Arkadelphia?
There are 4,822 People in the Labor Forcein in Arkadelphia.
What is the Percentage of People in the Labor Force in Arkadelphia?
55.2% of People are in the Labor Force in Arkadelphia.
What is the Unemployment Rate in Arkadelphia?
Unemployment Rate in Arkadelphia is 3.6%.