Altheimer, AR Map & Demographics
Altheimer Map
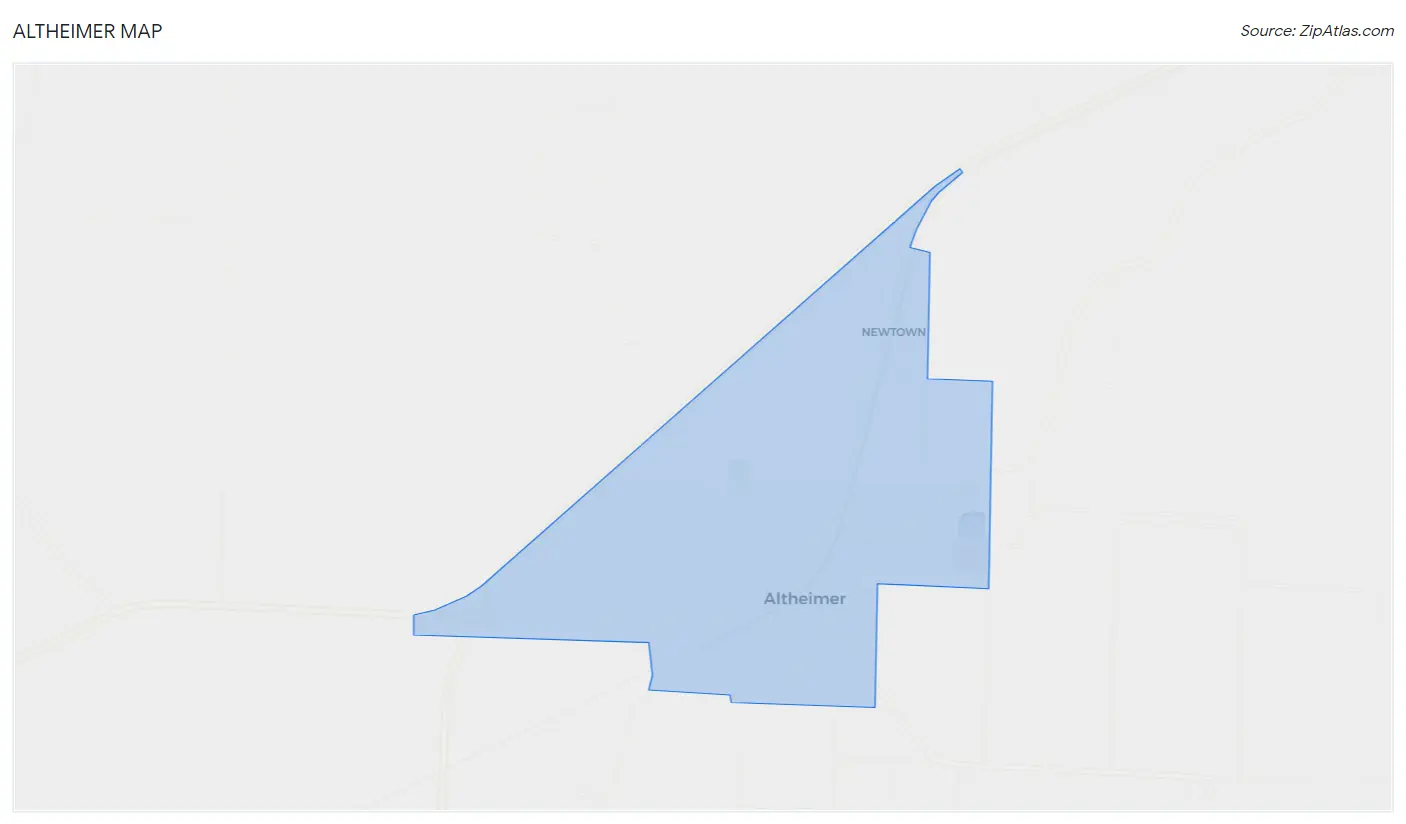
Altheimer Overview
$20,371
PER CAPITA INCOME
$41,875
AVG FAMILY INCOME
$31,429
AVG HOUSEHOLD INCOME
36.1%
WAGE / INCOME GAP [ % ]
63.9¢/ $1
WAGE / INCOME GAP [ $ ]
$9,170
FAMILY INCOME DEFICIT
0.41
INEQUALITY / GINI INDEX
625
TOTAL POPULATION
368
MALE POPULATION
257
FEMALE POPULATION
143.19
MALES / 100 FEMALES
69.84
FEMALES / 100 MALES
44.3
MEDIAN AGE
4.0
AVG FAMILY SIZE
3.2
AVG HOUSEHOLD SIZE
209
LABOR FORCE [ PEOPLE ]
40.7%
PERCENT IN LABOR FORCE
Altheimer Zip Codes
Altheimer Area Codes
Income in Altheimer
Income Overview in Altheimer
Per Capita Income in Altheimer is $20,371, while median incomes of families and households are $41,875 and $31,429 respectively.
| Characteristic | Number | Measure |
| Per Capita Income | 625 | $20,371 |
| Median Family Income | 143 | $41,875 |
| Mean Family Income | 143 | $53,124 |
| Median Household Income | 198 | $31,429 |
| Mean Household Income | 198 | $46,926 |
| Income Deficit | 143 | $9,170 |
| Wage / Income Gap (%) | 625 | 36.07% |
| Wage / Income Gap ($) | 625 | 63.93¢ per $1 |
| Gini / Inequality Index | 625 | 0.41 |
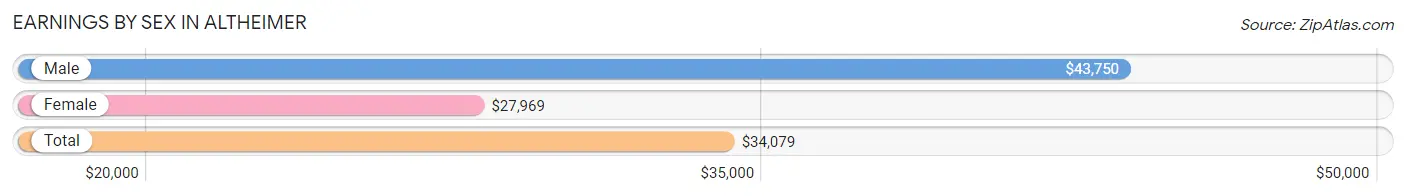
Earnings by Sex in Altheimer
Average Earnings in Altheimer are $34,079, $43,750 for men and $27,969 for women, a difference of 36.1%.
| Sex | Number | Average Earnings |
| Male | 117 (54.7%) | $43,750 |
| Female | 97 (45.3%) | $27,969 |
| Total | 214 (100.0%) | $34,079 |
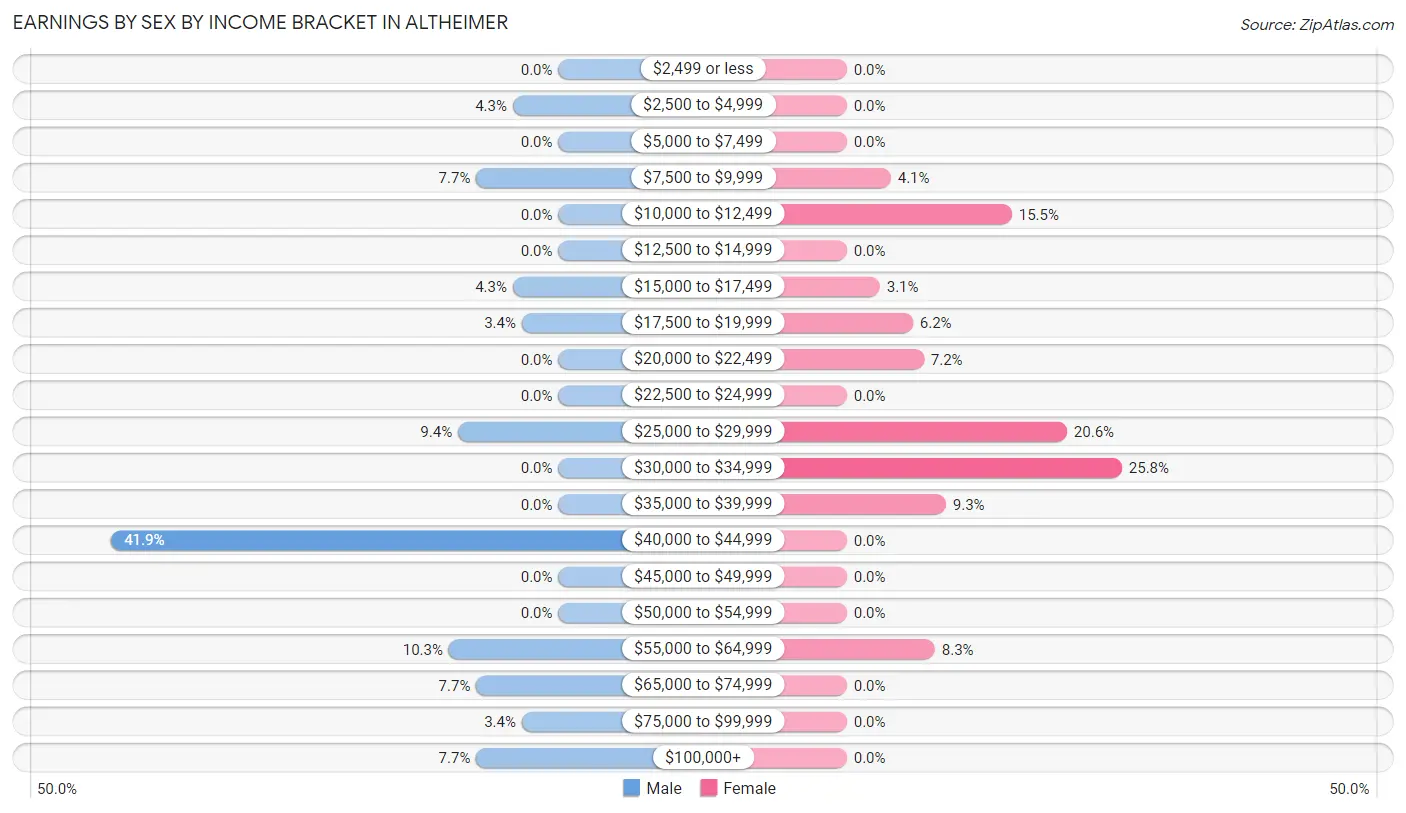
Earnings by Sex by Income Bracket in Altheimer
The most common earnings brackets in Altheimer are $40,000 to $44,999 for men (49 | 41.9%) and $30,000 to $34,999 for women (25 | 25.8%).
| Income | Male | Female |
| $2,499 or less | 0 (0.0%) | 0 (0.0%) |
| $2,500 to $4,999 | 5 (4.3%) | 0 (0.0%) |
| $5,000 to $7,499 | 0 (0.0%) | 0 (0.0%) |
| $7,500 to $9,999 | 9 (7.7%) | 4 (4.1%) |
| $10,000 to $12,499 | 0 (0.0%) | 15 (15.5%) |
| $12,500 to $14,999 | 0 (0.0%) | 0 (0.0%) |
| $15,000 to $17,499 | 5 (4.3%) | 3 (3.1%) |
| $17,500 to $19,999 | 4 (3.4%) | 6 (6.2%) |
| $20,000 to $22,499 | 0 (0.0%) | 7 (7.2%) |
| $22,500 to $24,999 | 0 (0.0%) | 0 (0.0%) |
| $25,000 to $29,999 | 11 (9.4%) | 20 (20.6%) |
| $30,000 to $34,999 | 0 (0.0%) | 25 (25.8%) |
| $35,000 to $39,999 | 0 (0.0%) | 9 (9.3%) |
| $40,000 to $44,999 | 49 (41.9%) | 0 (0.0%) |
| $45,000 to $49,999 | 0 (0.0%) | 0 (0.0%) |
| $50,000 to $54,999 | 0 (0.0%) | 0 (0.0%) |
| $55,000 to $64,999 | 12 (10.3%) | 8 (8.3%) |
| $65,000 to $74,999 | 9 (7.7%) | 0 (0.0%) |
| $75,000 to $99,999 | 4 (3.4%) | 0 (0.0%) |
| $100,000+ | 9 (7.7%) | 0 (0.0%) |
| Total | 117 (100.0%) | 97 (100.0%) |
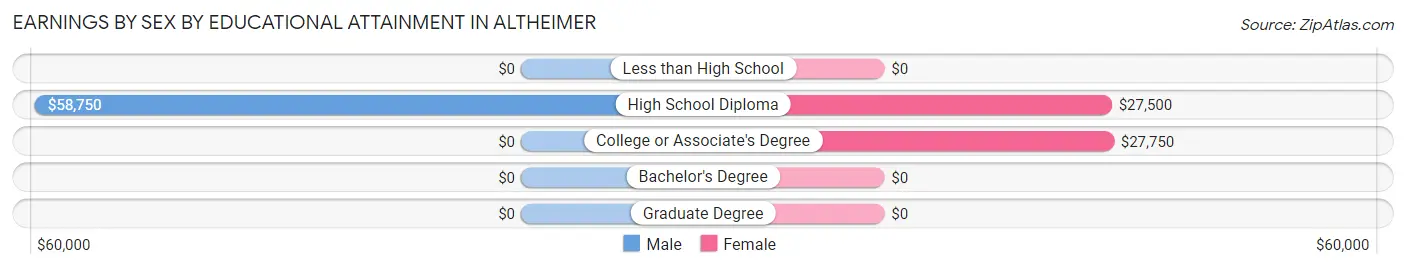
Earnings by Sex by Educational Attainment in Altheimer
Average earnings in Altheimer are $43,827 for men and $27,969 for women, a difference of 36.2%. Men with an educational attainment of high school diploma enjoy the highest average annual earnings of $58,750, while those with high school diploma education earn the least with $58,750. Women with an educational attainment of college or associate's degree earn the most with the average annual earnings of $27,750, while those with high school diploma education have the smallest earnings of $27,500.
| Educational Attainment | Male Income | Female Income |
| Less than High School | - | - |
| High School Diploma | $58,750 | $27,500 |
| College or Associate's Degree | - | - |
| Bachelor's Degree | - | - |
| Graduate Degree | - | - |
| Total | $43,827 | $27,969 |
Family Income in Altheimer
Family Income Brackets in Altheimer
According to the Altheimer family income data, there are 37 families falling into the $35,000 to $49,999 income range, which is the most common income bracket and makes up 25.9% of all families.
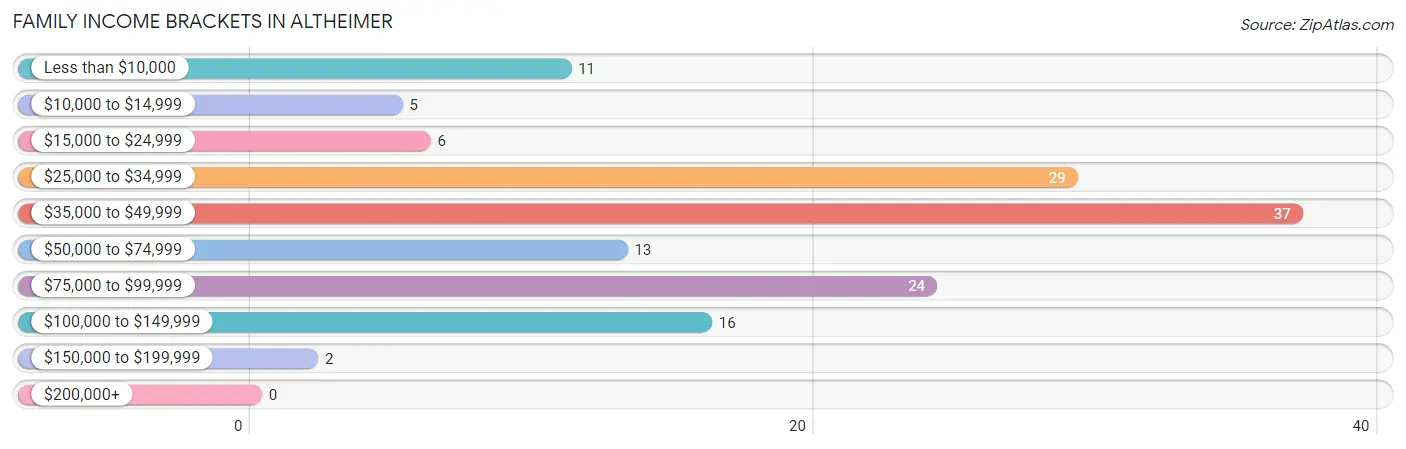
| Income Bracket | # Families | % Families |
| Less than $10,000 | 11 | 7.7% |
| $10,000 to $14,999 | 5 | 3.5% |
| $15,000 to $24,999 | 6 | 4.2% |
| $25,000 to $34,999 | 29 | 20.3% |
| $35,000 to $49,999 | 37 | 25.9% |
| $50,000 to $74,999 | 13 | 9.1% |
| $75,000 to $99,999 | 24 | 16.8% |
| $100,000 to $149,999 | 16 | 11.2% |
| $150,000 to $199,999 | 2 | 1.4% |
| $200,000+ | 0 | 0.0% |
Family Income by Famaliy Size in Altheimer
2-person families (77 | 53.8%) account for the highest median family income in Altheimer with $41,193 per family, while 2-person families (77 | 53.8%) have the highest median income of $20,596 per family member.
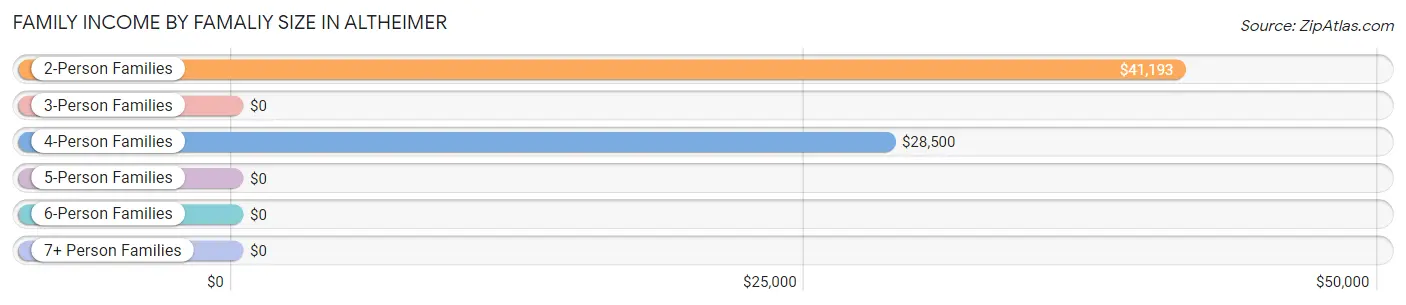
| Income Bracket | # Families | Median Income |
| 2-Person Families | 77 (53.8%) | $41,193 |
| 3-Person Families | 32 (22.4%) | $0 |
| 4-Person Families | 18 (12.6%) | $28,500 |
| 5-Person Families | 2 (1.4%) | $0 |
| 6-Person Families | 14 (9.8%) | $0 |
| 7+ Person Families | 0 (0.0%) | $0 |
| Total | 143 (100.0%) | $41,875 |
Family Income by Number of Earners in Altheimer
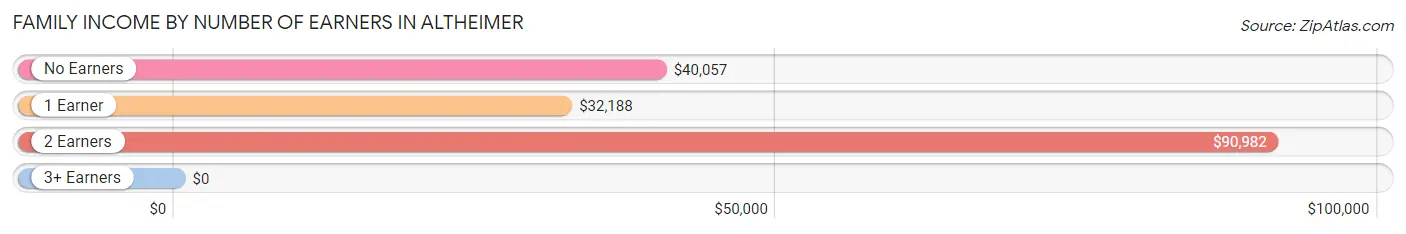
| Number of Earners | # Families | Median Income |
| No Earners | 59 (41.3%) | $40,057 |
| 1 Earner | 43 (30.1%) | $32,188 |
| 2 Earners | 35 (24.5%) | $90,982 |
| 3+ Earners | 6 (4.2%) | $0 |
| Total | 143 (100.0%) | $41,875 |
Household Income in Altheimer
Household Income Brackets in Altheimer
With 53 households falling in the category, the $25,000 to $34,999 income range is the most frequent in Altheimer, accounting for 26.8% of all households. In contrast, only 2 households (1.0%) fall into the $150,000 to $199,999 income bracket, making it the least populous group.
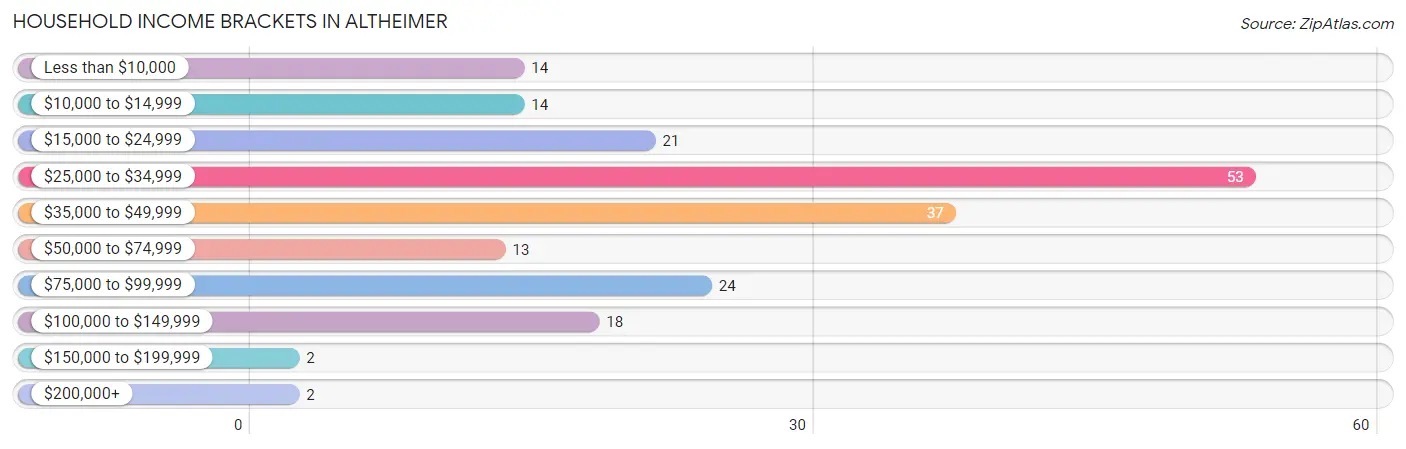
| Income Bracket | # Households | % Households |
| Less than $10,000 | 14 | 7.1% |
| $10,000 to $14,999 | 14 | 7.1% |
| $15,000 to $24,999 | 21 | 10.6% |
| $25,000 to $34,999 | 53 | 26.8% |
| $35,000 to $49,999 | 37 | 18.7% |
| $50,000 to $74,999 | 13 | 6.6% |
| $75,000 to $99,999 | 24 | 12.1% |
| $100,000 to $149,999 | 18 | 9.1% |
| $150,000 to $199,999 | 2 | 1.0% |
| $200,000+ | 2 | 1.0% |
Household Income by Householder Age in Altheimer
The median household income in Altheimer is $31,429, with the highest median household income of $30,000 found in the 65+ years age bracket for the primary householder. A total of 92 households (46.5%) fall into this category.
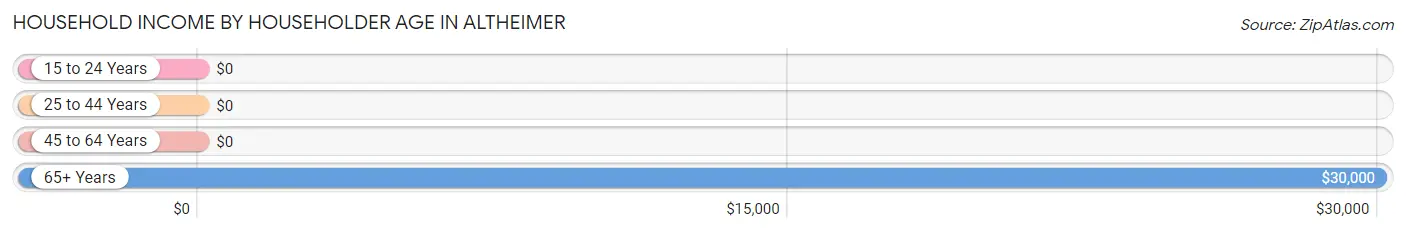
| Income Bracket | # Households | Median Income |
| 15 to 24 Years | 0 (0.0%) | $0 |
| 25 to 44 Years | 36 (18.2%) | $0 |
| 45 to 64 Years | 70 (35.3%) | $0 |
| 65+ Years | 92 (46.5%) | $30,000 |
| Total | 198 (100.0%) | $31,429 |
Poverty in Altheimer
Income Below Poverty by Sex and Age in Altheimer
With 17.9% poverty level for males and 17.1% for females among the residents of Altheimer, 6 to 11 year old males and 35 to 44 year old females are the most vulnerable to poverty, with 23 males (100.0%) and 14 females (50.0%) in their respective age groups living below the poverty level.
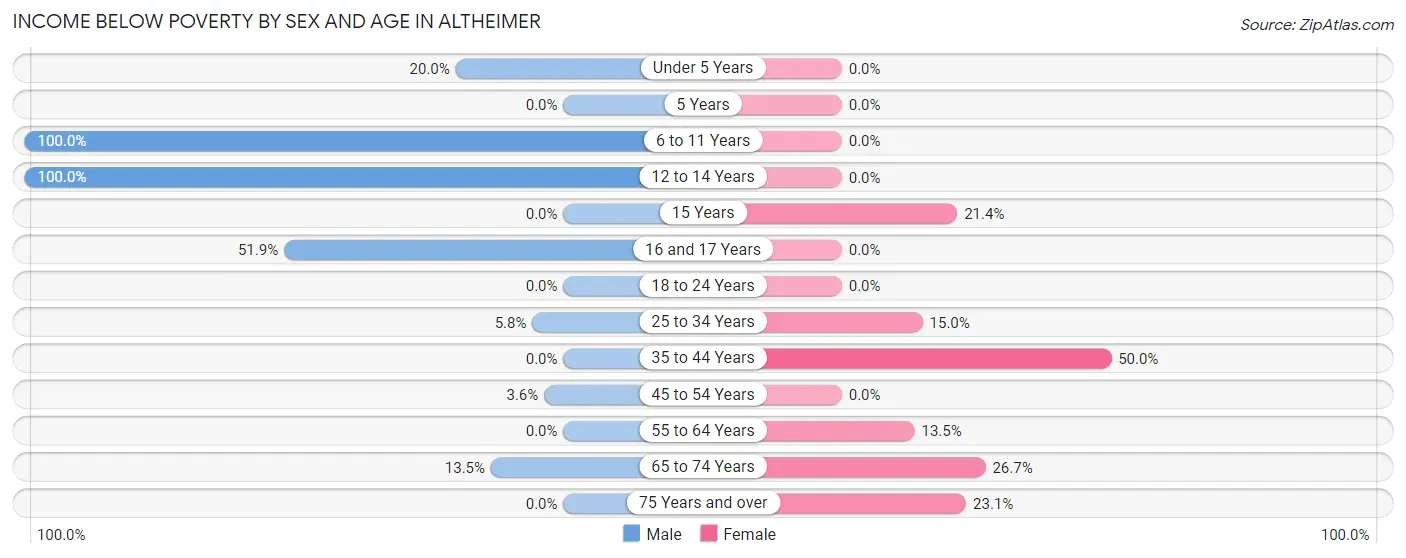
| Age Bracket | Male | Female |
| Under 5 Years | 7 (20.0%) | 0 (0.0%) |
| 5 Years | 0 (0.0%) | 0 (0.0%) |
| 6 to 11 Years | 23 (100.0%) | 0 (0.0%) |
| 12 to 14 Years | 10 (100.0%) | 0 (0.0%) |
| 15 Years | 0 (0.0%) | 3 (21.4%) |
| 16 and 17 Years | 14 (51.8%) | 0 (0.0%) |
| 18 to 24 Years | 0 (0.0%) | 0 (0.0%) |
| 25 to 34 Years | 3 (5.8%) | 3 (15.0%) |
| 35 to 44 Years | 0 (0.0%) | 14 (50.0%) |
| 45 to 54 Years | 2 (3.6%) | 0 (0.0%) |
| 55 to 64 Years | 0 (0.0%) | 5 (13.5%) |
| 65 to 74 Years | 7 (13.5%) | 16 (26.7%) |
| 75 Years and over | 0 (0.0%) | 3 (23.1%) |
| Total | 66 (17.9%) | 44 (17.1%) |
Income Above Poverty by Sex and Age in Altheimer
According to the poverty statistics in Altheimer, males aged 18 to 24 years and females aged 6 to 11 years are the age groups that are most secure financially, with 100.0% of males and 100.0% of females in these age groups living above the poverty line.
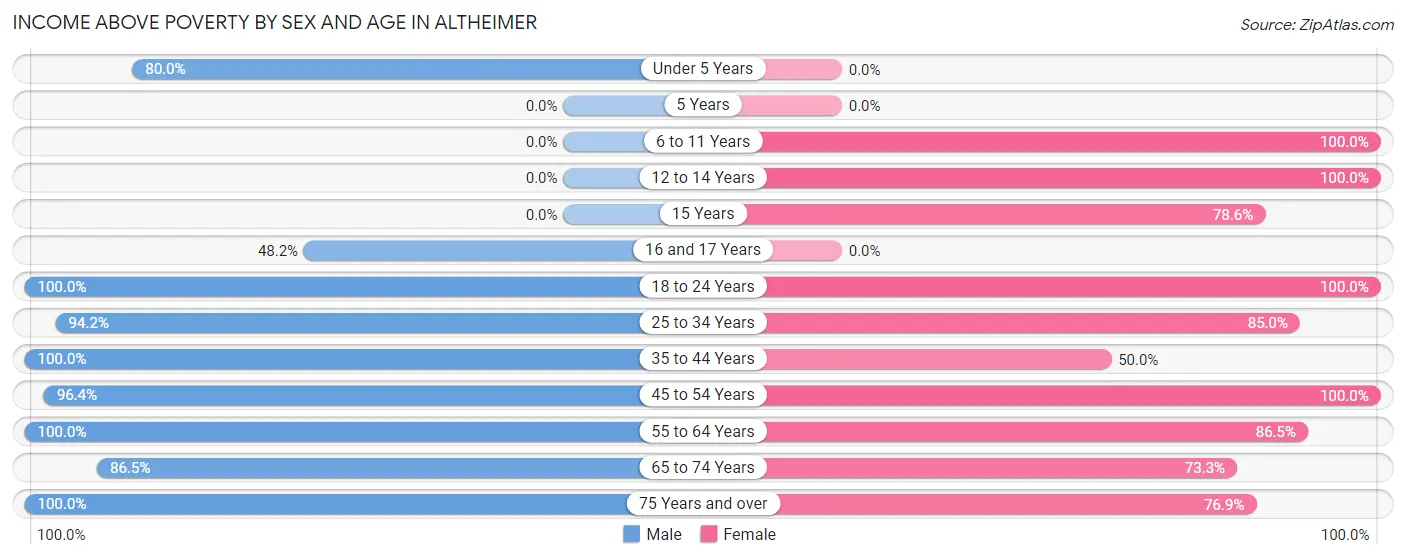
| Age Bracket | Male | Female |
| Under 5 Years | 28 (80.0%) | 0 (0.0%) |
| 5 Years | 0 (0.0%) | 0 (0.0%) |
| 6 to 11 Years | 0 (0.0%) | 21 (100.0%) |
| 12 to 14 Years | 0 (0.0%) | 8 (100.0%) |
| 15 Years | 0 (0.0%) | 11 (78.6%) |
| 16 and 17 Years | 13 (48.1%) | 0 (0.0%) |
| 18 to 24 Years | 31 (100.0%) | 23 (100.0%) |
| 25 to 34 Years | 49 (94.2%) | 17 (85.0%) |
| 35 to 44 Years | 24 (100.0%) | 14 (50.0%) |
| 45 to 54 Years | 54 (96.4%) | 33 (100.0%) |
| 55 to 64 Years | 41 (100.0%) | 32 (86.5%) |
| 65 to 74 Years | 45 (86.5%) | 44 (73.3%) |
| 75 Years and over | 17 (100.0%) | 10 (76.9%) |
| Total | 302 (82.1%) | 213 (82.9%) |
Income Below Poverty Among Married-Couple Families in Altheimer
The poverty statistics for married-couple families in Altheimer show that 10.2% or 10 of the total 98 families live below the poverty line. Families with no children have the highest poverty rate of 13.5%, comprising of 10 families. On the other hand, families with 1 or 2 children have the lowest poverty rate of 0.0%, which includes 0 families.
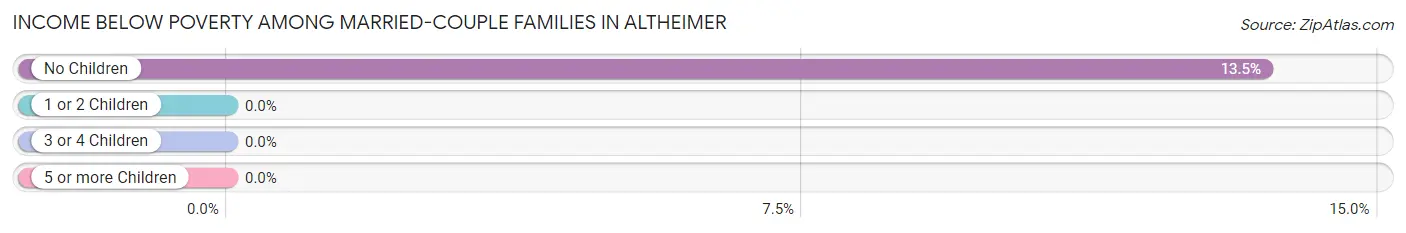
| Children | Above Poverty | Below Poverty |
| No Children | 64 (86.5%) | 10 (13.5%) |
| 1 or 2 Children | 24 (100.0%) | 0 (0.0%) |
| 3 or 4 Children | 0 (0.0%) | 0 (0.0%) |
| 5 or more Children | 0 (0.0%) | 0 (0.0%) |
| Total | 88 (89.8%) | 10 (10.2%) |
Income Below Poverty Among Single-Parent Households in Altheimer
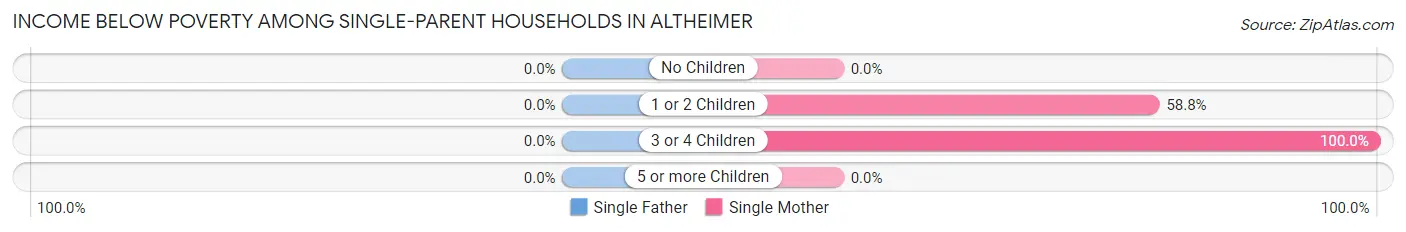
| Children | Single Father | Single Mother |
| No Children | 0 (0.0%) | 0 (0.0%) |
| 1 or 2 Children | 0 (0.0%) | 10 (58.8%) |
| 3 or 4 Children | 0 (0.0%) | 7 (100.0%) |
| 5 or more Children | 0 (0.0%) | 0 (0.0%) |
| Total | 0 (0.0%) | 17 (53.1%) |
Income Below Poverty Among Married-Couple vs Single-Parent Households in Altheimer
The poverty data for Altheimer shows that 10 of the married-couple family households (10.2%) and 17 of the single-parent households (37.8%) are living below the poverty level. Within the married-couple family households, those with no children have the highest poverty rate, with 10 households (13.5%) falling below the poverty line. Among the single-parent households, those with 3 or 4 children have the highest poverty rate, with 7 household (100.0%) living below poverty.
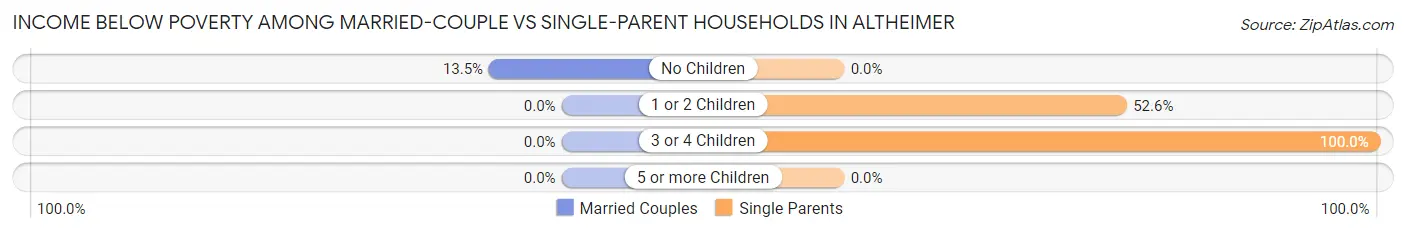
| Children | Married-Couple Families | Single-Parent Households |
| No Children | 10 (13.5%) | 0 (0.0%) |
| 1 or 2 Children | 0 (0.0%) | 10 (52.6%) |
| 3 or 4 Children | 0 (0.0%) | 7 (100.0%) |
| 5 or more Children | 0 (0.0%) | 0 (0.0%) |
| Total | 10 (10.2%) | 17 (37.8%) |
Race in Altheimer
The most populous races in Altheimer are Black / African American (595 | 95.2%), White / Caucasian (30 | 4.8%), and Hispanic or Latino (2 | 0.3%).
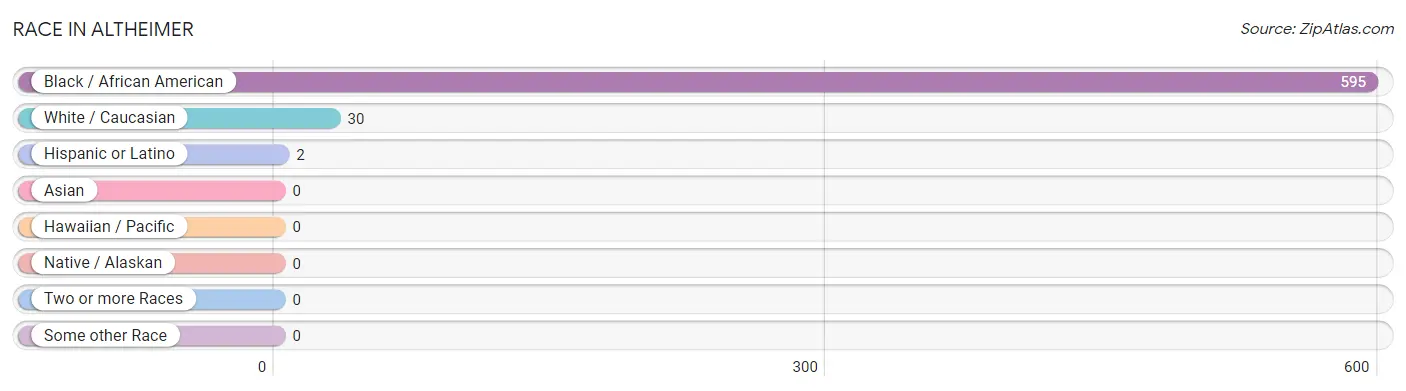
| Race | # Population | % Population |
| Asian | 0 | 0.0% |
| Black / African American | 595 | 95.2% |
| Hawaiian / Pacific | 0 | 0.0% |
| Hispanic or Latino | 2 | 0.3% |
| Native / Alaskan | 0 | 0.0% |
| White / Caucasian | 30 | 4.8% |
| Two or more Races | 0 | 0.0% |
| Some other Race | 0 | 0.0% |
| Total | 625 | 100.0% |
Ancestry in Altheimer
The most populous ancestries reported in Altheimer are African (8 | 1.3%), Subsaharan African (8 | 1.3%), and Mexican (2 | 0.3%), together accounting for 2.9% of all Altheimer residents.
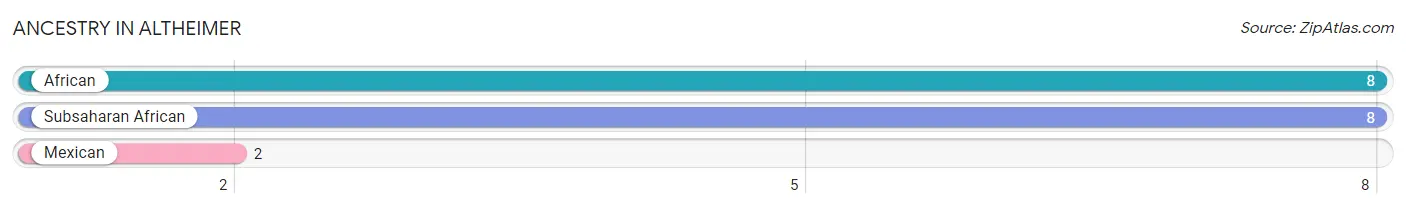
| Ancestry | # Population | % Population |
| African | 8 | 1.3% |
| Mexican | 2 | 0.3% |
| Subsaharan African | 8 | 1.3% | View All 3 Rows |
Immigrants in Altheimer

| Immigration Origin | # Population | % Population | View All 0 Rows |
Sex and Age in Altheimer
Sex and Age in Altheimer
The most populous age groups in Altheimer are 30 to 34 Years (49 | 13.3%) for men and 65 to 69 Years (50 | 19.5%) for women.
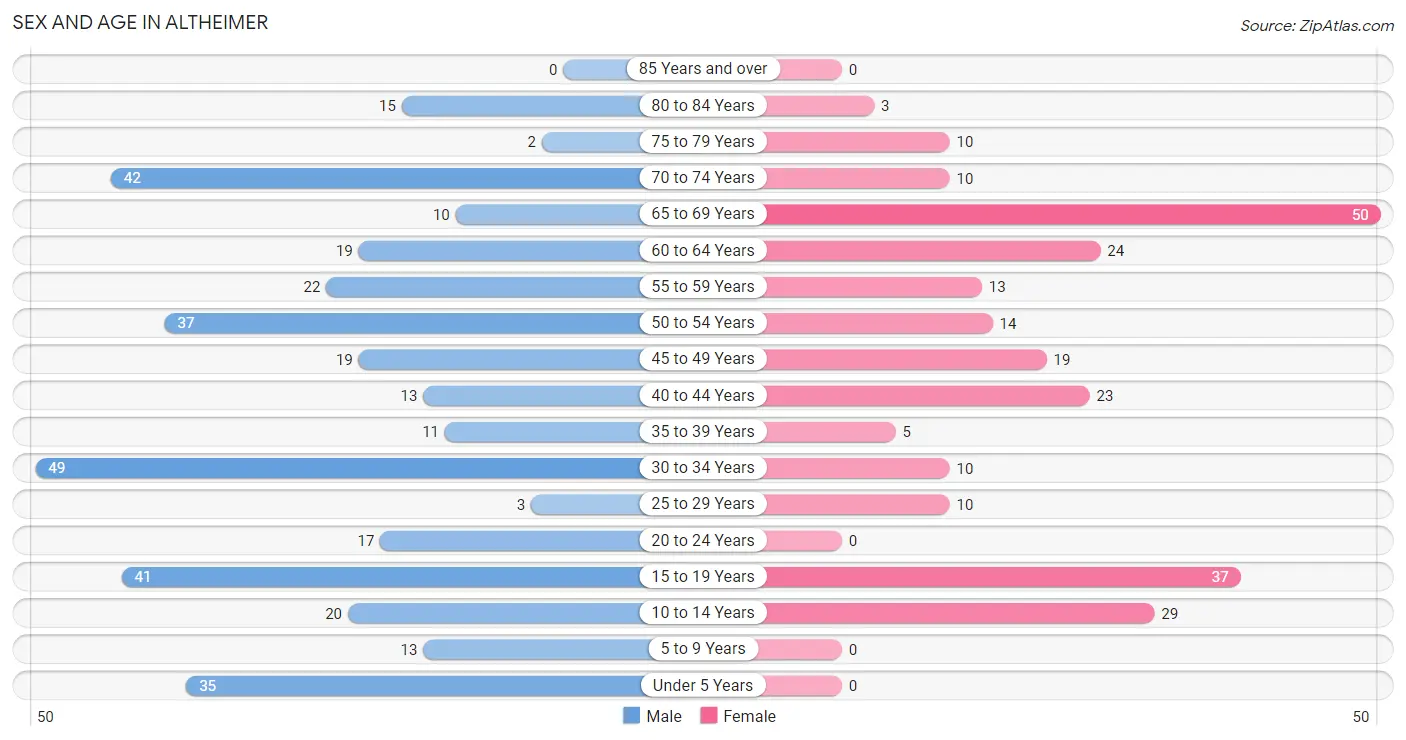
| Age Bracket | Male | Female |
| Under 5 Years | 35 (9.5%) | 0 (0.0%) |
| 5 to 9 Years | 13 (3.5%) | 0 (0.0%) |
| 10 to 14 Years | 20 (5.4%) | 29 (11.3%) |
| 15 to 19 Years | 41 (11.1%) | 37 (14.4%) |
| 20 to 24 Years | 17 (4.6%) | 0 (0.0%) |
| 25 to 29 Years | 3 (0.8%) | 10 (3.9%) |
| 30 to 34 Years | 49 (13.3%) | 10 (3.9%) |
| 35 to 39 Years | 11 (3.0%) | 5 (1.9%) |
| 40 to 44 Years | 13 (3.5%) | 23 (8.9%) |
| 45 to 49 Years | 19 (5.2%) | 19 (7.4%) |
| 50 to 54 Years | 37 (10.1%) | 14 (5.4%) |
| 55 to 59 Years | 22 (6.0%) | 13 (5.1%) |
| 60 to 64 Years | 19 (5.2%) | 24 (9.3%) |
| 65 to 69 Years | 10 (2.7%) | 50 (19.5%) |
| 70 to 74 Years | 42 (11.4%) | 10 (3.9%) |
| 75 to 79 Years | 2 (0.5%) | 10 (3.9%) |
| 80 to 84 Years | 15 (4.1%) | 3 (1.2%) |
| 85 Years and over | 0 (0.0%) | 0 (0.0%) |
| Total | 368 (100.0%) | 257 (100.0%) |
Families and Households in Altheimer
Median Family Size in Altheimer
The median family size in Altheimer is 3.97 persons per family, with married-couple families (98 | 68.5%) accounting for the largest median family size of 4.08 persons per family. On the other hand, single male/father families (13 | 9.1%) represent the smallest median family size with 3.23 persons per family.
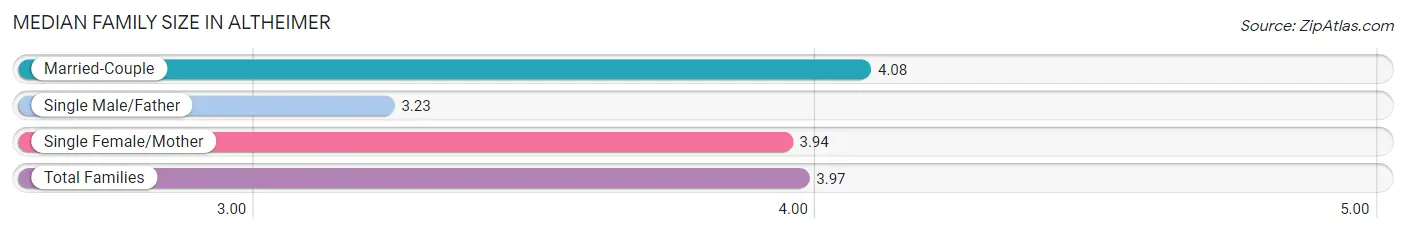
| Family Type | # Families | Family Size |
| Married-Couple | 98 (68.5%) | 4.08 |
| Single Male/Father | 13 (9.1%) | 3.23 |
| Single Female/Mother | 32 (22.4%) | 3.94 |
| Total Families | 143 (100.0%) | 3.97 |
Median Household Size in Altheimer
The median household size in Altheimer is 3.16 persons per household, with married-couple households (98 | 49.5%) accounting for the largest median household size of 4.08 persons per household. non-family households (55 | 27.8%) represent the smallest median household size with 1.04 persons per household.
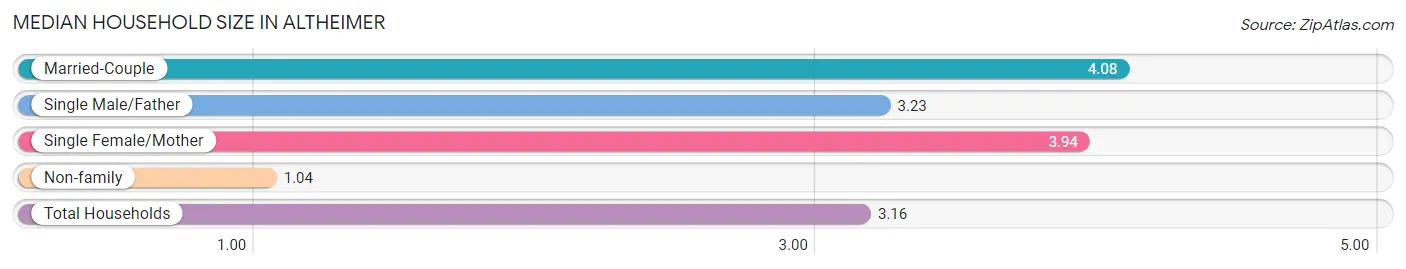
| Household Type | # Households | Household Size |
| Married-Couple | 98 (49.5%) | 4.08 |
| Single Male/Father | 13 (6.6%) | 3.23 |
| Single Female/Mother | 32 (16.2%) | 3.94 |
| Non-family | 55 (27.8%) | 1.04 |
| Total Households | 198 (100.0%) | 3.16 |
Household Size by Marriage Status in Altheimer
Out of a total of 198 households in Altheimer, 143 (72.2%) are family households, while 55 (27.8%) are nonfamily households. The most numerous type of family households are 2-person households, comprising 77, and the most common type of nonfamily households are 1-person households, comprising 53.
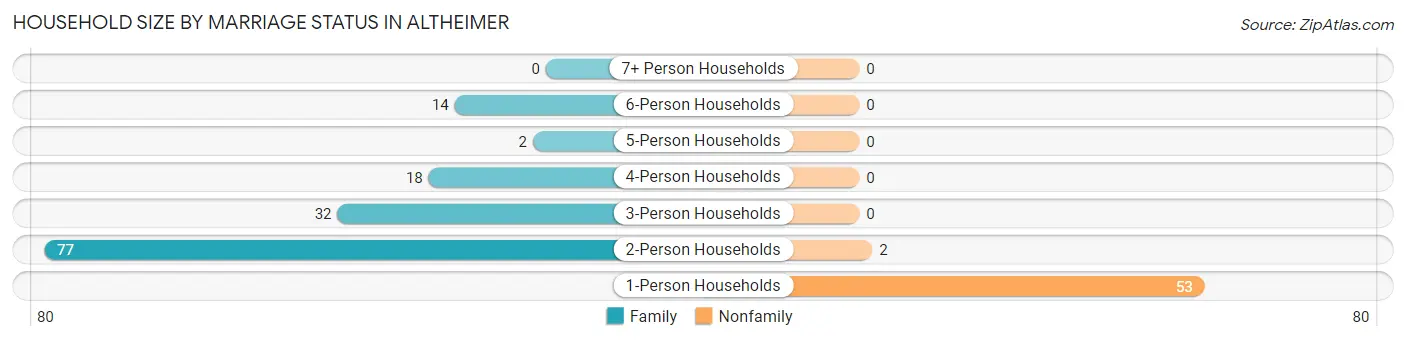
| Household Size | Family Households | Nonfamily Households |
| 1-Person Households | - | 53 (26.8%) |
| 2-Person Households | 77 (38.9%) | 2 (1.0%) |
| 3-Person Households | 32 (16.2%) | 0 (0.0%) |
| 4-Person Households | 18 (9.1%) | 0 (0.0%) |
| 5-Person Households | 2 (1.0%) | 0 (0.0%) |
| 6-Person Households | 14 (7.1%) | 0 (0.0%) |
| 7+ Person Households | 0 (0.0%) | 0 (0.0%) |
| Total | 143 (72.2%) | 55 (27.8%) |
Female Fertility in Altheimer
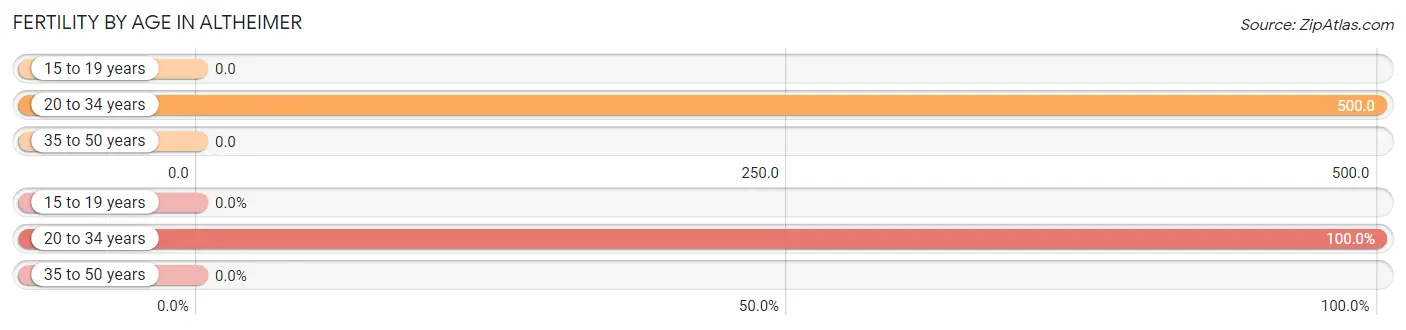
Fertility by Age in Altheimer
Average fertility rate in Altheimer is 96.0 births per 1,000 women. Women in the age bracket of 20 to 34 years have the highest fertility rate with 500.0 births per 1,000 women. Women in the age bracket of 20 to 34 years acount for 100.0% of all women with births.
| Age Bracket | Women with Births | Births / 1,000 Women |
| 15 to 19 years | 0 (0.0%) | 0.0 |
| 20 to 34 years | 10 (100.0%) | 500.0 |
| 35 to 50 years | 0 (0.0%) | 0.0 |
| Total | 10 (100.0%) | 96.0 |
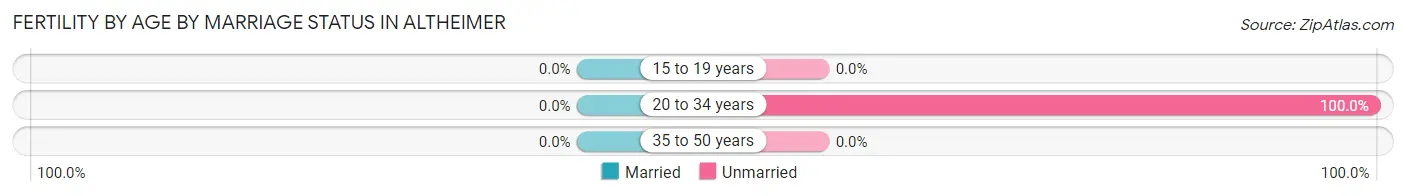
Fertility by Age by Marriage Status in Altheimer
| Age Bracket | Married | Unmarried |
| 15 to 19 years | 0 (0.0%) | 0 (0.0%) |
| 20 to 34 years | 0 (0.0%) | 10 (100.0%) |
| 35 to 50 years | 0 (0.0%) | 0 (0.0%) |
| Total | 0 (0.0%) | 10 (100.0%) |
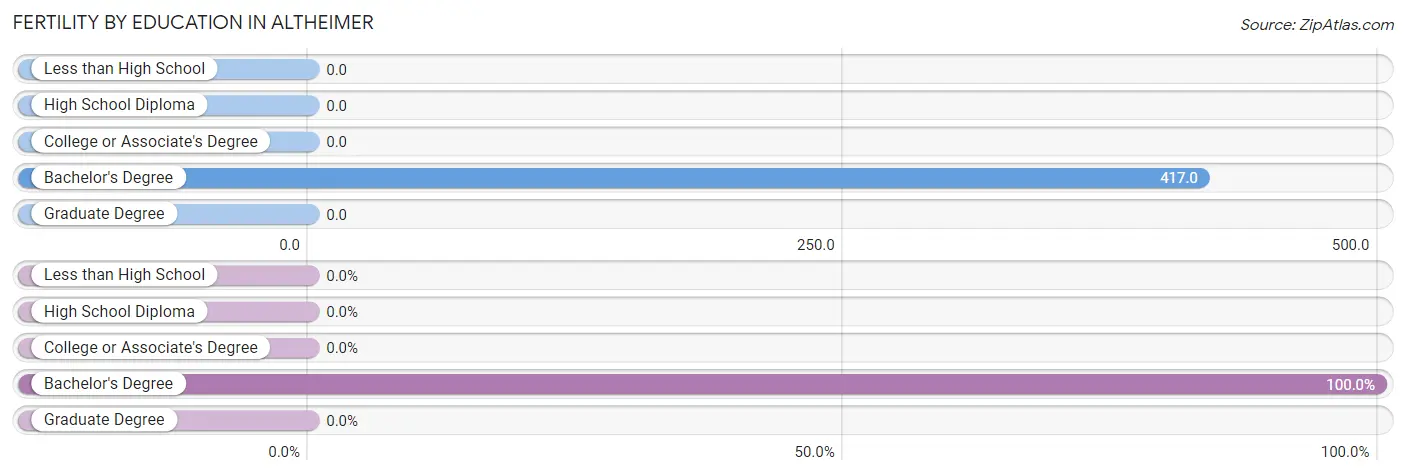
Fertility by Education in Altheimer
| Educational Attainment | Women with Births | Births / 1,000 Women |
| Less than High School | 0 (0.0%) | 0.0 |
| High School Diploma | 0 (0.0%) | 0.0 |
| College or Associate's Degree | 0 (0.0%) | 0.0 |
| Bachelor's Degree | 10 (100.0%) | 417.0 |
| Graduate Degree | 0 (0.0%) | 0.0 |
| Total | 10 (100.0%) | 96.0 |
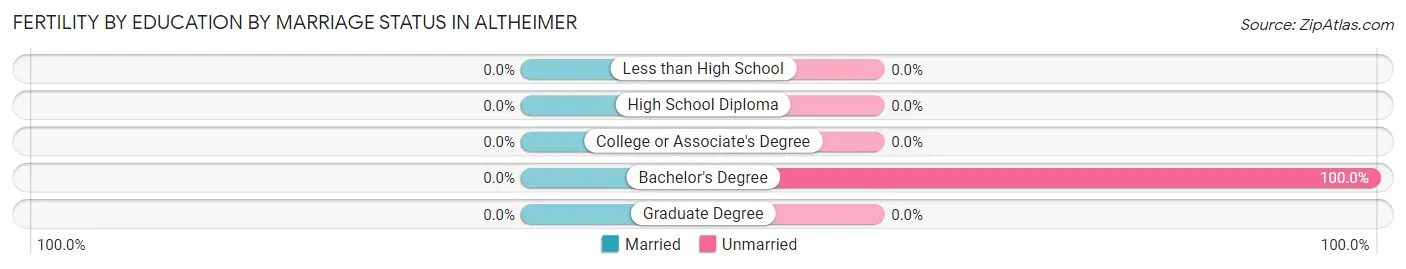
Fertility by Education by Marriage Status in Altheimer
| Educational Attainment | Married | Unmarried |
| Less than High School | 0 (0.0%) | 0 (0.0%) |
| High School Diploma | 0 (0.0%) | 0 (0.0%) |
| College or Associate's Degree | 0 (0.0%) | 0 (0.0%) |
| Bachelor's Degree | 0 (0.0%) | 10 (100.0%) |
| Graduate Degree | 0 (0.0%) | 0 (0.0%) |
| Total | 0 (0.0%) | 10 (100.0%) |
Employment Characteristics in Altheimer
Employment by Class of Employer in Altheimer
Among the 202 employed individuals in Altheimer, private company employees (67 | 33.2%), local government employees (62 | 30.7%), and state government employees (52 | 25.7%) make up the most common classes of employment.
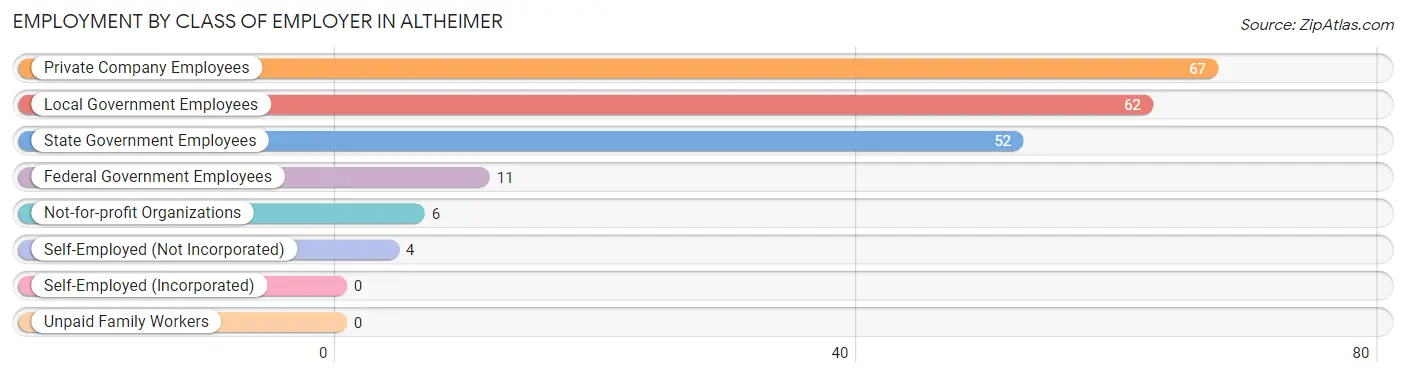
| Employer Class | # Employees | % Employees |
| Private Company Employees | 67 | 33.2% |
| Self-Employed (Incorporated) | 0 | 0.0% |
| Self-Employed (Not Incorporated) | 4 | 2.0% |
| Not-for-profit Organizations | 6 | 3.0% |
| Local Government Employees | 62 | 30.7% |
| State Government Employees | 52 | 25.7% |
| Federal Government Employees | 11 | 5.4% |
| Unpaid Family Workers | 0 | 0.0% |
| Total | 202 | 100.0% |
Employment Status by Age in Altheimer
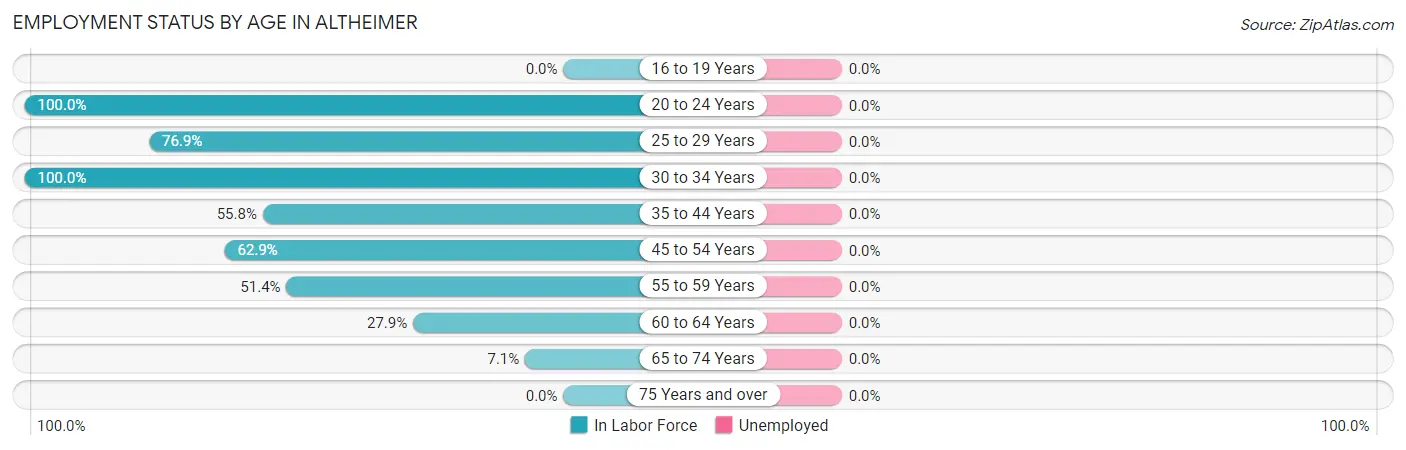
| Age Bracket | In Labor Force | Unemployed |
| 16 to 19 Years | 0 (0.0%) | 0 (0.0%) |
| 20 to 24 Years | 17 (100.0%) | 0 (0.0%) |
| 25 to 29 Years | 10 (76.9%) | 0 (0.0%) |
| 30 to 34 Years | 59 (100.0%) | 0 (0.0%) |
| 35 to 44 Years | 29 (55.8%) | 0 (0.0%) |
| 45 to 54 Years | 56 (62.9%) | 0 (0.0%) |
| 55 to 59 Years | 18 (51.4%) | 0 (0.0%) |
| 60 to 64 Years | 12 (27.9%) | 0 (0.0%) |
| 65 to 74 Years | 8 (7.1%) | 0 (0.0%) |
| 75 Years and over | 0 (0.0%) | 0 (0.0%) |
| Total | 209 (40.7%) | 0 (0.0%) |
Employment Status by Educational Attainment in Altheimer
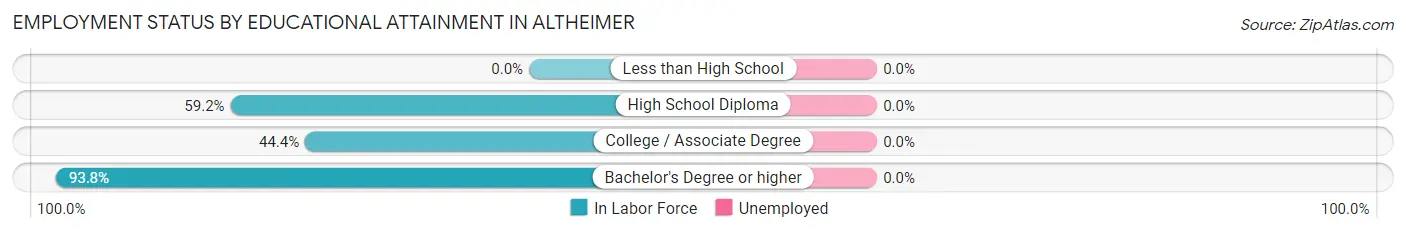
| Educational Attainment | In Labor Force | Unemployed |
| Less than High School | 0 (0.0%) | 0 (0.0%) |
| High School Diploma | 61 (59.2%) | 0 (0.0%) |
| College / Associate Degree | 48 (44.4%) | 0 (0.0%) |
| Bachelor's Degree or higher | 75 (93.8%) | 0 (0.0%) |
| Total | 184 (63.2%) | 0 (0.0%) |
Employment Occupations by Sex in Altheimer
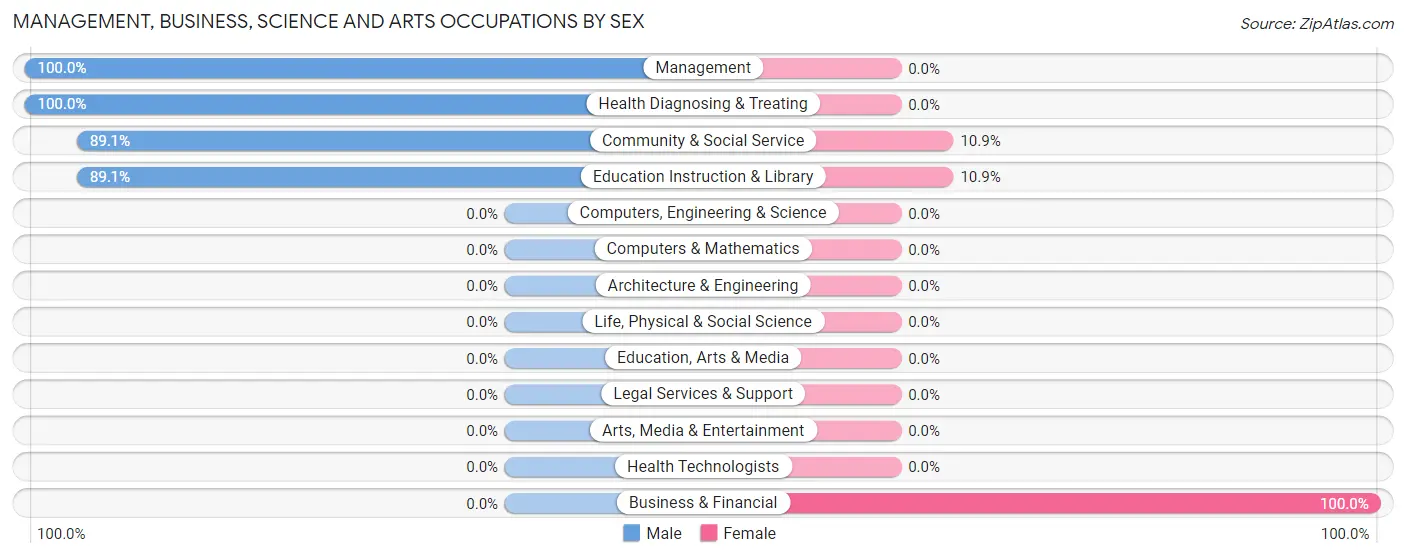
Management, Business, Science and Arts Occupations
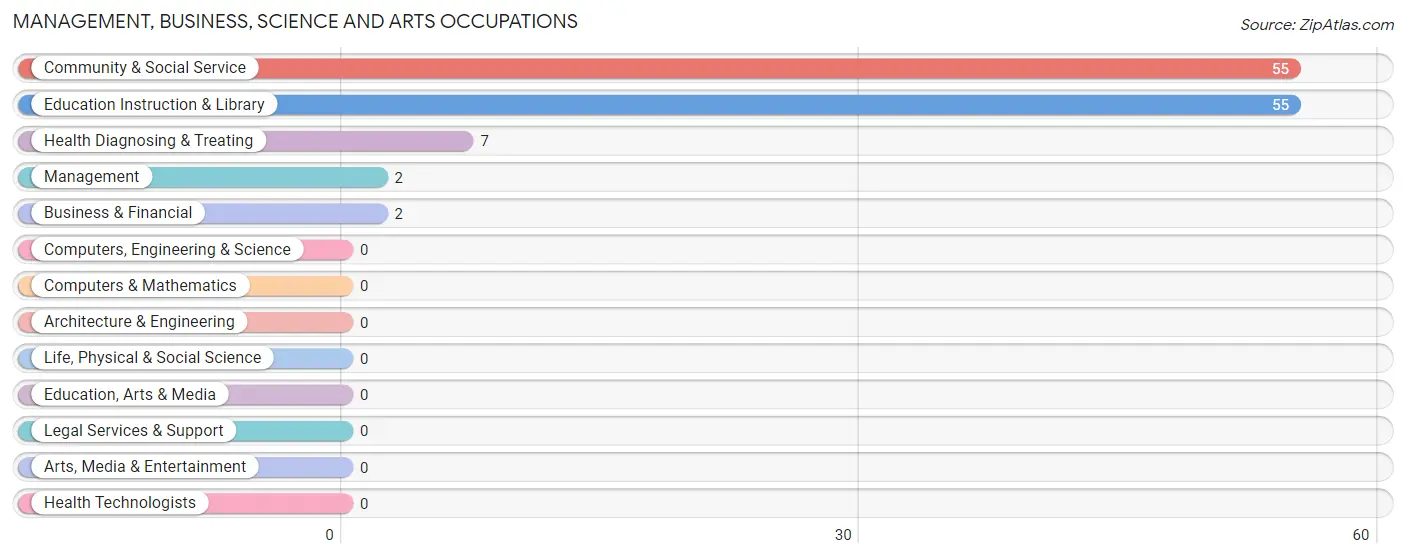
The most common Management, Business, Science and Arts occupations in Altheimer are Community & Social Service (55 | 26.3%), Education Instruction & Library (55 | 26.3%), Health Diagnosing & Treating (7 | 3.4%), Management (2 | 1.0%), and Business & Financial (2 | 1.0%).
Management, Business, Science and Arts Occupations by Sex
Within the Management, Business, Science and Arts occupations in Altheimer, the most male-oriented occupations are Management (100.0%), Health Diagnosing & Treating (100.0%), and Community & Social Service (89.1%), while the most female-oriented occupations are Business & Financial (100.0%), Community & Social Service (10.9%), and Education Instruction & Library (10.9%).
| Occupation | Male | Female |
| Management | 2 (100.0%) | 0 (0.0%) |
| Business & Financial | 0 (0.0%) | 2 (100.0%) |
| Computers, Engineering & Science | 0 (0.0%) | 0 (0.0%) |
| Computers & Mathematics | 0 (0.0%) | 0 (0.0%) |
| Architecture & Engineering | 0 (0.0%) | 0 (0.0%) |
| Life, Physical & Social Science | 0 (0.0%) | 0 (0.0%) |
| Community & Social Service | 49 (89.1%) | 6 (10.9%) |
| Education, Arts & Media | 0 (0.0%) | 0 (0.0%) |
| Legal Services & Support | 0 (0.0%) | 0 (0.0%) |
| Education Instruction & Library | 49 (89.1%) | 6 (10.9%) |
| Arts, Media & Entertainment | 0 (0.0%) | 0 (0.0%) |
| Health Diagnosing & Treating | 7 (100.0%) | 0 (0.0%) |
| Health Technologists | 0 (0.0%) | 0 (0.0%) |
| Total (Category) | 58 (87.9%) | 8 (12.1%) |
| Total (Overall) | 115 (55.0%) | 94 (45.0%) |
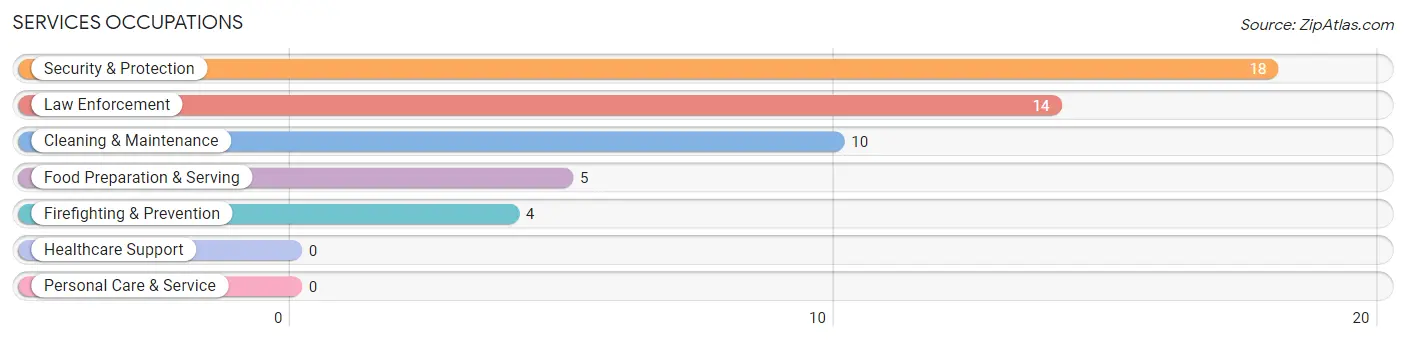
Services Occupations
The most common Services occupations in Altheimer are Security & Protection (18 | 8.6%), Law Enforcement (14 | 6.7%), Cleaning & Maintenance (10 | 4.8%), Food Preparation & Serving (5 | 2.4%), and Firefighting & Prevention (4 | 1.9%).
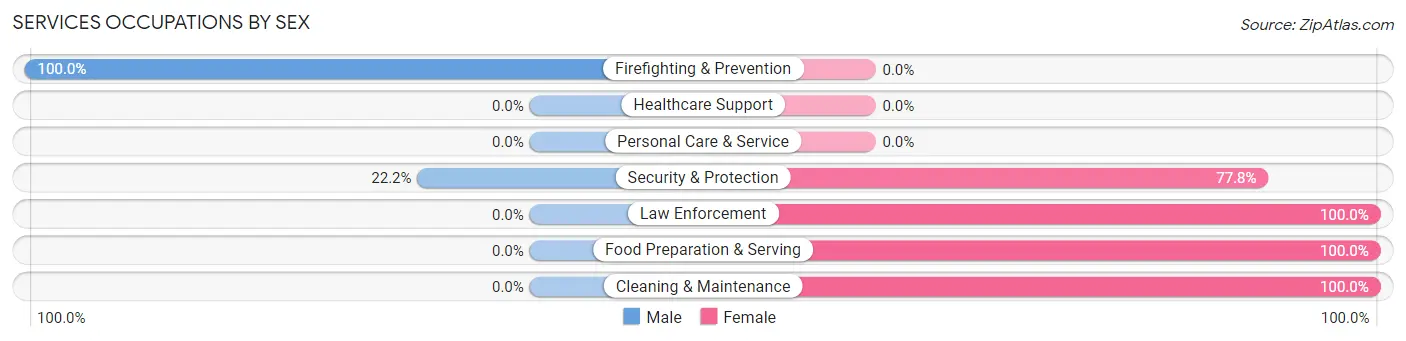
Services Occupations by Sex
Within the Services occupations in Altheimer, the most male-oriented occupations are Firefighting & Prevention (100.0%), and Security & Protection (22.2%), while the most female-oriented occupations are Law Enforcement (100.0%), Food Preparation & Serving (100.0%), and Cleaning & Maintenance (100.0%).
| Occupation | Male | Female |
| Healthcare Support | 0 (0.0%) | 0 (0.0%) |
| Security & Protection | 4 (22.2%) | 14 (77.8%) |
| Firefighting & Prevention | 4 (100.0%) | 0 (0.0%) |
| Law Enforcement | 0 (0.0%) | 14 (100.0%) |
| Food Preparation & Serving | 0 (0.0%) | 5 (100.0%) |
| Cleaning & Maintenance | 0 (0.0%) | 10 (100.0%) |
| Personal Care & Service | 0 (0.0%) | 0 (0.0%) |
| Total (Category) | 4 (12.1%) | 29 (87.9%) |
| Total (Overall) | 115 (55.0%) | 94 (45.0%) |
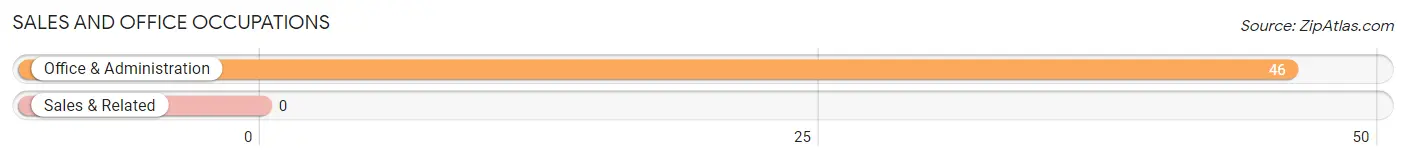
Sales and Office Occupations
The most common Sales and Office occupations in Altheimer are , and Office & Administration (46 | 22.0%).
Sales and Office Occupations by Sex
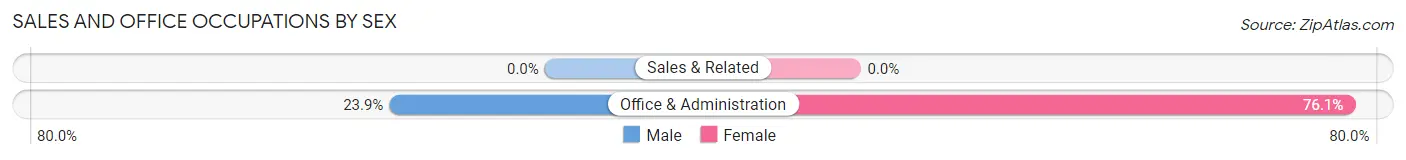
| Occupation | Male | Female |
| Sales & Related | 0 (0.0%) | 0 (0.0%) |
| Office & Administration | 11 (23.9%) | 35 (76.1%) |
| Total (Category) | 11 (23.9%) | 35 (76.1%) |
| Total (Overall) | 115 (55.0%) | 94 (45.0%) |
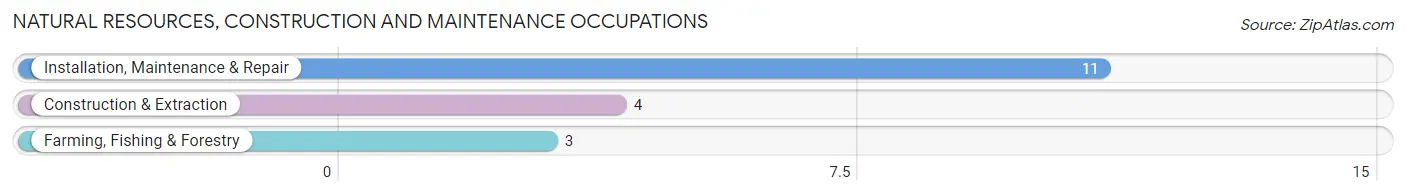
Natural Resources, Construction and Maintenance Occupations
The most common Natural Resources, Construction and Maintenance occupations in Altheimer are Installation, Maintenance & Repair (11 | 5.3%), Construction & Extraction (4 | 1.9%), and Farming, Fishing & Forestry (3 | 1.4%).
Natural Resources, Construction and Maintenance Occupations by Sex
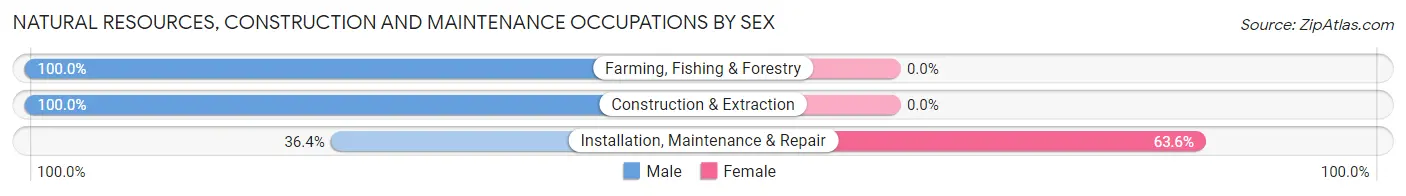
| Occupation | Male | Female |
| Farming, Fishing & Forestry | 3 (100.0%) | 0 (0.0%) |
| Construction & Extraction | 4 (100.0%) | 0 (0.0%) |
| Installation, Maintenance & Repair | 4 (36.4%) | 7 (63.6%) |
| Total (Category) | 11 (61.1%) | 7 (38.9%) |
| Total (Overall) | 115 (55.0%) | 94 (45.0%) |
Production, Transportation and Moving Occupations
The most common Production, Transportation and Moving occupations in Altheimer are Material Moving (25 | 12.0%), and Production (21 | 10.1%).
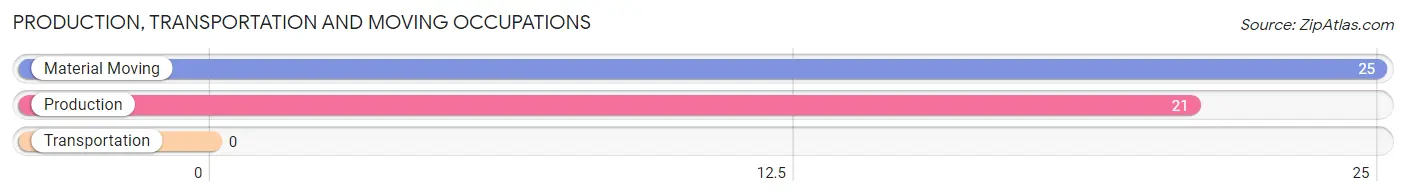
Production, Transportation and Moving Occupations by Sex
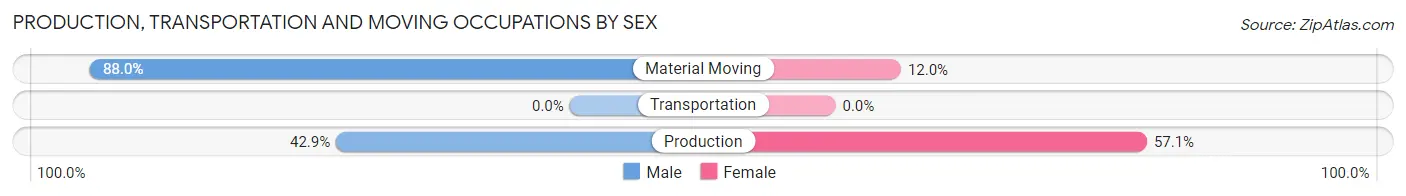
| Occupation | Male | Female |
| Production | 9 (42.9%) | 12 (57.1%) |
| Transportation | 0 (0.0%) | 0 (0.0%) |
| Material Moving | 22 (88.0%) | 3 (12.0%) |
| Total (Category) | 31 (67.4%) | 15 (32.6%) |
| Total (Overall) | 115 (55.0%) | 94 (45.0%) |
Employment Industries by Sex in Altheimer
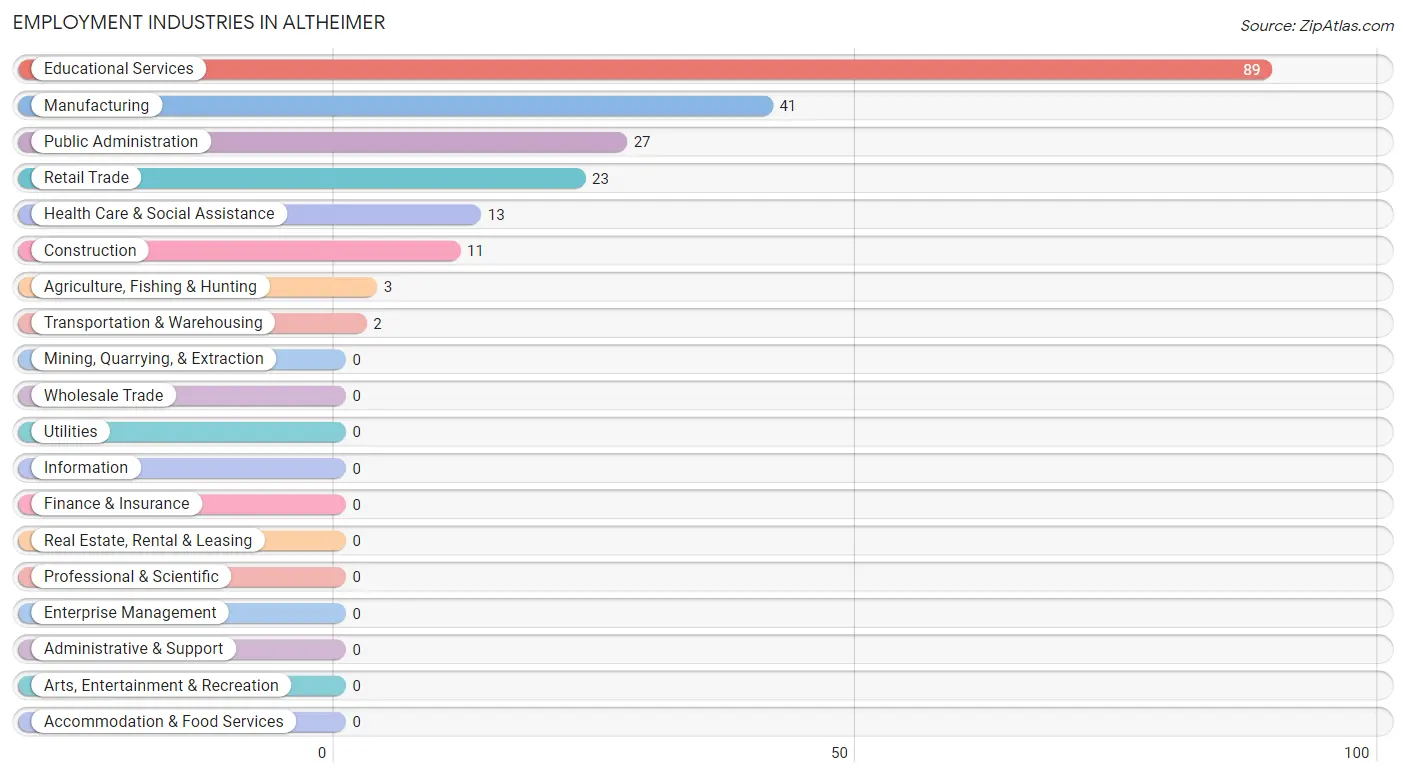
Employment Industries in Altheimer
The major employment industries in Altheimer include Educational Services (89 | 42.6%), Manufacturing (41 | 19.6%), Public Administration (27 | 12.9%), Retail Trade (23 | 11.0%), and Health Care & Social Assistance (13 | 6.2%).
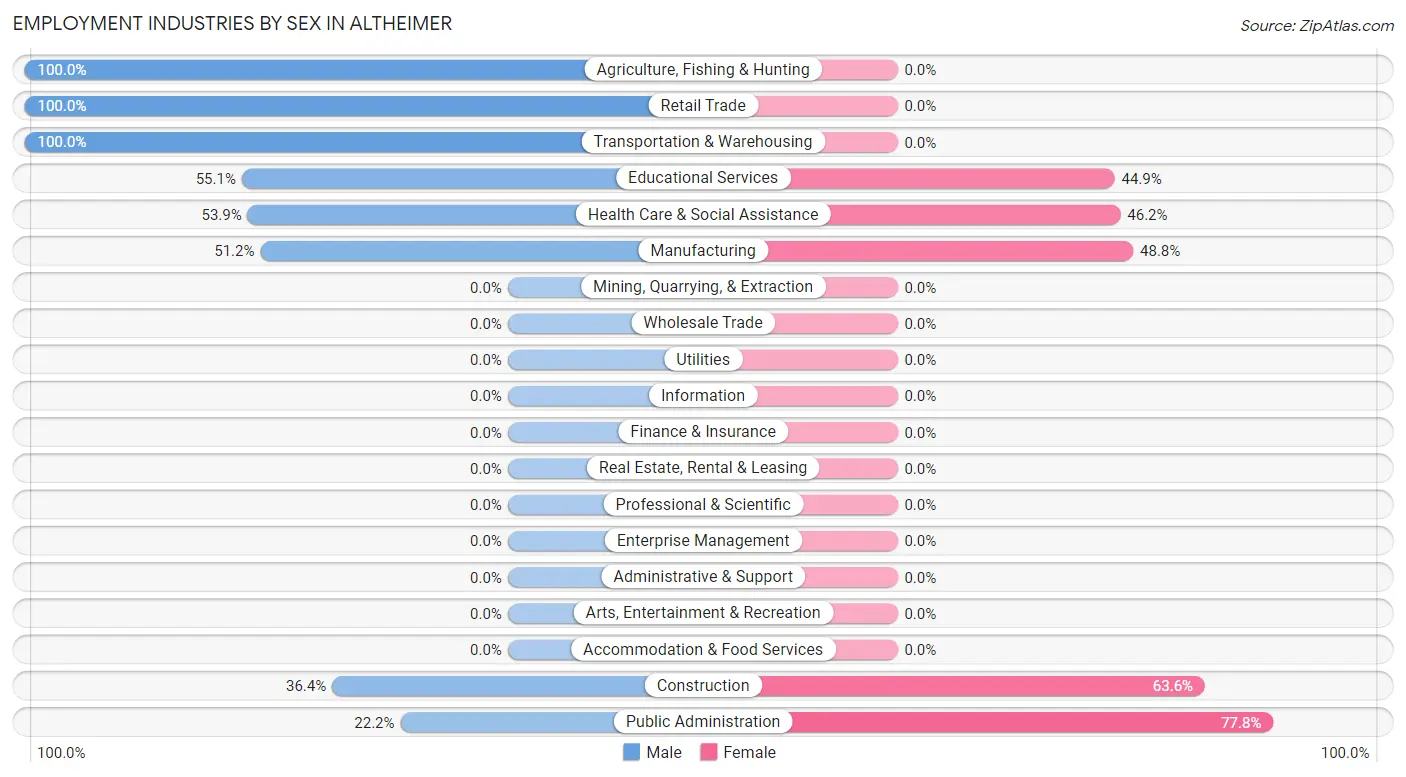
Employment Industries by Sex in Altheimer
The Altheimer industries that see more men than women are Agriculture, Fishing & Hunting (100.0%), Retail Trade (100.0%), and Transportation & Warehousing (100.0%), whereas the industries that tend to have a higher number of women are Public Administration (77.8%), Construction (63.6%), and Manufacturing (48.8%).
| Industry | Male | Female |
| Agriculture, Fishing & Hunting | 3 (100.0%) | 0 (0.0%) |
| Mining, Quarrying, & Extraction | 0 (0.0%) | 0 (0.0%) |
| Construction | 4 (36.4%) | 7 (63.6%) |
| Manufacturing | 21 (51.2%) | 20 (48.8%) |
| Wholesale Trade | 0 (0.0%) | 0 (0.0%) |
| Retail Trade | 23 (100.0%) | 0 (0.0%) |
| Transportation & Warehousing | 2 (100.0%) | 0 (0.0%) |
| Utilities | 0 (0.0%) | 0 (0.0%) |
| Information | 0 (0.0%) | 0 (0.0%) |
| Finance & Insurance | 0 (0.0%) | 0 (0.0%) |
| Real Estate, Rental & Leasing | 0 (0.0%) | 0 (0.0%) |
| Professional & Scientific | 0 (0.0%) | 0 (0.0%) |
| Enterprise Management | 0 (0.0%) | 0 (0.0%) |
| Administrative & Support | 0 (0.0%) | 0 (0.0%) |
| Educational Services | 49 (55.1%) | 40 (44.9%) |
| Health Care & Social Assistance | 7 (53.8%) | 6 (46.2%) |
| Arts, Entertainment & Recreation | 0 (0.0%) | 0 (0.0%) |
| Accommodation & Food Services | 0 (0.0%) | 0 (0.0%) |
| Public Administration | 6 (22.2%) | 21 (77.8%) |
| Total | 115 (55.0%) | 94 (45.0%) |
Education in Altheimer
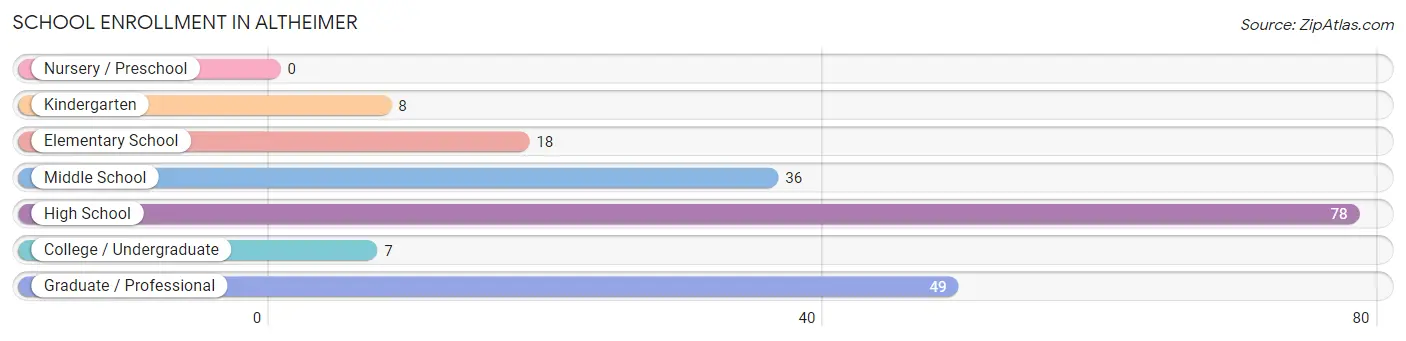
School Enrollment in Altheimer
The most common levels of schooling among the 196 students in Altheimer are high school (78 | 39.8%), graduate / professional (49 | 25.0%), and middle school (36 | 18.4%).
| School Level | # Students | % Students |
| Nursery / Preschool | 0 | 0.0% |
| Kindergarten | 8 | 4.1% |
| Elementary School | 18 | 9.2% |
| Middle School | 36 | 18.4% |
| High School | 78 | 39.8% |
| College / Undergraduate | 7 | 3.6% |
| Graduate / Professional | 49 | 25.0% |
| Total | 196 | 100.0% |
School Enrollment by Age by Funding Source in Altheimer
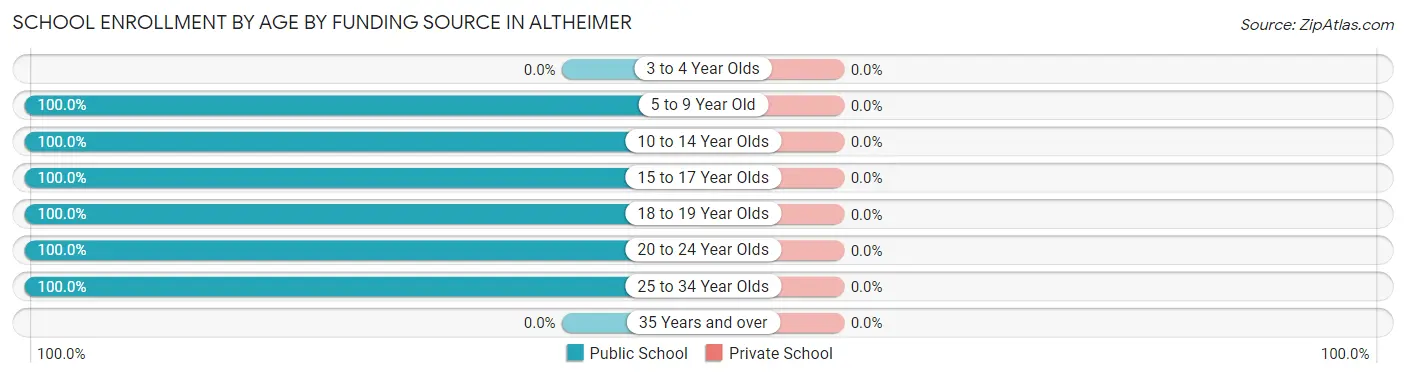
| Age Bracket | Public School | Private School |
| 3 to 4 Year Olds | 0 (0.0%) | 0 (0.0%) |
| 5 to 9 Year Old | 13 (100.0%) | 0 (0.0%) |
| 10 to 14 Year Olds | 49 (100.0%) | 0 (0.0%) |
| 15 to 17 Year Olds | 41 (100.0%) | 0 (0.0%) |
| 18 to 19 Year Olds | 37 (100.0%) | 0 (0.0%) |
| 20 to 24 Year Olds | 7 (100.0%) | 0 (0.0%) |
| 25 to 34 Year Olds | 49 (100.0%) | 0 (0.0%) |
| 35 Years and over | 0 (0.0%) | 0 (0.0%) |
| Total | 196 (100.0%) | 0 (0.0%) |
Educational Attainment by Field of Study in Altheimer
Arts & humanities (55 | 53.9%), business (32 | 31.4%), physical & health sciences (10 | 9.8%), and liberal arts & history (5 | 4.9%) are the most common fields of study among 102 individuals in Altheimer who have obtained a bachelor's degree or higher.
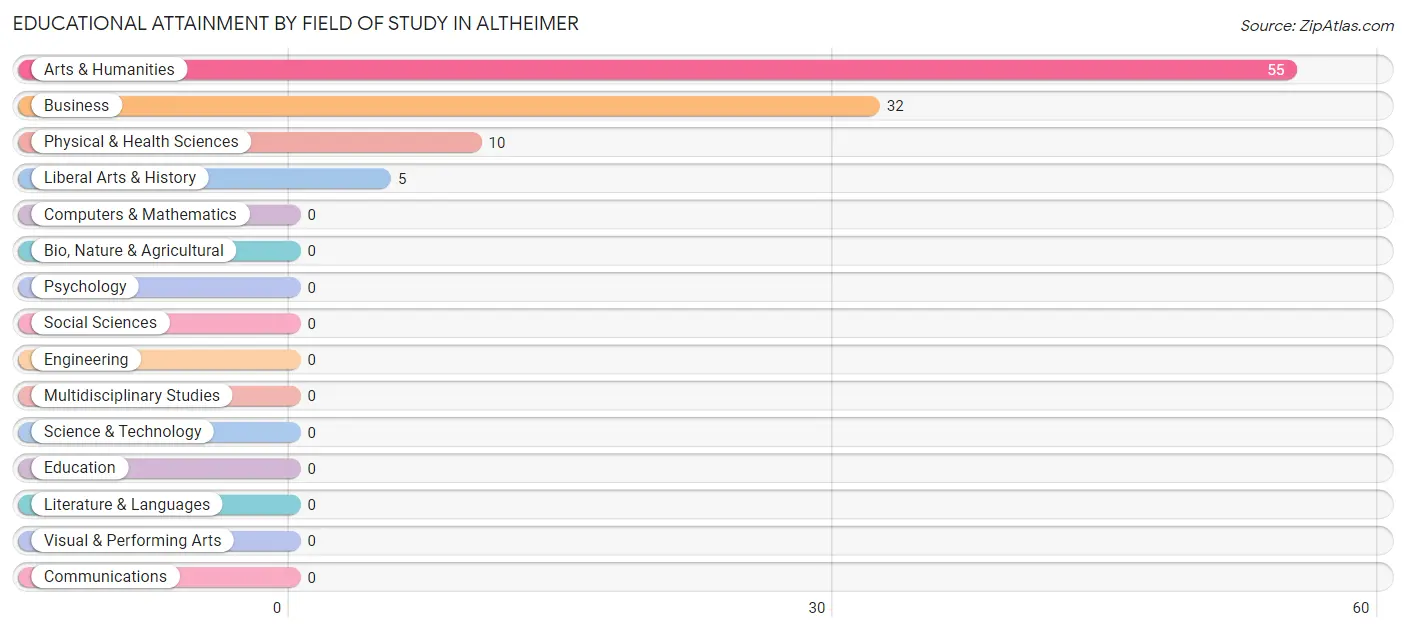
| Field of Study | # Graduates | % Graduates |
| Computers & Mathematics | 0 | 0.0% |
| Bio, Nature & Agricultural | 0 | 0.0% |
| Physical & Health Sciences | 10 | 9.8% |
| Psychology | 0 | 0.0% |
| Social Sciences | 0 | 0.0% |
| Engineering | 0 | 0.0% |
| Multidisciplinary Studies | 0 | 0.0% |
| Science & Technology | 0 | 0.0% |
| Business | 32 | 31.4% |
| Education | 0 | 0.0% |
| Literature & Languages | 0 | 0.0% |
| Liberal Arts & History | 5 | 4.9% |
| Visual & Performing Arts | 0 | 0.0% |
| Communications | 0 | 0.0% |
| Arts & Humanities | 55 | 53.9% |
| Total | 102 | 100.0% |
Transportation & Commute in Altheimer
Vehicle Availability by Sex in Altheimer
The most prevalent vehicle ownership categories in Altheimer are males with 3 vehicles (58, accounting for 50.4%) and females with 3 vehicles (14, making up 66.7%).
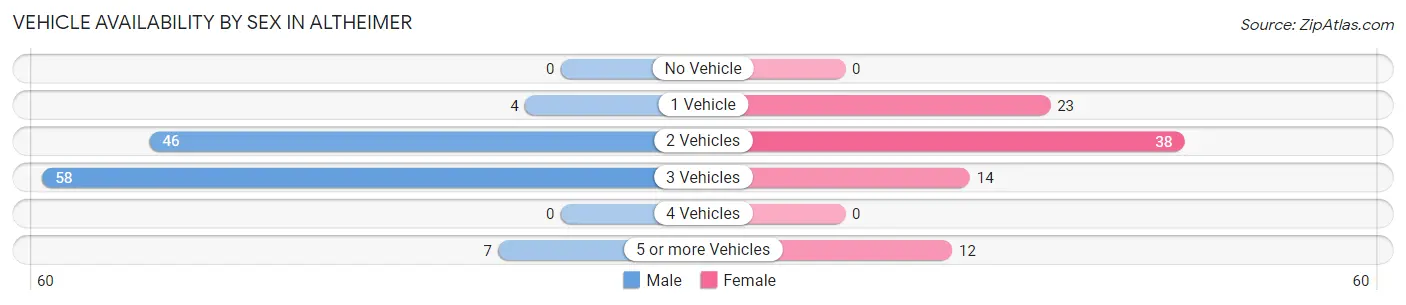
| Vehicles Available | Male | Female |
| No Vehicle | 0 (0.0%) | 0 (0.0%) |
| 1 Vehicle | 4 (3.5%) | 23 (26.4%) |
| 2 Vehicles | 46 (40.0%) | 38 (43.7%) |
| 3 Vehicles | 58 (50.4%) | 14 (16.1%) |
| 4 Vehicles | 0 (0.0%) | 0 (0.0%) |
| 5 or more Vehicles | 7 (6.1%) | 12 (13.8%) |
| Total | 115 (100.0%) | 87 (100.0%) |
Commute Time in Altheimer
The most frequently occuring commute durations in Altheimer are 90 or more minutes (49 commuters, 24.3%), 30 to 34 minutes (45 commuters, 22.3%), and 15 to 19 minutes (40 commuters, 19.8%).
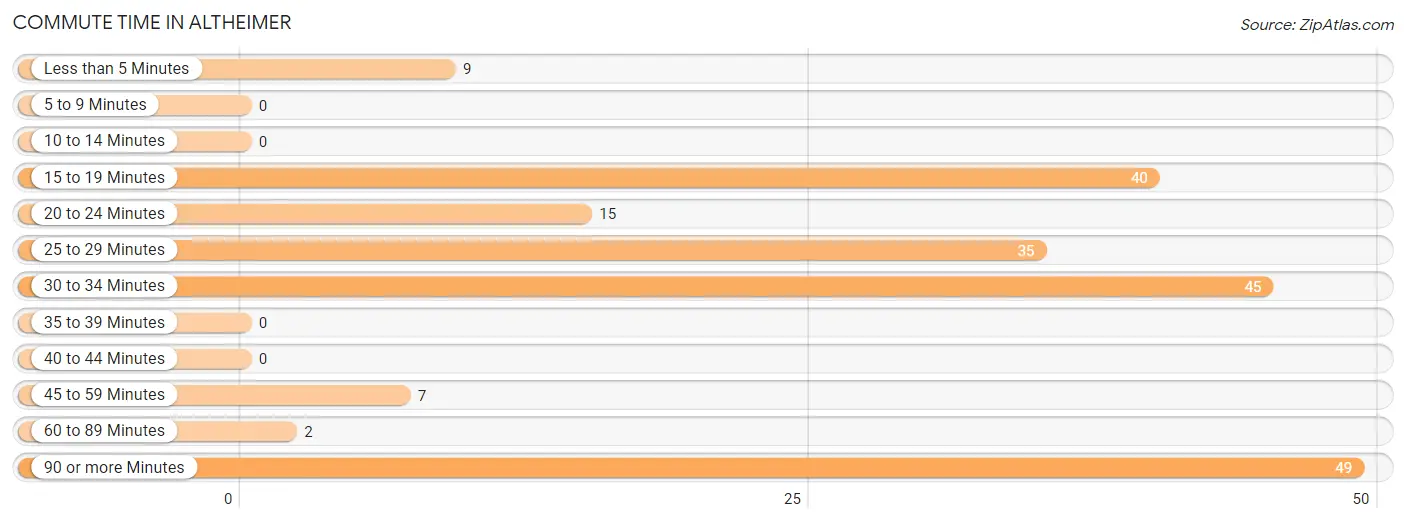
| Commute Time | # Commuters | % Commuters |
| Less than 5 Minutes | 9 | 4.5% |
| 5 to 9 Minutes | 0 | 0.0% |
| 10 to 14 Minutes | 0 | 0.0% |
| 15 to 19 Minutes | 40 | 19.8% |
| 20 to 24 Minutes | 15 | 7.4% |
| 25 to 29 Minutes | 35 | 17.3% |
| 30 to 34 Minutes | 45 | 22.3% |
| 35 to 39 Minutes | 0 | 0.0% |
| 40 to 44 Minutes | 0 | 0.0% |
| 45 to 59 Minutes | 7 | 3.5% |
| 60 to 89 Minutes | 2 | 1.0% |
| 90 or more Minutes | 49 | 24.3% |
Commute Time by Sex in Altheimer
The most common commute times in Altheimer are 90 or more minutes (49 commuters, 42.6%) for males and 30 to 34 minutes (31 commuters, 35.6%) for females.
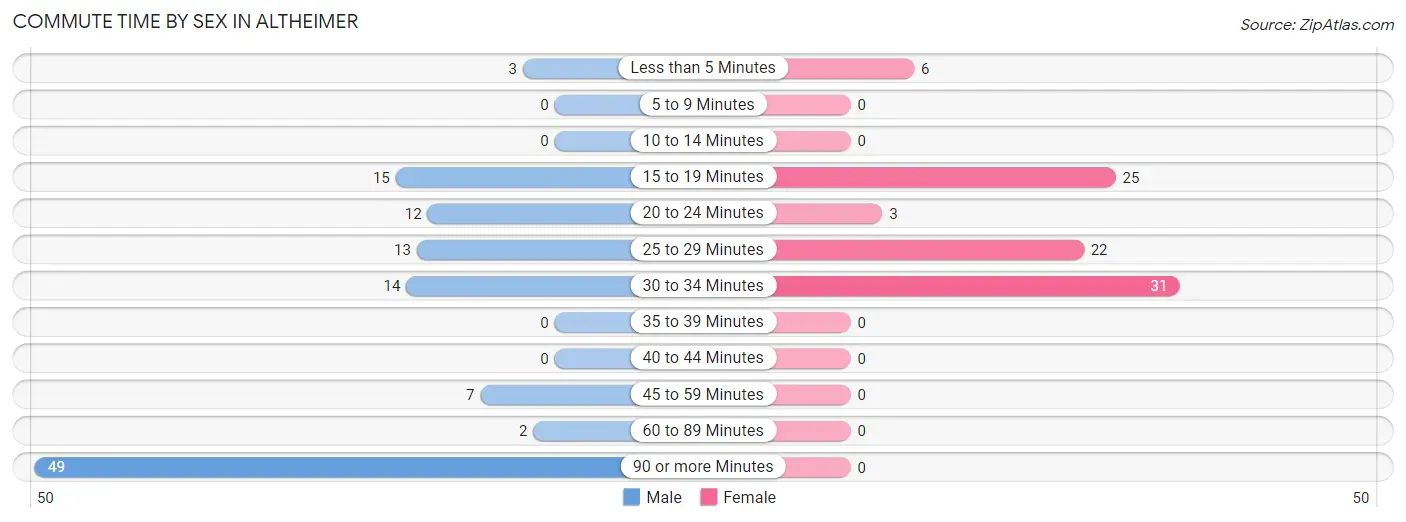
| Commute Time | Male | Female |
| Less than 5 Minutes | 3 (2.6%) | 6 (6.9%) |
| 5 to 9 Minutes | 0 (0.0%) | 0 (0.0%) |
| 10 to 14 Minutes | 0 (0.0%) | 0 (0.0%) |
| 15 to 19 Minutes | 15 (13.0%) | 25 (28.7%) |
| 20 to 24 Minutes | 12 (10.4%) | 3 (3.5%) |
| 25 to 29 Minutes | 13 (11.3%) | 22 (25.3%) |
| 30 to 34 Minutes | 14 (12.2%) | 31 (35.6%) |
| 35 to 39 Minutes | 0 (0.0%) | 0 (0.0%) |
| 40 to 44 Minutes | 0 (0.0%) | 0 (0.0%) |
| 45 to 59 Minutes | 7 (6.1%) | 0 (0.0%) |
| 60 to 89 Minutes | 2 (1.7%) | 0 (0.0%) |
| 90 or more Minutes | 49 (42.6%) | 0 (0.0%) |
Time of Departure to Work by Sex in Altheimer
The most frequent times of departure to work in Altheimer are 8:00 AM to 8:29 AM (51, 44.4%) for males and 7:30 AM to 7:59 AM (43, 49.4%) for females.
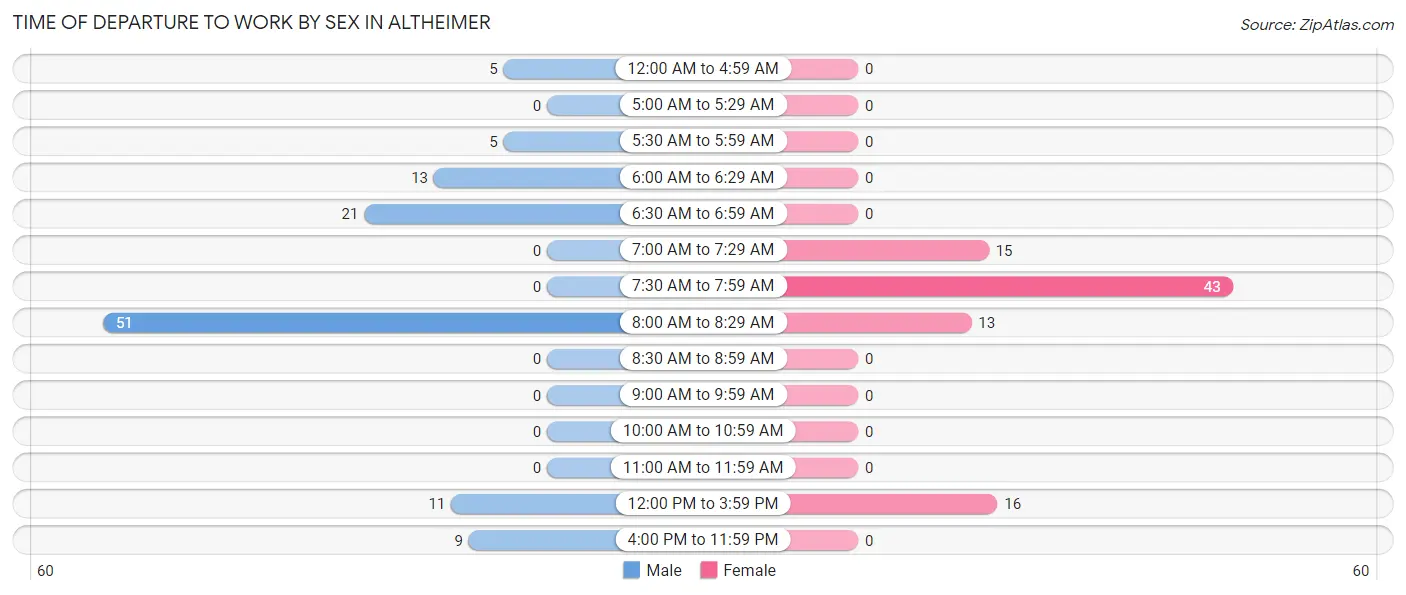
| Time of Departure | Male | Female |
| 12:00 AM to 4:59 AM | 5 (4.3%) | 0 (0.0%) |
| 5:00 AM to 5:29 AM | 0 (0.0%) | 0 (0.0%) |
| 5:30 AM to 5:59 AM | 5 (4.3%) | 0 (0.0%) |
| 6:00 AM to 6:29 AM | 13 (11.3%) | 0 (0.0%) |
| 6:30 AM to 6:59 AM | 21 (18.3%) | 0 (0.0%) |
| 7:00 AM to 7:29 AM | 0 (0.0%) | 15 (17.2%) |
| 7:30 AM to 7:59 AM | 0 (0.0%) | 43 (49.4%) |
| 8:00 AM to 8:29 AM | 51 (44.4%) | 13 (14.9%) |
| 8:30 AM to 8:59 AM | 0 (0.0%) | 0 (0.0%) |
| 9:00 AM to 9:59 AM | 0 (0.0%) | 0 (0.0%) |
| 10:00 AM to 10:59 AM | 0 (0.0%) | 0 (0.0%) |
| 11:00 AM to 11:59 AM | 0 (0.0%) | 0 (0.0%) |
| 12:00 PM to 3:59 PM | 11 (9.6%) | 16 (18.4%) |
| 4:00 PM to 11:59 PM | 9 (7.8%) | 0 (0.0%) |
| Total | 115 (100.0%) | 87 (100.0%) |
Housing Occupancy in Altheimer
Occupancy by Ownership in Altheimer
Of the total 198 dwellings in Altheimer, owner-occupied units account for 152 (76.8%), while renter-occupied units make up 46 (23.2%).
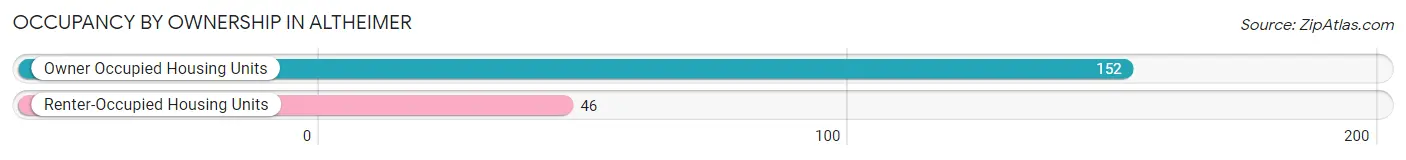
| Occupancy | # Housing Units | % Housing Units |
| Owner Occupied Housing Units | 152 | 76.8% |
| Renter-Occupied Housing Units | 46 | 23.2% |
| Total Occupied Housing Units | 198 | 100.0% |
Occupancy by Household Size in Altheimer
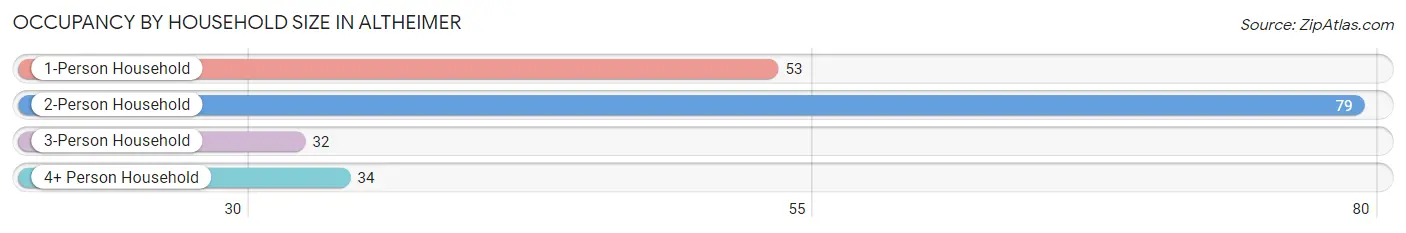
| Household Size | # Housing Units | % Housing Units |
| 1-Person Household | 53 | 26.8% |
| 2-Person Household | 79 | 39.9% |
| 3-Person Household | 32 | 16.2% |
| 4+ Person Household | 34 | 17.2% |
| Total Housing Units | 198 | 100.0% |
Occupancy by Ownership by Household Size in Altheimer
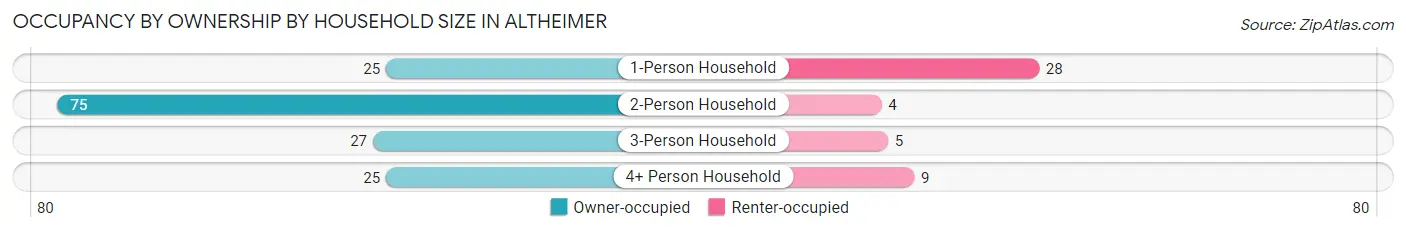
| Household Size | Owner-occupied | Renter-occupied |
| 1-Person Household | 25 (47.2%) | 28 (52.8%) |
| 2-Person Household | 75 (94.9%) | 4 (5.1%) |
| 3-Person Household | 27 (84.4%) | 5 (15.6%) |
| 4+ Person Household | 25 (73.5%) | 9 (26.5%) |
| Total Housing Units | 152 (76.8%) | 46 (23.2%) |
Occupancy by Educational Attainment in Altheimer
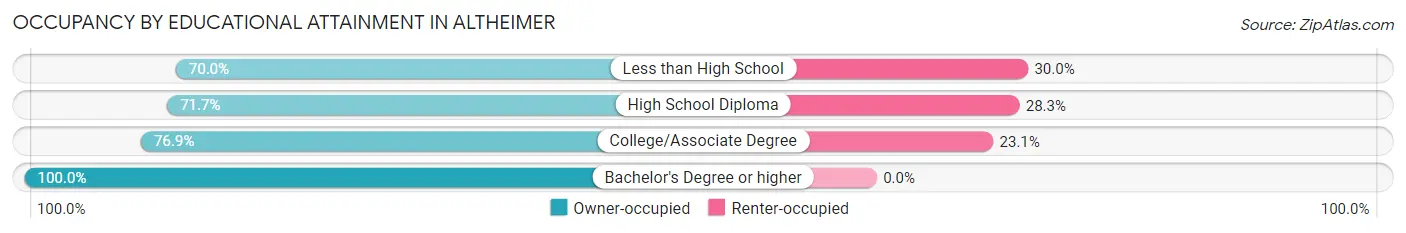
| Household Size | Owner-occupied | Renter-occupied |
| Less than High School | 14 (70.0%) | 6 (30.0%) |
| High School Diploma | 71 (71.7%) | 28 (28.3%) |
| College/Associate Degree | 40 (76.9%) | 12 (23.1%) |
| Bachelor's Degree or higher | 27 (100.0%) | 0 (0.0%) |
Occupancy by Age of Householder in Altheimer
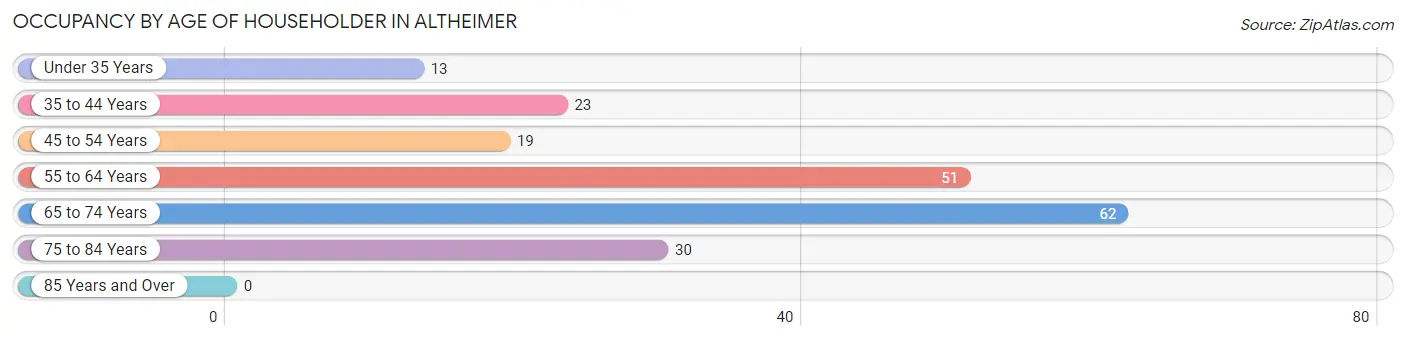
| Age Bracket | # Households | % Households |
| Under 35 Years | 13 | 6.6% |
| 35 to 44 Years | 23 | 11.6% |
| 45 to 54 Years | 19 | 9.6% |
| 55 to 64 Years | 51 | 25.8% |
| 65 to 74 Years | 62 | 31.3% |
| 75 to 84 Years | 30 | 15.1% |
| 85 Years and Over | 0 | 0.0% |
| Total | 198 | 100.0% |
Housing Finances in Altheimer
Median Income by Occupancy in Altheimer
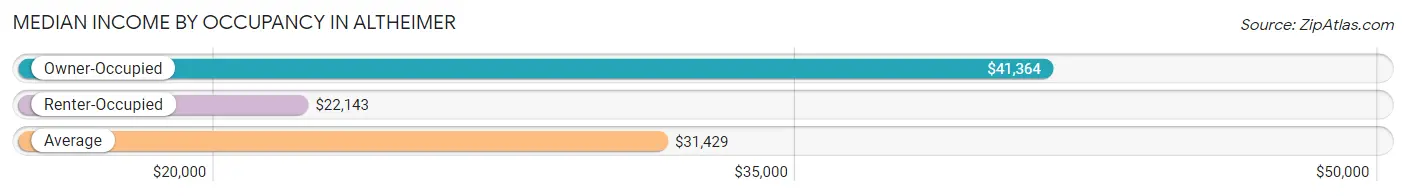
| Occupancy Type | # Households | Median Income |
| Owner-Occupied | 152 (76.8%) | $41,364 |
| Renter-Occupied | 46 (23.2%) | $22,143 |
| Average | 198 (100.0%) | $31,429 |
Occupancy by Householder Income Bracket in Altheimer
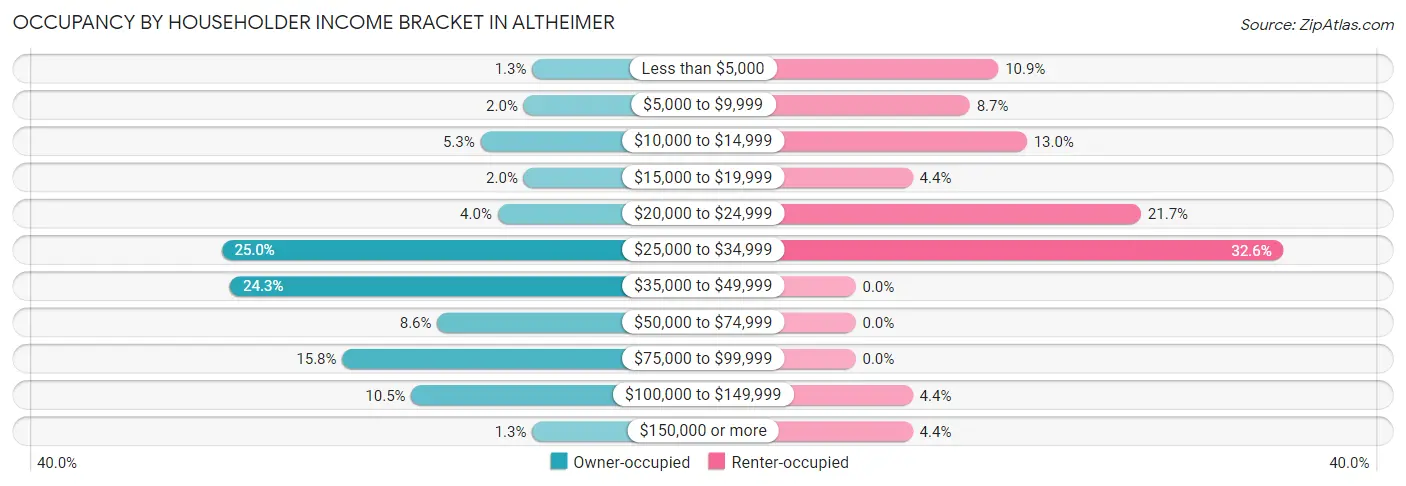
| Income Bracket | Owner-occupied | Renter-occupied |
| Less than $5,000 | 2 (1.3%) | 5 (10.9%) |
| $5,000 to $9,999 | 3 (2.0%) | 4 (8.7%) |
| $10,000 to $14,999 | 8 (5.3%) | 6 (13.0%) |
| $15,000 to $19,999 | 3 (2.0%) | 2 (4.3%) |
| $20,000 to $24,999 | 6 (4.0%) | 10 (21.7%) |
| $25,000 to $34,999 | 38 (25.0%) | 15 (32.6%) |
| $35,000 to $49,999 | 37 (24.3%) | 0 (0.0%) |
| $50,000 to $74,999 | 13 (8.6%) | 0 (0.0%) |
| $75,000 to $99,999 | 24 (15.8%) | 0 (0.0%) |
| $100,000 to $149,999 | 16 (10.5%) | 2 (4.3%) |
| $150,000 or more | 2 (1.3%) | 2 (4.3%) |
| Total | 152 (100.0%) | 46 (100.0%) |
Monthly Housing Cost Tiers in Altheimer
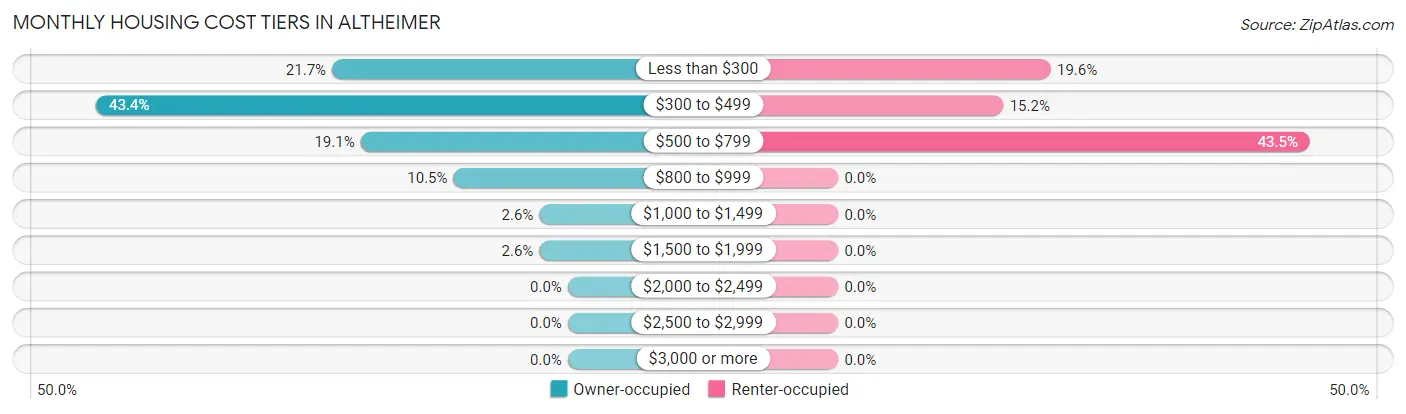
| Monthly Cost | Owner-occupied | Renter-occupied |
| Less than $300 | 33 (21.7%) | 9 (19.6%) |
| $300 to $499 | 66 (43.4%) | 7 (15.2%) |
| $500 to $799 | 29 (19.1%) | 20 (43.5%) |
| $800 to $999 | 16 (10.5%) | 0 (0.0%) |
| $1,000 to $1,499 | 4 (2.6%) | 0 (0.0%) |
| $1,500 to $1,999 | 4 (2.6%) | 0 (0.0%) |
| $2,000 to $2,499 | 0 (0.0%) | 0 (0.0%) |
| $2,500 to $2,999 | 0 (0.0%) | 0 (0.0%) |
| $3,000 or more | 0 (0.0%) | 0 (0.0%) |
| Total | 152 (100.0%) | 46 (100.0%) |
Physical Housing Characteristics in Altheimer
Housing Structures in Altheimer
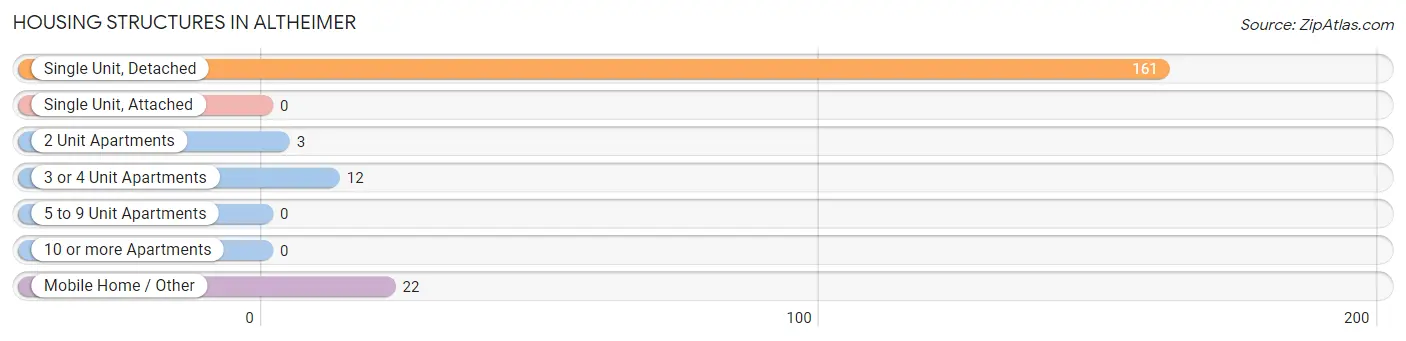
| Structure Type | # Housing Units | % Housing Units |
| Single Unit, Detached | 161 | 81.3% |
| Single Unit, Attached | 0 | 0.0% |
| 2 Unit Apartments | 3 | 1.5% |
| 3 or 4 Unit Apartments | 12 | 6.1% |
| 5 to 9 Unit Apartments | 0 | 0.0% |
| 10 or more Apartments | 0 | 0.0% |
| Mobile Home / Other | 22 | 11.1% |
| Total | 198 | 100.0% |
Housing Structures by Occupancy in Altheimer
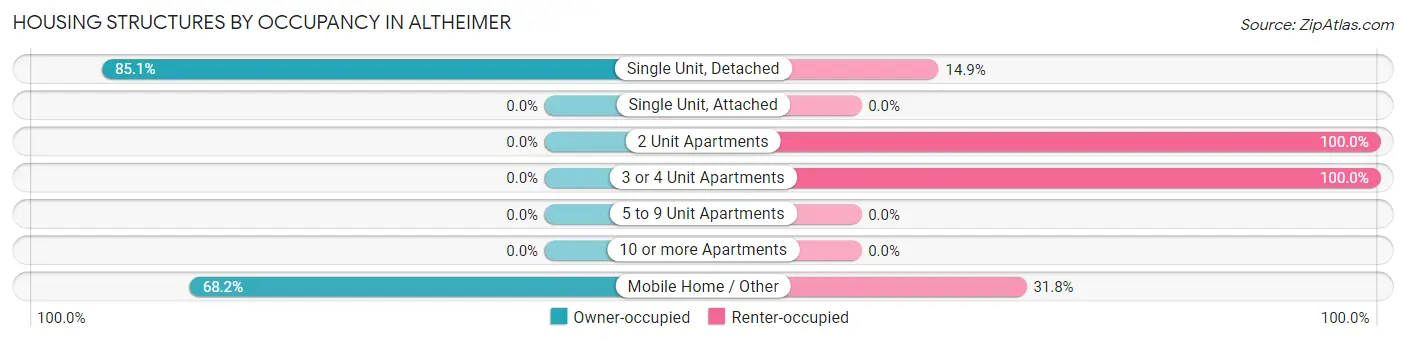
| Structure Type | Owner-occupied | Renter-occupied |
| Single Unit, Detached | 137 (85.1%) | 24 (14.9%) |
| Single Unit, Attached | 0 (0.0%) | 0 (0.0%) |
| 2 Unit Apartments | 0 (0.0%) | 3 (100.0%) |
| 3 or 4 Unit Apartments | 0 (0.0%) | 12 (100.0%) |
| 5 to 9 Unit Apartments | 0 (0.0%) | 0 (0.0%) |
| 10 or more Apartments | 0 (0.0%) | 0 (0.0%) |
| Mobile Home / Other | 15 (68.2%) | 7 (31.8%) |
| Total | 152 (76.8%) | 46 (23.2%) |
Housing Structures by Number of Rooms in Altheimer
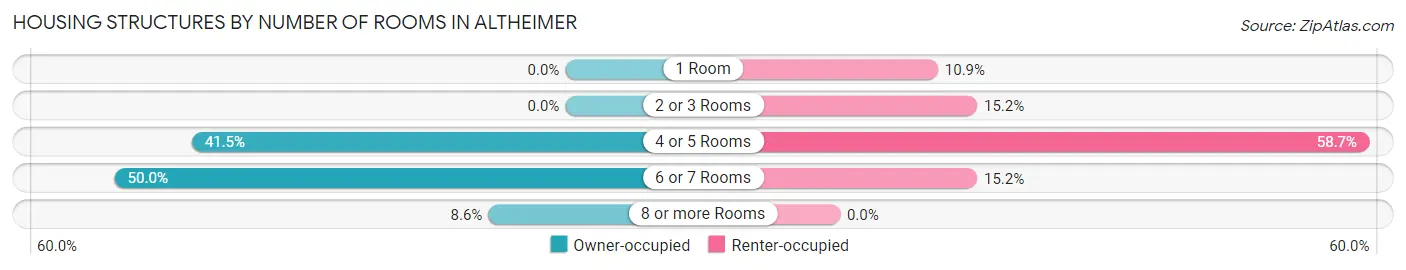
| Number of Rooms | Owner-occupied | Renter-occupied |
| 1 Room | 0 (0.0%) | 5 (10.9%) |
| 2 or 3 Rooms | 0 (0.0%) | 7 (15.2%) |
| 4 or 5 Rooms | 63 (41.4%) | 27 (58.7%) |
| 6 or 7 Rooms | 76 (50.0%) | 7 (15.2%) |
| 8 or more Rooms | 13 (8.6%) | 0 (0.0%) |
| Total | 152 (100.0%) | 46 (100.0%) |
Housing Structure by Heating Type in Altheimer
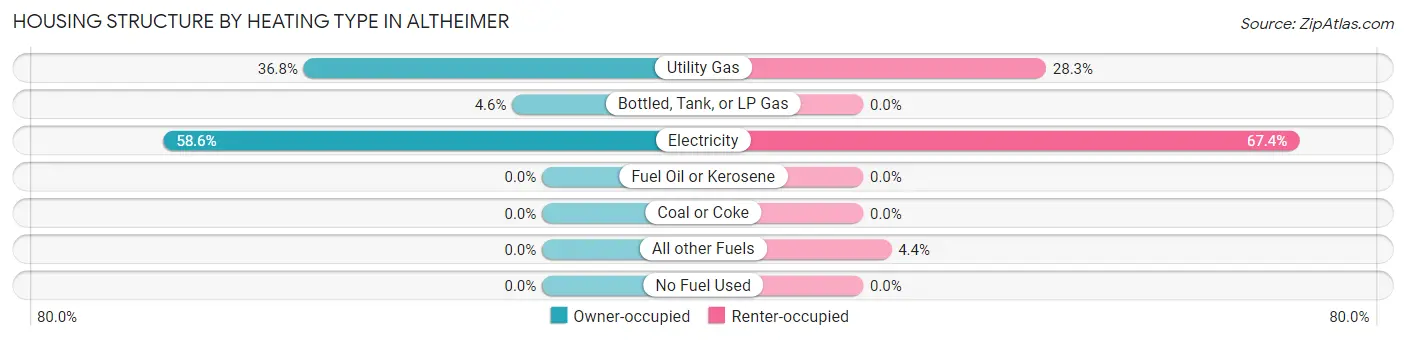
| Heating Type | Owner-occupied | Renter-occupied |
| Utility Gas | 56 (36.8%) | 13 (28.3%) |
| Bottled, Tank, or LP Gas | 7 (4.6%) | 0 (0.0%) |
| Electricity | 89 (58.6%) | 31 (67.4%) |
| Fuel Oil or Kerosene | 0 (0.0%) | 0 (0.0%) |
| Coal or Coke | 0 (0.0%) | 0 (0.0%) |
| All other Fuels | 0 (0.0%) | 2 (4.3%) |
| No Fuel Used | 0 (0.0%) | 0 (0.0%) |
| Total | 152 (100.0%) | 46 (100.0%) |
Household Vehicle Usage in Altheimer
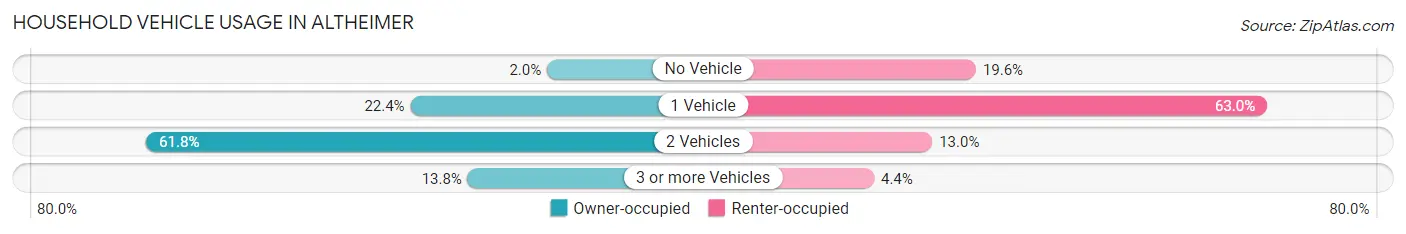
| Vehicles per Household | Owner-occupied | Renter-occupied |
| No Vehicle | 3 (2.0%) | 9 (19.6%) |
| 1 Vehicle | 34 (22.4%) | 29 (63.0%) |
| 2 Vehicles | 94 (61.8%) | 6 (13.0%) |
| 3 or more Vehicles | 21 (13.8%) | 2 (4.3%) |
| Total | 152 (100.0%) | 46 (100.0%) |
Real Estate & Mortgages in Altheimer
Real Estate and Mortgage Overview in Altheimer
| Characteristic | Without Mortgage | With Mortgage |
| Housing Units | 106 | 46 |
| Median Property Value | $58,300 | $110,700 |
| Median Household Income | $41,932 | $0 |
| Monthly Housing Costs | $370 | $0 |
| Real Estate Taxes | $374 | $0 |
Property Value by Mortgage Status in Altheimer
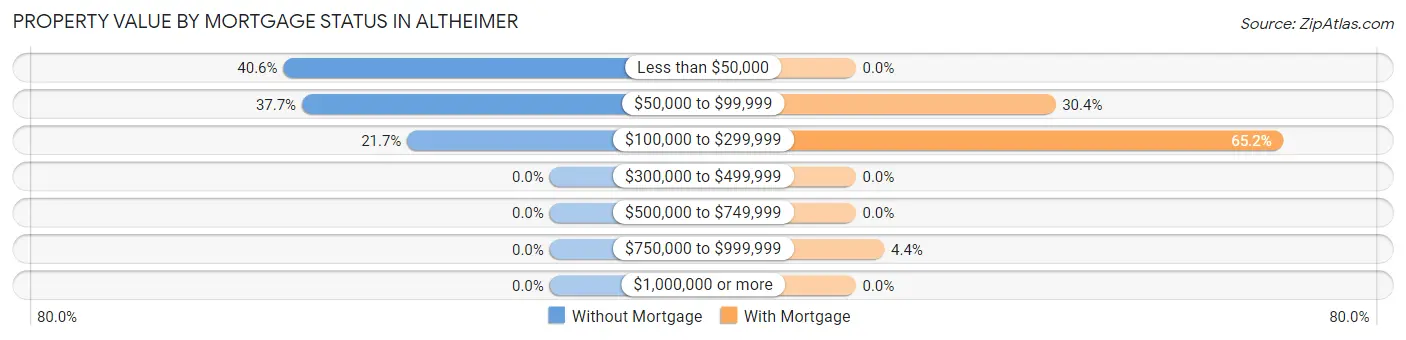
| Property Value | Without Mortgage | With Mortgage |
| Less than $50,000 | 43 (40.6%) | 0 (0.0%) |
| $50,000 to $99,999 | 40 (37.7%) | 14 (30.4%) |
| $100,000 to $299,999 | 23 (21.7%) | 30 (65.2%) |
| $300,000 to $499,999 | 0 (0.0%) | 0 (0.0%) |
| $500,000 to $749,999 | 0 (0.0%) | 0 (0.0%) |
| $750,000 to $999,999 | 0 (0.0%) | 2 (4.3%) |
| $1,000,000 or more | 0 (0.0%) | 0 (0.0%) |
| Total | 106 (100.0%) | 46 (100.0%) |
Household Income by Mortgage Status in Altheimer
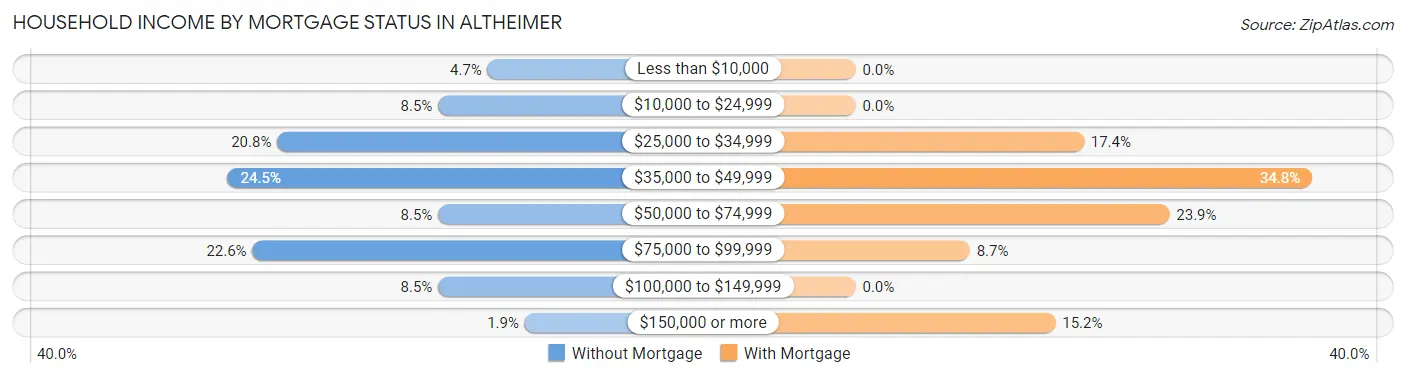
| Household Income | Without Mortgage | With Mortgage |
| Less than $10,000 | 5 (4.7%) | 0 (0.0%) |
| $10,000 to $24,999 | 9 (8.5%) | 0 (0.0%) |
| $25,000 to $34,999 | 22 (20.7%) | 8 (17.4%) |
| $35,000 to $49,999 | 26 (24.5%) | 16 (34.8%) |
| $50,000 to $74,999 | 9 (8.5%) | 11 (23.9%) |
| $75,000 to $99,999 | 24 (22.6%) | 4 (8.7%) |
| $100,000 to $149,999 | 9 (8.5%) | 0 (0.0%) |
| $150,000 or more | 2 (1.9%) | 7 (15.2%) |
| Total | 106 (100.0%) | 46 (100.0%) |
Property Value to Household Income Ratio in Altheimer
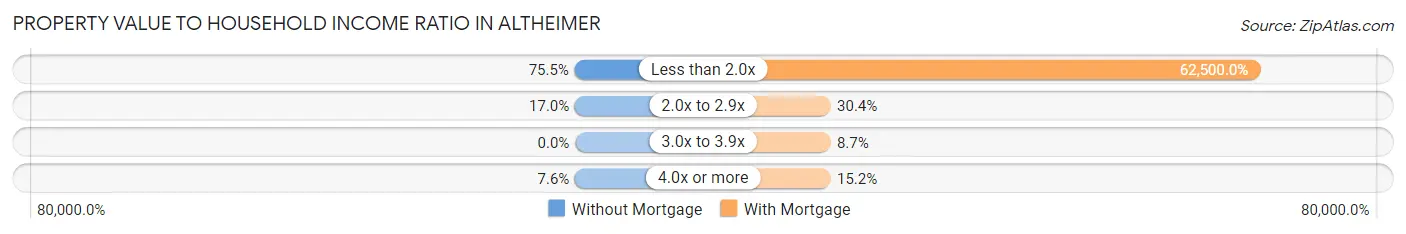
| Value-to-Income Ratio | Without Mortgage | With Mortgage |
| Less than 2.0x | 80 (75.5%) | 28,750 (62,500.0%) |
| 2.0x to 2.9x | 18 (17.0%) | 14 (30.4%) |
| 3.0x to 3.9x | 0 (0.0%) | 4 (8.7%) |
| 4.0x or more | 8 (7.5%) | 7 (15.2%) |
| Total | 106 (100.0%) | 46 (100.0%) |
Real Estate Taxes by Mortgage Status in Altheimer
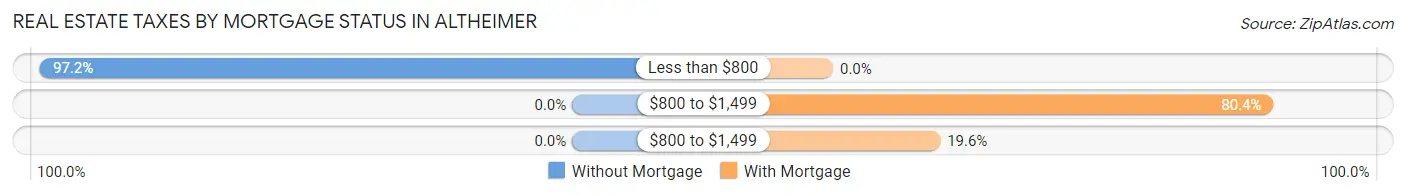
| Property Taxes | Without Mortgage | With Mortgage |
| Less than $800 | 103 (97.2%) | 0 (0.0%) |
| $800 to $1,499 | 0 (0.0%) | 37 (80.4%) |
| $800 to $1,499 | 0 (0.0%) | 9 (19.6%) |
| Total | 106 (100.0%) | 46 (100.0%) |
Health & Disability in Altheimer
Health Insurance Coverage by Age in Altheimer
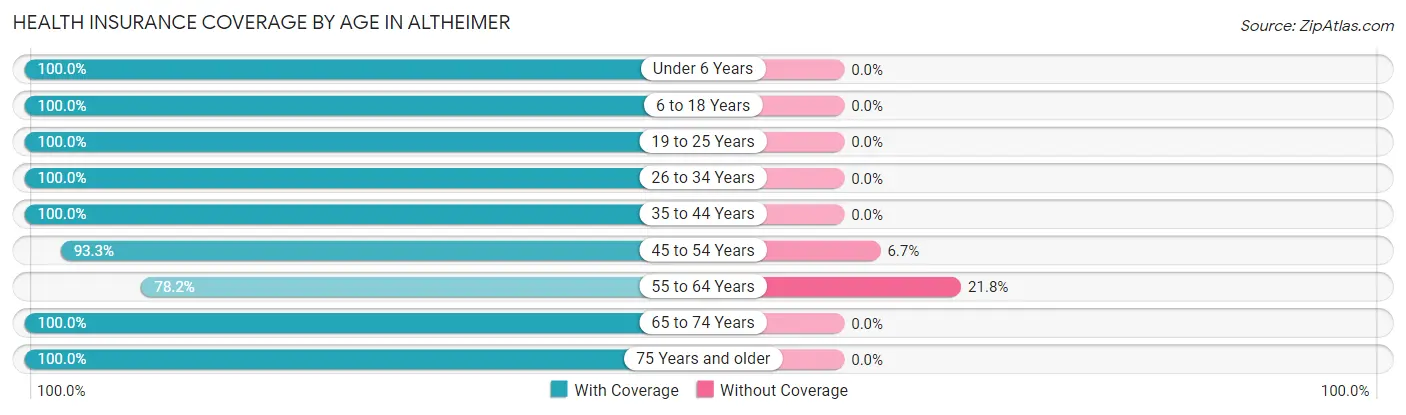
| Age Bracket | With Coverage | Without Coverage |
| Under 6 Years | 35 (100.0%) | 0 (0.0%) |
| 6 to 18 Years | 140 (100.0%) | 0 (0.0%) |
| 19 to 25 Years | 17 (100.0%) | 0 (0.0%) |
| 26 to 34 Years | 72 (100.0%) | 0 (0.0%) |
| 35 to 44 Years | 52 (100.0%) | 0 (0.0%) |
| 45 to 54 Years | 83 (93.3%) | 6 (6.7%) |
| 55 to 64 Years | 61 (78.2%) | 17 (21.8%) |
| 65 to 74 Years | 112 (100.0%) | 0 (0.0%) |
| 75 Years and older | 30 (100.0%) | 0 (0.0%) |
| Total | 602 (96.3%) | 23 (3.7%) |
Health Insurance Coverage by Citizenship Status in Altheimer
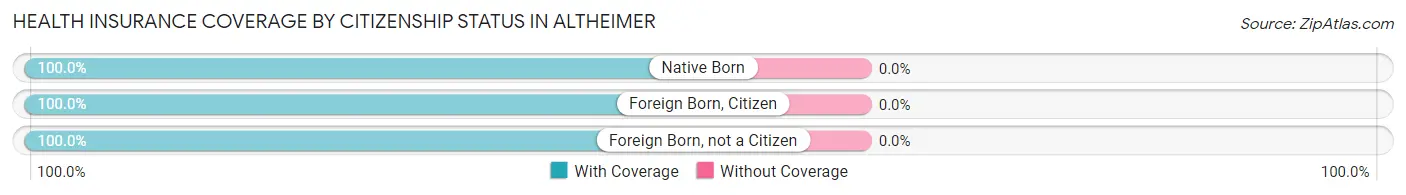
| Citizenship Status | With Coverage | Without Coverage |
| Native Born | 35 (100.0%) | 0 (0.0%) |
| Foreign Born, Citizen | 140 (100.0%) | 0 (0.0%) |
| Foreign Born, not a Citizen | 17 (100.0%) | 0 (0.0%) |
Health Insurance Coverage by Household Income in Altheimer
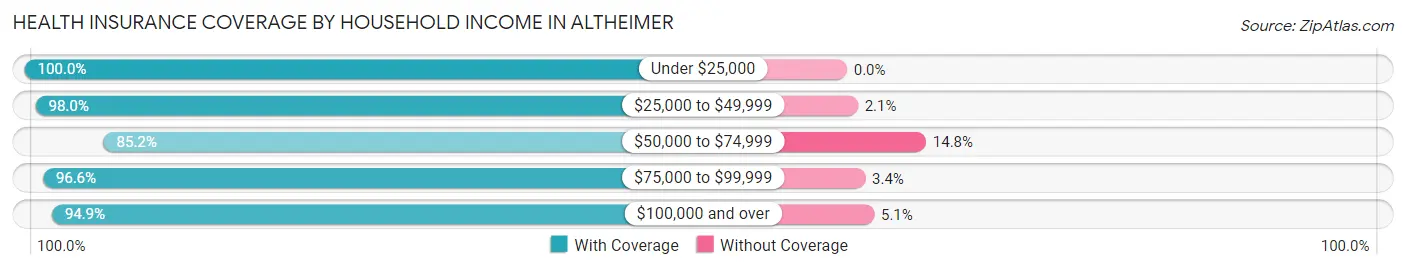
| Household Income | With Coverage | Without Coverage |
| Under $25,000 | 103 (100.0%) | 0 (0.0%) |
| $25,000 to $49,999 | 191 (98.0%) | 4 (2.1%) |
| $50,000 to $74,999 | 46 (85.2%) | 8 (14.8%) |
| $75,000 to $99,999 | 169 (96.6%) | 6 (3.4%) |
| $100,000 and over | 93 (94.9%) | 5 (5.1%) |
Public vs Private Health Insurance Coverage by Age in Altheimer
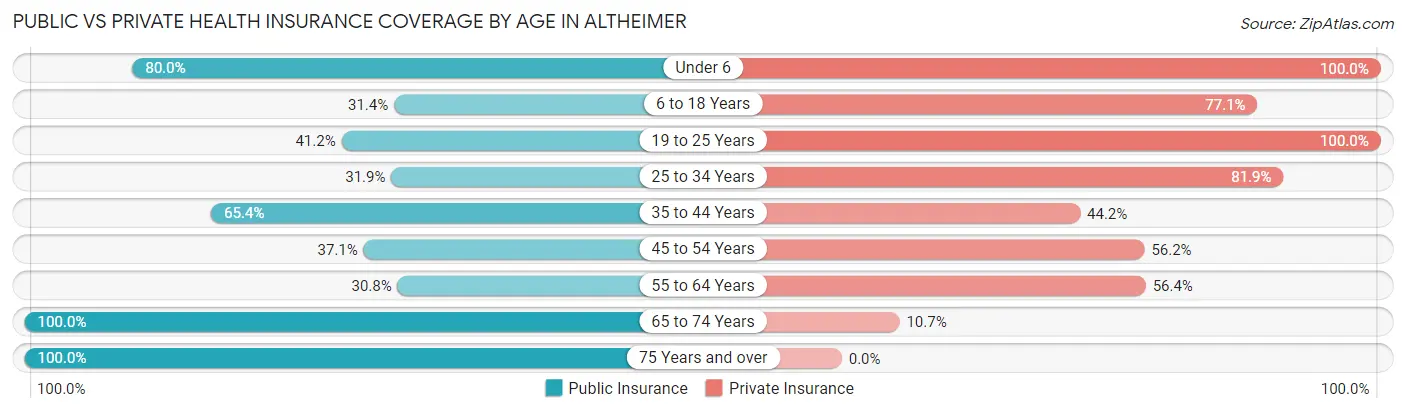
| Age Bracket | Public Insurance | Private Insurance |
| Under 6 | 28 (80.0%) | 35 (100.0%) |
| 6 to 18 Years | 44 (31.4%) | 108 (77.1%) |
| 19 to 25 Years | 7 (41.2%) | 17 (100.0%) |
| 25 to 34 Years | 23 (31.9%) | 59 (81.9%) |
| 35 to 44 Years | 34 (65.4%) | 23 (44.2%) |
| 45 to 54 Years | 33 (37.1%) | 50 (56.2%) |
| 55 to 64 Years | 24 (30.8%) | 44 (56.4%) |
| 65 to 74 Years | 112 (100.0%) | 12 (10.7%) |
| 75 Years and over | 30 (100.0%) | 0 (0.0%) |
| Total | 335 (53.6%) | 348 (55.7%) |
Disability Status by Sex by Age in Altheimer
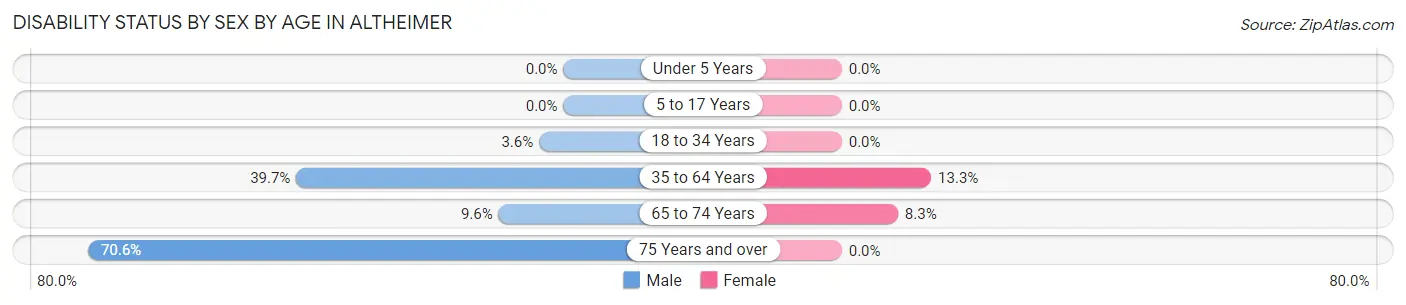
| Age Bracket | Male | Female |
| Under 5 Years | 0 (0.0%) | 0 (0.0%) |
| 5 to 17 Years | 0 (0.0%) | 0 (0.0%) |
| 18 to 34 Years | 3 (3.6%) | 0 (0.0%) |
| 35 to 64 Years | 48 (39.7%) | 13 (13.3%) |
| 65 to 74 Years | 5 (9.6%) | 5 (8.3%) |
| 75 Years and over | 12 (70.6%) | 0 (0.0%) |
Disability Class by Sex by Age in Altheimer
Disability Class: Hearing Difficulty
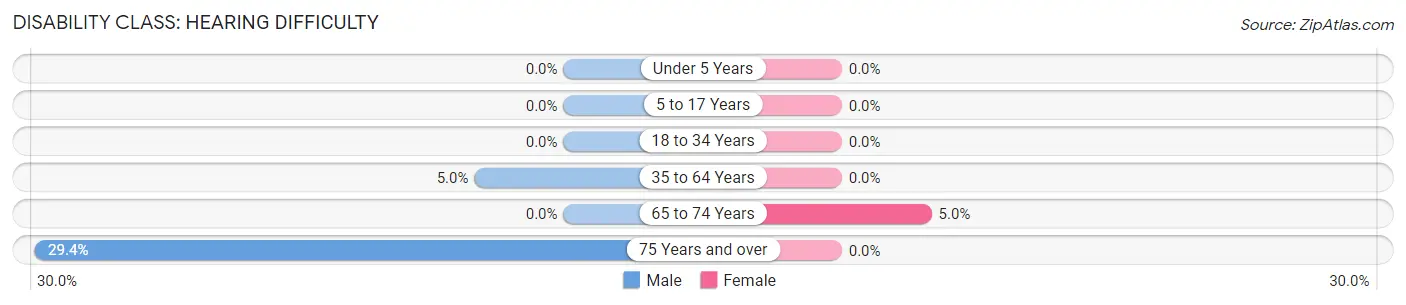
| Age Bracket | Male | Female |
| Under 5 Years | 0 (0.0%) | 0 (0.0%) |
| 5 to 17 Years | 0 (0.0%) | 0 (0.0%) |
| 18 to 34 Years | 0 (0.0%) | 0 (0.0%) |
| 35 to 64 Years | 6 (5.0%) | 0 (0.0%) |
| 65 to 74 Years | 0 (0.0%) | 3 (5.0%) |
| 75 Years and over | 5 (29.4%) | 0 (0.0%) |
Disability Class: Vision Difficulty
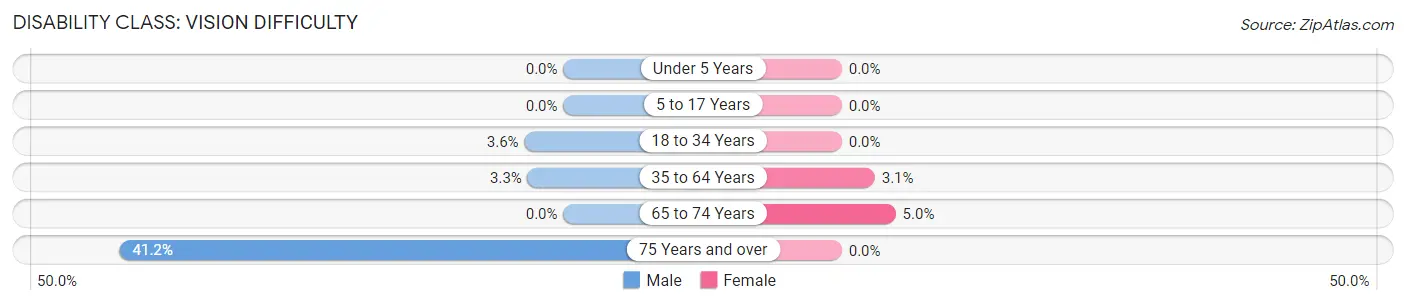
| Age Bracket | Male | Female |
| Under 5 Years | 0 (0.0%) | 0 (0.0%) |
| 5 to 17 Years | 0 (0.0%) | 0 (0.0%) |
| 18 to 34 Years | 3 (3.6%) | 0 (0.0%) |
| 35 to 64 Years | 4 (3.3%) | 3 (3.1%) |
| 65 to 74 Years | 0 (0.0%) | 3 (5.0%) |
| 75 Years and over | 7 (41.2%) | 0 (0.0%) |
Disability Class: Cognitive Difficulty
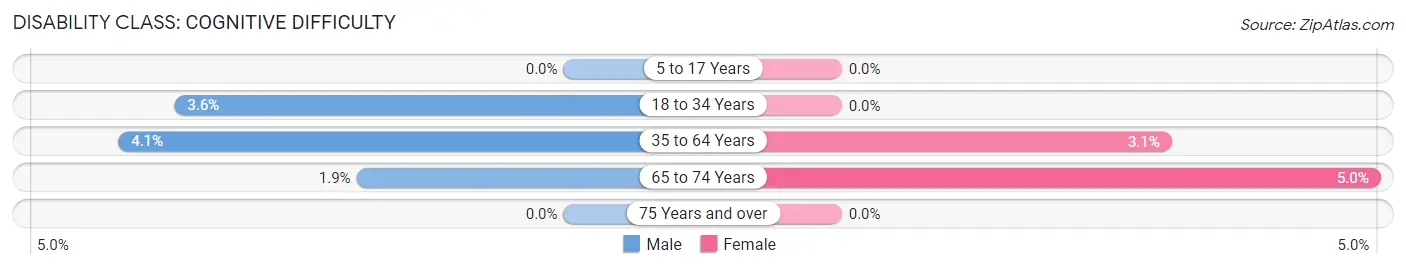
| Age Bracket | Male | Female |
| 5 to 17 Years | 0 (0.0%) | 0 (0.0%) |
| 18 to 34 Years | 3 (3.6%) | 0 (0.0%) |
| 35 to 64 Years | 5 (4.1%) | 3 (3.1%) |
| 65 to 74 Years | 1 (1.9%) | 3 (5.0%) |
| 75 Years and over | 0 (0.0%) | 0 (0.0%) |
Disability Class: Ambulatory Difficulty
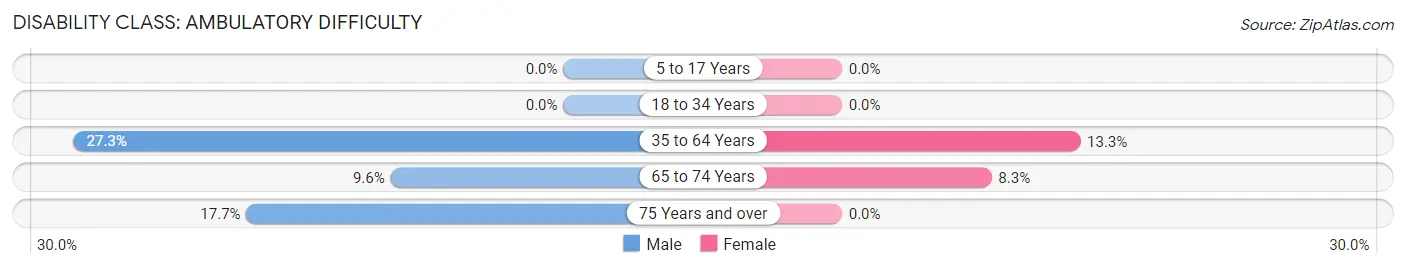
| Age Bracket | Male | Female |
| 5 to 17 Years | 0 (0.0%) | 0 (0.0%) |
| 18 to 34 Years | 0 (0.0%) | 0 (0.0%) |
| 35 to 64 Years | 33 (27.3%) | 13 (13.3%) |
| 65 to 74 Years | 5 (9.6%) | 5 (8.3%) |
| 75 Years and over | 3 (17.6%) | 0 (0.0%) |
Disability Class: Self-Care Difficulty
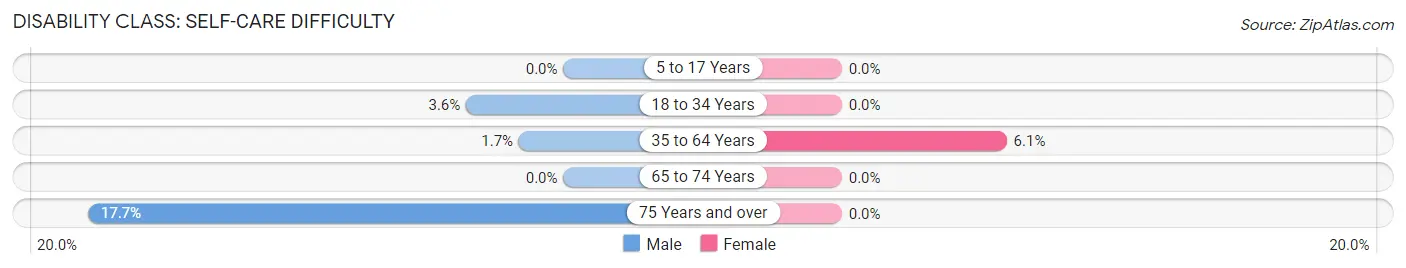
| Age Bracket | Male | Female |
| 5 to 17 Years | 0 (0.0%) | 0 (0.0%) |
| 18 to 34 Years | 3 (3.6%) | 0 (0.0%) |
| 35 to 64 Years | 2 (1.7%) | 6 (6.1%) |
| 65 to 74 Years | 0 (0.0%) | 0 (0.0%) |
| 75 Years and over | 3 (17.6%) | 0 (0.0%) |
Technology Access in Altheimer
Computing Device Access in Altheimer
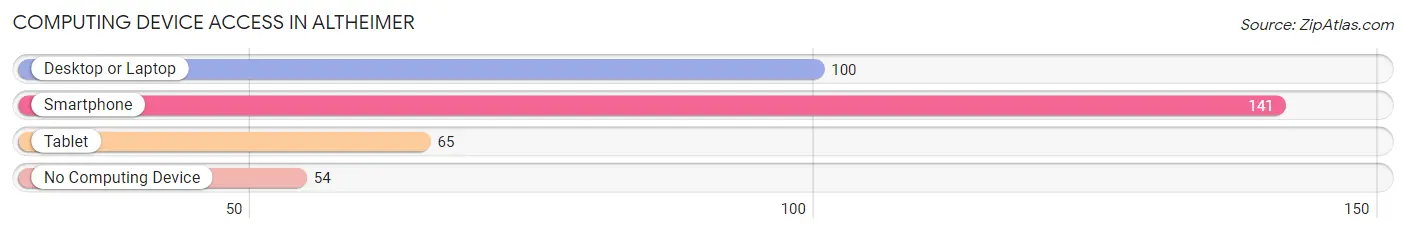
| Device Type | # Households | % Households |
| Desktop or Laptop | 100 | 50.5% |
| Smartphone | 141 | 71.2% |
| Tablet | 65 | 32.8% |
| No Computing Device | 54 | 27.3% |
| Total | 198 | 100.0% |
Internet Access in Altheimer
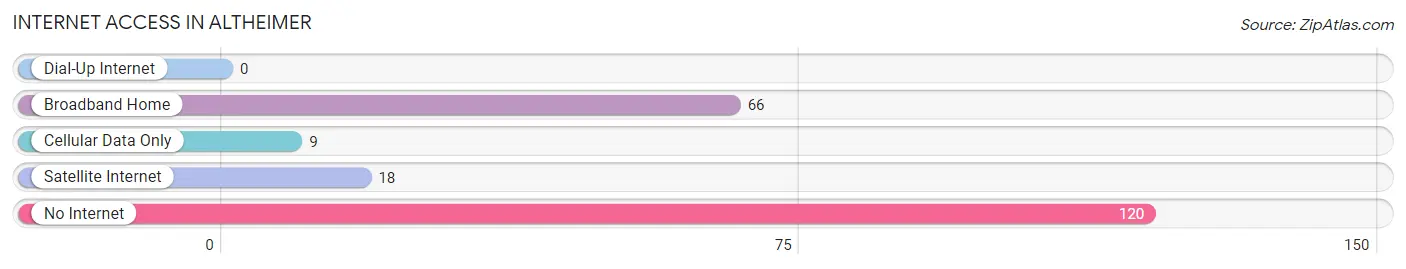
| Internet Type | # Households | % Households |
| Dial-Up Internet | 0 | 0.0% |
| Broadband Home | 66 | 33.3% |
| Cellular Data Only | 9 | 4.5% |
| Satellite Internet | 18 | 9.1% |
| No Internet | 120 | 60.6% |
| Total | 198 | 100.0% |
Altheimer Summary
Altheimer is a small town located in Jefferson County, Arkansas. It is situated on the banks of the White River, about 10 miles south of Pine Bluff. The town was founded in 1883 and incorporated in 1891. As of the 2010 census, the population of Altheimer was 1,026.
History
Altheimer was founded in 1883 by a group of settlers from the nearby town of Pine Bluff. The town was named after a local landowner, John Altheimer, who donated the land for the town. The first post office was established in 1884 and the first school was built in 1885.
In the early 1900s, Altheimer was a thriving agricultural community. Cotton was the main crop, and the town was home to several cotton gins and a cottonseed oil mill. The town also had a sawmill, a gristmill, and a brickyard.
In the 1920s, Altheimer began to experience a decline in population as many of its residents moved away in search of better economic opportunities. The Great Depression of the 1930s further exacerbated the town’s economic woes.
In the 1940s, Altheimer experienced a resurgence in population as many of its former residents returned to the area. The town also benefited from the construction of a new bridge across the White River, which allowed for increased trade and commerce.
In the 1950s, Altheimer experienced a period of growth and prosperity. The town was home to several businesses, including a grocery store, a hardware store, a drug store, and a movie theater.
In the 1960s, Altheimer began to experience a decline in population as many of its residents moved away in search of better economic opportunities. The town also suffered from the closure of several of its businesses.
In the 1970s, Altheimer experienced a period of revitalization as many of its former residents returned to the area. The town also benefited from the construction of a new bridge across the White River, which allowed for increased trade and commerce.
Geography
Altheimer is located in Jefferson County, Arkansas. It is situated on the banks of the White River, about 10 miles south of Pine Bluff. The town is located at the intersection of U.S. Highway 79 and Arkansas Highway 44.
The climate in Altheimer is humid subtropical, with hot, humid summers and mild winters. The average annual temperature is 64°F (18°C). The average annual precipitation is 48 inches (122 cm).
Economy
The economy of Altheimer is largely based on agriculture. Cotton is the main crop, and the town is home to several cotton gins and a cottonseed oil mill. The town also has a sawmill, a gristmill, and a brickyard.
Altheimer is also home to several small businesses, including a grocery store, a hardware store, a drug store, and a movie theater. The town is also home to a number of manufacturing companies, including a furniture factory and a plastics factory.
Demographics
As of the 2010 census, the population of Altheimer was 1,026. The racial makeup of the town was 79.3% African American, 19.2% White, 0.3% Native American, 0.2% Asian, and 0.9% from other races.
The median household income in Altheimer was $20,938, and the median family income was $25,625. The per capita income was $11,845. About 24.3% of the population was below the poverty line.
Common Questions
What is Per Capita Income in Altheimer?
Per Capita income in Altheimer is $20,371.
What is the Median Family Income in Altheimer?
Median Family Income in Altheimer is $41,875.
What is the Median Household income in Altheimer?
Median Household Income in Altheimer is $31,429.
What is Income or Wage Gap in Altheimer?
Income or Wage Gap in Altheimer is 36.1%.
Women in Altheimer earn 63.9 cents for every dollar earned by a man.
What is Family Income Deficit in Altheimer?
Family Income Deficit in Altheimer is $9,170.
Families that are below poverty line in Altheimer earn $9,170 less on average than the poverty threshold level.
What is Inequality or Gini Index in Altheimer?
Inequality or Gini Index in Altheimer is 0.41.
What is the Total Population of Altheimer?
Total Population of Altheimer is 625.
What is the Total Male Population of Altheimer?
Total Male Population of Altheimer is 368.
What is the Total Female Population of Altheimer?
Total Female Population of Altheimer is 257.
What is the Ratio of Males per 100 Females in Altheimer?
There are 143.19 Males per 100 Females in Altheimer.
What is the Ratio of Females per 100 Males in Altheimer?
There are 69.84 Females per 100 Males in Altheimer.
What is the Median Population Age in Altheimer?
Median Population Age in Altheimer is 44.3 Years.
What is the Average Family Size in Altheimer
Average Family Size in Altheimer is 4.0 People.
What is the Average Household Size in Altheimer
Average Household Size in Altheimer is 3.2 People.
How Large is the Labor Force in Altheimer?
There are 209 People in the Labor Forcein in Altheimer.
What is the Percentage of People in the Labor Force in Altheimer?
40.7% of People are in the Labor Force in Altheimer.