Alexander, AR Map & Demographics
Alexander Map
Alexander Overview
$23,665
PER CAPITA INCOME
$61,964
AVG FAMILY INCOME
$68,431
AVG HOUSEHOLD INCOME
2.8%
WAGE / INCOME GAP [ % ]
97.2¢/ $1
WAGE / INCOME GAP [ $ ]
0.35
INEQUALITY / GINI INDEX
3,444
TOTAL POPULATION
1,661
MALE POPULATION
1,783
FEMALE POPULATION
93.16
MALES / 100 FEMALES
107.34
FEMALES / 100 MALES
31.2
MEDIAN AGE
3.2
AVG FAMILY SIZE
2.9
AVG HOUSEHOLD SIZE
1,937
LABOR FORCE [ PEOPLE ]
73.1%
PERCENT IN LABOR FORCE
7.7%
UNEMPLOYMENT RATE
Alexander Zip Codes
Alexander Area Codes
Income in Alexander
Income Overview in Alexander
Per Capita Income in Alexander is $23,665, while median incomes of families and households are $61,964 and $68,431 respectively.
| Characteristic | Number | Measure |
| Per Capita Income | 3,444 | $23,665 |
| Median Family Income | 883 | $61,964 |
| Mean Family Income | 883 | $66,221 |
| Median Household Income | 1,199 | $68,431 |
| Mean Household Income | 1,199 | $64,680 |
| Income Deficit | 883 | $0 |
| Wage / Income Gap (%) | 3,444 | 2.83% |
| Wage / Income Gap ($) | 3,444 | 97.17¢ per $1 |
| Gini / Inequality Index | 3,444 | 0.35 |
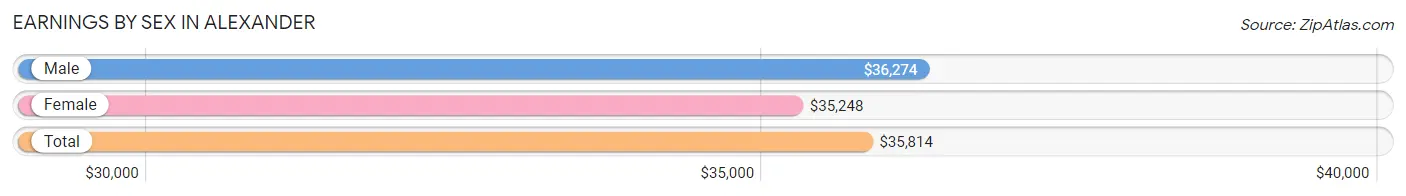
Earnings by Sex in Alexander
Average Earnings in Alexander are $35,814, $36,274 for men and $35,248 for women, a difference of 2.8%.
| Sex | Number | Average Earnings |
| Male | 876 (46.7%) | $36,274 |
| Female | 999 (53.3%) | $35,248 |
| Total | 1,875 (100.0%) | $35,814 |
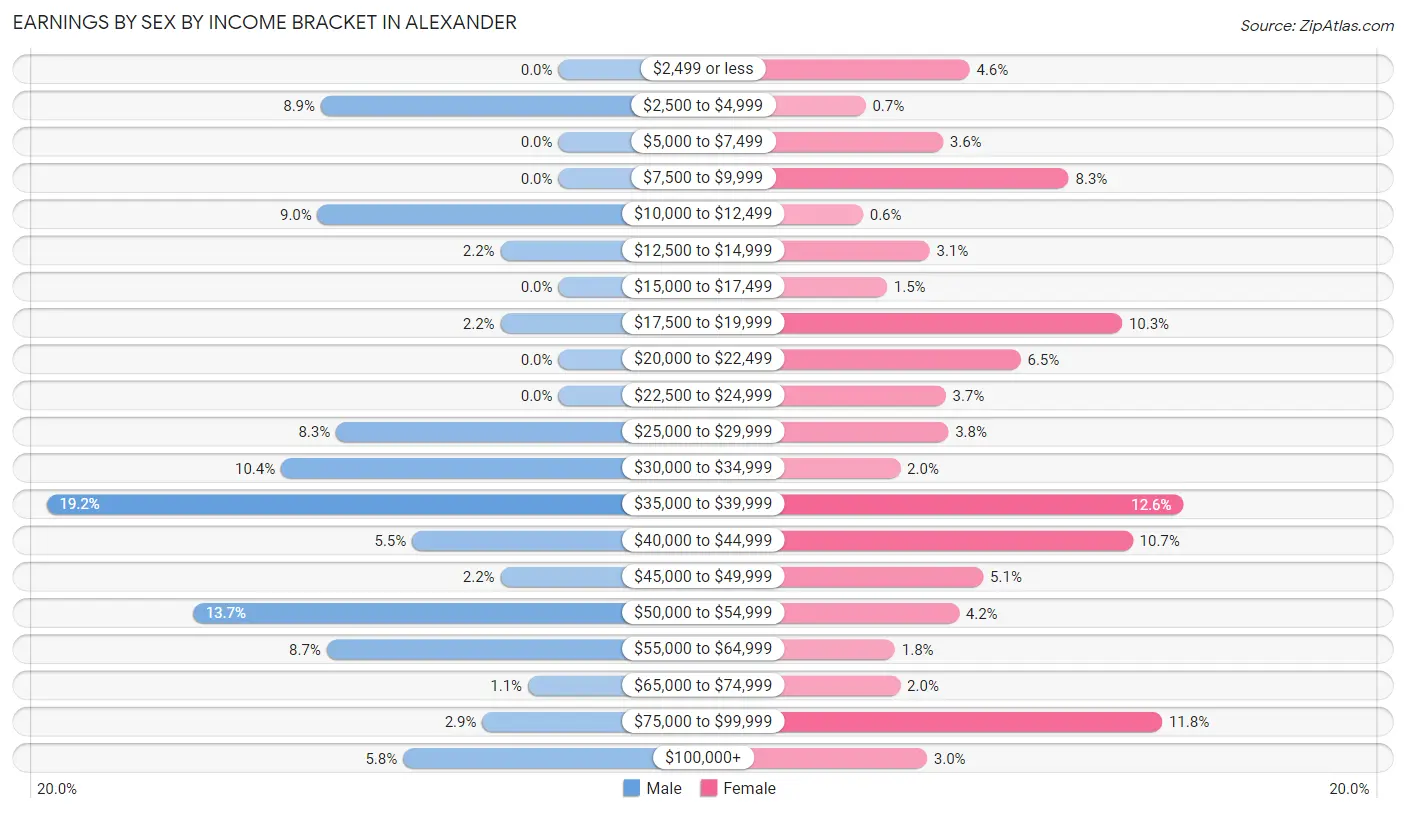
Earnings by Sex by Income Bracket in Alexander
The most common earnings brackets in Alexander are $35,000 to $39,999 for men (168 | 19.2%) and $35,000 to $39,999 for women (126 | 12.6%).
| Income | Male | Female |
| $2,499 or less | 0 (0.0%) | 46 (4.6%) |
| $2,500 to $4,999 | 78 (8.9%) | 7 (0.7%) |
| $5,000 to $7,499 | 0 (0.0%) | 36 (3.6%) |
| $7,500 to $9,999 | 0 (0.0%) | 83 (8.3%) |
| $10,000 to $12,499 | 79 (9.0%) | 6 (0.6%) |
| $12,500 to $14,999 | 19 (2.2%) | 31 (3.1%) |
| $15,000 to $17,499 | 0 (0.0%) | 15 (1.5%) |
| $17,500 to $19,999 | 19 (2.2%) | 103 (10.3%) |
| $20,000 to $22,499 | 0 (0.0%) | 65 (6.5%) |
| $22,500 to $24,999 | 0 (0.0%) | 37 (3.7%) |
| $25,000 to $29,999 | 73 (8.3%) | 38 (3.8%) |
| $30,000 to $34,999 | 91 (10.4%) | 20 (2.0%) |
| $35,000 to $39,999 | 168 (19.2%) | 126 (12.6%) |
| $40,000 to $44,999 | 48 (5.5%) | 107 (10.7%) |
| $45,000 to $49,999 | 19 (2.2%) | 51 (5.1%) |
| $50,000 to $54,999 | 120 (13.7%) | 42 (4.2%) |
| $55,000 to $64,999 | 76 (8.7%) | 18 (1.8%) |
| $65,000 to $74,999 | 10 (1.1%) | 20 (2.0%) |
| $75,000 to $99,999 | 25 (2.9%) | 118 (11.8%) |
| $100,000+ | 51 (5.8%) | 30 (3.0%) |
| Total | 876 (100.0%) | 999 (100.0%) |
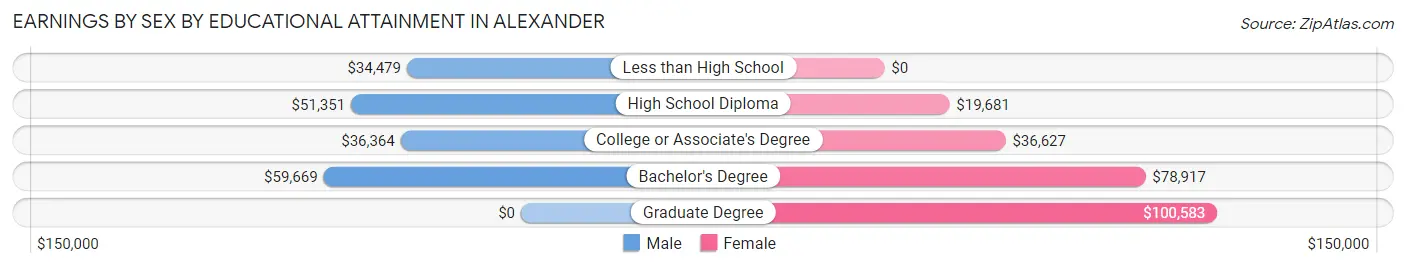
Earnings by Sex by Educational Attainment in Alexander
Average earnings in Alexander are $38,173 for men and $35,853 for women, a difference of 6.1%. Men with an educational attainment of bachelor's degree enjoy the highest average annual earnings of $59,669, while those with less than high school education earn the least with $34,479. Women with an educational attainment of graduate degree earn the most with the average annual earnings of $100,583, while those with high school diploma education have the smallest earnings of $19,681.
| Educational Attainment | Male Income | Female Income |
| Less than High School | $34,479 | $0 |
| High School Diploma | $51,351 | $19,681 |
| College or Associate's Degree | $36,364 | $36,627 |
| Bachelor's Degree | $59,669 | $78,917 |
| Graduate Degree | - | - |
| Total | $38,173 | $35,853 |
Family Income in Alexander
Family Income Brackets in Alexander
According to the Alexander family income data, there are 292 families falling into the $50,000 to $74,999 income range, which is the most common income bracket and makes up 33.1% of all families. Conversely, the $200,000+ income bracket is the least frequent group with only 16 families (1.8%) belonging to this category.
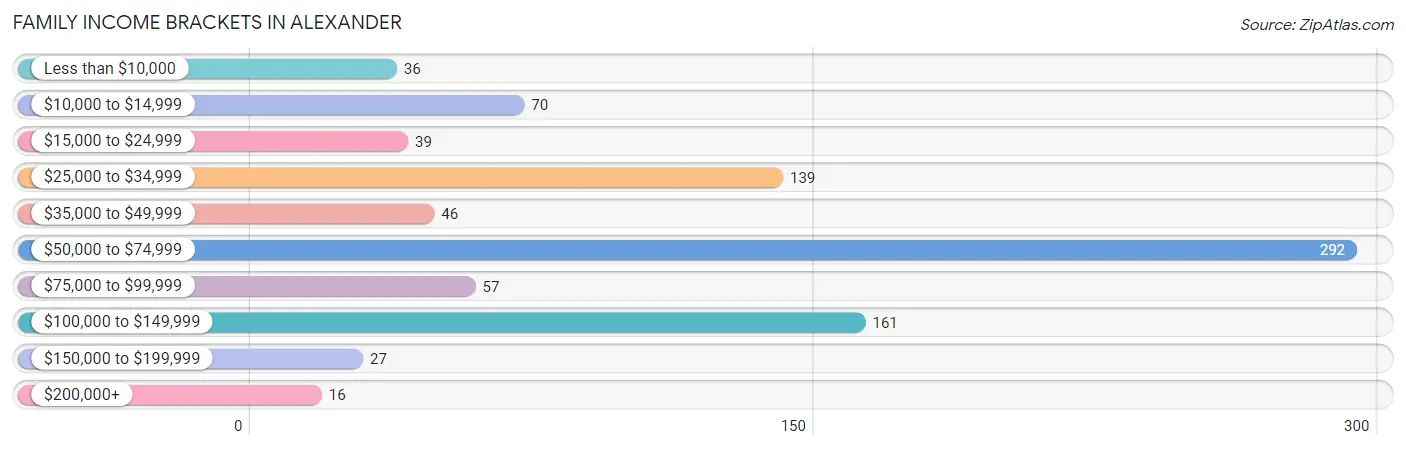
| Income Bracket | # Families | % Families |
| Less than $10,000 | 36 | 4.1% |
| $10,000 to $14,999 | 70 | 7.9% |
| $15,000 to $24,999 | 39 | 4.4% |
| $25,000 to $34,999 | 139 | 15.7% |
| $35,000 to $49,999 | 46 | 5.2% |
| $50,000 to $74,999 | 292 | 33.1% |
| $75,000 to $99,999 | 57 | 6.5% |
| $100,000 to $149,999 | 161 | 18.2% |
| $150,000 to $199,999 | 27 | 3.1% |
| $200,000+ | 16 | 1.8% |
Family Income by Famaliy Size in Alexander
4-person families (247 | 28.0%) account for the highest median family income in Alexander with $71,966 per family, while 2-person families (334 | 37.8%) have the highest median income of $30,238 per family member.
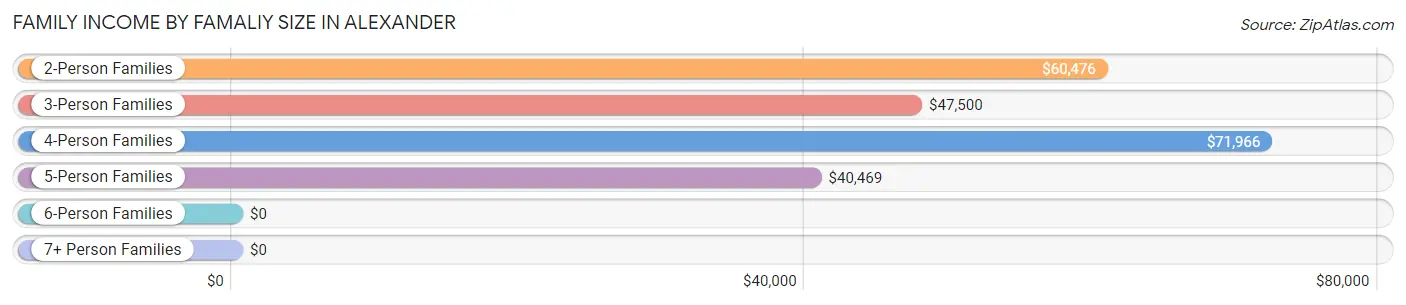
| Income Bracket | # Families | Median Income |
| 2-Person Families | 334 (37.8%) | $60,476 |
| 3-Person Families | 226 (25.6%) | $47,500 |
| 4-Person Families | 247 (28.0%) | $71,966 |
| 5-Person Families | 57 (6.5%) | $40,469 |
| 6-Person Families | 19 (2.1%) | $0 |
| 7+ Person Families | 0 (0.0%) | $0 |
| Total | 883 (100.0%) | $61,964 |
Family Income by Number of Earners in Alexander
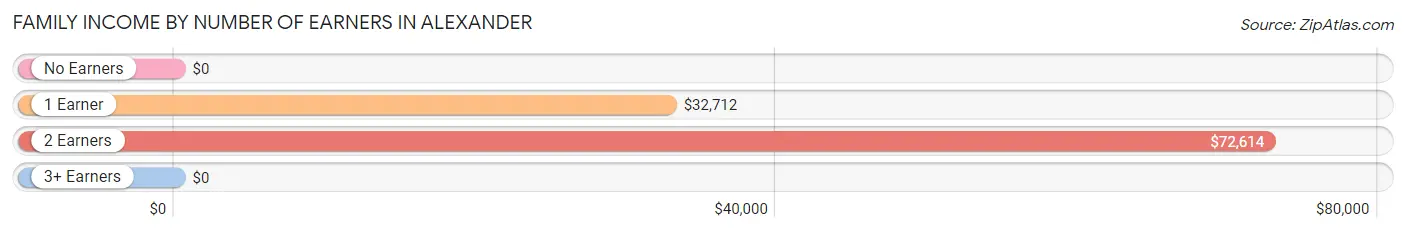
| Number of Earners | # Families | Median Income |
| No Earners | 62 (7.0%) | $0 |
| 1 Earner | 281 (31.8%) | $32,712 |
| 2 Earners | 539 (61.0%) | $72,614 |
| 3+ Earners | 1 (0.1%) | $0 |
| Total | 883 (100.0%) | $61,964 |
Household Income in Alexander
Household Income Brackets in Alexander
With 329 households falling in the category, the $50,000 to $74,999 income range is the most frequent in Alexander, accounting for 27.4% of all households. In contrast, only 24 households (2.0%) fall into the $200,000+ income bracket, making it the least populous group.
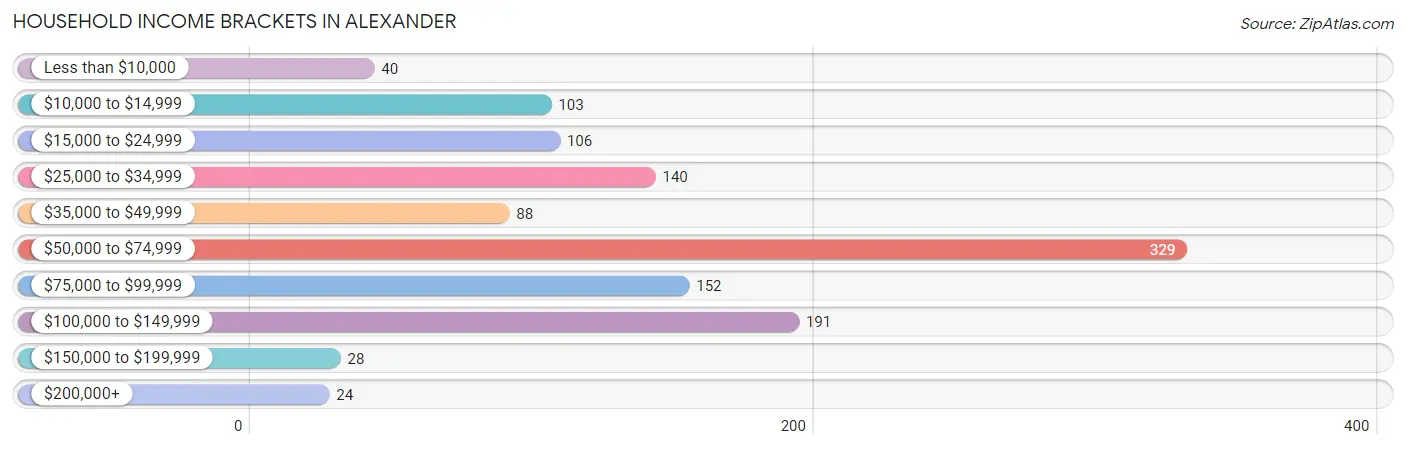
| Income Bracket | # Households | % Households |
| Less than $10,000 | 40 | 3.3% |
| $10,000 to $14,999 | 103 | 8.6% |
| $15,000 to $24,999 | 106 | 8.8% |
| $25,000 to $34,999 | 140 | 11.7% |
| $35,000 to $49,999 | 88 | 7.3% |
| $50,000 to $74,999 | 329 | 27.4% |
| $75,000 to $99,999 | 152 | 12.7% |
| $100,000 to $149,999 | 191 | 15.9% |
| $150,000 to $199,999 | 28 | 2.3% |
| $200,000+ | 24 | 2.0% |
Household Income by Householder Age in Alexander
The median household income in Alexander is $68,431, with the highest median household income of $71,750 found in the 25 to 44 years age bracket for the primary householder. A total of 632 households (52.7%) fall into this category. Meanwhile, the 65+ years age bracket for the primary householder has the lowest median household income of $0, with 156 households (13.0%) in this group.
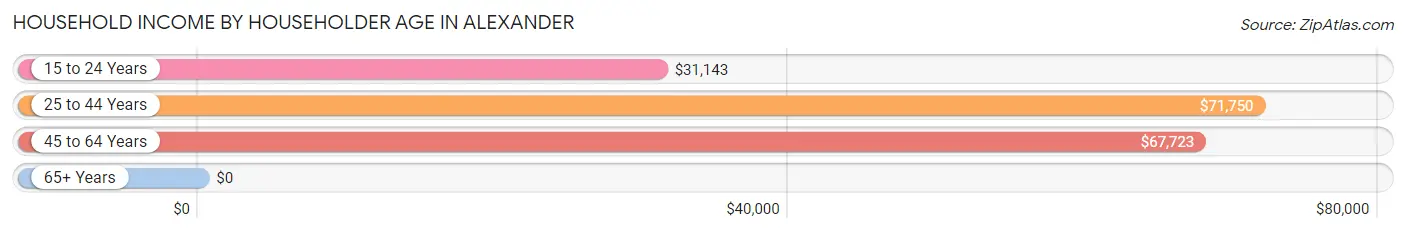
| Income Bracket | # Households | Median Income |
| 15 to 24 Years | 72 (6.0%) | $31,143 |
| 25 to 44 Years | 632 (52.7%) | $71,750 |
| 45 to 64 Years | 339 (28.3%) | $67,723 |
| 65+ Years | 156 (13.0%) | $0 |
| Total | 1,199 (100.0%) | $68,431 |
Poverty in Alexander
Income Below Poverty by Sex and Age in Alexander
With 20.5% poverty level for males and 29.0% for females among the residents of Alexander, 75 year old and over males and 5 year old females are the most vulnerable to poverty, with 40 males (74.1%) and 17 females (100.0%) in their respective age groups living below the poverty level.
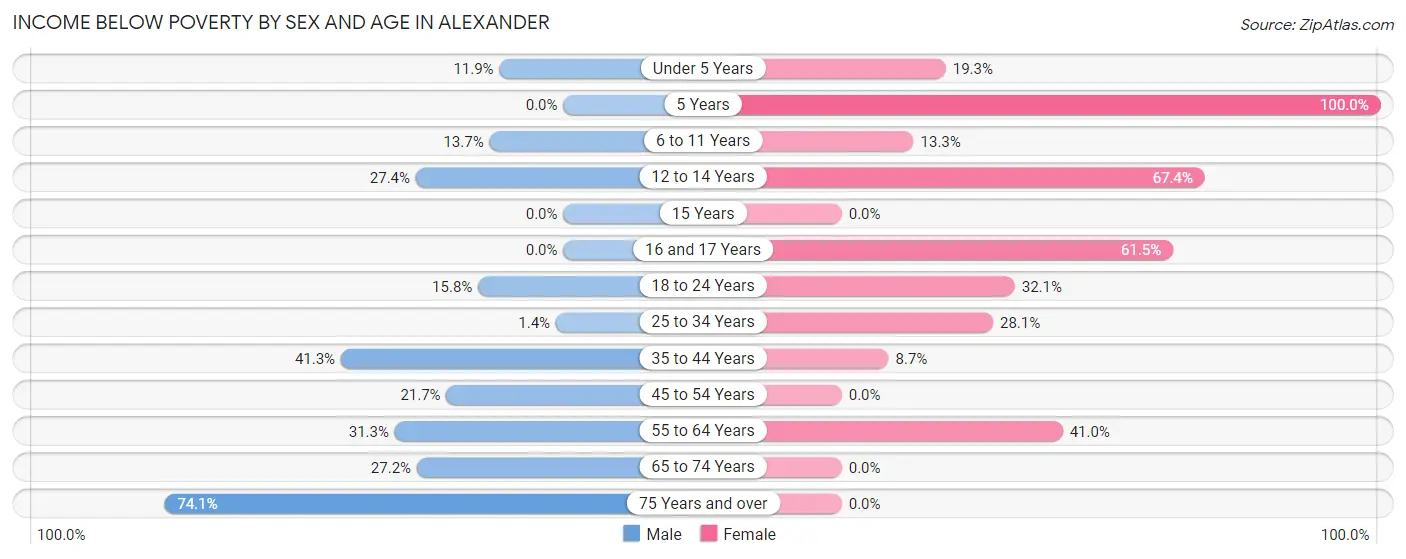
| Age Bracket | Male | Female |
| Under 5 Years | 14 (11.9%) | 33 (19.3%) |
| 5 Years | 0 (0.0%) | 17 (100.0%) |
| 6 to 11 Years | 24 (13.7%) | 8 (13.3%) |
| 12 to 14 Years | 23 (27.4%) | 64 (67.4%) |
| 15 Years | 0 (0.0%) | 0 (0.0%) |
| 16 and 17 Years | 0 (0.0%) | 99 (61.5%) |
| 18 to 24 Years | 37 (15.8%) | 44 (32.1%) |
| 25 to 34 Years | 4 (1.4%) | 107 (28.1%) |
| 35 to 44 Years | 71 (41.3%) | 23 (8.7%) |
| 45 to 54 Years | 23 (21.7%) | 0 (0.0%) |
| 55 to 64 Years | 76 (31.3%) | 123 (41.0%) |
| 65 to 74 Years | 28 (27.2%) | 0 (0.0%) |
| 75 Years and over | 40 (74.1%) | 0 (0.0%) |
| Total | 340 (20.5%) | 518 (29.0%) |
Income Above Poverty by Sex and Age in Alexander
According to the poverty statistics in Alexander, males aged 5 years and females aged 45 to 54 years are the age groups that are most secure financially, with 100.0% of males and 100.0% of females in these age groups living above the poverty line.
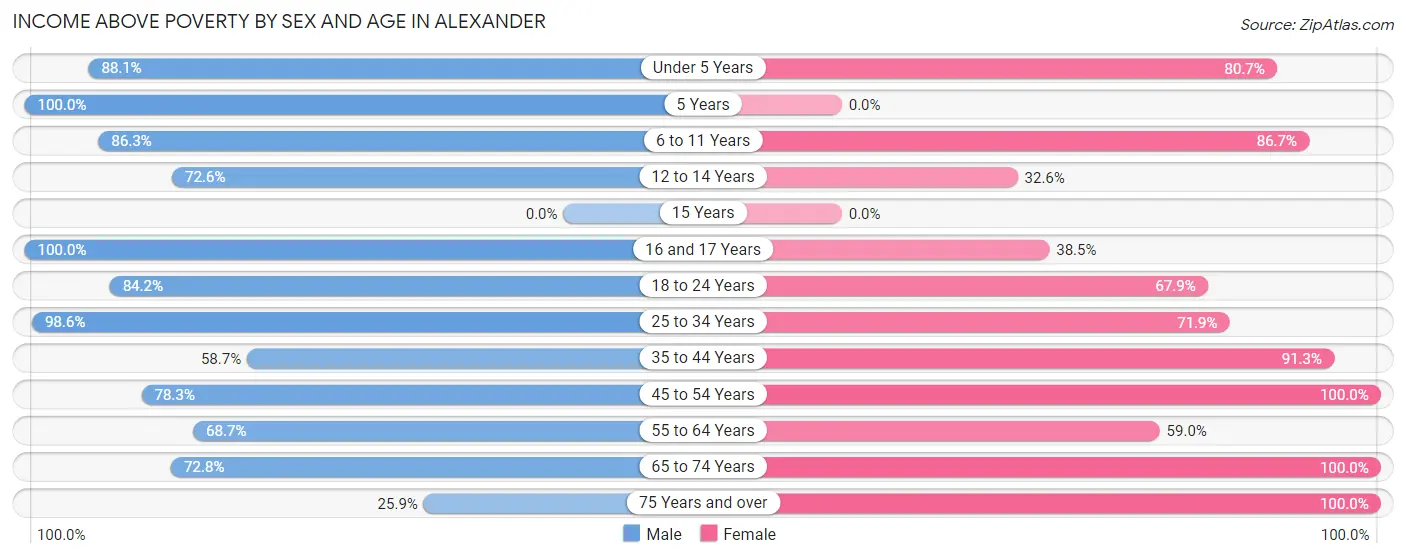
| Age Bracket | Male | Female |
| Under 5 Years | 104 (88.1%) | 138 (80.7%) |
| 5 Years | 74 (100.0%) | 0 (0.0%) |
| 6 to 11 Years | 151 (86.3%) | 52 (86.7%) |
| 12 to 14 Years | 61 (72.6%) | 31 (32.6%) |
| 15 Years | 0 (0.0%) | 0 (0.0%) |
| 16 and 17 Years | 8 (100.0%) | 62 (38.5%) |
| 18 to 24 Years | 197 (84.2%) | 93 (67.9%) |
| 25 to 34 Years | 286 (98.6%) | 274 (71.9%) |
| 35 to 44 Years | 101 (58.7%) | 242 (91.3%) |
| 45 to 54 Years | 83 (78.3%) | 132 (100.0%) |
| 55 to 64 Years | 167 (68.7%) | 177 (59.0%) |
| 65 to 74 Years | 75 (72.8%) | 48 (100.0%) |
| 75 Years and over | 14 (25.9%) | 16 (100.0%) |
| Total | 1,321 (79.5%) | 1,265 (71.0%) |
Income Below Poverty Among Married-Couple Families in Alexander
The poverty statistics for married-couple families in Alexander show that 6.0% or 35 of the total 582 families live below the poverty line. Families with 3 or 4 children have the highest poverty rate of 100.0%, comprising of 35 families. On the other hand, families with no children have the lowest poverty rate of 0.0%, which includes 0 families.
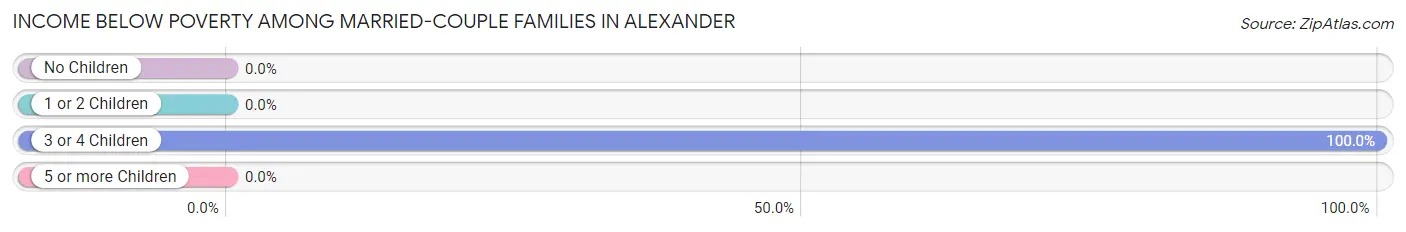
| Children | Above Poverty | Below Poverty |
| No Children | 218 (100.0%) | 0 (0.0%) |
| 1 or 2 Children | 329 (100.0%) | 0 (0.0%) |
| 3 or 4 Children | 0 (0.0%) | 35 (100.0%) |
| 5 or more Children | 0 (0.0%) | 0 (0.0%) |
| Total | 547 (94.0%) | 35 (6.0%) |
Income Below Poverty Among Single-Parent Households in Alexander
According to the poverty data in Alexander, 31.5% or 40 single-father households and 55.7% or 97 single-mother households are living below the poverty line. Among single-father households, those with no children have the highest poverty rate, with 40 households (74.1%) experiencing poverty. Likewise, among single-mother households, those with 3 or 4 children have the highest poverty rate, with 19 households (100.0%) falling below the poverty line.
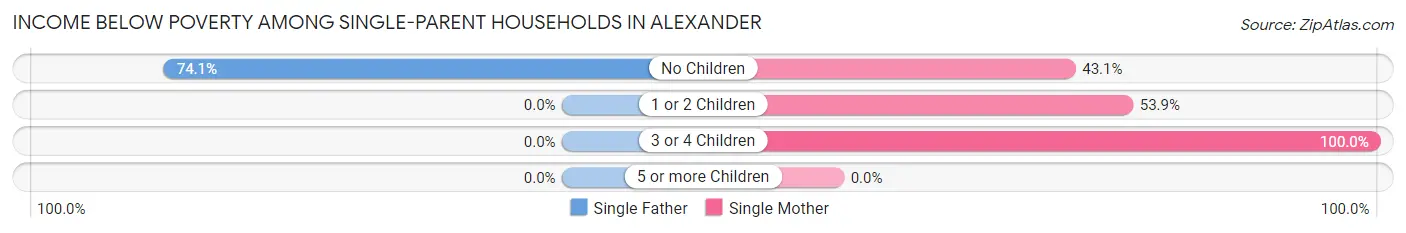
| Children | Single Father | Single Mother |
| No Children | 40 (74.1%) | 22 (43.1%) |
| 1 or 2 Children | 0 (0.0%) | 56 (53.8%) |
| 3 or 4 Children | 0 (0.0%) | 19 (100.0%) |
| 5 or more Children | 0 (0.0%) | 0 (0.0%) |
| Total | 40 (31.5%) | 97 (55.7%) |
Income Below Poverty Among Married-Couple vs Single-Parent Households in Alexander
The poverty data for Alexander shows that 35 of the married-couple family households (6.0%) and 137 of the single-parent households (45.5%) are living below the poverty level. Within the married-couple family households, those with 3 or 4 children have the highest poverty rate, with 35 households (100.0%) falling below the poverty line. Among the single-parent households, those with 3 or 4 children have the highest poverty rate, with 19 household (100.0%) living below poverty.
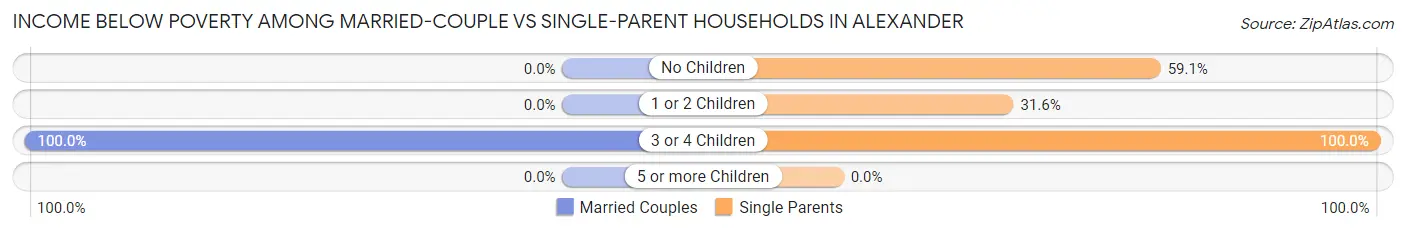
| Children | Married-Couple Families | Single-Parent Households |
| No Children | 0 (0.0%) | 62 (59.1%) |
| 1 or 2 Children | 0 (0.0%) | 56 (31.6%) |
| 3 or 4 Children | 35 (100.0%) | 19 (100.0%) |
| 5 or more Children | 0 (0.0%) | 0 (0.0%) |
| Total | 35 (6.0%) | 137 (45.5%) |
Race in Alexander
The most populous races in Alexander are White / Caucasian (2,044 | 59.4%), Hispanic or Latino (926 | 26.9%), and Black / African American (855 | 24.8%).
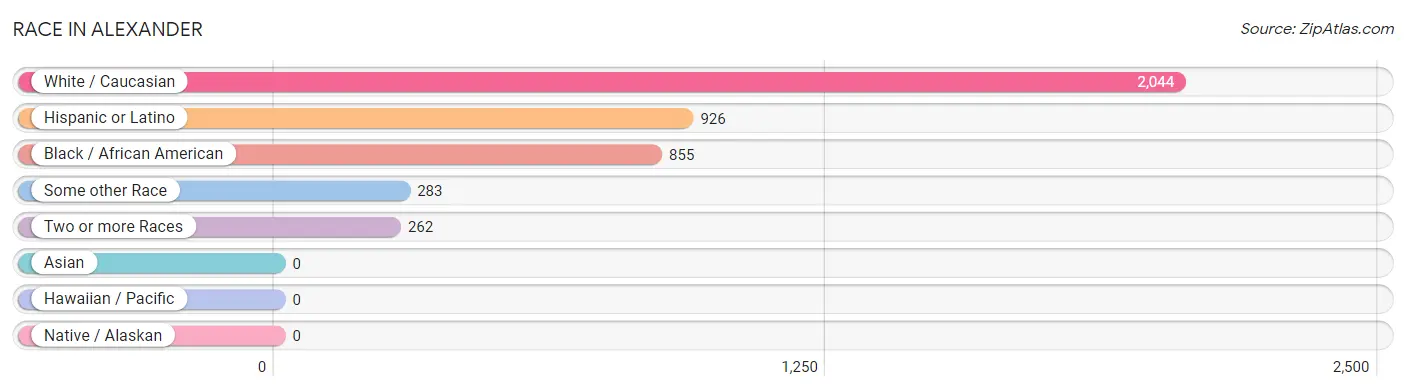
| Race | # Population | % Population |
| Asian | 0 | 0.0% |
| Black / African American | 855 | 24.8% |
| Hawaiian / Pacific | 0 | 0.0% |
| Hispanic or Latino | 926 | 26.9% |
| Native / Alaskan | 0 | 0.0% |
| White / Caucasian | 2,044 | 59.4% |
| Two or more Races | 262 | 7.6% |
| Some other Race | 283 | 8.2% |
| Total | 3,444 | 100.0% |
Ancestry in Alexander
The most populous ancestries reported in Alexander are Mexican (499 | 14.5%), Central American (427 | 12.4%), Irish (410 | 11.9%), Honduran (277 | 8.0%), and American (247 | 7.2%), together accounting for 54.0% of all Alexander residents.
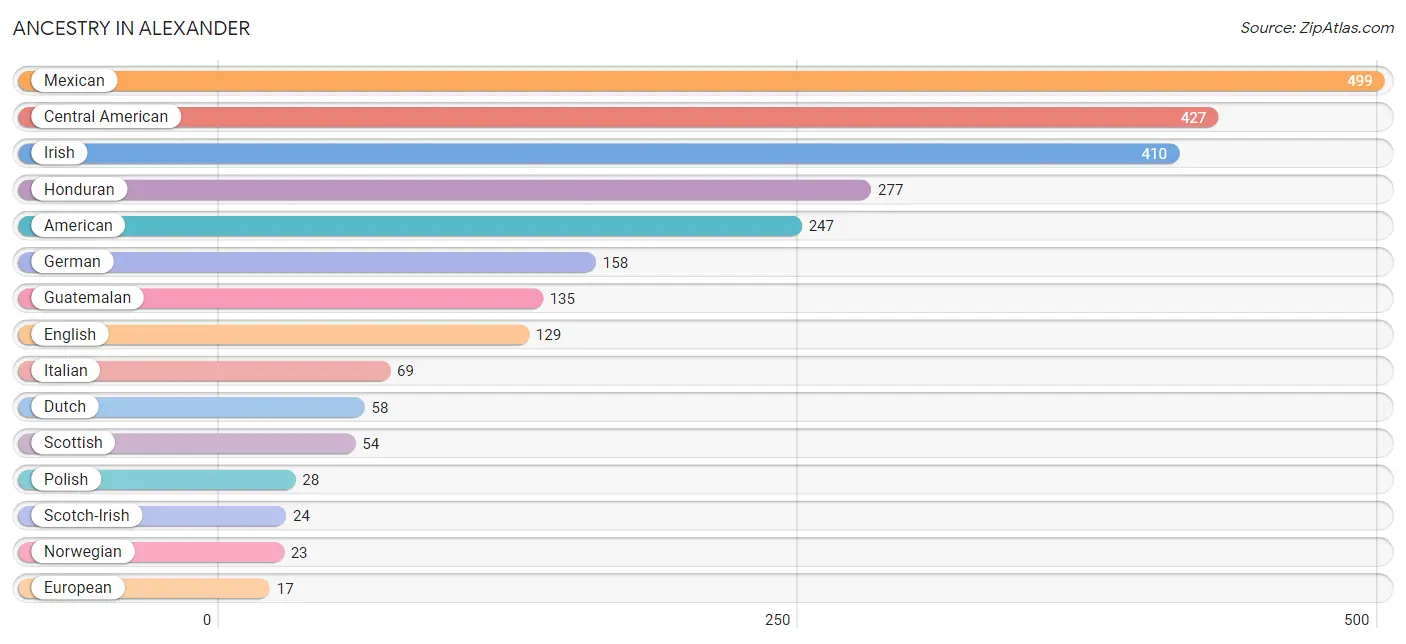
| Ancestry | # Population | % Population |
| African | 6 | 0.2% |
| American | 247 | 7.2% |
| Central American | 427 | 12.4% |
| Dutch | 58 | 1.7% |
| English | 129 | 3.7% |
| European | 17 | 0.5% |
| French | 8 | 0.2% |
| German | 158 | 4.6% |
| Greek | 6 | 0.2% |
| Guatemalan | 135 | 3.9% |
| Honduran | 277 | 8.0% |
| Irish | 410 | 11.9% |
| Italian | 69 | 2.0% |
| Lithuanian | 8 | 0.2% |
| Mexican | 499 | 14.5% |
| Norwegian | 23 | 0.7% |
| Polish | 28 | 0.8% |
| Salvadoran | 15 | 0.4% |
| Scotch-Irish | 24 | 0.7% |
| Scottish | 54 | 1.6% |
| Subsaharan African | 6 | 0.2% | View All 21 Rows |
Immigrants in Alexander
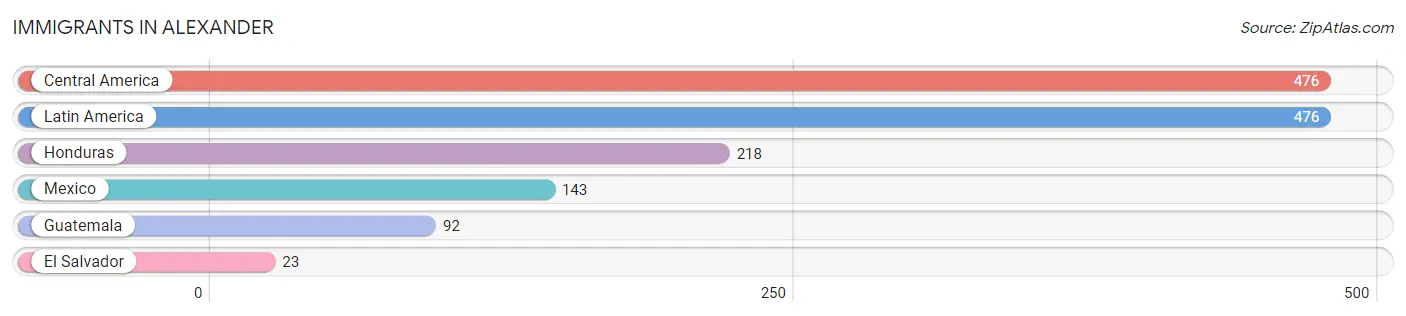
The most numerous immigrant groups reported in Alexander came from Central America (476 | 13.8%), Latin America (476 | 13.8%), Honduras (218 | 6.3%), Mexico (143 | 4.2%), and Guatemala (92 | 2.7%), together accounting for 40.8% of all Alexander residents.
| Immigration Origin | # Population | % Population |
| Central America | 476 | 13.8% |
| El Salvador | 23 | 0.7% |
| Guatemala | 92 | 2.7% |
| Honduras | 218 | 6.3% |
| Latin America | 476 | 13.8% |
| Mexico | 143 | 4.2% | View All 6 Rows |
Sex and Age in Alexander
Sex and Age in Alexander
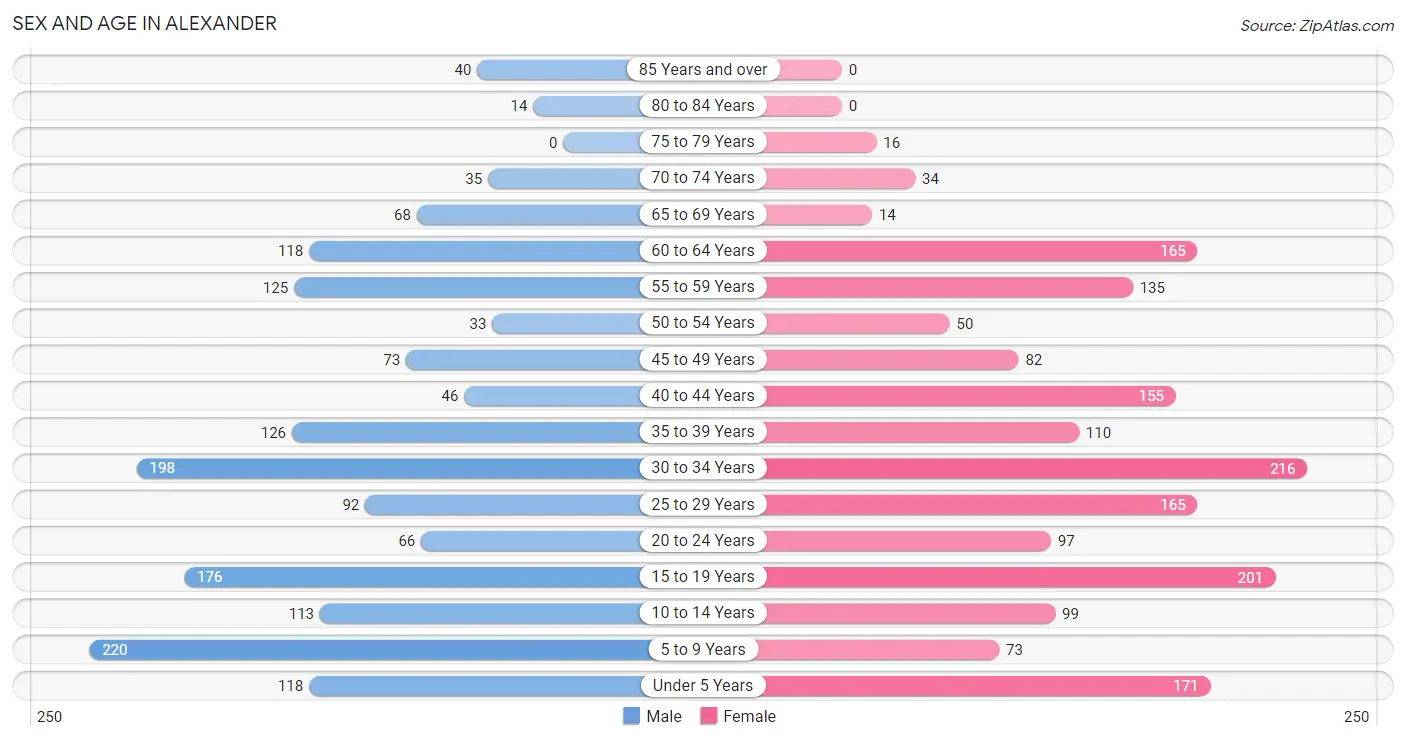
The most populous age groups in Alexander are 5 to 9 Years (220 | 13.3%) for men and 30 to 34 Years (216 | 12.1%) for women.
| Age Bracket | Male | Female |
| Under 5 Years | 118 (7.1%) | 171 (9.6%) |
| 5 to 9 Years | 220 (13.3%) | 73 (4.1%) |
| 10 to 14 Years | 113 (6.8%) | 99 (5.6%) |
| 15 to 19 Years | 176 (10.6%) | 201 (11.3%) |
| 20 to 24 Years | 66 (4.0%) | 97 (5.4%) |
| 25 to 29 Years | 92 (5.5%) | 165 (9.2%) |
| 30 to 34 Years | 198 (11.9%) | 216 (12.1%) |
| 35 to 39 Years | 126 (7.6%) | 110 (6.2%) |
| 40 to 44 Years | 46 (2.8%) | 155 (8.7%) |
| 45 to 49 Years | 73 (4.4%) | 82 (4.6%) |
| 50 to 54 Years | 33 (2.0%) | 50 (2.8%) |
| 55 to 59 Years | 125 (7.5%) | 135 (7.6%) |
| 60 to 64 Years | 118 (7.1%) | 165 (9.2%) |
| 65 to 69 Years | 68 (4.1%) | 14 (0.8%) |
| 70 to 74 Years | 35 (2.1%) | 34 (1.9%) |
| 75 to 79 Years | 0 (0.0%) | 16 (0.9%) |
| 80 to 84 Years | 14 (0.8%) | 0 (0.0%) |
| 85 Years and over | 40 (2.4%) | 0 (0.0%) |
| Total | 1,661 (100.0%) | 1,783 (100.0%) |
Families and Households in Alexander
Median Family Size in Alexander
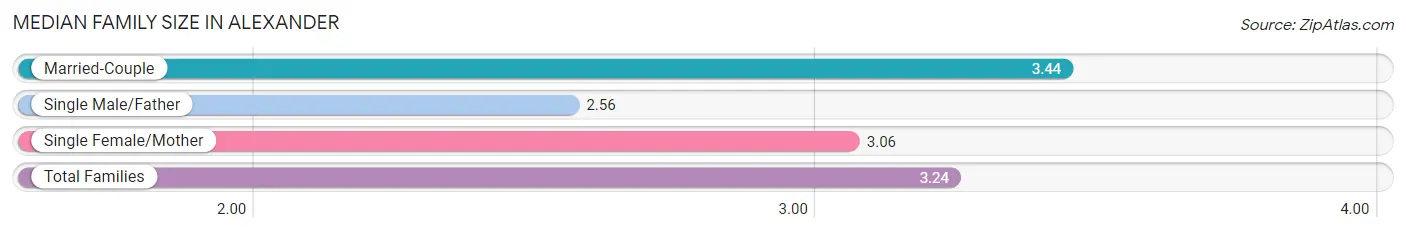
The median family size in Alexander is 3.24 persons per family, with married-couple families (582 | 65.9%) accounting for the largest median family size of 3.44 persons per family. On the other hand, single male/father families (127 | 14.4%) represent the smallest median family size with 2.56 persons per family.
| Family Type | # Families | Family Size |
| Married-Couple | 582 (65.9%) | 3.44 |
| Single Male/Father | 127 (14.4%) | 2.56 |
| Single Female/Mother | 174 (19.7%) | 3.06 |
| Total Families | 883 (100.0%) | 3.24 |
Median Household Size in Alexander
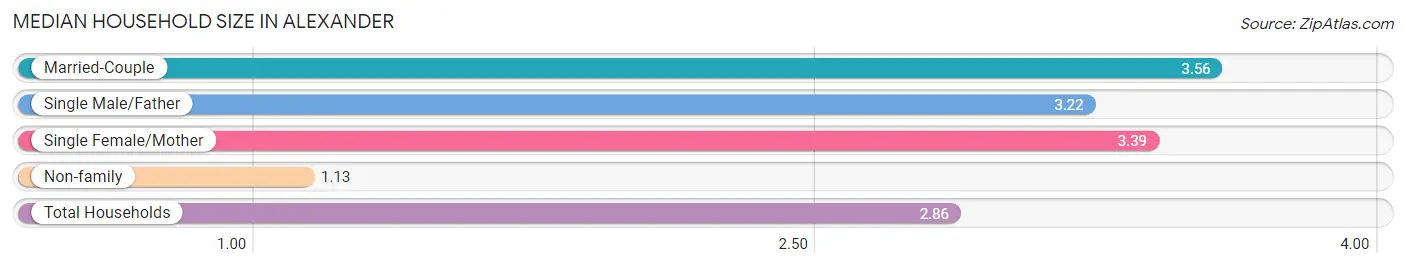
The median household size in Alexander is 2.86 persons per household, with married-couple households (582 | 48.5%) accounting for the largest median household size of 3.56 persons per household. non-family households (316 | 26.4%) represent the smallest median household size with 1.13 persons per household.
| Household Type | # Households | Household Size |
| Married-Couple | 582 (48.5%) | 3.56 |
| Single Male/Father | 127 (10.6%) | 3.22 |
| Single Female/Mother | 174 (14.5%) | 3.39 |
| Non-family | 316 (26.4%) | 1.13 |
| Total Households | 1,199 (100.0%) | 2.86 |
Household Size by Marriage Status in Alexander
Out of a total of 1,199 households in Alexander, 883 (73.6%) are family households, while 316 (26.4%) are nonfamily households. The most numerous type of family households are 4-person households, comprising 316, and the most common type of nonfamily households are 1-person households, comprising 275.
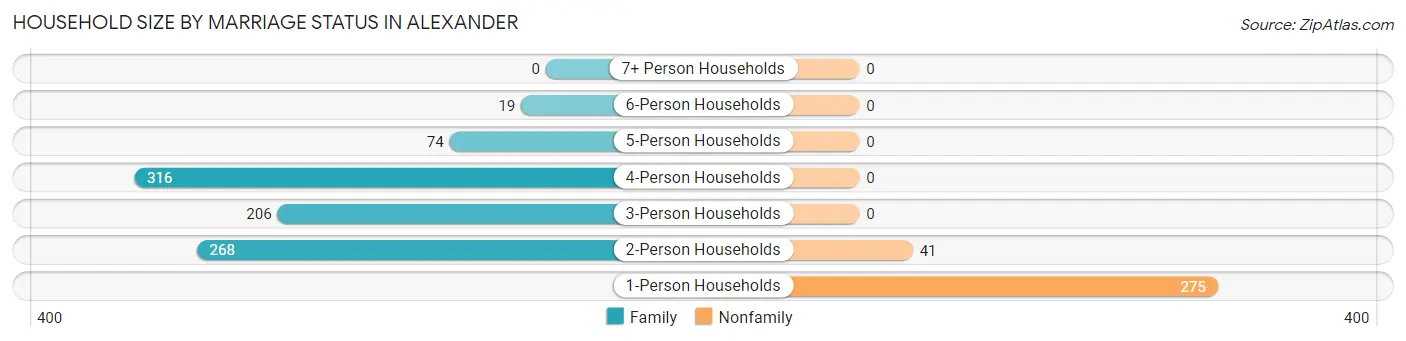
| Household Size | Family Households | Nonfamily Households |
| 1-Person Households | - | 275 (22.9%) |
| 2-Person Households | 268 (22.4%) | 41 (3.4%) |
| 3-Person Households | 206 (17.2%) | 0 (0.0%) |
| 4-Person Households | 316 (26.4%) | 0 (0.0%) |
| 5-Person Households | 74 (6.2%) | 0 (0.0%) |
| 6-Person Households | 19 (1.6%) | 0 (0.0%) |
| 7+ Person Households | 0 (0.0%) | 0 (0.0%) |
| Total | 883 (73.6%) | 316 (26.4%) |
Female Fertility in Alexander
Fertility by Age in Alexander
Average fertility rate in Alexander is 54.0 births per 1,000 women. Women in the age bracket of 20 to 34 years have the highest fertility rate with 98.0 births per 1,000 women. Women in the age bracket of 20 to 34 years acount for 85.5% of all women with births.
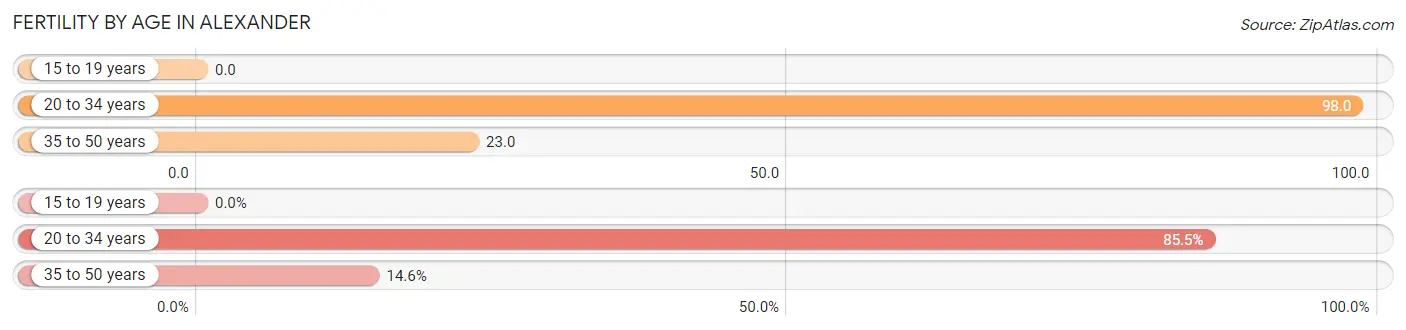
| Age Bracket | Women with Births | Births / 1,000 Women |
| 15 to 19 years | 0 (0.0%) | 0.0 |
| 20 to 34 years | 47 (85.5%) | 98.0 |
| 35 to 50 years | 8 (14.5%) | 23.0 |
| Total | 55 (100.0%) | 54.0 |
Fertility by Age by Marriage Status in Alexander
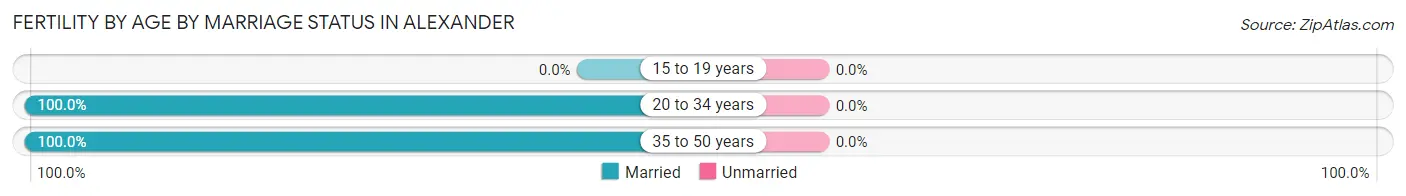
| Age Bracket | Married | Unmarried |
| 15 to 19 years | 0 (0.0%) | 0 (0.0%) |
| 20 to 34 years | 47 (100.0%) | 0 (0.0%) |
| 35 to 50 years | 8 (100.0%) | 0 (0.0%) |
| Total | 55 (100.0%) | 0 (0.0%) |
Fertility by Education in Alexander
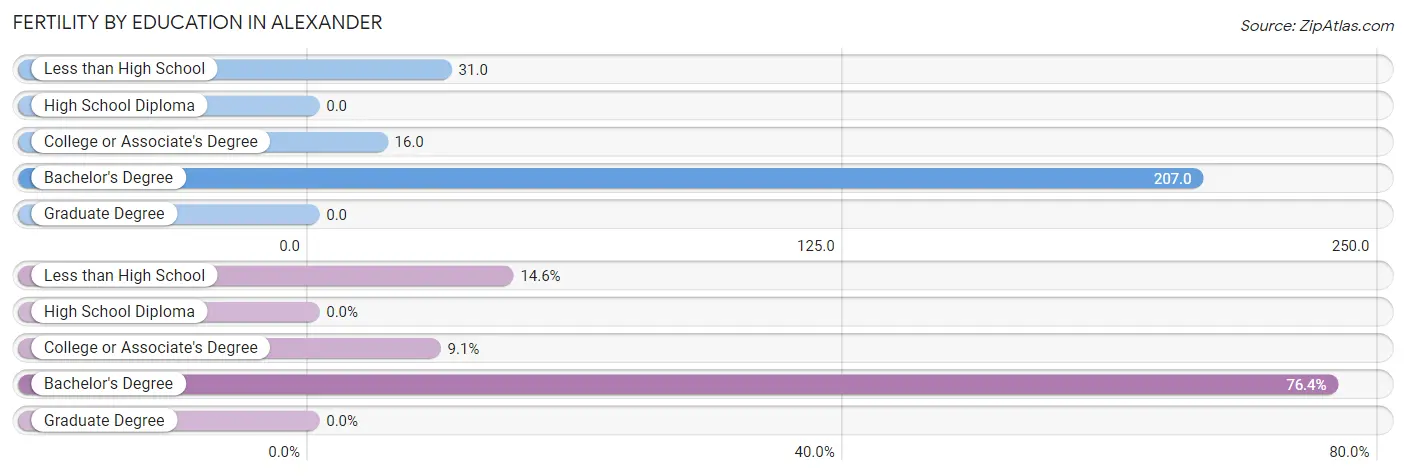
| Educational Attainment | Women with Births | Births / 1,000 Women |
| Less than High School | 8 (14.5%) | 31.0 |
| High School Diploma | 0 (0.0%) | 0.0 |
| College or Associate's Degree | 5 (9.1%) | 16.0 |
| Bachelor's Degree | 42 (76.4%) | 207.0 |
| Graduate Degree | 0 (0.0%) | 0.0 |
| Total | 55 (100.0%) | 54.0 |
Fertility by Education by Marriage Status in Alexander
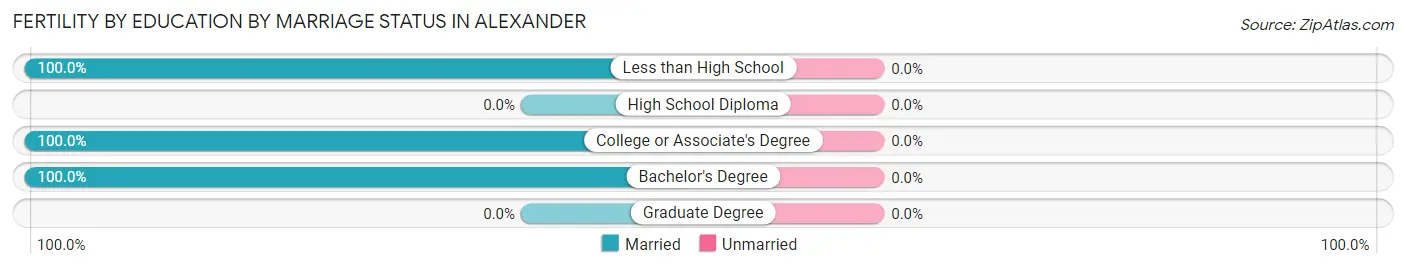
| Educational Attainment | Married | Unmarried |
| Less than High School | 8 (100.0%) | 0 (0.0%) |
| High School Diploma | 0 (0.0%) | 0 (0.0%) |
| College or Associate's Degree | 5 (100.0%) | 0 (0.0%) |
| Bachelor's Degree | 42 (100.0%) | 0 (0.0%) |
| Graduate Degree | 0 (0.0%) | 0 (0.0%) |
| Total | 55 (100.0%) | 0 (0.0%) |
Employment Characteristics in Alexander
Employment by Class of Employer in Alexander
Among the 1,693 employed individuals in Alexander, private company employees (1,309 | 77.3%), not-for-profit organizations (133 | 7.9%), and state government employees (123 | 7.3%) make up the most common classes of employment.
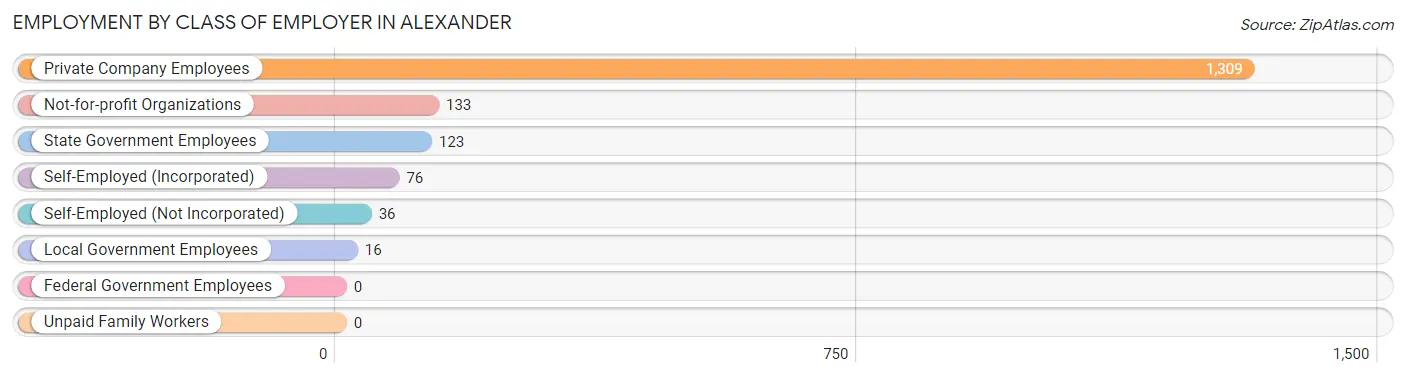
| Employer Class | # Employees | % Employees |
| Private Company Employees | 1,309 | 77.3% |
| Self-Employed (Incorporated) | 76 | 4.5% |
| Self-Employed (Not Incorporated) | 36 | 2.1% |
| Not-for-profit Organizations | 133 | 7.9% |
| Local Government Employees | 16 | 0.9% |
| State Government Employees | 123 | 7.3% |
| Federal Government Employees | 0 | 0.0% |
| Unpaid Family Workers | 0 | 0.0% |
| Total | 1,693 | 100.0% |
Employment Status by Age in Alexander
According to the labor force statistics for Alexander, out of the total population over 16 years of age (2,650), 73.1% or 1,937 individuals are in the labor force, with 7.7% or 149 of them unemployed. The age group with the highest labor force participation rate is 20 to 24 years, with 100.0% or 163 individuals in the labor force. Within the labor force, the 16 to 19 years age range has the highest percentage of unemployed individuals, with 35.9% or 52 of them being unemployed.
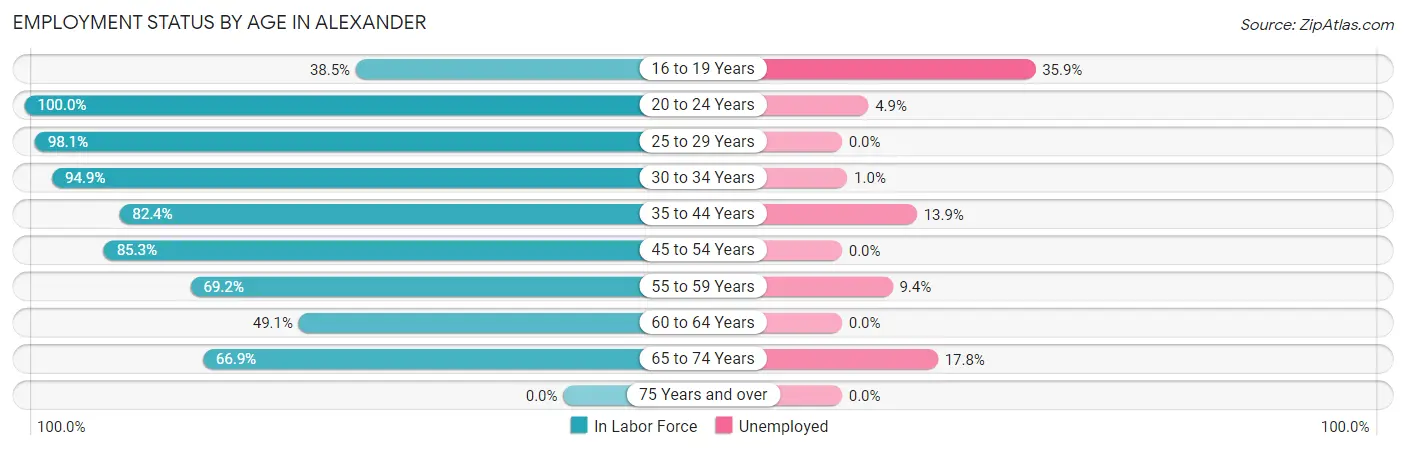
| Age Bracket | In Labor Force | Unemployed |
| 16 to 19 Years | 145 (38.5%) | 52 (35.9%) |
| 20 to 24 Years | 163 (100.0%) | 8 (4.9%) |
| 25 to 29 Years | 252 (98.1%) | 0 (0.0%) |
| 30 to 34 Years | 393 (94.9%) | 4 (1.0%) |
| 35 to 44 Years | 360 (82.4%) | 50 (13.9%) |
| 45 to 54 Years | 203 (85.3%) | 0 (0.0%) |
| 55 to 59 Years | 180 (69.2%) | 17 (9.4%) |
| 60 to 64 Years | 139 (49.1%) | 0 (0.0%) |
| 65 to 74 Years | 101 (66.9%) | 18 (17.8%) |
| 75 Years and over | 0 (0.0%) | 0 (0.0%) |
| Total | 1,937 (73.1%) | 149 (7.7%) |
Employment Status by Educational Attainment in Alexander
According to labor force statistics for Alexander, 80.8% of individuals (1,526) out of the total population between 25 and 64 years of age (1,889) are in the labor force, with 4.6% or 70 of them being unemployed. The group with the highest labor force participation rate are those with the educational attainment of college / associate degree, with 98.9% or 442 individuals in the labor force. Within the labor force, individuals with high school diploma education have the highest percentage of unemployment, with 10.8% or 52 of them being unemployed.
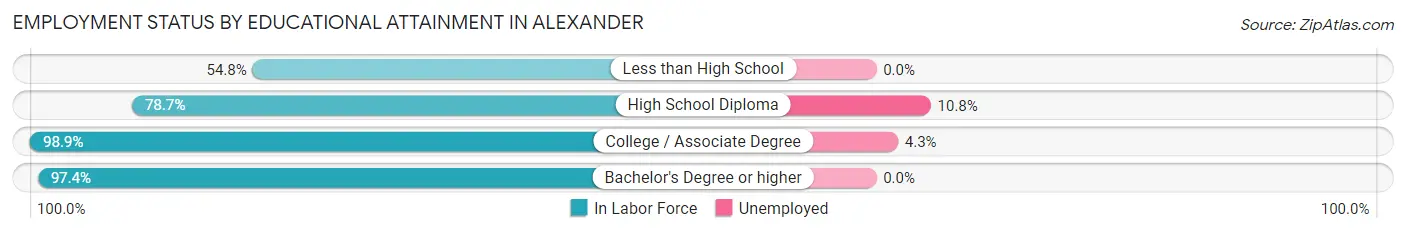
| Educational Attainment | In Labor Force | Unemployed |
| Less than High School | 263 (54.8%) | 0 (0.0%) |
| High School Diploma | 483 (78.7%) | 66 (10.8%) |
| College / Associate Degree | 442 (98.9%) | 19 (4.3%) |
| Bachelor's Degree or higher | 339 (97.4%) | 0 (0.0%) |
| Total | 1,526 (80.8%) | 87 (4.6%) |
Employment Occupations by Sex in Alexander
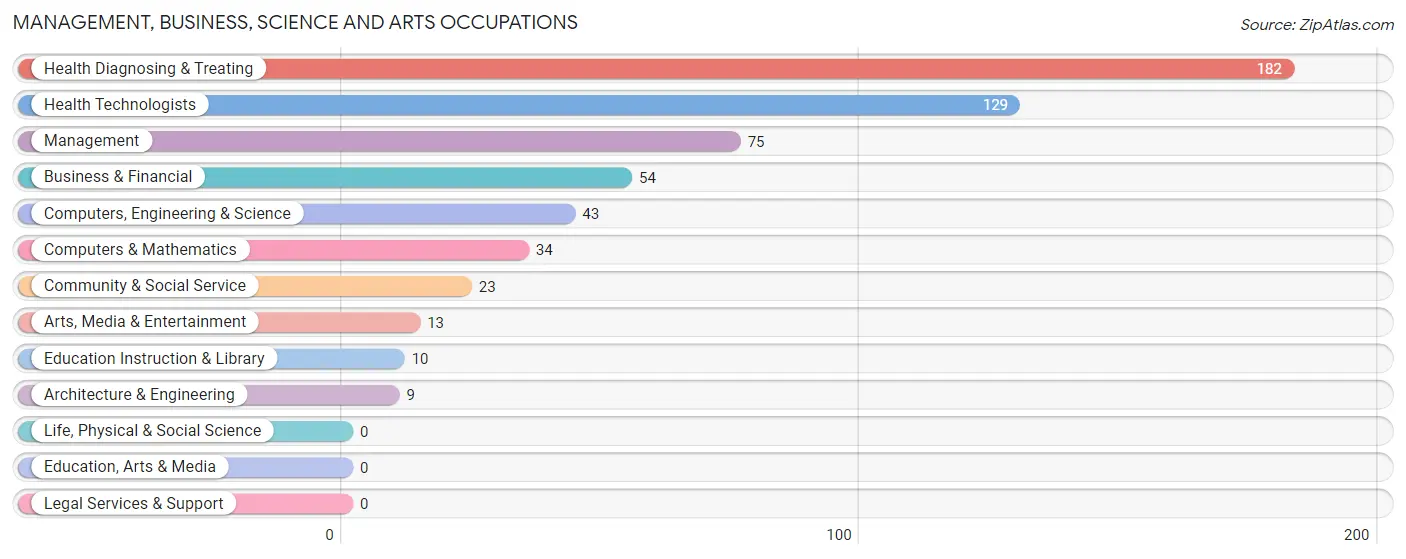
Management, Business, Science and Arts Occupations
The most common Management, Business, Science and Arts occupations in Alexander are Health Diagnosing & Treating (182 | 10.2%), Health Technologists (129 | 7.2%), Management (75 | 4.2%), Business & Financial (54 | 3.0%), and Computers, Engineering & Science (43 | 2.4%).
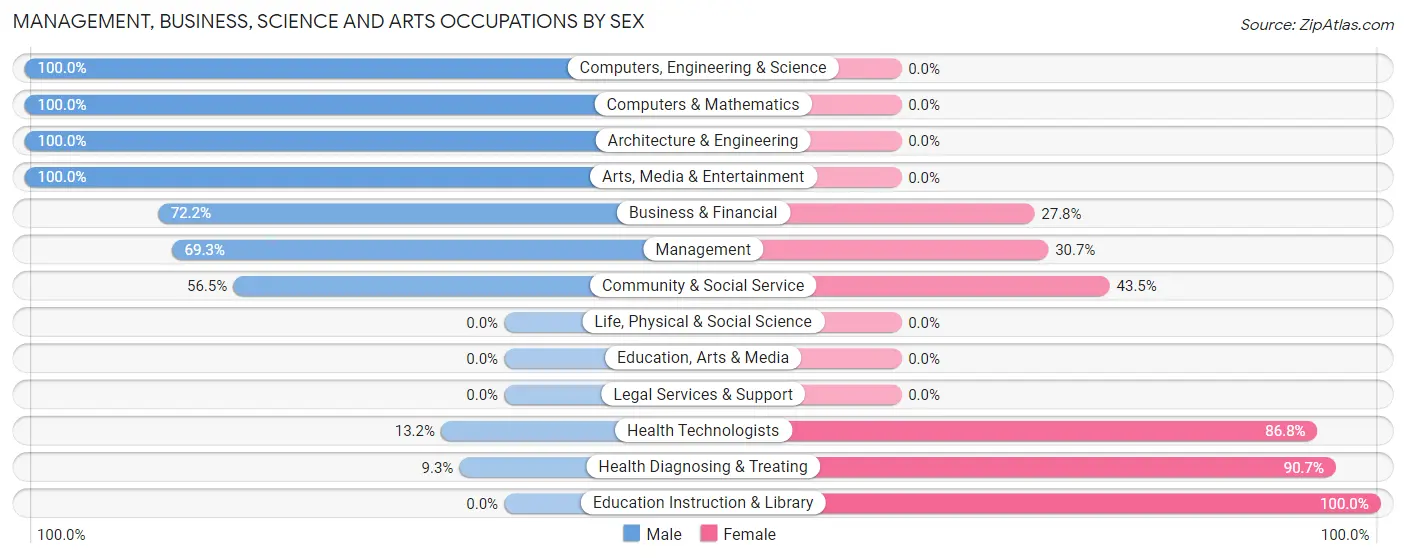
Management, Business, Science and Arts Occupations by Sex
Within the Management, Business, Science and Arts occupations in Alexander, the most male-oriented occupations are Computers, Engineering & Science (100.0%), Computers & Mathematics (100.0%), and Architecture & Engineering (100.0%), while the most female-oriented occupations are Education Instruction & Library (100.0%), Health Diagnosing & Treating (90.7%), and Health Technologists (86.8%).
| Occupation | Male | Female |
| Management | 52 (69.3%) | 23 (30.7%) |
| Business & Financial | 39 (72.2%) | 15 (27.8%) |
| Computers, Engineering & Science | 43 (100.0%) | 0 (0.0%) |
| Computers & Mathematics | 34 (100.0%) | 0 (0.0%) |
| Architecture & Engineering | 9 (100.0%) | 0 (0.0%) |
| Life, Physical & Social Science | 0 (0.0%) | 0 (0.0%) |
| Community & Social Service | 13 (56.5%) | 10 (43.5%) |
| Education, Arts & Media | 0 (0.0%) | 0 (0.0%) |
| Legal Services & Support | 0 (0.0%) | 0 (0.0%) |
| Education Instruction & Library | 0 (0.0%) | 10 (100.0%) |
| Arts, Media & Entertainment | 13 (100.0%) | 0 (0.0%) |
| Health Diagnosing & Treating | 17 (9.3%) | 165 (90.7%) |
| Health Technologists | 17 (13.2%) | 112 (86.8%) |
| Total (Category) | 164 (43.5%) | 213 (56.5%) |
| Total (Overall) | 858 (48.0%) | 929 (52.0%) |
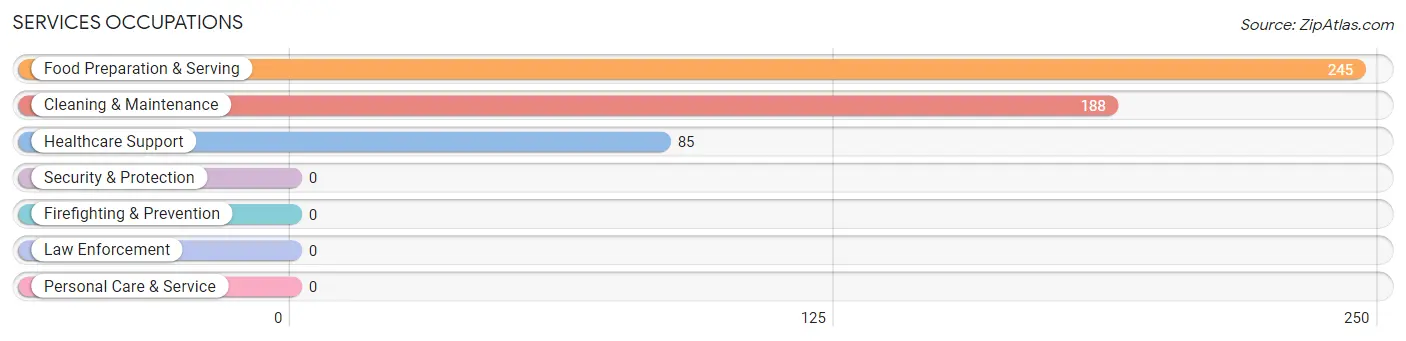
Services Occupations
The most common Services occupations in Alexander are Food Preparation & Serving (245 | 13.7%), Cleaning & Maintenance (188 | 10.5%), and Healthcare Support (85 | 4.8%).
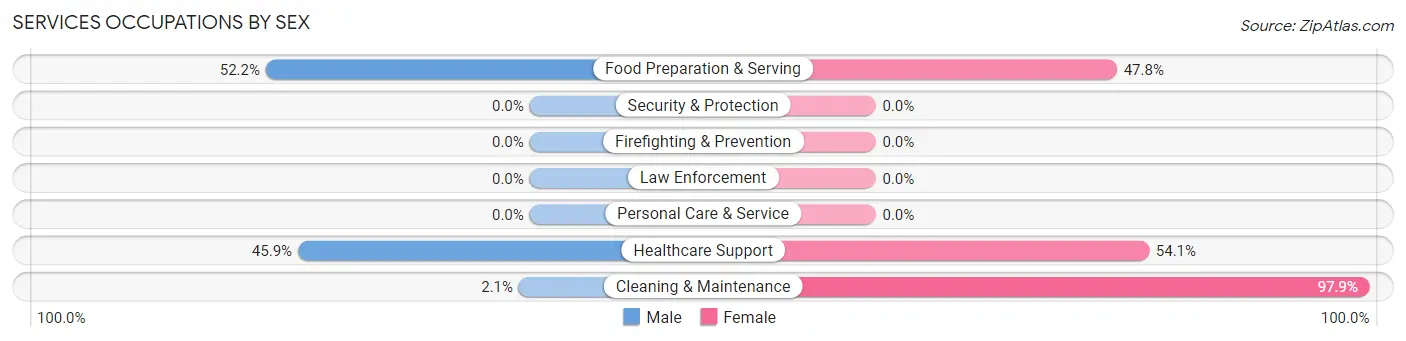
Services Occupations by Sex
Within the Services occupations in Alexander, the most male-oriented occupations are Food Preparation & Serving (52.2%), Healthcare Support (45.9%), and Cleaning & Maintenance (2.1%), while the most female-oriented occupations are Cleaning & Maintenance (97.9%), Healthcare Support (54.1%), and Food Preparation & Serving (47.8%).
| Occupation | Male | Female |
| Healthcare Support | 39 (45.9%) | 46 (54.1%) |
| Security & Protection | 0 (0.0%) | 0 (0.0%) |
| Firefighting & Prevention | 0 (0.0%) | 0 (0.0%) |
| Law Enforcement | 0 (0.0%) | 0 (0.0%) |
| Food Preparation & Serving | 128 (52.2%) | 117 (47.8%) |
| Cleaning & Maintenance | 4 (2.1%) | 184 (97.9%) |
| Personal Care & Service | 0 (0.0%) | 0 (0.0%) |
| Total (Category) | 171 (33.0%) | 347 (67.0%) |
| Total (Overall) | 858 (48.0%) | 929 (52.0%) |
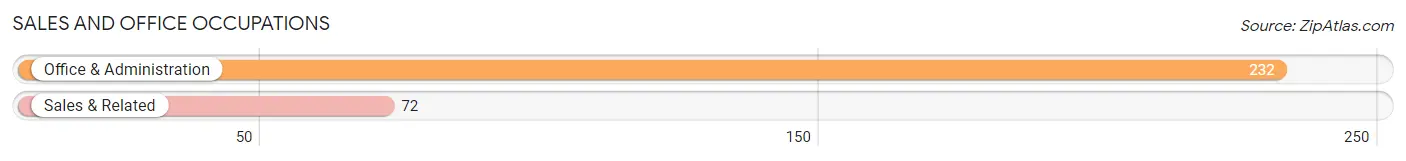
Sales and Office Occupations
The most common Sales and Office occupations in Alexander are Office & Administration (232 | 13.0%), and Sales & Related (72 | 4.0%).
Sales and Office Occupations by Sex
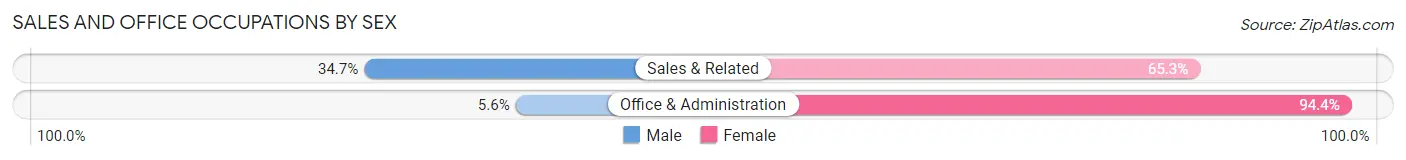
| Occupation | Male | Female |
| Sales & Related | 25 (34.7%) | 47 (65.3%) |
| Office & Administration | 13 (5.6%) | 219 (94.4%) |
| Total (Category) | 38 (12.5%) | 266 (87.5%) |
| Total (Overall) | 858 (48.0%) | 929 (52.0%) |
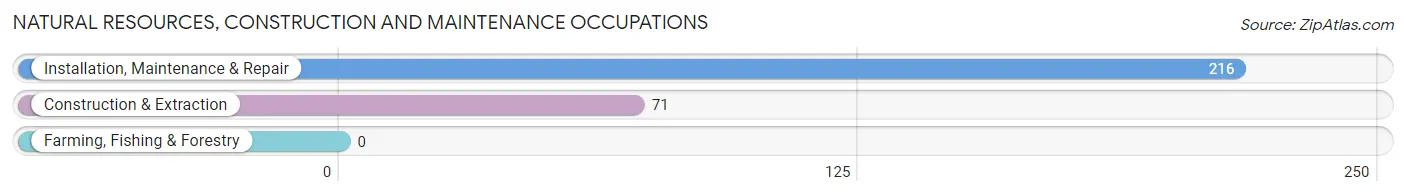
Natural Resources, Construction and Maintenance Occupations
The most common Natural Resources, Construction and Maintenance occupations in Alexander are Installation, Maintenance & Repair (216 | 12.1%), and Construction & Extraction (71 | 4.0%).
Natural Resources, Construction and Maintenance Occupations by Sex
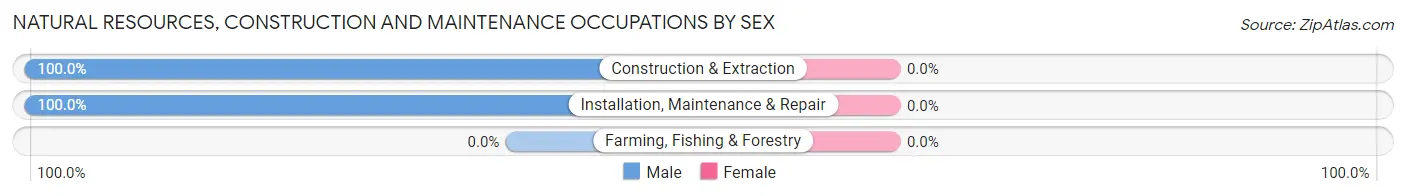
| Occupation | Male | Female |
| Farming, Fishing & Forestry | 0 (0.0%) | 0 (0.0%) |
| Construction & Extraction | 71 (100.0%) | 0 (0.0%) |
| Installation, Maintenance & Repair | 216 (100.0%) | 0 (0.0%) |
| Total (Category) | 287 (100.0%) | 0 (0.0%) |
| Total (Overall) | 858 (48.0%) | 929 (52.0%) |
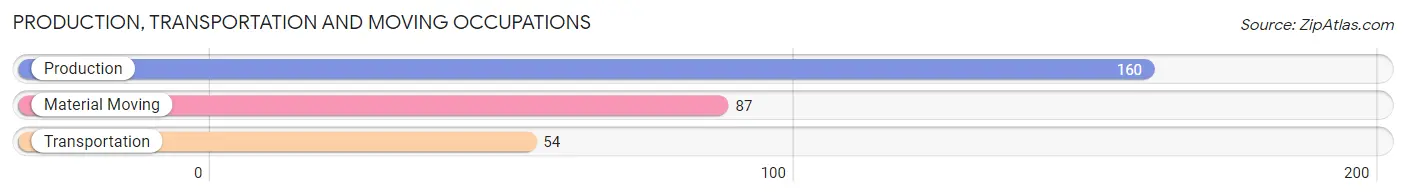
Production, Transportation and Moving Occupations
The most common Production, Transportation and Moving occupations in Alexander are Production (160 | 8.9%), Material Moving (87 | 4.9%), and Transportation (54 | 3.0%).
Production, Transportation and Moving Occupations by Sex
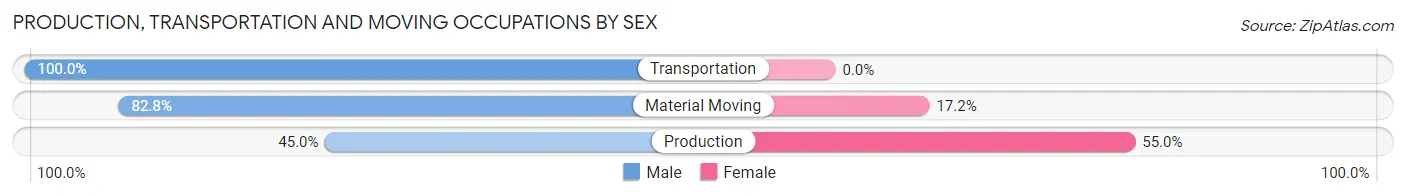
| Occupation | Male | Female |
| Production | 72 (45.0%) | 88 (55.0%) |
| Transportation | 54 (100.0%) | 0 (0.0%) |
| Material Moving | 72 (82.8%) | 15 (17.2%) |
| Total (Category) | 198 (65.8%) | 103 (34.2%) |
| Total (Overall) | 858 (48.0%) | 929 (52.0%) |
Employment Industries by Sex in Alexander
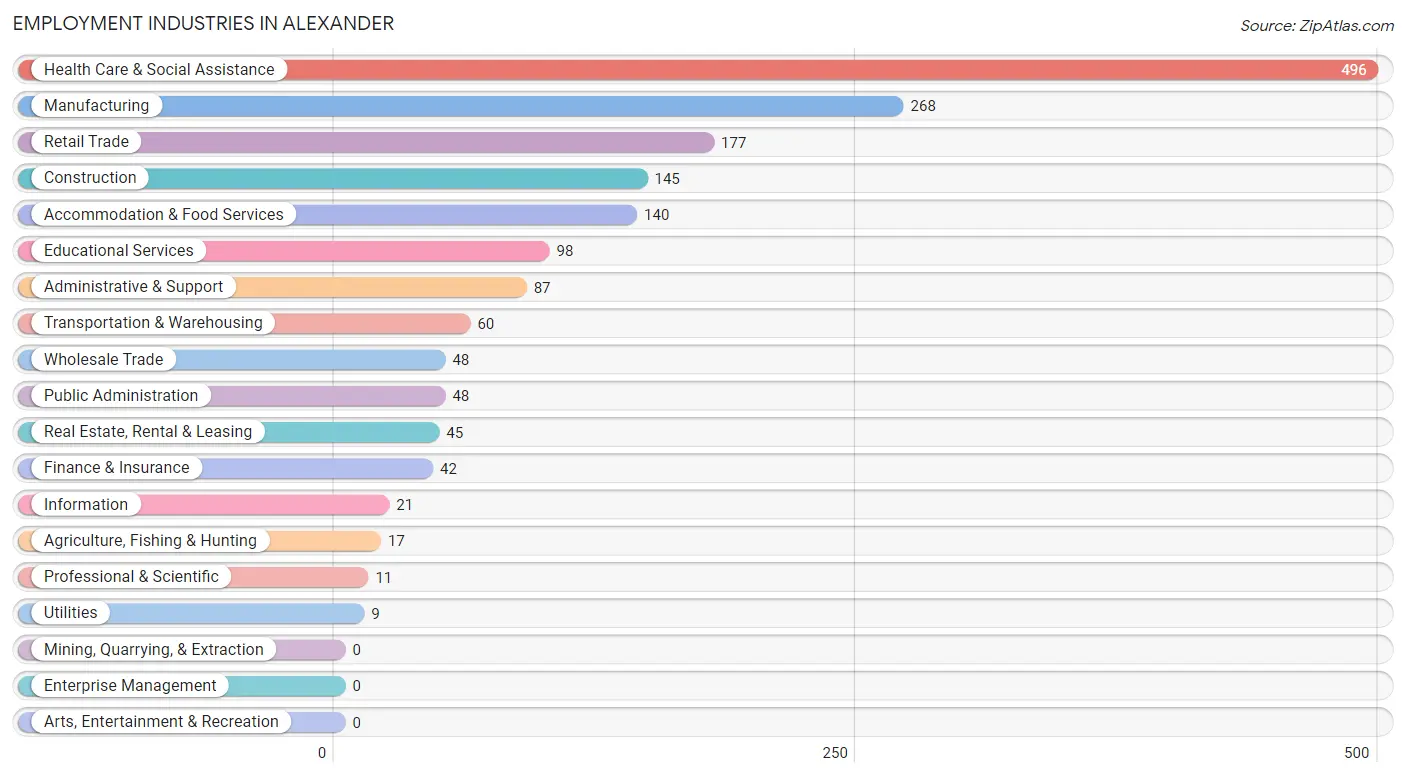
Employment Industries in Alexander
The major employment industries in Alexander include Health Care & Social Assistance (496 | 27.8%), Manufacturing (268 | 15.0%), Retail Trade (177 | 9.9%), Construction (145 | 8.1%), and Accommodation & Food Services (140 | 7.8%).
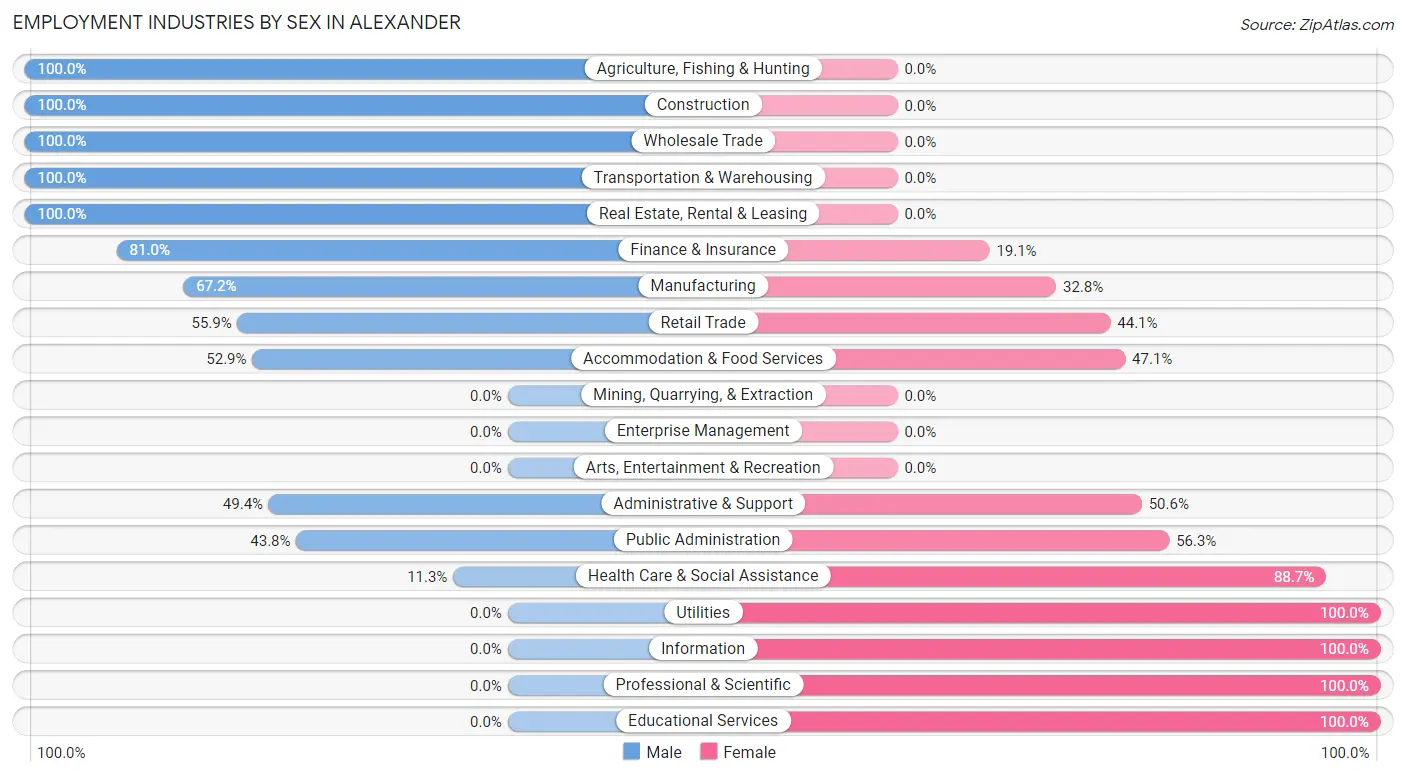
Employment Industries by Sex in Alexander
The Alexander industries that see more men than women are Agriculture, Fishing & Hunting (100.0%), Construction (100.0%), and Wholesale Trade (100.0%), whereas the industries that tend to have a higher number of women are Utilities (100.0%), Information (100.0%), and Professional & Scientific (100.0%).
| Industry | Male | Female |
| Agriculture, Fishing & Hunting | 17 (100.0%) | 0 (0.0%) |
| Mining, Quarrying, & Extraction | 0 (0.0%) | 0 (0.0%) |
| Construction | 145 (100.0%) | 0 (0.0%) |
| Manufacturing | 180 (67.2%) | 88 (32.8%) |
| Wholesale Trade | 48 (100.0%) | 0 (0.0%) |
| Retail Trade | 99 (55.9%) | 78 (44.1%) |
| Transportation & Warehousing | 60 (100.0%) | 0 (0.0%) |
| Utilities | 0 (0.0%) | 9 (100.0%) |
| Information | 0 (0.0%) | 21 (100.0%) |
| Finance & Insurance | 34 (80.9%) | 8 (19.1%) |
| Real Estate, Rental & Leasing | 45 (100.0%) | 0 (0.0%) |
| Professional & Scientific | 0 (0.0%) | 11 (100.0%) |
| Enterprise Management | 0 (0.0%) | 0 (0.0%) |
| Administrative & Support | 43 (49.4%) | 44 (50.6%) |
| Educational Services | 0 (0.0%) | 98 (100.0%) |
| Health Care & Social Assistance | 56 (11.3%) | 440 (88.7%) |
| Arts, Entertainment & Recreation | 0 (0.0%) | 0 (0.0%) |
| Accommodation & Food Services | 74 (52.9%) | 66 (47.1%) |
| Public Administration | 21 (43.8%) | 27 (56.2%) |
| Total | 858 (48.0%) | 929 (52.0%) |
Education in Alexander
School Enrollment in Alexander
The most common levels of schooling among the 1,085 students in Alexander are college / undergraduate (335 | 30.9%), high school (241 | 22.2%), and elementary school (206 | 19.0%).
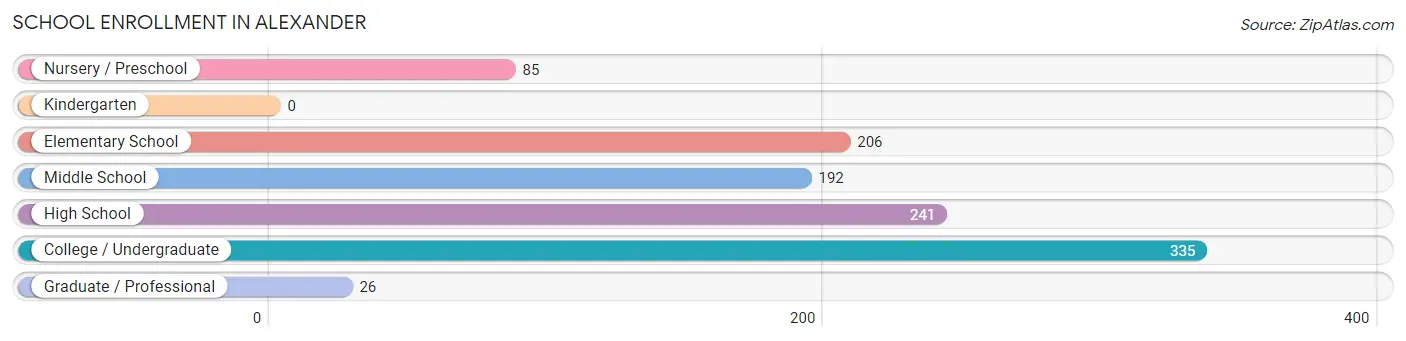
| School Level | # Students | % Students |
| Nursery / Preschool | 85 | 7.8% |
| Kindergarten | 0 | 0.0% |
| Elementary School | 206 | 19.0% |
| Middle School | 192 | 17.7% |
| High School | 241 | 22.2% |
| College / Undergraduate | 335 | 30.9% |
| Graduate / Professional | 26 | 2.4% |
| Total | 1,085 | 100.0% |
School Enrollment by Age by Funding Source in Alexander
Out of a total of 1,085 students who are enrolled in schools in Alexander, 259 (23.9%) attend a private institution, while the remaining 826 (76.1%) are enrolled in public schools. The age group of 25 to 34 year olds has the highest likelihood of being enrolled in private schools, with 236 (97.9% in the age bracket) enrolled. Conversely, the age group of 5 to 9 year old has the lowest likelihood of being enrolled in a private school, with 287 (100.0% in the age bracket) attending a public institution.
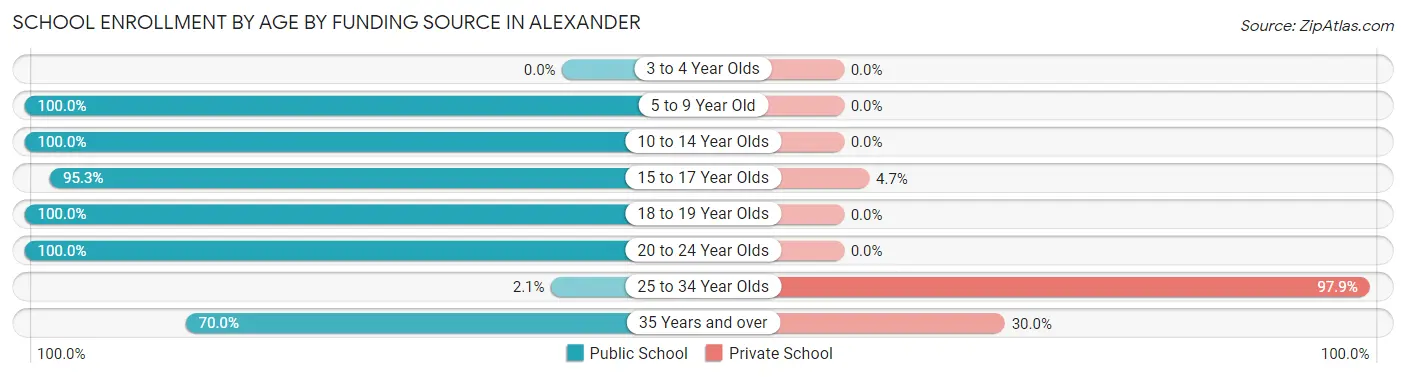
| Age Bracket | Public School | Private School |
| 3 to 4 Year Olds | 0 (0.0%) | 0 (0.0%) |
| 5 to 9 Year Old | 287 (100.0%) | 0 (0.0%) |
| 10 to 14 Year Olds | 212 (100.0%) | 0 (0.0%) |
| 15 to 17 Year Olds | 161 (95.3%) | 8 (4.7%) |
| 18 to 19 Year Olds | 71 (100.0%) | 0 (0.0%) |
| 20 to 24 Year Olds | 55 (100.0%) | 0 (0.0%) |
| 25 to 34 Year Olds | 5 (2.1%) | 236 (97.9%) |
| 35 Years and over | 35 (70.0%) | 15 (30.0%) |
| Total | 826 (76.1%) | 259 (23.9%) |
Educational Attainment by Field of Study in Alexander
Business (122 | 27.4%), science & technology (98 | 22.0%), bio, nature & agricultural (43 | 9.7%), computers & mathematics (34 | 7.6%), and education (29 | 6.5%) are the most common fields of study among 445 individuals in Alexander who have obtained a bachelor's degree or higher.
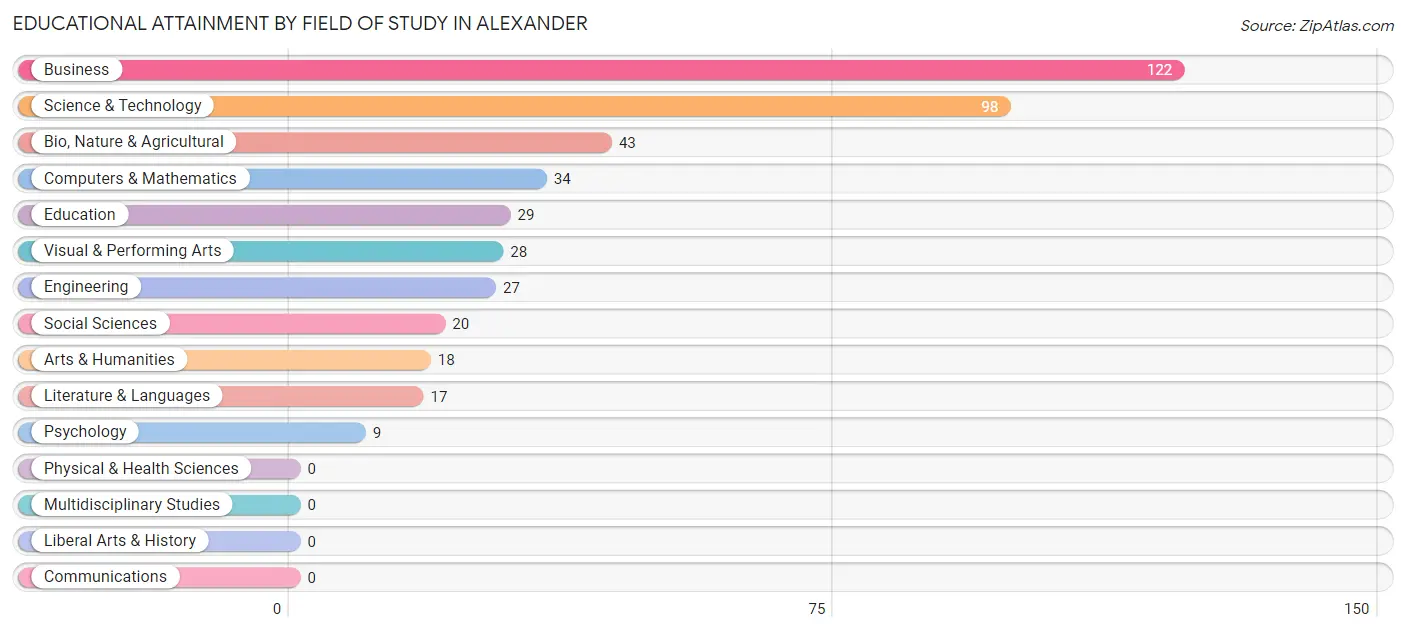
| Field of Study | # Graduates | % Graduates |
| Computers & Mathematics | 34 | 7.6% |
| Bio, Nature & Agricultural | 43 | 9.7% |
| Physical & Health Sciences | 0 | 0.0% |
| Psychology | 9 | 2.0% |
| Social Sciences | 20 | 4.5% |
| Engineering | 27 | 6.1% |
| Multidisciplinary Studies | 0 | 0.0% |
| Science & Technology | 98 | 22.0% |
| Business | 122 | 27.4% |
| Education | 29 | 6.5% |
| Literature & Languages | 17 | 3.8% |
| Liberal Arts & History | 0 | 0.0% |
| Visual & Performing Arts | 28 | 6.3% |
| Communications | 0 | 0.0% |
| Arts & Humanities | 18 | 4.0% |
| Total | 445 | 100.0% |
Transportation & Commute in Alexander
Vehicle Availability by Sex in Alexander
The most prevalent vehicle ownership categories in Alexander are males with 2 vehicles (464, accounting for 54.1%) and females with 2 vehicles (505, making up 55.6%).
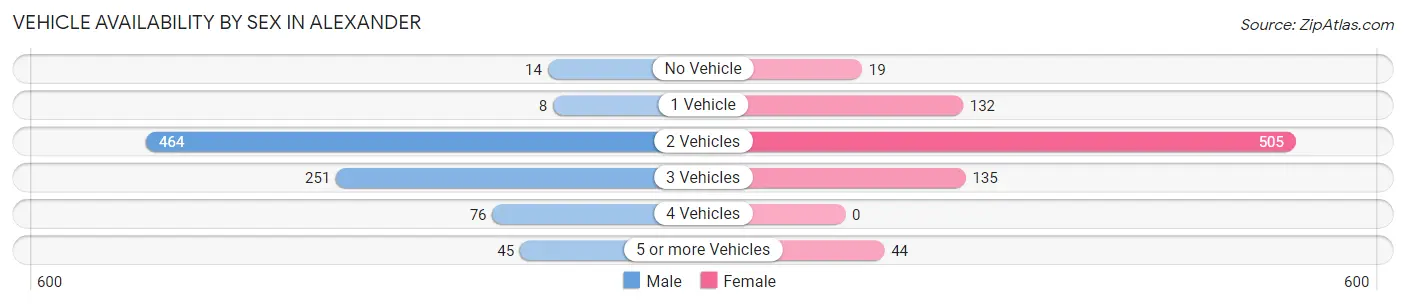
| Vehicles Available | Male | Female |
| No Vehicle | 14 (1.6%) | 19 (2.3%) |
| 1 Vehicle | 8 (0.9%) | 132 (15.8%) |
| 2 Vehicles | 464 (54.1%) | 505 (60.5%) |
| 3 Vehicles | 251 (29.2%) | 135 (16.2%) |
| 4 Vehicles | 76 (8.9%) | 0 (0.0%) |
| 5 or more Vehicles | 45 (5.2%) | 44 (5.3%) |
| Total | 858 (100.0%) | 835 (100.0%) |
Commute Time in Alexander
The most frequently occuring commute durations in Alexander are 20 to 24 minutes (471 commuters, 29.8%), 30 to 34 minutes (342 commuters, 21.7%), and 10 to 14 minutes (273 commuters, 17.3%).
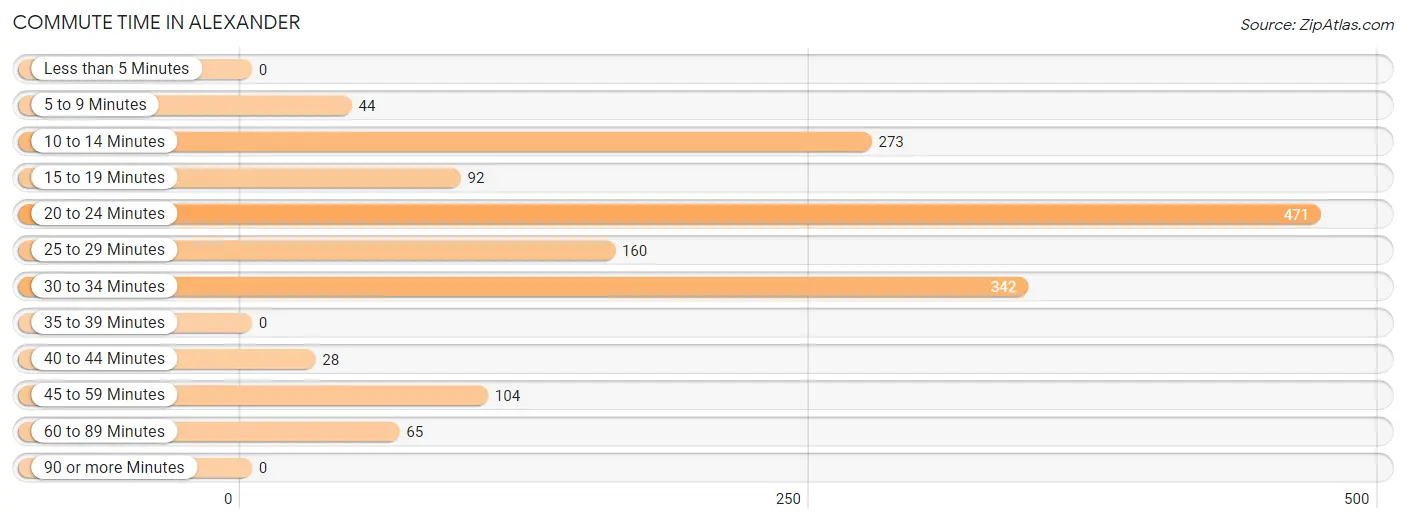
| Commute Time | # Commuters | % Commuters |
| Less than 5 Minutes | 0 | 0.0% |
| 5 to 9 Minutes | 44 | 2.8% |
| 10 to 14 Minutes | 273 | 17.3% |
| 15 to 19 Minutes | 92 | 5.8% |
| 20 to 24 Minutes | 471 | 29.8% |
| 25 to 29 Minutes | 160 | 10.1% |
| 30 to 34 Minutes | 342 | 21.7% |
| 35 to 39 Minutes | 0 | 0.0% |
| 40 to 44 Minutes | 28 | 1.8% |
| 45 to 59 Minutes | 104 | 6.6% |
| 60 to 89 Minutes | 65 | 4.1% |
| 90 or more Minutes | 0 | 0.0% |
Commute Time by Sex in Alexander
The most common commute times in Alexander are 20 to 24 minutes (313 commuters, 40.3%) for males and 30 to 34 minutes (251 commuters, 31.3%) for females.
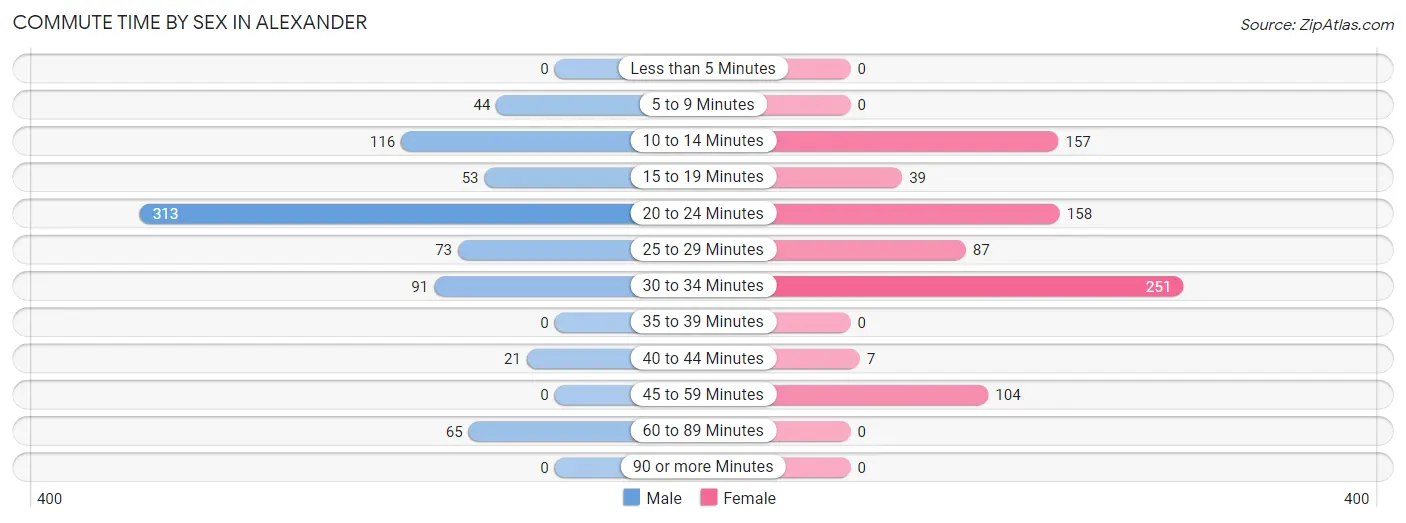
| Commute Time | Male | Female |
| Less than 5 Minutes | 0 (0.0%) | 0 (0.0%) |
| 5 to 9 Minutes | 44 (5.7%) | 0 (0.0%) |
| 10 to 14 Minutes | 116 (14.9%) | 157 (19.6%) |
| 15 to 19 Minutes | 53 (6.8%) | 39 (4.9%) |
| 20 to 24 Minutes | 313 (40.3%) | 158 (19.7%) |
| 25 to 29 Minutes | 73 (9.4%) | 87 (10.8%) |
| 30 to 34 Minutes | 91 (11.7%) | 251 (31.3%) |
| 35 to 39 Minutes | 0 (0.0%) | 0 (0.0%) |
| 40 to 44 Minutes | 21 (2.7%) | 7 (0.9%) |
| 45 to 59 Minutes | 0 (0.0%) | 104 (13.0%) |
| 60 to 89 Minutes | 65 (8.4%) | 0 (0.0%) |
| 90 or more Minutes | 0 (0.0%) | 0 (0.0%) |
Time of Departure to Work by Sex in Alexander
The most frequent times of departure to work in Alexander are 6:00 AM to 6:29 AM (193, 24.9%) for males and 7:00 AM to 7:29 AM (173, 21.5%) for females.
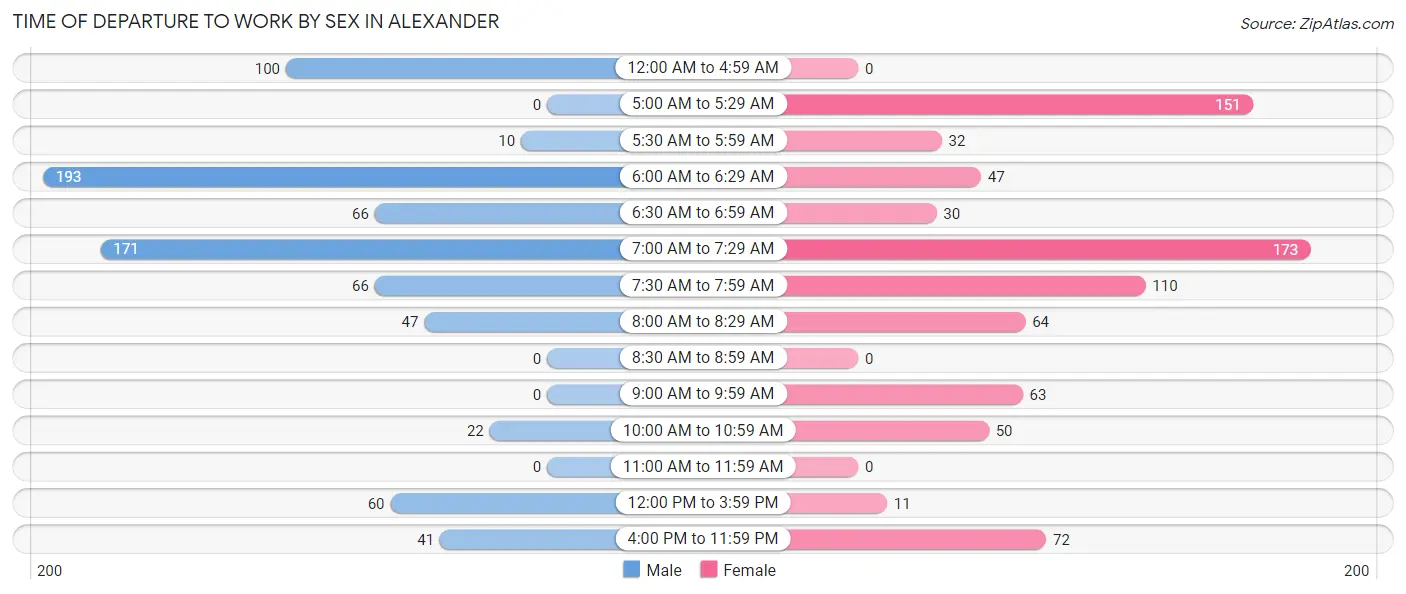
| Time of Departure | Male | Female |
| 12:00 AM to 4:59 AM | 100 (12.9%) | 0 (0.0%) |
| 5:00 AM to 5:29 AM | 0 (0.0%) | 151 (18.8%) |
| 5:30 AM to 5:59 AM | 10 (1.3%) | 32 (4.0%) |
| 6:00 AM to 6:29 AM | 193 (24.9%) | 47 (5.9%) |
| 6:30 AM to 6:59 AM | 66 (8.5%) | 30 (3.7%) |
| 7:00 AM to 7:29 AM | 171 (22.0%) | 173 (21.5%) |
| 7:30 AM to 7:59 AM | 66 (8.5%) | 110 (13.7%) |
| 8:00 AM to 8:29 AM | 47 (6.1%) | 64 (8.0%) |
| 8:30 AM to 8:59 AM | 0 (0.0%) | 0 (0.0%) |
| 9:00 AM to 9:59 AM | 0 (0.0%) | 63 (7.9%) |
| 10:00 AM to 10:59 AM | 22 (2.8%) | 50 (6.2%) |
| 11:00 AM to 11:59 AM | 0 (0.0%) | 0 (0.0%) |
| 12:00 PM to 3:59 PM | 60 (7.7%) | 11 (1.4%) |
| 4:00 PM to 11:59 PM | 41 (5.3%) | 72 (9.0%) |
| Total | 776 (100.0%) | 803 (100.0%) |
Housing Occupancy in Alexander
Occupancy by Ownership in Alexander
Of the total 1,199 dwellings in Alexander, owner-occupied units account for 979 (81.7%), while renter-occupied units make up 220 (18.3%).
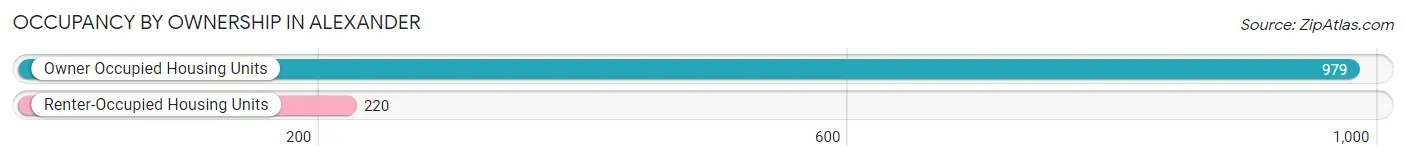
| Occupancy | # Housing Units | % Housing Units |
| Owner Occupied Housing Units | 979 | 81.7% |
| Renter-Occupied Housing Units | 220 | 18.3% |
| Total Occupied Housing Units | 1,199 | 100.0% |
Occupancy by Household Size in Alexander
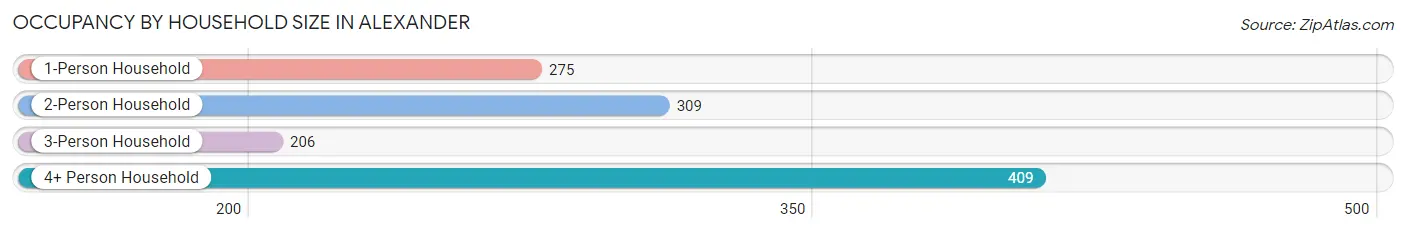
| Household Size | # Housing Units | % Housing Units |
| 1-Person Household | 275 | 22.9% |
| 2-Person Household | 309 | 25.8% |
| 3-Person Household | 206 | 17.2% |
| 4+ Person Household | 409 | 34.1% |
| Total Housing Units | 1,199 | 100.0% |
Occupancy by Ownership by Household Size in Alexander
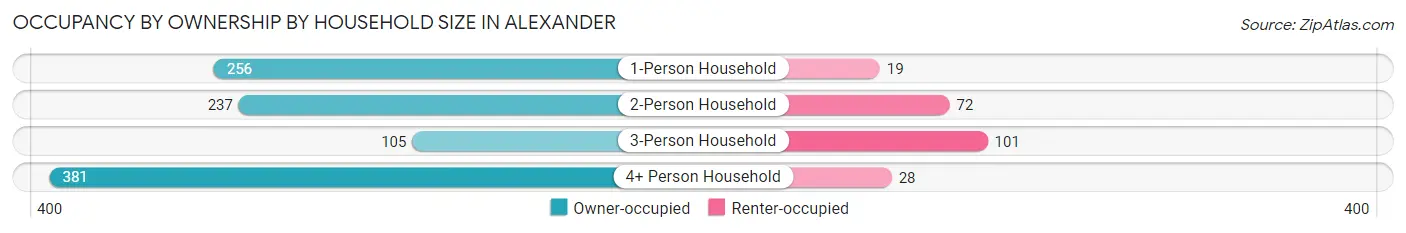
| Household Size | Owner-occupied | Renter-occupied |
| 1-Person Household | 256 (93.1%) | 19 (6.9%) |
| 2-Person Household | 237 (76.7%) | 72 (23.3%) |
| 3-Person Household | 105 (51.0%) | 101 (49.0%) |
| 4+ Person Household | 381 (93.1%) | 28 (6.9%) |
| Total Housing Units | 979 (81.7%) | 220 (18.3%) |
Occupancy by Educational Attainment in Alexander
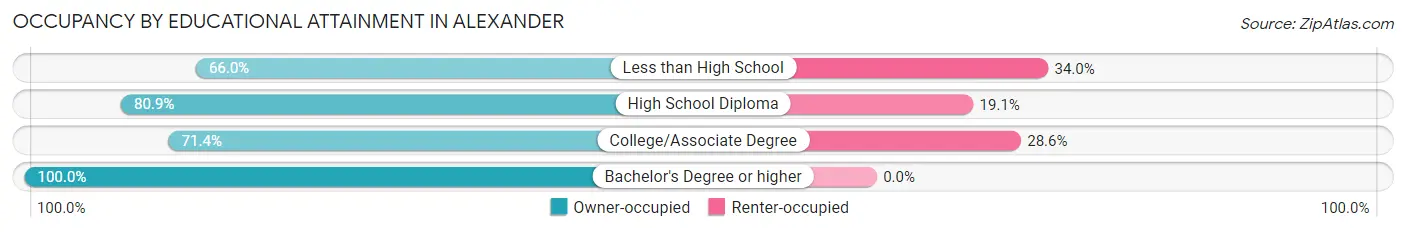
| Household Size | Owner-occupied | Renter-occupied |
| Less than High School | 136 (66.0%) | 70 (34.0%) |
| High School Diploma | 296 (80.9%) | 70 (19.1%) |
| College/Associate Degree | 200 (71.4%) | 80 (28.6%) |
| Bachelor's Degree or higher | 347 (100.0%) | 0 (0.0%) |
Occupancy by Age of Householder in Alexander
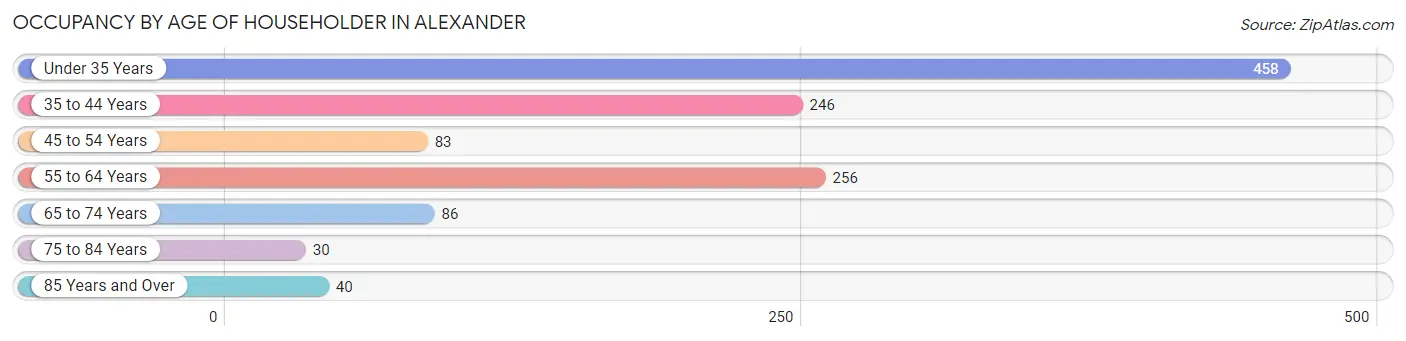
| Age Bracket | # Households | % Households |
| Under 35 Years | 458 | 38.2% |
| 35 to 44 Years | 246 | 20.5% |
| 45 to 54 Years | 83 | 6.9% |
| 55 to 64 Years | 256 | 21.3% |
| 65 to 74 Years | 86 | 7.2% |
| 75 to 84 Years | 30 | 2.5% |
| 85 Years and Over | 40 | 3.3% |
| Total | 1,199 | 100.0% |
Housing Finances in Alexander
Median Income by Occupancy in Alexander
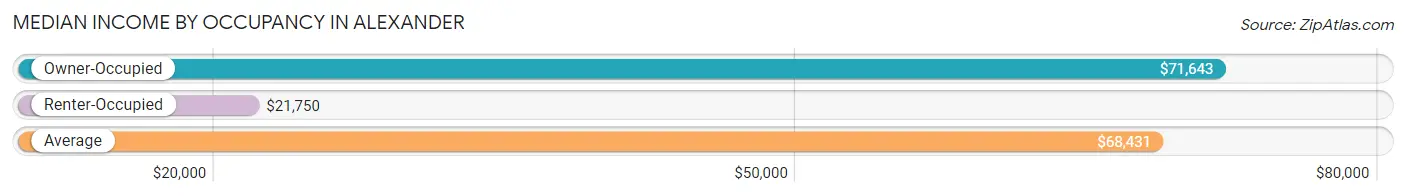
| Occupancy Type | # Households | Median Income |
| Owner-Occupied | 979 (81.7%) | $71,643 |
| Renter-Occupied | 220 (18.3%) | $21,750 |
| Average | 1,199 (100.0%) | $68,431 |
Occupancy by Householder Income Bracket in Alexander
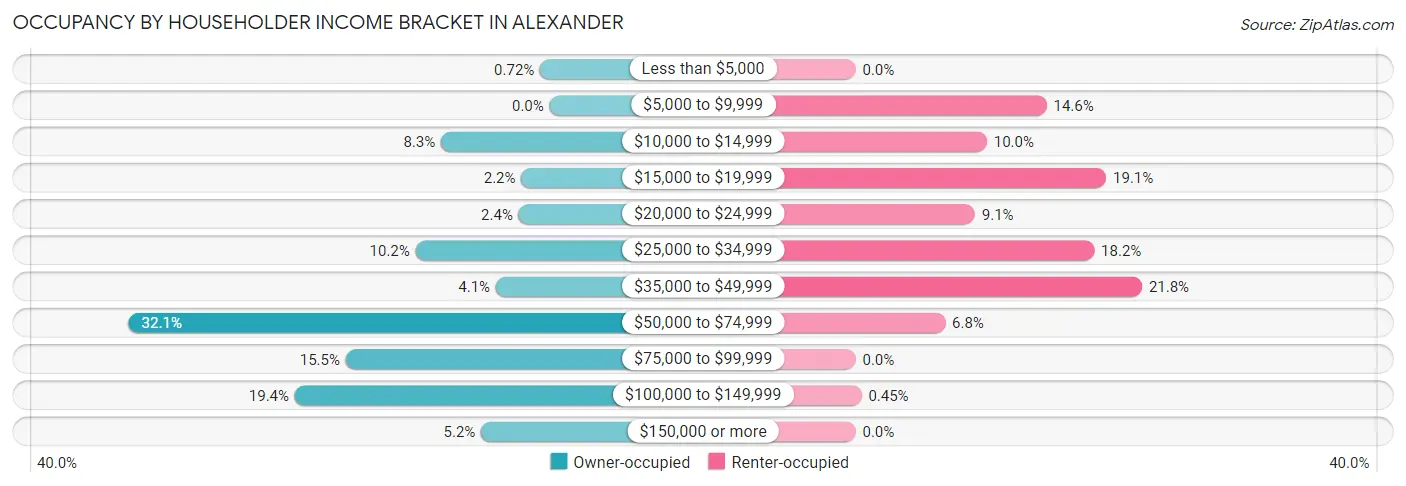
| Income Bracket | Owner-occupied | Renter-occupied |
| Less than $5,000 | 7 (0.7%) | 0 (0.0%) |
| $5,000 to $9,999 | 0 (0.0%) | 32 (14.5%) |
| $10,000 to $14,999 | 81 (8.3%) | 22 (10.0%) |
| $15,000 to $19,999 | 21 (2.1%) | 42 (19.1%) |
| $20,000 to $24,999 | 23 (2.4%) | 20 (9.1%) |
| $25,000 to $34,999 | 100 (10.2%) | 40 (18.2%) |
| $35,000 to $49,999 | 40 (4.1%) | 48 (21.8%) |
| $50,000 to $74,999 | 314 (32.1%) | 15 (6.8%) |
| $75,000 to $99,999 | 152 (15.5%) | 0 (0.0%) |
| $100,000 to $149,999 | 190 (19.4%) | 1 (0.4%) |
| $150,000 or more | 51 (5.2%) | 0 (0.0%) |
| Total | 979 (100.0%) | 220 (100.0%) |
Monthly Housing Cost Tiers in Alexander
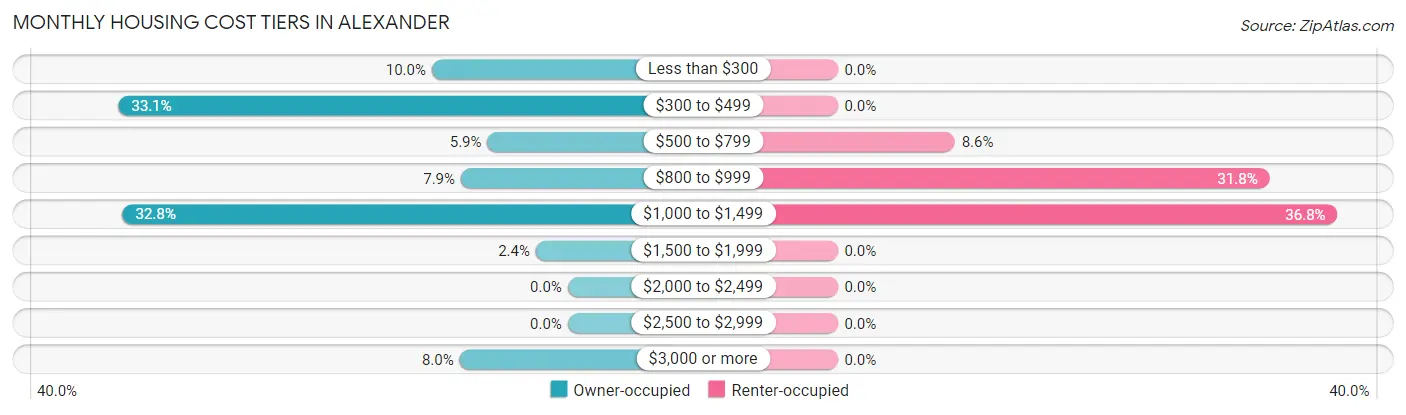
| Monthly Cost | Owner-occupied | Renter-occupied |
| Less than $300 | 98 (10.0%) | 0 (0.0%) |
| $300 to $499 | 324 (33.1%) | 0 (0.0%) |
| $500 to $799 | 58 (5.9%) | 19 (8.6%) |
| $800 to $999 | 77 (7.9%) | 70 (31.8%) |
| $1,000 to $1,499 | 321 (32.8%) | 81 (36.8%) |
| $1,500 to $1,999 | 23 (2.4%) | 0 (0.0%) |
| $2,000 to $2,499 | 0 (0.0%) | 0 (0.0%) |
| $2,500 to $2,999 | 0 (0.0%) | 0 (0.0%) |
| $3,000 or more | 78 (8.0%) | 0 (0.0%) |
| Total | 979 (100.0%) | 220 (100.0%) |
Physical Housing Characteristics in Alexander
Housing Structures in Alexander
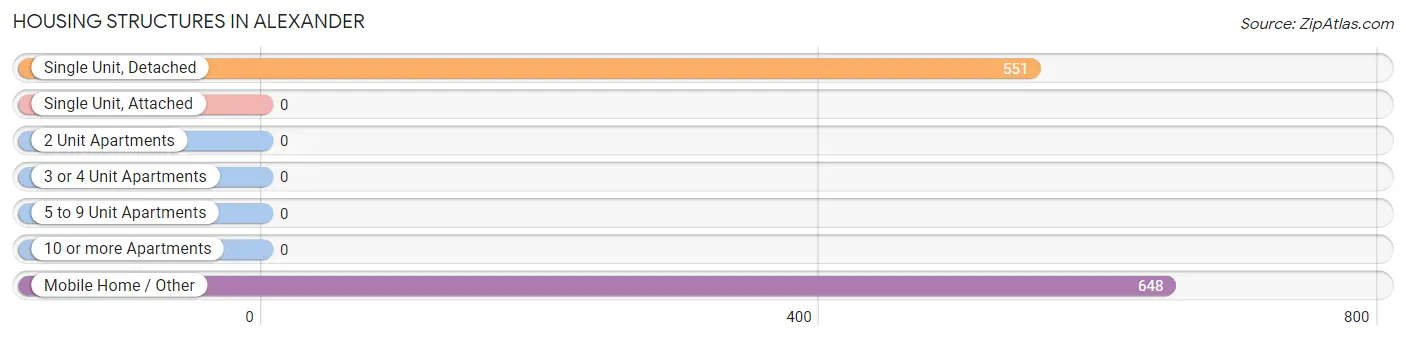
| Structure Type | # Housing Units | % Housing Units |
| Single Unit, Detached | 551 | 46.0% |
| Single Unit, Attached | 0 | 0.0% |
| 2 Unit Apartments | 0 | 0.0% |
| 3 or 4 Unit Apartments | 0 | 0.0% |
| 5 to 9 Unit Apartments | 0 | 0.0% |
| 10 or more Apartments | 0 | 0.0% |
| Mobile Home / Other | 648 | 54.0% |
| Total | 1,199 | 100.0% |
Housing Structures by Occupancy in Alexander
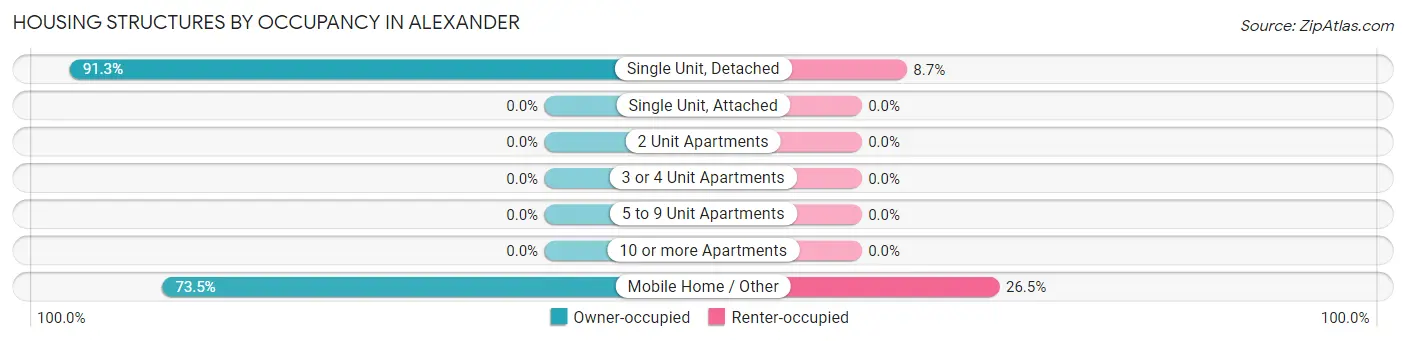
| Structure Type | Owner-occupied | Renter-occupied |
| Single Unit, Detached | 503 (91.3%) | 48 (8.7%) |
| Single Unit, Attached | 0 (0.0%) | 0 (0.0%) |
| 2 Unit Apartments | 0 (0.0%) | 0 (0.0%) |
| 3 or 4 Unit Apartments | 0 (0.0%) | 0 (0.0%) |
| 5 to 9 Unit Apartments | 0 (0.0%) | 0 (0.0%) |
| 10 or more Apartments | 0 (0.0%) | 0 (0.0%) |
| Mobile Home / Other | 476 (73.5%) | 172 (26.5%) |
| Total | 979 (81.7%) | 220 (18.3%) |
Housing Structures by Number of Rooms in Alexander
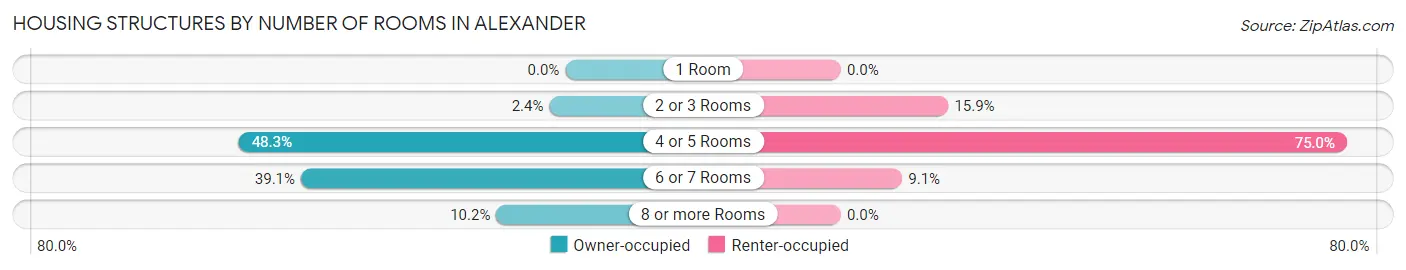
| Number of Rooms | Owner-occupied | Renter-occupied |
| 1 Room | 0 (0.0%) | 0 (0.0%) |
| 2 or 3 Rooms | 23 (2.4%) | 35 (15.9%) |
| 4 or 5 Rooms | 473 (48.3%) | 165 (75.0%) |
| 6 or 7 Rooms | 383 (39.1%) | 20 (9.1%) |
| 8 or more Rooms | 100 (10.2%) | 0 (0.0%) |
| Total | 979 (100.0%) | 220 (100.0%) |
Housing Structure by Heating Type in Alexander
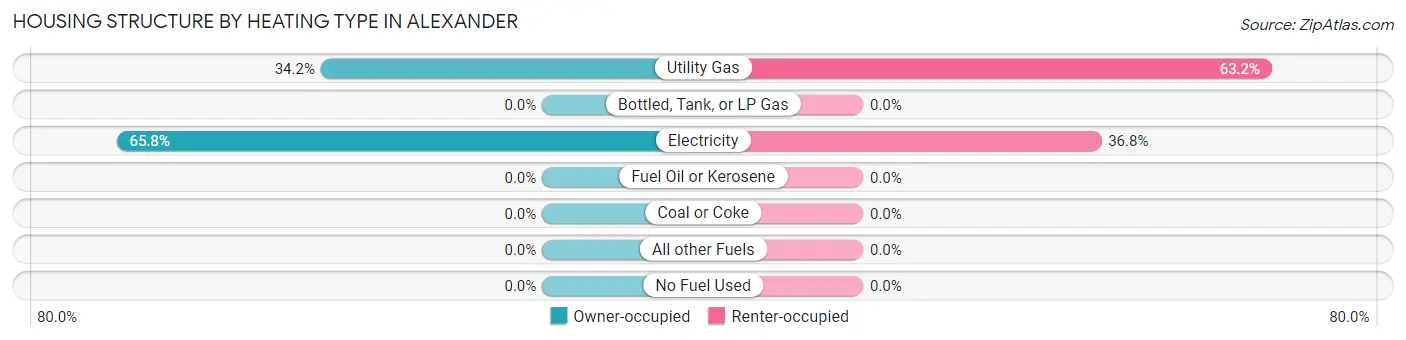
| Heating Type | Owner-occupied | Renter-occupied |
| Utility Gas | 335 (34.2%) | 139 (63.2%) |
| Bottled, Tank, or LP Gas | 0 (0.0%) | 0 (0.0%) |
| Electricity | 644 (65.8%) | 81 (36.8%) |
| Fuel Oil or Kerosene | 0 (0.0%) | 0 (0.0%) |
| Coal or Coke | 0 (0.0%) | 0 (0.0%) |
| All other Fuels | 0 (0.0%) | 0 (0.0%) |
| No Fuel Used | 0 (0.0%) | 0 (0.0%) |
| Total | 979 (100.0%) | 220 (100.0%) |
Household Vehicle Usage in Alexander
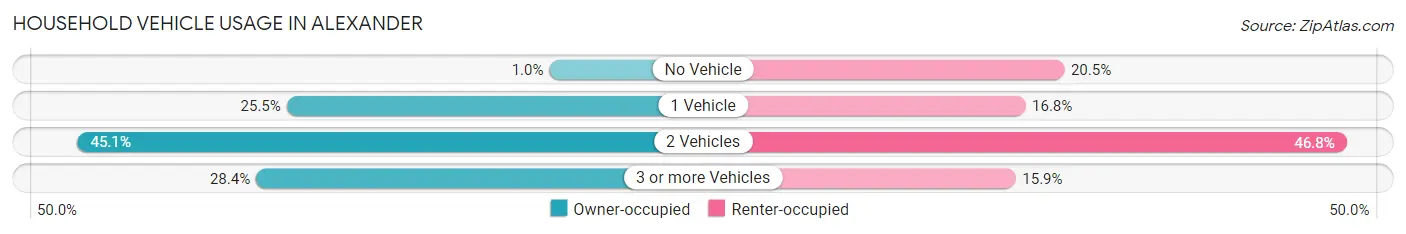
| Vehicles per Household | Owner-occupied | Renter-occupied |
| No Vehicle | 10 (1.0%) | 45 (20.4%) |
| 1 Vehicle | 250 (25.5%) | 37 (16.8%) |
| 2 Vehicles | 441 (45.1%) | 103 (46.8%) |
| 3 or more Vehicles | 278 (28.4%) | 35 (15.9%) |
| Total | 979 (100.0%) | 220 (100.0%) |
Real Estate & Mortgages in Alexander
Real Estate and Mortgage Overview in Alexander
| Characteristic | Without Mortgage | With Mortgage |
| Housing Units | 490 | 489 |
| Median Property Value | $69,300 | $155,700 |
| Median Household Income | $69,202 | $24 |
| Monthly Housing Costs | $338 | $0 |
| Real Estate Taxes | $404 | $29 |
Property Value by Mortgage Status in Alexander
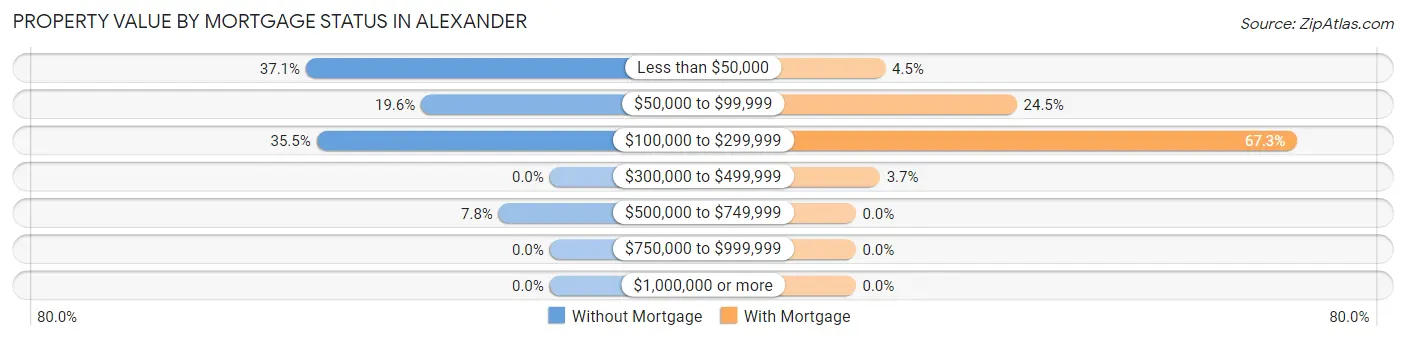
| Property Value | Without Mortgage | With Mortgage |
| Less than $50,000 | 182 (37.1%) | 22 (4.5%) |
| $50,000 to $99,999 | 96 (19.6%) | 120 (24.5%) |
| $100,000 to $299,999 | 174 (35.5%) | 329 (67.3%) |
| $300,000 to $499,999 | 0 (0.0%) | 18 (3.7%) |
| $500,000 to $749,999 | 38 (7.8%) | 0 (0.0%) |
| $750,000 to $999,999 | 0 (0.0%) | 0 (0.0%) |
| $1,000,000 or more | 0 (0.0%) | 0 (0.0%) |
| Total | 490 (100.0%) | 489 (100.0%) |
Household Income by Mortgage Status in Alexander
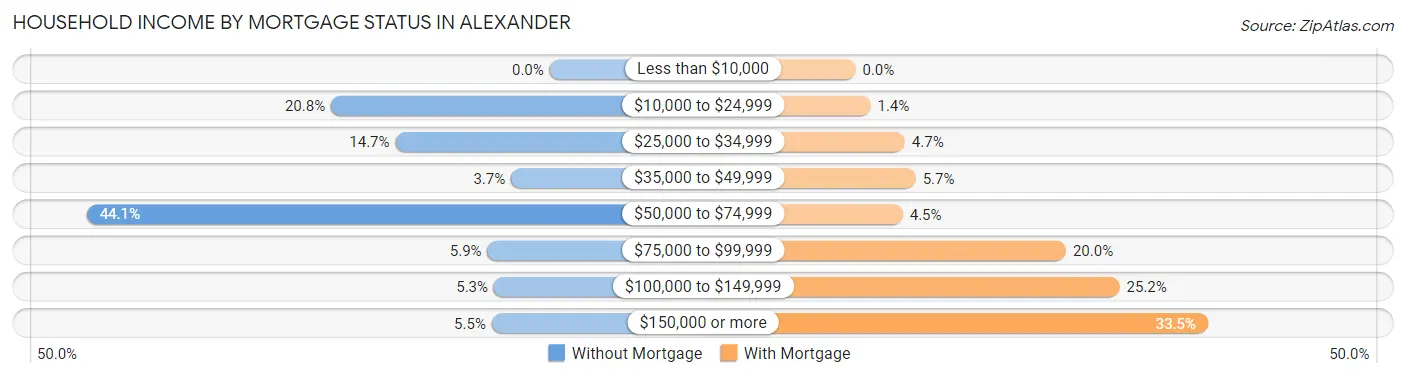
| Household Income | Without Mortgage | With Mortgage |
| Less than $10,000 | 0 (0.0%) | 0 (0.0%) |
| $10,000 to $24,999 | 102 (20.8%) | 7 (1.4%) |
| $25,000 to $34,999 | 72 (14.7%) | 23 (4.7%) |
| $35,000 to $49,999 | 18 (3.7%) | 28 (5.7%) |
| $50,000 to $74,999 | 216 (44.1%) | 22 (4.5%) |
| $75,000 to $99,999 | 29 (5.9%) | 98 (20.0%) |
| $100,000 to $149,999 | 26 (5.3%) | 123 (25.2%) |
| $150,000 or more | 27 (5.5%) | 164 (33.5%) |
| Total | 490 (100.0%) | 489 (100.0%) |
Property Value to Household Income Ratio in Alexander
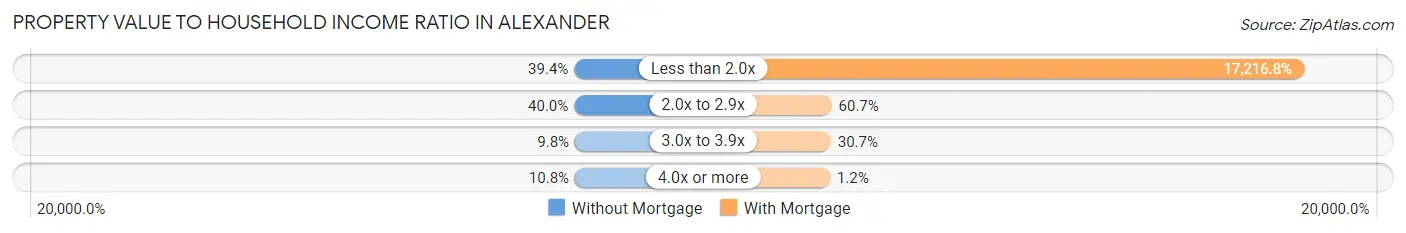
| Value-to-Income Ratio | Without Mortgage | With Mortgage |
| Less than 2.0x | 193 (39.4%) | 84,190 (17,216.8%) |
| 2.0x to 2.9x | 196 (40.0%) | 297 (60.7%) |
| 3.0x to 3.9x | 48 (9.8%) | 150 (30.7%) |
| 4.0x or more | 53 (10.8%) | 6 (1.2%) |
| Total | 490 (100.0%) | 489 (100.0%) |
Real Estate Taxes by Mortgage Status in Alexander
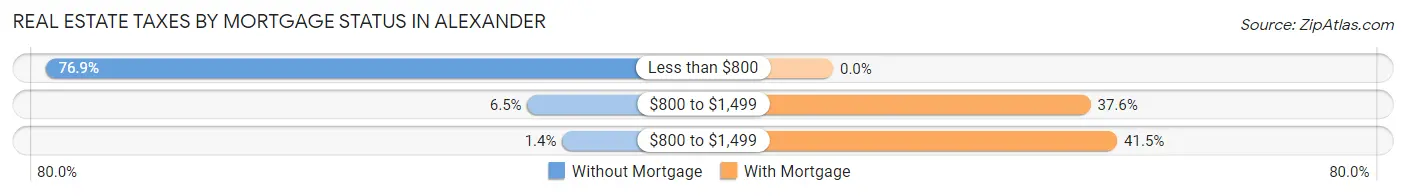
| Property Taxes | Without Mortgage | With Mortgage |
| Less than $800 | 377 (76.9%) | 0 (0.0%) |
| $800 to $1,499 | 32 (6.5%) | 184 (37.6%) |
| $800 to $1,499 | 7 (1.4%) | 203 (41.5%) |
| Total | 490 (100.0%) | 489 (100.0%) |
Health & Disability in Alexander
Health Insurance Coverage by Age in Alexander
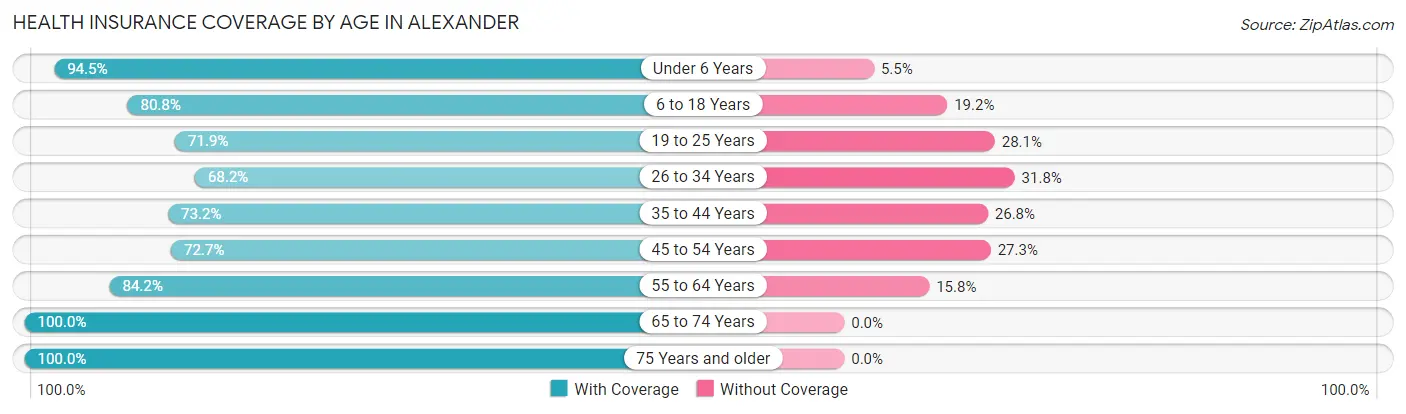
| Age Bracket | With Coverage | Without Coverage |
| Under 6 Years | 359 (94.5%) | 21 (5.5%) |
| 6 to 18 Years | 526 (80.8%) | 125 (19.2%) |
| 19 to 25 Years | 241 (71.9%) | 94 (28.1%) |
| 26 to 34 Years | 436 (68.2%) | 203 (31.8%) |
| 35 to 44 Years | 320 (73.2%) | 117 (26.8%) |
| 45 to 54 Years | 173 (72.7%) | 65 (27.3%) |
| 55 to 64 Years | 457 (84.2%) | 86 (15.8%) |
| 65 to 74 Years | 151 (100.0%) | 0 (0.0%) |
| 75 Years and older | 70 (100.0%) | 0 (0.0%) |
| Total | 2,733 (79.4%) | 711 (20.6%) |
Health Insurance Coverage by Citizenship Status in Alexander
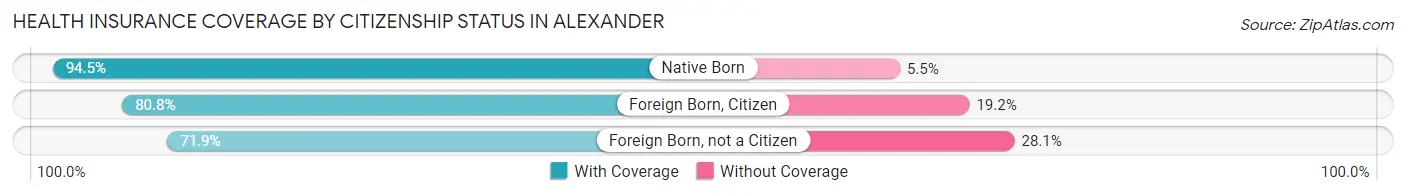
| Citizenship Status | With Coverage | Without Coverage |
| Native Born | 359 (94.5%) | 21 (5.5%) |
| Foreign Born, Citizen | 526 (80.8%) | 125 (19.2%) |
| Foreign Born, not a Citizen | 241 (71.9%) | 94 (28.1%) |
Health Insurance Coverage by Household Income in Alexander
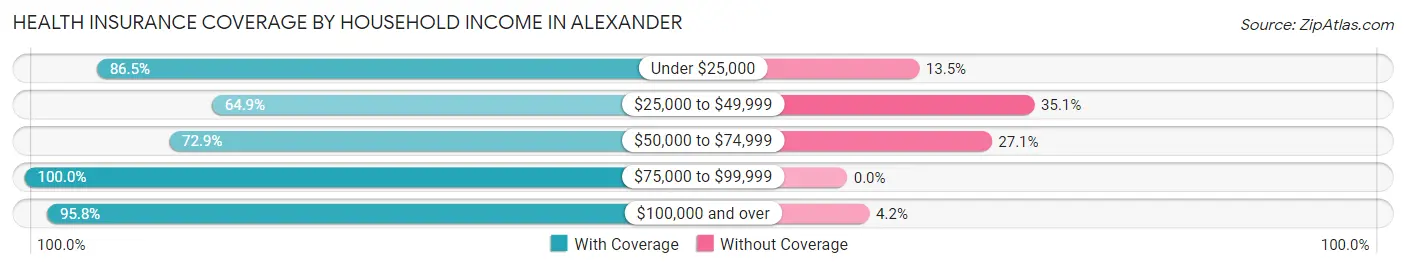
| Household Income | With Coverage | Without Coverage |
| Under $25,000 | 480 (86.5%) | 75 (13.5%) |
| $25,000 to $49,999 | 566 (64.9%) | 306 (35.1%) |
| $50,000 to $74,999 | 816 (72.9%) | 303 (27.1%) |
| $75,000 to $99,999 | 238 (100.0%) | 0 (0.0%) |
| $100,000 and over | 617 (95.8%) | 27 (4.2%) |
Public vs Private Health Insurance Coverage by Age in Alexander
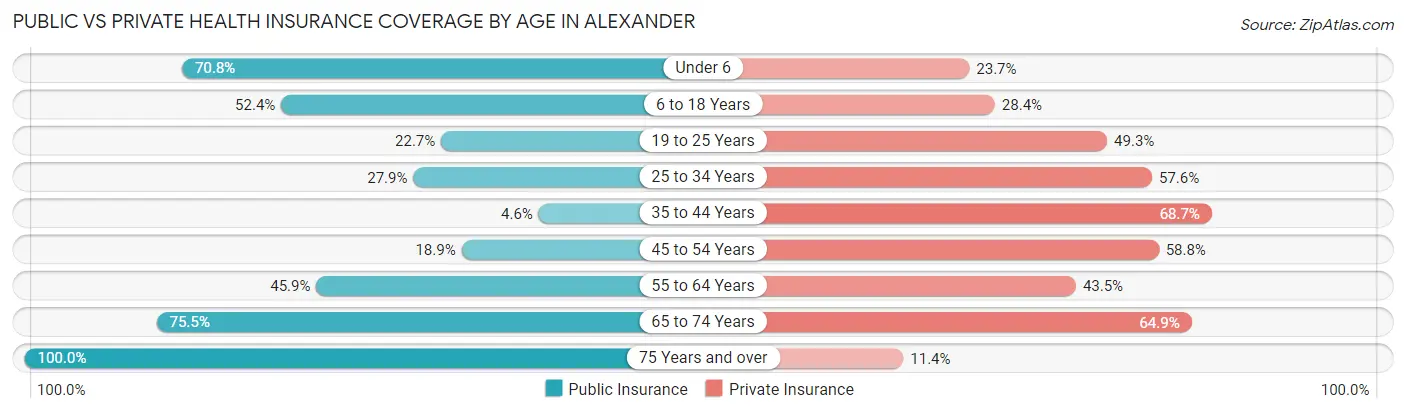
| Age Bracket | Public Insurance | Private Insurance |
| Under 6 | 269 (70.8%) | 90 (23.7%) |
| 6 to 18 Years | 341 (52.4%) | 185 (28.4%) |
| 19 to 25 Years | 76 (22.7%) | 165 (49.2%) |
| 25 to 34 Years | 178 (27.9%) | 368 (57.6%) |
| 35 to 44 Years | 20 (4.6%) | 300 (68.6%) |
| 45 to 54 Years | 45 (18.9%) | 140 (58.8%) |
| 55 to 64 Years | 249 (45.9%) | 236 (43.5%) |
| 65 to 74 Years | 114 (75.5%) | 98 (64.9%) |
| 75 Years and over | 70 (100.0%) | 8 (11.4%) |
| Total | 1,362 (39.6%) | 1,590 (46.2%) |
Disability Status by Sex by Age in Alexander
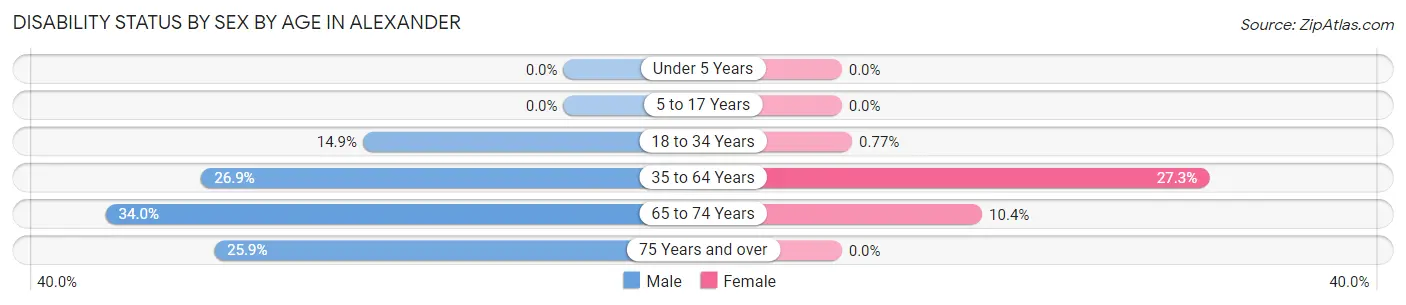
| Age Bracket | Male | Female |
| Under 5 Years | 0 (0.0%) | 0 (0.0%) |
| 5 to 17 Years | 0 (0.0%) | 0 (0.0%) |
| 18 to 34 Years | 78 (14.9%) | 4 (0.8%) |
| 35 to 64 Years | 140 (26.9%) | 190 (27.3%) |
| 65 to 74 Years | 35 (34.0%) | 5 (10.4%) |
| 75 Years and over | 14 (25.9%) | 0 (0.0%) |
Disability Class by Sex by Age in Alexander
Disability Class: Hearing Difficulty
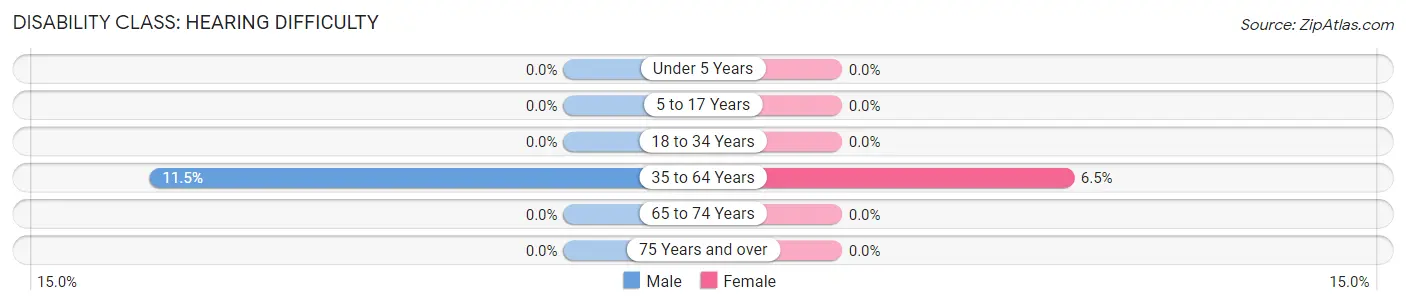
| Age Bracket | Male | Female |
| Under 5 Years | 0 (0.0%) | 0 (0.0%) |
| 5 to 17 Years | 0 (0.0%) | 0 (0.0%) |
| 18 to 34 Years | 0 (0.0%) | 0 (0.0%) |
| 35 to 64 Years | 60 (11.5%) | 45 (6.5%) |
| 65 to 74 Years | 0 (0.0%) | 0 (0.0%) |
| 75 Years and over | 0 (0.0%) | 0 (0.0%) |
Disability Class: Vision Difficulty
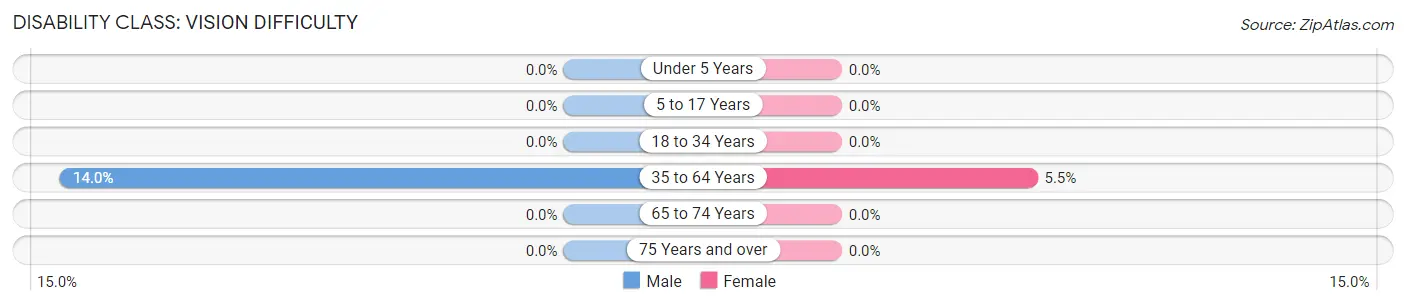
| Age Bracket | Male | Female |
| Under 5 Years | 0 (0.0%) | 0 (0.0%) |
| 5 to 17 Years | 0 (0.0%) | 0 (0.0%) |
| 18 to 34 Years | 0 (0.0%) | 0 (0.0%) |
| 35 to 64 Years | 73 (14.0%) | 38 (5.4%) |
| 65 to 74 Years | 0 (0.0%) | 0 (0.0%) |
| 75 Years and over | 0 (0.0%) | 0 (0.0%) |
Disability Class: Cognitive Difficulty
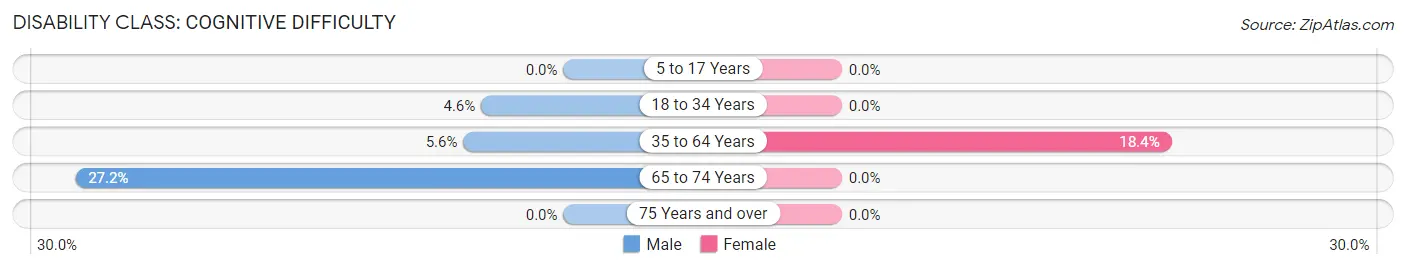
| Age Bracket | Male | Female |
| 5 to 17 Years | 0 (0.0%) | 0 (0.0%) |
| 18 to 34 Years | 24 (4.6%) | 0 (0.0%) |
| 35 to 64 Years | 29 (5.6%) | 128 (18.4%) |
| 65 to 74 Years | 28 (27.2%) | 0 (0.0%) |
| 75 Years and over | 0 (0.0%) | 0 (0.0%) |
Disability Class: Ambulatory Difficulty
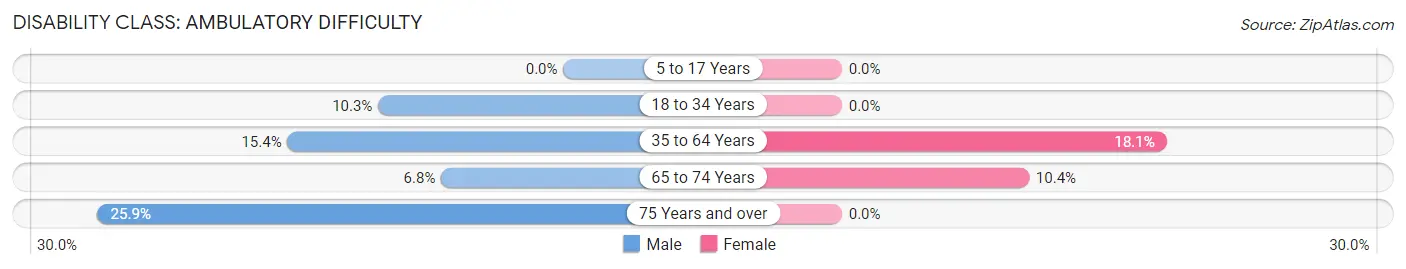
| Age Bracket | Male | Female |
| 5 to 17 Years | 0 (0.0%) | 0 (0.0%) |
| 18 to 34 Years | 54 (10.3%) | 0 (0.0%) |
| 35 to 64 Years | 80 (15.4%) | 126 (18.1%) |
| 65 to 74 Years | 7 (6.8%) | 5 (10.4%) |
| 75 Years and over | 14 (25.9%) | 0 (0.0%) |
Disability Class: Self-Care Difficulty
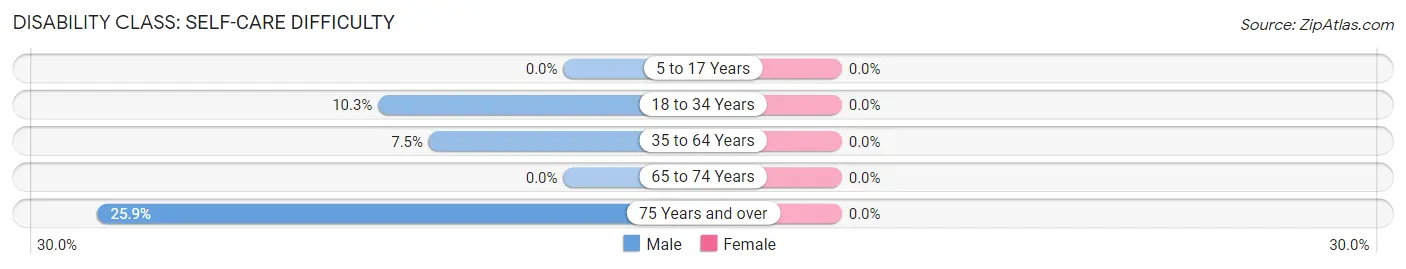
| Age Bracket | Male | Female |
| 5 to 17 Years | 0 (0.0%) | 0 (0.0%) |
| 18 to 34 Years | 54 (10.3%) | 0 (0.0%) |
| 35 to 64 Years | 39 (7.5%) | 0 (0.0%) |
| 65 to 74 Years | 0 (0.0%) | 0 (0.0%) |
| 75 Years and over | 14 (25.9%) | 0 (0.0%) |
Technology Access in Alexander
Computing Device Access in Alexander
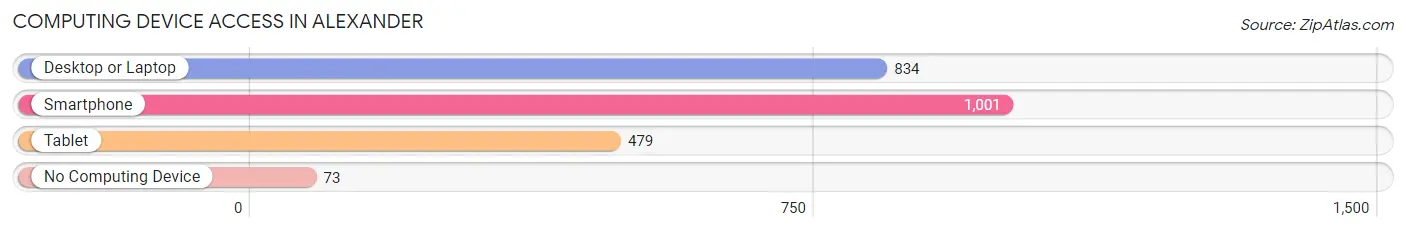
| Device Type | # Households | % Households |
| Desktop or Laptop | 834 | 69.6% |
| Smartphone | 1,001 | 83.5% |
| Tablet | 479 | 40.0% |
| No Computing Device | 73 | 6.1% |
| Total | 1,199 | 100.0% |
Internet Access in Alexander
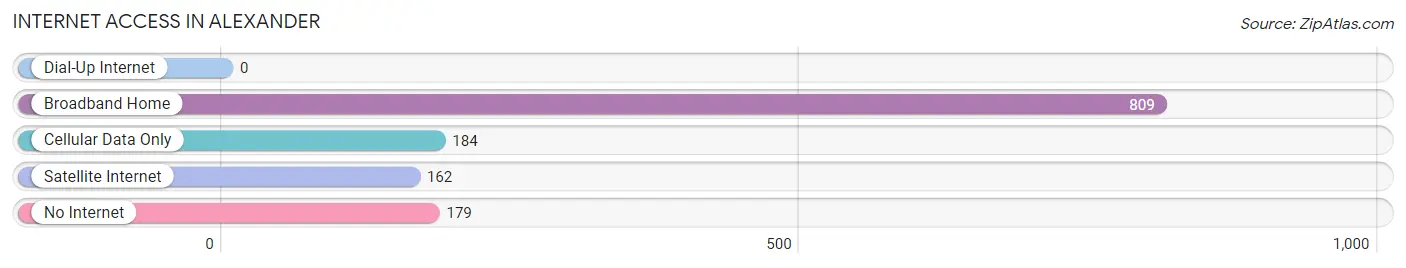
| Internet Type | # Households | % Households |
| Dial-Up Internet | 0 | 0.0% |
| Broadband Home | 809 | 67.5% |
| Cellular Data Only | 184 | 15.3% |
| Satellite Internet | 162 | 13.5% |
| No Internet | 179 | 14.9% |
| Total | 1,199 | 100.0% |
Alexander Summary
Alexander, Arkansas is a small city located in Saline County, Arkansas. It is situated in the foothills of the Ouachita Mountains, approximately 20 miles south of Little Rock. The city has a population of approximately 4,000 people and is part of the Little Rock-North Little Rock-Conway Metropolitan Statistical Area.
History
Alexander was founded in 1876 by a group of settlers from the nearby town of Benton. The town was named after Alexander McRae, a prominent local landowner. The town was incorporated in 1891 and was the first town in Saline County to be incorporated.
Alexander was a small farming community until the early 1900s when the railroad came to town. This allowed the town to become a shipping center for the surrounding area. The town also became a popular stop for travelers on the railroad.
In the 1920s, Alexander began to experience a period of growth and development. The town was home to several businesses, including a cotton gin, a sawmill, and a brick factory. The town also had a movie theater, a hotel, and several churches.
Geography
Alexander is located in the foothills of the Ouachita Mountains in central Arkansas. The city is situated in the Saline River Valley, which is part of the Arkansas River Valley. The city is located approximately 20 miles south of Little Rock and is part of the Little Rock-North Little Rock-Conway Metropolitan Statistical Area.
The city has a total area of 4.2 square miles, all of which is land. The city is located at an elevation of 545 feet above sea level. The climate in Alexander is humid subtropical, with hot, humid summers and mild winters.
Economy
Alexander’s economy is largely based on agriculture and manufacturing. The city is home to several manufacturing plants, including a poultry processing plant, a wood products plant, and a plastics plant. The city is also home to several agricultural businesses, including a cotton gin, a grain elevator, and a feed mill.
The city is also home to several retail businesses, including a grocery store, a hardware store, and several restaurants. The city is also home to several service businesses, including a bank, a post office, and a medical clinic.
Demographics
As of the 2010 census, Alexander had a population of 4,034 people. The racial makeup of the city was 79.3% White, 17.2% African American, 0.4% Native American, 0.7% Asian, 0.1% Pacific Islander, and 2.3% from other races. Hispanic or Latino of any race were 2.7% of the population.
The median household income in Alexander was $37,917, and the median family income was $45,938. The per capita income in Alexander was $18,945. About 16.2% of the population was below the poverty line.
Alexander is served by the Saline County School District. The city is home to two public schools, Alexander Elementary School and Alexander High School. The city is also home to several private schools, including St. Mary’s Catholic School and Alexander Christian Academy.
Common Questions
What is Per Capita Income in Alexander?
Per Capita income in Alexander is $23,665.
What is the Median Family Income in Alexander?
Median Family Income in Alexander is $61,964.
What is the Median Household income in Alexander?
Median Household Income in Alexander is $68,431.
What is Income or Wage Gap in Alexander?
Income or Wage Gap in Alexander is 2.8%.
Women in Alexander earn 97.2 cents for every dollar earned by a man.
What is Inequality or Gini Index in Alexander?
Inequality or Gini Index in Alexander is 0.35.
What is the Total Population of Alexander?
Total Population of Alexander is 3,444.
What is the Total Male Population of Alexander?
Total Male Population of Alexander is 1,661.
What is the Total Female Population of Alexander?
Total Female Population of Alexander is 1,783.
What is the Ratio of Males per 100 Females in Alexander?
There are 93.16 Males per 100 Females in Alexander.
What is the Ratio of Females per 100 Males in Alexander?
There are 107.34 Females per 100 Males in Alexander.
What is the Median Population Age in Alexander?
Median Population Age in Alexander is 31.2 Years.
What is the Average Family Size in Alexander
Average Family Size in Alexander is 3.2 People.
What is the Average Household Size in Alexander
Average Household Size in Alexander is 2.9 People.
How Large is the Labor Force in Alexander?
There are 1,937 People in the Labor Forcein in Alexander.
What is the Percentage of People in the Labor Force in Alexander?
73.1% of People are in the Labor Force in Alexander.
What is the Unemployment Rate in Alexander?
Unemployment Rate in Alexander is 7.7%.