Zip Codes with the Highest Percentage of Population Employed in Arts, Entertainment & Recreation in Alabama
RELATED REPORTS & OPTIONS
Arts, Entertainment & Recreation
Alabama
Compare Zip Codes
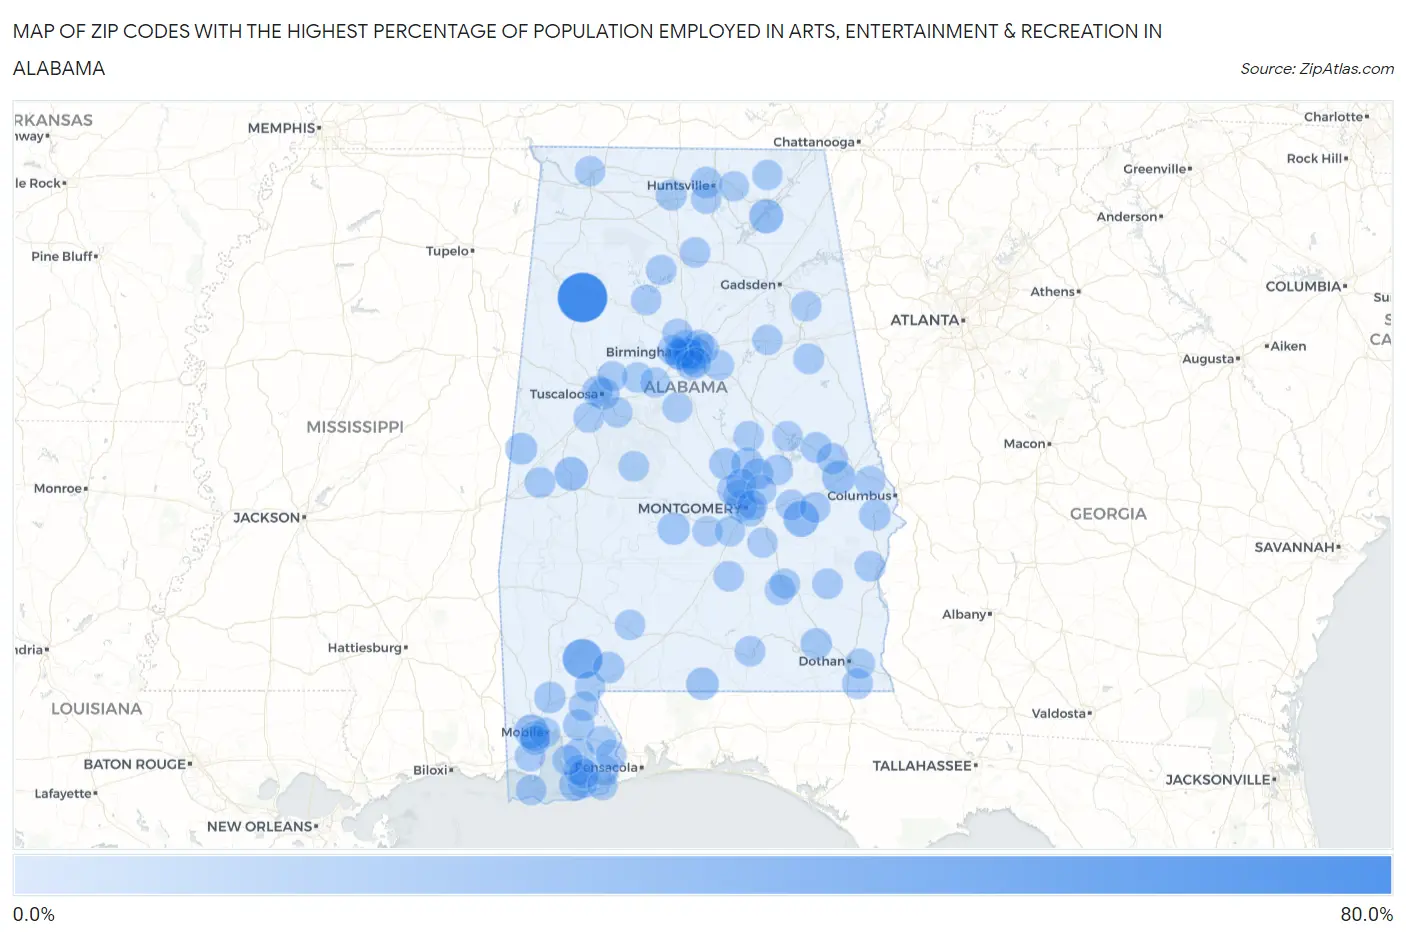
Map of Zip Codes with the Highest Percentage of Population Employed in Arts, Entertainment & Recreation in Alabama
0.0%
80.0%
Zip Codes with the Highest Percentage of Population Employed in Arts, Entertainment & Recreation in Alabama
| Zip Code | % Employed | vs State | vs National | |
| 1. | 35559 | 73.3% | 1.4%(+72.0)#1 | 2.1%(+71.3)#18 |
| 2. | 36550 | 36.2% | 1.4%(+34.8)#2 | 2.1%(+34.1)#60 |
| 3. | 36039 | 21.1% | 1.4%(+19.7)#3 | 2.1%(+19.0)#165 |
| 4. | 35755 | 15.8% | 1.4%(+14.5)#4 | 2.1%(+13.7)#300 |
| 5. | 36688 | 14.3% | 1.4%(+12.9)#5 | 2.1%(+12.2)#371 |
| 6. | 36740 | 14.1% | 1.4%(+12.7)#6 | 2.1%(+12.0)#384 |
| 7. | 36849 | 13.4% | 1.4%(+12.1)#7 | 2.1%(+11.4)#419 |
| 8. | 36483 | 10.6% | 1.4%(+9.20)#8 | 2.1%(+8.49)#644 |
| 9. | 36775 | 9.7% | 1.4%(+8.32)#9 | 2.1%(+7.61)#748 |
| 10. | 36080 | 8.5% | 1.4%(+7.18)#10 | 2.1%(+6.46)#935 |
| 11. | 36542 | 7.8% | 1.4%(+6.38)#11 | 2.1%(+5.67)#1,119 |
| 12. | 35459 | 7.5% | 1.4%(+6.14)#12 | 2.1%(+5.43)#1,177 |
| 13. | 35487 | 7.2% | 1.4%(+5.81)#13 | 2.1%(+5.10)#1,271 |
| 14. | 36502 | 6.9% | 1.4%(+5.50)#14 | 2.1%(+4.78)#1,371 |
| 15. | 36875 | 6.8% | 1.4%(+5.44)#15 | 2.1%(+4.73)#1,390 |
| 16. | 36051 | 6.6% | 1.4%(+5.23)#16 | 2.1%(+4.52)#1,457 |
| 17. | 35896 | 6.6% | 1.4%(+5.21)#17 | 2.1%(+4.49)#1,462 |
| 18. | 36505 | 6.5% | 1.4%(+5.13)#18 | 2.1%(+4.42)#1,498 |
| 19. | 36879 | 6.2% | 1.4%(+4.88)#19 | 2.1%(+4.17)#1,603 |
| 20. | 36578 | 6.0% | 1.4%(+4.68)#20 | 2.1%(+3.96)#1,675 |
| 21. | 35203 | 6.0% | 1.4%(+4.66)#21 | 2.1%(+3.94)#1,688 |
| 22. | 36362 | 5.7% | 1.4%(+4.33)#22 | 2.1%(+3.62)#1,859 |
| 23. | 36092 | 5.2% | 1.4%(+3.85)#23 | 2.1%(+3.14)#2,141 |
| 24. | 35671 | 5.0% | 1.4%(+3.67)#24 | 2.1%(+2.95)#2,263 |
| 25. | 35213 | 5.0% | 1.4%(+3.64)#25 | 2.1%(+2.92)#2,281 |
| 26. | 35205 | 4.8% | 1.4%(+3.41)#26 | 2.1%(+2.70)#2,456 |
| 27. | 35229 | 4.6% | 1.4%(+3.24)#27 | 2.1%(+2.53)#2,621 |
| 28. | 36576 | 4.6% | 1.4%(+3.20)#28 | 2.1%(+2.49)#2,666 |
| 29. | 35218 | 4.5% | 1.4%(+3.15)#29 | 2.1%(+2.43)#2,718 |
| 30. | 35476 | 4.5% | 1.4%(+3.13)#30 | 2.1%(+2.41)#2,748 |
| 31. | 35470 | 4.3% | 1.4%(+2.95)#31 | 2.1%(+2.23)#2,940 |
| 32. | 36850 | 4.3% | 1.4%(+2.93)#32 | 2.1%(+2.21)#2,974 |
| 33. | 36511 | 4.2% | 1.4%(+2.80)#33 | 2.1%(+2.08)#3,123 |
| 34. | 36320 | 4.1% | 1.4%(+2.71)#34 | 2.1%(+2.00)#3,218 |
| 35. | 36258 | 3.9% | 1.4%(+2.58)#35 | 2.1%(+1.87)#3,401 |
| 36. | 36075 | 3.9% | 1.4%(+2.54)#36 | 2.1%(+1.82)#3,473 |
| 37. | 36113 | 3.9% | 1.4%(+2.51)#37 | 2.1%(+1.79)#3,519 |
| 38. | 36111 | 3.9% | 1.4%(+2.49)#38 | 2.1%(+1.78)#3,540 |
| 39. | 36027 | 3.7% | 1.4%(+2.29)#39 | 2.1%(+1.57)#3,842 |
| 40. | 36054 | 3.6% | 1.4%(+2.26)#40 | 2.1%(+1.54)#3,908 |
| 41. | 35254 | 3.6% | 1.4%(+2.19)#41 | 2.1%(+1.47)#4,025 |
| 42. | 36048 | 3.6% | 1.4%(+2.18)#42 | 2.1%(+1.47)#4,031 |
| 43. | 36530 | 3.5% | 1.4%(+2.17)#43 | 2.1%(+1.46)#4,045 |
| 44. | 36066 | 3.5% | 1.4%(+2.13)#44 | 2.1%(+1.42)#4,129 |
| 45. | 35463 | 3.5% | 1.4%(+2.11)#45 | 2.1%(+1.39)#4,190 |
| 46. | 36555 | 3.3% | 1.4%(+1.90)#46 | 2.1%(+1.18)#4,653 |
| 47. | 35207 | 3.2% | 1.4%(+1.88)#47 | 2.1%(+1.17)#4,682 |
| 48. | 36083 | 3.2% | 1.4%(+1.81)#48 | 2.1%(+1.09)#4,868 |
| 49. | 36024 | 3.1% | 1.4%(+1.76)#49 | 2.1%(+1.05)#4,988 |
| 50. | 36042 | 3.1% | 1.4%(+1.74)#50 | 2.1%(+1.02)#5,053 |
| 51. | 35444 | 3.1% | 1.4%(+1.72)#51 | 2.1%(+1.00)#5,099 |
| 52. | 36467 | 3.1% | 1.4%(+1.72)#52 | 2.1%(+1.00)#5,113 |
| 53. | 35147 | 3.1% | 1.4%(+1.71)#53 | 2.1%(+0.993)#5,146 |
| 54. | 35058 | 3.1% | 1.4%(+1.70)#54 | 2.1%(+0.988)#5,159 |
| 55. | 36079 | 3.1% | 1.4%(+1.70)#55 | 2.1%(+0.984)#5,174 |
| 56. | 35136 | 3.0% | 1.4%(+1.62)#56 | 2.1%(+0.907)#5,381 |
| 57. | 36582 | 3.0% | 1.4%(+1.62)#57 | 2.1%(+0.904)#5,391 |
| 58. | 35206 | 2.9% | 1.4%(+1.58)#58 | 2.1%(+0.866)#5,509 |
| 59. | 35233 | 2.9% | 1.4%(+1.53)#59 | 2.1%(+0.810)#5,671 |
| 60. | 36874 | 2.9% | 1.4%(+1.53)#60 | 2.1%(+0.810)#5,672 |
| 61. | 35504 | 2.9% | 1.4%(+1.49)#61 | 2.1%(+0.771)#5,802 |
| 62. | 36756 | 2.9% | 1.4%(+1.48)#62 | 2.1%(+0.768)#5,816 |
| 63. | 36025 | 2.8% | 1.4%(+1.48)#63 | 2.1%(+0.765)#5,828 |
| 64. | 36574 | 2.8% | 1.4%(+1.45)#64 | 2.1%(+0.734)#5,926 |
| 65. | 35208 | 2.7% | 1.4%(+1.36)#65 | 2.1%(+0.646)#6,256 |
| 66. | 36460 | 2.7% | 1.4%(+1.36)#66 | 2.1%(+0.645)#6,258 |
| 67. | 35768 | 2.7% | 1.4%(+1.34)#67 | 2.1%(+0.627)#6,323 |
| 68. | 35224 | 2.7% | 1.4%(+1.30)#68 | 2.1%(+0.587)#6,486 |
| 69. | 36535 | 2.7% | 1.4%(+1.30)#69 | 2.1%(+0.583)#6,504 |
| 70. | 36265 | 2.7% | 1.4%(+1.30)#70 | 2.1%(+0.582)#6,505 |
| 71. | 36532 | 2.7% | 1.4%(+1.28)#71 | 2.1%(+0.568)#6,557 |
| 72. | 36040 | 2.7% | 1.4%(+1.28)#72 | 2.1%(+0.568)#6,559 |
| 73. | 36609 | 2.6% | 1.4%(+1.26)#73 | 2.1%(+0.549)#6,633 |
| 74. | 36093 | 2.6% | 1.4%(+1.26)#74 | 2.1%(+0.549)#6,634 |
| 75. | 35115 | 2.6% | 1.4%(+1.24)#75 | 2.1%(+0.520)#6,747 |
| 76. | 35808 | 2.5% | 1.4%(+1.18)#76 | 2.1%(+0.461)#6,976 |
| 77. | 35210 | 2.5% | 1.4%(+1.16)#77 | 2.1%(+0.442)#7,070 |
| 78. | 36082 | 2.5% | 1.4%(+1.15)#78 | 2.1%(+0.438)#7,082 |
| 79. | 35096 | 2.5% | 1.4%(+1.13)#79 | 2.1%(+0.410)#7,211 |
| 80. | 36562 | 2.5% | 1.4%(+1.11)#80 | 2.1%(+0.398)#7,261 |
| 81. | 35098 | 2.4% | 1.4%(+1.08)#81 | 2.1%(+0.367)#7,407 |
| 82. | 35117 | 2.4% | 1.4%(+1.02)#82 | 2.1%(+0.300)#7,724 |
| 83. | 35630 | 2.3% | 1.4%(+0.969)#83 | 2.1%(+0.253)#7,952 |
| 84. | 36043 | 2.3% | 1.4%(+0.956)#84 | 2.1%(+0.240)#8,024 |
| 85. | 36561 | 2.3% | 1.4%(+0.947)#85 | 2.1%(+0.231)#8,059 |
| 86. | 35010 | 2.3% | 1.4%(+0.939)#86 | 2.1%(+0.223)#8,096 |
| 87. | 36604 | 2.3% | 1.4%(+0.931)#87 | 2.1%(+0.216)#8,134 |
| 88. | 35748 | 2.3% | 1.4%(+0.930)#88 | 2.1%(+0.215)#8,136 |
| 89. | 35406 | 2.3% | 1.4%(+0.924)#89 | 2.1%(+0.209)#8,170 |
| 90. | 36528 | 2.3% | 1.4%(+0.920)#90 | 2.1%(+0.204)#8,190 |
| 91. | 36069 | 2.3% | 1.4%(+0.914)#91 | 2.1%(+0.199)#8,216 |
| 92. | 35216 | 2.3% | 1.4%(+0.908)#92 | 2.1%(+0.193)#8,247 |
| 93. | 35456 | 2.3% | 1.4%(+0.890)#93 | 2.1%(+0.175)#8,346 |
| 94. | 36109 | 2.2% | 1.4%(+0.813)#94 | 2.1%(+0.097)#8,762 |
| 95. | 36321 | 2.1% | 1.4%(+0.778)#95 | 2.1%(+0.063)#8,956 |
| 96. | 36507 | 2.1% | 1.4%(+0.748)#96 | 2.1%(+0.033)#9,126 |
| 97. | 35111 | 2.1% | 1.4%(+0.736)#97 | 2.1%(+0.021)#9,189 |
| 98. | 36693 | 2.1% | 1.4%(+0.725)#98 | 2.1%(+0.009)#9,262 |
| 99. | 36567 | 2.1% | 1.4%(+0.723)#99 | 2.1%(+0.008)#9,271 |
| 100. | 35243 | 2.1% | 1.4%(+0.711)#100 | 2.1%(-0.005)#9,330 |
Common Questions
What are the Top 10 Zip Codes with the Highest Percentage of Population Employed in Arts, Entertainment & Recreation in Alabama?
Top 10 Zip Codes with the Highest Percentage of Population Employed in Arts, Entertainment & Recreation in Alabama are:
What zip code has the Highest Percentage of Population Employed in Arts, Entertainment & Recreation in Alabama?
35559 has the Highest Percentage of Population Employed in Arts, Entertainment & Recreation in Alabama with 73.3%.
What is the Percentage of Population Employed in Arts, Entertainment & Recreation in the State of Alabama?
Percentage of Population Employed in Arts, Entertainment & Recreation in Alabama is 1.4%.
What is the Percentage of Population Employed in Arts, Entertainment & Recreation in the United States?
Percentage of Population Employed in Arts, Entertainment & Recreation in the United States is 2.1%.