Zip Codes with the Highest Percentage of Black / African American Population in Opelika, AL
RELATED REPORTS & OPTIONS
Black / African American
Opelika
Compare Zip Codes
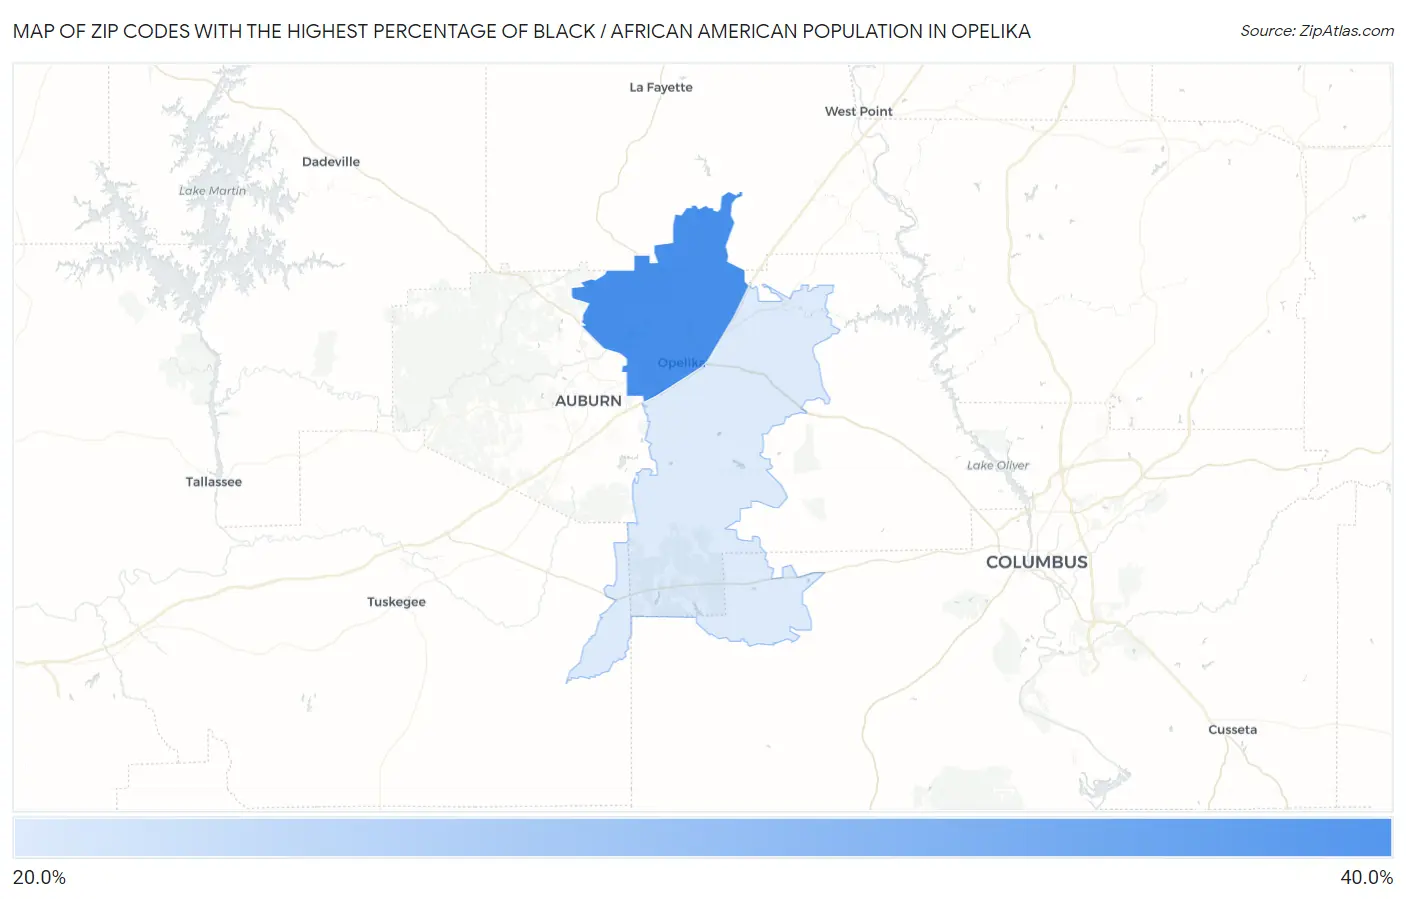
Map of Zip Codes with the Highest Percentage of Black / African American Population in Opelika
28.4%
37.3%
Zip Codes with the Highest Percentage of Black / African American Population in Opelika, AL
| Zip Code | Black / African American | vs State | vs National | |
| 1. | 36801 | 37.3% | 26.4%(+10.9)#182 | 12.5%(+24.8)#2,043 |
| 2. | 36804 | 28.4% | 26.4%(+2.04)#227 | 12.5%(+16.0)#2,818 |
1
Common Questions
What are the Top Zip Codes with the Highest Percentage of Black / African American Population in Opelika, AL?
Top Zip Codes with the Highest Percentage of Black / African American Population in Opelika, AL are:
What zip code has the Highest Percentage of Black / African American Population in Opelika, AL?
36801 has the Highest Percentage of Black / African American Population in Opelika, AL with 37.3%.
What is the Percentage of Black / African American Population in Opelika, AL?
Percentage of Black / African American Population in Opelika is 36.5%.
What is the Percentage of Black / African American Population in Alabama?
Percentage of Black / African American Population in Alabama is 26.4%.
What is the Percentage of Black / African American Population in the United States?
Percentage of Black / African American Population in the United States is 12.5%.