White Mountain, AK Map & Demographics
White Mountain Map
White Mountain Overview
$20,961
PER CAPITA INCOME
$58,750
AVG FAMILY INCOME
$53,125
AVG HOUSEHOLD INCOME
65.3%
WAGE / INCOME GAP [ % ]
34.7¢/ $1
WAGE / INCOME GAP [ $ ]
0.41
INEQUALITY / GINI INDEX
194
TOTAL POPULATION
97
MALE POPULATION
97
FEMALE POPULATION
100.00
MALES / 100 FEMALES
100.00
FEMALES / 100 MALES
31.7
MEDIAN AGE
3.2
AVG FAMILY SIZE
2.8
AVG HOUSEHOLD SIZE
95
LABOR FORCE [ PEOPLE ]
64.2%
PERCENT IN LABOR FORCE
26.3%
UNEMPLOYMENT RATE
White Mountain Zip Codes
White Mountain Area Codes
Income in White Mountain
Income Overview in White Mountain
Per Capita Income in White Mountain is $20,961, while median incomes of families and households are $58,750 and $53,125 respectively.
| Characteristic | Number | Measure |
| Per Capita Income | 194 | $20,961 |
| Median Family Income | 53 | $58,750 |
| Mean Family Income | 53 | $62,211 |
| Median Household Income | 70 | $53,125 |
| Mean Household Income | 70 | $57,757 |
| Income Deficit | 53 | $0 |
| Wage / Income Gap (%) | 194 | 65.33% |
| Wage / Income Gap ($) | 194 | 34.67¢ per $1 |
| Gini / Inequality Index | 194 | 0.41 |
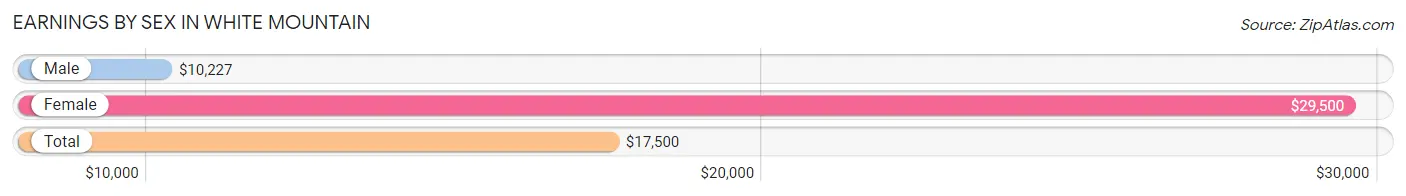
Earnings by Sex in White Mountain
Average Earnings in White Mountain are $17,500, $10,227 for men and $29,500 for women, a difference of 65.3%.
| Sex | Number | Average Earnings |
| Male | 56 (51.8%) | $10,227 |
| Female | 52 (48.1%) | $29,500 |
| Total | 108 (100.0%) | $17,500 |
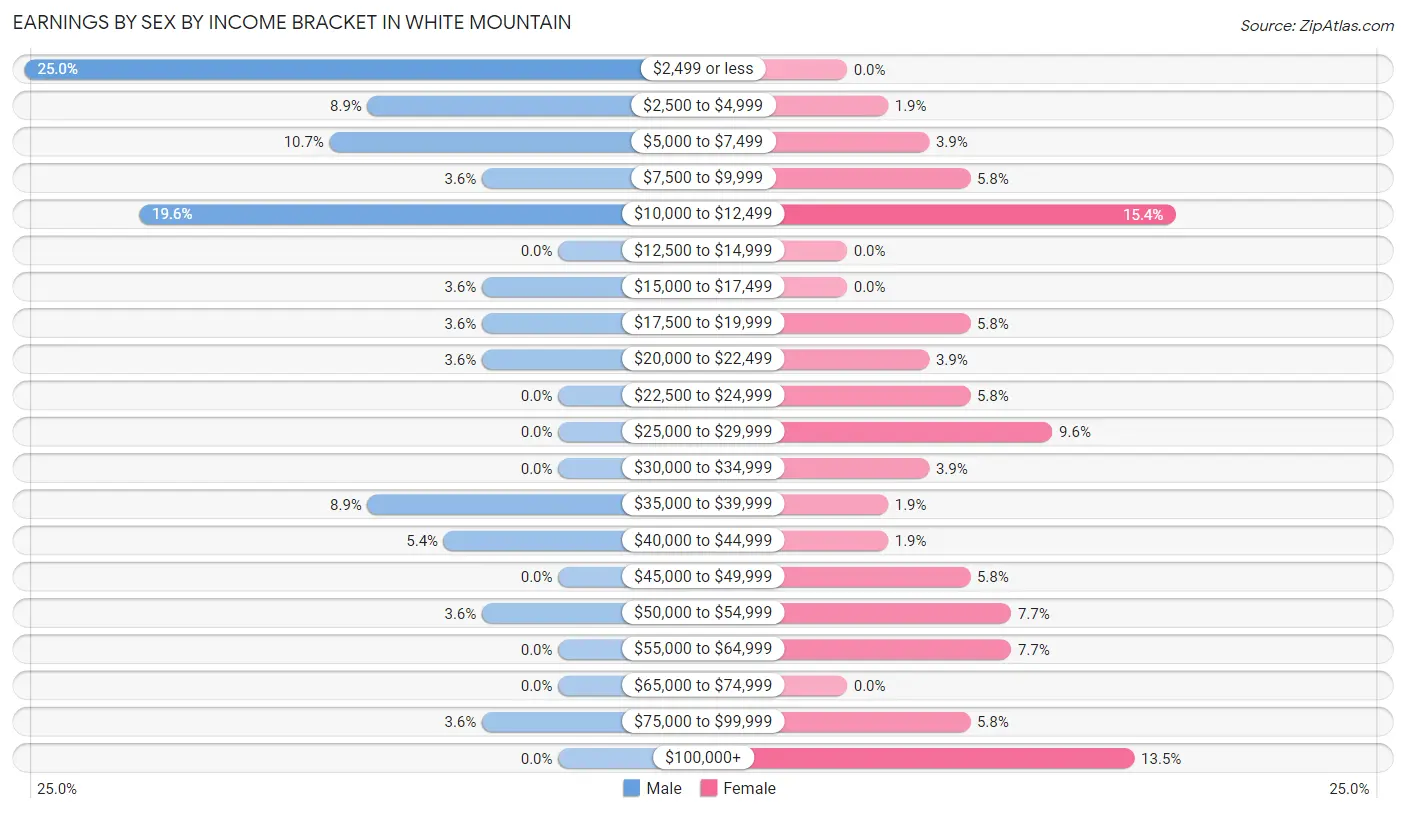
Earnings by Sex by Income Bracket in White Mountain
The most common earnings brackets in White Mountain are $2,499 or less for men (14 | 25.0%) and $10,000 to $12,499 for women (8 | 15.4%).
| Income | Male | Female |
| $2,499 or less | 14 (25.0%) | 0 (0.0%) |
| $2,500 to $4,999 | 5 (8.9%) | 1 (1.9%) |
| $5,000 to $7,499 | 6 (10.7%) | 2 (3.8%) |
| $7,500 to $9,999 | 2 (3.6%) | 3 (5.8%) |
| $10,000 to $12,499 | 11 (19.6%) | 8 (15.4%) |
| $12,500 to $14,999 | 0 (0.0%) | 0 (0.0%) |
| $15,000 to $17,499 | 2 (3.6%) | 0 (0.0%) |
| $17,500 to $19,999 | 2 (3.6%) | 3 (5.8%) |
| $20,000 to $22,499 | 2 (3.6%) | 2 (3.8%) |
| $22,500 to $24,999 | 0 (0.0%) | 3 (5.8%) |
| $25,000 to $29,999 | 0 (0.0%) | 5 (9.6%) |
| $30,000 to $34,999 | 0 (0.0%) | 2 (3.8%) |
| $35,000 to $39,999 | 5 (8.9%) | 1 (1.9%) |
| $40,000 to $44,999 | 3 (5.4%) | 1 (1.9%) |
| $45,000 to $49,999 | 0 (0.0%) | 3 (5.8%) |
| $50,000 to $54,999 | 2 (3.6%) | 4 (7.7%) |
| $55,000 to $64,999 | 0 (0.0%) | 4 (7.7%) |
| $65,000 to $74,999 | 0 (0.0%) | 0 (0.0%) |
| $75,000 to $99,999 | 2 (3.6%) | 3 (5.8%) |
| $100,000+ | 0 (0.0%) | 7 (13.5%) |
| Total | 56 (100.0%) | 52 (100.0%) |
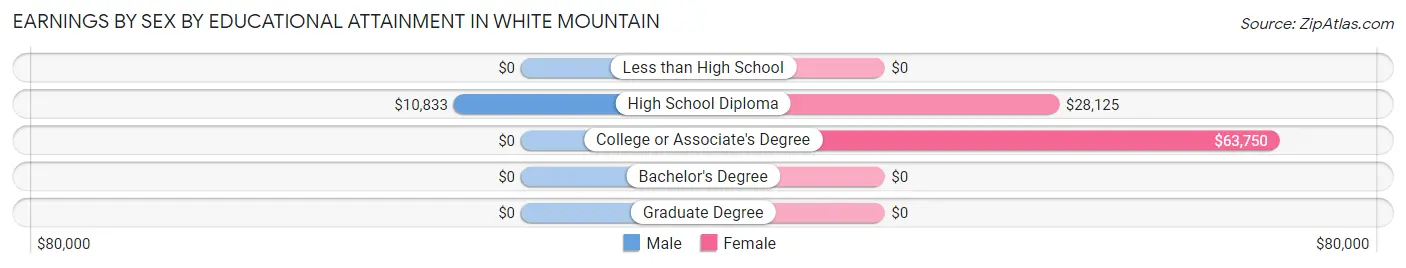
Earnings by Sex by Educational Attainment in White Mountain
Average earnings in White Mountain are $10,694 for men and $47,917 for women, a difference of 77.7%. Men with an educational attainment of high school diploma enjoy the highest average annual earnings of $10,833, while those with high school diploma education earn the least with $10,833. Women with an educational attainment of college or associate's degree earn the most with the average annual earnings of $63,750, while those with high school diploma education have the smallest earnings of $28,125.
| Educational Attainment | Male Income | Female Income |
| Less than High School | - | - |
| High School Diploma | $10,833 | $28,125 |
| College or Associate's Degree | - | - |
| Bachelor's Degree | - | - |
| Graduate Degree | - | - |
| Total | $10,694 | $47,917 |
Family Income in White Mountain
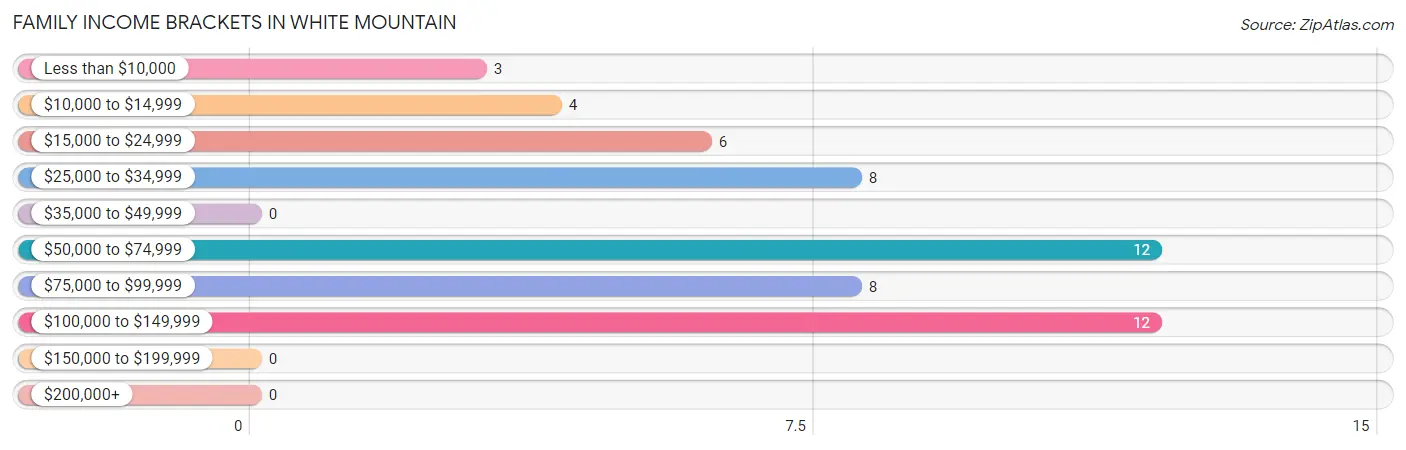
Family Income Brackets in White Mountain
According to the White Mountain family income data, there are 12 families falling into the $50,000 to $74,999 income range, which is the most common income bracket and makes up 22.6% of all families.
| Income Bracket | # Families | % Families |
| Less than $10,000 | 3 | 5.7% |
| $10,000 to $14,999 | 4 | 7.5% |
| $15,000 to $24,999 | 6 | 11.3% |
| $25,000 to $34,999 | 8 | 15.1% |
| $35,000 to $49,999 | 0 | 0.0% |
| $50,000 to $74,999 | 12 | 22.6% |
| $75,000 to $99,999 | 8 | 15.1% |
| $100,000 to $149,999 | 12 | 22.6% |
| $150,000 to $199,999 | 0 | 0.0% |
| $200,000+ | 0 | 0.0% |
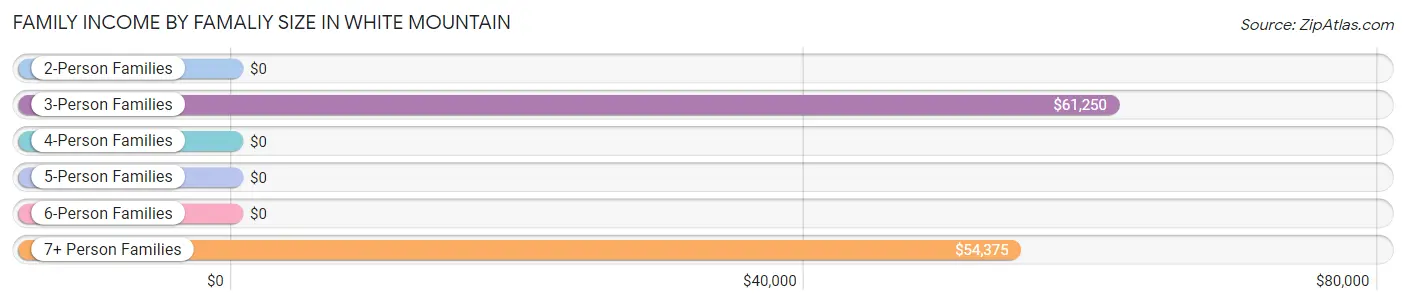
Family Income by Famaliy Size in White Mountain
3-person families (25 | 47.2%) account for the highest median family income in White Mountain with $61,250 per family, while 3-person families (25 | 47.2%) have the highest median income of $20,417 per family member.
| Income Bracket | # Families | Median Income |
| 2-Person Families | 13 (24.5%) | $0 |
| 3-Person Families | 25 (47.2%) | $61,250 |
| 4-Person Families | 4 (7.5%) | $0 |
| 5-Person Families | 6 (11.3%) | $0 |
| 6-Person Families | 0 (0.0%) | $0 |
| 7+ Person Families | 5 (9.4%) | $54,375 |
| Total | 53 (100.0%) | $58,750 |
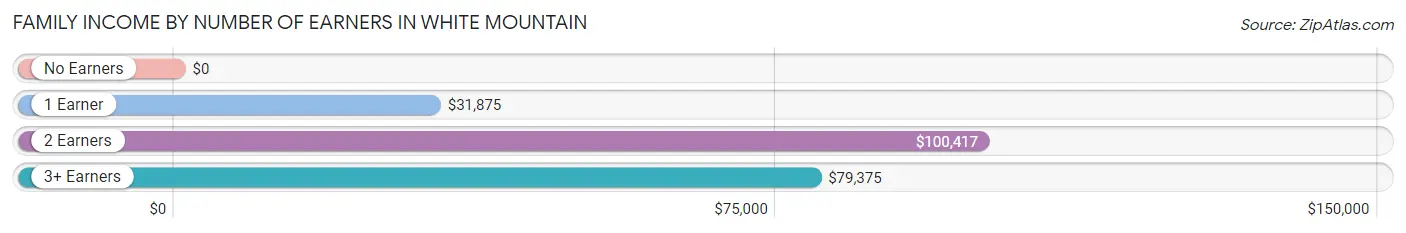
Family Income by Number of Earners in White Mountain
| Number of Earners | # Families | Median Income |
| No Earners | 3 (5.7%) | $0 |
| 1 Earner | 22 (41.5%) | $31,875 |
| 2 Earners | 19 (35.8%) | $100,417 |
| 3+ Earners | 9 (17.0%) | $79,375 |
| Total | 53 (100.0%) | $58,750 |
Household Income in White Mountain
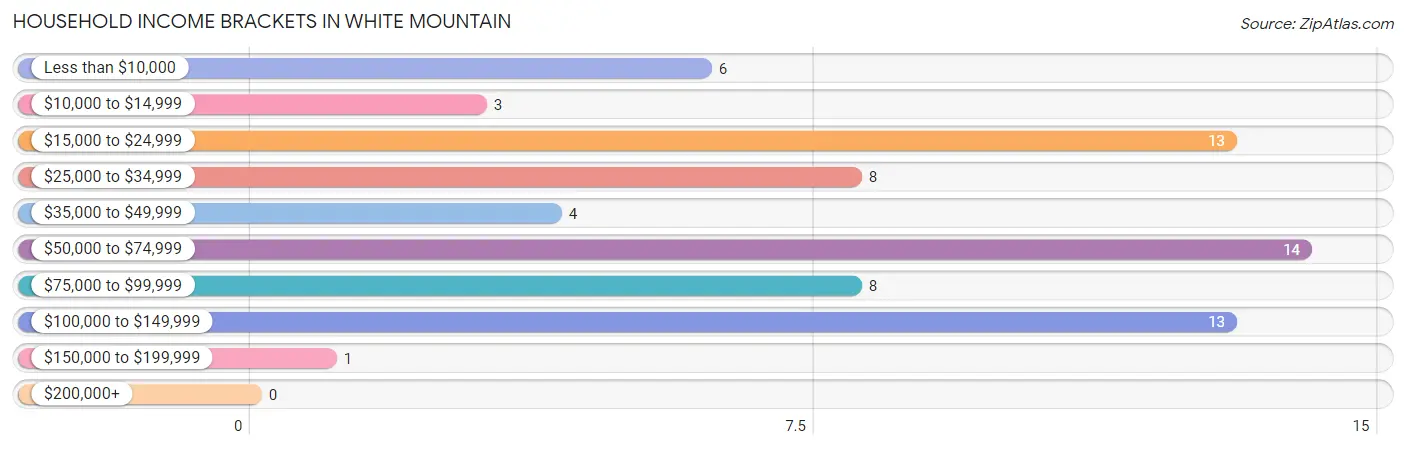
Household Income Brackets in White Mountain
With 14 households falling in the category, the $50,000 to $74,999 income range is the most frequent in White Mountain, accounting for 20.0% of all households.
| Income Bracket | # Households | % Households |
| Less than $10,000 | 6 | 8.6% |
| $10,000 to $14,999 | 3 | 4.3% |
| $15,000 to $24,999 | 13 | 18.6% |
| $25,000 to $34,999 | 8 | 11.4% |
| $35,000 to $49,999 | 4 | 5.7% |
| $50,000 to $74,999 | 14 | 20.0% |
| $75,000 to $99,999 | 8 | 11.4% |
| $100,000 to $149,999 | 13 | 18.6% |
| $150,000 to $199,999 | 1 | 1.4% |
| $200,000+ | 0 | 0.0% |
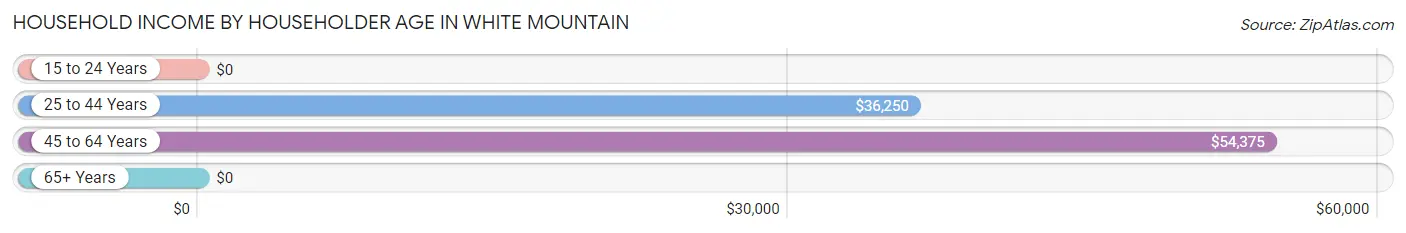
Household Income by Householder Age in White Mountain
The median household income in White Mountain is $53,125, with the highest median household income of $54,375 found in the 45 to 64 years age bracket for the primary householder. A total of 39 households (55.7%) fall into this category. Meanwhile, the 15 to 24 years age bracket for the primary householder has the lowest median household income of $0, with 2 households (2.9%) in this group.
| Income Bracket | # Households | Median Income |
| 15 to 24 Years | 2 (2.9%) | $0 |
| 25 to 44 Years | 20 (28.6%) | $36,250 |
| 45 to 64 Years | 39 (55.7%) | $54,375 |
| 65+ Years | 9 (12.9%) | $0 |
| Total | 70 (100.0%) | $53,125 |
Poverty in White Mountain
Income Below Poverty by Sex and Age in White Mountain
With 26.8% poverty level for males and 16.5% for females among the residents of White Mountain, under 5 year old males and 15 year old females are the most vulnerable to poverty, with 3 males (42.9%) and 2 females (66.7%) in their respective age groups living below the poverty level.
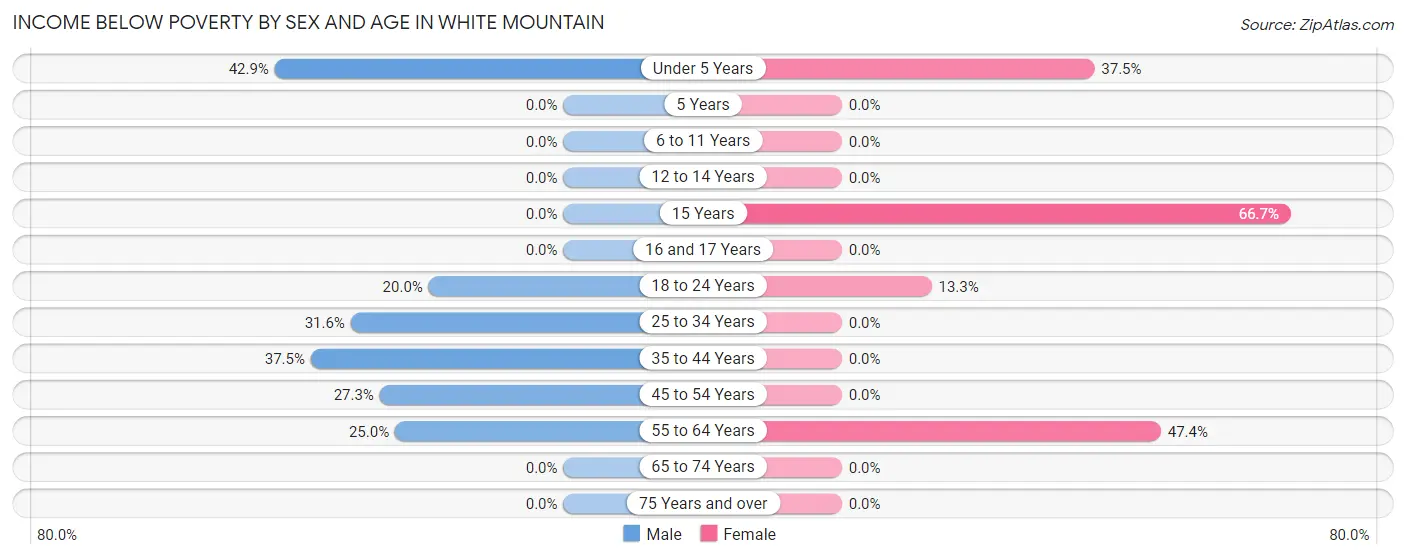
| Age Bracket | Male | Female |
| Under 5 Years | 3 (42.9%) | 3 (37.5%) |
| 5 Years | 0 (0.0%) | 0 (0.0%) |
| 6 to 11 Years | 0 (0.0%) | 0 (0.0%) |
| 12 to 14 Years | 0 (0.0%) | 0 (0.0%) |
| 15 Years | 0 (0.0%) | 2 (66.7%) |
| 16 and 17 Years | 0 (0.0%) | 0 (0.0%) |
| 18 to 24 Years | 3 (20.0%) | 2 (13.3%) |
| 25 to 34 Years | 6 (31.6%) | 0 (0.0%) |
| 35 to 44 Years | 9 (37.5%) | 0 (0.0%) |
| 45 to 54 Years | 3 (27.3%) | 0 (0.0%) |
| 55 to 64 Years | 2 (25.0%) | 9 (47.4%) |
| 65 to 74 Years | 0 (0.0%) | 0 (0.0%) |
| 75 Years and over | 0 (0.0%) | 0 (0.0%) |
| Total | 26 (26.8%) | 16 (16.5%) |
Income Above Poverty by Sex and Age in White Mountain
According to the poverty statistics in White Mountain, males aged 5 years and females aged 5 years are the age groups that are most secure financially, with 100.0% of males and 100.0% of females in these age groups living above the poverty line.
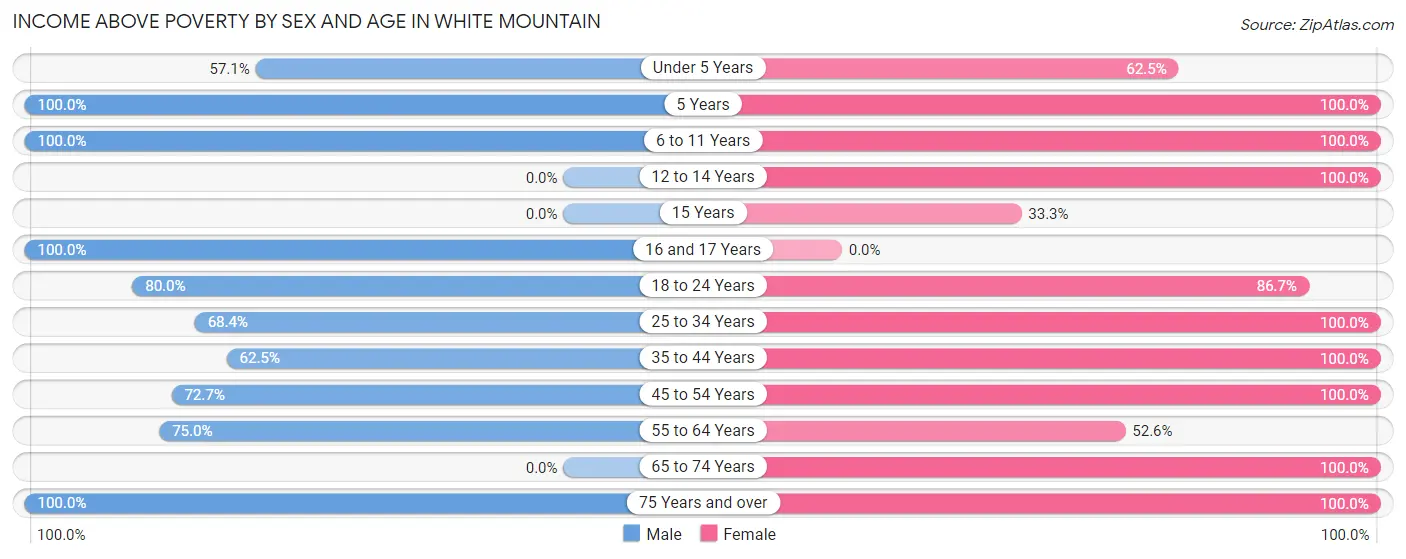
| Age Bracket | Male | Female |
| Under 5 Years | 4 (57.1%) | 5 (62.5%) |
| 5 Years | 4 (100.0%) | 2 (100.0%) |
| 6 to 11 Years | 6 (100.0%) | 11 (100.0%) |
| 12 to 14 Years | 0 (0.0%) | 5 (100.0%) |
| 15 Years | 0 (0.0%) | 1 (33.3%) |
| 16 and 17 Years | 2 (100.0%) | 0 (0.0%) |
| 18 to 24 Years | 12 (80.0%) | 13 (86.7%) |
| 25 to 34 Years | 13 (68.4%) | 11 (100.0%) |
| 35 to 44 Years | 15 (62.5%) | 7 (100.0%) |
| 45 to 54 Years | 8 (72.7%) | 8 (100.0%) |
| 55 to 64 Years | 6 (75.0%) | 10 (52.6%) |
| 65 to 74 Years | 0 (0.0%) | 6 (100.0%) |
| 75 Years and over | 1 (100.0%) | 2 (100.0%) |
| Total | 71 (73.2%) | 81 (83.5%) |
Income Below Poverty Among Married-Couple Families in White Mountain
The poverty statistics for married-couple families in White Mountain show that 11.1% or 1 of the total 9 families live below the poverty line. Families with 3 or 4 children have the highest poverty rate of 25.0%, comprising of 1 families. On the other hand, families with no children have the lowest poverty rate of 0.0%, which includes 0 families.
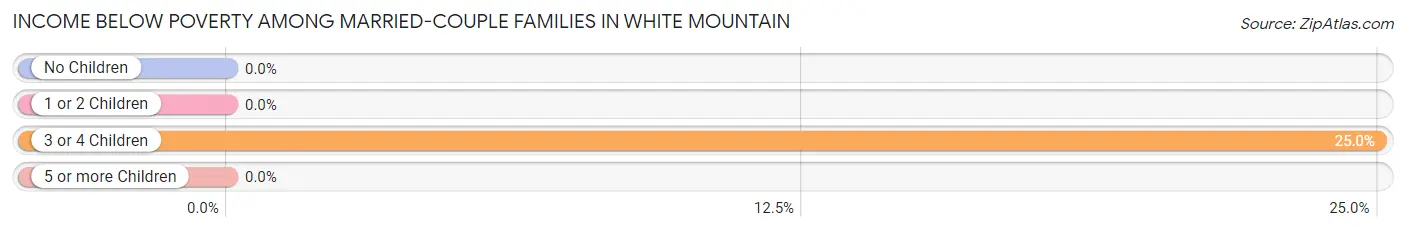
| Children | Above Poverty | Below Poverty |
| No Children | 3 (100.0%) | 0 (0.0%) |
| 1 or 2 Children | 0 (0.0%) | 0 (0.0%) |
| 3 or 4 Children | 3 (75.0%) | 1 (25.0%) |
| 5 or more Children | 2 (100.0%) | 0 (0.0%) |
| Total | 8 (88.9%) | 1 (11.1%) |
Income Below Poverty Among Single-Parent Households in White Mountain
According to the poverty data in White Mountain, 38.5% or 5 single-father households and 12.9% or 4 single-mother households are living below the poverty line. Among single-father households, those with 1 or 2 children have the highest poverty rate, with 2 households (66.7%) experiencing poverty. Likewise, among single-mother households, those with no children have the highest poverty rate, with 2 households (28.6%) falling below the poverty line.
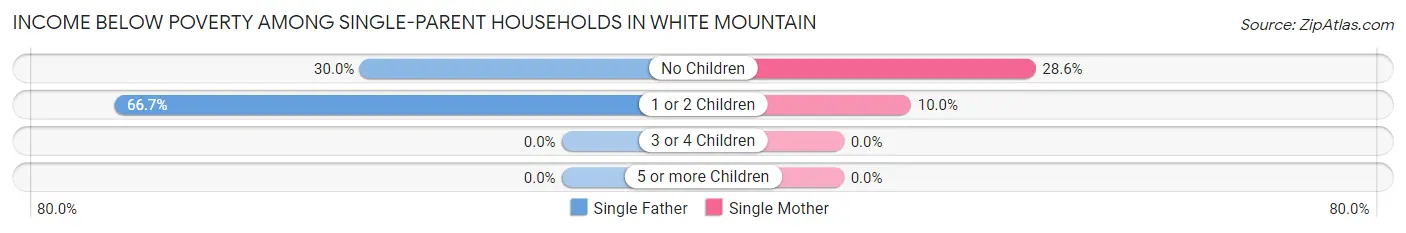
| Children | Single Father | Single Mother |
| No Children | 3 (30.0%) | 2 (28.6%) |
| 1 or 2 Children | 2 (66.7%) | 2 (10.0%) |
| 3 or 4 Children | 0 (0.0%) | 0 (0.0%) |
| 5 or more Children | 0 (0.0%) | 0 (0.0%) |
| Total | 5 (38.5%) | 4 (12.9%) |
Income Below Poverty Among Married-Couple vs Single-Parent Households in White Mountain
The poverty data for White Mountain shows that 1 of the married-couple family households (11.1%) and 9 of the single-parent households (20.4%) are living below the poverty level. Within the married-couple family households, those with 3 or 4 children have the highest poverty rate, with 1 households (25.0%) falling below the poverty line. Among the single-parent households, those with no children have the highest poverty rate, with 5 household (29.4%) living below poverty.
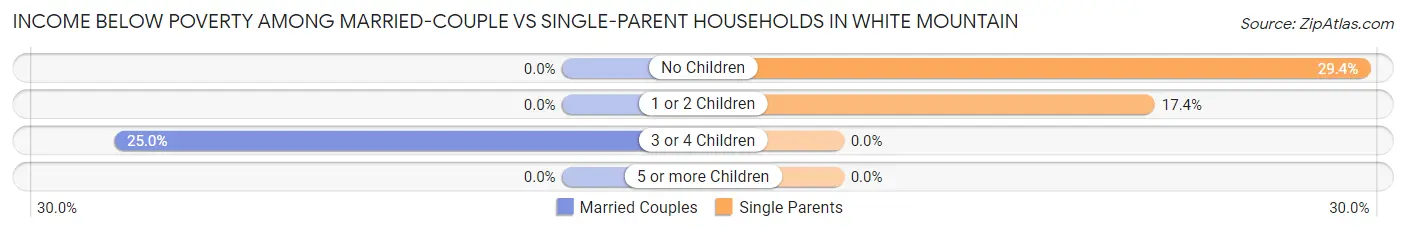
| Children | Married-Couple Families | Single-Parent Households |
| No Children | 0 (0.0%) | 5 (29.4%) |
| 1 or 2 Children | 0 (0.0%) | 4 (17.4%) |
| 3 or 4 Children | 1 (25.0%) | 0 (0.0%) |
| 5 or more Children | 0 (0.0%) | 0 (0.0%) |
| Total | 1 (11.1%) | 9 (20.4%) |
Race in White Mountain
The most populous races in White Mountain are Native / Alaskan (185 | 95.4%), White / Caucasian (5 | 2.6%), and Two or more Races (4 | 2.1%).
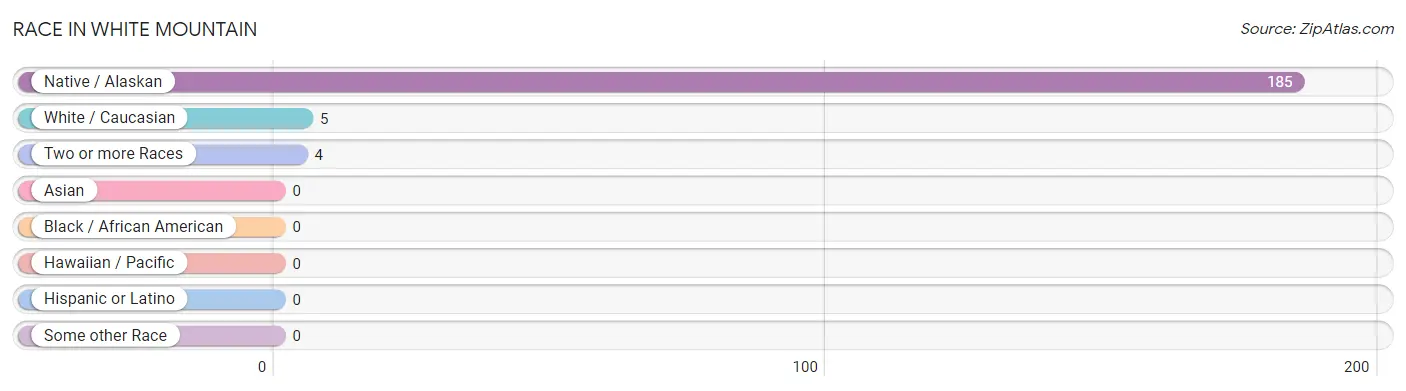
| Race | # Population | % Population |
| Asian | 0 | 0.0% |
| Black / African American | 0 | 0.0% |
| Hawaiian / Pacific | 0 | 0.0% |
| Hispanic or Latino | 0 | 0.0% |
| Native / Alaskan | 185 | 95.4% |
| White / Caucasian | 5 | 2.6% |
| Two or more Races | 4 | 2.1% |
| Some other Race | 0 | 0.0% |
| Total | 194 | 100.0% |
Ancestry in White Mountain
The most populous ancestries reported in White Mountain are Inupiat (177 | 91.2%), British (15 | 7.7%), German (10 | 5.1%), Apache (6 | 3.1%), and Alaska Native (4 | 2.1%), together accounting for 109.3% of all White Mountain residents.
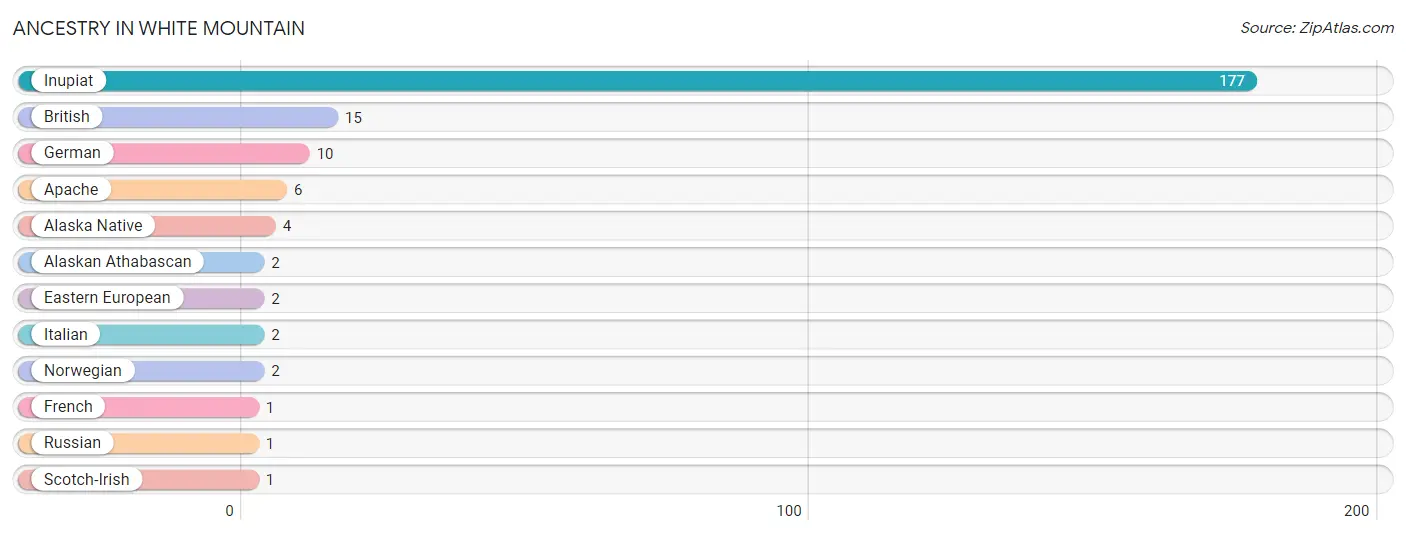
| Ancestry | # Population | % Population |
| Alaska Native | 4 | 2.1% |
| Alaskan Athabascan | 2 | 1.0% |
| Apache | 6 | 3.1% |
| British | 15 | 7.7% |
| Eastern European | 2 | 1.0% |
| French | 1 | 0.5% |
| German | 10 | 5.1% |
| Inupiat | 177 | 91.2% |
| Italian | 2 | 1.0% |
| Norwegian | 2 | 1.0% |
| Russian | 1 | 0.5% |
| Scotch-Irish | 1 | 0.5% | View All 12 Rows |
Immigrants in White Mountain

| Immigration Origin | # Population | % Population | View All 0 Rows |
Sex and Age in White Mountain
Sex and Age in White Mountain
The most populous age groups in White Mountain are 40 to 44 Years (21 | 21.6%) for men and 5 to 9 Years (11 | 11.3%) for women.
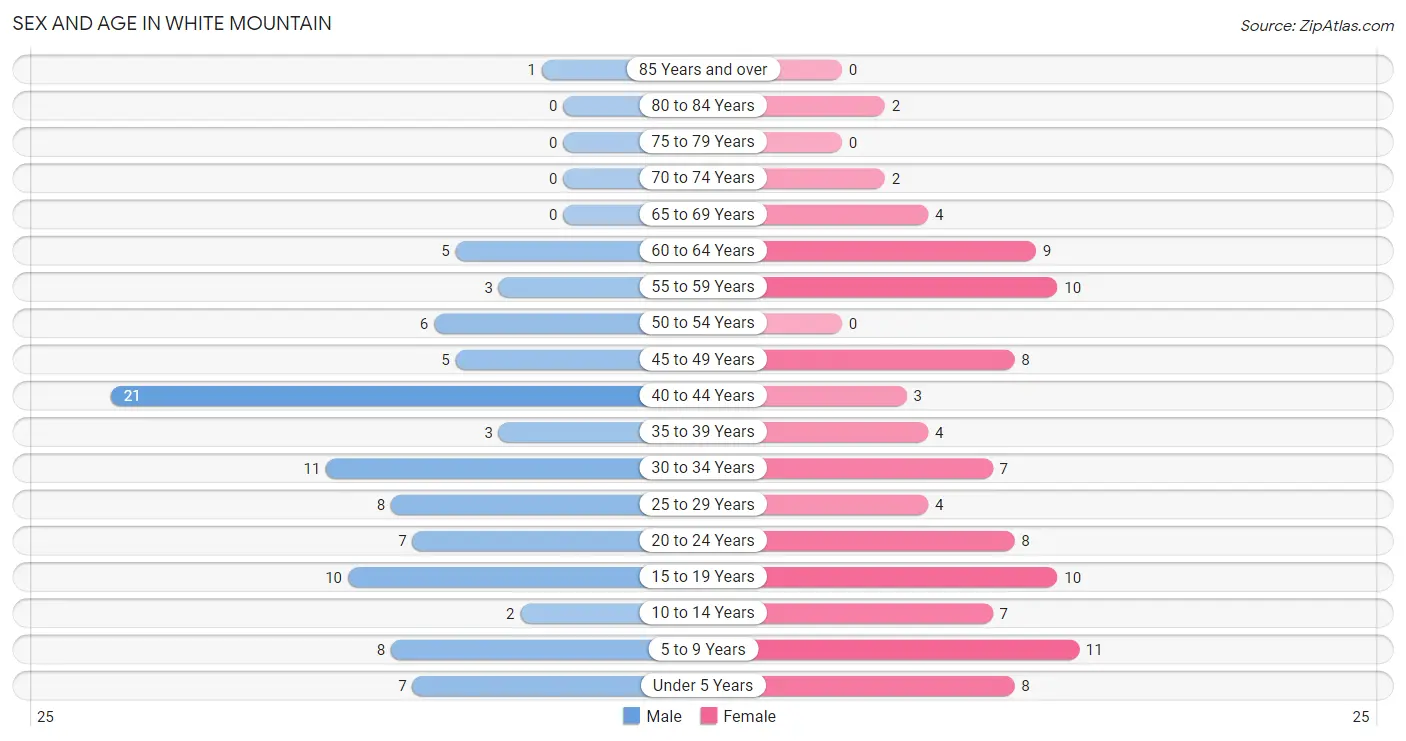
| Age Bracket | Male | Female |
| Under 5 Years | 7 (7.2%) | 8 (8.3%) |
| 5 to 9 Years | 8 (8.3%) | 11 (11.3%) |
| 10 to 14 Years | 2 (2.1%) | 7 (7.2%) |
| 15 to 19 Years | 10 (10.3%) | 10 (10.3%) |
| 20 to 24 Years | 7 (7.2%) | 8 (8.3%) |
| 25 to 29 Years | 8 (8.3%) | 4 (4.1%) |
| 30 to 34 Years | 11 (11.3%) | 7 (7.2%) |
| 35 to 39 Years | 3 (3.1%) | 4 (4.1%) |
| 40 to 44 Years | 21 (21.6%) | 3 (3.1%) |
| 45 to 49 Years | 5 (5.1%) | 8 (8.3%) |
| 50 to 54 Years | 6 (6.2%) | 0 (0.0%) |
| 55 to 59 Years | 3 (3.1%) | 10 (10.3%) |
| 60 to 64 Years | 5 (5.1%) | 9 (9.3%) |
| 65 to 69 Years | 0 (0.0%) | 4 (4.1%) |
| 70 to 74 Years | 0 (0.0%) | 2 (2.1%) |
| 75 to 79 Years | 0 (0.0%) | 0 (0.0%) |
| 80 to 84 Years | 0 (0.0%) | 2 (2.1%) |
| 85 Years and over | 1 (1.0%) | 0 (0.0%) |
| Total | 97 (100.0%) | 97 (100.0%) |
Families and Households in White Mountain
Median Family Size in White Mountain
The median family size in White Mountain is 3.17 persons per family, with married-couple families (9 | 17.0%) accounting for the largest median family size of 4.22 persons per family. On the other hand, single male/father families (13 | 24.5%) represent the smallest median family size with 2.54 persons per family.
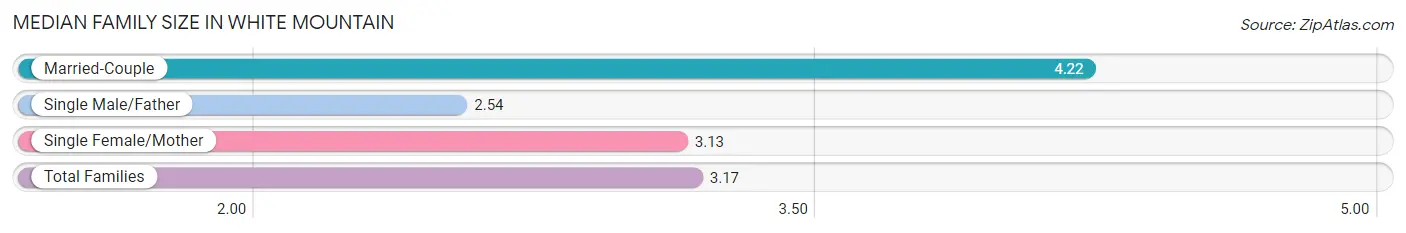
| Family Type | # Families | Family Size |
| Married-Couple | 9 (17.0%) | 4.22 |
| Single Male/Father | 13 (24.5%) | 2.54 |
| Single Female/Mother | 31 (58.5%) | 3.13 |
| Total Families | 53 (100.0%) | 3.17 |
Median Household Size in White Mountain
The median household size in White Mountain is 2.77 persons per household, with married-couple households (9 | 12.9%) accounting for the largest median household size of 4.33 persons per household. non-family households (17 | 24.3%) represent the smallest median household size with 1.06 persons per household.
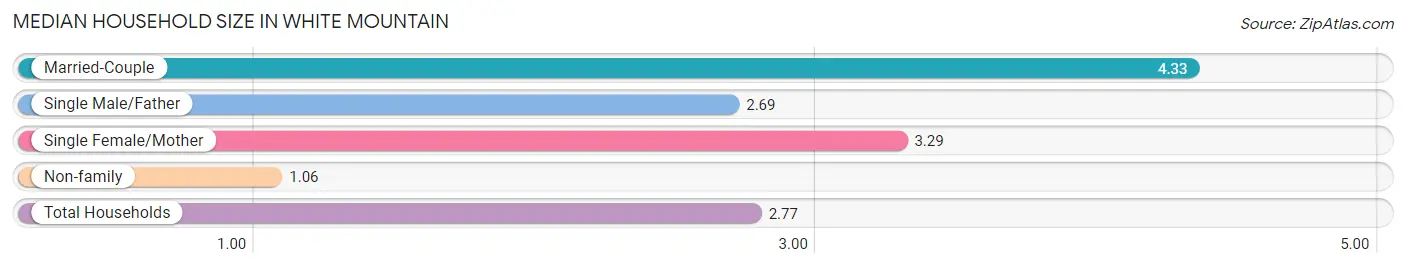
| Household Type | # Households | Household Size |
| Married-Couple | 9 (12.9%) | 4.33 |
| Single Male/Father | 13 (18.6%) | 2.69 |
| Single Female/Mother | 31 (44.3%) | 3.29 |
| Non-family | 17 (24.3%) | 1.06 |
| Total Households | 70 (100.0%) | 2.77 |
Household Size by Marriage Status in White Mountain
Out of a total of 70 households in White Mountain, 53 (75.7%) are family households, while 17 (24.3%) are nonfamily households. The most numerous type of family households are 3-person households, comprising 22, and the most common type of nonfamily households are 1-person households, comprising 16.
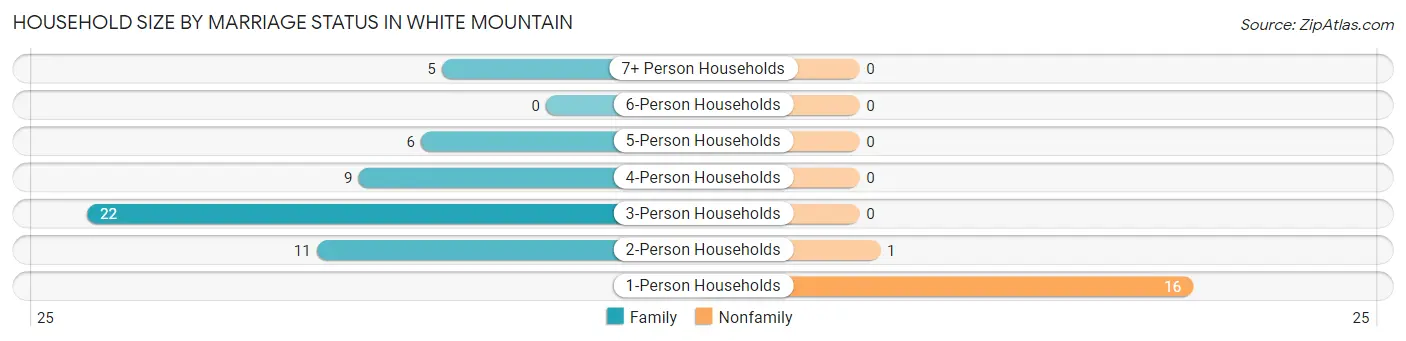
| Household Size | Family Households | Nonfamily Households |
| 1-Person Households | - | 16 (22.9%) |
| 2-Person Households | 11 (15.7%) | 1 (1.4%) |
| 3-Person Households | 22 (31.4%) | 0 (0.0%) |
| 4-Person Households | 9 (12.9%) | 0 (0.0%) |
| 5-Person Households | 6 (8.6%) | 0 (0.0%) |
| 6-Person Households | 0 (0.0%) | 0 (0.0%) |
| 7+ Person Households | 5 (7.1%) | 0 (0.0%) |
| Total | 53 (75.7%) | 17 (24.3%) |
Female Fertility in White Mountain
Fertility by Age in White Mountain
| Age Bracket | Women with Births | Births / 1,000 Women |
| 15 to 19 years | 0 (0.0%) | 0.0 |
| 20 to 34 years | 0 (0.0%) | 0.0 |
| 35 to 50 years | 0 (0.0%) | 0.0 |
| Total | 0 (0.0%) | 0.0 |
Fertility by Age by Marriage Status in White Mountain
| Age Bracket | Married | Unmarried |
| 15 to 19 years | 0 (0.0%) | 0 (0.0%) |
| 20 to 34 years | 0 (0.0%) | 0 (0.0%) |
| 35 to 50 years | 0 (0.0%) | 0 (0.0%) |
| Total | 0 (0.0%) | 0 (0.0%) |
Fertility by Education in White Mountain
| Educational Attainment | Women with Births | Births / 1,000 Women |
| Less than High School | 0 (0.0%) | 0.0 |
| High School Diploma | 0 (0.0%) | 0.0 |
| College or Associate's Degree | 0 (0.0%) | 0.0 |
| Bachelor's Degree | 0 (0.0%) | 0.0 |
| Graduate Degree | 0 (0.0%) | 0.0 |
| Total | 0 (0.0%) | 0.0 |
Fertility by Education by Marriage Status in White Mountain
| Educational Attainment | Married | Unmarried |
| Less than High School | 0 (0.0%) | 0 (0.0%) |
| High School Diploma | 0 (0.0%) | 0 (0.0%) |
| College or Associate's Degree | 0 (0.0%) | 0 (0.0%) |
| Bachelor's Degree | 0 (0.0%) | 0 (0.0%) |
| Graduate Degree | 0 (0.0%) | 0 (0.0%) |
| Total | 0 (0.0%) | 0 (0.0%) |
Employment Characteristics in White Mountain
Employment by Class of Employer in White Mountain
Among the 69 employed individuals in White Mountain, local government employees (28 | 40.6%), private company employees (13 | 18.8%), and not-for-profit organizations (12 | 17.4%) make up the most common classes of employment.
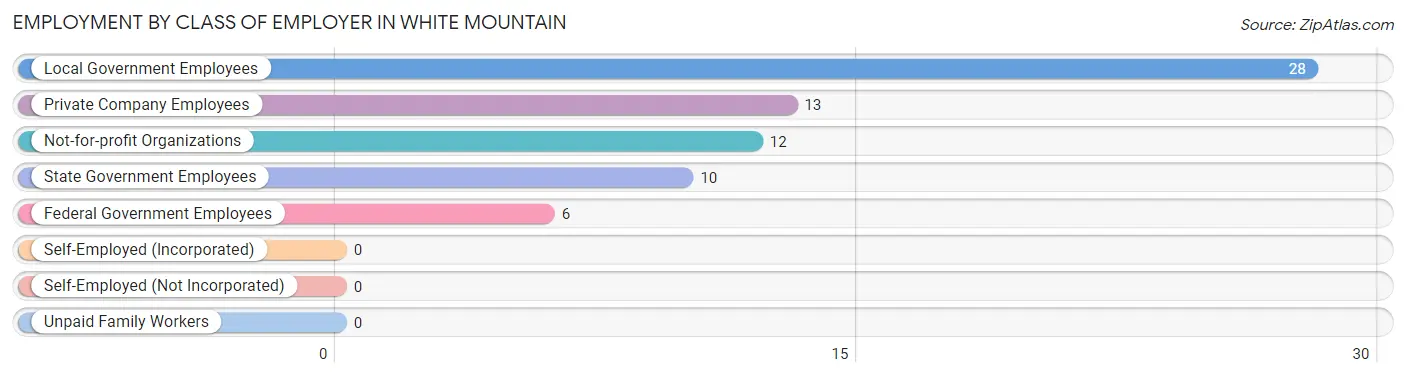
| Employer Class | # Employees | % Employees |
| Private Company Employees | 13 | 18.8% |
| Self-Employed (Incorporated) | 0 | 0.0% |
| Self-Employed (Not Incorporated) | 0 | 0.0% |
| Not-for-profit Organizations | 12 | 17.4% |
| Local Government Employees | 28 | 40.6% |
| State Government Employees | 10 | 14.5% |
| Federal Government Employees | 6 | 8.7% |
| Unpaid Family Workers | 0 | 0.0% |
| Total | 69 | 100.0% |
Employment Status by Age in White Mountain
According to the labor force statistics for White Mountain, out of the total population over 16 years of age (148), 64.2% or 95 individuals are in the labor force, with 26.3% or 25 of them unemployed. The age group with the highest labor force participation rate is 45 to 54 years, with 100.0% or 19 individuals in the labor force. Within the labor force, the 60 to 64 years age range has the highest percentage of unemployed individuals, with 50.0% or 2 of them being unemployed.
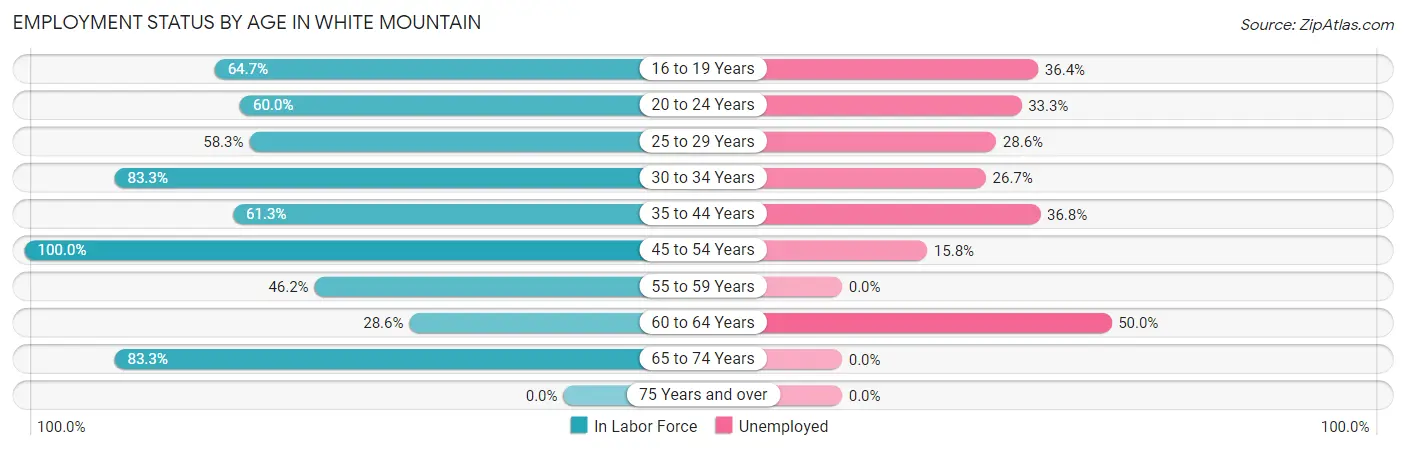
| Age Bracket | In Labor Force | Unemployed |
| 16 to 19 Years | 11 (64.7%) | 4 (36.4%) |
| 20 to 24 Years | 9 (60.0%) | 3 (33.3%) |
| 25 to 29 Years | 7 (58.3%) | 2 (28.6%) |
| 30 to 34 Years | 15 (83.3%) | 4 (26.7%) |
| 35 to 44 Years | 19 (61.3%) | 7 (36.8%) |
| 45 to 54 Years | 19 (100.0%) | 3 (15.8%) |
| 55 to 59 Years | 6 (46.2%) | 0 (0.0%) |
| 60 to 64 Years | 4 (28.6%) | 2 (50.0%) |
| 65 to 74 Years | 5 (83.3%) | 0 (0.0%) |
| 75 Years and over | 0 (0.0%) | 0 (0.0%) |
| Total | 95 (64.2%) | 25 (26.3%) |
Employment Status by Educational Attainment in White Mountain
According to labor force statistics for White Mountain, 65.4% of individuals (70) out of the total population between 25 and 64 years of age (107) are in the labor force, with 25.7% or 18 of them being unemployed. The group with the highest labor force participation rate are those with the educational attainment of bachelor's degree or higher, with 100.0% or 9 individuals in the labor force. Within the labor force, individuals with high school diploma education have the highest percentage of unemployment, with 41.4% or 12 of them being unemployed.
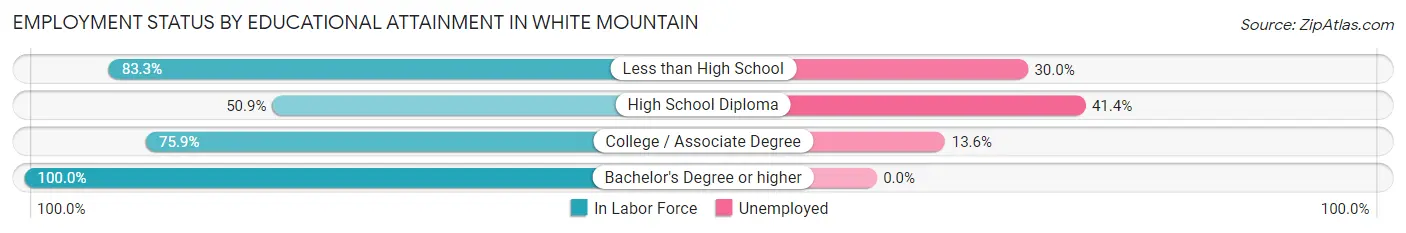
| Educational Attainment | In Labor Force | Unemployed |
| Less than High School | 10 (83.3%) | 4 (30.0%) |
| High School Diploma | 29 (50.9%) | 24 (41.4%) |
| College / Associate Degree | 22 (75.9%) | 4 (13.6%) |
| Bachelor's Degree or higher | 9 (100.0%) | 0 (0.0%) |
| Total | 70 (65.4%) | 27 (25.7%) |
Employment Occupations by Sex in White Mountain
Management, Business, Science and Arts Occupations
The most common Management, Business, Science and Arts occupations in White Mountain are Community & Social Service (12 | 17.1%), Education Instruction & Library (8 | 11.4%), Management (5 | 7.1%), Education, Arts & Media (4 | 5.7%), and Health Diagnosing & Treating (3 | 4.3%).
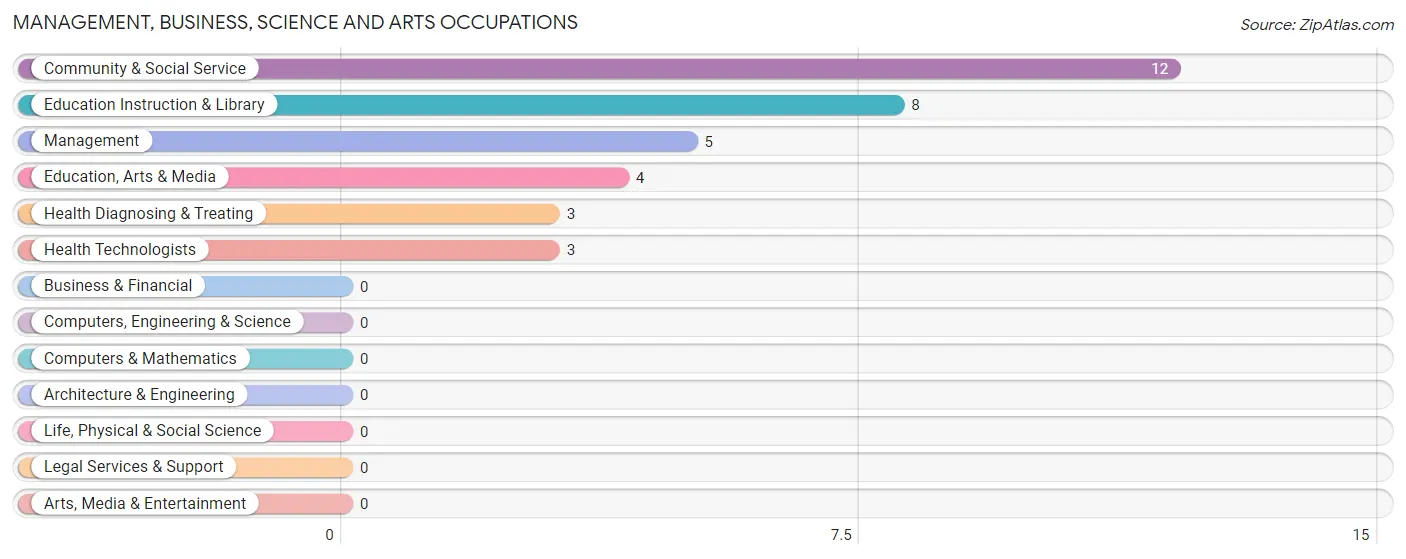
Management, Business, Science and Arts Occupations by Sex
Within the Management, Business, Science and Arts occupations in White Mountain, the most male-oriented occupations are Management (20.0%), Education Instruction & Library (12.5%), and Community & Social Service (8.3%), while the most female-oriented occupations are Education, Arts & Media (100.0%), Health Diagnosing & Treating (100.0%), and Health Technologists (100.0%).
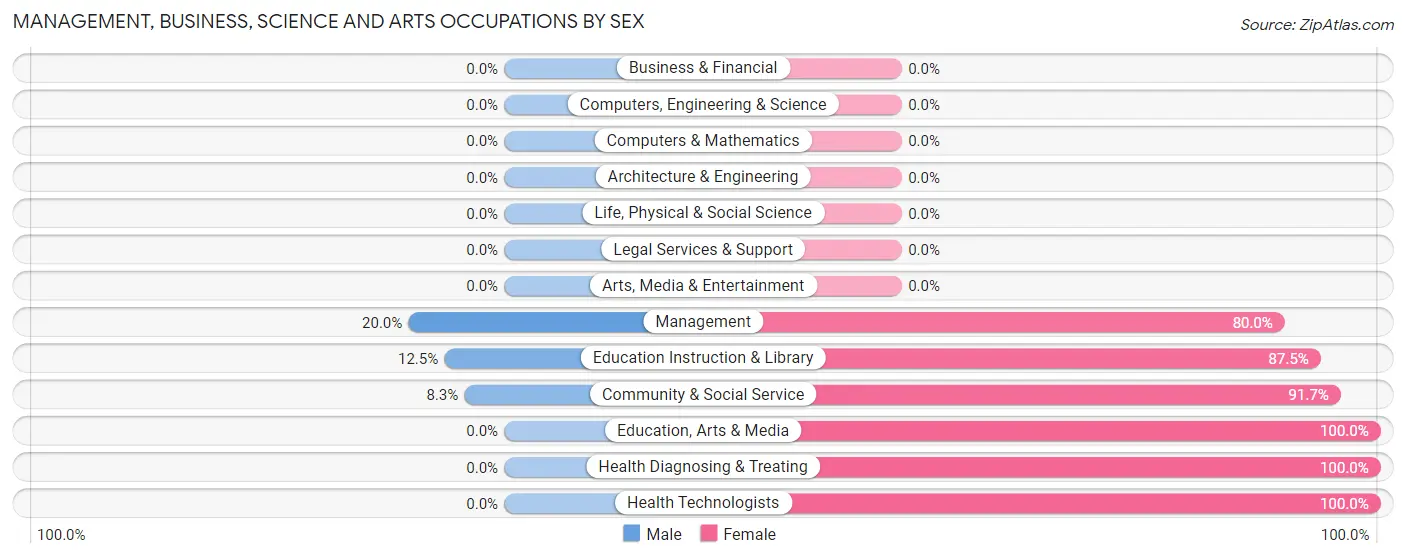
| Occupation | Male | Female |
| Management | 1 (20.0%) | 4 (80.0%) |
| Business & Financial | 0 (0.0%) | 0 (0.0%) |
| Computers, Engineering & Science | 0 (0.0%) | 0 (0.0%) |
| Computers & Mathematics | 0 (0.0%) | 0 (0.0%) |
| Architecture & Engineering | 0 (0.0%) | 0 (0.0%) |
| Life, Physical & Social Science | 0 (0.0%) | 0 (0.0%) |
| Community & Social Service | 1 (8.3%) | 11 (91.7%) |
| Education, Arts & Media | 0 (0.0%) | 4 (100.0%) |
| Legal Services & Support | 0 (0.0%) | 0 (0.0%) |
| Education Instruction & Library | 1 (12.5%) | 7 (87.5%) |
| Arts, Media & Entertainment | 0 (0.0%) | 0 (0.0%) |
| Health Diagnosing & Treating | 0 (0.0%) | 3 (100.0%) |
| Health Technologists | 0 (0.0%) | 3 (100.0%) |
| Total (Category) | 2 (10.0%) | 18 (90.0%) |
| Total (Overall) | 29 (41.4%) | 41 (58.6%) |
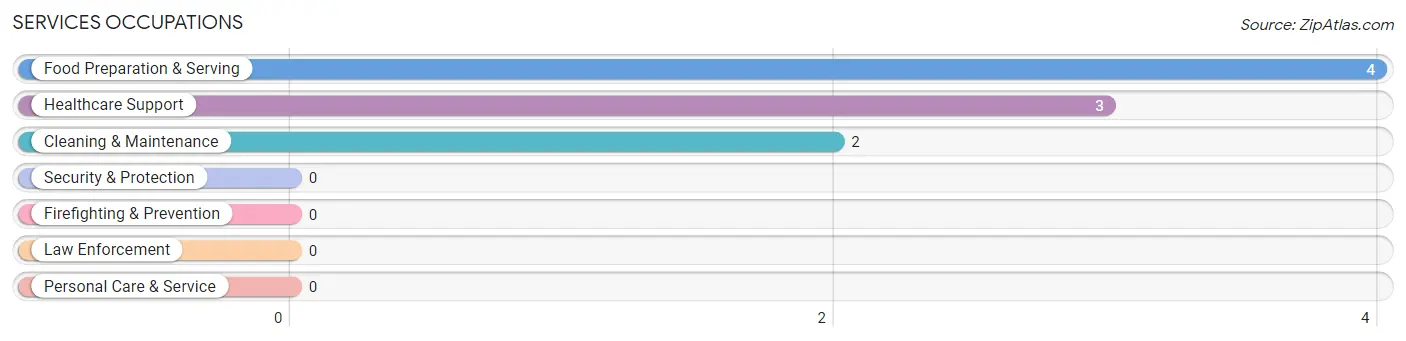
Services Occupations
The most common Services occupations in White Mountain are Food Preparation & Serving (4 | 5.7%), Healthcare Support (3 | 4.3%), and Cleaning & Maintenance (2 | 2.9%).
Services Occupations by Sex
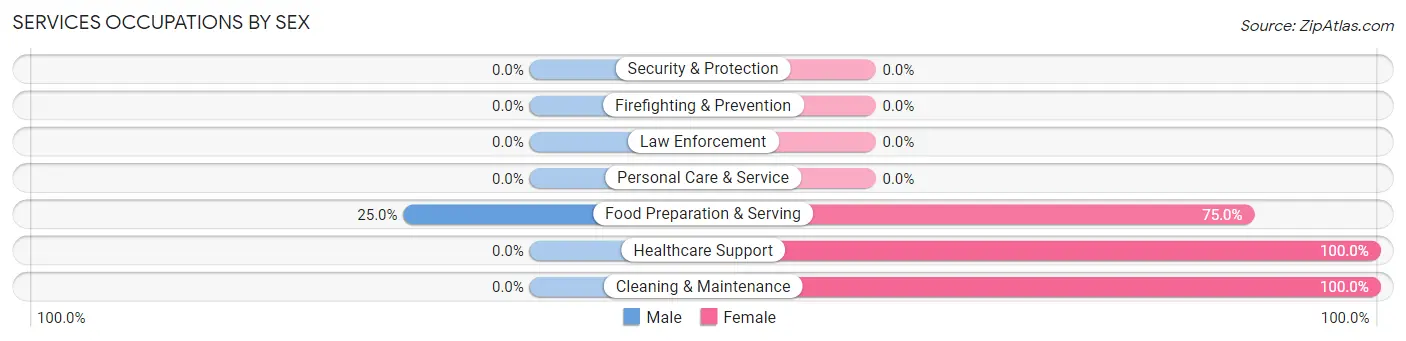
| Occupation | Male | Female |
| Healthcare Support | 0 (0.0%) | 3 (100.0%) |
| Security & Protection | 0 (0.0%) | 0 (0.0%) |
| Firefighting & Prevention | 0 (0.0%) | 0 (0.0%) |
| Law Enforcement | 0 (0.0%) | 0 (0.0%) |
| Food Preparation & Serving | 1 (25.0%) | 3 (75.0%) |
| Cleaning & Maintenance | 0 (0.0%) | 2 (100.0%) |
| Personal Care & Service | 0 (0.0%) | 0 (0.0%) |
| Total (Category) | 1 (11.1%) | 8 (88.9%) |
| Total (Overall) | 29 (41.4%) | 41 (58.6%) |
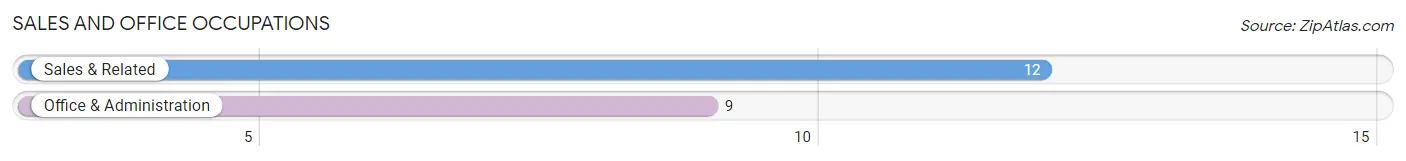
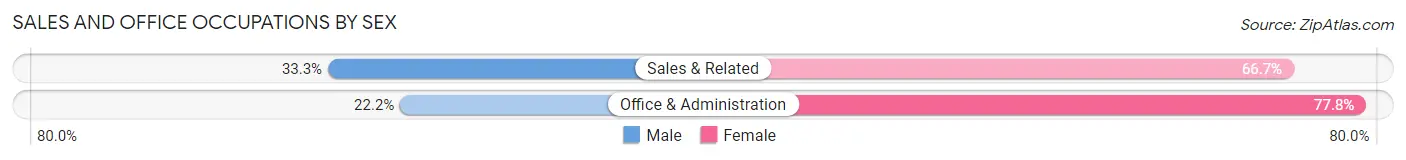
Sales and Office Occupations
The most common Sales and Office occupations in White Mountain are Sales & Related (12 | 17.1%), and Office & Administration (9 | 12.9%).
Sales and Office Occupations by Sex
| Occupation | Male | Female |
| Sales & Related | 4 (33.3%) | 8 (66.7%) |
| Office & Administration | 2 (22.2%) | 7 (77.8%) |
| Total (Category) | 6 (28.6%) | 15 (71.4%) |
| Total (Overall) | 29 (41.4%) | 41 (58.6%) |
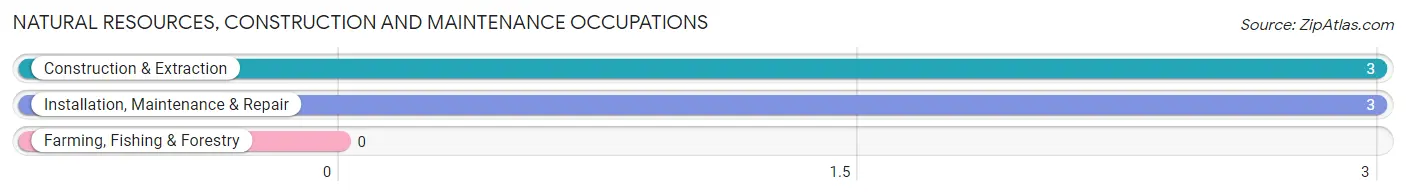
Natural Resources, Construction and Maintenance Occupations
The most common Natural Resources, Construction and Maintenance occupations in White Mountain are Construction & Extraction (3 | 4.3%), and Installation, Maintenance & Repair (3 | 4.3%).
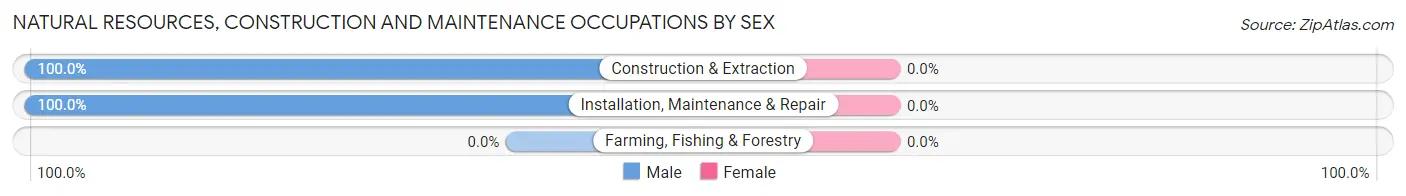
Natural Resources, Construction and Maintenance Occupations by Sex
| Occupation | Male | Female |
| Farming, Fishing & Forestry | 0 (0.0%) | 0 (0.0%) |
| Construction & Extraction | 3 (100.0%) | 0 (0.0%) |
| Installation, Maintenance & Repair | 3 (100.0%) | 0 (0.0%) |
| Total (Category) | 6 (100.0%) | 0 (0.0%) |
| Total (Overall) | 29 (41.4%) | 41 (58.6%) |
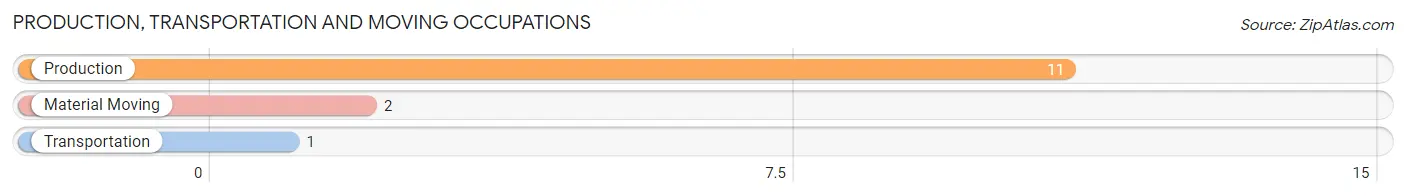
Production, Transportation and Moving Occupations
The most common Production, Transportation and Moving occupations in White Mountain are Production (11 | 15.7%), Material Moving (2 | 2.9%), and Transportation (1 | 1.4%).
Production, Transportation and Moving Occupations by Sex
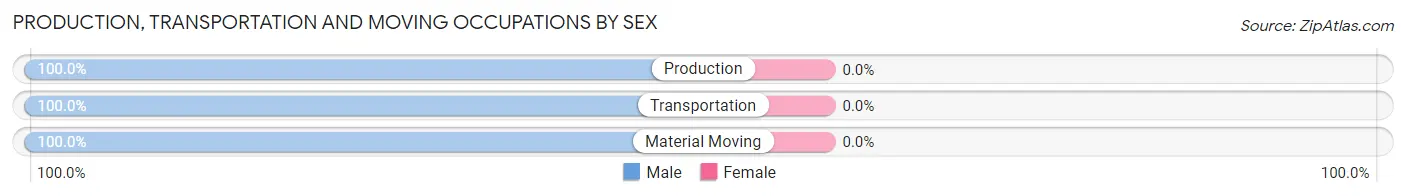
| Occupation | Male | Female |
| Production | 11 (100.0%) | 0 (0.0%) |
| Transportation | 1 (100.0%) | 0 (0.0%) |
| Material Moving | 2 (100.0%) | 0 (0.0%) |
| Total (Category) | 14 (100.0%) | 0 (0.0%) |
| Total (Overall) | 29 (41.4%) | 41 (58.6%) |
Employment Industries by Sex in White Mountain
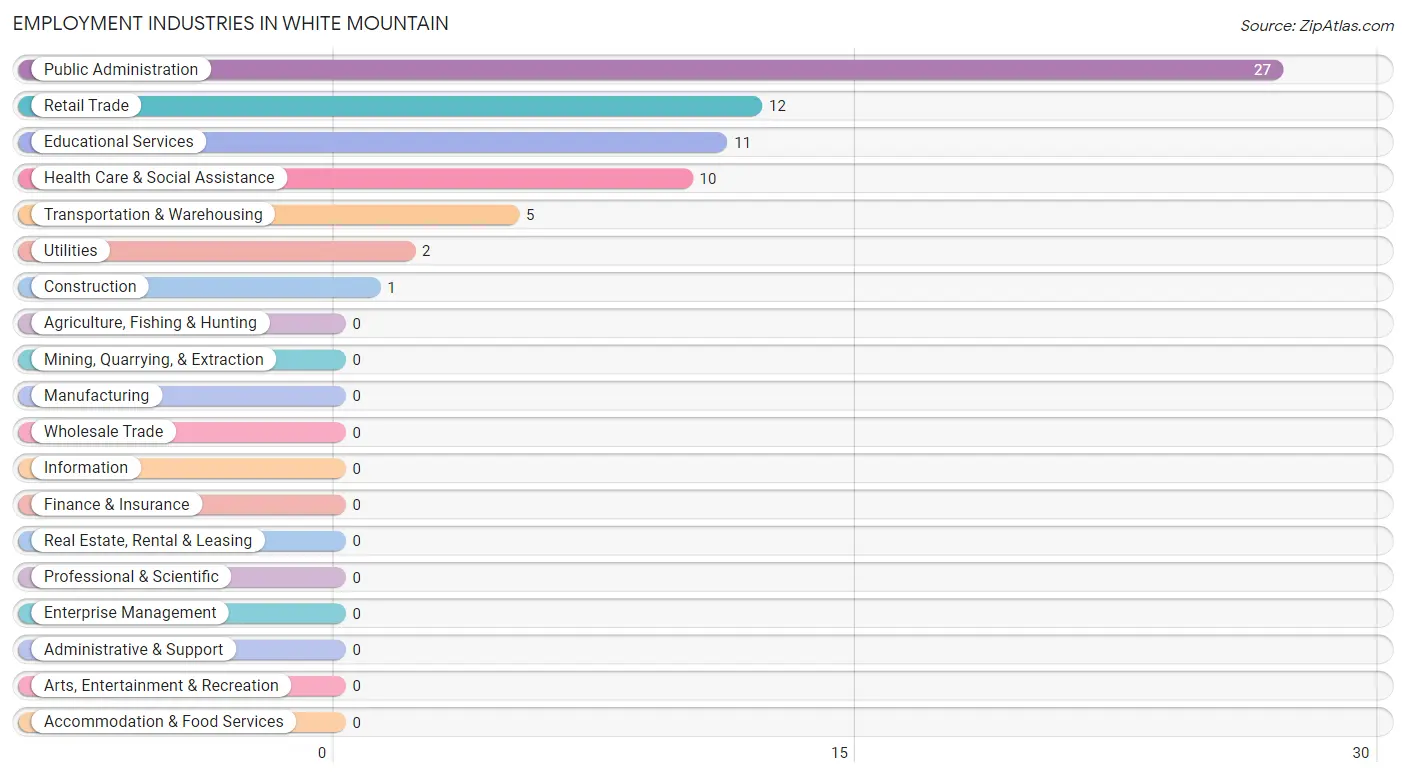
Employment Industries in White Mountain
The major employment industries in White Mountain include Public Administration (27 | 38.6%), Retail Trade (12 | 17.1%), Educational Services (11 | 15.7%), Health Care & Social Assistance (10 | 14.3%), and Transportation & Warehousing (5 | 7.1%).
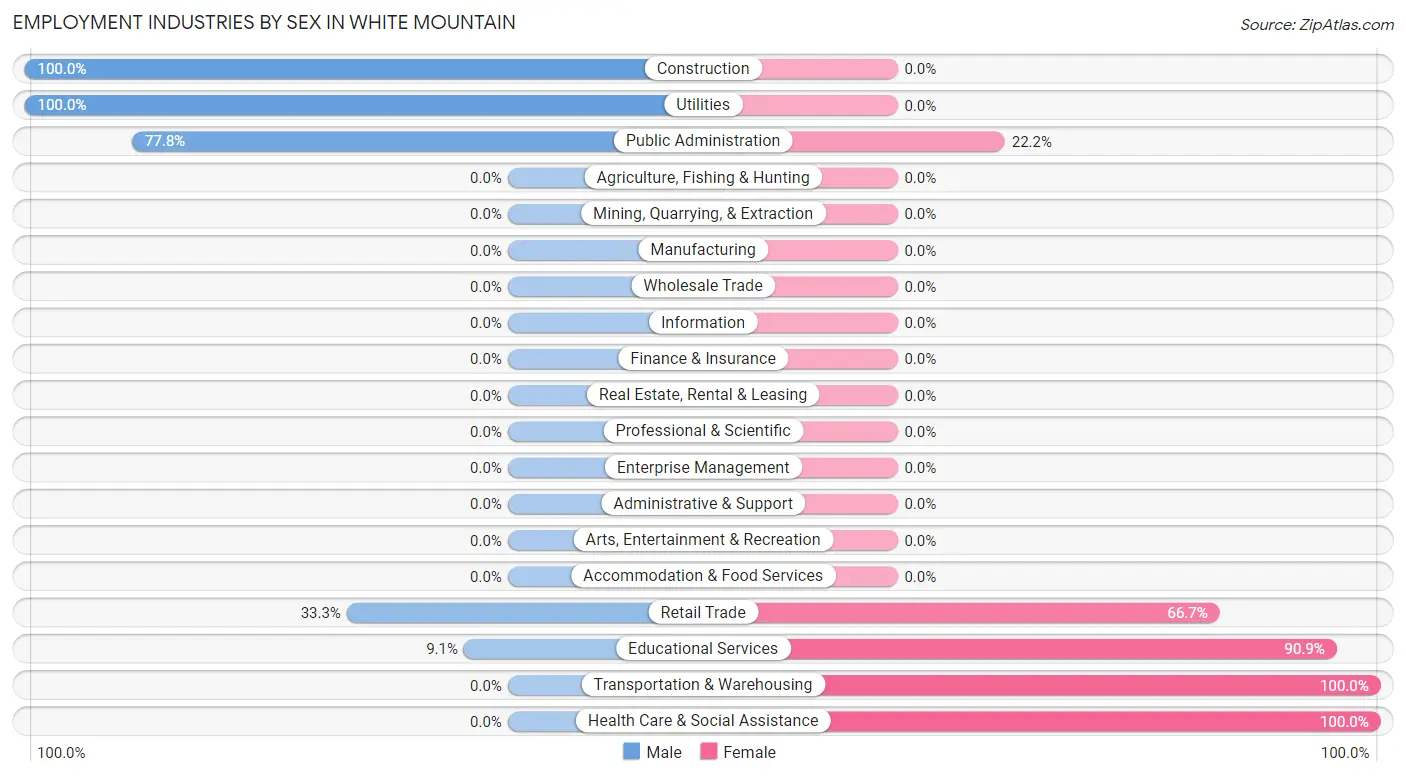
Employment Industries by Sex in White Mountain
The White Mountain industries that see more men than women are Construction (100.0%), Utilities (100.0%), and Public Administration (77.8%), whereas the industries that tend to have a higher number of women are Transportation & Warehousing (100.0%), Health Care & Social Assistance (100.0%), and Educational Services (90.9%).
| Industry | Male | Female |
| Agriculture, Fishing & Hunting | 0 (0.0%) | 0 (0.0%) |
| Mining, Quarrying, & Extraction | 0 (0.0%) | 0 (0.0%) |
| Construction | 1 (100.0%) | 0 (0.0%) |
| Manufacturing | 0 (0.0%) | 0 (0.0%) |
| Wholesale Trade | 0 (0.0%) | 0 (0.0%) |
| Retail Trade | 4 (33.3%) | 8 (66.7%) |
| Transportation & Warehousing | 0 (0.0%) | 5 (100.0%) |
| Utilities | 2 (100.0%) | 0 (0.0%) |
| Information | 0 (0.0%) | 0 (0.0%) |
| Finance & Insurance | 0 (0.0%) | 0 (0.0%) |
| Real Estate, Rental & Leasing | 0 (0.0%) | 0 (0.0%) |
| Professional & Scientific | 0 (0.0%) | 0 (0.0%) |
| Enterprise Management | 0 (0.0%) | 0 (0.0%) |
| Administrative & Support | 0 (0.0%) | 0 (0.0%) |
| Educational Services | 1 (9.1%) | 10 (90.9%) |
| Health Care & Social Assistance | 0 (0.0%) | 10 (100.0%) |
| Arts, Entertainment & Recreation | 0 (0.0%) | 0 (0.0%) |
| Accommodation & Food Services | 0 (0.0%) | 0 (0.0%) |
| Public Administration | 21 (77.8%) | 6 (22.2%) |
| Total | 29 (41.4%) | 41 (58.6%) |
Education in White Mountain
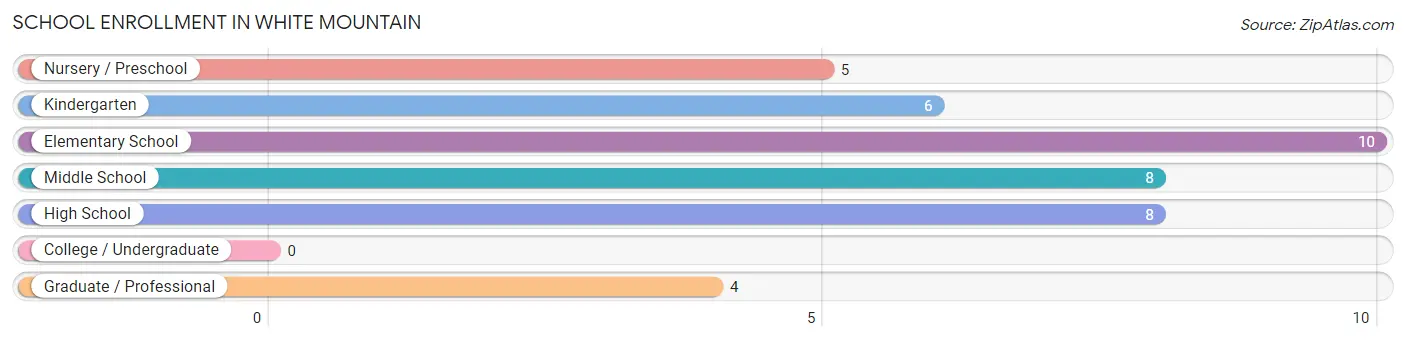
School Enrollment in White Mountain
The most common levels of schooling among the 41 students in White Mountain are elementary school (10 | 24.4%), middle school (8 | 19.5%), and high school (8 | 19.5%).
| School Level | # Students | % Students |
| Nursery / Preschool | 5 | 12.2% |
| Kindergarten | 6 | 14.6% |
| Elementary School | 10 | 24.4% |
| Middle School | 8 | 19.5% |
| High School | 8 | 19.5% |
| College / Undergraduate | 0 | 0.0% |
| Graduate / Professional | 4 | 9.8% |
| Total | 41 | 100.0% |
School Enrollment by Age by Funding Source in White Mountain
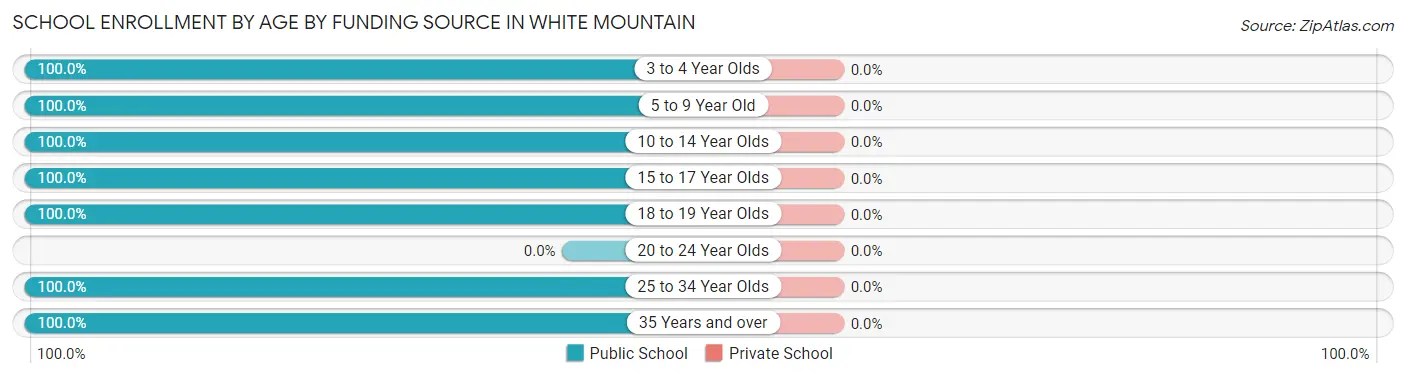
| Age Bracket | Public School | Private School |
| 3 to 4 Year Olds | 4 (100.0%) | 0 (0.0%) |
| 5 to 9 Year Old | 17 (100.0%) | 0 (0.0%) |
| 10 to 14 Year Olds | 9 (100.0%) | 0 (0.0%) |
| 15 to 17 Year Olds | 5 (100.0%) | 0 (0.0%) |
| 18 to 19 Year Olds | 2 (100.0%) | 0 (0.0%) |
| 20 to 24 Year Olds | 0 (0.0%) | 0 (0.0%) |
| 25 to 34 Year Olds | 3 (100.0%) | 0 (0.0%) |
| 35 Years and over | 1 (100.0%) | 0 (0.0%) |
| Total | 41 (100.0%) | 0 (0.0%) |
Educational Attainment by Field of Study in White Mountain
Psychology (4 | 44.4%), literature & languages (2 | 22.2%), bio, nature & agricultural (1 | 11.1%), education (1 | 11.1%), and liberal arts & history (1 | 11.1%) are the most common fields of study among 9 individuals in White Mountain who have obtained a bachelor's degree or higher.
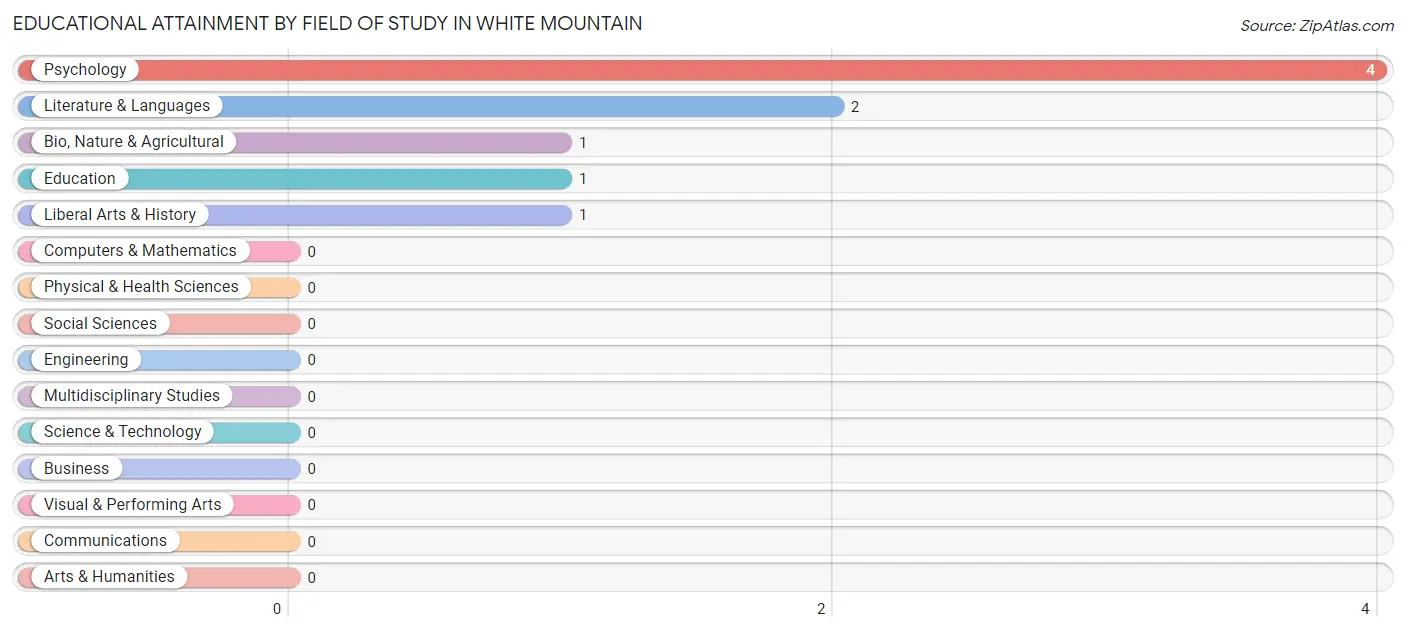
| Field of Study | # Graduates | % Graduates |
| Computers & Mathematics | 0 | 0.0% |
| Bio, Nature & Agricultural | 1 | 11.1% |
| Physical & Health Sciences | 0 | 0.0% |
| Psychology | 4 | 44.4% |
| Social Sciences | 0 | 0.0% |
| Engineering | 0 | 0.0% |
| Multidisciplinary Studies | 0 | 0.0% |
| Science & Technology | 0 | 0.0% |
| Business | 0 | 0.0% |
| Education | 1 | 11.1% |
| Literature & Languages | 2 | 22.2% |
| Liberal Arts & History | 1 | 11.1% |
| Visual & Performing Arts | 0 | 0.0% |
| Communications | 0 | 0.0% |
| Arts & Humanities | 0 | 0.0% |
| Total | 9 | 100.0% |
Transportation & Commute in White Mountain
Vehicle Availability by Sex in White Mountain
The most prevalent vehicle ownership categories in White Mountain are males with no vehicle (20, accounting for 69.0%) and females with no vehicle (35, making up 50.0%).
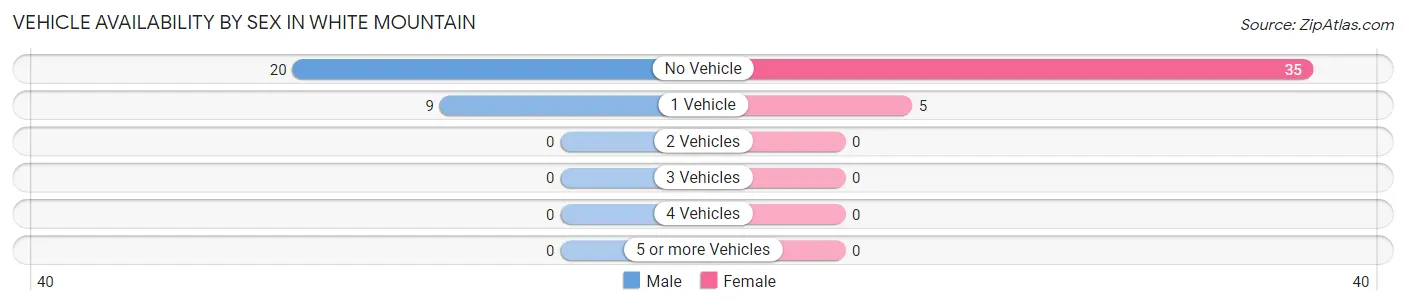
| Vehicles Available | Male | Female |
| No Vehicle | 20 (69.0%) | 35 (87.5%) |
| 1 Vehicle | 9 (31.0%) | 5 (12.5%) |
| 2 Vehicles | 0 (0.0%) | 0 (0.0%) |
| 3 Vehicles | 0 (0.0%) | 0 (0.0%) |
| 4 Vehicles | 0 (0.0%) | 0 (0.0%) |
| 5 or more Vehicles | 0 (0.0%) | 0 (0.0%) |
| Total | 29 (100.0%) | 40 (100.0%) |
Commute Time in White Mountain
The most frequently occuring commute durations in White Mountain are less than 5 minutes (48 commuters, 69.6%), 5 to 9 minutes (9 commuters, 13.0%), and 10 to 14 minutes (7 commuters, 10.1%).
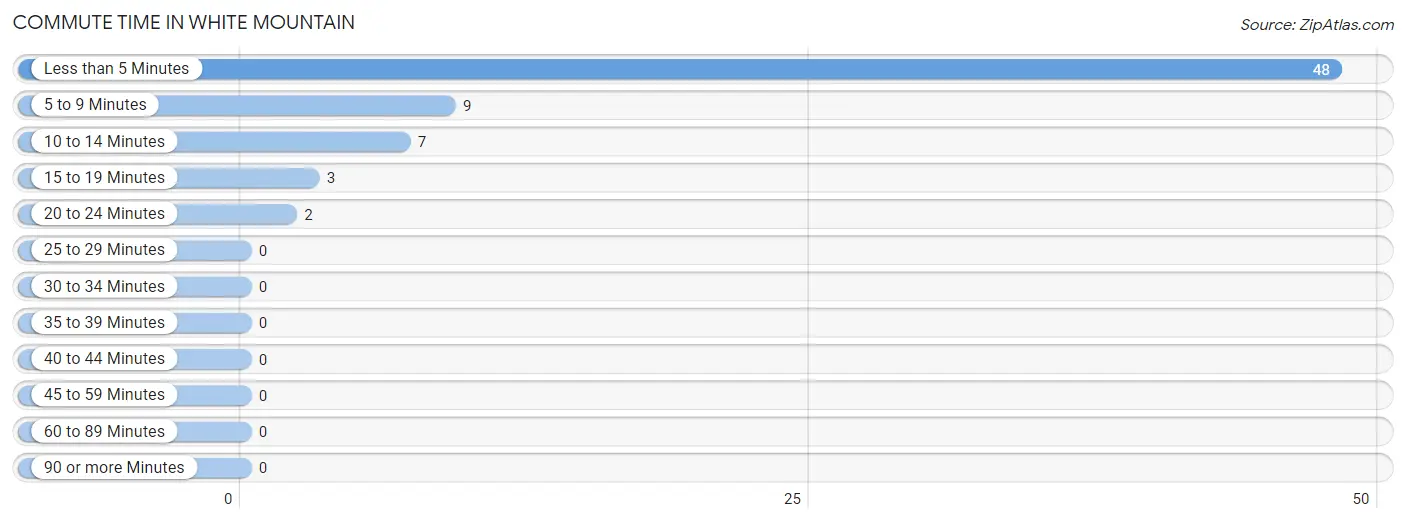
| Commute Time | # Commuters | % Commuters |
| Less than 5 Minutes | 48 | 69.6% |
| 5 to 9 Minutes | 9 | 13.0% |
| 10 to 14 Minutes | 7 | 10.1% |
| 15 to 19 Minutes | 3 | 4.3% |
| 20 to 24 Minutes | 2 | 2.9% |
| 25 to 29 Minutes | 0 | 0.0% |
| 30 to 34 Minutes | 0 | 0.0% |
| 35 to 39 Minutes | 0 | 0.0% |
| 40 to 44 Minutes | 0 | 0.0% |
| 45 to 59 Minutes | 0 | 0.0% |
| 60 to 89 Minutes | 0 | 0.0% |
| 90 or more Minutes | 0 | 0.0% |
Commute Time by Sex in White Mountain
The most common commute times in White Mountain are less than 5 minutes (18 commuters, 62.1%) for males and less than 5 minutes (30 commuters, 75.0%) for females.
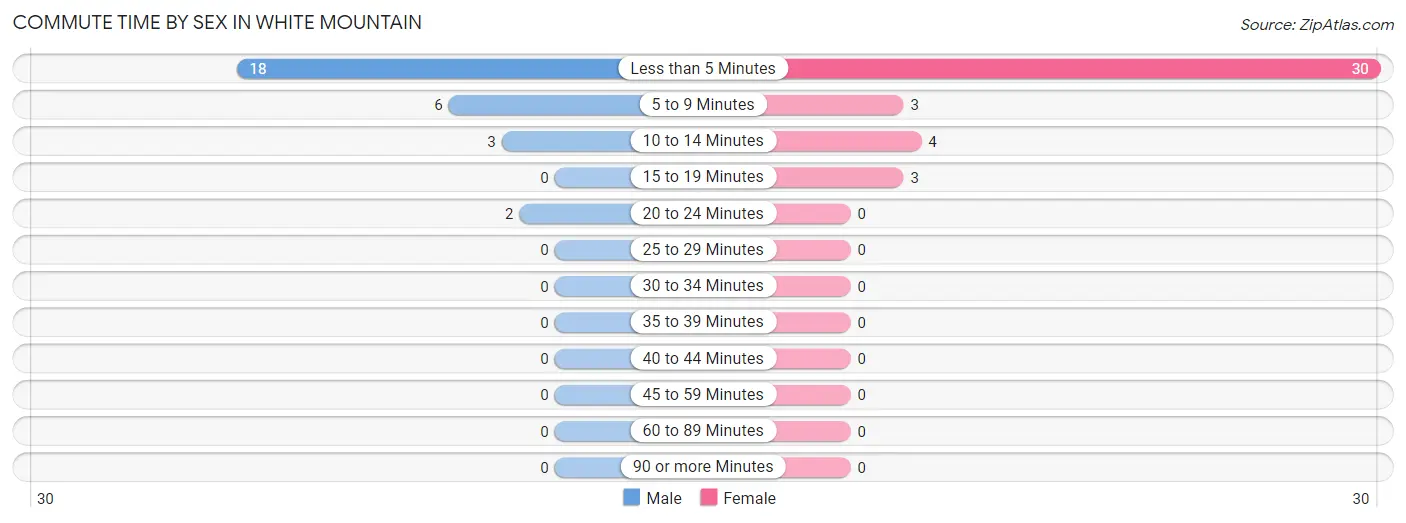
| Commute Time | Male | Female |
| Less than 5 Minutes | 18 (62.1%) | 30 (75.0%) |
| 5 to 9 Minutes | 6 (20.7%) | 3 (7.5%) |
| 10 to 14 Minutes | 3 (10.3%) | 4 (10.0%) |
| 15 to 19 Minutes | 0 (0.0%) | 3 (7.5%) |
| 20 to 24 Minutes | 2 (6.9%) | 0 (0.0%) |
| 25 to 29 Minutes | 0 (0.0%) | 0 (0.0%) |
| 30 to 34 Minutes | 0 (0.0%) | 0 (0.0%) |
| 35 to 39 Minutes | 0 (0.0%) | 0 (0.0%) |
| 40 to 44 Minutes | 0 (0.0%) | 0 (0.0%) |
| 45 to 59 Minutes | 0 (0.0%) | 0 (0.0%) |
| 60 to 89 Minutes | 0 (0.0%) | 0 (0.0%) |
| 90 or more Minutes | 0 (0.0%) | 0 (0.0%) |
Time of Departure to Work by Sex in White Mountain
The most frequent times of departure to work in White Mountain are 10:00 AM to 10:59 AM (11, 37.9%) for males and 7:30 AM to 7:59 AM (12, 30.0%) for females.
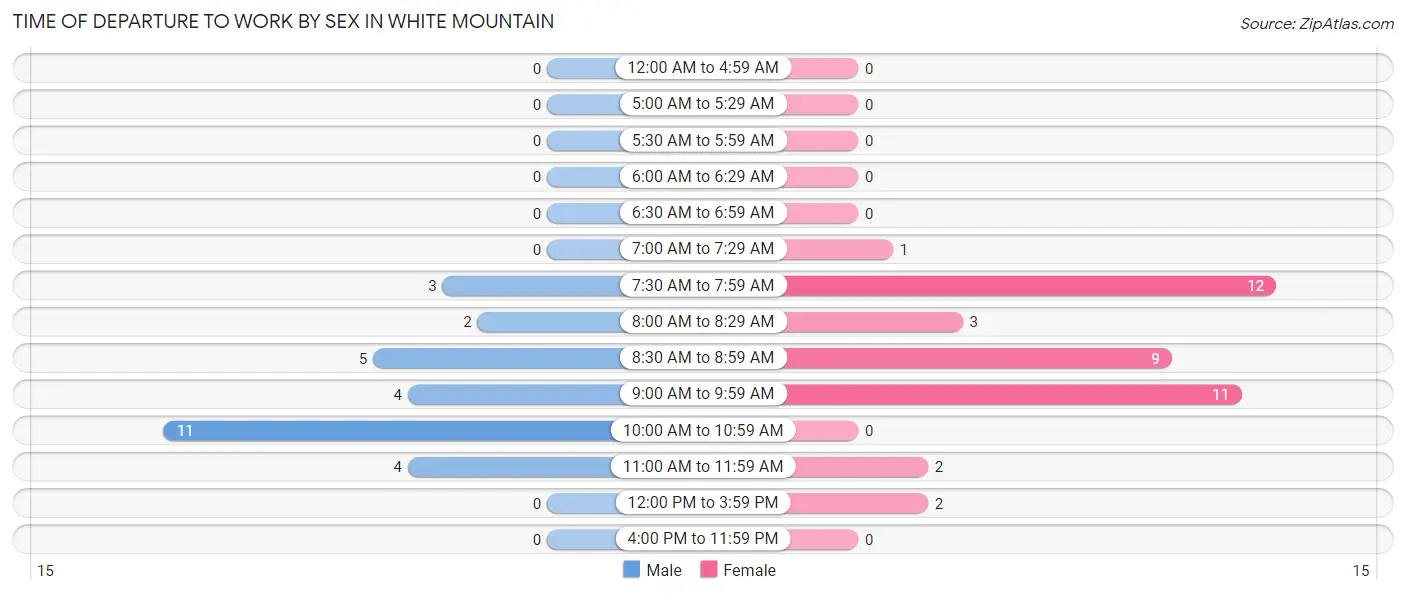
| Time of Departure | Male | Female |
| 12:00 AM to 4:59 AM | 0 (0.0%) | 0 (0.0%) |
| 5:00 AM to 5:29 AM | 0 (0.0%) | 0 (0.0%) |
| 5:30 AM to 5:59 AM | 0 (0.0%) | 0 (0.0%) |
| 6:00 AM to 6:29 AM | 0 (0.0%) | 0 (0.0%) |
| 6:30 AM to 6:59 AM | 0 (0.0%) | 0 (0.0%) |
| 7:00 AM to 7:29 AM | 0 (0.0%) | 1 (2.5%) |
| 7:30 AM to 7:59 AM | 3 (10.3%) | 12 (30.0%) |
| 8:00 AM to 8:29 AM | 2 (6.9%) | 3 (7.5%) |
| 8:30 AM to 8:59 AM | 5 (17.2%) | 9 (22.5%) |
| 9:00 AM to 9:59 AM | 4 (13.8%) | 11 (27.5%) |
| 10:00 AM to 10:59 AM | 11 (37.9%) | 0 (0.0%) |
| 11:00 AM to 11:59 AM | 4 (13.8%) | 2 (5.0%) |
| 12:00 PM to 3:59 PM | 0 (0.0%) | 2 (5.0%) |
| 4:00 PM to 11:59 PM | 0 (0.0%) | 0 (0.0%) |
| Total | 29 (100.0%) | 40 (100.0%) |
Housing Occupancy in White Mountain
Occupancy by Ownership in White Mountain
Of the total 70 dwellings in White Mountain, owner-occupied units account for 47 (67.1%), while renter-occupied units make up 23 (32.9%).
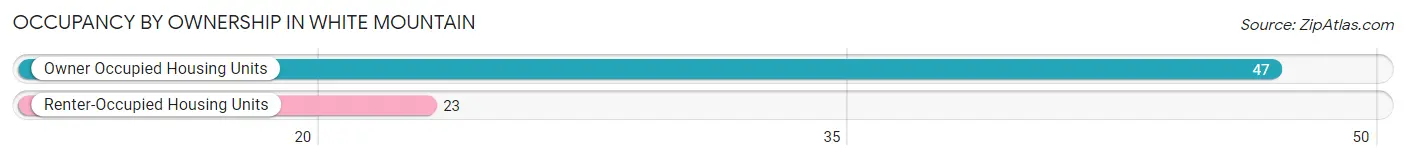
| Occupancy | # Housing Units | % Housing Units |
| Owner Occupied Housing Units | 47 | 67.1% |
| Renter-Occupied Housing Units | 23 | 32.9% |
| Total Occupied Housing Units | 70 | 100.0% |
Occupancy by Household Size in White Mountain
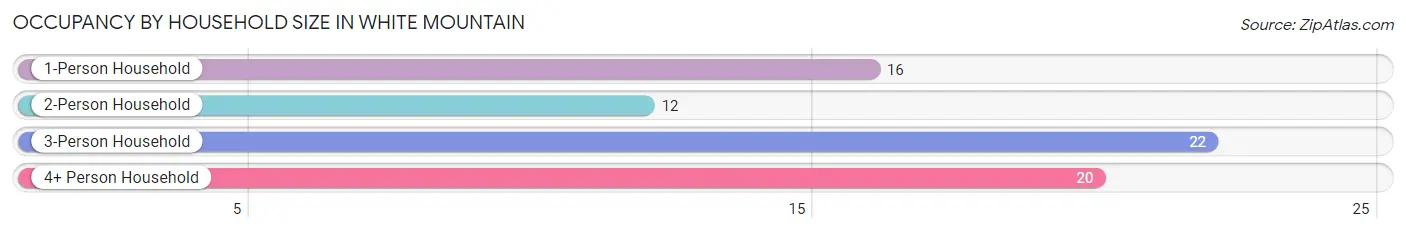
| Household Size | # Housing Units | % Housing Units |
| 1-Person Household | 16 | 22.9% |
| 2-Person Household | 12 | 17.1% |
| 3-Person Household | 22 | 31.4% |
| 4+ Person Household | 20 | 28.6% |
| Total Housing Units | 70 | 100.0% |
Occupancy by Ownership by Household Size in White Mountain
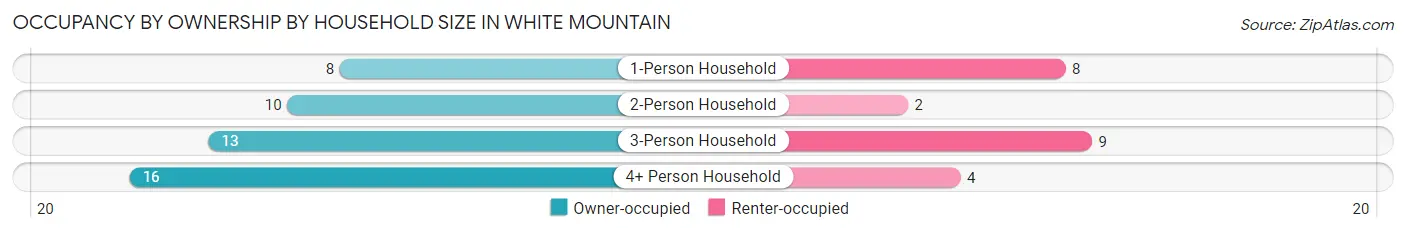
| Household Size | Owner-occupied | Renter-occupied |
| 1-Person Household | 8 (50.0%) | 8 (50.0%) |
| 2-Person Household | 10 (83.3%) | 2 (16.7%) |
| 3-Person Household | 13 (59.1%) | 9 (40.9%) |
| 4+ Person Household | 16 (80.0%) | 4 (20.0%) |
| Total Housing Units | 47 (67.1%) | 23 (32.9%) |
Occupancy by Educational Attainment in White Mountain
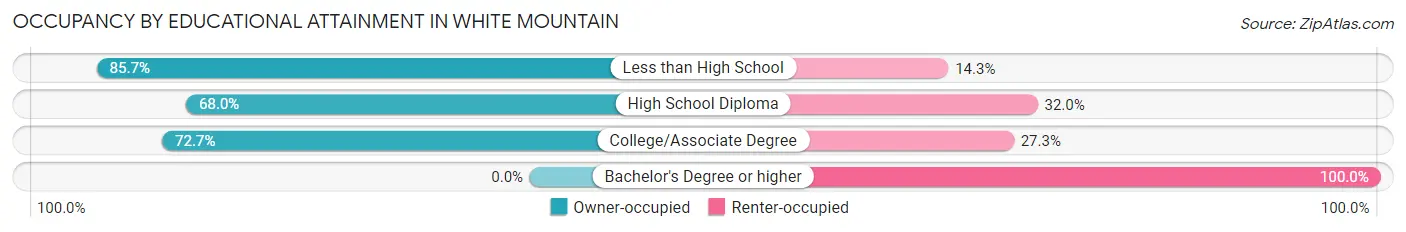
| Household Size | Owner-occupied | Renter-occupied |
| Less than High School | 6 (85.7%) | 1 (14.3%) |
| High School Diploma | 17 (68.0%) | 8 (32.0%) |
| College/Associate Degree | 24 (72.7%) | 9 (27.3%) |
| Bachelor's Degree or higher | 0 (0.0%) | 5 (100.0%) |
Occupancy by Age of Householder in White Mountain
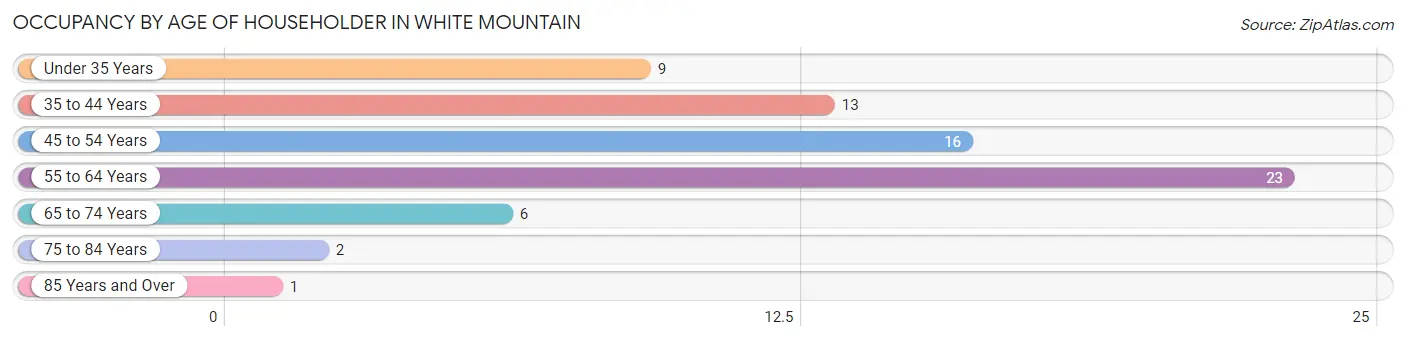
| Age Bracket | # Households | % Households |
| Under 35 Years | 9 | 12.9% |
| 35 to 44 Years | 13 | 18.6% |
| 45 to 54 Years | 16 | 22.9% |
| 55 to 64 Years | 23 | 32.9% |
| 65 to 74 Years | 6 | 8.6% |
| 75 to 84 Years | 2 | 2.9% |
| 85 Years and Over | 1 | 1.4% |
| Total | 70 | 100.0% |
Housing Finances in White Mountain
Median Income by Occupancy in White Mountain
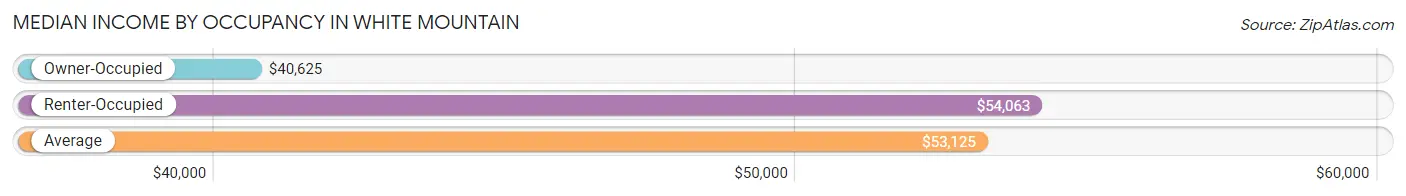
| Occupancy Type | # Households | Median Income |
| Owner-Occupied | 47 (67.1%) | $40,625 |
| Renter-Occupied | 23 (32.9%) | $54,063 |
| Average | 70 (100.0%) | $53,125 |
Occupancy by Householder Income Bracket in White Mountain
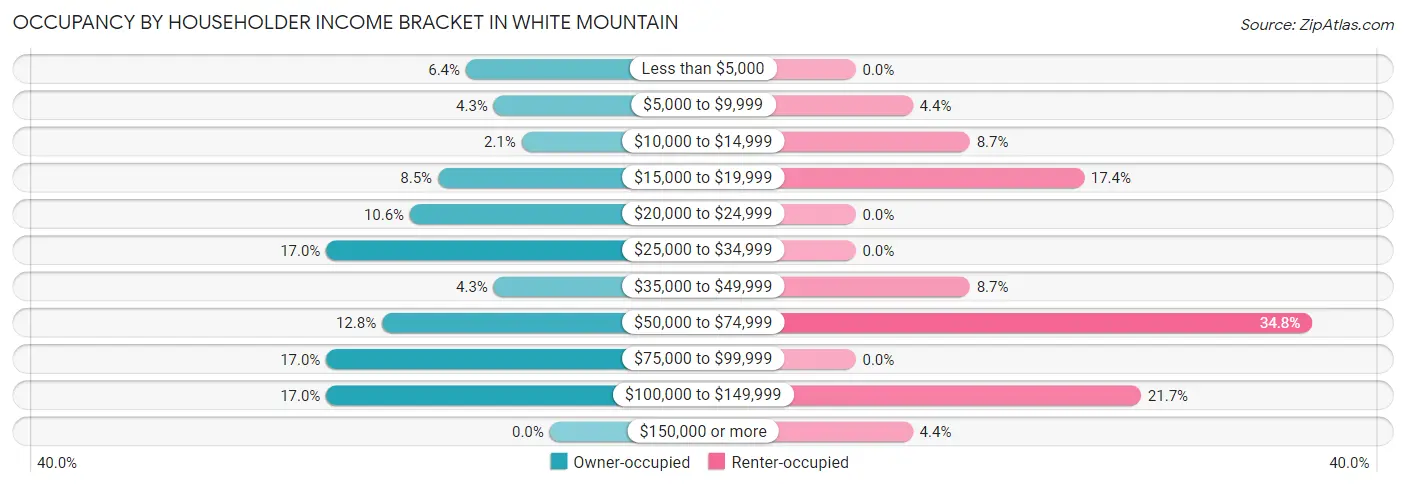
| Income Bracket | Owner-occupied | Renter-occupied |
| Less than $5,000 | 3 (6.4%) | 0 (0.0%) |
| $5,000 to $9,999 | 2 (4.3%) | 1 (4.3%) |
| $10,000 to $14,999 | 1 (2.1%) | 2 (8.7%) |
| $15,000 to $19,999 | 4 (8.5%) | 4 (17.4%) |
| $20,000 to $24,999 | 5 (10.6%) | 0 (0.0%) |
| $25,000 to $34,999 | 8 (17.0%) | 0 (0.0%) |
| $35,000 to $49,999 | 2 (4.3%) | 2 (8.7%) |
| $50,000 to $74,999 | 6 (12.8%) | 8 (34.8%) |
| $75,000 to $99,999 | 8 (17.0%) | 0 (0.0%) |
| $100,000 to $149,999 | 8 (17.0%) | 5 (21.7%) |
| $150,000 or more | 0 (0.0%) | 1 (4.3%) |
| Total | 47 (100.0%) | 23 (100.0%) |
Monthly Housing Cost Tiers in White Mountain
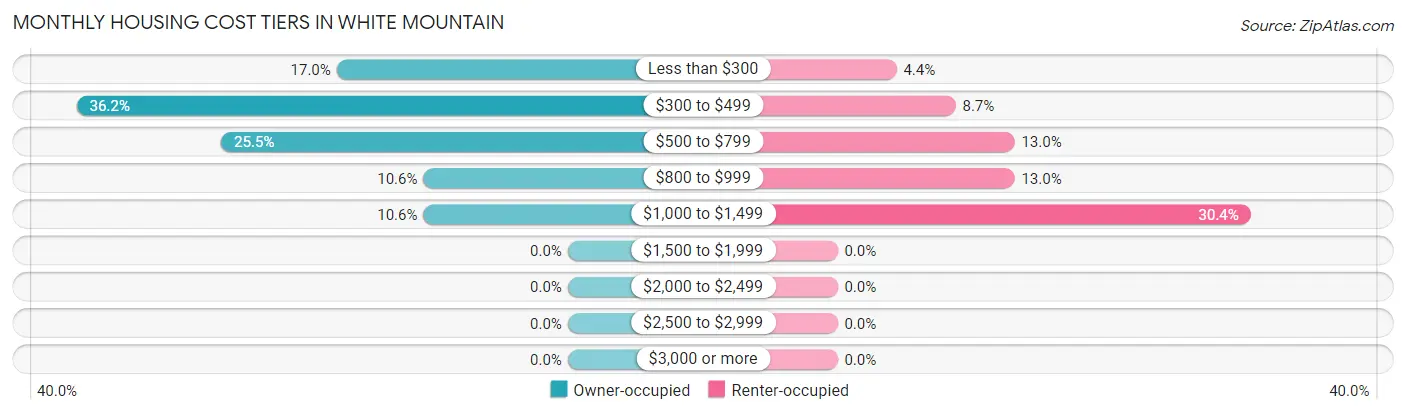
| Monthly Cost | Owner-occupied | Renter-occupied |
| Less than $300 | 8 (17.0%) | 1 (4.3%) |
| $300 to $499 | 17 (36.2%) | 2 (8.7%) |
| $500 to $799 | 12 (25.5%) | 3 (13.0%) |
| $800 to $999 | 5 (10.6%) | 3 (13.0%) |
| $1,000 to $1,499 | 5 (10.6%) | 7 (30.4%) |
| $1,500 to $1,999 | 0 (0.0%) | 0 (0.0%) |
| $2,000 to $2,499 | 0 (0.0%) | 0 (0.0%) |
| $2,500 to $2,999 | 0 (0.0%) | 0 (0.0%) |
| $3,000 or more | 0 (0.0%) | 0 (0.0%) |
| Total | 47 (100.0%) | 23 (100.0%) |
Physical Housing Characteristics in White Mountain
Housing Structures in White Mountain
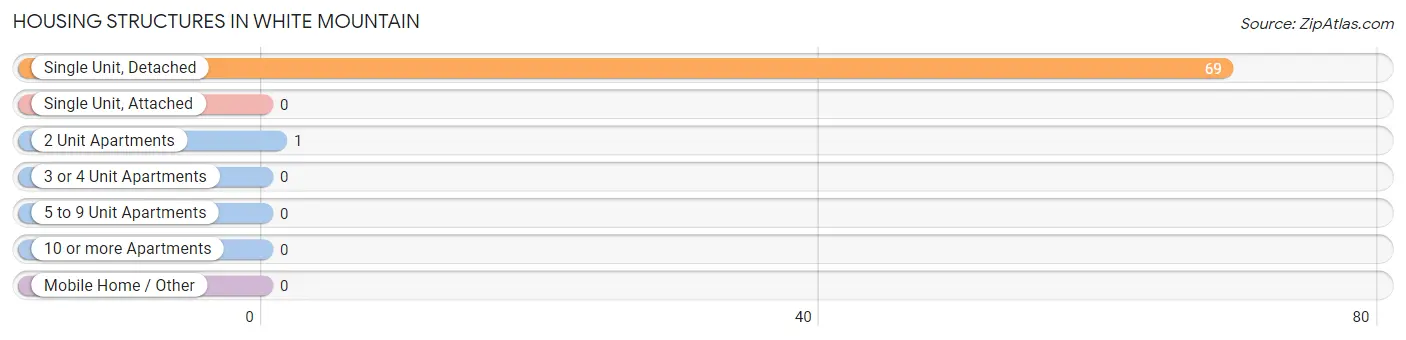
| Structure Type | # Housing Units | % Housing Units |
| Single Unit, Detached | 69 | 98.6% |
| Single Unit, Attached | 0 | 0.0% |
| 2 Unit Apartments | 1 | 1.4% |
| 3 or 4 Unit Apartments | 0 | 0.0% |
| 5 to 9 Unit Apartments | 0 | 0.0% |
| 10 or more Apartments | 0 | 0.0% |
| Mobile Home / Other | 0 | 0.0% |
| Total | 70 | 100.0% |
Housing Structures by Occupancy in White Mountain
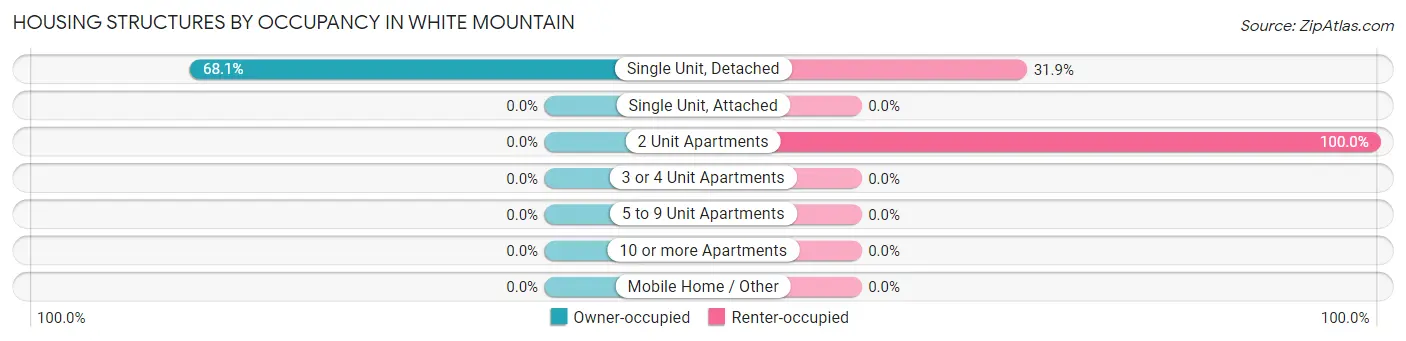
| Structure Type | Owner-occupied | Renter-occupied |
| Single Unit, Detached | 47 (68.1%) | 22 (31.9%) |
| Single Unit, Attached | 0 (0.0%) | 0 (0.0%) |
| 2 Unit Apartments | 0 (0.0%) | 1 (100.0%) |
| 3 or 4 Unit Apartments | 0 (0.0%) | 0 (0.0%) |
| 5 to 9 Unit Apartments | 0 (0.0%) | 0 (0.0%) |
| 10 or more Apartments | 0 (0.0%) | 0 (0.0%) |
| Mobile Home / Other | 0 (0.0%) | 0 (0.0%) |
| Total | 47 (67.1%) | 23 (32.9%) |
Housing Structures by Number of Rooms in White Mountain
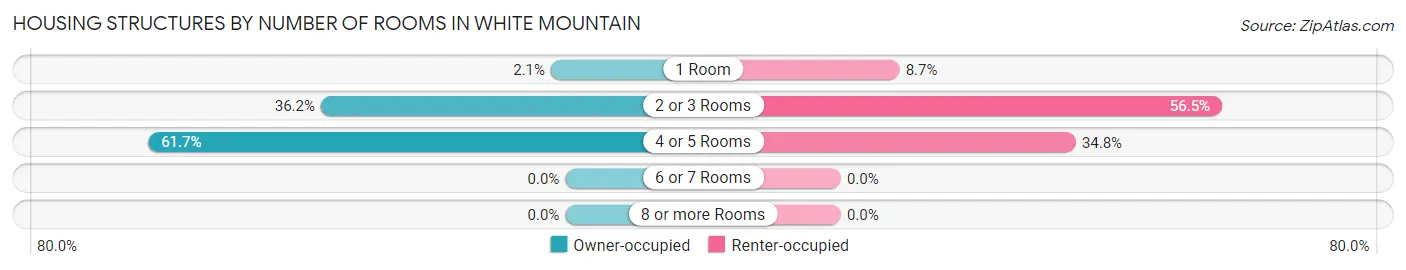
| Number of Rooms | Owner-occupied | Renter-occupied |
| 1 Room | 1 (2.1%) | 2 (8.7%) |
| 2 or 3 Rooms | 17 (36.2%) | 13 (56.5%) |
| 4 or 5 Rooms | 29 (61.7%) | 8 (34.8%) |
| 6 or 7 Rooms | 0 (0.0%) | 0 (0.0%) |
| 8 or more Rooms | 0 (0.0%) | 0 (0.0%) |
| Total | 47 (100.0%) | 23 (100.0%) |
Housing Structure by Heating Type in White Mountain
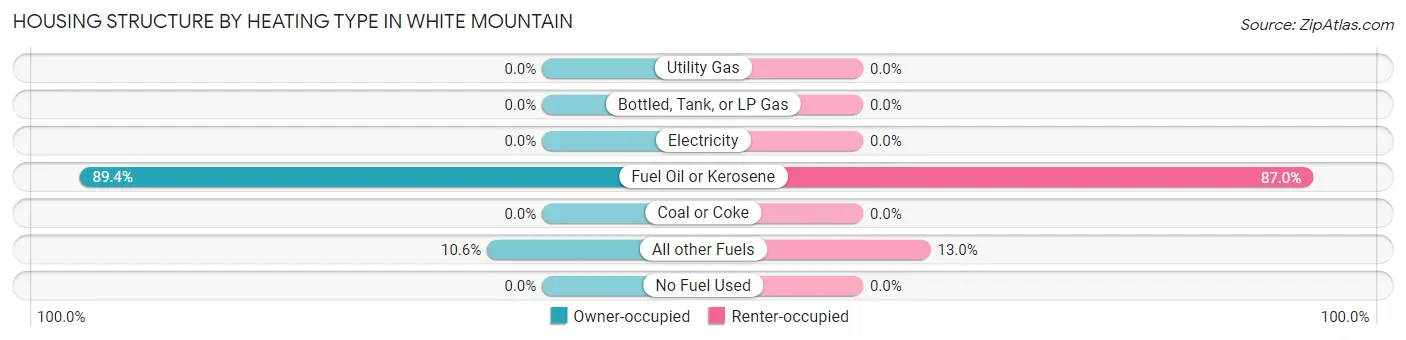
| Heating Type | Owner-occupied | Renter-occupied |
| Utility Gas | 0 (0.0%) | 0 (0.0%) |
| Bottled, Tank, or LP Gas | 0 (0.0%) | 0 (0.0%) |
| Electricity | 0 (0.0%) | 0 (0.0%) |
| Fuel Oil or Kerosene | 42 (89.4%) | 20 (87.0%) |
| Coal or Coke | 0 (0.0%) | 0 (0.0%) |
| All other Fuels | 5 (10.6%) | 3 (13.0%) |
| No Fuel Used | 0 (0.0%) | 0 (0.0%) |
| Total | 47 (100.0%) | 23 (100.0%) |
Household Vehicle Usage in White Mountain
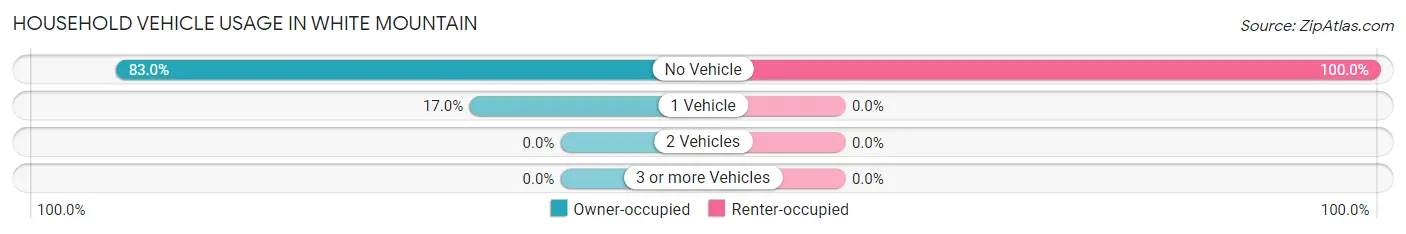
| Vehicles per Household | Owner-occupied | Renter-occupied |
| No Vehicle | 39 (83.0%) | 23 (100.0%) |
| 1 Vehicle | 8 (17.0%) | 0 (0.0%) |
| 2 Vehicles | 0 (0.0%) | 0 (0.0%) |
| 3 or more Vehicles | 0 (0.0%) | 0 (0.0%) |
| Total | 47 (100.0%) | 23 (100.0%) |
Real Estate & Mortgages in White Mountain
Real Estate and Mortgage Overview in White Mountain
| Characteristic | Without Mortgage | With Mortgage |
| Housing Units | 36 | 11 |
| Median Property Value | $100,000 | $0 |
| Median Household Income | $37,500 | $0 |
| Monthly Housing Costs | $458 | $0 |
| Real Estate Taxes | - | - |
Property Value by Mortgage Status in White Mountain
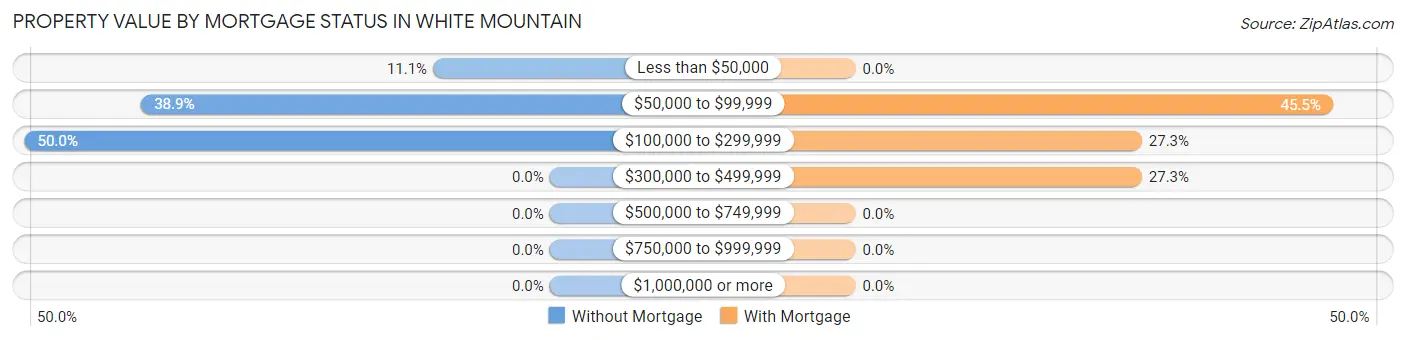
| Property Value | Without Mortgage | With Mortgage |
| Less than $50,000 | 4 (11.1%) | 0 (0.0%) |
| $50,000 to $99,999 | 14 (38.9%) | 5 (45.5%) |
| $100,000 to $299,999 | 18 (50.0%) | 3 (27.3%) |
| $300,000 to $499,999 | 0 (0.0%) | 3 (27.3%) |
| $500,000 to $749,999 | 0 (0.0%) | 0 (0.0%) |
| $750,000 to $999,999 | 0 (0.0%) | 0 (0.0%) |
| $1,000,000 or more | 0 (0.0%) | 0 (0.0%) |
| Total | 36 (100.0%) | 11 (100.0%) |
Household Income by Mortgage Status in White Mountain
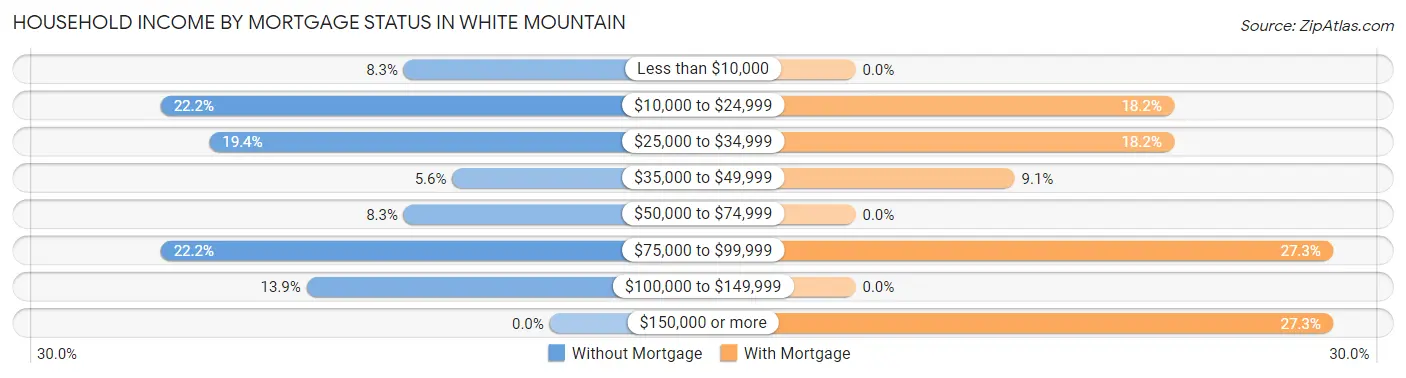
| Household Income | Without Mortgage | With Mortgage |
| Less than $10,000 | 3 (8.3%) | 0 (0.0%) |
| $10,000 to $24,999 | 8 (22.2%) | 2 (18.2%) |
| $25,000 to $34,999 | 7 (19.4%) | 2 (18.2%) |
| $35,000 to $49,999 | 2 (5.6%) | 1 (9.1%) |
| $50,000 to $74,999 | 3 (8.3%) | 0 (0.0%) |
| $75,000 to $99,999 | 8 (22.2%) | 3 (27.3%) |
| $100,000 to $149,999 | 5 (13.9%) | 0 (0.0%) |
| $150,000 or more | 0 (0.0%) | 3 (27.3%) |
| Total | 36 (100.0%) | 11 (100.0%) |
Property Value to Household Income Ratio in White Mountain
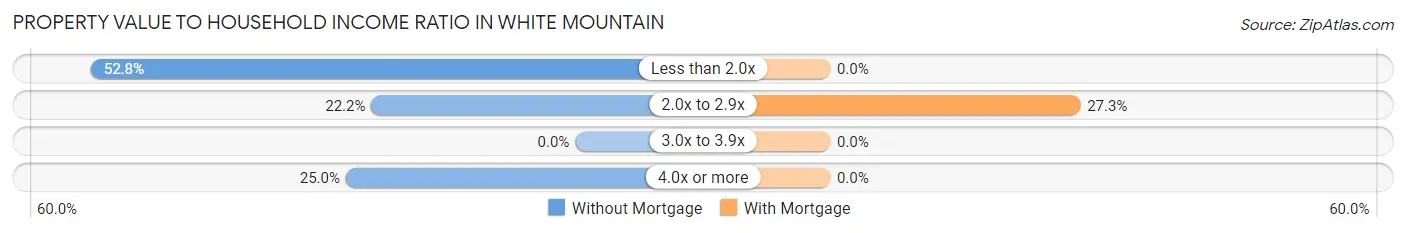
| Value-to-Income Ratio | Without Mortgage | With Mortgage |
| Less than 2.0x | 19 (52.8%) | 0 (0.0%) |
| 2.0x to 2.9x | 8 (22.2%) | 3 (27.3%) |
| 3.0x to 3.9x | 0 (0.0%) | 0 (0.0%) |
| 4.0x or more | 9 (25.0%) | 0 (0.0%) |
| Total | 36 (100.0%) | 11 (100.0%) |
Real Estate Taxes by Mortgage Status in White Mountain
| Property Taxes | Without Mortgage | With Mortgage |
| Less than $800 | 0 (0.0%) | 0 (0.0%) |
| $800 to $1,499 | 0 (0.0%) | 0 (0.0%) |
| $800 to $1,499 | 0 (0.0%) | 0 (0.0%) |
| Total | 36 (100.0%) | 11 (100.0%) |
Health & Disability in White Mountain
Health Insurance Coverage by Age in White Mountain
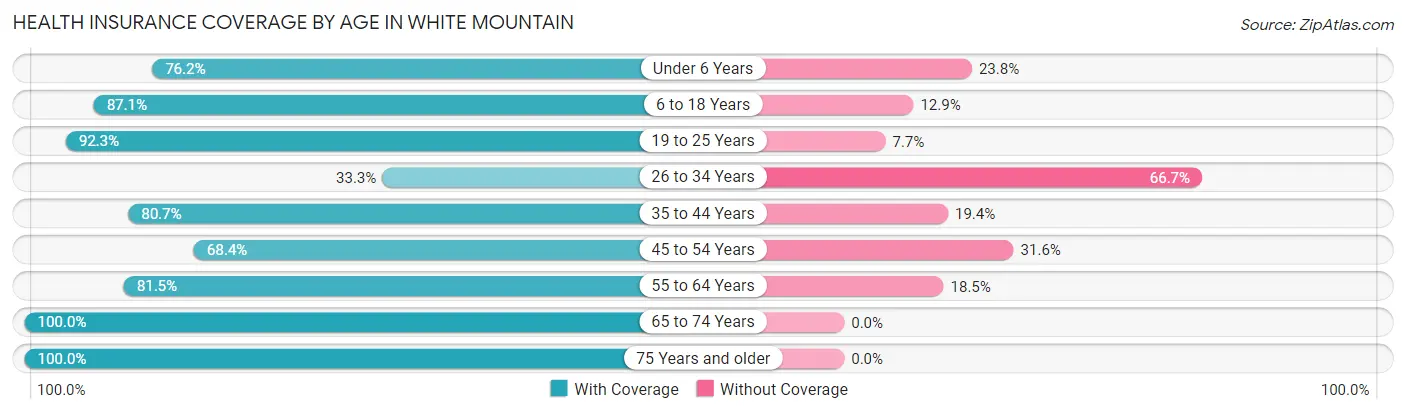
| Age Bracket | With Coverage | Without Coverage |
| Under 6 Years | 16 (76.2%) | 5 (23.8%) |
| 6 to 18 Years | 27 (87.1%) | 4 (12.9%) |
| 19 to 25 Years | 24 (92.3%) | 2 (7.7%) |
| 26 to 34 Years | 10 (33.3%) | 20 (66.7%) |
| 35 to 44 Years | 25 (80.6%) | 6 (19.4%) |
| 45 to 54 Years | 13 (68.4%) | 6 (31.6%) |
| 55 to 64 Years | 22 (81.5%) | 5 (18.5%) |
| 65 to 74 Years | 6 (100.0%) | 0 (0.0%) |
| 75 Years and older | 3 (100.0%) | 0 (0.0%) |
| Total | 146 (75.3%) | 48 (24.7%) |
Health Insurance Coverage by Citizenship Status in White Mountain
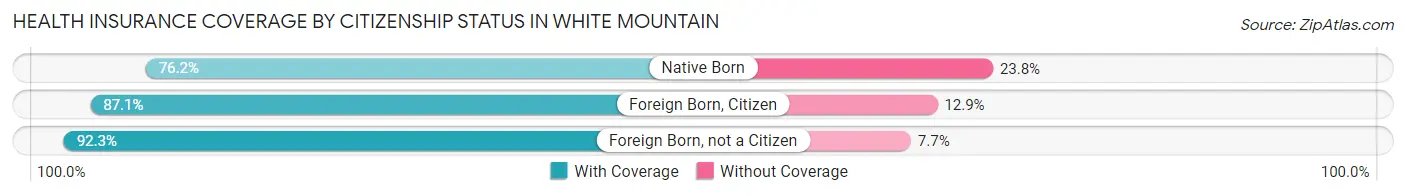
| Citizenship Status | With Coverage | Without Coverage |
| Native Born | 16 (76.2%) | 5 (23.8%) |
| Foreign Born, Citizen | 27 (87.1%) | 4 (12.9%) |
| Foreign Born, not a Citizen | 24 (92.3%) | 2 (7.7%) |
Health Insurance Coverage by Household Income in White Mountain
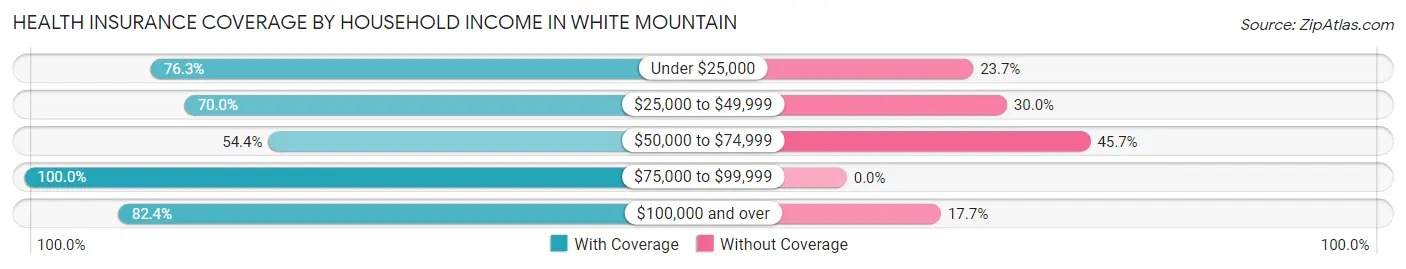
| Household Income | With Coverage | Without Coverage |
| Under $25,000 | 29 (76.3%) | 9 (23.7%) |
| $25,000 to $49,999 | 28 (70.0%) | 12 (30.0%) |
| $50,000 to $74,999 | 25 (54.3%) | 21 (45.7%) |
| $75,000 to $99,999 | 36 (100.0%) | 0 (0.0%) |
| $100,000 and over | 28 (82.4%) | 6 (17.6%) |
Public vs Private Health Insurance Coverage by Age in White Mountain
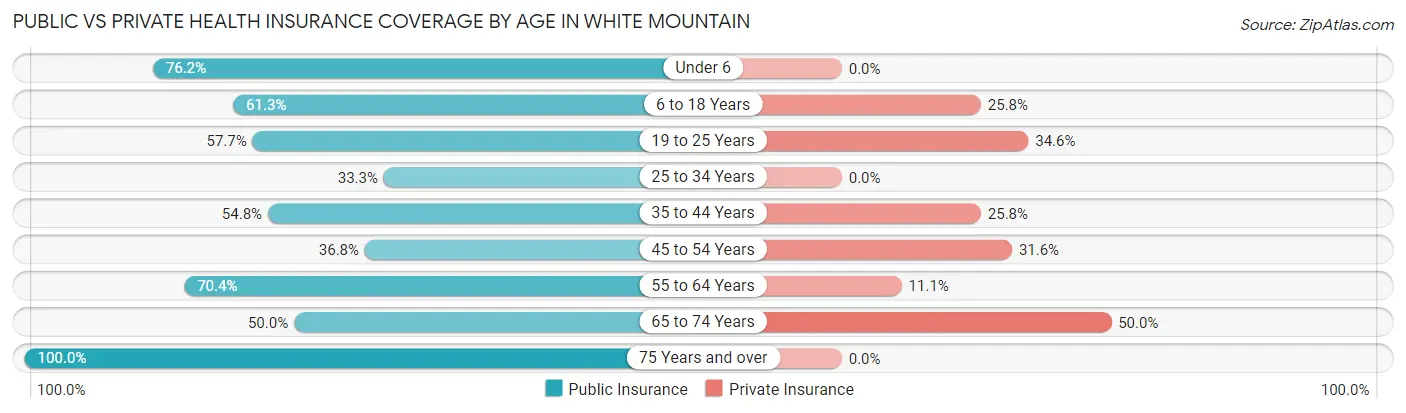
| Age Bracket | Public Insurance | Private Insurance |
| Under 6 | 16 (76.2%) | 0 (0.0%) |
| 6 to 18 Years | 19 (61.3%) | 8 (25.8%) |
| 19 to 25 Years | 15 (57.7%) | 9 (34.6%) |
| 25 to 34 Years | 10 (33.3%) | 0 (0.0%) |
| 35 to 44 Years | 17 (54.8%) | 8 (25.8%) |
| 45 to 54 Years | 7 (36.8%) | 6 (31.6%) |
| 55 to 64 Years | 19 (70.4%) | 3 (11.1%) |
| 65 to 74 Years | 3 (50.0%) | 3 (50.0%) |
| 75 Years and over | 3 (100.0%) | 0 (0.0%) |
| Total | 109 (56.2%) | 37 (19.1%) |
Disability Status by Sex by Age in White Mountain
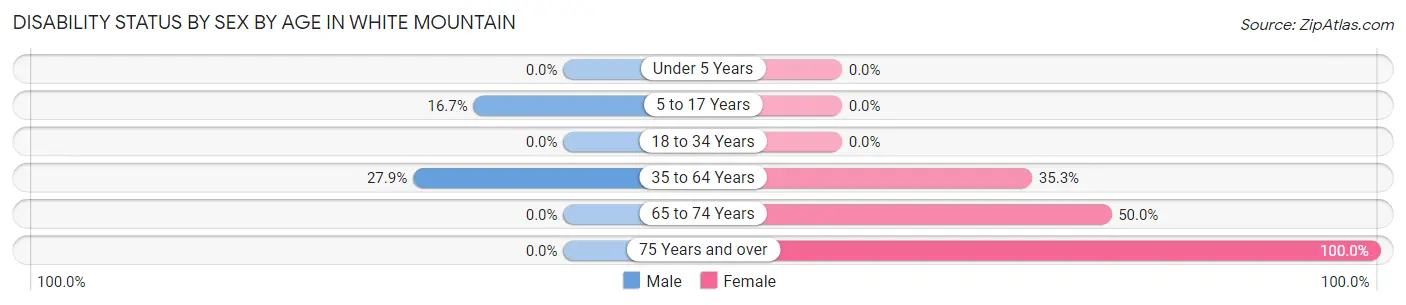
| Age Bracket | Male | Female |
| Under 5 Years | 0 (0.0%) | 0 (0.0%) |
| 5 to 17 Years | 2 (16.7%) | 0 (0.0%) |
| 18 to 34 Years | 0 (0.0%) | 0 (0.0%) |
| 35 to 64 Years | 12 (27.9%) | 12 (35.3%) |
| 65 to 74 Years | 0 (0.0%) | 3 (50.0%) |
| 75 Years and over | 0 (0.0%) | 2 (100.0%) |
Disability Class by Sex by Age in White Mountain
Disability Class: Hearing Difficulty
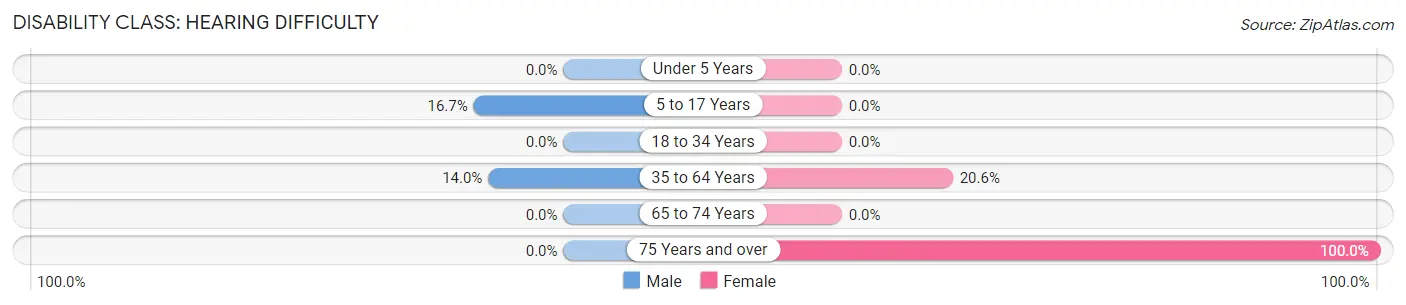
| Age Bracket | Male | Female |
| Under 5 Years | 0 (0.0%) | 0 (0.0%) |
| 5 to 17 Years | 2 (16.7%) | 0 (0.0%) |
| 18 to 34 Years | 0 (0.0%) | 0 (0.0%) |
| 35 to 64 Years | 6 (14.0%) | 7 (20.6%) |
| 65 to 74 Years | 0 (0.0%) | 0 (0.0%) |
| 75 Years and over | 0 (0.0%) | 2 (100.0%) |
Disability Class: Vision Difficulty
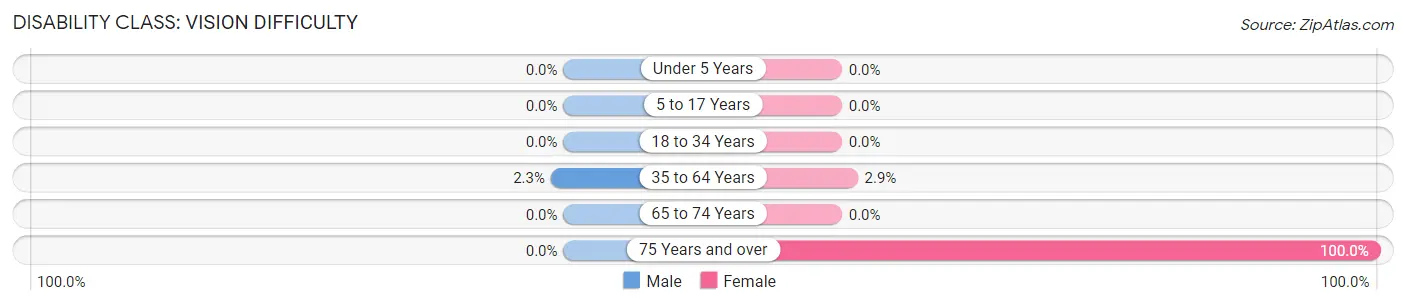
| Age Bracket | Male | Female |
| Under 5 Years | 0 (0.0%) | 0 (0.0%) |
| 5 to 17 Years | 0 (0.0%) | 0 (0.0%) |
| 18 to 34 Years | 0 (0.0%) | 0 (0.0%) |
| 35 to 64 Years | 1 (2.3%) | 1 (2.9%) |
| 65 to 74 Years | 0 (0.0%) | 0 (0.0%) |
| 75 Years and over | 0 (0.0%) | 2 (100.0%) |
Disability Class: Cognitive Difficulty
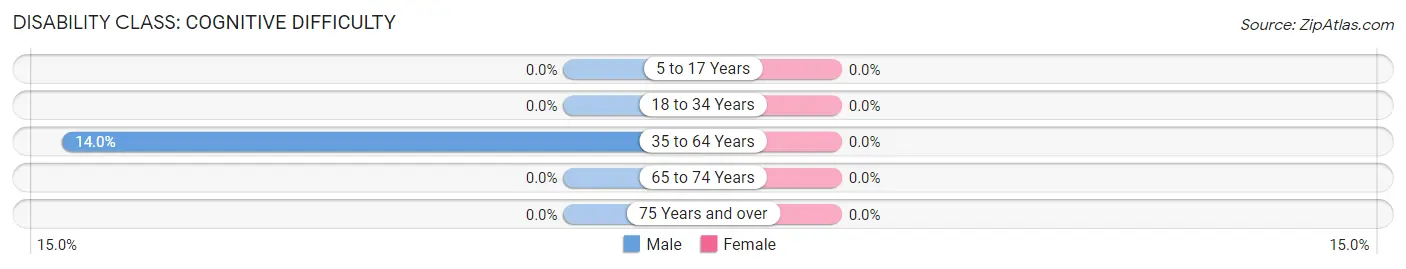
| Age Bracket | Male | Female |
| 5 to 17 Years | 0 (0.0%) | 0 (0.0%) |
| 18 to 34 Years | 0 (0.0%) | 0 (0.0%) |
| 35 to 64 Years | 6 (14.0%) | 0 (0.0%) |
| 65 to 74 Years | 0 (0.0%) | 0 (0.0%) |
| 75 Years and over | 0 (0.0%) | 0 (0.0%) |
Disability Class: Ambulatory Difficulty
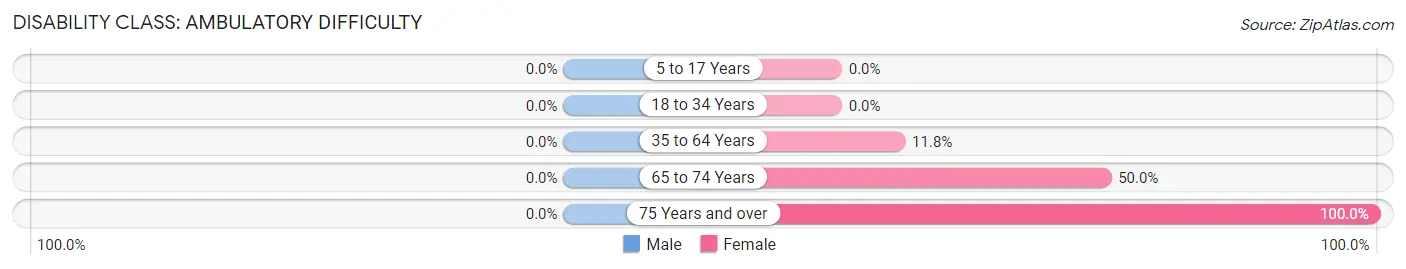
| Age Bracket | Male | Female |
| 5 to 17 Years | 0 (0.0%) | 0 (0.0%) |
| 18 to 34 Years | 0 (0.0%) | 0 (0.0%) |
| 35 to 64 Years | 0 (0.0%) | 4 (11.8%) |
| 65 to 74 Years | 0 (0.0%) | 3 (50.0%) |
| 75 Years and over | 0 (0.0%) | 2 (100.0%) |
Disability Class: Self-Care Difficulty
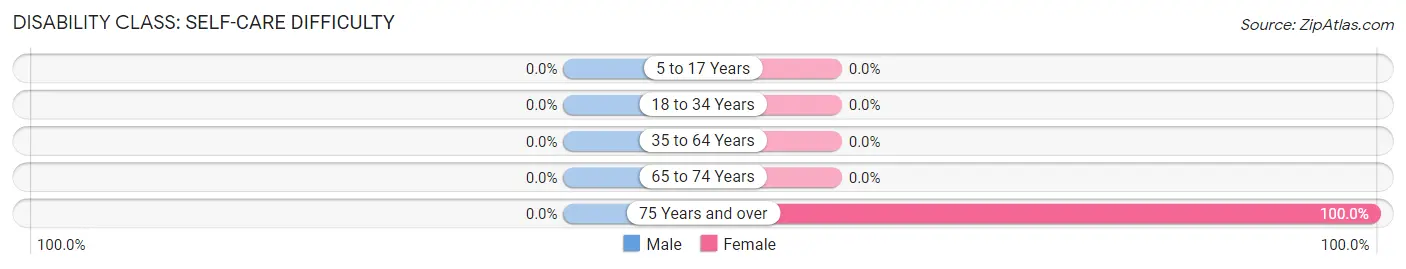
| Age Bracket | Male | Female |
| 5 to 17 Years | 0 (0.0%) | 0 (0.0%) |
| 18 to 34 Years | 0 (0.0%) | 0 (0.0%) |
| 35 to 64 Years | 0 (0.0%) | 0 (0.0%) |
| 65 to 74 Years | 0 (0.0%) | 0 (0.0%) |
| 75 Years and over | 0 (0.0%) | 2 (100.0%) |
Technology Access in White Mountain
Computing Device Access in White Mountain
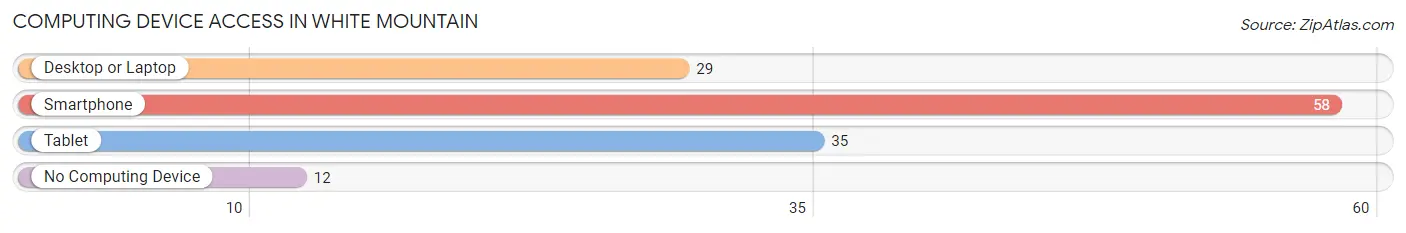
| Device Type | # Households | % Households |
| Desktop or Laptop | 29 | 41.4% |
| Smartphone | 58 | 82.9% |
| Tablet | 35 | 50.0% |
| No Computing Device | 12 | 17.1% |
| Total | 70 | 100.0% |
Internet Access in White Mountain
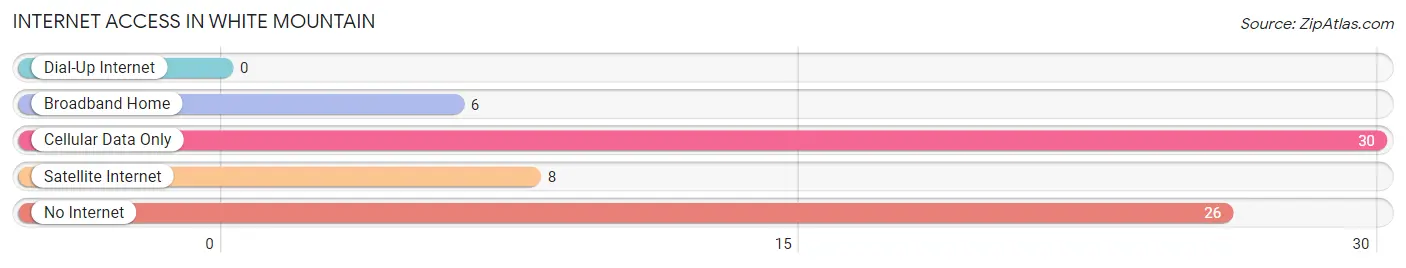
| Internet Type | # Households | % Households |
| Dial-Up Internet | 0 | 0.0% |
| Broadband Home | 6 | 8.6% |
| Cellular Data Only | 30 | 42.9% |
| Satellite Internet | 8 | 11.4% |
| No Internet | 26 | 37.1% |
| Total | 70 | 100.0% |
White Mountain Summary
White Mountain is a small city located in the Northwest Arctic Borough of Alaska. It is situated on the south bank of the Kobuk River, approximately 25 miles east of Kotzebue. The city is home to a population of approximately 500 people, most of whom are of Inupiaq descent.
History
White Mountain has a long and rich history. The area has been inhabited by the Inupiaq people for thousands of years. The Inupiaq people have a deep connection to the land and the sea, and have long relied on the resources of the area for their subsistence lifestyle.
The first recorded contact with Europeans in the area was in 1826, when the Russian explorer Fyodor Litke visited the area. In 1867, the United States purchased Alaska from Russia, and the area became part of the United States.
In the late 1800s, the area was home to a whaling station, and in the early 1900s, a trading post was established. In the 1920s, the area was surveyed for a possible airfield, and in the 1930s, the White Mountain Airport was built.
In the 1950s, the White Mountain School was built, and in the 1960s, the White Mountain Clinic was established. In the 1970s, the White Mountain Native Corporation was formed, and in the 1980s, the White Mountain Tribal Council was established.
Geography
White Mountain is located in the Northwest Arctic Borough of Alaska. It is situated on the south bank of the Kobuk River, approximately 25 miles east of Kotzebue. The city is surrounded by the Kobuk Valley National Park, which is home to a variety of wildlife, including caribou, moose, and bears.
The climate in White Mountain is subarctic, with cold winters and mild summers. The average temperature in January is -14°F, and the average temperature in July is 57°F. The average annual precipitation is 11.5 inches.
Economy
The economy of White Mountain is largely based on subsistence activities, such as hunting, fishing, and gathering. The city is also home to a number of small businesses, including a grocery store, a hardware store, and a restaurant.
The White Mountain Native Corporation is the largest employer in the city, and provides jobs in construction, transportation, and other industries. The White Mountain Tribal Council also provides employment opportunities in the form of government jobs.
Demographics
As of the 2010 census, the population of White Mountain was 498. The racial makeup of the city was 95.2% Native American, 2.2% White, 0.2% Asian, 0.2% Black or African American, and 2.2% from two or more races.
The median household income in White Mountain was $30,000, and the median family income was $31,000. The per capita income was $14,000. Approximately 25.2% of the population was below the poverty line.
Conclusion
White Mountain is a small city located in the Northwest Arctic Borough of Alaska. It is home to a population of approximately 500 people, most of whom are of Inupiaq descent. The city has a long and rich history, and the economy is largely based on subsistence activities. The White Mountain Native Corporation and the White Mountain Tribal Council are the largest employers in the city. The population of White Mountain is 95.2% Native American, 2.2% White, 0.2% Asian, 0.2% Black or African American, and 2.2% from two or more races. The median household income in White Mountain was $30,000, and the median family income was $31,000. Approximately 25.2% of the population was below the poverty line.
Common Questions
What is Per Capita Income in White Mountain?
Per Capita income in White Mountain is $20,961.
What is the Median Family Income in White Mountain?
Median Family Income in White Mountain is $58,750.
What is the Median Household income in White Mountain?
Median Household Income in White Mountain is $53,125.
What is Income or Wage Gap in White Mountain?
Income or Wage Gap in White Mountain is 65.3%.
Women in White Mountain earn 34.7 cents for every dollar earned by a man.
What is Inequality or Gini Index in White Mountain?
Inequality or Gini Index in White Mountain is 0.41.
What is the Total Population of White Mountain?
Total Population of White Mountain is 194.
What is the Total Male Population of White Mountain?
Total Male Population of White Mountain is 97.
What is the Total Female Population of White Mountain?
Total Female Population of White Mountain is 97.
What is the Ratio of Males per 100 Females in White Mountain?
There are 100.00 Males per 100 Females in White Mountain.
What is the Ratio of Females per 100 Males in White Mountain?
There are 100.00 Females per 100 Males in White Mountain.
What is the Median Population Age in White Mountain?
Median Population Age in White Mountain is 31.7 Years.
What is the Average Family Size in White Mountain
Average Family Size in White Mountain is 3.2 People.
What is the Average Household Size in White Mountain
Average Household Size in White Mountain is 2.8 People.
How Large is the Labor Force in White Mountain?
There are 95 People in the Labor Forcein in White Mountain.
What is the Percentage of People in the Labor Force in White Mountain?
64.2% of People are in the Labor Force in White Mountain.
What is the Unemployment Rate in White Mountain?
Unemployment Rate in White Mountain is 26.3%.