Wales, AK Map & Demographics
Wales Map
Wales Overview
$12,759
PER CAPITA INCOME
$34,432
AVG FAMILY INCOME
$34,167
AVG HOUSEHOLD INCOME
2.5%
WAGE / INCOME GAP [ % ]
97.5¢/ $1
WAGE / INCOME GAP [ $ ]
$14,989
FAMILY INCOME DEFICIT
0.42
INEQUALITY / GINI INDEX
294
TOTAL POPULATION
176
MALE POPULATION
118
FEMALE POPULATION
149.15
MALES / 100 FEMALES
67.05
FEMALES / 100 MALES
24.0
MEDIAN AGE
3.6
AVG FAMILY SIZE
3.4
AVG HOUSEHOLD SIZE
116
LABOR FORCE [ PEOPLE ]
64.4%
PERCENT IN LABOR FORCE
14.7%
UNEMPLOYMENT RATE
Wales Zip Codes
Wales Area Codes
Income in Wales
Income Overview in Wales
Per Capita Income in Wales is $12,759, while median incomes of families and households are $34,432 and $34,167 respectively.
| Characteristic | Number | Measure |
| Per Capita Income | 294 | $12,759 |
| Median Family Income | 67 | $34,432 |
| Mean Family Income | 67 | $48,430 |
| Median Household Income | 86 | $34,167 |
| Mean Household Income | 86 | $48,149 |
| Income Deficit | 67 | $14,989 |
| Wage / Income Gap (%) | 294 | 2.50% |
| Wage / Income Gap ($) | 294 | 97.50¢ per $1 |
| Gini / Inequality Index | 294 | 0.42 |
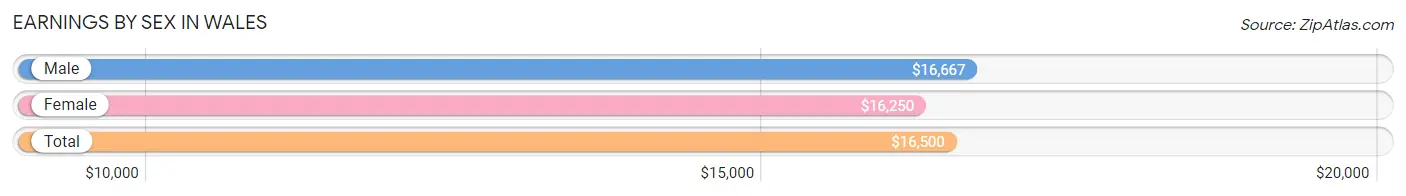
Earnings by Sex in Wales
Average Earnings in Wales are $16,500, $16,667 for men and $16,250 for women, a difference of 2.5%.
| Sex | Number | Average Earnings |
| Male | 80 (59.7%) | $16,667 |
| Female | 54 (40.3%) | $16,250 |
| Total | 134 (100.0%) | $16,500 |
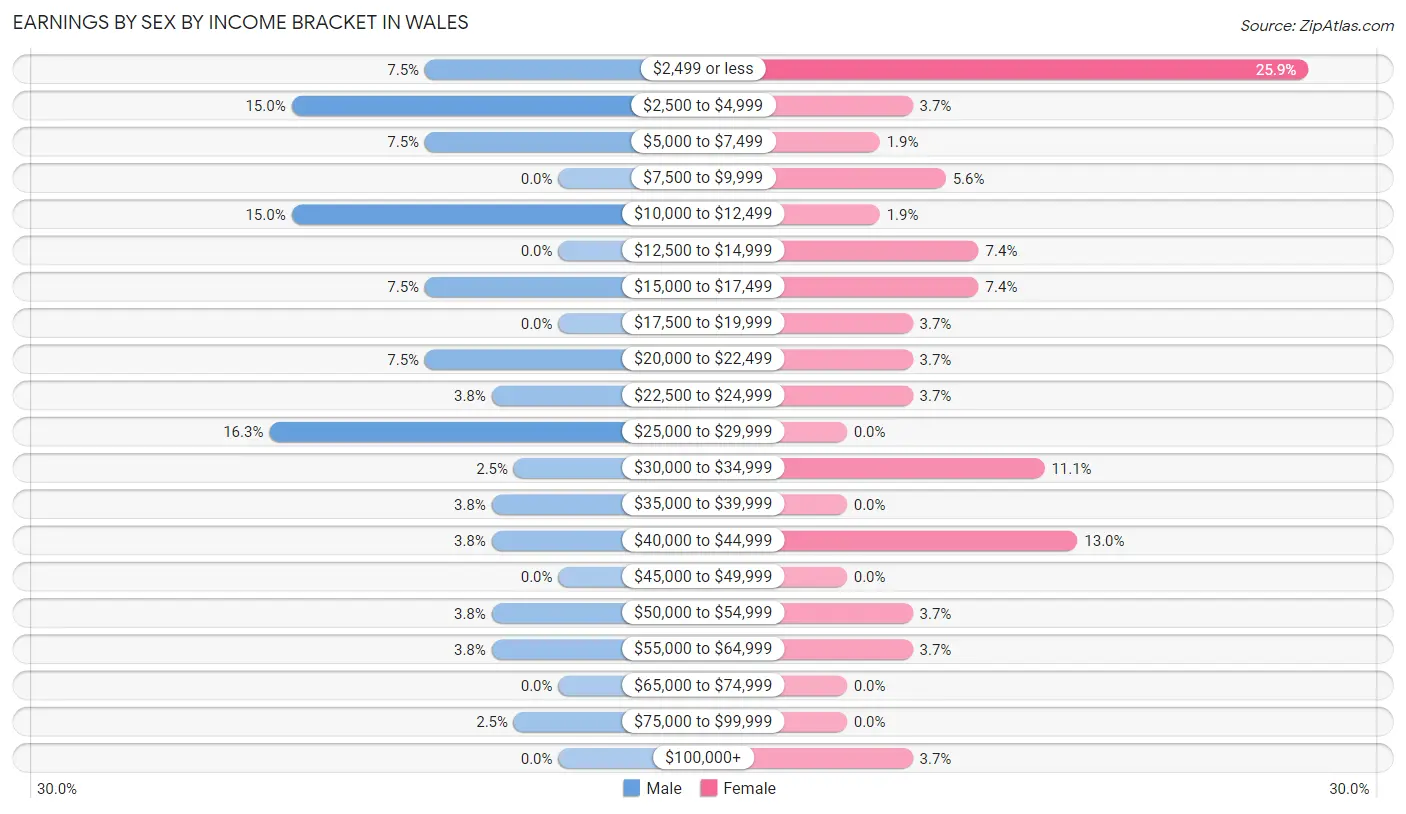
Earnings by Sex by Income Bracket in Wales
The most common earnings brackets in Wales are $25,000 to $29,999 for men (13 | 16.3%) and $2,499 or less for women (14 | 25.9%).
| Income | Male | Female |
| $2,499 or less | 6 (7.5%) | 14 (25.9%) |
| $2,500 to $4,999 | 12 (15.0%) | 2 (3.7%) |
| $5,000 to $7,499 | 6 (7.5%) | 1 (1.8%) |
| $7,500 to $9,999 | 0 (0.0%) | 3 (5.6%) |
| $10,000 to $12,499 | 12 (15.0%) | 1 (1.8%) |
| $12,500 to $14,999 | 0 (0.0%) | 4 (7.4%) |
| $15,000 to $17,499 | 6 (7.5%) | 4 (7.4%) |
| $17,500 to $19,999 | 0 (0.0%) | 2 (3.7%) |
| $20,000 to $22,499 | 6 (7.5%) | 2 (3.7%) |
| $22,500 to $24,999 | 3 (3.7%) | 2 (3.7%) |
| $25,000 to $29,999 | 13 (16.3%) | 0 (0.0%) |
| $30,000 to $34,999 | 2 (2.5%) | 6 (11.1%) |
| $35,000 to $39,999 | 3 (3.7%) | 0 (0.0%) |
| $40,000 to $44,999 | 3 (3.7%) | 7 (13.0%) |
| $45,000 to $49,999 | 0 (0.0%) | 0 (0.0%) |
| $50,000 to $54,999 | 3 (3.7%) | 2 (3.7%) |
| $55,000 to $64,999 | 3 (3.7%) | 2 (3.7%) |
| $65,000 to $74,999 | 0 (0.0%) | 0 (0.0%) |
| $75,000 to $99,999 | 2 (2.5%) | 0 (0.0%) |
| $100,000+ | 0 (0.0%) | 2 (3.7%) |
| Total | 80 (100.0%) | 54 (100.0%) |
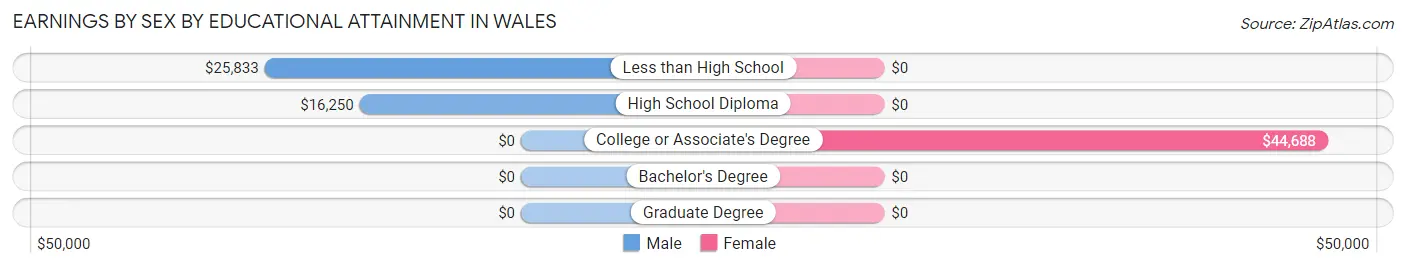
Earnings by Sex by Educational Attainment in Wales
Average earnings in Wales are $20,208 for men and $24,375 for women, a difference of 17.1%. Men with an educational attainment of less than high school enjoy the highest average annual earnings of $25,833, while those with high school diploma education earn the least with $16,250. Women with an educational attainment of college or associate's degree earn the most with the average annual earnings of $44,688, while those with college or associate's degree education have the smallest earnings of $44,688.
| Educational Attainment | Male Income | Female Income |
| Less than High School | $25,833 | $0 |
| High School Diploma | $16,250 | $0 |
| College or Associate's Degree | - | - |
| Bachelor's Degree | - | - |
| Graduate Degree | - | - |
| Total | $20,208 | $24,375 |
Family Income in Wales
Family Income Brackets in Wales
According to the Wales family income data, there are 16 families falling into the $50,000 to $74,999 income range, which is the most common income bracket and makes up 23.9% of all families.
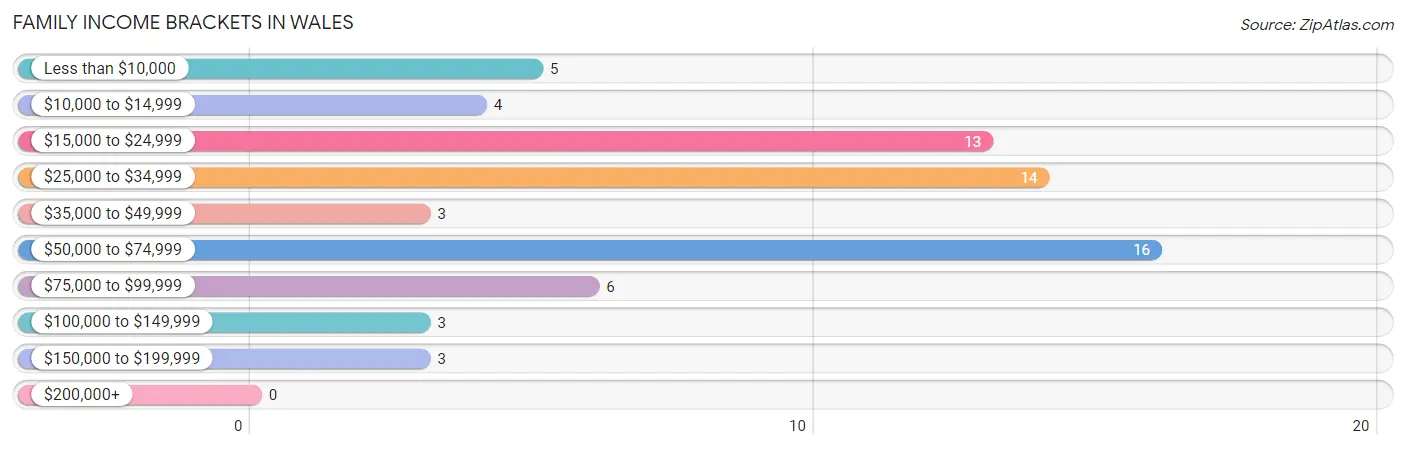
| Income Bracket | # Families | % Families |
| Less than $10,000 | 5 | 7.5% |
| $10,000 to $14,999 | 4 | 6.0% |
| $15,000 to $24,999 | 13 | 19.4% |
| $25,000 to $34,999 | 14 | 20.9% |
| $35,000 to $49,999 | 3 | 4.5% |
| $50,000 to $74,999 | 16 | 23.9% |
| $75,000 to $99,999 | 6 | 9.0% |
| $100,000 to $149,999 | 3 | 4.5% |
| $150,000 to $199,999 | 3 | 4.5% |
| $200,000+ | 0 | 0.0% |
Family Income by Famaliy Size in Wales
7+ person families (16 | 23.9%) account for the highest median family income in Wales with $62,500 per family, while 2-person families (16 | 23.9%) have the highest median income of $16,666 per family member.
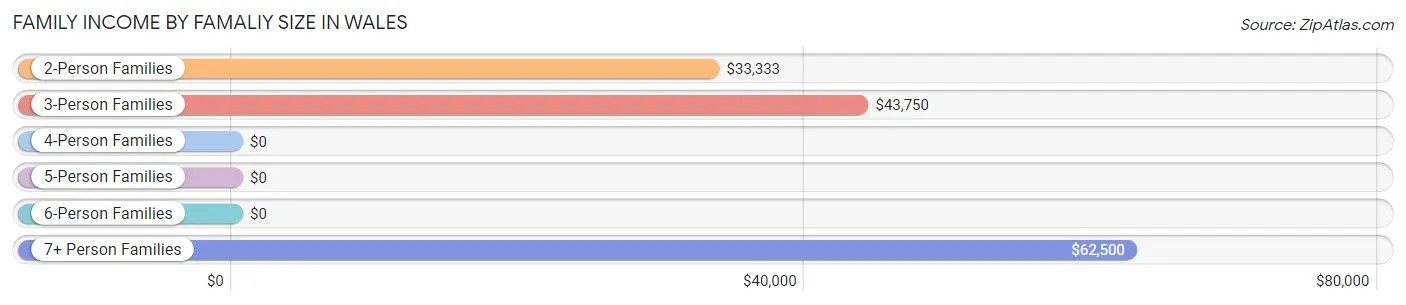
| Income Bracket | # Families | Median Income |
| 2-Person Families | 16 (23.9%) | $33,333 |
| 3-Person Families | 14 (20.9%) | $43,750 |
| 4-Person Families | 10 (14.9%) | $0 |
| 5-Person Families | 9 (13.4%) | $0 |
| 6-Person Families | 2 (3.0%) | $0 |
| 7+ Person Families | 16 (23.9%) | $62,500 |
| Total | 67 (100.0%) | $34,432 |
Family Income by Number of Earners in Wales
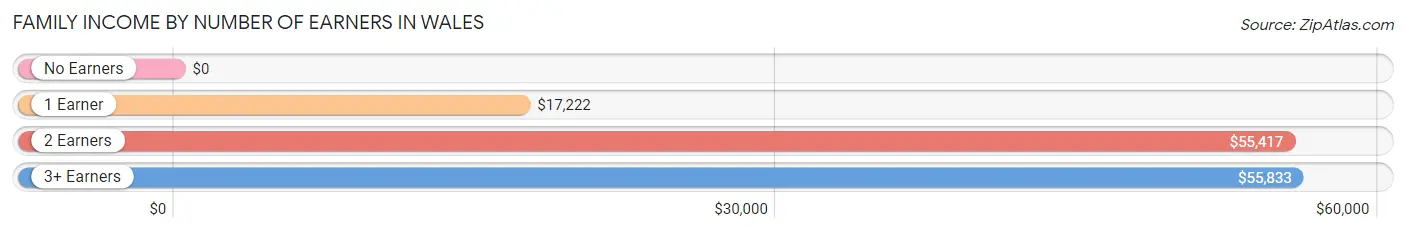
| Number of Earners | # Families | Median Income |
| No Earners | 0 (0.0%) | $0 |
| 1 Earner | 34 (50.7%) | $17,222 |
| 2 Earners | 25 (37.3%) | $55,417 |
| 3+ Earners | 8 (11.9%) | $55,833 |
| Total | 67 (100.0%) | $34,432 |
Household Income in Wales
Household Income Brackets in Wales
With 22 households falling in the category, the $15,000 to $24,999 income range is the most frequent in Wales, accounting for 25.6% of all households.
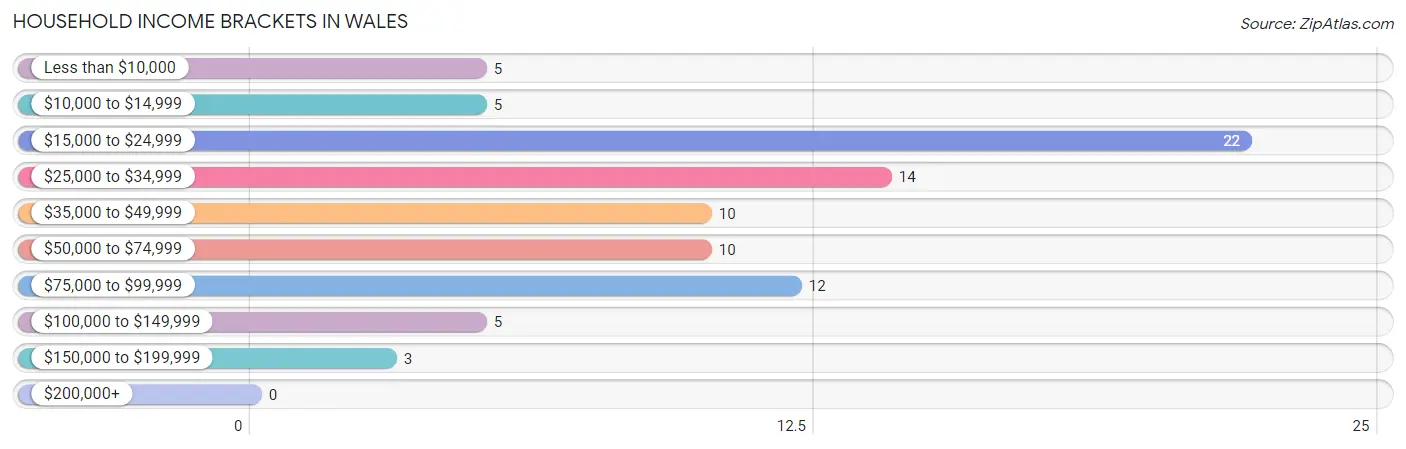
| Income Bracket | # Households | % Households |
| Less than $10,000 | 5 | 5.8% |
| $10,000 to $14,999 | 5 | 5.8% |
| $15,000 to $24,999 | 22 | 25.6% |
| $25,000 to $34,999 | 14 | 16.3% |
| $35,000 to $49,999 | 10 | 11.6% |
| $50,000 to $74,999 | 10 | 11.6% |
| $75,000 to $99,999 | 12 | 14.0% |
| $100,000 to $149,999 | 5 | 5.8% |
| $150,000 to $199,999 | 3 | 3.5% |
| $200,000+ | 0 | 0.0% |
Household Income by Householder Age in Wales
The median household income in Wales is $34,167, with the highest median household income of $45,417 found in the 25 to 44 years age bracket for the primary householder. A total of 31 households (36.0%) fall into this category. Meanwhile, the 15 to 24 years age bracket for the primary householder has the lowest median household income of $0, with 6 households (7.0%) in this group.
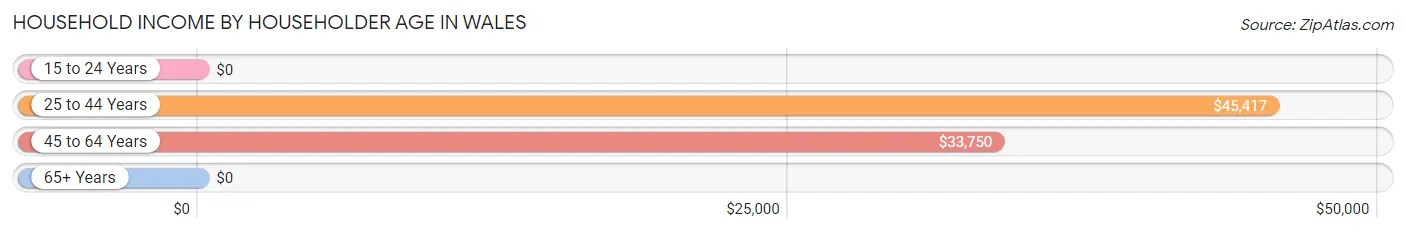
| Income Bracket | # Households | Median Income |
| 15 to 24 Years | 6 (7.0%) | $0 |
| 25 to 44 Years | 31 (36.0%) | $45,417 |
| 45 to 64 Years | 43 (50.0%) | $33,750 |
| 65+ Years | 6 (7.0%) | $0 |
| Total | 86 (100.0%) | $34,167 |
Poverty in Wales
Income Below Poverty by Sex and Age in Wales
With 25.6% poverty level for males and 35.3% for females among the residents of Wales, 15 year old males and under 5 year old females are the most vulnerable to poverty, with 1 males (100.0%) and 10 females (76.9%) in their respective age groups living below the poverty level.
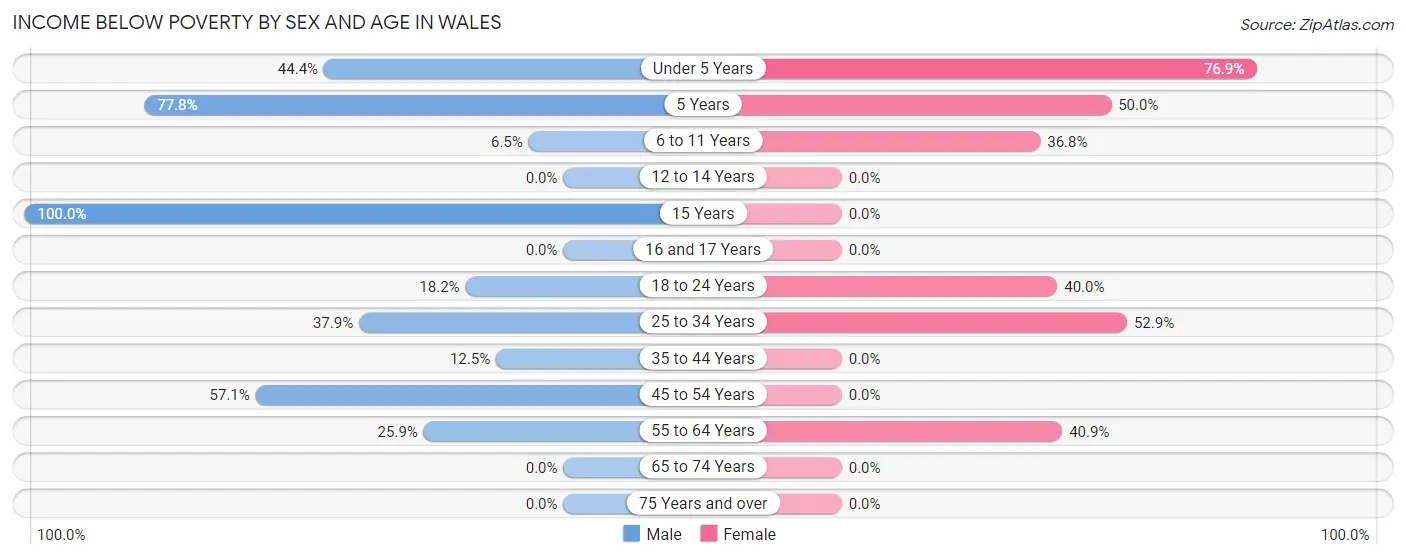
| Age Bracket | Male | Female |
| Under 5 Years | 8 (44.4%) | 10 (76.9%) |
| 5 Years | 7 (77.8%) | 2 (50.0%) |
| 6 to 11 Years | 2 (6.5%) | 7 (36.8%) |
| 12 to 14 Years | 0 (0.0%) | 0 (0.0%) |
| 15 Years | 1 (100.0%) | 0 (0.0%) |
| 16 and 17 Years | 0 (0.0%) | 0 (0.0%) |
| 18 to 24 Years | 2 (18.2%) | 4 (40.0%) |
| 25 to 34 Years | 11 (37.9%) | 9 (52.9%) |
| 35 to 44 Years | 3 (12.5%) | 0 (0.0%) |
| 45 to 54 Years | 4 (57.1%) | 0 (0.0%) |
| 55 to 64 Years | 7 (25.9%) | 9 (40.9%) |
| 65 to 74 Years | 0 (0.0%) | 0 (0.0%) |
| 75 Years and over | 0 (0.0%) | 0 (0.0%) |
| Total | 45 (25.6%) | 41 (35.3%) |
Income Above Poverty by Sex and Age in Wales
According to the poverty statistics in Wales, males aged 12 to 14 years and females aged 12 to 14 years are the age groups that are most secure financially, with 100.0% of males and 100.0% of females in these age groups living above the poverty line.
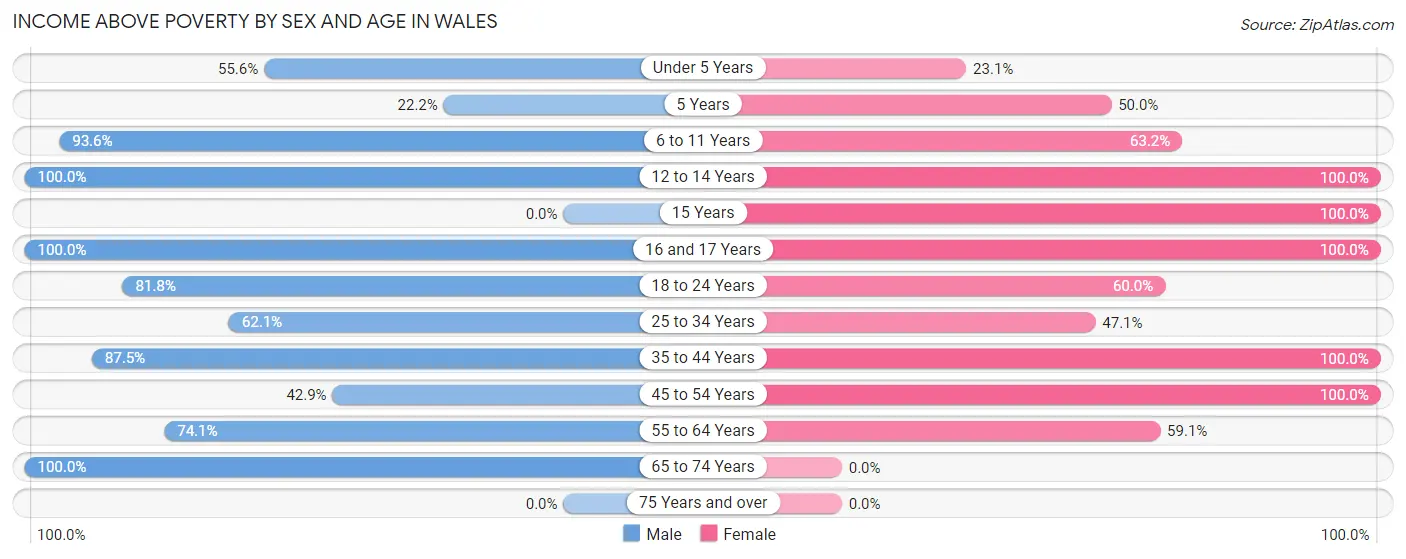
| Age Bracket | Male | Female |
| Under 5 Years | 10 (55.6%) | 3 (23.1%) |
| 5 Years | 2 (22.2%) | 2 (50.0%) |
| 6 to 11 Years | 29 (93.5%) | 12 (63.2%) |
| 12 to 14 Years | 5 (100.0%) | 8 (100.0%) |
| 15 Years | 0 (0.0%) | 4 (100.0%) |
| 16 and 17 Years | 6 (100.0%) | 9 (100.0%) |
| 18 to 24 Years | 9 (81.8%) | 6 (60.0%) |
| 25 to 34 Years | 18 (62.1%) | 8 (47.1%) |
| 35 to 44 Years | 21 (87.5%) | 8 (100.0%) |
| 45 to 54 Years | 3 (42.9%) | 2 (100.0%) |
| 55 to 64 Years | 20 (74.1%) | 13 (59.1%) |
| 65 to 74 Years | 8 (100.0%) | 0 (0.0%) |
| 75 Years and over | 0 (0.0%) | 0 (0.0%) |
| Total | 131 (74.4%) | 75 (64.7%) |
Income Below Poverty Among Married-Couple Families in Wales
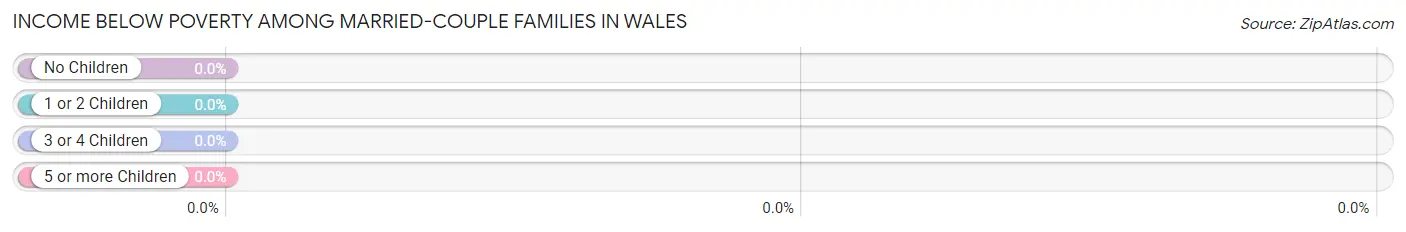
| Children | Above Poverty | Below Poverty |
| No Children | 2 (100.0%) | 0 (0.0%) |
| 1 or 2 Children | 4 (100.0%) | 0 (0.0%) |
| 3 or 4 Children | 2 (100.0%) | 0 (0.0%) |
| 5 or more Children | 6 (100.0%) | 0 (0.0%) |
| Total | 14 (100.0%) | 0 (0.0%) |
Income Below Poverty Among Single-Parent Households in Wales
According to the poverty data in Wales, 19.4% or 6 single-father households and 59.1% or 13 single-mother households are living below the poverty line. Among single-father households, those with 3 or 4 children have the highest poverty rate, with 2 households (40.0%) experiencing poverty. Likewise, among single-mother households, those with 3 or 4 children have the highest poverty rate, with 12 households (75.0%) falling below the poverty line.
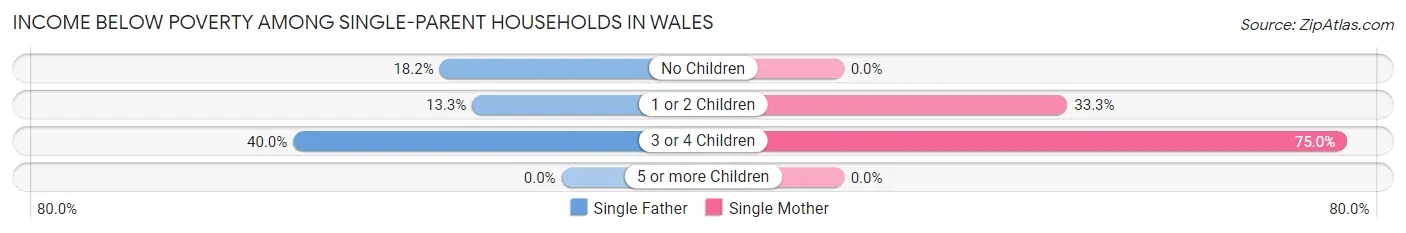
| Children | Single Father | Single Mother |
| No Children | 2 (18.2%) | 0 (0.0%) |
| 1 or 2 Children | 2 (13.3%) | 1 (33.3%) |
| 3 or 4 Children | 2 (40.0%) | 12 (75.0%) |
| 5 or more Children | 0 (0.0%) | 0 (0.0%) |
| Total | 6 (19.4%) | 13 (59.1%) |
Income Below Poverty Among Married-Couple vs Single-Parent Households in Wales
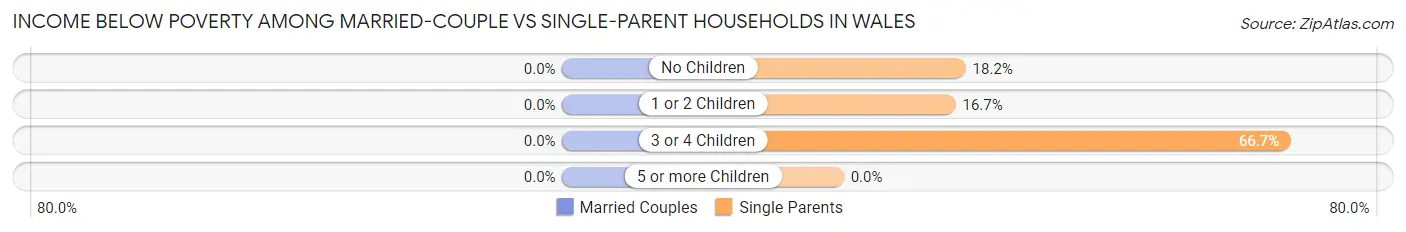
| Children | Married-Couple Families | Single-Parent Households |
| No Children | 0 (0.0%) | 2 (18.2%) |
| 1 or 2 Children | 0 (0.0%) | 3 (16.7%) |
| 3 or 4 Children | 0 (0.0%) | 14 (66.7%) |
| 5 or more Children | 0 (0.0%) | 0 (0.0%) |
| Total | 0 (0.0%) | 19 (35.8%) |
Race in Wales
The most populous races in Wales are , and Native / Alaskan (294 | 100.0%).
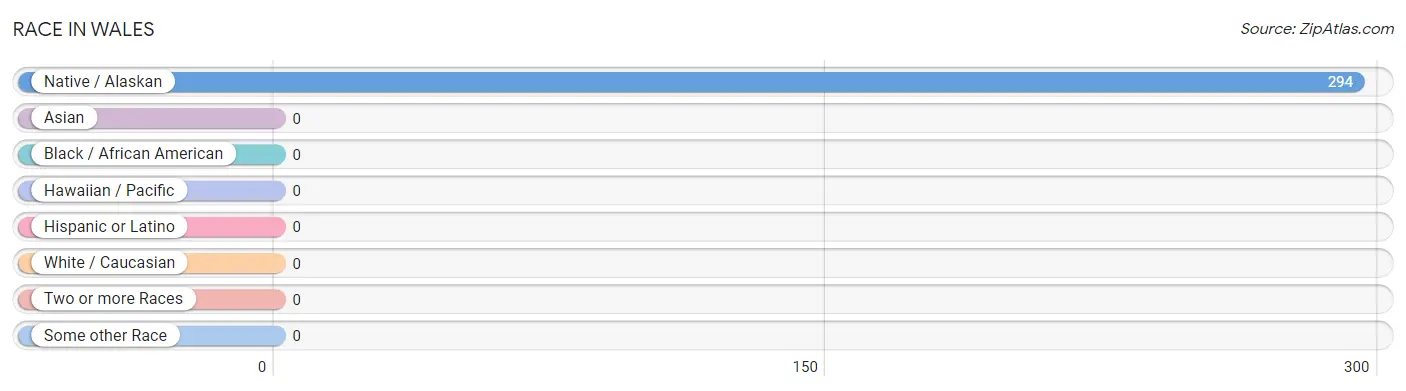
| Race | # Population | % Population |
| Asian | 0 | 0.0% |
| Black / African American | 0 | 0.0% |
| Hawaiian / Pacific | 0 | 0.0% |
| Hispanic or Latino | 0 | 0.0% |
| Native / Alaskan | 294 | 100.0% |
| White / Caucasian | 0 | 0.0% |
| Two or more Races | 0 | 0.0% |
| Some other Race | 0 | 0.0% |
| Total | 294 | 100.0% |
Ancestry in Wales
The most populous ancestries reported in Wales are Inupiat (284 | 96.6%), Yup'ik (8 | 2.7%), American (4 | 1.4%), and Alaska Native (2 | 0.7%), together accounting for 101.4% of all Wales residents.
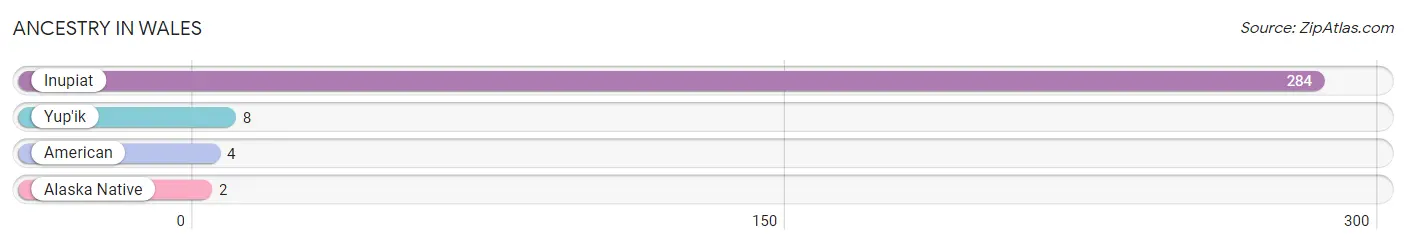
| Ancestry | # Population | % Population |
| Alaska Native | 2 | 0.7% |
| American | 4 | 1.4% |
| Inupiat | 284 | 96.6% |
| Yup'ik | 8 | 2.7% | View All 4 Rows |
Immigrants in Wales

| Immigration Origin | # Population | % Population | View All 0 Rows |
Sex and Age in Wales
Sex and Age in Wales
The most populous age groups in Wales are 5 to 9 Years (28 | 15.9%) for men and 5 to 9 Years (17 | 14.4%) for women.
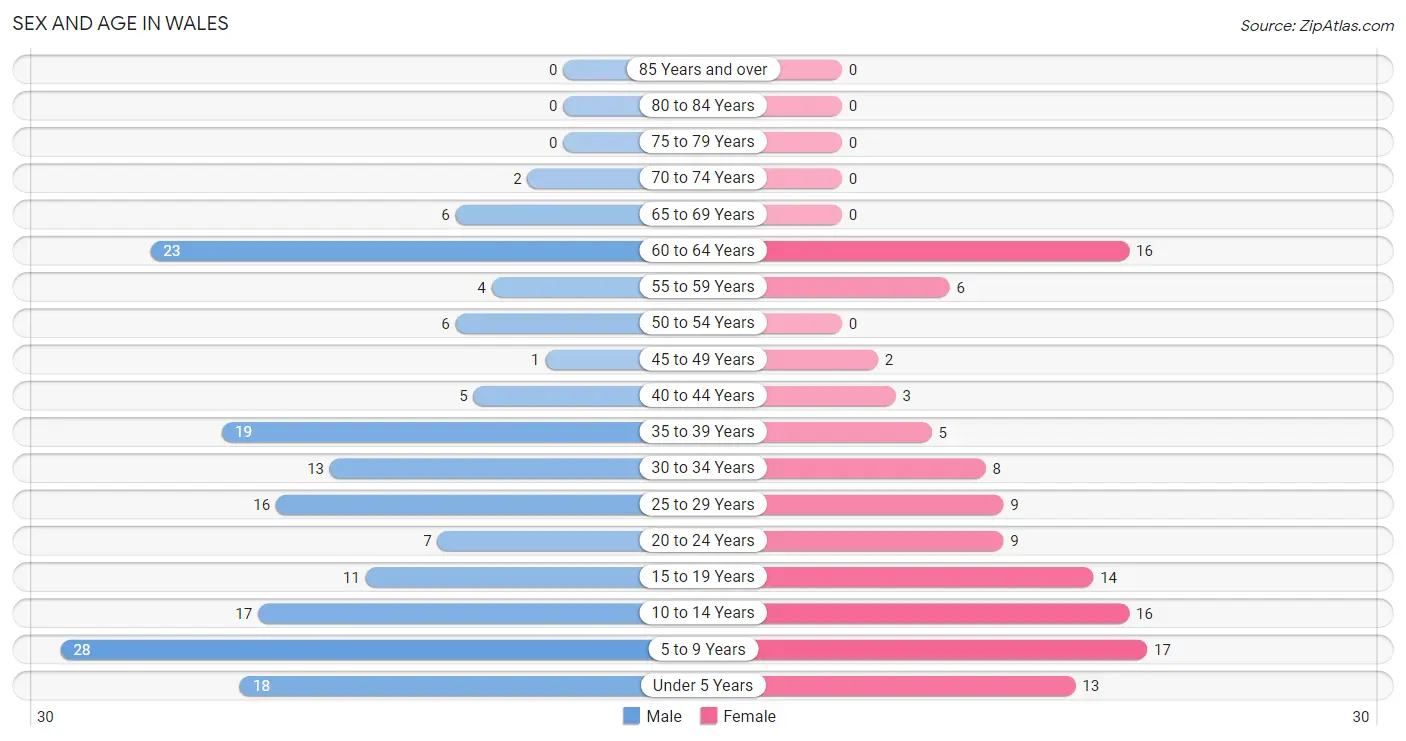
| Age Bracket | Male | Female |
| Under 5 Years | 18 (10.2%) | 13 (11.0%) |
| 5 to 9 Years | 28 (15.9%) | 17 (14.4%) |
| 10 to 14 Years | 17 (9.7%) | 16 (13.6%) |
| 15 to 19 Years | 11 (6.2%) | 14 (11.9%) |
| 20 to 24 Years | 7 (4.0%) | 9 (7.6%) |
| 25 to 29 Years | 16 (9.1%) | 9 (7.6%) |
| 30 to 34 Years | 13 (7.4%) | 8 (6.8%) |
| 35 to 39 Years | 19 (10.8%) | 5 (4.2%) |
| 40 to 44 Years | 5 (2.8%) | 3 (2.5%) |
| 45 to 49 Years | 1 (0.6%) | 2 (1.7%) |
| 50 to 54 Years | 6 (3.4%) | 0 (0.0%) |
| 55 to 59 Years | 4 (2.3%) | 6 (5.1%) |
| 60 to 64 Years | 23 (13.1%) | 16 (13.6%) |
| 65 to 69 Years | 6 (3.4%) | 0 (0.0%) |
| 70 to 74 Years | 2 (1.1%) | 0 (0.0%) |
| 75 to 79 Years | 0 (0.0%) | 0 (0.0%) |
| 80 to 84 Years | 0 (0.0%) | 0 (0.0%) |
| 85 Years and over | 0 (0.0%) | 0 (0.0%) |
| Total | 176 (100.0%) | 118 (100.0%) |
Families and Households in Wales
Median Family Size in Wales
The median family size in Wales is 3.60 persons per family, with married-couple families (14 | 20.9%) accounting for the largest median family size of 4.86 persons per family. On the other hand, single male/father families (31 | 46.3%) represent the smallest median family size with 2.48 persons per family.
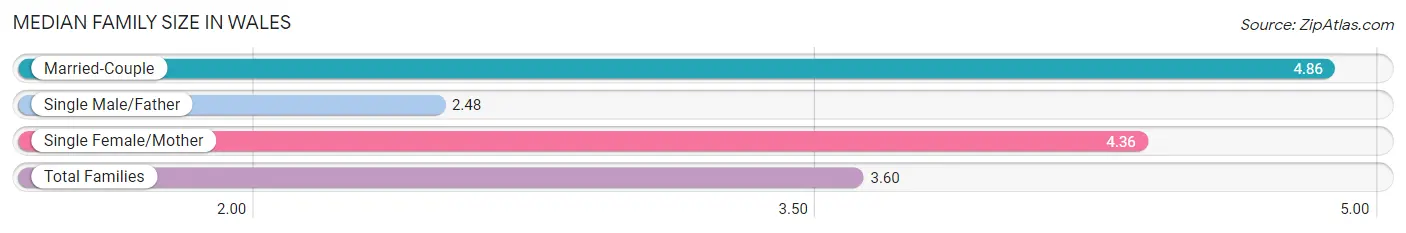
| Family Type | # Families | Family Size |
| Married-Couple | 14 (20.9%) | 4.86 |
| Single Male/Father | 31 (46.3%) | 2.48 |
| Single Female/Mother | 22 (32.8%) | 4.36 |
| Total Families | 67 (100.0%) | 3.60 |
Median Household Size in Wales
The median household size in Wales is 3.42 persons per household, with single female/mother households (22 | 25.6%) accounting for the largest median household size of 4.95 persons per household. non-family households (19 | 22.1%) represent the smallest median household size with 1.11 persons per household.
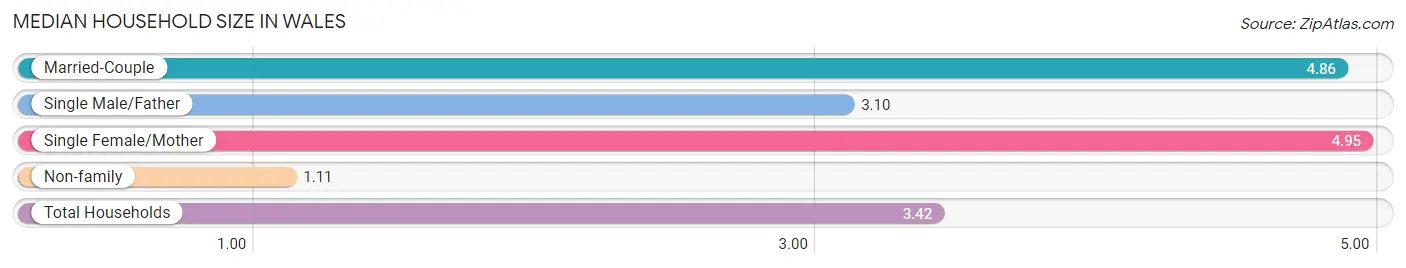
| Household Type | # Households | Household Size |
| Married-Couple | 14 (16.3%) | 4.86 |
| Single Male/Father | 31 (36.0%) | 3.10 |
| Single Female/Mother | 22 (25.6%) | 4.95 |
| Non-family | 19 (22.1%) | 1.11 |
| Total Households | 86 (100.0%) | 3.42 |
Household Size by Marriage Status in Wales
Out of a total of 86 households in Wales, 67 (77.9%) are family households, while 19 (22.1%) are nonfamily households. The most numerous type of family households are 7+ person households, comprising 16, and the most common type of nonfamily households are 1-person households, comprising 17.
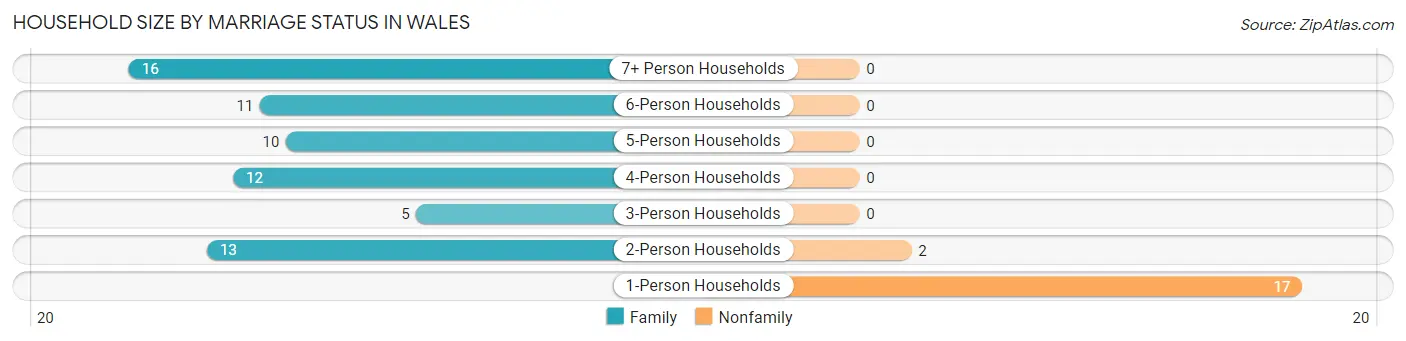
| Household Size | Family Households | Nonfamily Households |
| 1-Person Households | - | 17 (19.8%) |
| 2-Person Households | 13 (15.1%) | 2 (2.3%) |
| 3-Person Households | 5 (5.8%) | 0 (0.0%) |
| 4-Person Households | 12 (14.0%) | 0 (0.0%) |
| 5-Person Households | 10 (11.6%) | 0 (0.0%) |
| 6-Person Households | 11 (12.8%) | 0 (0.0%) |
| 7+ Person Households | 16 (18.6%) | 0 (0.0%) |
| Total | 67 (77.9%) | 19 (22.1%) |
Female Fertility in Wales
Fertility by Age in Wales
Average fertility rate in Wales is 140.0 births per 1,000 women. Women in the age bracket of 20 to 34 years have the highest fertility rate with 269.0 births per 1,000 women. Women in the age bracket of 20 to 34 years acount for 100.0% of all women with births.
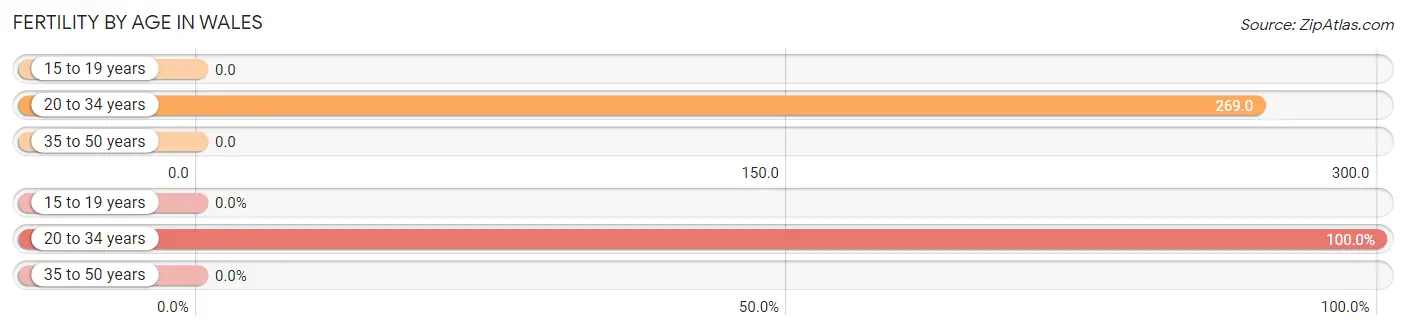
| Age Bracket | Women with Births | Births / 1,000 Women |
| 15 to 19 years | 0 (0.0%) | 0.0 |
| 20 to 34 years | 7 (100.0%) | 269.0 |
| 35 to 50 years | 0 (0.0%) | 0.0 |
| Total | 7 (100.0%) | 140.0 |
Fertility by Age by Marriage Status in Wales
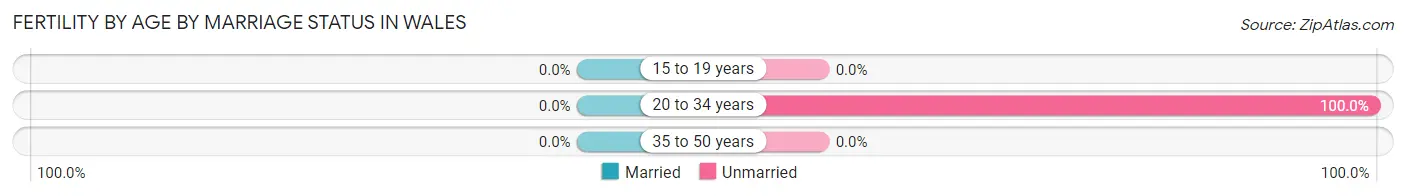
| Age Bracket | Married | Unmarried |
| 15 to 19 years | 0 (0.0%) | 0 (0.0%) |
| 20 to 34 years | 0 (0.0%) | 7 (100.0%) |
| 35 to 50 years | 0 (0.0%) | 0 (0.0%) |
| Total | 0 (0.0%) | 7 (100.0%) |
Fertility by Education in Wales
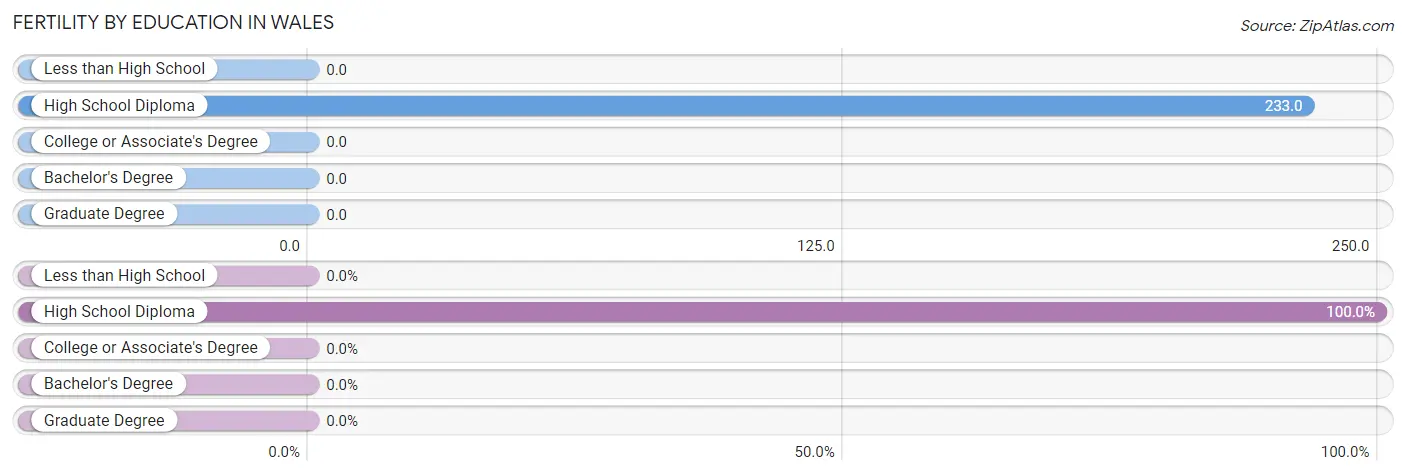
| Educational Attainment | Women with Births | Births / 1,000 Women |
| Less than High School | 0 (0.0%) | 0.0 |
| High School Diploma | 7 (100.0%) | 233.0 |
| College or Associate's Degree | 0 (0.0%) | 0.0 |
| Bachelor's Degree | 0 (0.0%) | 0.0 |
| Graduate Degree | 0 (0.0%) | 0.0 |
| Total | 7 (100.0%) | 140.0 |
Fertility by Education by Marriage Status in Wales
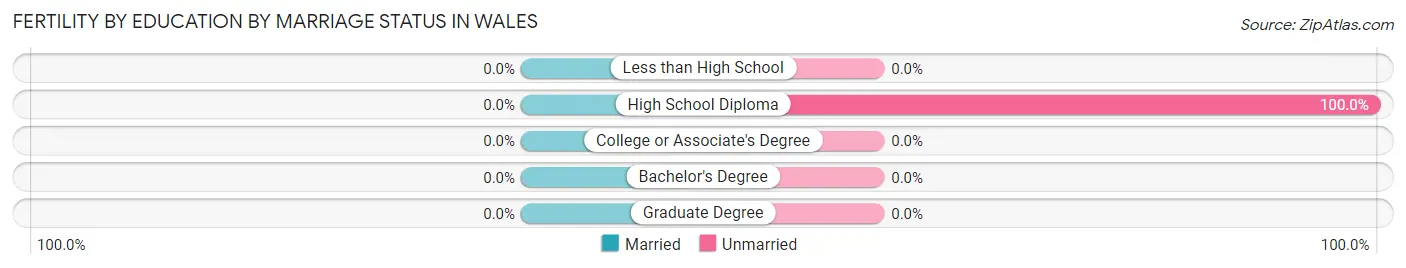
| Educational Attainment | Married | Unmarried |
| Less than High School | 0 (0.0%) | 0 (0.0%) |
| High School Diploma | 0 (0.0%) | 7 (100.0%) |
| College or Associate's Degree | 0 (0.0%) | 0 (0.0%) |
| Bachelor's Degree | 0 (0.0%) | 0 (0.0%) |
| Graduate Degree | 0 (0.0%) | 0 (0.0%) |
| Total | 0 (0.0%) | 7 (100.0%) |
Employment Characteristics in Wales
Employment by Class of Employer in Wales
Among the 93 employed individuals in Wales, local government employees (32 | 34.4%), private company employees (26 | 28.0%), and not-for-profit organizations (16 | 17.2%) make up the most common classes of employment.
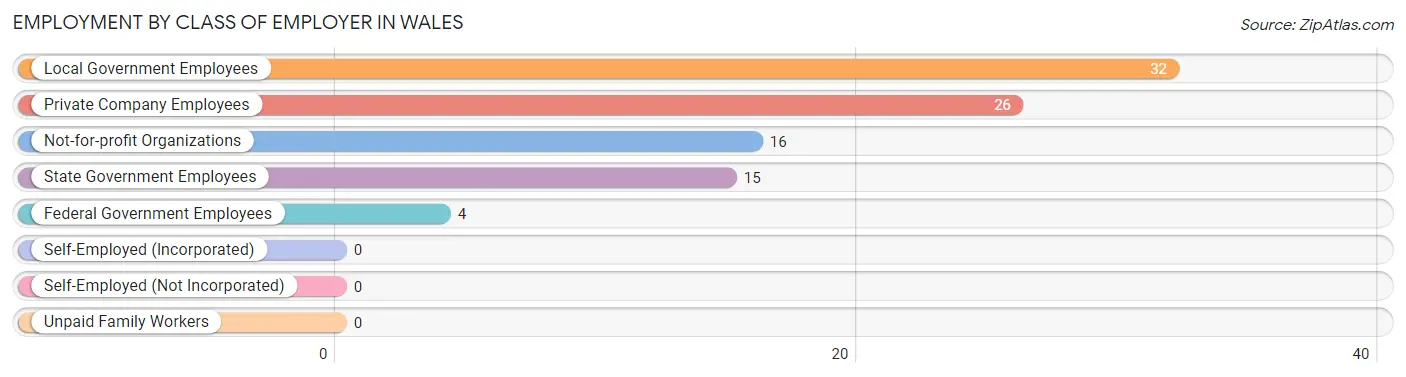
| Employer Class | # Employees | % Employees |
| Private Company Employees | 26 | 28.0% |
| Self-Employed (Incorporated) | 0 | 0.0% |
| Self-Employed (Not Incorporated) | 0 | 0.0% |
| Not-for-profit Organizations | 16 | 17.2% |
| Local Government Employees | 32 | 34.4% |
| State Government Employees | 15 | 16.1% |
| Federal Government Employees | 4 | 4.3% |
| Unpaid Family Workers | 0 | 0.0% |
| Total | 93 | 100.0% |
Employment Status by Age in Wales
According to the labor force statistics for Wales, out of the total population over 16 years of age (180), 64.4% or 116 individuals are in the labor force, with 14.7% or 17 of them unemployed. The age group with the highest labor force participation rate is 20 to 24 years, with 100.0% or 16 individuals in the labor force. Within the labor force, the 45 to 54 years age range has the highest percentage of unemployed individuals, with 37.5% or 3 of them being unemployed.
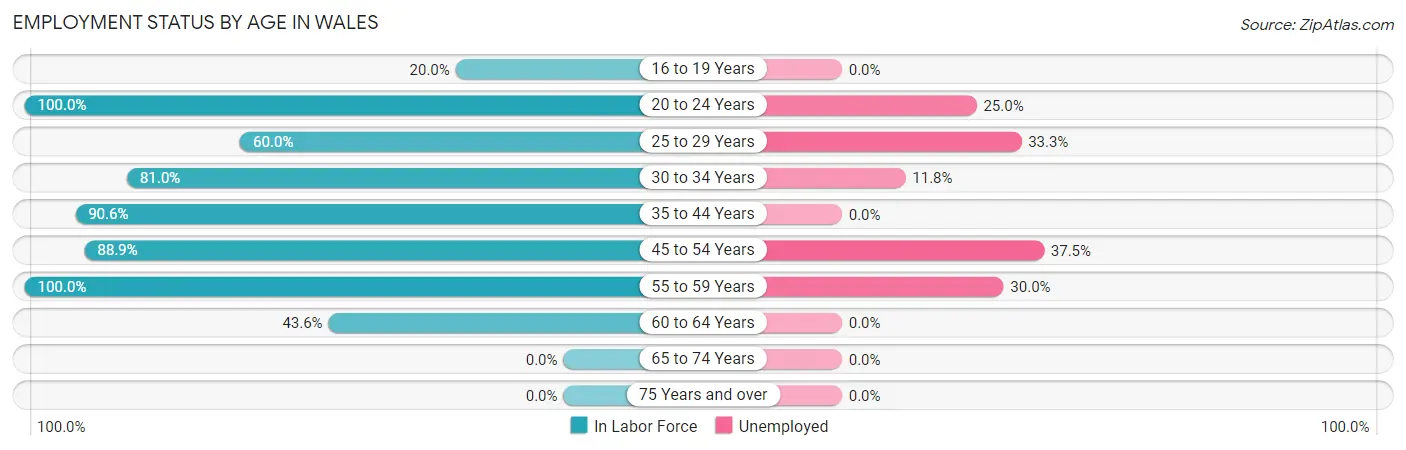
| Age Bracket | In Labor Force | Unemployed |
| 16 to 19 Years | 4 (20.0%) | 0 (0.0%) |
| 20 to 24 Years | 16 (100.0%) | 4 (25.0%) |
| 25 to 29 Years | 15 (60.0%) | 5 (33.3%) |
| 30 to 34 Years | 17 (81.0%) | 2 (11.8%) |
| 35 to 44 Years | 29 (90.6%) | 0 (0.0%) |
| 45 to 54 Years | 8 (88.9%) | 3 (37.5%) |
| 55 to 59 Years | 10 (100.0%) | 3 (30.0%) |
| 60 to 64 Years | 17 (43.6%) | 0 (0.0%) |
| 65 to 74 Years | 0 (0.0%) | 0 (0.0%) |
| 75 Years and over | 0 (0.0%) | 0 (0.0%) |
| Total | 116 (64.4%) | 17 (14.7%) |
Employment Status by Educational Attainment in Wales
According to labor force statistics for Wales, 70.6% of individuals (96) out of the total population between 25 and 64 years of age (136) are in the labor force, with 13.5% or 13 of them being unemployed. The group with the highest labor force participation rate are those with the educational attainment of college / associate degree, with 88.9% or 16 individuals in the labor force. Within the labor force, individuals with high school diploma education have the highest percentage of unemployment, with 17.9% or 12 of them being unemployed.
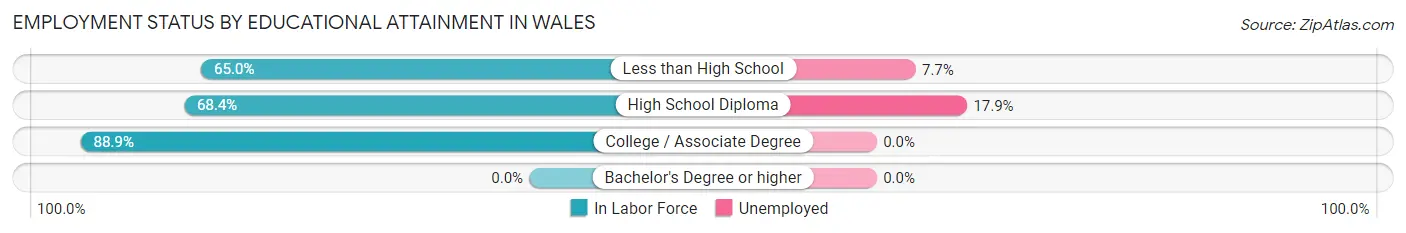
| Educational Attainment | In Labor Force | Unemployed |
| Less than High School | 13 (65.0%) | 2 (7.7%) |
| High School Diploma | 67 (68.4%) | 18 (17.9%) |
| College / Associate Degree | 16 (88.9%) | 0 (0.0%) |
| Bachelor's Degree or higher | 0 (0.0%) | 0 (0.0%) |
| Total | 96 (70.6%) | 18 (13.5%) |
Employment Occupations by Sex in Wales
Management, Business, Science and Arts Occupations
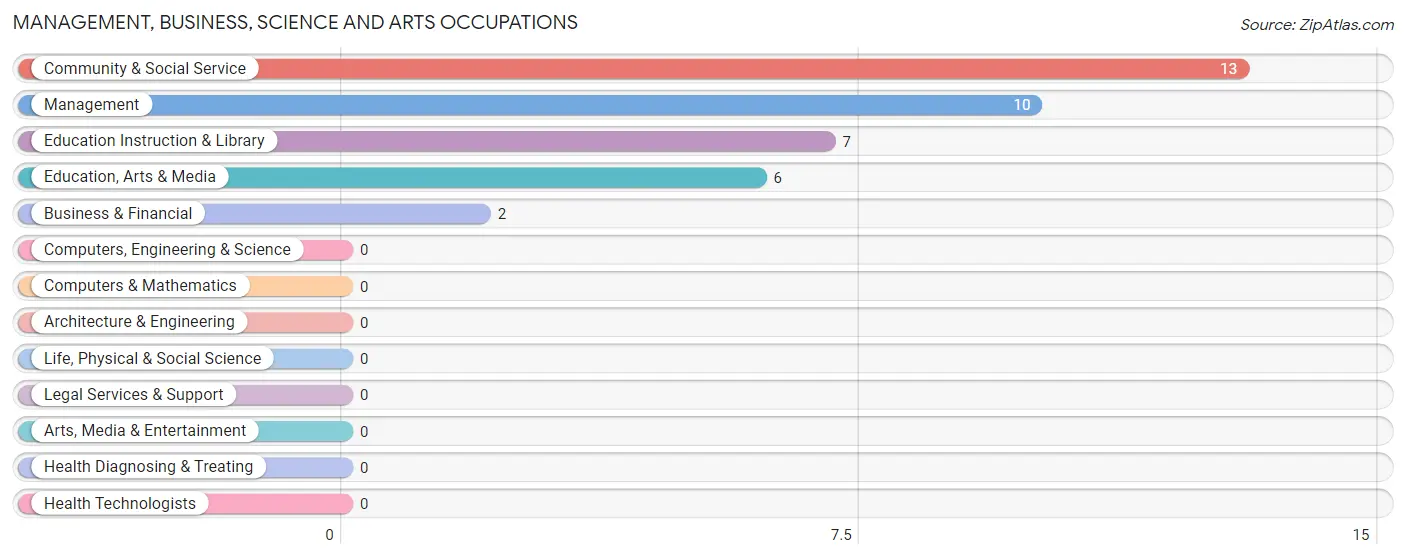
The most common Management, Business, Science and Arts occupations in Wales are Community & Social Service (13 | 13.1%), Management (10 | 10.1%), Education Instruction & Library (7 | 7.1%), Education, Arts & Media (6 | 6.1%), and Business & Financial (2 | 2.0%).
Management, Business, Science and Arts Occupations by Sex
Within the Management, Business, Science and Arts occupations in Wales, the most male-oriented occupations are Business & Financial (100.0%), Education, Arts & Media (66.7%), and Management (40.0%), while the most female-oriented occupations are Education Instruction & Library (100.0%), Community & Social Service (69.2%), and Management (60.0%).
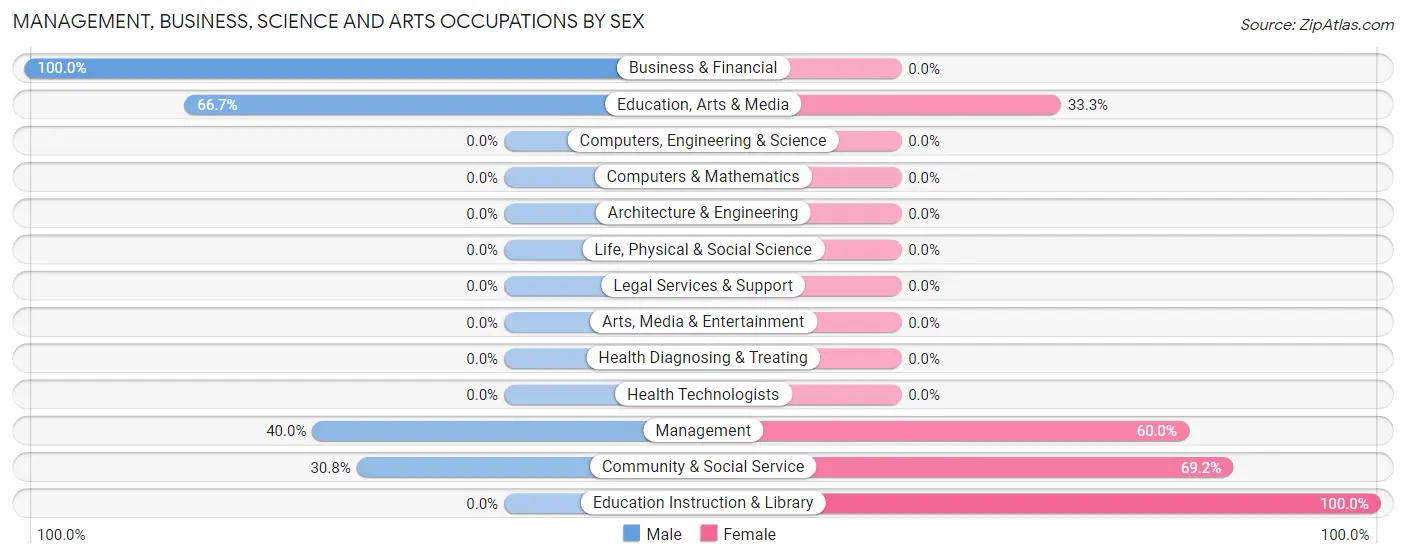
| Occupation | Male | Female |
| Management | 4 (40.0%) | 6 (60.0%) |
| Business & Financial | 2 (100.0%) | 0 (0.0%) |
| Computers, Engineering & Science | 0 (0.0%) | 0 (0.0%) |
| Computers & Mathematics | 0 (0.0%) | 0 (0.0%) |
| Architecture & Engineering | 0 (0.0%) | 0 (0.0%) |
| Life, Physical & Social Science | 0 (0.0%) | 0 (0.0%) |
| Community & Social Service | 4 (30.8%) | 9 (69.2%) |
| Education, Arts & Media | 4 (66.7%) | 2 (33.3%) |
| Legal Services & Support | 0 (0.0%) | 0 (0.0%) |
| Education Instruction & Library | 0 (0.0%) | 7 (100.0%) |
| Arts, Media & Entertainment | 0 (0.0%) | 0 (0.0%) |
| Health Diagnosing & Treating | 0 (0.0%) | 0 (0.0%) |
| Health Technologists | 0 (0.0%) | 0 (0.0%) |
| Total (Category) | 10 (40.0%) | 15 (60.0%) |
| Total (Overall) | 61 (61.6%) | 38 (38.4%) |
Services Occupations
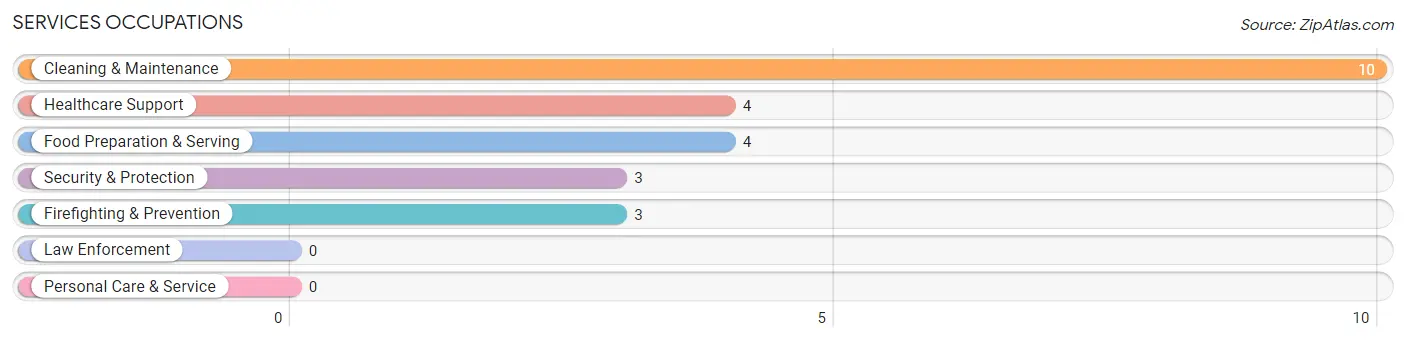
The most common Services occupations in Wales are Cleaning & Maintenance (10 | 10.1%), Healthcare Support (4 | 4.0%), Food Preparation & Serving (4 | 4.0%), Security & Protection (3 | 3.0%), and Firefighting & Prevention (3 | 3.0%).
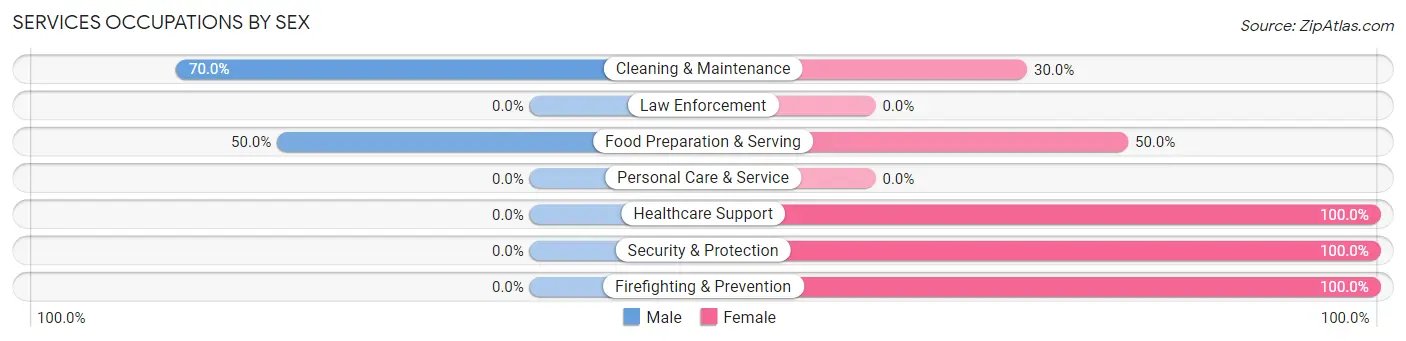
Services Occupations by Sex
Within the Services occupations in Wales, the most male-oriented occupations are Cleaning & Maintenance (70.0%), and Food Preparation & Serving (50.0%), while the most female-oriented occupations are Healthcare Support (100.0%), Security & Protection (100.0%), and Firefighting & Prevention (100.0%).
| Occupation | Male | Female |
| Healthcare Support | 0 (0.0%) | 4 (100.0%) |
| Security & Protection | 0 (0.0%) | 3 (100.0%) |
| Firefighting & Prevention | 0 (0.0%) | 3 (100.0%) |
| Law Enforcement | 0 (0.0%) | 0 (0.0%) |
| Food Preparation & Serving | 2 (50.0%) | 2 (50.0%) |
| Cleaning & Maintenance | 7 (70.0%) | 3 (30.0%) |
| Personal Care & Service | 0 (0.0%) | 0 (0.0%) |
| Total (Category) | 9 (42.9%) | 12 (57.1%) |
| Total (Overall) | 61 (61.6%) | 38 (38.4%) |
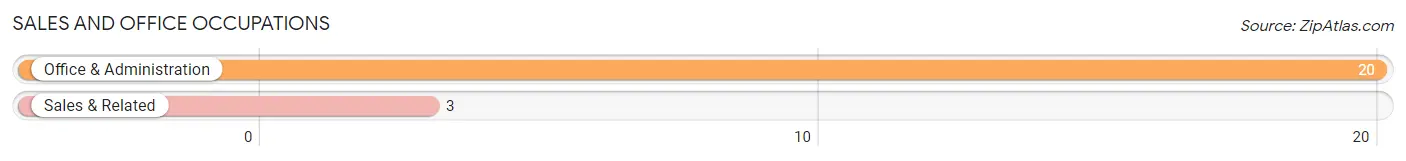
Sales and Office Occupations
The most common Sales and Office occupations in Wales are Office & Administration (20 | 20.2%), and Sales & Related (3 | 3.0%).
Sales and Office Occupations by Sex

| Occupation | Male | Female |
| Sales & Related | 0 (0.0%) | 3 (100.0%) |
| Office & Administration | 12 (60.0%) | 8 (40.0%) |
| Total (Category) | 12 (52.2%) | 11 (47.8%) |
| Total (Overall) | 61 (61.6%) | 38 (38.4%) |
Natural Resources, Construction and Maintenance Occupations
The most common Natural Resources, Construction and Maintenance occupations in Wales are , and Installation, Maintenance & Repair (6 | 6.1%).

Natural Resources, Construction and Maintenance Occupations by Sex
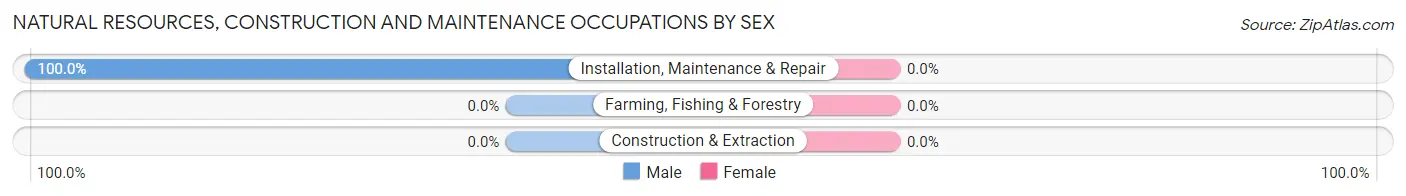
| Occupation | Male | Female |
| Farming, Fishing & Forestry | 0 (0.0%) | 0 (0.0%) |
| Construction & Extraction | 0 (0.0%) | 0 (0.0%) |
| Installation, Maintenance & Repair | 6 (100.0%) | 0 (0.0%) |
| Total (Category) | 6 (100.0%) | 0 (0.0%) |
| Total (Overall) | 61 (61.6%) | 38 (38.4%) |
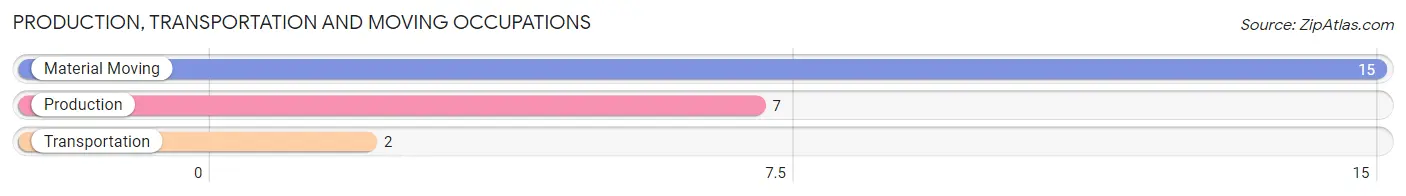
Production, Transportation and Moving Occupations
The most common Production, Transportation and Moving occupations in Wales are Material Moving (15 | 15.1%), Production (7 | 7.1%), and Transportation (2 | 2.0%).
Production, Transportation and Moving Occupations by Sex
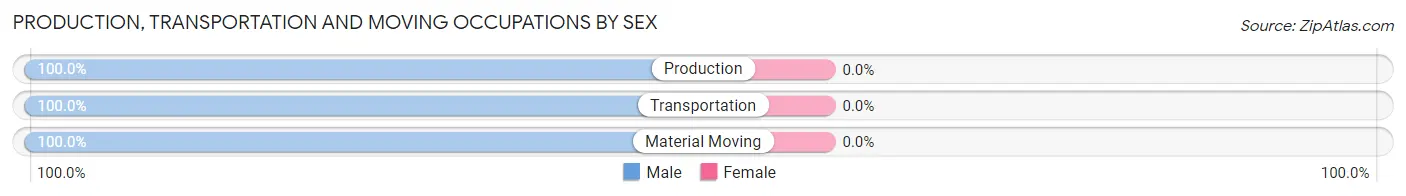
| Occupation | Male | Female |
| Production | 7 (100.0%) | 0 (0.0%) |
| Transportation | 2 (100.0%) | 0 (0.0%) |
| Material Moving | 15 (100.0%) | 0 (0.0%) |
| Total (Category) | 24 (100.0%) | 0 (0.0%) |
| Total (Overall) | 61 (61.6%) | 38 (38.4%) |
Employment Industries by Sex in Wales
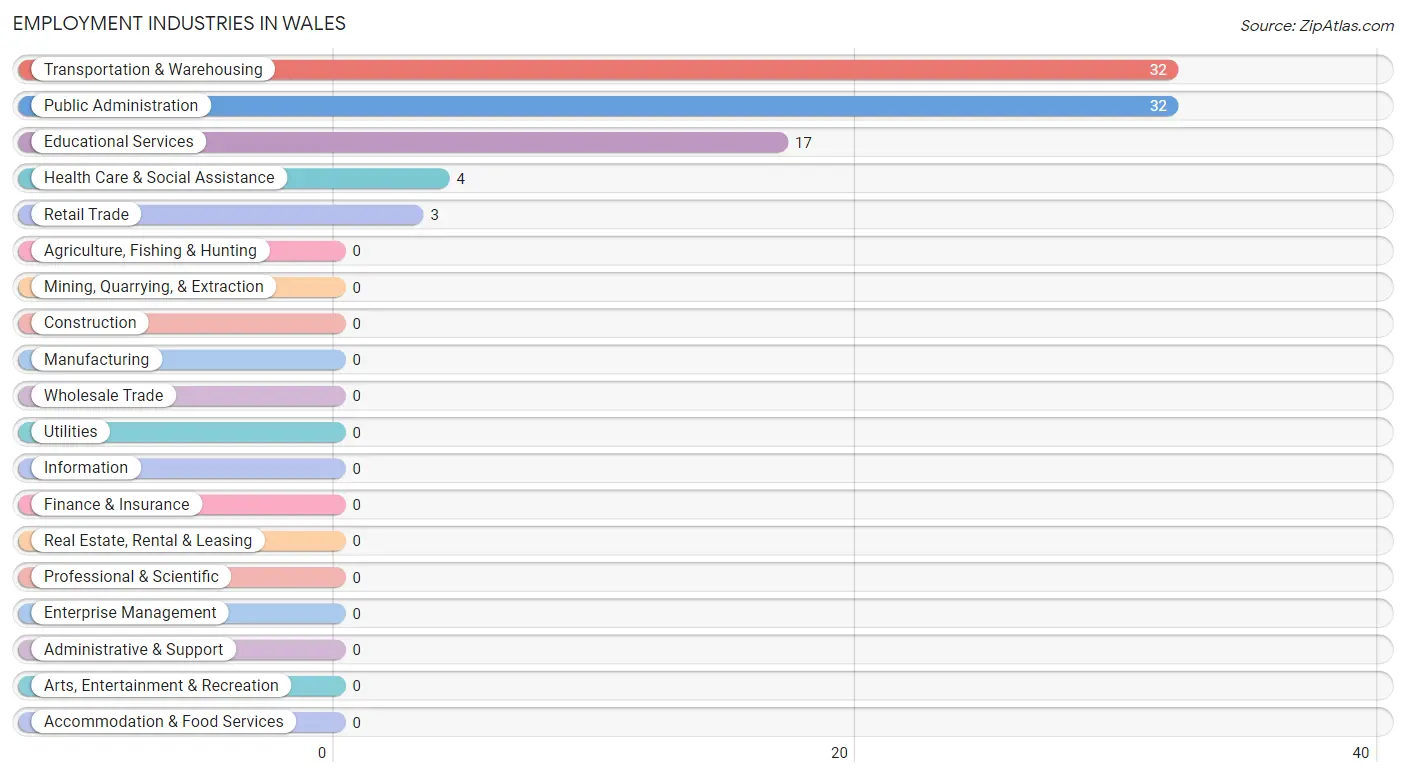
Employment Industries in Wales
The major employment industries in Wales include Transportation & Warehousing (32 | 32.3%), Public Administration (32 | 32.3%), Educational Services (17 | 17.2%), Health Care & Social Assistance (4 | 4.0%), and Retail Trade (3 | 3.0%).
Employment Industries by Sex in Wales
The Wales industries that see more men than women are Transportation & Warehousing (81.2%), Retail Trade (66.7%), and Public Administration (59.4%), whereas the industries that tend to have a higher number of women are Health Care & Social Assistance (100.0%), Educational Services (58.8%), and Public Administration (40.6%).
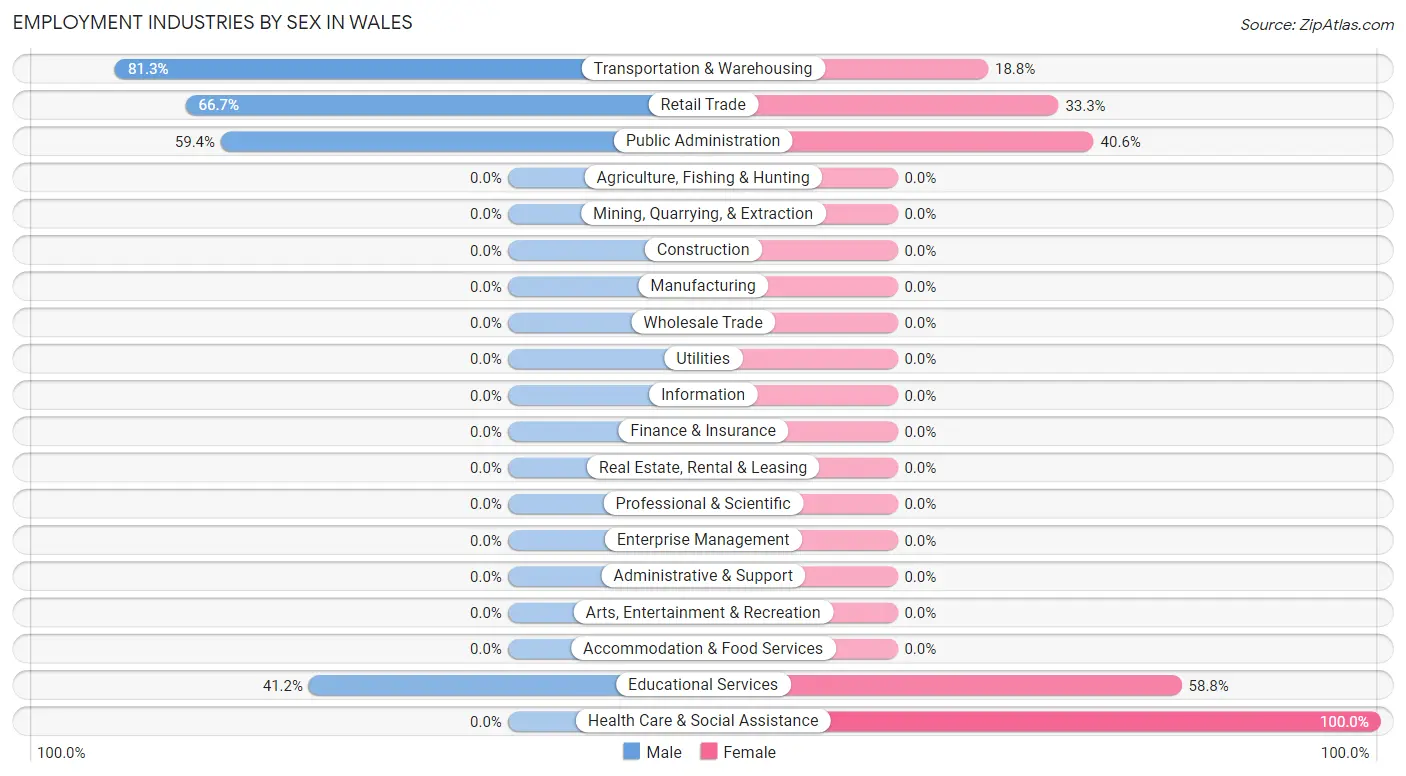
| Industry | Male | Female |
| Agriculture, Fishing & Hunting | 0 (0.0%) | 0 (0.0%) |
| Mining, Quarrying, & Extraction | 0 (0.0%) | 0 (0.0%) |
| Construction | 0 (0.0%) | 0 (0.0%) |
| Manufacturing | 0 (0.0%) | 0 (0.0%) |
| Wholesale Trade | 0 (0.0%) | 0 (0.0%) |
| Retail Trade | 2 (66.7%) | 1 (33.3%) |
| Transportation & Warehousing | 26 (81.2%) | 6 (18.8%) |
| Utilities | 0 (0.0%) | 0 (0.0%) |
| Information | 0 (0.0%) | 0 (0.0%) |
| Finance & Insurance | 0 (0.0%) | 0 (0.0%) |
| Real Estate, Rental & Leasing | 0 (0.0%) | 0 (0.0%) |
| Professional & Scientific | 0 (0.0%) | 0 (0.0%) |
| Enterprise Management | 0 (0.0%) | 0 (0.0%) |
| Administrative & Support | 0 (0.0%) | 0 (0.0%) |
| Educational Services | 7 (41.2%) | 10 (58.8%) |
| Health Care & Social Assistance | 0 (0.0%) | 4 (100.0%) |
| Arts, Entertainment & Recreation | 0 (0.0%) | 0 (0.0%) |
| Accommodation & Food Services | 0 (0.0%) | 0 (0.0%) |
| Public Administration | 19 (59.4%) | 13 (40.6%) |
| Total | 61 (61.6%) | 38 (38.4%) |
Education in Wales
School Enrollment in Wales
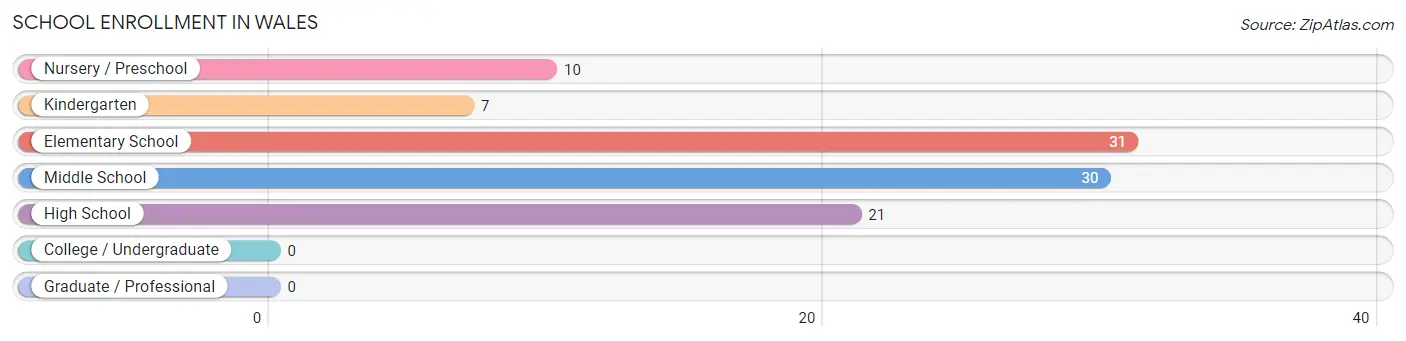
The most common levels of schooling among the 99 students in Wales are elementary school (31 | 31.3%), middle school (30 | 30.3%), and high school (21 | 21.2%).
| School Level | # Students | % Students |
| Nursery / Preschool | 10 | 10.1% |
| Kindergarten | 7 | 7.1% |
| Elementary School | 31 | 31.3% |
| Middle School | 30 | 30.3% |
| High School | 21 | 21.2% |
| College / Undergraduate | 0 | 0.0% |
| Graduate / Professional | 0 | 0.0% |
| Total | 99 | 100.0% |
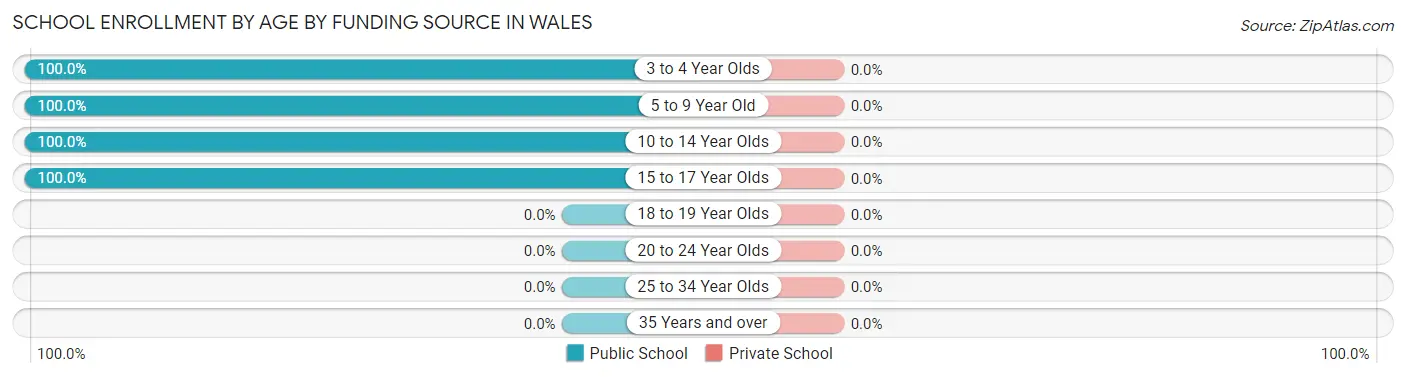
School Enrollment by Age by Funding Source in Wales
| Age Bracket | Public School | Private School |
| 3 to 4 Year Olds | 4 (100.0%) | 0 (0.0%) |
| 5 to 9 Year Old | 45 (100.0%) | 0 (0.0%) |
| 10 to 14 Year Olds | 33 (100.0%) | 0 (0.0%) |
| 15 to 17 Year Olds | 17 (100.0%) | 0 (0.0%) |
| 18 to 19 Year Olds | 0 (0.0%) | 0 (0.0%) |
| 20 to 24 Year Olds | 0 (0.0%) | 0 (0.0%) |
| 25 to 34 Year Olds | 0 (0.0%) | 0 (0.0%) |
| 35 Years and over | 0 (0.0%) | 0 (0.0%) |
| Total | 99 (100.0%) | 0 (0.0%) |
Educational Attainment by Field of Study in Wales
| Field of Study | # Graduates | % Graduates |
| Computers & Mathematics | 0 | 0.0% |
| Bio, Nature & Agricultural | 0 | 0.0% |
| Physical & Health Sciences | 0 | 0.0% |
| Psychology | 0 | 0.0% |
| Social Sciences | 0 | 0.0% |
| Engineering | 0 | 0.0% |
| Multidisciplinary Studies | 0 | 0.0% |
| Science & Technology | 0 | 0.0% |
| Business | 0 | 0.0% |
| Education | 0 | 0.0% |
| Literature & Languages | 0 | 0.0% |
| Liberal Arts & History | 0 | 0.0% |
| Visual & Performing Arts | 0 | 0.0% |
| Communications | 0 | 0.0% |
| Arts & Humanities | 0 | 0.0% |
| Total | 0 | 0.0% |
Transportation & Commute in Wales
Vehicle Availability by Sex in Wales
The most prevalent vehicle ownership categories in Wales are males with no vehicle (55, accounting for 100.0%) and females with no vehicle (38, making up 144.7%).
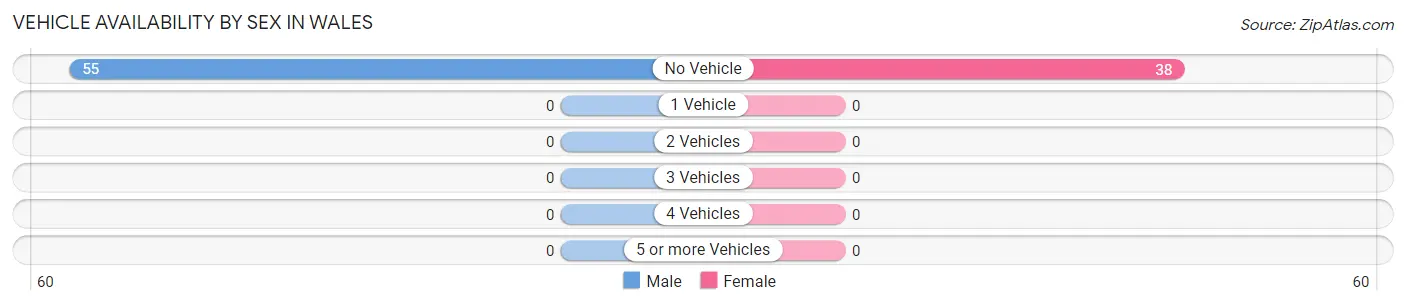
| Vehicles Available | Male | Female |
| No Vehicle | 55 (100.0%) | 38 (100.0%) |
| 1 Vehicle | 0 (0.0%) | 0 (0.0%) |
| 2 Vehicles | 0 (0.0%) | 0 (0.0%) |
| 3 Vehicles | 0 (0.0%) | 0 (0.0%) |
| 4 Vehicles | 0 (0.0%) | 0 (0.0%) |
| 5 or more Vehicles | 0 (0.0%) | 0 (0.0%) |
| Total | 55 (100.0%) | 38 (100.0%) |
Commute Time in Wales
The most frequently occuring commute durations in Wales are less than 5 minutes (51 commuters, 58.6%), 5 to 9 minutes (31 commuters, 35.6%), and 10 to 14 minutes (3 commuters, 3.5%).
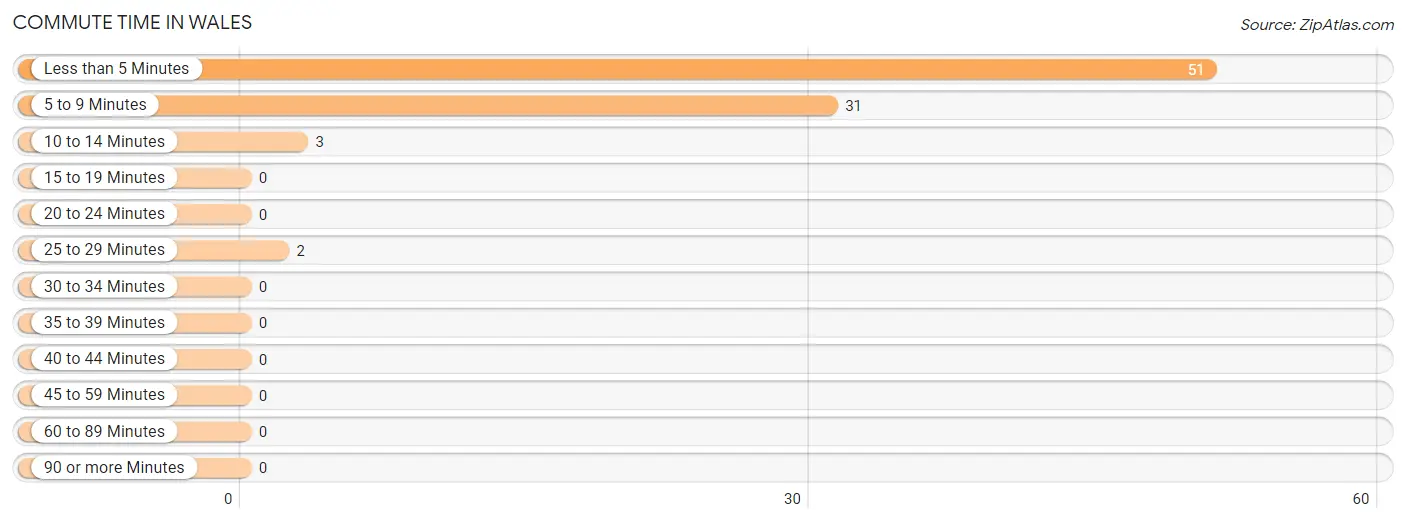
| Commute Time | # Commuters | % Commuters |
| Less than 5 Minutes | 51 | 58.6% |
| 5 to 9 Minutes | 31 | 35.6% |
| 10 to 14 Minutes | 3 | 3.5% |
| 15 to 19 Minutes | 0 | 0.0% |
| 20 to 24 Minutes | 0 | 0.0% |
| 25 to 29 Minutes | 2 | 2.3% |
| 30 to 34 Minutes | 0 | 0.0% |
| 35 to 39 Minutes | 0 | 0.0% |
| 40 to 44 Minutes | 0 | 0.0% |
| 45 to 59 Minutes | 0 | 0.0% |
| 60 to 89 Minutes | 0 | 0.0% |
| 90 or more Minutes | 0 | 0.0% |
Commute Time by Sex in Wales
The most common commute times in Wales are less than 5 minutes (36 commuters, 70.6%) for males and 5 to 9 minutes (16 commuters, 44.4%) for females.
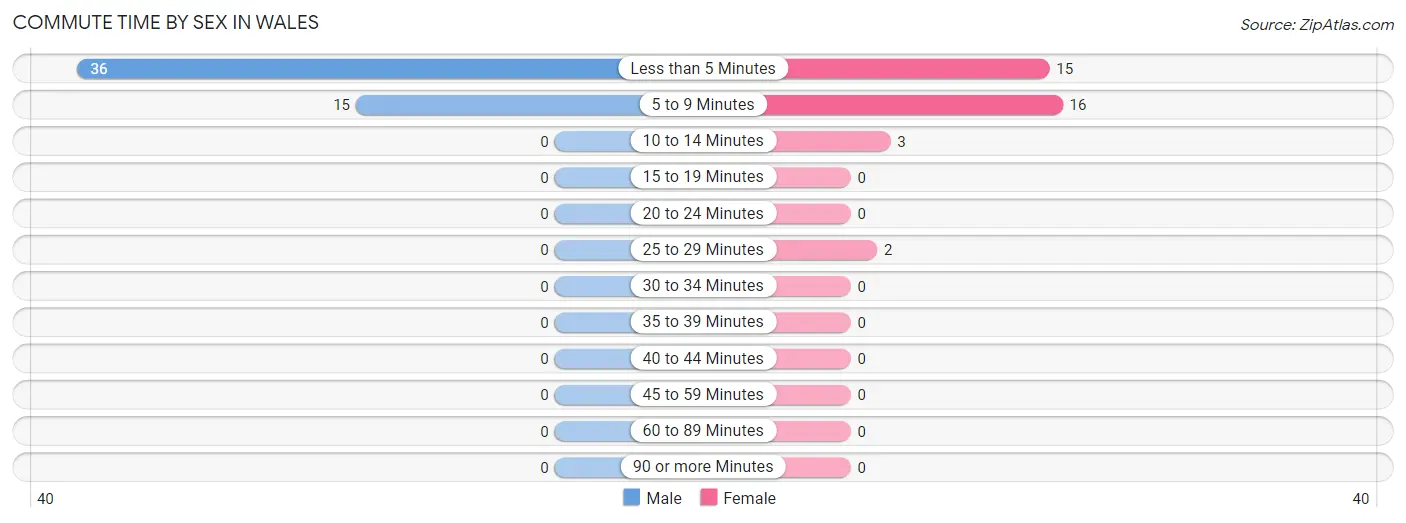
| Commute Time | Male | Female |
| Less than 5 Minutes | 36 (70.6%) | 15 (41.7%) |
| 5 to 9 Minutes | 15 (29.4%) | 16 (44.4%) |
| 10 to 14 Minutes | 0 (0.0%) | 3 (8.3%) |
| 15 to 19 Minutes | 0 (0.0%) | 0 (0.0%) |
| 20 to 24 Minutes | 0 (0.0%) | 0 (0.0%) |
| 25 to 29 Minutes | 0 (0.0%) | 2 (5.6%) |
| 30 to 34 Minutes | 0 (0.0%) | 0 (0.0%) |
| 35 to 39 Minutes | 0 (0.0%) | 0 (0.0%) |
| 40 to 44 Minutes | 0 (0.0%) | 0 (0.0%) |
| 45 to 59 Minutes | 0 (0.0%) | 0 (0.0%) |
| 60 to 89 Minutes | 0 (0.0%) | 0 (0.0%) |
| 90 or more Minutes | 0 (0.0%) | 0 (0.0%) |
Time of Departure to Work by Sex in Wales
The most frequent times of departure to work in Wales are 8:30 AM to 8:59 AM (25, 49.0%) for males and 8:30 AM to 8:59 AM (16, 44.4%) for females.
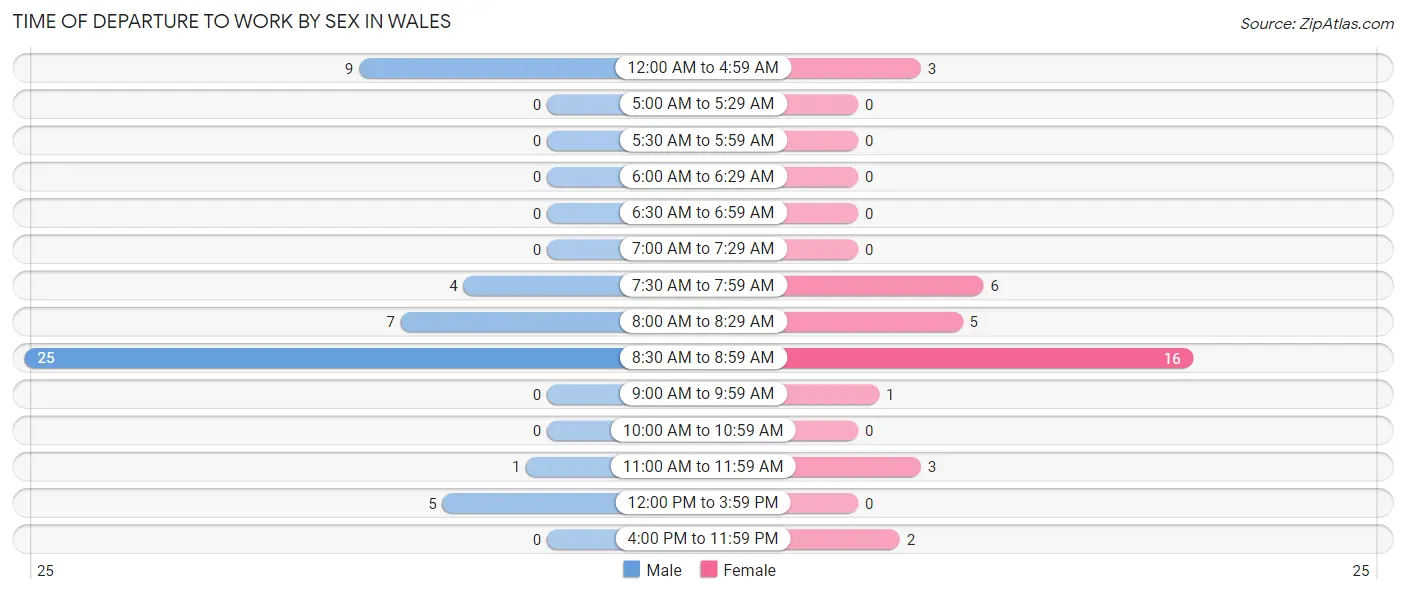
| Time of Departure | Male | Female |
| 12:00 AM to 4:59 AM | 9 (17.6%) | 3 (8.3%) |
| 5:00 AM to 5:29 AM | 0 (0.0%) | 0 (0.0%) |
| 5:30 AM to 5:59 AM | 0 (0.0%) | 0 (0.0%) |
| 6:00 AM to 6:29 AM | 0 (0.0%) | 0 (0.0%) |
| 6:30 AM to 6:59 AM | 0 (0.0%) | 0 (0.0%) |
| 7:00 AM to 7:29 AM | 0 (0.0%) | 0 (0.0%) |
| 7:30 AM to 7:59 AM | 4 (7.8%) | 6 (16.7%) |
| 8:00 AM to 8:29 AM | 7 (13.7%) | 5 (13.9%) |
| 8:30 AM to 8:59 AM | 25 (49.0%) | 16 (44.4%) |
| 9:00 AM to 9:59 AM | 0 (0.0%) | 1 (2.8%) |
| 10:00 AM to 10:59 AM | 0 (0.0%) | 0 (0.0%) |
| 11:00 AM to 11:59 AM | 1 (2.0%) | 3 (8.3%) |
| 12:00 PM to 3:59 PM | 5 (9.8%) | 0 (0.0%) |
| 4:00 PM to 11:59 PM | 0 (0.0%) | 2 (5.6%) |
| Total | 51 (100.0%) | 36 (100.0%) |
Housing Occupancy in Wales
Occupancy by Ownership in Wales
Of the total 86 dwellings in Wales, owner-occupied units account for 62 (72.1%), while renter-occupied units make up 24 (27.9%).
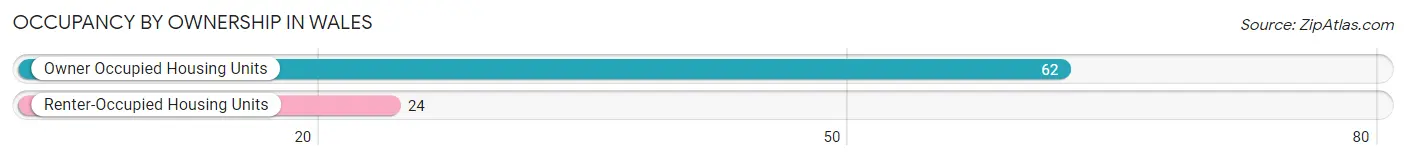
| Occupancy | # Housing Units | % Housing Units |
| Owner Occupied Housing Units | 62 | 72.1% |
| Renter-Occupied Housing Units | 24 | 27.9% |
| Total Occupied Housing Units | 86 | 100.0% |
Occupancy by Household Size in Wales
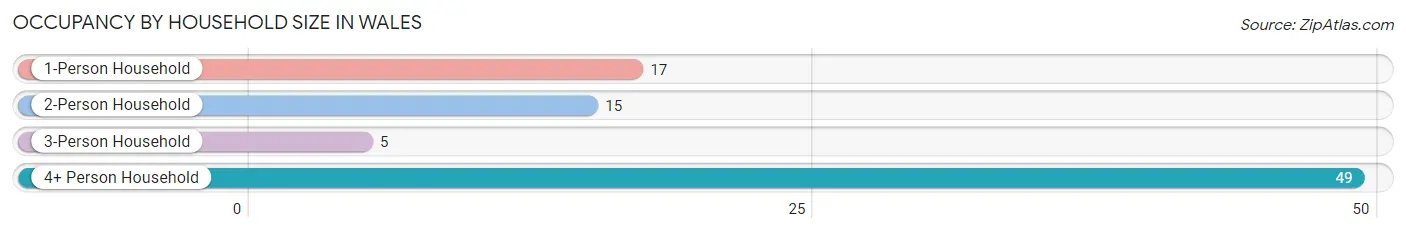
| Household Size | # Housing Units | % Housing Units |
| 1-Person Household | 17 | 19.8% |
| 2-Person Household | 15 | 17.4% |
| 3-Person Household | 5 | 5.8% |
| 4+ Person Household | 49 | 57.0% |
| Total Housing Units | 86 | 100.0% |
Occupancy by Ownership by Household Size in Wales
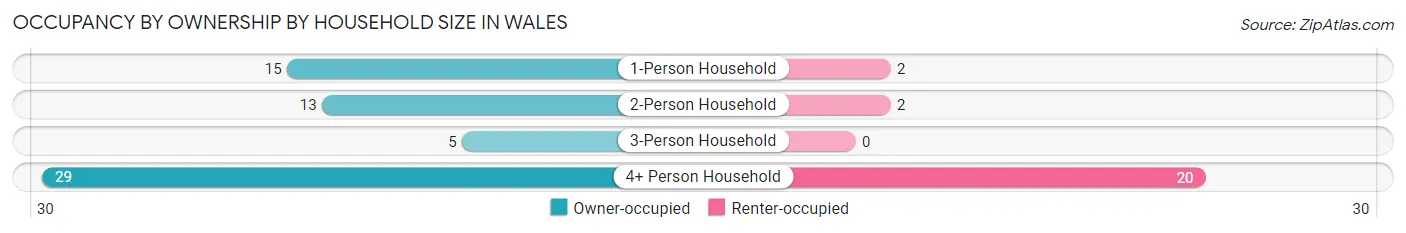
| Household Size | Owner-occupied | Renter-occupied |
| 1-Person Household | 15 (88.2%) | 2 (11.8%) |
| 2-Person Household | 13 (86.7%) | 2 (13.3%) |
| 3-Person Household | 5 (100.0%) | 0 (0.0%) |
| 4+ Person Household | 29 (59.2%) | 20 (40.8%) |
| Total Housing Units | 62 (72.1%) | 24 (27.9%) |
Occupancy by Educational Attainment in Wales
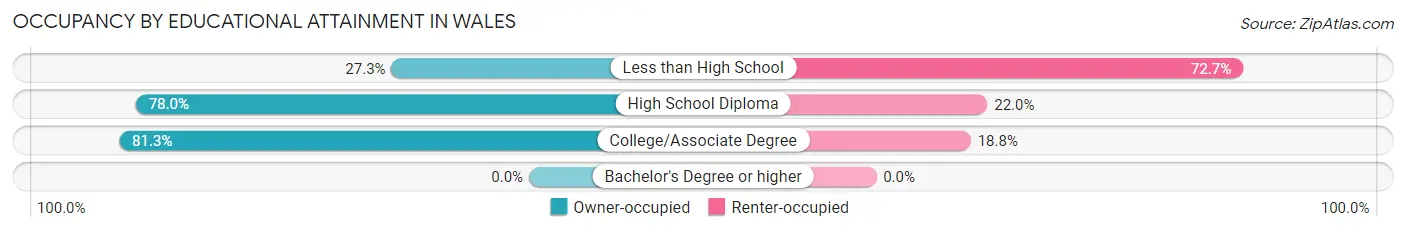
| Household Size | Owner-occupied | Renter-occupied |
| Less than High School | 3 (27.3%) | 8 (72.7%) |
| High School Diploma | 46 (78.0%) | 13 (22.0%) |
| College/Associate Degree | 13 (81.2%) | 3 (18.8%) |
| Bachelor's Degree or higher | 0 (0.0%) | 0 (0.0%) |
Occupancy by Age of Householder in Wales
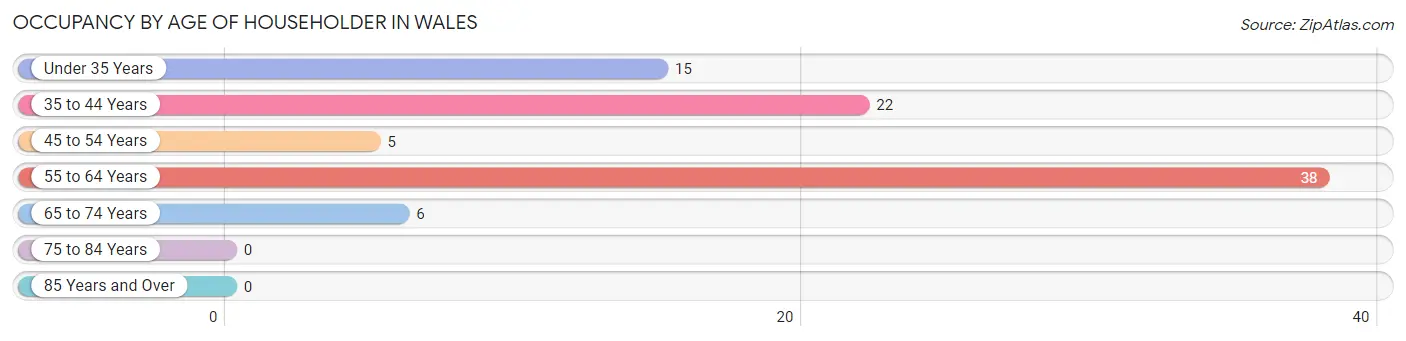
| Age Bracket | # Households | % Households |
| Under 35 Years | 15 | 17.4% |
| 35 to 44 Years | 22 | 25.6% |
| 45 to 54 Years | 5 | 5.8% |
| 55 to 64 Years | 38 | 44.2% |
| 65 to 74 Years | 6 | 7.0% |
| 75 to 84 Years | 0 | 0.0% |
| 85 Years and Over | 0 | 0.0% |
| Total | 86 | 100.0% |
Housing Finances in Wales
Median Income by Occupancy in Wales
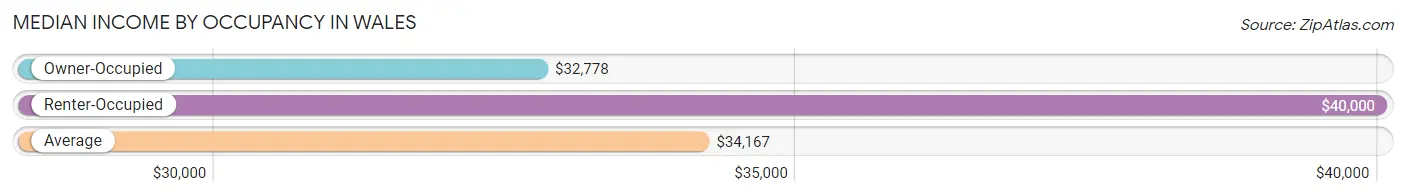
| Occupancy Type | # Households | Median Income |
| Owner-Occupied | 62 (72.1%) | $32,778 |
| Renter-Occupied | 24 (27.9%) | $40,000 |
| Average | 86 (100.0%) | $34,167 |
Occupancy by Householder Income Bracket in Wales
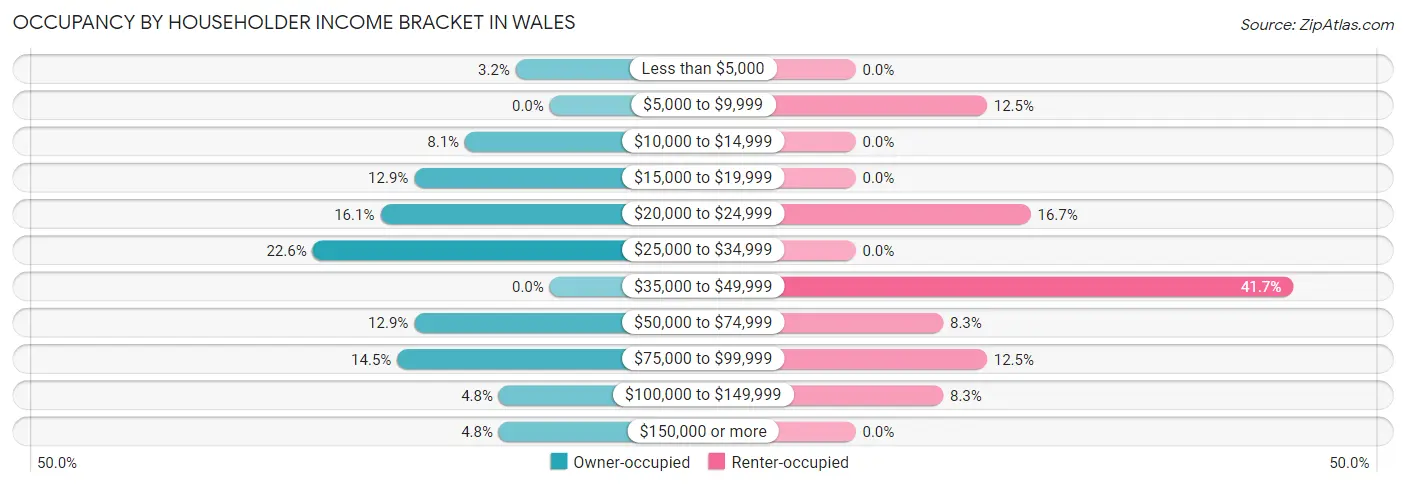
| Income Bracket | Owner-occupied | Renter-occupied |
| Less than $5,000 | 2 (3.2%) | 0 (0.0%) |
| $5,000 to $9,999 | 0 (0.0%) | 3 (12.5%) |
| $10,000 to $14,999 | 5 (8.1%) | 0 (0.0%) |
| $15,000 to $19,999 | 8 (12.9%) | 0 (0.0%) |
| $20,000 to $24,999 | 10 (16.1%) | 4 (16.7%) |
| $25,000 to $34,999 | 14 (22.6%) | 0 (0.0%) |
| $35,000 to $49,999 | 0 (0.0%) | 10 (41.7%) |
| $50,000 to $74,999 | 8 (12.9%) | 2 (8.3%) |
| $75,000 to $99,999 | 9 (14.5%) | 3 (12.5%) |
| $100,000 to $149,999 | 3 (4.8%) | 2 (8.3%) |
| $150,000 or more | 3 (4.8%) | 0 (0.0%) |
| Total | 62 (100.0%) | 24 (100.0%) |
Monthly Housing Cost Tiers in Wales
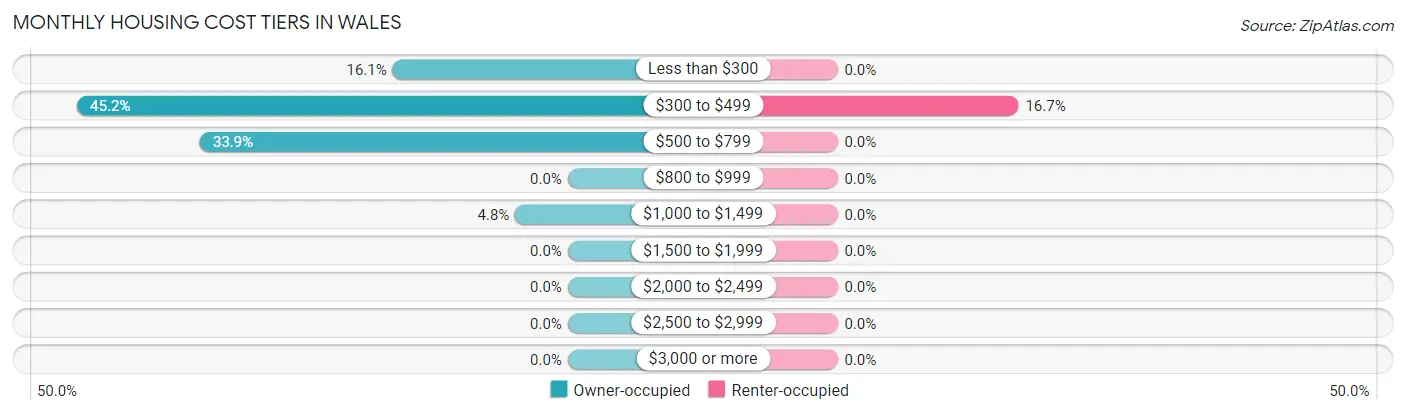
| Monthly Cost | Owner-occupied | Renter-occupied |
| Less than $300 | 10 (16.1%) | 0 (0.0%) |
| $300 to $499 | 28 (45.2%) | 4 (16.7%) |
| $500 to $799 | 21 (33.9%) | 0 (0.0%) |
| $800 to $999 | 0 (0.0%) | 0 (0.0%) |
| $1,000 to $1,499 | 3 (4.8%) | 0 (0.0%) |
| $1,500 to $1,999 | 0 (0.0%) | 0 (0.0%) |
| $2,000 to $2,499 | 0 (0.0%) | 0 (0.0%) |
| $2,500 to $2,999 | 0 (0.0%) | 0 (0.0%) |
| $3,000 or more | 0 (0.0%) | 0 (0.0%) |
| Total | 62 (100.0%) | 24 (100.0%) |
Physical Housing Characteristics in Wales
Housing Structures in Wales
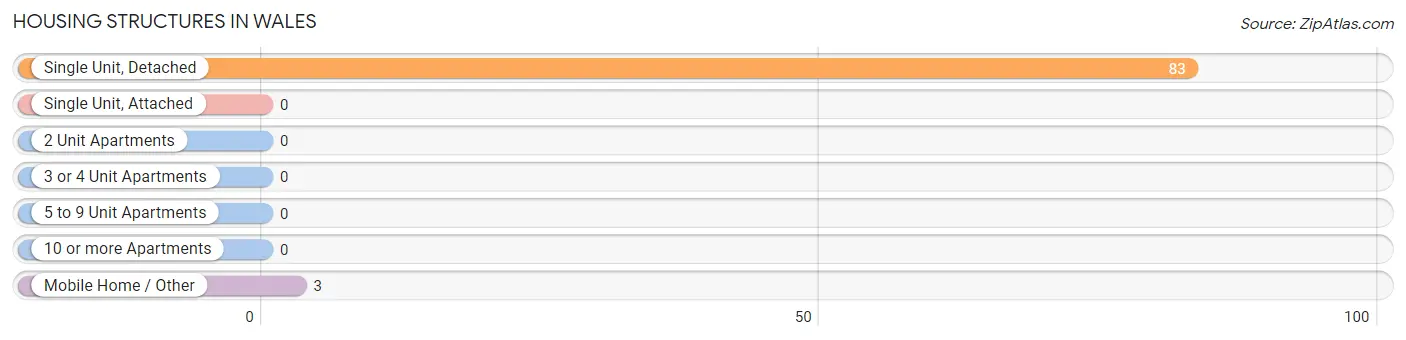
| Structure Type | # Housing Units | % Housing Units |
| Single Unit, Detached | 83 | 96.5% |
| Single Unit, Attached | 0 | 0.0% |
| 2 Unit Apartments | 0 | 0.0% |
| 3 or 4 Unit Apartments | 0 | 0.0% |
| 5 to 9 Unit Apartments | 0 | 0.0% |
| 10 or more Apartments | 0 | 0.0% |
| Mobile Home / Other | 3 | 3.5% |
| Total | 86 | 100.0% |
Housing Structures by Occupancy in Wales
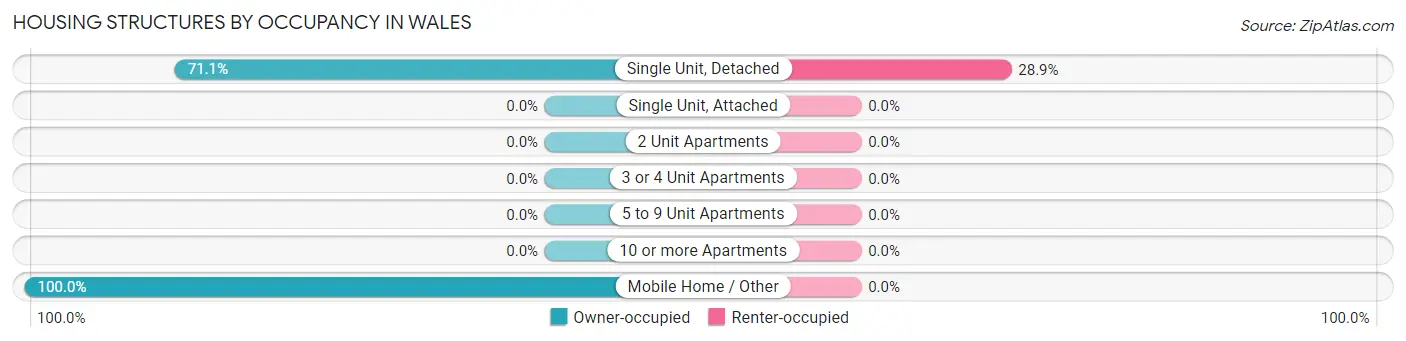
| Structure Type | Owner-occupied | Renter-occupied |
| Single Unit, Detached | 59 (71.1%) | 24 (28.9%) |
| Single Unit, Attached | 0 (0.0%) | 0 (0.0%) |
| 2 Unit Apartments | 0 (0.0%) | 0 (0.0%) |
| 3 or 4 Unit Apartments | 0 (0.0%) | 0 (0.0%) |
| 5 to 9 Unit Apartments | 0 (0.0%) | 0 (0.0%) |
| 10 or more Apartments | 0 (0.0%) | 0 (0.0%) |
| Mobile Home / Other | 3 (100.0%) | 0 (0.0%) |
| Total | 62 (72.1%) | 24 (27.9%) |
Housing Structures by Number of Rooms in Wales
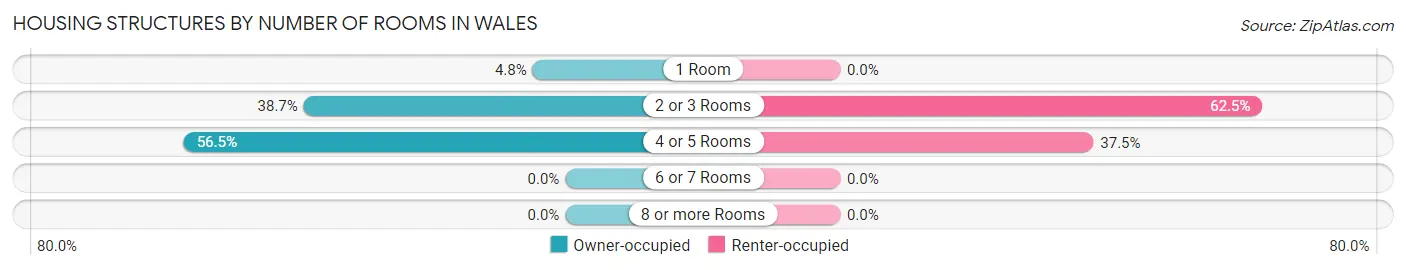
| Number of Rooms | Owner-occupied | Renter-occupied |
| 1 Room | 3 (4.8%) | 0 (0.0%) |
| 2 or 3 Rooms | 24 (38.7%) | 15 (62.5%) |
| 4 or 5 Rooms | 35 (56.5%) | 9 (37.5%) |
| 6 or 7 Rooms | 0 (0.0%) | 0 (0.0%) |
| 8 or more Rooms | 0 (0.0%) | 0 (0.0%) |
| Total | 62 (100.0%) | 24 (100.0%) |
Housing Structure by Heating Type in Wales
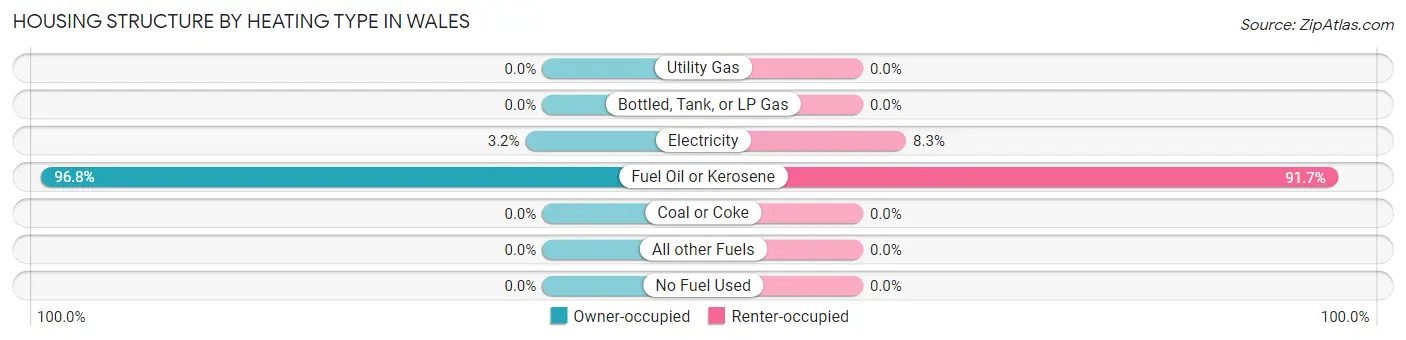
| Heating Type | Owner-occupied | Renter-occupied |
| Utility Gas | 0 (0.0%) | 0 (0.0%) |
| Bottled, Tank, or LP Gas | 0 (0.0%) | 0 (0.0%) |
| Electricity | 2 (3.2%) | 2 (8.3%) |
| Fuel Oil or Kerosene | 60 (96.8%) | 22 (91.7%) |
| Coal or Coke | 0 (0.0%) | 0 (0.0%) |
| All other Fuels | 0 (0.0%) | 0 (0.0%) |
| No Fuel Used | 0 (0.0%) | 0 (0.0%) |
| Total | 62 (100.0%) | 24 (100.0%) |
Household Vehicle Usage in Wales
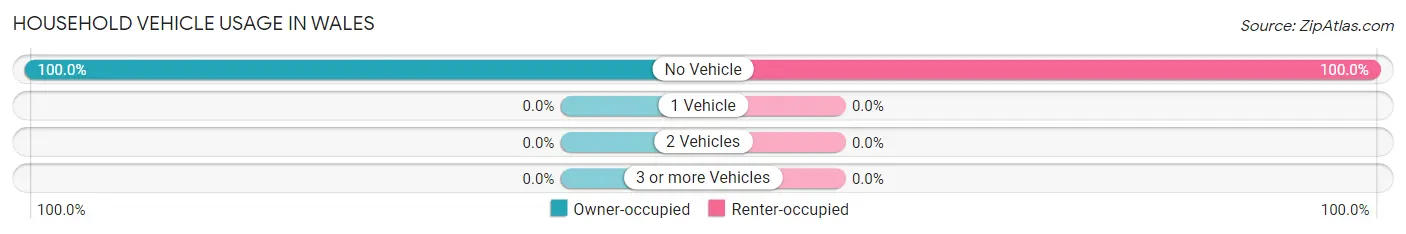
| Vehicles per Household | Owner-occupied | Renter-occupied |
| No Vehicle | 62 (100.0%) | 24 (100.0%) |
| 1 Vehicle | 0 (0.0%) | 0 (0.0%) |
| 2 Vehicles | 0 (0.0%) | 0 (0.0%) |
| 3 or more Vehicles | 0 (0.0%) | 0 (0.0%) |
| Total | 62 (100.0%) | 24 (100.0%) |
Real Estate & Mortgages in Wales
Real Estate and Mortgage Overview in Wales
| Characteristic | Without Mortgage | With Mortgage |
| Housing Units | 52 | 10 |
| Median Property Value | - | - |
| Median Household Income | $28,333 | $3 |
| Monthly Housing Costs | $350 | $0 |
| Real Estate Taxes | - | - |
Property Value by Mortgage Status in Wales
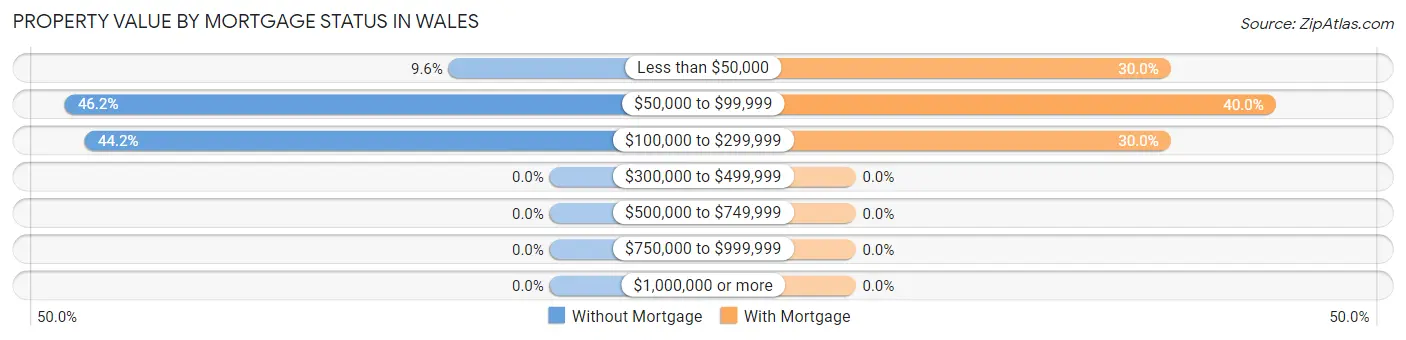
| Property Value | Without Mortgage | With Mortgage |
| Less than $50,000 | 5 (9.6%) | 3 (30.0%) |
| $50,000 to $99,999 | 24 (46.2%) | 4 (40.0%) |
| $100,000 to $299,999 | 23 (44.2%) | 3 (30.0%) |
| $300,000 to $499,999 | 0 (0.0%) | 0 (0.0%) |
| $500,000 to $749,999 | 0 (0.0%) | 0 (0.0%) |
| $750,000 to $999,999 | 0 (0.0%) | 0 (0.0%) |
| $1,000,000 or more | 0 (0.0%) | 0 (0.0%) |
| Total | 52 (100.0%) | 10 (100.0%) |
Household Income by Mortgage Status in Wales
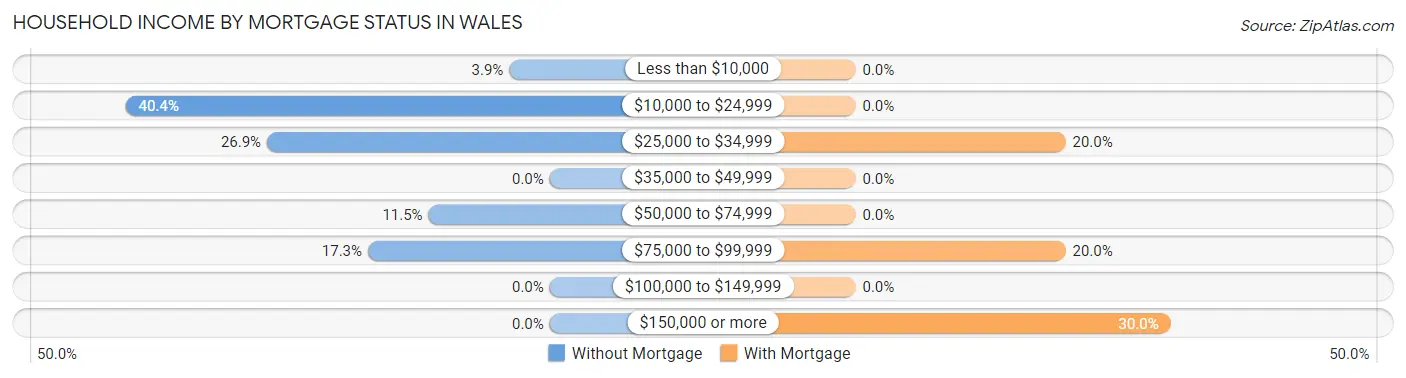
| Household Income | Without Mortgage | With Mortgage |
| Less than $10,000 | 2 (3.8%) | 0 (0.0%) |
| $10,000 to $24,999 | 21 (40.4%) | 0 (0.0%) |
| $25,000 to $34,999 | 14 (26.9%) | 2 (20.0%) |
| $35,000 to $49,999 | 0 (0.0%) | 0 (0.0%) |
| $50,000 to $74,999 | 6 (11.5%) | 0 (0.0%) |
| $75,000 to $99,999 | 9 (17.3%) | 2 (20.0%) |
| $100,000 to $149,999 | 0 (0.0%) | 0 (0.0%) |
| $150,000 or more | 0 (0.0%) | 3 (30.0%) |
| Total | 52 (100.0%) | 10 (100.0%) |
Property Value to Household Income Ratio in Wales
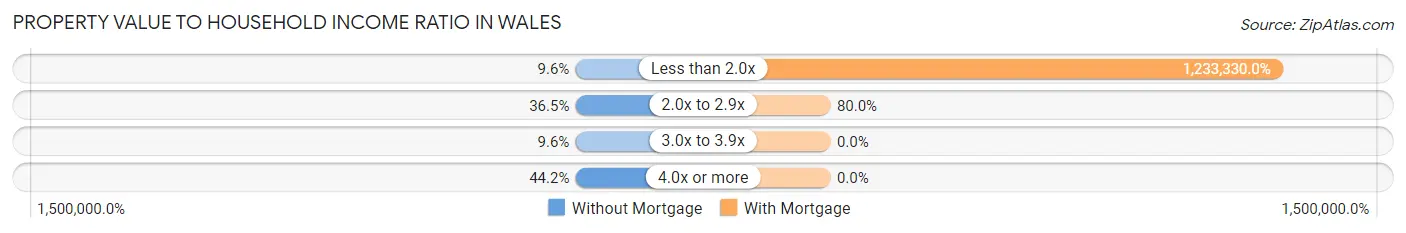
| Value-to-Income Ratio | Without Mortgage | With Mortgage |
| Less than 2.0x | 5 (9.6%) | 123,333 (1,233,330.0%) |
| 2.0x to 2.9x | 19 (36.5%) | 8 (80.0%) |
| 3.0x to 3.9x | 5 (9.6%) | 0 (0.0%) |
| 4.0x or more | 23 (44.2%) | 0 (0.0%) |
| Total | 52 (100.0%) | 10 (100.0%) |
Real Estate Taxes by Mortgage Status in Wales
| Property Taxes | Without Mortgage | With Mortgage |
| Less than $800 | 0 (0.0%) | 0 (0.0%) |
| $800 to $1,499 | 0 (0.0%) | 0 (0.0%) |
| $800 to $1,499 | 0 (0.0%) | 0 (0.0%) |
| Total | 52 (100.0%) | 10 (100.0%) |
Health & Disability in Wales
Health Insurance Coverage by Age in Wales
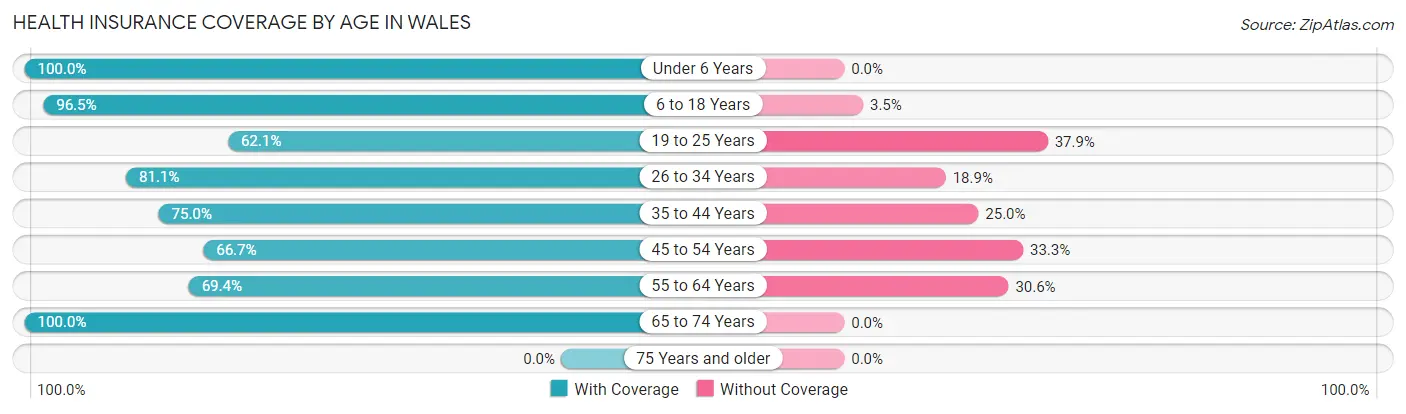
| Age Bracket | With Coverage | Without Coverage |
| Under 6 Years | 44 (100.0%) | 0 (0.0%) |
| 6 to 18 Years | 83 (96.5%) | 3 (3.5%) |
| 19 to 25 Years | 18 (62.1%) | 11 (37.9%) |
| 26 to 34 Years | 30 (81.1%) | 7 (18.9%) |
| 35 to 44 Years | 24 (75.0%) | 8 (25.0%) |
| 45 to 54 Years | 6 (66.7%) | 3 (33.3%) |
| 55 to 64 Years | 34 (69.4%) | 15 (30.6%) |
| 65 to 74 Years | 8 (100.0%) | 0 (0.0%) |
| 75 Years and older | 0 (0.0%) | 0 (0.0%) |
| Total | 247 (84.0%) | 47 (16.0%) |
Health Insurance Coverage by Citizenship Status in Wales
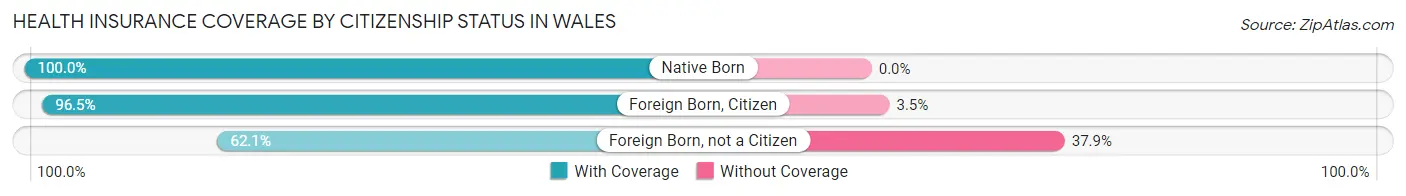
| Citizenship Status | With Coverage | Without Coverage |
| Native Born | 44 (100.0%) | 0 (0.0%) |
| Foreign Born, Citizen | 83 (96.5%) | 3 (3.5%) |
| Foreign Born, not a Citizen | 18 (62.1%) | 11 (37.9%) |
Health Insurance Coverage by Household Income in Wales
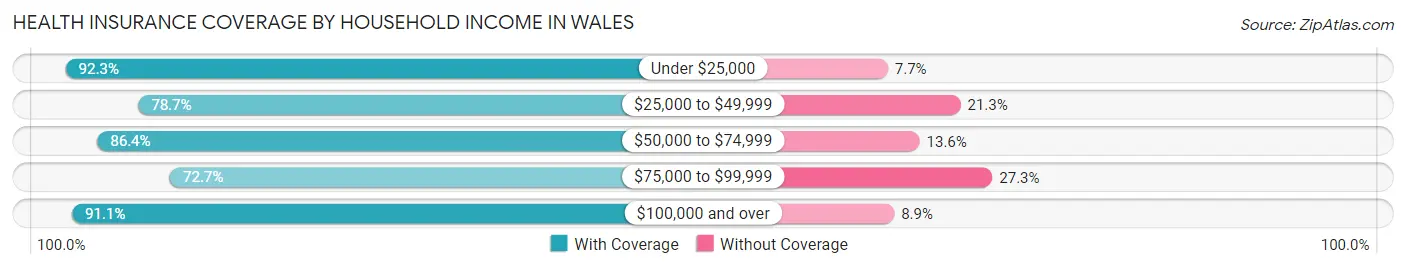
| Household Income | With Coverage | Without Coverage |
| Under $25,000 | 72 (92.3%) | 6 (7.7%) |
| $25,000 to $49,999 | 48 (78.7%) | 13 (21.3%) |
| $50,000 to $74,999 | 38 (86.4%) | 6 (13.6%) |
| $75,000 to $99,999 | 48 (72.7%) | 18 (27.3%) |
| $100,000 and over | 41 (91.1%) | 4 (8.9%) |
Public vs Private Health Insurance Coverage by Age in Wales
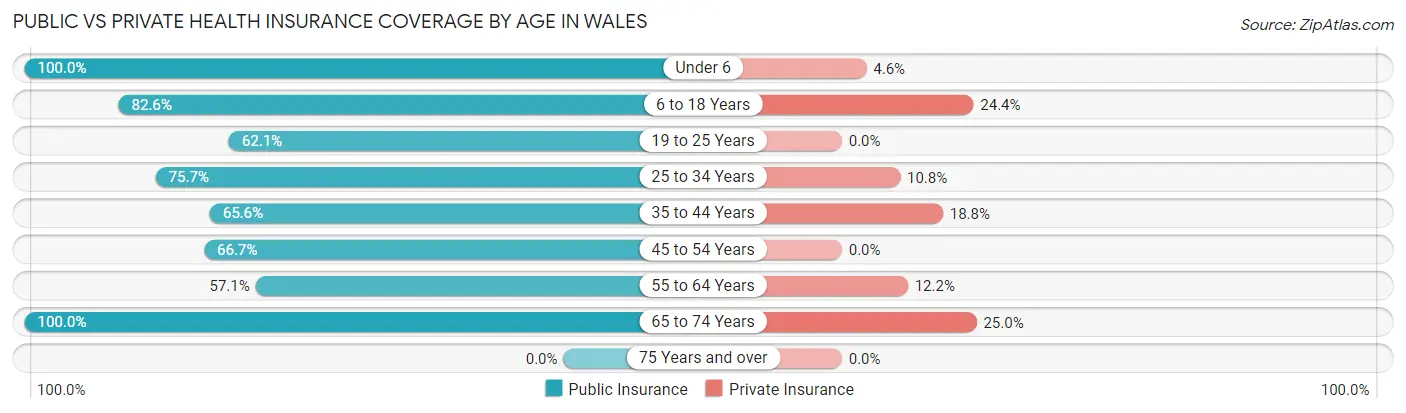
| Age Bracket | Public Insurance | Private Insurance |
| Under 6 | 44 (100.0%) | 2 (4.5%) |
| 6 to 18 Years | 71 (82.6%) | 21 (24.4%) |
| 19 to 25 Years | 18 (62.1%) | 0 (0.0%) |
| 25 to 34 Years | 28 (75.7%) | 4 (10.8%) |
| 35 to 44 Years | 21 (65.6%) | 6 (18.8%) |
| 45 to 54 Years | 6 (66.7%) | 0 (0.0%) |
| 55 to 64 Years | 28 (57.1%) | 6 (12.2%) |
| 65 to 74 Years | 8 (100.0%) | 2 (25.0%) |
| 75 Years and over | 0 (0.0%) | 0 (0.0%) |
| Total | 224 (76.2%) | 41 (14.0%) |
Disability Status by Sex by Age in Wales
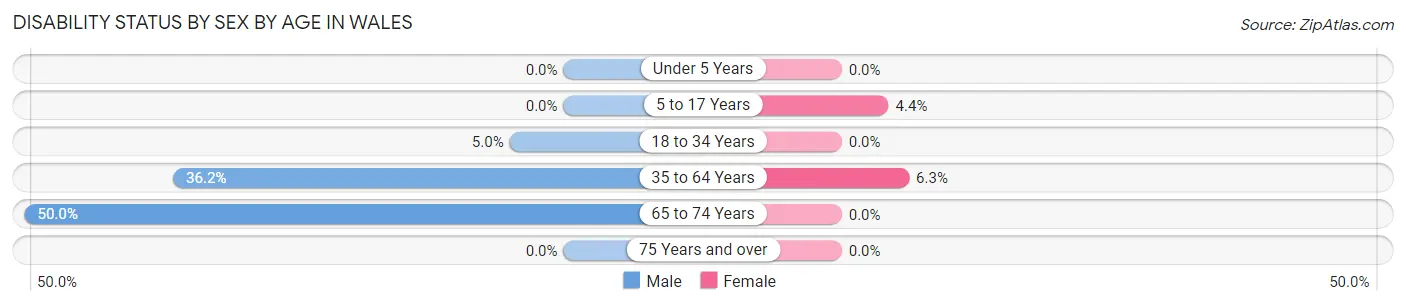
| Age Bracket | Male | Female |
| Under 5 Years | 0 (0.0%) | 0 (0.0%) |
| 5 to 17 Years | 0 (0.0%) | 2 (4.3%) |
| 18 to 34 Years | 2 (5.0%) | 0 (0.0%) |
| 35 to 64 Years | 21 (36.2%) | 2 (6.2%) |
| 65 to 74 Years | 4 (50.0%) | 0 (0.0%) |
| 75 Years and over | 0 (0.0%) | 0 (0.0%) |
Disability Class by Sex by Age in Wales
Disability Class: Hearing Difficulty
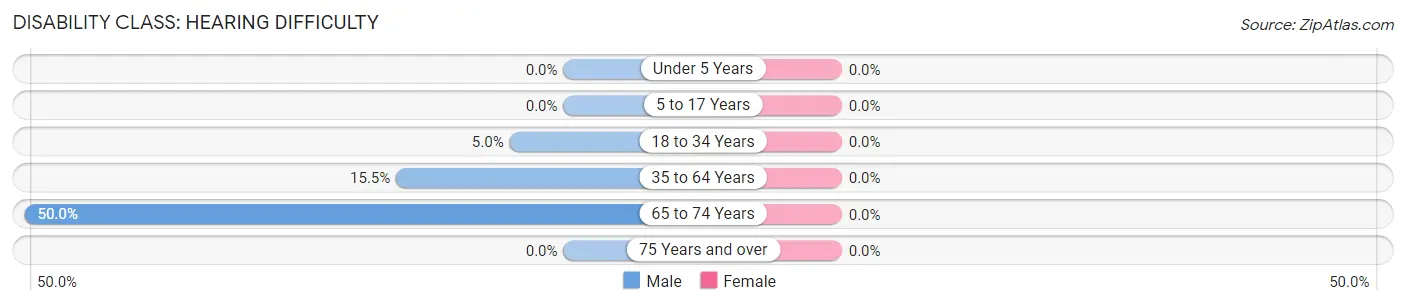
| Age Bracket | Male | Female |
| Under 5 Years | 0 (0.0%) | 0 (0.0%) |
| 5 to 17 Years | 0 (0.0%) | 0 (0.0%) |
| 18 to 34 Years | 2 (5.0%) | 0 (0.0%) |
| 35 to 64 Years | 9 (15.5%) | 0 (0.0%) |
| 65 to 74 Years | 4 (50.0%) | 0 (0.0%) |
| 75 Years and over | 0 (0.0%) | 0 (0.0%) |
Disability Class: Vision Difficulty
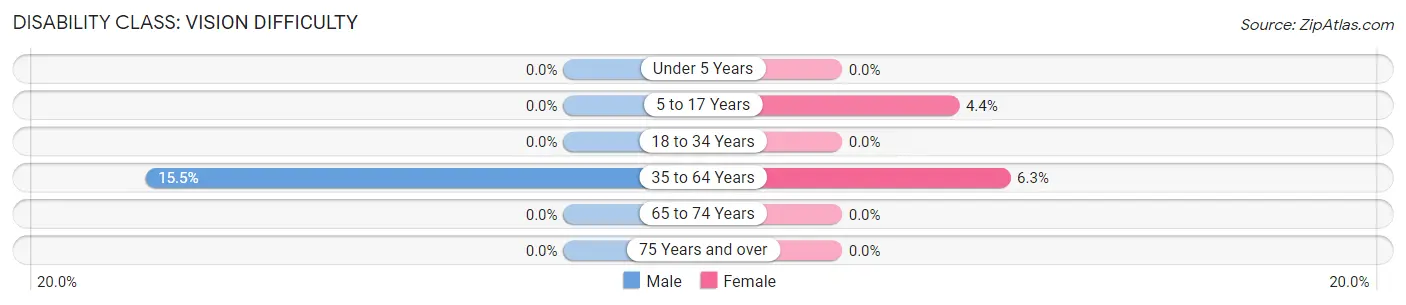
| Age Bracket | Male | Female |
| Under 5 Years | 0 (0.0%) | 0 (0.0%) |
| 5 to 17 Years | 0 (0.0%) | 2 (4.3%) |
| 18 to 34 Years | 0 (0.0%) | 0 (0.0%) |
| 35 to 64 Years | 9 (15.5%) | 2 (6.2%) |
| 65 to 74 Years | 0 (0.0%) | 0 (0.0%) |
| 75 Years and over | 0 (0.0%) | 0 (0.0%) |
Disability Class: Cognitive Difficulty
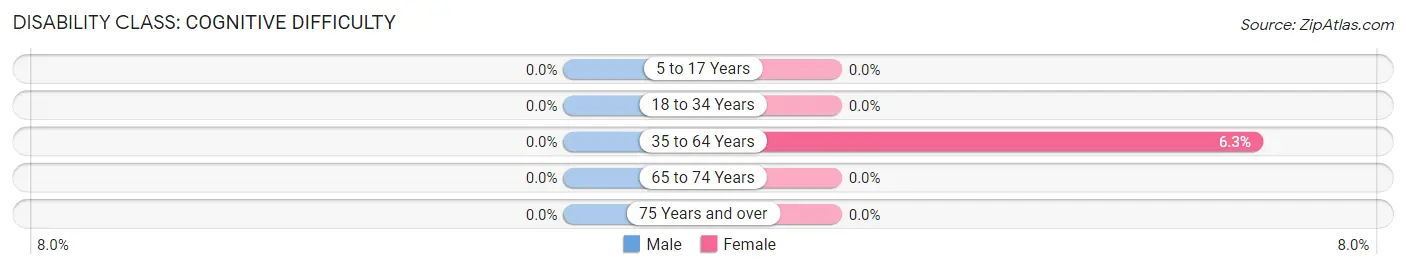
| Age Bracket | Male | Female |
| 5 to 17 Years | 0 (0.0%) | 0 (0.0%) |
| 18 to 34 Years | 0 (0.0%) | 0 (0.0%) |
| 35 to 64 Years | 0 (0.0%) | 2 (6.2%) |
| 65 to 74 Years | 0 (0.0%) | 0 (0.0%) |
| 75 Years and over | 0 (0.0%) | 0 (0.0%) |
Disability Class: Ambulatory Difficulty
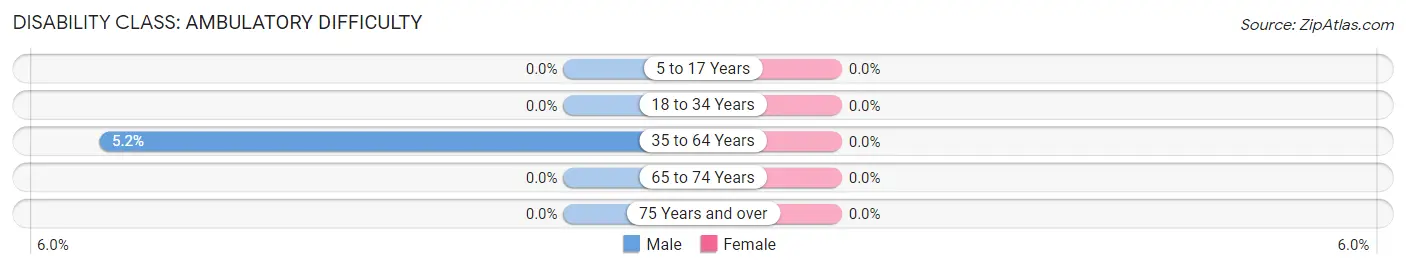
| Age Bracket | Male | Female |
| 5 to 17 Years | 0 (0.0%) | 0 (0.0%) |
| 18 to 34 Years | 0 (0.0%) | 0 (0.0%) |
| 35 to 64 Years | 3 (5.2%) | 0 (0.0%) |
| 65 to 74 Years | 0 (0.0%) | 0 (0.0%) |
| 75 Years and over | 0 (0.0%) | 0 (0.0%) |
Disability Class: Self-Care Difficulty
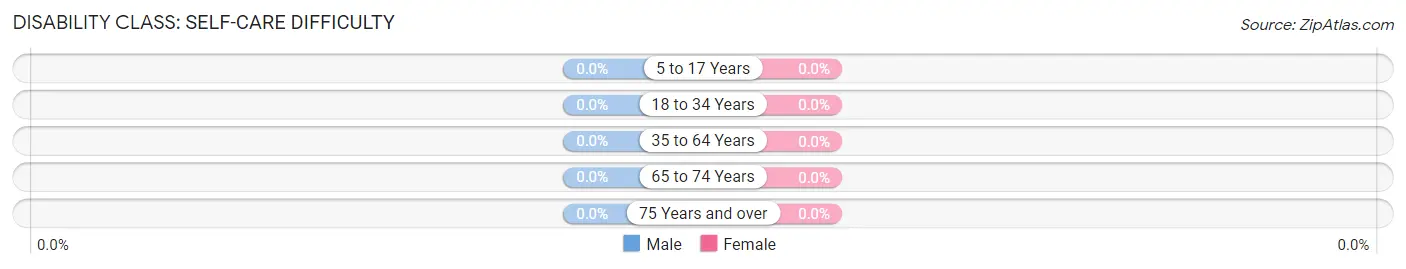
| Age Bracket | Male | Female |
| 5 to 17 Years | 0 (0.0%) | 0 (0.0%) |
| 18 to 34 Years | 0 (0.0%) | 0 (0.0%) |
| 35 to 64 Years | 0 (0.0%) | 0 (0.0%) |
| 65 to 74 Years | 0 (0.0%) | 0 (0.0%) |
| 75 Years and over | 0 (0.0%) | 0 (0.0%) |
Technology Access in Wales
Computing Device Access in Wales
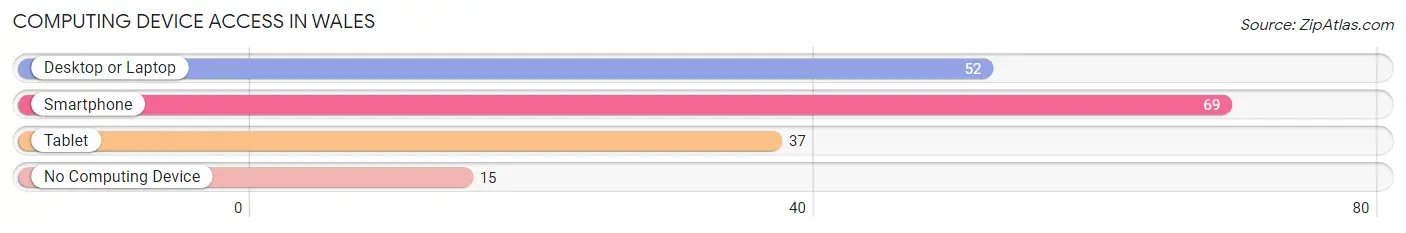
| Device Type | # Households | % Households |
| Desktop or Laptop | 52 | 60.5% |
| Smartphone | 69 | 80.2% |
| Tablet | 37 | 43.0% |
| No Computing Device | 15 | 17.4% |
| Total | 86 | 100.0% |
Internet Access in Wales
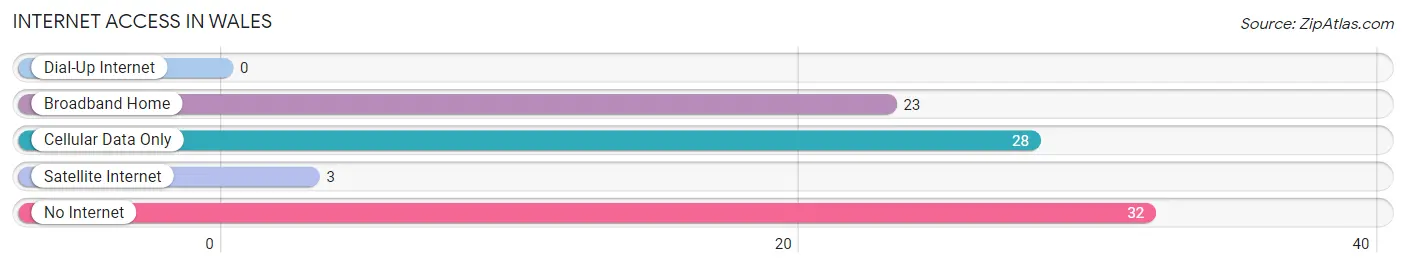
| Internet Type | # Households | % Households |
| Dial-Up Internet | 0 | 0.0% |
| Broadband Home | 23 | 26.7% |
| Cellular Data Only | 28 | 32.6% |
| Satellite Internet | 3 | 3.5% |
| No Internet | 32 | 37.2% |
| Total | 86 | 100.0% |
Wales Summary
Wales is a country located in the United Kingdom, and is part of the island of Great Britain. It is bordered by England to the east, the Irish Sea to the north and west, and the Bristol Channel to the south. Wales has a population of approximately 3.1 million people, and is the third-largest country in the United Kingdom.
Geography
Wales is a mountainous country, with the highest peak being Snowdon at 1,085 metres (3,560 ft). The country is divided into three distinct regions: North Wales, Mid Wales, and South Wales. North Wales is the most mountainous region, with the highest peaks in Snowdonia National Park. Mid Wales is a more rural area, with rolling hills and valleys. South Wales is the most populous region, and is home to the cities of Cardiff, Swansea, and Newport.
The climate in Wales is temperate, with mild winters and warm summers. Rainfall is common throughout the year, and snow is rare.
Economy
The economy of Wales is largely based on services, with the largest sector being finance and insurance. Other important sectors include manufacturing, retail, and tourism. Wales is also home to a number of large companies, including the Welsh Government, BT Group, and Admiral Group.
The Welsh Government is responsible for the economic development of Wales, and has implemented a number of initiatives to promote economic growth. These include the Welsh Development Agency, which provides grants and loans to businesses, and the Welsh Assembly Government, which provides funding for infrastructure projects.
Demographics
The population of Wales is approximately 3.1 million people, with the majority of the population living in the South Wales region. The largest cities in Wales are Cardiff, Swansea, and Newport.
The majority of the population is of Welsh descent, with the largest minority group being English. Other minority groups include Irish, Scottish, and Asian.
The official language of Wales is English, although Welsh is also spoken by a significant minority of the population.
Religion is an important part of Welsh culture, with the majority of the population being Christian. Other religions practiced in Wales include Islam, Hinduism, and Judaism.
Conclusion
Wales is a country located in the United Kingdom, and is part of the island of Great Britain. It is bordered by England to the east, the Irish Sea to the north and west, and the Bristol Channel to the south. Wales has a population of approximately 3.1 million people, and is the third-largest country in the United Kingdom. The economy of Wales is largely based on services, with the largest sector being finance and insurance. The majority of the population is of Welsh descent, with the largest minority group being English. Religion is an important part of Welsh culture, with the majority of the population being Christian.
Common Questions
What is Per Capita Income in Wales?
Per Capita income in Wales is $12,759.
What is the Median Family Income in Wales?
Median Family Income in Wales is $34,432.
What is the Median Household income in Wales?
Median Household Income in Wales is $34,167.
What is Income or Wage Gap in Wales?
Income or Wage Gap in Wales is 2.5%.
Women in Wales earn 97.5 cents for every dollar earned by a man.
What is Family Income Deficit in Wales?
Family Income Deficit in Wales is $14,989.
Families that are below poverty line in Wales earn $14,989 less on average than the poverty threshold level.
What is Inequality or Gini Index in Wales?
Inequality or Gini Index in Wales is 0.42.
What is the Total Population of Wales?
Total Population of Wales is 294.
What is the Total Male Population of Wales?
Total Male Population of Wales is 176.
What is the Total Female Population of Wales?
Total Female Population of Wales is 118.
What is the Ratio of Males per 100 Females in Wales?
There are 149.15 Males per 100 Females in Wales.
What is the Ratio of Females per 100 Males in Wales?
There are 67.05 Females per 100 Males in Wales.
What is the Median Population Age in Wales?
Median Population Age in Wales is 24.0 Years.
What is the Average Family Size in Wales
Average Family Size in Wales is 3.6 People.
What is the Average Household Size in Wales
Average Household Size in Wales is 3.4 People.
How Large is the Labor Force in Wales?
There are 116 People in the Labor Forcein in Wales.
What is the Percentage of People in the Labor Force in Wales?
64.4% of People are in the Labor Force in Wales.
What is the Unemployment Rate in Wales?
Unemployment Rate in Wales is 14.7%.