Venetie, AK Map & Demographics
Venetie Map
Venetie Overview
$23,398
PER CAPITA INCOME
$59,688
AVG FAMILY INCOME
$58,281
AVG HOUSEHOLD INCOME
0.40
INEQUALITY / GINI INDEX
109
TOTAL POPULATION
58
MALE POPULATION
51
FEMALE POPULATION
113.73
MALES / 100 FEMALES
87.93
FEMALES / 100 MALES
25.6
MEDIAN AGE
2.9
AVG FAMILY SIZE
2.8
AVG HOUSEHOLD SIZE
44
LABOR FORCE [ PEOPLE ]
51.8%
PERCENT IN LABOR FORCE
6.8%
UNEMPLOYMENT RATE
Venetie Zip Codes
Venetie Area Codes
Income in Venetie
Income Overview in Venetie
Per Capita Income in Venetie is $23,398, while median incomes of families and households are $59,688 and $58,281 respectively.
| Characteristic | Number | Measure |
| Per Capita Income | 109 | $23,398 |
| Median Family Income | 29 | $59,688 |
| Mean Family Income | 29 | $56,752 |
| Median Household Income | 39 | $58,281 |
| Mean Household Income | 39 | $51,523 |
| Income Deficit | 29 | $0 |
| Wage / Income Gap (%) | 109 | 0.00% |
| Wage / Income Gap ($) | 109 | 100.00¢ per $1 |
| Gini / Inequality Index | 109 | 0.40 |
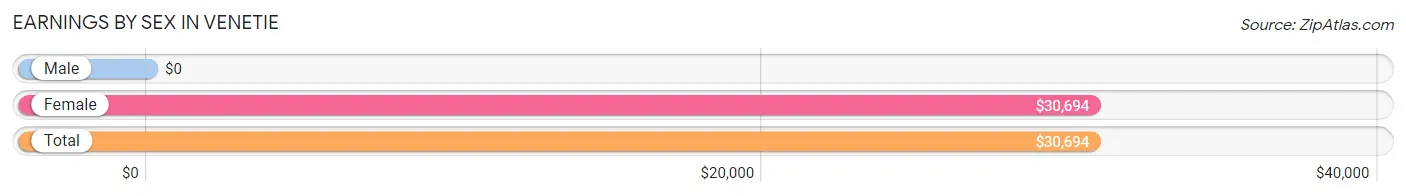
Earnings by Sex in Venetie
| Sex | Number | Average Earnings |
| Male | 28 (50.9%) | $0 |
| Female | 27 (49.1%) | $30,694 |
| Total | 55 (100.0%) | $30,694 |
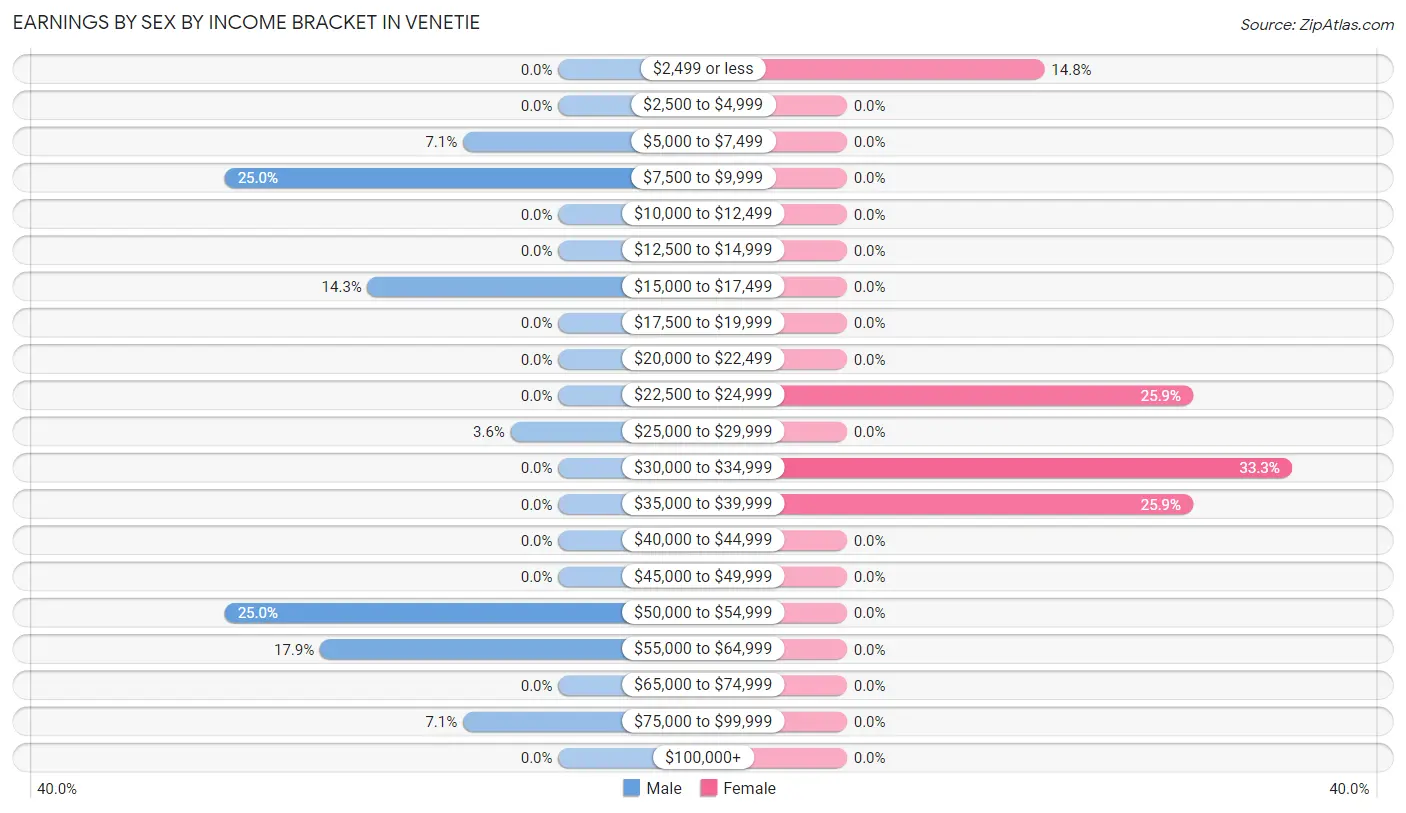
Earnings by Sex by Income Bracket in Venetie
The most common earnings brackets in Venetie are $7,500 to $9,999 for men (7 | 25.0%) and $30,000 to $34,999 for women (9 | 33.3%).
| Income | Male | Female |
| $2,499 or less | 0 (0.0%) | 4 (14.8%) |
| $2,500 to $4,999 | 0 (0.0%) | 0 (0.0%) |
| $5,000 to $7,499 | 2 (7.1%) | 0 (0.0%) |
| $7,500 to $9,999 | 7 (25.0%) | 0 (0.0%) |
| $10,000 to $12,499 | 0 (0.0%) | 0 (0.0%) |
| $12,500 to $14,999 | 0 (0.0%) | 0 (0.0%) |
| $15,000 to $17,499 | 4 (14.3%) | 0 (0.0%) |
| $17,500 to $19,999 | 0 (0.0%) | 0 (0.0%) |
| $20,000 to $22,499 | 0 (0.0%) | 0 (0.0%) |
| $22,500 to $24,999 | 0 (0.0%) | 7 (25.9%) |
| $25,000 to $29,999 | 1 (3.6%) | 0 (0.0%) |
| $30,000 to $34,999 | 0 (0.0%) | 9 (33.3%) |
| $35,000 to $39,999 | 0 (0.0%) | 7 (25.9%) |
| $40,000 to $44,999 | 0 (0.0%) | 0 (0.0%) |
| $45,000 to $49,999 | 0 (0.0%) | 0 (0.0%) |
| $50,000 to $54,999 | 7 (25.0%) | 0 (0.0%) |
| $55,000 to $64,999 | 5 (17.9%) | 0 (0.0%) |
| $65,000 to $74,999 | 0 (0.0%) | 0 (0.0%) |
| $75,000 to $99,999 | 2 (7.1%) | 0 (0.0%) |
| $100,000+ | 0 (0.0%) | 0 (0.0%) |
| Total | 28 (100.0%) | 27 (100.0%) |
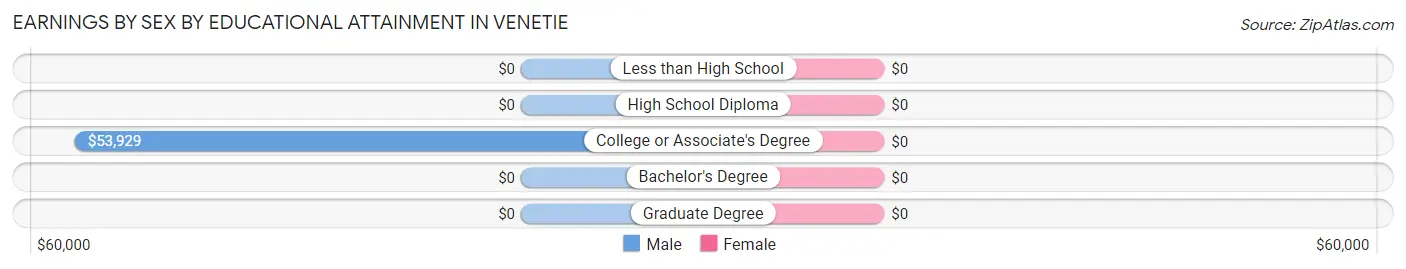
Earnings by Sex by Educational Attainment in Venetie
| Educational Attainment | Male Income | Female Income |
| Less than High School | - | - |
| High School Diploma | - | - |
| College or Associate's Degree | $53,929 | $0 |
| Bachelor's Degree | - | - |
| Graduate Degree | - | - |
| Total | $53,750 | $0 |
Family Income in Venetie
Family Income Brackets in Venetie
According to the Venetie family income data, there are 9 families falling into the $50,000 to $74,999 income range, which is the most common income bracket and makes up 31.0% of all families.

| Income Bracket | # Families | % Families |
| Less than $10,000 | 3 | 10.3% |
| $10,000 to $14,999 | 3 | 10.3% |
| $15,000 to $24,999 | 1 | 3.4% |
| $25,000 to $34,999 | 4 | 13.8% |
| $35,000 to $49,999 | 0 | 0.0% |
| $50,000 to $74,999 | 9 | 31.0% |
| $75,000 to $99,999 | 2 | 6.9% |
| $100,000 to $149,999 | 7 | 24.1% |
| $150,000 to $199,999 | 0 | 0.0% |
| $200,000+ | 0 | 0.0% |
Family Income by Famaliy Size in Venetie
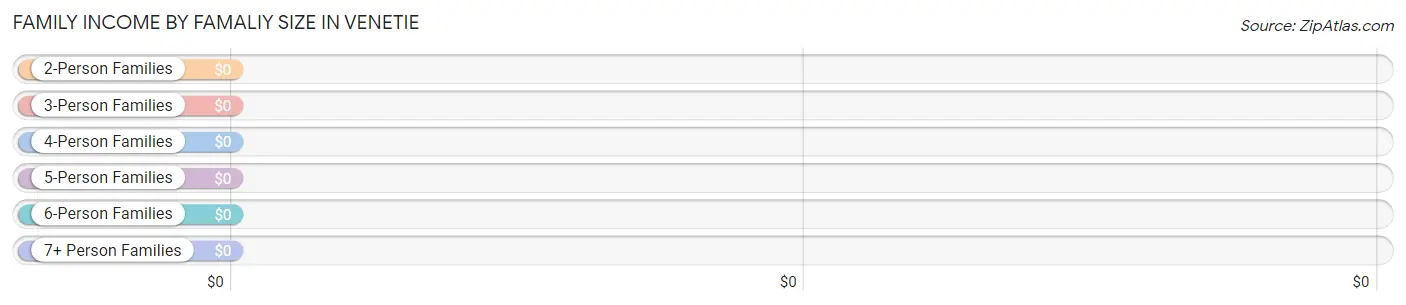
| Income Bracket | # Families | Median Income |
| 2-Person Families | 17 (58.6%) | $0 |
| 3-Person Families | 9 (31.0%) | $0 |
| 4-Person Families | 3 (10.3%) | $0 |
| 5-Person Families | 0 (0.0%) | $0 |
| 6-Person Families | 0 (0.0%) | $0 |
| 7+ Person Families | 0 (0.0%) | $0 |
| Total | 29 (100.0%) | $59,688 |
Family Income by Number of Earners in Venetie
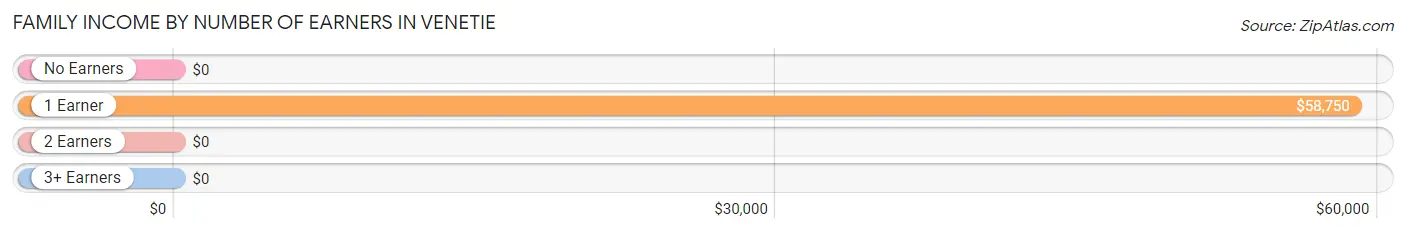
| Number of Earners | # Families | Median Income |
| No Earners | 4 (13.8%) | $0 |
| 1 Earner | 18 (62.1%) | $58,750 |
| 2 Earners | 7 (24.1%) | $0 |
| 3+ Earners | 0 (0.0%) | $0 |
| Total | 29 (100.0%) | $59,688 |
Household Income in Venetie
Household Income Brackets in Venetie
With 16 households falling in the category, the $50,000 to $74,999 income range is the most frequent in Venetie, accounting for 41.0% of all households.
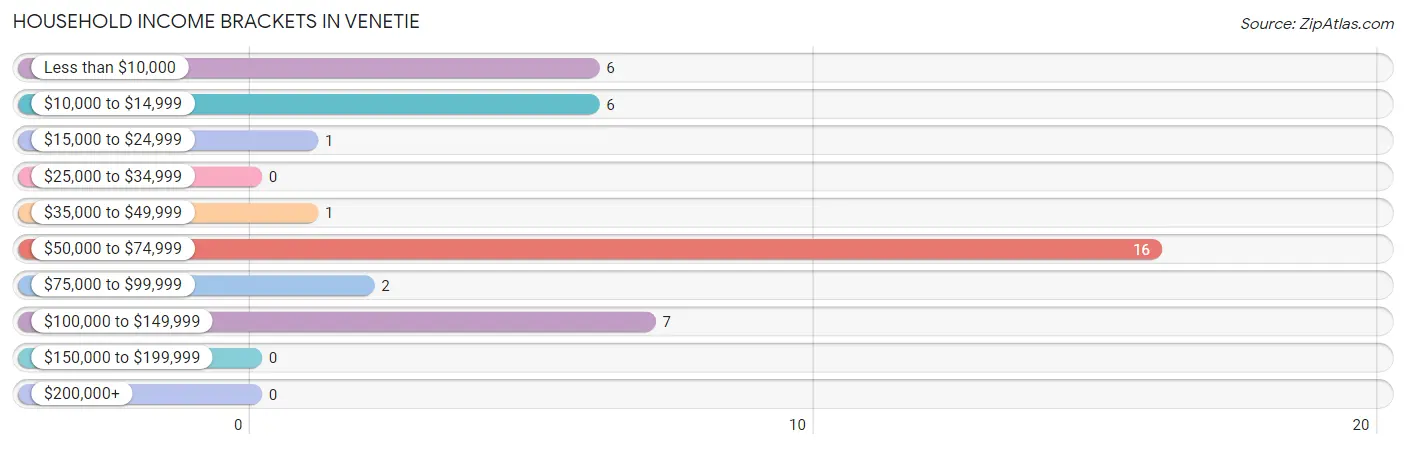
| Income Bracket | # Households | % Households |
| Less than $10,000 | 6 | 15.4% |
| $10,000 to $14,999 | 6 | 15.4% |
| $15,000 to $24,999 | 1 | 2.6% |
| $25,000 to $34,999 | 0 | 0.0% |
| $35,000 to $49,999 | 1 | 2.6% |
| $50,000 to $74,999 | 16 | 41.0% |
| $75,000 to $99,999 | 2 | 5.1% |
| $100,000 to $149,999 | 7 | 17.9% |
| $150,000 to $199,999 | 0 | 0.0% |
| $200,000+ | 0 | 0.0% |
Household Income by Householder Age in Venetie
The median household income in Venetie is $58,281, with the highest median household income of $107,857 found in the 65+ years age bracket for the primary householder. A total of 12 households (30.8%) fall into this category. Meanwhile, the 15 to 24 years age bracket for the primary householder has the lowest median household income of $0, with 7 households (17.9%) in this group.
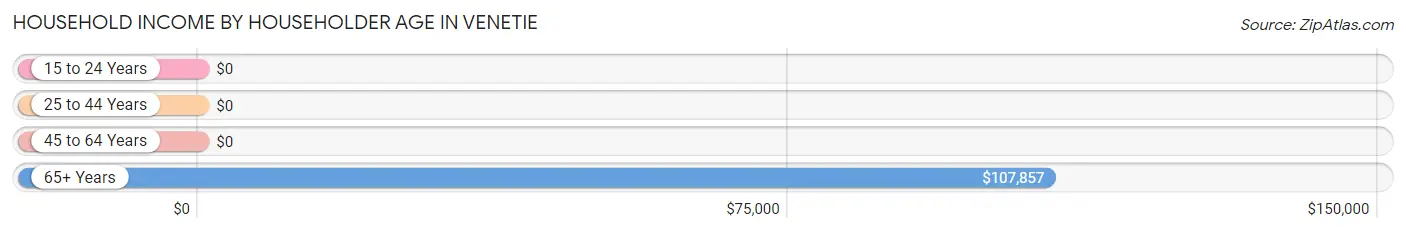
| Income Bracket | # Households | Median Income |
| 15 to 24 Years | 7 (17.9%) | $0 |
| 25 to 44 Years | 12 (30.8%) | $0 |
| 45 to 64 Years | 8 (20.5%) | $0 |
| 65+ Years | 12 (30.8%) | $107,857 |
| Total | 39 (100.0%) | $58,281 |
Poverty in Venetie
Income Below Poverty by Sex and Age in Venetie
With 36.2% poverty level for males and 17.6% for females among the residents of Venetie, 6 to 11 year old males and 16 and 17 year old females are the most vulnerable to poverty, with 4 males (100.0%) and 3 females (100.0%) in their respective age groups living below the poverty level.
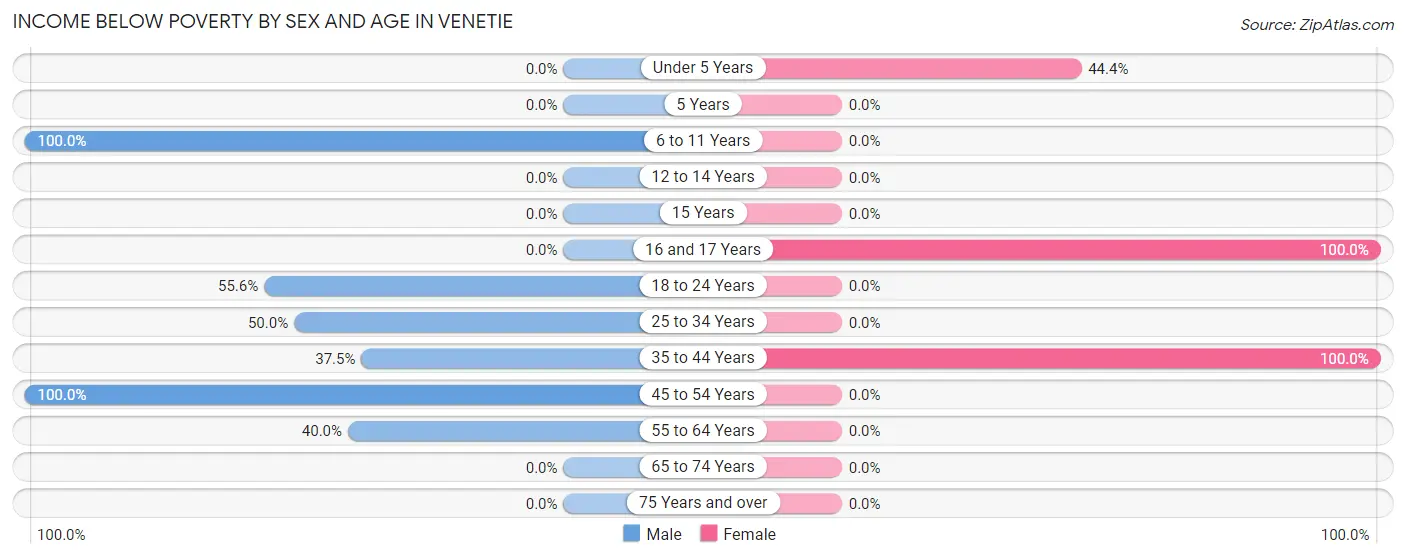
| Age Bracket | Male | Female |
| Under 5 Years | 0 (0.0%) | 4 (44.4%) |
| 5 Years | 0 (0.0%) | 0 (0.0%) |
| 6 to 11 Years | 4 (100.0%) | 0 (0.0%) |
| 12 to 14 Years | 0 (0.0%) | 0 (0.0%) |
| 15 Years | 0 (0.0%) | 0 (0.0%) |
| 16 and 17 Years | 0 (0.0%) | 3 (100.0%) |
| 18 to 24 Years | 5 (55.6%) | 0 (0.0%) |
| 25 to 34 Years | 4 (50.0%) | 0 (0.0%) |
| 35 to 44 Years | 3 (37.5%) | 2 (100.0%) |
| 45 to 54 Years | 3 (100.0%) | 0 (0.0%) |
| 55 to 64 Years | 2 (40.0%) | 0 (0.0%) |
| 65 to 74 Years | 0 (0.0%) | 0 (0.0%) |
| 75 Years and over | 0 (0.0%) | 0 (0.0%) |
| Total | 21 (36.2%) | 9 (17.6%) |
Income Above Poverty by Sex and Age in Venetie
According to the poverty statistics in Venetie, males aged 12 to 14 years and females aged 6 to 11 years are the age groups that are most secure financially, with 100.0% of males and 100.0% of females in these age groups living above the poverty line.
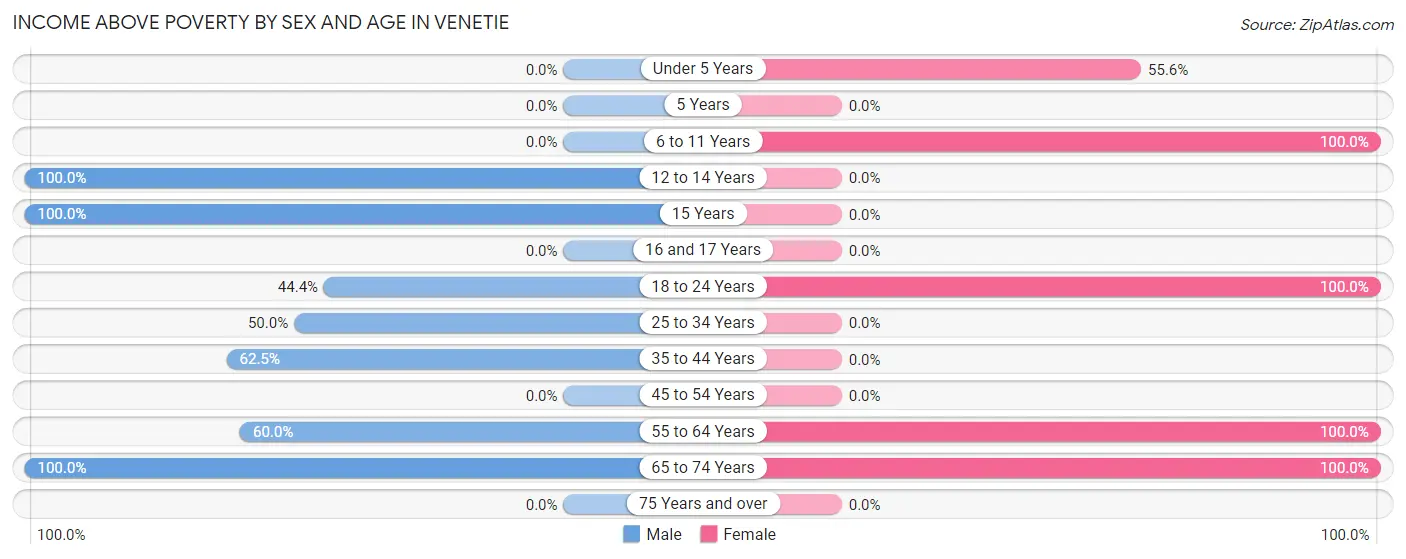
| Age Bracket | Male | Female |
| Under 5 Years | 0 (0.0%) | 5 (55.6%) |
| 5 Years | 0 (0.0%) | 0 (0.0%) |
| 6 to 11 Years | 0 (0.0%) | 6 (100.0%) |
| 12 to 14 Years | 3 (100.0%) | 0 (0.0%) |
| 15 Years | 2 (100.0%) | 0 (0.0%) |
| 16 and 17 Years | 0 (0.0%) | 0 (0.0%) |
| 18 to 24 Years | 4 (44.4%) | 16 (100.0%) |
| 25 to 34 Years | 4 (50.0%) | 0 (0.0%) |
| 35 to 44 Years | 5 (62.5%) | 0 (0.0%) |
| 45 to 54 Years | 0 (0.0%) | 0 (0.0%) |
| 55 to 64 Years | 3 (60.0%) | 3 (100.0%) |
| 65 to 74 Years | 16 (100.0%) | 12 (100.0%) |
| 75 Years and over | 0 (0.0%) | 0 (0.0%) |
| Total | 37 (63.8%) | 42 (82.4%) |
Income Below Poverty Among Married-Couple Families in Venetie
| Children | Above Poverty | Below Poverty |
| No Children | 11 (100.0%) | 0 (0.0%) |
| 1 or 2 Children | 2 (100.0%) | 0 (0.0%) |
| 3 or 4 Children | 0 (0.0%) | 0 (0.0%) |
| 5 or more Children | 0 (0.0%) | 0 (0.0%) |
| Total | 13 (100.0%) | 0 (0.0%) |
Income Below Poverty Among Single-Parent Households in Venetie
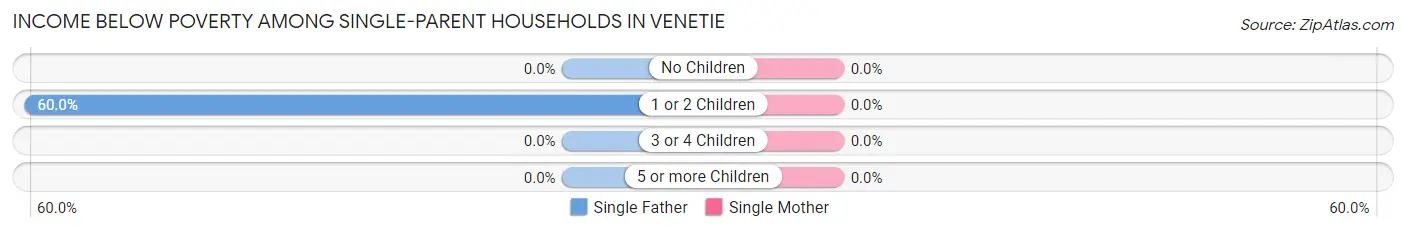
| Children | Single Father | Single Mother |
| No Children | 0 (0.0%) | 0 (0.0%) |
| 1 or 2 Children | 6 (60.0%) | 0 (0.0%) |
| 3 or 4 Children | 0 (0.0%) | 0 (0.0%) |
| 5 or more Children | 0 (0.0%) | 0 (0.0%) |
| Total | 6 (40.0%) | 0 (0.0%) |
Income Below Poverty Among Married-Couple vs Single-Parent Households in Venetie
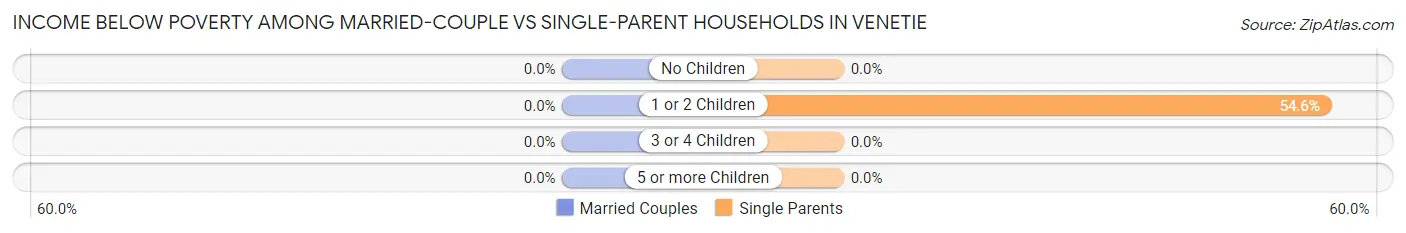
| Children | Married-Couple Families | Single-Parent Households |
| No Children | 0 (0.0%) | 0 (0.0%) |
| 1 or 2 Children | 0 (0.0%) | 6 (54.5%) |
| 3 or 4 Children | 0 (0.0%) | 0 (0.0%) |
| 5 or more Children | 0 (0.0%) | 0 (0.0%) |
| Total | 0 (0.0%) | 6 (37.5%) |
Race in Venetie
The most populous races in Venetie are Native / Alaskan (97 | 89.0%), Hispanic or Latino (9 | 8.3%), and Some other Race (9 | 8.3%).
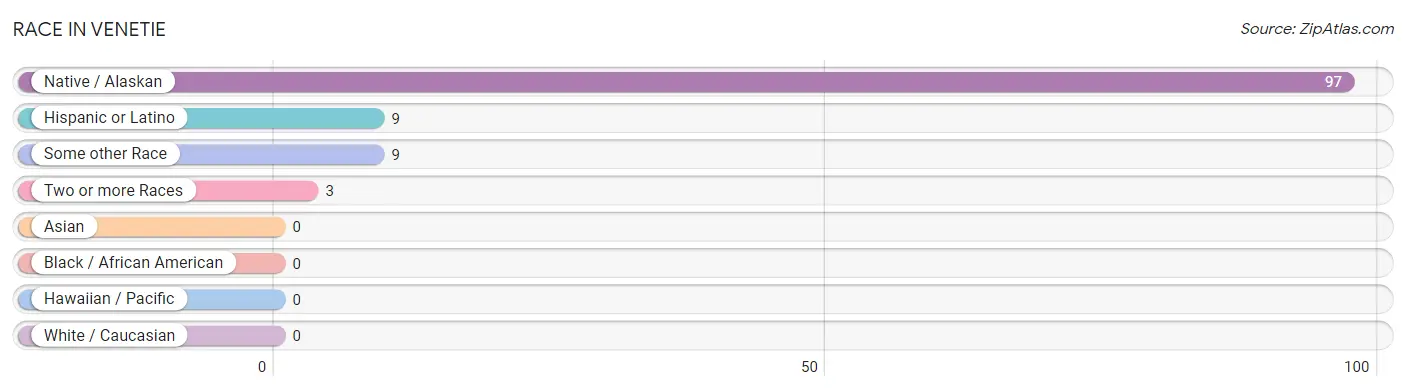
| Race | # Population | % Population |
| Asian | 0 | 0.0% |
| Black / African American | 0 | 0.0% |
| Hawaiian / Pacific | 0 | 0.0% |
| Hispanic or Latino | 9 | 8.3% |
| Native / Alaskan | 97 | 89.0% |
| White / Caucasian | 0 | 0.0% |
| Two or more Races | 3 | 2.8% |
| Some other Race | 9 | 8.3% |
| Total | 109 | 100.0% |
Ancestry in Venetie
The most populous ancestries reported in Venetie are Alaskan Athabascan (85 | 78.0%), Yup'ik (8 | 7.3%), and Inupiat (7 | 6.4%), together accounting for 91.7% of all Venetie residents.
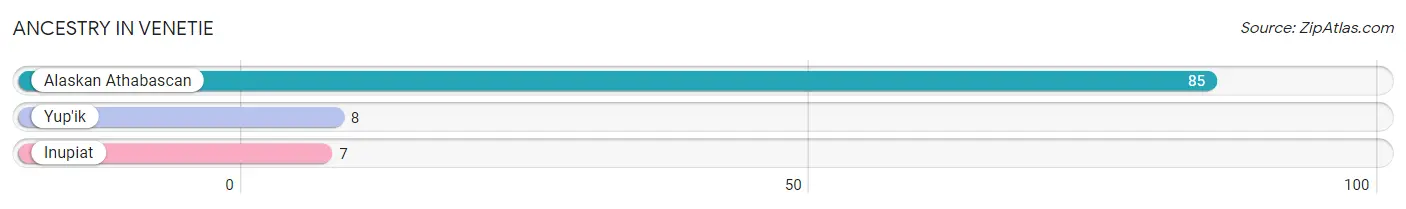
| Ancestry | # Population | % Population |
| Alaskan Athabascan | 85 | 78.0% |
| Inupiat | 7 | 6.4% |
| Yup'ik | 8 | 7.3% | View All 3 Rows |
Immigrants in Venetie

| Immigration Origin | # Population | % Population | View All 0 Rows |
Sex and Age in Venetie
Sex and Age in Venetie
The most populous age groups in Venetie are 65 to 69 Years (16 | 27.6%) for men and 20 to 24 Years (16 | 31.4%) for women.
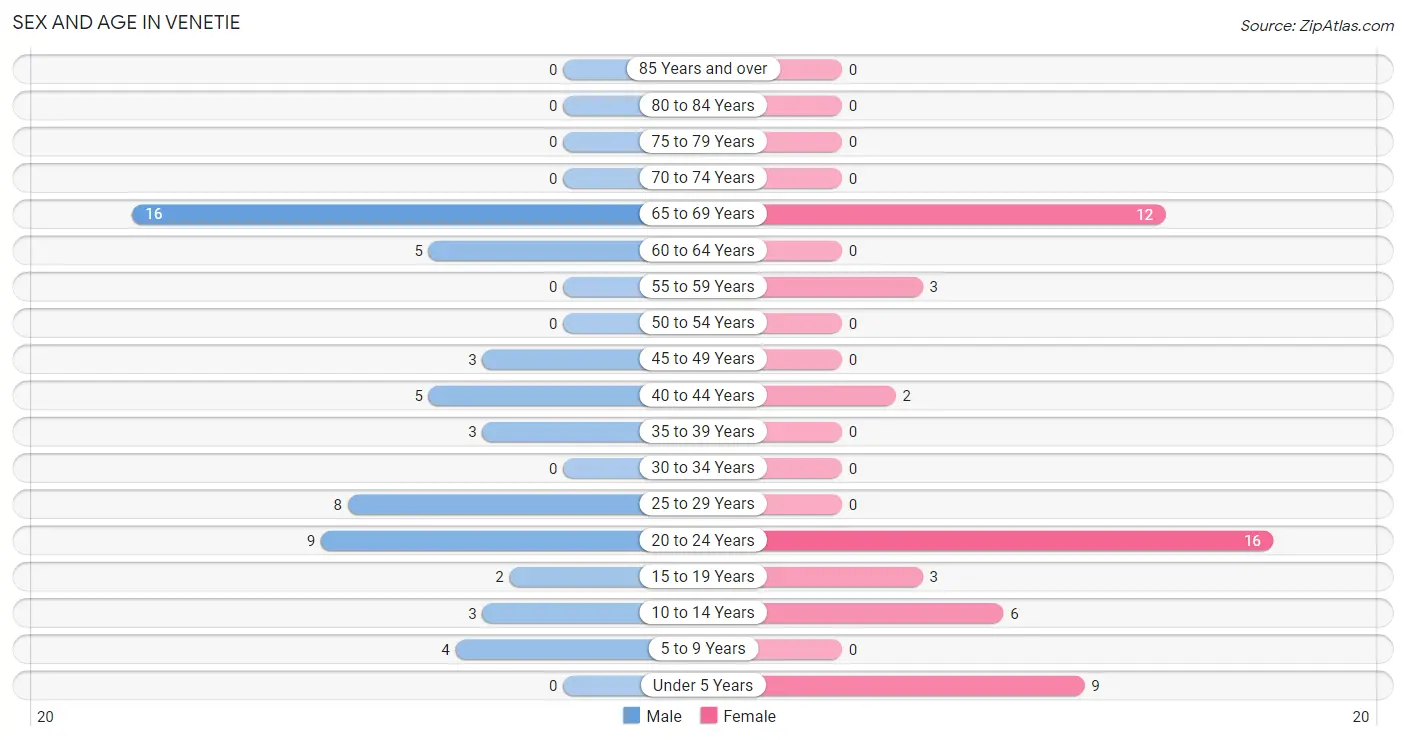
| Age Bracket | Male | Female |
| Under 5 Years | 0 (0.0%) | 9 (17.6%) |
| 5 to 9 Years | 4 (6.9%) | 0 (0.0%) |
| 10 to 14 Years | 3 (5.2%) | 6 (11.8%) |
| 15 to 19 Years | 2 (3.5%) | 3 (5.9%) |
| 20 to 24 Years | 9 (15.5%) | 16 (31.4%) |
| 25 to 29 Years | 8 (13.8%) | 0 (0.0%) |
| 30 to 34 Years | 0 (0.0%) | 0 (0.0%) |
| 35 to 39 Years | 3 (5.2%) | 0 (0.0%) |
| 40 to 44 Years | 5 (8.6%) | 2 (3.9%) |
| 45 to 49 Years | 3 (5.2%) | 0 (0.0%) |
| 50 to 54 Years | 0 (0.0%) | 0 (0.0%) |
| 55 to 59 Years | 0 (0.0%) | 3 (5.9%) |
| 60 to 64 Years | 5 (8.6%) | 0 (0.0%) |
| 65 to 69 Years | 16 (27.6%) | 12 (23.5%) |
| 70 to 74 Years | 0 (0.0%) | 0 (0.0%) |
| 75 to 79 Years | 0 (0.0%) | 0 (0.0%) |
| 80 to 84 Years | 0 (0.0%) | 0 (0.0%) |
| 85 Years and over | 0 (0.0%) | 0 (0.0%) |
| Total | 58 (100.0%) | 51 (100.0%) |
Families and Households in Venetie
Median Family Size in Venetie
The median family size in Venetie is 2.86 persons per family, with single female/mother families (1 | 3.5%) accounting for the largest median family size of 7 persons per family. On the other hand, married-couple families (13 | 44.8%) represent the smallest median family size with 2.62 persons per family.
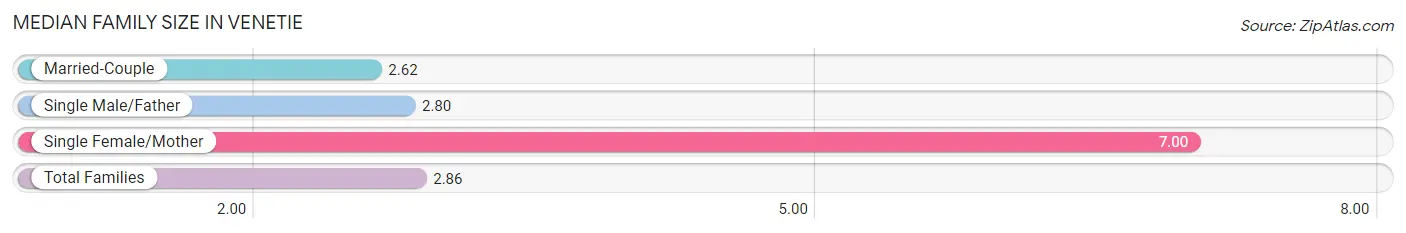
| Family Type | # Families | Family Size |
| Married-Couple | 13 (44.8%) | 2.62 |
| Single Male/Father | 15 (51.7%) | 2.80 |
| Single Female/Mother | 1 (3.5%) | 7.00 |
| Total Families | 29 (100.0%) | 2.86 |
Median Household Size in Venetie
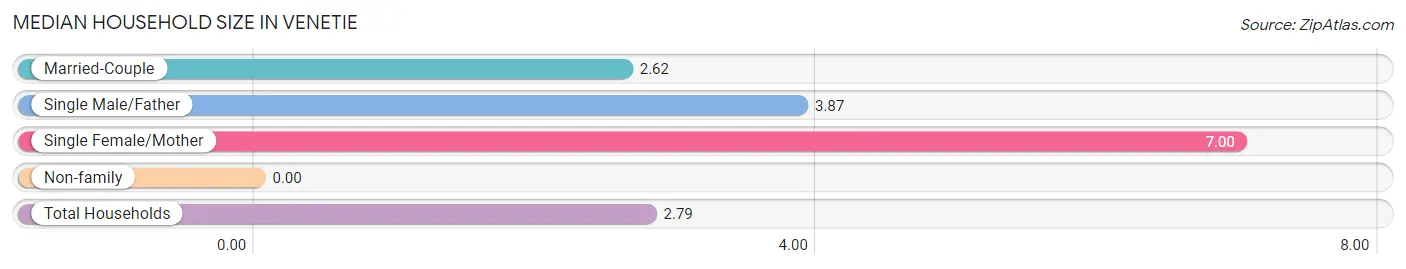
| Household Type | # Households | Household Size |
| Married-Couple | 13 (33.3%) | 2.62 |
| Single Male/Father | 15 (38.5%) | 3.87 |
| Single Female/Mother | 1 (2.6%) | 7.00 |
| Non-family | 10 (25.6%) | - |
| Total Households | 39 (100.0%) | 2.79 |
Household Size by Marriage Status in Venetie
Out of a total of 39 households in Venetie, 29 (74.4%) are family households, while 10 (25.6%) are nonfamily households. The most numerous type of family households are 2-person households, comprising 17, and the most common type of nonfamily households are 1-person households, comprising 10.
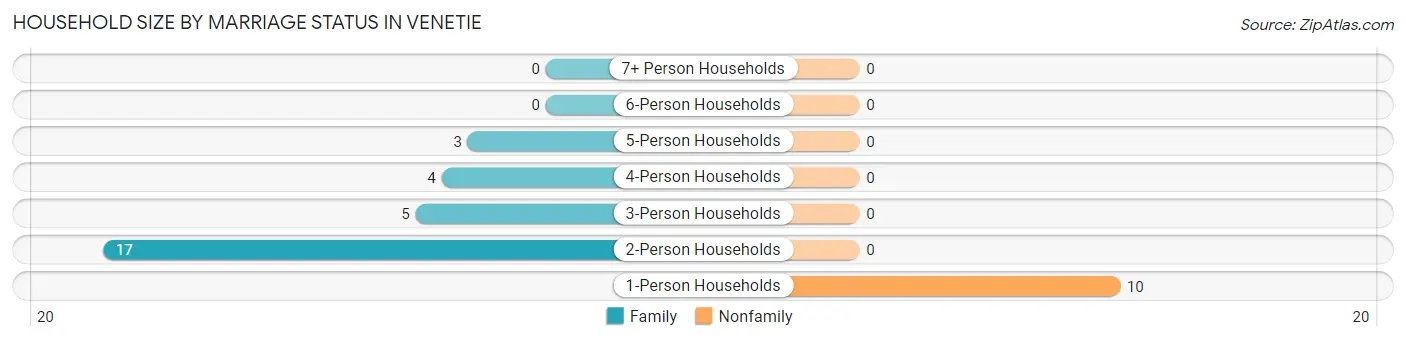
| Household Size | Family Households | Nonfamily Households |
| 1-Person Households | - | 10 (25.6%) |
| 2-Person Households | 17 (43.6%) | 0 (0.0%) |
| 3-Person Households | 5 (12.8%) | 0 (0.0%) |
| 4-Person Households | 4 (10.3%) | 0 (0.0%) |
| 5-Person Households | 3 (7.7%) | 0 (0.0%) |
| 6-Person Households | 0 (0.0%) | 0 (0.0%) |
| 7+ Person Households | 0 (0.0%) | 0 (0.0%) |
| Total | 29 (74.4%) | 10 (25.6%) |
Female Fertility in Venetie
Fertility by Age in Venetie
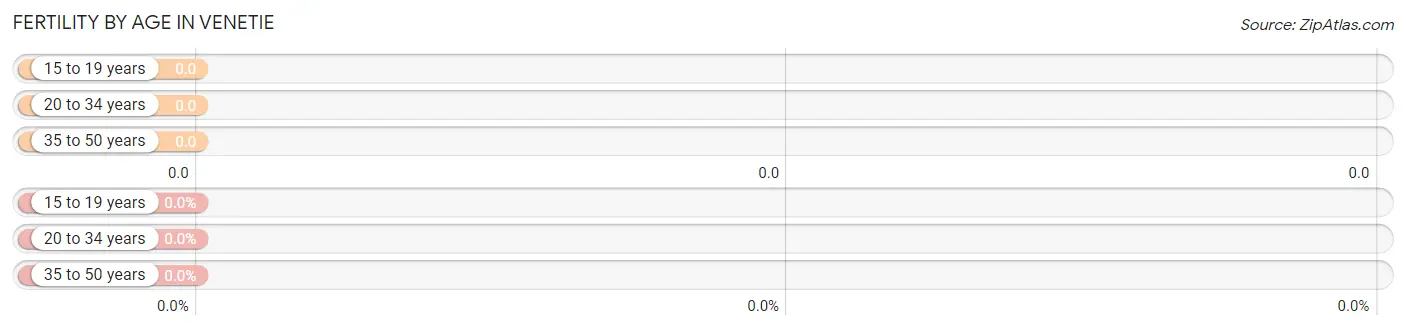
| Age Bracket | Women with Births | Births / 1,000 Women |
| 15 to 19 years | 0 (0.0%) | 0.0 |
| 20 to 34 years | 0 (0.0%) | 0.0 |
| 35 to 50 years | 0 (0.0%) | 0.0 |
| Total | 0 (0.0%) | 0.0 |
Fertility by Age by Marriage Status in Venetie
| Age Bracket | Married | Unmarried |
| 15 to 19 years | 0 (0.0%) | 0 (0.0%) |
| 20 to 34 years | 0 (0.0%) | 0 (0.0%) |
| 35 to 50 years | 0 (0.0%) | 0 (0.0%) |
| Total | 0 (0.0%) | 0 (0.0%) |
Fertility by Education in Venetie
| Educational Attainment | Women with Births | Births / 1,000 Women |
| Less than High School | 0 (0.0%) | 0.0 |
| High School Diploma | 0 (0.0%) | 0.0 |
| College or Associate's Degree | 0 (0.0%) | 0.0 |
| Bachelor's Degree | 0 (0.0%) | 0.0 |
| Graduate Degree | 0 (0.0%) | 0.0 |
| Total | 0 (0.0%) | 0.0 |
Fertility by Education by Marriage Status in Venetie
| Educational Attainment | Married | Unmarried |
| Less than High School | 0 (0.0%) | 0 (0.0%) |
| High School Diploma | 0 (0.0%) | 0 (0.0%) |
| College or Associate's Degree | 0 (0.0%) | 0 (0.0%) |
| Bachelor's Degree | 0 (0.0%) | 0 (0.0%) |
| Graduate Degree | 0 (0.0%) | 0 (0.0%) |
| Total | 0 (0.0%) | 0 (0.0%) |
Employment Characteristics in Venetie
Employment by Class of Employer in Venetie
Among the 41 employed individuals in Venetie, local government employees (28 | 68.3%), federal government employees (9 | 22.0%), and private company employees (4 | 9.8%) make up the most common classes of employment.
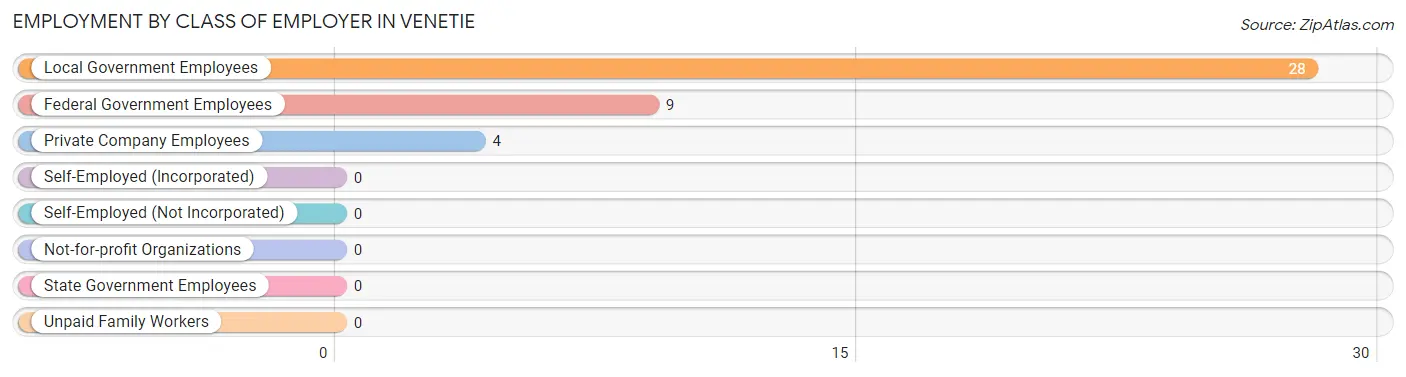
| Employer Class | # Employees | % Employees |
| Private Company Employees | 4 | 9.8% |
| Self-Employed (Incorporated) | 0 | 0.0% |
| Self-Employed (Not Incorporated) | 0 | 0.0% |
| Not-for-profit Organizations | 0 | 0.0% |
| Local Government Employees | 28 | 68.3% |
| State Government Employees | 0 | 0.0% |
| Federal Government Employees | 9 | 22.0% |
| Unpaid Family Workers | 0 | 0.0% |
| Total | 41 | 100.0% |
Employment Status by Age in Venetie
According to the labor force statistics for Venetie, out of the total population over 16 years of age (85), 51.8% or 44 individuals are in the labor force, with 6.8% or 3 of them unemployed. The age group with the highest labor force participation rate is 60 to 64 years, with 100.0% or 5 individuals in the labor force. Within the labor force, the 20 to 24 years age range has the highest percentage of unemployed individuals, with 18.8% or 3 of them being unemployed.
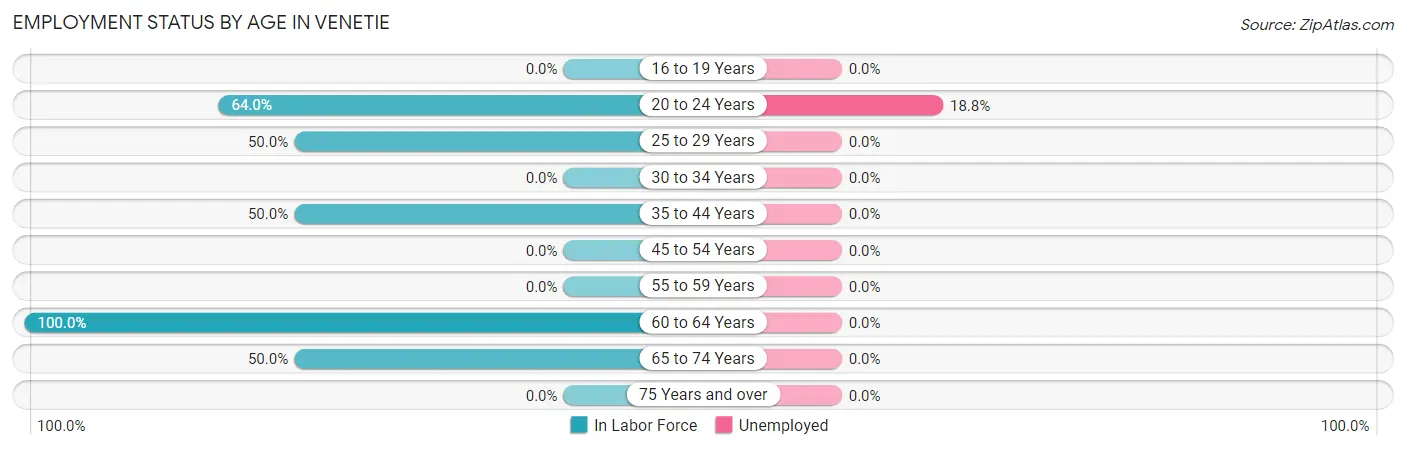
| Age Bracket | In Labor Force | Unemployed |
| 16 to 19 Years | 0 (0.0%) | 0 (0.0%) |
| 20 to 24 Years | 16 (64.0%) | 3 (18.8%) |
| 25 to 29 Years | 4 (50.0%) | 0 (0.0%) |
| 30 to 34 Years | 0 (0.0%) | 0 (0.0%) |
| 35 to 44 Years | 5 (50.0%) | 0 (0.0%) |
| 45 to 54 Years | 0 (0.0%) | 0 (0.0%) |
| 55 to 59 Years | 0 (0.0%) | 0 (0.0%) |
| 60 to 64 Years | 5 (100.0%) | 0 (0.0%) |
| 65 to 74 Years | 14 (50.0%) | 0 (0.0%) |
| 75 Years and over | 0 (0.0%) | 0 (0.0%) |
| Total | 44 (51.8%) | 3 (6.8%) |
Employment Status by Educational Attainment in Venetie
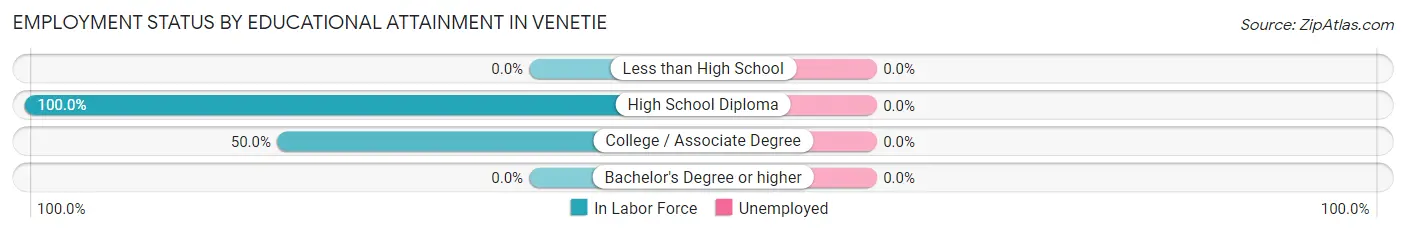
| Educational Attainment | In Labor Force | Unemployed |
| Less than High School | 0 (0.0%) | 0 (0.0%) |
| High School Diploma | 11 (100.0%) | 0 (0.0%) |
| College / Associate Degree | 3 (50.0%) | 0 (0.0%) |
| Bachelor's Degree or higher | 0 (0.0%) | 0 (0.0%) |
| Total | 14 (48.3%) | 0 (0.0%) |
Employment Occupations by Sex in Venetie
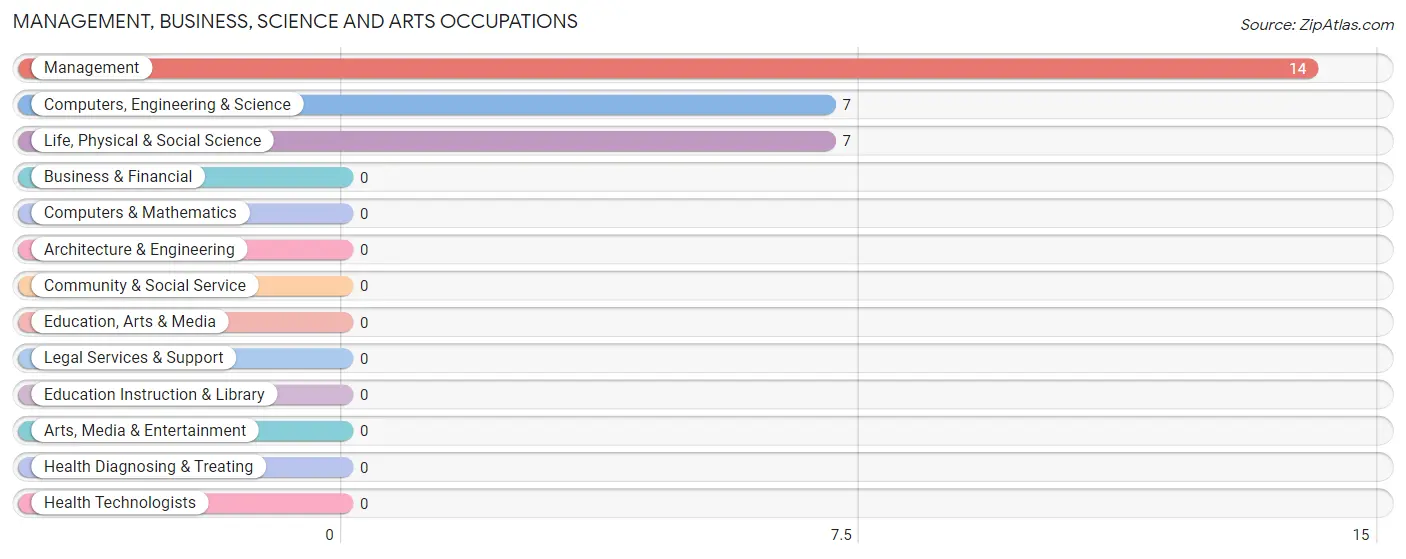
Management, Business, Science and Arts Occupations
The most common Management, Business, Science and Arts occupations in Venetie are Management (14 | 34.2%), Computers, Engineering & Science (7 | 17.1%), and Life, Physical & Social Science (7 | 17.1%).
Management, Business, Science and Arts Occupations by Sex
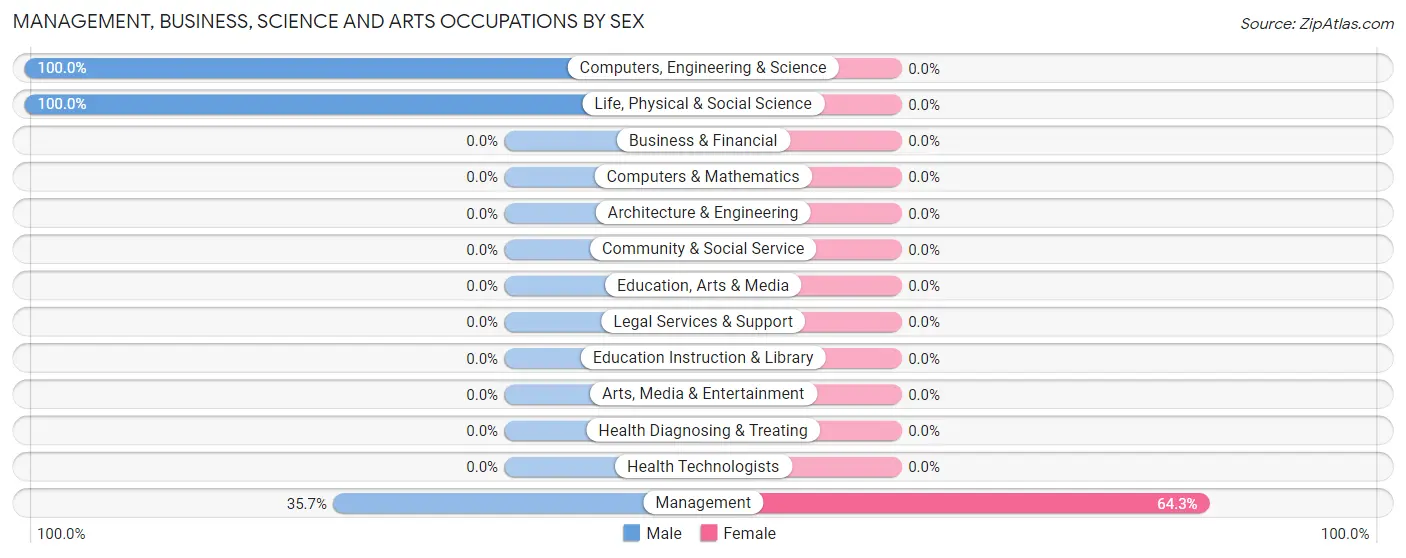
| Occupation | Male | Female |
| Management | 5 (35.7%) | 9 (64.3%) |
| Business & Financial | 0 (0.0%) | 0 (0.0%) |
| Computers, Engineering & Science | 7 (100.0%) | 0 (0.0%) |
| Computers & Mathematics | 0 (0.0%) | 0 (0.0%) |
| Architecture & Engineering | 0 (0.0%) | 0 (0.0%) |
| Life, Physical & Social Science | 7 (100.0%) | 0 (0.0%) |
| Community & Social Service | 0 (0.0%) | 0 (0.0%) |
| Education, Arts & Media | 0 (0.0%) | 0 (0.0%) |
| Legal Services & Support | 0 (0.0%) | 0 (0.0%) |
| Education Instruction & Library | 0 (0.0%) | 0 (0.0%) |
| Arts, Media & Entertainment | 0 (0.0%) | 0 (0.0%) |
| Health Diagnosing & Treating | 0 (0.0%) | 0 (0.0%) |
| Health Technologists | 0 (0.0%) | 0 (0.0%) |
| Total (Category) | 12 (57.1%) | 9 (42.9%) |
| Total (Overall) | 25 (61.0%) | 16 (39.0%) |
Services Occupations
Services Occupations by Sex
| Occupation | Male | Female |
| Healthcare Support | 0 (0.0%) | 0 (0.0%) |
| Security & Protection | 0 (0.0%) | 0 (0.0%) |
| Firefighting & Prevention | 0 (0.0%) | 0 (0.0%) |
| Law Enforcement | 0 (0.0%) | 0 (0.0%) |
| Food Preparation & Serving | 0 (0.0%) | 0 (0.0%) |
| Cleaning & Maintenance | 0 (0.0%) | 0 (0.0%) |
| Personal Care & Service | 0 (0.0%) | 0 (0.0%) |
| Total (Category) | 0 (0.0%) | 0 (0.0%) |
| Total (Overall) | 25 (61.0%) | 16 (39.0%) |
Sales and Office Occupations
Sales and Office Occupations by Sex
| Occupation | Male | Female |
| Sales & Related | 0 (0.0%) | 0 (0.0%) |
| Office & Administration | 0 (0.0%) | 0 (0.0%) |
| Total (Category) | 0 (0.0%) | 0 (0.0%) |
| Total (Overall) | 25 (61.0%) | 16 (39.0%) |
Natural Resources, Construction and Maintenance Occupations
The most common Natural Resources, Construction and Maintenance occupations in Venetie are , and Installation, Maintenance & Repair (2 | 4.9%).
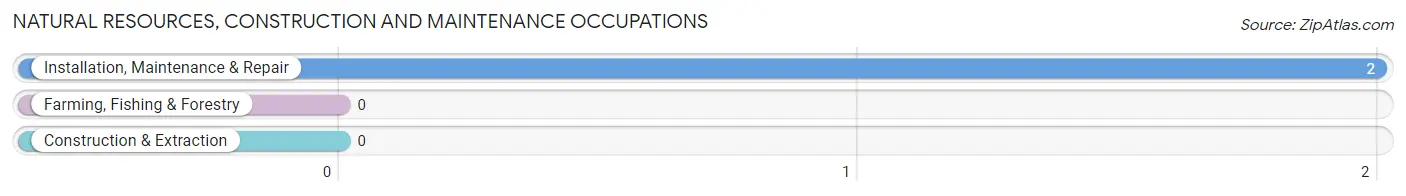
Natural Resources, Construction and Maintenance Occupations by Sex
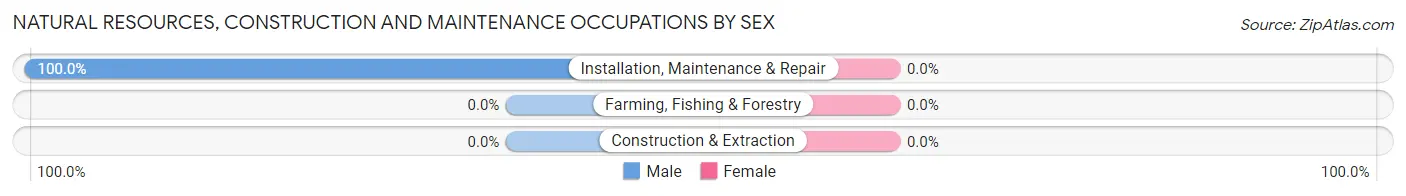
| Occupation | Male | Female |
| Farming, Fishing & Forestry | 0 (0.0%) | 0 (0.0%) |
| Construction & Extraction | 0 (0.0%) | 0 (0.0%) |
| Installation, Maintenance & Repair | 2 (100.0%) | 0 (0.0%) |
| Total (Category) | 2 (100.0%) | 0 (0.0%) |
| Total (Overall) | 25 (61.0%) | 16 (39.0%) |
Production, Transportation and Moving Occupations
The most common Production, Transportation and Moving occupations in Venetie are Production (14 | 34.2%), and Material Moving (4 | 9.8%).
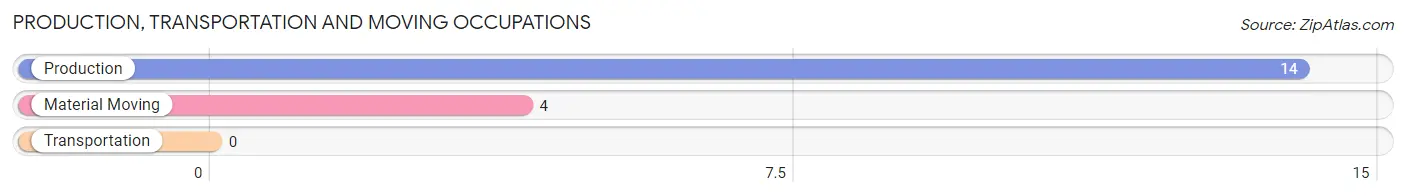
Production, Transportation and Moving Occupations by Sex
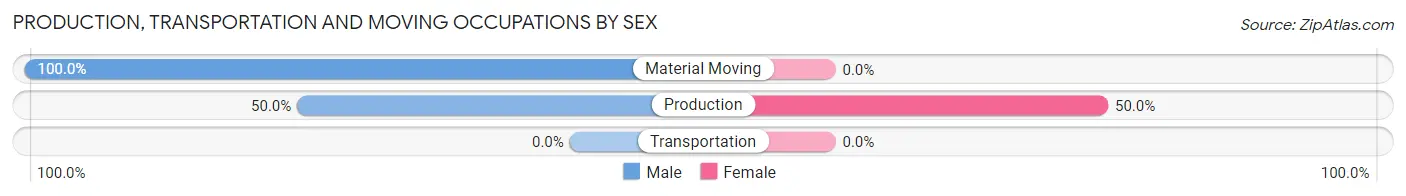
| Occupation | Male | Female |
| Production | 7 (50.0%) | 7 (50.0%) |
| Transportation | 0 (0.0%) | 0 (0.0%) |
| Material Moving | 4 (100.0%) | 0 (0.0%) |
| Total (Category) | 11 (61.1%) | 7 (38.9%) |
| Total (Overall) | 25 (61.0%) | 16 (39.0%) |
Employment Industries by Sex in Venetie
Employment Industries in Venetie
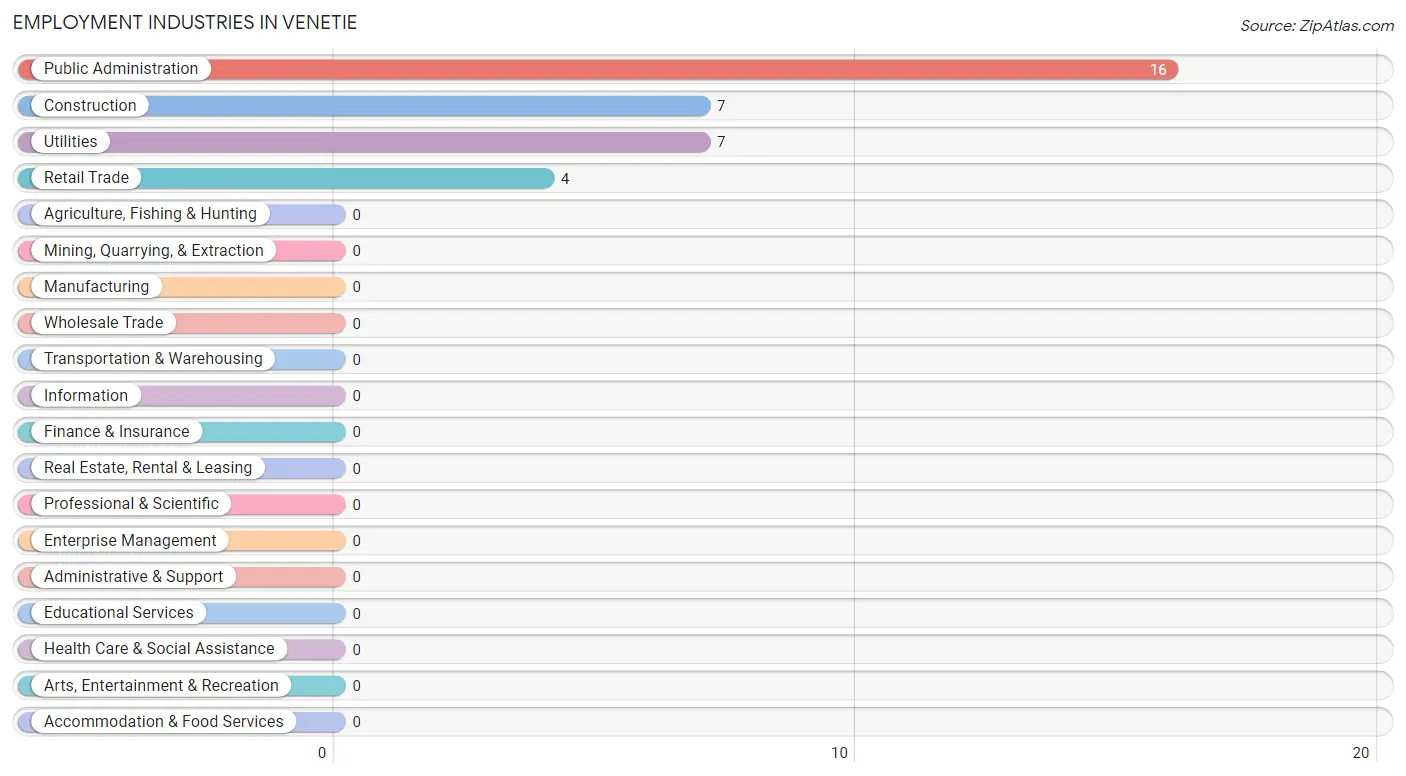
The major employment industries in Venetie include Public Administration (16 | 39.0%), Construction (7 | 17.1%), Utilities (7 | 17.1%), and Retail Trade (4 | 9.8%).
Employment Industries by Sex in Venetie
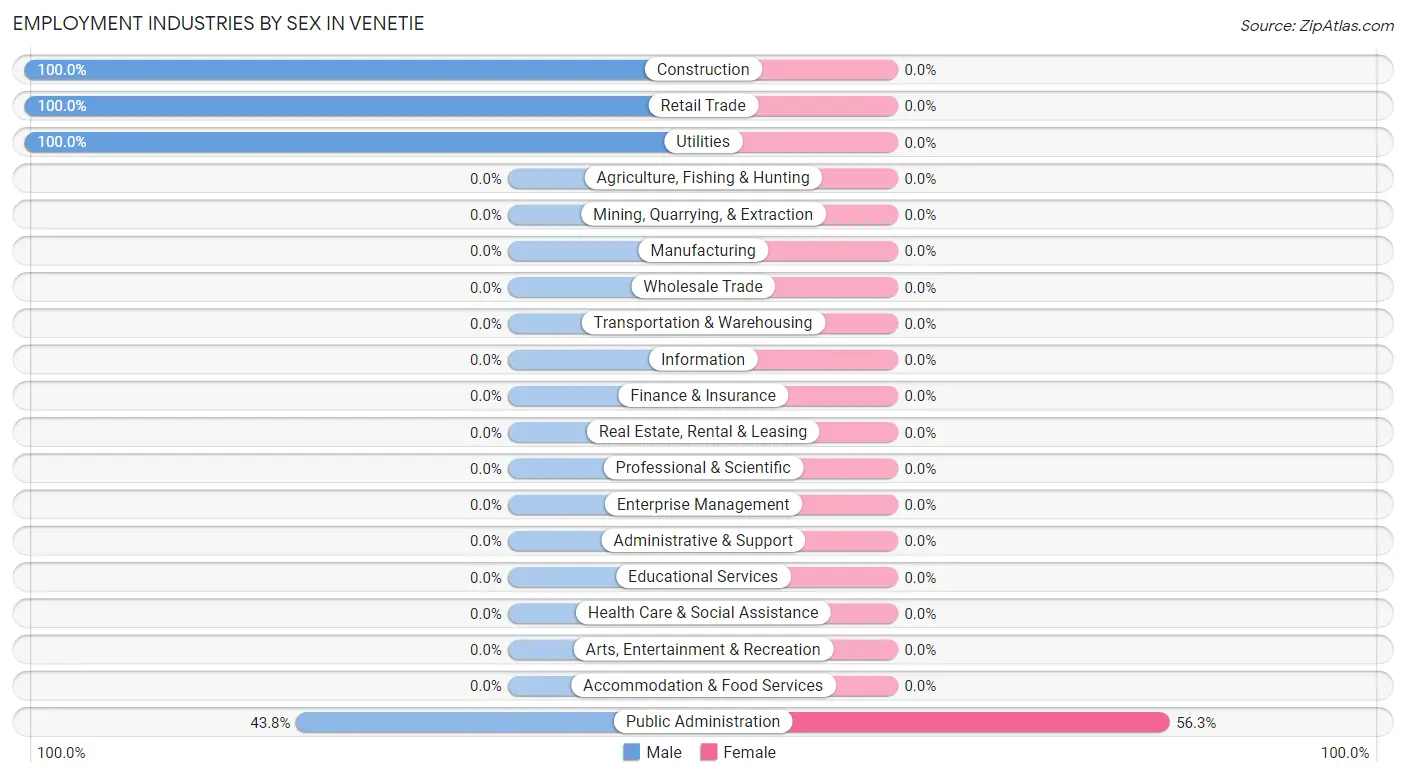
| Industry | Male | Female |
| Agriculture, Fishing & Hunting | 0 (0.0%) | 0 (0.0%) |
| Mining, Quarrying, & Extraction | 0 (0.0%) | 0 (0.0%) |
| Construction | 7 (100.0%) | 0 (0.0%) |
| Manufacturing | 0 (0.0%) | 0 (0.0%) |
| Wholesale Trade | 0 (0.0%) | 0 (0.0%) |
| Retail Trade | 4 (100.0%) | 0 (0.0%) |
| Transportation & Warehousing | 0 (0.0%) | 0 (0.0%) |
| Utilities | 7 (100.0%) | 0 (0.0%) |
| Information | 0 (0.0%) | 0 (0.0%) |
| Finance & Insurance | 0 (0.0%) | 0 (0.0%) |
| Real Estate, Rental & Leasing | 0 (0.0%) | 0 (0.0%) |
| Professional & Scientific | 0 (0.0%) | 0 (0.0%) |
| Enterprise Management | 0 (0.0%) | 0 (0.0%) |
| Administrative & Support | 0 (0.0%) | 0 (0.0%) |
| Educational Services | 0 (0.0%) | 0 (0.0%) |
| Health Care & Social Assistance | 0 (0.0%) | 0 (0.0%) |
| Arts, Entertainment & Recreation | 0 (0.0%) | 0 (0.0%) |
| Accommodation & Food Services | 0 (0.0%) | 0 (0.0%) |
| Public Administration | 7 (43.8%) | 9 (56.2%) |
| Total | 25 (61.0%) | 16 (39.0%) |
Education in Venetie
School Enrollment in Venetie
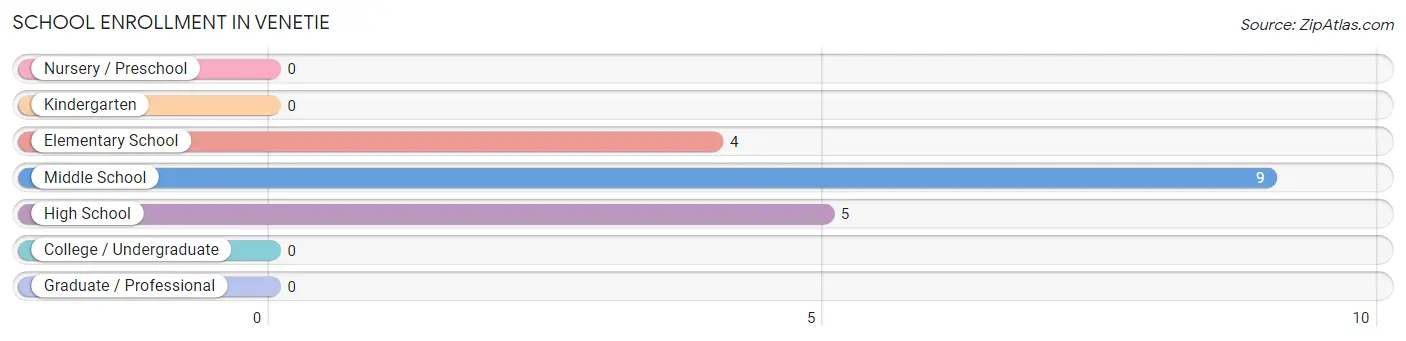
The most common levels of schooling among the 18 students in Venetie are middle school (9 | 50.0%), high school (5 | 27.8%), and elementary school (4 | 22.2%).
| School Level | # Students | % Students |
| Nursery / Preschool | 0 | 0.0% |
| Kindergarten | 0 | 0.0% |
| Elementary School | 4 | 22.2% |
| Middle School | 9 | 50.0% |
| High School | 5 | 27.8% |
| College / Undergraduate | 0 | 0.0% |
| Graduate / Professional | 0 | 0.0% |
| Total | 18 | 100.0% |
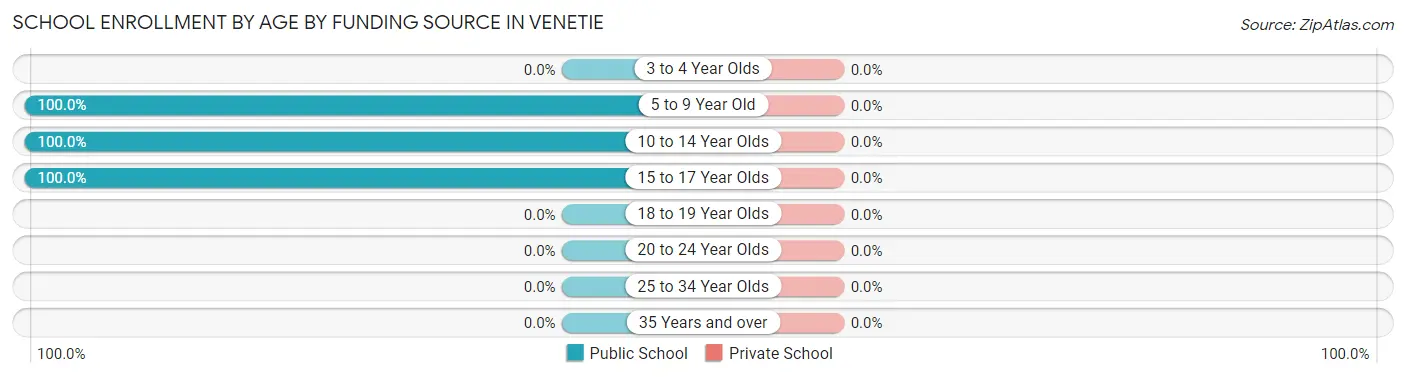
School Enrollment by Age by Funding Source in Venetie
| Age Bracket | Public School | Private School |
| 3 to 4 Year Olds | 0 (0.0%) | 0 (0.0%) |
| 5 to 9 Year Old | 4 (100.0%) | 0 (0.0%) |
| 10 to 14 Year Olds | 9 (100.0%) | 0 (0.0%) |
| 15 to 17 Year Olds | 5 (100.0%) | 0 (0.0%) |
| 18 to 19 Year Olds | 0 (0.0%) | 0 (0.0%) |
| 20 to 24 Year Olds | 0 (0.0%) | 0 (0.0%) |
| 25 to 34 Year Olds | 0 (0.0%) | 0 (0.0%) |
| 35 Years and over | 0 (0.0%) | 0 (0.0%) |
| Total | 18 (100.0%) | 0 (0.0%) |
Educational Attainment by Field of Study in Venetie
| Field of Study | # Graduates | % Graduates |
| Computers & Mathematics | 0 | 0.0% |
| Bio, Nature & Agricultural | 0 | 0.0% |
| Physical & Health Sciences | 0 | 0.0% |
| Psychology | 0 | 0.0% |
| Social Sciences | 0 | 0.0% |
| Engineering | 0 | 0.0% |
| Multidisciplinary Studies | 0 | 0.0% |
| Science & Technology | 0 | 0.0% |
| Business | 0 | 0.0% |
| Education | 0 | 0.0% |
| Literature & Languages | 0 | 0.0% |
| Liberal Arts & History | 0 | 0.0% |
| Visual & Performing Arts | 0 | 0.0% |
| Communications | 0 | 0.0% |
| Arts & Humanities | 0 | 0.0% |
| Total | 0 | 0.0% |
Transportation & Commute in Venetie
Vehicle Availability by Sex in Venetie
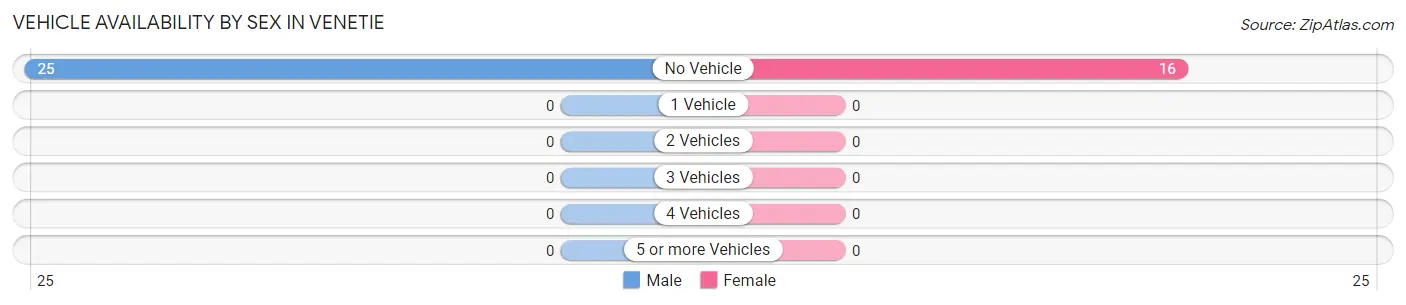
The most prevalent vehicle ownership categories in Venetie are males with no vehicle (25, accounting for 100.0%) and females with no vehicle (16, making up 156.2%).
| Vehicles Available | Male | Female |
| No Vehicle | 25 (100.0%) | 16 (100.0%) |
| 1 Vehicle | 0 (0.0%) | 0 (0.0%) |
| 2 Vehicles | 0 (0.0%) | 0 (0.0%) |
| 3 Vehicles | 0 (0.0%) | 0 (0.0%) |
| 4 Vehicles | 0 (0.0%) | 0 (0.0%) |
| 5 or more Vehicles | 0 (0.0%) | 0 (0.0%) |
| Total | 25 (100.0%) | 16 (100.0%) |
Commute Time in Venetie
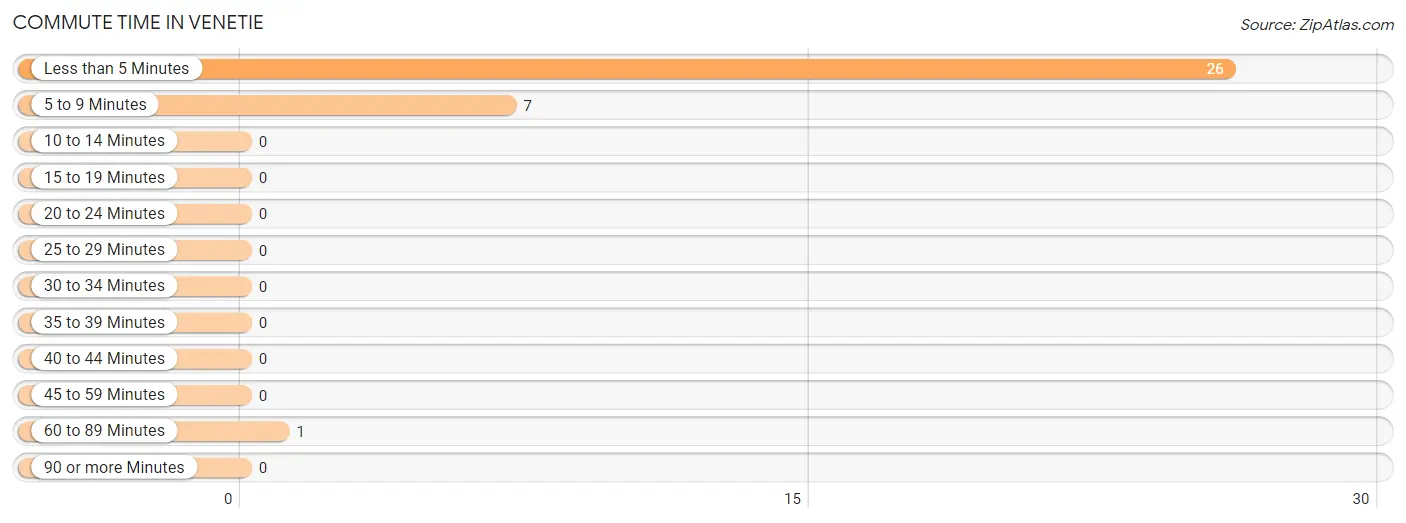
The most frequently occuring commute durations in Venetie are less than 5 minutes (26 commuters, 76.5%), 5 to 9 minutes (7 commuters, 20.6%), and 60 to 89 minutes (1 commuters, 2.9%).
| Commute Time | # Commuters | % Commuters |
| Less than 5 Minutes | 26 | 76.5% |
| 5 to 9 Minutes | 7 | 20.6% |
| 10 to 14 Minutes | 0 | 0.0% |
| 15 to 19 Minutes | 0 | 0.0% |
| 20 to 24 Minutes | 0 | 0.0% |
| 25 to 29 Minutes | 0 | 0.0% |
| 30 to 34 Minutes | 0 | 0.0% |
| 35 to 39 Minutes | 0 | 0.0% |
| 40 to 44 Minutes | 0 | 0.0% |
| 45 to 59 Minutes | 0 | 0.0% |
| 60 to 89 Minutes | 1 | 2.9% |
| 90 or more Minutes | 0 | 0.0% |
Commute Time by Sex in Venetie
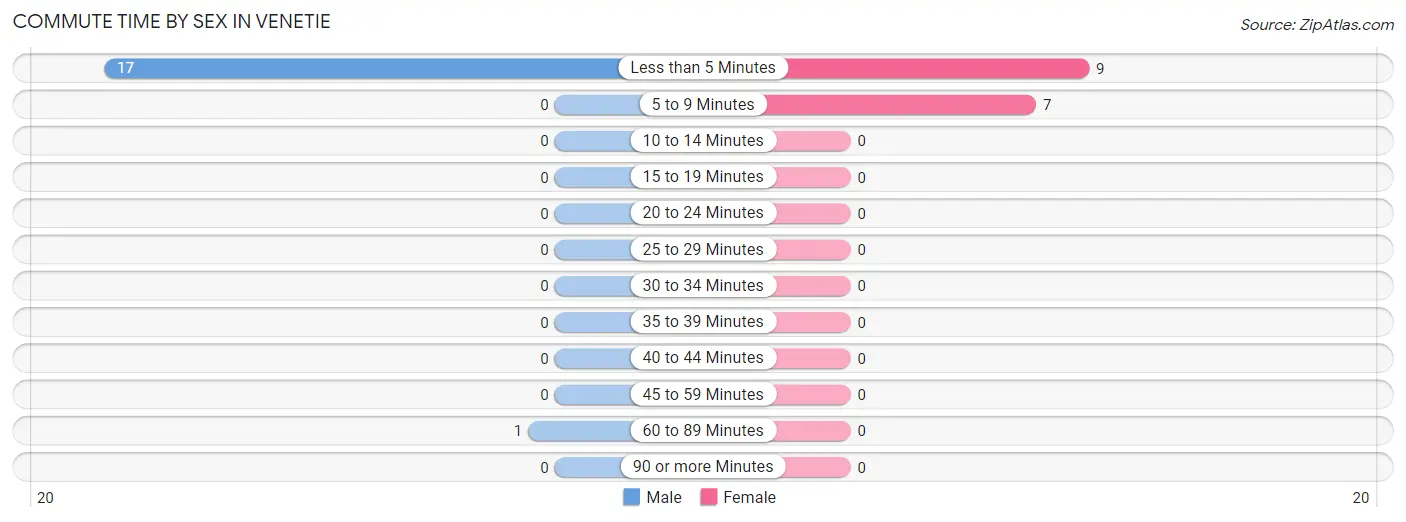
The most common commute times in Venetie are less than 5 minutes (17 commuters, 94.4%) for males and less than 5 minutes (9 commuters, 56.2%) for females.
| Commute Time | Male | Female |
| Less than 5 Minutes | 17 (94.4%) | 9 (56.2%) |
| 5 to 9 Minutes | 0 (0.0%) | 7 (43.8%) |
| 10 to 14 Minutes | 0 (0.0%) | 0 (0.0%) |
| 15 to 19 Minutes | 0 (0.0%) | 0 (0.0%) |
| 20 to 24 Minutes | 0 (0.0%) | 0 (0.0%) |
| 25 to 29 Minutes | 0 (0.0%) | 0 (0.0%) |
| 30 to 34 Minutes | 0 (0.0%) | 0 (0.0%) |
| 35 to 39 Minutes | 0 (0.0%) | 0 (0.0%) |
| 40 to 44 Minutes | 0 (0.0%) | 0 (0.0%) |
| 45 to 59 Minutes | 0 (0.0%) | 0 (0.0%) |
| 60 to 89 Minutes | 1 (5.6%) | 0 (0.0%) |
| 90 or more Minutes | 0 (0.0%) | 0 (0.0%) |
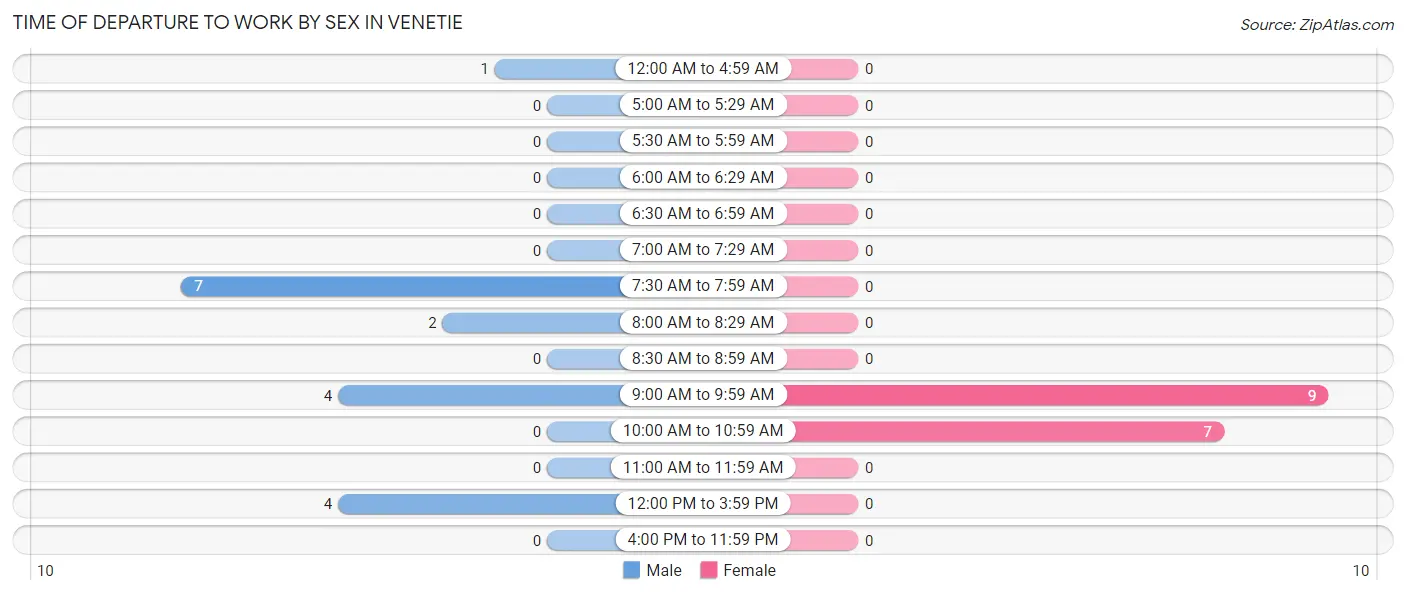
Time of Departure to Work by Sex in Venetie
The most frequent times of departure to work in Venetie are 7:30 AM to 7:59 AM (7, 38.9%) for males and 9:00 AM to 9:59 AM (9, 56.2%) for females.
| Time of Departure | Male | Female |
| 12:00 AM to 4:59 AM | 1 (5.6%) | 0 (0.0%) |
| 5:00 AM to 5:29 AM | 0 (0.0%) | 0 (0.0%) |
| 5:30 AM to 5:59 AM | 0 (0.0%) | 0 (0.0%) |
| 6:00 AM to 6:29 AM | 0 (0.0%) | 0 (0.0%) |
| 6:30 AM to 6:59 AM | 0 (0.0%) | 0 (0.0%) |
| 7:00 AM to 7:29 AM | 0 (0.0%) | 0 (0.0%) |
| 7:30 AM to 7:59 AM | 7 (38.9%) | 0 (0.0%) |
| 8:00 AM to 8:29 AM | 2 (11.1%) | 0 (0.0%) |
| 8:30 AM to 8:59 AM | 0 (0.0%) | 0 (0.0%) |
| 9:00 AM to 9:59 AM | 4 (22.2%) | 9 (56.2%) |
| 10:00 AM to 10:59 AM | 0 (0.0%) | 7 (43.8%) |
| 11:00 AM to 11:59 AM | 0 (0.0%) | 0 (0.0%) |
| 12:00 PM to 3:59 PM | 4 (22.2%) | 0 (0.0%) |
| 4:00 PM to 11:59 PM | 0 (0.0%) | 0 (0.0%) |
| Total | 18 (100.0%) | 16 (100.0%) |
Housing Occupancy in Venetie
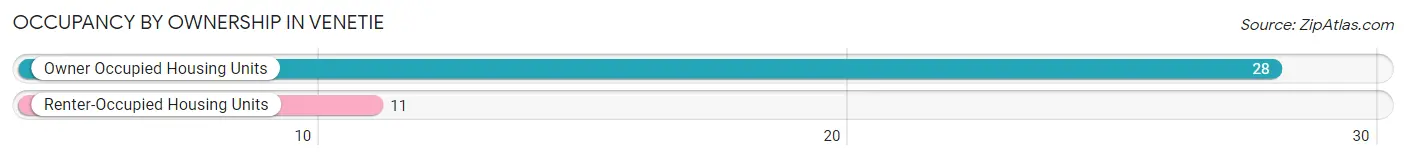
Occupancy by Ownership in Venetie
Of the total 39 dwellings in Venetie, owner-occupied units account for 28 (71.8%), while renter-occupied units make up 11 (28.2%).
| Occupancy | # Housing Units | % Housing Units |
| Owner Occupied Housing Units | 28 | 71.8% |
| Renter-Occupied Housing Units | 11 | 28.2% |
| Total Occupied Housing Units | 39 | 100.0% |
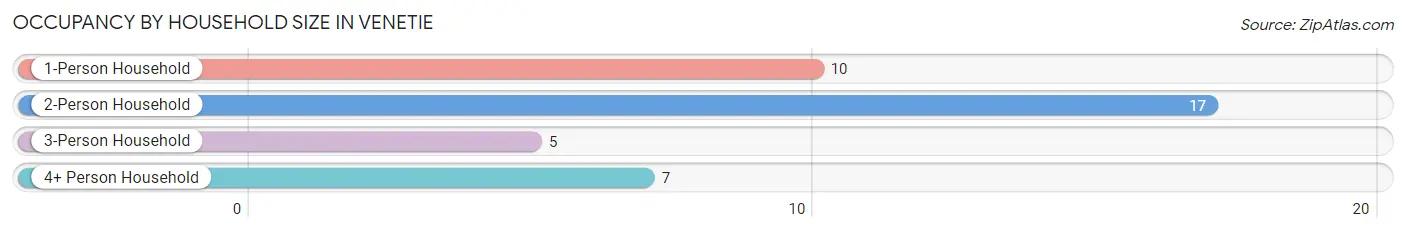
Occupancy by Household Size in Venetie
| Household Size | # Housing Units | % Housing Units |
| 1-Person Household | 10 | 25.6% |
| 2-Person Household | 17 | 43.6% |
| 3-Person Household | 5 | 12.8% |
| 4+ Person Household | 7 | 17.9% |
| Total Housing Units | 39 | 100.0% |
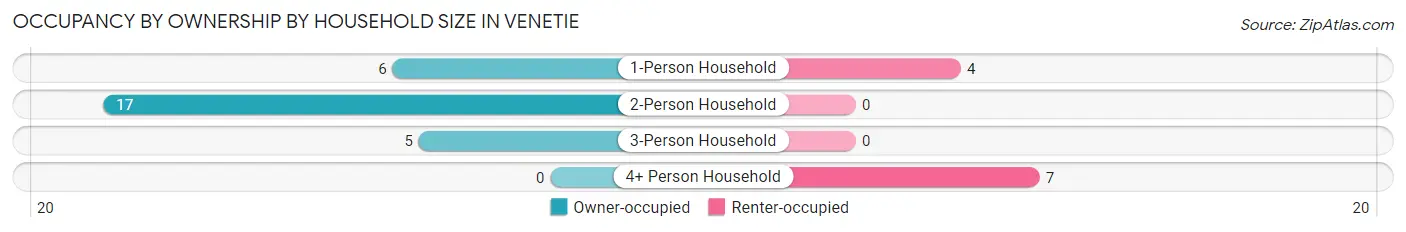
Occupancy by Ownership by Household Size in Venetie
| Household Size | Owner-occupied | Renter-occupied |
| 1-Person Household | 6 (60.0%) | 4 (40.0%) |
| 2-Person Household | 17 (100.0%) | 0 (0.0%) |
| 3-Person Household | 5 (100.0%) | 0 (0.0%) |
| 4+ Person Household | 0 (0.0%) | 7 (100.0%) |
| Total Housing Units | 28 (71.8%) | 11 (28.2%) |
Occupancy by Educational Attainment in Venetie
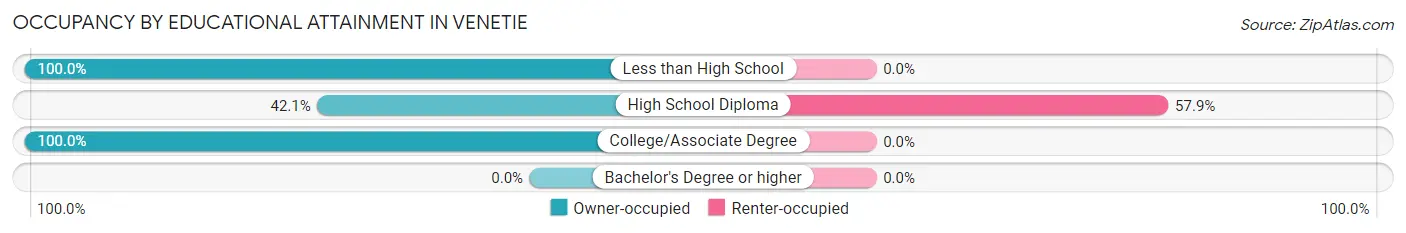
| Household Size | Owner-occupied | Renter-occupied |
| Less than High School | 13 (100.0%) | 0 (0.0%) |
| High School Diploma | 8 (42.1%) | 11 (57.9%) |
| College/Associate Degree | 7 (100.0%) | 0 (0.0%) |
| Bachelor's Degree or higher | 0 (0.0%) | 0 (0.0%) |
Occupancy by Age of Householder in Venetie
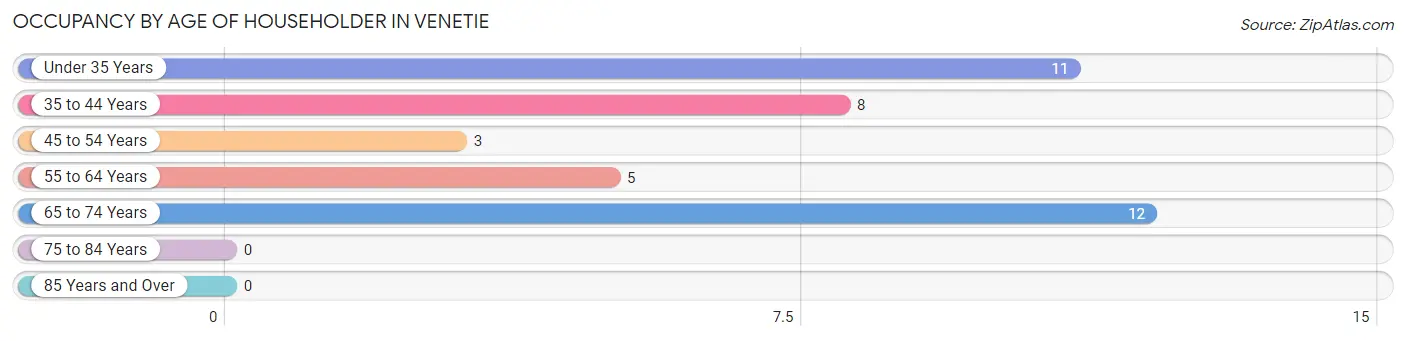
| Age Bracket | # Households | % Households |
| Under 35 Years | 11 | 28.2% |
| 35 to 44 Years | 8 | 20.5% |
| 45 to 54 Years | 3 | 7.7% |
| 55 to 64 Years | 5 | 12.8% |
| 65 to 74 Years | 12 | 30.8% |
| 75 to 84 Years | 0 | 0.0% |
| 85 Years and Over | 0 | 0.0% |
| Total | 39 | 100.0% |
Housing Finances in Venetie
Median Income by Occupancy in Venetie
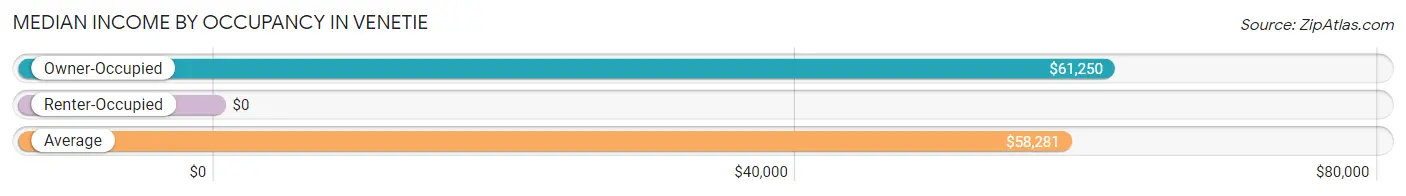
| Occupancy Type | # Households | Median Income |
| Owner-Occupied | 28 (71.8%) | $61,250 |
| Renter-Occupied | 11 (28.2%) | $0 |
| Average | 39 (100.0%) | $58,281 |
Occupancy by Householder Income Bracket in Venetie
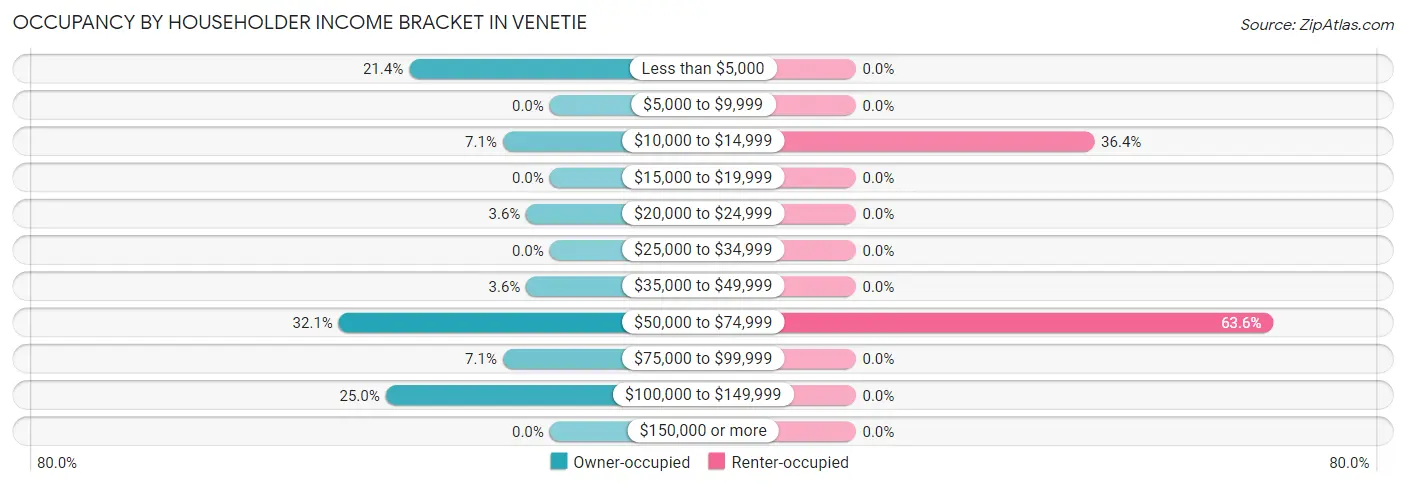
| Income Bracket | Owner-occupied | Renter-occupied |
| Less than $5,000 | 6 (21.4%) | 0 (0.0%) |
| $5,000 to $9,999 | 0 (0.0%) | 0 (0.0%) |
| $10,000 to $14,999 | 2 (7.1%) | 4 (36.4%) |
| $15,000 to $19,999 | 0 (0.0%) | 0 (0.0%) |
| $20,000 to $24,999 | 1 (3.6%) | 0 (0.0%) |
| $25,000 to $34,999 | 0 (0.0%) | 0 (0.0%) |
| $35,000 to $49,999 | 1 (3.6%) | 0 (0.0%) |
| $50,000 to $74,999 | 9 (32.1%) | 7 (63.6%) |
| $75,000 to $99,999 | 2 (7.1%) | 0 (0.0%) |
| $100,000 to $149,999 | 7 (25.0%) | 0 (0.0%) |
| $150,000 or more | 0 (0.0%) | 0 (0.0%) |
| Total | 28 (100.0%) | 11 (100.0%) |
Monthly Housing Cost Tiers in Venetie
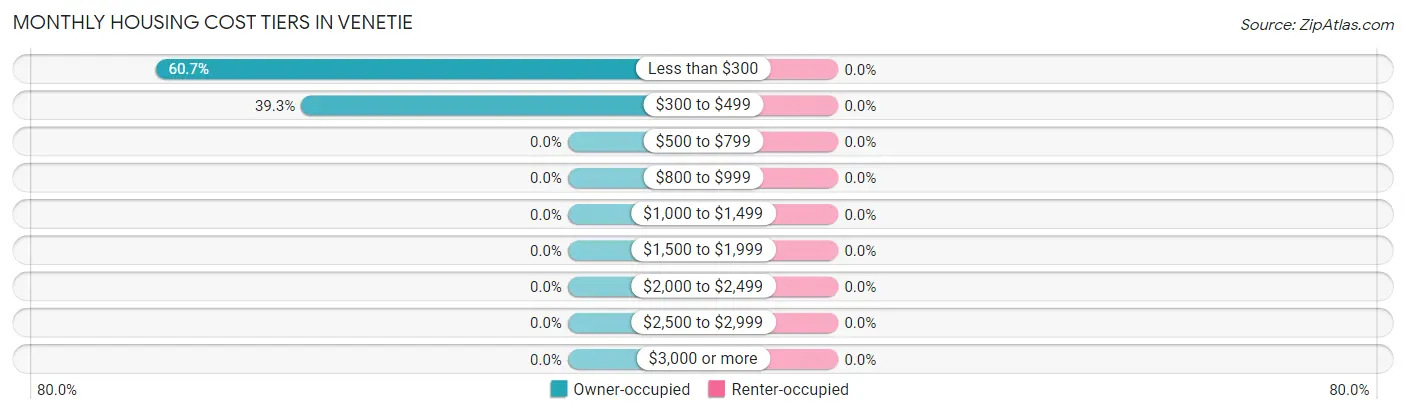
| Monthly Cost | Owner-occupied | Renter-occupied |
| Less than $300 | 17 (60.7%) | 0 (0.0%) |
| $300 to $499 | 11 (39.3%) | 0 (0.0%) |
| $500 to $799 | 0 (0.0%) | 0 (0.0%) |
| $800 to $999 | 0 (0.0%) | 0 (0.0%) |
| $1,000 to $1,499 | 0 (0.0%) | 0 (0.0%) |
| $1,500 to $1,999 | 0 (0.0%) | 0 (0.0%) |
| $2,000 to $2,499 | 0 (0.0%) | 0 (0.0%) |
| $2,500 to $2,999 | 0 (0.0%) | 0 (0.0%) |
| $3,000 or more | 0 (0.0%) | 0 (0.0%) |
| Total | 28 (100.0%) | 11 (100.0%) |
Physical Housing Characteristics in Venetie
Housing Structures in Venetie
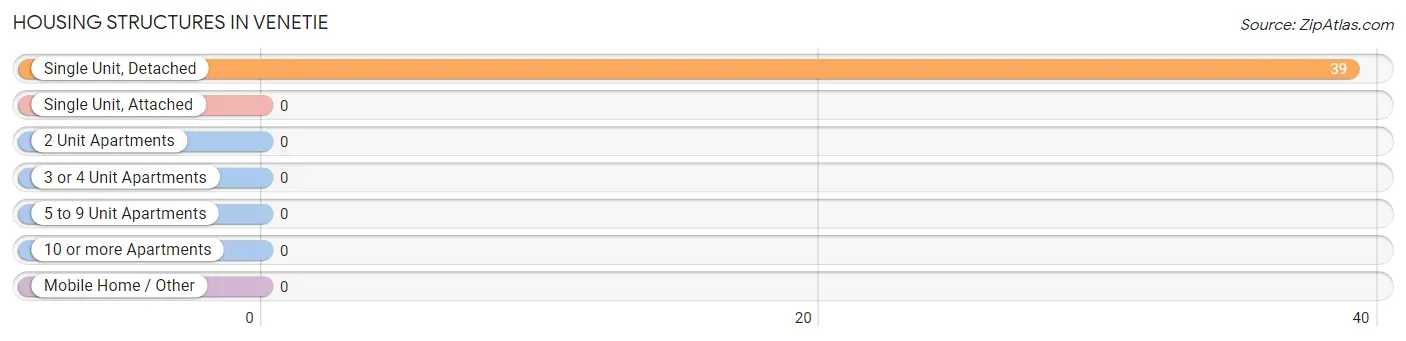
| Structure Type | # Housing Units | % Housing Units |
| Single Unit, Detached | 39 | 100.0% |
| Single Unit, Attached | 0 | 0.0% |
| 2 Unit Apartments | 0 | 0.0% |
| 3 or 4 Unit Apartments | 0 | 0.0% |
| 5 to 9 Unit Apartments | 0 | 0.0% |
| 10 or more Apartments | 0 | 0.0% |
| Mobile Home / Other | 0 | 0.0% |
| Total | 39 | 100.0% |
Housing Structures by Occupancy in Venetie
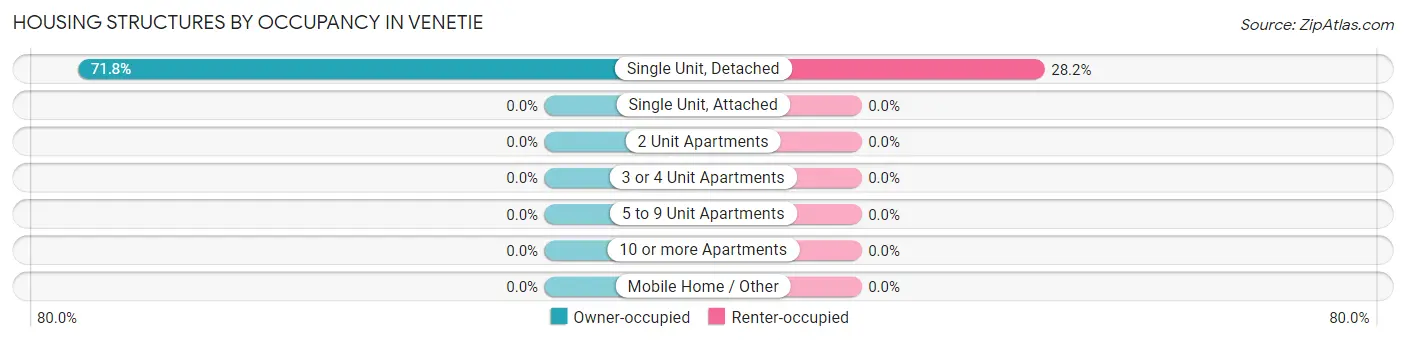
| Structure Type | Owner-occupied | Renter-occupied |
| Single Unit, Detached | 28 (71.8%) | 11 (28.2%) |
| Single Unit, Attached | 0 (0.0%) | 0 (0.0%) |
| 2 Unit Apartments | 0 (0.0%) | 0 (0.0%) |
| 3 or 4 Unit Apartments | 0 (0.0%) | 0 (0.0%) |
| 5 to 9 Unit Apartments | 0 (0.0%) | 0 (0.0%) |
| 10 or more Apartments | 0 (0.0%) | 0 (0.0%) |
| Mobile Home / Other | 0 (0.0%) | 0 (0.0%) |
| Total | 28 (71.8%) | 11 (28.2%) |
Housing Structures by Number of Rooms in Venetie
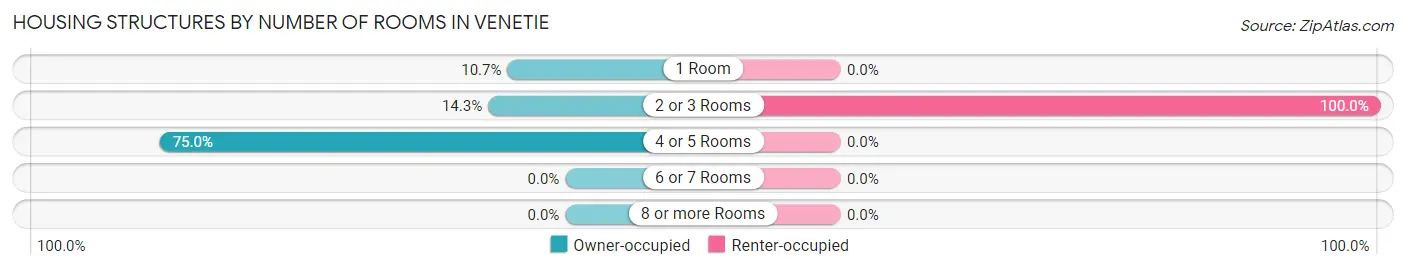
| Number of Rooms | Owner-occupied | Renter-occupied |
| 1 Room | 3 (10.7%) | 0 (0.0%) |
| 2 or 3 Rooms | 4 (14.3%) | 11 (100.0%) |
| 4 or 5 Rooms | 21 (75.0%) | 0 (0.0%) |
| 6 or 7 Rooms | 0 (0.0%) | 0 (0.0%) |
| 8 or more Rooms | 0 (0.0%) | 0 (0.0%) |
| Total | 28 (100.0%) | 11 (100.0%) |
Housing Structure by Heating Type in Venetie
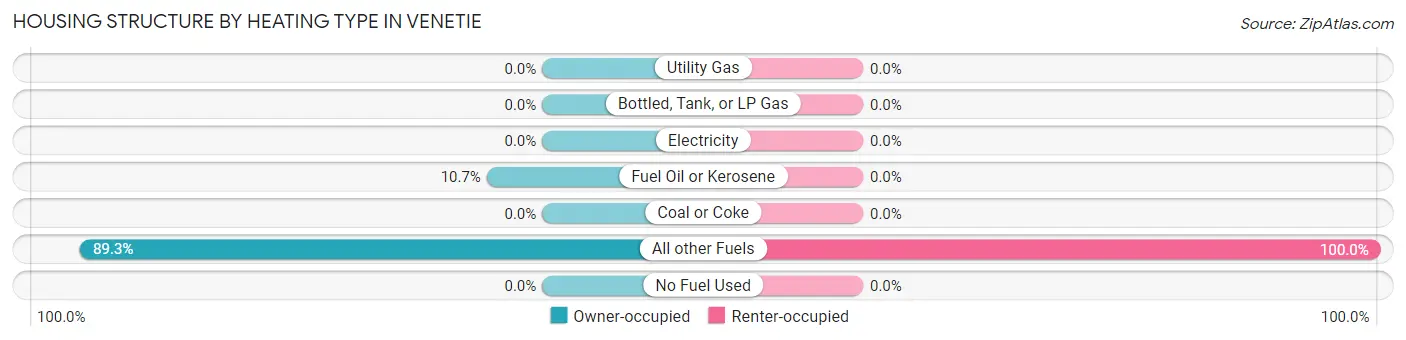
| Heating Type | Owner-occupied | Renter-occupied |
| Utility Gas | 0 (0.0%) | 0 (0.0%) |
| Bottled, Tank, or LP Gas | 0 (0.0%) | 0 (0.0%) |
| Electricity | 0 (0.0%) | 0 (0.0%) |
| Fuel Oil or Kerosene | 3 (10.7%) | 0 (0.0%) |
| Coal or Coke | 0 (0.0%) | 0 (0.0%) |
| All other Fuels | 25 (89.3%) | 11 (100.0%) |
| No Fuel Used | 0 (0.0%) | 0 (0.0%) |
| Total | 28 (100.0%) | 11 (100.0%) |
Household Vehicle Usage in Venetie
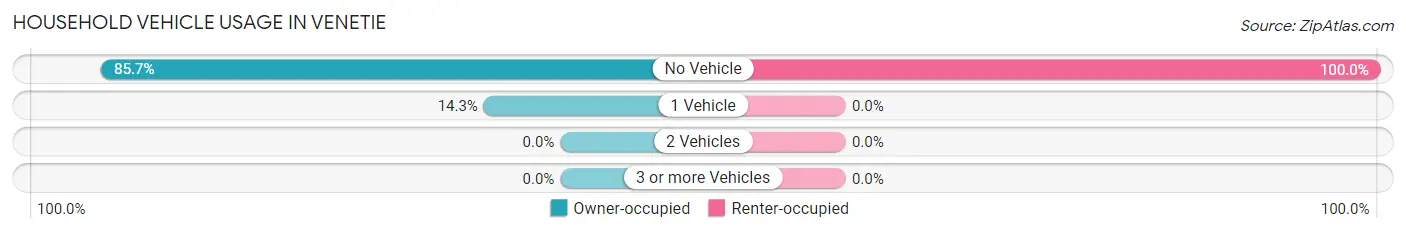
| Vehicles per Household | Owner-occupied | Renter-occupied |
| No Vehicle | 24 (85.7%) | 11 (100.0%) |
| 1 Vehicle | 4 (14.3%) | 0 (0.0%) |
| 2 Vehicles | 0 (0.0%) | 0 (0.0%) |
| 3 or more Vehicles | 0 (0.0%) | 0 (0.0%) |
| Total | 28 (100.0%) | 11 (100.0%) |
Real Estate & Mortgages in Venetie
Real Estate and Mortgage Overview in Venetie
| Characteristic | Without Mortgage | With Mortgage |
| Housing Units | 28 | 0 |
| Median Property Value | - | - |
| Median Household Income | $61,250 | $0 |
| Monthly Housing Costs | $288 | $0 |
| Real Estate Taxes | - | - |
Property Value by Mortgage Status in Venetie
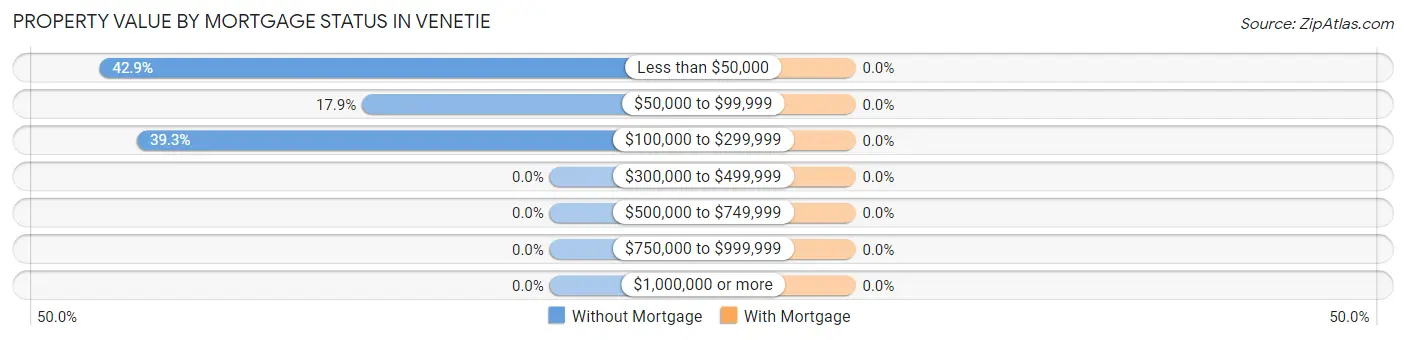
| Property Value | Without Mortgage | With Mortgage |
| Less than $50,000 | 12 (42.9%) | 0 (0.0%) |
| $50,000 to $99,999 | 5 (17.9%) | 0 (0.0%) |
| $100,000 to $299,999 | 11 (39.3%) | 0 (0.0%) |
| $300,000 to $499,999 | 0 (0.0%) | 0 (0.0%) |
| $500,000 to $749,999 | 0 (0.0%) | 0 (0.0%) |
| $750,000 to $999,999 | 0 (0.0%) | 0 (0.0%) |
| $1,000,000 or more | 0 (0.0%) | 0 (0.0%) |
| Total | 28 (100.0%) | 0 (0.0%) |
Household Income by Mortgage Status in Venetie
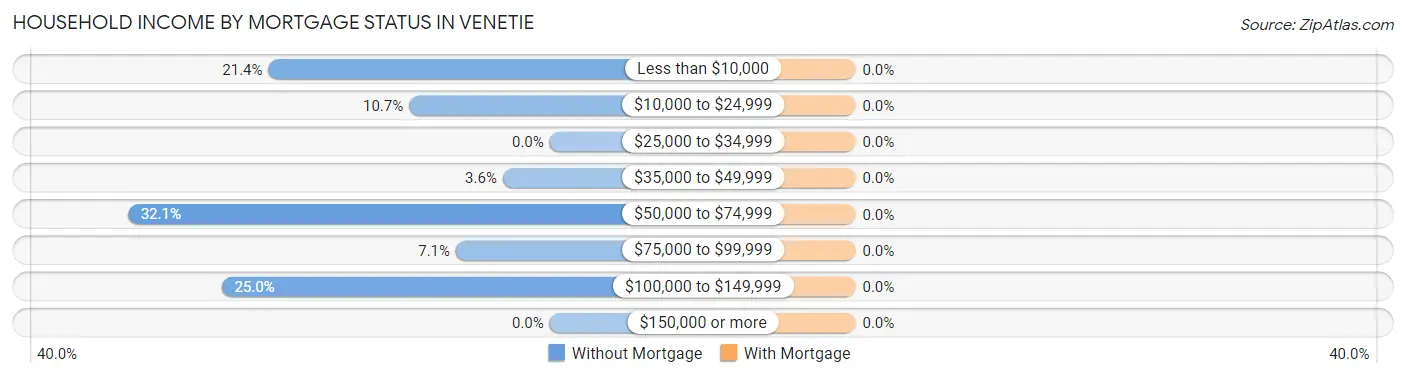
| Household Income | Without Mortgage | With Mortgage |
| Less than $10,000 | 6 (21.4%) | 0 (0.0%) |
| $10,000 to $24,999 | 3 (10.7%) | 0 (0.0%) |
| $25,000 to $34,999 | 0 (0.0%) | 0 (0.0%) |
| $35,000 to $49,999 | 1 (3.6%) | 0 (0.0%) |
| $50,000 to $74,999 | 9 (32.1%) | 0 (0.0%) |
| $75,000 to $99,999 | 2 (7.1%) | 0 (0.0%) |
| $100,000 to $149,999 | 7 (25.0%) | 0 (0.0%) |
| $150,000 or more | 0 (0.0%) | 0 (0.0%) |
| Total | 28 (100.0%) | 0 (0.0%) |
Property Value to Household Income Ratio in Venetie
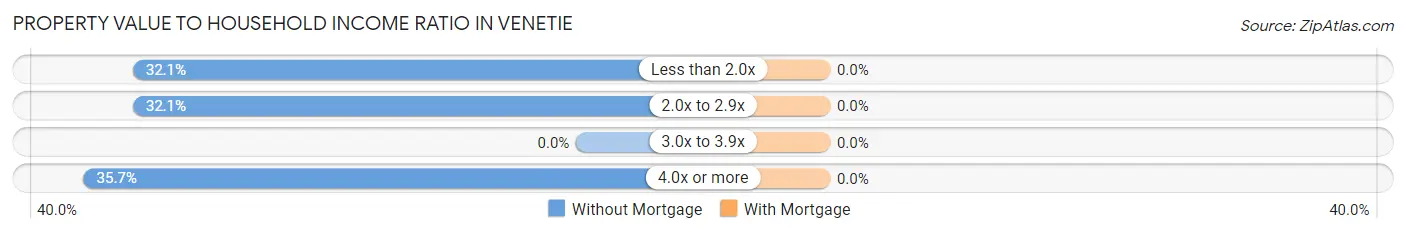
| Value-to-Income Ratio | Without Mortgage | With Mortgage |
| Less than 2.0x | 9 (32.1%) | 0 (0.0%) |
| 2.0x to 2.9x | 9 (32.1%) | 0 (0.0%) |
| 3.0x to 3.9x | 0 (0.0%) | 0 (0.0%) |
| 4.0x or more | 10 (35.7%) | 0 (0.0%) |
| Total | 28 (100.0%) | 0 (0.0%) |
Real Estate Taxes by Mortgage Status in Venetie
| Property Taxes | Without Mortgage | With Mortgage |
| Less than $800 | 0 (0.0%) | 0 (0.0%) |
| $800 to $1,499 | 0 (0.0%) | 0 (0.0%) |
| $800 to $1,499 | 0 (0.0%) | 0 (0.0%) |
| Total | 28 (100.0%) | 0 (0.0%) |
Health & Disability in Venetie
Health Insurance Coverage by Age in Venetie
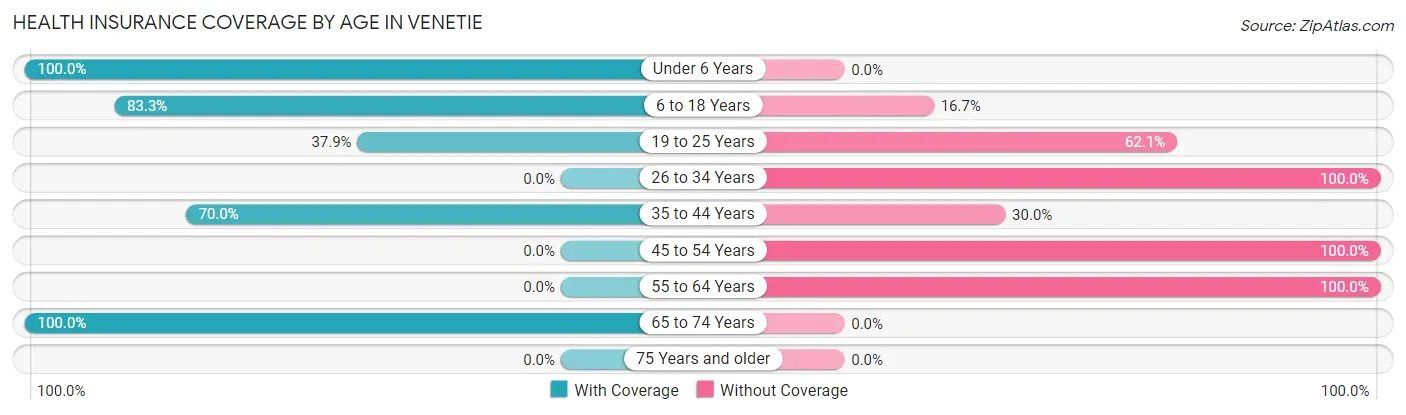
| Age Bracket | With Coverage | Without Coverage |
| Under 6 Years | 9 (100.0%) | 0 (0.0%) |
| 6 to 18 Years | 15 (83.3%) | 3 (16.7%) |
| 19 to 25 Years | 11 (37.9%) | 18 (62.1%) |
| 26 to 34 Years | 0 (0.0%) | 4 (100.0%) |
| 35 to 44 Years | 7 (70.0%) | 3 (30.0%) |
| 45 to 54 Years | 0 (0.0%) | 3 (100.0%) |
| 55 to 64 Years | 0 (0.0%) | 8 (100.0%) |
| 65 to 74 Years | 28 (100.0%) | 0 (0.0%) |
| 75 Years and older | 0 (0.0%) | 0 (0.0%) |
| Total | 70 (64.2%) | 39 (35.8%) |
Health Insurance Coverage by Citizenship Status in Venetie
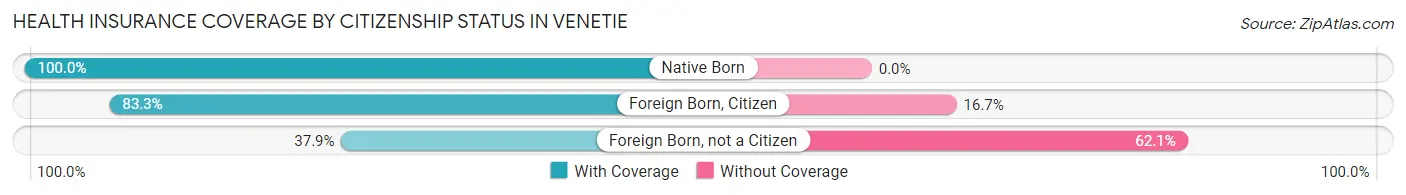
| Citizenship Status | With Coverage | Without Coverage |
| Native Born | 9 (100.0%) | 0 (0.0%) |
| Foreign Born, Citizen | 15 (83.3%) | 3 (16.7%) |
| Foreign Born, not a Citizen | 11 (37.9%) | 18 (62.1%) |
Health Insurance Coverage by Household Income in Venetie
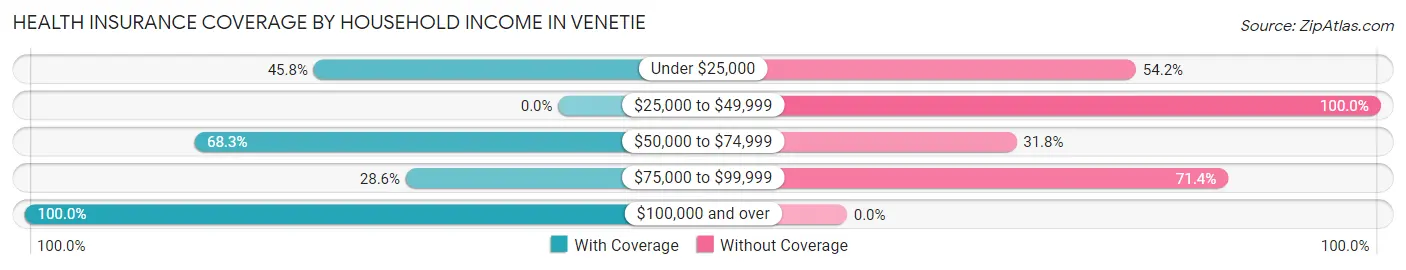
| Household Income | With Coverage | Without Coverage |
| Under $25,000 | 11 (45.8%) | 13 (54.2%) |
| $25,000 to $49,999 | 0 (0.0%) | 1 (100.0%) |
| $50,000 to $74,999 | 43 (68.2%) | 20 (31.8%) |
| $75,000 to $99,999 | 2 (28.6%) | 5 (71.4%) |
| $100,000 and over | 14 (100.0%) | 0 (0.0%) |
Public vs Private Health Insurance Coverage by Age in Venetie
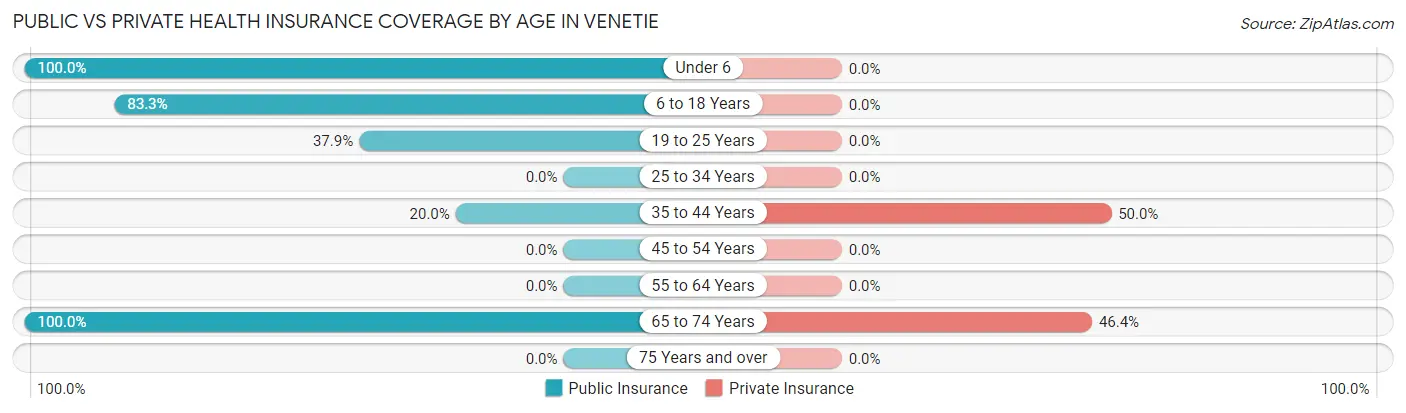
| Age Bracket | Public Insurance | Private Insurance |
| Under 6 | 9 (100.0%) | 0 (0.0%) |
| 6 to 18 Years | 15 (83.3%) | 0 (0.0%) |
| 19 to 25 Years | 11 (37.9%) | 0 (0.0%) |
| 25 to 34 Years | 0 (0.0%) | 0 (0.0%) |
| 35 to 44 Years | 2 (20.0%) | 5 (50.0%) |
| 45 to 54 Years | 0 (0.0%) | 0 (0.0%) |
| 55 to 64 Years | 0 (0.0%) | 0 (0.0%) |
| 65 to 74 Years | 28 (100.0%) | 13 (46.4%) |
| 75 Years and over | 0 (0.0%) | 0 (0.0%) |
| Total | 65 (59.6%) | 18 (16.5%) |
Disability Status by Sex by Age in Venetie
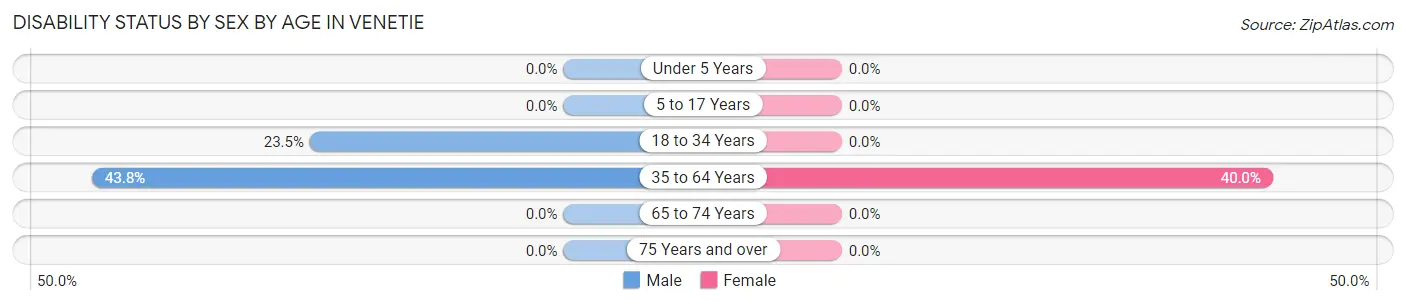
| Age Bracket | Male | Female |
| Under 5 Years | 0 (0.0%) | 0 (0.0%) |
| 5 to 17 Years | 0 (0.0%) | 0 (0.0%) |
| 18 to 34 Years | 4 (23.5%) | 0 (0.0%) |
| 35 to 64 Years | 7 (43.8%) | 2 (40.0%) |
| 65 to 74 Years | 0 (0.0%) | 0 (0.0%) |
| 75 Years and over | 0 (0.0%) | 0 (0.0%) |
Disability Class by Sex by Age in Venetie
Disability Class: Hearing Difficulty
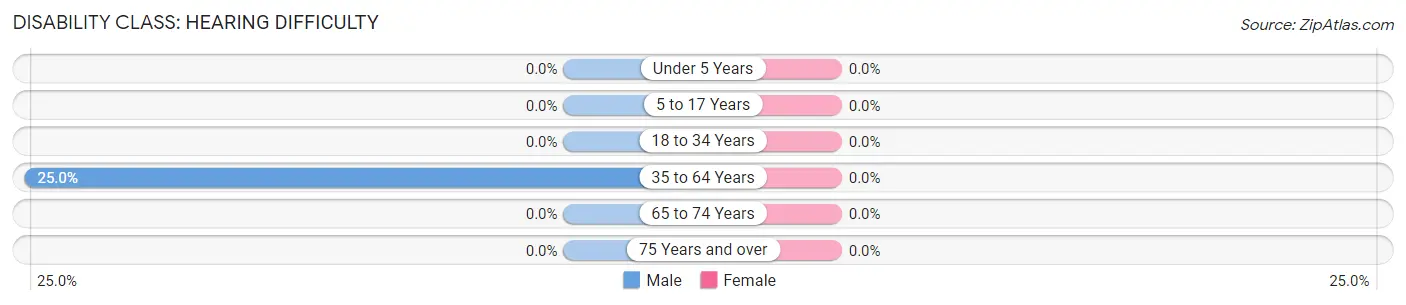
| Age Bracket | Male | Female |
| Under 5 Years | 0 (0.0%) | 0 (0.0%) |
| 5 to 17 Years | 0 (0.0%) | 0 (0.0%) |
| 18 to 34 Years | 0 (0.0%) | 0 (0.0%) |
| 35 to 64 Years | 4 (25.0%) | 0 (0.0%) |
| 65 to 74 Years | 0 (0.0%) | 0 (0.0%) |
| 75 Years and over | 0 (0.0%) | 0 (0.0%) |
Disability Class: Vision Difficulty
| Age Bracket | Male | Female |
| Under 5 Years | 0 (0.0%) | 0 (0.0%) |
| 5 to 17 Years | 0 (0.0%) | 0 (0.0%) |
| 18 to 34 Years | 0 (0.0%) | 0 (0.0%) |
| 35 to 64 Years | 0 (0.0%) | 0 (0.0%) |
| 65 to 74 Years | 0 (0.0%) | 0 (0.0%) |
| 75 Years and over | 0 (0.0%) | 0 (0.0%) |
Disability Class: Cognitive Difficulty
| Age Bracket | Male | Female |
| 5 to 17 Years | 0 (0.0%) | 0 (0.0%) |
| 18 to 34 Years | 4 (23.5%) | 0 (0.0%) |
| 35 to 64 Years | 0 (0.0%) | 0 (0.0%) |
| 65 to 74 Years | 0 (0.0%) | 0 (0.0%) |
| 75 Years and over | 0 (0.0%) | 0 (0.0%) |
Disability Class: Ambulatory Difficulty
| Age Bracket | Male | Female |
| 5 to 17 Years | 0 (0.0%) | 0 (0.0%) |
| 18 to 34 Years | 0 (0.0%) | 0 (0.0%) |
| 35 to 64 Years | 6 (37.5%) | 2 (40.0%) |
| 65 to 74 Years | 0 (0.0%) | 0 (0.0%) |
| 75 Years and over | 0 (0.0%) | 0 (0.0%) |
Disability Class: Self-Care Difficulty
| Age Bracket | Male | Female |
| 5 to 17 Years | 0 (0.0%) | 0 (0.0%) |
| 18 to 34 Years | 0 (0.0%) | 0 (0.0%) |
| 35 to 64 Years | 0 (0.0%) | 0 (0.0%) |
| 65 to 74 Years | 0 (0.0%) | 0 (0.0%) |
| 75 Years and over | 0 (0.0%) | 0 (0.0%) |
Technology Access in Venetie
Computing Device Access in Venetie
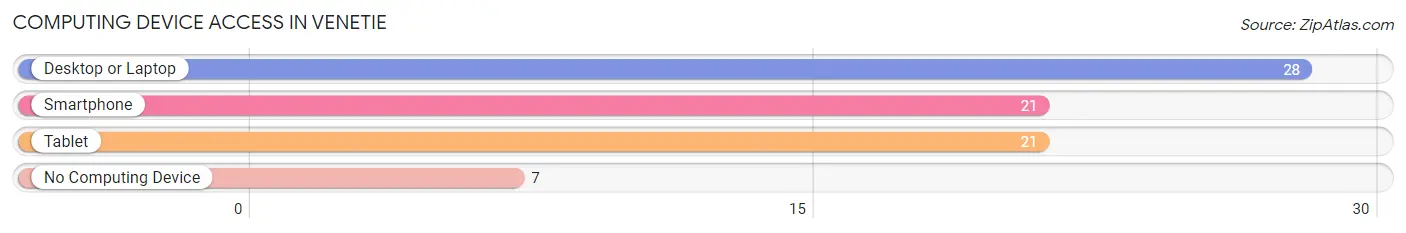
| Device Type | # Households | % Households |
| Desktop or Laptop | 28 | 71.8% |
| Smartphone | 21 | 53.8% |
| Tablet | 21 | 53.8% |
| No Computing Device | 7 | 17.9% |
| Total | 39 | 100.0% |
Internet Access in Venetie
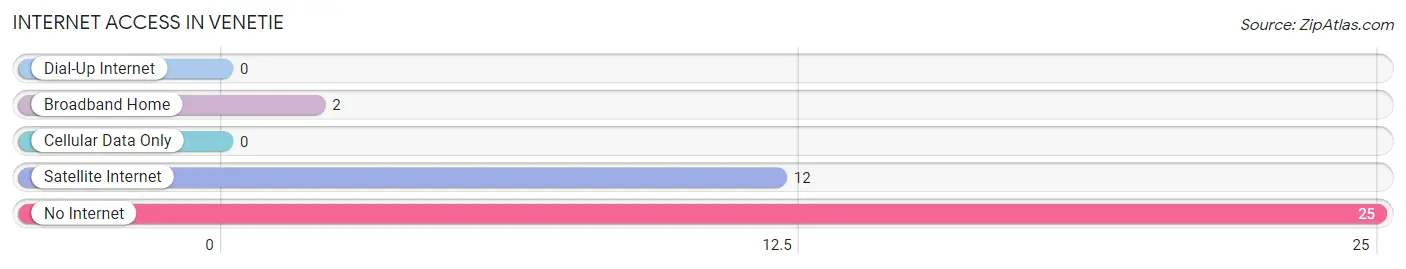
| Internet Type | # Households | % Households |
| Dial-Up Internet | 0 | 0.0% |
| Broadband Home | 2 | 5.1% |
| Cellular Data Only | 0 | 0.0% |
| Satellite Internet | 12 | 30.8% |
| No Internet | 25 | 64.1% |
| Total | 39 | 100.0% |
Venetie Summary
Venetie is a small unincorporated community located in the Arctic Circle in the state of Alaska. It is located in the Northwest Arctic Borough, approximately 40 miles east of the city of Kotzebue. Venetie is home to the Venaqnaqmiut, an Alaska Native people of the Iñupiat culture. The population of Venetie was estimated to be around 200 people in 2020.
History
The Venaqnaqmiut people have lived in the area for thousands of years, and Venetie has been an important settlement for the Iñupiat people since the early 1800s. The name Venetie is derived from the Iñupiat word for “people of the lake”, referring to the nearby lake of the same name. The area was first explored by Europeans in 1826, when the Russian explorer Fyodor Litke visited the area.
In the late 1800s, Venetie was a trading post for the Hudson’s Bay Company. The trading post was established in 1867 and was used to trade furs and other goods with the local Iñupiat people. In the early 1900s, Venetie was a stop on the Alaska Railroad, which connected the town to Fairbanks and other parts of Alaska.
In the 1950s, Venetie was the site of a Cold War-era military base. The base was used to monitor Soviet activity in the Arctic and was home to a radar station and a small airstrip. The base was closed in the 1970s, and the airstrip is now used for recreational purposes.
Geography
Venetie is located in the Arctic Circle in the Northwest Arctic Borough of Alaska. The town is situated on the banks of the Venetie River, which flows into the nearby Venetie Lake. The area is mostly flat, with rolling hills and tundra. The climate is subarctic, with cold winters and short, cool summers.
Economy
The economy of Venetie is largely based on subsistence hunting and fishing. The Venaqnaqmiut people rely on the land and water for their livelihood, and many of the residents are involved in the commercial fishing industry. The town also has a small tourism industry, with visitors coming to experience the unique culture and landscape of the Arctic.
Demographics
The population of Venetie was estimated to be around 200 people in 2020. The majority of the population is Alaska Native, with the Venaqnaqmiut people making up the majority of the population. The median age of the population is 28.5 years, and the median household income is $25,000. The town is served by the Venetie School District, which provides education for students from kindergarten through 12th grade.
Common Questions
What is Per Capita Income in Venetie?
Per Capita income in Venetie is $23,398.
What is the Median Family Income in Venetie?
Median Family Income in Venetie is $59,688.
What is the Median Household income in Venetie?
Median Household Income in Venetie is $58,281.
What is Inequality or Gini Index in Venetie?
Inequality or Gini Index in Venetie is 0.40.
What is the Total Population of Venetie?
Total Population of Venetie is 109.
What is the Total Male Population of Venetie?
Total Male Population of Venetie is 58.
What is the Total Female Population of Venetie?
Total Female Population of Venetie is 51.
What is the Ratio of Males per 100 Females in Venetie?
There are 113.73 Males per 100 Females in Venetie.
What is the Ratio of Females per 100 Males in Venetie?
There are 87.93 Females per 100 Males in Venetie.
What is the Median Population Age in Venetie?
Median Population Age in Venetie is 25.6 Years.
What is the Average Family Size in Venetie
Average Family Size in Venetie is 2.9 People.
What is the Average Household Size in Venetie
Average Household Size in Venetie is 2.8 People.
How Large is the Labor Force in Venetie?
There are 44 People in the Labor Forcein in Venetie.
What is the Percentage of People in the Labor Force in Venetie?
51.8% of People are in the Labor Force in Venetie.
What is the Unemployment Rate in Venetie?
Unemployment Rate in Venetie is 6.8%.