Tok, AK Map & Demographics
Tok Map
Tok Overview
$33,257
PER CAPITA INCOME
$47,344
AVG FAMILY INCOME
$45,156
AVG HOUSEHOLD INCOME
23.8%
WAGE / INCOME GAP [ % ]
76.2¢/ $1
WAGE / INCOME GAP [ $ ]
0.47
INEQUALITY / GINI INDEX
1,352
TOTAL POPULATION
711
MALE POPULATION
641
FEMALE POPULATION
110.92
MALES / 100 FEMALES
90.15
FEMALES / 100 MALES
46.7
MEDIAN AGE
2.9
AVG FAMILY SIZE
2.4
AVG HOUSEHOLD SIZE
581
LABOR FORCE [ PEOPLE ]
50.2%
PERCENT IN LABOR FORCE
8.6%
UNEMPLOYMENT RATE
Tok Zip Codes
Tok Area Codes
Income in Tok
Income Overview in Tok
Per Capita Income in Tok is $33,257, while median incomes of families and households are $47,344 and $45,156 respectively.
| Characteristic | Number | Measure |
| Per Capita Income | 1,352 | $33,257 |
| Median Family Income | 351 | $47,344 |
| Mean Family Income | 351 | $80,062 |
| Median Household Income | 567 | $45,156 |
| Mean Household Income | 567 | $71,614 |
| Income Deficit | 351 | $0 |
| Wage / Income Gap (%) | 1,352 | 23.78% |
| Wage / Income Gap ($) | 1,352 | 76.22¢ per $1 |
| Gini / Inequality Index | 1,352 | 0.47 |
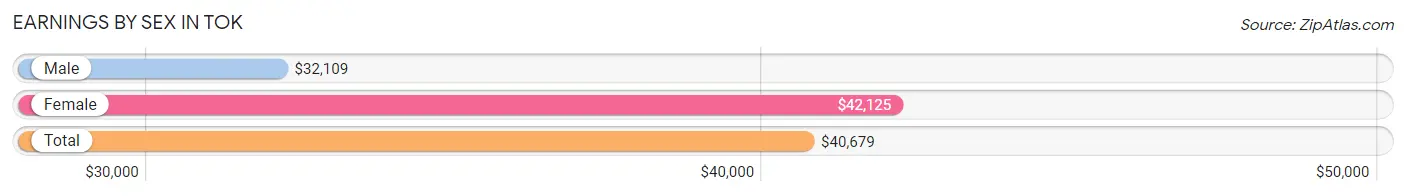
Earnings by Sex in Tok
Average Earnings in Tok are $40,679, $32,109 for men and $42,125 for women, a difference of 23.8%.
| Sex | Number | Average Earnings |
| Male | 343 (59.2%) | $32,109 |
| Female | 236 (40.8%) | $42,125 |
| Total | 579 (100.0%) | $40,679 |
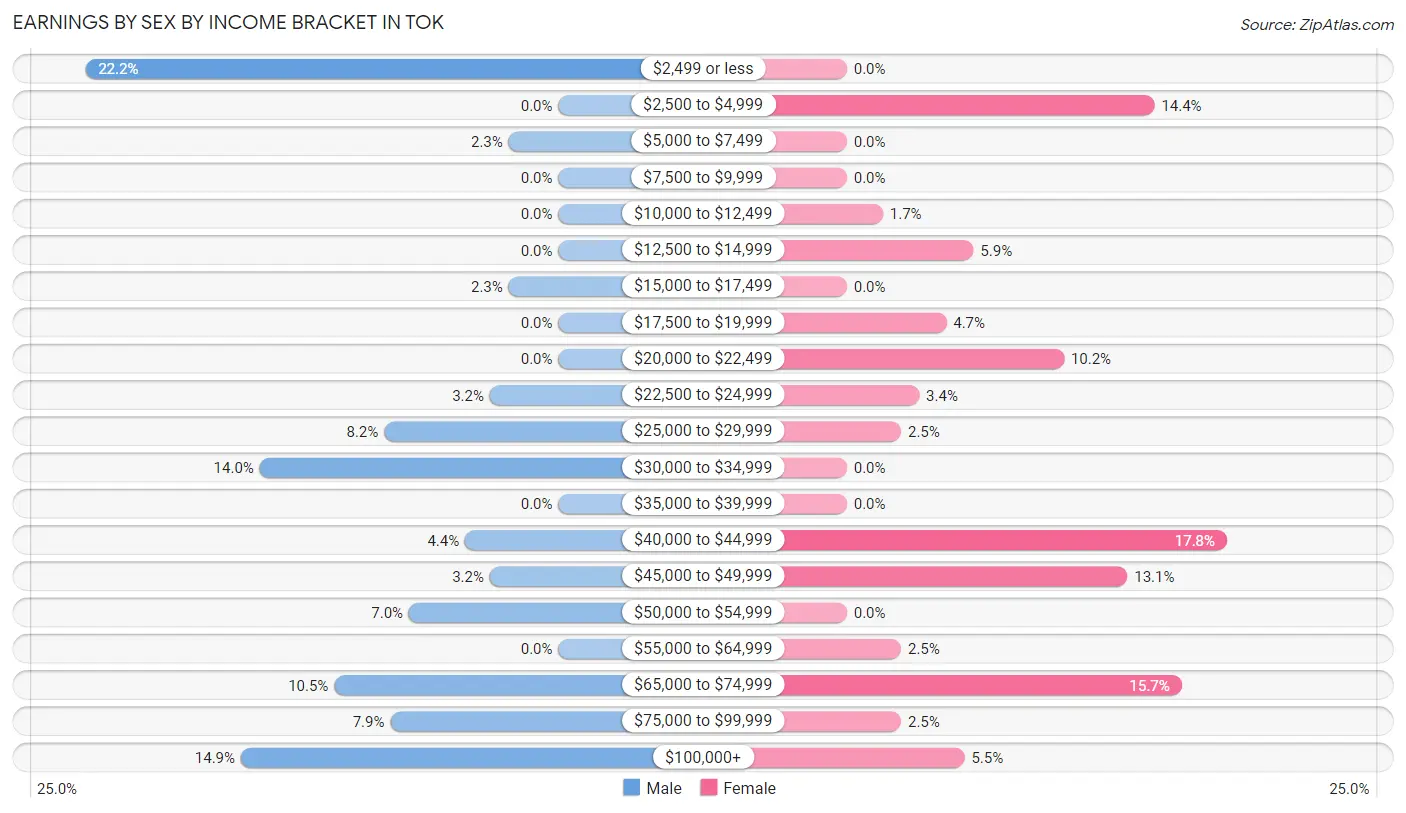
Earnings by Sex by Income Bracket in Tok
The most common earnings brackets in Tok are $2,499 or less for men (76 | 22.2%) and $40,000 to $44,999 for women (42 | 17.8%).
| Income | Male | Female |
| $2,499 or less | 76 (22.2%) | 0 (0.0%) |
| $2,500 to $4,999 | 0 (0.0%) | 34 (14.4%) |
| $5,000 to $7,499 | 8 (2.3%) | 0 (0.0%) |
| $7,500 to $9,999 | 0 (0.0%) | 0 (0.0%) |
| $10,000 to $12,499 | 0 (0.0%) | 4 (1.7%) |
| $12,500 to $14,999 | 0 (0.0%) | 14 (5.9%) |
| $15,000 to $17,499 | 8 (2.3%) | 0 (0.0%) |
| $17,500 to $19,999 | 0 (0.0%) | 11 (4.7%) |
| $20,000 to $22,499 | 0 (0.0%) | 24 (10.2%) |
| $22,500 to $24,999 | 11 (3.2%) | 8 (3.4%) |
| $25,000 to $29,999 | 28 (8.2%) | 6 (2.5%) |
| $30,000 to $34,999 | 48 (14.0%) | 0 (0.0%) |
| $35,000 to $39,999 | 0 (0.0%) | 0 (0.0%) |
| $40,000 to $44,999 | 15 (4.4%) | 42 (17.8%) |
| $45,000 to $49,999 | 11 (3.2%) | 31 (13.1%) |
| $50,000 to $54,999 | 24 (7.0%) | 0 (0.0%) |
| $55,000 to $64,999 | 0 (0.0%) | 6 (2.5%) |
| $65,000 to $74,999 | 36 (10.5%) | 37 (15.7%) |
| $75,000 to $99,999 | 27 (7.9%) | 6 (2.5%) |
| $100,000+ | 51 (14.9%) | 13 (5.5%) |
| Total | 343 (100.0%) | 236 (100.0%) |
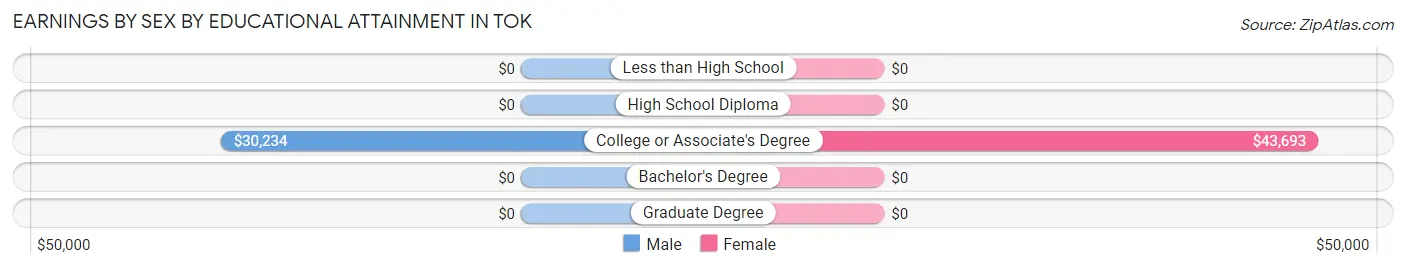
Earnings by Sex by Educational Attainment in Tok
Average earnings in Tok are $32,396 for men and $44,375 for women, a difference of 27.0%. Men with an educational attainment of college or associate's degree enjoy the highest average annual earnings of $30,234, while those with college or associate's degree education earn the least with $30,234. Women with an educational attainment of college or associate's degree earn the most with the average annual earnings of $43,693, while those with college or associate's degree education have the smallest earnings of $43,693.
| Educational Attainment | Male Income | Female Income |
| Less than High School | - | - |
| High School Diploma | - | - |
| College or Associate's Degree | $30,234 | $43,693 |
| Bachelor's Degree | - | - |
| Graduate Degree | - | - |
| Total | $32,396 | $44,375 |
Family Income in Tok
Family Income Brackets in Tok
According to the Tok family income data, there are 64 families falling into the $15,000 to $24,999 income range, which is the most common income bracket and makes up 18.2% of all families. Conversely, the less than $10,000 income bracket is the least frequent group with only 9 families (2.6%) belonging to this category.
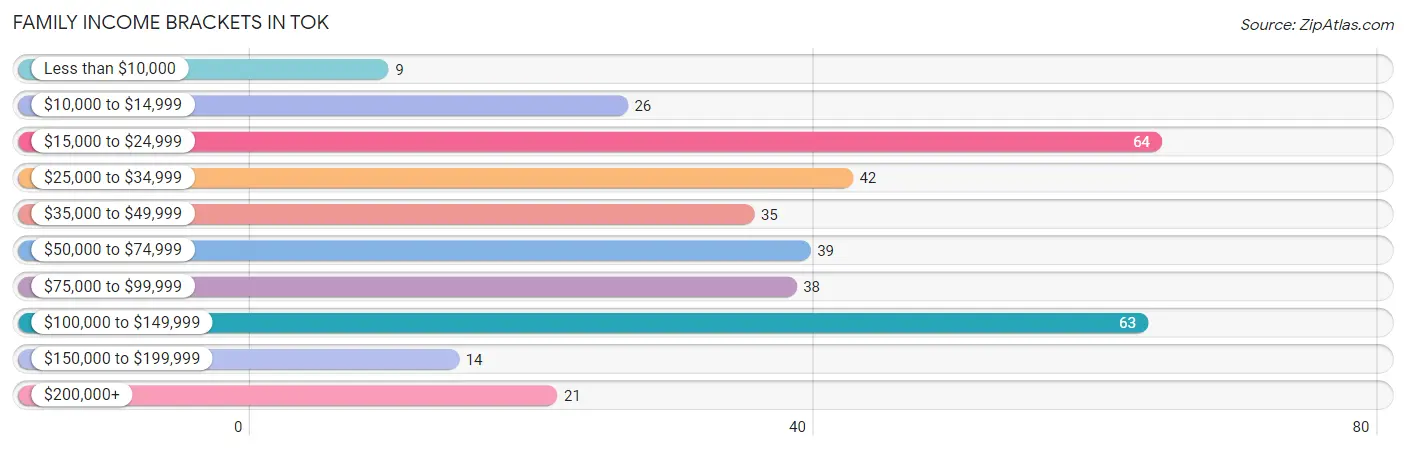
| Income Bracket | # Families | % Families |
| Less than $10,000 | 9 | 2.6% |
| $10,000 to $14,999 | 26 | 7.4% |
| $15,000 to $24,999 | 64 | 18.2% |
| $25,000 to $34,999 | 42 | 12.0% |
| $35,000 to $49,999 | 35 | 10.0% |
| $50,000 to $74,999 | 39 | 11.1% |
| $75,000 to $99,999 | 38 | 10.8% |
| $100,000 to $149,999 | 63 | 17.9% |
| $150,000 to $199,999 | 14 | 4.0% |
| $200,000+ | 21 | 6.0% |
Family Income by Famaliy Size in Tok
3-person families (43 | 12.2%) account for the highest median family income in Tok with $53,828 per family, while 2-person families (249 | 70.9%) have the highest median income of $22,098 per family member.
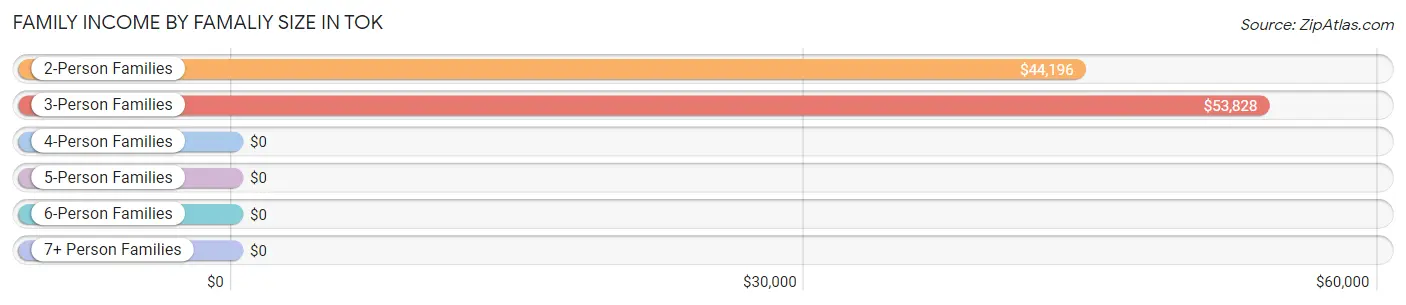
| Income Bracket | # Families | Median Income |
| 2-Person Families | 249 (70.9%) | $44,196 |
| 3-Person Families | 43 (12.2%) | $53,828 |
| 4-Person Families | 51 (14.5%) | $0 |
| 5-Person Families | 0 (0.0%) | $0 |
| 6-Person Families | 0 (0.0%) | $0 |
| 7+ Person Families | 8 (2.3%) | $0 |
| Total | 351 (100.0%) | $47,344 |
Family Income by Number of Earners in Tok
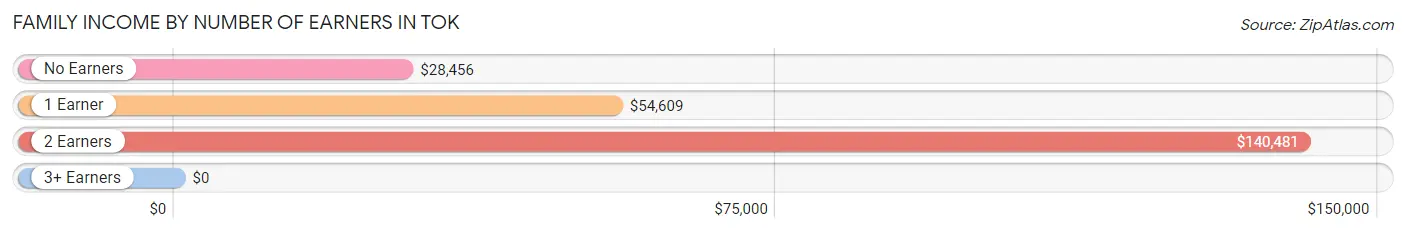
| Number of Earners | # Families | Median Income |
| No Earners | 129 (36.7%) | $28,456 |
| 1 Earner | 131 (37.3%) | $54,609 |
| 2 Earners | 91 (25.9%) | $140,481 |
| 3+ Earners | 0 (0.0%) | $0 |
| Total | 351 (100.0%) | $47,344 |
Household Income in Tok
Household Income Brackets in Tok
With 102 households falling in the category, the $15,000 to $24,999 income range is the most frequent in Tok, accounting for 18.0% of all households. In contrast, only 21 households (3.7%) fall into the $200,000+ income bracket, making it the least populous group.
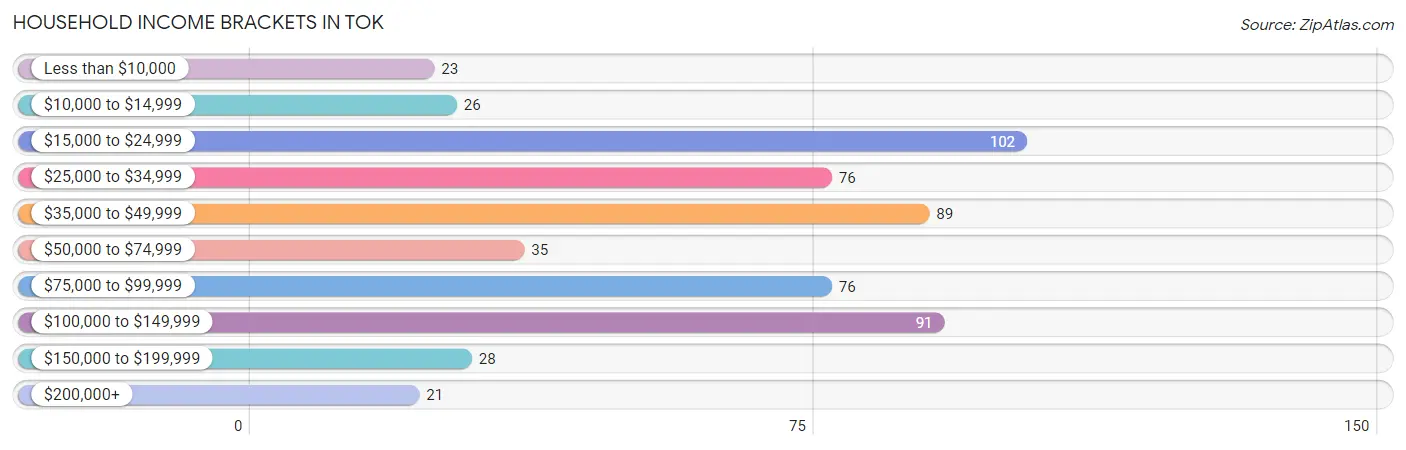
| Income Bracket | # Households | % Households |
| Less than $10,000 | 23 | 4.1% |
| $10,000 to $14,999 | 26 | 4.6% |
| $15,000 to $24,999 | 102 | 18.0% |
| $25,000 to $34,999 | 76 | 13.4% |
| $35,000 to $49,999 | 89 | 15.7% |
| $50,000 to $74,999 | 35 | 6.2% |
| $75,000 to $99,999 | 76 | 13.4% |
| $100,000 to $149,999 | 91 | 16.0% |
| $150,000 to $199,999 | 28 | 4.9% |
| $200,000+ | 21 | 3.7% |
Household Income by Householder Age in Tok
The median household income in Tok is $45,156, with the highest median household income of $77,045 found in the 25 to 44 years age bracket for the primary householder. A total of 188 households (33.2%) fall into this category. Meanwhile, the 15 to 24 years age bracket for the primary householder has the lowest median household income of $0, with 8 households (1.4%) in this group.
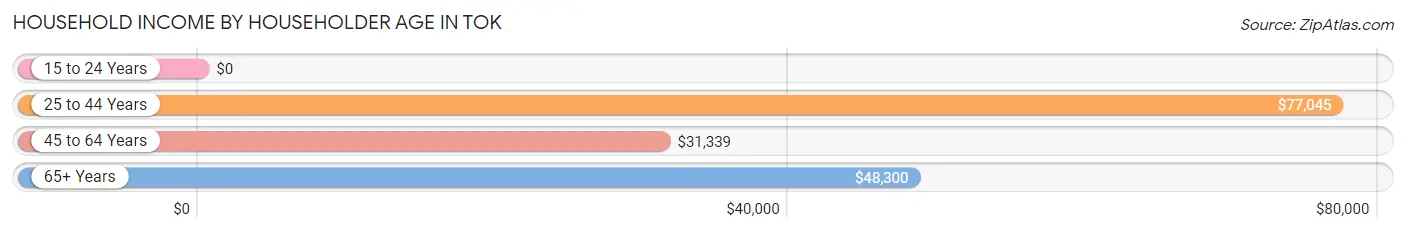
| Income Bracket | # Households | Median Income |
| 15 to 24 Years | 8 (1.4%) | $0 |
| 25 to 44 Years | 188 (33.2%) | $77,045 |
| 45 to 64 Years | 211 (37.2%) | $31,339 |
| 65+ Years | 160 (28.2%) | $48,300 |
| Total | 567 (100.0%) | $45,156 |
Poverty in Tok
Income Below Poverty by Sex and Age in Tok
With 24.7% poverty level for males and 16.7% for females among the residents of Tok, 12 to 14 year old males and 35 to 44 year old females are the most vulnerable to poverty, with 22 males (100.0%) and 37 females (72.6%) in their respective age groups living below the poverty level.
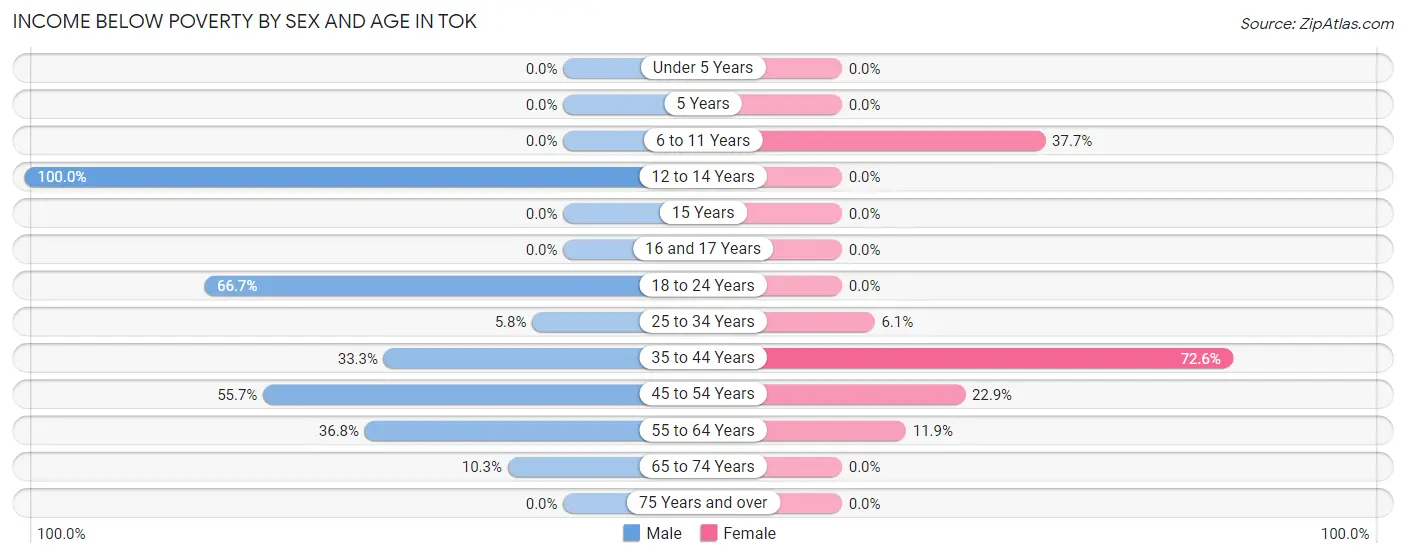
| Age Bracket | Male | Female |
| Under 5 Years | 0 (0.0%) | 0 (0.0%) |
| 5 Years | 0 (0.0%) | 0 (0.0%) |
| 6 to 11 Years | 0 (0.0%) | 20 (37.7%) |
| 12 to 14 Years | 22 (100.0%) | 0 (0.0%) |
| 15 Years | 0 (0.0%) | 0 (0.0%) |
| 16 and 17 Years | 0 (0.0%) | 0 (0.0%) |
| 18 to 24 Years | 22 (66.7%) | 0 (0.0%) |
| 25 to 34 Years | 8 (5.8%) | 6 (6.1%) |
| 35 to 44 Years | 26 (33.3%) | 37 (72.6%) |
| 45 to 54 Years | 39 (55.7%) | 32 (22.9%) |
| 55 to 64 Years | 49 (36.8%) | 12 (11.9%) |
| 65 to 74 Years | 10 (10.3%) | 0 (0.0%) |
| 75 Years and over | 0 (0.0%) | 0 (0.0%) |
| Total | 176 (24.7%) | 107 (16.7%) |
Income Above Poverty by Sex and Age in Tok
According to the poverty statistics in Tok, males aged under 5 years and females aged under 5 years are the age groups that are most secure financially, with 100.0% of males and 100.0% of females in these age groups living above the poverty line.
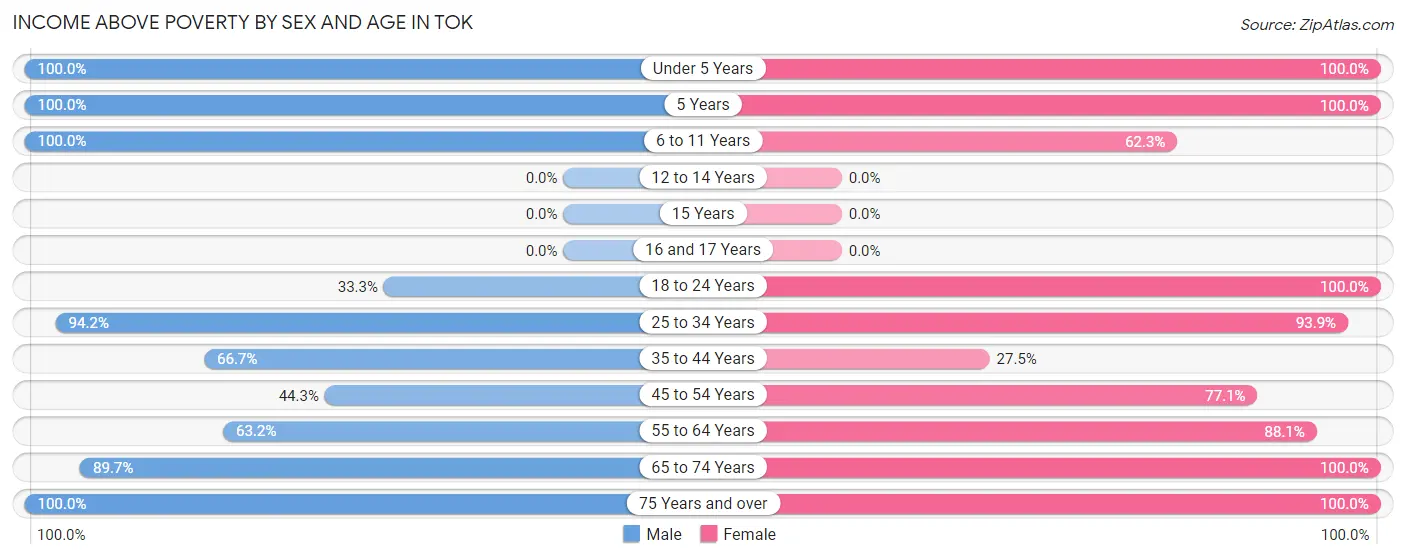
| Age Bracket | Male | Female |
| Under 5 Years | 22 (100.0%) | 24 (100.0%) |
| 5 Years | 8 (100.0%) | 18 (100.0%) |
| 6 to 11 Years | 47 (100.0%) | 33 (62.3%) |
| 12 to 14 Years | 0 (0.0%) | 0 (0.0%) |
| 15 Years | 0 (0.0%) | 0 (0.0%) |
| 16 and 17 Years | 0 (0.0%) | 0 (0.0%) |
| 18 to 24 Years | 11 (33.3%) | 39 (100.0%) |
| 25 to 34 Years | 131 (94.2%) | 93 (93.9%) |
| 35 to 44 Years | 52 (66.7%) | 14 (27.5%) |
| 45 to 54 Years | 31 (44.3%) | 108 (77.1%) |
| 55 to 64 Years | 84 (63.2%) | 89 (88.1%) |
| 65 to 74 Years | 87 (89.7%) | 47 (100.0%) |
| 75 Years and over | 62 (100.0%) | 69 (100.0%) |
| Total | 535 (75.2%) | 534 (83.3%) |
Income Below Poverty Among Married-Couple Families in Tok
The poverty statistics for married-couple families in Tok show that 25.8% or 64 of the total 248 families live below the poverty line. Families with 1 or 2 children have the highest poverty rate of 43.3%, comprising of 26 families. On the other hand, families with 3 or 4 children have the lowest poverty rate of 0.0%, which includes 0 families.
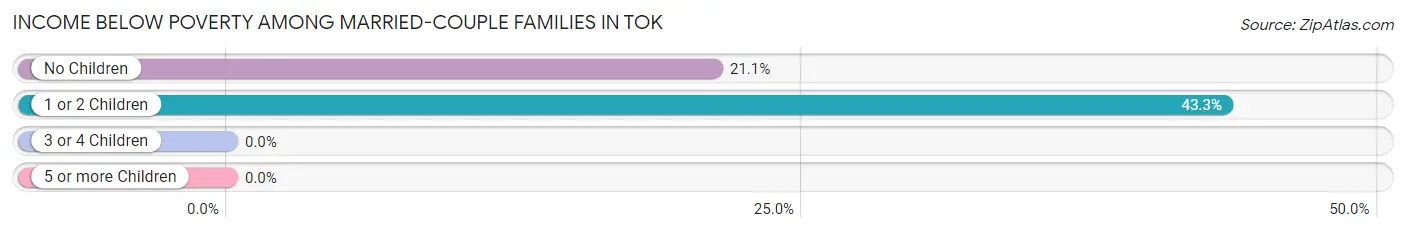
| Children | Above Poverty | Below Poverty |
| No Children | 142 (78.9%) | 38 (21.1%) |
| 1 or 2 Children | 34 (56.7%) | 26 (43.3%) |
| 3 or 4 Children | 8 (100.0%) | 0 (0.0%) |
| 5 or more Children | 0 (0.0%) | 0 (0.0%) |
| Total | 184 (74.2%) | 64 (25.8%) |
Income Below Poverty Among Single-Parent Households in Tok
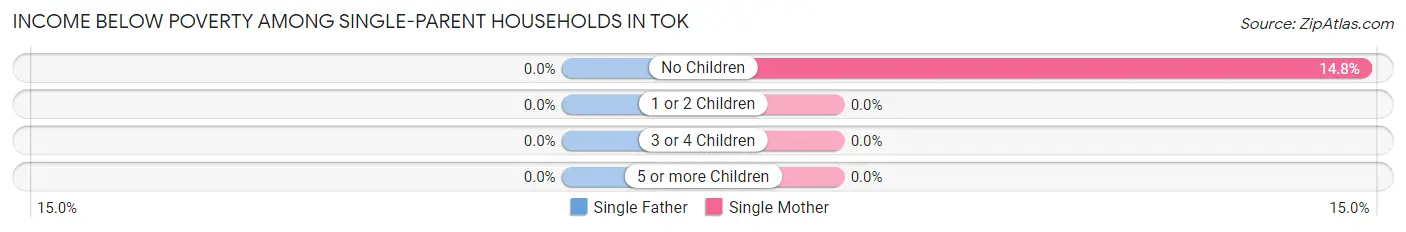
| Children | Single Father | Single Mother |
| No Children | 0 (0.0%) | 9 (14.7%) |
| 1 or 2 Children | 0 (0.0%) | 0 (0.0%) |
| 3 or 4 Children | 0 (0.0%) | 0 (0.0%) |
| 5 or more Children | 0 (0.0%) | 0 (0.0%) |
| Total | 0 (0.0%) | 9 (11.4%) |
Income Below Poverty Among Married-Couple vs Single-Parent Households in Tok
The poverty data for Tok shows that 64 of the married-couple family households (25.8%) and 9 of the single-parent households (8.7%) are living below the poverty level. Within the married-couple family households, those with 1 or 2 children have the highest poverty rate, with 26 households (43.3%) falling below the poverty line. Among the single-parent households, those with no children have the highest poverty rate, with 9 household (14.7%) living below poverty.
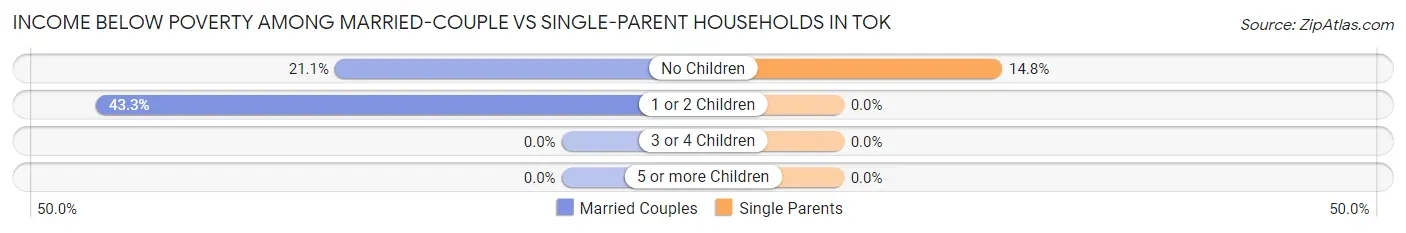
| Children | Married-Couple Families | Single-Parent Households |
| No Children | 38 (21.1%) | 9 (14.7%) |
| 1 or 2 Children | 26 (43.3%) | 0 (0.0%) |
| 3 or 4 Children | 0 (0.0%) | 0 (0.0%) |
| 5 or more Children | 0 (0.0%) | 0 (0.0%) |
| Total | 64 (25.8%) | 9 (8.7%) |
Race in Tok
The most populous races in Tok are White / Caucasian (1,044 | 77.2%), Native / Alaskan (207 | 15.3%), and Two or more Races (89 | 6.6%).
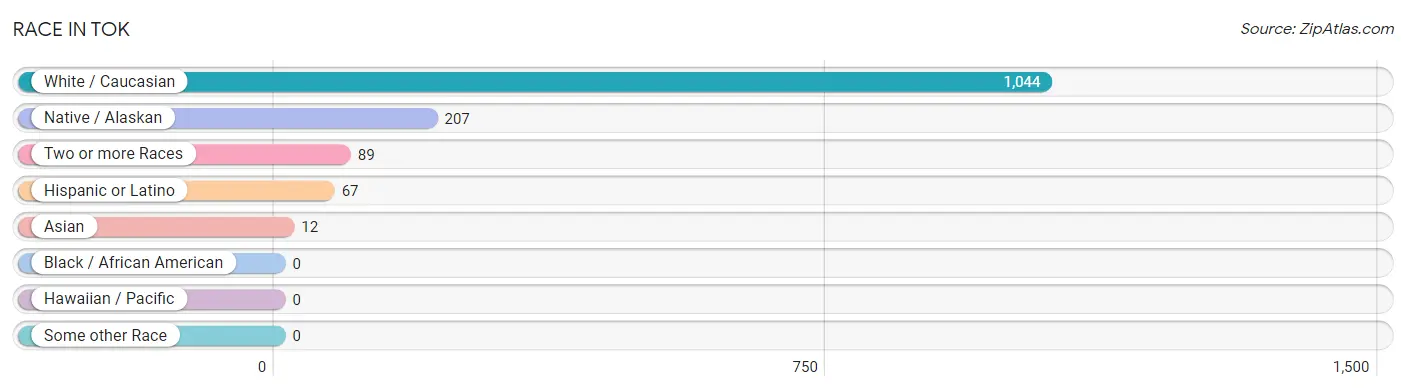
| Race | # Population | % Population |
| Asian | 12 | 0.9% |
| Black / African American | 0 | 0.0% |
| Hawaiian / Pacific | 0 | 0.0% |
| Hispanic or Latino | 67 | 5.0% |
| Native / Alaskan | 207 | 15.3% |
| White / Caucasian | 1,044 | 77.2% |
| Two or more Races | 89 | 6.6% |
| Some other Race | 0 | 0.0% |
| Total | 1,352 | 100.0% |
Ancestry in Tok
The most populous ancestries reported in Tok are Alaskan Athabascan (235 | 17.4%), German (189 | 14.0%), English (154 | 11.4%), Irish (143 | 10.6%), and Scotch-Irish (96 | 7.1%), together accounting for 60.4% of all Tok residents.
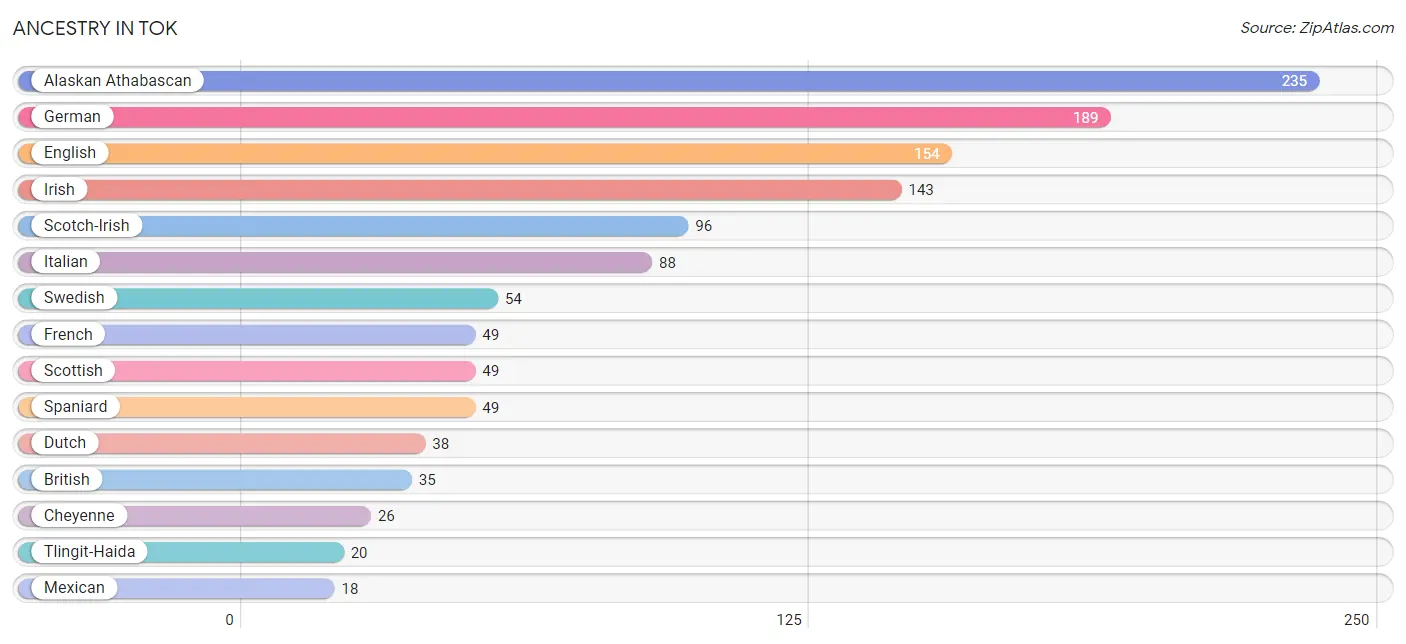
| Ancestry | # Population | % Population |
| Alaskan Athabascan | 235 | 17.4% |
| British | 35 | 2.6% |
| Cheyenne | 26 | 1.9% |
| Dutch | 38 | 2.8% |
| English | 154 | 11.4% |
| European | 10 | 0.7% |
| French | 49 | 3.6% |
| French Canadian | 3 | 0.2% |
| German | 189 | 14.0% |
| Irish | 143 | 10.6% |
| Iroquois | 9 | 0.7% |
| Italian | 88 | 6.5% |
| Mexican | 18 | 1.3% |
| Norwegian | 10 | 0.7% |
| Pakistani | 12 | 0.9% |
| Polish | 14 | 1.0% |
| Scandinavian | 14 | 1.0% |
| Scotch-Irish | 96 | 7.1% |
| Scottish | 49 | 3.6% |
| Slavic | 8 | 0.6% |
| Slovene | 14 | 1.0% |
| Spaniard | 49 | 3.6% |
| Swedish | 54 | 4.0% |
| Swiss | 14 | 1.0% |
| Tlingit-Haida | 20 | 1.5% |
| Welsh | 18 | 1.3% |
| Yup'ik | 6 | 0.4% | View All 27 Rows |
Immigrants in Tok
The most numerous immigrant groups reported in Tok came from Europe (26 | 1.9%), Netherlands (18 | 1.3%), Western Europe (18 | 1.3%), Asia (12 | 0.9%), and South Eastern Asia (12 | 0.9%), together accounting for 6.4% of all Tok residents.
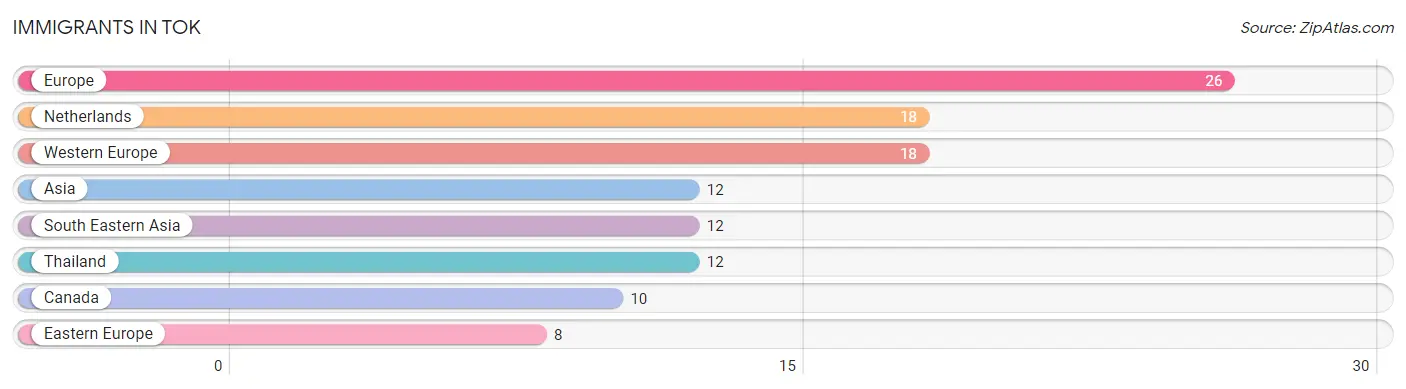
| Immigration Origin | # Population | % Population |
| Asia | 12 | 0.9% |
| Canada | 10 | 0.7% |
| Eastern Europe | 8 | 0.6% |
| Europe | 26 | 1.9% |
| Netherlands | 18 | 1.3% |
| South Eastern Asia | 12 | 0.9% |
| Thailand | 12 | 0.9% |
| Western Europe | 18 | 1.3% | View All 8 Rows |
Sex and Age in Tok
Sex and Age in Tok
The most populous age groups in Tok are 25 to 29 Years (98 | 13.8%) for men and 50 to 54 Years (90 | 14.0%) for women.
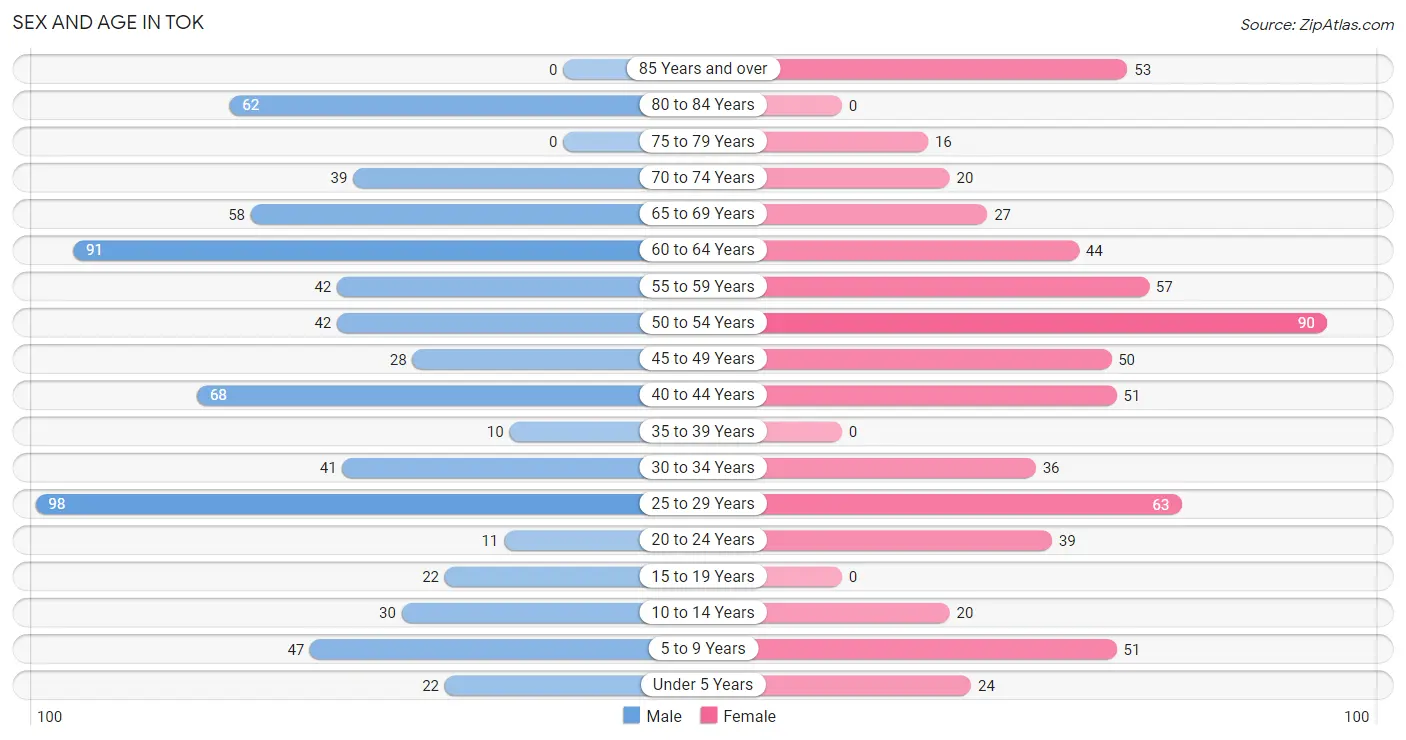
| Age Bracket | Male | Female |
| Under 5 Years | 22 (3.1%) | 24 (3.7%) |
| 5 to 9 Years | 47 (6.6%) | 51 (8.0%) |
| 10 to 14 Years | 30 (4.2%) | 20 (3.1%) |
| 15 to 19 Years | 22 (3.1%) | 0 (0.0%) |
| 20 to 24 Years | 11 (1.5%) | 39 (6.1%) |
| 25 to 29 Years | 98 (13.8%) | 63 (9.8%) |
| 30 to 34 Years | 41 (5.8%) | 36 (5.6%) |
| 35 to 39 Years | 10 (1.4%) | 0 (0.0%) |
| 40 to 44 Years | 68 (9.6%) | 51 (8.0%) |
| 45 to 49 Years | 28 (3.9%) | 50 (7.8%) |
| 50 to 54 Years | 42 (5.9%) | 90 (14.0%) |
| 55 to 59 Years | 42 (5.9%) | 57 (8.9%) |
| 60 to 64 Years | 91 (12.8%) | 44 (6.9%) |
| 65 to 69 Years | 58 (8.2%) | 27 (4.2%) |
| 70 to 74 Years | 39 (5.5%) | 20 (3.1%) |
| 75 to 79 Years | 0 (0.0%) | 16 (2.5%) |
| 80 to 84 Years | 62 (8.7%) | 0 (0.0%) |
| 85 Years and over | 0 (0.0%) | 53 (8.3%) |
| Total | 711 (100.0%) | 641 (100.0%) |
Families and Households in Tok
Median Family Size in Tok
The median family size in Tok is 2.91 persons per family, with single female/mother families (79 | 22.5%) accounting for the largest median family size of 3.2 persons per family. On the other hand, single male/father families (24 | 6.8%) represent the smallest median family size with 2.63 persons per family.
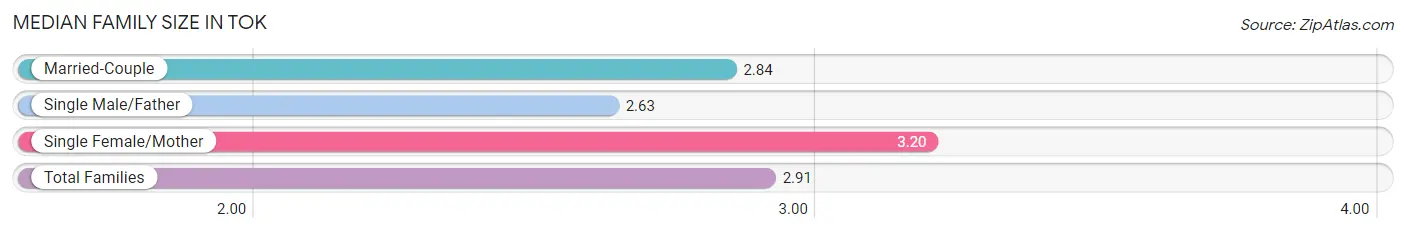
| Family Type | # Families | Family Size |
| Married-Couple | 248 (70.7%) | 2.84 |
| Single Male/Father | 24 (6.8%) | 2.63 |
| Single Female/Mother | 79 (22.5%) | 3.20 |
| Total Families | 351 (100.0%) | 2.91 |
Median Household Size in Tok
The median household size in Tok is 2.38 persons per household, with single female/mother households (79 | 13.9%) accounting for the largest median household size of 3.2 persons per household. non-family households (216 | 38.1%) represent the smallest median household size with 1.48 persons per household.
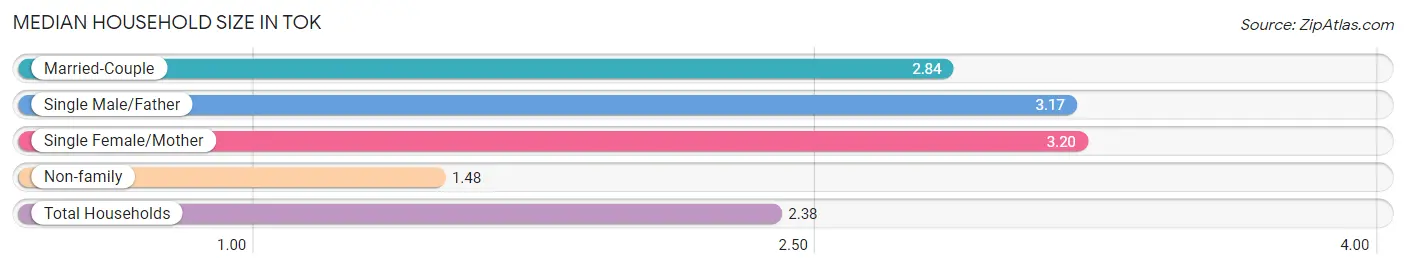
| Household Type | # Households | Household Size |
| Married-Couple | 248 (43.7%) | 2.84 |
| Single Male/Father | 24 (4.2%) | 3.17 |
| Single Female/Mother | 79 (13.9%) | 3.20 |
| Non-family | 216 (38.1%) | 1.48 |
| Total Households | 567 (100.0%) | 2.38 |
Household Size by Marriage Status in Tok
Out of a total of 567 households in Tok, 351 (61.9%) are family households, while 216 (38.1%) are nonfamily households. The most numerous type of family households are 2-person households, comprising 249, and the most common type of nonfamily households are 1-person households, comprising 148.
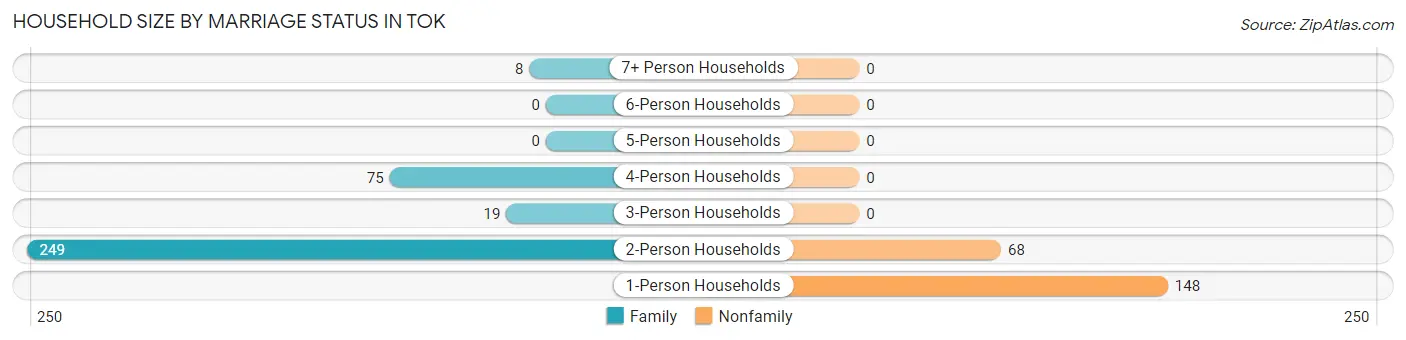
| Household Size | Family Households | Nonfamily Households |
| 1-Person Households | - | 148 (26.1%) |
| 2-Person Households | 249 (43.9%) | 68 (12.0%) |
| 3-Person Households | 19 (3.4%) | 0 (0.0%) |
| 4-Person Households | 75 (13.2%) | 0 (0.0%) |
| 5-Person Households | 0 (0.0%) | 0 (0.0%) |
| 6-Person Households | 0 (0.0%) | 0 (0.0%) |
| 7+ Person Households | 8 (1.4%) | 0 (0.0%) |
| Total | 351 (61.9%) | 216 (38.1%) |
Female Fertility in Tok
Fertility by Age in Tok
Average fertility rate in Tok is 16.0 births per 1,000 women. Women in the age bracket of 20 to 34 years have the highest fertility rate with 29.0 births per 1,000 women. Women in the age bracket of 20 to 34 years acount for 100.0% of all women with births.
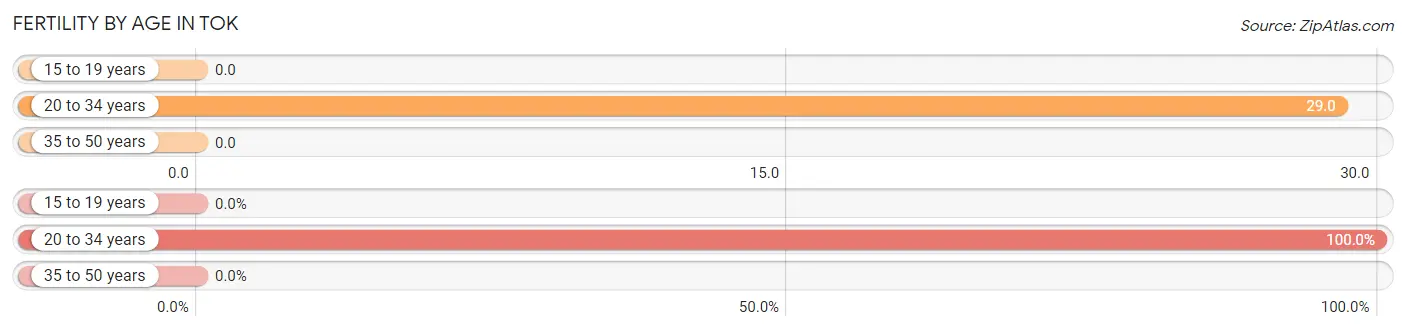
| Age Bracket | Women with Births | Births / 1,000 Women |
| 15 to 19 years | 0 (0.0%) | 0.0 |
| 20 to 34 years | 4 (100.0%) | 29.0 |
| 35 to 50 years | 0 (0.0%) | 0.0 |
| Total | 4 (100.0%) | 16.0 |
Fertility by Age by Marriage Status in Tok
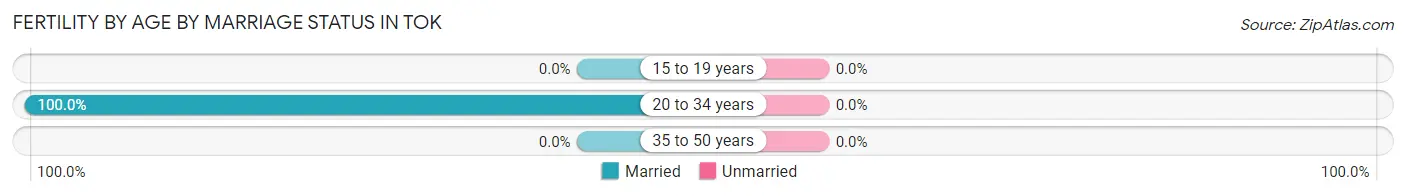
| Age Bracket | Married | Unmarried |
| 15 to 19 years | 0 (0.0%) | 0 (0.0%) |
| 20 to 34 years | 4 (100.0%) | 0 (0.0%) |
| 35 to 50 years | 0 (0.0%) | 0 (0.0%) |
| Total | 4 (100.0%) | 0 (0.0%) |
Fertility by Education in Tok
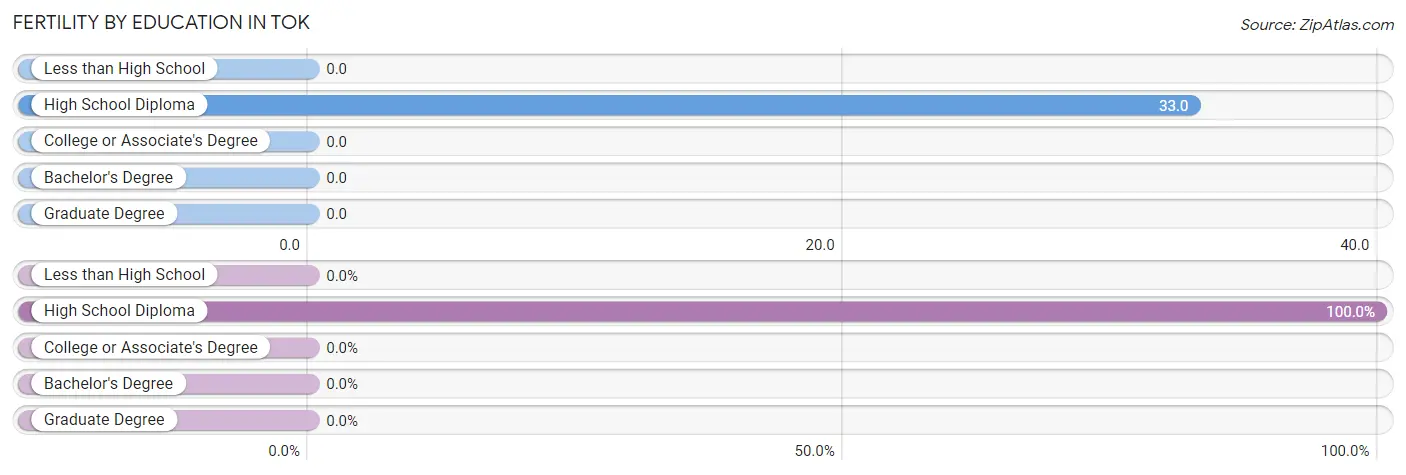
| Educational Attainment | Women with Births | Births / 1,000 Women |
| Less than High School | 0 (0.0%) | 0.0 |
| High School Diploma | 4 (100.0%) | 33.0 |
| College or Associate's Degree | 0 (0.0%) | 0.0 |
| Bachelor's Degree | 0 (0.0%) | 0.0 |
| Graduate Degree | 0 (0.0%) | 0.0 |
| Total | 4 (100.0%) | 16.0 |
Fertility by Education by Marriage Status in Tok
| Educational Attainment | Married | Unmarried |
| Less than High School | 0 (0.0%) | 0 (0.0%) |
| High School Diploma | 4 (100.0%) | 0 (0.0%) |
| College or Associate's Degree | 0 (0.0%) | 0 (0.0%) |
| Bachelor's Degree | 0 (0.0%) | 0 (0.0%) |
| Graduate Degree | 0 (0.0%) | 0 (0.0%) |
| Total | 4 (100.0%) | 0 (0.0%) |
Employment Characteristics in Tok
Employment by Class of Employer in Tok
Among the 531 employed individuals in Tok, private company employees (267 | 50.3%), state government employees (134 | 25.2%), and not-for-profit organizations (43 | 8.1%) make up the most common classes of employment.
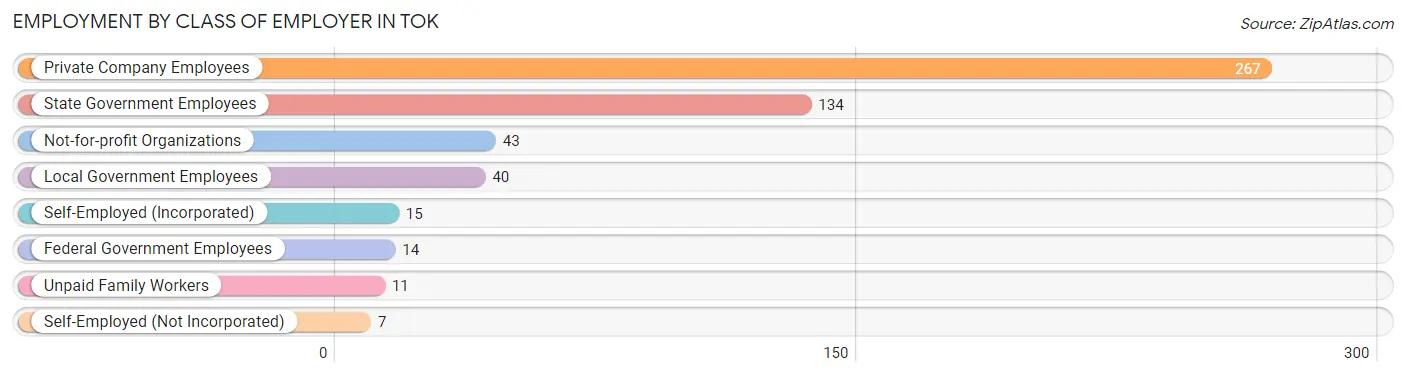
| Employer Class | # Employees | % Employees |
| Private Company Employees | 267 | 50.3% |
| Self-Employed (Incorporated) | 15 | 2.8% |
| Self-Employed (Not Incorporated) | 7 | 1.3% |
| Not-for-profit Organizations | 43 | 8.1% |
| Local Government Employees | 40 | 7.5% |
| State Government Employees | 134 | 25.2% |
| Federal Government Employees | 14 | 2.6% |
| Unpaid Family Workers | 11 | 2.1% |
| Total | 531 | 100.0% |
Employment Status by Age in Tok
According to the labor force statistics for Tok, out of the total population over 16 years of age (1,158), 50.2% or 581 individuals are in the labor force, with 8.6% or 50 of them unemployed. The age group with the highest labor force participation rate is 25 to 29 years, with 88.2% or 142 individuals in the labor force. Within the labor force, the 35 to 44 years age range has the highest percentage of unemployed individuals, with 24.5% or 26 of them being unemployed.
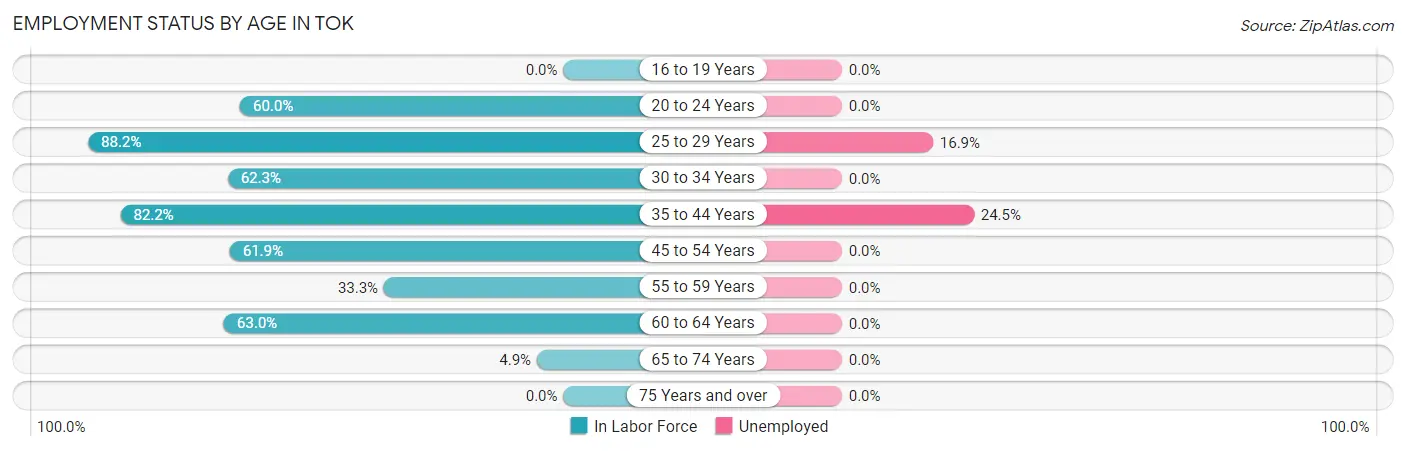
| Age Bracket | In Labor Force | Unemployed |
| 16 to 19 Years | 0 (0.0%) | 0 (0.0%) |
| 20 to 24 Years | 30 (60.0%) | 0 (0.0%) |
| 25 to 29 Years | 142 (88.2%) | 24 (16.9%) |
| 30 to 34 Years | 48 (62.3%) | 0 (0.0%) |
| 35 to 44 Years | 106 (82.2%) | 26 (24.5%) |
| 45 to 54 Years | 130 (61.9%) | 0 (0.0%) |
| 55 to 59 Years | 33 (33.3%) | 0 (0.0%) |
| 60 to 64 Years | 85 (63.0%) | 0 (0.0%) |
| 65 to 74 Years | 7 (4.9%) | 0 (0.0%) |
| 75 Years and over | 0 (0.0%) | 0 (0.0%) |
| Total | 581 (50.2%) | 50 (8.6%) |
Employment Status by Educational Attainment in Tok
According to labor force statistics for Tok, 67.1% of individuals (544) out of the total population between 25 and 64 years of age (811) are in the labor force, with 9.2% or 50 of them being unemployed. The group with the highest labor force participation rate are those with the educational attainment of college / associate degree, with 76.0% or 311 individuals in the labor force. Within the labor force, individuals with less than high school education have the highest percentage of unemployment, with 100.0% or 26 of them being unemployed.
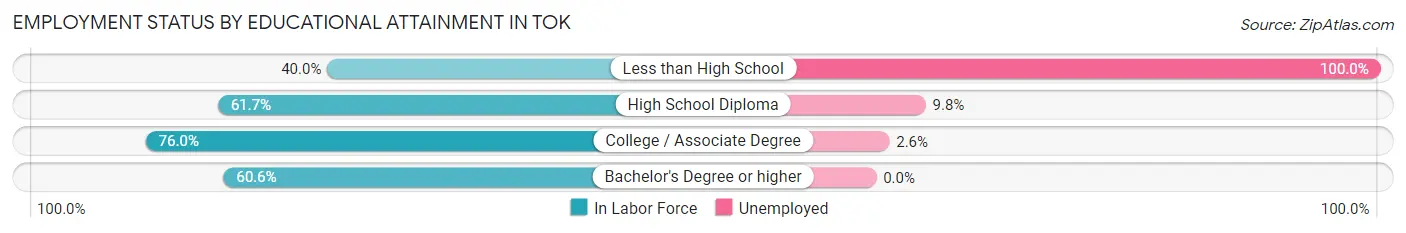
| Educational Attainment | In Labor Force | Unemployed |
| Less than High School | 26 (40.0%) | 65 (100.0%) |
| High School Diploma | 164 (61.7%) | 26 (9.8%) |
| College / Associate Degree | 311 (76.0%) | 11 (2.6%) |
| Bachelor's Degree or higher | 43 (60.6%) | 0 (0.0%) |
| Total | 544 (67.1%) | 75 (9.2%) |
Employment Occupations by Sex in Tok
Management, Business, Science and Arts Occupations
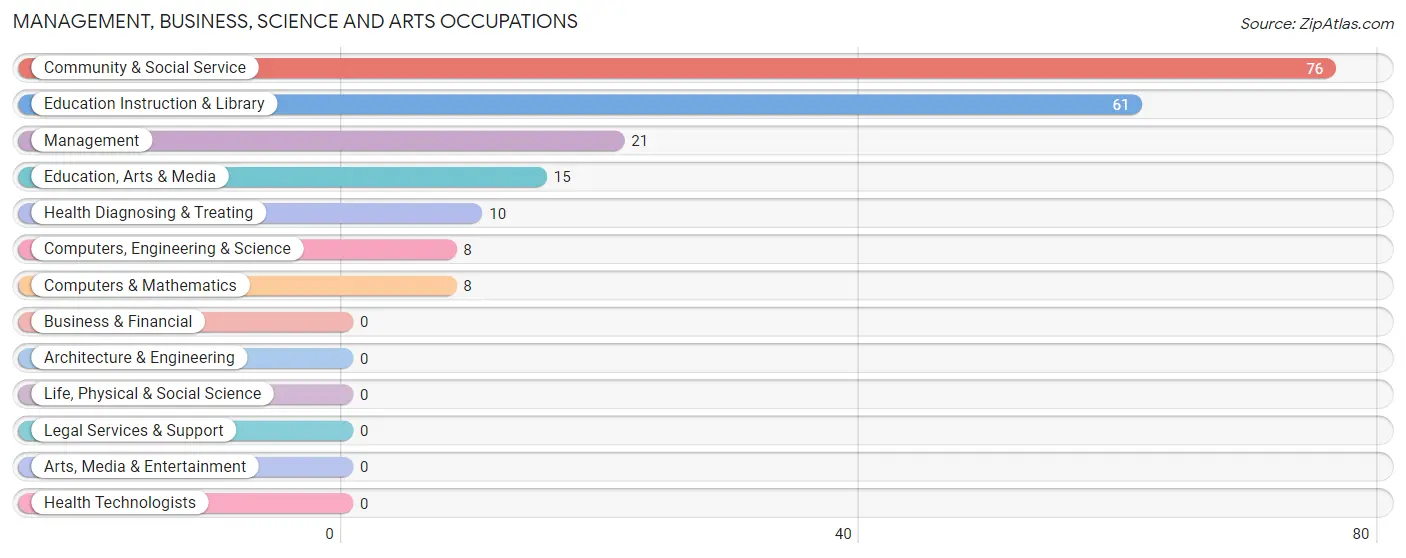
The most common Management, Business, Science and Arts occupations in Tok are Community & Social Service (76 | 14.3%), Education Instruction & Library (61 | 11.5%), Management (21 | 4.0%), Education, Arts & Media (15 | 2.8%), and Health Diagnosing & Treating (10 | 1.9%).
Management, Business, Science and Arts Occupations by Sex
Within the Management, Business, Science and Arts occupations in Tok, the most male-oriented occupations are Computers, Engineering & Science (100.0%), Computers & Mathematics (100.0%), and Education, Arts & Media (100.0%), while the most female-oriented occupations are Health Diagnosing & Treating (100.0%), Education Instruction & Library (77.0%), and Management (61.9%).
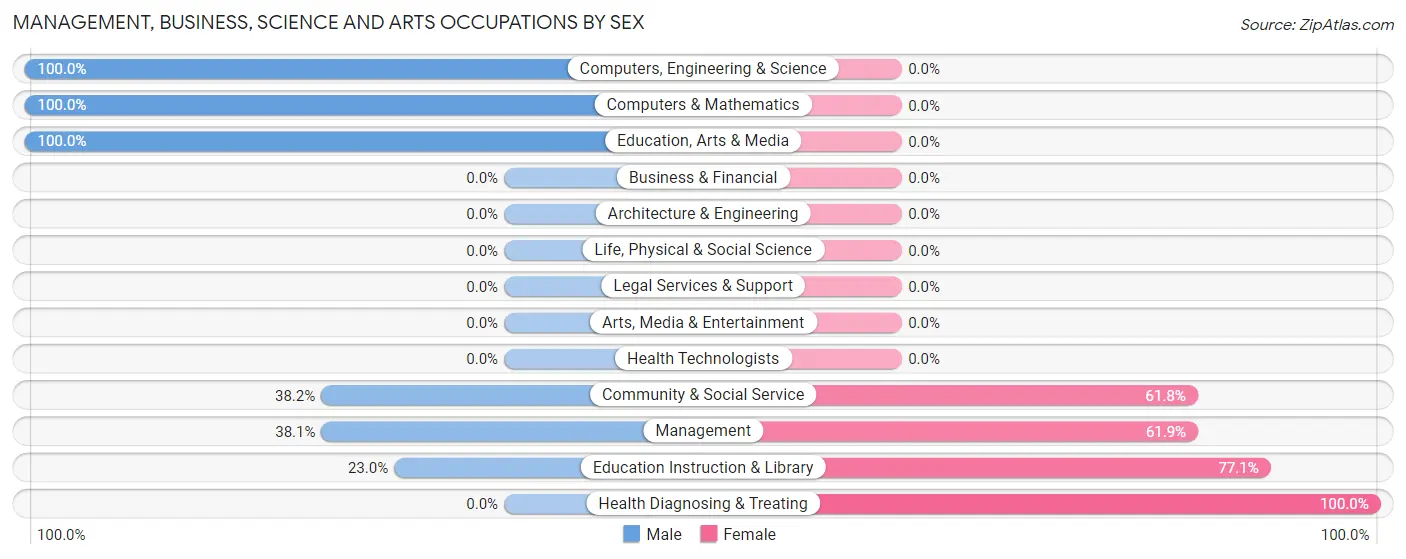
| Occupation | Male | Female |
| Management | 8 (38.1%) | 13 (61.9%) |
| Business & Financial | 0 (0.0%) | 0 (0.0%) |
| Computers, Engineering & Science | 8 (100.0%) | 0 (0.0%) |
| Computers & Mathematics | 8 (100.0%) | 0 (0.0%) |
| Architecture & Engineering | 0 (0.0%) | 0 (0.0%) |
| Life, Physical & Social Science | 0 (0.0%) | 0 (0.0%) |
| Community & Social Service | 29 (38.2%) | 47 (61.8%) |
| Education, Arts & Media | 15 (100.0%) | 0 (0.0%) |
| Legal Services & Support | 0 (0.0%) | 0 (0.0%) |
| Education Instruction & Library | 14 (23.0%) | 47 (77.0%) |
| Arts, Media & Entertainment | 0 (0.0%) | 0 (0.0%) |
| Health Diagnosing & Treating | 0 (0.0%) | 10 (100.0%) |
| Health Technologists | 0 (0.0%) | 0 (0.0%) |
| Total (Category) | 45 (39.1%) | 70 (60.9%) |
| Total (Overall) | 315 (59.3%) | 216 (40.7%) |
Services Occupations
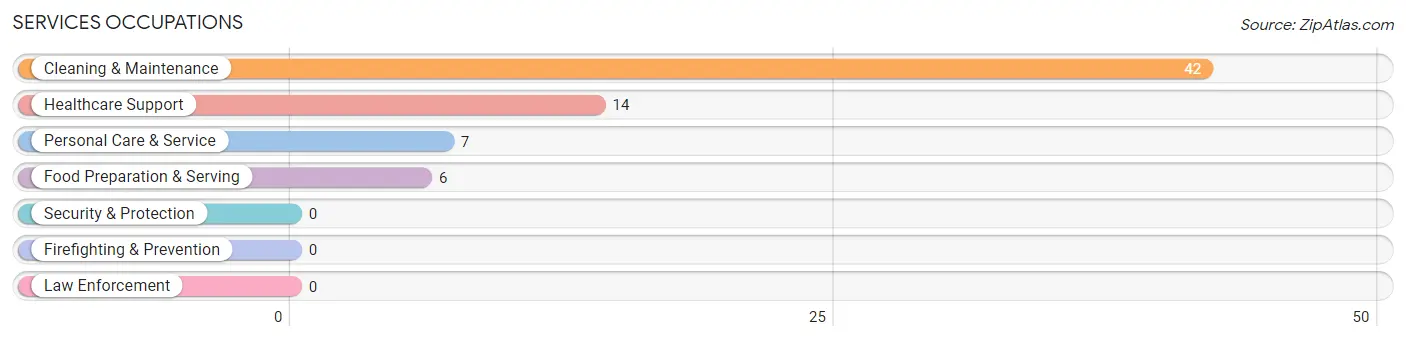
The most common Services occupations in Tok are Cleaning & Maintenance (42 | 7.9%), Healthcare Support (14 | 2.6%), Personal Care & Service (7 | 1.3%), and Food Preparation & Serving (6 | 1.1%).
Services Occupations by Sex
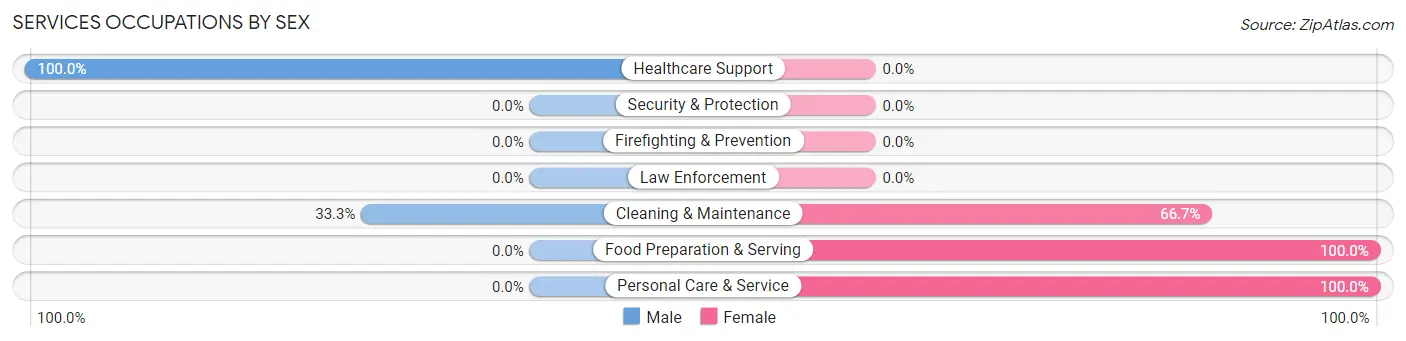
Within the Services occupations in Tok, the most male-oriented occupations are Healthcare Support (100.0%), and Cleaning & Maintenance (33.3%), while the most female-oriented occupations are Food Preparation & Serving (100.0%), Personal Care & Service (100.0%), and Cleaning & Maintenance (66.7%).
| Occupation | Male | Female |
| Healthcare Support | 14 (100.0%) | 0 (0.0%) |
| Security & Protection | 0 (0.0%) | 0 (0.0%) |
| Firefighting & Prevention | 0 (0.0%) | 0 (0.0%) |
| Law Enforcement | 0 (0.0%) | 0 (0.0%) |
| Food Preparation & Serving | 0 (0.0%) | 6 (100.0%) |
| Cleaning & Maintenance | 14 (33.3%) | 28 (66.7%) |
| Personal Care & Service | 0 (0.0%) | 7 (100.0%) |
| Total (Category) | 28 (40.6%) | 41 (59.4%) |
| Total (Overall) | 315 (59.3%) | 216 (40.7%) |
Sales and Office Occupations
The most common Sales and Office occupations in Tok are Office & Administration (68 | 12.8%), and Sales & Related (59 | 11.1%).
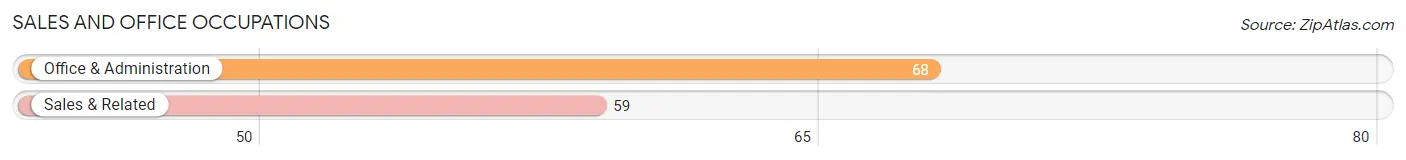
Sales and Office Occupations by Sex
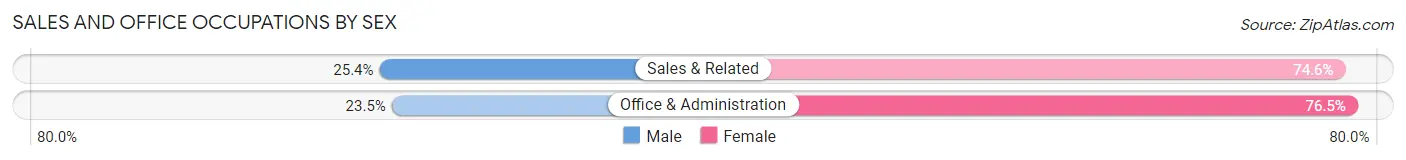
| Occupation | Male | Female |
| Sales & Related | 15 (25.4%) | 44 (74.6%) |
| Office & Administration | 16 (23.5%) | 52 (76.5%) |
| Total (Category) | 31 (24.4%) | 96 (75.6%) |
| Total (Overall) | 315 (59.3%) | 216 (40.7%) |
Natural Resources, Construction and Maintenance Occupations
The most common Natural Resources, Construction and Maintenance occupations in Tok are , and Construction & Extraction (117 | 22.0%).
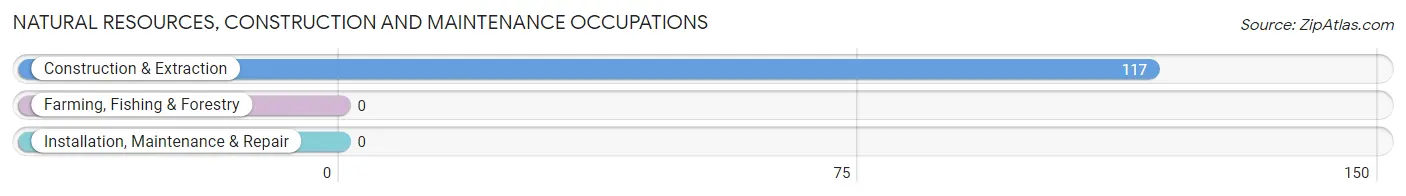
Natural Resources, Construction and Maintenance Occupations by Sex
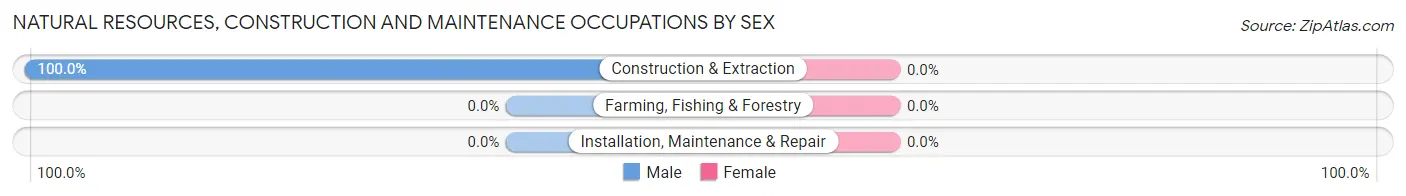
| Occupation | Male | Female |
| Farming, Fishing & Forestry | 0 (0.0%) | 0 (0.0%) |
| Construction & Extraction | 117 (100.0%) | 0 (0.0%) |
| Installation, Maintenance & Repair | 0 (0.0%) | 0 (0.0%) |
| Total (Category) | 117 (100.0%) | 0 (0.0%) |
| Total (Overall) | 315 (59.3%) | 216 (40.7%) |
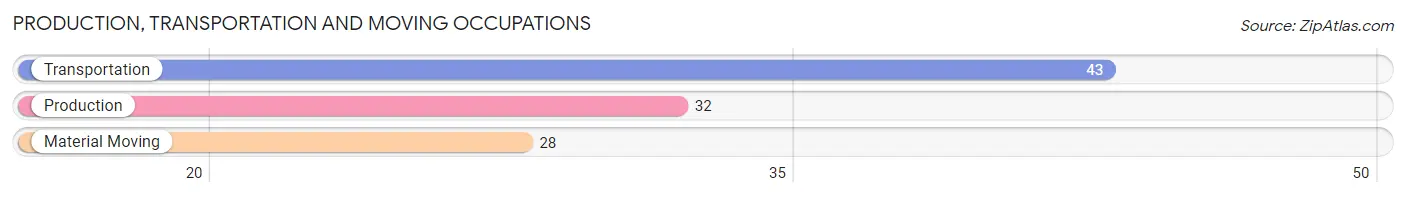
Production, Transportation and Moving Occupations
The most common Production, Transportation and Moving occupations in Tok are Transportation (43 | 8.1%), Production (32 | 6.0%), and Material Moving (28 | 5.3%).
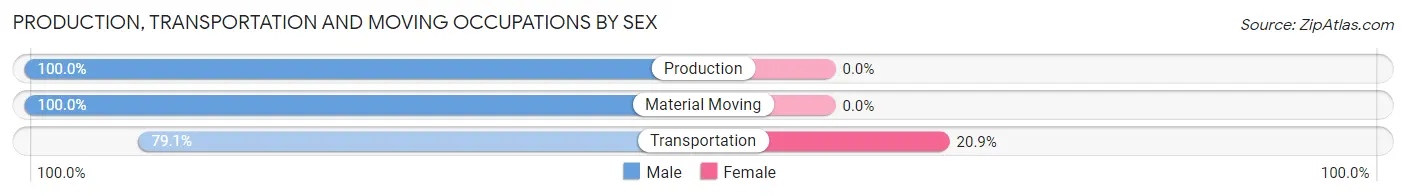
Production, Transportation and Moving Occupations by Sex
| Occupation | Male | Female |
| Production | 32 (100.0%) | 0 (0.0%) |
| Transportation | 34 (79.1%) | 9 (20.9%) |
| Material Moving | 28 (100.0%) | 0 (0.0%) |
| Total (Category) | 94 (91.3%) | 9 (8.7%) |
| Total (Overall) | 315 (59.3%) | 216 (40.7%) |
Employment Industries by Sex in Tok
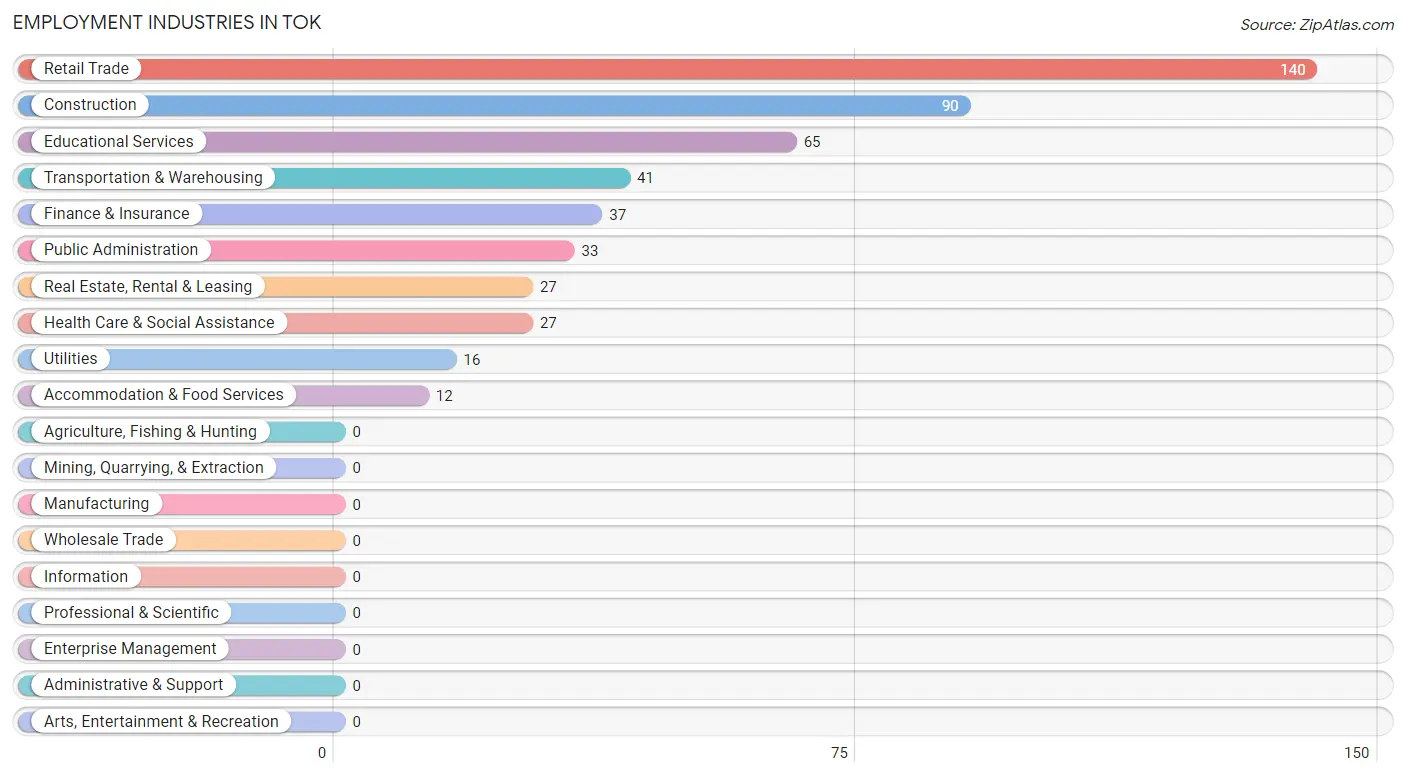
Employment Industries in Tok
The major employment industries in Tok include Retail Trade (140 | 26.4%), Construction (90 | 17.0%), Educational Services (65 | 12.2%), Transportation & Warehousing (41 | 7.7%), and Finance & Insurance (37 | 7.0%).
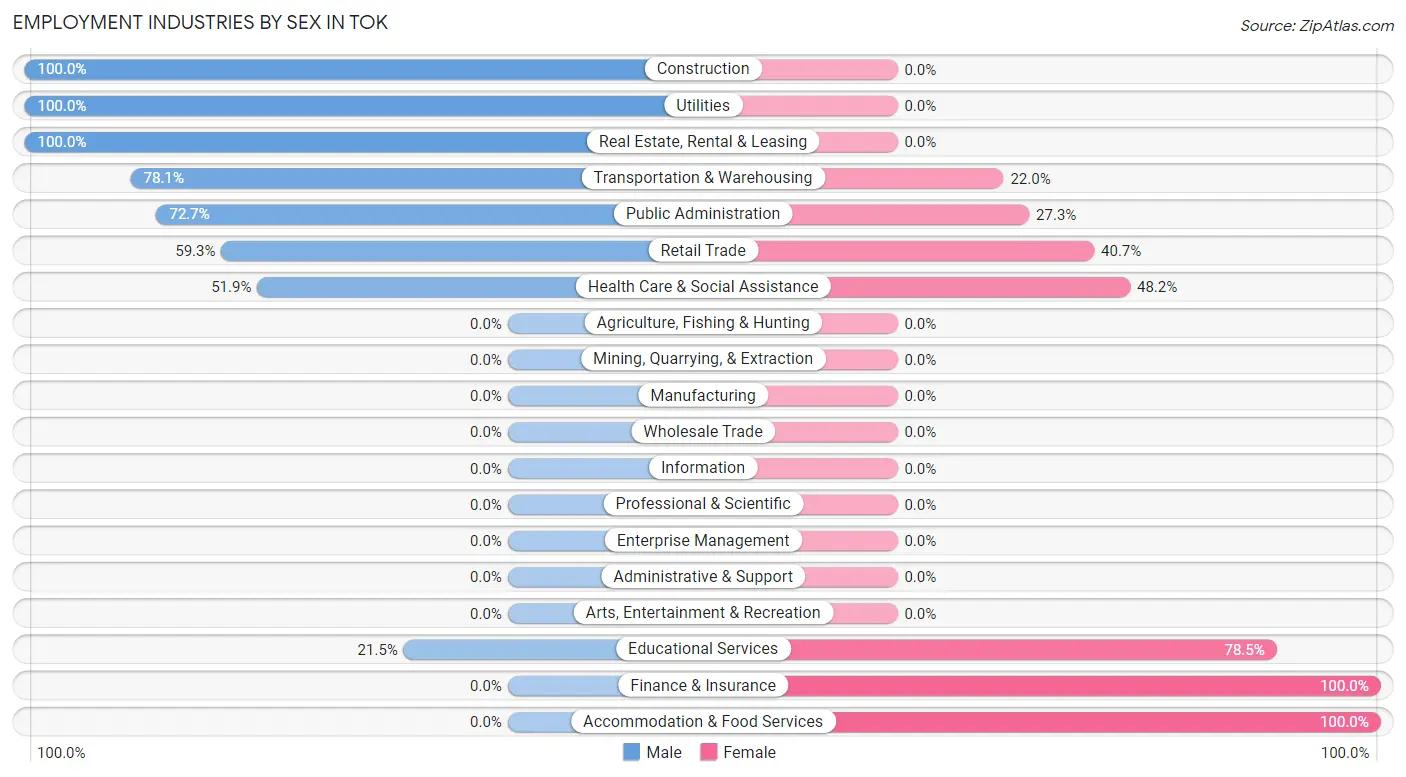
Employment Industries by Sex in Tok
The Tok industries that see more men than women are Construction (100.0%), Utilities (100.0%), and Real Estate, Rental & Leasing (100.0%), whereas the industries that tend to have a higher number of women are Finance & Insurance (100.0%), Accommodation & Food Services (100.0%), and Educational Services (78.5%).
| Industry | Male | Female |
| Agriculture, Fishing & Hunting | 0 (0.0%) | 0 (0.0%) |
| Mining, Quarrying, & Extraction | 0 (0.0%) | 0 (0.0%) |
| Construction | 90 (100.0%) | 0 (0.0%) |
| Manufacturing | 0 (0.0%) | 0 (0.0%) |
| Wholesale Trade | 0 (0.0%) | 0 (0.0%) |
| Retail Trade | 83 (59.3%) | 57 (40.7%) |
| Transportation & Warehousing | 32 (78.0%) | 9 (22.0%) |
| Utilities | 16 (100.0%) | 0 (0.0%) |
| Information | 0 (0.0%) | 0 (0.0%) |
| Finance & Insurance | 0 (0.0%) | 37 (100.0%) |
| Real Estate, Rental & Leasing | 27 (100.0%) | 0 (0.0%) |
| Professional & Scientific | 0 (0.0%) | 0 (0.0%) |
| Enterprise Management | 0 (0.0%) | 0 (0.0%) |
| Administrative & Support | 0 (0.0%) | 0 (0.0%) |
| Educational Services | 14 (21.5%) | 51 (78.5%) |
| Health Care & Social Assistance | 14 (51.8%) | 13 (48.1%) |
| Arts, Entertainment & Recreation | 0 (0.0%) | 0 (0.0%) |
| Accommodation & Food Services | 0 (0.0%) | 12 (100.0%) |
| Public Administration | 24 (72.7%) | 9 (27.3%) |
| Total | 315 (59.3%) | 216 (40.7%) |
Education in Tok
School Enrollment in Tok
The most common levels of schooling among the 192 students in Tok are elementary school (76 | 39.6%), middle school (50 | 26.0%), and nursery / preschool (24 | 12.5%).
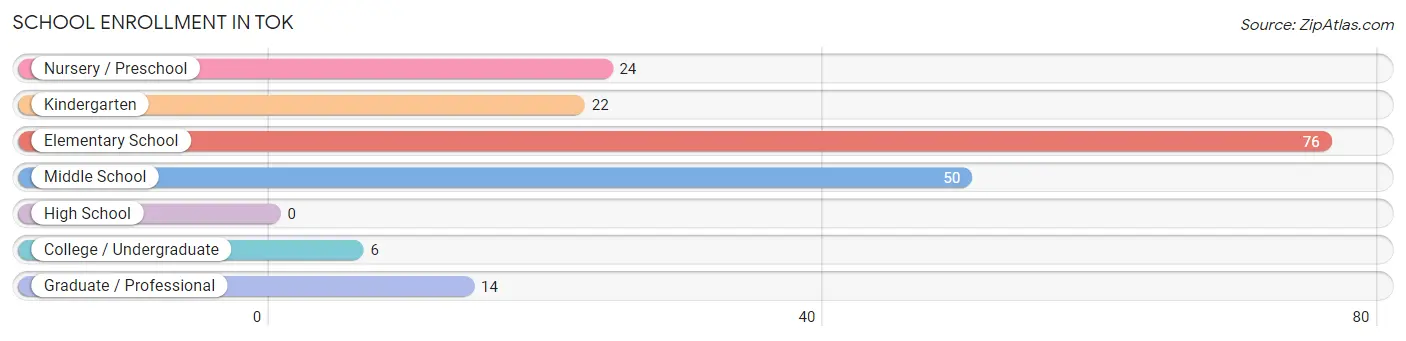
| School Level | # Students | % Students |
| Nursery / Preschool | 24 | 12.5% |
| Kindergarten | 22 | 11.5% |
| Elementary School | 76 | 39.6% |
| Middle School | 50 | 26.0% |
| High School | 0 | 0.0% |
| College / Undergraduate | 6 | 3.1% |
| Graduate / Professional | 14 | 7.3% |
| Total | 192 | 100.0% |
School Enrollment by Age by Funding Source in Tok
Out of a total of 192 students who are enrolled in schools in Tok, 73 (38.0%) attend a private institution, while the remaining 119 (62.0%) are enrolled in public schools. The age group of 10 to 14 year olds has the highest likelihood of being enrolled in private schools, with 42 (84.0% in the age bracket) enrolled. Conversely, the age group of 3 to 4 year olds has the lowest likelihood of being enrolled in a private school, with 24 (100.0% in the age bracket) attending a public institution.
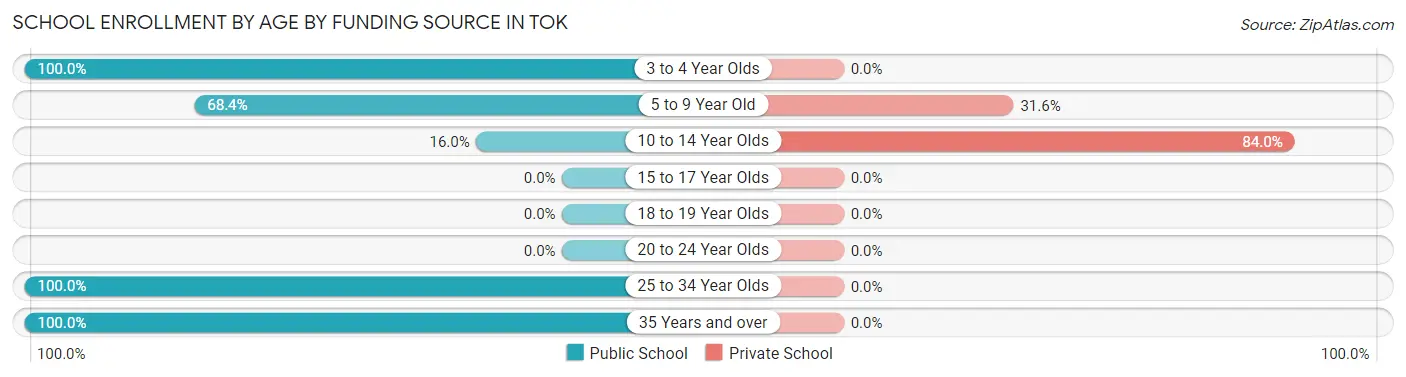
| Age Bracket | Public School | Private School |
| 3 to 4 Year Olds | 24 (100.0%) | 0 (0.0%) |
| 5 to 9 Year Old | 67 (68.4%) | 31 (31.6%) |
| 10 to 14 Year Olds | 8 (16.0%) | 42 (84.0%) |
| 15 to 17 Year Olds | 0 (0.0%) | 0 (0.0%) |
| 18 to 19 Year Olds | 0 (0.0%) | 0 (0.0%) |
| 20 to 24 Year Olds | 0 (0.0%) | 0 (0.0%) |
| 25 to 34 Year Olds | 6 (100.0%) | 0 (0.0%) |
| 35 Years and over | 14 (100.0%) | 0 (0.0%) |
| Total | 119 (62.0%) | 73 (38.0%) |
Educational Attainment by Field of Study in Tok
Bio, nature & agricultural (63 | 53.8%), physical & health sciences (15 | 12.8%), education (14 | 12.0%), computers & mathematics (12 | 10.3%), and literature & languages (7 | 6.0%) are the most common fields of study among 117 individuals in Tok who have obtained a bachelor's degree or higher.
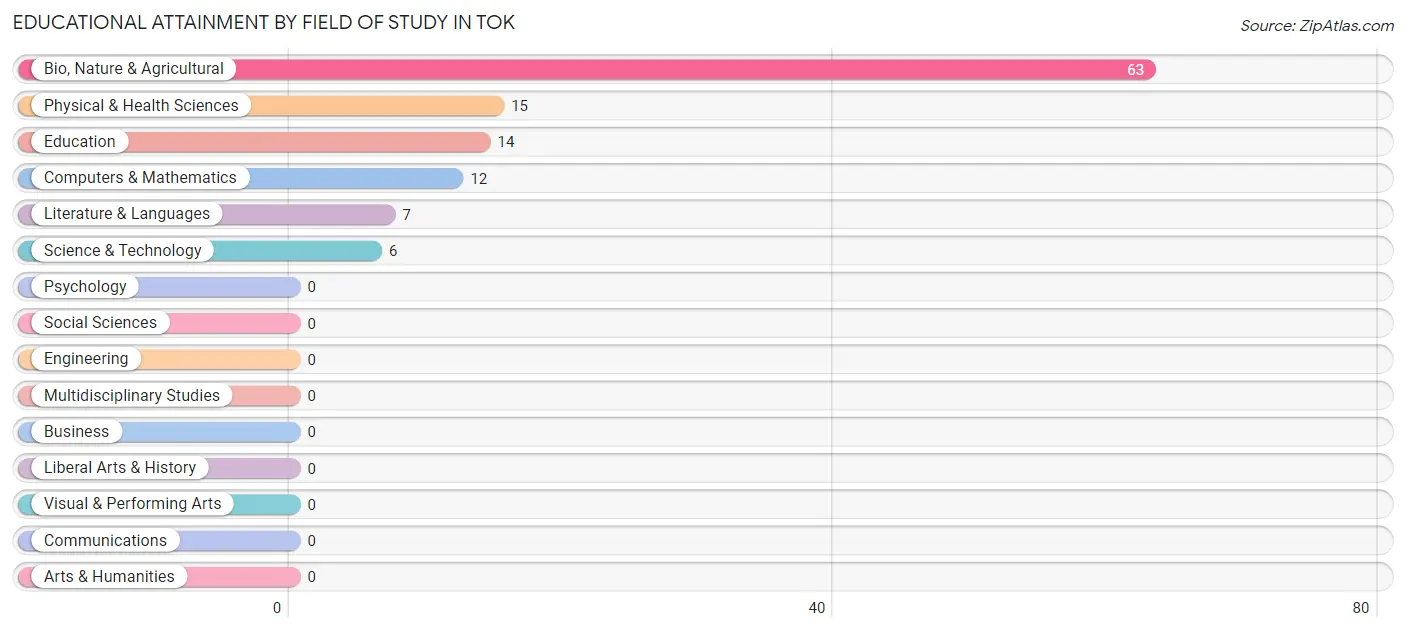
| Field of Study | # Graduates | % Graduates |
| Computers & Mathematics | 12 | 10.3% |
| Bio, Nature & Agricultural | 63 | 53.8% |
| Physical & Health Sciences | 15 | 12.8% |
| Psychology | 0 | 0.0% |
| Social Sciences | 0 | 0.0% |
| Engineering | 0 | 0.0% |
| Multidisciplinary Studies | 0 | 0.0% |
| Science & Technology | 6 | 5.1% |
| Business | 0 | 0.0% |
| Education | 14 | 12.0% |
| Literature & Languages | 7 | 6.0% |
| Liberal Arts & History | 0 | 0.0% |
| Visual & Performing Arts | 0 | 0.0% |
| Communications | 0 | 0.0% |
| Arts & Humanities | 0 | 0.0% |
| Total | 117 | 100.0% |
Transportation & Commute in Tok
Vehicle Availability by Sex in Tok
The most prevalent vehicle ownership categories in Tok are males with 2 vehicles (95, accounting for 30.2%) and females with 2 vehicles (86, making up 44.0%).
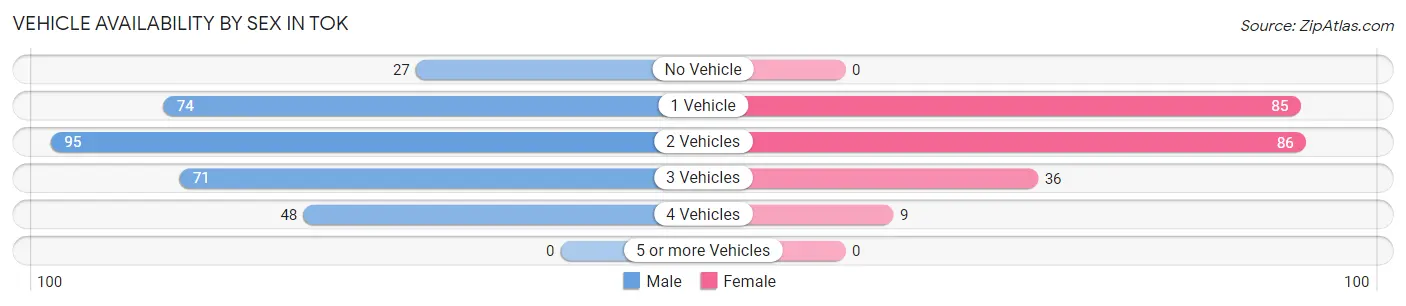
| Vehicles Available | Male | Female |
| No Vehicle | 27 (8.6%) | 0 (0.0%) |
| 1 Vehicle | 74 (23.5%) | 85 (39.4%) |
| 2 Vehicles | 95 (30.2%) | 86 (39.8%) |
| 3 Vehicles | 71 (22.5%) | 36 (16.7%) |
| 4 Vehicles | 48 (15.2%) | 9 (4.2%) |
| 5 or more Vehicles | 0 (0.0%) | 0 (0.0%) |
| Total | 315 (100.0%) | 216 (100.0%) |
Commute Time in Tok
The most frequently occuring commute durations in Tok are 5 to 9 minutes (152 commuters, 30.6%), less than 5 minutes (139 commuters, 28.0%), and 10 to 14 minutes (77 commuters, 15.5%).
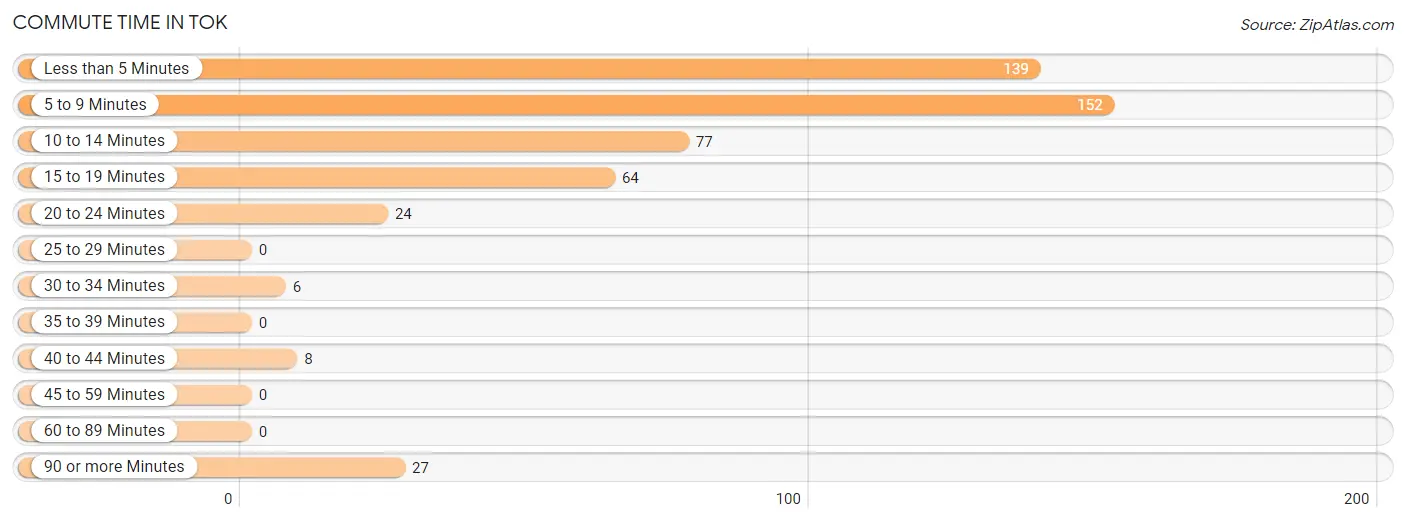
| Commute Time | # Commuters | % Commuters |
| Less than 5 Minutes | 139 | 28.0% |
| 5 to 9 Minutes | 152 | 30.6% |
| 10 to 14 Minutes | 77 | 15.5% |
| 15 to 19 Minutes | 64 | 12.9% |
| 20 to 24 Minutes | 24 | 4.8% |
| 25 to 29 Minutes | 0 | 0.0% |
| 30 to 34 Minutes | 6 | 1.2% |
| 35 to 39 Minutes | 0 | 0.0% |
| 40 to 44 Minutes | 8 | 1.6% |
| 45 to 59 Minutes | 0 | 0.0% |
| 60 to 89 Minutes | 0 | 0.0% |
| 90 or more Minutes | 27 | 5.4% |
Commute Time by Sex in Tok
The most common commute times in Tok are less than 5 minutes (105 commuters, 35.5%) for males and 5 to 9 minutes (86 commuters, 42.8%) for females.
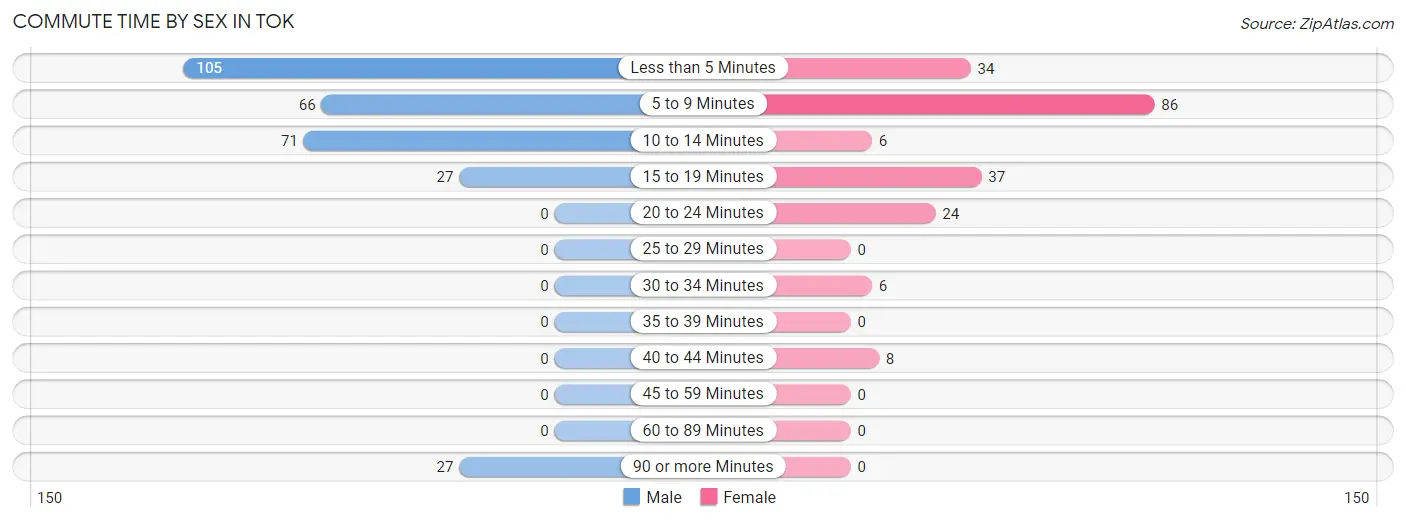
| Commute Time | Male | Female |
| Less than 5 Minutes | 105 (35.5%) | 34 (16.9%) |
| 5 to 9 Minutes | 66 (22.3%) | 86 (42.8%) |
| 10 to 14 Minutes | 71 (24.0%) | 6 (3.0%) |
| 15 to 19 Minutes | 27 (9.1%) | 37 (18.4%) |
| 20 to 24 Minutes | 0 (0.0%) | 24 (11.9%) |
| 25 to 29 Minutes | 0 (0.0%) | 0 (0.0%) |
| 30 to 34 Minutes | 0 (0.0%) | 6 (3.0%) |
| 35 to 39 Minutes | 0 (0.0%) | 0 (0.0%) |
| 40 to 44 Minutes | 0 (0.0%) | 8 (4.0%) |
| 45 to 59 Minutes | 0 (0.0%) | 0 (0.0%) |
| 60 to 89 Minutes | 0 (0.0%) | 0 (0.0%) |
| 90 or more Minutes | 27 (9.1%) | 0 (0.0%) |
Time of Departure to Work by Sex in Tok
The most frequent times of departure to work in Tok are 6:30 AM to 6:59 AM (73, 24.7%) for males and 7:30 AM to 7:59 AM (38, 18.9%) for females.
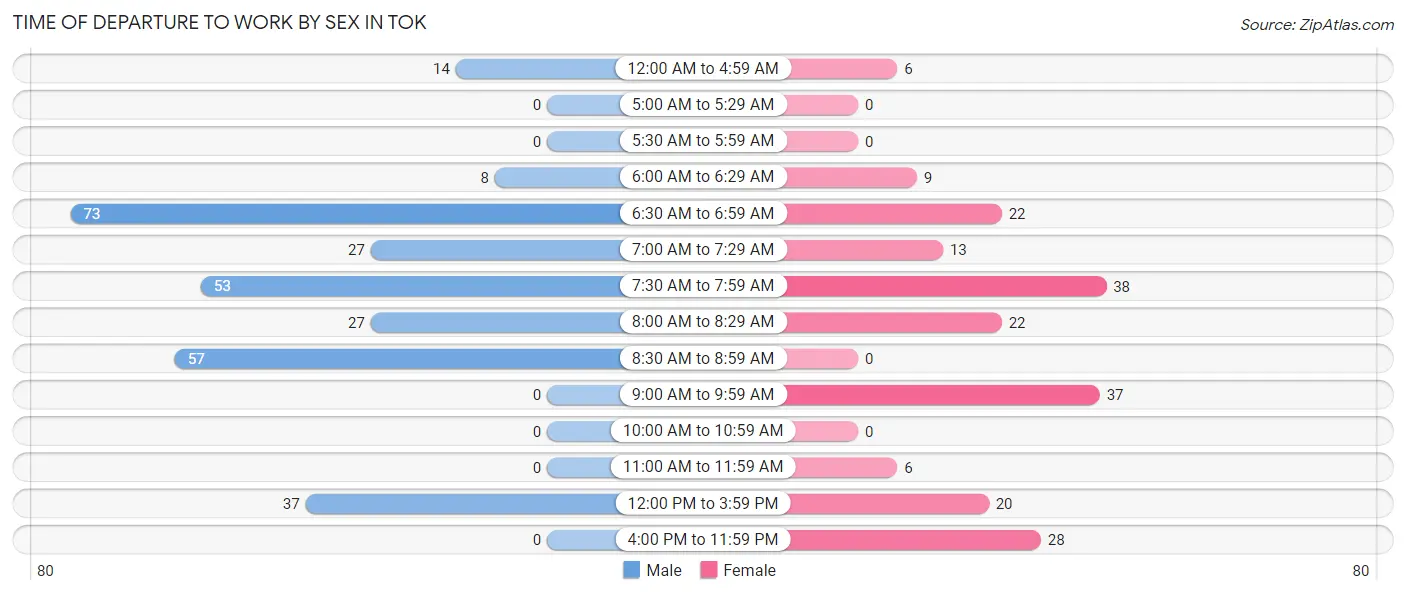
| Time of Departure | Male | Female |
| 12:00 AM to 4:59 AM | 14 (4.7%) | 6 (3.0%) |
| 5:00 AM to 5:29 AM | 0 (0.0%) | 0 (0.0%) |
| 5:30 AM to 5:59 AM | 0 (0.0%) | 0 (0.0%) |
| 6:00 AM to 6:29 AM | 8 (2.7%) | 9 (4.5%) |
| 6:30 AM to 6:59 AM | 73 (24.7%) | 22 (11.0%) |
| 7:00 AM to 7:29 AM | 27 (9.1%) | 13 (6.5%) |
| 7:30 AM to 7:59 AM | 53 (17.9%) | 38 (18.9%) |
| 8:00 AM to 8:29 AM | 27 (9.1%) | 22 (11.0%) |
| 8:30 AM to 8:59 AM | 57 (19.3%) | 0 (0.0%) |
| 9:00 AM to 9:59 AM | 0 (0.0%) | 37 (18.4%) |
| 10:00 AM to 10:59 AM | 0 (0.0%) | 0 (0.0%) |
| 11:00 AM to 11:59 AM | 0 (0.0%) | 6 (3.0%) |
| 12:00 PM to 3:59 PM | 37 (12.5%) | 20 (10.0%) |
| 4:00 PM to 11:59 PM | 0 (0.0%) | 28 (13.9%) |
| Total | 296 (100.0%) | 201 (100.0%) |
Housing Occupancy in Tok
Occupancy by Ownership in Tok
Of the total 567 dwellings in Tok, owner-occupied units account for 442 (77.9%), while renter-occupied units make up 125 (22.1%).
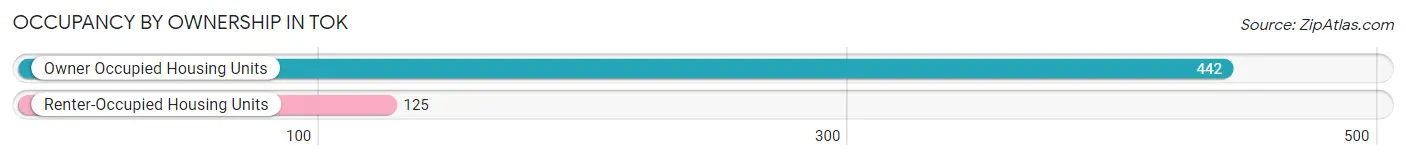
| Occupancy | # Housing Units | % Housing Units |
| Owner Occupied Housing Units | 442 | 77.9% |
| Renter-Occupied Housing Units | 125 | 22.1% |
| Total Occupied Housing Units | 567 | 100.0% |
Occupancy by Household Size in Tok
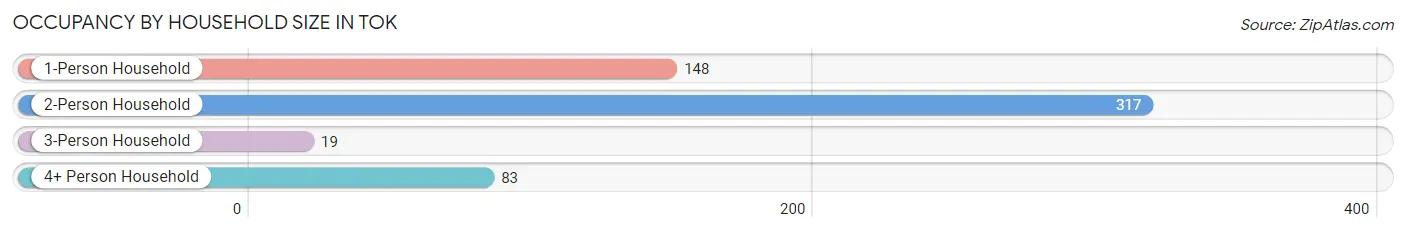
| Household Size | # Housing Units | % Housing Units |
| 1-Person Household | 148 | 26.1% |
| 2-Person Household | 317 | 55.9% |
| 3-Person Household | 19 | 3.4% |
| 4+ Person Household | 83 | 14.6% |
| Total Housing Units | 567 | 100.0% |
Occupancy by Ownership by Household Size in Tok
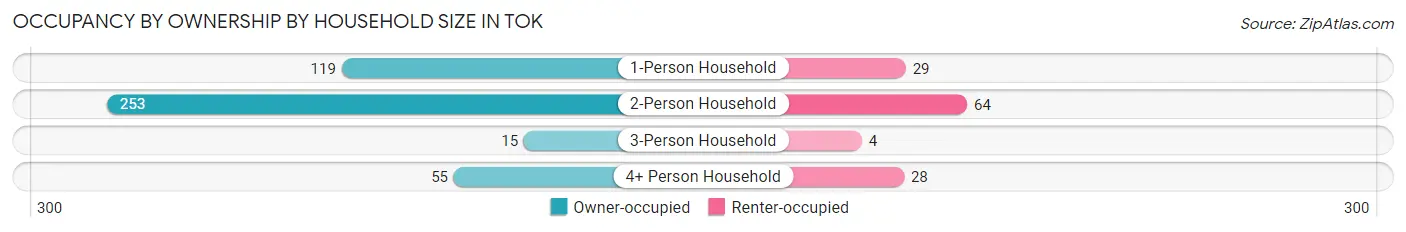
| Household Size | Owner-occupied | Renter-occupied |
| 1-Person Household | 119 (80.4%) | 29 (19.6%) |
| 2-Person Household | 253 (79.8%) | 64 (20.2%) |
| 3-Person Household | 15 (78.9%) | 4 (21.0%) |
| 4+ Person Household | 55 (66.3%) | 28 (33.7%) |
| Total Housing Units | 442 (77.9%) | 125 (22.1%) |
Occupancy by Educational Attainment in Tok
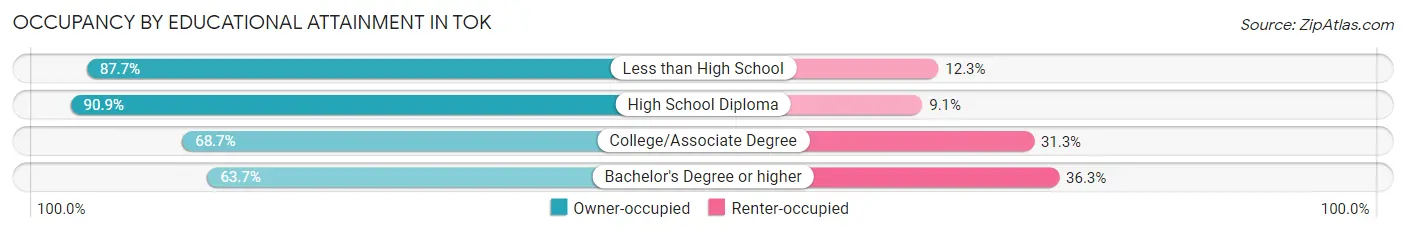
| Household Size | Owner-occupied | Renter-occupied |
| Less than High School | 64 (87.7%) | 9 (12.3%) |
| High School Diploma | 179 (90.9%) | 18 (9.1%) |
| College/Associate Degree | 134 (68.7%) | 61 (31.3%) |
| Bachelor's Degree or higher | 65 (63.7%) | 37 (36.3%) |
Occupancy by Age of Householder in Tok
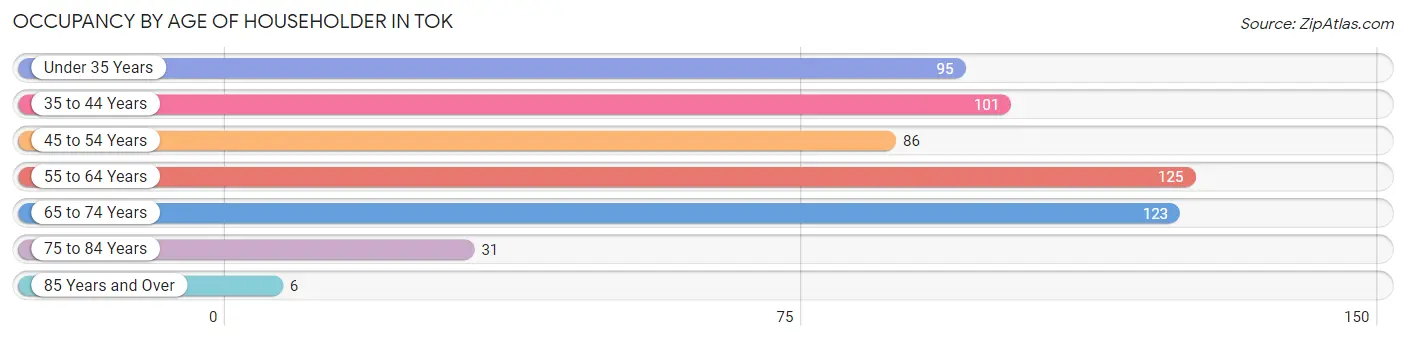
| Age Bracket | # Households | % Households |
| Under 35 Years | 95 | 16.8% |
| 35 to 44 Years | 101 | 17.8% |
| 45 to 54 Years | 86 | 15.2% |
| 55 to 64 Years | 125 | 22.1% |
| 65 to 74 Years | 123 | 21.7% |
| 75 to 84 Years | 31 | 5.5% |
| 85 Years and Over | 6 | 1.1% |
| Total | 567 | 100.0% |
Housing Finances in Tok
Median Income by Occupancy in Tok
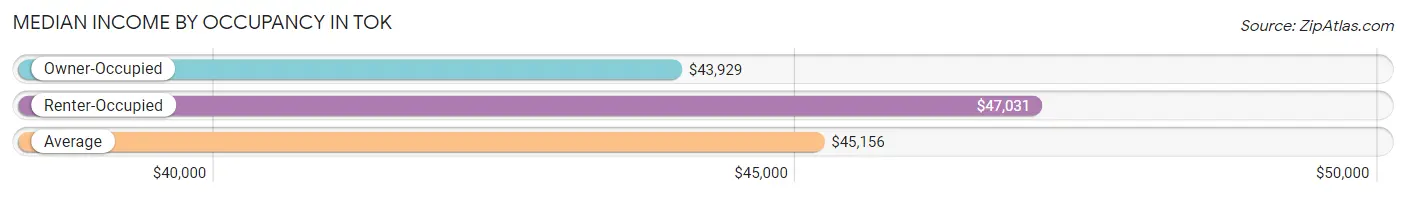
| Occupancy Type | # Households | Median Income |
| Owner-Occupied | 442 (77.9%) | $43,929 |
| Renter-Occupied | 125 (22.1%) | $47,031 |
| Average | 567 (100.0%) | $45,156 |
Occupancy by Householder Income Bracket in Tok
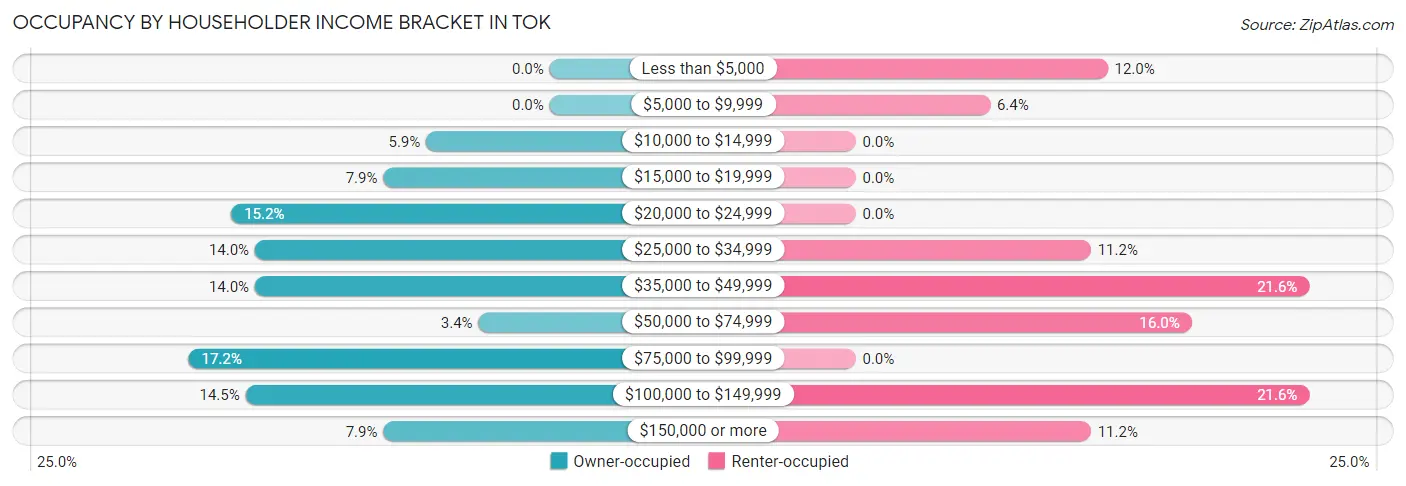
| Income Bracket | Owner-occupied | Renter-occupied |
| Less than $5,000 | 0 (0.0%) | 15 (12.0%) |
| $5,000 to $9,999 | 0 (0.0%) | 8 (6.4%) |
| $10,000 to $14,999 | 26 (5.9%) | 0 (0.0%) |
| $15,000 to $19,999 | 35 (7.9%) | 0 (0.0%) |
| $20,000 to $24,999 | 67 (15.2%) | 0 (0.0%) |
| $25,000 to $34,999 | 62 (14.0%) | 14 (11.2%) |
| $35,000 to $49,999 | 62 (14.0%) | 27 (21.6%) |
| $50,000 to $74,999 | 15 (3.4%) | 20 (16.0%) |
| $75,000 to $99,999 | 76 (17.2%) | 0 (0.0%) |
| $100,000 to $149,999 | 64 (14.5%) | 27 (21.6%) |
| $150,000 or more | 35 (7.9%) | 14 (11.2%) |
| Total | 442 (100.0%) | 125 (100.0%) |
Monthly Housing Cost Tiers in Tok
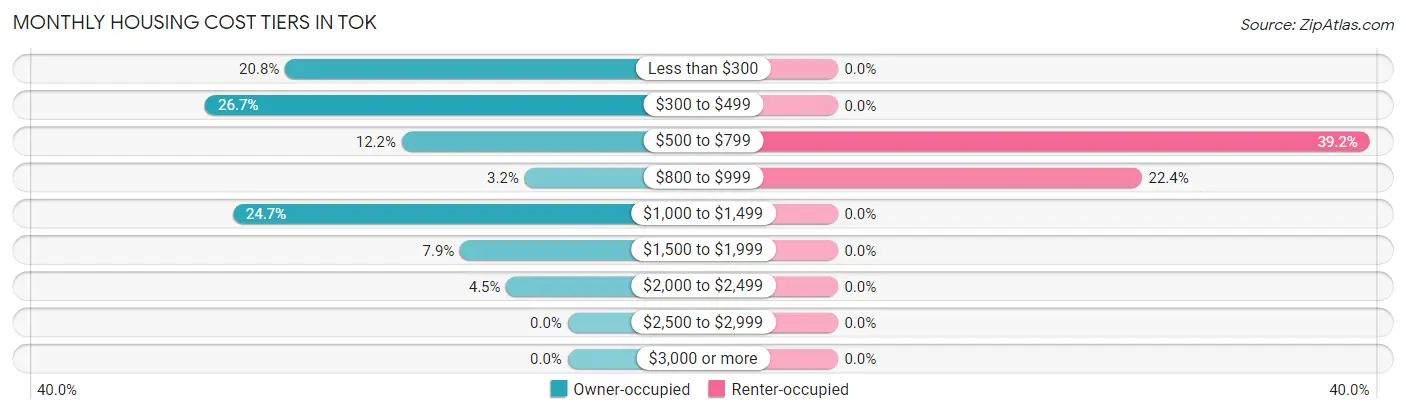
| Monthly Cost | Owner-occupied | Renter-occupied |
| Less than $300 | 92 (20.8%) | 0 (0.0%) |
| $300 to $499 | 118 (26.7%) | 0 (0.0%) |
| $500 to $799 | 54 (12.2%) | 49 (39.2%) |
| $800 to $999 | 14 (3.2%) | 28 (22.4%) |
| $1,000 to $1,499 | 109 (24.7%) | 0 (0.0%) |
| $1,500 to $1,999 | 35 (7.9%) | 0 (0.0%) |
| $2,000 to $2,499 | 20 (4.5%) | 0 (0.0%) |
| $2,500 to $2,999 | 0 (0.0%) | 0 (0.0%) |
| $3,000 or more | 0 (0.0%) | 0 (0.0%) |
| Total | 442 (100.0%) | 125 (100.0%) |
Physical Housing Characteristics in Tok
Housing Structures in Tok
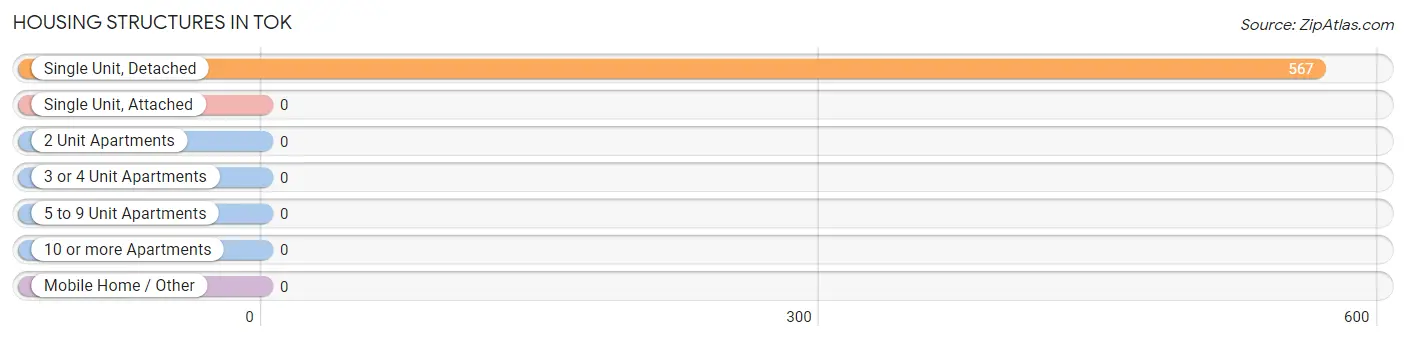
| Structure Type | # Housing Units | % Housing Units |
| Single Unit, Detached | 567 | 100.0% |
| Single Unit, Attached | 0 | 0.0% |
| 2 Unit Apartments | 0 | 0.0% |
| 3 or 4 Unit Apartments | 0 | 0.0% |
| 5 to 9 Unit Apartments | 0 | 0.0% |
| 10 or more Apartments | 0 | 0.0% |
| Mobile Home / Other | 0 | 0.0% |
| Total | 567 | 100.0% |
Housing Structures by Occupancy in Tok
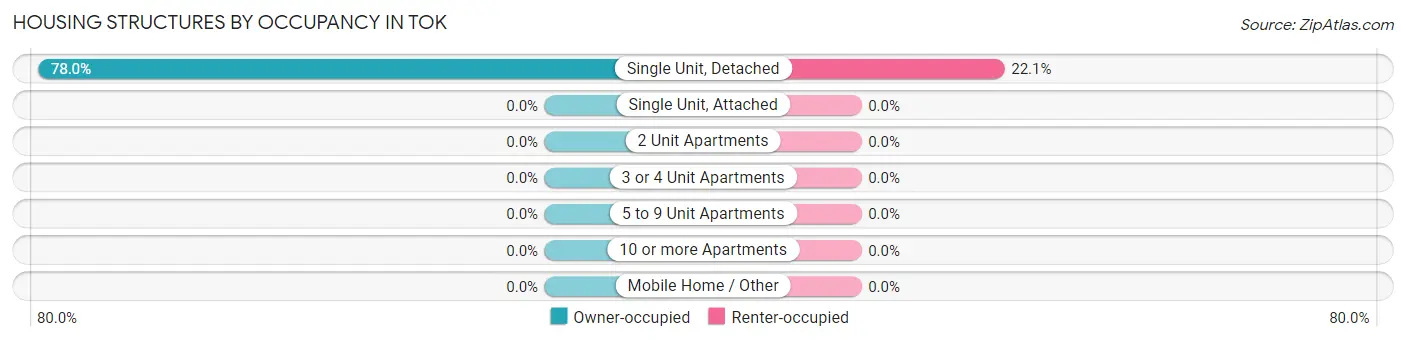
| Structure Type | Owner-occupied | Renter-occupied |
| Single Unit, Detached | 442 (77.9%) | 125 (22.1%) |
| Single Unit, Attached | 0 (0.0%) | 0 (0.0%) |
| 2 Unit Apartments | 0 (0.0%) | 0 (0.0%) |
| 3 or 4 Unit Apartments | 0 (0.0%) | 0 (0.0%) |
| 5 to 9 Unit Apartments | 0 (0.0%) | 0 (0.0%) |
| 10 or more Apartments | 0 (0.0%) | 0 (0.0%) |
| Mobile Home / Other | 0 (0.0%) | 0 (0.0%) |
| Total | 442 (77.9%) | 125 (22.1%) |
Housing Structures by Number of Rooms in Tok
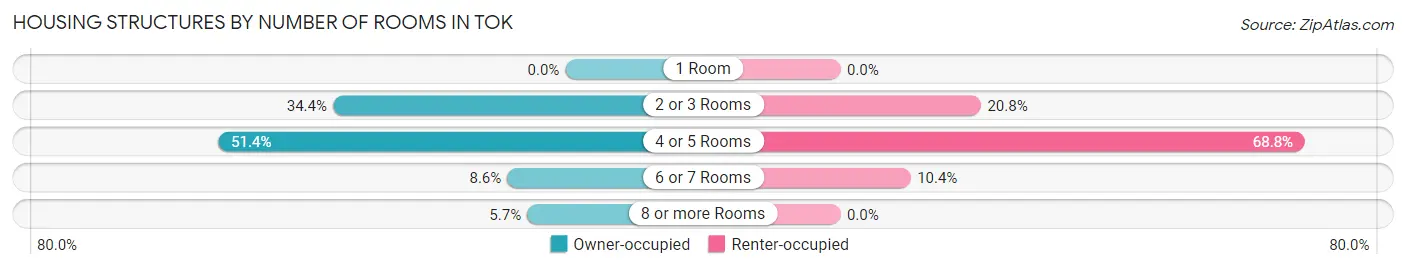
| Number of Rooms | Owner-occupied | Renter-occupied |
| 1 Room | 0 (0.0%) | 0 (0.0%) |
| 2 or 3 Rooms | 152 (34.4%) | 26 (20.8%) |
| 4 or 5 Rooms | 227 (51.4%) | 86 (68.8%) |
| 6 or 7 Rooms | 38 (8.6%) | 13 (10.4%) |
| 8 or more Rooms | 25 (5.7%) | 0 (0.0%) |
| Total | 442 (100.0%) | 125 (100.0%) |
Housing Structure by Heating Type in Tok
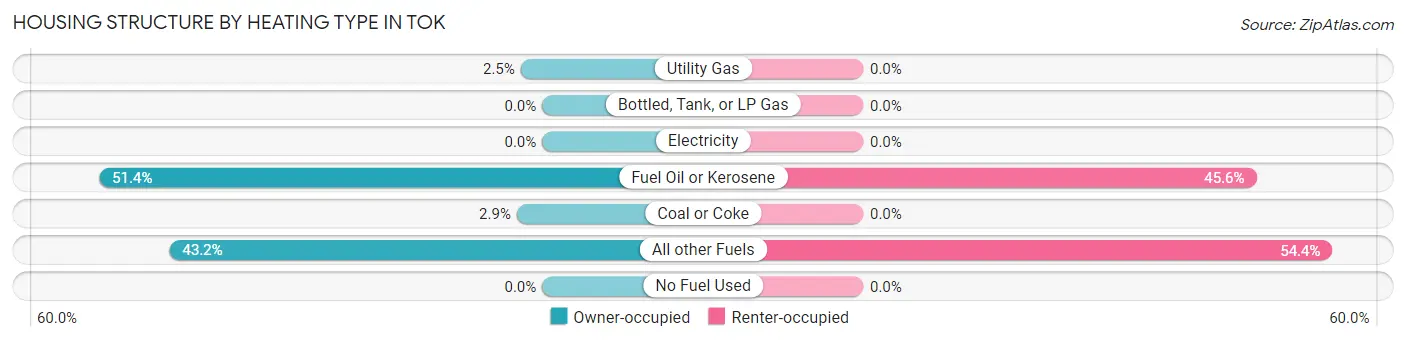
| Heating Type | Owner-occupied | Renter-occupied |
| Utility Gas | 11 (2.5%) | 0 (0.0%) |
| Bottled, Tank, or LP Gas | 0 (0.0%) | 0 (0.0%) |
| Electricity | 0 (0.0%) | 0 (0.0%) |
| Fuel Oil or Kerosene | 227 (51.4%) | 57 (45.6%) |
| Coal or Coke | 13 (2.9%) | 0 (0.0%) |
| All other Fuels | 191 (43.2%) | 68 (54.4%) |
| No Fuel Used | 0 (0.0%) | 0 (0.0%) |
| Total | 442 (100.0%) | 125 (100.0%) |
Household Vehicle Usage in Tok
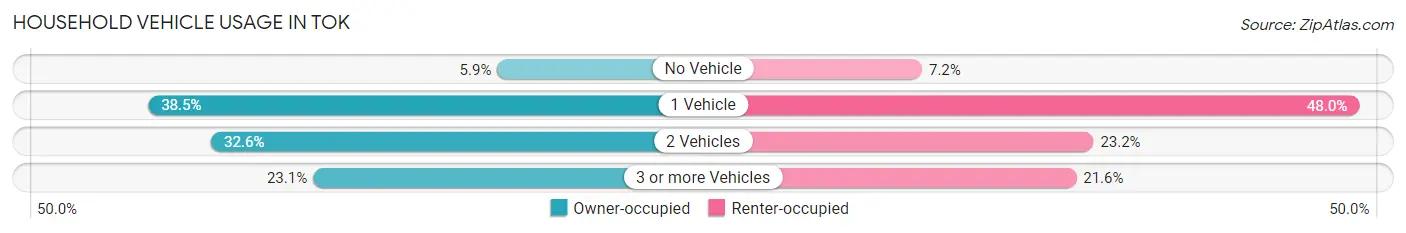
| Vehicles per Household | Owner-occupied | Renter-occupied |
| No Vehicle | 26 (5.9%) | 9 (7.2%) |
| 1 Vehicle | 170 (38.5%) | 60 (48.0%) |
| 2 Vehicles | 144 (32.6%) | 29 (23.2%) |
| 3 or more Vehicles | 102 (23.1%) | 27 (21.6%) |
| Total | 442 (100.0%) | 125 (100.0%) |
Real Estate & Mortgages in Tok
Real Estate and Mortgage Overview in Tok
| Characteristic | Without Mortgage | With Mortgage |
| Housing Units | 222 | 220 |
| Median Property Value | $203,900 | $192,000 |
| Median Household Income | $32,895 | $35 |
| Monthly Housing Costs | $319 | $0 |
| Real Estate Taxes | - | - |
Property Value by Mortgage Status in Tok
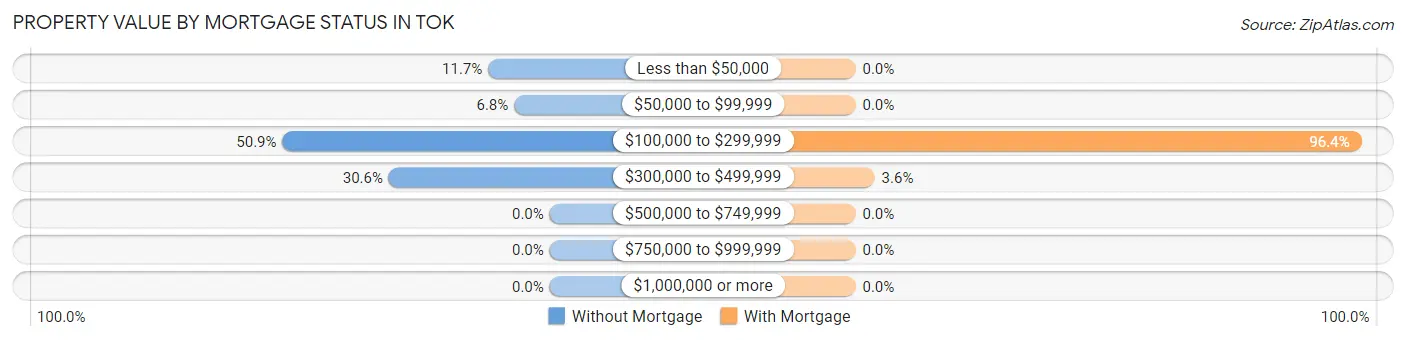
| Property Value | Without Mortgage | With Mortgage |
| Less than $50,000 | 26 (11.7%) | 0 (0.0%) |
| $50,000 to $99,999 | 15 (6.8%) | 0 (0.0%) |
| $100,000 to $299,999 | 113 (50.9%) | 212 (96.4%) |
| $300,000 to $499,999 | 68 (30.6%) | 8 (3.6%) |
| $500,000 to $749,999 | 0 (0.0%) | 0 (0.0%) |
| $750,000 to $999,999 | 0 (0.0%) | 0 (0.0%) |
| $1,000,000 or more | 0 (0.0%) | 0 (0.0%) |
| Total | 222 (100.0%) | 220 (100.0%) |
Household Income by Mortgage Status in Tok
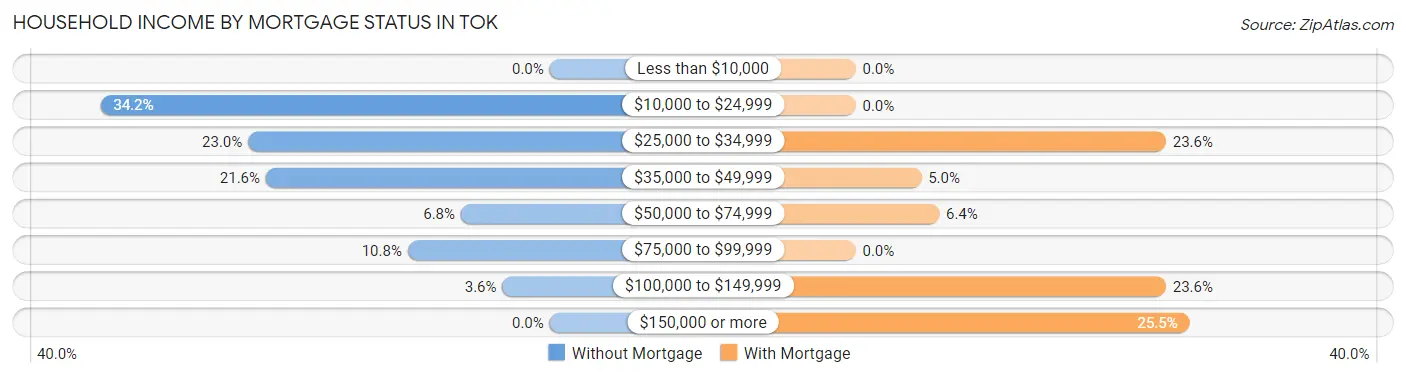
| Household Income | Without Mortgage | With Mortgage |
| Less than $10,000 | 0 (0.0%) | 0 (0.0%) |
| $10,000 to $24,999 | 76 (34.2%) | 0 (0.0%) |
| $25,000 to $34,999 | 51 (23.0%) | 52 (23.6%) |
| $35,000 to $49,999 | 48 (21.6%) | 11 (5.0%) |
| $50,000 to $74,999 | 15 (6.8%) | 14 (6.4%) |
| $75,000 to $99,999 | 24 (10.8%) | 0 (0.0%) |
| $100,000 to $149,999 | 8 (3.6%) | 52 (23.6%) |
| $150,000 or more | 0 (0.0%) | 56 (25.5%) |
| Total | 222 (100.0%) | 220 (100.0%) |
Property Value to Household Income Ratio in Tok
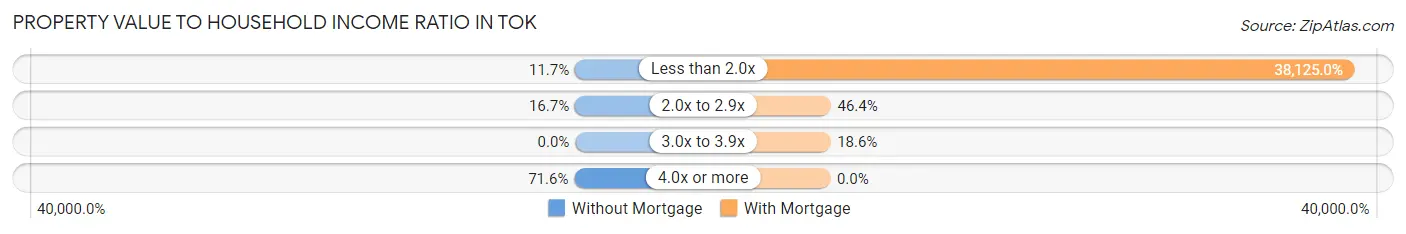
| Value-to-Income Ratio | Without Mortgage | With Mortgage |
| Less than 2.0x | 26 (11.7%) | 83,875 (38,125.0%) |
| 2.0x to 2.9x | 37 (16.7%) | 102 (46.4%) |
| 3.0x to 3.9x | 0 (0.0%) | 41 (18.6%) |
| 4.0x or more | 159 (71.6%) | 0 (0.0%) |
| Total | 222 (100.0%) | 220 (100.0%) |
Real Estate Taxes by Mortgage Status in Tok
| Property Taxes | Without Mortgage | With Mortgage |
| Less than $800 | 0 (0.0%) | 0 (0.0%) |
| $800 to $1,499 | 0 (0.0%) | 0 (0.0%) |
| $800 to $1,499 | 0 (0.0%) | 0 (0.0%) |
| Total | 222 (100.0%) | 220 (100.0%) |
Health & Disability in Tok
Health Insurance Coverage by Age in Tok
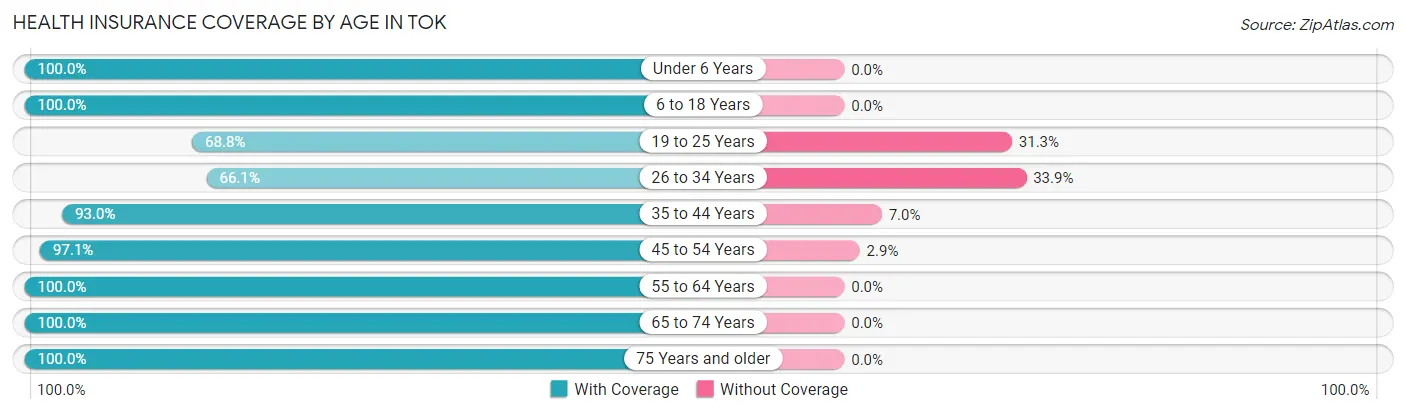
| Age Bracket | With Coverage | Without Coverage |
| Under 6 Years | 72 (100.0%) | 0 (0.0%) |
| 6 to 18 Years | 144 (100.0%) | 0 (0.0%) |
| 19 to 25 Years | 44 (68.8%) | 20 (31.2%) |
| 26 to 34 Years | 148 (66.1%) | 76 (33.9%) |
| 35 to 44 Years | 120 (93.0%) | 9 (7.0%) |
| 45 to 54 Years | 204 (97.1%) | 6 (2.9%) |
| 55 to 64 Years | 234 (100.0%) | 0 (0.0%) |
| 65 to 74 Years | 144 (100.0%) | 0 (0.0%) |
| 75 Years and older | 131 (100.0%) | 0 (0.0%) |
| Total | 1,241 (91.8%) | 111 (8.2%) |
Health Insurance Coverage by Citizenship Status in Tok
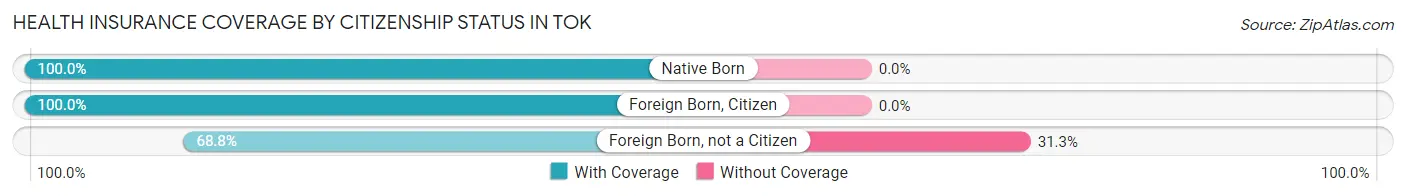
| Citizenship Status | With Coverage | Without Coverage |
| Native Born | 72 (100.0%) | 0 (0.0%) |
| Foreign Born, Citizen | 144 (100.0%) | 0 (0.0%) |
| Foreign Born, not a Citizen | 44 (68.8%) | 20 (31.2%) |
Health Insurance Coverage by Household Income in Tok
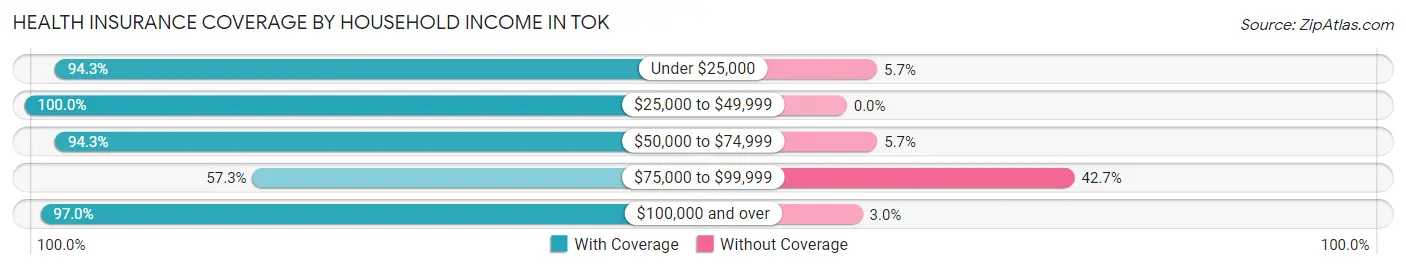
| Household Income | With Coverage | Without Coverage |
| Under $25,000 | 381 (94.3%) | 23 (5.7%) |
| $25,000 to $49,999 | 274 (100.0%) | 0 (0.0%) |
| $50,000 to $74,999 | 99 (94.3%) | 6 (5.7%) |
| $75,000 to $99,999 | 94 (57.3%) | 70 (42.7%) |
| $100,000 and over | 393 (97.0%) | 12 (3.0%) |
Public vs Private Health Insurance Coverage by Age in Tok
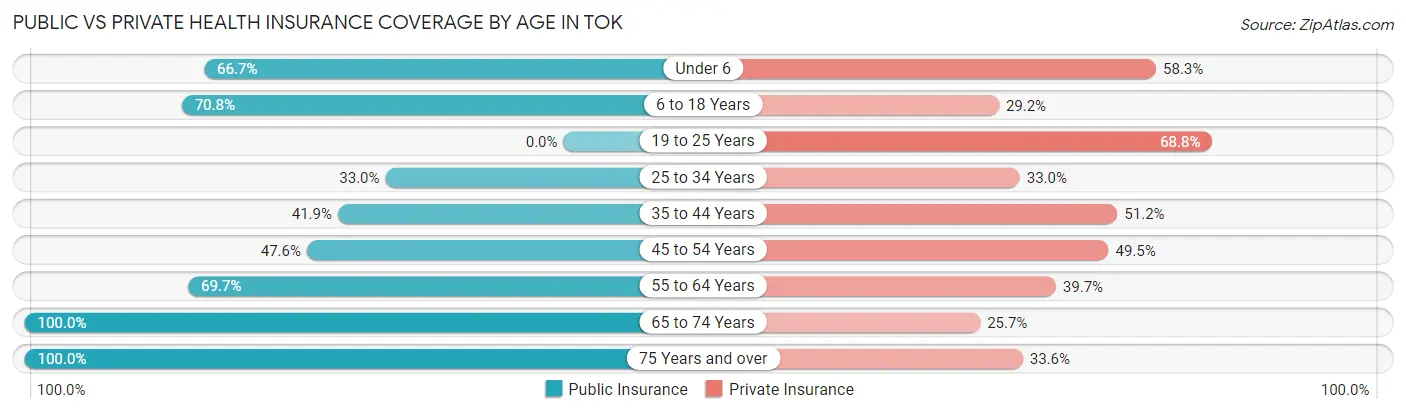
| Age Bracket | Public Insurance | Private Insurance |
| Under 6 | 48 (66.7%) | 42 (58.3%) |
| 6 to 18 Years | 102 (70.8%) | 42 (29.2%) |
| 19 to 25 Years | 0 (0.0%) | 44 (68.8%) |
| 25 to 34 Years | 74 (33.0%) | 74 (33.0%) |
| 35 to 44 Years | 54 (41.9%) | 66 (51.2%) |
| 45 to 54 Years | 100 (47.6%) | 104 (49.5%) |
| 55 to 64 Years | 163 (69.7%) | 93 (39.7%) |
| 65 to 74 Years | 144 (100.0%) | 37 (25.7%) |
| 75 Years and over | 131 (100.0%) | 44 (33.6%) |
| Total | 816 (60.4%) | 546 (40.4%) |
Disability Status by Sex by Age in Tok
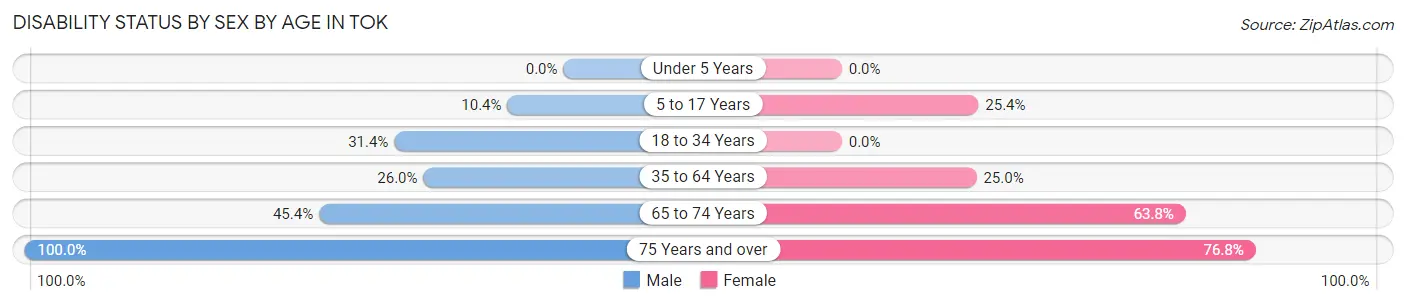
| Age Bracket | Male | Female |
| Under 5 Years | 0 (0.0%) | 0 (0.0%) |
| 5 to 17 Years | 8 (10.4%) | 18 (25.4%) |
| 18 to 34 Years | 54 (31.4%) | 0 (0.0%) |
| 35 to 64 Years | 73 (26.0%) | 73 (25.0%) |
| 65 to 74 Years | 44 (45.4%) | 30 (63.8%) |
| 75 Years and over | 62 (100.0%) | 53 (76.8%) |
Disability Class by Sex by Age in Tok
Disability Class: Hearing Difficulty
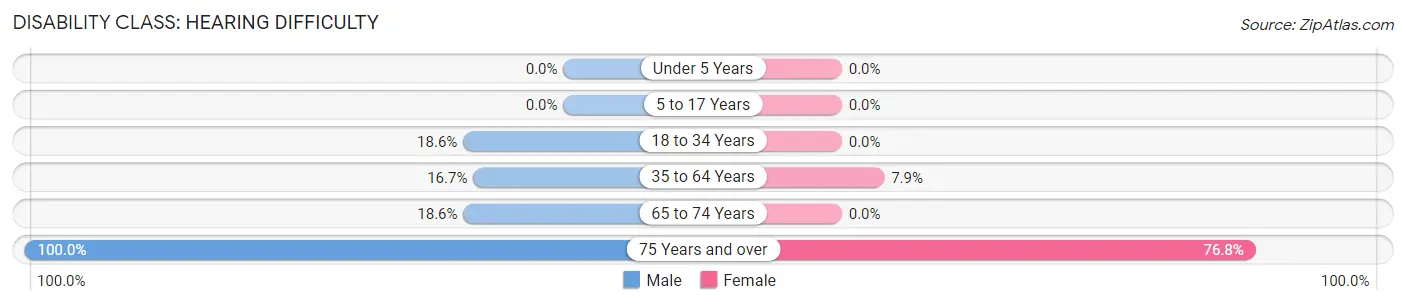
| Age Bracket | Male | Female |
| Under 5 Years | 0 (0.0%) | 0 (0.0%) |
| 5 to 17 Years | 0 (0.0%) | 0 (0.0%) |
| 18 to 34 Years | 32 (18.6%) | 0 (0.0%) |
| 35 to 64 Years | 47 (16.7%) | 23 (7.9%) |
| 65 to 74 Years | 18 (18.6%) | 0 (0.0%) |
| 75 Years and over | 62 (100.0%) | 53 (76.8%) |
Disability Class: Vision Difficulty
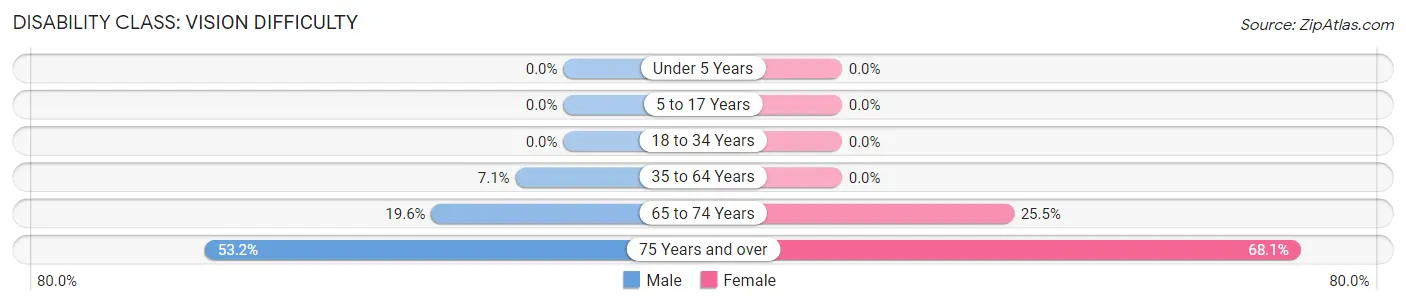
| Age Bracket | Male | Female |
| Under 5 Years | 0 (0.0%) | 0 (0.0%) |
| 5 to 17 Years | 0 (0.0%) | 0 (0.0%) |
| 18 to 34 Years | 0 (0.0%) | 0 (0.0%) |
| 35 to 64 Years | 20 (7.1%) | 0 (0.0%) |
| 65 to 74 Years | 19 (19.6%) | 12 (25.5%) |
| 75 Years and over | 33 (53.2%) | 47 (68.1%) |
Disability Class: Cognitive Difficulty
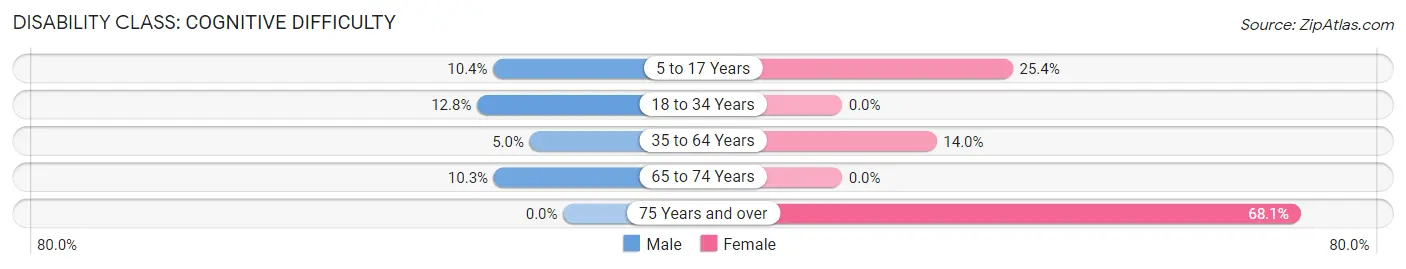
| Age Bracket | Male | Female |
| 5 to 17 Years | 8 (10.4%) | 18 (25.4%) |
| 18 to 34 Years | 22 (12.8%) | 0 (0.0%) |
| 35 to 64 Years | 14 (5.0%) | 41 (14.0%) |
| 65 to 74 Years | 10 (10.3%) | 0 (0.0%) |
| 75 Years and over | 0 (0.0%) | 47 (68.1%) |
Disability Class: Ambulatory Difficulty
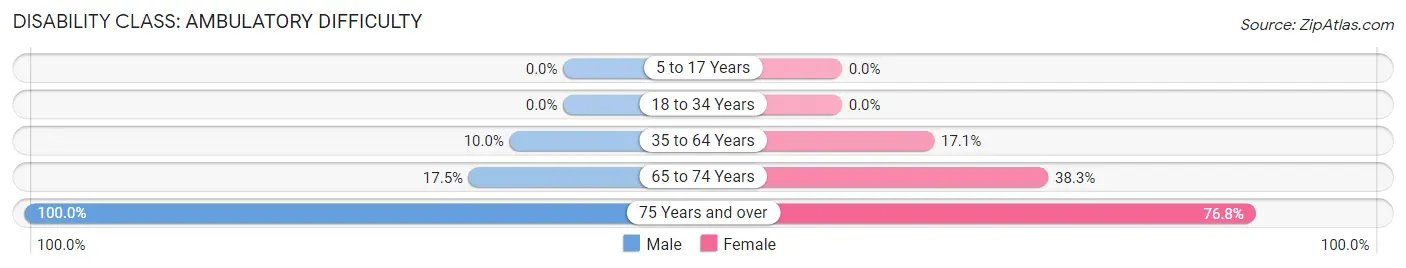
| Age Bracket | Male | Female |
| 5 to 17 Years | 0 (0.0%) | 0 (0.0%) |
| 18 to 34 Years | 0 (0.0%) | 0 (0.0%) |
| 35 to 64 Years | 28 (10.0%) | 50 (17.1%) |
| 65 to 74 Years | 17 (17.5%) | 18 (38.3%) |
| 75 Years and over | 62 (100.0%) | 53 (76.8%) |
Disability Class: Self-Care Difficulty
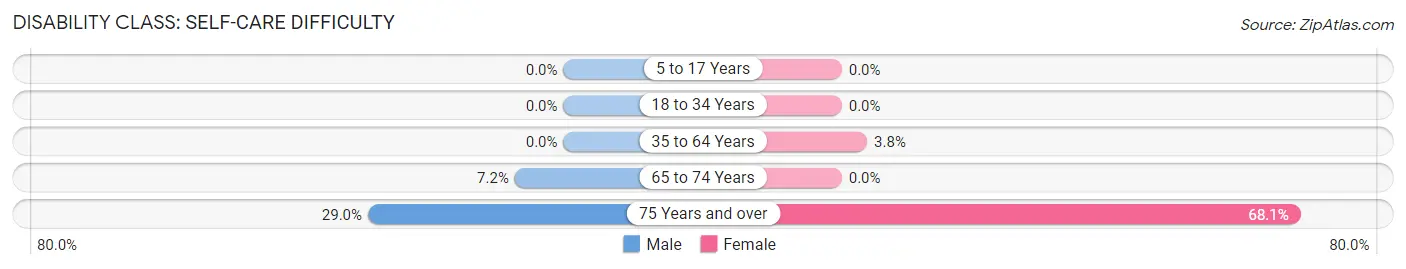
| Age Bracket | Male | Female |
| 5 to 17 Years | 0 (0.0%) | 0 (0.0%) |
| 18 to 34 Years | 0 (0.0%) | 0 (0.0%) |
| 35 to 64 Years | 0 (0.0%) | 11 (3.8%) |
| 65 to 74 Years | 7 (7.2%) | 0 (0.0%) |
| 75 Years and over | 18 (29.0%) | 47 (68.1%) |
Technology Access in Tok
Computing Device Access in Tok
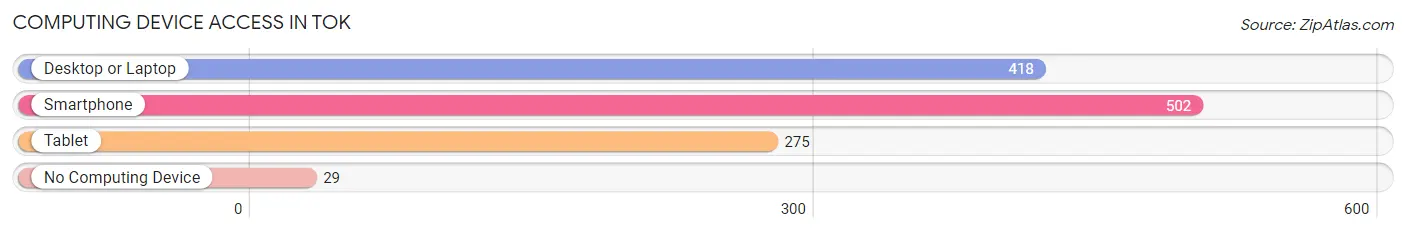
| Device Type | # Households | % Households |
| Desktop or Laptop | 418 | 73.7% |
| Smartphone | 502 | 88.5% |
| Tablet | 275 | 48.5% |
| No Computing Device | 29 | 5.1% |
| Total | 567 | 100.0% |
Internet Access in Tok
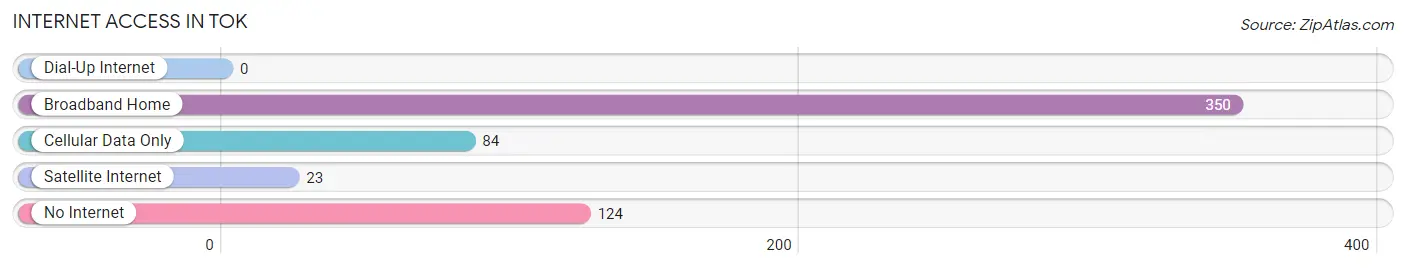
| Internet Type | # Households | % Households |
| Dial-Up Internet | 0 | 0.0% |
| Broadband Home | 350 | 61.7% |
| Cellular Data Only | 84 | 14.8% |
| Satellite Internet | 23 | 4.1% |
| No Internet | 124 | 21.9% |
| Total | 567 | 100.0% |
Tok Summary
AK History
Alaska is the largest state in the United States, located in the northwest corner of the continent. It is bordered by Canada to the east, the Arctic Ocean to the north, and the Pacific Ocean to the west. Alaska was purchased from Russia in 1867 for $7.2 million, and became the 49th state in 1959.
The history of Alaska dates back to the Paleolithic era, when the first humans arrived in the region. The first inhabitants were the Inuit, Aleut, and Yupik peoples, who lived in small, nomadic groups. They hunted and fished for their food, and traded with other tribes.
The first Europeans to explore Alaska were Russian fur traders, who arrived in the late 1700s. They established trading posts and settlements, and began trading with the native peoples. In 1867, the United States purchased Alaska from Russia for $7.2 million, and it became a U.S. territory.
In the late 1800s, gold was discovered in Alaska, and thousands of prospectors flocked to the region. This led to the establishment of towns and cities, and the growth of the fishing and timber industries.
In 1912, Alaska became an organized territory, and in 1959 it became the 49th state. Since then, Alaska has become an important part of the United States, with its vast natural resources and strategic location.
AK Geography
Alaska is the largest state in the United States, covering an area of 663,268 square miles. It is bordered by Canada to the east, the Arctic Ocean to the north, and the Pacific Ocean to the west.
Alaska is divided into five regions: the Interior, the Southcentral, the Southeast, the North Slope, and the Aleutian Islands. The Interior is a vast, sparsely populated region of mountains, forests, and tundra. The Southcentral region is home to the state’s largest cities, including Anchorage and Fairbanks. The Southeast is a rugged, mountainous region with many glaciers and fjords. The North Slope is a vast, treeless region of tundra and permafrost. The Aleutian Islands are a chain of volcanic islands in the Bering Sea.
Alaska is home to some of the most spectacular scenery in the world, including glaciers, mountains, fjords, and tundra. It is also home to an abundance of wildlife, including bears, moose, caribou, and whales.
AK Economy
Alaska’s economy is largely based on natural resources, such as oil, gas, timber, and fish. Oil and gas account for the majority of the state’s revenue, and are the main drivers of the economy.
The fishing industry is also an important part of the economy, with salmon, crab, and halibut being the most important species. Tourism is also a major industry, with visitors coming to Alaska to experience its natural beauty and wildlife.
The state also has a large military presence, with several military bases located in Alaska. The military is a major employer in the state, and provides a significant boost to the economy.
AK Demographics
As of 2020, Alaska had an estimated population of 731,545. The population is largely concentrated in the Southcentral region, with Anchorage being the largest city.
The majority of the population is white (68.2%), followed by Native American (15.2%), Asian (4.7%), and African American (3.2%). The state also has a large Hispanic population (7.2%).
Alaska is home to many different cultures and languages, including English, Spanish, Russian, and several Native American languages. The state also has a large number of immigrants, with the largest groups coming from the Philippines, Mexico, and India.
Conclusion
Alaska is the largest state in the United States, located in the northwest corner of the continent. It has a rich history, with the first inhabitants being the Inuit, Aleut, and Yupik peoples. The economy is largely based on natural resources, such as oil, gas, timber, and fish. The population is largely concentrated in the Southcentral region, with Anchorage being the largest city. Alaska is home to many different cultures and languages, and is an important part of the United States.
Common Questions
What is Per Capita Income in Tok?
Per Capita income in Tok is $33,257.
What is the Median Family Income in Tok?
Median Family Income in Tok is $47,344.
What is the Median Household income in Tok?
Median Household Income in Tok is $45,156.
What is Income or Wage Gap in Tok?
Income or Wage Gap in Tok is 23.8%.
Women in Tok earn 76.2 cents for every dollar earned by a man.
What is Inequality or Gini Index in Tok?
Inequality or Gini Index in Tok is 0.47.
What is the Total Population of Tok?
Total Population of Tok is 1,352.
What is the Total Male Population of Tok?
Total Male Population of Tok is 711.
What is the Total Female Population of Tok?
Total Female Population of Tok is 641.
What is the Ratio of Males per 100 Females in Tok?
There are 110.92 Males per 100 Females in Tok.
What is the Ratio of Females per 100 Males in Tok?
There are 90.15 Females per 100 Males in Tok.
What is the Median Population Age in Tok?
Median Population Age in Tok is 46.7 Years.
What is the Average Family Size in Tok
Average Family Size in Tok is 2.9 People.
What is the Average Household Size in Tok
Average Household Size in Tok is 2.4 People.
How Large is the Labor Force in Tok?
There are 581 People in the Labor Forcein in Tok.
What is the Percentage of People in the Labor Force in Tok?
50.2% of People are in the Labor Force in Tok.
What is the Unemployment Rate in Tok?
Unemployment Rate in Tok is 8.6%.