Tenakee Springs, AK Map & Demographics
Tenakee Springs Map
Tenakee Springs Overview
$44,023
PER CAPITA INCOME
$85,750
AVG FAMILY INCOME
$48,846
AVG HOUSEHOLD INCOME
6.6%
WAGE / INCOME GAP [ % ]
93.4¢/ $1
WAGE / INCOME GAP [ $ ]
0.50
INEQUALITY / GINI INDEX
136
TOTAL POPULATION
74
MALE POPULATION
62
FEMALE POPULATION
119.35
MALES / 100 FEMALES
83.78
FEMALES / 100 MALES
64.0
MEDIAN AGE
1.9
AVG FAMILY SIZE
1.4
AVG HOUSEHOLD SIZE
75
LABOR FORCE [ PEOPLE ]
59.1%
PERCENT IN LABOR FORCE
14.7%
UNEMPLOYMENT RATE
Tenakee Springs Zip Codes
Tenakee Springs Area Codes
Income in Tenakee Springs
Income Overview in Tenakee Springs
Per Capita Income in Tenakee Springs is $44,023, while median incomes of families and households are $85,750 and $48,846 respectively.
| Characteristic | Number | Measure |
| Per Capita Income | 136 | $44,023 |
| Median Family Income | 44 | $85,750 |
| Mean Family Income | 44 | $118,150 |
| Median Household Income | 98 | $48,846 |
| Mean Household Income | 98 | $73,477 |
| Income Deficit | 44 | $0 |
| Wage / Income Gap (%) | 136 | 6.58% |
| Wage / Income Gap ($) | 136 | 93.42¢ per $1 |
| Gini / Inequality Index | 136 | 0.50 |
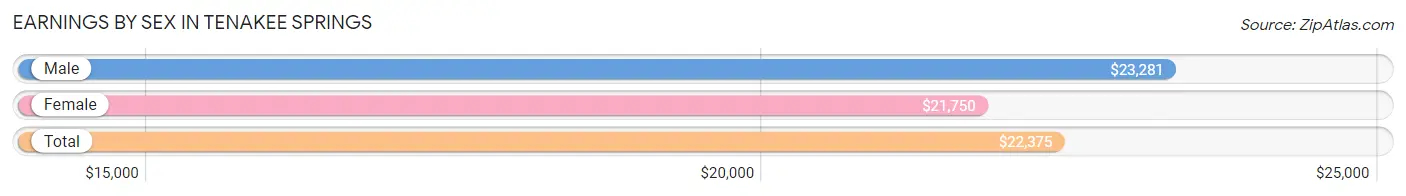
Earnings by Sex in Tenakee Springs
Average Earnings in Tenakee Springs are $22,375, $23,281 for men and $21,750 for women, a difference of 6.6%.
| Sex | Number | Average Earnings |
| Male | 47 (62.7%) | $23,281 |
| Female | 28 (37.3%) | $21,750 |
| Total | 75 (100.0%) | $22,375 |
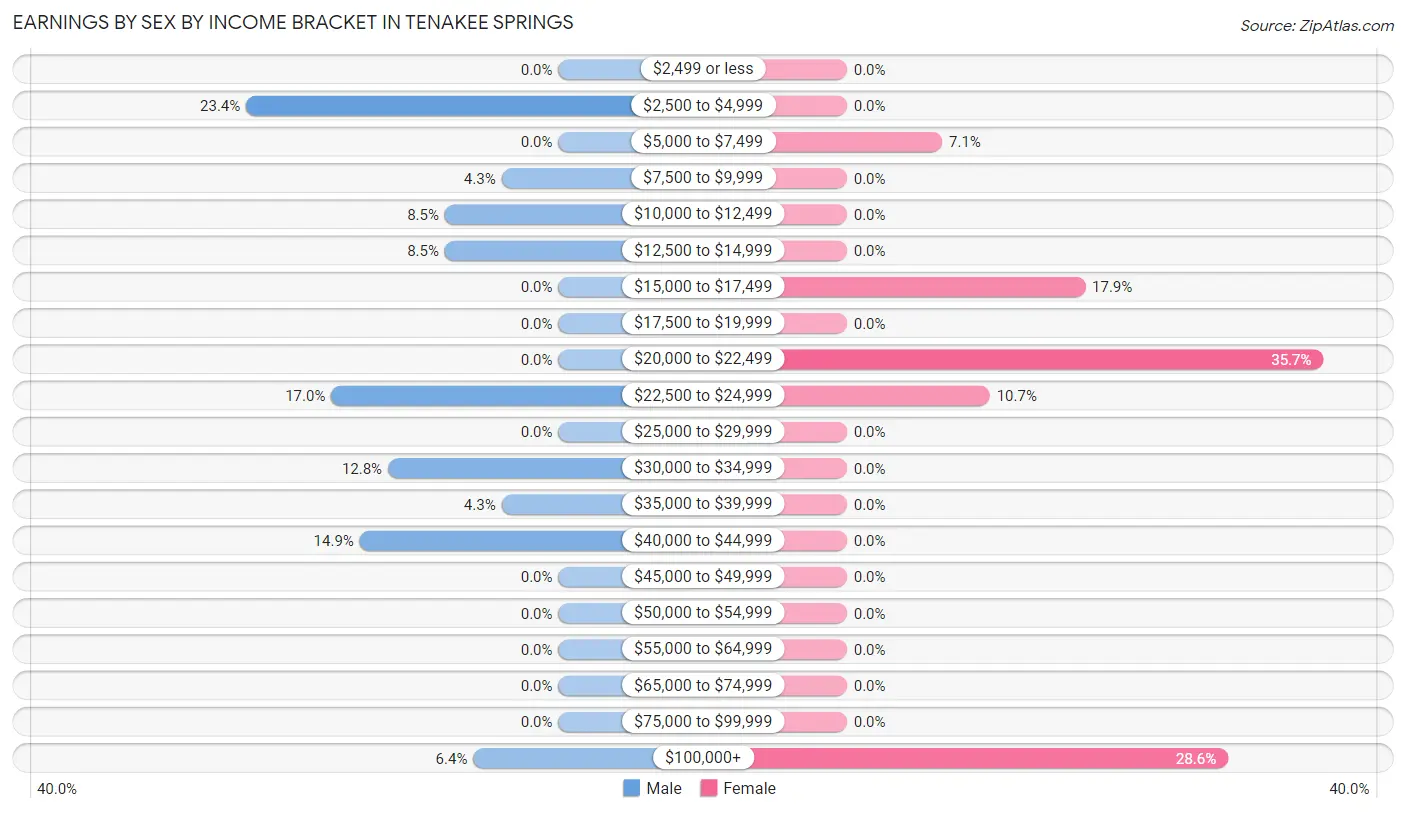
Earnings by Sex by Income Bracket in Tenakee Springs
The most common earnings brackets in Tenakee Springs are $2,500 to $4,999 for men (11 | 23.4%) and $20,000 to $22,499 for women (10 | 35.7%).
| Income | Male | Female |
| $2,499 or less | 0 (0.0%) | 0 (0.0%) |
| $2,500 to $4,999 | 11 (23.4%) | 0 (0.0%) |
| $5,000 to $7,499 | 0 (0.0%) | 2 (7.1%) |
| $7,500 to $9,999 | 2 (4.3%) | 0 (0.0%) |
| $10,000 to $12,499 | 4 (8.5%) | 0 (0.0%) |
| $12,500 to $14,999 | 4 (8.5%) | 0 (0.0%) |
| $15,000 to $17,499 | 0 (0.0%) | 5 (17.9%) |
| $17,500 to $19,999 | 0 (0.0%) | 0 (0.0%) |
| $20,000 to $22,499 | 0 (0.0%) | 10 (35.7%) |
| $22,500 to $24,999 | 8 (17.0%) | 3 (10.7%) |
| $25,000 to $29,999 | 0 (0.0%) | 0 (0.0%) |
| $30,000 to $34,999 | 6 (12.8%) | 0 (0.0%) |
| $35,000 to $39,999 | 2 (4.3%) | 0 (0.0%) |
| $40,000 to $44,999 | 7 (14.9%) | 0 (0.0%) |
| $45,000 to $49,999 | 0 (0.0%) | 0 (0.0%) |
| $50,000 to $54,999 | 0 (0.0%) | 0 (0.0%) |
| $55,000 to $64,999 | 0 (0.0%) | 0 (0.0%) |
| $65,000 to $74,999 | 0 (0.0%) | 0 (0.0%) |
| $75,000 to $99,999 | 0 (0.0%) | 0 (0.0%) |
| $100,000+ | 3 (6.4%) | 8 (28.6%) |
| Total | 47 (100.0%) | 28 (100.0%) |
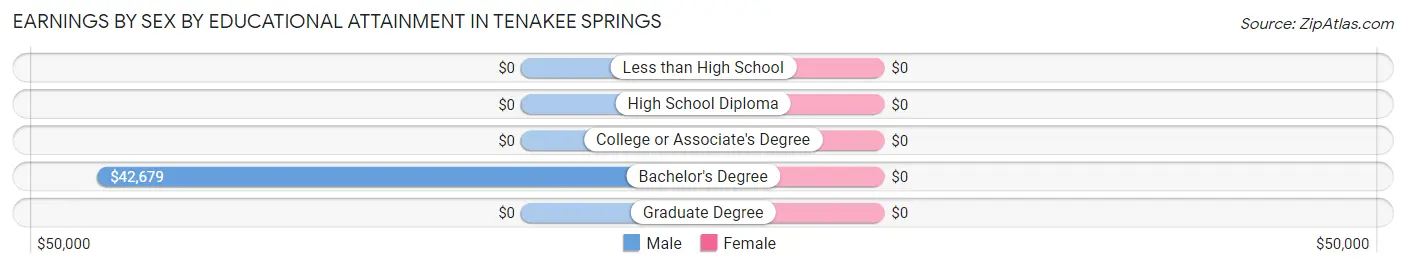
Earnings by Sex by Educational Attainment in Tenakee Springs
| Educational Attainment | Male Income | Female Income |
| Less than High School | - | - |
| High School Diploma | - | - |
| College or Associate's Degree | - | - |
| Bachelor's Degree | $42,679 | $0 |
| Graduate Degree | - | - |
| Total | $23,281 | $21,750 |
Family Income in Tenakee Springs
Family Income Brackets in Tenakee Springs
According to the Tenakee Springs family income data, there are 10 families falling into the $25,000 to $34,999 income range, which is the most common income bracket and makes up 22.7% of all families.
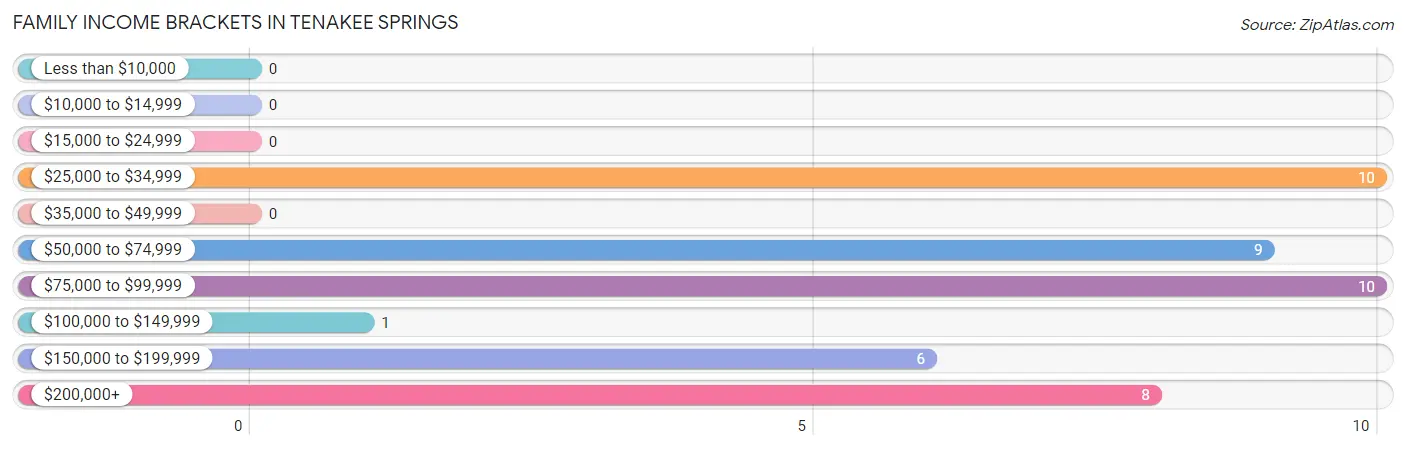
| Income Bracket | # Families | % Families |
| Less than $10,000 | 0 | 0.0% |
| $10,000 to $14,999 | 0 | 0.0% |
| $15,000 to $24,999 | 0 | 0.0% |
| $25,000 to $34,999 | 10 | 22.7% |
| $35,000 to $49,999 | 0 | 0.0% |
| $50,000 to $74,999 | 9 | 20.5% |
| $75,000 to $99,999 | 10 | 22.7% |
| $100,000 to $149,999 | 1 | 2.3% |
| $150,000 to $199,999 | 6 | 13.6% |
| $200,000+ | 8 | 18.2% |
Family Income by Famaliy Size in Tenakee Springs
2-person families (36 | 81.8%) account for the highest median family income in Tenakee Springs with $86,750 per family, while 2-person families (36 | 81.8%) have the highest median income of $43,375 per family member.
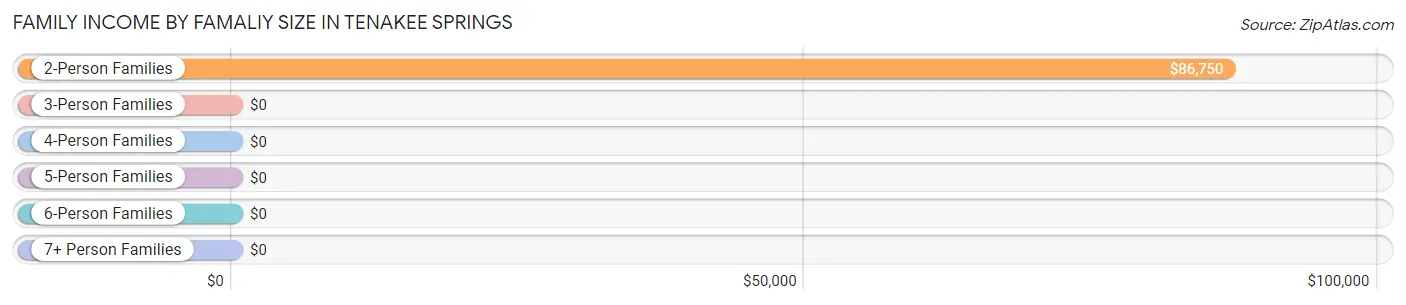
| Income Bracket | # Families | Median Income |
| 2-Person Families | 36 (81.8%) | $86,750 |
| 3-Person Families | 8 (18.2%) | $0 |
| 4-Person Families | 0 (0.0%) | $0 |
| 5-Person Families | 0 (0.0%) | $0 |
| 6-Person Families | 0 (0.0%) | $0 |
| 7+ Person Families | 0 (0.0%) | $0 |
| Total | 44 (100.0%) | $85,750 |
Family Income by Number of Earners in Tenakee Springs
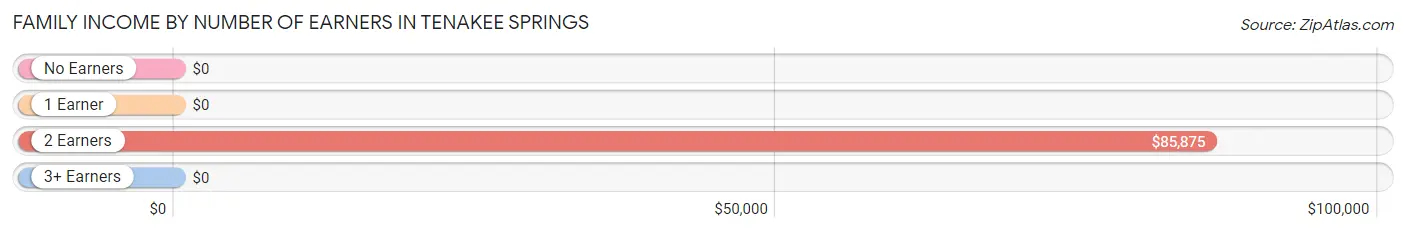
| Number of Earners | # Families | Median Income |
| No Earners | 3 (6.8%) | $0 |
| 1 Earner | 16 (36.4%) | $0 |
| 2 Earners | 25 (56.8%) | $85,875 |
| 3+ Earners | 0 (0.0%) | $0 |
| Total | 44 (100.0%) | $85,750 |
Household Income in Tenakee Springs
Household Income Brackets in Tenakee Springs
With 23 households falling in the category, the $35,000 to $49,999 income range is the most frequent in Tenakee Springs, accounting for 23.5% of all households.
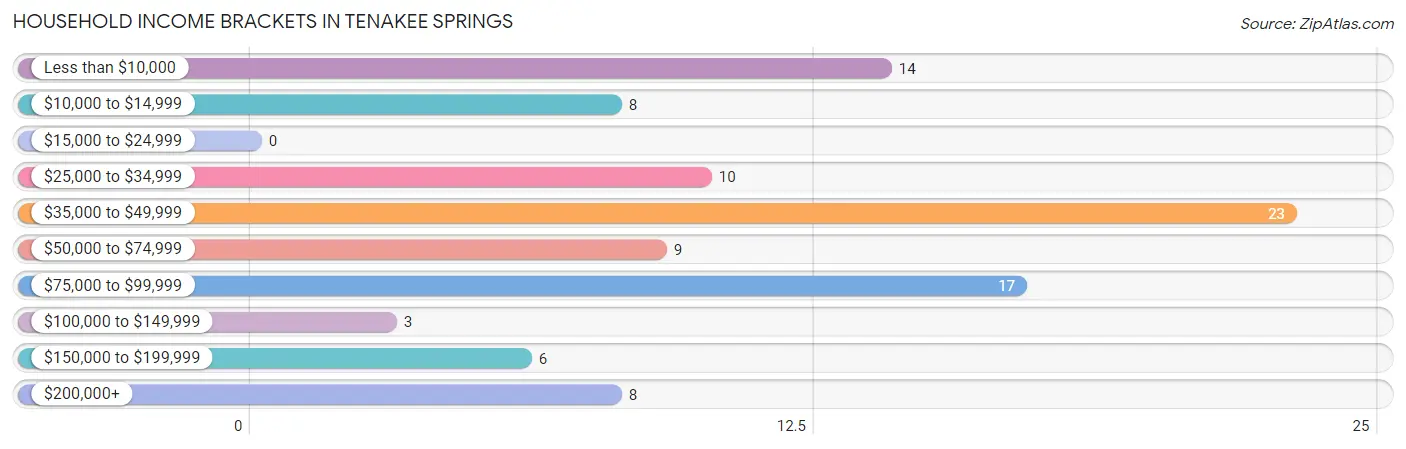
| Income Bracket | # Households | % Households |
| Less than $10,000 | 14 | 14.3% |
| $10,000 to $14,999 | 8 | 8.2% |
| $15,000 to $24,999 | 0 | 0.0% |
| $25,000 to $34,999 | 10 | 10.2% |
| $35,000 to $49,999 | 23 | 23.5% |
| $50,000 to $74,999 | 9 | 9.2% |
| $75,000 to $99,999 | 17 | 17.3% |
| $100,000 to $149,999 | 3 | 3.1% |
| $150,000 to $199,999 | 6 | 6.1% |
| $200,000+ | 8 | 8.2% |
Household Income by Householder Age in Tenakee Springs
The median household income in Tenakee Springs is $48,846, with the highest median household income of $48,750 found in the 65+ years age bracket for the primary householder. A total of 45 households (45.9%) fall into this category.
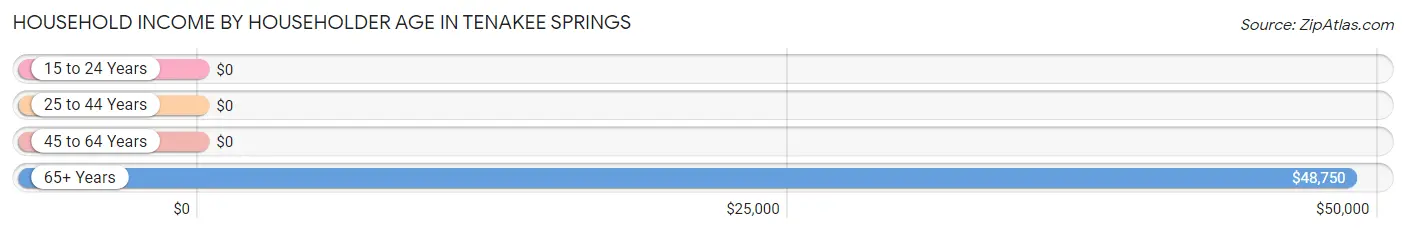
| Income Bracket | # Households | Median Income |
| 15 to 24 Years | 0 (0.0%) | $0 |
| 25 to 44 Years | 0 (0.0%) | $0 |
| 45 to 64 Years | 53 (54.1%) | $0 |
| 65+ Years | 45 (45.9%) | $48,750 |
| Total | 98 (100.0%) | $48,846 |
Poverty in Tenakee Springs
Income Below Poverty by Sex and Age in Tenakee Springs
With 21.6% poverty level for males and 6.5% for females among the residents of Tenakee Springs, 55 to 64 year old males and 65 to 74 year old females are the most vulnerable to poverty, with 3 males (60.0%) and 2 females (10.5%) in their respective age groups living below the poverty level.
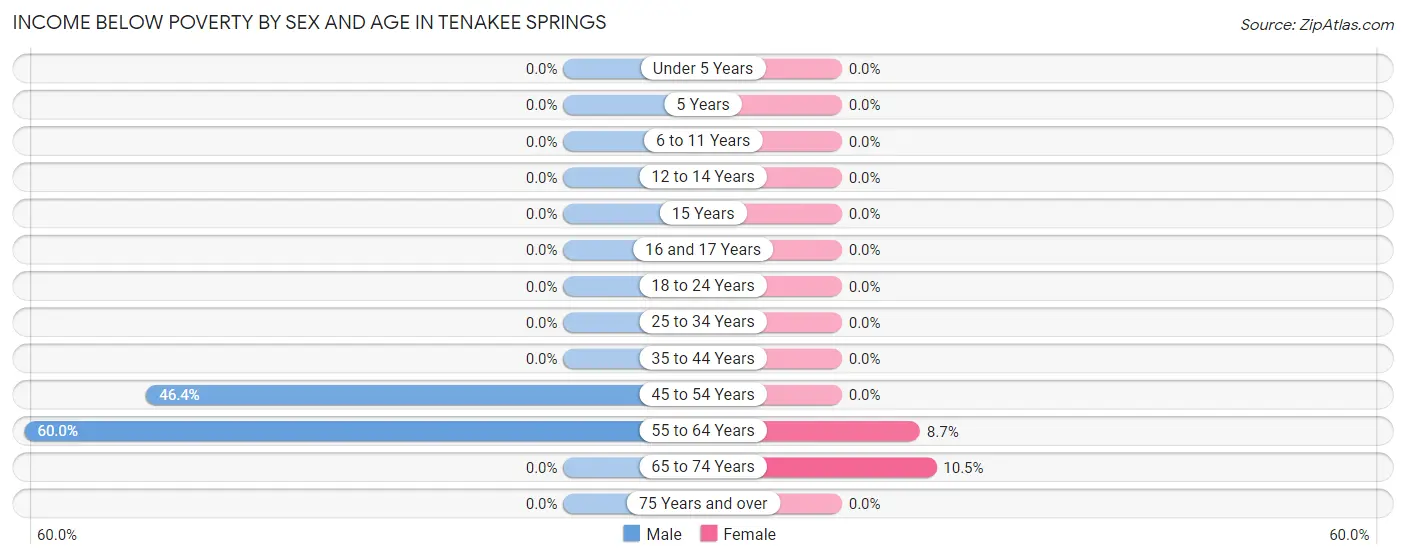
| Age Bracket | Male | Female |
| Under 5 Years | 0 (0.0%) | 0 (0.0%) |
| 5 Years | 0 (0.0%) | 0 (0.0%) |
| 6 to 11 Years | 0 (0.0%) | 0 (0.0%) |
| 12 to 14 Years | 0 (0.0%) | 0 (0.0%) |
| 15 Years | 0 (0.0%) | 0 (0.0%) |
| 16 and 17 Years | 0 (0.0%) | 0 (0.0%) |
| 18 to 24 Years | 0 (0.0%) | 0 (0.0%) |
| 25 to 34 Years | 0 (0.0%) | 0 (0.0%) |
| 35 to 44 Years | 0 (0.0%) | 0 (0.0%) |
| 45 to 54 Years | 13 (46.4%) | 0 (0.0%) |
| 55 to 64 Years | 3 (60.0%) | 2 (8.7%) |
| 65 to 74 Years | 0 (0.0%) | 2 (10.5%) |
| 75 Years and over | 0 (0.0%) | 0 (0.0%) |
| Total | 16 (21.6%) | 4 (6.5%) |
Income Above Poverty by Sex and Age in Tenakee Springs
According to the poverty statistics in Tenakee Springs, males aged 35 to 44 years and females aged 6 to 11 years are the age groups that are most secure financially, with 100.0% of males and 100.0% of females in these age groups living above the poverty line.
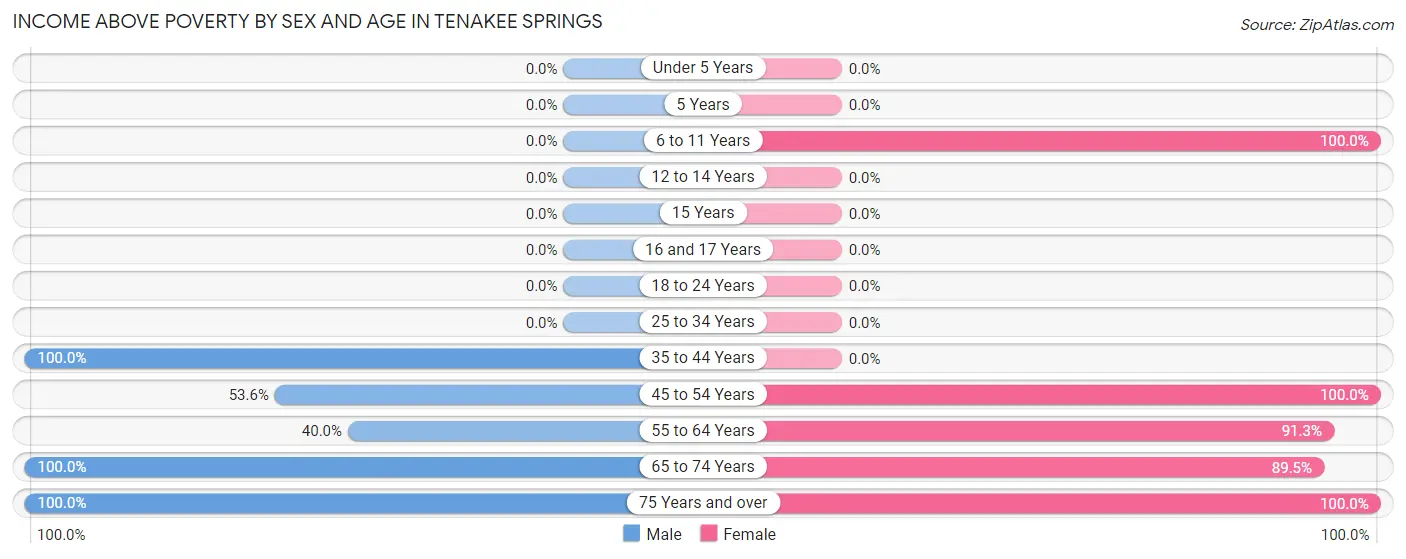
| Age Bracket | Male | Female |
| Under 5 Years | 0 (0.0%) | 0 (0.0%) |
| 5 Years | 0 (0.0%) | 0 (0.0%) |
| 6 to 11 Years | 0 (0.0%) | 9 (100.0%) |
| 12 to 14 Years | 0 (0.0%) | 0 (0.0%) |
| 15 Years | 0 (0.0%) | 0 (0.0%) |
| 16 and 17 Years | 0 (0.0%) | 0 (0.0%) |
| 18 to 24 Years | 0 (0.0%) | 0 (0.0%) |
| 25 to 34 Years | 0 (0.0%) | 0 (0.0%) |
| 35 to 44 Years | 3 (100.0%) | 0 (0.0%) |
| 45 to 54 Years | 15 (53.6%) | 10 (100.0%) |
| 55 to 64 Years | 2 (40.0%) | 21 (91.3%) |
| 65 to 74 Years | 29 (100.0%) | 17 (89.5%) |
| 75 Years and over | 9 (100.0%) | 1 (100.0%) |
| Total | 58 (78.4%) | 58 (93.5%) |
Income Below Poverty Among Married-Couple Families in Tenakee Springs
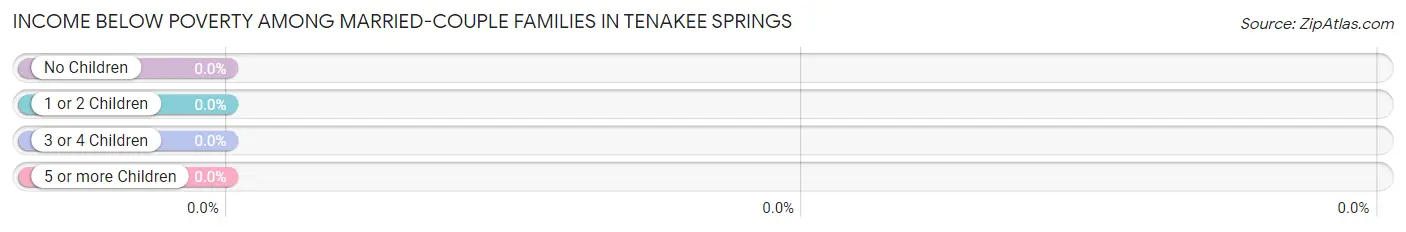
| Children | Above Poverty | Below Poverty |
| No Children | 36 (100.0%) | 0 (0.0%) |
| 1 or 2 Children | 8 (100.0%) | 0 (0.0%) |
| 3 or 4 Children | 0 (0.0%) | 0 (0.0%) |
| 5 or more Children | 0 (0.0%) | 0 (0.0%) |
| Total | 44 (100.0%) | 0 (0.0%) |
Income Below Poverty Among Single-Parent Households in Tenakee Springs
| Children | Single Father | Single Mother |
| No Children | 0 (0.0%) | 0 (0.0%) |
| 1 or 2 Children | 0 (0.0%) | 0 (0.0%) |
| 3 or 4 Children | 0 (0.0%) | 0 (0.0%) |
| 5 or more Children | 0 (0.0%) | 0 (0.0%) |
| Total | 0 (0.0%) | 0 (0.0%) |
Income Below Poverty Among Married-Couple vs Single-Parent Households in Tenakee Springs
| Children | Married-Couple Families | Single-Parent Households |
| No Children | 0 (0.0%) | 0 (0.0%) |
| 1 or 2 Children | 0 (0.0%) | 0 (0.0%) |
| 3 or 4 Children | 0 (0.0%) | 0 (0.0%) |
| 5 or more Children | 0 (0.0%) | 0 (0.0%) |
| Total | 0 (0.0%) | 0 (0.0%) |
Race in Tenakee Springs
The most populous races in Tenakee Springs are White / Caucasian (130 | 95.6%), Hispanic or Latino (19 | 14.0%), and Two or more Races (6 | 4.4%).
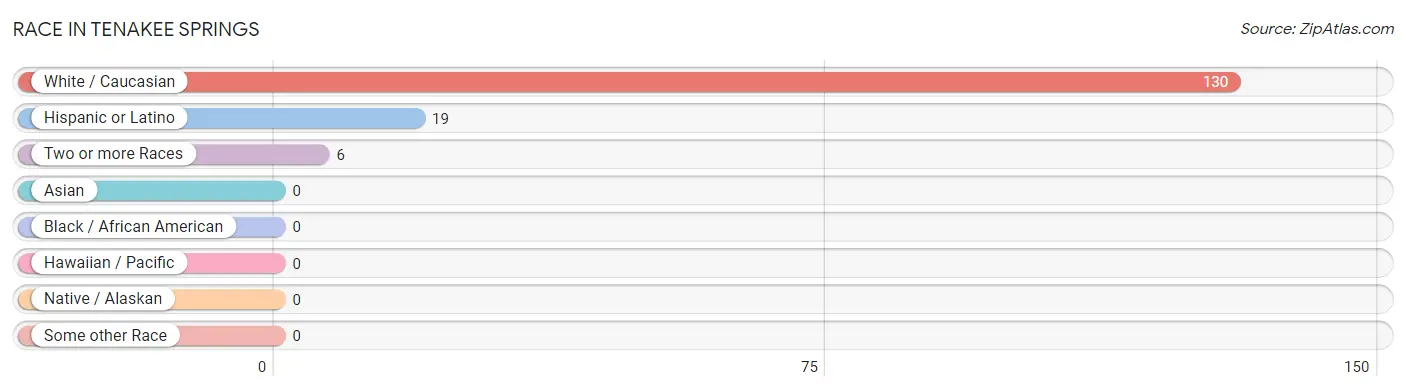
| Race | # Population | % Population |
| Asian | 0 | 0.0% |
| Black / African American | 0 | 0.0% |
| Hawaiian / Pacific | 0 | 0.0% |
| Hispanic or Latino | 19 | 14.0% |
| Native / Alaskan | 0 | 0.0% |
| White / Caucasian | 130 | 95.6% |
| Two or more Races | 6 | 4.4% |
| Some other Race | 0 | 0.0% |
| Total | 136 | 100.0% |
Ancestry in Tenakee Springs
The most populous ancestries reported in Tenakee Springs are German (48 | 35.3%), Italian (30 | 22.1%), English (21 | 15.4%), Irish (12 | 8.8%), and Swedish (11 | 8.1%), together accounting for 89.7% of all Tenakee Springs residents.
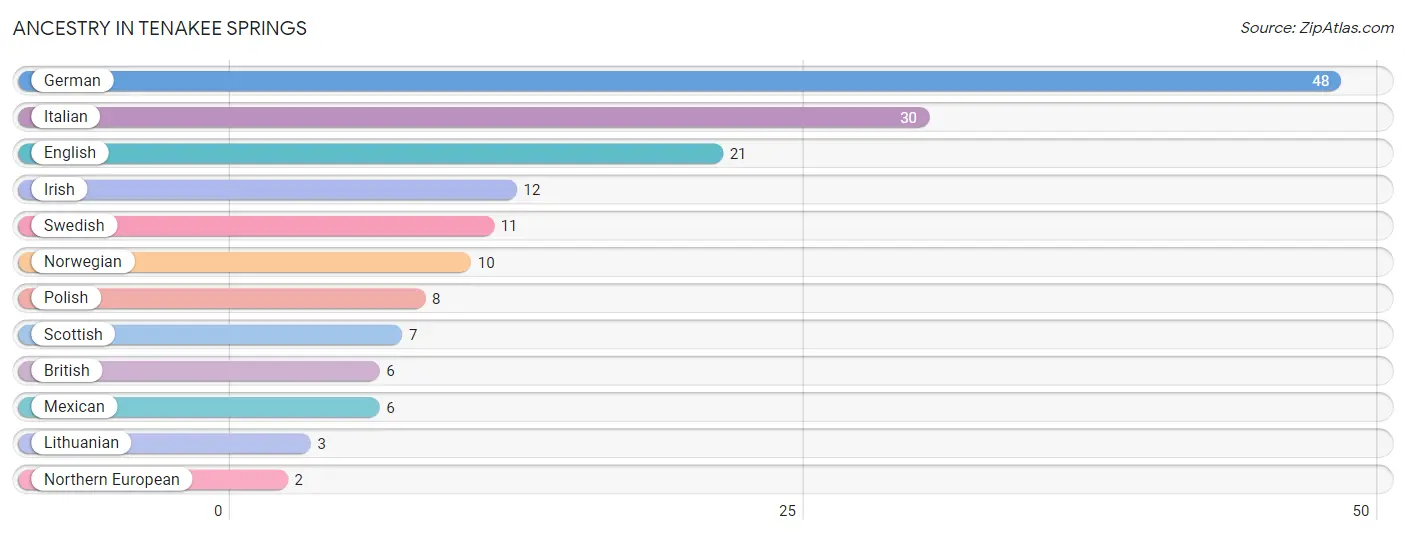
| Ancestry | # Population | % Population |
| British | 6 | 4.4% |
| English | 21 | 15.4% |
| German | 48 | 35.3% |
| Irish | 12 | 8.8% |
| Italian | 30 | 22.1% |
| Lithuanian | 3 | 2.2% |
| Mexican | 6 | 4.4% |
| Northern European | 2 | 1.5% |
| Norwegian | 10 | 7.3% |
| Polish | 8 | 5.9% |
| Scottish | 7 | 5.1% |
| Swedish | 11 | 8.1% | View All 12 Rows |
Immigrants in Tenakee Springs

| Immigration Origin | # Population | % Population | View All 0 Rows |
Sex and Age in Tenakee Springs
Sex and Age in Tenakee Springs
The most populous age groups in Tenakee Springs are 45 to 49 Years (19 | 25.7%) for men and 60 to 64 Years (15 | 24.2%) for women.
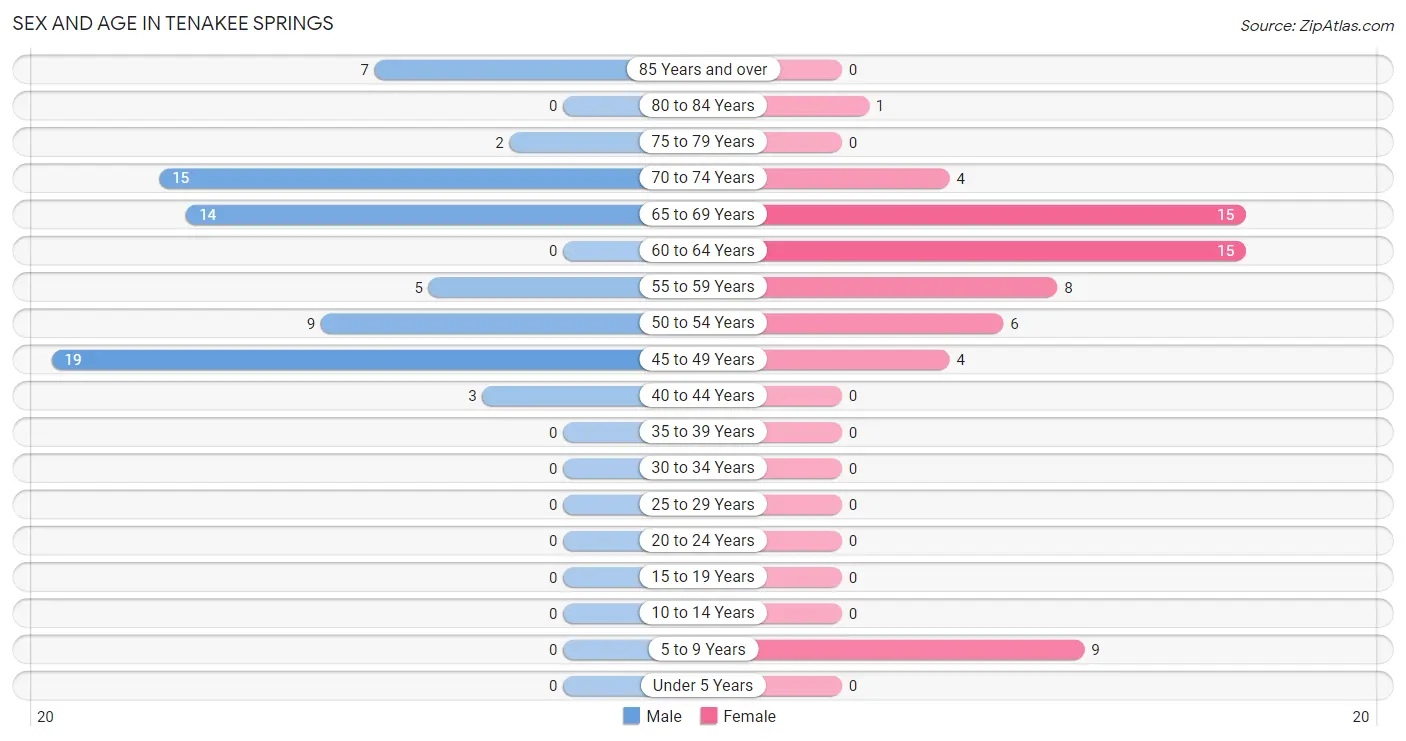
| Age Bracket | Male | Female |
| Under 5 Years | 0 (0.0%) | 0 (0.0%) |
| 5 to 9 Years | 0 (0.0%) | 9 (14.5%) |
| 10 to 14 Years | 0 (0.0%) | 0 (0.0%) |
| 15 to 19 Years | 0 (0.0%) | 0 (0.0%) |
| 20 to 24 Years | 0 (0.0%) | 0 (0.0%) |
| 25 to 29 Years | 0 (0.0%) | 0 (0.0%) |
| 30 to 34 Years | 0 (0.0%) | 0 (0.0%) |
| 35 to 39 Years | 0 (0.0%) | 0 (0.0%) |
| 40 to 44 Years | 3 (4.1%) | 0 (0.0%) |
| 45 to 49 Years | 19 (25.7%) | 4 (6.5%) |
| 50 to 54 Years | 9 (12.2%) | 6 (9.7%) |
| 55 to 59 Years | 5 (6.8%) | 8 (12.9%) |
| 60 to 64 Years | 0 (0.0%) | 15 (24.2%) |
| 65 to 69 Years | 14 (18.9%) | 15 (24.2%) |
| 70 to 74 Years | 15 (20.3%) | 4 (6.5%) |
| 75 to 79 Years | 2 (2.7%) | 0 (0.0%) |
| 80 to 84 Years | 0 (0.0%) | 1 (1.6%) |
| 85 Years and over | 7 (9.5%) | 0 (0.0%) |
| Total | 74 (100.0%) | 62 (100.0%) |
Families and Households in Tenakee Springs
Median Family Size in Tenakee Springs
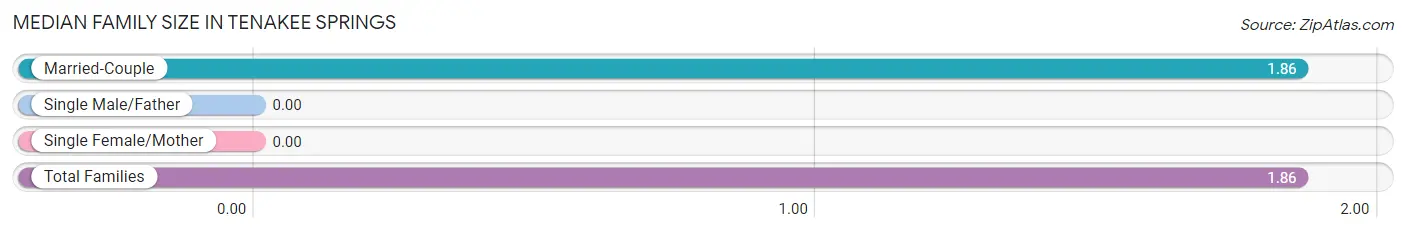
| Family Type | # Families | Family Size |
| Married-Couple | 44 (100.0%) | 1.86 |
| Single Male/Father | 0 (0.0%) | - |
| Single Female/Mother | 0 (0.0%) | - |
| Total Families | 44 (100.0%) | 1.86 |
Median Household Size in Tenakee Springs
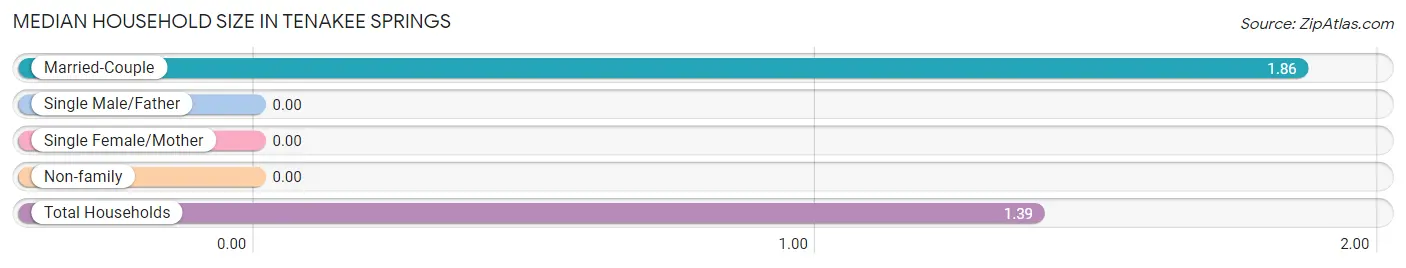
| Household Type | # Households | Household Size |
| Married-Couple | 44 (44.9%) | 1.86 |
| Single Male/Father | 0 (0.0%) | - |
| Single Female/Mother | 0 (0.0%) | - |
| Non-family | 54 (55.1%) | - |
| Total Households | 98 (100.0%) | 1.39 |
Household Size by Marriage Status in Tenakee Springs
Out of a total of 98 households in Tenakee Springs, 44 (44.9%) are family households, while 54 (55.1%) are nonfamily households. The most numerous type of family households are 2-person households, comprising 36, and the most common type of nonfamily households are 1-person households, comprising 54.
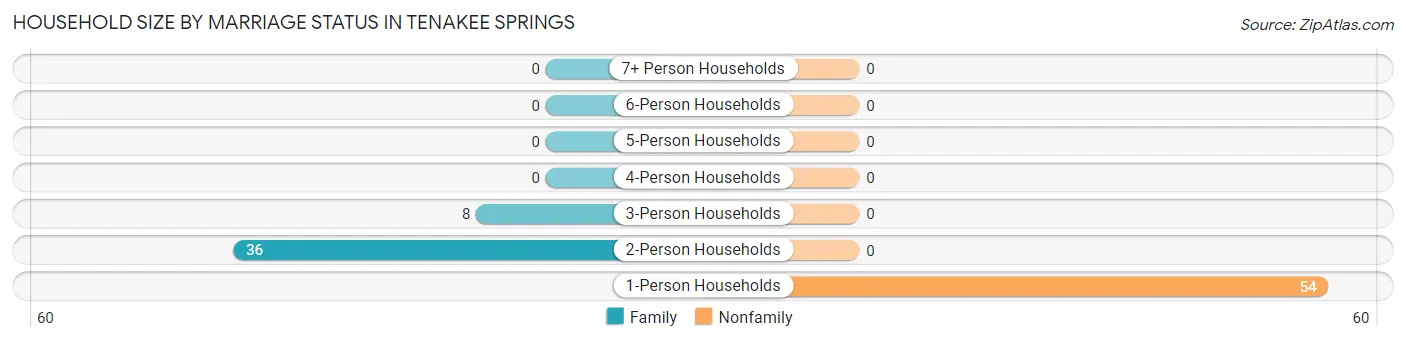
| Household Size | Family Households | Nonfamily Households |
| 1-Person Households | - | 54 (55.1%) |
| 2-Person Households | 36 (36.7%) | 0 (0.0%) |
| 3-Person Households | 8 (8.2%) | 0 (0.0%) |
| 4-Person Households | 0 (0.0%) | 0 (0.0%) |
| 5-Person Households | 0 (0.0%) | 0 (0.0%) |
| 6-Person Households | 0 (0.0%) | 0 (0.0%) |
| 7+ Person Households | 0 (0.0%) | 0 (0.0%) |
| Total | 44 (44.9%) | 54 (55.1%) |
Female Fertility in Tenakee Springs
Fertility by Age in Tenakee Springs
| Age Bracket | Women with Births | Births / 1,000 Women |
| 15 to 19 years | 0 (0.0%) | 0.0 |
| 20 to 34 years | 0 (0.0%) | 0.0 |
| 35 to 50 years | 0 (0.0%) | 0.0 |
| Total | 0 (0.0%) | 0.0 |
Fertility by Age by Marriage Status in Tenakee Springs
| Age Bracket | Married | Unmarried |
| 15 to 19 years | 0 (0.0%) | 0 (0.0%) |
| 20 to 34 years | 0 (0.0%) | 0 (0.0%) |
| 35 to 50 years | 0 (0.0%) | 0 (0.0%) |
| Total | 0 (0.0%) | 0 (0.0%) |
Fertility by Education in Tenakee Springs
| Educational Attainment | Women with Births | Births / 1,000 Women |
| Less than High School | 0 (0.0%) | 0.0 |
| High School Diploma | 0 (0.0%) | 0.0 |
| College or Associate's Degree | 0 (0.0%) | 0.0 |
| Bachelor's Degree | 0 (0.0%) | 0.0 |
| Graduate Degree | 0 (0.0%) | 0.0 |
| Total | 0 (0.0%) | 0.0 |
Fertility by Education by Marriage Status in Tenakee Springs
| Educational Attainment | Married | Unmarried |
| Less than High School | 0 (0.0%) | 0 (0.0%) |
| High School Diploma | 0 (0.0%) | 0 (0.0%) |
| College or Associate's Degree | 0 (0.0%) | 0 (0.0%) |
| Bachelor's Degree | 0 (0.0%) | 0 (0.0%) |
| Graduate Degree | 0 (0.0%) | 0 (0.0%) |
| Total | 0 (0.0%) | 0 (0.0%) |
Employment Characteristics in Tenakee Springs
Employment by Class of Employer in Tenakee Springs
Among the 56 employed individuals in Tenakee Springs, self-employed (not incorporated) (24 | 42.9%), local government employees (16 | 28.6%), and state government employees (8 | 14.3%) make up the most common classes of employment.
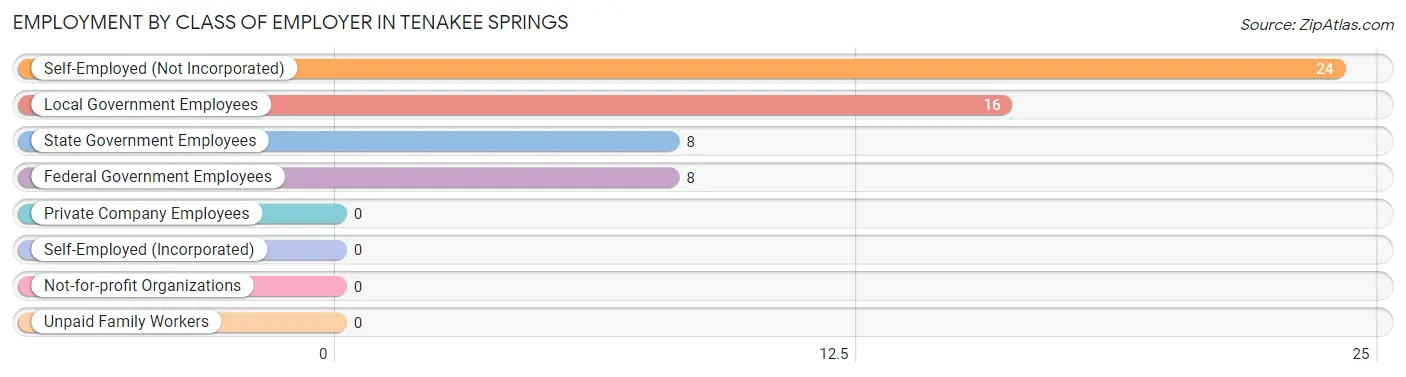
| Employer Class | # Employees | % Employees |
| Private Company Employees | 0 | 0.0% |
| Self-Employed (Incorporated) | 0 | 0.0% |
| Self-Employed (Not Incorporated) | 24 | 42.9% |
| Not-for-profit Organizations | 0 | 0.0% |
| Local Government Employees | 16 | 28.6% |
| State Government Employees | 8 | 14.3% |
| Federal Government Employees | 8 | 14.3% |
| Unpaid Family Workers | 0 | 0.0% |
| Total | 56 | 100.0% |
Employment Status by Age in Tenakee Springs
According to the labor force statistics for Tenakee Springs, out of the total population over 16 years of age (127), 59.1% or 75 individuals are in the labor force, with 14.7% or 11 of them unemployed. The age group with the highest labor force participation rate is 35 to 44 years, with 100.0% or 3 individuals in the labor force. Within the labor force, the 65 to 74 years age range has the highest percentage of unemployed individuals, with 52.4% or 11 of them being unemployed.
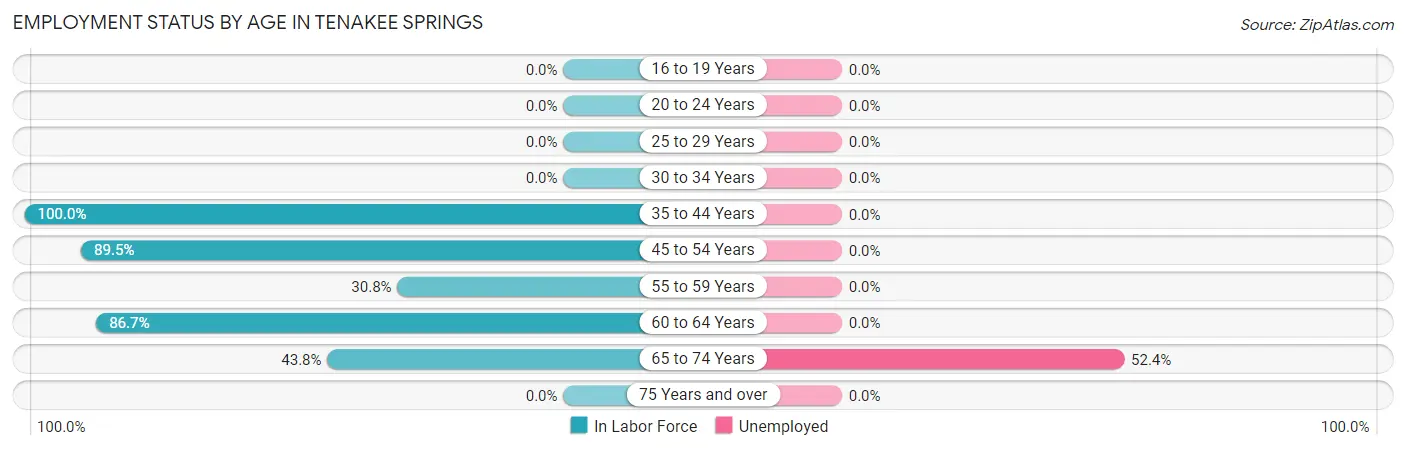
| Age Bracket | In Labor Force | Unemployed |
| 16 to 19 Years | 0 (0.0%) | 0 (0.0%) |
| 20 to 24 Years | 0 (0.0%) | 0 (0.0%) |
| 25 to 29 Years | 0 (0.0%) | 0 (0.0%) |
| 30 to 34 Years | 0 (0.0%) | 0 (0.0%) |
| 35 to 44 Years | 3 (100.0%) | 0 (0.0%) |
| 45 to 54 Years | 34 (89.5%) | 0 (0.0%) |
| 55 to 59 Years | 4 (30.8%) | 0 (0.0%) |
| 60 to 64 Years | 13 (86.7%) | 0 (0.0%) |
| 65 to 74 Years | 21 (43.8%) | 11 (52.4%) |
| 75 Years and over | 0 (0.0%) | 0 (0.0%) |
| Total | 75 (59.1%) | 11 (14.7%) |
Employment Status by Educational Attainment in Tenakee Springs
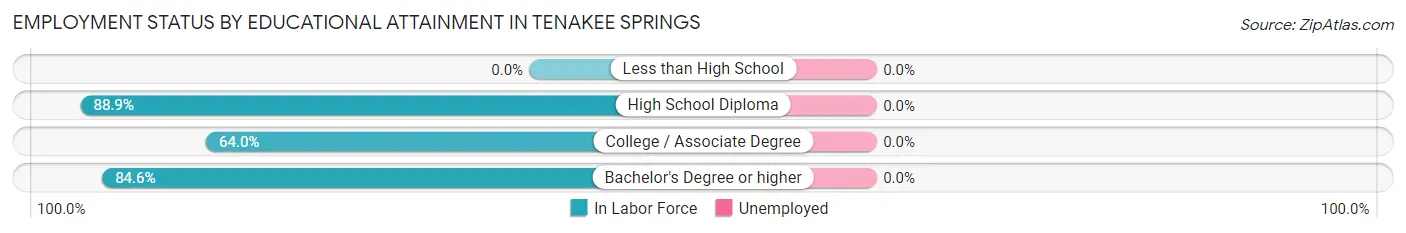
| Educational Attainment | In Labor Force | Unemployed |
| Less than High School | 0 (0.0%) | 0 (0.0%) |
| High School Diploma | 16 (88.9%) | 0 (0.0%) |
| College / Associate Degree | 16 (64.0%) | 0 (0.0%) |
| Bachelor's Degree or higher | 22 (84.6%) | 0 (0.0%) |
| Total | 54 (78.3%) | 0 (0.0%) |
Employment Occupations by Sex in Tenakee Springs
Management, Business, Science and Arts Occupations
The most common Management, Business, Science and Arts occupations in Tenakee Springs are Management (18 | 28.1%), Community & Social Service (7 | 10.9%), Arts, Media & Entertainment (5 | 7.8%), and Education Instruction & Library (2 | 3.1%).
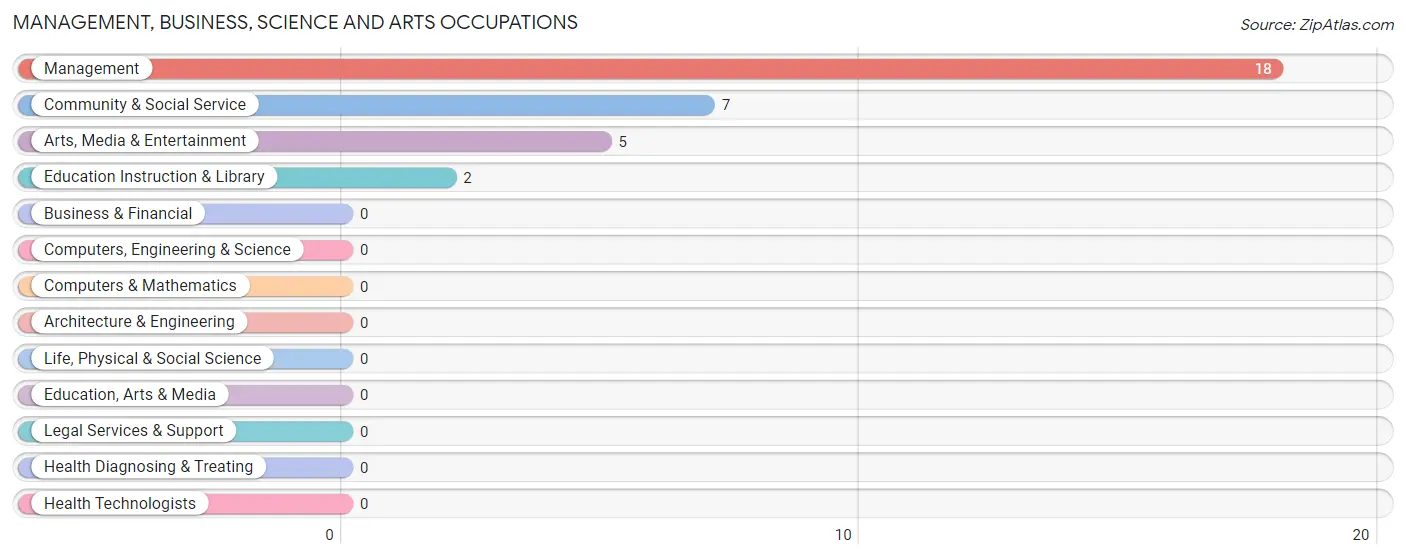
Management, Business, Science and Arts Occupations by Sex
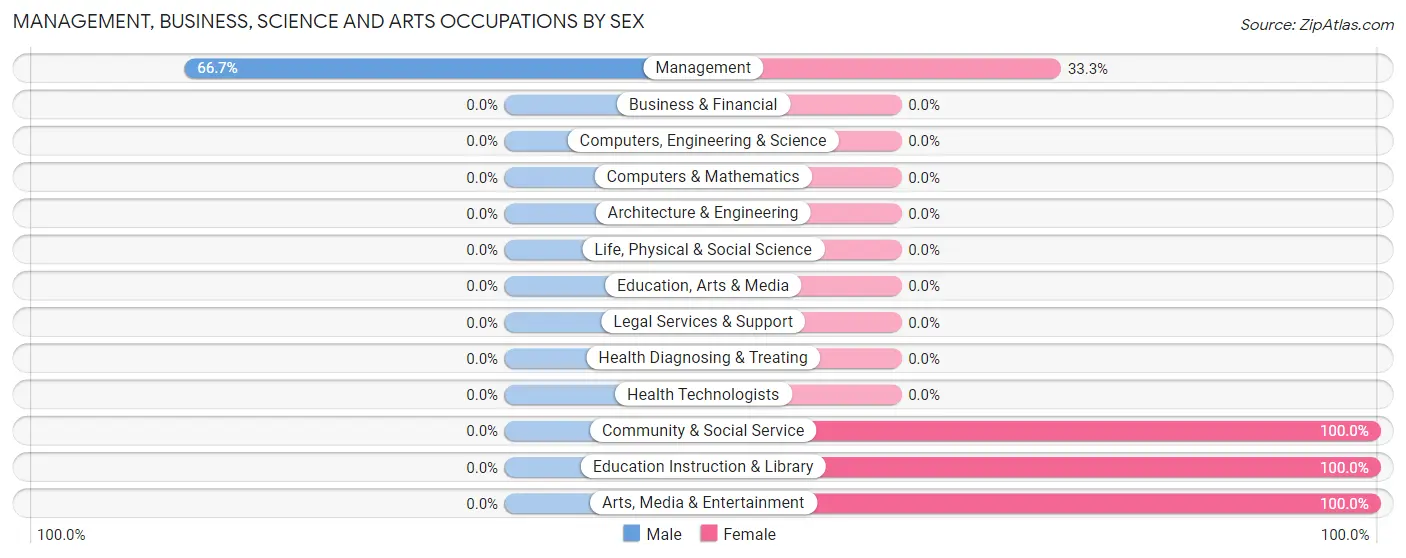
| Occupation | Male | Female |
| Management | 12 (66.7%) | 6 (33.3%) |
| Business & Financial | 0 (0.0%) | 0 (0.0%) |
| Computers, Engineering & Science | 0 (0.0%) | 0 (0.0%) |
| Computers & Mathematics | 0 (0.0%) | 0 (0.0%) |
| Architecture & Engineering | 0 (0.0%) | 0 (0.0%) |
| Life, Physical & Social Science | 0 (0.0%) | 0 (0.0%) |
| Community & Social Service | 0 (0.0%) | 7 (100.0%) |
| Education, Arts & Media | 0 (0.0%) | 0 (0.0%) |
| Legal Services & Support | 0 (0.0%) | 0 (0.0%) |
| Education Instruction & Library | 0 (0.0%) | 2 (100.0%) |
| Arts, Media & Entertainment | 0 (0.0%) | 5 (100.0%) |
| Health Diagnosing & Treating | 0 (0.0%) | 0 (0.0%) |
| Health Technologists | 0 (0.0%) | 0 (0.0%) |
| Total (Category) | 12 (48.0%) | 13 (52.0%) |
| Total (Overall) | 41 (64.1%) | 23 (35.9%) |
Services Occupations
Services Occupations by Sex
| Occupation | Male | Female |
| Healthcare Support | 0 (0.0%) | 0 (0.0%) |
| Security & Protection | 0 (0.0%) | 0 (0.0%) |
| Firefighting & Prevention | 0 (0.0%) | 0 (0.0%) |
| Law Enforcement | 0 (0.0%) | 0 (0.0%) |
| Food Preparation & Serving | 0 (0.0%) | 0 (0.0%) |
| Cleaning & Maintenance | 0 (0.0%) | 0 (0.0%) |
| Personal Care & Service | 0 (0.0%) | 0 (0.0%) |
| Total (Category) | 0 (0.0%) | 0 (0.0%) |
| Total (Overall) | 41 (64.1%) | 23 (35.9%) |
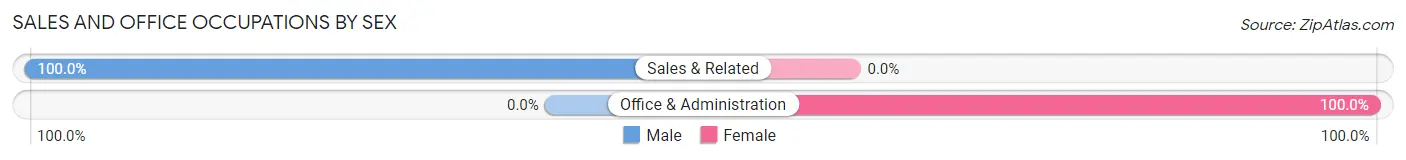
Sales and Office Occupations
The most common Sales and Office occupations in Tenakee Springs are Office & Administration (10 | 15.6%), and Sales & Related (7 | 10.9%).
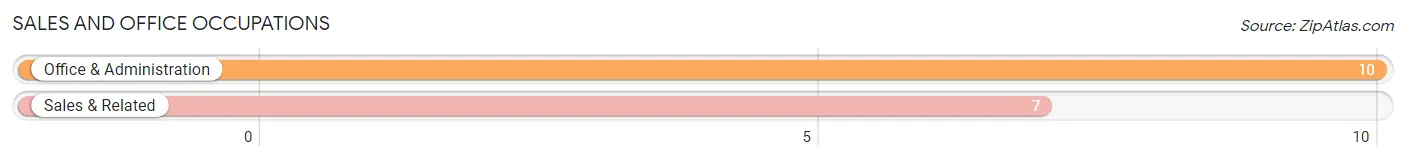
Sales and Office Occupations by Sex
| Occupation | Male | Female |
| Sales & Related | 7 (100.0%) | 0 (0.0%) |
| Office & Administration | 0 (0.0%) | 10 (100.0%) |
| Total (Category) | 7 (41.2%) | 10 (58.8%) |
| Total (Overall) | 41 (64.1%) | 23 (35.9%) |
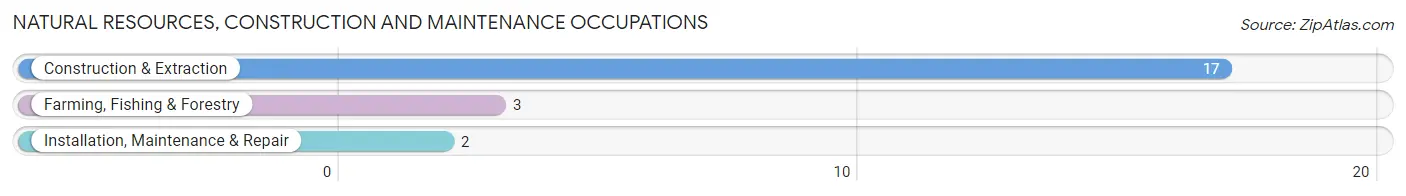
Natural Resources, Construction and Maintenance Occupations
The most common Natural Resources, Construction and Maintenance occupations in Tenakee Springs are Construction & Extraction (17 | 26.6%), Farming, Fishing & Forestry (3 | 4.7%), and Installation, Maintenance & Repair (2 | 3.1%).
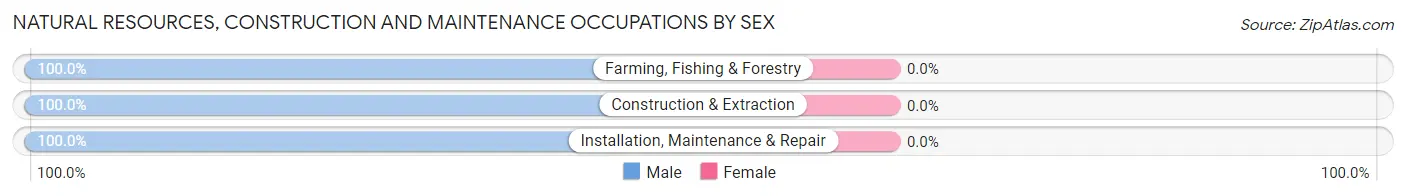
Natural Resources, Construction and Maintenance Occupations by Sex
| Occupation | Male | Female |
| Farming, Fishing & Forestry | 3 (100.0%) | 0 (0.0%) |
| Construction & Extraction | 17 (100.0%) | 0 (0.0%) |
| Installation, Maintenance & Repair | 2 (100.0%) | 0 (0.0%) |
| Total (Category) | 22 (100.0%) | 0 (0.0%) |
| Total (Overall) | 41 (64.1%) | 23 (35.9%) |
Production, Transportation and Moving Occupations
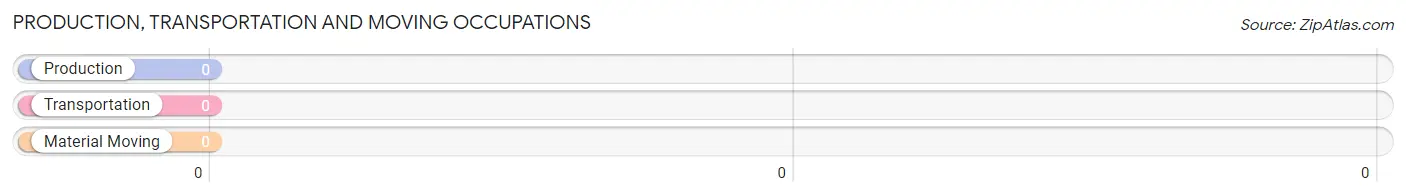
Production, Transportation and Moving Occupations by Sex
| Occupation | Male | Female |
| Production | 0 (0.0%) | 0 (0.0%) |
| Transportation | 0 (0.0%) | 0 (0.0%) |
| Material Moving | 0 (0.0%) | 0 (0.0%) |
| Total (Category) | 0 (0.0%) | 0 (0.0%) |
| Total (Overall) | 41 (64.1%) | 23 (35.9%) |
Employment Industries by Sex in Tenakee Springs
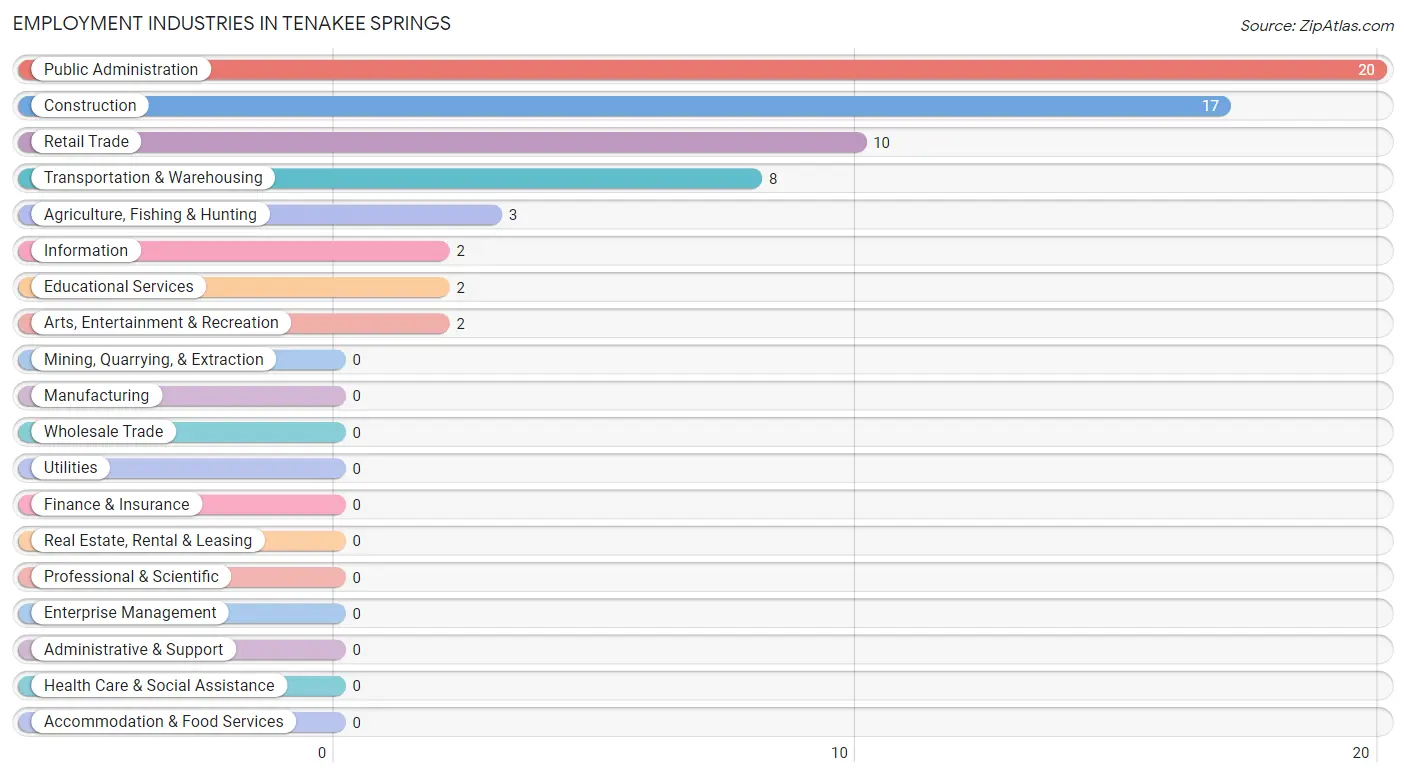
Employment Industries in Tenakee Springs
The major employment industries in Tenakee Springs include Public Administration (20 | 31.2%), Construction (17 | 26.6%), Retail Trade (10 | 15.6%), Transportation & Warehousing (8 | 12.5%), and Agriculture, Fishing & Hunting (3 | 4.7%).
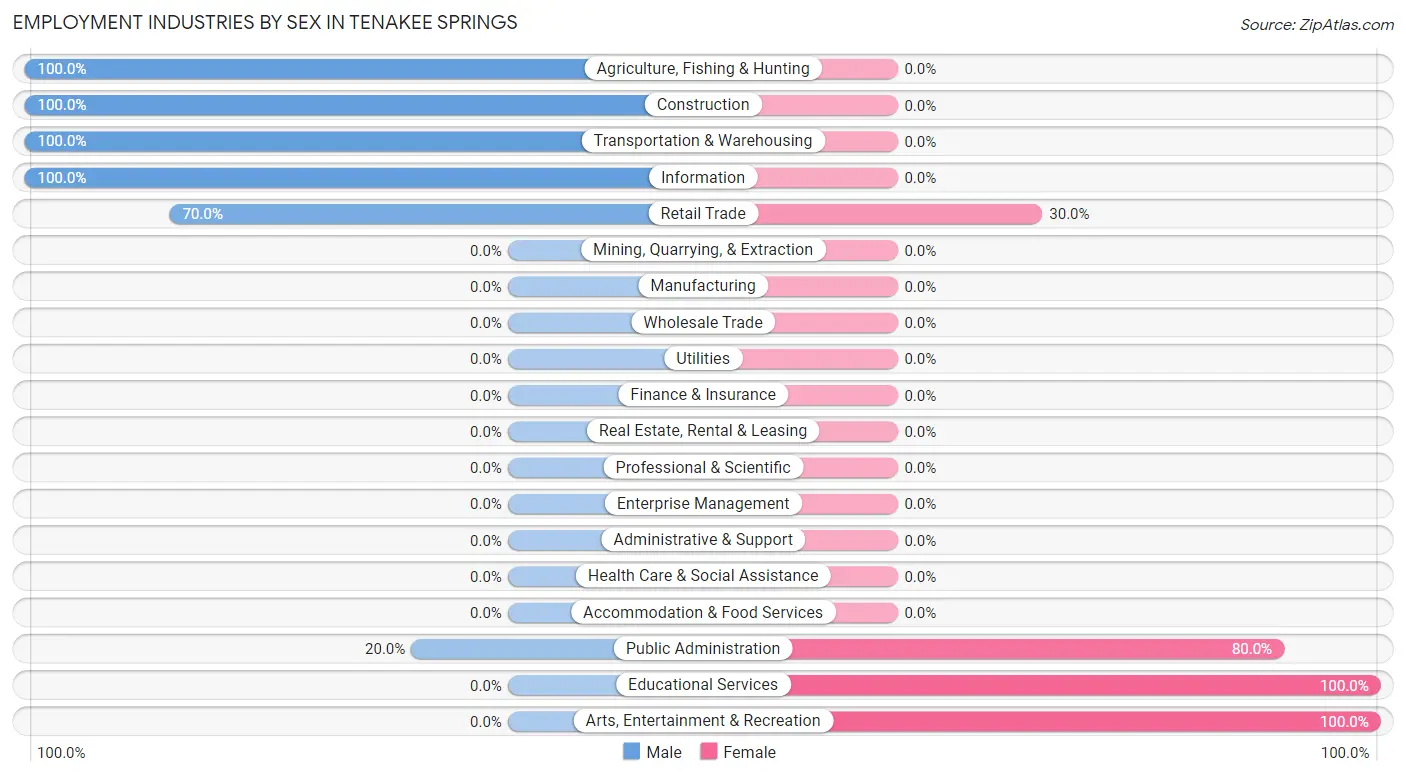
Employment Industries by Sex in Tenakee Springs
The Tenakee Springs industries that see more men than women are Agriculture, Fishing & Hunting (100.0%), Construction (100.0%), and Transportation & Warehousing (100.0%), whereas the industries that tend to have a higher number of women are Educational Services (100.0%), Arts, Entertainment & Recreation (100.0%), and Public Administration (80.0%).
| Industry | Male | Female |
| Agriculture, Fishing & Hunting | 3 (100.0%) | 0 (0.0%) |
| Mining, Quarrying, & Extraction | 0 (0.0%) | 0 (0.0%) |
| Construction | 17 (100.0%) | 0 (0.0%) |
| Manufacturing | 0 (0.0%) | 0 (0.0%) |
| Wholesale Trade | 0 (0.0%) | 0 (0.0%) |
| Retail Trade | 7 (70.0%) | 3 (30.0%) |
| Transportation & Warehousing | 8 (100.0%) | 0 (0.0%) |
| Utilities | 0 (0.0%) | 0 (0.0%) |
| Information | 2 (100.0%) | 0 (0.0%) |
| Finance & Insurance | 0 (0.0%) | 0 (0.0%) |
| Real Estate, Rental & Leasing | 0 (0.0%) | 0 (0.0%) |
| Professional & Scientific | 0 (0.0%) | 0 (0.0%) |
| Enterprise Management | 0 (0.0%) | 0 (0.0%) |
| Administrative & Support | 0 (0.0%) | 0 (0.0%) |
| Educational Services | 0 (0.0%) | 2 (100.0%) |
| Health Care & Social Assistance | 0 (0.0%) | 0 (0.0%) |
| Arts, Entertainment & Recreation | 0 (0.0%) | 2 (100.0%) |
| Accommodation & Food Services | 0 (0.0%) | 0 (0.0%) |
| Public Administration | 4 (20.0%) | 16 (80.0%) |
| Total | 41 (64.1%) | 23 (35.9%) |
Education in Tenakee Springs
School Enrollment in Tenakee Springs
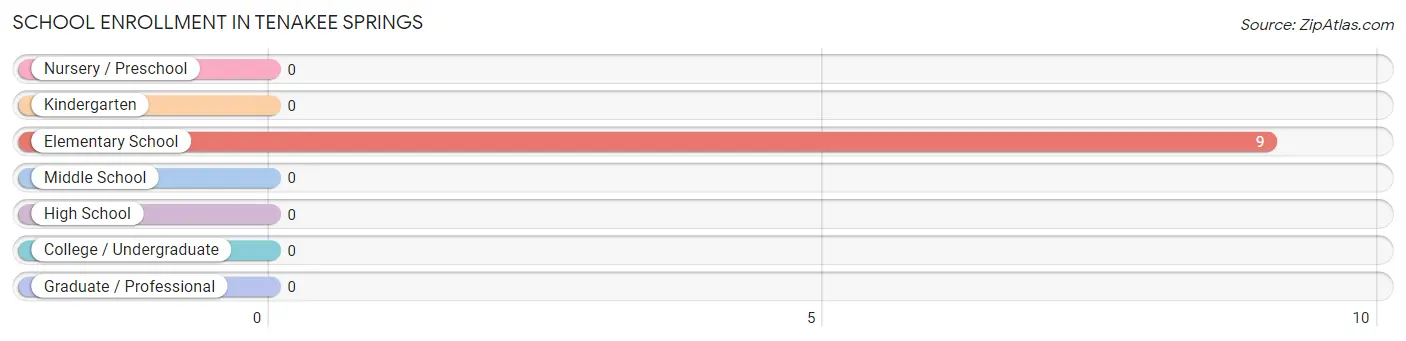
| School Level | # Students | % Students |
| Nursery / Preschool | 0 | 0.0% |
| Kindergarten | 0 | 0.0% |
| Elementary School | 9 | 100.0% |
| Middle School | 0 | 0.0% |
| High School | 0 | 0.0% |
| College / Undergraduate | 0 | 0.0% |
| Graduate / Professional | 0 | 0.0% |
| Total | 9 | 100.0% |
School Enrollment by Age by Funding Source in Tenakee Springs
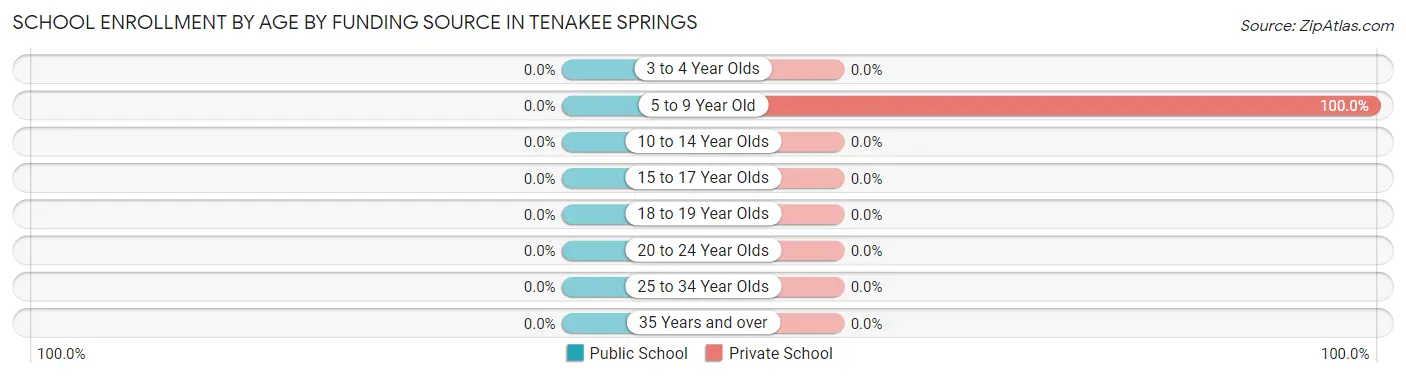
| Age Bracket | Public School | Private School |
| 3 to 4 Year Olds | 0 (0.0%) | 0 (0.0%) |
| 5 to 9 Year Old | 0 (0.0%) | 9 (100.0%) |
| 10 to 14 Year Olds | 0 (0.0%) | 0 (0.0%) |
| 15 to 17 Year Olds | 0 (0.0%) | 0 (0.0%) |
| 18 to 19 Year Olds | 0 (0.0%) | 0 (0.0%) |
| 20 to 24 Year Olds | 0 (0.0%) | 0 (0.0%) |
| 25 to 34 Year Olds | 0 (0.0%) | 0 (0.0%) |
| 35 Years and over | 0 (0.0%) | 0 (0.0%) |
| Total | 0 (0.0%) | 9 (100.0%) |
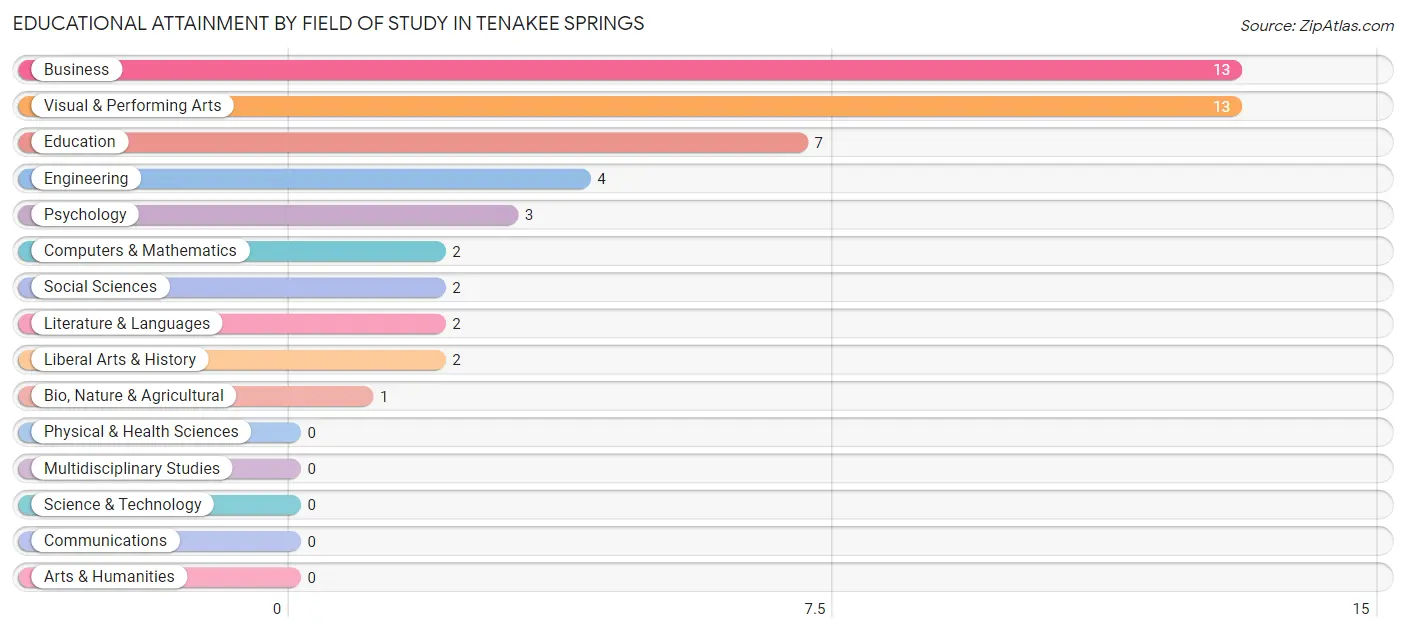
Educational Attainment by Field of Study in Tenakee Springs
Business (13 | 26.5%), visual & performing arts (13 | 26.5%), education (7 | 14.3%), engineering (4 | 8.2%), and psychology (3 | 6.1%) are the most common fields of study among 49 individuals in Tenakee Springs who have obtained a bachelor's degree or higher.
| Field of Study | # Graduates | % Graduates |
| Computers & Mathematics | 2 | 4.1% |
| Bio, Nature & Agricultural | 1 | 2.0% |
| Physical & Health Sciences | 0 | 0.0% |
| Psychology | 3 | 6.1% |
| Social Sciences | 2 | 4.1% |
| Engineering | 4 | 8.2% |
| Multidisciplinary Studies | 0 | 0.0% |
| Science & Technology | 0 | 0.0% |
| Business | 13 | 26.5% |
| Education | 7 | 14.3% |
| Literature & Languages | 2 | 4.1% |
| Liberal Arts & History | 2 | 4.1% |
| Visual & Performing Arts | 13 | 26.5% |
| Communications | 0 | 0.0% |
| Arts & Humanities | 0 | 0.0% |
| Total | 49 | 100.0% |
Transportation & Commute in Tenakee Springs
Vehicle Availability by Sex in Tenakee Springs
The most prevalent vehicle ownership categories in Tenakee Springs are males with no vehicle (36, accounting for 100.0%) and females with no vehicle (18, making up 180.0%).
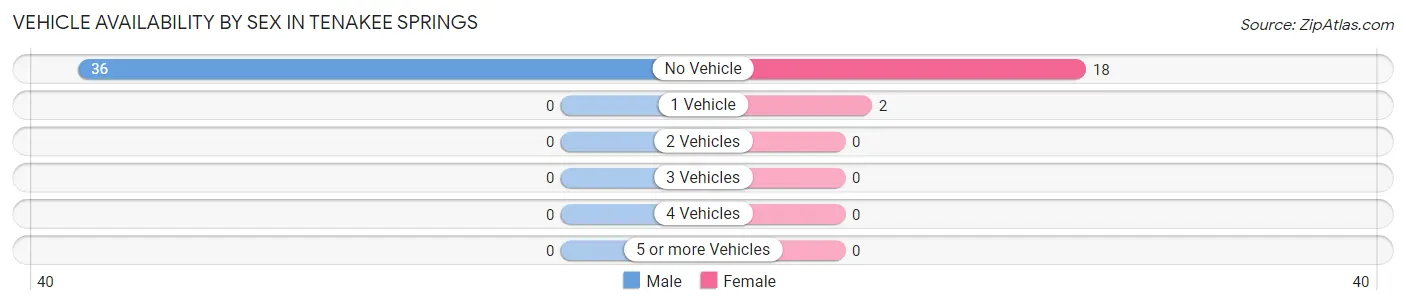
| Vehicles Available | Male | Female |
| No Vehicle | 36 (100.0%) | 18 (90.0%) |
| 1 Vehicle | 0 (0.0%) | 2 (10.0%) |
| 2 Vehicles | 0 (0.0%) | 0 (0.0%) |
| 3 Vehicles | 0 (0.0%) | 0 (0.0%) |
| 4 Vehicles | 0 (0.0%) | 0 (0.0%) |
| 5 or more Vehicles | 0 (0.0%) | 0 (0.0%) |
| Total | 36 (100.0%) | 20 (100.0%) |
Commute Time in Tenakee Springs
The most frequently occuring commute durations in Tenakee Springs are 5 to 9 minutes (31 commuters, 55.4%), 30 to 34 minutes (11 commuters, 19.6%), and less than 5 minutes (10 commuters, 17.9%).
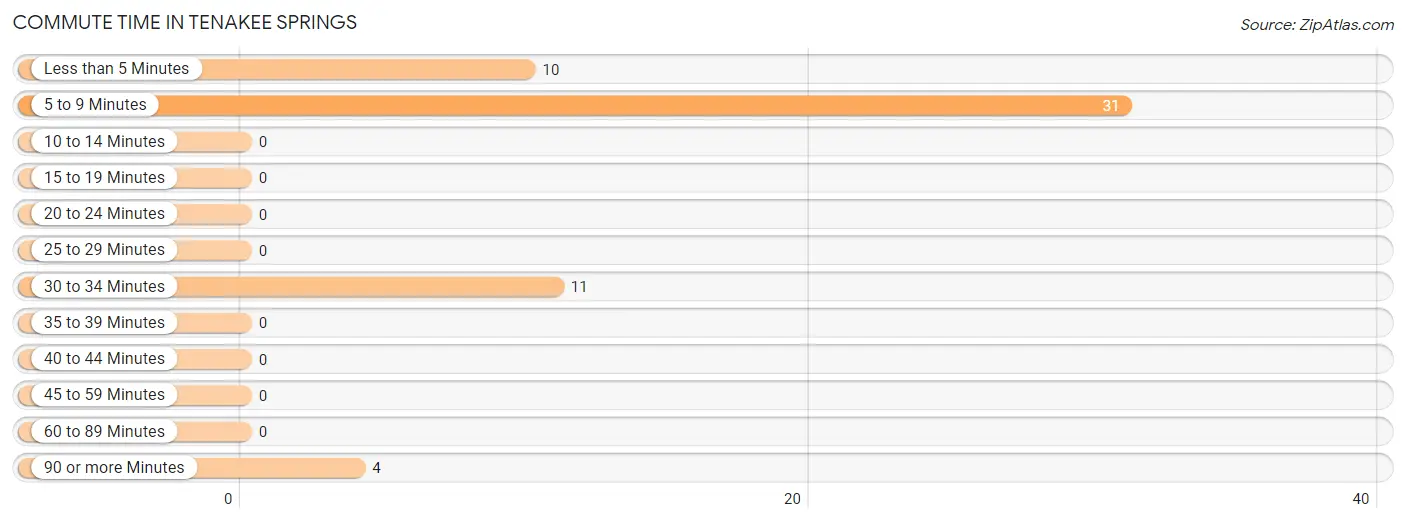
| Commute Time | # Commuters | % Commuters |
| Less than 5 Minutes | 10 | 17.9% |
| 5 to 9 Minutes | 31 | 55.4% |
| 10 to 14 Minutes | 0 | 0.0% |
| 15 to 19 Minutes | 0 | 0.0% |
| 20 to 24 Minutes | 0 | 0.0% |
| 25 to 29 Minutes | 0 | 0.0% |
| 30 to 34 Minutes | 11 | 19.6% |
| 35 to 39 Minutes | 0 | 0.0% |
| 40 to 44 Minutes | 0 | 0.0% |
| 45 to 59 Minutes | 0 | 0.0% |
| 60 to 89 Minutes | 0 | 0.0% |
| 90 or more Minutes | 4 | 7.1% |
Commute Time by Sex in Tenakee Springs
The most common commute times in Tenakee Springs are 5 to 9 minutes (13 commuters, 36.1%) for males and 5 to 9 minutes (18 commuters, 90.0%) for females.
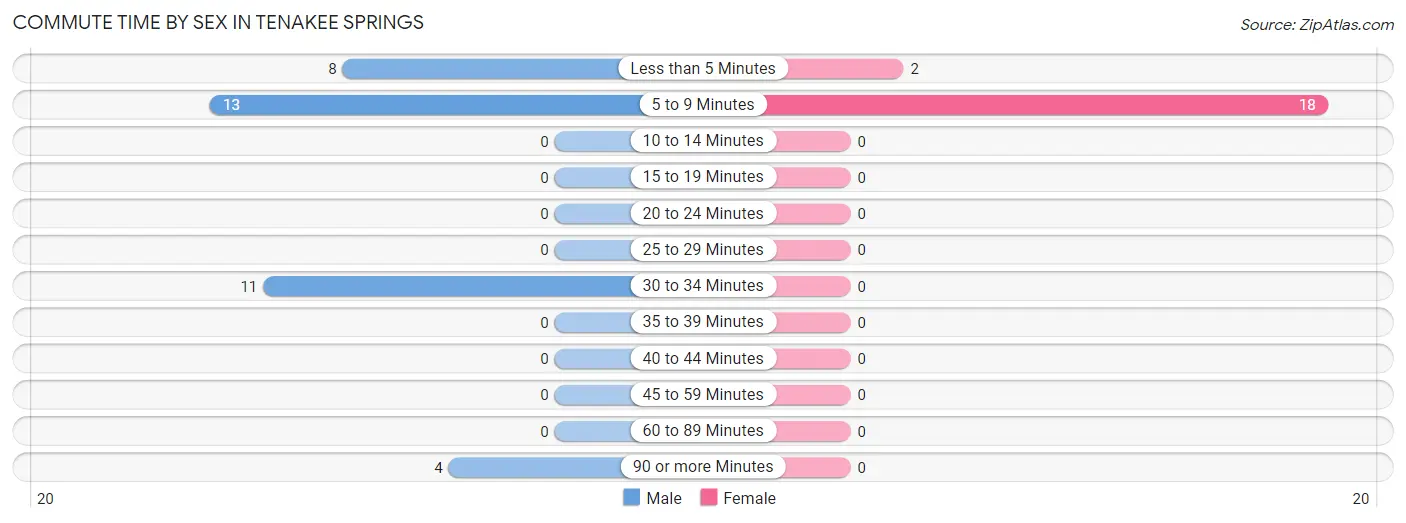
| Commute Time | Male | Female |
| Less than 5 Minutes | 8 (22.2%) | 2 (10.0%) |
| 5 to 9 Minutes | 13 (36.1%) | 18 (90.0%) |
| 10 to 14 Minutes | 0 (0.0%) | 0 (0.0%) |
| 15 to 19 Minutes | 0 (0.0%) | 0 (0.0%) |
| 20 to 24 Minutes | 0 (0.0%) | 0 (0.0%) |
| 25 to 29 Minutes | 0 (0.0%) | 0 (0.0%) |
| 30 to 34 Minutes | 11 (30.6%) | 0 (0.0%) |
| 35 to 39 Minutes | 0 (0.0%) | 0 (0.0%) |
| 40 to 44 Minutes | 0 (0.0%) | 0 (0.0%) |
| 45 to 59 Minutes | 0 (0.0%) | 0 (0.0%) |
| 60 to 89 Minutes | 0 (0.0%) | 0 (0.0%) |
| 90 or more Minutes | 4 (11.1%) | 0 (0.0%) |
Time of Departure to Work by Sex in Tenakee Springs
The most frequent times of departure to work in Tenakee Springs are 9:00 AM to 9:59 AM (22, 61.1%) for males and 8:00 AM to 8:29 AM (10, 50.0%) for females.
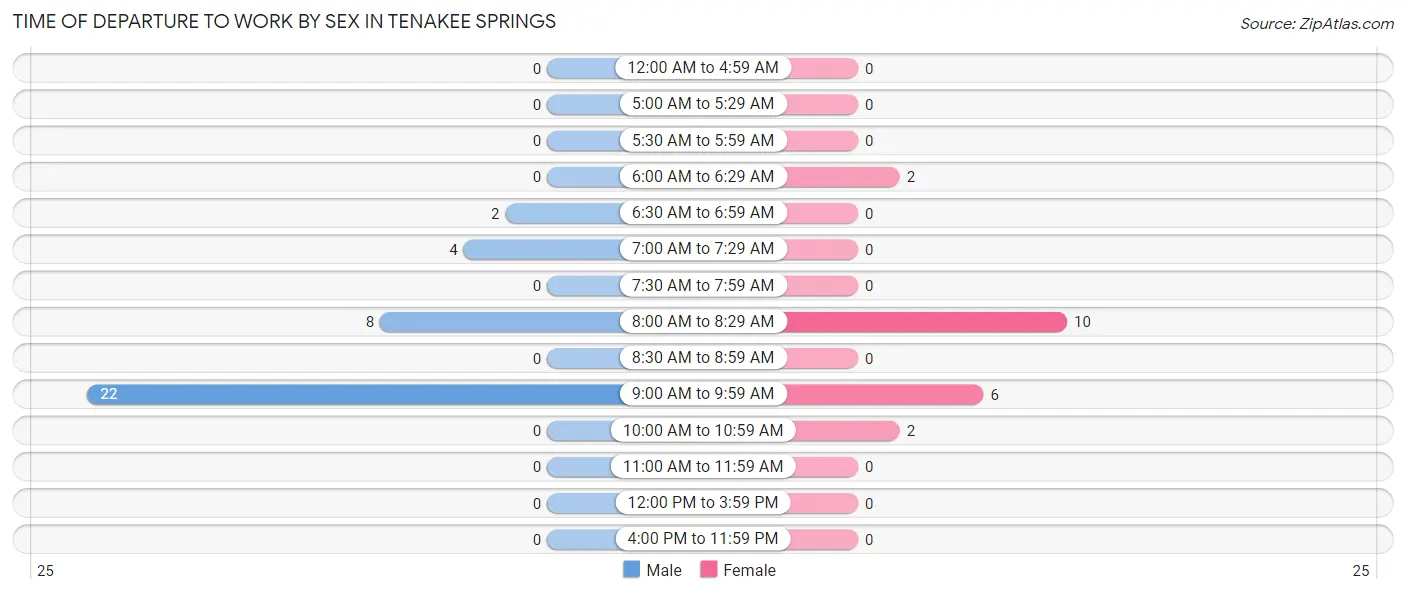
| Time of Departure | Male | Female |
| 12:00 AM to 4:59 AM | 0 (0.0%) | 0 (0.0%) |
| 5:00 AM to 5:29 AM | 0 (0.0%) | 0 (0.0%) |
| 5:30 AM to 5:59 AM | 0 (0.0%) | 0 (0.0%) |
| 6:00 AM to 6:29 AM | 0 (0.0%) | 2 (10.0%) |
| 6:30 AM to 6:59 AM | 2 (5.6%) | 0 (0.0%) |
| 7:00 AM to 7:29 AM | 4 (11.1%) | 0 (0.0%) |
| 7:30 AM to 7:59 AM | 0 (0.0%) | 0 (0.0%) |
| 8:00 AM to 8:29 AM | 8 (22.2%) | 10 (50.0%) |
| 8:30 AM to 8:59 AM | 0 (0.0%) | 0 (0.0%) |
| 9:00 AM to 9:59 AM | 22 (61.1%) | 6 (30.0%) |
| 10:00 AM to 10:59 AM | 0 (0.0%) | 2 (10.0%) |
| 11:00 AM to 11:59 AM | 0 (0.0%) | 0 (0.0%) |
| 12:00 PM to 3:59 PM | 0 (0.0%) | 0 (0.0%) |
| 4:00 PM to 11:59 PM | 0 (0.0%) | 0 (0.0%) |
| Total | 36 (100.0%) | 20 (100.0%) |
Housing Occupancy in Tenakee Springs
Occupancy by Ownership in Tenakee Springs
Of the total 98 dwellings in Tenakee Springs, owner-occupied units account for 82 (83.7%), while renter-occupied units make up 16 (16.3%).
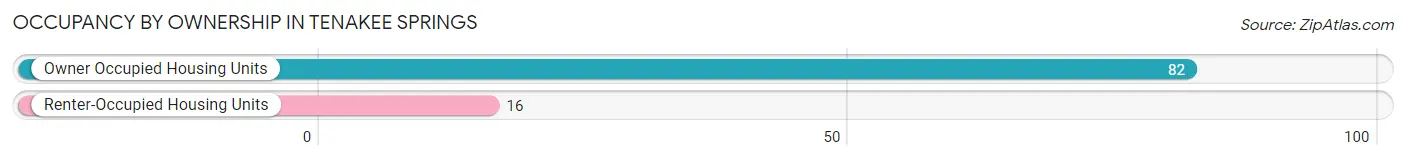
| Occupancy | # Housing Units | % Housing Units |
| Owner Occupied Housing Units | 82 | 83.7% |
| Renter-Occupied Housing Units | 16 | 16.3% |
| Total Occupied Housing Units | 98 | 100.0% |
Occupancy by Household Size in Tenakee Springs
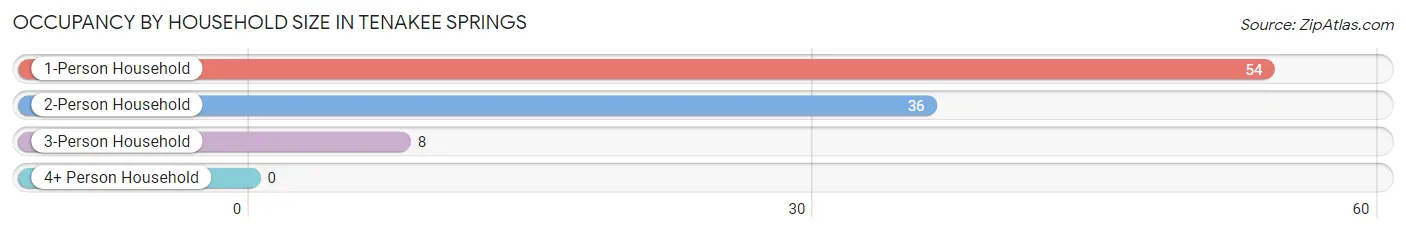
| Household Size | # Housing Units | % Housing Units |
| 1-Person Household | 54 | 55.1% |
| 2-Person Household | 36 | 36.7% |
| 3-Person Household | 8 | 8.2% |
| 4+ Person Household | 0 | 0.0% |
| Total Housing Units | 98 | 100.0% |
Occupancy by Ownership by Household Size in Tenakee Springs
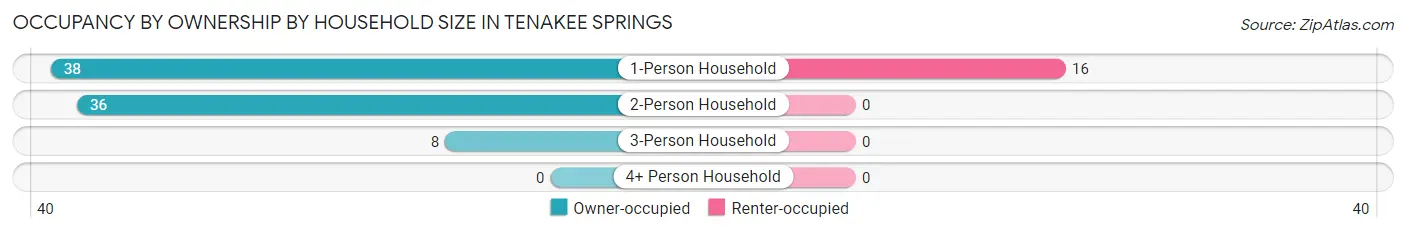
| Household Size | Owner-occupied | Renter-occupied |
| 1-Person Household | 38 (70.4%) | 16 (29.6%) |
| 2-Person Household | 36 (100.0%) | 0 (0.0%) |
| 3-Person Household | 8 (100.0%) | 0 (0.0%) |
| 4+ Person Household | 0 (0.0%) | 0 (0.0%) |
| Total Housing Units | 82 (83.7%) | 16 (16.3%) |
Occupancy by Educational Attainment in Tenakee Springs
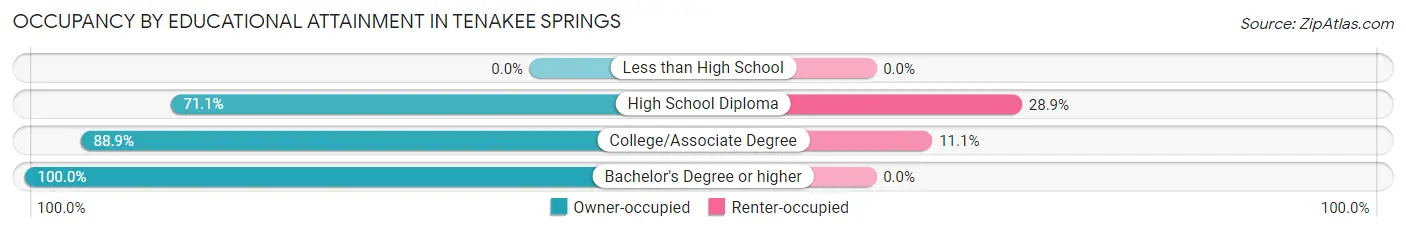
| Household Size | Owner-occupied | Renter-occupied |
| Less than High School | 0 (0.0%) | 0 (0.0%) |
| High School Diploma | 32 (71.1%) | 13 (28.9%) |
| College/Associate Degree | 24 (88.9%) | 3 (11.1%) |
| Bachelor's Degree or higher | 26 (100.0%) | 0 (0.0%) |
Occupancy by Age of Householder in Tenakee Springs
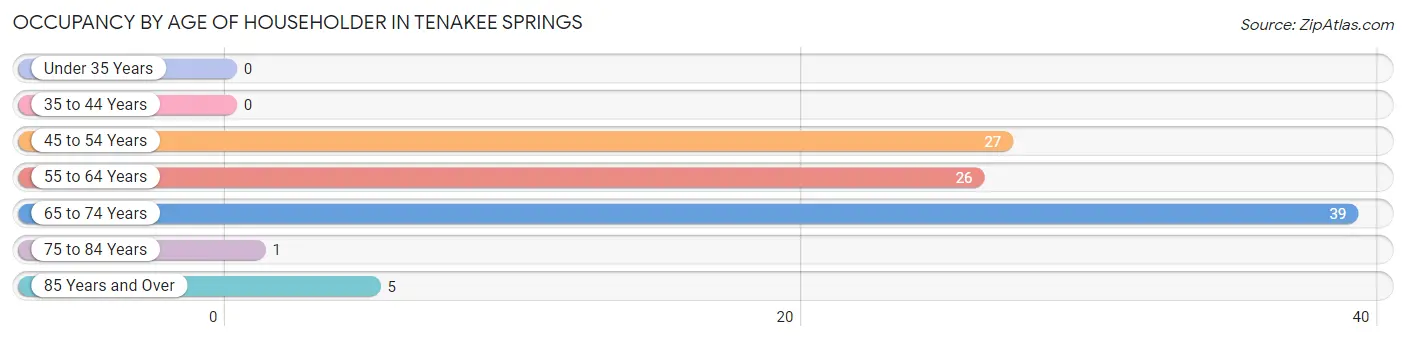
| Age Bracket | # Households | % Households |
| Under 35 Years | 0 | 0.0% |
| 35 to 44 Years | 0 | 0.0% |
| 45 to 54 Years | 27 | 27.6% |
| 55 to 64 Years | 26 | 26.5% |
| 65 to 74 Years | 39 | 39.8% |
| 75 to 84 Years | 1 | 1.0% |
| 85 Years and Over | 5 | 5.1% |
| Total | 98 | 100.0% |
Housing Finances in Tenakee Springs
Median Income by Occupancy in Tenakee Springs
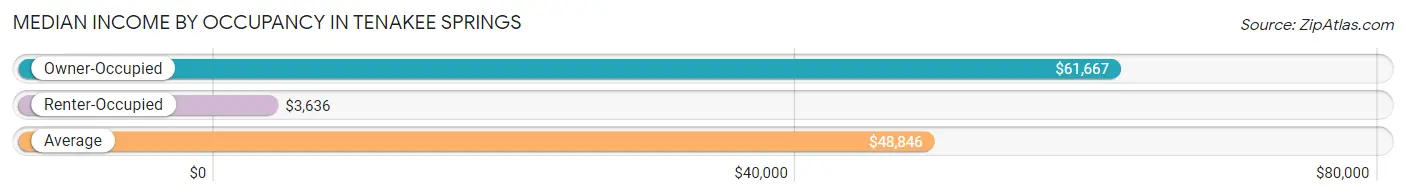
| Occupancy Type | # Households | Median Income |
| Owner-Occupied | 82 (83.7%) | $61,667 |
| Renter-Occupied | 16 (16.3%) | $3,636 |
| Average | 98 (100.0%) | $48,846 |
Occupancy by Householder Income Bracket in Tenakee Springs
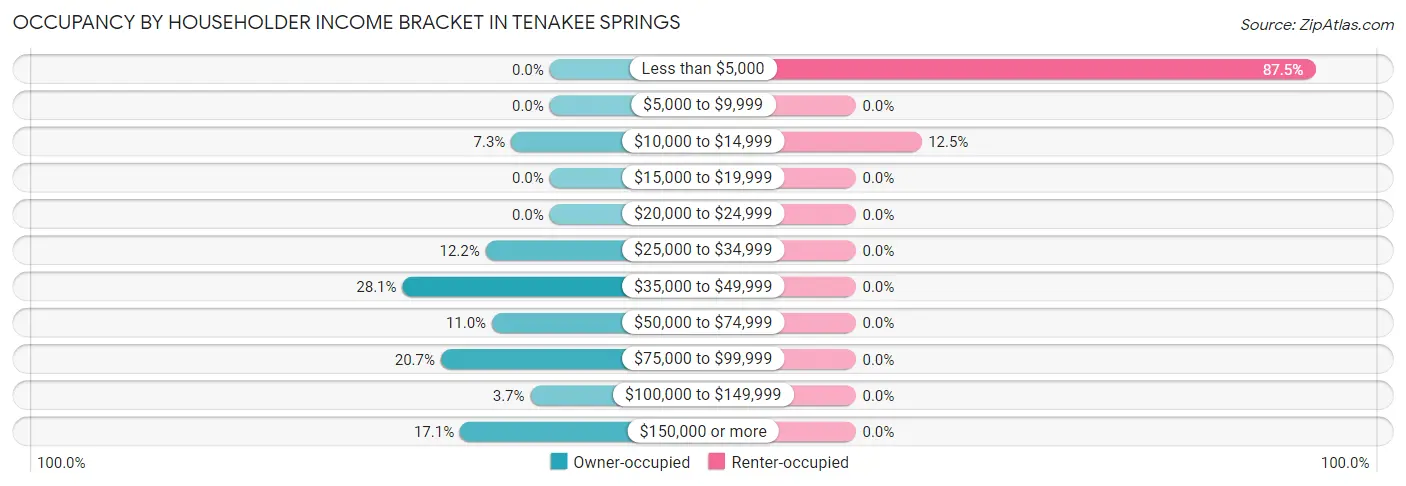
| Income Bracket | Owner-occupied | Renter-occupied |
| Less than $5,000 | 0 (0.0%) | 14 (87.5%) |
| $5,000 to $9,999 | 0 (0.0%) | 0 (0.0%) |
| $10,000 to $14,999 | 6 (7.3%) | 2 (12.5%) |
| $15,000 to $19,999 | 0 (0.0%) | 0 (0.0%) |
| $20,000 to $24,999 | 0 (0.0%) | 0 (0.0%) |
| $25,000 to $34,999 | 10 (12.2%) | 0 (0.0%) |
| $35,000 to $49,999 | 23 (28.1%) | 0 (0.0%) |
| $50,000 to $74,999 | 9 (11.0%) | 0 (0.0%) |
| $75,000 to $99,999 | 17 (20.7%) | 0 (0.0%) |
| $100,000 to $149,999 | 3 (3.7%) | 0 (0.0%) |
| $150,000 or more | 14 (17.1%) | 0 (0.0%) |
| Total | 82 (100.0%) | 16 (100.0%) |
Monthly Housing Cost Tiers in Tenakee Springs
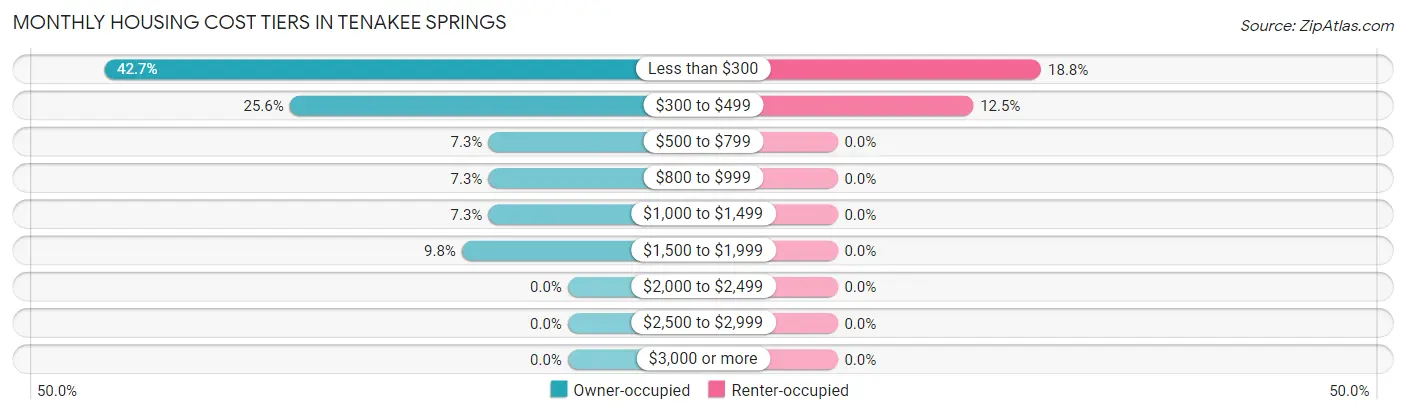
| Monthly Cost | Owner-occupied | Renter-occupied |
| Less than $300 | 35 (42.7%) | 3 (18.8%) |
| $300 to $499 | 21 (25.6%) | 2 (12.5%) |
| $500 to $799 | 6 (7.3%) | 0 (0.0%) |
| $800 to $999 | 6 (7.3%) | 0 (0.0%) |
| $1,000 to $1,499 | 6 (7.3%) | 0 (0.0%) |
| $1,500 to $1,999 | 8 (9.8%) | 0 (0.0%) |
| $2,000 to $2,499 | 0 (0.0%) | 0 (0.0%) |
| $2,500 to $2,999 | 0 (0.0%) | 0 (0.0%) |
| $3,000 or more | 0 (0.0%) | 0 (0.0%) |
| Total | 82 (100.0%) | 16 (100.0%) |
Physical Housing Characteristics in Tenakee Springs
Housing Structures in Tenakee Springs
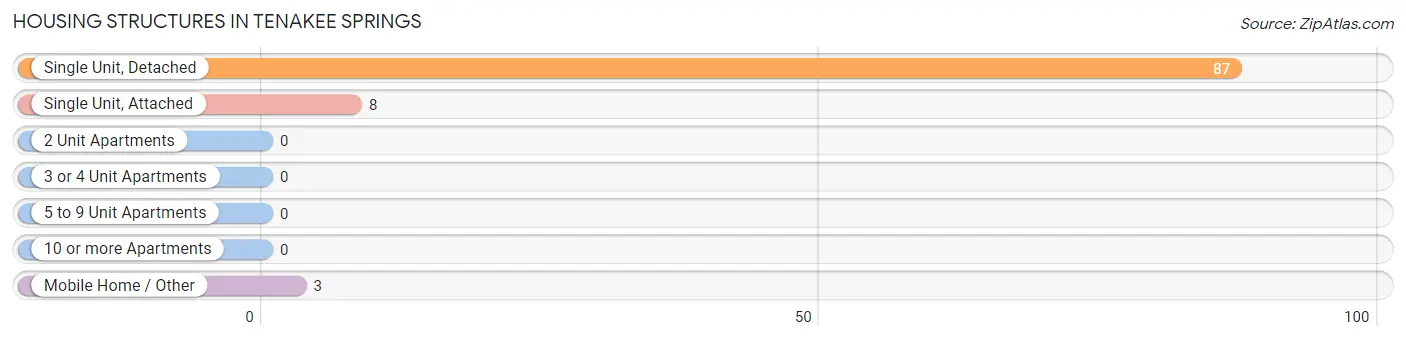
| Structure Type | # Housing Units | % Housing Units |
| Single Unit, Detached | 87 | 88.8% |
| Single Unit, Attached | 8 | 8.2% |
| 2 Unit Apartments | 0 | 0.0% |
| 3 or 4 Unit Apartments | 0 | 0.0% |
| 5 to 9 Unit Apartments | 0 | 0.0% |
| 10 or more Apartments | 0 | 0.0% |
| Mobile Home / Other | 3 | 3.1% |
| Total | 98 | 100.0% |
Housing Structures by Occupancy in Tenakee Springs
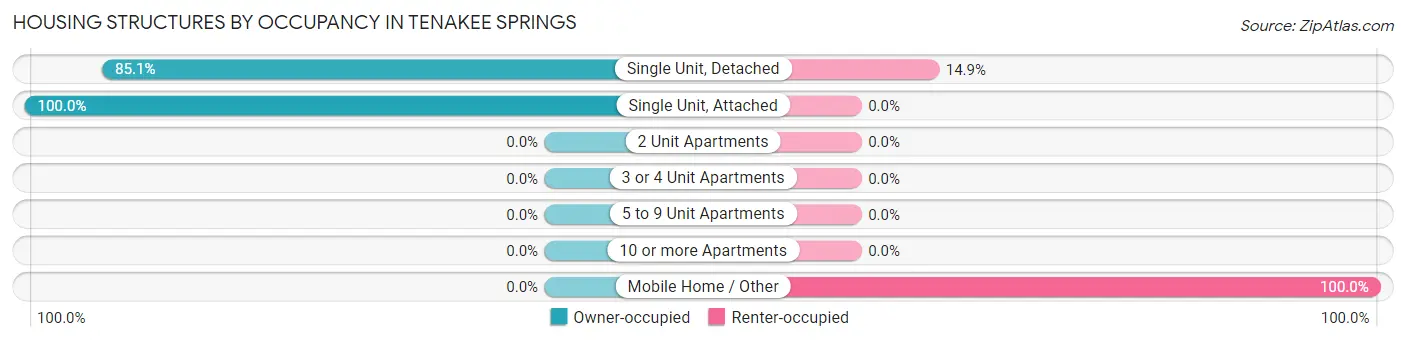
| Structure Type | Owner-occupied | Renter-occupied |
| Single Unit, Detached | 74 (85.1%) | 13 (14.9%) |
| Single Unit, Attached | 8 (100.0%) | 0 (0.0%) |
| 2 Unit Apartments | 0 (0.0%) | 0 (0.0%) |
| 3 or 4 Unit Apartments | 0 (0.0%) | 0 (0.0%) |
| 5 to 9 Unit Apartments | 0 (0.0%) | 0 (0.0%) |
| 10 or more Apartments | 0 (0.0%) | 0 (0.0%) |
| Mobile Home / Other | 0 (0.0%) | 3 (100.0%) |
| Total | 82 (83.7%) | 16 (16.3%) |
Housing Structures by Number of Rooms in Tenakee Springs
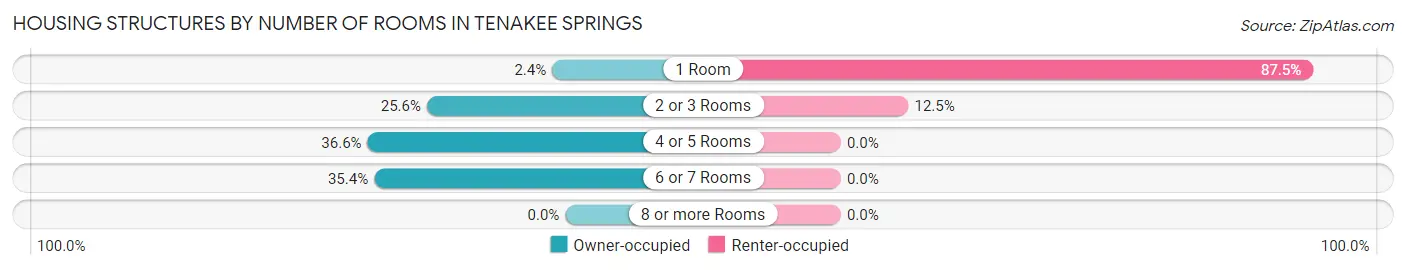
| Number of Rooms | Owner-occupied | Renter-occupied |
| 1 Room | 2 (2.4%) | 14 (87.5%) |
| 2 or 3 Rooms | 21 (25.6%) | 2 (12.5%) |
| 4 or 5 Rooms | 30 (36.6%) | 0 (0.0%) |
| 6 or 7 Rooms | 29 (35.4%) | 0 (0.0%) |
| 8 or more Rooms | 0 (0.0%) | 0 (0.0%) |
| Total | 82 (100.0%) | 16 (100.0%) |
Housing Structure by Heating Type in Tenakee Springs
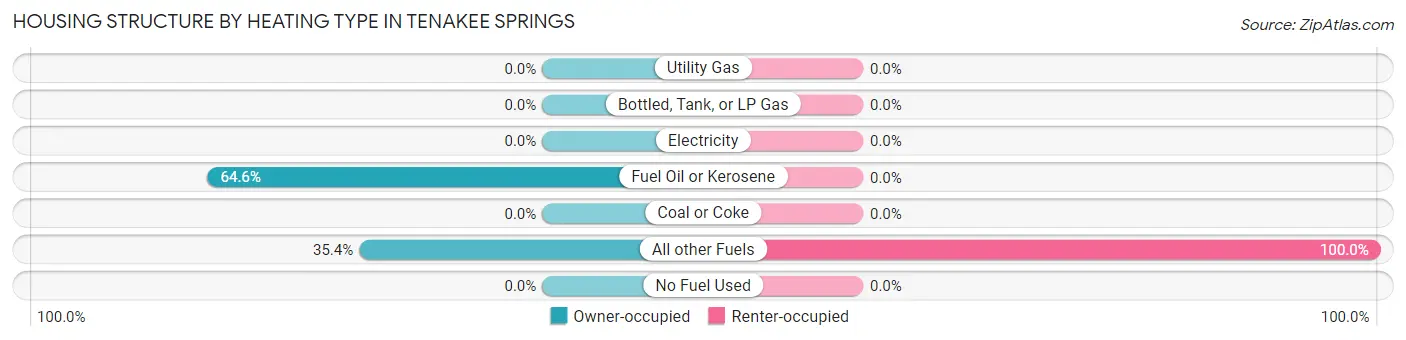
| Heating Type | Owner-occupied | Renter-occupied |
| Utility Gas | 0 (0.0%) | 0 (0.0%) |
| Bottled, Tank, or LP Gas | 0 (0.0%) | 0 (0.0%) |
| Electricity | 0 (0.0%) | 0 (0.0%) |
| Fuel Oil or Kerosene | 53 (64.6%) | 0 (0.0%) |
| Coal or Coke | 0 (0.0%) | 0 (0.0%) |
| All other Fuels | 29 (35.4%) | 16 (100.0%) |
| No Fuel Used | 0 (0.0%) | 0 (0.0%) |
| Total | 82 (100.0%) | 16 (100.0%) |
Household Vehicle Usage in Tenakee Springs
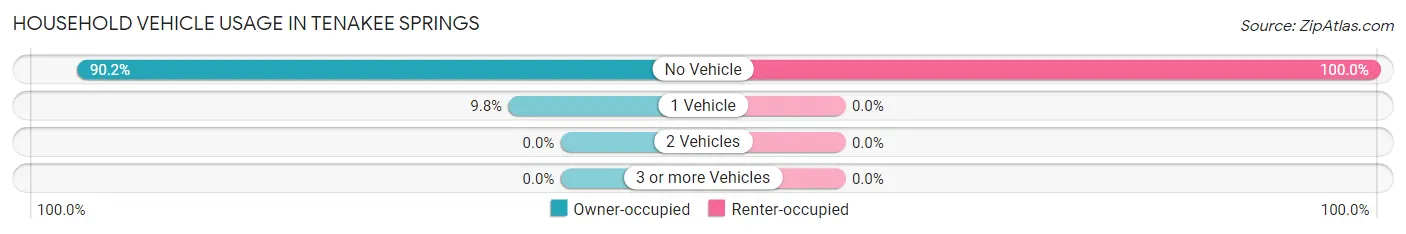
| Vehicles per Household | Owner-occupied | Renter-occupied |
| No Vehicle | 74 (90.2%) | 16 (100.0%) |
| 1 Vehicle | 8 (9.8%) | 0 (0.0%) |
| 2 Vehicles | 0 (0.0%) | 0 (0.0%) |
| 3 or more Vehicles | 0 (0.0%) | 0 (0.0%) |
| Total | 82 (100.0%) | 16 (100.0%) |
Real Estate & Mortgages in Tenakee Springs
Real Estate and Mortgage Overview in Tenakee Springs
| Characteristic | Without Mortgage | With Mortgage |
| Housing Units | 68 | 14 |
| Median Property Value | $250,000 | $0 |
| Median Household Income | $70,000 | $0 |
| Monthly Housing Costs | $290 | $0 |
| Real Estate Taxes | - | - |
Property Value by Mortgage Status in Tenakee Springs
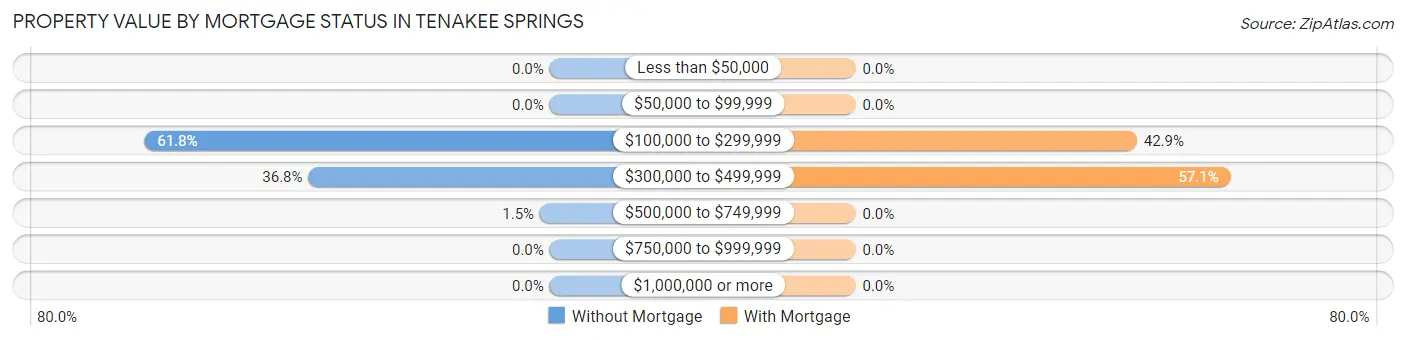
| Property Value | Without Mortgage | With Mortgage |
| Less than $50,000 | 0 (0.0%) | 0 (0.0%) |
| $50,000 to $99,999 | 0 (0.0%) | 0 (0.0%) |
| $100,000 to $299,999 | 42 (61.8%) | 6 (42.9%) |
| $300,000 to $499,999 | 25 (36.8%) | 8 (57.1%) |
| $500,000 to $749,999 | 1 (1.5%) | 0 (0.0%) |
| $750,000 to $999,999 | 0 (0.0%) | 0 (0.0%) |
| $1,000,000 or more | 0 (0.0%) | 0 (0.0%) |
| Total | 68 (100.0%) | 14 (100.0%) |
Household Income by Mortgage Status in Tenakee Springs
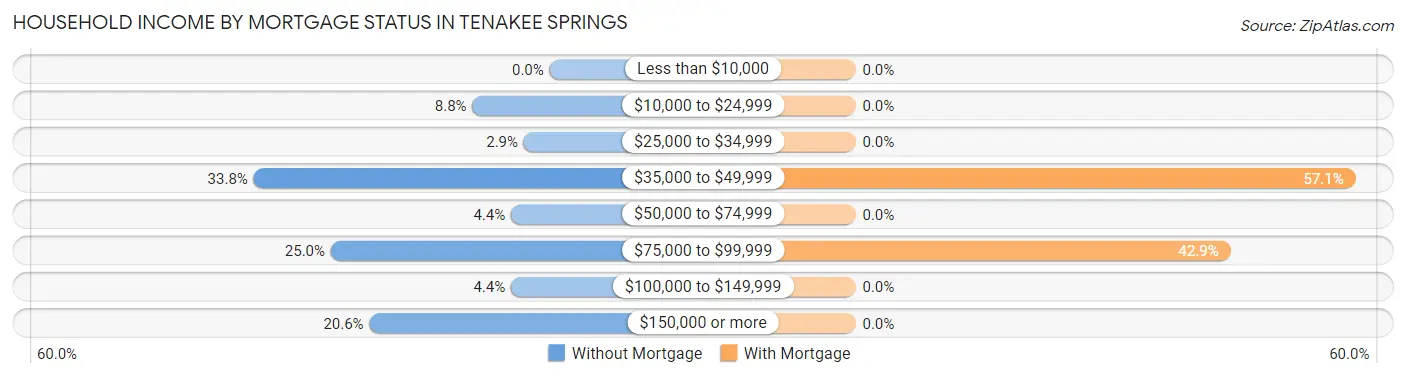
| Household Income | Without Mortgage | With Mortgage |
| Less than $10,000 | 0 (0.0%) | 0 (0.0%) |
| $10,000 to $24,999 | 6 (8.8%) | 0 (0.0%) |
| $25,000 to $34,999 | 2 (2.9%) | 0 (0.0%) |
| $35,000 to $49,999 | 23 (33.8%) | 8 (57.1%) |
| $50,000 to $74,999 | 3 (4.4%) | 0 (0.0%) |
| $75,000 to $99,999 | 17 (25.0%) | 6 (42.9%) |
| $100,000 to $149,999 | 3 (4.4%) | 0 (0.0%) |
| $150,000 or more | 14 (20.6%) | 0 (0.0%) |
| Total | 68 (100.0%) | 14 (100.0%) |
Property Value to Household Income Ratio in Tenakee Springs
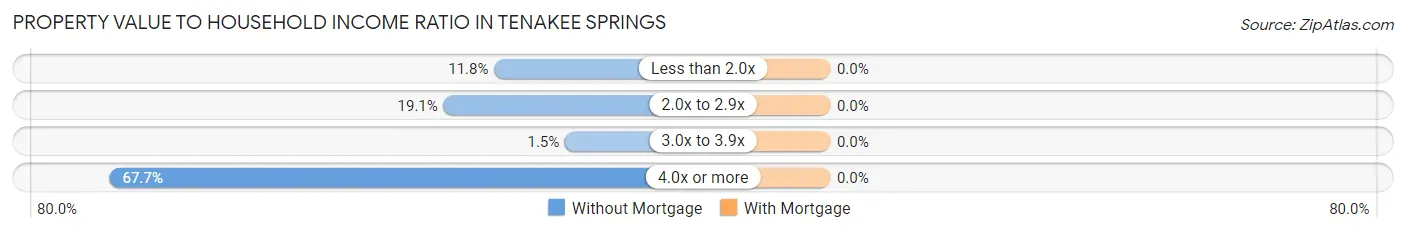
| Value-to-Income Ratio | Without Mortgage | With Mortgage |
| Less than 2.0x | 8 (11.8%) | 0 (0.0%) |
| 2.0x to 2.9x | 13 (19.1%) | 0 (0.0%) |
| 3.0x to 3.9x | 1 (1.5%) | 0 (0.0%) |
| 4.0x or more | 46 (67.6%) | 0 (0.0%) |
| Total | 68 (100.0%) | 14 (100.0%) |
Real Estate Taxes by Mortgage Status in Tenakee Springs
| Property Taxes | Without Mortgage | With Mortgage |
| Less than $800 | 0 (0.0%) | 0 (0.0%) |
| $800 to $1,499 | 0 (0.0%) | 0 (0.0%) |
| $800 to $1,499 | 0 (0.0%) | 0 (0.0%) |
| Total | 68 (100.0%) | 14 (100.0%) |
Health & Disability in Tenakee Springs
Health Insurance Coverage by Age in Tenakee Springs
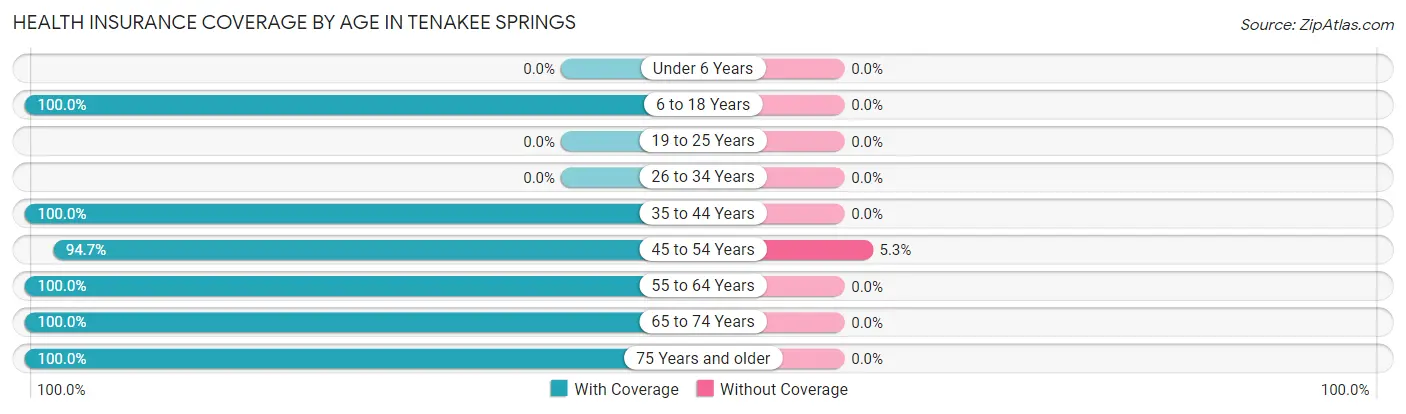
| Age Bracket | With Coverage | Without Coverage |
| Under 6 Years | 0 (0.0%) | 0 (0.0%) |
| 6 to 18 Years | 9 (100.0%) | 0 (0.0%) |
| 19 to 25 Years | 0 (0.0%) | 0 (0.0%) |
| 26 to 34 Years | 0 (0.0%) | 0 (0.0%) |
| 35 to 44 Years | 3 (100.0%) | 0 (0.0%) |
| 45 to 54 Years | 36 (94.7%) | 2 (5.3%) |
| 55 to 64 Years | 28 (100.0%) | 0 (0.0%) |
| 65 to 74 Years | 48 (100.0%) | 0 (0.0%) |
| 75 Years and older | 10 (100.0%) | 0 (0.0%) |
| Total | 134 (98.5%) | 2 (1.5%) |
Health Insurance Coverage by Citizenship Status in Tenakee Springs
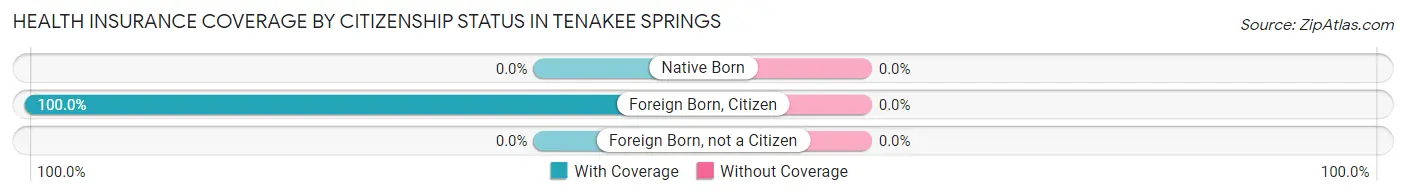
| Citizenship Status | With Coverage | Without Coverage |
| Native Born | 0 (0.0%) | 0 (0.0%) |
| Foreign Born, Citizen | 9 (100.0%) | 0 (0.0%) |
| Foreign Born, not a Citizen | 0 (0.0%) | 0 (0.0%) |
Health Insurance Coverage by Household Income in Tenakee Springs
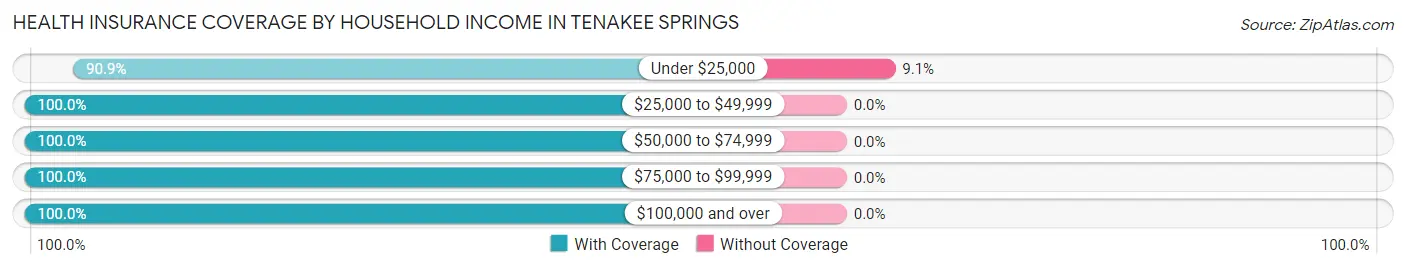
| Household Income | With Coverage | Without Coverage |
| Under $25,000 | 20 (90.9%) | 2 (9.1%) |
| $25,000 to $49,999 | 48 (100.0%) | 0 (0.0%) |
| $50,000 to $74,999 | 16 (100.0%) | 0 (0.0%) |
| $75,000 to $99,999 | 21 (100.0%) | 0 (0.0%) |
| $100,000 and over | 29 (100.0%) | 0 (0.0%) |
Public vs Private Health Insurance Coverage by Age in Tenakee Springs
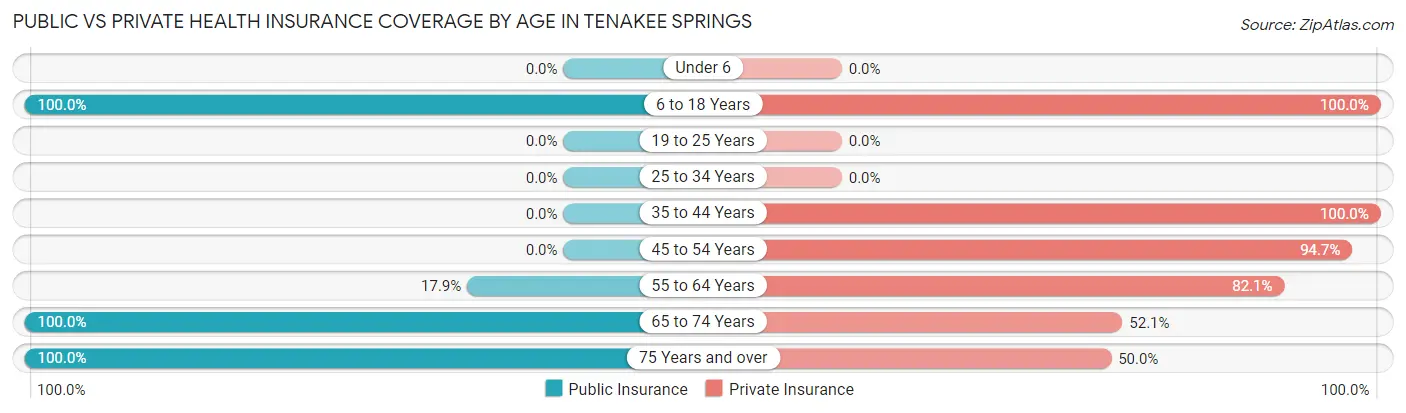
| Age Bracket | Public Insurance | Private Insurance |
| Under 6 | 0 (0.0%) | 0 (0.0%) |
| 6 to 18 Years | 9 (100.0%) | 9 (100.0%) |
| 19 to 25 Years | 0 (0.0%) | 0 (0.0%) |
| 25 to 34 Years | 0 (0.0%) | 0 (0.0%) |
| 35 to 44 Years | 0 (0.0%) | 3 (100.0%) |
| 45 to 54 Years | 0 (0.0%) | 36 (94.7%) |
| 55 to 64 Years | 5 (17.9%) | 23 (82.1%) |
| 65 to 74 Years | 48 (100.0%) | 25 (52.1%) |
| 75 Years and over | 10 (100.0%) | 5 (50.0%) |
| Total | 72 (52.9%) | 101 (74.3%) |
Disability Status by Sex by Age in Tenakee Springs
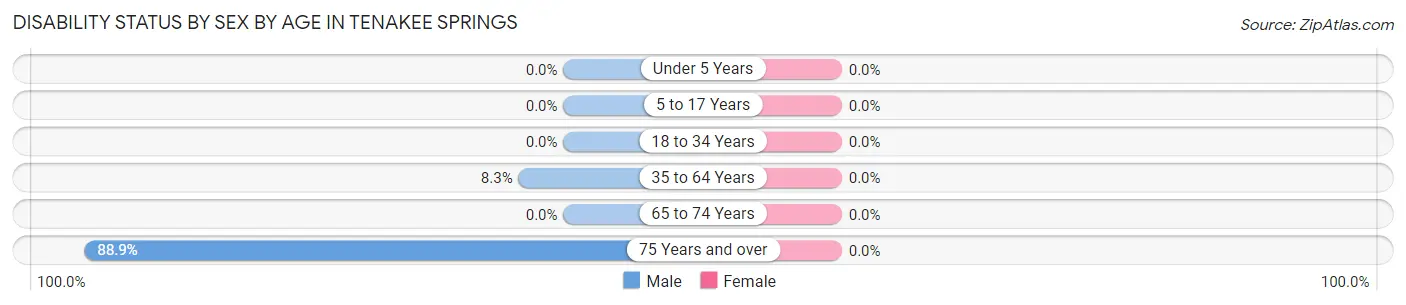
| Age Bracket | Male | Female |
| Under 5 Years | 0 (0.0%) | 0 (0.0%) |
| 5 to 17 Years | 0 (0.0%) | 0 (0.0%) |
| 18 to 34 Years | 0 (0.0%) | 0 (0.0%) |
| 35 to 64 Years | 3 (8.3%) | 0 (0.0%) |
| 65 to 74 Years | 0 (0.0%) | 0 (0.0%) |
| 75 Years and over | 8 (88.9%) | 0 (0.0%) |
Disability Class by Sex by Age in Tenakee Springs
Disability Class: Hearing Difficulty
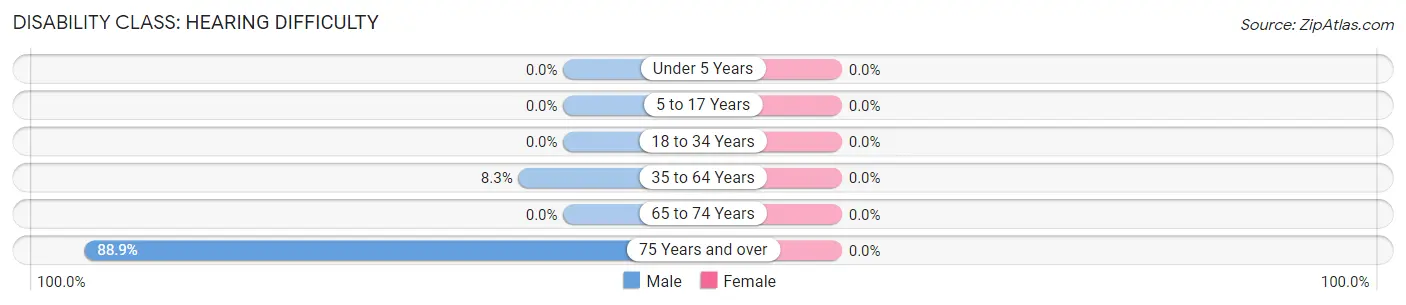
| Age Bracket | Male | Female |
| Under 5 Years | 0 (0.0%) | 0 (0.0%) |
| 5 to 17 Years | 0 (0.0%) | 0 (0.0%) |
| 18 to 34 Years | 0 (0.0%) | 0 (0.0%) |
| 35 to 64 Years | 3 (8.3%) | 0 (0.0%) |
| 65 to 74 Years | 0 (0.0%) | 0 (0.0%) |
| 75 Years and over | 8 (88.9%) | 0 (0.0%) |
Disability Class: Vision Difficulty
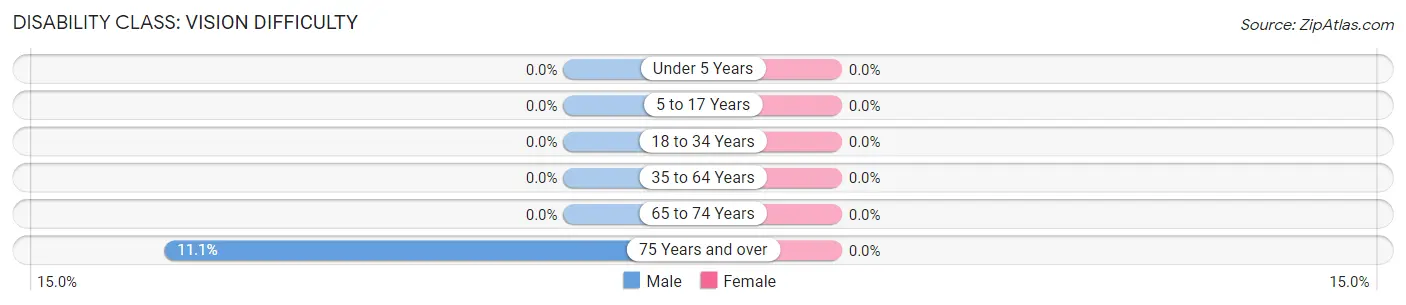
| Age Bracket | Male | Female |
| Under 5 Years | 0 (0.0%) | 0 (0.0%) |
| 5 to 17 Years | 0 (0.0%) | 0 (0.0%) |
| 18 to 34 Years | 0 (0.0%) | 0 (0.0%) |
| 35 to 64 Years | 0 (0.0%) | 0 (0.0%) |
| 65 to 74 Years | 0 (0.0%) | 0 (0.0%) |
| 75 Years and over | 1 (11.1%) | 0 (0.0%) |
Disability Class: Cognitive Difficulty
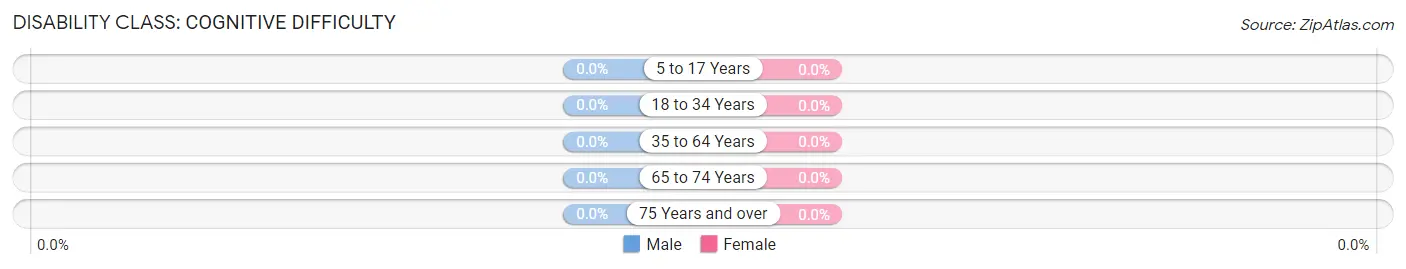
| Age Bracket | Male | Female |
| 5 to 17 Years | 0 (0.0%) | 0 (0.0%) |
| 18 to 34 Years | 0 (0.0%) | 0 (0.0%) |
| 35 to 64 Years | 0 (0.0%) | 0 (0.0%) |
| 65 to 74 Years | 0 (0.0%) | 0 (0.0%) |
| 75 Years and over | 0 (0.0%) | 0 (0.0%) |
Disability Class: Ambulatory Difficulty
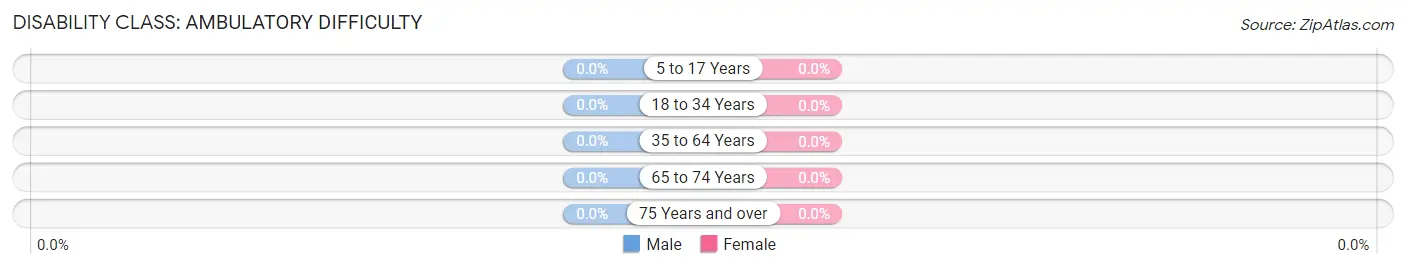
| Age Bracket | Male | Female |
| 5 to 17 Years | 0 (0.0%) | 0 (0.0%) |
| 18 to 34 Years | 0 (0.0%) | 0 (0.0%) |
| 35 to 64 Years | 0 (0.0%) | 0 (0.0%) |
| 65 to 74 Years | 0 (0.0%) | 0 (0.0%) |
| 75 Years and over | 0 (0.0%) | 0 (0.0%) |
Disability Class: Self-Care Difficulty

| Age Bracket | Male | Female |
| 5 to 17 Years | 0 (0.0%) | 0 (0.0%) |
| 18 to 34 Years | 0 (0.0%) | 0 (0.0%) |
| 35 to 64 Years | 0 (0.0%) | 0 (0.0%) |
| 65 to 74 Years | 0 (0.0%) | 0 (0.0%) |
| 75 Years and over | 0 (0.0%) | 0 (0.0%) |
Technology Access in Tenakee Springs
Computing Device Access in Tenakee Springs
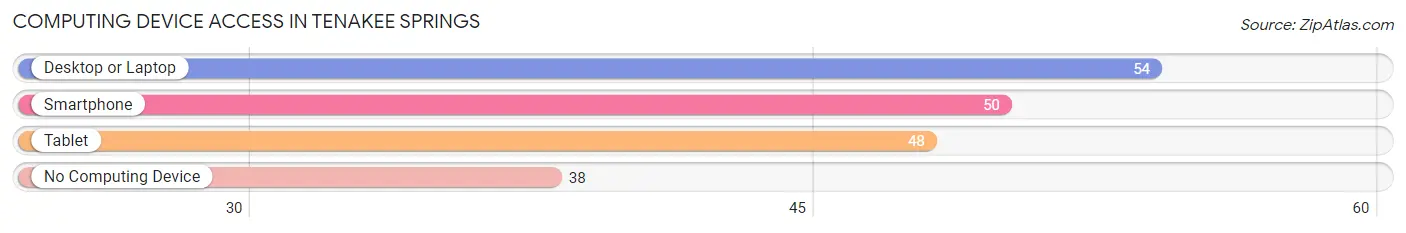
| Device Type | # Households | % Households |
| Desktop or Laptop | 54 | 55.1% |
| Smartphone | 50 | 51.0% |
| Tablet | 48 | 49.0% |
| No Computing Device | 38 | 38.8% |
| Total | 98 | 100.0% |
Internet Access in Tenakee Springs
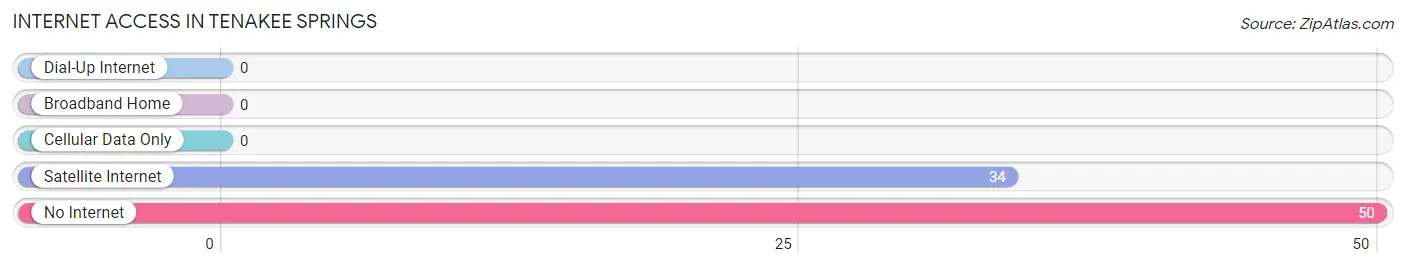
| Internet Type | # Households | % Households |
| Dial-Up Internet | 0 | 0.0% |
| Broadband Home | 0 | 0.0% |
| Cellular Data Only | 0 | 0.0% |
| Satellite Internet | 34 | 34.7% |
| No Internet | 50 | 51.0% |
| Total | 98 | 100.0% |
Tenakee Springs Summary
Tenakee Springs is a small town located on Chichagof Island in the Alexander Archipelago of Southeast Alaska. It is situated on the northern shore of Tenakee Inlet, a narrow inlet of the Pacific Ocean. The town is located approximately 75 miles (120 km) southwest of Juneau, the state capital. Tenakee Springs is a popular tourist destination, known for its natural beauty, outdoor recreation opportunities, and unique culture.
History
The area around Tenakee Springs has been inhabited for thousands of years by the Tlingit people. The town was founded in the late 19th century by a group of miners who were searching for gold. The miners named the town after the nearby Tenakee Inlet. The town grew rapidly in the early 20th century, as it became a popular destination for fishermen and tourists.
In the 1950s, Tenakee Springs was a bustling fishing village, with a population of over 500 people. However, the population began to decline in the 1960s, as the fishing industry declined and the town’s economy shifted to tourism. By the 1990s, the population had dropped to around 200 people.
Geography
Tenakee Springs is located on the northern shore of Tenakee Inlet, a narrow inlet of the Pacific Ocean. The town is surrounded by the Tongass National Forest, which covers most of Southeast Alaska. The town is located approximately 75 miles (120 km) southwest of Juneau, the state capital.
The town is situated at the base of a steep mountain, which rises to an elevation of 2,000 feet (610 m). The mountain is covered in dense forest, and is home to a variety of wildlife, including black bears, bald eagles, and Sitka black-tailed deer.
The climate in Tenakee Springs is mild and temperate, with an average annual temperature of 45°F (7°C). The town receives an average of 80 inches (203 cm) of precipitation per year, most of which falls as rain.
Economy
The economy of Tenakee Springs is largely based on tourism and fishing. The town is a popular destination for sport fishing, and is home to several charter fishing companies. The town also attracts tourists who come to enjoy the natural beauty of the area, as well as the unique culture of the Tlingit people.
The town is also home to several small businesses, including a grocery store, a hardware store, and a restaurant. The town also has a small boatyard, which repairs and builds boats for local fishermen.
Demographics
As of the 2010 census, the population of Tenakee Springs was 197 people. The town is predominantly white, with a small Native American population. The median age of the population is 44 years, and the median household income is $45,000.
The town is served by the Tenakee Springs School District, which operates a K-12 school. The school has an enrollment of approximately 50 students. The town also has a public library, which is operated by the Alaska State Library.
Conclusion
Tenakee Springs is a small town located on Chichagof Island in the Alexander Archipelago of Southeast Alaska. The town is known for its natural beauty, outdoor recreation opportunities, and unique culture. The economy of Tenakee Springs is largely based on tourism and fishing, and the town is home to several small businesses. The population of Tenakee Springs is predominantly white, with a small Native American population. The town is served by the Tenakee Springs School District, and has a public library operated by the Alaska State Library.
Common Questions
What is Per Capita Income in Tenakee Springs?
Per Capita income in Tenakee Springs is $44,023.
What is the Median Family Income in Tenakee Springs?
Median Family Income in Tenakee Springs is $85,750.
What is the Median Household income in Tenakee Springs?
Median Household Income in Tenakee Springs is $48,846.
What is Income or Wage Gap in Tenakee Springs?
Income or Wage Gap in Tenakee Springs is 6.6%.
Women in Tenakee Springs earn 93.4 cents for every dollar earned by a man.
What is Inequality or Gini Index in Tenakee Springs?
Inequality or Gini Index in Tenakee Springs is 0.50.
What is the Total Population of Tenakee Springs?
Total Population of Tenakee Springs is 136.
What is the Total Male Population of Tenakee Springs?
Total Male Population of Tenakee Springs is 74.
What is the Total Female Population of Tenakee Springs?
Total Female Population of Tenakee Springs is 62.
What is the Ratio of Males per 100 Females in Tenakee Springs?
There are 119.35 Males per 100 Females in Tenakee Springs.
What is the Ratio of Females per 100 Males in Tenakee Springs?
There are 83.78 Females per 100 Males in Tenakee Springs.
What is the Median Population Age in Tenakee Springs?
Median Population Age in Tenakee Springs is 64.0 Years.
What is the Average Family Size in Tenakee Springs
Average Family Size in Tenakee Springs is 1.9 People.
What is the Average Household Size in Tenakee Springs
Average Household Size in Tenakee Springs is 1.4 People.
How Large is the Labor Force in Tenakee Springs?
There are 75 People in the Labor Forcein in Tenakee Springs.
What is the Percentage of People in the Labor Force in Tenakee Springs?
59.1% of People are in the Labor Force in Tenakee Springs.
What is the Unemployment Rate in Tenakee Springs?
Unemployment Rate in Tenakee Springs is 14.7%.