Teller, AK Map & Demographics
Teller Map
Teller Overview
$21,124
PER CAPITA INCOME
$37,250
AVG FAMILY INCOME
$34,688
AVG HOUSEHOLD INCOME
35.1%
WAGE / INCOME GAP [ % ]
64.9¢/ $1
WAGE / INCOME GAP [ $ ]
0.57
INEQUALITY / GINI INDEX
279
TOTAL POPULATION
146
MALE POPULATION
133
FEMALE POPULATION
109.77
MALES / 100 FEMALES
91.10
FEMALES / 100 MALES
28.9
MEDIAN AGE
3.4
AVG FAMILY SIZE
3.1
AVG HOUSEHOLD SIZE
96
LABOR FORCE [ PEOPLE ]
46.2%
PERCENT IN LABOR FORCE
10.4%
UNEMPLOYMENT RATE
Teller Zip Codes
Teller Area Codes
Income in Teller
Income Overview in Teller
Per Capita Income in Teller is $21,124, while median incomes of families and households are $37,250 and $34,688 respectively.
| Characteristic | Number | Measure |
| Per Capita Income | 279 | $21,124 |
| Median Family Income | 73 | $37,250 |
| Mean Family Income | 73 | $71,319 |
| Median Household Income | 89 | $34,688 |
| Mean Household Income | 89 | $63,621 |
| Income Deficit | 73 | $0 |
| Wage / Income Gap (%) | 279 | 35.10% |
| Wage / Income Gap ($) | 279 | 64.90¢ per $1 |
| Gini / Inequality Index | 279 | 0.57 |
Earnings by Sex in Teller
Average Earnings in Teller are $24,333, $22,917 for men and $35,313 for women, a difference of 35.1%.
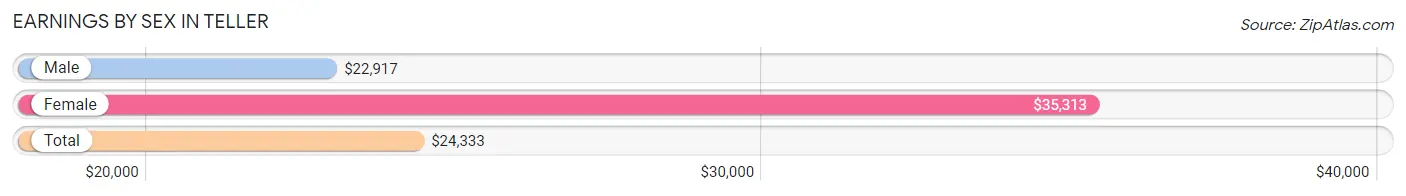
| Sex | Number | Average Earnings |
| Male | 57 (50.9%) | $22,917 |
| Female | 55 (49.1%) | $35,313 |
| Total | 112 (100.0%) | $24,333 |
Earnings by Sex by Income Bracket in Teller
The most common earnings brackets in Teller are $22,500 to $24,999 for men (9 | 15.8%) and $40,000 to $44,999 for women (9 | 16.4%).
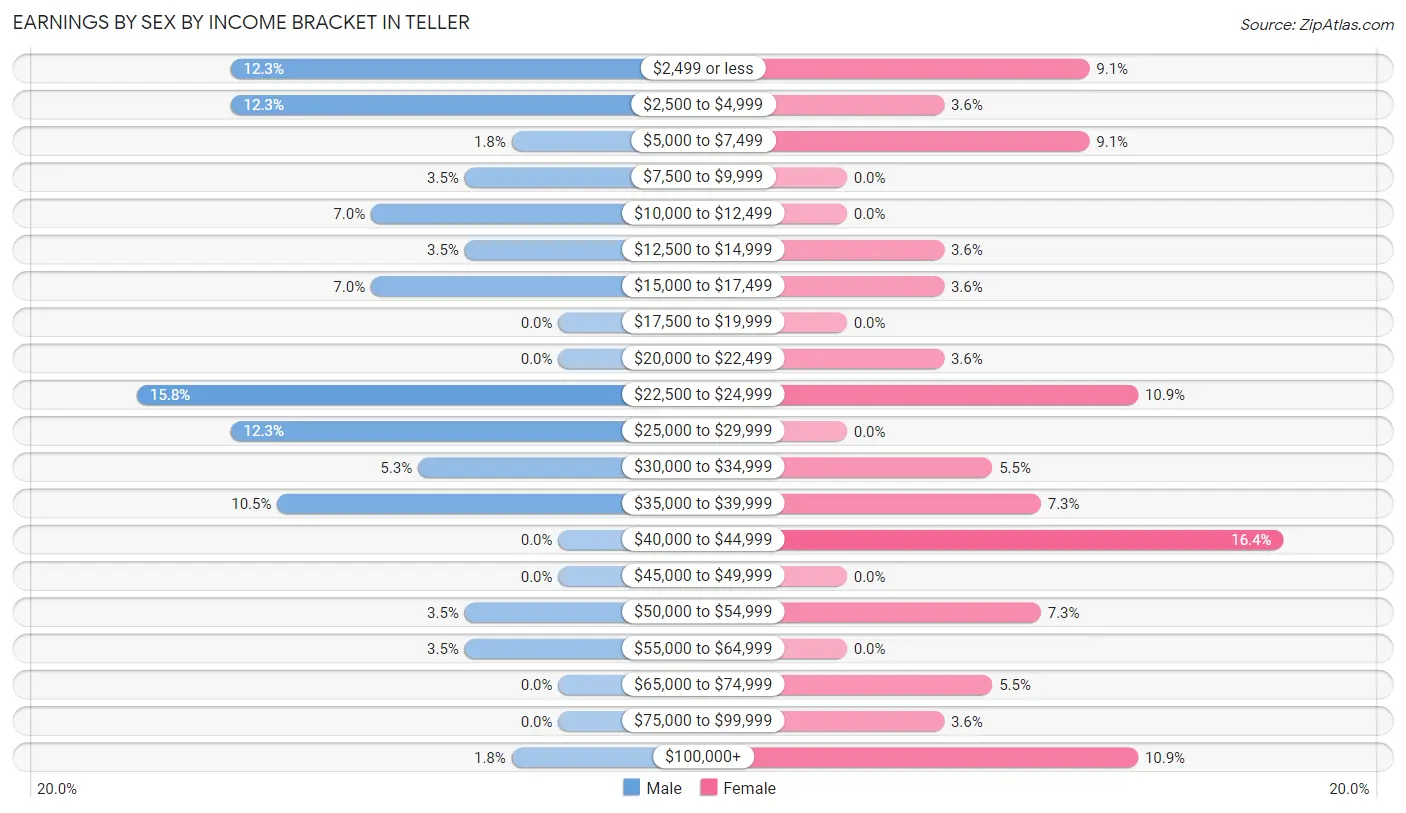
| Income | Male | Female |
| $2,499 or less | 7 (12.3%) | 5 (9.1%) |
| $2,500 to $4,999 | 7 (12.3%) | 2 (3.6%) |
| $5,000 to $7,499 | 1 (1.8%) | 5 (9.1%) |
| $7,500 to $9,999 | 2 (3.5%) | 0 (0.0%) |
| $10,000 to $12,499 | 4 (7.0%) | 0 (0.0%) |
| $12,500 to $14,999 | 2 (3.5%) | 2 (3.6%) |
| $15,000 to $17,499 | 4 (7.0%) | 2 (3.6%) |
| $17,500 to $19,999 | 0 (0.0%) | 0 (0.0%) |
| $20,000 to $22,499 | 0 (0.0%) | 2 (3.6%) |
| $22,500 to $24,999 | 9 (15.8%) | 6 (10.9%) |
| $25,000 to $29,999 | 7 (12.3%) | 0 (0.0%) |
| $30,000 to $34,999 | 3 (5.3%) | 3 (5.4%) |
| $35,000 to $39,999 | 6 (10.5%) | 4 (7.3%) |
| $40,000 to $44,999 | 0 (0.0%) | 9 (16.4%) |
| $45,000 to $49,999 | 0 (0.0%) | 0 (0.0%) |
| $50,000 to $54,999 | 2 (3.5%) | 4 (7.3%) |
| $55,000 to $64,999 | 2 (3.5%) | 0 (0.0%) |
| $65,000 to $74,999 | 0 (0.0%) | 3 (5.4%) |
| $75,000 to $99,999 | 0 (0.0%) | 2 (3.6%) |
| $100,000+ | 1 (1.8%) | 6 (10.9%) |
| Total | 57 (100.0%) | 55 (100.0%) |
Earnings by Sex by Educational Attainment in Teller
Average earnings in Teller are $20,000 for men and $40,313 for women, a difference of 50.4%. Men with an educational attainment of less than high school enjoy the highest average annual earnings of $22,778, while those with high school diploma education earn the least with $12,188. Women with an educational attainment of college or associate's degree earn the most with the average annual earnings of $55,000, while those with less than high school education have the smallest earnings of $23,438.
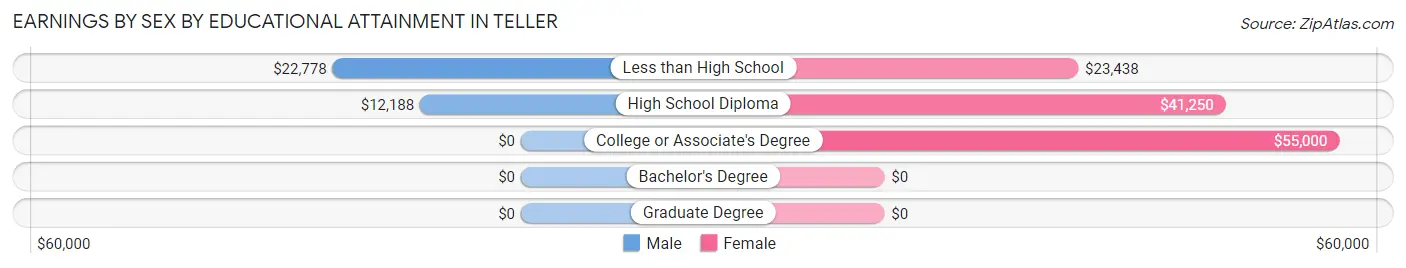
| Educational Attainment | Male Income | Female Income |
| Less than High School | $22,778 | $23,438 |
| High School Diploma | $12,188 | $41,250 |
| College or Associate's Degree | - | - |
| Bachelor's Degree | - | - |
| Graduate Degree | - | - |
| Total | $20,000 | $40,313 |
Family Income in Teller
Family Income Brackets in Teller
According to the Teller family income data, there are 16 families falling into the $15,000 to $24,999 income range, which is the most common income bracket and makes up 21.9% of all families. Conversely, the $10,000 to $14,999 income bracket is the least frequent group with only 1 families (1.4%) belonging to this category.
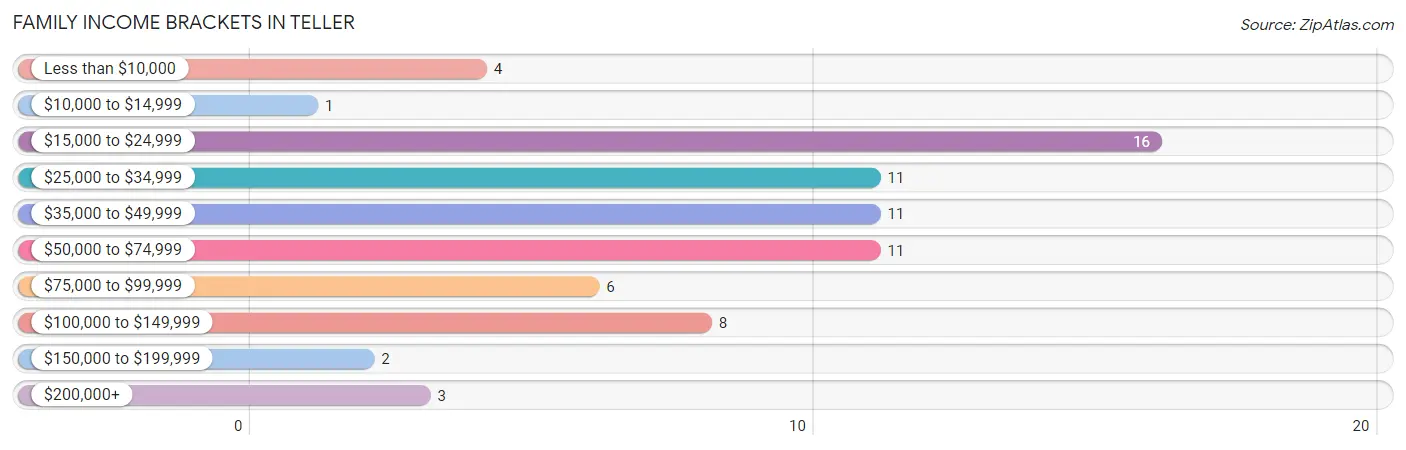
| Income Bracket | # Families | % Families |
| Less than $10,000 | 4 | 5.5% |
| $10,000 to $14,999 | 1 | 1.4% |
| $15,000 to $24,999 | 16 | 21.9% |
| $25,000 to $34,999 | 11 | 15.1% |
| $35,000 to $49,999 | 11 | 15.1% |
| $50,000 to $74,999 | 11 | 15.1% |
| $75,000 to $99,999 | 6 | 8.2% |
| $100,000 to $149,999 | 8 | 11.0% |
| $150,000 to $199,999 | 2 | 2.7% |
| $200,000+ | 3 | 4.1% |
Family Income by Famaliy Size in Teller
6-person families (8 | 11.0%) account for the highest median family income in Teller with $75,000 per family, while 4-person families (9 | 12.3%) have the highest median income of $13,229 per family member.
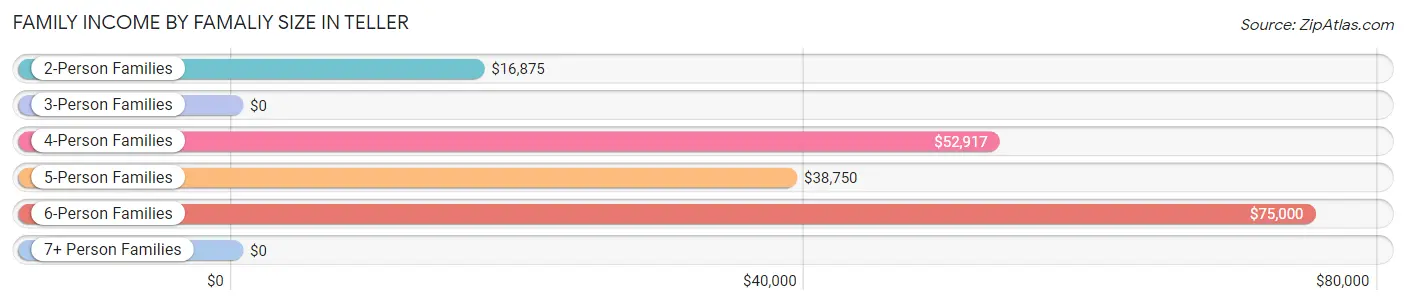
| Income Bracket | # Families | Median Income |
| 2-Person Families | 29 (39.7%) | $16,875 |
| 3-Person Families | 18 (24.7%) | $0 |
| 4-Person Families | 9 (12.3%) | $52,917 |
| 5-Person Families | 8 (11.0%) | $38,750 |
| 6-Person Families | 8 (11.0%) | $75,000 |
| 7+ Person Families | 1 (1.4%) | $0 |
| Total | 73 (100.0%) | $37,250 |
Family Income by Number of Earners in Teller
The median family income in Teller is $37,250, with families comprising 3+ earners (6) having the highest median family income of $101,250, while families with no earners (23) have the lowest median family income of $16,161, accounting for 8.2% and 31.5% of families, respectively.
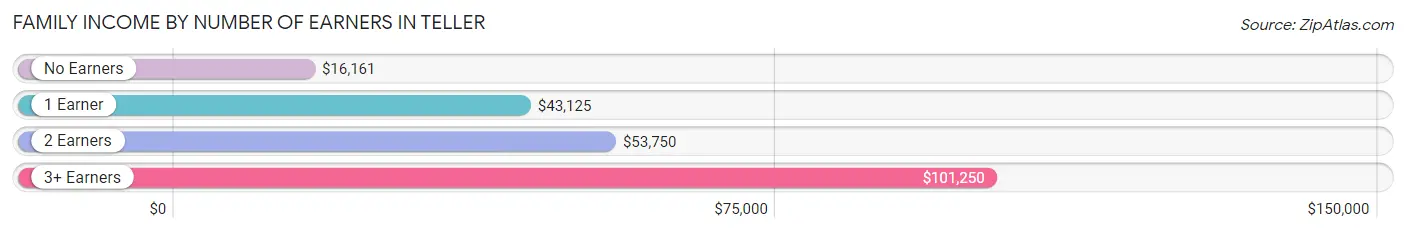
| Number of Earners | # Families | Median Income |
| No Earners | 23 (31.5%) | $16,161 |
| 1 Earner | 17 (23.3%) | $43,125 |
| 2 Earners | 27 (37.0%) | $53,750 |
| 3+ Earners | 6 (8.2%) | $101,250 |
| Total | 73 (100.0%) | $37,250 |
Household Income in Teller
Household Income Brackets in Teller
With 20 households falling in the category, the $15,000 to $24,999 income range is the most frequent in Teller, accounting for 22.5% of all households. In contrast, only 2 households (2.2%) fall into the $150,000 to $199,999 income bracket, making it the least populous group.
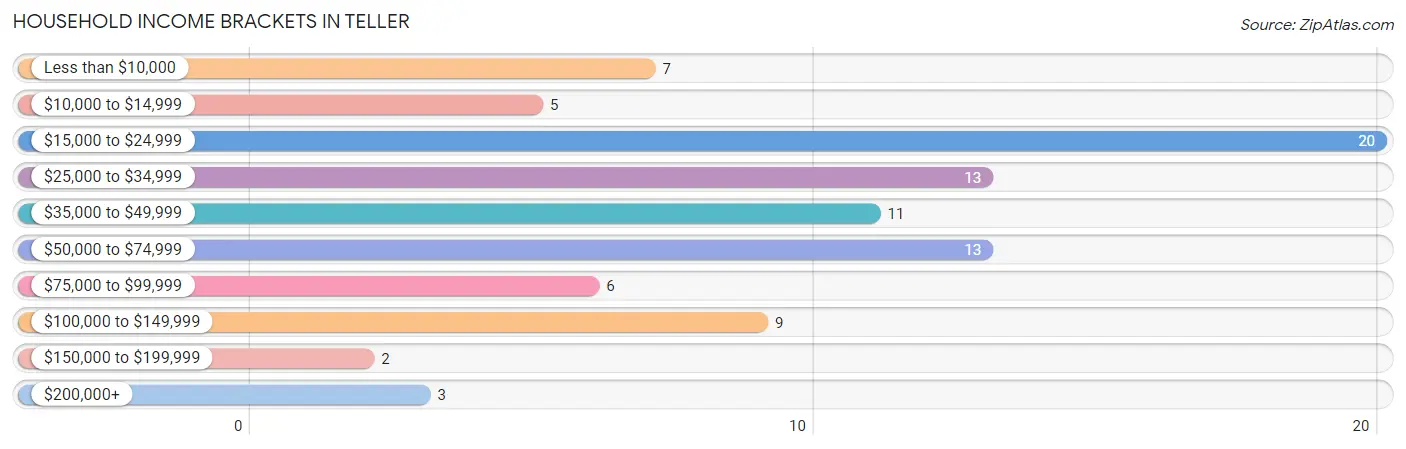
| Income Bracket | # Households | % Households |
| Less than $10,000 | 7 | 7.9% |
| $10,000 to $14,999 | 5 | 5.6% |
| $15,000 to $24,999 | 20 | 22.5% |
| $25,000 to $34,999 | 13 | 14.6% |
| $35,000 to $49,999 | 11 | 12.4% |
| $50,000 to $74,999 | 13 | 14.6% |
| $75,000 to $99,999 | 6 | 6.7% |
| $100,000 to $149,999 | 9 | 10.1% |
| $150,000 to $199,999 | 2 | 2.2% |
| $200,000+ | 3 | 3.4% |
Household Income by Householder Age in Teller
The median household income in Teller is $34,688, with the highest median household income of $56,667 found in the 25 to 44 years age bracket for the primary householder. A total of 20 households (22.5%) fall into this category. Meanwhile, the 15 to 24 years age bracket for the primary householder has the lowest median household income of $0, with 6 households (6.7%) in this group.
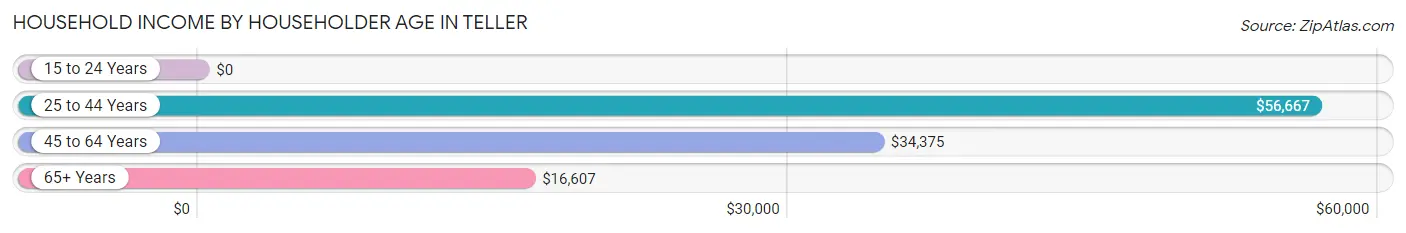
| Income Bracket | # Households | Median Income |
| 15 to 24 Years | 6 (6.7%) | $0 |
| 25 to 44 Years | 20 (22.5%) | $56,667 |
| 45 to 64 Years | 37 (41.6%) | $34,375 |
| 65+ Years | 26 (29.2%) | $16,607 |
| Total | 89 (100.0%) | $34,688 |
Poverty in Teller
Income Below Poverty by Sex and Age in Teller
With 33.6% poverty level for males and 35.3% for females among the residents of Teller, 65 to 74 year old males and 75 year old and over females are the most vulnerable to poverty, with 7 males (100.0%) and 14 females (77.8%) in their respective age groups living below the poverty level.
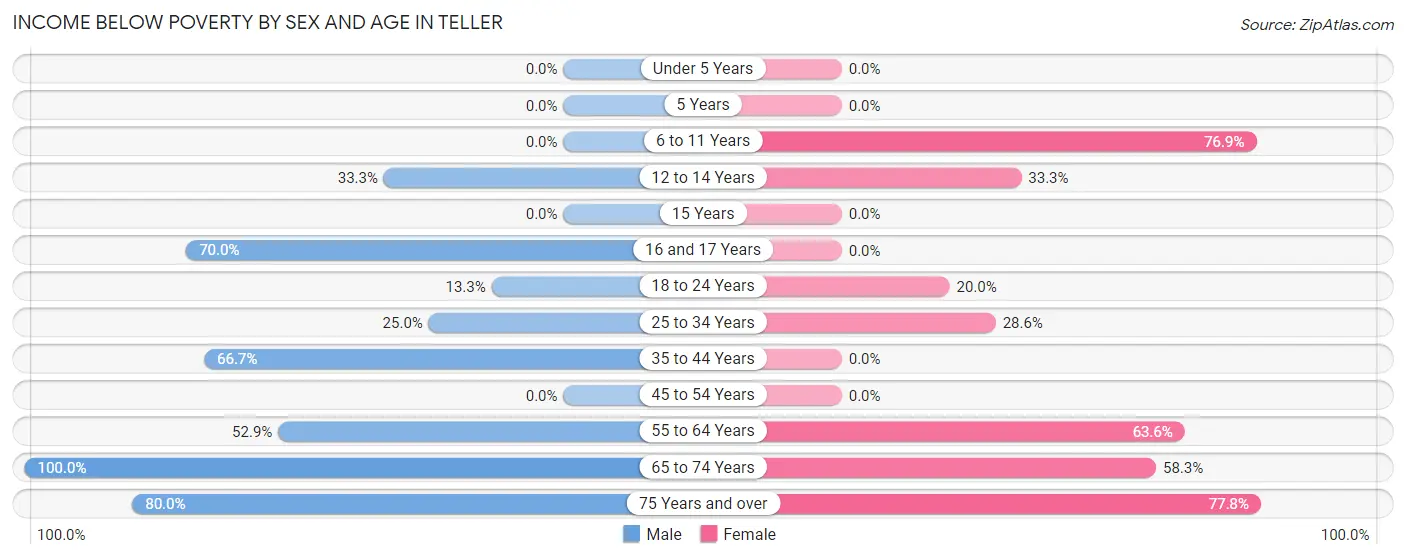
| Age Bracket | Male | Female |
| Under 5 Years | 0 (0.0%) | 0 (0.0%) |
| 5 Years | 0 (0.0%) | 0 (0.0%) |
| 6 to 11 Years | 0 (0.0%) | 10 (76.9%) |
| 12 to 14 Years | 6 (33.3%) | 3 (33.3%) |
| 15 Years | 0 (0.0%) | 0 (0.0%) |
| 16 and 17 Years | 7 (70.0%) | 0 (0.0%) |
| 18 to 24 Years | 2 (13.3%) | 4 (20.0%) |
| 25 to 34 Years | 6 (25.0%) | 2 (28.6%) |
| 35 to 44 Years | 4 (66.7%) | 0 (0.0%) |
| 45 to 54 Years | 0 (0.0%) | 0 (0.0%) |
| 55 to 64 Years | 9 (52.9%) | 7 (63.6%) |
| 65 to 74 Years | 7 (100.0%) | 7 (58.3%) |
| 75 Years and over | 8 (80.0%) | 14 (77.8%) |
| Total | 49 (33.6%) | 47 (35.3%) |
Income Above Poverty by Sex and Age in Teller
According to the poverty statistics in Teller, males aged under 5 years and females aged under 5 years are the age groups that are most secure financially, with 100.0% of males and 100.0% of females in these age groups living above the poverty line.
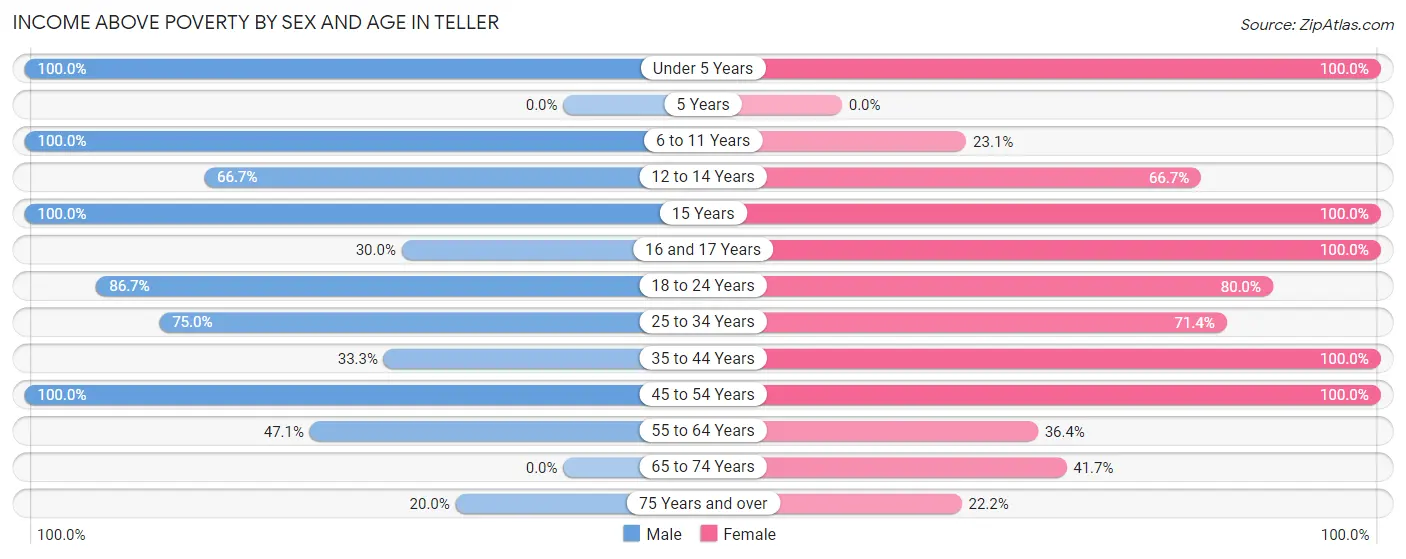
| Age Bracket | Male | Female |
| Under 5 Years | 4 (100.0%) | 2 (100.0%) |
| 5 Years | 0 (0.0%) | 0 (0.0%) |
| 6 to 11 Years | 17 (100.0%) | 3 (23.1%) |
| 12 to 14 Years | 12 (66.7%) | 6 (66.7%) |
| 15 Years | 6 (100.0%) | 2 (100.0%) |
| 16 and 17 Years | 3 (30.0%) | 11 (100.0%) |
| 18 to 24 Years | 13 (86.7%) | 16 (80.0%) |
| 25 to 34 Years | 18 (75.0%) | 5 (71.4%) |
| 35 to 44 Years | 2 (33.3%) | 14 (100.0%) |
| 45 to 54 Years | 12 (100.0%) | 14 (100.0%) |
| 55 to 64 Years | 8 (47.1%) | 4 (36.4%) |
| 65 to 74 Years | 0 (0.0%) | 5 (41.7%) |
| 75 Years and over | 2 (20.0%) | 4 (22.2%) |
| Total | 97 (66.4%) | 86 (64.7%) |
Income Below Poverty Among Married-Couple Families in Teller
The poverty statistics for married-couple families in Teller show that 23.5% or 4 of the total 17 families live below the poverty line. Families with 3 or 4 children have the highest poverty rate of 66.7%, comprising of 4 families. On the other hand, families with no children have the lowest poverty rate of 0.0%, which includes 0 families.
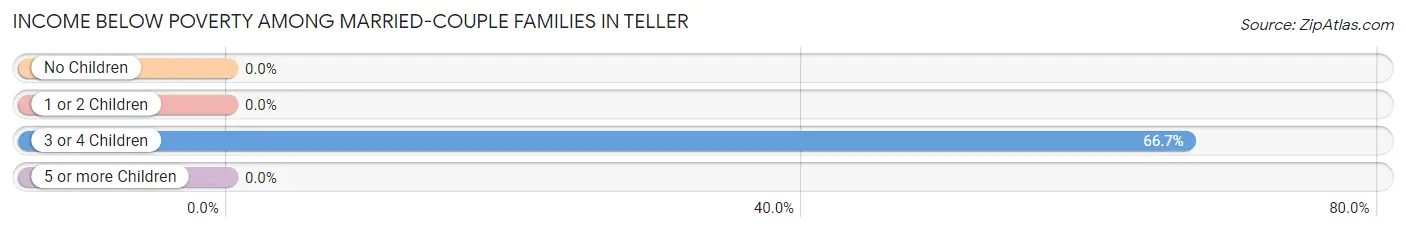
| Children | Above Poverty | Below Poverty |
| No Children | 5 (100.0%) | 0 (0.0%) |
| 1 or 2 Children | 5 (100.0%) | 0 (0.0%) |
| 3 or 4 Children | 2 (33.3%) | 4 (66.7%) |
| 5 or more Children | 1 (100.0%) | 0 (0.0%) |
| Total | 13 (76.5%) | 4 (23.5%) |
Income Below Poverty Among Single-Parent Households in Teller
According to the poverty data in Teller, 31.2% or 5 single-father households and 40.0% or 16 single-mother households are living below the poverty line. Among single-father households, those with no children have the highest poverty rate, with 3 households (33.3%) experiencing poverty. Likewise, among single-mother households, those with 1 or 2 children have the highest poverty rate, with 14 households (56.0%) falling below the poverty line.
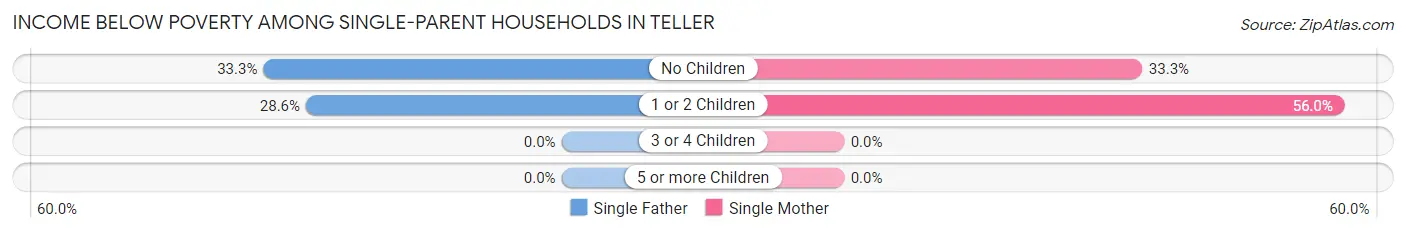
| Children | Single Father | Single Mother |
| No Children | 3 (33.3%) | 2 (33.3%) |
| 1 or 2 Children | 2 (28.6%) | 14 (56.0%) |
| 3 or 4 Children | 0 (0.0%) | 0 (0.0%) |
| 5 or more Children | 0 (0.0%) | 0 (0.0%) |
| Total | 5 (31.2%) | 16 (40.0%) |
Income Below Poverty Among Married-Couple vs Single-Parent Households in Teller
The poverty data for Teller shows that 4 of the married-couple family households (23.5%) and 21 of the single-parent households (37.5%) are living below the poverty level. Within the married-couple family households, those with 3 or 4 children have the highest poverty rate, with 4 households (66.7%) falling below the poverty line. Among the single-parent households, those with 1 or 2 children have the highest poverty rate, with 16 household (50.0%) living below poverty.
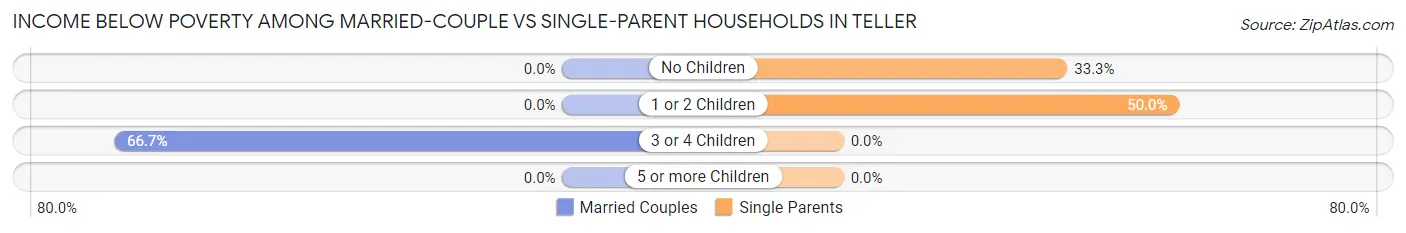
| Children | Married-Couple Families | Single-Parent Households |
| No Children | 0 (0.0%) | 5 (33.3%) |
| 1 or 2 Children | 0 (0.0%) | 16 (50.0%) |
| 3 or 4 Children | 4 (66.7%) | 0 (0.0%) |
| 5 or more Children | 0 (0.0%) | 0 (0.0%) |
| Total | 4 (23.5%) | 21 (37.5%) |
Race in Teller
The most populous races in Teller are Native / Alaskan (275 | 98.6%), Hispanic or Latino (6 | 2.1%), and Black / African American (3 | 1.1%).
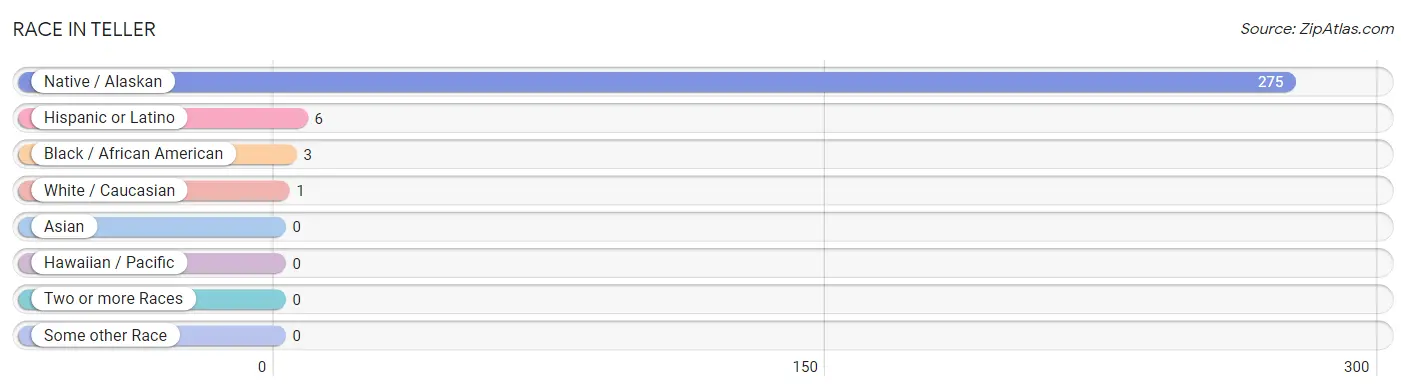
| Race | # Population | % Population |
| Asian | 0 | 0.0% |
| Black / African American | 3 | 1.1% |
| Hawaiian / Pacific | 0 | 0.0% |
| Hispanic or Latino | 6 | 2.1% |
| Native / Alaskan | 275 | 98.6% |
| White / Caucasian | 1 | 0.4% |
| Two or more Races | 0 | 0.0% |
| Some other Race | 0 | 0.0% |
| Total | 279 | 100.0% |
Ancestry in Teller
The most populous ancestries reported in Teller are Inupiat (238 | 85.3%), Alaska Native (37 | 13.3%), Mexican (6 | 2.1%), European (2 | 0.7%), and English (1 | 0.4%), together accounting for 101.8% of all Teller residents.
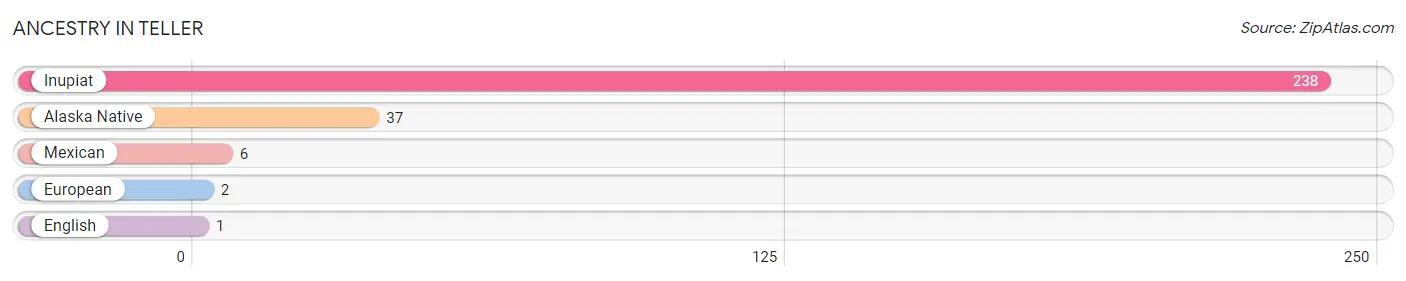
| Ancestry | # Population | % Population |
| Alaska Native | 37 | 13.3% |
| English | 1 | 0.4% |
| European | 2 | 0.7% |
| Inupiat | 238 | 85.3% |
| Mexican | 6 | 2.1% | View All 5 Rows |
Immigrants in Teller

| Immigration Origin | # Population | % Population | View All 0 Rows |
Sex and Age in Teller
Sex and Age in Teller
The most populous age groups in Teller are 10 to 14 Years (25 | 17.1%) for men and 15 to 19 Years (19 | 14.3%) for women.
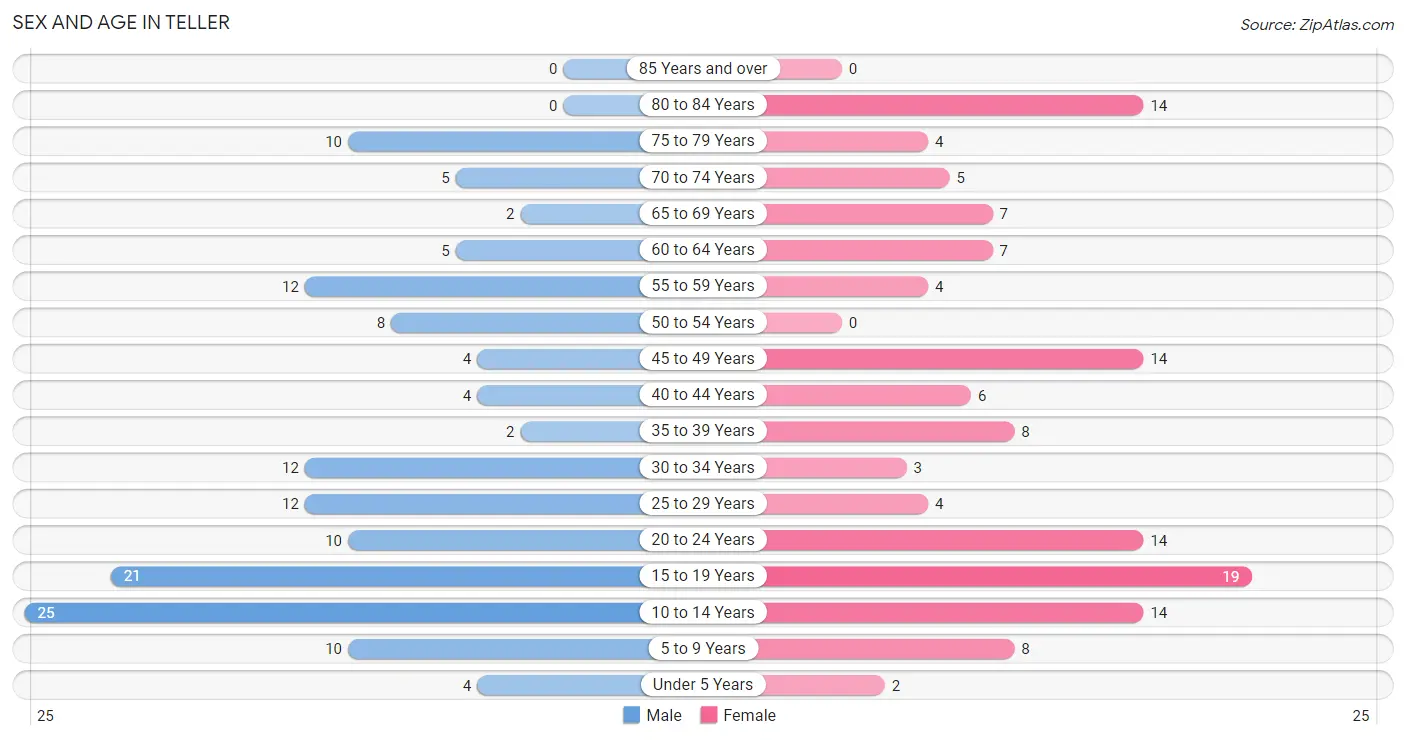
| Age Bracket | Male | Female |
| Under 5 Years | 4 (2.7%) | 2 (1.5%) |
| 5 to 9 Years | 10 (6.9%) | 8 (6.0%) |
| 10 to 14 Years | 25 (17.1%) | 14 (10.5%) |
| 15 to 19 Years | 21 (14.4%) | 19 (14.3%) |
| 20 to 24 Years | 10 (6.9%) | 14 (10.5%) |
| 25 to 29 Years | 12 (8.2%) | 4 (3.0%) |
| 30 to 34 Years | 12 (8.2%) | 3 (2.3%) |
| 35 to 39 Years | 2 (1.4%) | 8 (6.0%) |
| 40 to 44 Years | 4 (2.7%) | 6 (4.5%) |
| 45 to 49 Years | 4 (2.7%) | 14 (10.5%) |
| 50 to 54 Years | 8 (5.5%) | 0 (0.0%) |
| 55 to 59 Years | 12 (8.2%) | 4 (3.0%) |
| 60 to 64 Years | 5 (3.4%) | 7 (5.3%) |
| 65 to 69 Years | 2 (1.4%) | 7 (5.3%) |
| 70 to 74 Years | 5 (3.4%) | 5 (3.8%) |
| 75 to 79 Years | 10 (6.9%) | 4 (3.0%) |
| 80 to 84 Years | 0 (0.0%) | 14 (10.5%) |
| 85 Years and over | 0 (0.0%) | 0 (0.0%) |
| Total | 146 (100.0%) | 133 (100.0%) |
Families and Households in Teller
Median Family Size in Teller
The median family size in Teller is 3.41 persons per family, with married-couple families (17 | 23.3%) accounting for the largest median family size of 5.12 persons per family. On the other hand, single female/mother families (40 | 54.8%) represent the smallest median family size with 2.63 persons per family.
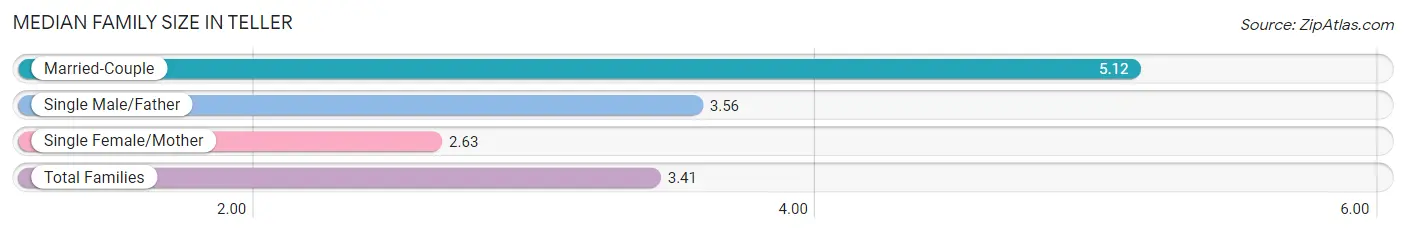
| Family Type | # Families | Family Size |
| Married-Couple | 17 (23.3%) | 5.12 |
| Single Male/Father | 16 (21.9%) | 3.56 |
| Single Female/Mother | 40 (54.8%) | 2.63 |
| Total Families | 73 (100.0%) | 3.41 |
Median Household Size in Teller
The median household size in Teller is 3.13 persons per household, with married-couple households (17 | 19.1%) accounting for the largest median household size of 5.12 persons per household. non-family households (16 | 18.0%) represent the smallest median household size with 1.31 persons per household.
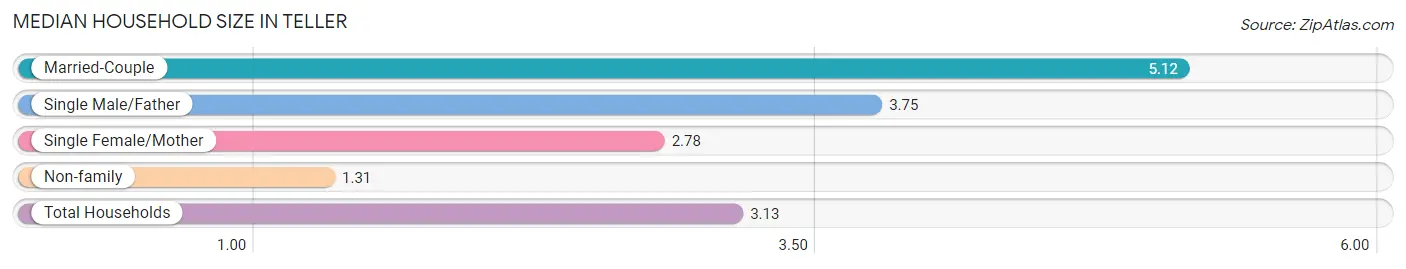
| Household Type | # Households | Household Size |
| Married-Couple | 17 (19.1%) | 5.12 |
| Single Male/Father | 16 (18.0%) | 3.75 |
| Single Female/Mother | 40 (44.9%) | 2.78 |
| Non-family | 16 (18.0%) | 1.31 |
| Total Households | 89 (100.0%) | 3.13 |
Household Size by Marriage Status in Teller
Out of a total of 89 households in Teller, 73 (82.0%) are family households, while 16 (18.0%) are nonfamily households. The most numerous type of family households are 2-person households, comprising 25, and the most common type of nonfamily households are 1-person households, comprising 10.
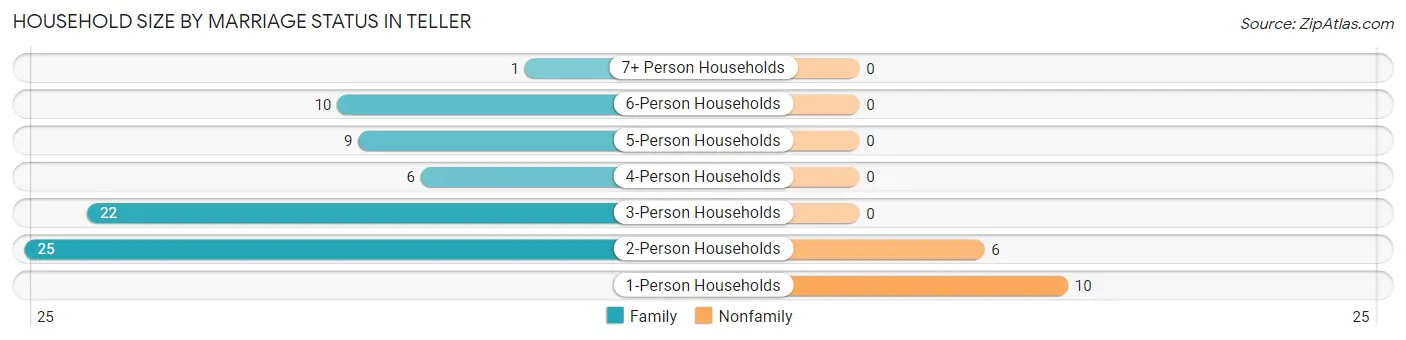
| Household Size | Family Households | Nonfamily Households |
| 1-Person Households | - | 10 (11.2%) |
| 2-Person Households | 25 (28.1%) | 6 (6.7%) |
| 3-Person Households | 22 (24.7%) | 0 (0.0%) |
| 4-Person Households | 6 (6.7%) | 0 (0.0%) |
| 5-Person Households | 9 (10.1%) | 0 (0.0%) |
| 6-Person Households | 10 (11.2%) | 0 (0.0%) |
| 7+ Person Households | 1 (1.1%) | 0 (0.0%) |
| Total | 73 (82.0%) | 16 (18.0%) |
Female Fertility in Teller
Fertility by Age in Teller
Average fertility rate in Teller is 59.0 births per 1,000 women. Women in the age bracket of 20 to 34 years have the highest fertility rate with 190.0 births per 1,000 women. Women in the age bracket of 20 to 34 years acount for 100.0% of all women with births.
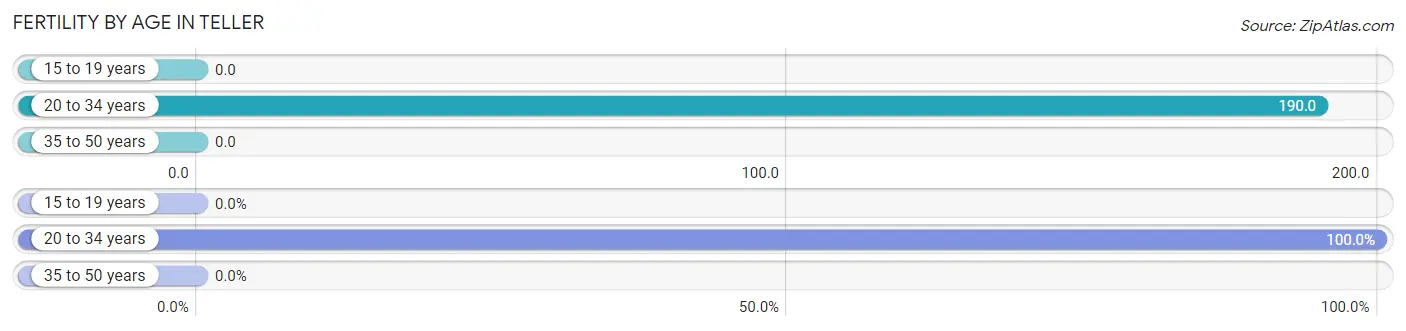
| Age Bracket | Women with Births | Births / 1,000 Women |
| 15 to 19 years | 0 (0.0%) | 0.0 |
| 20 to 34 years | 4 (100.0%) | 190.0 |
| 35 to 50 years | 0 (0.0%) | 0.0 |
| Total | 4 (100.0%) | 59.0 |
Fertility by Age by Marriage Status in Teller
50.0% of women with births (4) in Teller are married. The highest percentage of unmarried women with births falls into 20 to 34 years age bracket with 50.0% of them unmarried at the time of birth, while the lowest percentage of unmarried women with births belong to 20 to 34 years age bracket with 50.0% of them unmarried.
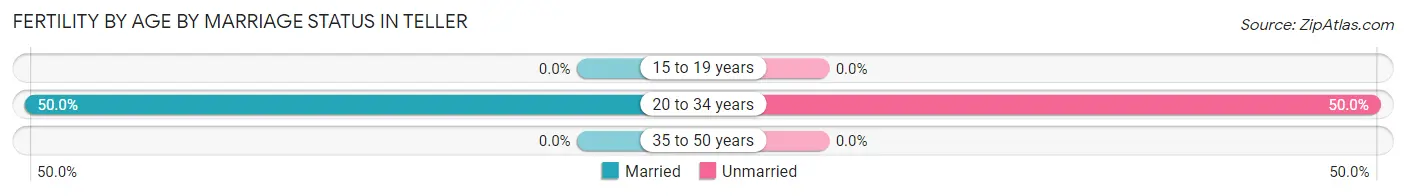
| Age Bracket | Married | Unmarried |
| 15 to 19 years | 0 (0.0%) | 0 (0.0%) |
| 20 to 34 years | 2 (50.0%) | 2 (50.0%) |
| 35 to 50 years | 0 (0.0%) | 0 (0.0%) |
| Total | 2 (50.0%) | 2 (50.0%) |
Fertility by Education in Teller
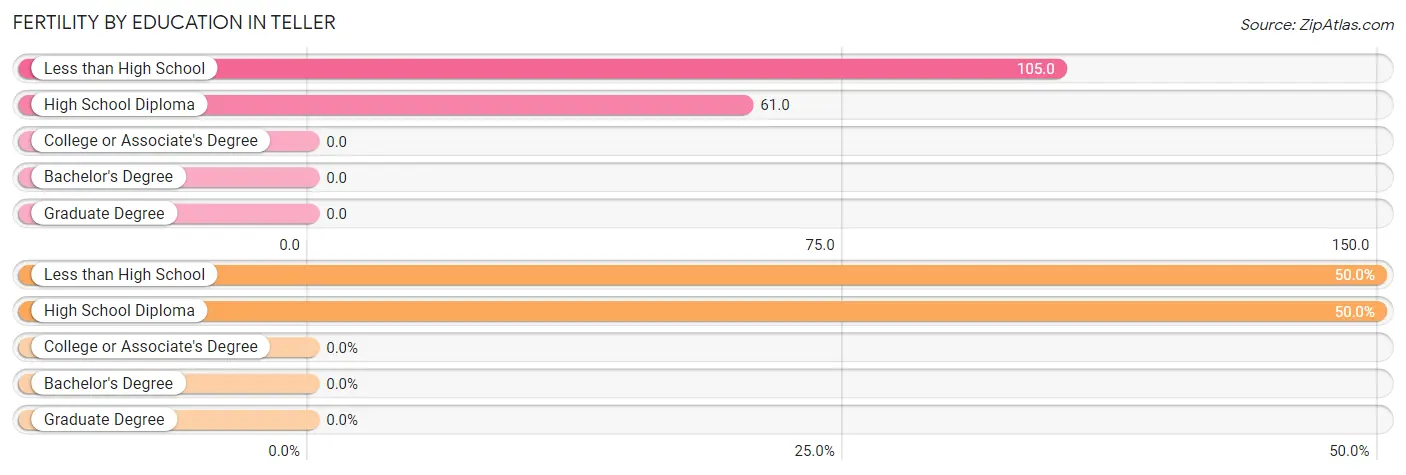
| Educational Attainment | Women with Births | Births / 1,000 Women |
| Less than High School | 2 (50.0%) | 105.0 |
| High School Diploma | 2 (50.0%) | 61.0 |
| College or Associate's Degree | 0 (0.0%) | 0.0 |
| Bachelor's Degree | 0 (0.0%) | 0.0 |
| Graduate Degree | 0 (0.0%) | 0.0 |
| Total | 4 (100.0%) | 59.0 |
Fertility by Education by Marriage Status in Teller
50.0% of women with births in Teller are unmarried. Women with the educational attainment of less than high school are most likely to be married with 100.0% of them married at childbirth, while women with the educational attainment of high school diploma are least likely to be married with 100.0% of them unmarried at childbirth.
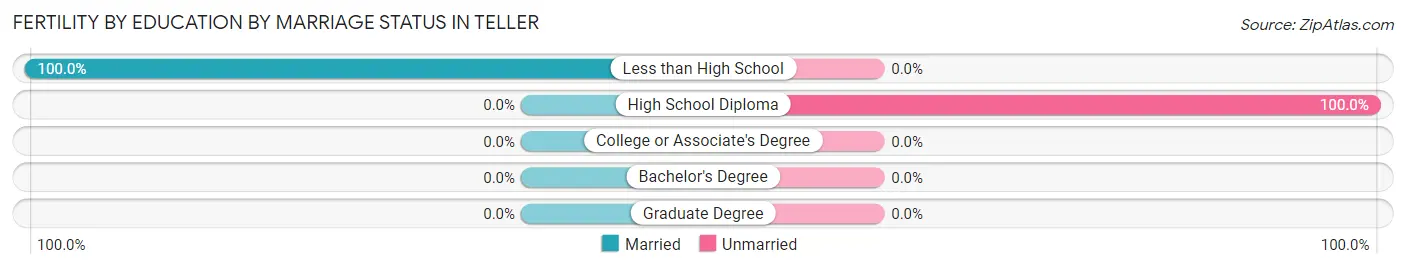
| Educational Attainment | Married | Unmarried |
| Less than High School | 2 (100.0%) | 0 (0.0%) |
| High School Diploma | 0 (0.0%) | 2 (100.0%) |
| College or Associate's Degree | 0 (0.0%) | 0 (0.0%) |
| Bachelor's Degree | 0 (0.0%) | 0 (0.0%) |
| Graduate Degree | 0 (0.0%) | 0 (0.0%) |
| Total | 2 (50.0%) | 2 (50.0%) |
Employment Characteristics in Teller
Employment by Class of Employer in Teller
Among the 84 employed individuals in Teller, local government employees (35 | 41.7%), private company employees (15 | 17.9%), and not-for-profit organizations (14 | 16.7%) make up the most common classes of employment.

| Employer Class | # Employees | % Employees |
| Private Company Employees | 15 | 17.9% |
| Self-Employed (Incorporated) | 0 | 0.0% |
| Self-Employed (Not Incorporated) | 0 | 0.0% |
| Not-for-profit Organizations | 14 | 16.7% |
| Local Government Employees | 35 | 41.7% |
| State Government Employees | 13 | 15.5% |
| Federal Government Employees | 7 | 8.3% |
| Unpaid Family Workers | 0 | 0.0% |
| Total | 84 | 100.0% |
Employment Status by Age in Teller
According to the labor force statistics for Teller, out of the total population over 16 years of age (208), 46.2% or 96 individuals are in the labor force, with 10.4% or 10 of them unemployed. The age group with the highest labor force participation rate is 25 to 29 years, with 81.3% or 13 individuals in the labor force. Within the labor force, the 55 to 59 years age range has the highest percentage of unemployed individuals, with 71.4% or 5 of them being unemployed.
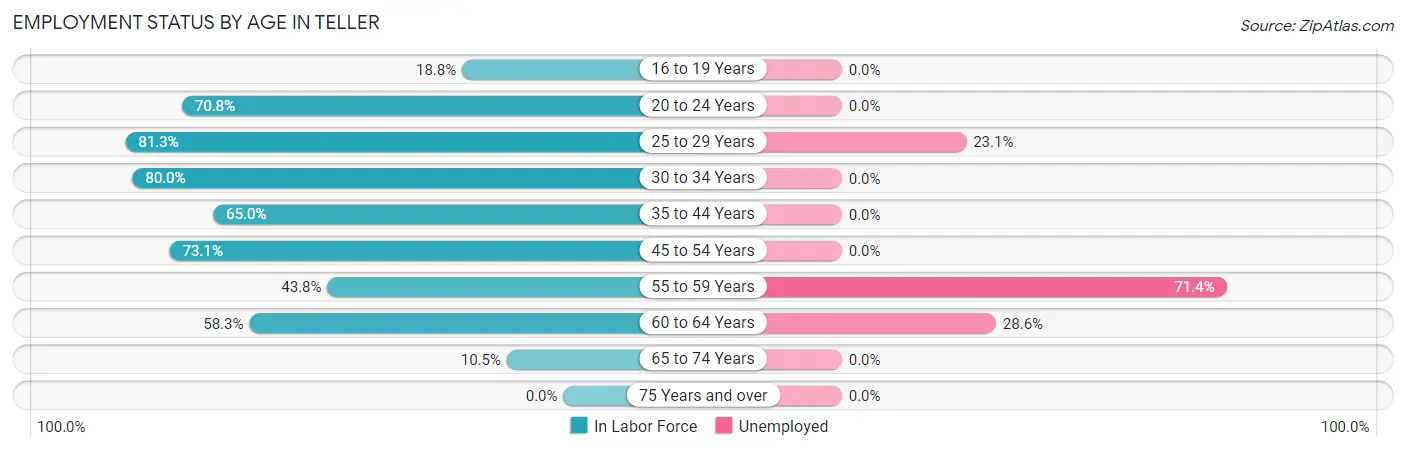
| Age Bracket | In Labor Force | Unemployed |
| 16 to 19 Years | 6 (18.8%) | 0 (0.0%) |
| 20 to 24 Years | 17 (70.8%) | 0 (0.0%) |
| 25 to 29 Years | 13 (81.3%) | 3 (23.1%) |
| 30 to 34 Years | 12 (80.0%) | 0 (0.0%) |
| 35 to 44 Years | 13 (65.0%) | 0 (0.0%) |
| 45 to 54 Years | 19 (73.1%) | 0 (0.0%) |
| 55 to 59 Years | 7 (43.8%) | 5 (71.4%) |
| 60 to 64 Years | 7 (58.3%) | 2 (28.6%) |
| 65 to 74 Years | 2 (10.5%) | 0 (0.0%) |
| 75 Years and over | 0 (0.0%) | 0 (0.0%) |
| Total | 96 (46.2%) | 10 (10.4%) |
Employment Status by Educational Attainment in Teller
According to labor force statistics for Teller, 67.6% of individuals (71) out of the total population between 25 and 64 years of age (105) are in the labor force, with 14.1% or 10 of them being unemployed. The group with the highest labor force participation rate are those with the educational attainment of bachelor's degree or higher, with 100.0% or 1 individuals in the labor force. Within the labor force, individuals with less than high school education have the highest percentage of unemployment, with 35.0% or 7 of them being unemployed.
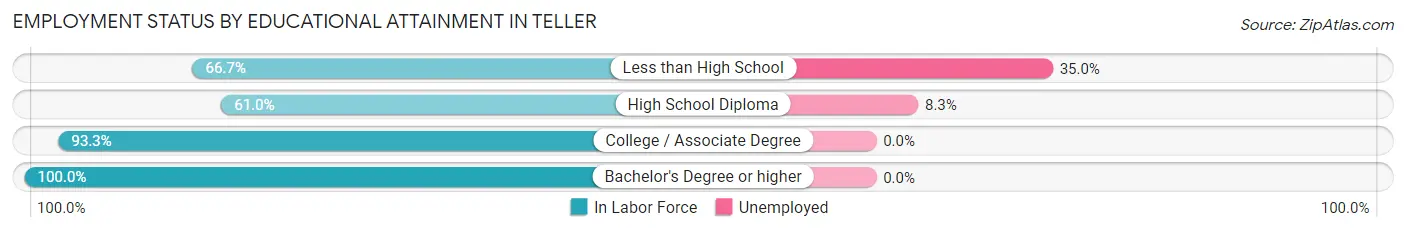
| Educational Attainment | In Labor Force | Unemployed |
| Less than High School | 20 (66.7%) | 10 (35.0%) |
| High School Diploma | 36 (61.0%) | 5 (8.3%) |
| College / Associate Degree | 14 (93.3%) | 0 (0.0%) |
| Bachelor's Degree or higher | 1 (100.0%) | 0 (0.0%) |
| Total | 71 (67.6%) | 15 (14.1%) |
Employment Occupations by Sex in Teller
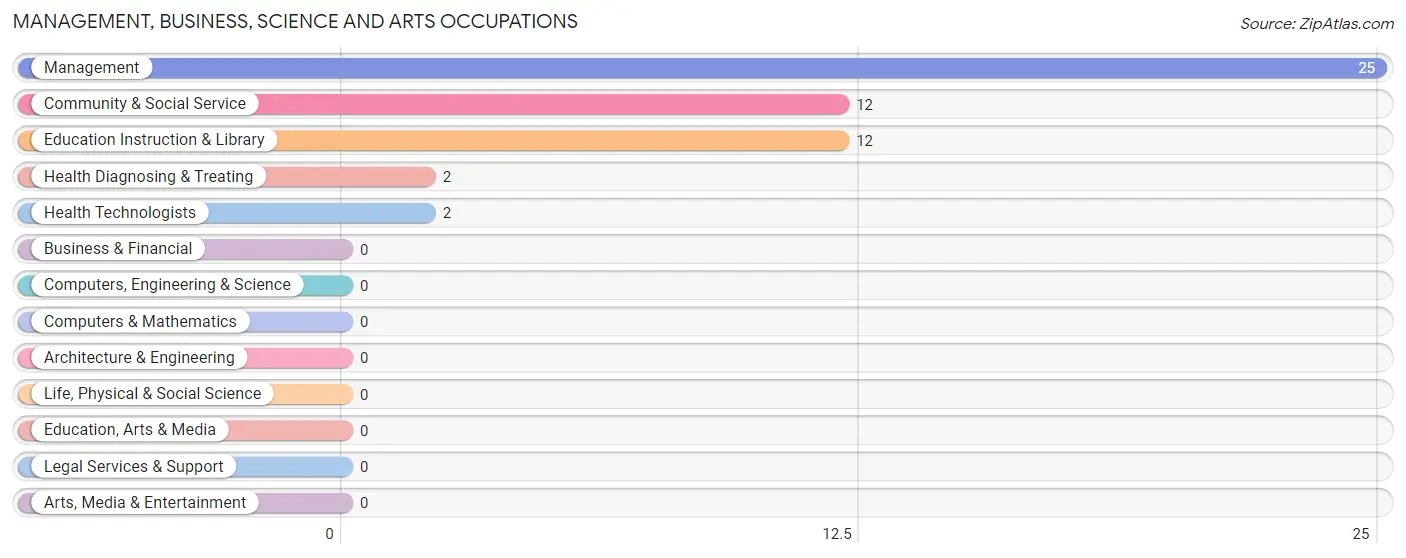
Management, Business, Science and Arts Occupations
The most common Management, Business, Science and Arts occupations in Teller are Management (25 | 29.1%), Community & Social Service (12 | 14.0%), Education Instruction & Library (12 | 14.0%), Health Diagnosing & Treating (2 | 2.3%), and Health Technologists (2 | 2.3%).
Management, Business, Science and Arts Occupations by Sex
Within the Management, Business, Science and Arts occupations in Teller, the most male-oriented occupations are Community & Social Service (33.3%), and Education Instruction & Library (33.3%), while the most female-oriented occupations are Management (100.0%), Health Diagnosing & Treating (100.0%), and Health Technologists (100.0%).
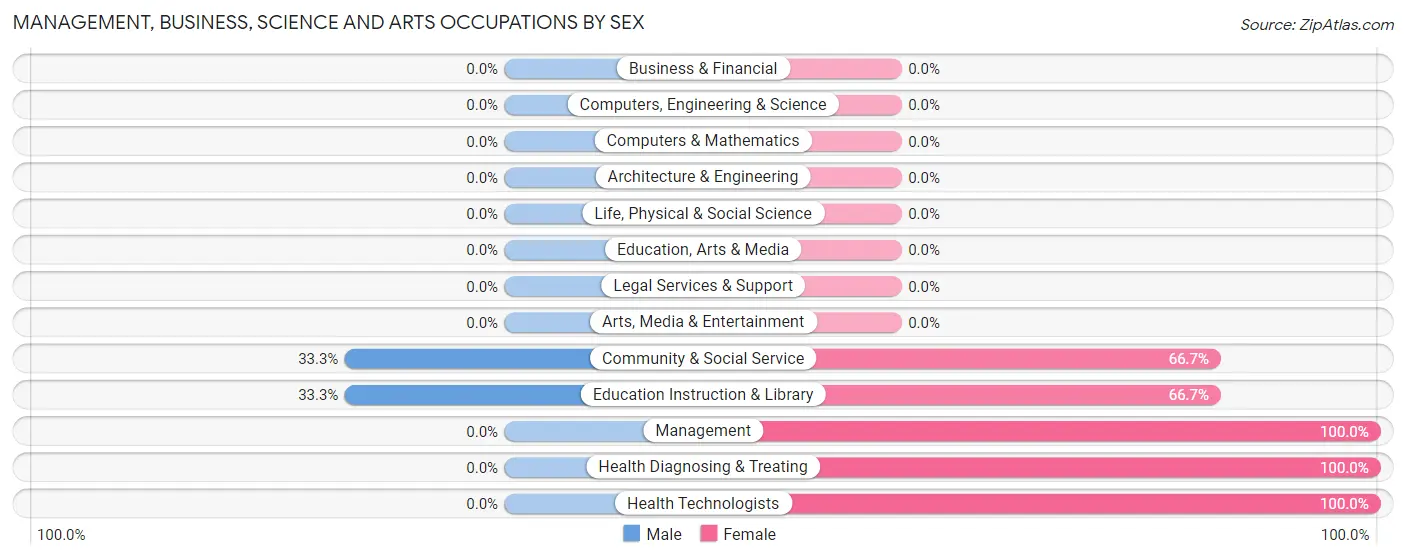
| Occupation | Male | Female |
| Management | 0 (0.0%) | 25 (100.0%) |
| Business & Financial | 0 (0.0%) | 0 (0.0%) |
| Computers, Engineering & Science | 0 (0.0%) | 0 (0.0%) |
| Computers & Mathematics | 0 (0.0%) | 0 (0.0%) |
| Architecture & Engineering | 0 (0.0%) | 0 (0.0%) |
| Life, Physical & Social Science | 0 (0.0%) | 0 (0.0%) |
| Community & Social Service | 4 (33.3%) | 8 (66.7%) |
| Education, Arts & Media | 0 (0.0%) | 0 (0.0%) |
| Legal Services & Support | 0 (0.0%) | 0 (0.0%) |
| Education Instruction & Library | 4 (33.3%) | 8 (66.7%) |
| Arts, Media & Entertainment | 0 (0.0%) | 0 (0.0%) |
| Health Diagnosing & Treating | 0 (0.0%) | 2 (100.0%) |
| Health Technologists | 0 (0.0%) | 2 (100.0%) |
| Total (Category) | 4 (10.3%) | 35 (89.7%) |
| Total (Overall) | 39 (45.4%) | 47 (54.6%) |
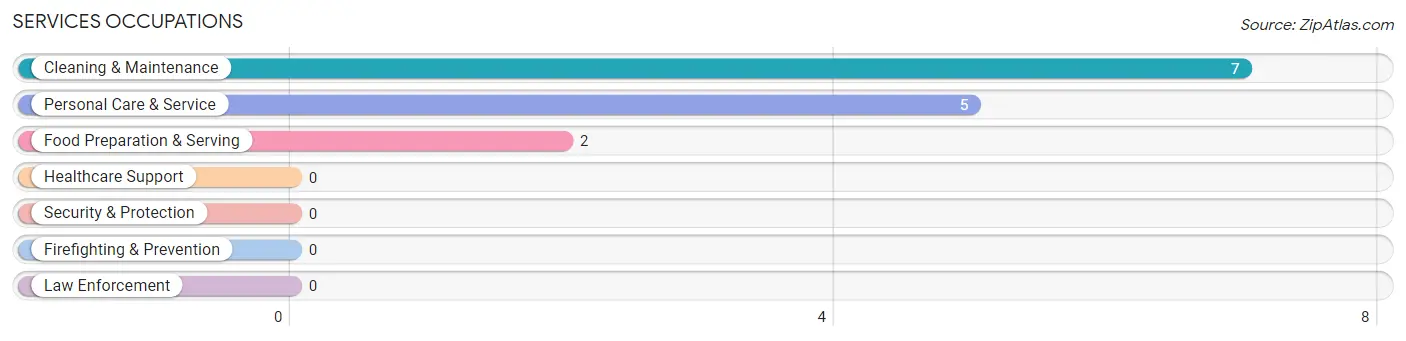
Services Occupations
The most common Services occupations in Teller are Cleaning & Maintenance (7 | 8.1%), Personal Care & Service (5 | 5.8%), and Food Preparation & Serving (2 | 2.3%).
Services Occupations by Sex
Within the Services occupations in Teller, the most male-oriented occupations are Cleaning & Maintenance (100.0%), and Personal Care & Service (60.0%), while the most female-oriented occupations are Food Preparation & Serving (100.0%), and Personal Care & Service (40.0%).
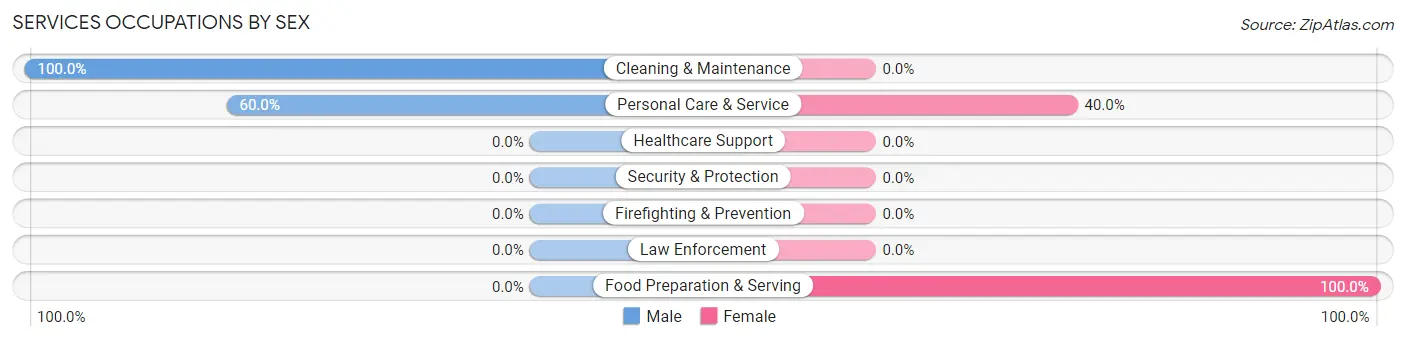
| Occupation | Male | Female |
| Healthcare Support | 0 (0.0%) | 0 (0.0%) |
| Security & Protection | 0 (0.0%) | 0 (0.0%) |
| Firefighting & Prevention | 0 (0.0%) | 0 (0.0%) |
| Law Enforcement | 0 (0.0%) | 0 (0.0%) |
| Food Preparation & Serving | 0 (0.0%) | 2 (100.0%) |
| Cleaning & Maintenance | 7 (100.0%) | 0 (0.0%) |
| Personal Care & Service | 3 (60.0%) | 2 (40.0%) |
| Total (Category) | 10 (71.4%) | 4 (28.6%) |
| Total (Overall) | 39 (45.4%) | 47 (54.6%) |
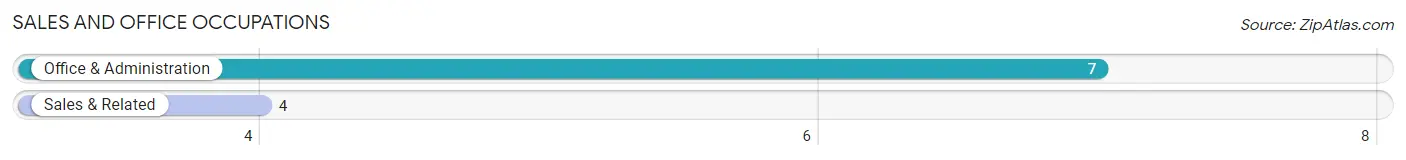
Sales and Office Occupations
The most common Sales and Office occupations in Teller are Office & Administration (7 | 8.1%), and Sales & Related (4 | 4.6%).
Sales and Office Occupations by Sex
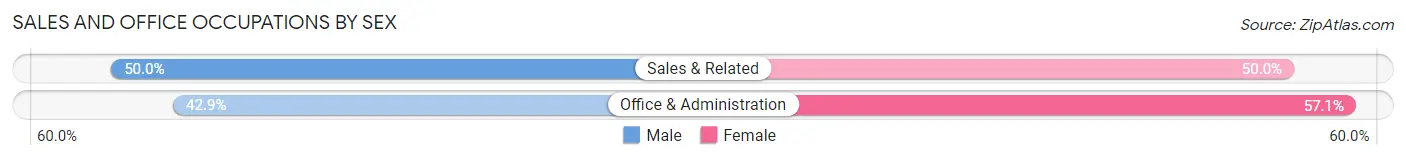
| Occupation | Male | Female |
| Sales & Related | 2 (50.0%) | 2 (50.0%) |
| Office & Administration | 3 (42.9%) | 4 (57.1%) |
| Total (Category) | 5 (45.5%) | 6 (54.5%) |
| Total (Overall) | 39 (45.4%) | 47 (54.6%) |
Natural Resources, Construction and Maintenance Occupations
The most common Natural Resources, Construction and Maintenance occupations in Teller are , and Construction & Extraction (4 | 4.6%).
Natural Resources, Construction and Maintenance Occupations by Sex
| Occupation | Male | Female |
| Farming, Fishing & Forestry | 0 (0.0%) | 0 (0.0%) |
| Construction & Extraction | 4 (100.0%) | 0 (0.0%) |
| Installation, Maintenance & Repair | 0 (0.0%) | 0 (0.0%) |
| Total (Category) | 4 (100.0%) | 0 (0.0%) |
| Total (Overall) | 39 (45.4%) | 47 (54.6%) |
Production, Transportation and Moving Occupations
The most common Production, Transportation and Moving occupations in Teller are Production (11 | 12.8%), Material Moving (4 | 4.6%), and Transportation (3 | 3.5%).
Production, Transportation and Moving Occupations by Sex
| Occupation | Male | Female |
| Production | 9 (81.8%) | 2 (18.2%) |
| Transportation | 3 (100.0%) | 0 (0.0%) |
| Material Moving | 4 (100.0%) | 0 (0.0%) |
| Total (Category) | 16 (88.9%) | 2 (11.1%) |
| Total (Overall) | 39 (45.4%) | 47 (54.6%) |
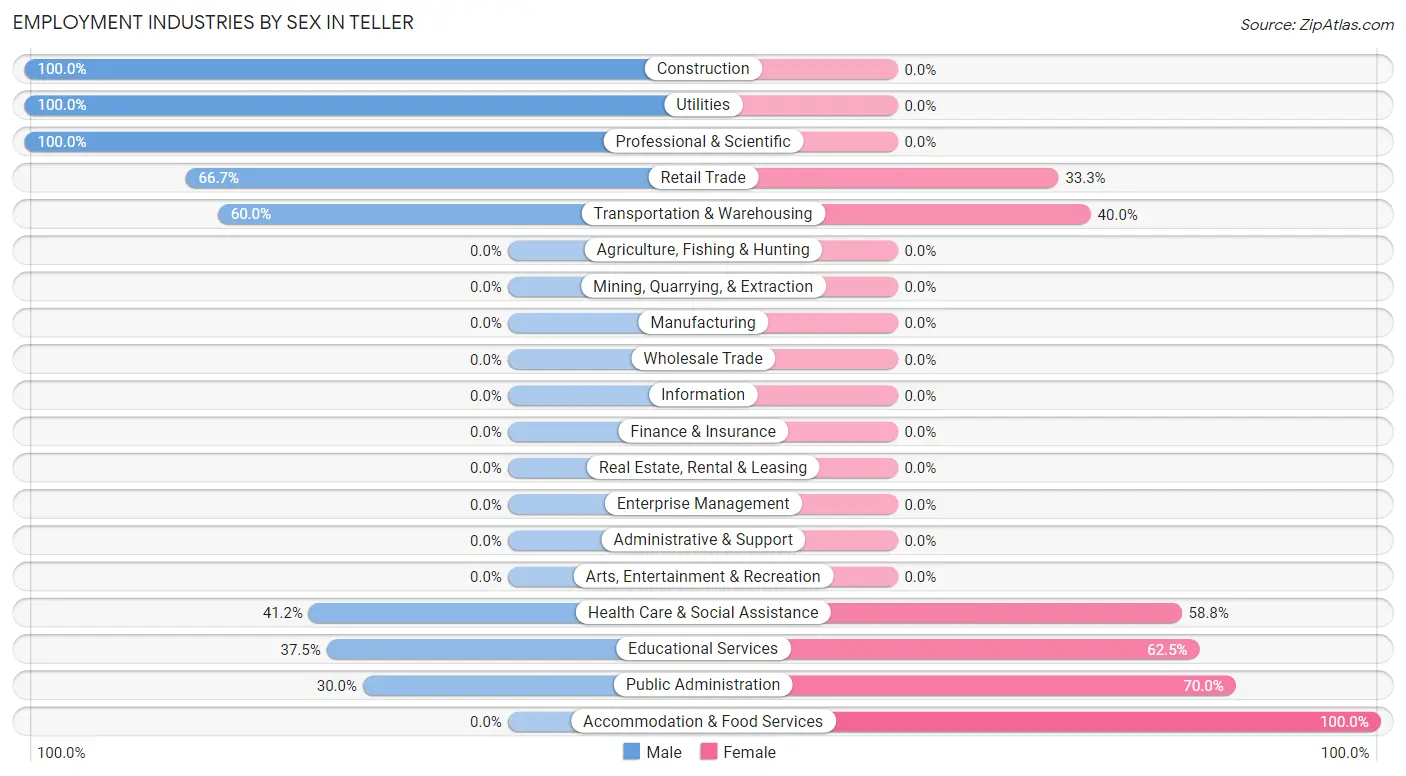
Employment Industries by Sex in Teller
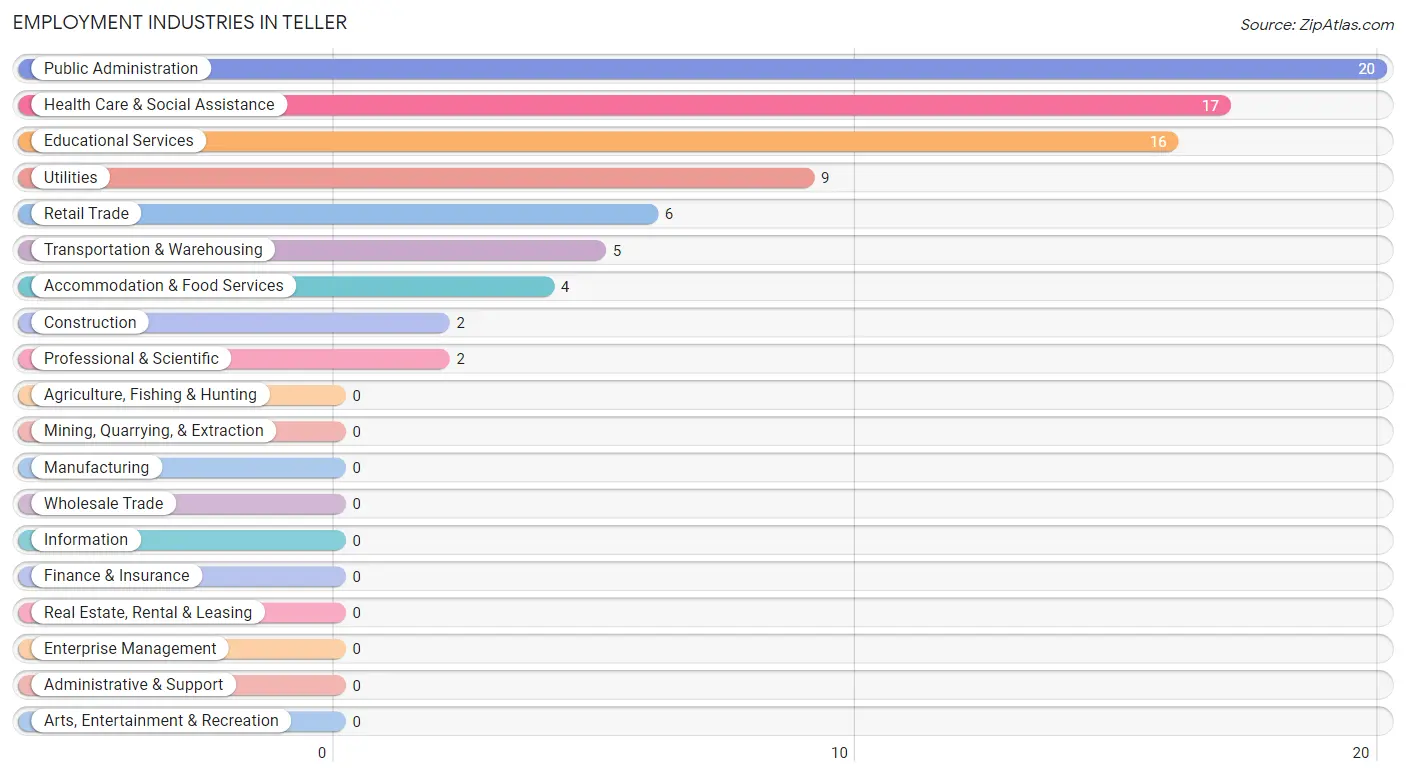
Employment Industries in Teller
The major employment industries in Teller include Public Administration (20 | 23.3%), Health Care & Social Assistance (17 | 19.8%), Educational Services (16 | 18.6%), Utilities (9 | 10.5%), and Retail Trade (6 | 7.0%).
Employment Industries by Sex in Teller
The Teller industries that see more men than women are Construction (100.0%), Utilities (100.0%), and Professional & Scientific (100.0%), whereas the industries that tend to have a higher number of women are Accommodation & Food Services (100.0%), Public Administration (70.0%), and Educational Services (62.5%).
| Industry | Male | Female |
| Agriculture, Fishing & Hunting | 0 (0.0%) | 0 (0.0%) |
| Mining, Quarrying, & Extraction | 0 (0.0%) | 0 (0.0%) |
| Construction | 2 (100.0%) | 0 (0.0%) |
| Manufacturing | 0 (0.0%) | 0 (0.0%) |
| Wholesale Trade | 0 (0.0%) | 0 (0.0%) |
| Retail Trade | 4 (66.7%) | 2 (33.3%) |
| Transportation & Warehousing | 3 (60.0%) | 2 (40.0%) |
| Utilities | 9 (100.0%) | 0 (0.0%) |
| Information | 0 (0.0%) | 0 (0.0%) |
| Finance & Insurance | 0 (0.0%) | 0 (0.0%) |
| Real Estate, Rental & Leasing | 0 (0.0%) | 0 (0.0%) |
| Professional & Scientific | 2 (100.0%) | 0 (0.0%) |
| Enterprise Management | 0 (0.0%) | 0 (0.0%) |
| Administrative & Support | 0 (0.0%) | 0 (0.0%) |
| Educational Services | 6 (37.5%) | 10 (62.5%) |
| Health Care & Social Assistance | 7 (41.2%) | 10 (58.8%) |
| Arts, Entertainment & Recreation | 0 (0.0%) | 0 (0.0%) |
| Accommodation & Food Services | 0 (0.0%) | 4 (100.0%) |
| Public Administration | 6 (30.0%) | 14 (70.0%) |
| Total | 39 (45.4%) | 47 (54.6%) |
Education in Teller
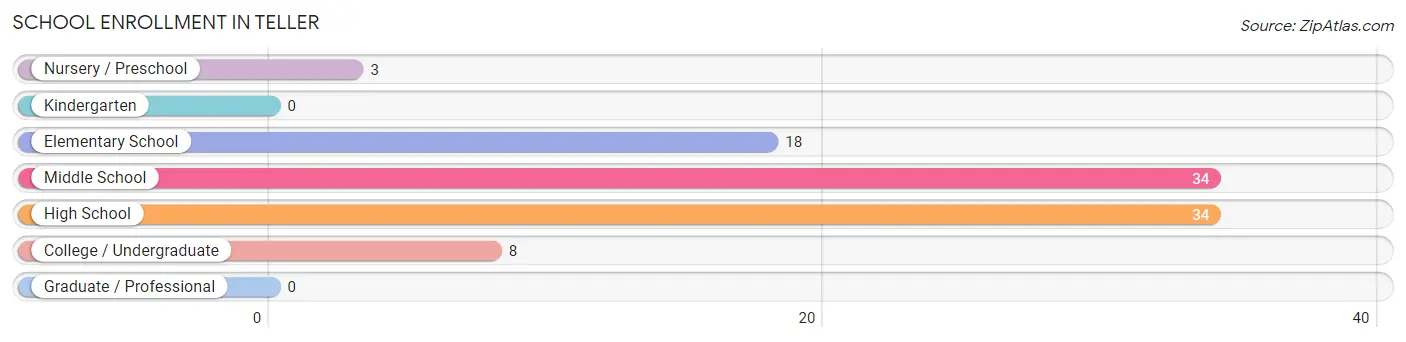
School Enrollment in Teller
The most common levels of schooling among the 97 students in Teller are middle school (34 | 35.0%), high school (34 | 35.0%), and elementary school (18 | 18.6%).
| School Level | # Students | % Students |
| Nursery / Preschool | 3 | 3.1% |
| Kindergarten | 0 | 0.0% |
| Elementary School | 18 | 18.6% |
| Middle School | 34 | 35.0% |
| High School | 34 | 35.0% |
| College / Undergraduate | 8 | 8.3% |
| Graduate / Professional | 0 | 0.0% |
| Total | 97 | 100.0% |
School Enrollment by Age by Funding Source in Teller
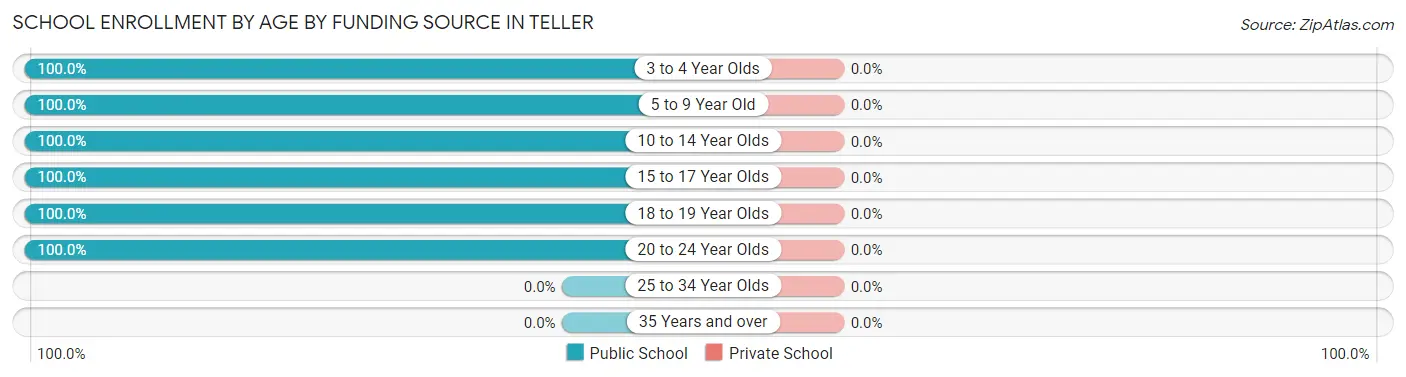
| Age Bracket | Public School | Private School |
| 3 to 4 Year Olds | 3 (100.0%) | 0 (0.0%) |
| 5 to 9 Year Old | 18 (100.0%) | 0 (0.0%) |
| 10 to 14 Year Olds | 39 (100.0%) | 0 (0.0%) |
| 15 to 17 Year Olds | 29 (100.0%) | 0 (0.0%) |
| 18 to 19 Year Olds | 5 (100.0%) | 0 (0.0%) |
| 20 to 24 Year Olds | 3 (100.0%) | 0 (0.0%) |
| 25 to 34 Year Olds | 0 (0.0%) | 0 (0.0%) |
| 35 Years and over | 0 (0.0%) | 0 (0.0%) |
| Total | 97 (100.0%) | 0 (0.0%) |
Educational Attainment by Field of Study in Teller
, and education (1 | 100.0%) are the most common fields of study among 1 individuals in Teller who have obtained a bachelor's degree or higher.
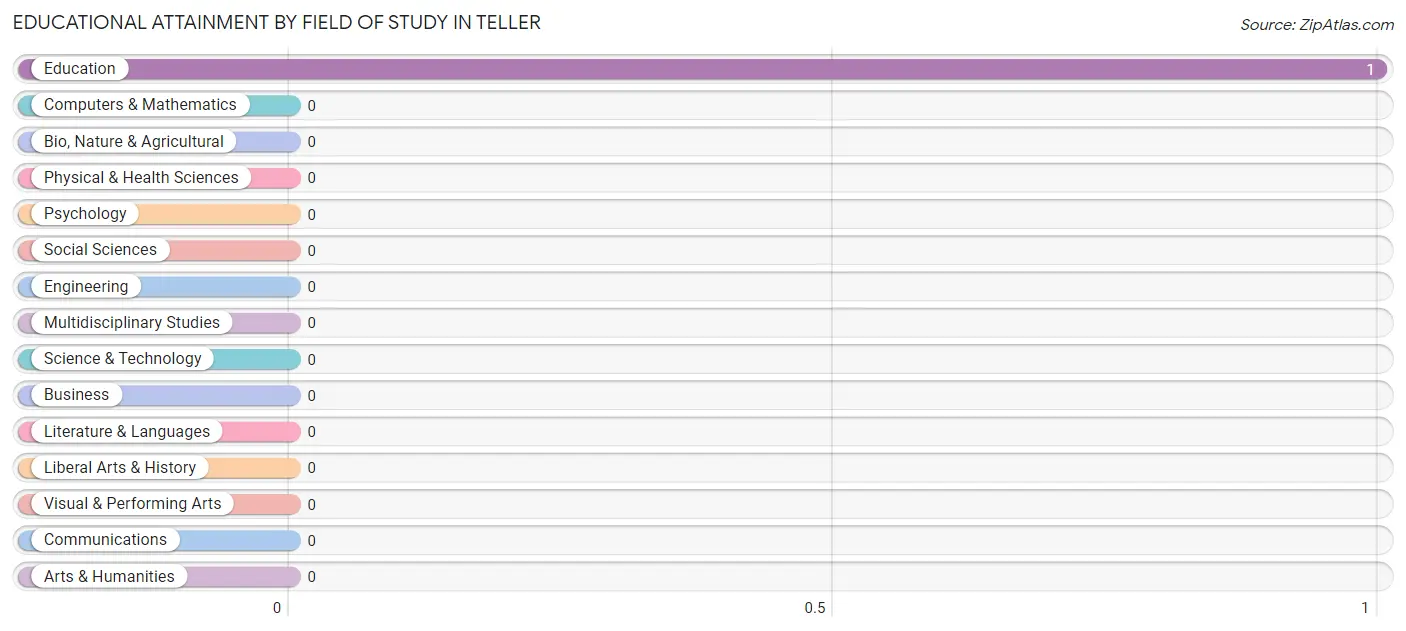
| Field of Study | # Graduates | % Graduates |
| Computers & Mathematics | 0 | 0.0% |
| Bio, Nature & Agricultural | 0 | 0.0% |
| Physical & Health Sciences | 0 | 0.0% |
| Psychology | 0 | 0.0% |
| Social Sciences | 0 | 0.0% |
| Engineering | 0 | 0.0% |
| Multidisciplinary Studies | 0 | 0.0% |
| Science & Technology | 0 | 0.0% |
| Business | 0 | 0.0% |
| Education | 1 | 100.0% |
| Literature & Languages | 0 | 0.0% |
| Liberal Arts & History | 0 | 0.0% |
| Visual & Performing Arts | 0 | 0.0% |
| Communications | 0 | 0.0% |
| Arts & Humanities | 0 | 0.0% |
| Total | 1 | 100.0% |
Transportation & Commute in Teller
Vehicle Availability by Sex in Teller
The most prevalent vehicle ownership categories in Teller are males with no vehicle (22, accounting for 56.4%) and females with no vehicle (30, making up 48.9%).
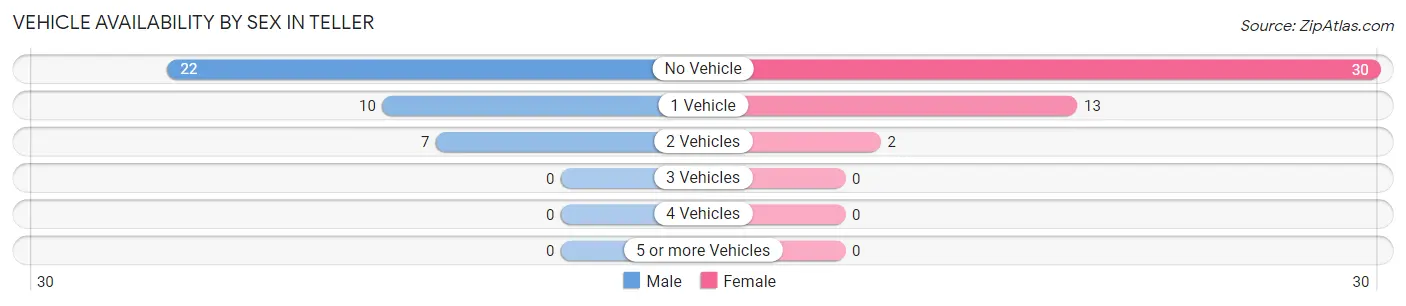
| Vehicles Available | Male | Female |
| No Vehicle | 22 (56.4%) | 30 (66.7%) |
| 1 Vehicle | 10 (25.6%) | 13 (28.9%) |
| 2 Vehicles | 7 (17.9%) | 2 (4.4%) |
| 3 Vehicles | 0 (0.0%) | 0 (0.0%) |
| 4 Vehicles | 0 (0.0%) | 0 (0.0%) |
| 5 or more Vehicles | 0 (0.0%) | 0 (0.0%) |
| Total | 39 (100.0%) | 45 (100.0%) |
Commute Time in Teller
The most frequently occuring commute durations in Teller are less than 5 minutes (43 commuters, 54.4%), 5 to 9 minutes (21 commuters, 26.6%), and 10 to 14 minutes (9 commuters, 11.4%).
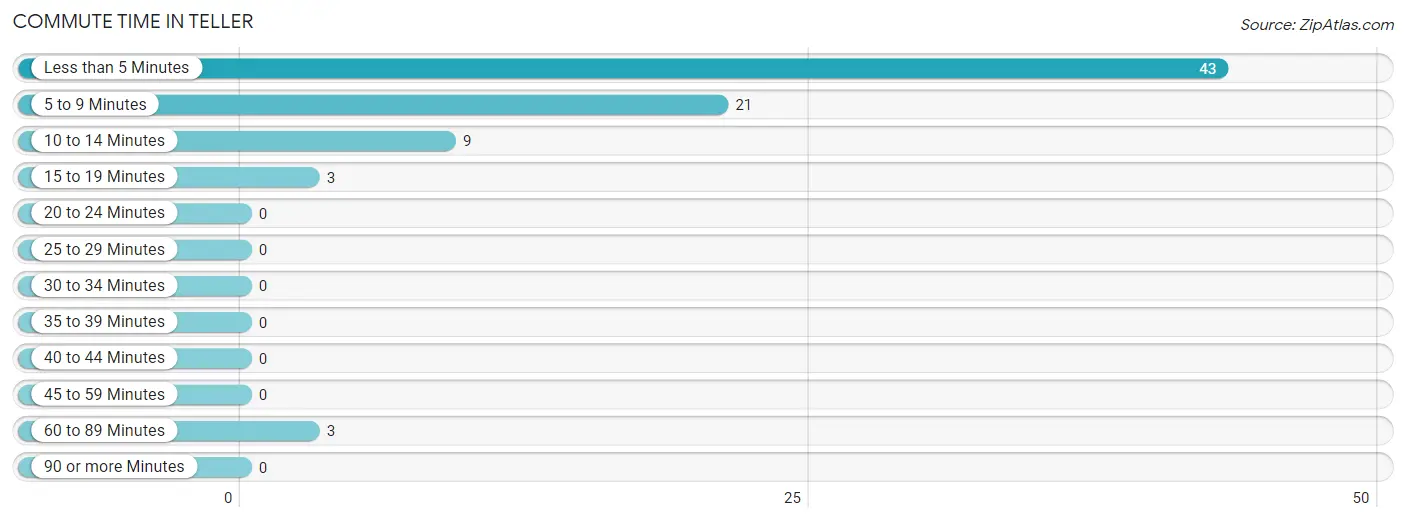
| Commute Time | # Commuters | % Commuters |
| Less than 5 Minutes | 43 | 54.4% |
| 5 to 9 Minutes | 21 | 26.6% |
| 10 to 14 Minutes | 9 | 11.4% |
| 15 to 19 Minutes | 3 | 3.8% |
| 20 to 24 Minutes | 0 | 0.0% |
| 25 to 29 Minutes | 0 | 0.0% |
| 30 to 34 Minutes | 0 | 0.0% |
| 35 to 39 Minutes | 0 | 0.0% |
| 40 to 44 Minutes | 0 | 0.0% |
| 45 to 59 Minutes | 0 | 0.0% |
| 60 to 89 Minutes | 3 | 3.8% |
| 90 or more Minutes | 0 | 0.0% |
Commute Time by Sex in Teller
The most common commute times in Teller are less than 5 minutes (23 commuters, 63.9%) for males and less than 5 minutes (20 commuters, 46.5%) for females.
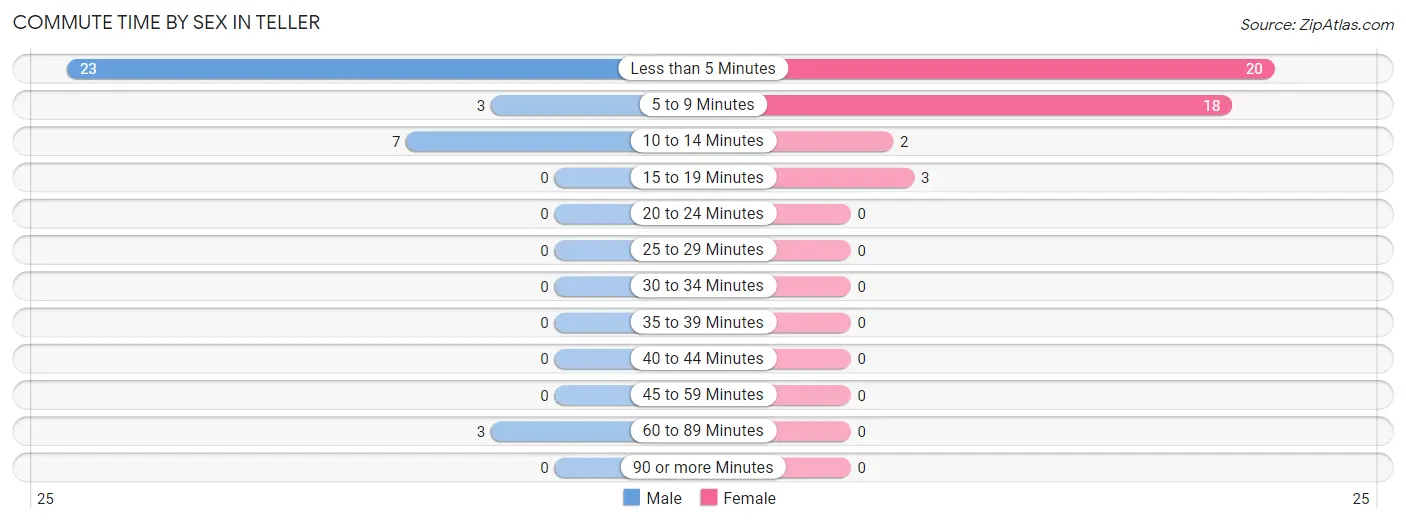
| Commute Time | Male | Female |
| Less than 5 Minutes | 23 (63.9%) | 20 (46.5%) |
| 5 to 9 Minutes | 3 (8.3%) | 18 (41.9%) |
| 10 to 14 Minutes | 7 (19.4%) | 2 (4.6%) |
| 15 to 19 Minutes | 0 (0.0%) | 3 (7.0%) |
| 20 to 24 Minutes | 0 (0.0%) | 0 (0.0%) |
| 25 to 29 Minutes | 0 (0.0%) | 0 (0.0%) |
| 30 to 34 Minutes | 0 (0.0%) | 0 (0.0%) |
| 35 to 39 Minutes | 0 (0.0%) | 0 (0.0%) |
| 40 to 44 Minutes | 0 (0.0%) | 0 (0.0%) |
| 45 to 59 Minutes | 0 (0.0%) | 0 (0.0%) |
| 60 to 89 Minutes | 3 (8.3%) | 0 (0.0%) |
| 90 or more Minutes | 0 (0.0%) | 0 (0.0%) |
Time of Departure to Work by Sex in Teller
The most frequent times of departure to work in Teller are 9:00 AM to 9:59 AM (18, 50.0%) for males and 8:30 AM to 8:59 AM (18, 41.9%) for females.
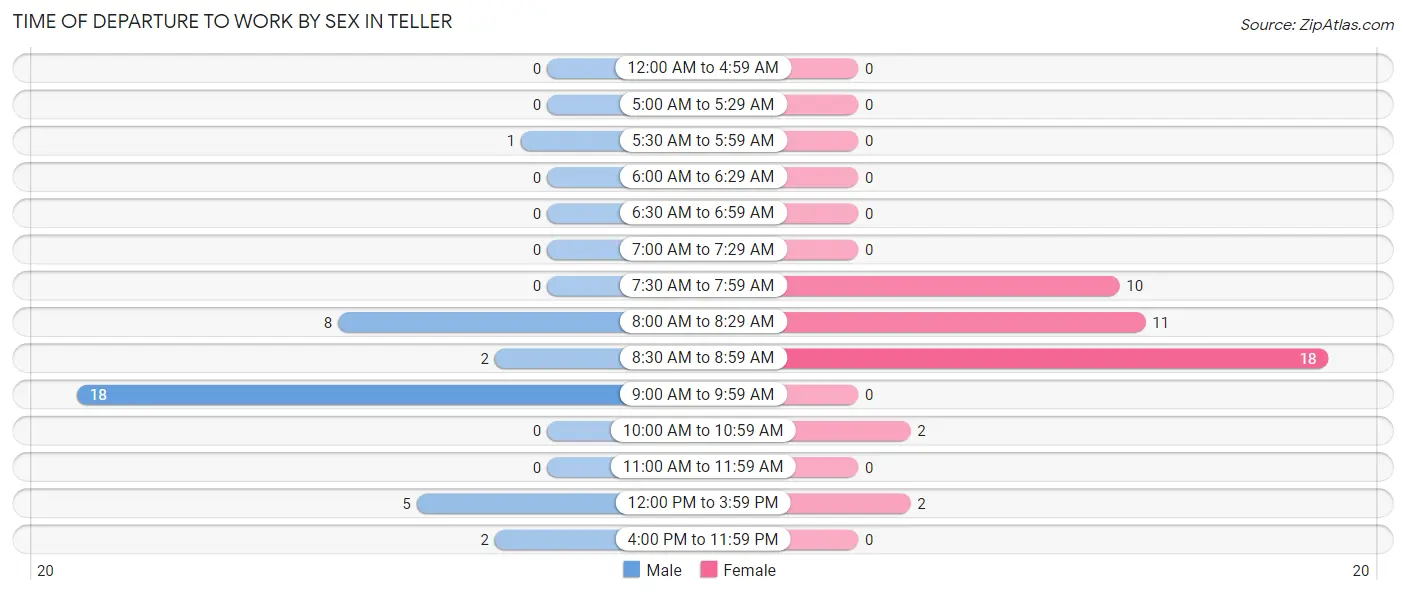
| Time of Departure | Male | Female |
| 12:00 AM to 4:59 AM | 0 (0.0%) | 0 (0.0%) |
| 5:00 AM to 5:29 AM | 0 (0.0%) | 0 (0.0%) |
| 5:30 AM to 5:59 AM | 1 (2.8%) | 0 (0.0%) |
| 6:00 AM to 6:29 AM | 0 (0.0%) | 0 (0.0%) |
| 6:30 AM to 6:59 AM | 0 (0.0%) | 0 (0.0%) |
| 7:00 AM to 7:29 AM | 0 (0.0%) | 0 (0.0%) |
| 7:30 AM to 7:59 AM | 0 (0.0%) | 10 (23.3%) |
| 8:00 AM to 8:29 AM | 8 (22.2%) | 11 (25.6%) |
| 8:30 AM to 8:59 AM | 2 (5.6%) | 18 (41.9%) |
| 9:00 AM to 9:59 AM | 18 (50.0%) | 0 (0.0%) |
| 10:00 AM to 10:59 AM | 0 (0.0%) | 2 (4.6%) |
| 11:00 AM to 11:59 AM | 0 (0.0%) | 0 (0.0%) |
| 12:00 PM to 3:59 PM | 5 (13.9%) | 2 (4.6%) |
| 4:00 PM to 11:59 PM | 2 (5.6%) | 0 (0.0%) |
| Total | 36 (100.0%) | 43 (100.0%) |
Housing Occupancy in Teller
Occupancy by Ownership in Teller
Of the total 89 dwellings in Teller, owner-occupied units account for 53 (59.6%), while renter-occupied units make up 36 (40.5%).
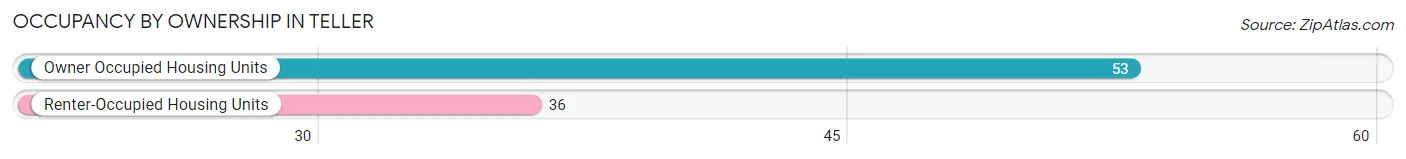
| Occupancy | # Housing Units | % Housing Units |
| Owner Occupied Housing Units | 53 | 59.6% |
| Renter-Occupied Housing Units | 36 | 40.5% |
| Total Occupied Housing Units | 89 | 100.0% |
Occupancy by Household Size in Teller
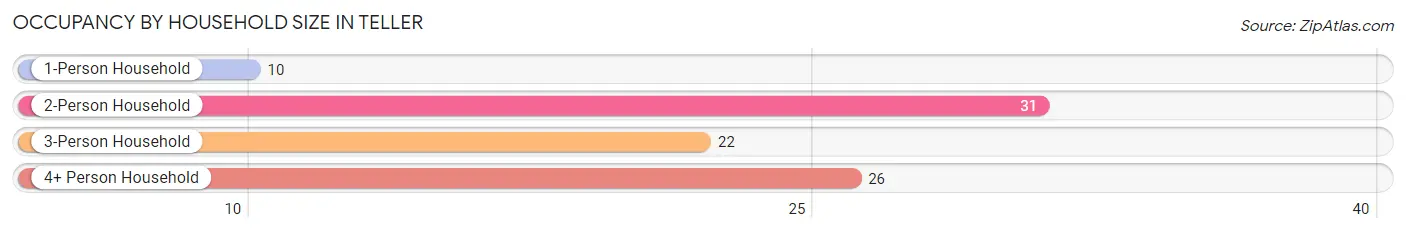
| Household Size | # Housing Units | % Housing Units |
| 1-Person Household | 10 | 11.2% |
| 2-Person Household | 31 | 34.8% |
| 3-Person Household | 22 | 24.7% |
| 4+ Person Household | 26 | 29.2% |
| Total Housing Units | 89 | 100.0% |
Occupancy by Ownership by Household Size in Teller
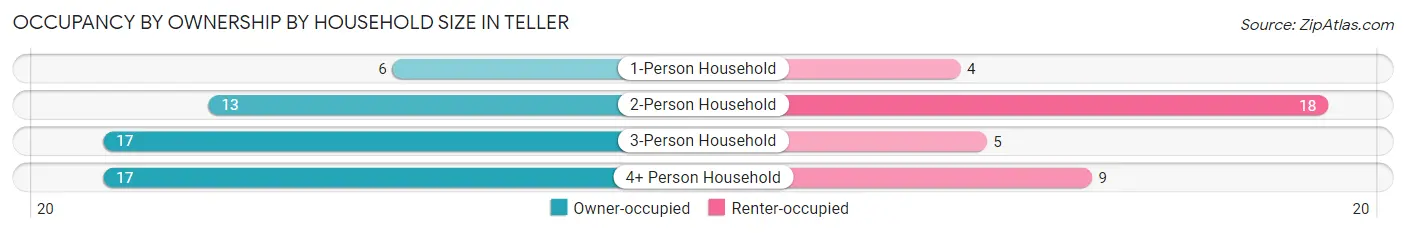
| Household Size | Owner-occupied | Renter-occupied |
| 1-Person Household | 6 (60.0%) | 4 (40.0%) |
| 2-Person Household | 13 (41.9%) | 18 (58.1%) |
| 3-Person Household | 17 (77.3%) | 5 (22.7%) |
| 4+ Person Household | 17 (65.4%) | 9 (34.6%) |
| Total Housing Units | 53 (59.6%) | 36 (40.5%) |
Occupancy by Educational Attainment in Teller
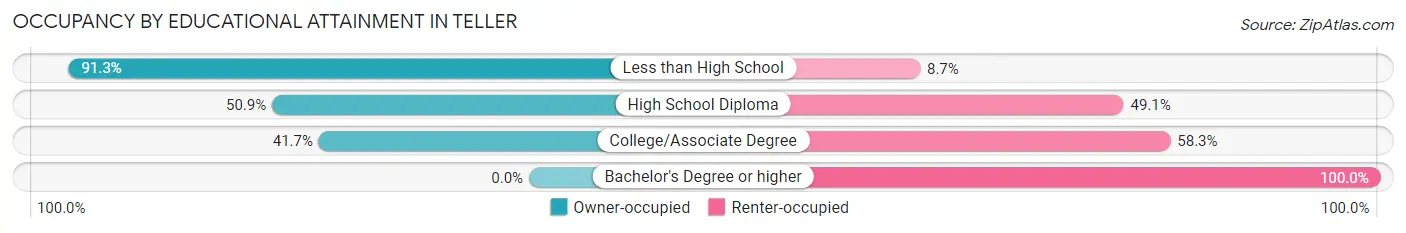
| Household Size | Owner-occupied | Renter-occupied |
| Less than High School | 21 (91.3%) | 2 (8.7%) |
| High School Diploma | 27 (50.9%) | 26 (49.1%) |
| College/Associate Degree | 5 (41.7%) | 7 (58.3%) |
| Bachelor's Degree or higher | 0 (0.0%) | 1 (100.0%) |
Occupancy by Age of Householder in Teller
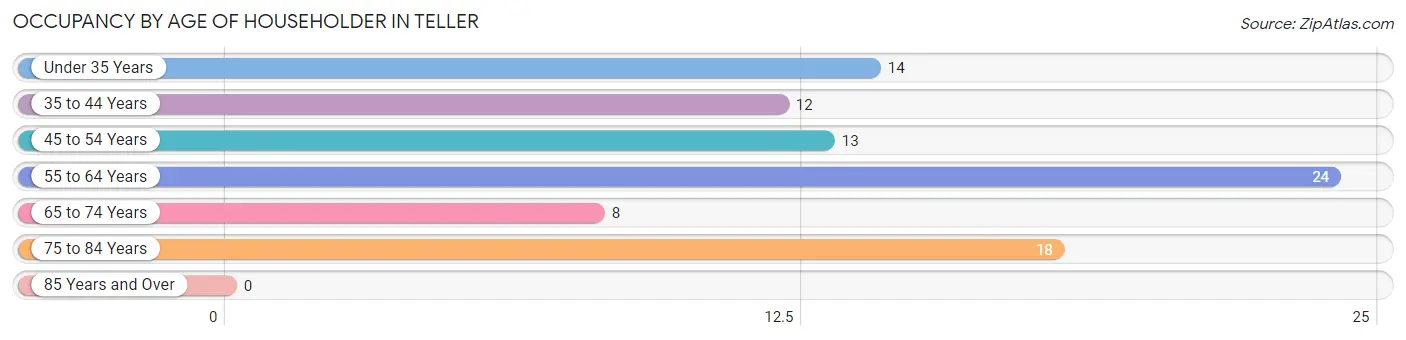
| Age Bracket | # Households | % Households |
| Under 35 Years | 14 | 15.7% |
| 35 to 44 Years | 12 | 13.5% |
| 45 to 54 Years | 13 | 14.6% |
| 55 to 64 Years | 24 | 27.0% |
| 65 to 74 Years | 8 | 9.0% |
| 75 to 84 Years | 18 | 20.2% |
| 85 Years and Over | 0 | 0.0% |
| Total | 89 | 100.0% |
Housing Finances in Teller
Median Income by Occupancy in Teller
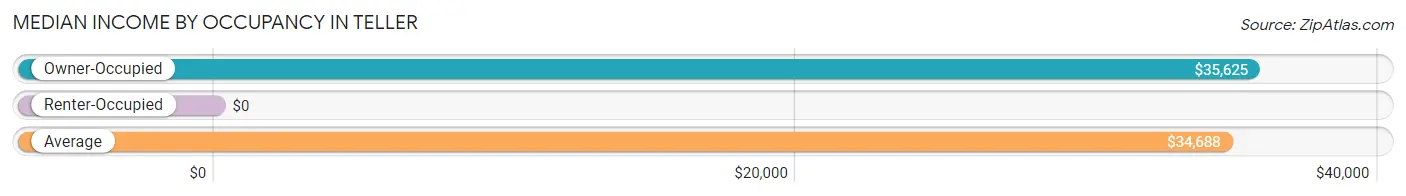
| Occupancy Type | # Households | Median Income |
| Owner-Occupied | 53 (59.6%) | $35,625 |
| Renter-Occupied | 36 (40.5%) | $0 |
| Average | 89 (100.0%) | $34,688 |
Occupancy by Householder Income Bracket in Teller
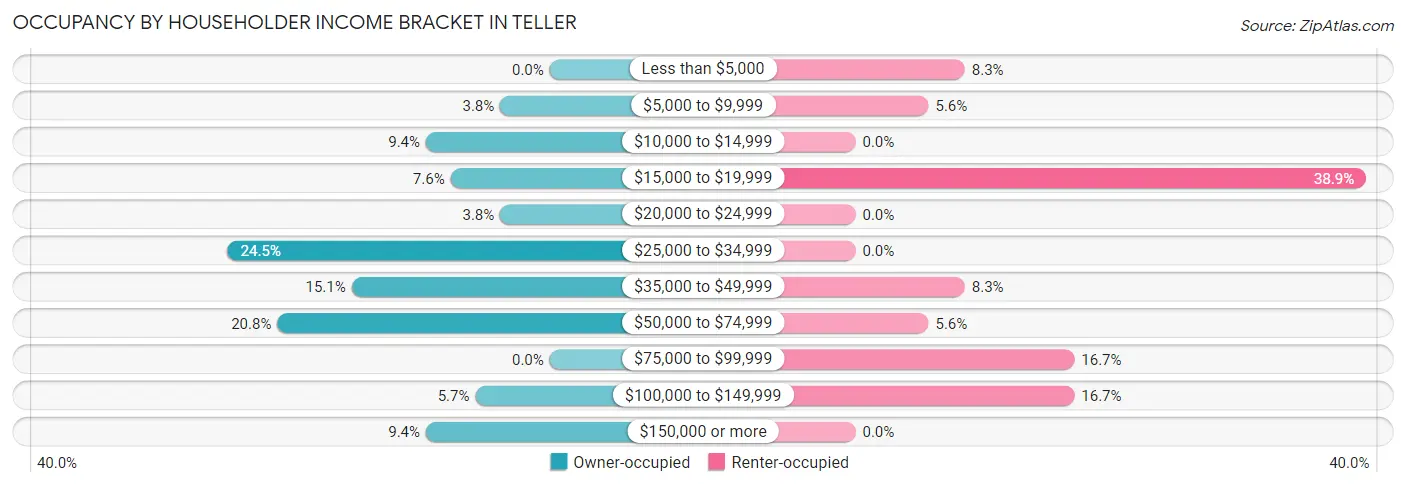
| Income Bracket | Owner-occupied | Renter-occupied |
| Less than $5,000 | 0 (0.0%) | 3 (8.3%) |
| $5,000 to $9,999 | 2 (3.8%) | 2 (5.6%) |
| $10,000 to $14,999 | 5 (9.4%) | 0 (0.0%) |
| $15,000 to $19,999 | 4 (7.5%) | 14 (38.9%) |
| $20,000 to $24,999 | 2 (3.8%) | 0 (0.0%) |
| $25,000 to $34,999 | 13 (24.5%) | 0 (0.0%) |
| $35,000 to $49,999 | 8 (15.1%) | 3 (8.3%) |
| $50,000 to $74,999 | 11 (20.7%) | 2 (5.6%) |
| $75,000 to $99,999 | 0 (0.0%) | 6 (16.7%) |
| $100,000 to $149,999 | 3 (5.7%) | 6 (16.7%) |
| $150,000 or more | 5 (9.4%) | 0 (0.0%) |
| Total | 53 (100.0%) | 36 (100.0%) |
Monthly Housing Cost Tiers in Teller
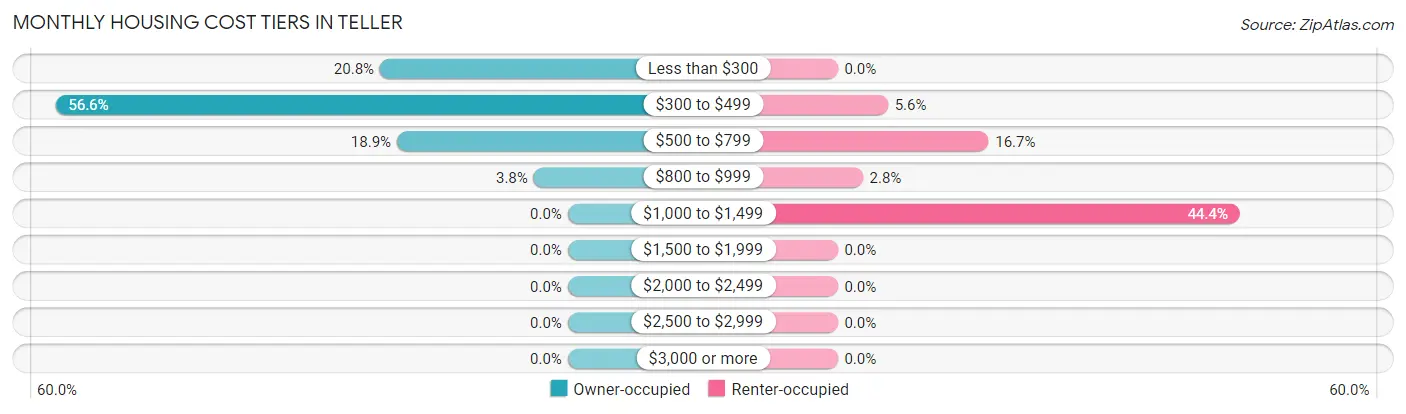
| Monthly Cost | Owner-occupied | Renter-occupied |
| Less than $300 | 11 (20.7%) | 0 (0.0%) |
| $300 to $499 | 30 (56.6%) | 2 (5.6%) |
| $500 to $799 | 10 (18.9%) | 6 (16.7%) |
| $800 to $999 | 2 (3.8%) | 1 (2.8%) |
| $1,000 to $1,499 | 0 (0.0%) | 16 (44.4%) |
| $1,500 to $1,999 | 0 (0.0%) | 0 (0.0%) |
| $2,000 to $2,499 | 0 (0.0%) | 0 (0.0%) |
| $2,500 to $2,999 | 0 (0.0%) | 0 (0.0%) |
| $3,000 or more | 0 (0.0%) | 0 (0.0%) |
| Total | 53 (100.0%) | 36 (100.0%) |
Physical Housing Characteristics in Teller
Housing Structures in Teller
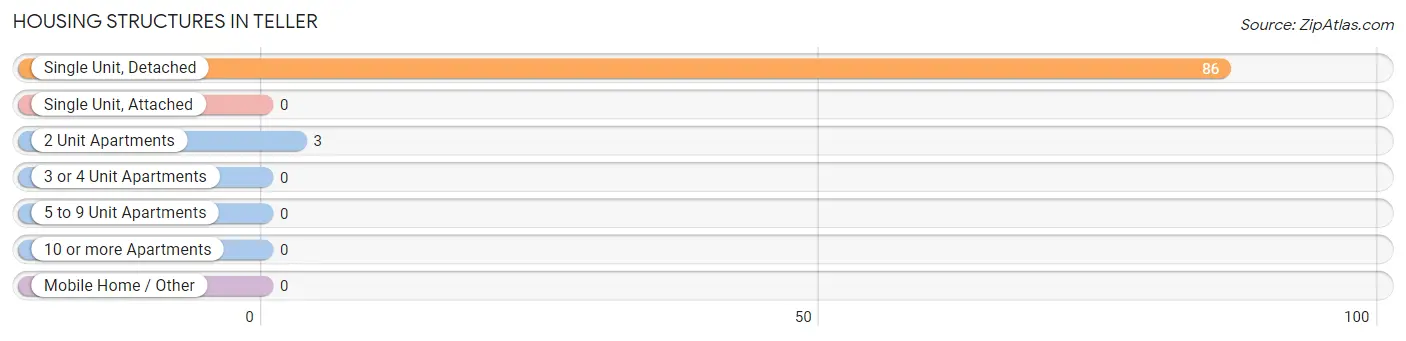
| Structure Type | # Housing Units | % Housing Units |
| Single Unit, Detached | 86 | 96.6% |
| Single Unit, Attached | 0 | 0.0% |
| 2 Unit Apartments | 3 | 3.4% |
| 3 or 4 Unit Apartments | 0 | 0.0% |
| 5 to 9 Unit Apartments | 0 | 0.0% |
| 10 or more Apartments | 0 | 0.0% |
| Mobile Home / Other | 0 | 0.0% |
| Total | 89 | 100.0% |
Housing Structures by Occupancy in Teller
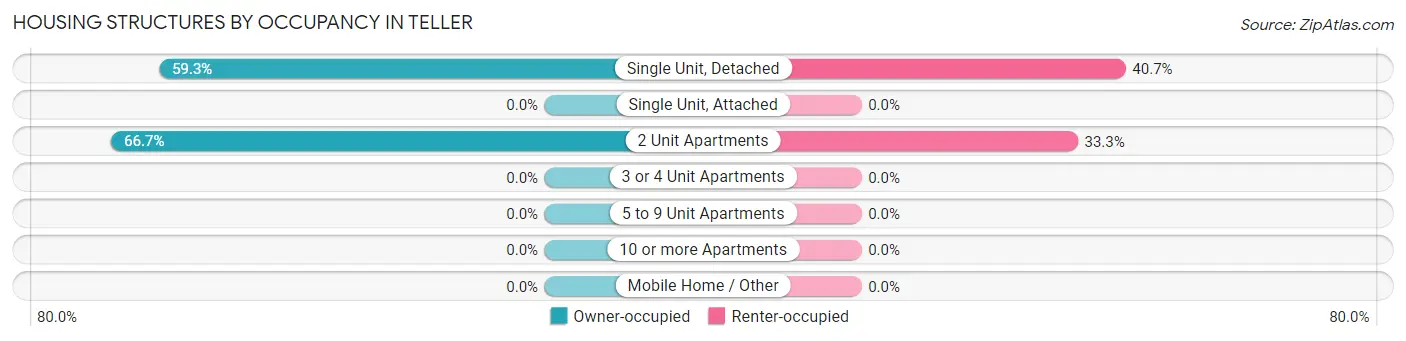
| Structure Type | Owner-occupied | Renter-occupied |
| Single Unit, Detached | 51 (59.3%) | 35 (40.7%) |
| Single Unit, Attached | 0 (0.0%) | 0 (0.0%) |
| 2 Unit Apartments | 2 (66.7%) | 1 (33.3%) |
| 3 or 4 Unit Apartments | 0 (0.0%) | 0 (0.0%) |
| 5 to 9 Unit Apartments | 0 (0.0%) | 0 (0.0%) |
| 10 or more Apartments | 0 (0.0%) | 0 (0.0%) |
| Mobile Home / Other | 0 (0.0%) | 0 (0.0%) |
| Total | 53 (59.6%) | 36 (40.5%) |
Housing Structures by Number of Rooms in Teller
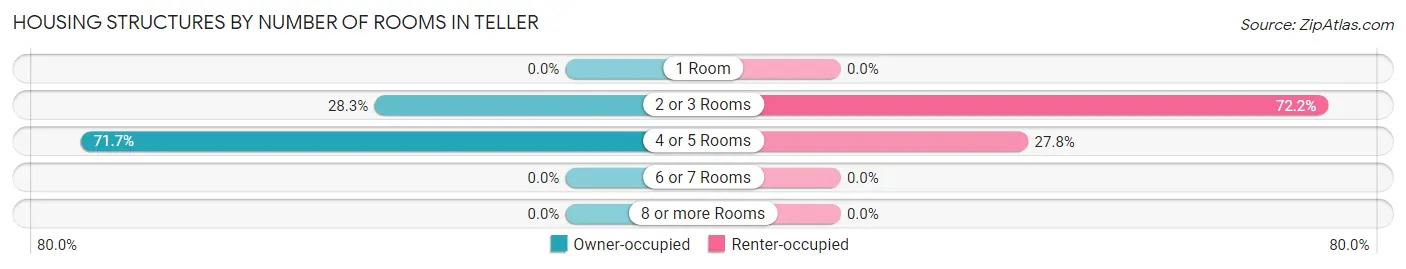
| Number of Rooms | Owner-occupied | Renter-occupied |
| 1 Room | 0 (0.0%) | 0 (0.0%) |
| 2 or 3 Rooms | 15 (28.3%) | 26 (72.2%) |
| 4 or 5 Rooms | 38 (71.7%) | 10 (27.8%) |
| 6 or 7 Rooms | 0 (0.0%) | 0 (0.0%) |
| 8 or more Rooms | 0 (0.0%) | 0 (0.0%) |
| Total | 53 (100.0%) | 36 (100.0%) |
Housing Structure by Heating Type in Teller
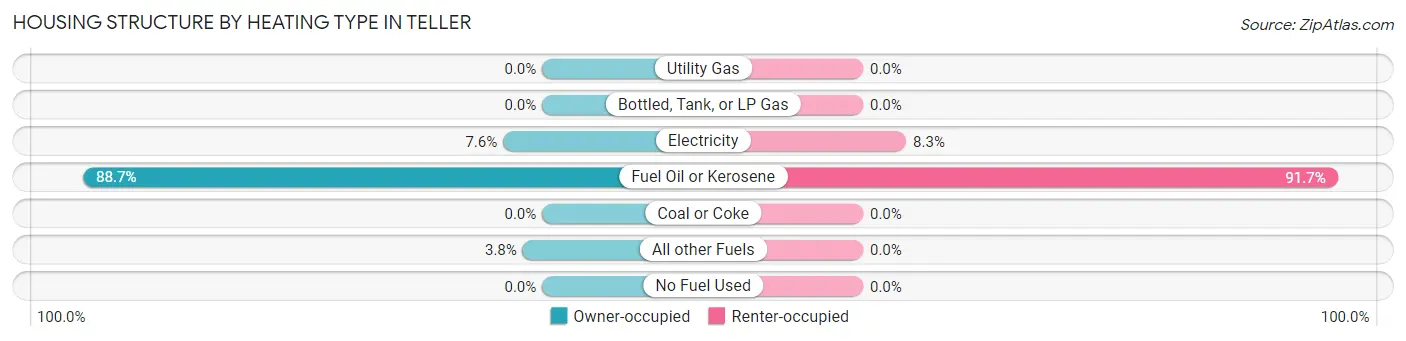
| Heating Type | Owner-occupied | Renter-occupied |
| Utility Gas | 0 (0.0%) | 0 (0.0%) |
| Bottled, Tank, or LP Gas | 0 (0.0%) | 0 (0.0%) |
| Electricity | 4 (7.5%) | 3 (8.3%) |
| Fuel Oil or Kerosene | 47 (88.7%) | 33 (91.7%) |
| Coal or Coke | 0 (0.0%) | 0 (0.0%) |
| All other Fuels | 2 (3.8%) | 0 (0.0%) |
| No Fuel Used | 0 (0.0%) | 0 (0.0%) |
| Total | 53 (100.0%) | 36 (100.0%) |
Household Vehicle Usage in Teller
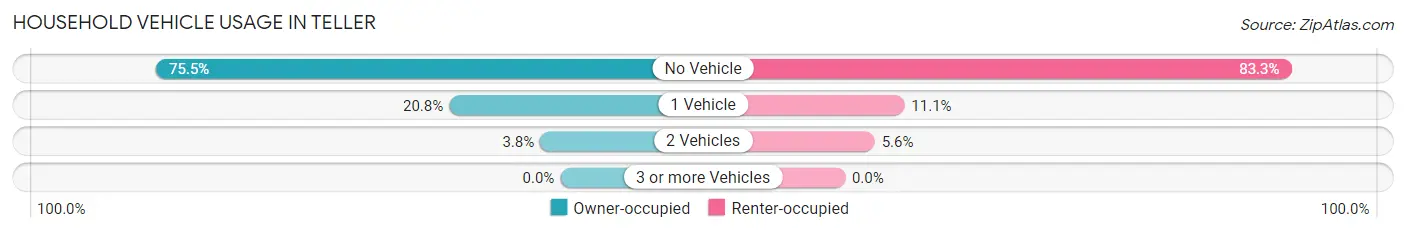
| Vehicles per Household | Owner-occupied | Renter-occupied |
| No Vehicle | 40 (75.5%) | 30 (83.3%) |
| 1 Vehicle | 11 (20.7%) | 4 (11.1%) |
| 2 Vehicles | 2 (3.8%) | 2 (5.6%) |
| 3 or more Vehicles | 0 (0.0%) | 0 (0.0%) |
| Total | 53 (100.0%) | 36 (100.0%) |
Real Estate & Mortgages in Teller
Real Estate and Mortgage Overview in Teller
| Characteristic | Without Mortgage | With Mortgage |
| Housing Units | 49 | 4 |
| Median Property Value | $111,300 | $0 |
| Median Household Income | $35,625 | $0 |
| Monthly Housing Costs | $388 | $0 |
| Real Estate Taxes | - | - |
Property Value by Mortgage Status in Teller
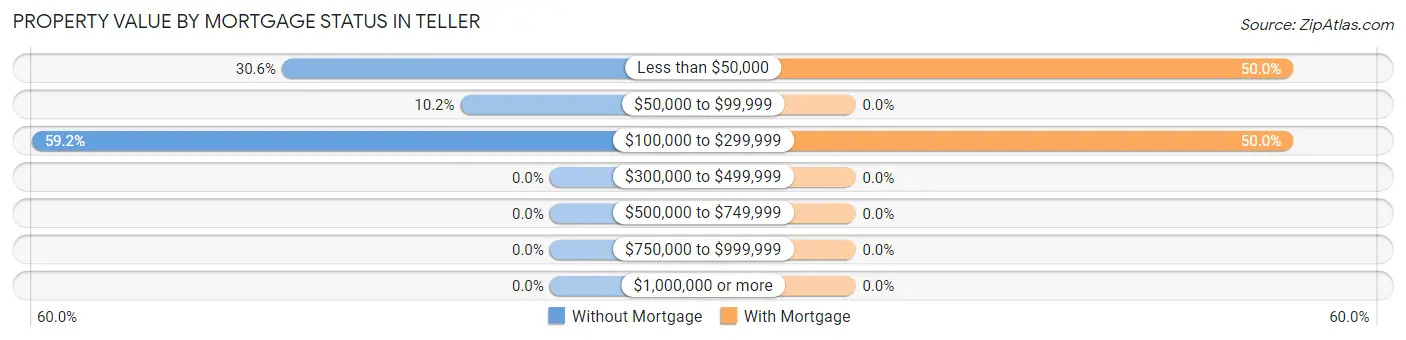
| Property Value | Without Mortgage | With Mortgage |
| Less than $50,000 | 15 (30.6%) | 2 (50.0%) |
| $50,000 to $99,999 | 5 (10.2%) | 0 (0.0%) |
| $100,000 to $299,999 | 29 (59.2%) | 2 (50.0%) |
| $300,000 to $499,999 | 0 (0.0%) | 0 (0.0%) |
| $500,000 to $749,999 | 0 (0.0%) | 0 (0.0%) |
| $750,000 to $999,999 | 0 (0.0%) | 0 (0.0%) |
| $1,000,000 or more | 0 (0.0%) | 0 (0.0%) |
| Total | 49 (100.0%) | 4 (100.0%) |
Household Income by Mortgage Status in Teller
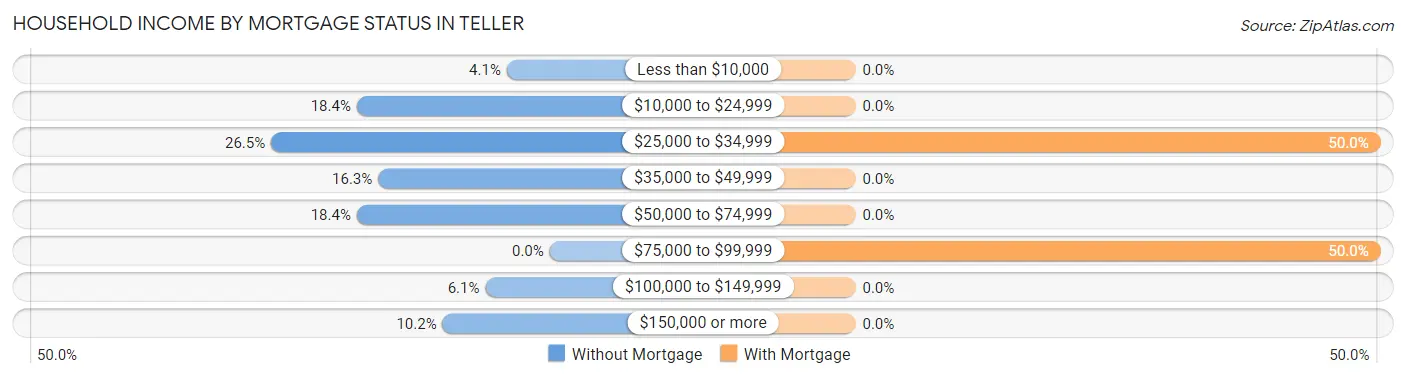
| Household Income | Without Mortgage | With Mortgage |
| Less than $10,000 | 2 (4.1%) | 0 (0.0%) |
| $10,000 to $24,999 | 9 (18.4%) | 0 (0.0%) |
| $25,000 to $34,999 | 13 (26.5%) | 2 (50.0%) |
| $35,000 to $49,999 | 8 (16.3%) | 0 (0.0%) |
| $50,000 to $74,999 | 9 (18.4%) | 0 (0.0%) |
| $75,000 to $99,999 | 0 (0.0%) | 2 (50.0%) |
| $100,000 to $149,999 | 3 (6.1%) | 0 (0.0%) |
| $150,000 or more | 5 (10.2%) | 0 (0.0%) |
| Total | 49 (100.0%) | 4 (100.0%) |
Property Value to Household Income Ratio in Teller
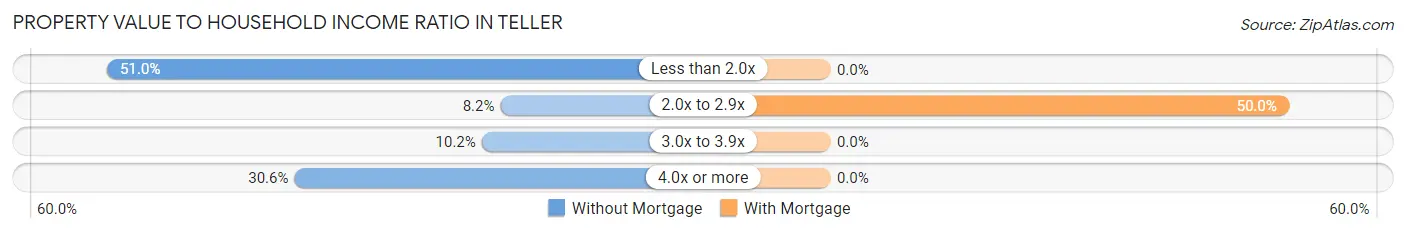
| Value-to-Income Ratio | Without Mortgage | With Mortgage |
| Less than 2.0x | 25 (51.0%) | 0 (0.0%) |
| 2.0x to 2.9x | 4 (8.2%) | 2 (50.0%) |
| 3.0x to 3.9x | 5 (10.2%) | 0 (0.0%) |
| 4.0x or more | 15 (30.6%) | 0 (0.0%) |
| Total | 49 (100.0%) | 4 (100.0%) |
Real Estate Taxes by Mortgage Status in Teller
| Property Taxes | Without Mortgage | With Mortgage |
| Less than $800 | 0 (0.0%) | 0 (0.0%) |
| $800 to $1,499 | 0 (0.0%) | 0 (0.0%) |
| $800 to $1,499 | 0 (0.0%) | 0 (0.0%) |
| Total | 49 (100.0%) | 4 (100.0%) |
Health & Disability in Teller
Health Insurance Coverage by Age in Teller
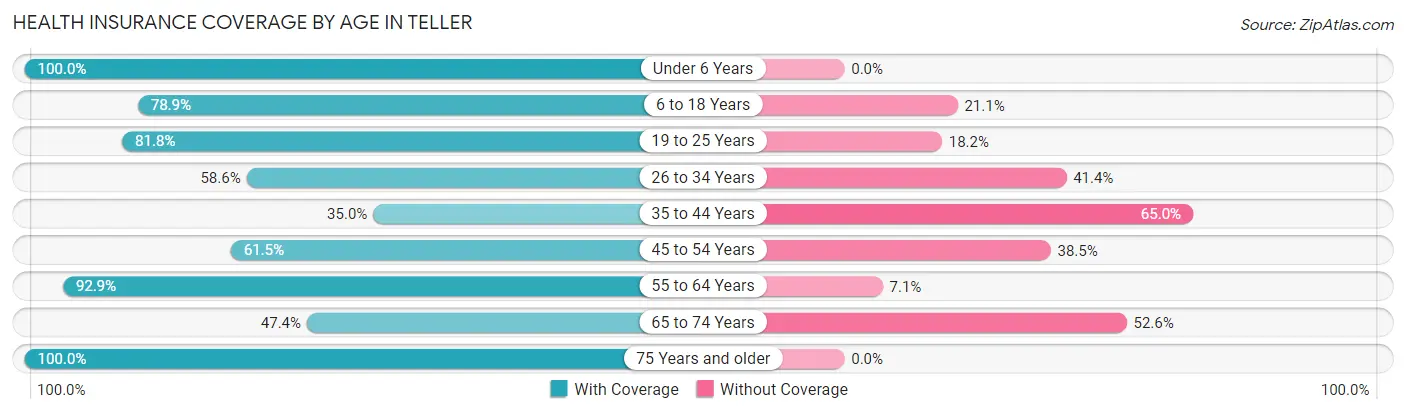
| Age Bracket | With Coverage | Without Coverage |
| Under 6 Years | 6 (100.0%) | 0 (0.0%) |
| 6 to 18 Years | 71 (78.9%) | 19 (21.1%) |
| 19 to 25 Years | 27 (81.8%) | 6 (18.2%) |
| 26 to 34 Years | 17 (58.6%) | 12 (41.4%) |
| 35 to 44 Years | 7 (35.0%) | 13 (65.0%) |
| 45 to 54 Years | 16 (61.5%) | 10 (38.5%) |
| 55 to 64 Years | 26 (92.9%) | 2 (7.1%) |
| 65 to 74 Years | 9 (47.4%) | 10 (52.6%) |
| 75 Years and older | 28 (100.0%) | 0 (0.0%) |
| Total | 207 (74.2%) | 72 (25.8%) |
Health Insurance Coverage by Citizenship Status in Teller
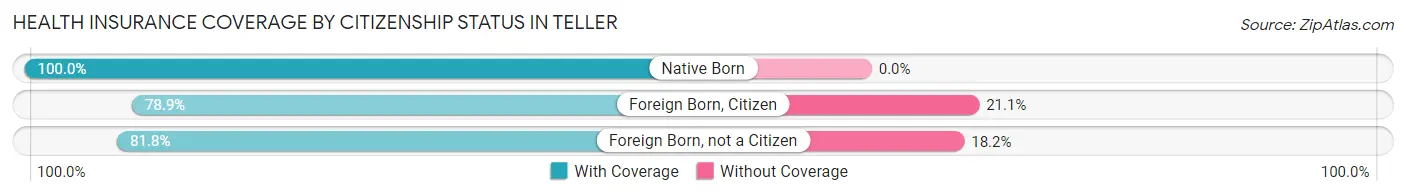
| Citizenship Status | With Coverage | Without Coverage |
| Native Born | 6 (100.0%) | 0 (0.0%) |
| Foreign Born, Citizen | 71 (78.9%) | 19 (21.1%) |
| Foreign Born, not a Citizen | 27 (81.8%) | 6 (18.2%) |
Health Insurance Coverage by Household Income in Teller
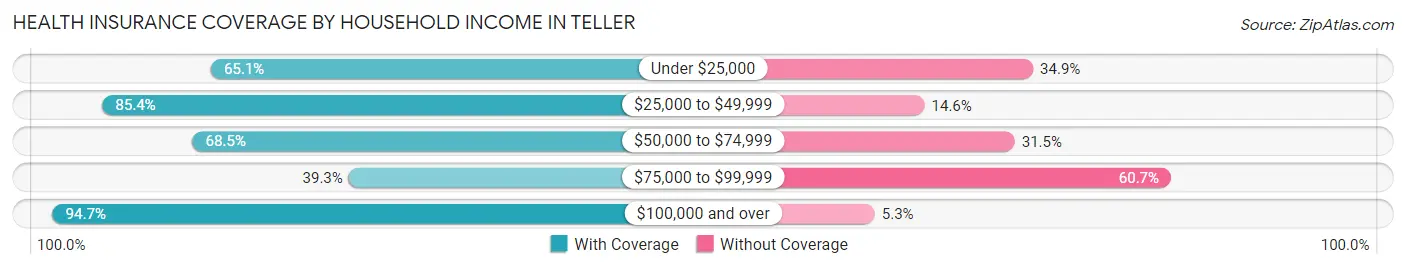
| Household Income | With Coverage | Without Coverage |
| Under $25,000 | 41 (65.1%) | 22 (34.9%) |
| $25,000 to $49,999 | 82 (85.4%) | 14 (14.6%) |
| $50,000 to $74,999 | 37 (68.5%) | 17 (31.5%) |
| $75,000 to $99,999 | 11 (39.3%) | 17 (60.7%) |
| $100,000 and over | 36 (94.7%) | 2 (5.3%) |
Public vs Private Health Insurance Coverage by Age in Teller
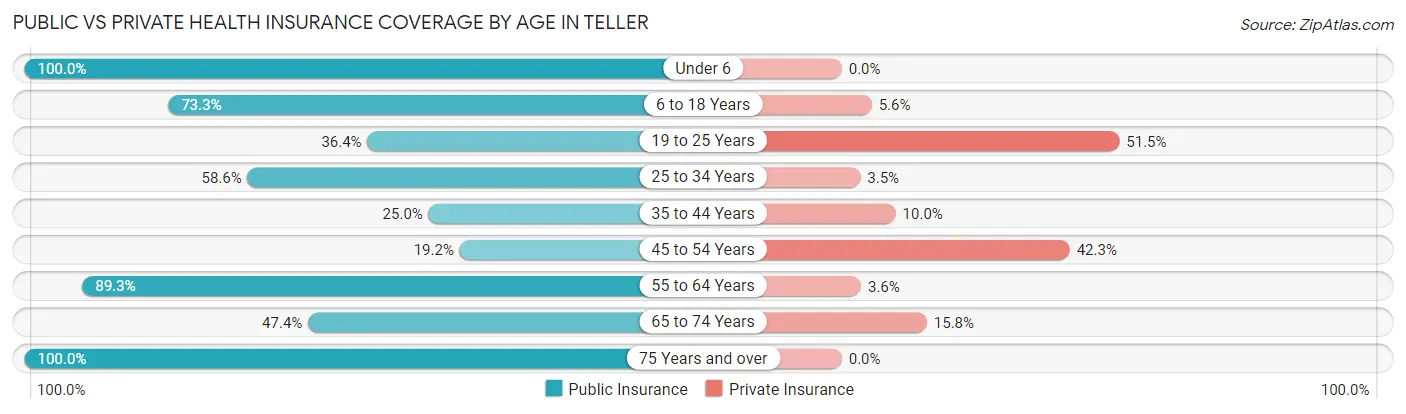
| Age Bracket | Public Insurance | Private Insurance |
| Under 6 | 6 (100.0%) | 0 (0.0%) |
| 6 to 18 Years | 66 (73.3%) | 5 (5.6%) |
| 19 to 25 Years | 12 (36.4%) | 17 (51.5%) |
| 25 to 34 Years | 17 (58.6%) | 1 (3.5%) |
| 35 to 44 Years | 5 (25.0%) | 2 (10.0%) |
| 45 to 54 Years | 5 (19.2%) | 11 (42.3%) |
| 55 to 64 Years | 25 (89.3%) | 1 (3.6%) |
| 65 to 74 Years | 9 (47.4%) | 3 (15.8%) |
| 75 Years and over | 28 (100.0%) | 0 (0.0%) |
| Total | 173 (62.0%) | 40 (14.3%) |
Disability Status by Sex by Age in Teller
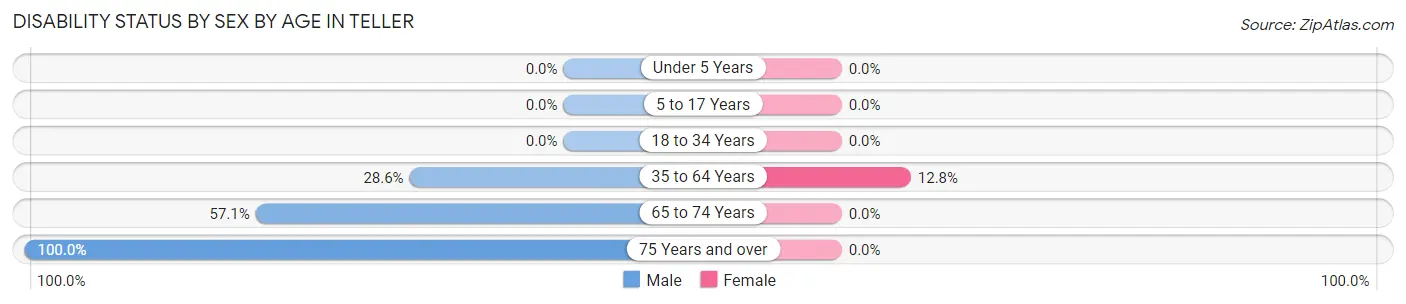
| Age Bracket | Male | Female |
| Under 5 Years | 0 (0.0%) | 0 (0.0%) |
| 5 to 17 Years | 0 (0.0%) | 0 (0.0%) |
| 18 to 34 Years | 0 (0.0%) | 0 (0.0%) |
| 35 to 64 Years | 10 (28.6%) | 5 (12.8%) |
| 65 to 74 Years | 4 (57.1%) | 0 (0.0%) |
| 75 Years and over | 10 (100.0%) | 0 (0.0%) |
Disability Class by Sex by Age in Teller
Disability Class: Hearing Difficulty
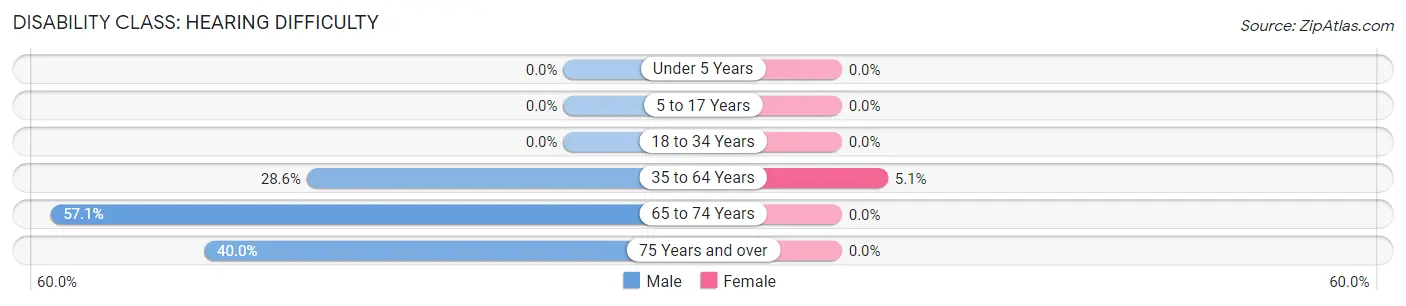
| Age Bracket | Male | Female |
| Under 5 Years | 0 (0.0%) | 0 (0.0%) |
| 5 to 17 Years | 0 (0.0%) | 0 (0.0%) |
| 18 to 34 Years | 0 (0.0%) | 0 (0.0%) |
| 35 to 64 Years | 10 (28.6%) | 2 (5.1%) |
| 65 to 74 Years | 4 (57.1%) | 0 (0.0%) |
| 75 Years and over | 4 (40.0%) | 0 (0.0%) |
Disability Class: Vision Difficulty
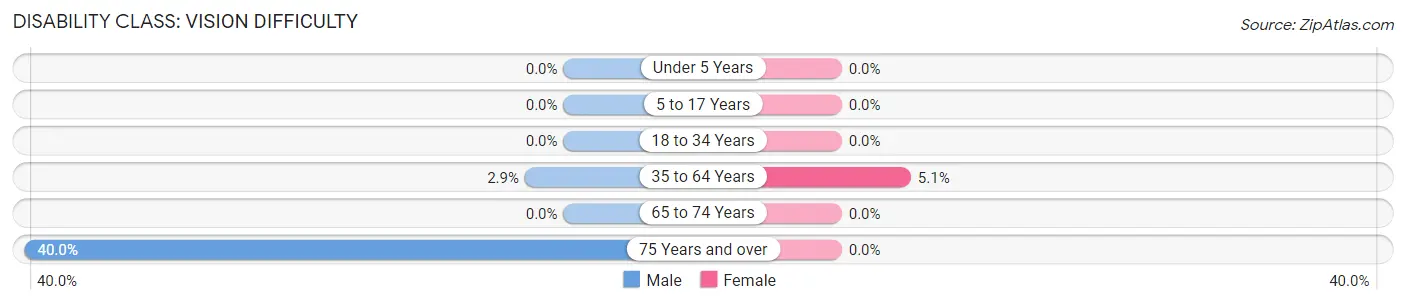
| Age Bracket | Male | Female |
| Under 5 Years | 0 (0.0%) | 0 (0.0%) |
| 5 to 17 Years | 0 (0.0%) | 0 (0.0%) |
| 18 to 34 Years | 0 (0.0%) | 0 (0.0%) |
| 35 to 64 Years | 1 (2.9%) | 2 (5.1%) |
| 65 to 74 Years | 0 (0.0%) | 0 (0.0%) |
| 75 Years and over | 4 (40.0%) | 0 (0.0%) |
Disability Class: Cognitive Difficulty
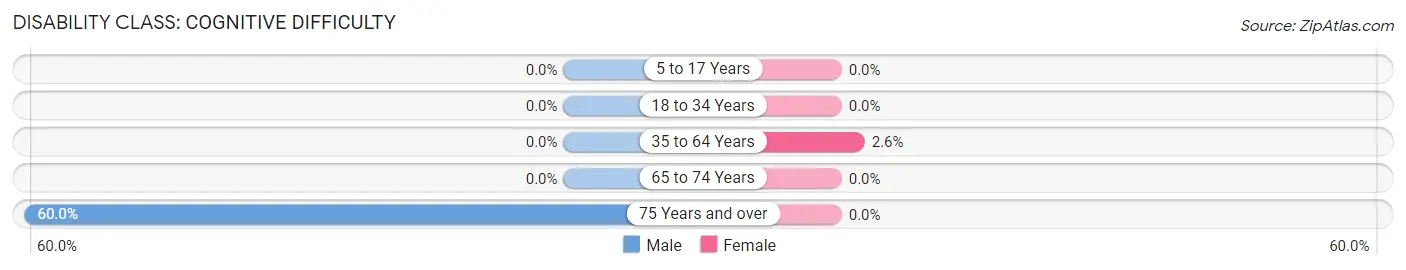
| Age Bracket | Male | Female |
| 5 to 17 Years | 0 (0.0%) | 0 (0.0%) |
| 18 to 34 Years | 0 (0.0%) | 0 (0.0%) |
| 35 to 64 Years | 0 (0.0%) | 1 (2.6%) |
| 65 to 74 Years | 0 (0.0%) | 0 (0.0%) |
| 75 Years and over | 6 (60.0%) | 0 (0.0%) |
Disability Class: Ambulatory Difficulty
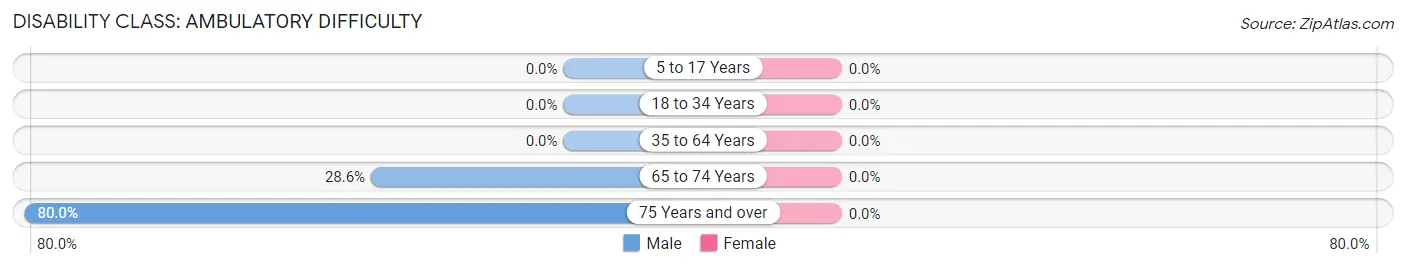
| Age Bracket | Male | Female |
| 5 to 17 Years | 0 (0.0%) | 0 (0.0%) |
| 18 to 34 Years | 0 (0.0%) | 0 (0.0%) |
| 35 to 64 Years | 0 (0.0%) | 0 (0.0%) |
| 65 to 74 Years | 2 (28.6%) | 0 (0.0%) |
| 75 Years and over | 8 (80.0%) | 0 (0.0%) |
Disability Class: Self-Care Difficulty
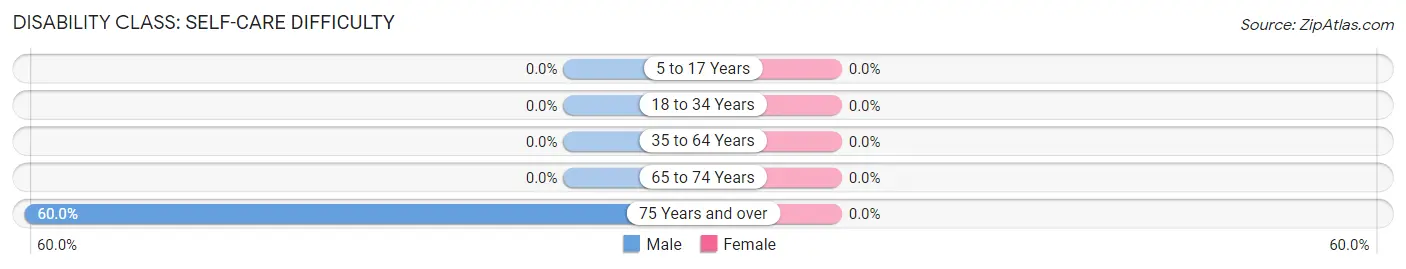
| Age Bracket | Male | Female |
| 5 to 17 Years | 0 (0.0%) | 0 (0.0%) |
| 18 to 34 Years | 0 (0.0%) | 0 (0.0%) |
| 35 to 64 Years | 0 (0.0%) | 0 (0.0%) |
| 65 to 74 Years | 0 (0.0%) | 0 (0.0%) |
| 75 Years and over | 6 (60.0%) | 0 (0.0%) |
Technology Access in Teller
Computing Device Access in Teller
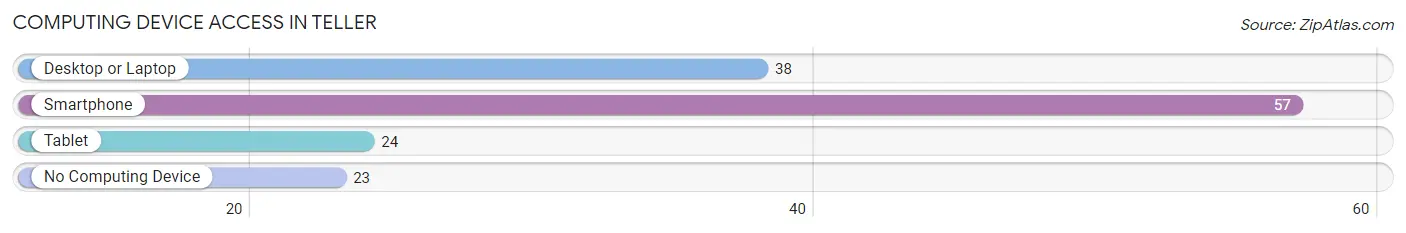
| Device Type | # Households | % Households |
| Desktop or Laptop | 38 | 42.7% |
| Smartphone | 57 | 64.0% |
| Tablet | 24 | 27.0% |
| No Computing Device | 23 | 25.8% |
| Total | 89 | 100.0% |
Internet Access in Teller
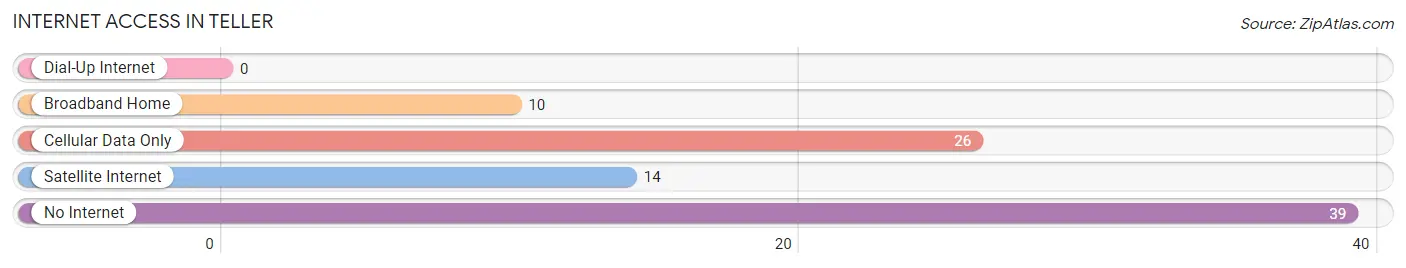
| Internet Type | # Households | % Households |
| Dial-Up Internet | 0 | 0.0% |
| Broadband Home | 10 | 11.2% |
| Cellular Data Only | 26 | 29.2% |
| Satellite Internet | 14 | 15.7% |
| No Internet | 39 | 43.8% |
| Total | 89 | 100.0% |
Teller Summary
AK History
Alaska is the largest state in the United States, and its history is as vast and varied as its landscape. The first inhabitants of Alaska were the Paleo-Eskimos, who arrived around 10,000 years ago. They were followed by the Thule people, who arrived around 1000 AD. The Thule people were the ancestors of the modern Inuit and Yupik peoples.
The first Europeans to explore Alaska were Russian fur traders, who arrived in the late 1700s. They established trading posts and settlements, and began trading with the native peoples. In 1867, the United States purchased Alaska from Russia for $7.2 million, in what became known as the Alaska Purchase.
The United States initially saw Alaska as a strategic military outpost, and the US Army established a number of forts and outposts throughout the territory. In 1912, Alaska became an organized territory of the United States, and in 1959, it was admitted as the 49th state.
Since statehood, Alaska has experienced a period of rapid growth and development. The discovery of oil in the late 1960s led to an economic boom, and the construction of the Trans-Alaska Pipeline in the 1970s. Today, Alaska is a major producer of oil and natural gas, and is home to a thriving fishing and tourism industry.
Geography
Alaska is located in the northwest corner of North America, bordered by Canada to the east and the Arctic Ocean to the north. It is the largest state in the United States, covering an area of 663,268 square miles.
Alaska is divided into five distinct regions: the Interior, the Southcentral, the Southeast, the North Slope, and the Aleutian Islands. The Interior is a vast expanse of boreal forest and tundra, while the Southcentral region is home to the state’s largest cities, including Anchorage and Fairbanks. The Southeast is a rugged coastal region, and the North Slope is an arctic tundra. The Aleutian Islands are a chain of volcanic islands stretching from the Alaska Peninsula to the Kamchatka Peninsula in Russia.
Alaska is home to some of the most spectacular scenery in the world, including the towering peaks of the Alaska Range, the glaciers of the Kenai Peninsula, and the vast expanse of the Arctic tundra.
Economy
Alaska’s economy is largely driven by the oil and gas industry, which accounts for more than one-third of the state’s total economic output. Other major industries include fishing, tourism, and timber.
The discovery of oil in the late 1960s led to an economic boom, and the construction of the Trans-Alaska Pipeline in the 1970s. Today, Alaska is the third-largest oil-producing state in the United States, and the oil and gas industry is the largest contributor to the state’s economy.
Fishing is also an important part of Alaska’s economy. The state is home to some of the world’s most productive fisheries, and the fishing industry accounts for more than 10% of the state’s total economic output.
Tourism is another major industry in Alaska. The state is home to some of the most spectacular scenery in the world, and attracts millions of visitors each year. Tourism is the second-largest contributor to the state’s economy, and is responsible for more than 8% of the state’s total economic output.
Demographics
As of 2019, Alaska had an estimated population of 731,545. The state is home to a diverse population, with the largest ethnic groups being White (66.2%), Native American (15.2%), and Asian (5.2%).
Alaska is also home to a large number of immigrants, with the largest groups being from Mexico (3.2%), the Philippines (2.2%), and India (1.2%).
The state’s largest cities are Anchorage, Fairbanks, Juneau, and Sitka. Anchorage is the largest city, with an estimated population of 291,538. Fairbanks is the second-largest city, with an estimated population of 32,717. Juneau is the state capital, with an estimated population of 32,406. Sitka is the fourth-largest city, with an estimated population of 8,835.
Common Questions
What is Per Capita Income in Teller?
Per Capita income in Teller is $21,124.
What is the Median Family Income in Teller?
Median Family Income in Teller is $37,250.
What is the Median Household income in Teller?
Median Household Income in Teller is $34,688.
What is Income or Wage Gap in Teller?
Income or Wage Gap in Teller is 35.1%.
Women in Teller earn 64.9 cents for every dollar earned by a man.
What is Inequality or Gini Index in Teller?
Inequality or Gini Index in Teller is 0.57.
What is the Total Population of Teller?
Total Population of Teller is 279.
What is the Total Male Population of Teller?
Total Male Population of Teller is 146.
What is the Total Female Population of Teller?
Total Female Population of Teller is 133.
What is the Ratio of Males per 100 Females in Teller?
There are 109.77 Males per 100 Females in Teller.
What is the Ratio of Females per 100 Males in Teller?
There are 91.10 Females per 100 Males in Teller.
What is the Median Population Age in Teller?
Median Population Age in Teller is 28.9 Years.
What is the Average Family Size in Teller
Average Family Size in Teller is 3.4 People.
What is the Average Household Size in Teller
Average Household Size in Teller is 3.1 People.
How Large is the Labor Force in Teller?
There are 96 People in the Labor Forcein in Teller.
What is the Percentage of People in the Labor Force in Teller?
46.2% of People are in the Labor Force in Teller.
What is the Unemployment Rate in Teller?
Unemployment Rate in Teller is 10.4%.