Tanana, AK Map & Demographics
Tanana Map
Tanana Overview
$32,458
PER CAPITA INCOME
$91,875
AVG FAMILY INCOME
$52,031
AVG HOUSEHOLD INCOME
8.8%
WAGE / INCOME GAP [ % ]
91.2¢/ $1
WAGE / INCOME GAP [ $ ]
0.49
INEQUALITY / GINI INDEX
214
TOTAL POPULATION
114
MALE POPULATION
100
FEMALE POPULATION
114.00
MALES / 100 FEMALES
87.72
FEMALES / 100 MALES
37.3
MEDIAN AGE
3.3
AVG FAMILY SIZE
2.5
AVG HOUSEHOLD SIZE
100
LABOR FORCE [ PEOPLE ]
64.5%
PERCENT IN LABOR FORCE
7.0%
UNEMPLOYMENT RATE
Tanana Zip Codes
Tanana Area Codes
Income in Tanana
Income Overview in Tanana
Per Capita Income in Tanana is $32,458, while median incomes of families and households are $91,875 and $52,031 respectively.
| Characteristic | Number | Measure |
| Per Capita Income | 214 | $32,458 |
| Median Family Income | 48 | $91,875 |
| Mean Family Income | 48 | $104,852 |
| Median Household Income | 81 | $52,031 |
| Mean Household Income | 81 | $82,868 |
| Income Deficit | 48 | $0 |
| Wage / Income Gap (%) | 214 | 8.76% |
| Wage / Income Gap ($) | 214 | 91.24¢ per $1 |
| Gini / Inequality Index | 214 | 0.49 |
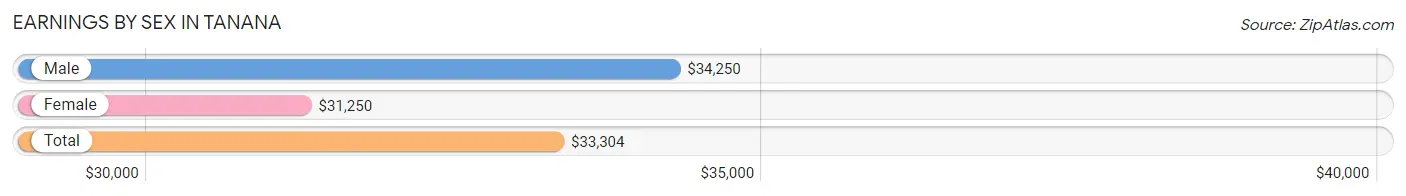
Earnings by Sex in Tanana
Average Earnings in Tanana are $33,304, $34,250 for men and $31,250 for women, a difference of 8.8%.
| Sex | Number | Average Earnings |
| Male | 66 (54.5%) | $34,250 |
| Female | 55 (45.5%) | $31,250 |
| Total | 121 (100.0%) | $33,304 |
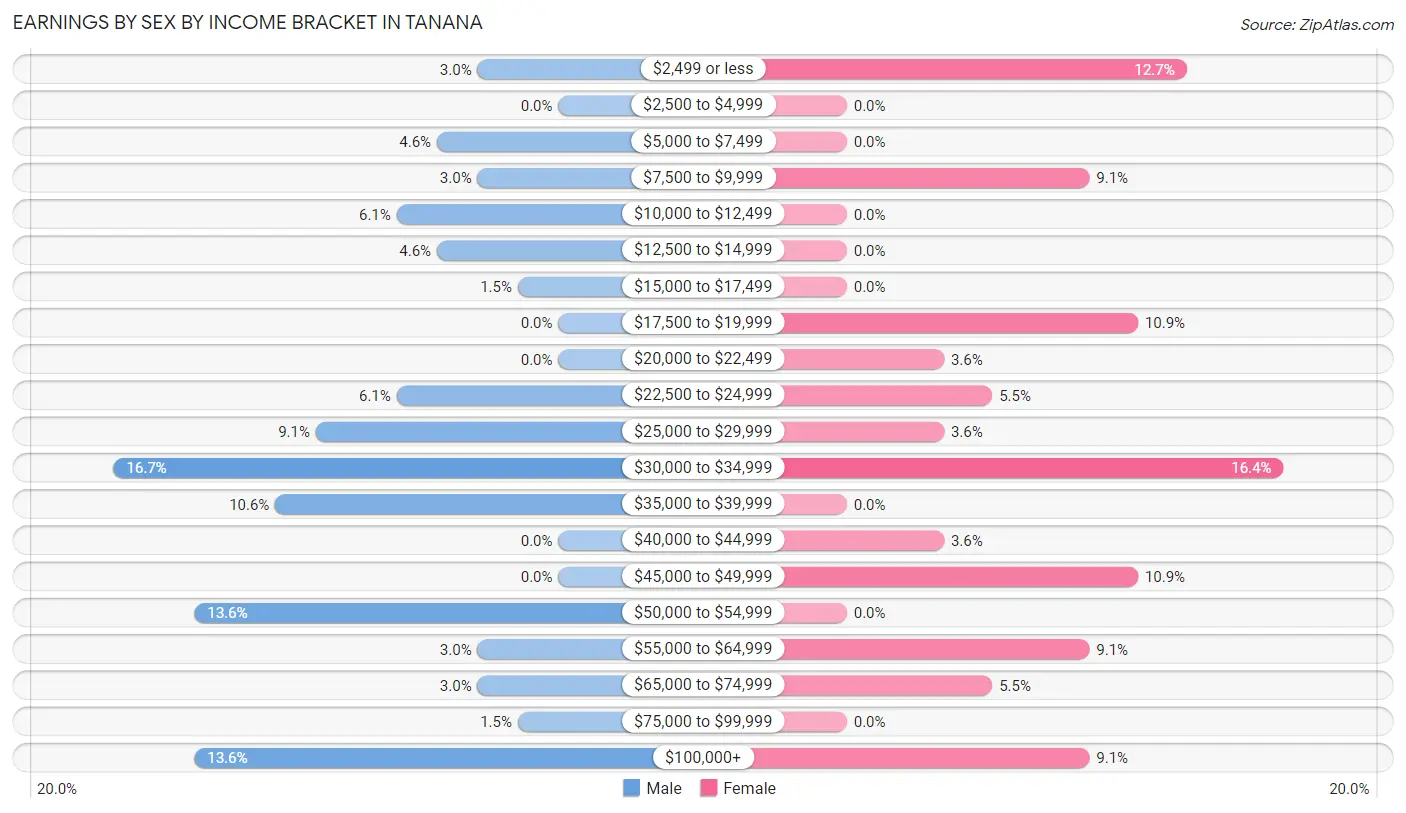
Earnings by Sex by Income Bracket in Tanana
The most common earnings brackets in Tanana are $30,000 to $34,999 for men (11 | 16.7%) and $30,000 to $34,999 for women (9 | 16.4%).
| Income | Male | Female |
| $2,499 or less | 2 (3.0%) | 7 (12.7%) |
| $2,500 to $4,999 | 0 (0.0%) | 0 (0.0%) |
| $5,000 to $7,499 | 3 (4.5%) | 0 (0.0%) |
| $7,500 to $9,999 | 2 (3.0%) | 5 (9.1%) |
| $10,000 to $12,499 | 4 (6.1%) | 0 (0.0%) |
| $12,500 to $14,999 | 3 (4.5%) | 0 (0.0%) |
| $15,000 to $17,499 | 1 (1.5%) | 0 (0.0%) |
| $17,500 to $19,999 | 0 (0.0%) | 6 (10.9%) |
| $20,000 to $22,499 | 0 (0.0%) | 2 (3.6%) |
| $22,500 to $24,999 | 4 (6.1%) | 3 (5.4%) |
| $25,000 to $29,999 | 6 (9.1%) | 2 (3.6%) |
| $30,000 to $34,999 | 11 (16.7%) | 9 (16.4%) |
| $35,000 to $39,999 | 7 (10.6%) | 0 (0.0%) |
| $40,000 to $44,999 | 0 (0.0%) | 2 (3.6%) |
| $45,000 to $49,999 | 0 (0.0%) | 6 (10.9%) |
| $50,000 to $54,999 | 9 (13.6%) | 0 (0.0%) |
| $55,000 to $64,999 | 2 (3.0%) | 5 (9.1%) |
| $65,000 to $74,999 | 2 (3.0%) | 3 (5.4%) |
| $75,000 to $99,999 | 1 (1.5%) | 0 (0.0%) |
| $100,000+ | 9 (13.6%) | 5 (9.1%) |
| Total | 66 (100.0%) | 55 (100.0%) |
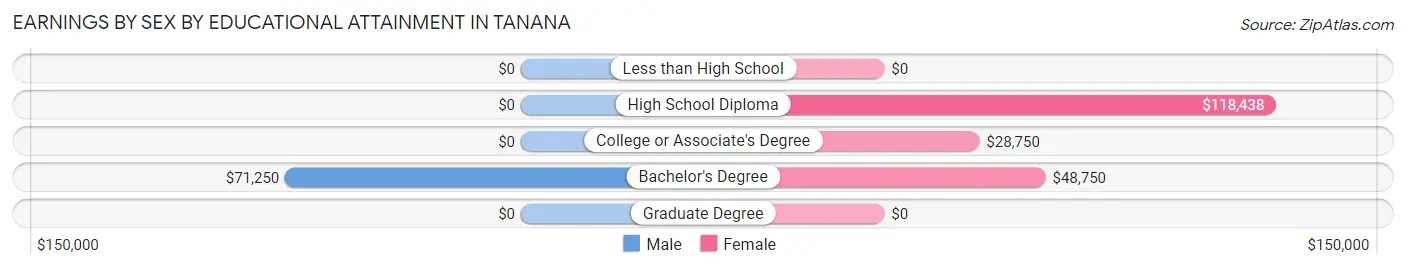
Earnings by Sex by Educational Attainment in Tanana
Average earnings in Tanana are $33,125 for men and $34,063 for women, a difference of 2.8%. Men with an educational attainment of bachelor's degree enjoy the highest average annual earnings of $71,250, while those with bachelor's degree education earn the least with $71,250. Women with an educational attainment of high school diploma earn the most with the average annual earnings of $118,438, while those with college or associate's degree education have the smallest earnings of $28,750.
| Educational Attainment | Male Income | Female Income |
| Less than High School | - | - |
| High School Diploma | - | - |
| College or Associate's Degree | - | - |
| Bachelor's Degree | $71,250 | $48,750 |
| Graduate Degree | - | - |
| Total | $33,125 | $34,063 |
Family Income in Tanana
Family Income Brackets in Tanana
According to the Tanana family income data, there are 9 families falling into the less than $10,000 income range, which is the most common income bracket and makes up 18.8% of all families.
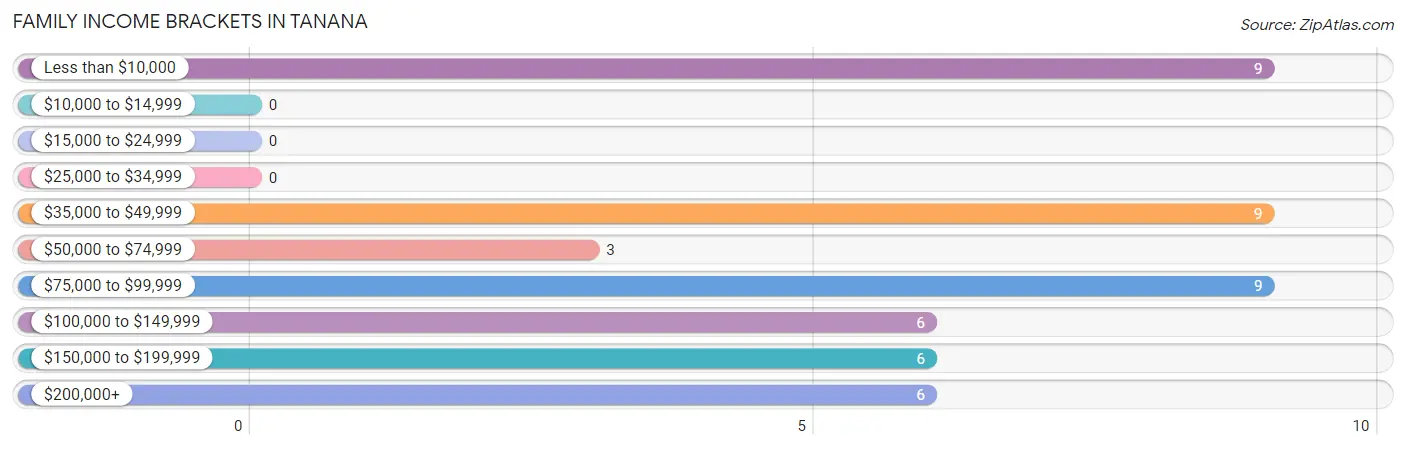
| Income Bracket | # Families | % Families |
| Less than $10,000 | 9 | 18.8% |
| $10,000 to $14,999 | 0 | 0.0% |
| $15,000 to $24,999 | 0 | 0.0% |
| $25,000 to $34,999 | 0 | 0.0% |
| $35,000 to $49,999 | 9 | 18.8% |
| $50,000 to $74,999 | 3 | 6.3% |
| $75,000 to $99,999 | 9 | 18.8% |
| $100,000 to $149,999 | 6 | 12.5% |
| $150,000 to $199,999 | 6 | 12.5% |
| $200,000+ | 6 | 12.5% |
Family Income by Famaliy Size in Tanana
5-person families (9 | 18.8%) account for the highest median family income in Tanana with $158,125 per family, while 5-person families (9 | 18.8%) have the highest median income of $31,625 per family member.
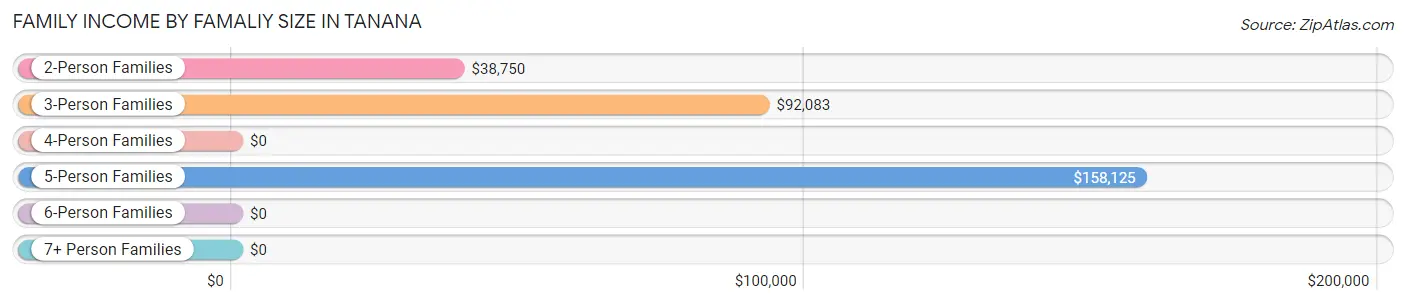
| Income Bracket | # Families | Median Income |
| 2-Person Families | 14 (29.2%) | $38,750 |
| 3-Person Families | 21 (43.8%) | $92,083 |
| 4-Person Families | 4 (8.3%) | $0 |
| 5-Person Families | 9 (18.8%) | $158,125 |
| 6-Person Families | 0 (0.0%) | $0 |
| 7+ Person Families | 0 (0.0%) | $0 |
| Total | 48 (100.0%) | $91,875 |
Family Income by Number of Earners in Tanana
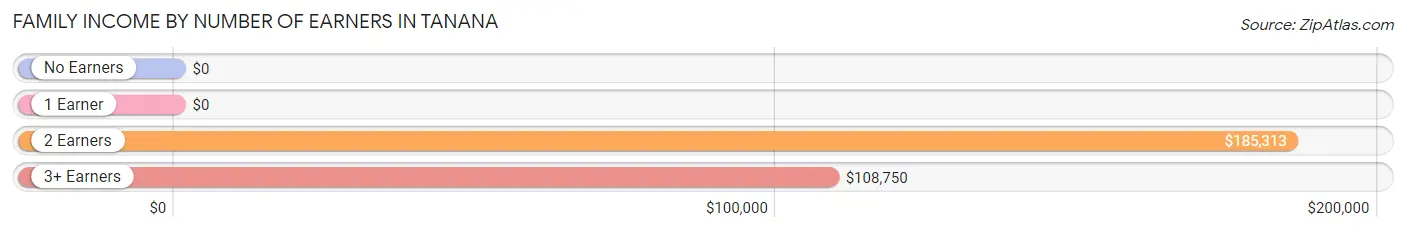
| Number of Earners | # Families | Median Income |
| No Earners | 7 (14.6%) | $0 |
| 1 Earner | 12 (25.0%) | $0 |
| 2 Earners | 19 (39.6%) | $185,313 |
| 3+ Earners | 10 (20.8%) | $108,750 |
| Total | 48 (100.0%) | $91,875 |
Household Income in Tanana
Household Income Brackets in Tanana
With 14 households falling in the category, the $50,000 to $74,999 income range is the most frequent in Tanana, accounting for 17.3% of all households.
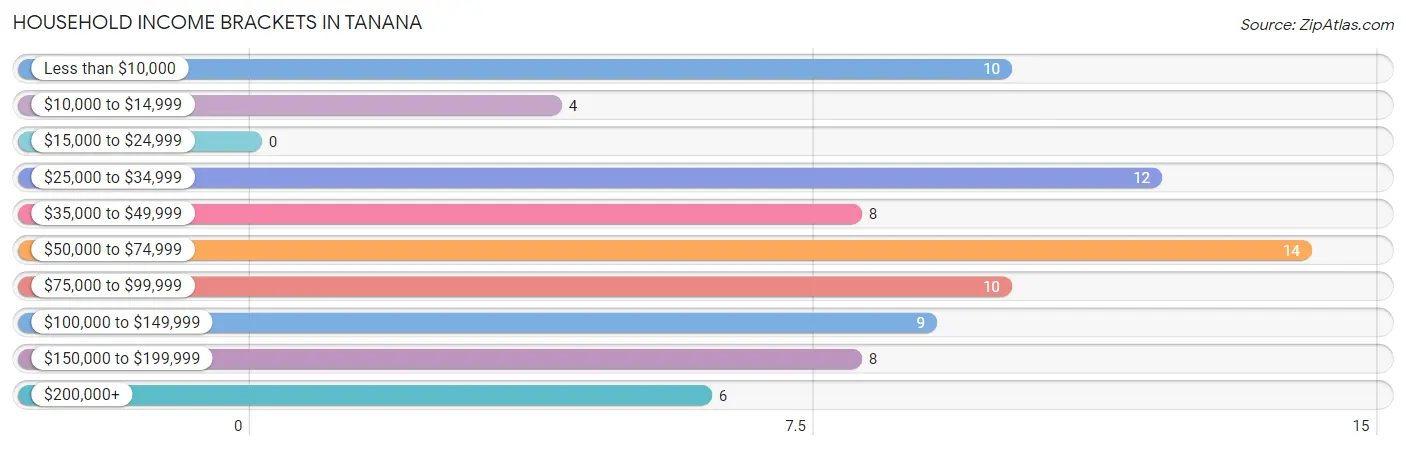
| Income Bracket | # Households | % Households |
| Less than $10,000 | 10 | 12.3% |
| $10,000 to $14,999 | 4 | 4.9% |
| $15,000 to $24,999 | 0 | 0.0% |
| $25,000 to $34,999 | 12 | 14.8% |
| $35,000 to $49,999 | 8 | 9.9% |
| $50,000 to $74,999 | 14 | 17.3% |
| $75,000 to $99,999 | 10 | 12.3% |
| $100,000 to $149,999 | 9 | 11.1% |
| $150,000 to $199,999 | 8 | 9.9% |
| $200,000+ | 6 | 7.4% |
Household Income by Householder Age in Tanana
The median household income in Tanana is $52,031, with the highest median household income of $90,625 found in the 45 to 64 years age bracket for the primary householder. A total of 34 households (42.0%) fall into this category. Meanwhile, the 15 to 24 years age bracket for the primary householder has the lowest median household income of $0, with 4 households (4.9%) in this group.
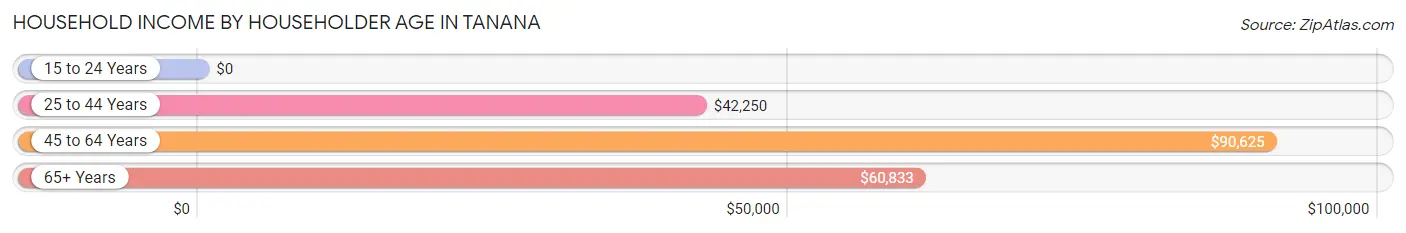
| Income Bracket | # Households | Median Income |
| 15 to 24 Years | 4 (4.9%) | $0 |
| 25 to 44 Years | 17 (21.0%) | $42,250 |
| 45 to 64 Years | 34 (42.0%) | $90,625 |
| 65+ Years | 26 (32.1%) | $60,833 |
| Total | 81 (100.0%) | $52,031 |
Poverty in Tanana
Income Below Poverty by Sex and Age in Tanana
With 21.8% poverty level for males and 11.6% for females among the residents of Tanana, 45 to 54 year old males and 25 to 34 year old females are the most vulnerable to poverty, with 7 males (53.8%) and 7 females (100.0%) in their respective age groups living below the poverty level.
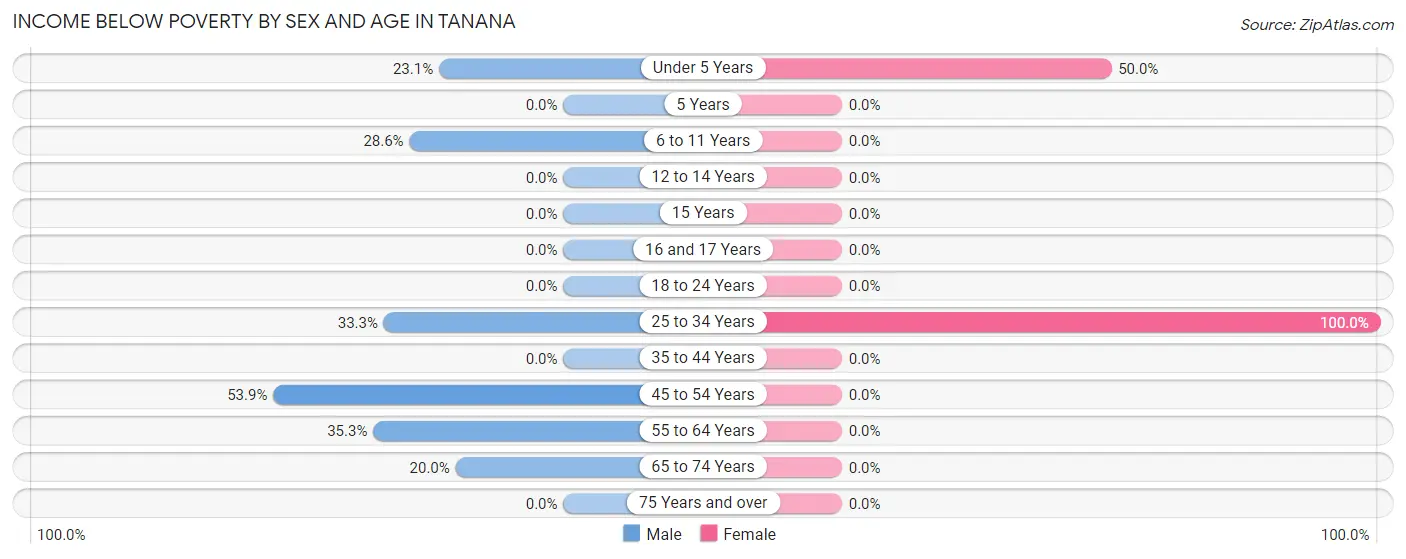
| Age Bracket | Male | Female |
| Under 5 Years | 3 (23.1%) | 4 (50.0%) |
| 5 Years | 0 (0.0%) | 0 (0.0%) |
| 6 to 11 Years | 4 (28.6%) | 0 (0.0%) |
| 12 to 14 Years | 0 (0.0%) | 0 (0.0%) |
| 15 Years | 0 (0.0%) | 0 (0.0%) |
| 16 and 17 Years | 0 (0.0%) | 0 (0.0%) |
| 18 to 24 Years | 0 (0.0%) | 0 (0.0%) |
| 25 to 34 Years | 2 (33.3%) | 7 (100.0%) |
| 35 to 44 Years | 0 (0.0%) | 0 (0.0%) |
| 45 to 54 Years | 7 (53.8%) | 0 (0.0%) |
| 55 to 64 Years | 6 (35.3%) | 0 (0.0%) |
| 65 to 74 Years | 2 (20.0%) | 0 (0.0%) |
| 75 Years and over | 0 (0.0%) | 0 (0.0%) |
| Total | 24 (21.8%) | 11 (11.6%) |
Income Above Poverty by Sex and Age in Tanana
According to the poverty statistics in Tanana, males aged 12 to 14 years and females aged 6 to 11 years are the age groups that are most secure financially, with 100.0% of males and 100.0% of females in these age groups living above the poverty line.
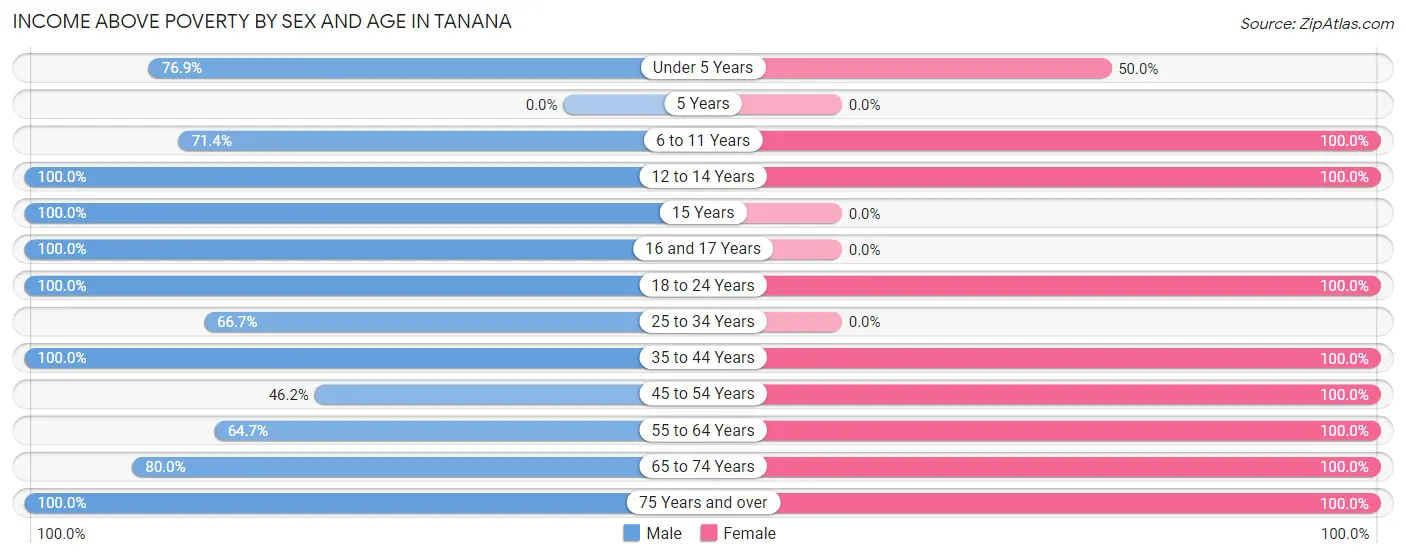
| Age Bracket | Male | Female |
| Under 5 Years | 10 (76.9%) | 4 (50.0%) |
| 5 Years | 0 (0.0%) | 0 (0.0%) |
| 6 to 11 Years | 10 (71.4%) | 17 (100.0%) |
| 12 to 14 Years | 3 (100.0%) | 3 (100.0%) |
| 15 Years | 1 (100.0%) | 0 (0.0%) |
| 16 and 17 Years | 2 (100.0%) | 0 (0.0%) |
| 18 to 24 Years | 16 (100.0%) | 10 (100.0%) |
| 25 to 34 Years | 4 (66.7%) | 0 (0.0%) |
| 35 to 44 Years | 8 (100.0%) | 8 (100.0%) |
| 45 to 54 Years | 6 (46.2%) | 11 (100.0%) |
| 55 to 64 Years | 11 (64.7%) | 15 (100.0%) |
| 65 to 74 Years | 8 (80.0%) | 10 (100.0%) |
| 75 Years and over | 7 (100.0%) | 6 (100.0%) |
| Total | 86 (78.2%) | 84 (88.4%) |
Income Below Poverty Among Married-Couple Families in Tanana
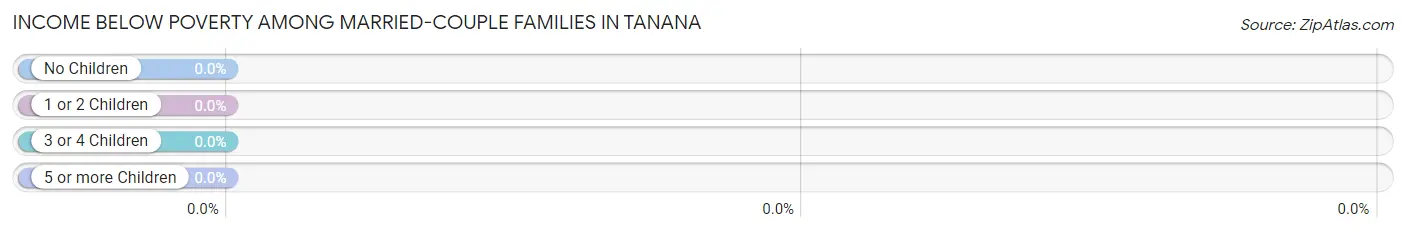
| Children | Above Poverty | Below Poverty |
| No Children | 10 (100.0%) | 0 (0.0%) |
| 1 or 2 Children | 17 (100.0%) | 0 (0.0%) |
| 3 or 4 Children | 2 (100.0%) | 0 (0.0%) |
| 5 or more Children | 0 (0.0%) | 0 (0.0%) |
| Total | 29 (100.0%) | 0 (0.0%) |
Income Below Poverty Among Single-Parent Households in Tanana
According to the poverty data in Tanana, 100.0% or 2 single-father households and 41.2% or 7 single-mother households are living below the poverty line. Among single-father households, those with no children have the highest poverty rate, with 2 households (100.0%) experiencing poverty. Likewise, among single-mother households, those with 1 or 2 children have the highest poverty rate, with 7 households (63.6%) falling below the poverty line.
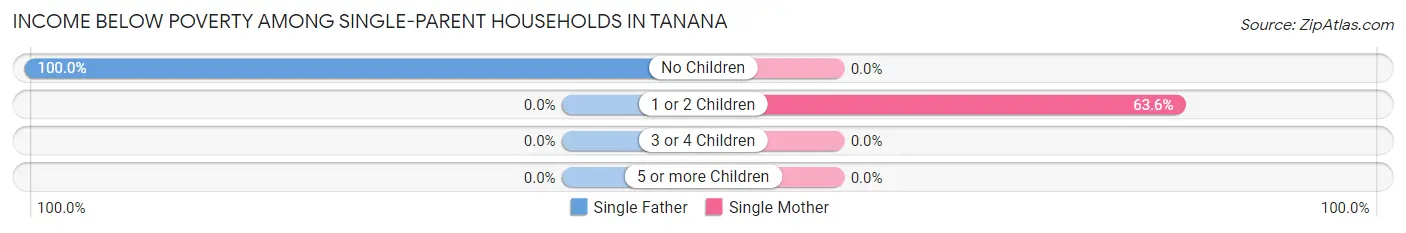
| Children | Single Father | Single Mother |
| No Children | 2 (100.0%) | 0 (0.0%) |
| 1 or 2 Children | 0 (0.0%) | 7 (63.6%) |
| 3 or 4 Children | 0 (0.0%) | 0 (0.0%) |
| 5 or more Children | 0 (0.0%) | 0 (0.0%) |
| Total | 2 (100.0%) | 7 (41.2%) |
Income Below Poverty Among Married-Couple vs Single-Parent Households in Tanana
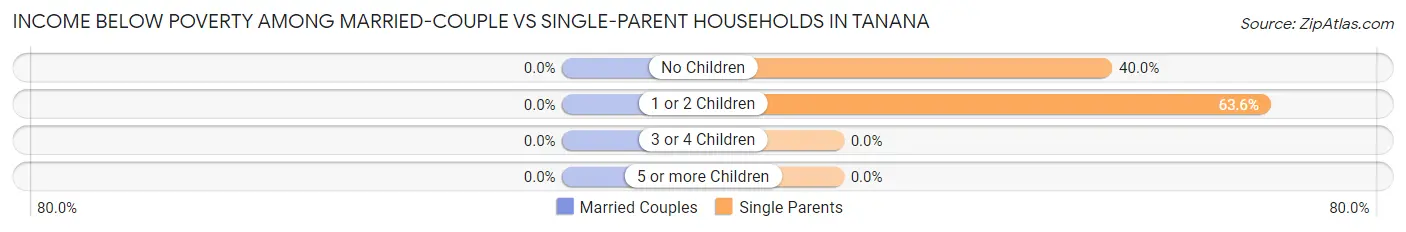
| Children | Married-Couple Families | Single-Parent Households |
| No Children | 0 (0.0%) | 2 (40.0%) |
| 1 or 2 Children | 0 (0.0%) | 7 (63.6%) |
| 3 or 4 Children | 0 (0.0%) | 0 (0.0%) |
| 5 or more Children | 0 (0.0%) | 0 (0.0%) |
| Total | 0 (0.0%) | 9 (47.4%) |
Race in Tanana
The most populous races in Tanana are Native / Alaskan (181 | 84.6%), White / Caucasian (21 | 9.8%), and Two or more Races (12 | 5.6%).
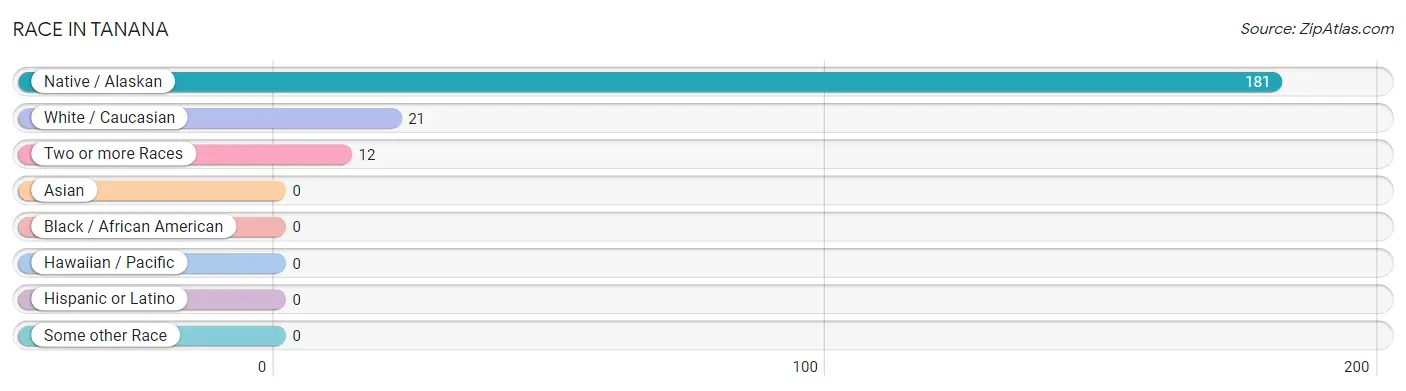
| Race | # Population | % Population |
| Asian | 0 | 0.0% |
| Black / African American | 0 | 0.0% |
| Hawaiian / Pacific | 0 | 0.0% |
| Hispanic or Latino | 0 | 0.0% |
| Native / Alaskan | 181 | 84.6% |
| White / Caucasian | 21 | 9.8% |
| Two or more Races | 12 | 5.6% |
| Some other Race | 0 | 0.0% |
| Total | 214 | 100.0% |
Ancestry in Tanana
The most populous ancestries reported in Tanana are Alaskan Athabascan (178 | 83.2%), Inupiat (17 | 7.9%), Yup'ik (9 | 4.2%), Norwegian (7 | 3.3%), and Alaska Native (5 | 2.3%), together accounting for 100.9% of all Tanana residents.
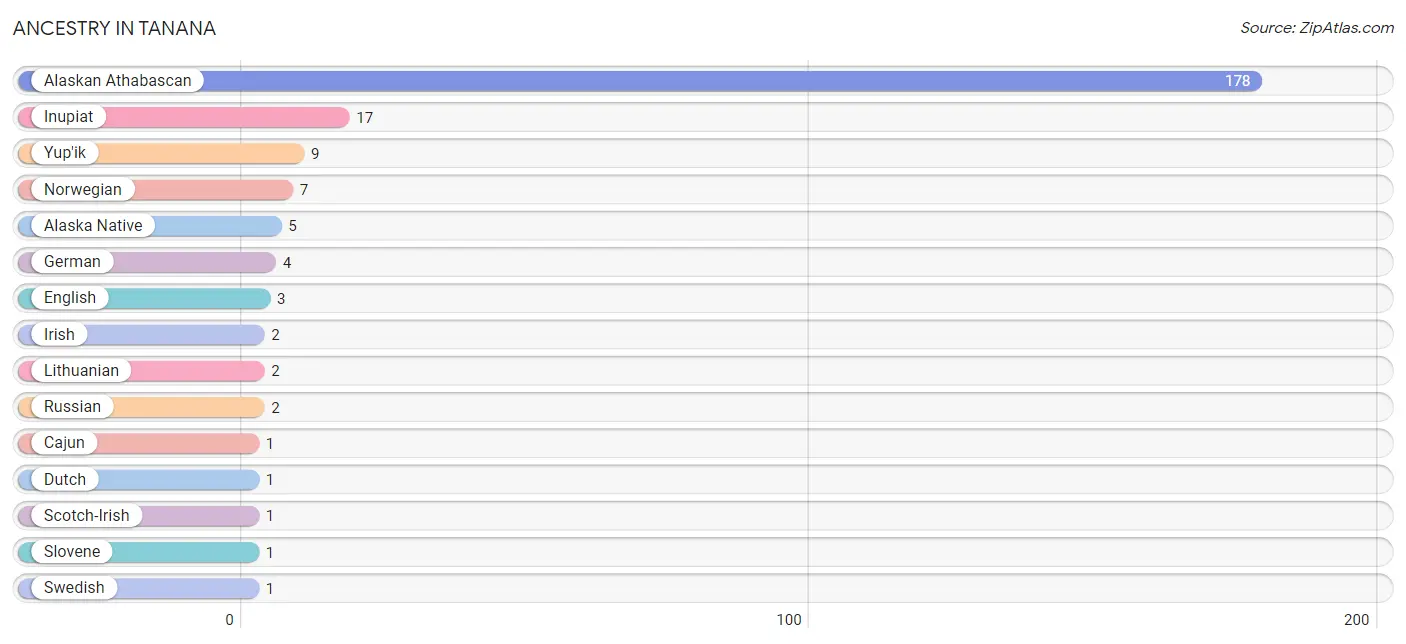
| Ancestry | # Population | % Population |
| Alaska Native | 5 | 2.3% |
| Alaskan Athabascan | 178 | 83.2% |
| Cajun | 1 | 0.5% |
| Dutch | 1 | 0.5% |
| English | 3 | 1.4% |
| German | 4 | 1.9% |
| Inupiat | 17 | 7.9% |
| Irish | 2 | 0.9% |
| Lithuanian | 2 | 0.9% |
| Norwegian | 7 | 3.3% |
| Russian | 2 | 0.9% |
| Scotch-Irish | 1 | 0.5% |
| Slovene | 1 | 0.5% |
| Swedish | 1 | 0.5% |
| Tlingit-Haida | 1 | 0.5% |
| Yup'ik | 9 | 4.2% | View All 16 Rows |
Immigrants in Tanana

| Immigration Origin | # Population | % Population | View All 0 Rows |
Sex and Age in Tanana
Sex and Age in Tanana
The most populous age groups in Tanana are Under 5 Years (13 | 11.4%) for men and 5 to 9 Years (11 | 11.0%) for women.
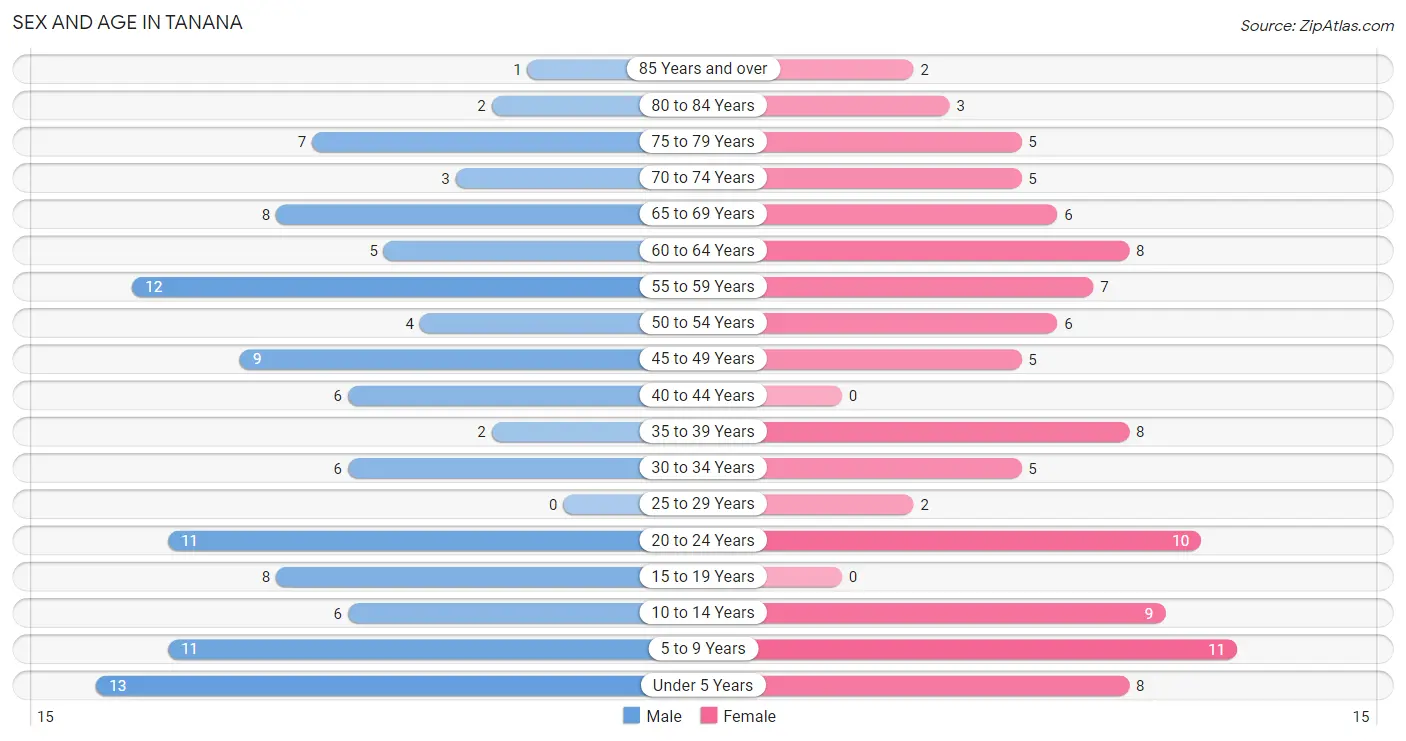
| Age Bracket | Male | Female |
| Under 5 Years | 13 (11.4%) | 8 (8.0%) |
| 5 to 9 Years | 11 (9.7%) | 11 (11.0%) |
| 10 to 14 Years | 6 (5.3%) | 9 (9.0%) |
| 15 to 19 Years | 8 (7.0%) | 0 (0.0%) |
| 20 to 24 Years | 11 (9.7%) | 10 (10.0%) |
| 25 to 29 Years | 0 (0.0%) | 2 (2.0%) |
| 30 to 34 Years | 6 (5.3%) | 5 (5.0%) |
| 35 to 39 Years | 2 (1.8%) | 8 (8.0%) |
| 40 to 44 Years | 6 (5.3%) | 0 (0.0%) |
| 45 to 49 Years | 9 (7.9%) | 5 (5.0%) |
| 50 to 54 Years | 4 (3.5%) | 6 (6.0%) |
| 55 to 59 Years | 12 (10.5%) | 7 (7.0%) |
| 60 to 64 Years | 5 (4.4%) | 8 (8.0%) |
| 65 to 69 Years | 8 (7.0%) | 6 (6.0%) |
| 70 to 74 Years | 3 (2.6%) | 5 (5.0%) |
| 75 to 79 Years | 7 (6.1%) | 5 (5.0%) |
| 80 to 84 Years | 2 (1.8%) | 3 (3.0%) |
| 85 Years and over | 1 (0.9%) | 2 (2.0%) |
| Total | 114 (100.0%) | 100 (100.0%) |
Families and Households in Tanana
Median Family Size in Tanana
The median family size in Tanana is 3.31 persons per family, with married-couple families (29 | 60.4%) accounting for the largest median family size of 3.59 persons per family. On the other hand, single male/father families (2 | 4.2%) represent the smallest median family size with 1.50 persons per family.
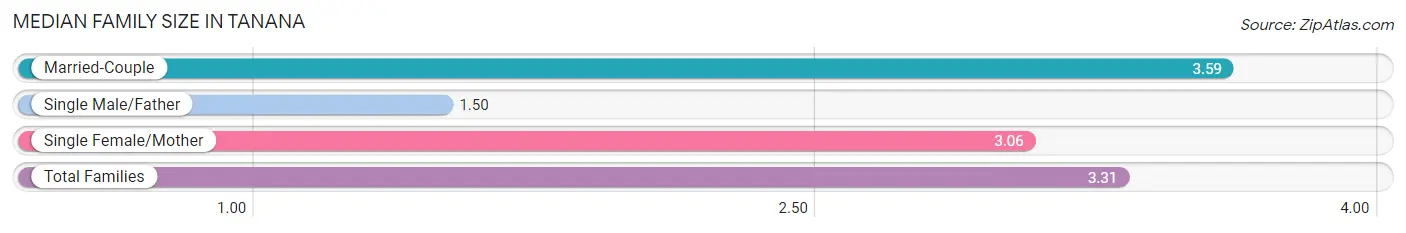
| Family Type | # Families | Family Size |
| Married-Couple | 29 (60.4%) | 3.59 |
| Single Male/Father | 2 (4.2%) | 1.50 |
| Single Female/Mother | 17 (35.4%) | 3.06 |
| Total Families | 48 (100.0%) | 3.31 |
Median Household Size in Tanana
The median household size in Tanana is 2.53 persons per household, with single female/mother households (17 | 21.0%) accounting for the largest median household size of 3.71 persons per household. non-family households (33 | 40.7%) represent the smallest median household size with 1.06 persons per household.
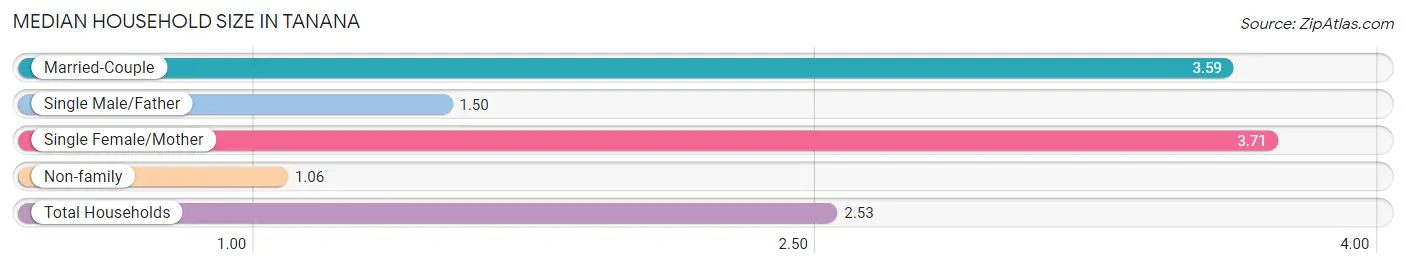
| Household Type | # Households | Household Size |
| Married-Couple | 29 (35.8%) | 3.59 |
| Single Male/Father | 2 (2.5%) | 1.50 |
| Single Female/Mother | 17 (21.0%) | 3.71 |
| Non-family | 33 (40.7%) | 1.06 |
| Total Households | 81 (100.0%) | 2.53 |
Household Size by Marriage Status in Tanana
Out of a total of 81 households in Tanana, 48 (59.3%) are family households, while 33 (40.7%) are nonfamily households. The most numerous type of family households are 3-person households, comprising 23, and the most common type of nonfamily households are 1-person households, comprising 30.
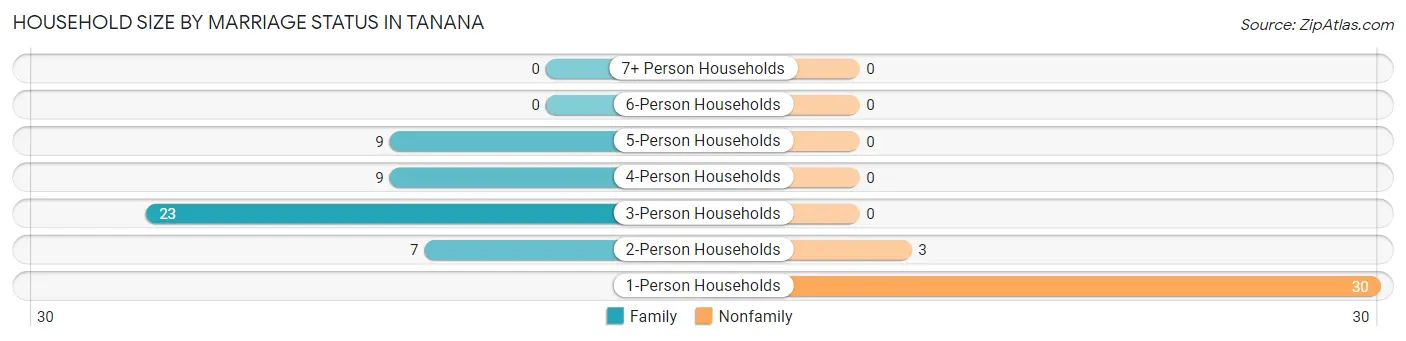
| Household Size | Family Households | Nonfamily Households |
| 1-Person Households | - | 30 (37.0%) |
| 2-Person Households | 7 (8.6%) | 3 (3.7%) |
| 3-Person Households | 23 (28.4%) | 0 (0.0%) |
| 4-Person Households | 9 (11.1%) | 0 (0.0%) |
| 5-Person Households | 9 (11.1%) | 0 (0.0%) |
| 6-Person Households | 0 (0.0%) | 0 (0.0%) |
| 7+ Person Households | 0 (0.0%) | 0 (0.0%) |
| Total | 48 (59.3%) | 33 (40.7%) |
Female Fertility in Tanana
Fertility by Age in Tanana
| Age Bracket | Women with Births | Births / 1,000 Women |
| 15 to 19 years | 0 (0.0%) | 0.0 |
| 20 to 34 years | 0 (0.0%) | 0.0 |
| 35 to 50 years | 0 (0.0%) | 0.0 |
| Total | 0 (0.0%) | 0.0 |
Fertility by Age by Marriage Status in Tanana
| Age Bracket | Married | Unmarried |
| 15 to 19 years | 0 (0.0%) | 0 (0.0%) |
| 20 to 34 years | 0 (0.0%) | 0 (0.0%) |
| 35 to 50 years | 0 (0.0%) | 0 (0.0%) |
| Total | 0 (0.0%) | 0 (0.0%) |
Fertility by Education in Tanana
| Educational Attainment | Women with Births | Births / 1,000 Women |
| Less than High School | 0 (0.0%) | 0.0 |
| High School Diploma | 0 (0.0%) | 0.0 |
| College or Associate's Degree | 0 (0.0%) | 0.0 |
| Bachelor's Degree | 0 (0.0%) | 0.0 |
| Graduate Degree | 0 (0.0%) | 0.0 |
| Total | 0 (0.0%) | 0.0 |
Fertility by Education by Marriage Status in Tanana
| Educational Attainment | Married | Unmarried |
| Less than High School | 0 (0.0%) | 0 (0.0%) |
| High School Diploma | 0 (0.0%) | 0 (0.0%) |
| College or Associate's Degree | 0 (0.0%) | 0 (0.0%) |
| Bachelor's Degree | 0 (0.0%) | 0 (0.0%) |
| Graduate Degree | 0 (0.0%) | 0 (0.0%) |
| Total | 0 (0.0%) | 0 (0.0%) |
Employment Characteristics in Tanana
Employment by Class of Employer in Tanana
Among the 92 employed individuals in Tanana, local government employees (25 | 27.2%), federal government employees (24 | 26.1%), and private company employees (20 | 21.7%) make up the most common classes of employment.
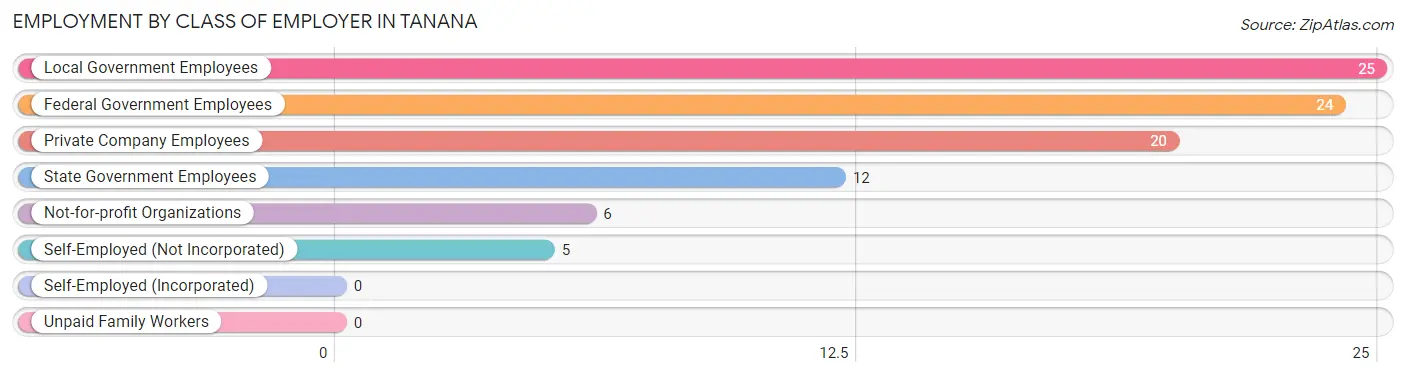
| Employer Class | # Employees | % Employees |
| Private Company Employees | 20 | 21.7% |
| Self-Employed (Incorporated) | 0 | 0.0% |
| Self-Employed (Not Incorporated) | 5 | 5.4% |
| Not-for-profit Organizations | 6 | 6.5% |
| Local Government Employees | 25 | 27.2% |
| State Government Employees | 12 | 13.0% |
| Federal Government Employees | 24 | 26.1% |
| Unpaid Family Workers | 0 | 0.0% |
| Total | 92 | 100.0% |
Employment Status by Age in Tanana
According to the labor force statistics for Tanana, out of the total population over 16 years of age (155), 64.5% or 100 individuals are in the labor force, with 7.0% or 7 of them unemployed. The age group with the highest labor force participation rate is 35 to 44 years, with 100.0% or 16 individuals in the labor force. Within the labor force, the 30 to 34 years age range has the highest percentage of unemployed individuals, with 33.3% or 2 of them being unemployed.
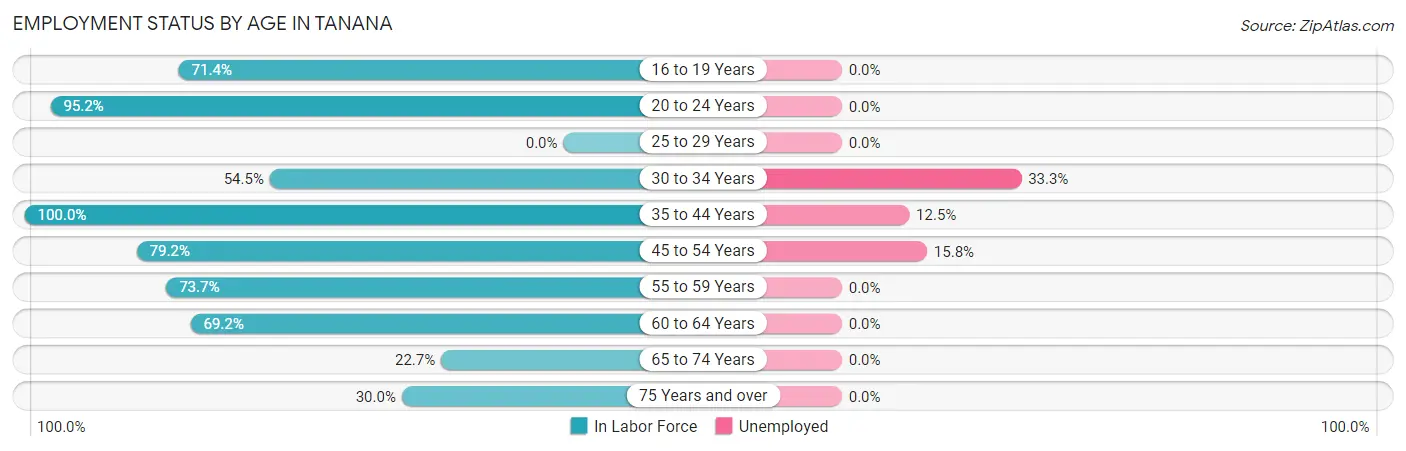
| Age Bracket | In Labor Force | Unemployed |
| 16 to 19 Years | 5 (71.4%) | 0 (0.0%) |
| 20 to 24 Years | 20 (95.2%) | 0 (0.0%) |
| 25 to 29 Years | 0 (0.0%) | 0 (0.0%) |
| 30 to 34 Years | 6 (54.5%) | 2 (33.3%) |
| 35 to 44 Years | 16 (100.0%) | 2 (12.5%) |
| 45 to 54 Years | 19 (79.2%) | 3 (15.8%) |
| 55 to 59 Years | 14 (73.7%) | 0 (0.0%) |
| 60 to 64 Years | 9 (69.2%) | 0 (0.0%) |
| 65 to 74 Years | 5 (22.7%) | 0 (0.0%) |
| 75 Years and over | 6 (30.0%) | 0 (0.0%) |
| Total | 100 (64.5%) | 7 (7.0%) |
Employment Status by Educational Attainment in Tanana
According to labor force statistics for Tanana, 75.3% of individuals (64) out of the total population between 25 and 64 years of age (85) are in the labor force, with 10.9% or 7 of them being unemployed. The group with the highest labor force participation rate are those with the educational attainment of bachelor's degree or higher, with 100.0% or 12 individuals in the labor force. Within the labor force, individuals with high school diploma education have the highest percentage of unemployment, with 14.3% or 2 of them being unemployed.
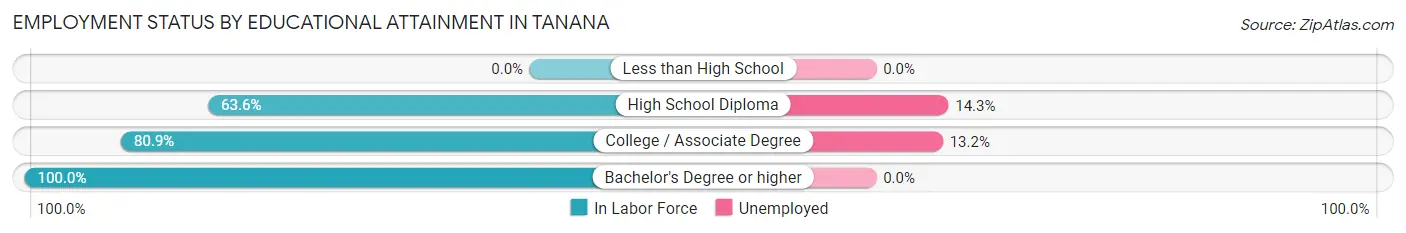
| Educational Attainment | In Labor Force | Unemployed |
| Less than High School | 0 (0.0%) | 0 (0.0%) |
| High School Diploma | 14 (63.6%) | 3 (14.3%) |
| College / Associate Degree | 38 (80.9%) | 6 (13.2%) |
| Bachelor's Degree or higher | 12 (100.0%) | 0 (0.0%) |
| Total | 64 (75.3%) | 9 (10.9%) |
Employment Occupations by Sex in Tanana
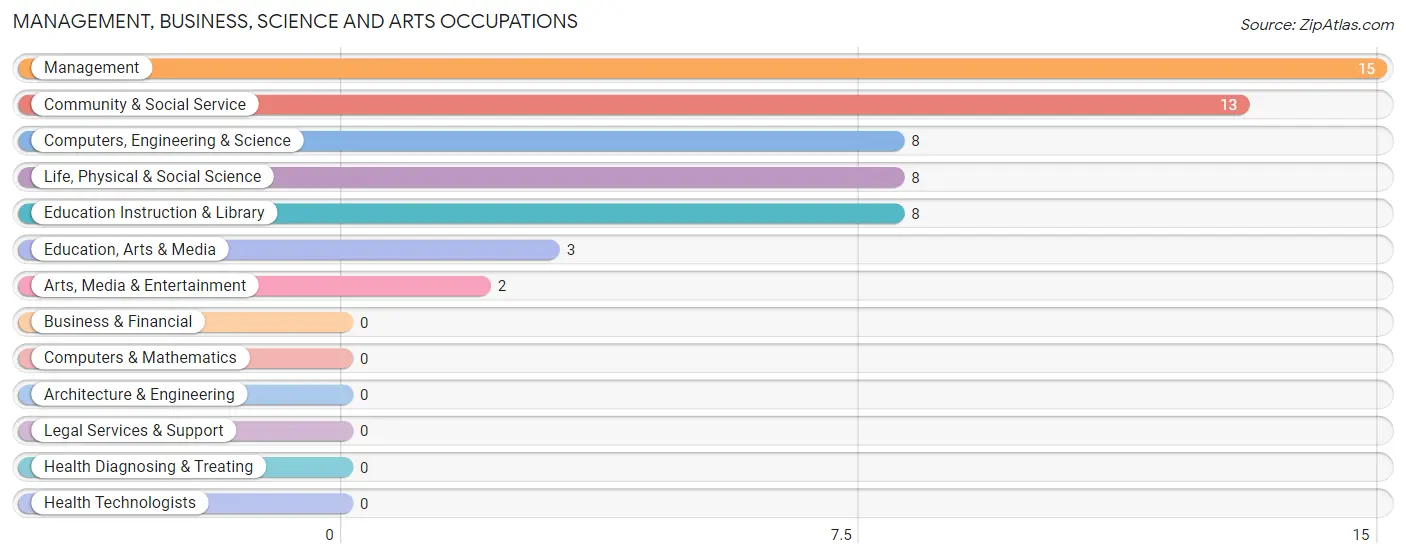
Management, Business, Science and Arts Occupations
The most common Management, Business, Science and Arts occupations in Tanana are Management (15 | 16.1%), Community & Social Service (13 | 14.0%), Computers, Engineering & Science (8 | 8.6%), Life, Physical & Social Science (8 | 8.6%), and Education Instruction & Library (8 | 8.6%).
Management, Business, Science and Arts Occupations by Sex
Within the Management, Business, Science and Arts occupations in Tanana, the most male-oriented occupations are Arts, Media & Entertainment (100.0%), Education Instruction & Library (62.5%), and Community & Social Service (53.8%), while the most female-oriented occupations are Education, Arts & Media (100.0%), Computers, Engineering & Science (87.5%), and Life, Physical & Social Science (87.5%).
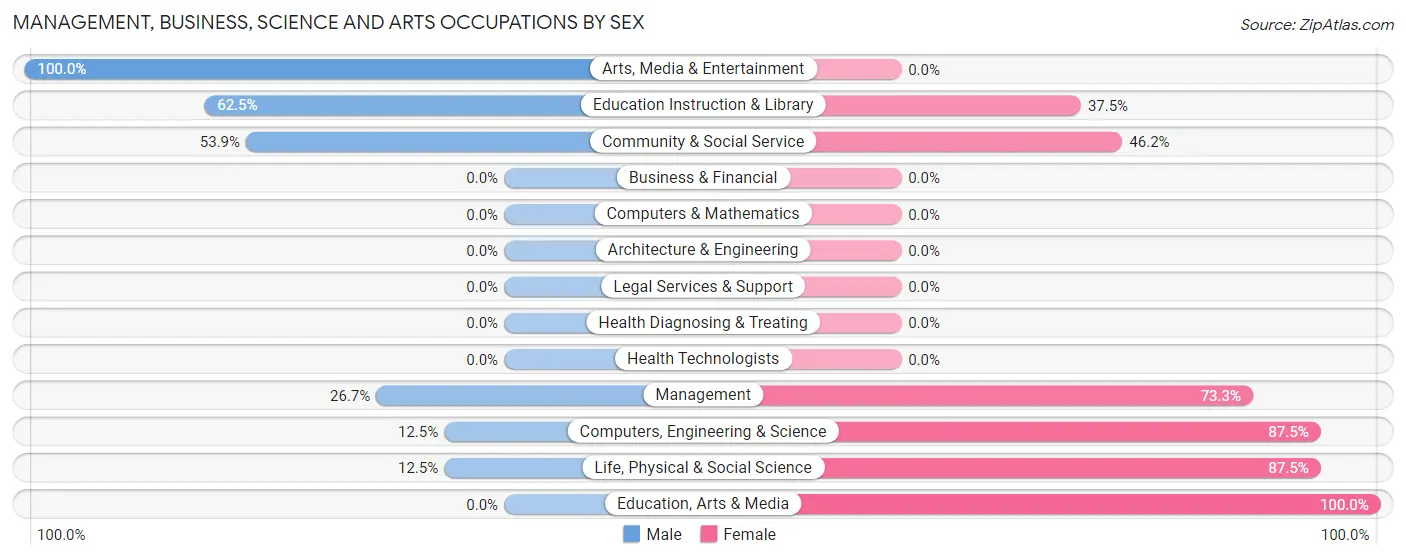
| Occupation | Male | Female |
| Management | 4 (26.7%) | 11 (73.3%) |
| Business & Financial | 0 (0.0%) | 0 (0.0%) |
| Computers, Engineering & Science | 1 (12.5%) | 7 (87.5%) |
| Computers & Mathematics | 0 (0.0%) | 0 (0.0%) |
| Architecture & Engineering | 0 (0.0%) | 0 (0.0%) |
| Life, Physical & Social Science | 1 (12.5%) | 7 (87.5%) |
| Community & Social Service | 7 (53.8%) | 6 (46.2%) |
| Education, Arts & Media | 0 (0.0%) | 3 (100.0%) |
| Legal Services & Support | 0 (0.0%) | 0 (0.0%) |
| Education Instruction & Library | 5 (62.5%) | 3 (37.5%) |
| Arts, Media & Entertainment | 2 (100.0%) | 0 (0.0%) |
| Health Diagnosing & Treating | 0 (0.0%) | 0 (0.0%) |
| Health Technologists | 0 (0.0%) | 0 (0.0%) |
| Total (Category) | 12 (33.3%) | 24 (66.7%) |
| Total (Overall) | 47 (50.5%) | 46 (49.5%) |
Services Occupations
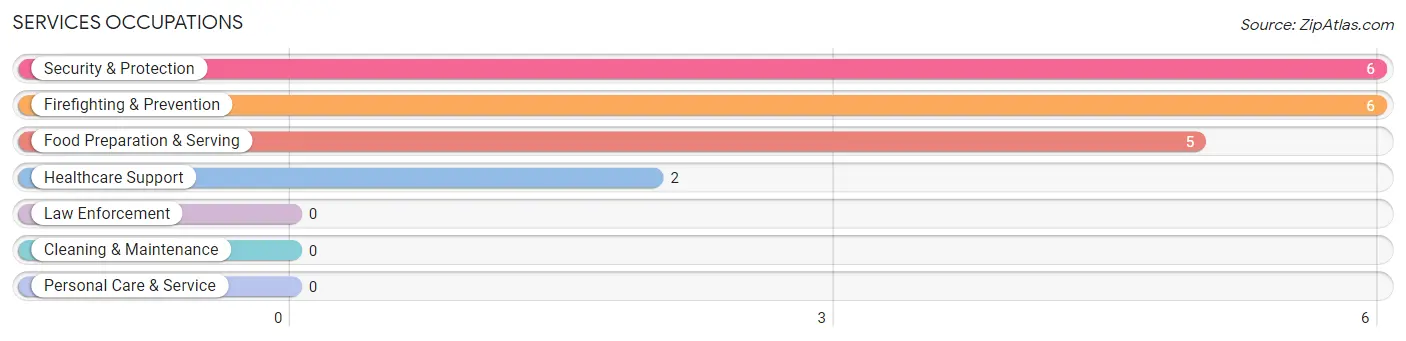
The most common Services occupations in Tanana are Security & Protection (6 | 6.5%), Firefighting & Prevention (6 | 6.5%), Food Preparation & Serving (5 | 5.4%), and Healthcare Support (2 | 2.1%).
Services Occupations by Sex
Within the Services occupations in Tanana, the most male-oriented occupations are Security & Protection (100.0%), Firefighting & Prevention (100.0%), and Food Preparation & Serving (80.0%), while the most female-oriented occupations are Healthcare Support (100.0%), and Food Preparation & Serving (20.0%).
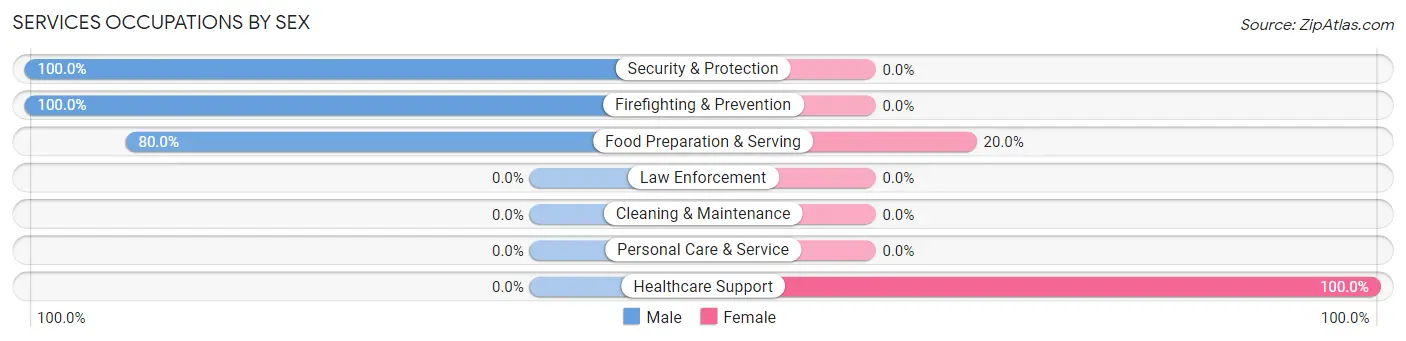
| Occupation | Male | Female |
| Healthcare Support | 0 (0.0%) | 2 (100.0%) |
| Security & Protection | 6 (100.0%) | 0 (0.0%) |
| Firefighting & Prevention | 6 (100.0%) | 0 (0.0%) |
| Law Enforcement | 0 (0.0%) | 0 (0.0%) |
| Food Preparation & Serving | 4 (80.0%) | 1 (20.0%) |
| Cleaning & Maintenance | 0 (0.0%) | 0 (0.0%) |
| Personal Care & Service | 0 (0.0%) | 0 (0.0%) |
| Total (Category) | 10 (76.9%) | 3 (23.1%) |
| Total (Overall) | 47 (50.5%) | 46 (49.5%) |
Sales and Office Occupations
The most common Sales and Office occupations in Tanana are Office & Administration (16 | 17.2%), and Sales & Related (3 | 3.2%).
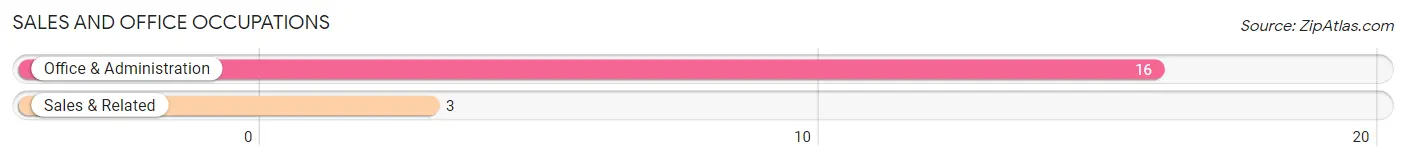
Sales and Office Occupations by Sex
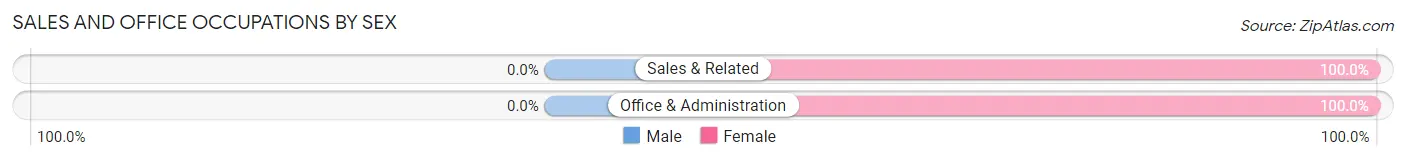
| Occupation | Male | Female |
| Sales & Related | 0 (0.0%) | 3 (100.0%) |
| Office & Administration | 0 (0.0%) | 16 (100.0%) |
| Total (Category) | 0 (0.0%) | 19 (100.0%) |
| Total (Overall) | 47 (50.5%) | 46 (49.5%) |
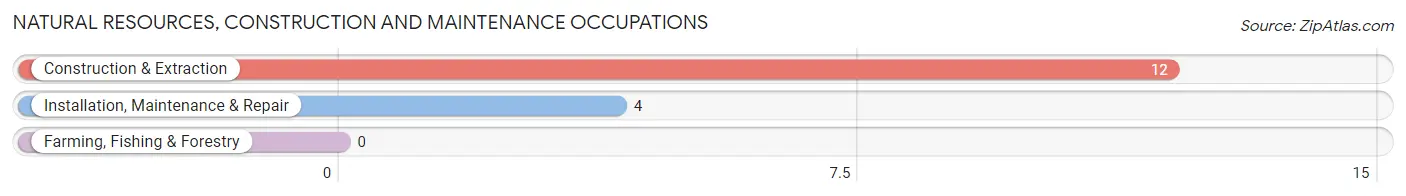
Natural Resources, Construction and Maintenance Occupations
The most common Natural Resources, Construction and Maintenance occupations in Tanana are Construction & Extraction (12 | 12.9%), and Installation, Maintenance & Repair (4 | 4.3%).
Natural Resources, Construction and Maintenance Occupations by Sex
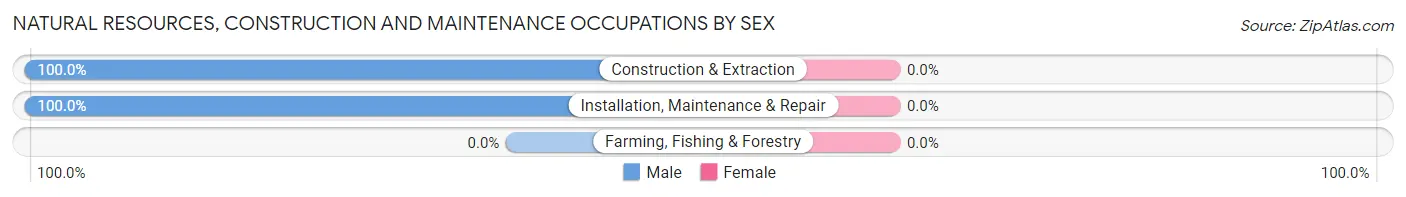
| Occupation | Male | Female |
| Farming, Fishing & Forestry | 0 (0.0%) | 0 (0.0%) |
| Construction & Extraction | 12 (100.0%) | 0 (0.0%) |
| Installation, Maintenance & Repair | 4 (100.0%) | 0 (0.0%) |
| Total (Category) | 16 (100.0%) | 0 (0.0%) |
| Total (Overall) | 47 (50.5%) | 46 (49.5%) |
Production, Transportation and Moving Occupations
The most common Production, Transportation and Moving occupations in Tanana are Material Moving (5 | 5.4%), and Production (4 | 4.3%).
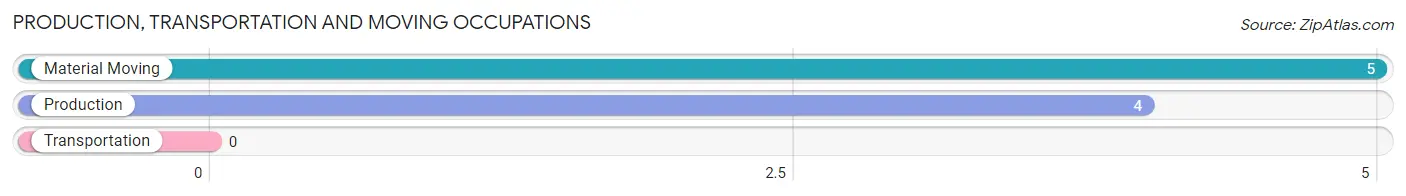
Production, Transportation and Moving Occupations by Sex
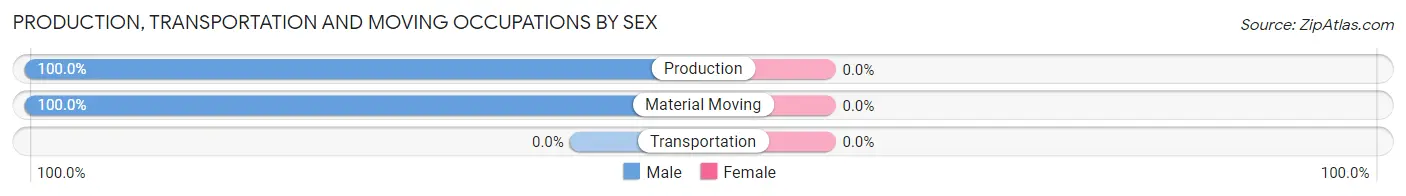
| Occupation | Male | Female |
| Production | 4 (100.0%) | 0 (0.0%) |
| Transportation | 0 (0.0%) | 0 (0.0%) |
| Material Moving | 5 (100.0%) | 0 (0.0%) |
| Total (Category) | 9 (100.0%) | 0 (0.0%) |
| Total (Overall) | 47 (50.5%) | 46 (49.5%) |
Employment Industries by Sex in Tanana
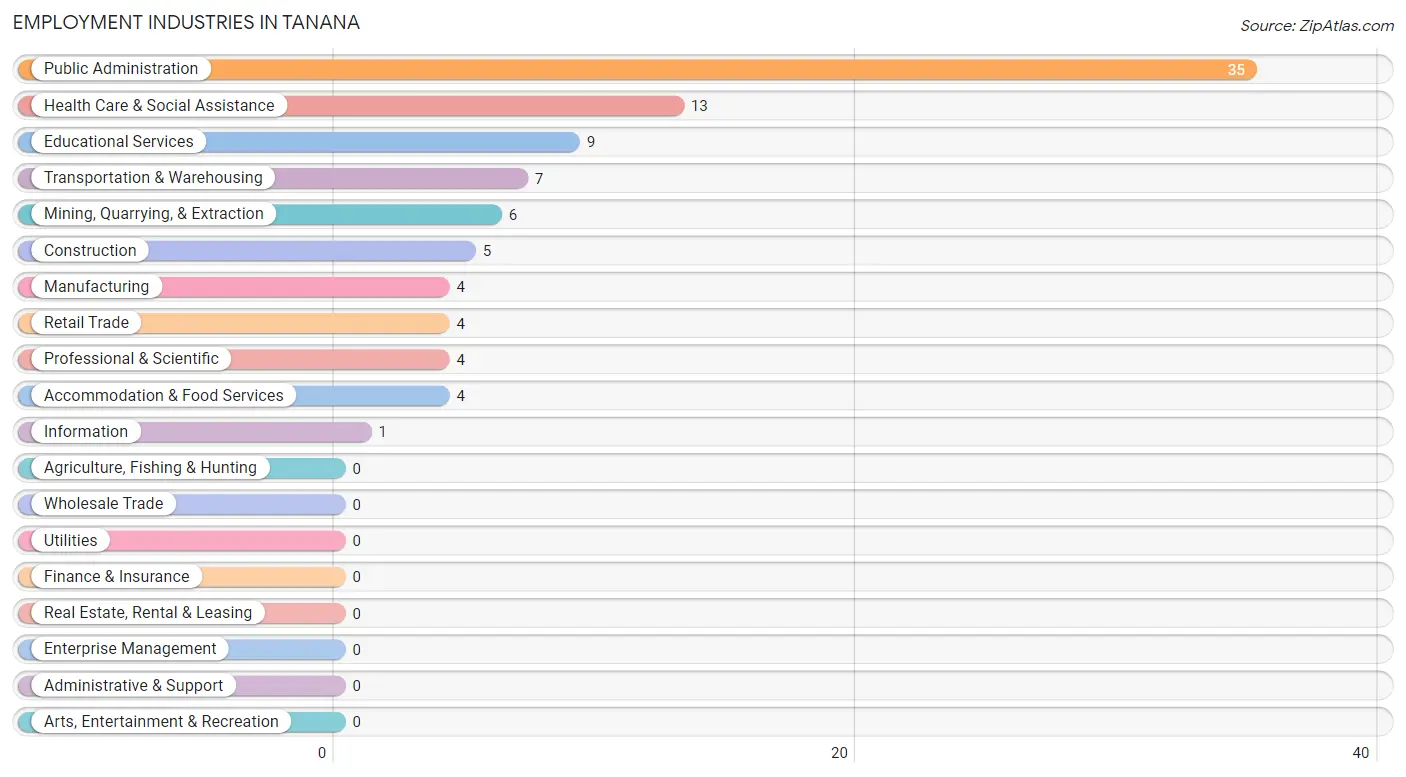
Employment Industries in Tanana
The major employment industries in Tanana include Public Administration (35 | 37.6%), Health Care & Social Assistance (13 | 14.0%), Educational Services (9 | 9.7%), Transportation & Warehousing (7 | 7.5%), and Mining, Quarrying, & Extraction (6 | 6.5%).
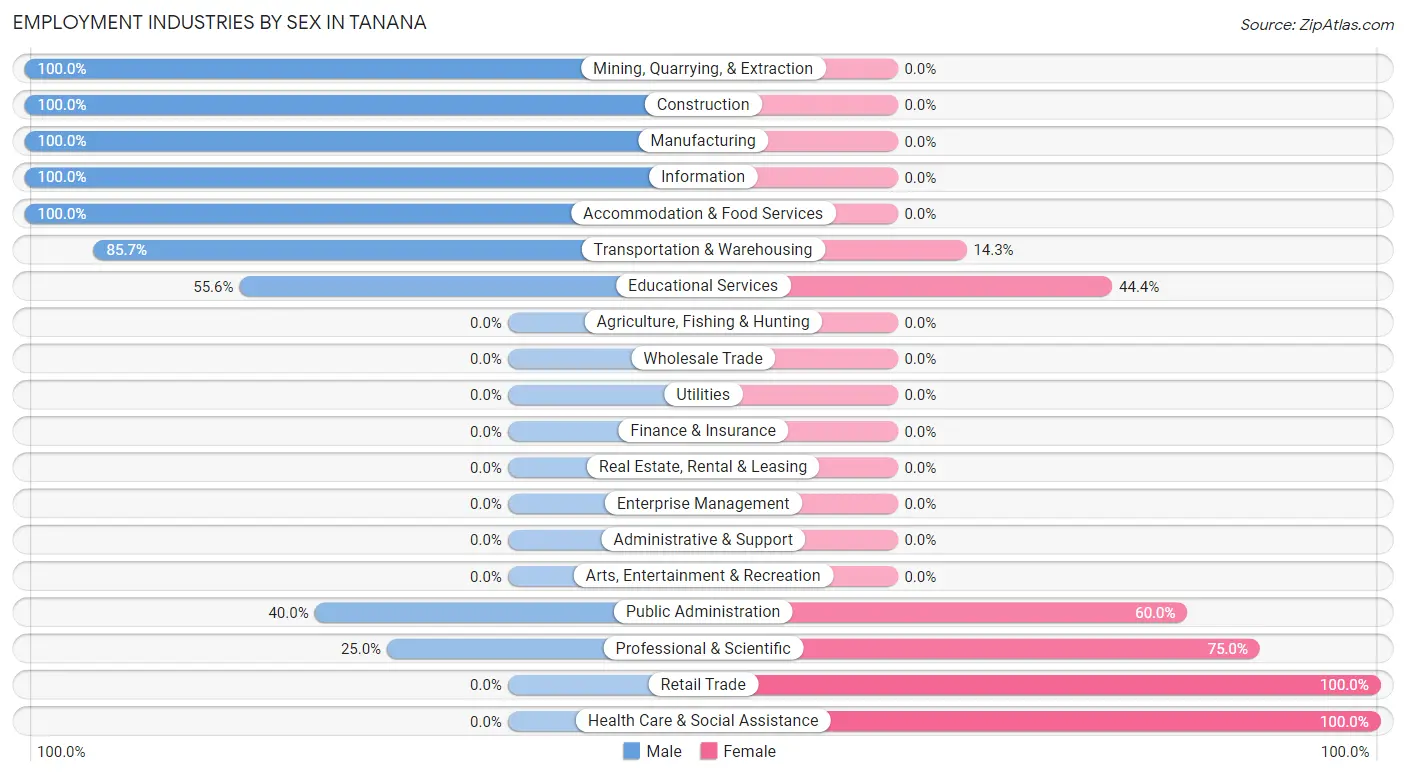
Employment Industries by Sex in Tanana
The Tanana industries that see more men than women are Mining, Quarrying, & Extraction (100.0%), Construction (100.0%), and Manufacturing (100.0%), whereas the industries that tend to have a higher number of women are Retail Trade (100.0%), Health Care & Social Assistance (100.0%), and Professional & Scientific (75.0%).
| Industry | Male | Female |
| Agriculture, Fishing & Hunting | 0 (0.0%) | 0 (0.0%) |
| Mining, Quarrying, & Extraction | 6 (100.0%) | 0 (0.0%) |
| Construction | 5 (100.0%) | 0 (0.0%) |
| Manufacturing | 4 (100.0%) | 0 (0.0%) |
| Wholesale Trade | 0 (0.0%) | 0 (0.0%) |
| Retail Trade | 0 (0.0%) | 4 (100.0%) |
| Transportation & Warehousing | 6 (85.7%) | 1 (14.3%) |
| Utilities | 0 (0.0%) | 0 (0.0%) |
| Information | 1 (100.0%) | 0 (0.0%) |
| Finance & Insurance | 0 (0.0%) | 0 (0.0%) |
| Real Estate, Rental & Leasing | 0 (0.0%) | 0 (0.0%) |
| Professional & Scientific | 1 (25.0%) | 3 (75.0%) |
| Enterprise Management | 0 (0.0%) | 0 (0.0%) |
| Administrative & Support | 0 (0.0%) | 0 (0.0%) |
| Educational Services | 5 (55.6%) | 4 (44.4%) |
| Health Care & Social Assistance | 0 (0.0%) | 13 (100.0%) |
| Arts, Entertainment & Recreation | 0 (0.0%) | 0 (0.0%) |
| Accommodation & Food Services | 4 (100.0%) | 0 (0.0%) |
| Public Administration | 14 (40.0%) | 21 (60.0%) |
| Total | 47 (50.5%) | 46 (49.5%) |
Education in Tanana
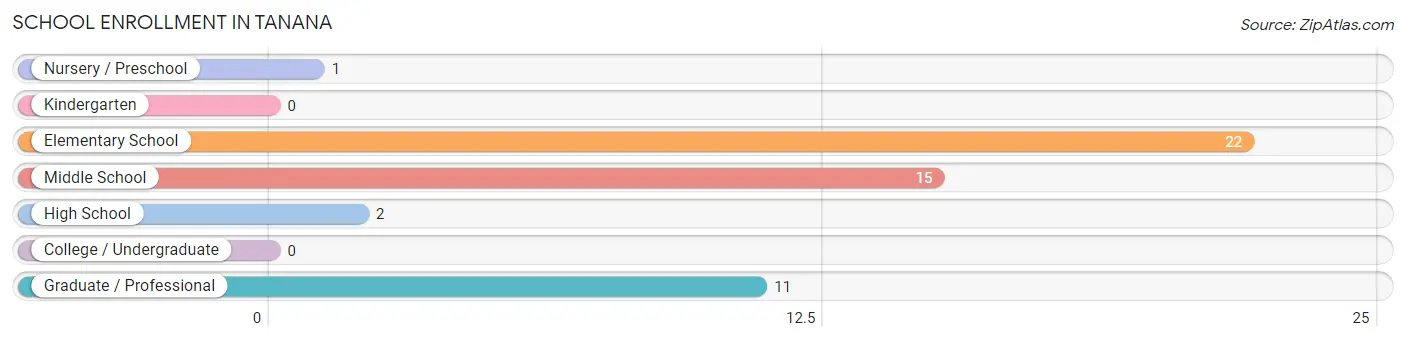
School Enrollment in Tanana
The most common levels of schooling among the 51 students in Tanana are elementary school (22 | 43.1%), middle school (15 | 29.4%), and graduate / professional (11 | 21.6%).
| School Level | # Students | % Students |
| Nursery / Preschool | 1 | 2.0% |
| Kindergarten | 0 | 0.0% |
| Elementary School | 22 | 43.1% |
| Middle School | 15 | 29.4% |
| High School | 2 | 3.9% |
| College / Undergraduate | 0 | 0.0% |
| Graduate / Professional | 11 | 21.6% |
| Total | 51 | 100.0% |
School Enrollment by Age by Funding Source in Tanana
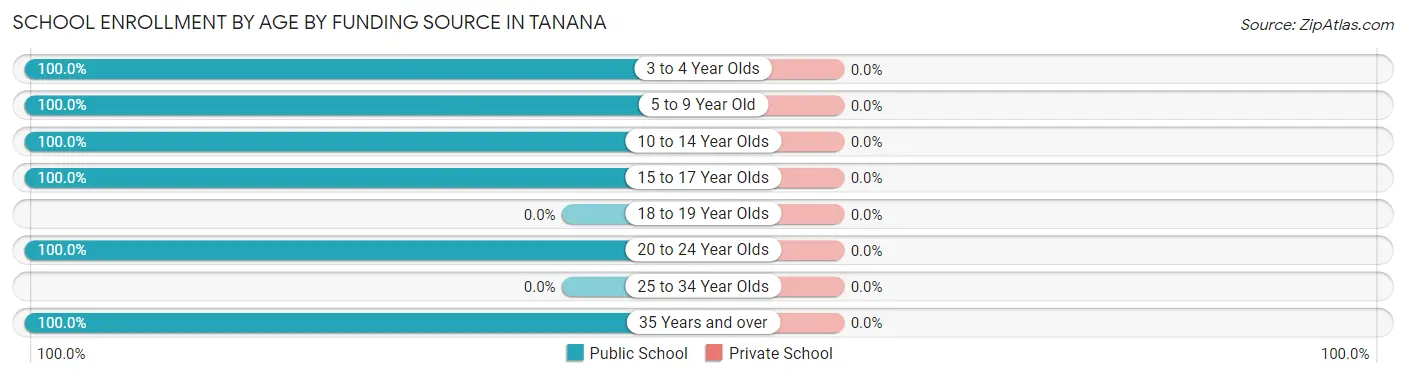
| Age Bracket | Public School | Private School |
| 3 to 4 Year Olds | 1 (100.0%) | 0 (0.0%) |
| 5 to 9 Year Old | 22 (100.0%) | 0 (0.0%) |
| 10 to 14 Year Olds | 15 (100.0%) | 0 (0.0%) |
| 15 to 17 Year Olds | 2 (100.0%) | 0 (0.0%) |
| 18 to 19 Year Olds | 0 (0.0%) | 0 (0.0%) |
| 20 to 24 Year Olds | 4 (100.0%) | 0 (0.0%) |
| 25 to 34 Year Olds | 0 (0.0%) | 0 (0.0%) |
| 35 Years and over | 7 (100.0%) | 0 (0.0%) |
| Total | 51 (100.0%) | 0 (0.0%) |
Educational Attainment by Field of Study in Tanana
Education (7 | 36.8%), arts & humanities (6 | 31.6%), computers & mathematics (2 | 10.5%), science & technology (2 | 10.5%), and engineering (1 | 5.3%) are the most common fields of study among 19 individuals in Tanana who have obtained a bachelor's degree or higher.
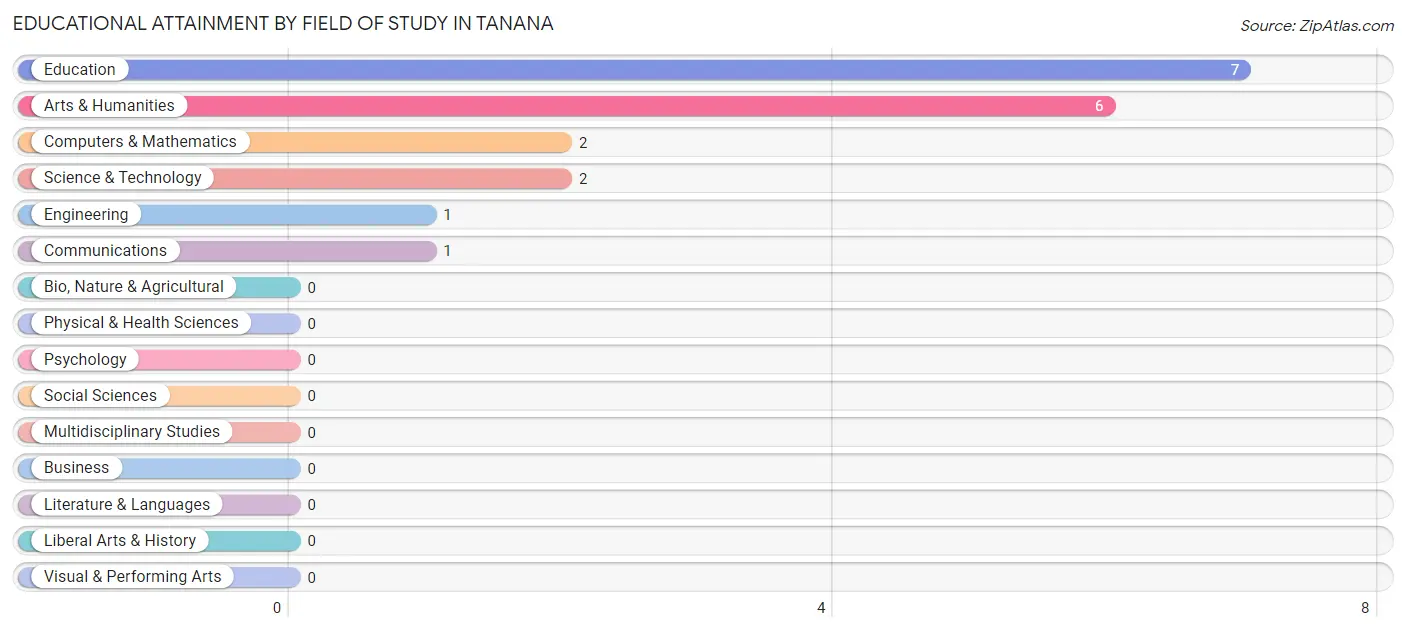
| Field of Study | # Graduates | % Graduates |
| Computers & Mathematics | 2 | 10.5% |
| Bio, Nature & Agricultural | 0 | 0.0% |
| Physical & Health Sciences | 0 | 0.0% |
| Psychology | 0 | 0.0% |
| Social Sciences | 0 | 0.0% |
| Engineering | 1 | 5.3% |
| Multidisciplinary Studies | 0 | 0.0% |
| Science & Technology | 2 | 10.5% |
| Business | 0 | 0.0% |
| Education | 7 | 36.8% |
| Literature & Languages | 0 | 0.0% |
| Liberal Arts & History | 0 | 0.0% |
| Visual & Performing Arts | 0 | 0.0% |
| Communications | 1 | 5.3% |
| Arts & Humanities | 6 | 31.6% |
| Total | 19 | 100.0% |
Transportation & Commute in Tanana
Vehicle Availability by Sex in Tanana
The most prevalent vehicle ownership categories in Tanana are males with 1 vehicle (20, accounting for 42.5%) and females with 1 vehicle (8, making up 44.4%).
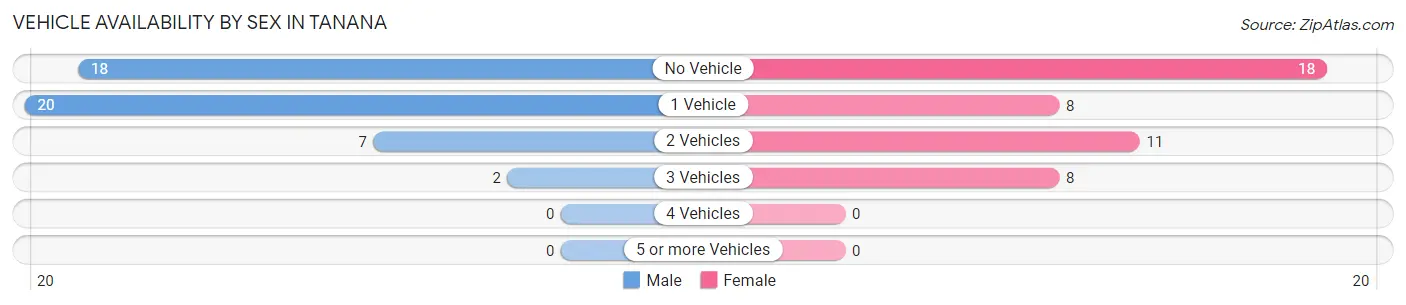
| Vehicles Available | Male | Female |
| No Vehicle | 18 (38.3%) | 18 (40.0%) |
| 1 Vehicle | 20 (42.5%) | 8 (17.8%) |
| 2 Vehicles | 7 (14.9%) | 11 (24.4%) |
| 3 Vehicles | 2 (4.3%) | 8 (17.8%) |
| 4 Vehicles | 0 (0.0%) | 0 (0.0%) |
| 5 or more Vehicles | 0 (0.0%) | 0 (0.0%) |
| Total | 47 (100.0%) | 45 (100.0%) |
Commute Time in Tanana
The most frequently occuring commute durations in Tanana are less than 5 minutes (30 commuters, 34.9%), 5 to 9 minutes (26 commuters, 30.2%), and 15 to 19 minutes (13 commuters, 15.1%).
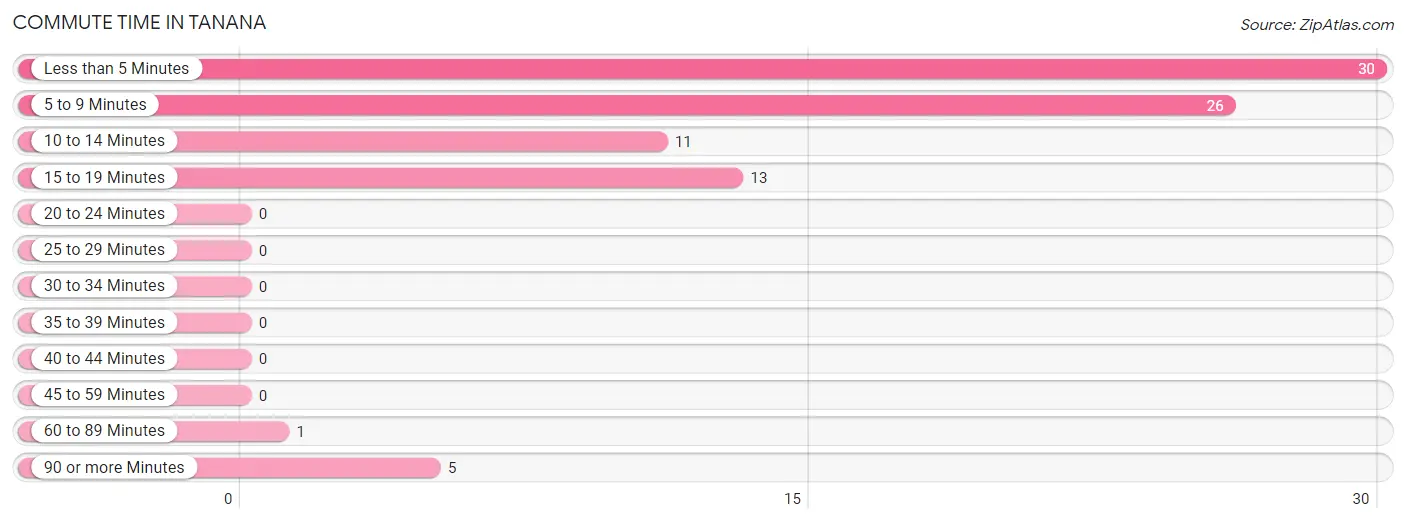
| Commute Time | # Commuters | % Commuters |
| Less than 5 Minutes | 30 | 34.9% |
| 5 to 9 Minutes | 26 | 30.2% |
| 10 to 14 Minutes | 11 | 12.8% |
| 15 to 19 Minutes | 13 | 15.1% |
| 20 to 24 Minutes | 0 | 0.0% |
| 25 to 29 Minutes | 0 | 0.0% |
| 30 to 34 Minutes | 0 | 0.0% |
| 35 to 39 Minutes | 0 | 0.0% |
| 40 to 44 Minutes | 0 | 0.0% |
| 45 to 59 Minutes | 0 | 0.0% |
| 60 to 89 Minutes | 1 | 1.2% |
| 90 or more Minutes | 5 | 5.8% |
Commute Time by Sex in Tanana
The most common commute times in Tanana are less than 5 minutes (19 commuters, 46.3%) for males and 5 to 9 minutes (18 commuters, 40.0%) for females.
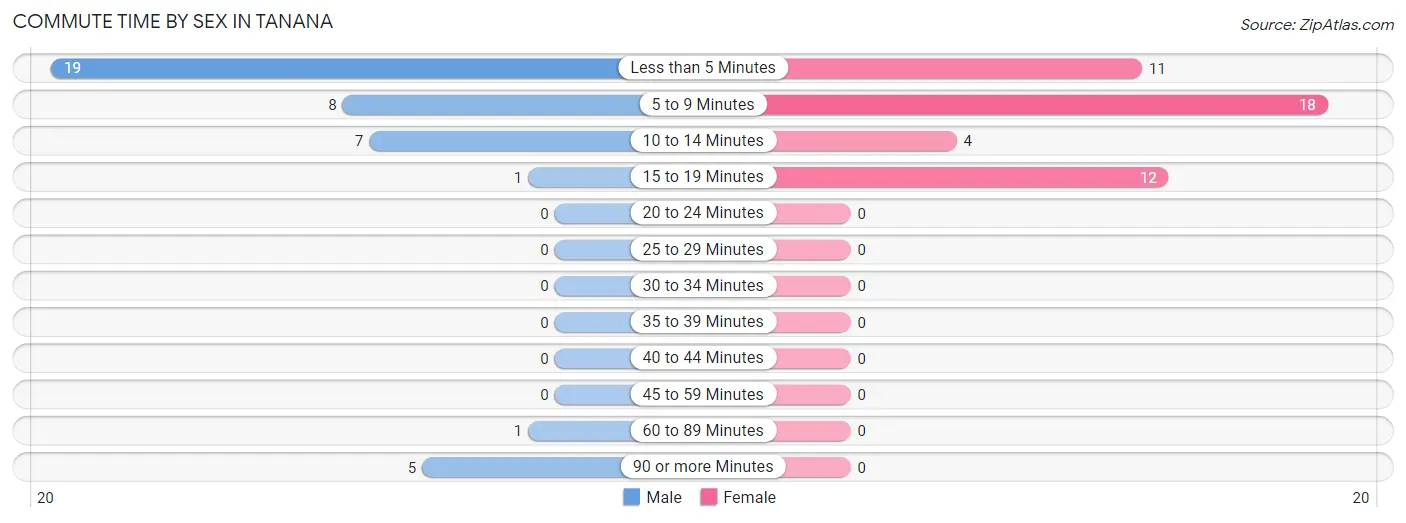
| Commute Time | Male | Female |
| Less than 5 Minutes | 19 (46.3%) | 11 (24.4%) |
| 5 to 9 Minutes | 8 (19.5%) | 18 (40.0%) |
| 10 to 14 Minutes | 7 (17.1%) | 4 (8.9%) |
| 15 to 19 Minutes | 1 (2.4%) | 12 (26.7%) |
| 20 to 24 Minutes | 0 (0.0%) | 0 (0.0%) |
| 25 to 29 Minutes | 0 (0.0%) | 0 (0.0%) |
| 30 to 34 Minutes | 0 (0.0%) | 0 (0.0%) |
| 35 to 39 Minutes | 0 (0.0%) | 0 (0.0%) |
| 40 to 44 Minutes | 0 (0.0%) | 0 (0.0%) |
| 45 to 59 Minutes | 0 (0.0%) | 0 (0.0%) |
| 60 to 89 Minutes | 1 (2.4%) | 0 (0.0%) |
| 90 or more Minutes | 5 (12.2%) | 0 (0.0%) |
Time of Departure to Work by Sex in Tanana
The most frequent times of departure to work in Tanana are 9:00 AM to 9:59 AM (20, 48.8%) for males and 7:30 AM to 7:59 AM (18, 40.0%) for females.
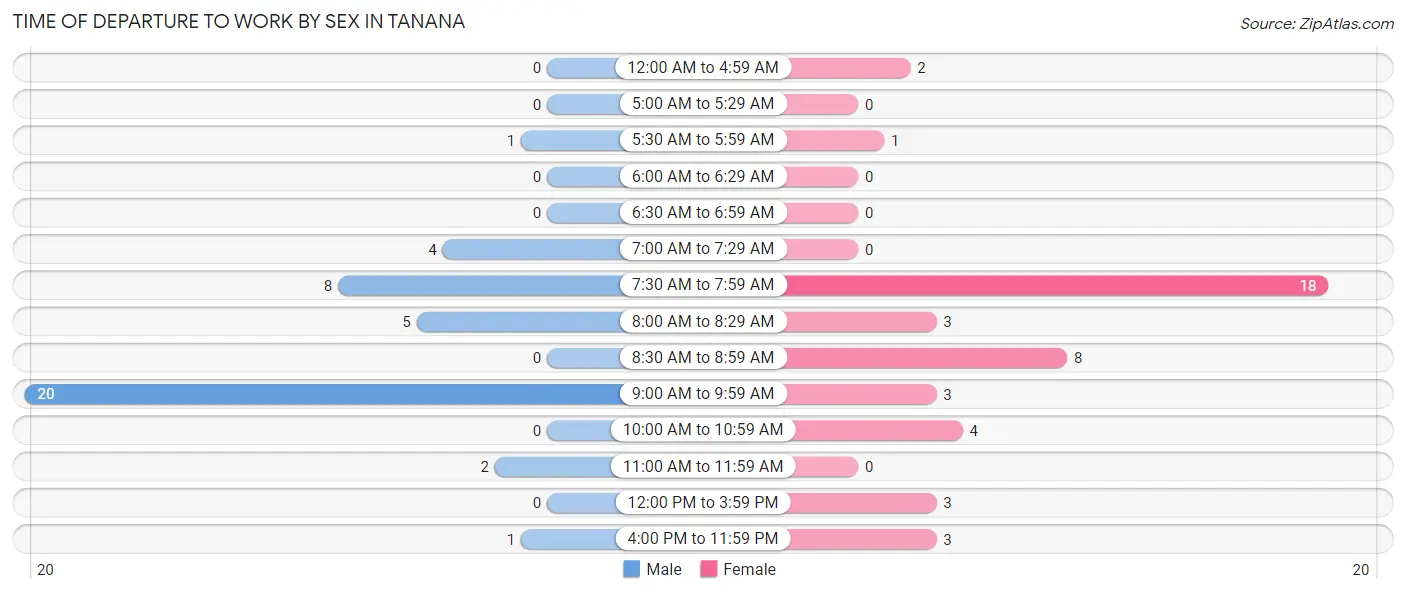
| Time of Departure | Male | Female |
| 12:00 AM to 4:59 AM | 0 (0.0%) | 2 (4.4%) |
| 5:00 AM to 5:29 AM | 0 (0.0%) | 0 (0.0%) |
| 5:30 AM to 5:59 AM | 1 (2.4%) | 1 (2.2%) |
| 6:00 AM to 6:29 AM | 0 (0.0%) | 0 (0.0%) |
| 6:30 AM to 6:59 AM | 0 (0.0%) | 0 (0.0%) |
| 7:00 AM to 7:29 AM | 4 (9.8%) | 0 (0.0%) |
| 7:30 AM to 7:59 AM | 8 (19.5%) | 18 (40.0%) |
| 8:00 AM to 8:29 AM | 5 (12.2%) | 3 (6.7%) |
| 8:30 AM to 8:59 AM | 0 (0.0%) | 8 (17.8%) |
| 9:00 AM to 9:59 AM | 20 (48.8%) | 3 (6.7%) |
| 10:00 AM to 10:59 AM | 0 (0.0%) | 4 (8.9%) |
| 11:00 AM to 11:59 AM | 2 (4.9%) | 0 (0.0%) |
| 12:00 PM to 3:59 PM | 0 (0.0%) | 3 (6.7%) |
| 4:00 PM to 11:59 PM | 1 (2.4%) | 3 (6.7%) |
| Total | 41 (100.0%) | 45 (100.0%) |
Housing Occupancy in Tanana
Occupancy by Ownership in Tanana
Of the total 81 dwellings in Tanana, owner-occupied units account for 38 (46.9%), while renter-occupied units make up 43 (53.1%).
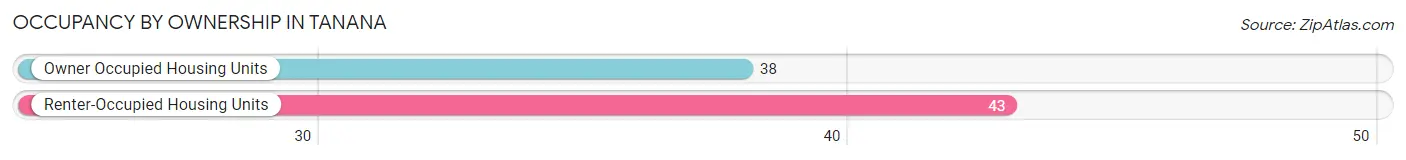
| Occupancy | # Housing Units | % Housing Units |
| Owner Occupied Housing Units | 38 | 46.9% |
| Renter-Occupied Housing Units | 43 | 53.1% |
| Total Occupied Housing Units | 81 | 100.0% |
Occupancy by Household Size in Tanana
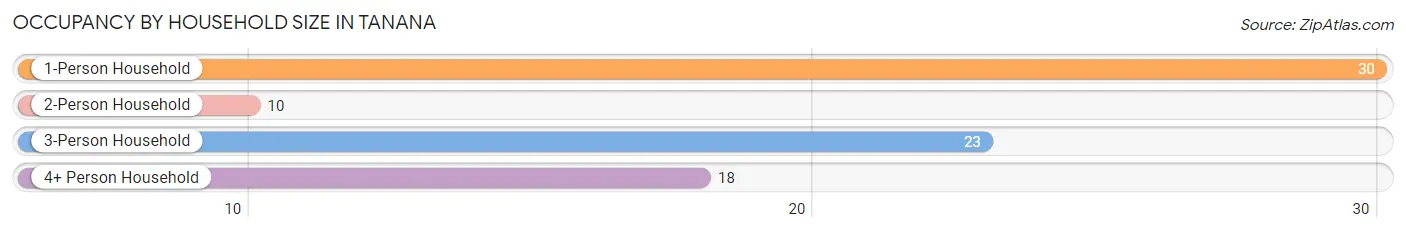
| Household Size | # Housing Units | % Housing Units |
| 1-Person Household | 30 | 37.0% |
| 2-Person Household | 10 | 12.3% |
| 3-Person Household | 23 | 28.4% |
| 4+ Person Household | 18 | 22.2% |
| Total Housing Units | 81 | 100.0% |
Occupancy by Ownership by Household Size in Tanana
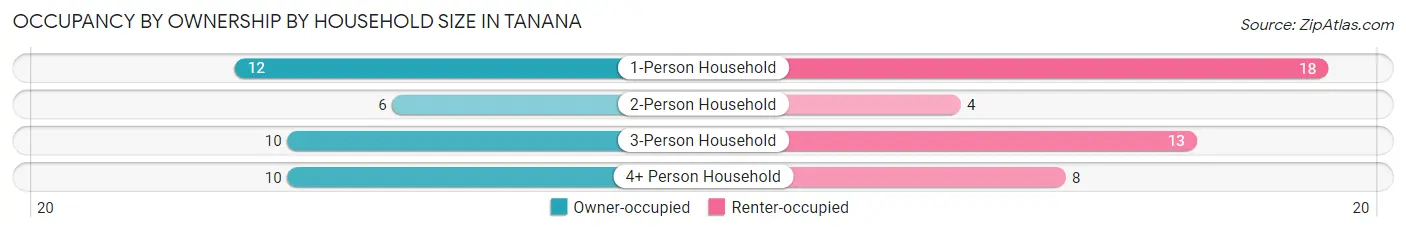
| Household Size | Owner-occupied | Renter-occupied |
| 1-Person Household | 12 (40.0%) | 18 (60.0%) |
| 2-Person Household | 6 (60.0%) | 4 (40.0%) |
| 3-Person Household | 10 (43.5%) | 13 (56.5%) |
| 4+ Person Household | 10 (55.6%) | 8 (44.4%) |
| Total Housing Units | 38 (46.9%) | 43 (53.1%) |
Occupancy by Educational Attainment in Tanana
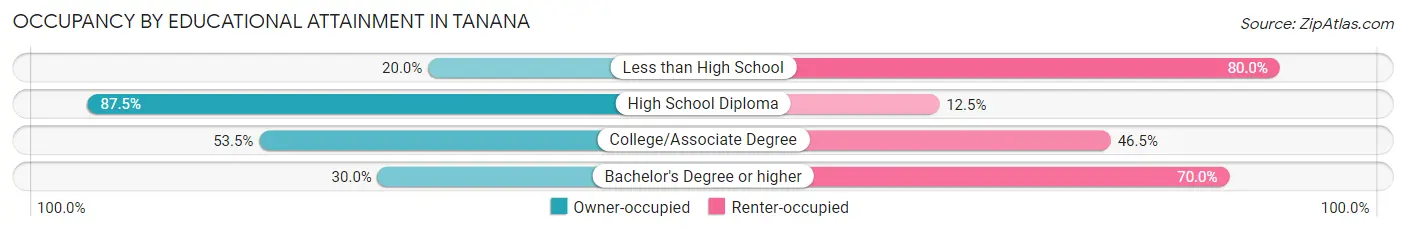
| Household Size | Owner-occupied | Renter-occupied |
| Less than High School | 2 (20.0%) | 8 (80.0%) |
| High School Diploma | 7 (87.5%) | 1 (12.5%) |
| College/Associate Degree | 23 (53.5%) | 20 (46.5%) |
| Bachelor's Degree or higher | 6 (30.0%) | 14 (70.0%) |
Occupancy by Age of Householder in Tanana
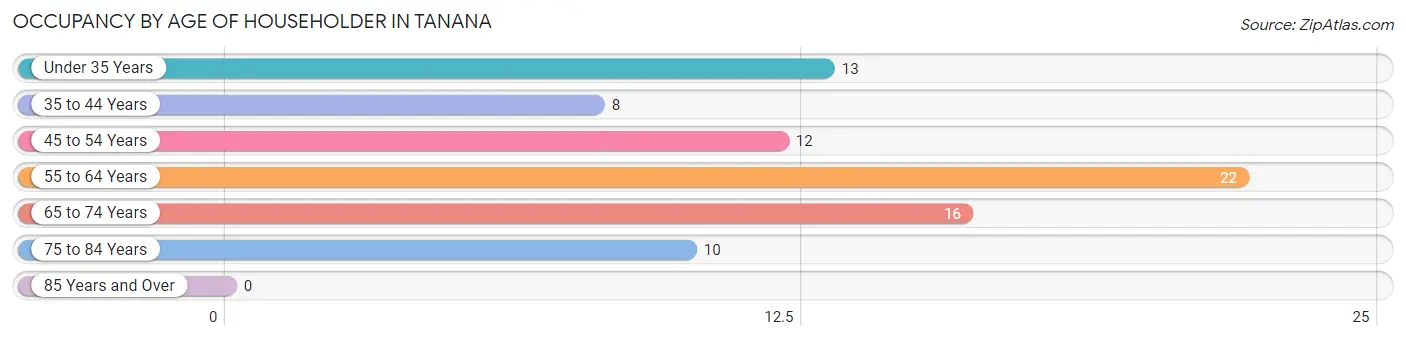
| Age Bracket | # Households | % Households |
| Under 35 Years | 13 | 16.1% |
| 35 to 44 Years | 8 | 9.9% |
| 45 to 54 Years | 12 | 14.8% |
| 55 to 64 Years | 22 | 27.2% |
| 65 to 74 Years | 16 | 19.8% |
| 75 to 84 Years | 10 | 12.3% |
| 85 Years and Over | 0 | 0.0% |
| Total | 81 | 100.0% |
Housing Finances in Tanana
Median Income by Occupancy in Tanana
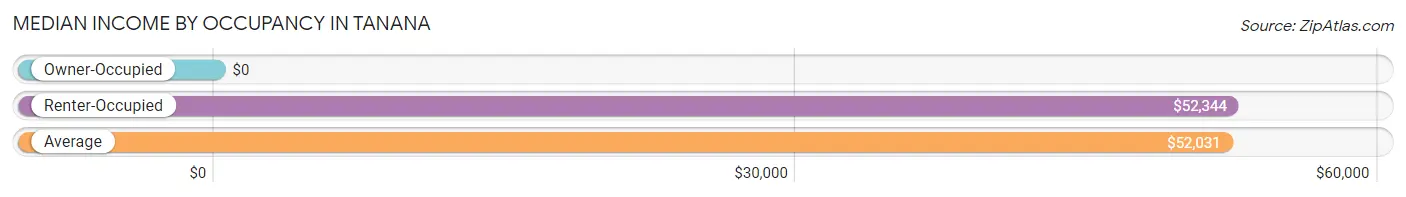
| Occupancy Type | # Households | Median Income |
| Owner-Occupied | 38 (46.9%) | $0 |
| Renter-Occupied | 43 (53.1%) | $52,344 |
| Average | 81 (100.0%) | $52,031 |
Occupancy by Householder Income Bracket in Tanana
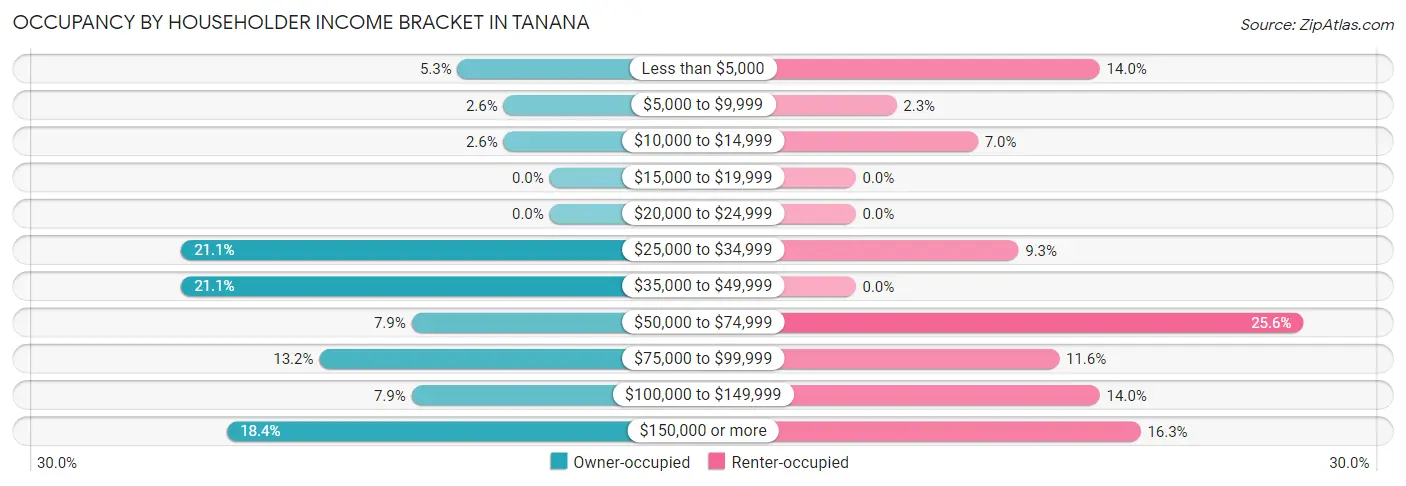
| Income Bracket | Owner-occupied | Renter-occupied |
| Less than $5,000 | 2 (5.3%) | 6 (14.0%) |
| $5,000 to $9,999 | 1 (2.6%) | 1 (2.3%) |
| $10,000 to $14,999 | 1 (2.6%) | 3 (7.0%) |
| $15,000 to $19,999 | 0 (0.0%) | 0 (0.0%) |
| $20,000 to $24,999 | 0 (0.0%) | 0 (0.0%) |
| $25,000 to $34,999 | 8 (21.0%) | 4 (9.3%) |
| $35,000 to $49,999 | 8 (21.0%) | 0 (0.0%) |
| $50,000 to $74,999 | 3 (7.9%) | 11 (25.6%) |
| $75,000 to $99,999 | 5 (13.2%) | 5 (11.6%) |
| $100,000 to $149,999 | 3 (7.9%) | 6 (14.0%) |
| $150,000 or more | 7 (18.4%) | 7 (16.3%) |
| Total | 38 (100.0%) | 43 (100.0%) |
Monthly Housing Cost Tiers in Tanana
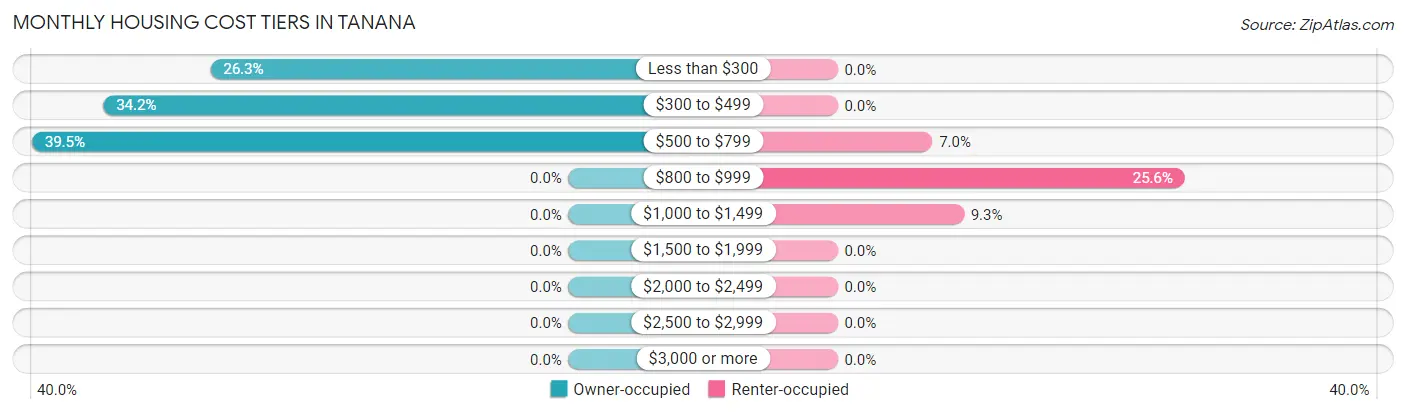
| Monthly Cost | Owner-occupied | Renter-occupied |
| Less than $300 | 10 (26.3%) | 0 (0.0%) |
| $300 to $499 | 13 (34.2%) | 0 (0.0%) |
| $500 to $799 | 15 (39.5%) | 3 (7.0%) |
| $800 to $999 | 0 (0.0%) | 11 (25.6%) |
| $1,000 to $1,499 | 0 (0.0%) | 4 (9.3%) |
| $1,500 to $1,999 | 0 (0.0%) | 0 (0.0%) |
| $2,000 to $2,499 | 0 (0.0%) | 0 (0.0%) |
| $2,500 to $2,999 | 0 (0.0%) | 0 (0.0%) |
| $3,000 or more | 0 (0.0%) | 0 (0.0%) |
| Total | 38 (100.0%) | 43 (100.0%) |
Physical Housing Characteristics in Tanana
Housing Structures in Tanana
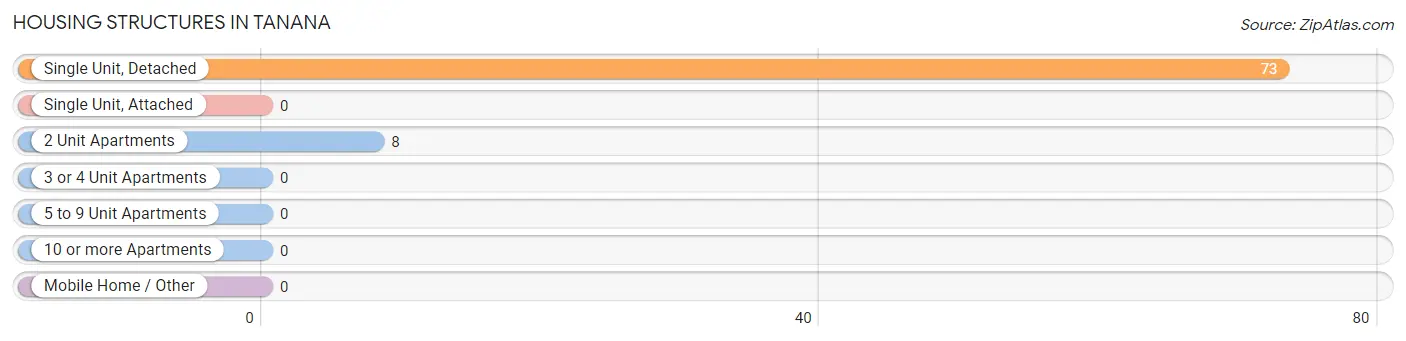
| Structure Type | # Housing Units | % Housing Units |
| Single Unit, Detached | 73 | 90.1% |
| Single Unit, Attached | 0 | 0.0% |
| 2 Unit Apartments | 8 | 9.9% |
| 3 or 4 Unit Apartments | 0 | 0.0% |
| 5 to 9 Unit Apartments | 0 | 0.0% |
| 10 or more Apartments | 0 | 0.0% |
| Mobile Home / Other | 0 | 0.0% |
| Total | 81 | 100.0% |
Housing Structures by Occupancy in Tanana
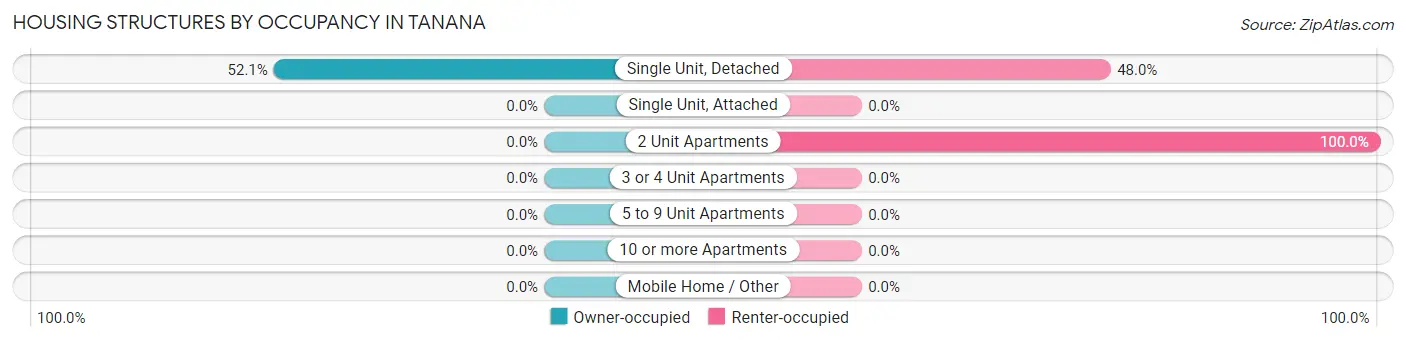
| Structure Type | Owner-occupied | Renter-occupied |
| Single Unit, Detached | 38 (52.0%) | 35 (47.9%) |
| Single Unit, Attached | 0 (0.0%) | 0 (0.0%) |
| 2 Unit Apartments | 0 (0.0%) | 8 (100.0%) |
| 3 or 4 Unit Apartments | 0 (0.0%) | 0 (0.0%) |
| 5 to 9 Unit Apartments | 0 (0.0%) | 0 (0.0%) |
| 10 or more Apartments | 0 (0.0%) | 0 (0.0%) |
| Mobile Home / Other | 0 (0.0%) | 0 (0.0%) |
| Total | 38 (46.9%) | 43 (53.1%) |
Housing Structures by Number of Rooms in Tanana
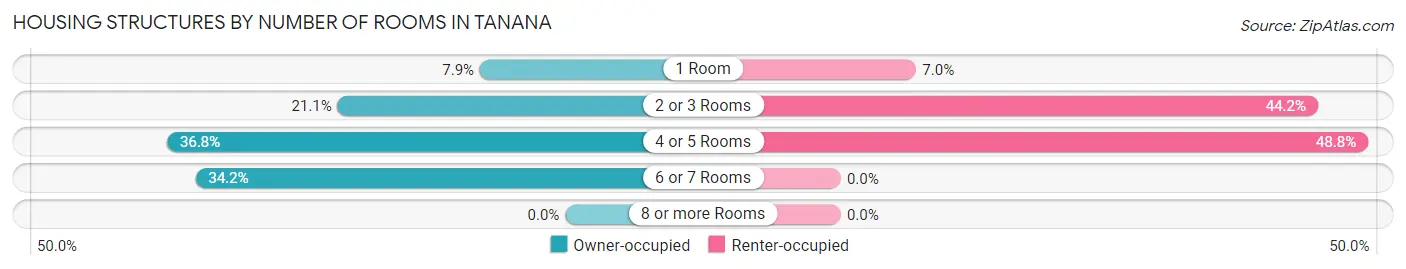
| Number of Rooms | Owner-occupied | Renter-occupied |
| 1 Room | 3 (7.9%) | 3 (7.0%) |
| 2 or 3 Rooms | 8 (21.0%) | 19 (44.2%) |
| 4 or 5 Rooms | 14 (36.8%) | 21 (48.8%) |
| 6 or 7 Rooms | 13 (34.2%) | 0 (0.0%) |
| 8 or more Rooms | 0 (0.0%) | 0 (0.0%) |
| Total | 38 (100.0%) | 43 (100.0%) |
Housing Structure by Heating Type in Tanana
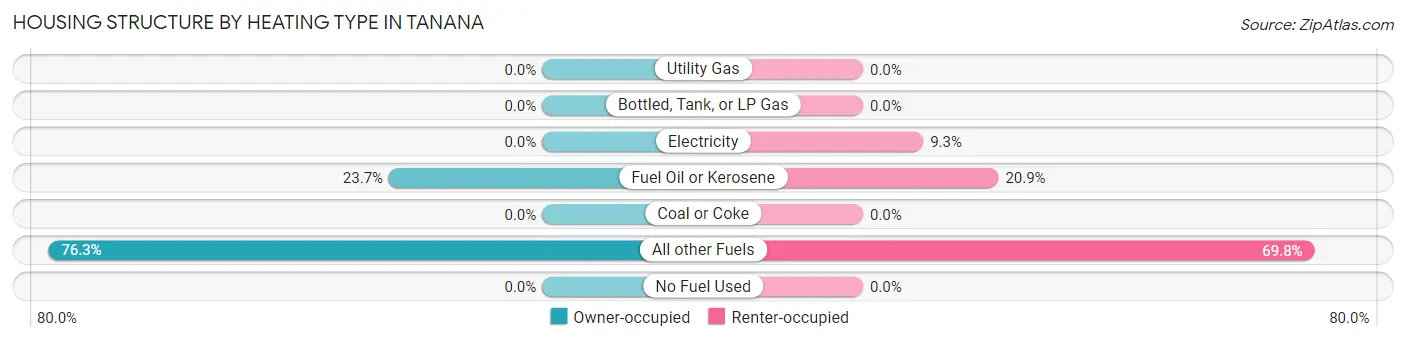
| Heating Type | Owner-occupied | Renter-occupied |
| Utility Gas | 0 (0.0%) | 0 (0.0%) |
| Bottled, Tank, or LP Gas | 0 (0.0%) | 0 (0.0%) |
| Electricity | 0 (0.0%) | 4 (9.3%) |
| Fuel Oil or Kerosene | 9 (23.7%) | 9 (20.9%) |
| Coal or Coke | 0 (0.0%) | 0 (0.0%) |
| All other Fuels | 29 (76.3%) | 30 (69.8%) |
| No Fuel Used | 0 (0.0%) | 0 (0.0%) |
| Total | 38 (100.0%) | 43 (100.0%) |
Household Vehicle Usage in Tanana
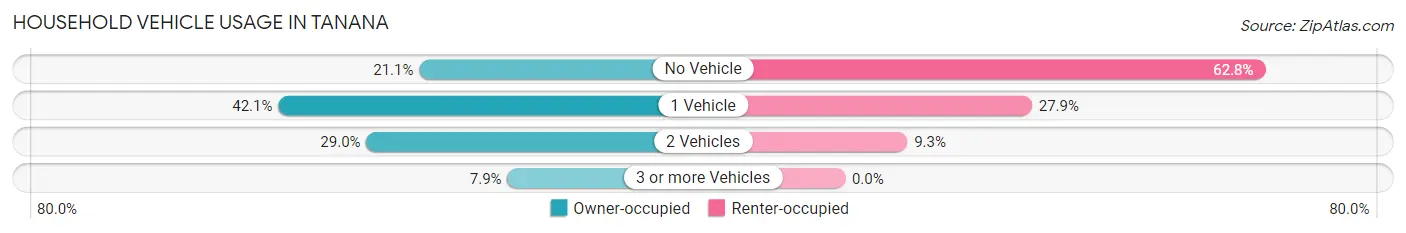
| Vehicles per Household | Owner-occupied | Renter-occupied |
| No Vehicle | 8 (21.0%) | 27 (62.8%) |
| 1 Vehicle | 16 (42.1%) | 12 (27.9%) |
| 2 Vehicles | 11 (28.9%) | 4 (9.3%) |
| 3 or more Vehicles | 3 (7.9%) | 0 (0.0%) |
| Total | 38 (100.0%) | 43 (100.0%) |
Real Estate & Mortgages in Tanana
Real Estate and Mortgage Overview in Tanana
| Characteristic | Without Mortgage | With Mortgage |
| Housing Units | 33 | 5 |
| Median Property Value | $61,000 | $0 |
| Median Household Income | - | - |
| Monthly Housing Costs | $407 | $0 |
| Real Estate Taxes | - | - |
Property Value by Mortgage Status in Tanana
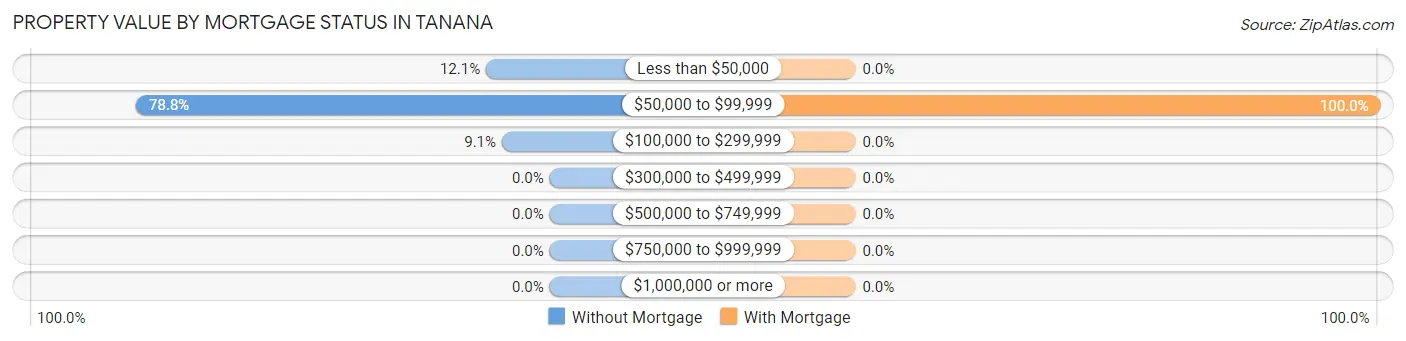
| Property Value | Without Mortgage | With Mortgage |
| Less than $50,000 | 4 (12.1%) | 0 (0.0%) |
| $50,000 to $99,999 | 26 (78.8%) | 5 (100.0%) |
| $100,000 to $299,999 | 3 (9.1%) | 0 (0.0%) |
| $300,000 to $499,999 | 0 (0.0%) | 0 (0.0%) |
| $500,000 to $749,999 | 0 (0.0%) | 0 (0.0%) |
| $750,000 to $999,999 | 0 (0.0%) | 0 (0.0%) |
| $1,000,000 or more | 0 (0.0%) | 0 (0.0%) |
| Total | 33 (100.0%) | 5 (100.0%) |
Household Income by Mortgage Status in Tanana
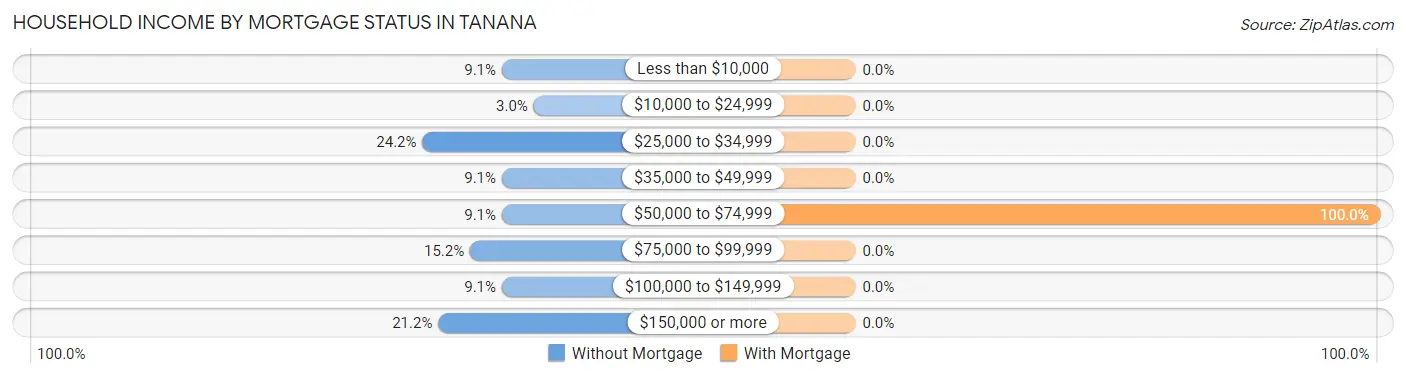
| Household Income | Without Mortgage | With Mortgage |
| Less than $10,000 | 3 (9.1%) | 0 (0.0%) |
| $10,000 to $24,999 | 1 (3.0%) | 0 (0.0%) |
| $25,000 to $34,999 | 8 (24.2%) | 0 (0.0%) |
| $35,000 to $49,999 | 3 (9.1%) | 0 (0.0%) |
| $50,000 to $74,999 | 3 (9.1%) | 5 (100.0%) |
| $75,000 to $99,999 | 5 (15.1%) | 0 (0.0%) |
| $100,000 to $149,999 | 3 (9.1%) | 0 (0.0%) |
| $150,000 or more | 7 (21.2%) | 0 (0.0%) |
| Total | 33 (100.0%) | 5 (100.0%) |
Property Value to Household Income Ratio in Tanana
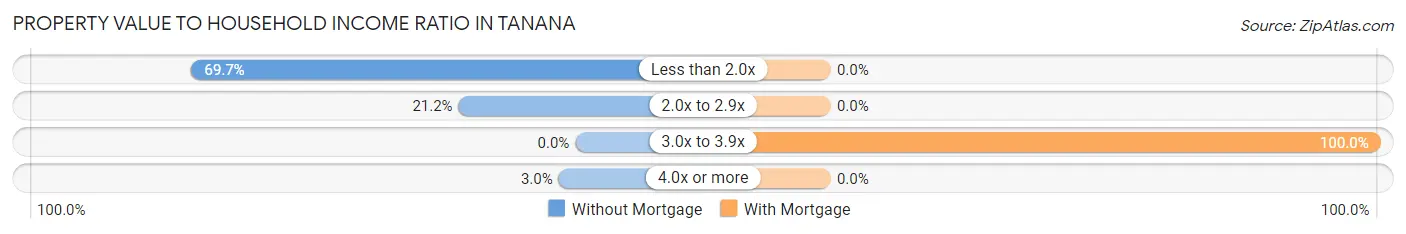
| Value-to-Income Ratio | Without Mortgage | With Mortgage |
| Less than 2.0x | 23 (69.7%) | 0 (0.0%) |
| 2.0x to 2.9x | 7 (21.2%) | 0 (0.0%) |
| 3.0x to 3.9x | 0 (0.0%) | 5 (100.0%) |
| 4.0x or more | 1 (3.0%) | 0 (0.0%) |
| Total | 33 (100.0%) | 5 (100.0%) |
Real Estate Taxes by Mortgage Status in Tanana
| Property Taxes | Without Mortgage | With Mortgage |
| Less than $800 | 0 (0.0%) | 0 (0.0%) |
| $800 to $1,499 | 0 (0.0%) | 0 (0.0%) |
| $800 to $1,499 | 0 (0.0%) | 0 (0.0%) |
| Total | 33 (100.0%) | 5 (100.0%) |
Health & Disability in Tanana
Health Insurance Coverage by Age in Tanana
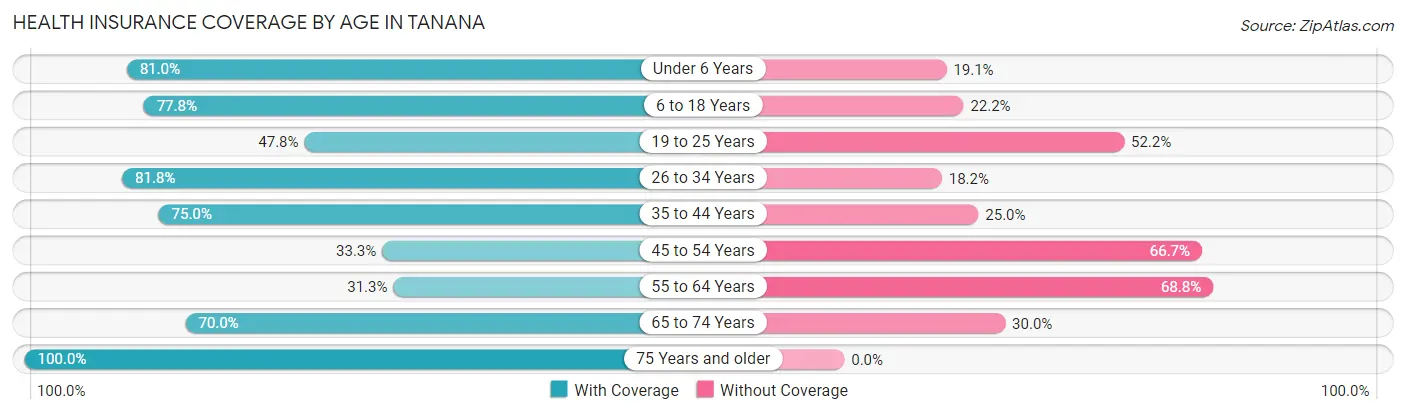
| Age Bracket | With Coverage | Without Coverage |
| Under 6 Years | 17 (80.9%) | 4 (19.1%) |
| 6 to 18 Years | 35 (77.8%) | 10 (22.2%) |
| 19 to 25 Years | 11 (47.8%) | 12 (52.2%) |
| 26 to 34 Years | 9 (81.8%) | 2 (18.2%) |
| 35 to 44 Years | 12 (75.0%) | 4 (25.0%) |
| 45 to 54 Years | 8 (33.3%) | 16 (66.7%) |
| 55 to 64 Years | 10 (31.2%) | 22 (68.8%) |
| 65 to 74 Years | 14 (70.0%) | 6 (30.0%) |
| 75 Years and older | 13 (100.0%) | 0 (0.0%) |
| Total | 129 (62.9%) | 76 (37.1%) |
Health Insurance Coverage by Citizenship Status in Tanana
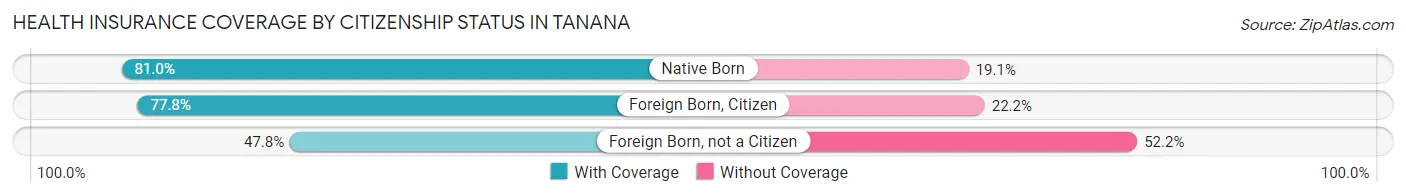
| Citizenship Status | With Coverage | Without Coverage |
| Native Born | 17 (80.9%) | 4 (19.1%) |
| Foreign Born, Citizen | 35 (77.8%) | 10 (22.2%) |
| Foreign Born, not a Citizen | 11 (47.8%) | 12 (52.2%) |
Health Insurance Coverage by Household Income in Tanana
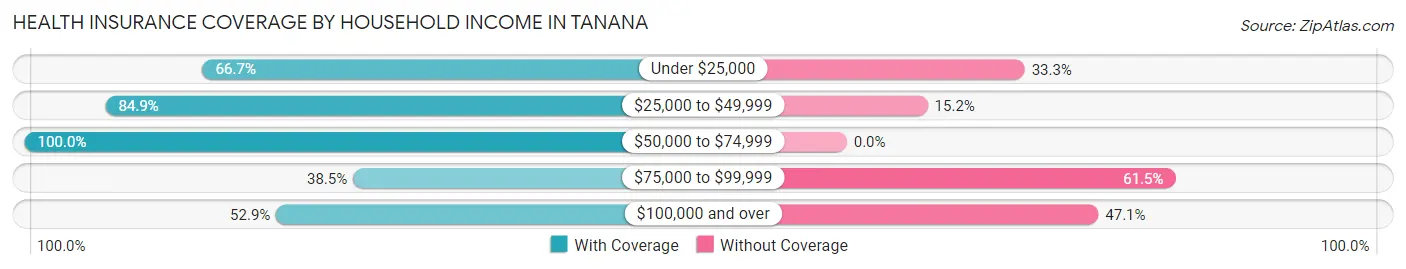
| Household Income | With Coverage | Without Coverage |
| Under $25,000 | 12 (66.7%) | 6 (33.3%) |
| $25,000 to $49,999 | 28 (84.9%) | 5 (15.1%) |
| $50,000 to $74,999 | 28 (100.0%) | 0 (0.0%) |
| $75,000 to $99,999 | 15 (38.5%) | 24 (61.5%) |
| $100,000 and over | 46 (52.9%) | 41 (47.1%) |
Public vs Private Health Insurance Coverage by Age in Tanana
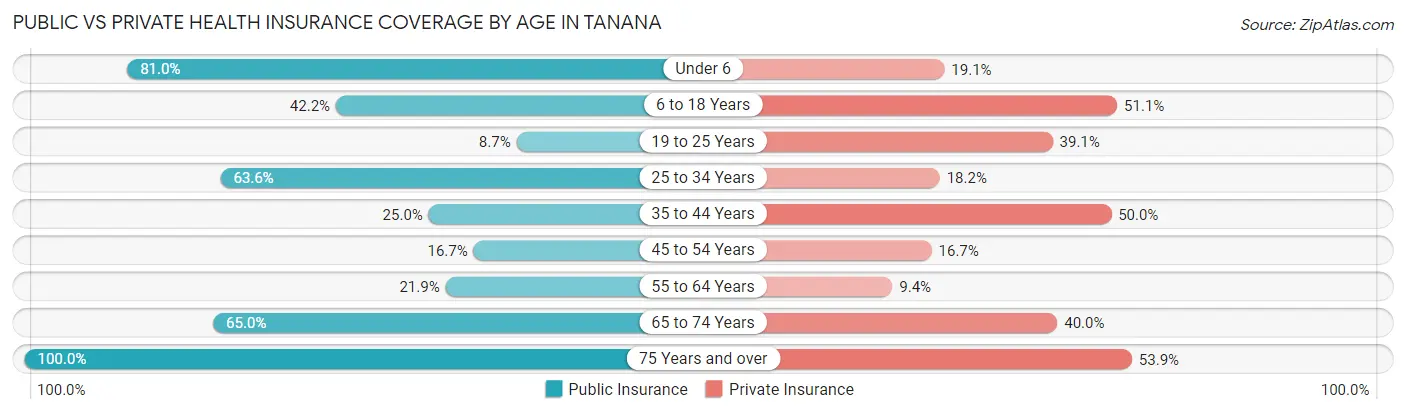
| Age Bracket | Public Insurance | Private Insurance |
| Under 6 | 17 (80.9%) | 4 (19.1%) |
| 6 to 18 Years | 19 (42.2%) | 23 (51.1%) |
| 19 to 25 Years | 2 (8.7%) | 9 (39.1%) |
| 25 to 34 Years | 7 (63.6%) | 2 (18.2%) |
| 35 to 44 Years | 4 (25.0%) | 8 (50.0%) |
| 45 to 54 Years | 4 (16.7%) | 4 (16.7%) |
| 55 to 64 Years | 7 (21.9%) | 3 (9.4%) |
| 65 to 74 Years | 13 (65.0%) | 8 (40.0%) |
| 75 Years and over | 13 (100.0%) | 7 (53.8%) |
| Total | 86 (41.9%) | 68 (33.2%) |
Disability Status by Sex by Age in Tanana
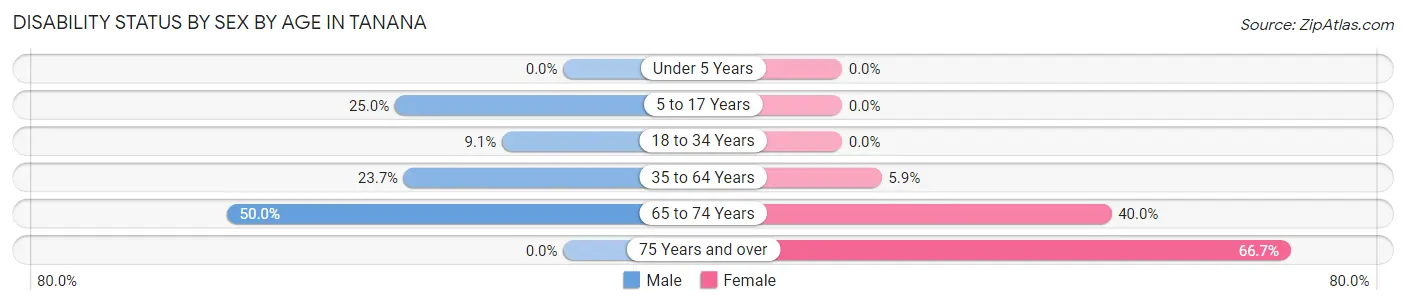
| Age Bracket | Male | Female |
| Under 5 Years | 0 (0.0%) | 0 (0.0%) |
| 5 to 17 Years | 5 (25.0%) | 0 (0.0%) |
| 18 to 34 Years | 2 (9.1%) | 0 (0.0%) |
| 35 to 64 Years | 9 (23.7%) | 2 (5.9%) |
| 65 to 74 Years | 5 (50.0%) | 4 (40.0%) |
| 75 Years and over | 0 (0.0%) | 4 (66.7%) |
Disability Class by Sex by Age in Tanana
Disability Class: Hearing Difficulty
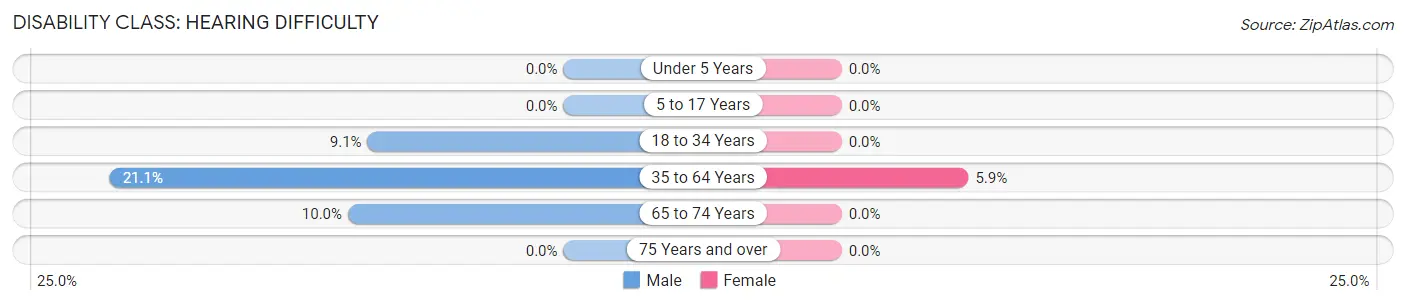
| Age Bracket | Male | Female |
| Under 5 Years | 0 (0.0%) | 0 (0.0%) |
| 5 to 17 Years | 0 (0.0%) | 0 (0.0%) |
| 18 to 34 Years | 2 (9.1%) | 0 (0.0%) |
| 35 to 64 Years | 8 (21.0%) | 2 (5.9%) |
| 65 to 74 Years | 1 (10.0%) | 0 (0.0%) |
| 75 Years and over | 0 (0.0%) | 0 (0.0%) |
Disability Class: Vision Difficulty
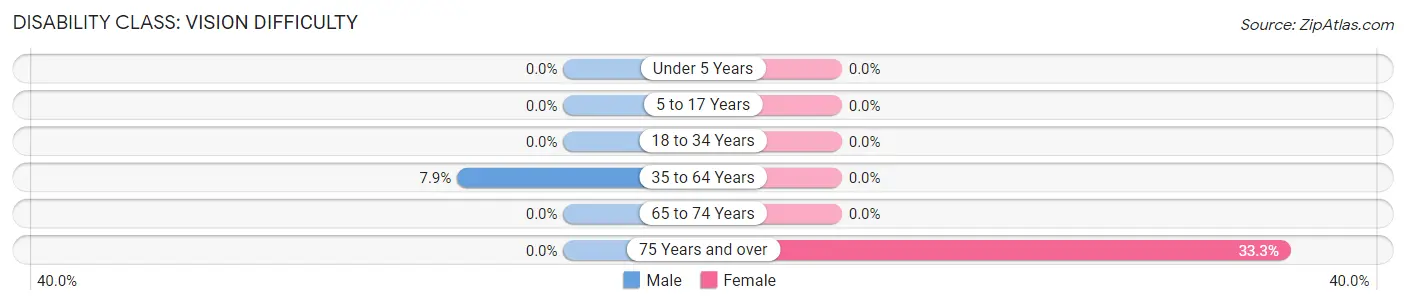
| Age Bracket | Male | Female |
| Under 5 Years | 0 (0.0%) | 0 (0.0%) |
| 5 to 17 Years | 0 (0.0%) | 0 (0.0%) |
| 18 to 34 Years | 0 (0.0%) | 0 (0.0%) |
| 35 to 64 Years | 3 (7.9%) | 0 (0.0%) |
| 65 to 74 Years | 0 (0.0%) | 0 (0.0%) |
| 75 Years and over | 0 (0.0%) | 2 (33.3%) |
Disability Class: Cognitive Difficulty
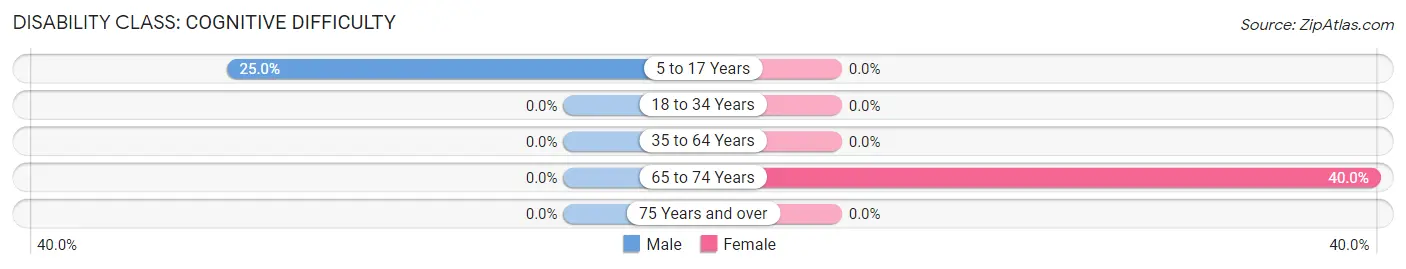
| Age Bracket | Male | Female |
| 5 to 17 Years | 5 (25.0%) | 0 (0.0%) |
| 18 to 34 Years | 0 (0.0%) | 0 (0.0%) |
| 35 to 64 Years | 0 (0.0%) | 0 (0.0%) |
| 65 to 74 Years | 0 (0.0%) | 4 (40.0%) |
| 75 Years and over | 0 (0.0%) | 0 (0.0%) |
Disability Class: Ambulatory Difficulty
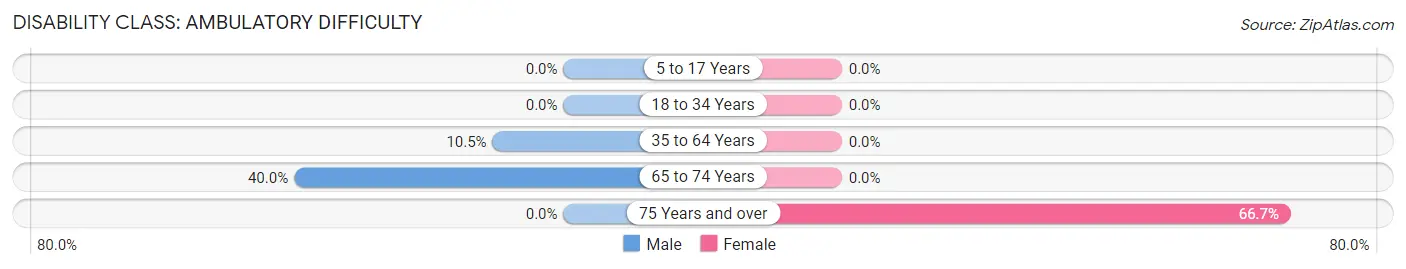
| Age Bracket | Male | Female |
| 5 to 17 Years | 0 (0.0%) | 0 (0.0%) |
| 18 to 34 Years | 0 (0.0%) | 0 (0.0%) |
| 35 to 64 Years | 4 (10.5%) | 0 (0.0%) |
| 65 to 74 Years | 4 (40.0%) | 0 (0.0%) |
| 75 Years and over | 0 (0.0%) | 4 (66.7%) |
Disability Class: Self-Care Difficulty
| Age Bracket | Male | Female |
| 5 to 17 Years | 0 (0.0%) | 0 (0.0%) |
| 18 to 34 Years | 0 (0.0%) | 0 (0.0%) |
| 35 to 64 Years | 0 (0.0%) | 0 (0.0%) |
| 65 to 74 Years | 0 (0.0%) | 0 (0.0%) |
| 75 Years and over | 0 (0.0%) | 0 (0.0%) |
Technology Access in Tanana
Computing Device Access in Tanana
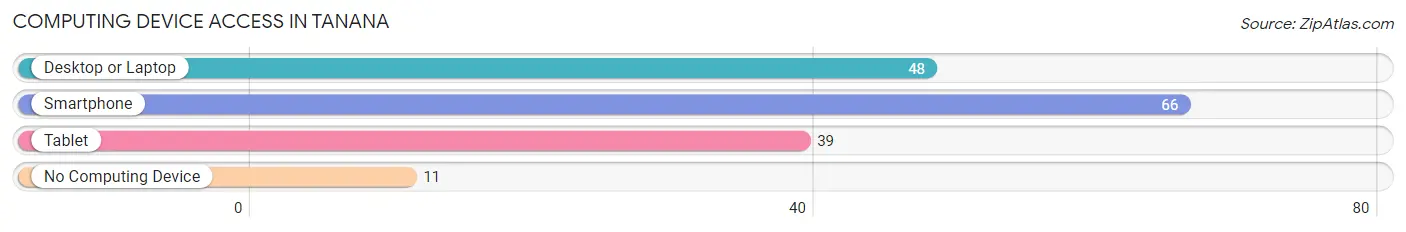
| Device Type | # Households | % Households |
| Desktop or Laptop | 48 | 59.3% |
| Smartphone | 66 | 81.5% |
| Tablet | 39 | 48.1% |
| No Computing Device | 11 | 13.6% |
| Total | 81 | 100.0% |
Internet Access in Tanana
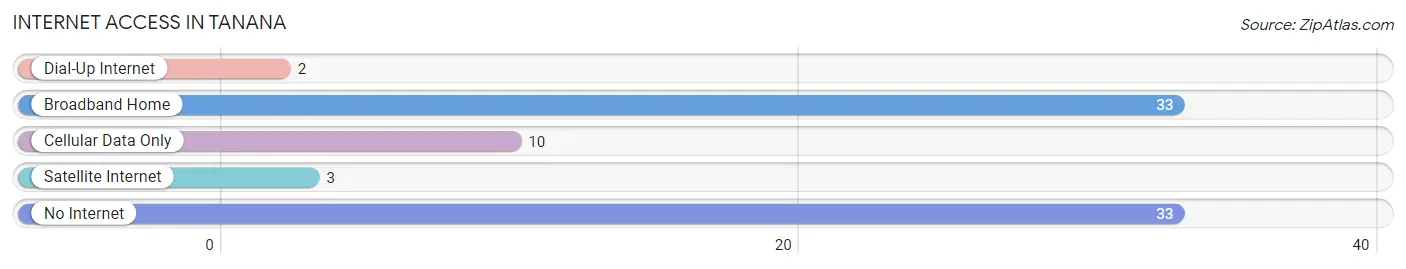
| Internet Type | # Households | % Households |
| Dial-Up Internet | 2 | 2.5% |
| Broadband Home | 33 | 40.7% |
| Cellular Data Only | 10 | 12.3% |
| Satellite Internet | 3 | 3.7% |
| No Internet | 33 | 40.7% |
| Total | 81 | 100.0% |
Tanana Summary
Tanana, Alaska is a small city located in the interior of Alaska, approximately 200 miles west of Fairbanks. It is the largest city in the Yukon-Koyukuk Census Area and is the gateway to the Yukon River. The city has a population of approximately 500 people and is the traditional home of the Tanana Athabascan people.
Geography
Tanana is located in the interior of Alaska, approximately 200 miles west of Fairbanks. It is situated on the banks of the Tanana River, which is a major tributary of the Yukon River. The city is surrounded by the White Mountains and the Tanana Hills, and is located in a region of boreal forest. The climate in Tanana is subarctic, with cold winters and short, warm summers.
Economy
The economy of Tanana is largely based on subsistence activities, such as hunting, fishing, and trapping. The city is also home to a number of small businesses, including a general store, a gas station, and a restaurant. The city is also home to a number of small-scale mining operations, which provide employment for some of the local residents.
Demographics
As of the 2010 census, the population of Tanana was 498 people. The racial makeup of the city was 95.2% Native American, 2.2% White, 0.2% Asian, 0.2% Pacific Islander, and 2.2% from other races. The median household income in Tanana was $25,000, and the median family income was $30,000.
History
The Tanana Athabascan people have lived in the area for thousands of years. The first European settlers arrived in the area in the late 19th century, and the city of Tanana was officially established in 1901. The city was named after the Tanana River, which was named by the explorer Robert Campbell in 1847.
In the early 20th century, Tanana was a major trading post for the region, and was a hub for riverboat traffic on the Yukon River. The city was also home to a number of gold mining operations, which provided employment for many of the local residents.
In the late 20th century, Tanana experienced a period of economic decline, as the gold mining operations closed and the riverboat traffic decreased. The city has since experienced a resurgence, as the local economy has diversified and the population has grown.
Today, Tanana is a small but vibrant city, with a diverse population and a strong sense of community. The city is home to a number of small businesses, and is a popular destination for tourists and outdoor enthusiasts. The city is also home to a number of cultural and historical sites, including the Tanana Chiefs Conference Hall and the Tanana Valley State Fairgrounds.
Common Questions
What is Per Capita Income in Tanana?
Per Capita income in Tanana is $32,458.
What is the Median Family Income in Tanana?
Median Family Income in Tanana is $91,875.
What is the Median Household income in Tanana?
Median Household Income in Tanana is $52,031.
What is Income or Wage Gap in Tanana?
Income or Wage Gap in Tanana is 8.8%.
Women in Tanana earn 91.2 cents for every dollar earned by a man.
What is Inequality or Gini Index in Tanana?
Inequality or Gini Index in Tanana is 0.49.
What is the Total Population of Tanana?
Total Population of Tanana is 214.
What is the Total Male Population of Tanana?
Total Male Population of Tanana is 114.
What is the Total Female Population of Tanana?
Total Female Population of Tanana is 100.
What is the Ratio of Males per 100 Females in Tanana?
There are 114.00 Males per 100 Females in Tanana.
What is the Ratio of Females per 100 Males in Tanana?
There are 87.72 Females per 100 Males in Tanana.
What is the Median Population Age in Tanana?
Median Population Age in Tanana is 37.3 Years.
What is the Average Family Size in Tanana
Average Family Size in Tanana is 3.3 People.
What is the Average Household Size in Tanana
Average Household Size in Tanana is 2.5 People.
How Large is the Labor Force in Tanana?
There are 100 People in the Labor Forcein in Tanana.
What is the Percentage of People in the Labor Force in Tanana?
64.5% of People are in the Labor Force in Tanana.
What is the Unemployment Rate in Tanana?
Unemployment Rate in Tanana is 7.0%.