Tanacross, AK Map & Demographics
Tanacross Map
Tanacross Overview
$14,525
PER CAPITA INCOME
$80,833
AVG FAMILY INCOME
$53,125
AVG HOUSEHOLD INCOME
0.39
INEQUALITY / GINI INDEX
136
TOTAL POPULATION
77
MALE POPULATION
59
FEMALE POPULATION
130.51
MALES / 100 FEMALES
76.62
FEMALES / 100 MALES
32.3
MEDIAN AGE
6.3
AVG FAMILY SIZE
4.9
AVG HOUSEHOLD SIZE
35
LABOR FORCE [ PEOPLE ]
34.7%
PERCENT IN LABOR FORCE
Tanacross Zip Codes
Tanacross Area Codes
Income in Tanacross
Income Overview in Tanacross
Per Capita Income in Tanacross is $14,525, while median incomes of families and households are $80,833 and $53,125 respectively.
| Characteristic | Number | Measure |
| Per Capita Income | 136 | $14,525 |
| Median Family Income | 20 | $80,833 |
| Mean Family Income | 20 | $75,695 |
| Median Household Income | 28 | $53,125 |
| Mean Household Income | 28 | $58,557 |
| Income Deficit | 20 | $0 |
| Wage / Income Gap (%) | 136 | 0.00% |
| Wage / Income Gap ($) | 136 | 100.00¢ per $1 |
| Gini / Inequality Index | 136 | 0.39 |
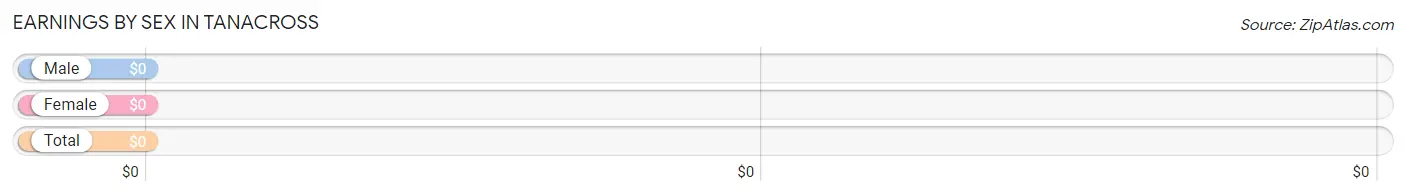
Earnings by Sex in Tanacross
| Sex | Number | Average Earnings |
| Male | 32 (51.6%) | $0 |
| Female | 30 (48.4%) | $0 |
| Total | 62 (100.0%) | $0 |
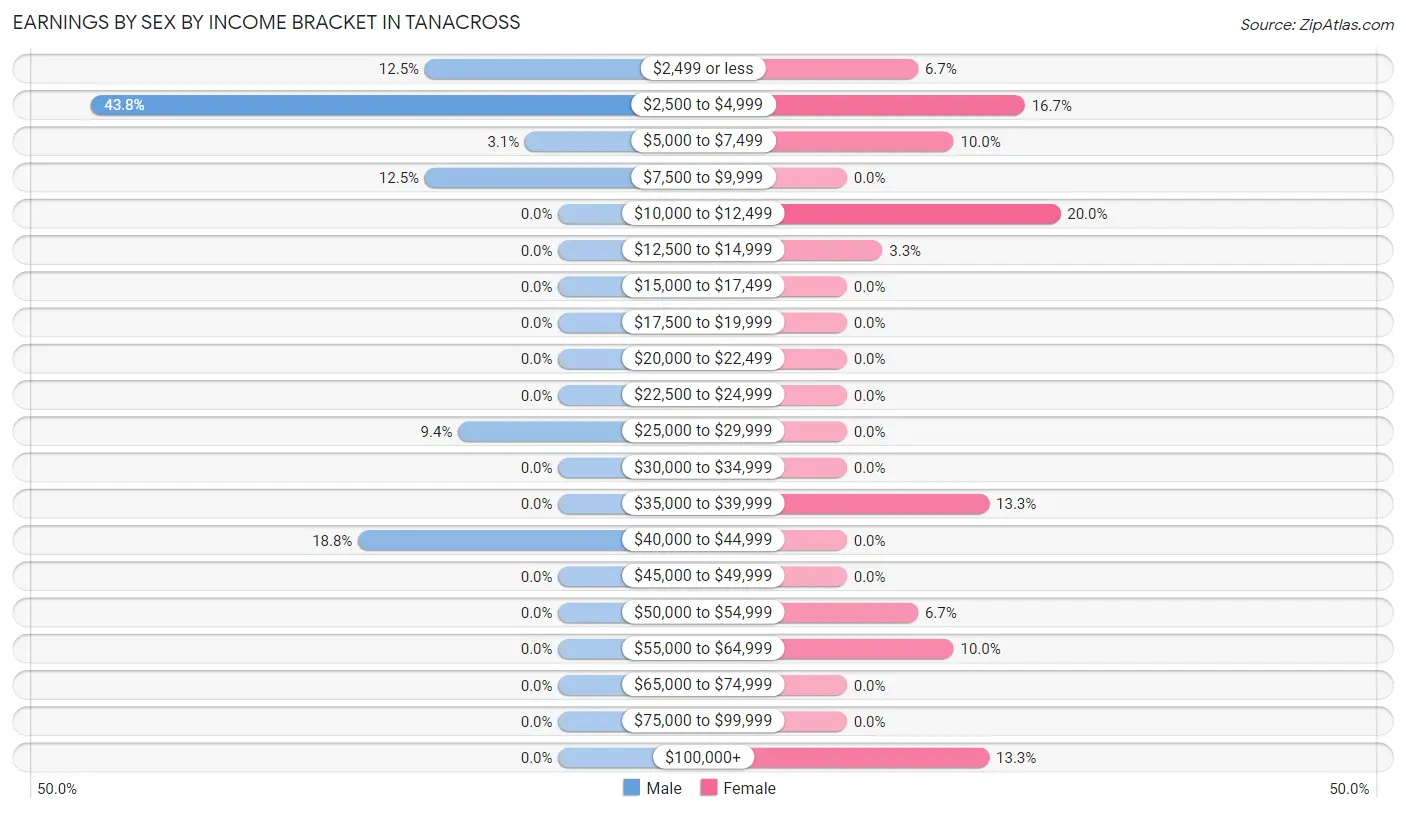
Earnings by Sex by Income Bracket in Tanacross
The most common earnings brackets in Tanacross are $2,500 to $4,999 for men (14 | 43.8%) and $10,000 to $12,499 for women (6 | 20.0%).
| Income | Male | Female |
| $2,499 or less | 4 (12.5%) | 2 (6.7%) |
| $2,500 to $4,999 | 14 (43.8%) | 5 (16.7%) |
| $5,000 to $7,499 | 1 (3.1%) | 3 (10.0%) |
| $7,500 to $9,999 | 4 (12.5%) | 0 (0.0%) |
| $10,000 to $12,499 | 0 (0.0%) | 6 (20.0%) |
| $12,500 to $14,999 | 0 (0.0%) | 1 (3.3%) |
| $15,000 to $17,499 | 0 (0.0%) | 0 (0.0%) |
| $17,500 to $19,999 | 0 (0.0%) | 0 (0.0%) |
| $20,000 to $22,499 | 0 (0.0%) | 0 (0.0%) |
| $22,500 to $24,999 | 0 (0.0%) | 0 (0.0%) |
| $25,000 to $29,999 | 3 (9.4%) | 0 (0.0%) |
| $30,000 to $34,999 | 0 (0.0%) | 0 (0.0%) |
| $35,000 to $39,999 | 0 (0.0%) | 4 (13.3%) |
| $40,000 to $44,999 | 6 (18.8%) | 0 (0.0%) |
| $45,000 to $49,999 | 0 (0.0%) | 0 (0.0%) |
| $50,000 to $54,999 | 0 (0.0%) | 2 (6.7%) |
| $55,000 to $64,999 | 0 (0.0%) | 3 (10.0%) |
| $65,000 to $74,999 | 0 (0.0%) | 0 (0.0%) |
| $75,000 to $99,999 | 0 (0.0%) | 0 (0.0%) |
| $100,000+ | 0 (0.0%) | 4 (13.3%) |
| Total | 32 (100.0%) | 30 (100.0%) |
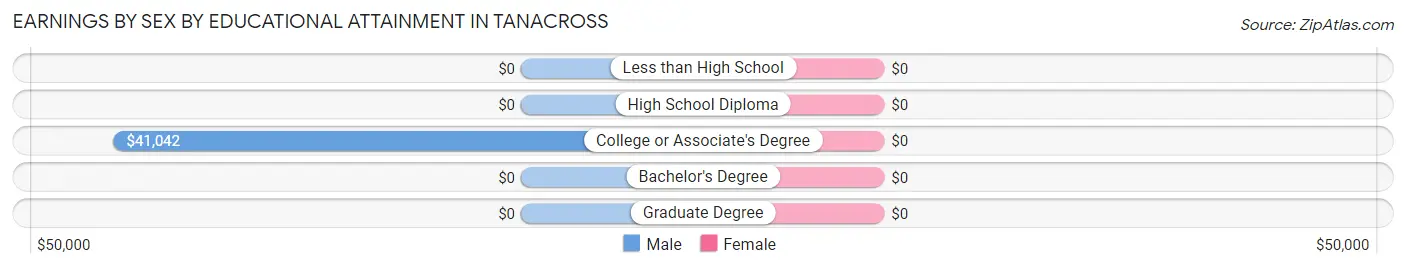
Earnings by Sex by Educational Attainment in Tanacross
| Educational Attainment | Male Income | Female Income |
| Less than High School | - | - |
| High School Diploma | - | - |
| College or Associate's Degree | $41,042 | $0 |
| Bachelor's Degree | - | - |
| Graduate Degree | - | - |
| Total | - | - |
Family Income in Tanacross
Family Income Brackets in Tanacross
According to the Tanacross family income data, there are 6 families falling into the $100,000 to $149,999 income range, which is the most common income bracket and makes up 30.0% of all families.
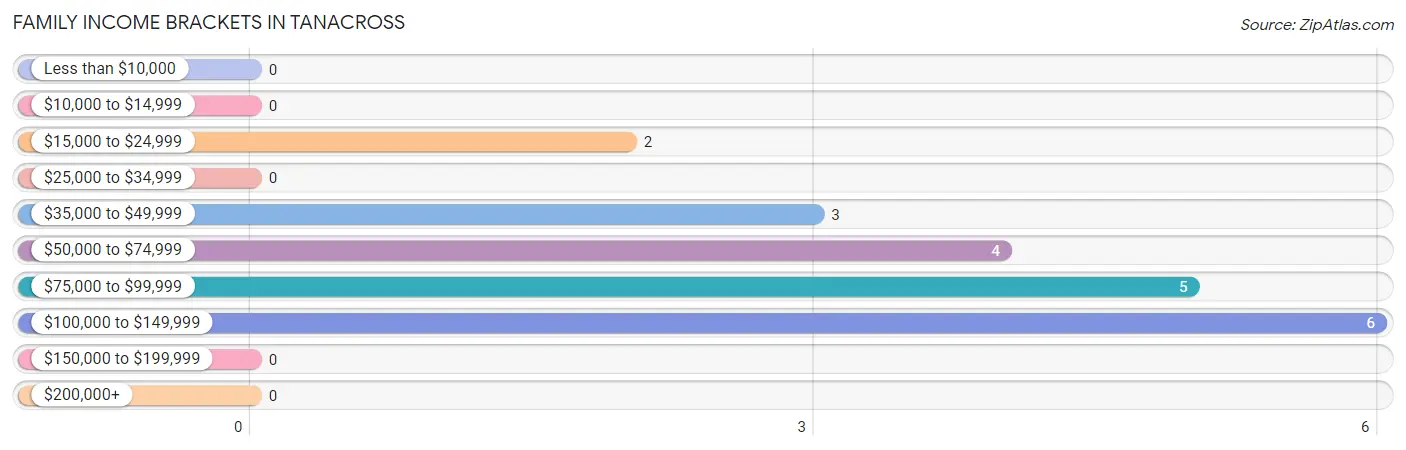
| Income Bracket | # Families | % Families |
| Less than $10,000 | 0 | 0.0% |
| $10,000 to $14,999 | 0 | 0.0% |
| $15,000 to $24,999 | 2 | 10.0% |
| $25,000 to $34,999 | 0 | 0.0% |
| $35,000 to $49,999 | 3 | 15.0% |
| $50,000 to $74,999 | 4 | 20.0% |
| $75,000 to $99,999 | 5 | 25.0% |
| $100,000 to $149,999 | 6 | 30.0% |
| $150,000 to $199,999 | 0 | 0.0% |
| $200,000+ | 0 | 0.0% |
Family Income by Famaliy Size in Tanacross
4-person families (6 | 30.0%) account for the highest median family income in Tanacross with $81,667 per family, while 4-person families (6 | 30.0%) have the highest median income of $20,417 per family member.
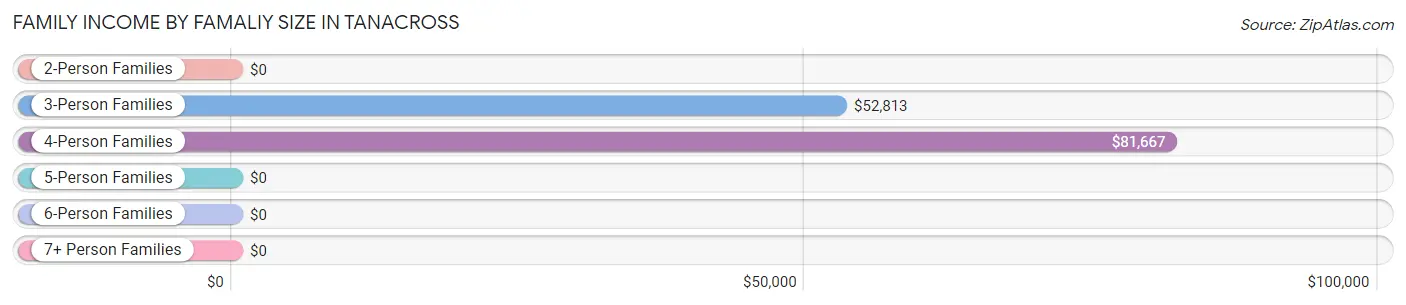
| Income Bracket | # Families | Median Income |
| 2-Person Families | 6 (30.0%) | $0 |
| 3-Person Families | 7 (35.0%) | $52,813 |
| 4-Person Families | 6 (30.0%) | $81,667 |
| 5-Person Families | 1 (5.0%) | $0 |
| 6-Person Families | 0 (0.0%) | $0 |
| 7+ Person Families | 0 (0.0%) | $0 |
| Total | 20 (100.0%) | $80,833 |
Family Income by Number of Earners in Tanacross
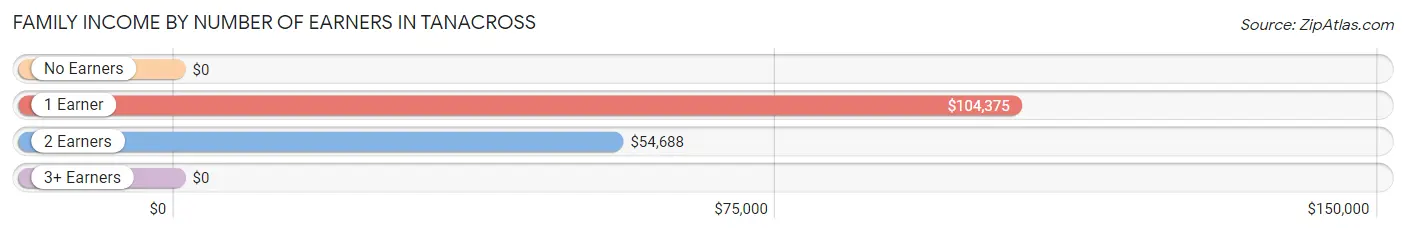
| Number of Earners | # Families | Median Income |
| No Earners | 0 (0.0%) | $0 |
| 1 Earner | 9 (45.0%) | $104,375 |
| 2 Earners | 11 (55.0%) | $54,688 |
| 3+ Earners | 0 (0.0%) | $0 |
| Total | 20 (100.0%) | $80,833 |
Household Income in Tanacross
Household Income Brackets in Tanacross
With 6 households falling in the category, the $100,000 to $149,999 income range is the most frequent in Tanacross, accounting for 21.4% of all households.
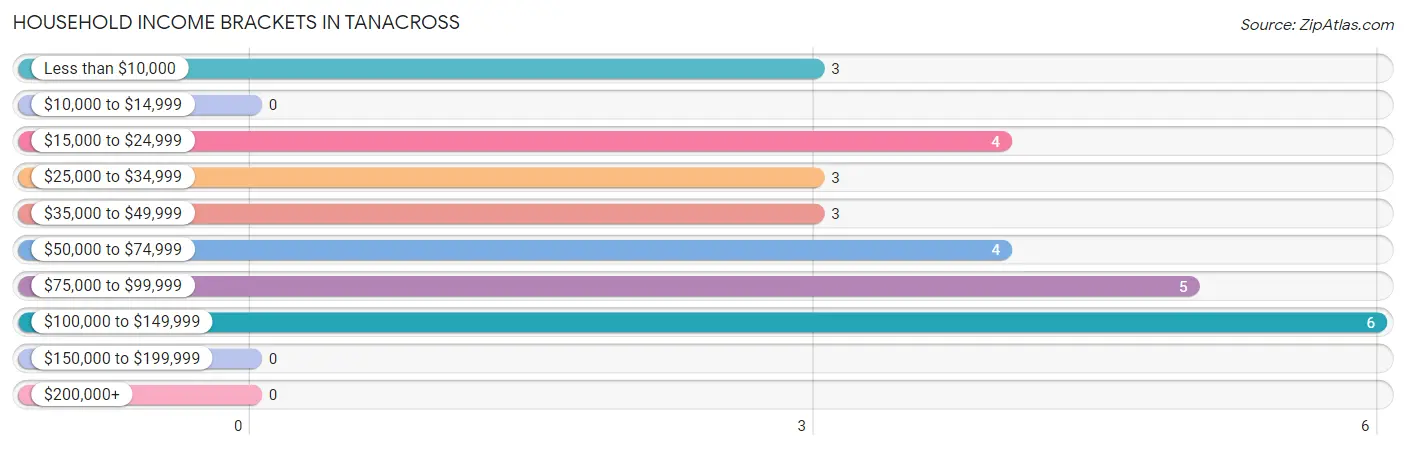
| Income Bracket | # Households | % Households |
| Less than $10,000 | 3 | 10.7% |
| $10,000 to $14,999 | 0 | 0.0% |
| $15,000 to $24,999 | 4 | 14.3% |
| $25,000 to $34,999 | 3 | 10.7% |
| $35,000 to $49,999 | 3 | 10.7% |
| $50,000 to $74,999 | 4 | 14.3% |
| $75,000 to $99,999 | 5 | 17.9% |
| $100,000 to $149,999 | 6 | 21.4% |
| $150,000 to $199,999 | 0 | 0.0% |
| $200,000+ | 0 | 0.0% |
Household Income by Householder Age in Tanacross
The median household income in Tanacross is $53,125, with the highest median household income of $54,688 found in the 45 to 64 years age bracket for the primary householder. A total of 19 households (67.9%) fall into this category.
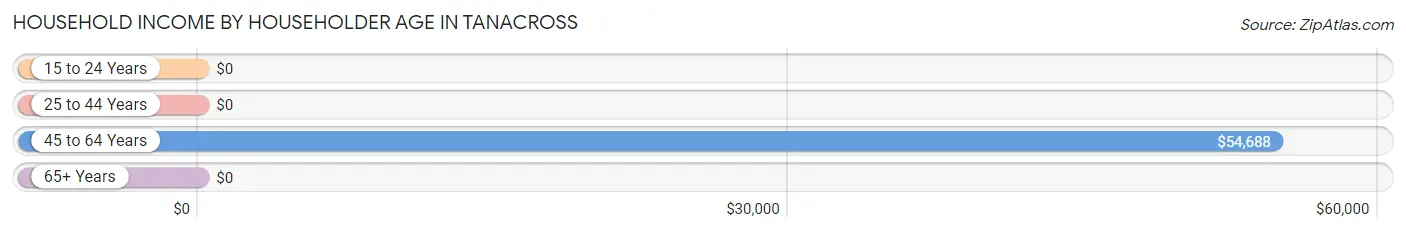
| Income Bracket | # Households | Median Income |
| 15 to 24 Years | 0 (0.0%) | $0 |
| 25 to 44 Years | 3 (10.7%) | $0 |
| 45 to 64 Years | 19 (67.9%) | $54,688 |
| 65+ Years | 6 (21.4%) | $0 |
| Total | 28 (100.0%) | $53,125 |
Poverty in Tanacross
Income Below Poverty by Sex and Age in Tanacross
With 10.4% poverty level for males and 15.2% for females among the residents of Tanacross, 45 to 54 year old males and 25 to 34 year old females are the most vulnerable to poverty, with 3 males (100.0%) and 2 females (66.7%) in their respective age groups living below the poverty level.
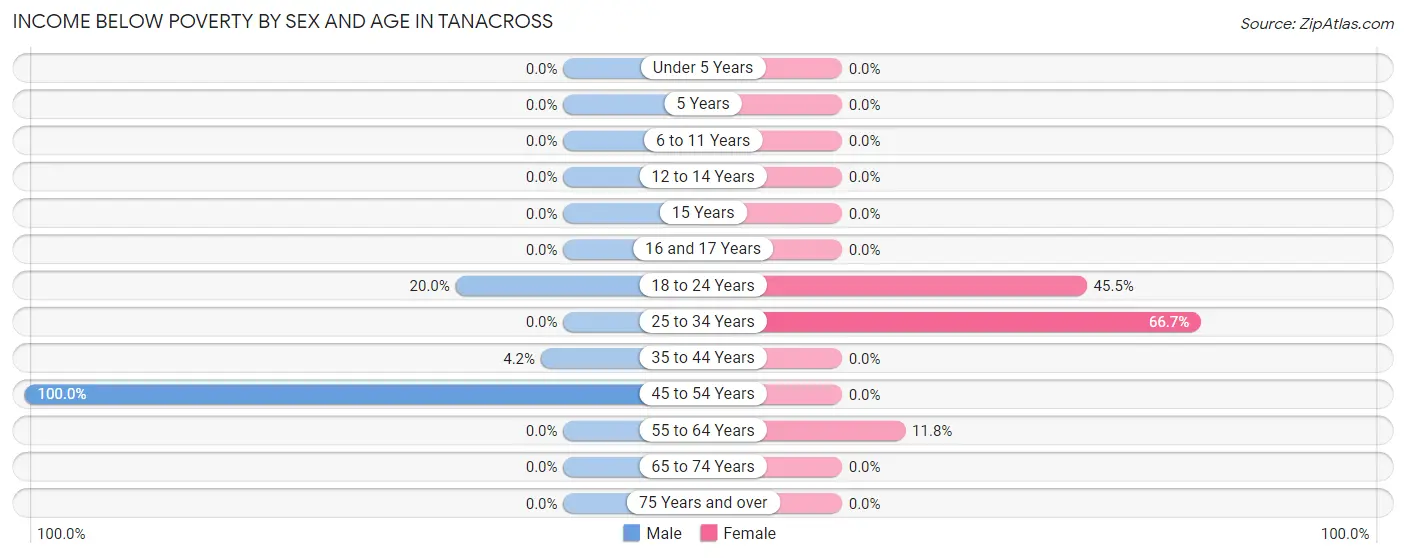
| Age Bracket | Male | Female |
| Under 5 Years | 0 (0.0%) | 0 (0.0%) |
| 5 Years | 0 (0.0%) | 0 (0.0%) |
| 6 to 11 Years | 0 (0.0%) | 0 (0.0%) |
| 12 to 14 Years | 0 (0.0%) | 0 (0.0%) |
| 15 Years | 0 (0.0%) | 0 (0.0%) |
| 16 and 17 Years | 0 (0.0%) | 0 (0.0%) |
| 18 to 24 Years | 4 (20.0%) | 5 (45.5%) |
| 25 to 34 Years | 0 (0.0%) | 2 (66.7%) |
| 35 to 44 Years | 1 (4.2%) | 0 (0.0%) |
| 45 to 54 Years | 3 (100.0%) | 0 (0.0%) |
| 55 to 64 Years | 0 (0.0%) | 2 (11.8%) |
| 65 to 74 Years | 0 (0.0%) | 0 (0.0%) |
| 75 Years and over | 0 (0.0%) | 0 (0.0%) |
| Total | 8 (10.4%) | 9 (15.2%) |
Income Above Poverty by Sex and Age in Tanacross
According to the poverty statistics in Tanacross, males aged 6 to 11 years and females aged under 5 years are the age groups that are most secure financially, with 100.0% of males and 100.0% of females in these age groups living above the poverty line.
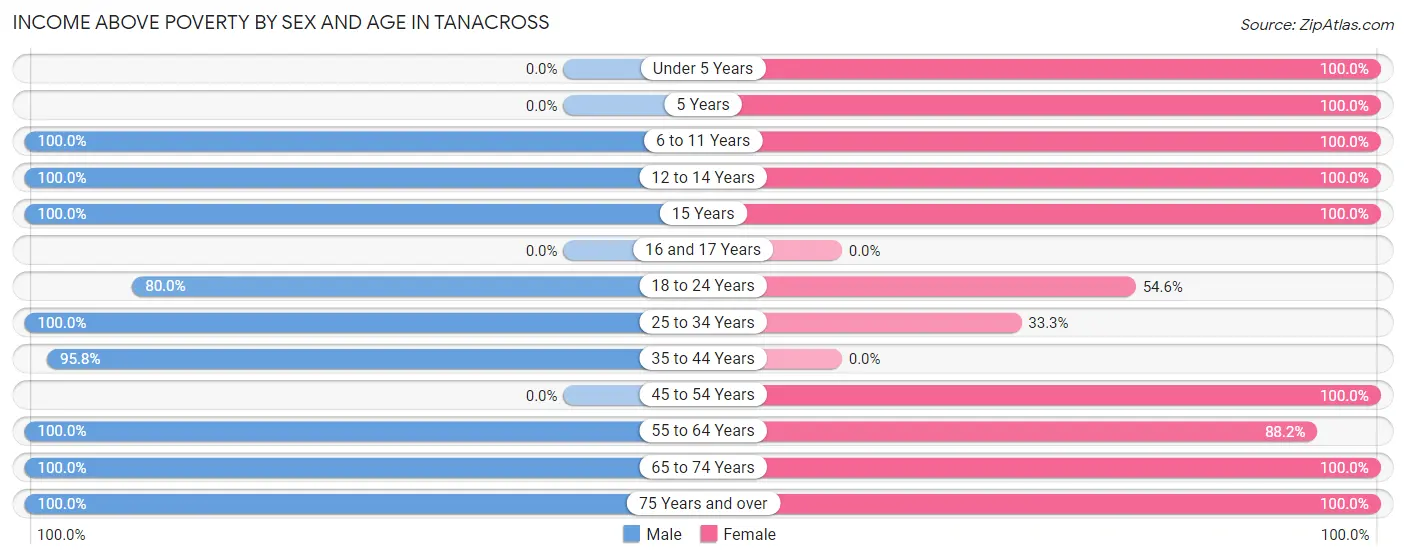
| Age Bracket | Male | Female |
| Under 5 Years | 0 (0.0%) | 9 (100.0%) |
| 5 Years | 0 (0.0%) | 3 (100.0%) |
| 6 to 11 Years | 6 (100.0%) | 4 (100.0%) |
| 12 to 14 Years | 5 (100.0%) | 2 (100.0%) |
| 15 Years | 3 (100.0%) | 3 (100.0%) |
| 16 and 17 Years | 0 (0.0%) | 0 (0.0%) |
| 18 to 24 Years | 16 (80.0%) | 6 (54.5%) |
| 25 to 34 Years | 4 (100.0%) | 1 (33.3%) |
| 35 to 44 Years | 23 (95.8%) | 0 (0.0%) |
| 45 to 54 Years | 0 (0.0%) | 1 (100.0%) |
| 55 to 64 Years | 6 (100.0%) | 15 (88.2%) |
| 65 to 74 Years | 5 (100.0%) | 5 (100.0%) |
| 75 Years and over | 1 (100.0%) | 1 (100.0%) |
| Total | 69 (89.6%) | 50 (84.8%) |
Income Below Poverty Among Married-Couple Families in Tanacross
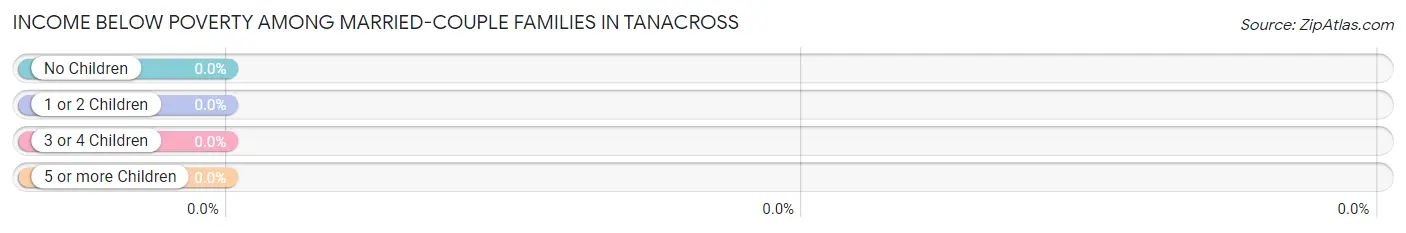
| Children | Above Poverty | Below Poverty |
| No Children | 3 (100.0%) | 0 (0.0%) |
| 1 or 2 Children | 6 (100.0%) | 0 (0.0%) |
| 3 or 4 Children | 1 (100.0%) | 0 (0.0%) |
| 5 or more Children | 0 (0.0%) | 0 (0.0%) |
| Total | 10 (100.0%) | 0 (0.0%) |
Income Below Poverty Among Single-Parent Households in Tanacross
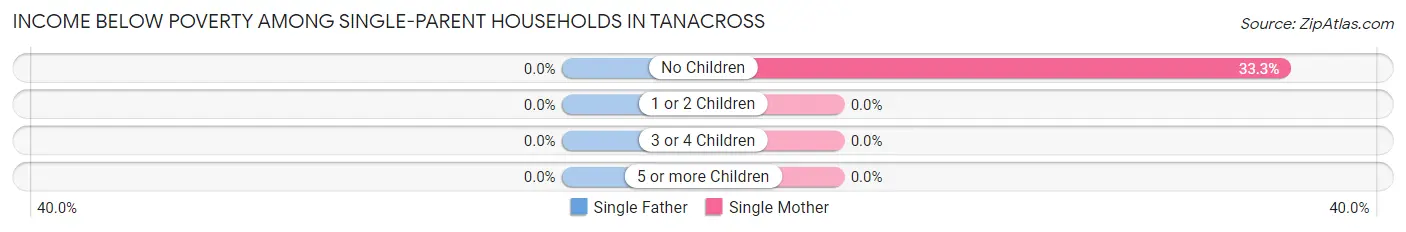
| Children | Single Father | Single Mother |
| No Children | 0 (0.0%) | 2 (33.3%) |
| 1 or 2 Children | 0 (0.0%) | 0 (0.0%) |
| 3 or 4 Children | 0 (0.0%) | 0 (0.0%) |
| 5 or more Children | 0 (0.0%) | 0 (0.0%) |
| Total | 0 (0.0%) | 2 (20.0%) |
Income Below Poverty Among Married-Couple vs Single-Parent Households in Tanacross
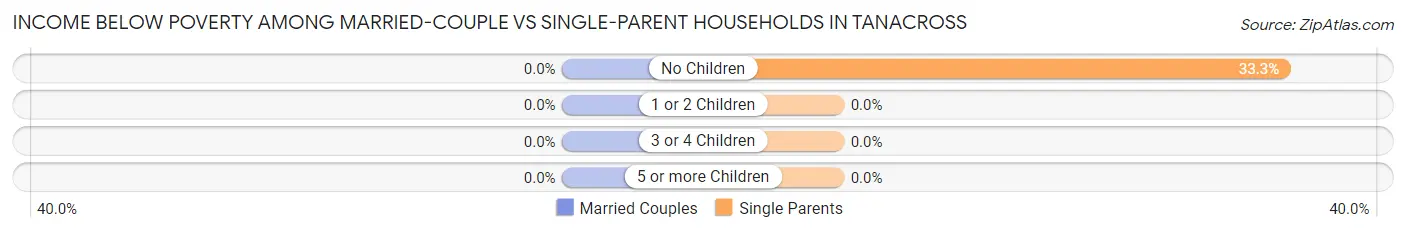
| Children | Married-Couple Families | Single-Parent Households |
| No Children | 0 (0.0%) | 2 (33.3%) |
| 1 or 2 Children | 0 (0.0%) | 0 (0.0%) |
| 3 or 4 Children | 0 (0.0%) | 0 (0.0%) |
| 5 or more Children | 0 (0.0%) | 0 (0.0%) |
| Total | 0 (0.0%) | 2 (20.0%) |
Race in Tanacross
The most populous races in Tanacross are Native / Alaskan (117 | 86.0%), Black / African American (9 | 6.6%), and Two or more Races (6 | 4.4%).
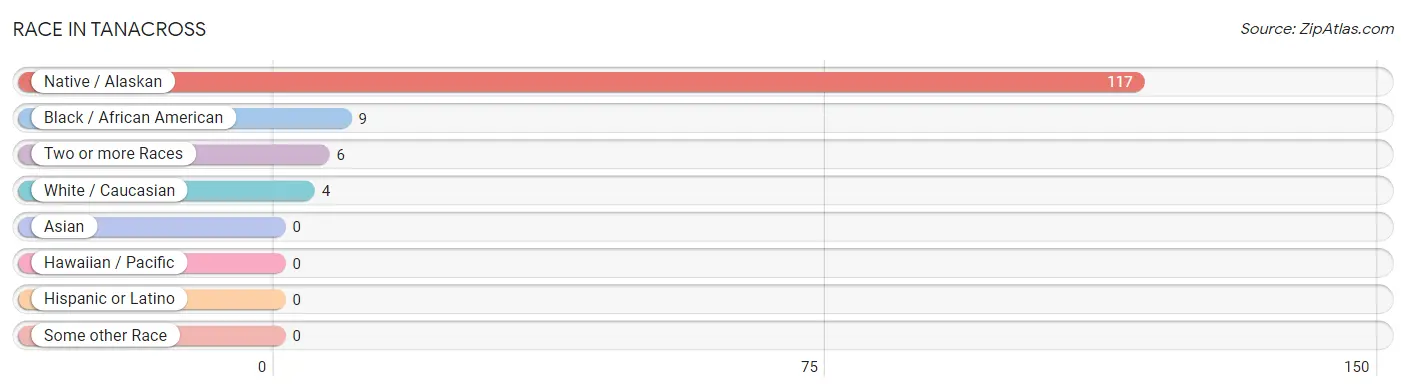
| Race | # Population | % Population |
| Asian | 0 | 0.0% |
| Black / African American | 9 | 6.6% |
| Hawaiian / Pacific | 0 | 0.0% |
| Hispanic or Latino | 0 | 0.0% |
| Native / Alaskan | 117 | 86.0% |
| White / Caucasian | 4 | 2.9% |
| Two or more Races | 6 | 4.4% |
| Some other Race | 0 | 0.0% |
| Total | 136 | 100.0% |
Ancestry in Tanacross
The most populous ancestries reported in Tanacross are Alaskan Athabascan (95 | 69.9%), Alaska Native (23 | 16.9%), Cherokee (5 | 3.7%), European (2 | 1.5%), and Norwegian (2 | 1.5%), together accounting for 93.4% of all Tanacross residents.
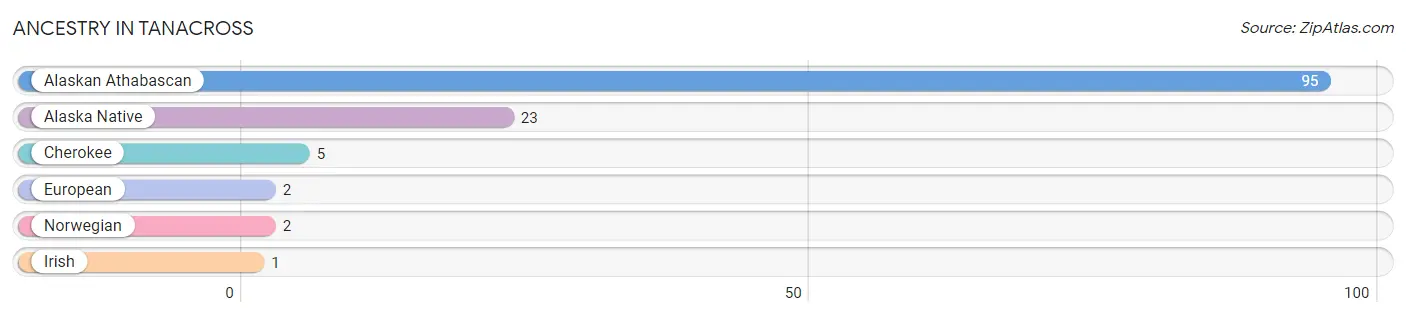
| Ancestry | # Population | % Population |
| Alaska Native | 23 | 16.9% |
| Alaskan Athabascan | 95 | 69.9% |
| Cherokee | 5 | 3.7% |
| European | 2 | 1.5% |
| Irish | 1 | 0.7% |
| Norwegian | 2 | 1.5% | View All 6 Rows |
Immigrants in Tanacross

| Immigration Origin | # Population | % Population | View All 0 Rows |
Sex and Age in Tanacross
Sex and Age in Tanacross
The most populous age groups in Tanacross are 35 to 39 Years (24 | 31.2%) for men and 20 to 24 Years (11 | 18.6%) for women.
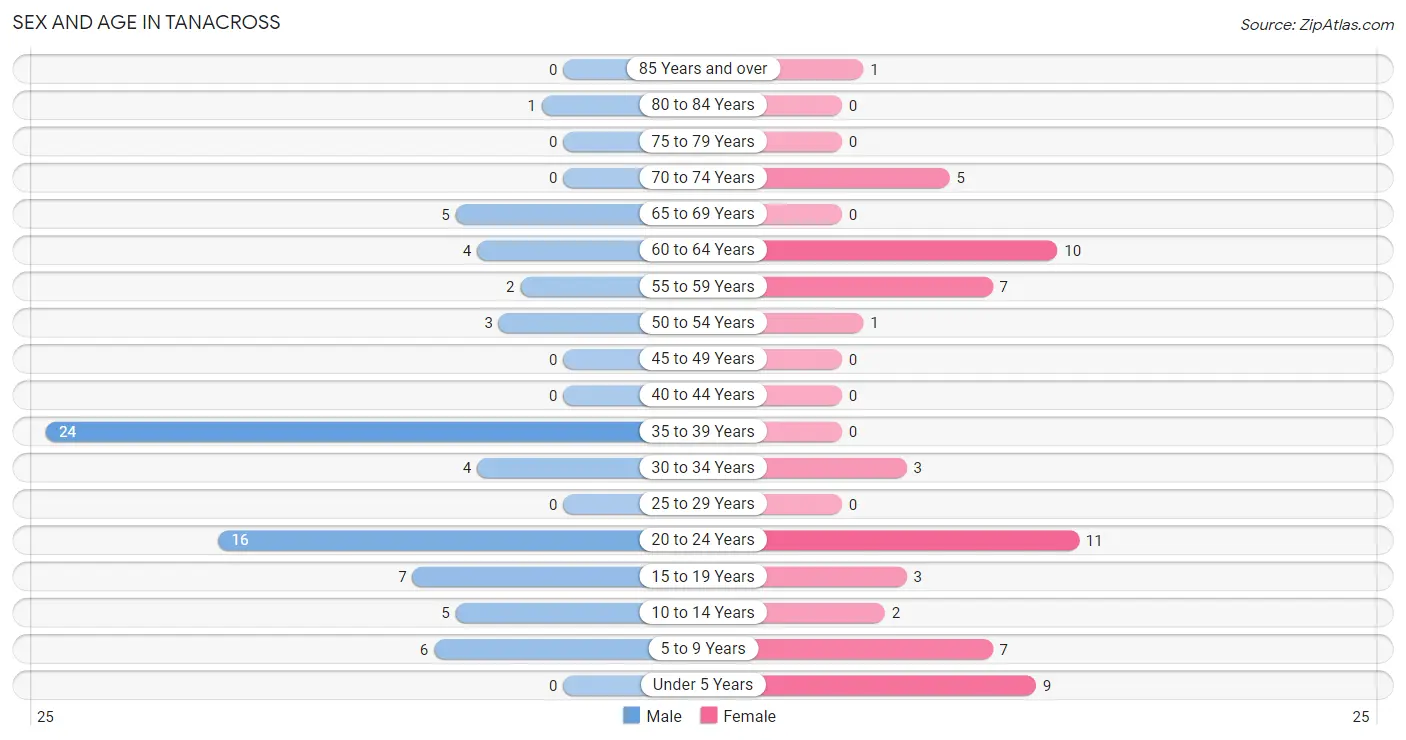
| Age Bracket | Male | Female |
| Under 5 Years | 0 (0.0%) | 9 (15.2%) |
| 5 to 9 Years | 6 (7.8%) | 7 (11.9%) |
| 10 to 14 Years | 5 (6.5%) | 2 (3.4%) |
| 15 to 19 Years | 7 (9.1%) | 3 (5.1%) |
| 20 to 24 Years | 16 (20.8%) | 11 (18.6%) |
| 25 to 29 Years | 0 (0.0%) | 0 (0.0%) |
| 30 to 34 Years | 4 (5.2%) | 3 (5.1%) |
| 35 to 39 Years | 24 (31.2%) | 0 (0.0%) |
| 40 to 44 Years | 0 (0.0%) | 0 (0.0%) |
| 45 to 49 Years | 0 (0.0%) | 0 (0.0%) |
| 50 to 54 Years | 3 (3.9%) | 1 (1.7%) |
| 55 to 59 Years | 2 (2.6%) | 7 (11.9%) |
| 60 to 64 Years | 4 (5.2%) | 10 (17.0%) |
| 65 to 69 Years | 5 (6.5%) | 0 (0.0%) |
| 70 to 74 Years | 0 (0.0%) | 5 (8.5%) |
| 75 to 79 Years | 0 (0.0%) | 0 (0.0%) |
| 80 to 84 Years | 1 (1.3%) | 0 (0.0%) |
| 85 Years and over | 0 (0.0%) | 1 (1.7%) |
| Total | 77 (100.0%) | 59 (100.0%) |
Families and Households in Tanacross
Median Family Size in Tanacross
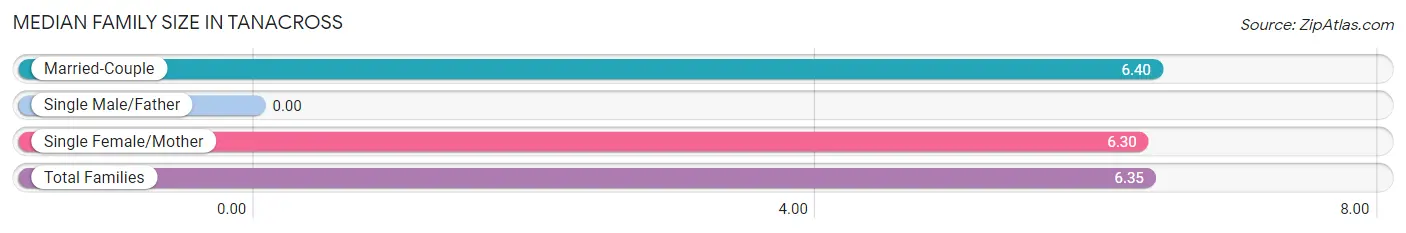
| Family Type | # Families | Family Size |
| Married-Couple | 10 (50.0%) | 6.40 |
| Single Male/Father | 0 (0.0%) | - |
| Single Female/Mother | 10 (50.0%) | 6.30 |
| Total Families | 20 (100.0%) | 6.35 |
Median Household Size in Tanacross
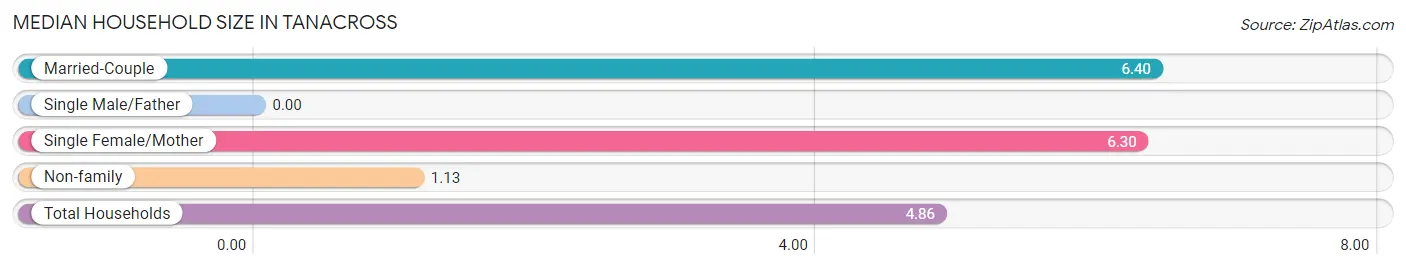
| Household Type | # Households | Household Size |
| Married-Couple | 10 (35.7%) | 6.40 |
| Single Male/Father | 0 (0.0%) | - |
| Single Female/Mother | 10 (35.7%) | 6.30 |
| Non-family | 8 (28.6%) | 1.13 |
| Total Households | 28 (100.0%) | 4.86 |
Household Size by Marriage Status in Tanacross
Out of a total of 28 households in Tanacross, 20 (71.4%) are family households, while 8 (28.6%) are nonfamily households. The most numerous type of family households are 3-person households, comprising 7, and the most common type of nonfamily households are 1-person households, comprising 6.
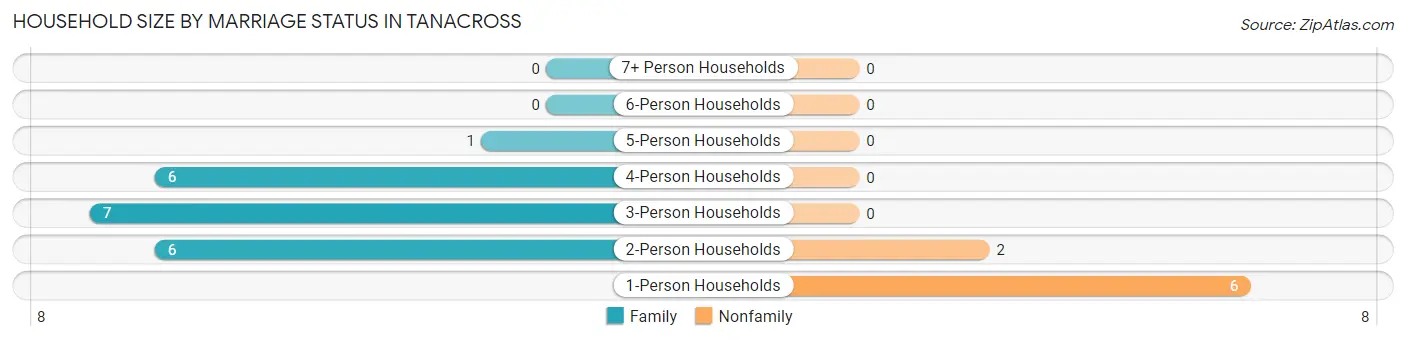
| Household Size | Family Households | Nonfamily Households |
| 1-Person Households | - | 6 (21.4%) |
| 2-Person Households | 6 (21.4%) | 2 (7.1%) |
| 3-Person Households | 7 (25.0%) | 0 (0.0%) |
| 4-Person Households | 6 (21.4%) | 0 (0.0%) |
| 5-Person Households | 1 (3.6%) | 0 (0.0%) |
| 6-Person Households | 0 (0.0%) | 0 (0.0%) |
| 7+ Person Households | 0 (0.0%) | 0 (0.0%) |
| Total | 20 (71.4%) | 8 (28.6%) |
Female Fertility in Tanacross
Fertility by Age in Tanacross
| Age Bracket | Women with Births | Births / 1,000 Women |
| 15 to 19 years | 0 (0.0%) | 0.0 |
| 20 to 34 years | 0 (0.0%) | 0.0 |
| 35 to 50 years | 0 (0.0%) | 0.0 |
| Total | 0 (0.0%) | 0.0 |
Fertility by Age by Marriage Status in Tanacross
| Age Bracket | Married | Unmarried |
| 15 to 19 years | 0 (0.0%) | 0 (0.0%) |
| 20 to 34 years | 0 (0.0%) | 0 (0.0%) |
| 35 to 50 years | 0 (0.0%) | 0 (0.0%) |
| Total | 0 (0.0%) | 0 (0.0%) |
Fertility by Education in Tanacross
| Educational Attainment | Women with Births | Births / 1,000 Women |
| Less than High School | 0 (0.0%) | 0.0 |
| High School Diploma | 0 (0.0%) | 0.0 |
| College or Associate's Degree | 0 (0.0%) | 0.0 |
| Bachelor's Degree | 0 (0.0%) | 0.0 |
| Graduate Degree | 0 (0.0%) | 0.0 |
| Total | 0 (0.0%) | 0.0 |
Fertility by Education by Marriage Status in Tanacross
| Educational Attainment | Married | Unmarried |
| Less than High School | 0 (0.0%) | 0 (0.0%) |
| High School Diploma | 0 (0.0%) | 0 (0.0%) |
| College or Associate's Degree | 0 (0.0%) | 0 (0.0%) |
| Bachelor's Degree | 0 (0.0%) | 0 (0.0%) |
| Graduate Degree | 0 (0.0%) | 0 (0.0%) |
| Total | 0 (0.0%) | 0 (0.0%) |
Employment Characteristics in Tanacross
Employment by Class of Employer in Tanacross
Among the 35 employed individuals in Tanacross, local government employees (19 | 54.3%), private company employees (11 | 31.4%), and not-for-profit organizations (3 | 8.6%) make up the most common classes of employment.
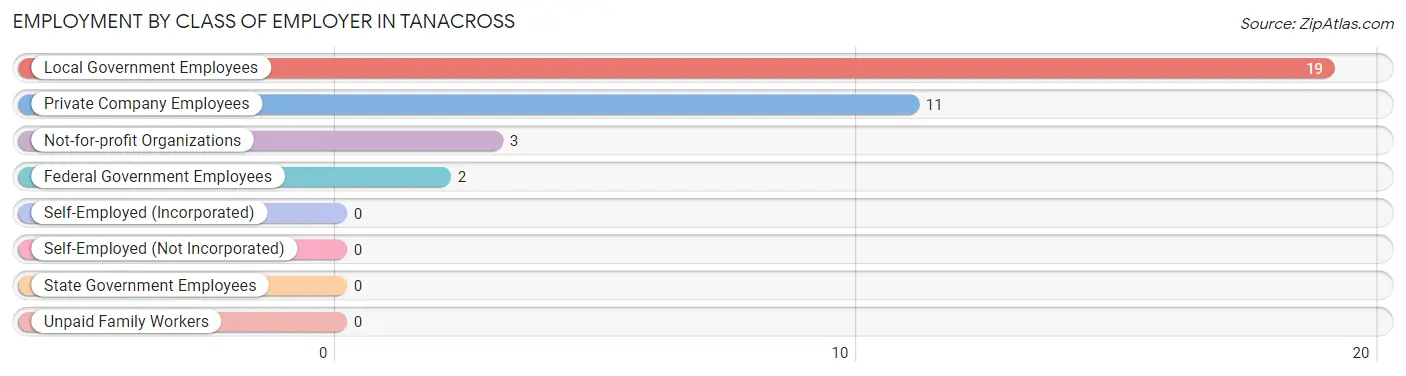
| Employer Class | # Employees | % Employees |
| Private Company Employees | 11 | 31.4% |
| Self-Employed (Incorporated) | 0 | 0.0% |
| Self-Employed (Not Incorporated) | 0 | 0.0% |
| Not-for-profit Organizations | 3 | 8.6% |
| Local Government Employees | 19 | 54.3% |
| State Government Employees | 0 | 0.0% |
| Federal Government Employees | 2 | 5.7% |
| Unpaid Family Workers | 0 | 0.0% |
| Total | 35 | 100.0% |
Employment Status by Age in Tanacross
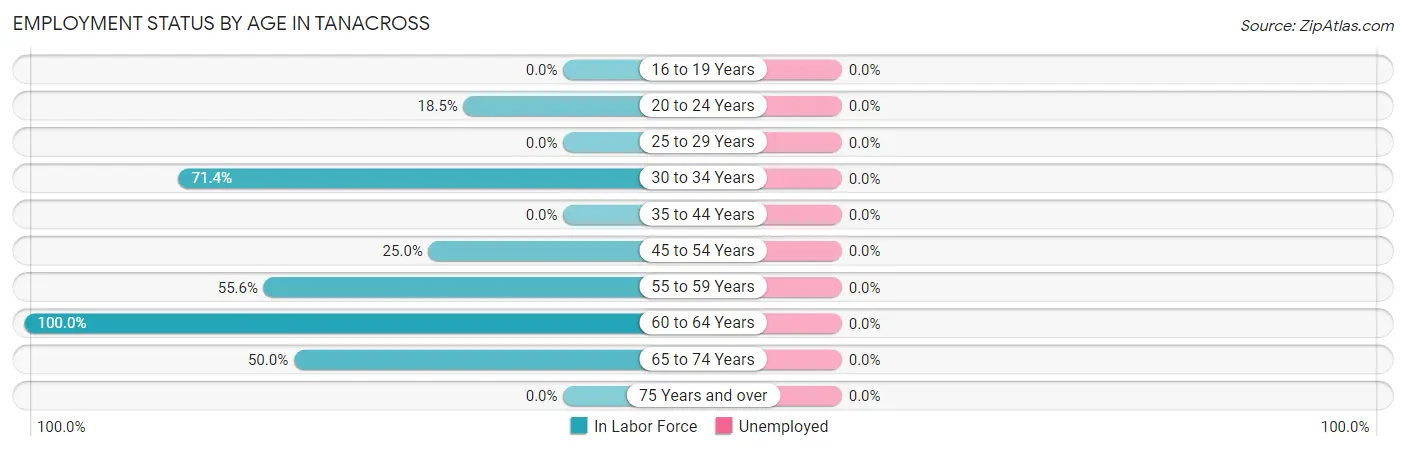
| Age Bracket | In Labor Force | Unemployed |
| 16 to 19 Years | 0 (0.0%) | 0 (0.0%) |
| 20 to 24 Years | 5 (18.5%) | 0 (0.0%) |
| 25 to 29 Years | 0 (0.0%) | 0 (0.0%) |
| 30 to 34 Years | 5 (71.4%) | 0 (0.0%) |
| 35 to 44 Years | 0 (0.0%) | 0 (0.0%) |
| 45 to 54 Years | 1 (25.0%) | 0 (0.0%) |
| 55 to 59 Years | 5 (55.6%) | 0 (0.0%) |
| 60 to 64 Years | 14 (100.0%) | 0 (0.0%) |
| 65 to 74 Years | 5 (50.0%) | 0 (0.0%) |
| 75 Years and over | 0 (0.0%) | 0 (0.0%) |
| Total | 35 (34.7%) | 0 (0.0%) |
Employment Status by Educational Attainment in Tanacross
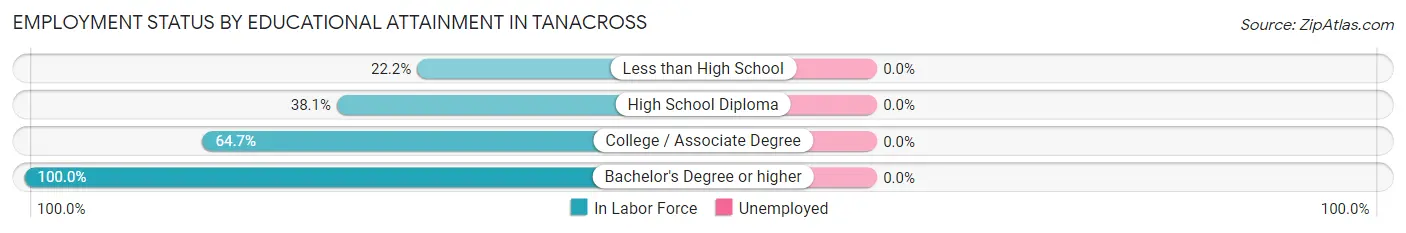
| Educational Attainment | In Labor Force | Unemployed |
| Less than High School | 4 (22.2%) | 0 (0.0%) |
| High School Diploma | 8 (38.1%) | 0 (0.0%) |
| College / Associate Degree | 11 (64.7%) | 0 (0.0%) |
| Bachelor's Degree or higher | 2 (100.0%) | 0 (0.0%) |
| Total | 25 (43.1%) | 0 (0.0%) |
Employment Occupations by Sex in Tanacross
Management, Business, Science and Arts Occupations
The most common Management, Business, Science and Arts occupations in Tanacross are Management (6 | 17.1%), Computers, Engineering & Science (5 | 14.3%), Computers & Mathematics (3 | 8.6%), Community & Social Service (3 | 8.6%), and Education, Arts & Media (3 | 8.6%).
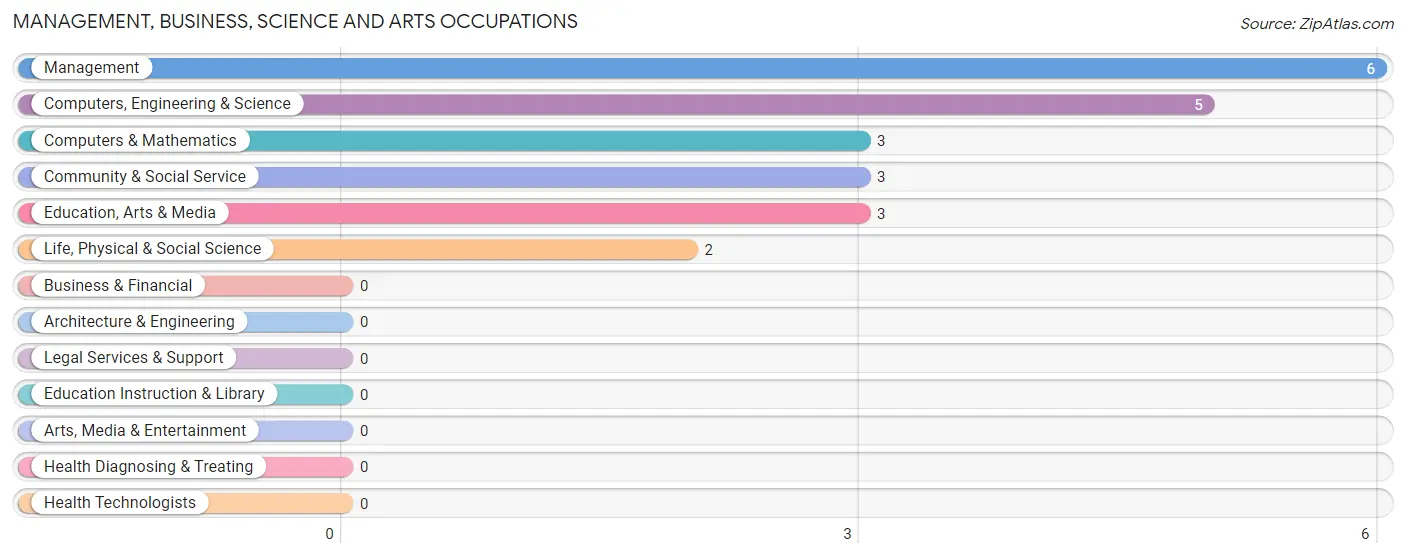
Management, Business, Science and Arts Occupations by Sex
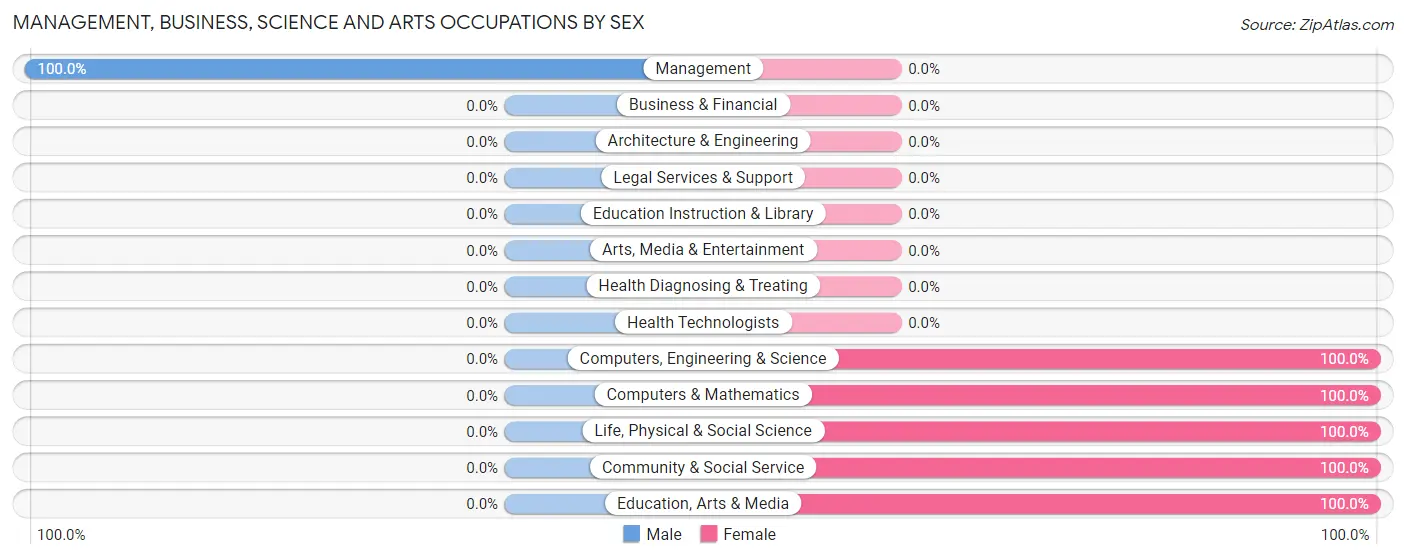
| Occupation | Male | Female |
| Management | 6 (100.0%) | 0 (0.0%) |
| Business & Financial | 0 (0.0%) | 0 (0.0%) |
| Computers, Engineering & Science | 0 (0.0%) | 5 (100.0%) |
| Computers & Mathematics | 0 (0.0%) | 3 (100.0%) |
| Architecture & Engineering | 0 (0.0%) | 0 (0.0%) |
| Life, Physical & Social Science | 0 (0.0%) | 2 (100.0%) |
| Community & Social Service | 0 (0.0%) | 3 (100.0%) |
| Education, Arts & Media | 0 (0.0%) | 3 (100.0%) |
| Legal Services & Support | 0 (0.0%) | 0 (0.0%) |
| Education Instruction & Library | 0 (0.0%) | 0 (0.0%) |
| Arts, Media & Entertainment | 0 (0.0%) | 0 (0.0%) |
| Health Diagnosing & Treating | 0 (0.0%) | 0 (0.0%) |
| Health Technologists | 0 (0.0%) | 0 (0.0%) |
| Total (Category) | 6 (42.9%) | 8 (57.1%) |
| Total (Overall) | 13 (37.1%) | 22 (62.9%) |
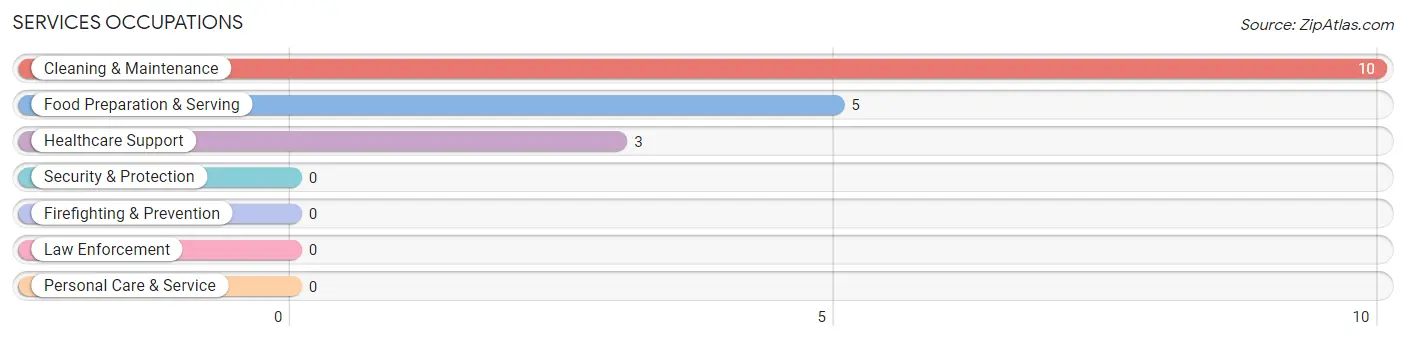
Services Occupations
The most common Services occupations in Tanacross are Cleaning & Maintenance (10 | 28.6%), Food Preparation & Serving (5 | 14.3%), and Healthcare Support (3 | 8.6%).
Services Occupations by Sex
Within the Services occupations in Tanacross, the most male-oriented occupations are Healthcare Support (100.0%), and Food Preparation & Serving (80.0%), while the most female-oriented occupations are Cleaning & Maintenance (100.0%), and Food Preparation & Serving (20.0%).
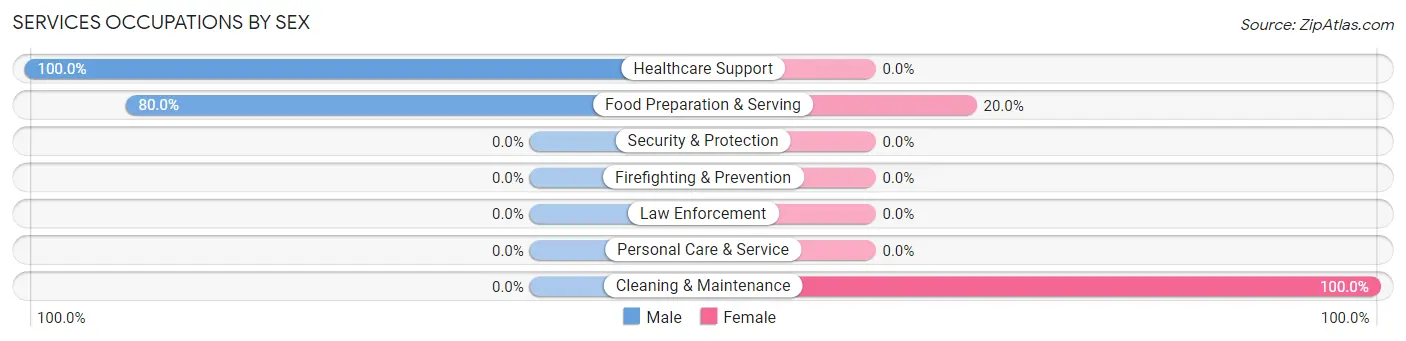
| Occupation | Male | Female |
| Healthcare Support | 3 (100.0%) | 0 (0.0%) |
| Security & Protection | 0 (0.0%) | 0 (0.0%) |
| Firefighting & Prevention | 0 (0.0%) | 0 (0.0%) |
| Law Enforcement | 0 (0.0%) | 0 (0.0%) |
| Food Preparation & Serving | 4 (80.0%) | 1 (20.0%) |
| Cleaning & Maintenance | 0 (0.0%) | 10 (100.0%) |
| Personal Care & Service | 0 (0.0%) | 0 (0.0%) |
| Total (Category) | 7 (38.9%) | 11 (61.1%) |
| Total (Overall) | 13 (37.1%) | 22 (62.9%) |
Sales and Office Occupations
The most common Sales and Office occupations in Tanacross are , and Office & Administration (3 | 8.6%).
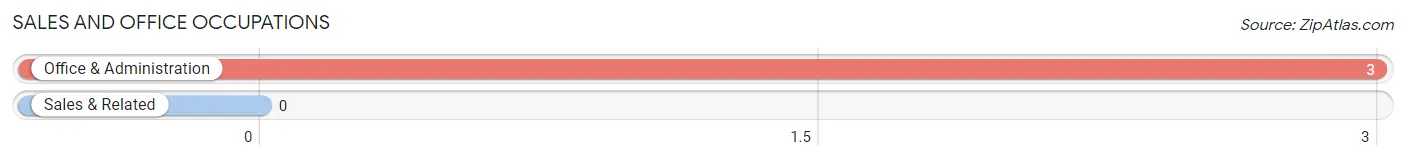
Sales and Office Occupations by Sex
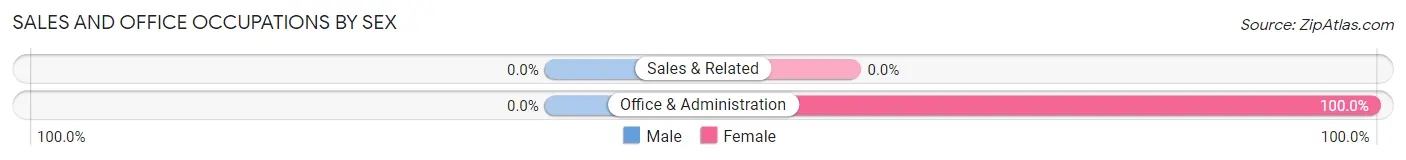
| Occupation | Male | Female |
| Sales & Related | 0 (0.0%) | 0 (0.0%) |
| Office & Administration | 0 (0.0%) | 3 (100.0%) |
| Total (Category) | 0 (0.0%) | 3 (100.0%) |
| Total (Overall) | 13 (37.1%) | 22 (62.9%) |
Natural Resources, Construction and Maintenance Occupations
Natural Resources, Construction and Maintenance Occupations by Sex
| Occupation | Male | Female |
| Farming, Fishing & Forestry | 0 (0.0%) | 0 (0.0%) |
| Construction & Extraction | 0 (0.0%) | 0 (0.0%) |
| Installation, Maintenance & Repair | 0 (0.0%) | 0 (0.0%) |
| Total (Category) | 0 (0.0%) | 0 (0.0%) |
| Total (Overall) | 13 (37.1%) | 22 (62.9%) |
Production, Transportation and Moving Occupations
Production, Transportation and Moving Occupations by Sex
| Occupation | Male | Female |
| Production | 0 (0.0%) | 0 (0.0%) |
| Transportation | 0 (0.0%) | 0 (0.0%) |
| Material Moving | 0 (0.0%) | 0 (0.0%) |
| Total (Category) | 0 (0.0%) | 0 (0.0%) |
| Total (Overall) | 13 (37.1%) | 22 (62.9%) |
Employment Industries by Sex in Tanacross
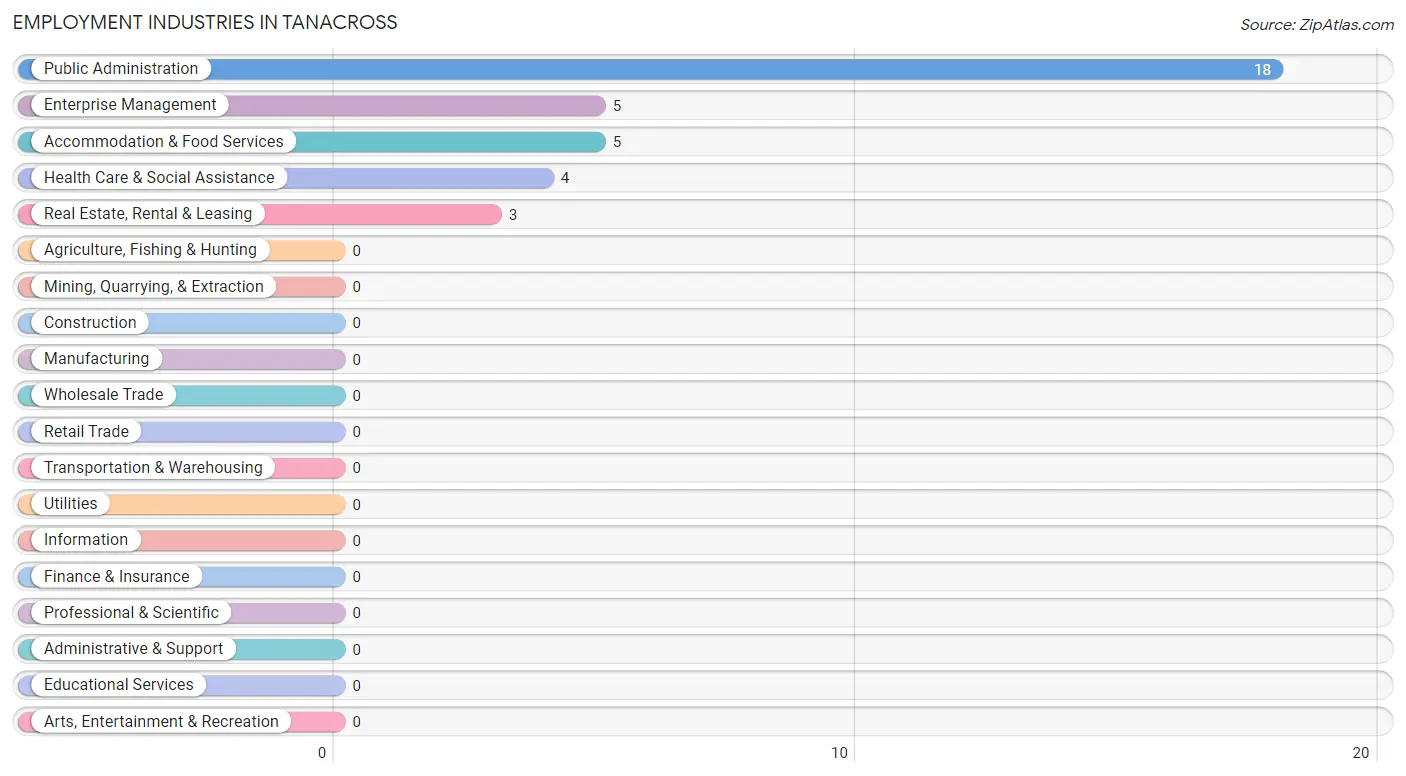
Employment Industries in Tanacross
The major employment industries in Tanacross include Public Administration (18 | 51.4%), Enterprise Management (5 | 14.3%), Accommodation & Food Services (5 | 14.3%), Health Care & Social Assistance (4 | 11.4%), and Real Estate, Rental & Leasing (3 | 8.6%).
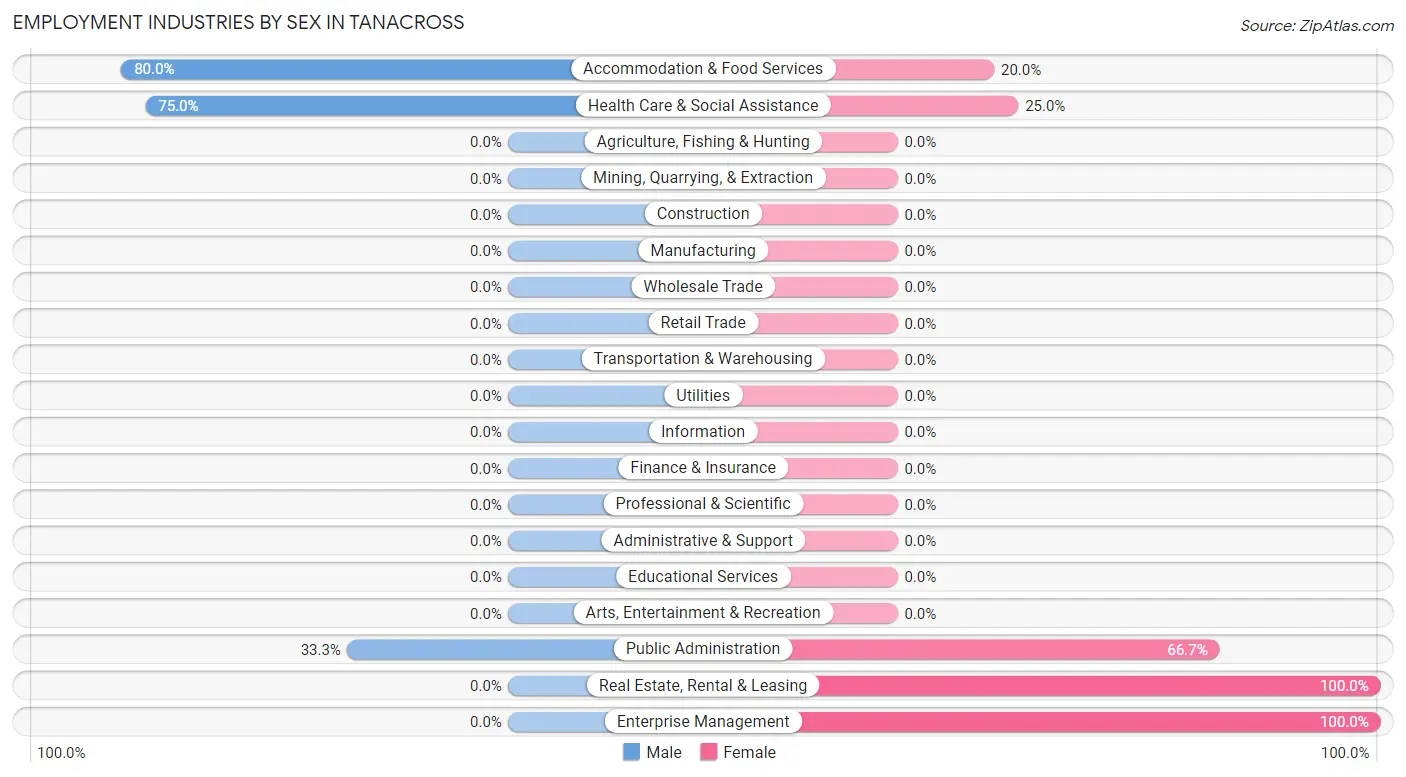
Employment Industries by Sex in Tanacross
The Tanacross industries that see more men than women are Accommodation & Food Services (80.0%), Health Care & Social Assistance (75.0%), and Public Administration (33.3%), whereas the industries that tend to have a higher number of women are Real Estate, Rental & Leasing (100.0%), Enterprise Management (100.0%), and Public Administration (66.7%).
| Industry | Male | Female |
| Agriculture, Fishing & Hunting | 0 (0.0%) | 0 (0.0%) |
| Mining, Quarrying, & Extraction | 0 (0.0%) | 0 (0.0%) |
| Construction | 0 (0.0%) | 0 (0.0%) |
| Manufacturing | 0 (0.0%) | 0 (0.0%) |
| Wholesale Trade | 0 (0.0%) | 0 (0.0%) |
| Retail Trade | 0 (0.0%) | 0 (0.0%) |
| Transportation & Warehousing | 0 (0.0%) | 0 (0.0%) |
| Utilities | 0 (0.0%) | 0 (0.0%) |
| Information | 0 (0.0%) | 0 (0.0%) |
| Finance & Insurance | 0 (0.0%) | 0 (0.0%) |
| Real Estate, Rental & Leasing | 0 (0.0%) | 3 (100.0%) |
| Professional & Scientific | 0 (0.0%) | 0 (0.0%) |
| Enterprise Management | 0 (0.0%) | 5 (100.0%) |
| Administrative & Support | 0 (0.0%) | 0 (0.0%) |
| Educational Services | 0 (0.0%) | 0 (0.0%) |
| Health Care & Social Assistance | 3 (75.0%) | 1 (25.0%) |
| Arts, Entertainment & Recreation | 0 (0.0%) | 0 (0.0%) |
| Accommodation & Food Services | 4 (80.0%) | 1 (20.0%) |
| Public Administration | 6 (33.3%) | 12 (66.7%) |
| Total | 13 (37.1%) | 22 (62.9%) |
Education in Tanacross
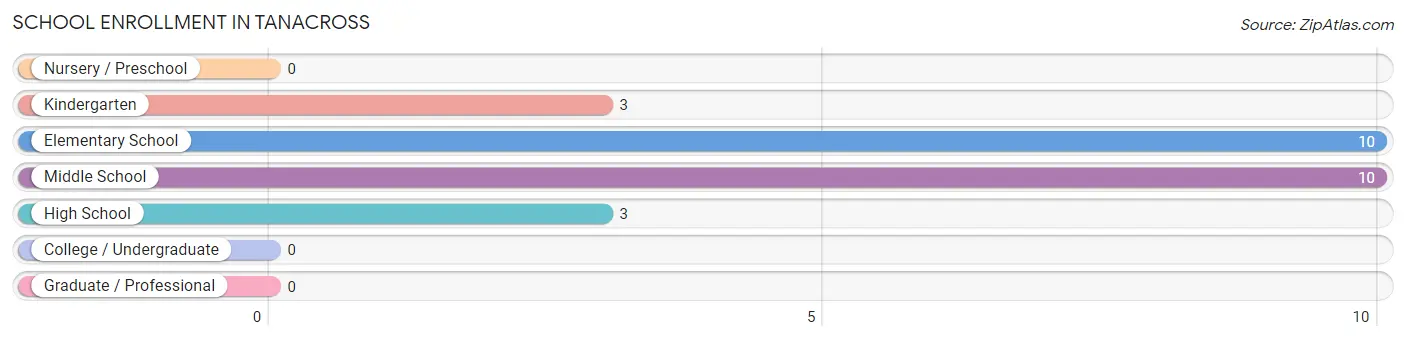
School Enrollment in Tanacross
The most common levels of schooling among the 26 students in Tanacross are elementary school (10 | 38.5%), middle school (10 | 38.5%), and kindergarten (3 | 11.5%).
| School Level | # Students | % Students |
| Nursery / Preschool | 0 | 0.0% |
| Kindergarten | 3 | 11.5% |
| Elementary School | 10 | 38.5% |
| Middle School | 10 | 38.5% |
| High School | 3 | 11.5% |
| College / Undergraduate | 0 | 0.0% |
| Graduate / Professional | 0 | 0.0% |
| Total | 26 | 100.0% |
School Enrollment by Age by Funding Source in Tanacross
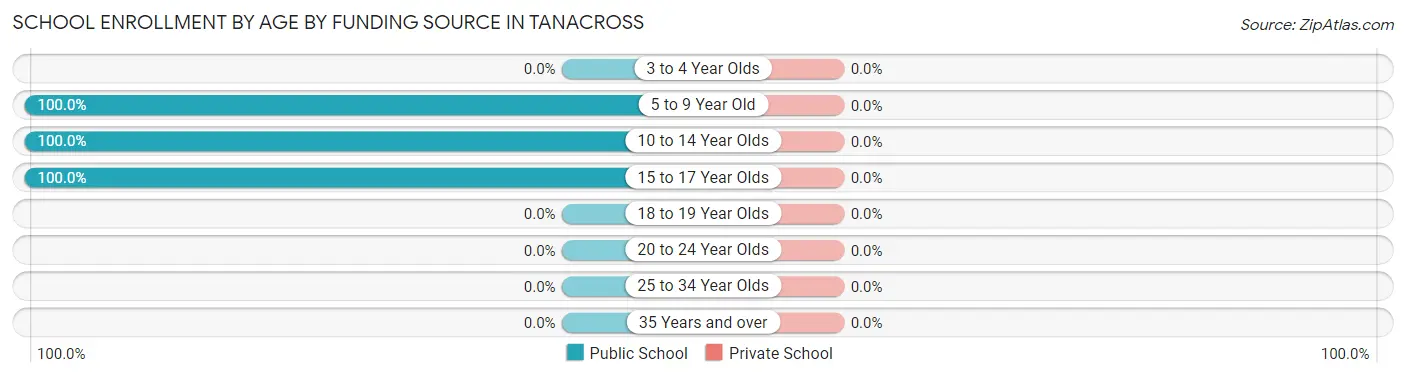
| Age Bracket | Public School | Private School |
| 3 to 4 Year Olds | 0 (0.0%) | 0 (0.0%) |
| 5 to 9 Year Old | 13 (100.0%) | 0 (0.0%) |
| 10 to 14 Year Olds | 7 (100.0%) | 0 (0.0%) |
| 15 to 17 Year Olds | 6 (100.0%) | 0 (0.0%) |
| 18 to 19 Year Olds | 0 (0.0%) | 0 (0.0%) |
| 20 to 24 Year Olds | 0 (0.0%) | 0 (0.0%) |
| 25 to 34 Year Olds | 0 (0.0%) | 0 (0.0%) |
| 35 Years and over | 0 (0.0%) | 0 (0.0%) |
| Total | 26 (100.0%) | 0 (0.0%) |
Educational Attainment by Field of Study in Tanacross
Science & technology (5 | 71.4%), and social sciences (2 | 28.6%) are the most common fields of study among 7 individuals in Tanacross who have obtained a bachelor's degree or higher.
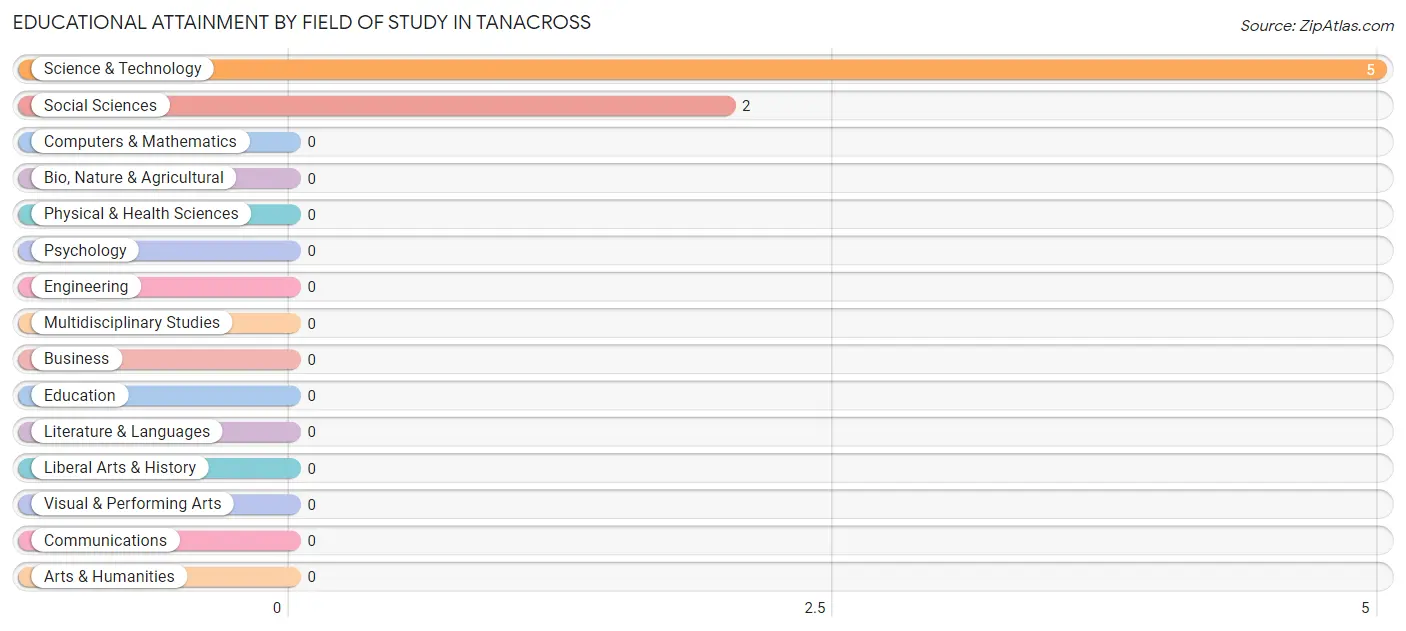
| Field of Study | # Graduates | % Graduates |
| Computers & Mathematics | 0 | 0.0% |
| Bio, Nature & Agricultural | 0 | 0.0% |
| Physical & Health Sciences | 0 | 0.0% |
| Psychology | 0 | 0.0% |
| Social Sciences | 2 | 28.6% |
| Engineering | 0 | 0.0% |
| Multidisciplinary Studies | 0 | 0.0% |
| Science & Technology | 5 | 71.4% |
| Business | 0 | 0.0% |
| Education | 0 | 0.0% |
| Literature & Languages | 0 | 0.0% |
| Liberal Arts & History | 0 | 0.0% |
| Visual & Performing Arts | 0 | 0.0% |
| Communications | 0 | 0.0% |
| Arts & Humanities | 0 | 0.0% |
| Total | 7 | 100.0% |
Transportation & Commute in Tanacross
Vehicle Availability by Sex in Tanacross
The most prevalent vehicle ownership categories in Tanacross are males with 1 vehicle (11, accounting for 84.6%) and females with 1 vehicle (13, making up 50.0%).
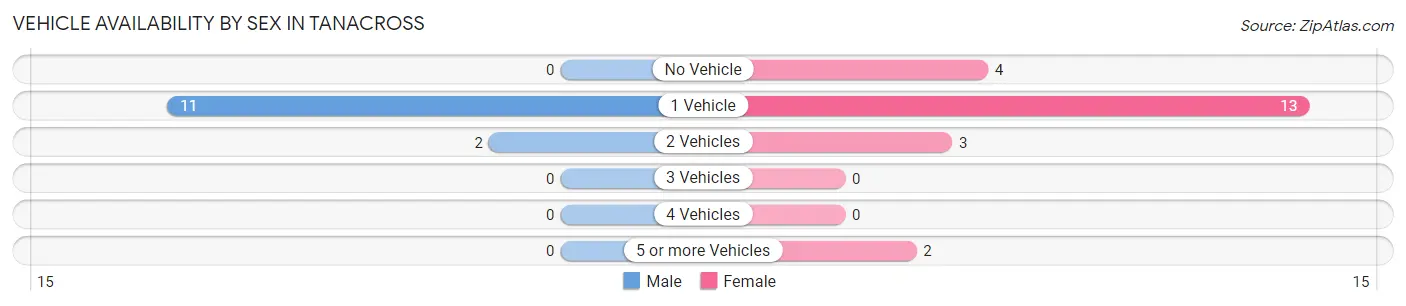
| Vehicles Available | Male | Female |
| No Vehicle | 0 (0.0%) | 4 (18.2%) |
| 1 Vehicle | 11 (84.6%) | 13 (59.1%) |
| 2 Vehicles | 2 (15.4%) | 3 (13.6%) |
| 3 Vehicles | 0 (0.0%) | 0 (0.0%) |
| 4 Vehicles | 0 (0.0%) | 0 (0.0%) |
| 5 or more Vehicles | 0 (0.0%) | 2 (9.1%) |
| Total | 13 (100.0%) | 22 (100.0%) |
Commute Time in Tanacross
The most frequently occuring commute durations in Tanacross are less than 5 minutes (23 commuters, 65.7%), 30 to 34 minutes (10 commuters, 28.6%), and 90 or more minutes (2 commuters, 5.7%).
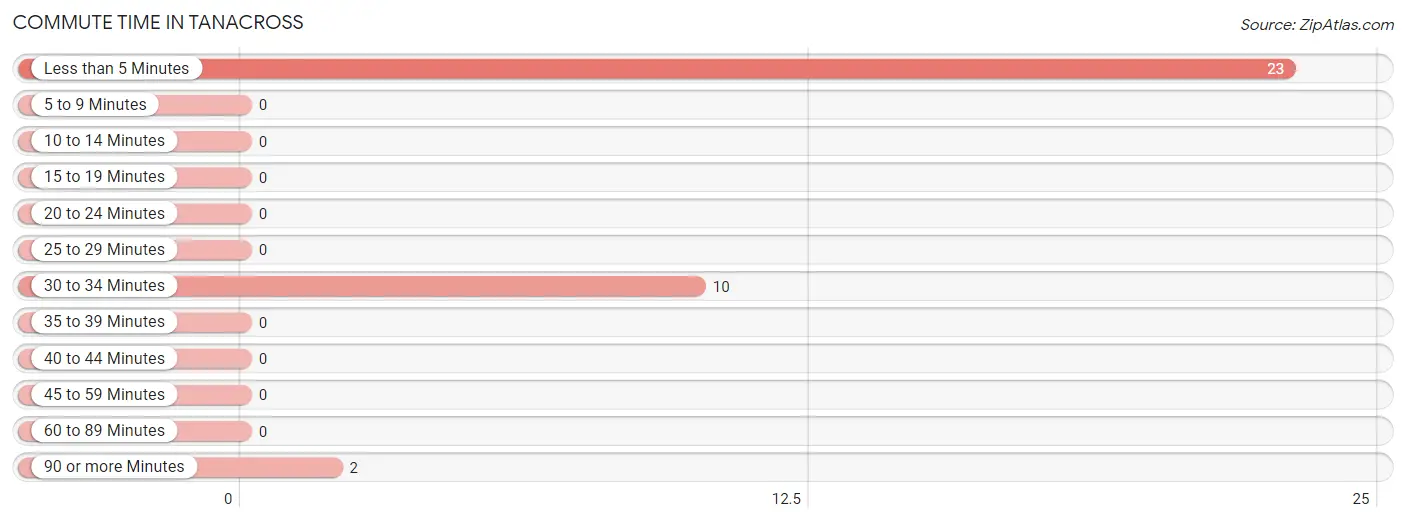
| Commute Time | # Commuters | % Commuters |
| Less than 5 Minutes | 23 | 65.7% |
| 5 to 9 Minutes | 0 | 0.0% |
| 10 to 14 Minutes | 0 | 0.0% |
| 15 to 19 Minutes | 0 | 0.0% |
| 20 to 24 Minutes | 0 | 0.0% |
| 25 to 29 Minutes | 0 | 0.0% |
| 30 to 34 Minutes | 10 | 28.6% |
| 35 to 39 Minutes | 0 | 0.0% |
| 40 to 44 Minutes | 0 | 0.0% |
| 45 to 59 Minutes | 0 | 0.0% |
| 60 to 89 Minutes | 0 | 0.0% |
| 90 or more Minutes | 2 | 5.7% |
Commute Time by Sex in Tanacross
The most common commute times in Tanacross are less than 5 minutes (9 commuters, 69.2%) for males and less than 5 minutes (14 commuters, 63.6%) for females.
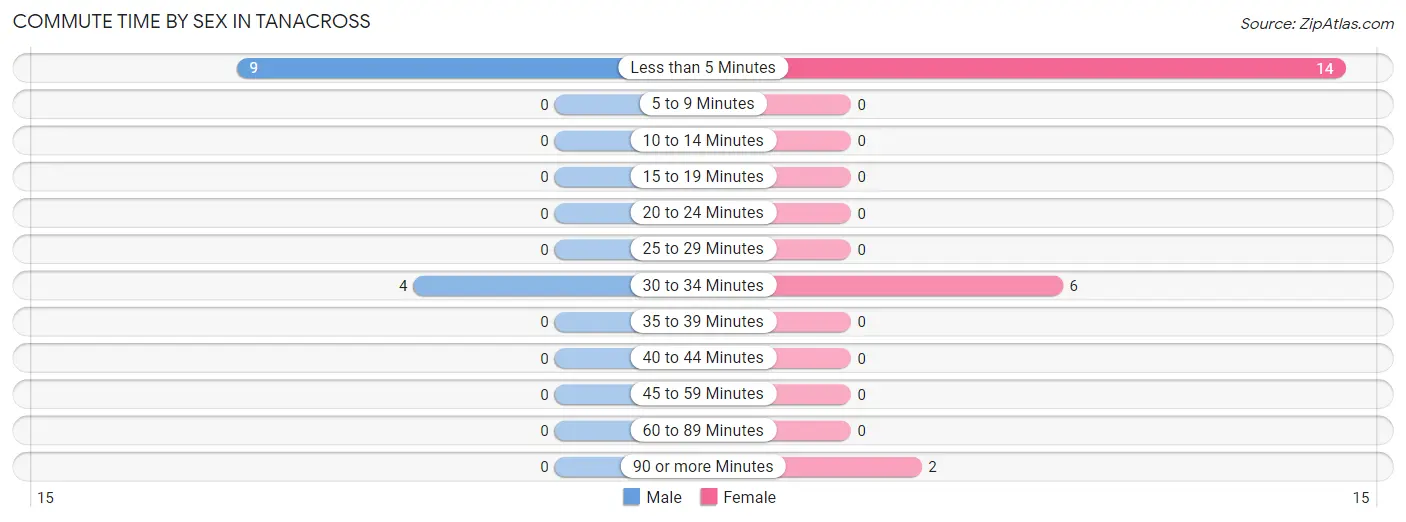
| Commute Time | Male | Female |
| Less than 5 Minutes | 9 (69.2%) | 14 (63.6%) |
| 5 to 9 Minutes | 0 (0.0%) | 0 (0.0%) |
| 10 to 14 Minutes | 0 (0.0%) | 0 (0.0%) |
| 15 to 19 Minutes | 0 (0.0%) | 0 (0.0%) |
| 20 to 24 Minutes | 0 (0.0%) | 0 (0.0%) |
| 25 to 29 Minutes | 0 (0.0%) | 0 (0.0%) |
| 30 to 34 Minutes | 4 (30.8%) | 6 (27.3%) |
| 35 to 39 Minutes | 0 (0.0%) | 0 (0.0%) |
| 40 to 44 Minutes | 0 (0.0%) | 0 (0.0%) |
| 45 to 59 Minutes | 0 (0.0%) | 0 (0.0%) |
| 60 to 89 Minutes | 0 (0.0%) | 0 (0.0%) |
| 90 or more Minutes | 0 (0.0%) | 2 (9.1%) |
Time of Departure to Work by Sex in Tanacross
The most frequent times of departure to work in Tanacross are 9:00 AM to 9:59 AM (6, 46.2%) for males and 8:00 AM to 8:29 AM (9, 40.9%) for females.
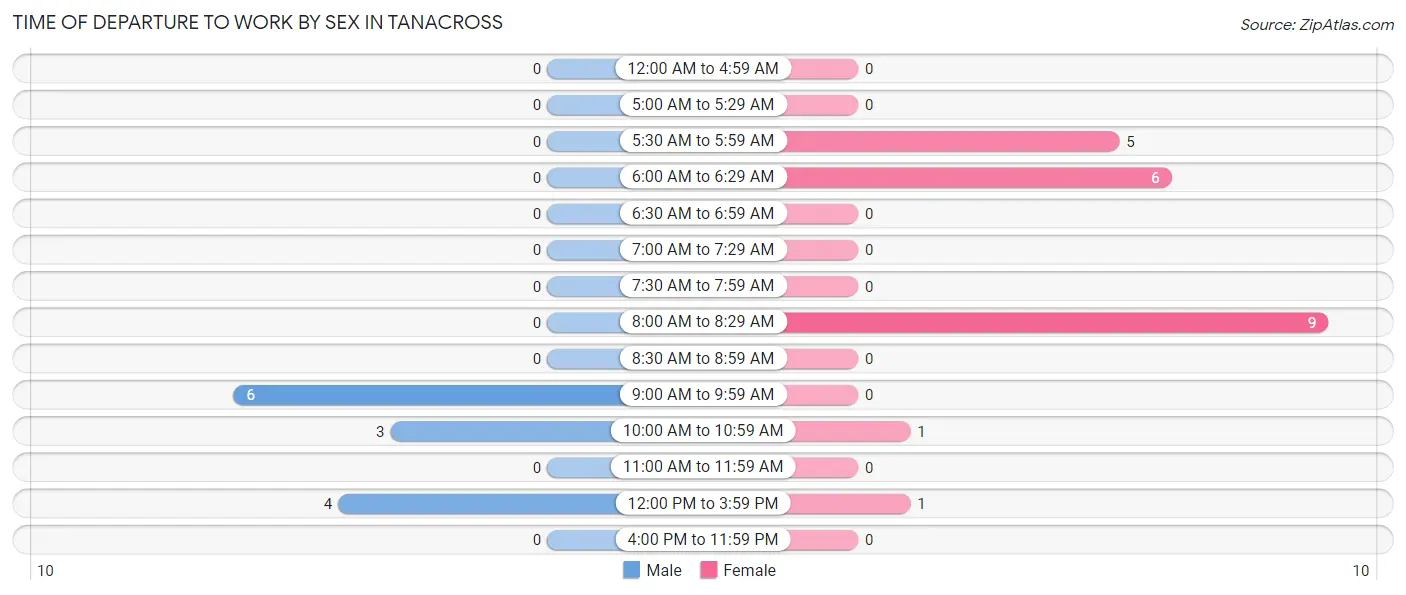
| Time of Departure | Male | Female |
| 12:00 AM to 4:59 AM | 0 (0.0%) | 0 (0.0%) |
| 5:00 AM to 5:29 AM | 0 (0.0%) | 0 (0.0%) |
| 5:30 AM to 5:59 AM | 0 (0.0%) | 5 (22.7%) |
| 6:00 AM to 6:29 AM | 0 (0.0%) | 6 (27.3%) |
| 6:30 AM to 6:59 AM | 0 (0.0%) | 0 (0.0%) |
| 7:00 AM to 7:29 AM | 0 (0.0%) | 0 (0.0%) |
| 7:30 AM to 7:59 AM | 0 (0.0%) | 0 (0.0%) |
| 8:00 AM to 8:29 AM | 0 (0.0%) | 9 (40.9%) |
| 8:30 AM to 8:59 AM | 0 (0.0%) | 0 (0.0%) |
| 9:00 AM to 9:59 AM | 6 (46.2%) | 0 (0.0%) |
| 10:00 AM to 10:59 AM | 3 (23.1%) | 1 (4.5%) |
| 11:00 AM to 11:59 AM | 0 (0.0%) | 0 (0.0%) |
| 12:00 PM to 3:59 PM | 4 (30.8%) | 1 (4.5%) |
| 4:00 PM to 11:59 PM | 0 (0.0%) | 0 (0.0%) |
| Total | 13 (100.0%) | 22 (100.0%) |
Housing Occupancy in Tanacross
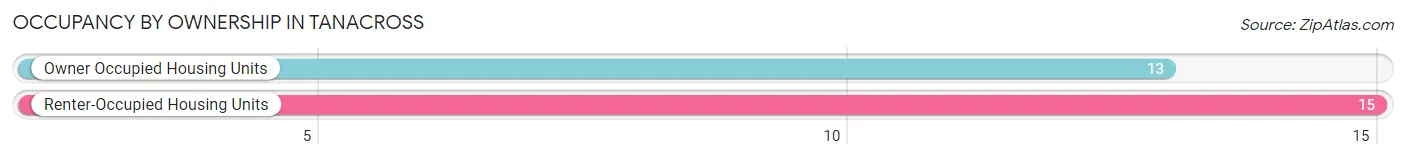
Occupancy by Ownership in Tanacross
Of the total 28 dwellings in Tanacross, owner-occupied units account for 13 (46.4%), while renter-occupied units make up 15 (53.6%).
| Occupancy | # Housing Units | % Housing Units |
| Owner Occupied Housing Units | 13 | 46.4% |
| Renter-Occupied Housing Units | 15 | 53.6% |
| Total Occupied Housing Units | 28 | 100.0% |
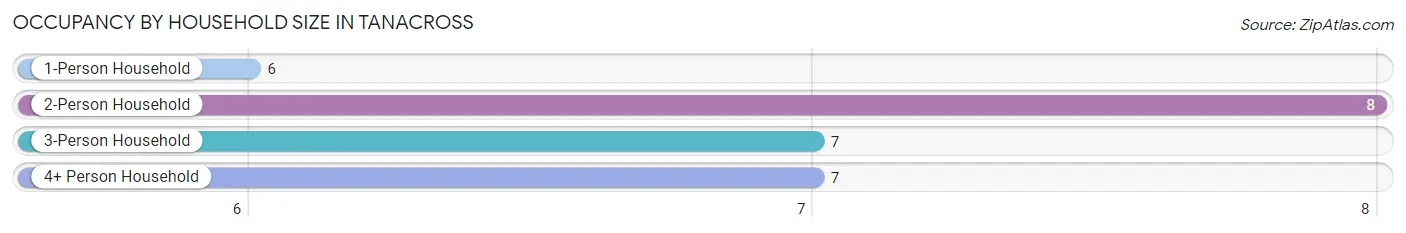
Occupancy by Household Size in Tanacross
| Household Size | # Housing Units | % Housing Units |
| 1-Person Household | 6 | 21.4% |
| 2-Person Household | 8 | 28.6% |
| 3-Person Household | 7 | 25.0% |
| 4+ Person Household | 7 | 25.0% |
| Total Housing Units | 28 | 100.0% |
Occupancy by Ownership by Household Size in Tanacross
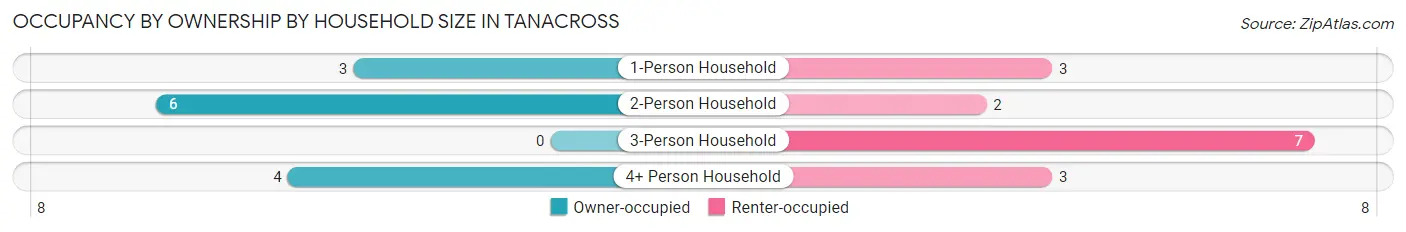
| Household Size | Owner-occupied | Renter-occupied |
| 1-Person Household | 3 (50.0%) | 3 (50.0%) |
| 2-Person Household | 6 (75.0%) | 2 (25.0%) |
| 3-Person Household | 0 (0.0%) | 7 (100.0%) |
| 4+ Person Household | 4 (57.1%) | 3 (42.9%) |
| Total Housing Units | 13 (46.4%) | 15 (53.6%) |
Occupancy by Educational Attainment in Tanacross
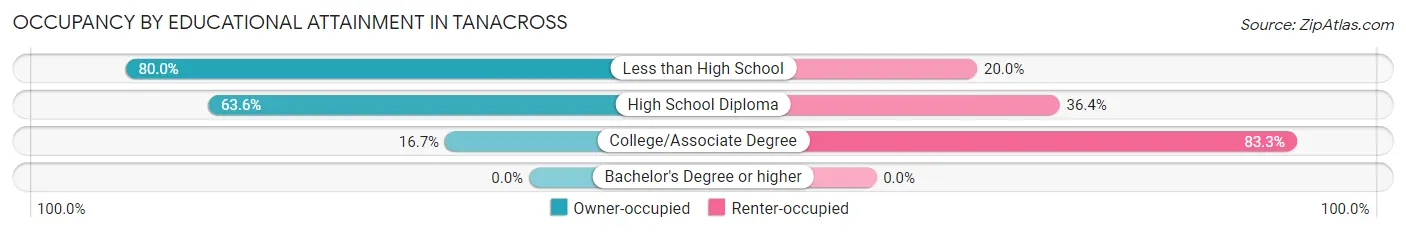
| Household Size | Owner-occupied | Renter-occupied |
| Less than High School | 4 (80.0%) | 1 (20.0%) |
| High School Diploma | 7 (63.6%) | 4 (36.4%) |
| College/Associate Degree | 2 (16.7%) | 10 (83.3%) |
| Bachelor's Degree or higher | 0 (0.0%) | 0 (0.0%) |
Occupancy by Age of Householder in Tanacross
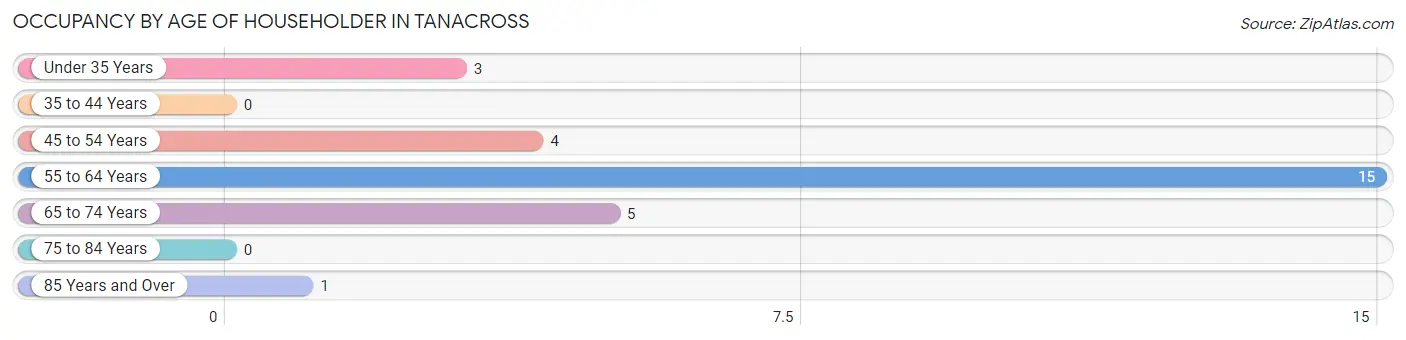
| Age Bracket | # Households | % Households |
| Under 35 Years | 3 | 10.7% |
| 35 to 44 Years | 0 | 0.0% |
| 45 to 54 Years | 4 | 14.3% |
| 55 to 64 Years | 15 | 53.6% |
| 65 to 74 Years | 5 | 17.9% |
| 75 to 84 Years | 0 | 0.0% |
| 85 Years and Over | 1 | 3.6% |
| Total | 28 | 100.0% |
Housing Finances in Tanacross
Median Income by Occupancy in Tanacross
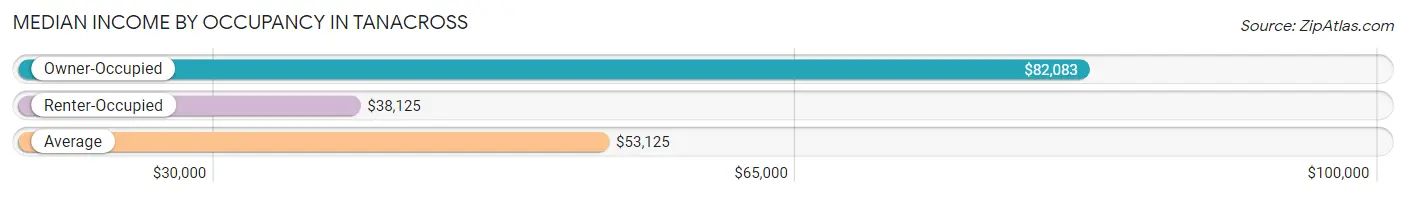
| Occupancy Type | # Households | Median Income |
| Owner-Occupied | 13 (46.4%) | $82,083 |
| Renter-Occupied | 15 (53.6%) | $38,125 |
| Average | 28 (100.0%) | $53,125 |
Occupancy by Householder Income Bracket in Tanacross
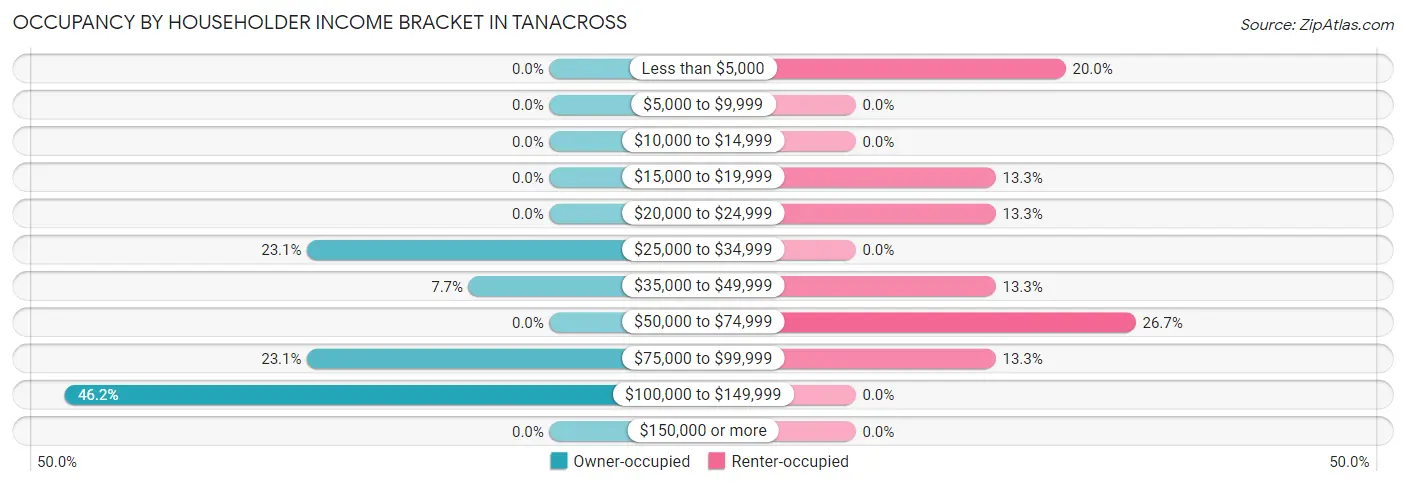
| Income Bracket | Owner-occupied | Renter-occupied |
| Less than $5,000 | 0 (0.0%) | 3 (20.0%) |
| $5,000 to $9,999 | 0 (0.0%) | 0 (0.0%) |
| $10,000 to $14,999 | 0 (0.0%) | 0 (0.0%) |
| $15,000 to $19,999 | 0 (0.0%) | 2 (13.3%) |
| $20,000 to $24,999 | 0 (0.0%) | 2 (13.3%) |
| $25,000 to $34,999 | 3 (23.1%) | 0 (0.0%) |
| $35,000 to $49,999 | 1 (7.7%) | 2 (13.3%) |
| $50,000 to $74,999 | 0 (0.0%) | 4 (26.7%) |
| $75,000 to $99,999 | 3 (23.1%) | 2 (13.3%) |
| $100,000 to $149,999 | 6 (46.2%) | 0 (0.0%) |
| $150,000 or more | 0 (0.0%) | 0 (0.0%) |
| Total | 13 (100.0%) | 15 (100.0%) |
Monthly Housing Cost Tiers in Tanacross
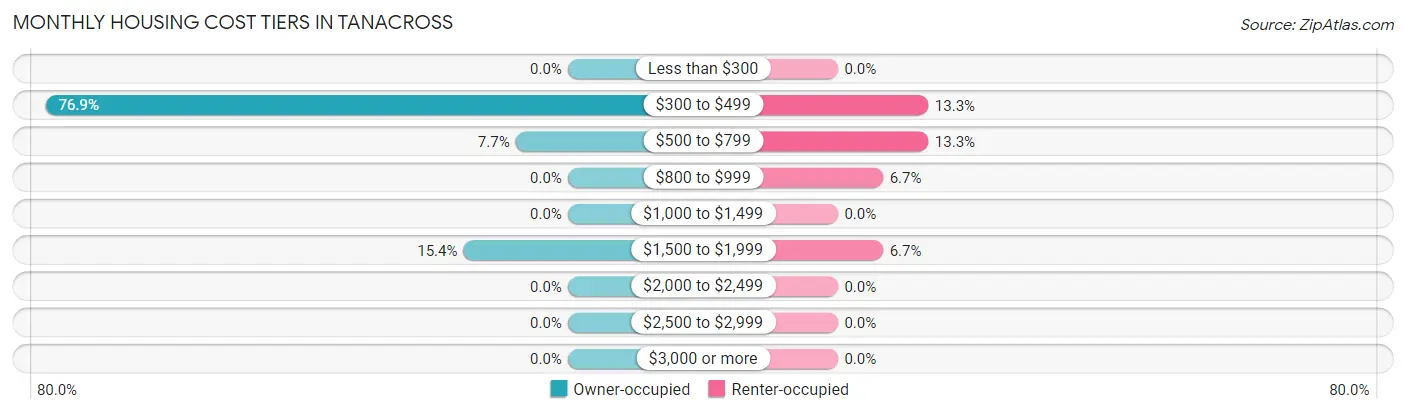
| Monthly Cost | Owner-occupied | Renter-occupied |
| Less than $300 | 0 (0.0%) | 0 (0.0%) |
| $300 to $499 | 10 (76.9%) | 2 (13.3%) |
| $500 to $799 | 1 (7.7%) | 2 (13.3%) |
| $800 to $999 | 0 (0.0%) | 1 (6.7%) |
| $1,000 to $1,499 | 0 (0.0%) | 0 (0.0%) |
| $1,500 to $1,999 | 2 (15.4%) | 1 (6.7%) |
| $2,000 to $2,499 | 0 (0.0%) | 0 (0.0%) |
| $2,500 to $2,999 | 0 (0.0%) | 0 (0.0%) |
| $3,000 or more | 0 (0.0%) | 0 (0.0%) |
| Total | 13 (100.0%) | 15 (100.0%) |
Physical Housing Characteristics in Tanacross
Housing Structures in Tanacross
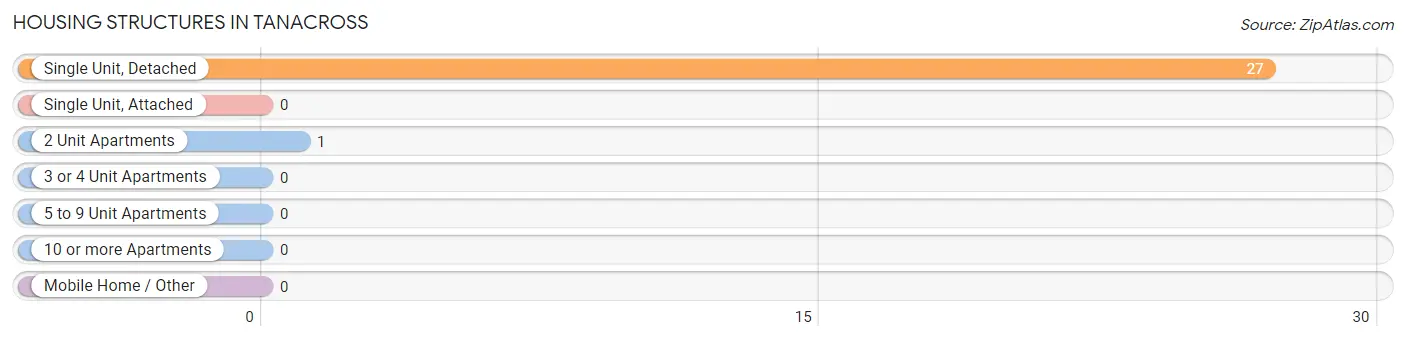
| Structure Type | # Housing Units | % Housing Units |
| Single Unit, Detached | 27 | 96.4% |
| Single Unit, Attached | 0 | 0.0% |
| 2 Unit Apartments | 1 | 3.6% |
| 3 or 4 Unit Apartments | 0 | 0.0% |
| 5 to 9 Unit Apartments | 0 | 0.0% |
| 10 or more Apartments | 0 | 0.0% |
| Mobile Home / Other | 0 | 0.0% |
| Total | 28 | 100.0% |
Housing Structures by Occupancy in Tanacross
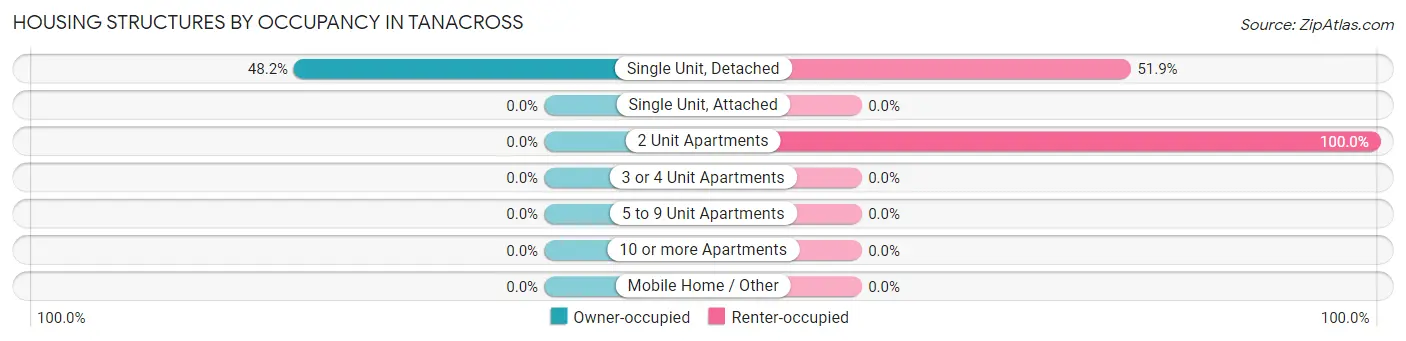
| Structure Type | Owner-occupied | Renter-occupied |
| Single Unit, Detached | 13 (48.1%) | 14 (51.8%) |
| Single Unit, Attached | 0 (0.0%) | 0 (0.0%) |
| 2 Unit Apartments | 0 (0.0%) | 1 (100.0%) |
| 3 or 4 Unit Apartments | 0 (0.0%) | 0 (0.0%) |
| 5 to 9 Unit Apartments | 0 (0.0%) | 0 (0.0%) |
| 10 or more Apartments | 0 (0.0%) | 0 (0.0%) |
| Mobile Home / Other | 0 (0.0%) | 0 (0.0%) |
| Total | 13 (46.4%) | 15 (53.6%) |
Housing Structures by Number of Rooms in Tanacross
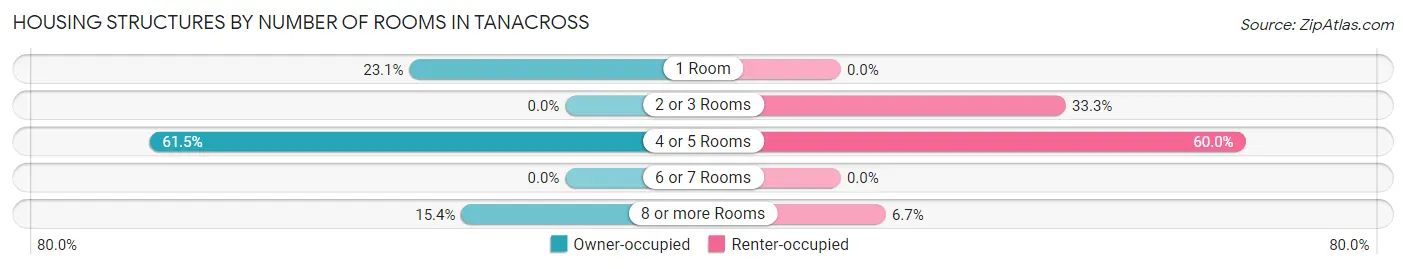
| Number of Rooms | Owner-occupied | Renter-occupied |
| 1 Room | 3 (23.1%) | 0 (0.0%) |
| 2 or 3 Rooms | 0 (0.0%) | 5 (33.3%) |
| 4 or 5 Rooms | 8 (61.5%) | 9 (60.0%) |
| 6 or 7 Rooms | 0 (0.0%) | 0 (0.0%) |
| 8 or more Rooms | 2 (15.4%) | 1 (6.7%) |
| Total | 13 (100.0%) | 15 (100.0%) |
Housing Structure by Heating Type in Tanacross
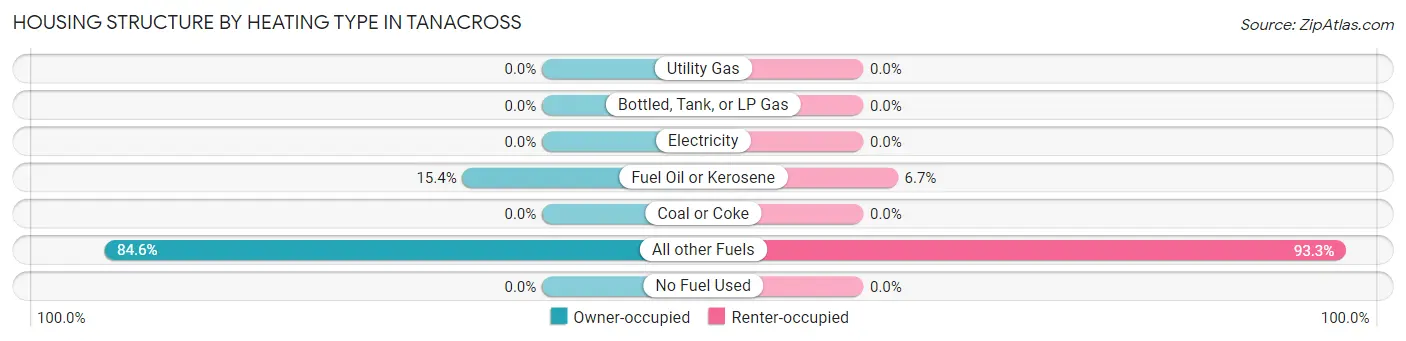
| Heating Type | Owner-occupied | Renter-occupied |
| Utility Gas | 0 (0.0%) | 0 (0.0%) |
| Bottled, Tank, or LP Gas | 0 (0.0%) | 0 (0.0%) |
| Electricity | 0 (0.0%) | 0 (0.0%) |
| Fuel Oil or Kerosene | 2 (15.4%) | 1 (6.7%) |
| Coal or Coke | 0 (0.0%) | 0 (0.0%) |
| All other Fuels | 11 (84.6%) | 14 (93.3%) |
| No Fuel Used | 0 (0.0%) | 0 (0.0%) |
| Total | 13 (100.0%) | 15 (100.0%) |
Household Vehicle Usage in Tanacross
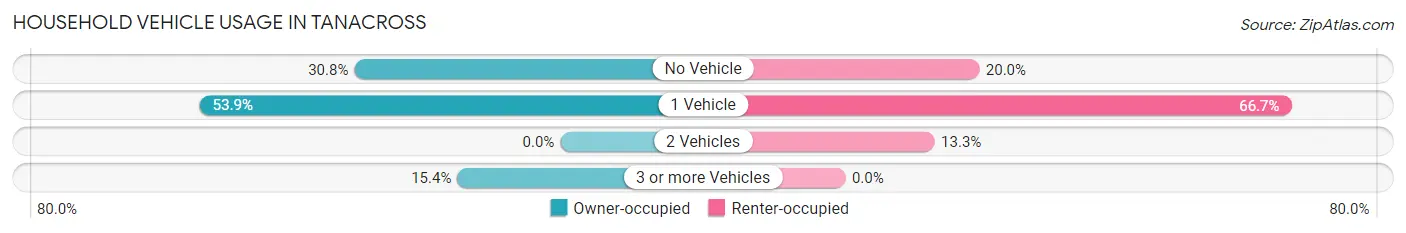
| Vehicles per Household | Owner-occupied | Renter-occupied |
| No Vehicle | 4 (30.8%) | 3 (20.0%) |
| 1 Vehicle | 7 (53.8%) | 10 (66.7%) |
| 2 Vehicles | 0 (0.0%) | 2 (13.3%) |
| 3 or more Vehicles | 2 (15.4%) | 0 (0.0%) |
| Total | 13 (100.0%) | 15 (100.0%) |
Real Estate & Mortgages in Tanacross
Real Estate and Mortgage Overview in Tanacross
| Characteristic | Without Mortgage | With Mortgage |
| Housing Units | 11 | 2 |
| Median Property Value | - | - |
| Median Household Income | $81,250 | $0 |
| Monthly Housing Costs | $389 | $0 |
| Real Estate Taxes | - | - |
Property Value by Mortgage Status in Tanacross
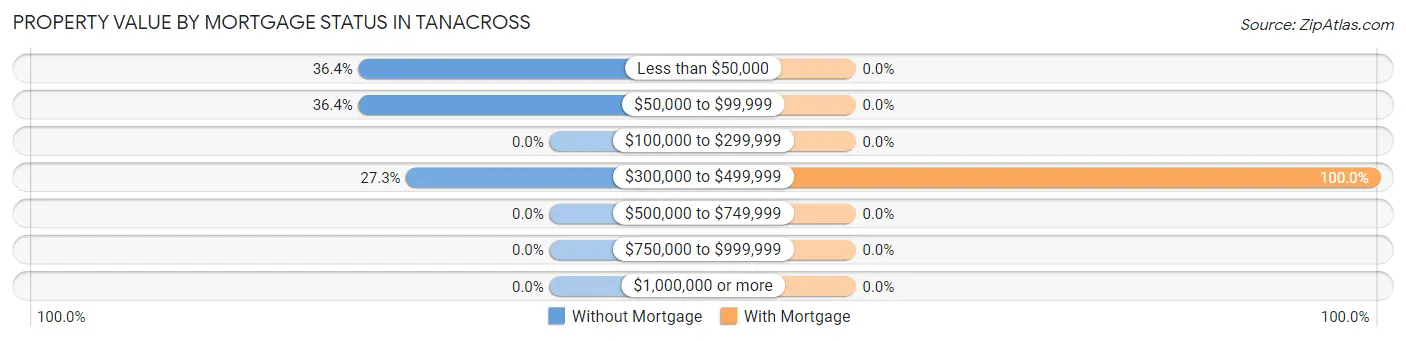
| Property Value | Without Mortgage | With Mortgage |
| Less than $50,000 | 4 (36.4%) | 0 (0.0%) |
| $50,000 to $99,999 | 4 (36.4%) | 0 (0.0%) |
| $100,000 to $299,999 | 0 (0.0%) | 0 (0.0%) |
| $300,000 to $499,999 | 3 (27.3%) | 2 (100.0%) |
| $500,000 to $749,999 | 0 (0.0%) | 0 (0.0%) |
| $750,000 to $999,999 | 0 (0.0%) | 0 (0.0%) |
| $1,000,000 or more | 0 (0.0%) | 0 (0.0%) |
| Total | 11 (100.0%) | 2 (100.0%) |
Household Income by Mortgage Status in Tanacross
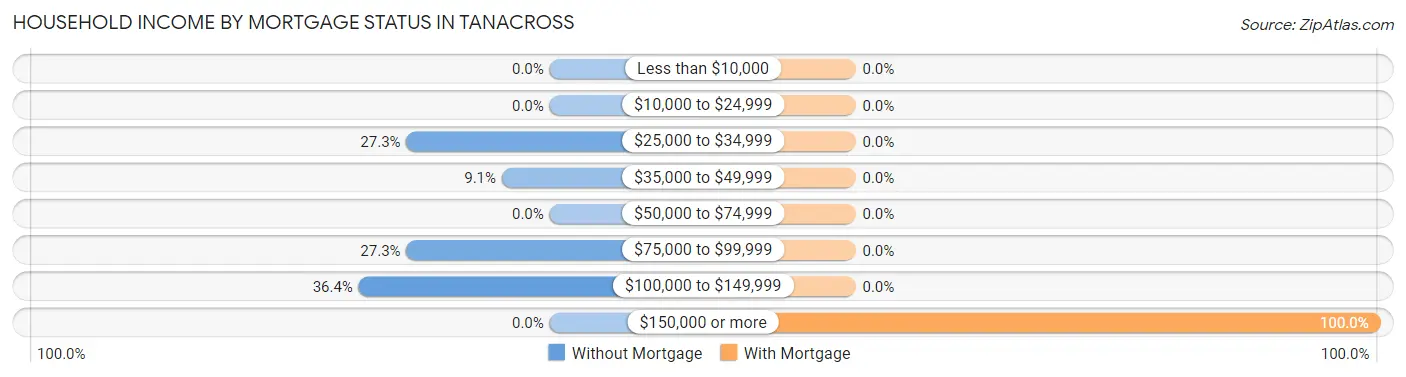
| Household Income | Without Mortgage | With Mortgage |
| Less than $10,000 | 0 (0.0%) | 0 (0.0%) |
| $10,000 to $24,999 | 0 (0.0%) | 0 (0.0%) |
| $25,000 to $34,999 | 3 (27.3%) | 0 (0.0%) |
| $35,000 to $49,999 | 1 (9.1%) | 0 (0.0%) |
| $50,000 to $74,999 | 0 (0.0%) | 0 (0.0%) |
| $75,000 to $99,999 | 3 (27.3%) | 0 (0.0%) |
| $100,000 to $149,999 | 4 (36.4%) | 0 (0.0%) |
| $150,000 or more | 0 (0.0%) | 2 (100.0%) |
| Total | 11 (100.0%) | 2 (100.0%) |
Property Value to Household Income Ratio in Tanacross
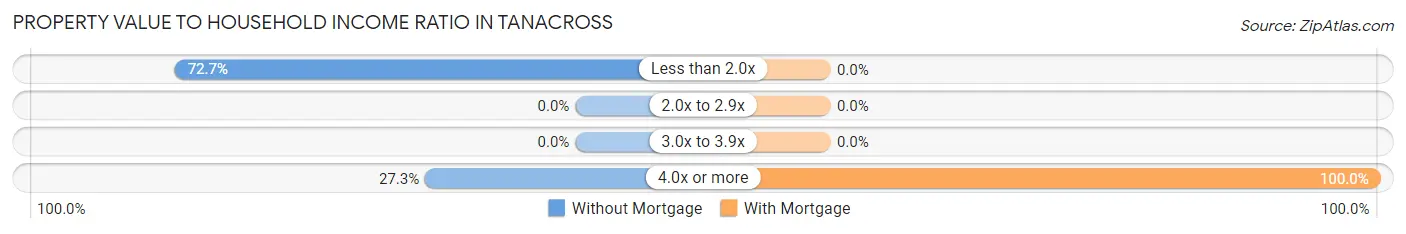
| Value-to-Income Ratio | Without Mortgage | With Mortgage |
| Less than 2.0x | 8 (72.7%) | 0 (0.0%) |
| 2.0x to 2.9x | 0 (0.0%) | 0 (0.0%) |
| 3.0x to 3.9x | 0 (0.0%) | 0 (0.0%) |
| 4.0x or more | 3 (27.3%) | 2 (100.0%) |
| Total | 11 (100.0%) | 2 (100.0%) |
Real Estate Taxes by Mortgage Status in Tanacross
| Property Taxes | Without Mortgage | With Mortgage |
| Less than $800 | 0 (0.0%) | 0 (0.0%) |
| $800 to $1,499 | 0 (0.0%) | 0 (0.0%) |
| $800 to $1,499 | 0 (0.0%) | 0 (0.0%) |
| Total | 11 (100.0%) | 2 (100.0%) |
Health & Disability in Tanacross
Health Insurance Coverage by Age in Tanacross
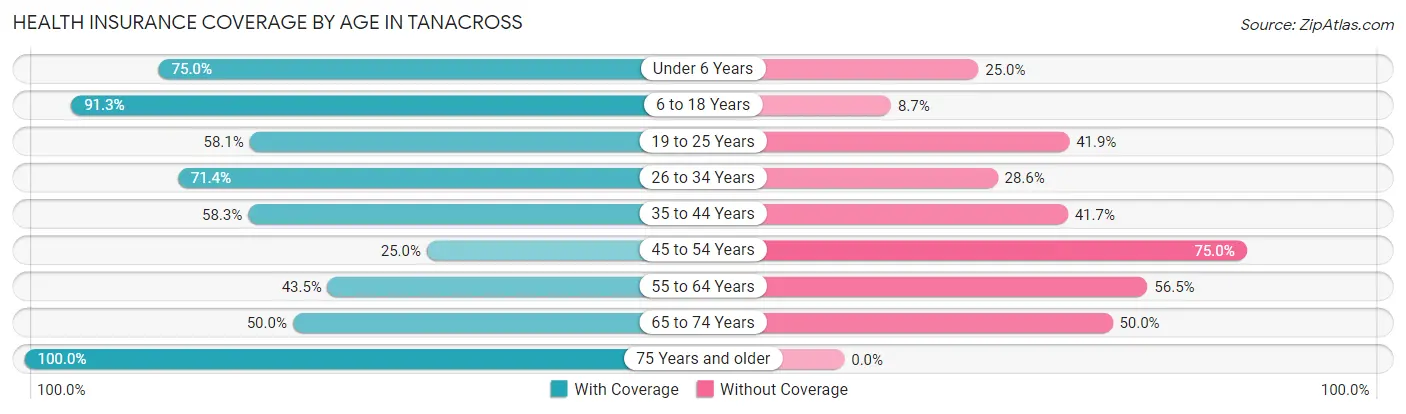
| Age Bracket | With Coverage | Without Coverage |
| Under 6 Years | 9 (75.0%) | 3 (25.0%) |
| 6 to 18 Years | 21 (91.3%) | 2 (8.7%) |
| 19 to 25 Years | 18 (58.1%) | 13 (41.9%) |
| 26 to 34 Years | 5 (71.4%) | 2 (28.6%) |
| 35 to 44 Years | 14 (58.3%) | 10 (41.7%) |
| 45 to 54 Years | 1 (25.0%) | 3 (75.0%) |
| 55 to 64 Years | 10 (43.5%) | 13 (56.5%) |
| 65 to 74 Years | 5 (50.0%) | 5 (50.0%) |
| 75 Years and older | 2 (100.0%) | 0 (0.0%) |
| Total | 85 (62.5%) | 51 (37.5%) |
Health Insurance Coverage by Citizenship Status in Tanacross
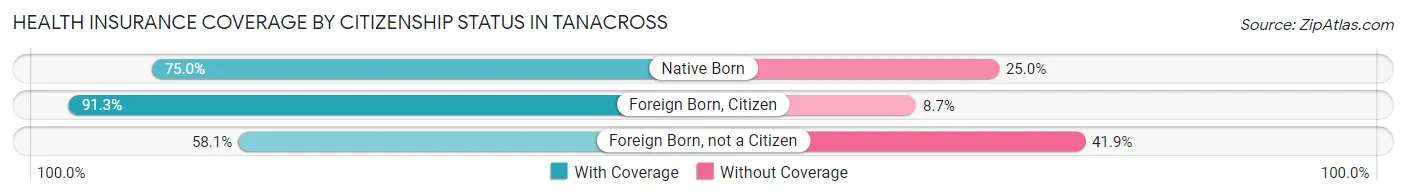
| Citizenship Status | With Coverage | Without Coverage |
| Native Born | 9 (75.0%) | 3 (25.0%) |
| Foreign Born, Citizen | 21 (91.3%) | 2 (8.7%) |
| Foreign Born, not a Citizen | 18 (58.1%) | 13 (41.9%) |
Health Insurance Coverage by Household Income in Tanacross
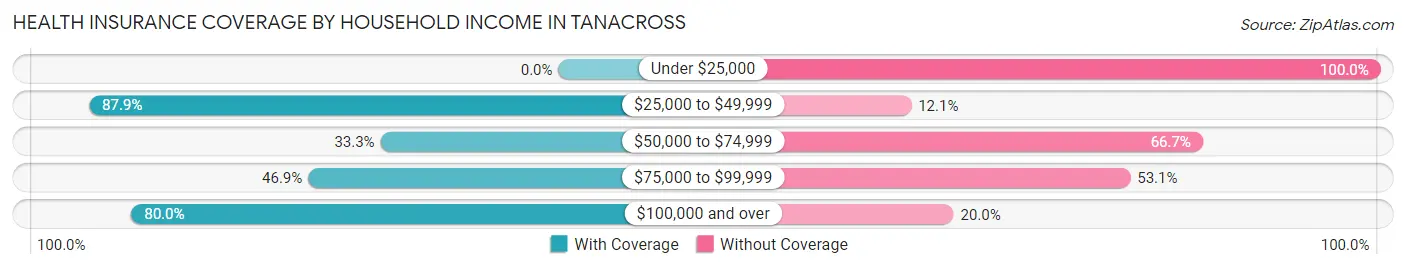
| Household Income | With Coverage | Without Coverage |
| Under $25,000 | 0 (0.0%) | 17 (100.0%) |
| $25,000 to $49,999 | 51 (87.9%) | 7 (12.1%) |
| $50,000 to $74,999 | 3 (33.3%) | 6 (66.7%) |
| $75,000 to $99,999 | 15 (46.9%) | 17 (53.1%) |
| $100,000 and over | 16 (80.0%) | 4 (20.0%) |
Public vs Private Health Insurance Coverage by Age in Tanacross
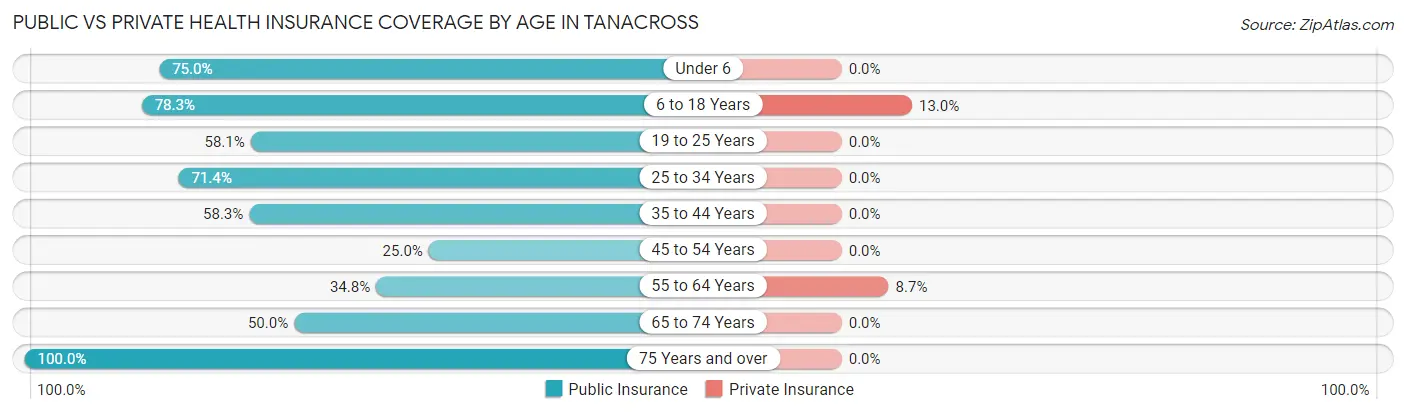
| Age Bracket | Public Insurance | Private Insurance |
| Under 6 | 9 (75.0%) | 0 (0.0%) |
| 6 to 18 Years | 18 (78.3%) | 3 (13.0%) |
| 19 to 25 Years | 18 (58.1%) | 0 (0.0%) |
| 25 to 34 Years | 5 (71.4%) | 0 (0.0%) |
| 35 to 44 Years | 14 (58.3%) | 0 (0.0%) |
| 45 to 54 Years | 1 (25.0%) | 0 (0.0%) |
| 55 to 64 Years | 8 (34.8%) | 2 (8.7%) |
| 65 to 74 Years | 5 (50.0%) | 0 (0.0%) |
| 75 Years and over | 2 (100.0%) | 0 (0.0%) |
| Total | 80 (58.8%) | 5 (3.7%) |
Disability Status by Sex by Age in Tanacross
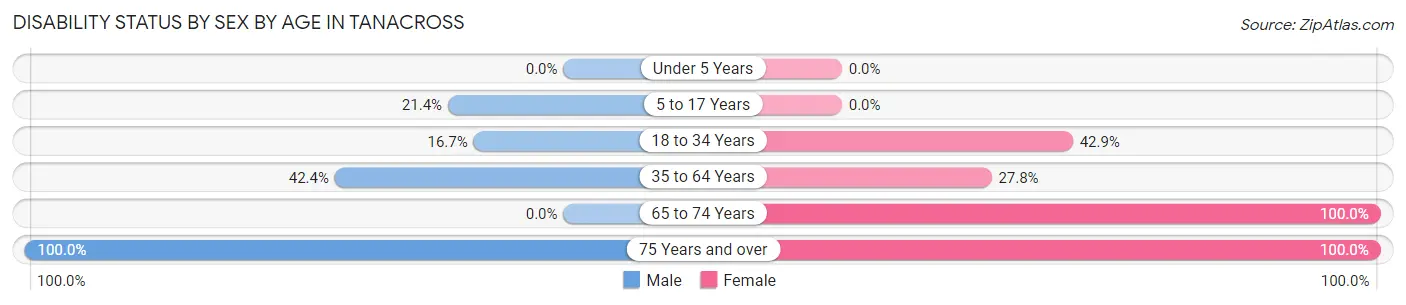
| Age Bracket | Male | Female |
| Under 5 Years | 0 (0.0%) | 0 (0.0%) |
| 5 to 17 Years | 3 (21.4%) | 0 (0.0%) |
| 18 to 34 Years | 4 (16.7%) | 6 (42.9%) |
| 35 to 64 Years | 14 (42.4%) | 5 (27.8%) |
| 65 to 74 Years | 0 (0.0%) | 5 (100.0%) |
| 75 Years and over | 1 (100.0%) | 1 (100.0%) |
Disability Class by Sex by Age in Tanacross
Disability Class: Hearing Difficulty
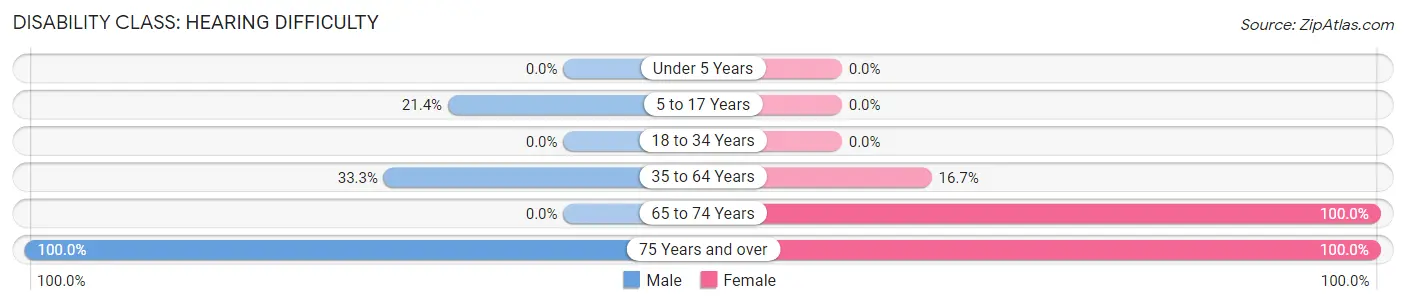
| Age Bracket | Male | Female |
| Under 5 Years | 0 (0.0%) | 0 (0.0%) |
| 5 to 17 Years | 3 (21.4%) | 0 (0.0%) |
| 18 to 34 Years | 0 (0.0%) | 0 (0.0%) |
| 35 to 64 Years | 11 (33.3%) | 3 (16.7%) |
| 65 to 74 Years | 0 (0.0%) | 5 (100.0%) |
| 75 Years and over | 1 (100.0%) | 1 (100.0%) |
Disability Class: Vision Difficulty
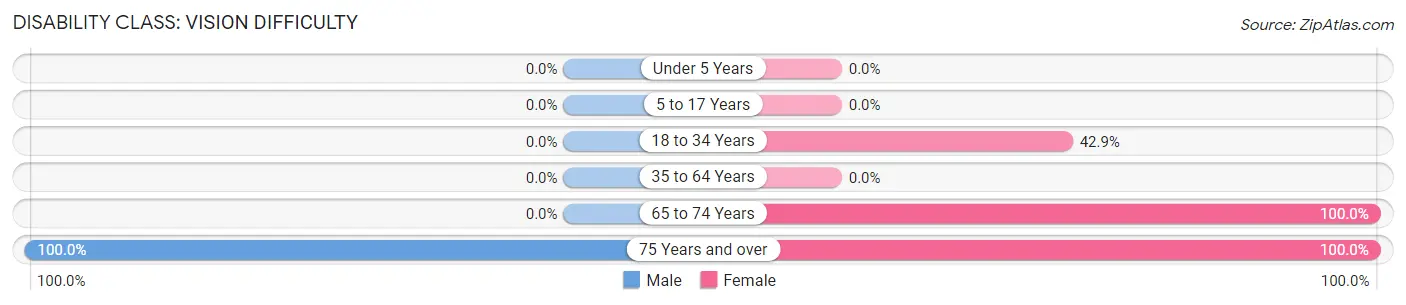
| Age Bracket | Male | Female |
| Under 5 Years | 0 (0.0%) | 0 (0.0%) |
| 5 to 17 Years | 0 (0.0%) | 0 (0.0%) |
| 18 to 34 Years | 0 (0.0%) | 6 (42.9%) |
| 35 to 64 Years | 0 (0.0%) | 0 (0.0%) |
| 65 to 74 Years | 0 (0.0%) | 5 (100.0%) |
| 75 Years and over | 1 (100.0%) | 1 (100.0%) |
Disability Class: Cognitive Difficulty
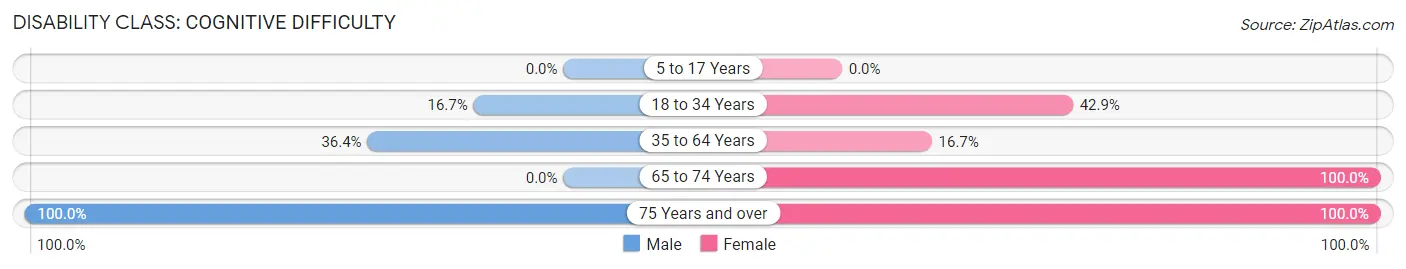
| Age Bracket | Male | Female |
| 5 to 17 Years | 0 (0.0%) | 0 (0.0%) |
| 18 to 34 Years | 4 (16.7%) | 6 (42.9%) |
| 35 to 64 Years | 12 (36.4%) | 3 (16.7%) |
| 65 to 74 Years | 0 (0.0%) | 5 (100.0%) |
| 75 Years and over | 1 (100.0%) | 1 (100.0%) |
Disability Class: Ambulatory Difficulty
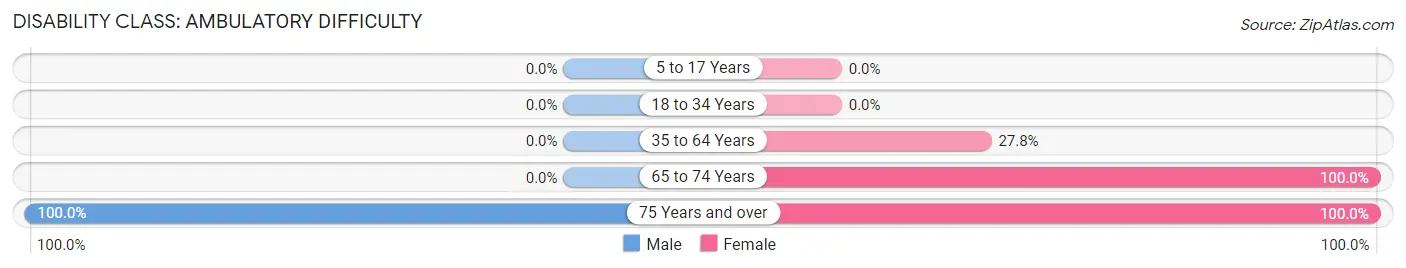
| Age Bracket | Male | Female |
| 5 to 17 Years | 0 (0.0%) | 0 (0.0%) |
| 18 to 34 Years | 0 (0.0%) | 0 (0.0%) |
| 35 to 64 Years | 0 (0.0%) | 5 (27.8%) |
| 65 to 74 Years | 0 (0.0%) | 5 (100.0%) |
| 75 Years and over | 1 (100.0%) | 1 (100.0%) |
Disability Class: Self-Care Difficulty
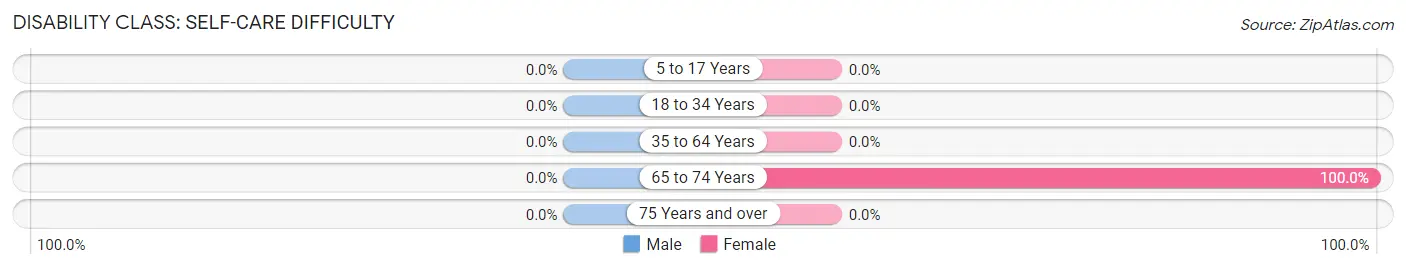
| Age Bracket | Male | Female |
| 5 to 17 Years | 0 (0.0%) | 0 (0.0%) |
| 18 to 34 Years | 0 (0.0%) | 0 (0.0%) |
| 35 to 64 Years | 0 (0.0%) | 0 (0.0%) |
| 65 to 74 Years | 0 (0.0%) | 5 (100.0%) |
| 75 Years and over | 0 (0.0%) | 0 (0.0%) |
Technology Access in Tanacross
Computing Device Access in Tanacross
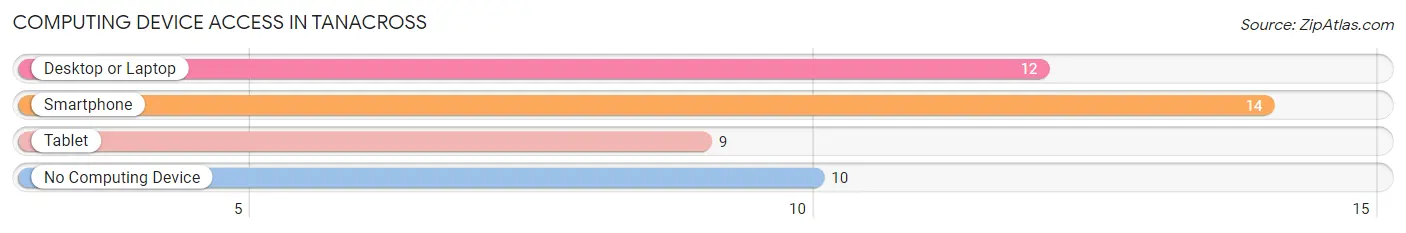
| Device Type | # Households | % Households |
| Desktop or Laptop | 12 | 42.9% |
| Smartphone | 14 | 50.0% |
| Tablet | 9 | 32.1% |
| No Computing Device | 10 | 35.7% |
| Total | 28 | 100.0% |
Internet Access in Tanacross

| Internet Type | # Households | % Households |
| Dial-Up Internet | 0 | 0.0% |
| Broadband Home | 6 | 21.4% |
| Cellular Data Only | 2 | 7.1% |
| Satellite Internet | 2 | 7.1% |
| No Internet | 18 | 64.3% |
| Total | 28 | 100.0% |
Tanacross Summary
Tanacross is a small unincorporated community located in the eastern interior of Alaska, in the Yukon-Koyukuk Census Area. It is situated on the south bank of the Tanana River, approximately 40 miles east of Tok, Alaska. The population of Tanacross was estimated to be around 200 people in 2020.
History
Tanacross has a long and rich history, dating back to the early 1800s when the Tanana Athabascans first settled in the area. The Tanana Athabascans were a nomadic people who followed the caribou herds and other game animals for sustenance. They were also known for their intricate beadwork and basketry.
In the late 1800s, the first non-Native settlers arrived in the area, primarily gold miners and fur traders. The first post office was established in Tanacross in 1902, and the first school was built in 1906.
In the early 1900s, the Tanana Athabascans began to adopt a more sedentary lifestyle, and the population of Tanacross began to grow. In the 1920s, the Alaska Railroad was built, connecting Tanacross to the rest of Alaska. This allowed for increased trade and commerce, and the population of Tanacross continued to grow.
In the 1950s, the Tanana Athabascans began to receive federal recognition as a tribe, and the Tanana Tribal Council was established. This allowed the Tanana Athabascans to gain more control over their land and resources.
Geography
Tanacross is located in the eastern interior of Alaska, in the Yukon-Koyukuk Census Area. It is situated on the south bank of the Tanana River, approximately 40 miles east of Tok, Alaska. The Tanana River is a major tributary of the Yukon River, and is the longest river in Alaska.
The terrain around Tanacross is mostly flat, with rolling hills and low mountains in the distance. The area is heavily forested, with spruce, birch, and aspen trees. The climate is subarctic, with cold winters and mild summers.
Economy
The economy of Tanacross is largely based on subsistence activities, such as hunting, fishing, and trapping. The Tanana Athabascans also practice traditional crafts such as beadwork and basketry.
The Tanana Tribal Council operates a number of businesses in the area, including a gas station, a grocery store, and a restaurant. The Tanana Tribal Council also operates a number of programs to help the local population, such as a housing program and a health clinic.
The Tanana Tribal Council also operates a number of programs to promote economic development in the area, such as a small business loan program and a tourism program.
Demographics
The population of Tanacross was estimated to be around 200 people in 2020. The majority of the population is Native American, primarily Tanana Athabascans. The median age of the population is 33.
The median household income in Tanacross is $25,000, and the median home value is $50,000. The unemployment rate is around 10%. The poverty rate is around 40%.
Conclusion
Tanacross is a small unincorporated community located in the eastern interior of Alaska, in the Yukon-Koyukuk Census Area. It has a long and rich history, dating back to the early 1800s when the Tanana Athabascans first settled in the area. The economy of Tanacross is largely based on subsistence activities, such as hunting, fishing, and trapping. The population of Tanacross was estimated to be around 200 people in 2020, and the majority of the population is Native American, primarily Tanana Athabascans. The median household income in Tanacross is $25,000, and the median home value is $50,000. The unemployment rate is around 10%, and the poverty rate is around 40%.
Common Questions
What is Per Capita Income in Tanacross?
Per Capita income in Tanacross is $14,525.
What is the Median Family Income in Tanacross?
Median Family Income in Tanacross is $80,833.
What is the Median Household income in Tanacross?
Median Household Income in Tanacross is $53,125.
What is Inequality or Gini Index in Tanacross?
Inequality or Gini Index in Tanacross is 0.39.
What is the Total Population of Tanacross?
Total Population of Tanacross is 136.
What is the Total Male Population of Tanacross?
Total Male Population of Tanacross is 77.
What is the Total Female Population of Tanacross?
Total Female Population of Tanacross is 59.
What is the Ratio of Males per 100 Females in Tanacross?
There are 130.51 Males per 100 Females in Tanacross.
What is the Ratio of Females per 100 Males in Tanacross?
There are 76.62 Females per 100 Males in Tanacross.
What is the Median Population Age in Tanacross?
Median Population Age in Tanacross is 32.3 Years.
What is the Average Family Size in Tanacross
Average Family Size in Tanacross is 6.3 People.
What is the Average Household Size in Tanacross
Average Household Size in Tanacross is 4.9 People.
How Large is the Labor Force in Tanacross?
There are 35 People in the Labor Forcein in Tanacross.
What is the Percentage of People in the Labor Force in Tanacross?
34.7% of People are in the Labor Force in Tanacross.