Talkeetna, AK Map & Demographics
Talkeetna Map
Talkeetna Overview
$32,274
PER CAPITA INCOME
$79,659
AVG FAMILY INCOME
$79,091
AVG HOUSEHOLD INCOME
25.8%
WAGE / INCOME GAP [ % ]
74.2¢/ $1
WAGE / INCOME GAP [ $ ]
0.36
INEQUALITY / GINI INDEX
1,044
TOTAL POPULATION
499
MALE POPULATION
545
FEMALE POPULATION
91.56
MALES / 100 FEMALES
109.22
FEMALES / 100 MALES
41.5
MEDIAN AGE
3.3
AVG FAMILY SIZE
2.5
AVG HOUSEHOLD SIZE
567
LABOR FORCE [ PEOPLE ]
80.5%
PERCENT IN LABOR FORCE
4.2%
UNEMPLOYMENT RATE
Talkeetna Zip Codes
Talkeetna Area Codes
Income in Talkeetna
Income Overview in Talkeetna
Per Capita Income in Talkeetna is $32,274, while median incomes of families and households are $79,659 and $79,091 respectively.
| Characteristic | Number | Measure |
| Per Capita Income | 1,044 | $32,274 |
| Median Family Income | 265 | $79,659 |
| Mean Family Income | 265 | $84,690 |
| Median Household Income | 408 | $79,091 |
| Mean Household Income | 408 | $82,390 |
| Income Deficit | 265 | $0 |
| Wage / Income Gap (%) | 1,044 | 25.79% |
| Wage / Income Gap ($) | 1,044 | 74.21¢ per $1 |
| Gini / Inequality Index | 1,044 | 0.36 |
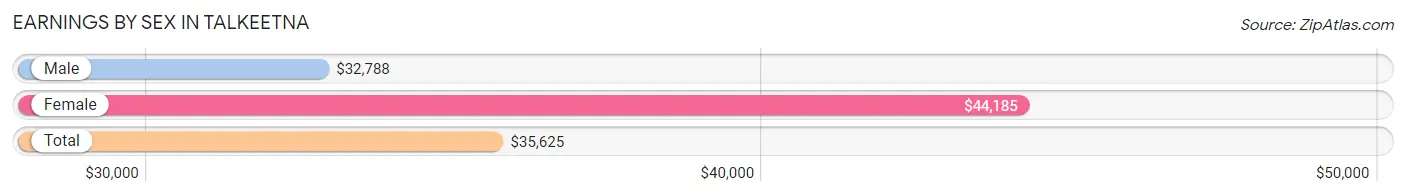
Earnings by Sex in Talkeetna
Average Earnings in Talkeetna are $35,625, $32,788 for men and $44,185 for women, a difference of 25.8%.
| Sex | Number | Average Earnings |
| Male | 272 (49.0%) | $32,788 |
| Female | 283 (51.0%) | $44,185 |
| Total | 555 (100.0%) | $35,625 |
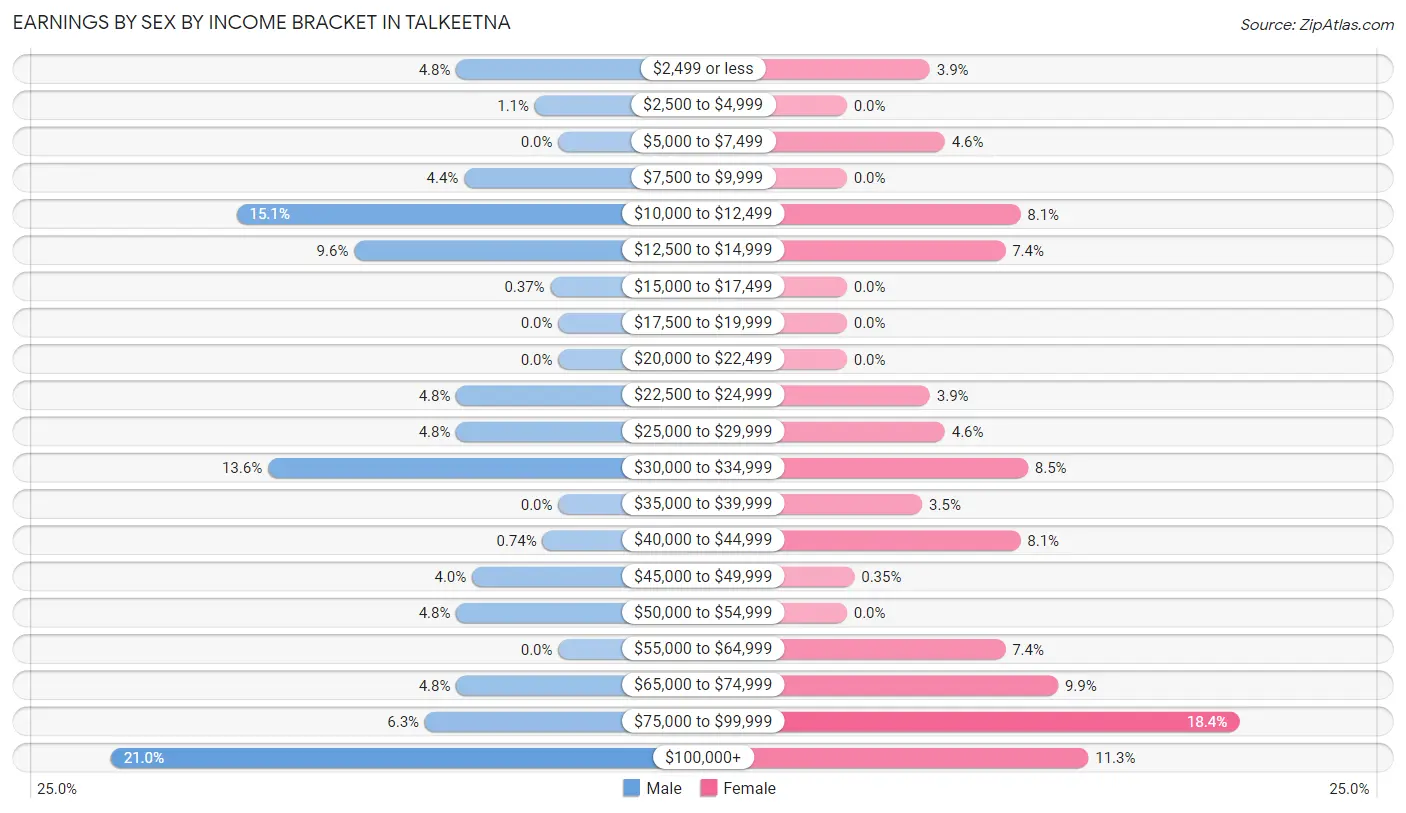
Earnings by Sex by Income Bracket in Talkeetna
The most common earnings brackets in Talkeetna are $100,000+ for men (57 | 21.0%) and $75,000 to $99,999 for women (52 | 18.4%).
| Income | Male | Female |
| $2,499 or less | 13 (4.8%) | 11 (3.9%) |
| $2,500 to $4,999 | 3 (1.1%) | 0 (0.0%) |
| $5,000 to $7,499 | 0 (0.0%) | 13 (4.6%) |
| $7,500 to $9,999 | 12 (4.4%) | 0 (0.0%) |
| $10,000 to $12,499 | 41 (15.1%) | 23 (8.1%) |
| $12,500 to $14,999 | 26 (9.6%) | 21 (7.4%) |
| $15,000 to $17,499 | 1 (0.4%) | 0 (0.0%) |
| $17,500 to $19,999 | 0 (0.0%) | 0 (0.0%) |
| $20,000 to $22,499 | 0 (0.0%) | 0 (0.0%) |
| $22,500 to $24,999 | 13 (4.8%) | 11 (3.9%) |
| $25,000 to $29,999 | 13 (4.8%) | 13 (4.6%) |
| $30,000 to $34,999 | 37 (13.6%) | 24 (8.5%) |
| $35,000 to $39,999 | 0 (0.0%) | 10 (3.5%) |
| $40,000 to $44,999 | 2 (0.7%) | 23 (8.1%) |
| $45,000 to $49,999 | 11 (4.0%) | 1 (0.4%) |
| $50,000 to $54,999 | 13 (4.8%) | 0 (0.0%) |
| $55,000 to $64,999 | 0 (0.0%) | 21 (7.4%) |
| $65,000 to $74,999 | 13 (4.8%) | 28 (9.9%) |
| $75,000 to $99,999 | 17 (6.2%) | 52 (18.4%) |
| $100,000+ | 57 (21.0%) | 32 (11.3%) |
| Total | 272 (100.0%) | 283 (100.0%) |
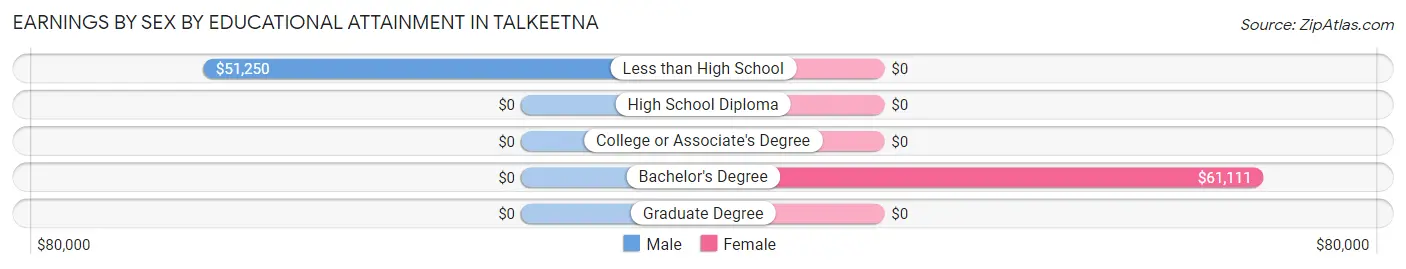
Earnings by Sex by Educational Attainment in Talkeetna
Average earnings in Talkeetna are $32,837 for men and $44,891 for women, a difference of 26.9%. Men with an educational attainment of less than high school enjoy the highest average annual earnings of $51,250, while those with less than high school education earn the least with $51,250. Women with an educational attainment of bachelor's degree earn the most with the average annual earnings of $61,111, while those with bachelor's degree education have the smallest earnings of $61,111.
| Educational Attainment | Male Income | Female Income |
| Less than High School | $51,250 | $0 |
| High School Diploma | - | - |
| College or Associate's Degree | - | - |
| Bachelor's Degree | - | - |
| Graduate Degree | - | - |
| Total | $32,837 | $44,891 |
Family Income in Talkeetna
Family Income Brackets in Talkeetna
According to the Talkeetna family income data, there are 79 families falling into the $100,000 to $149,999 income range, which is the most common income bracket and makes up 29.8% of all families.
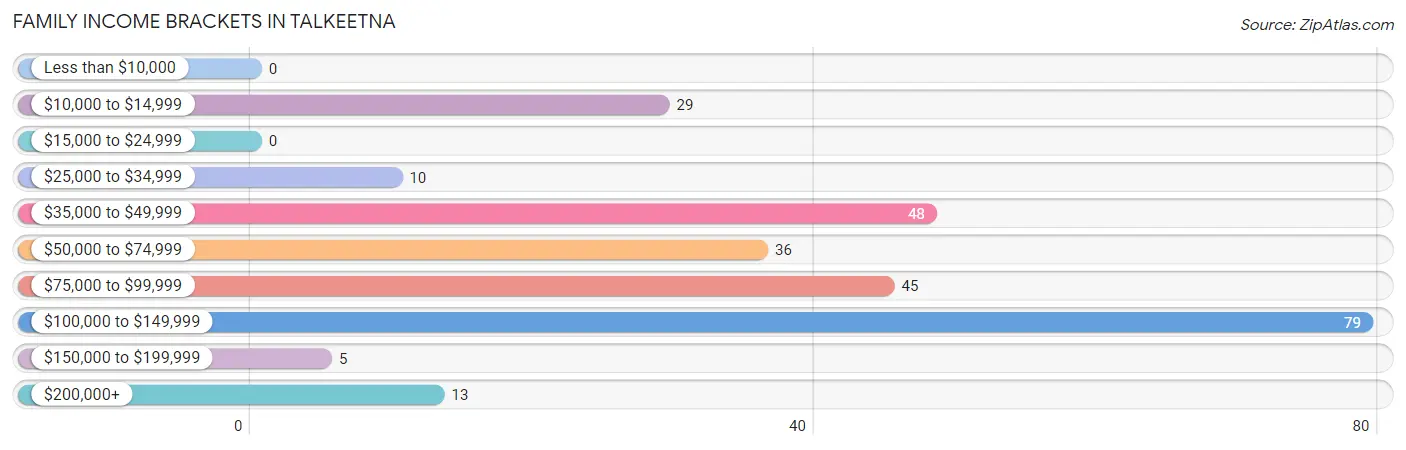
| Income Bracket | # Families | % Families |
| Less than $10,000 | 0 | 0.0% |
| $10,000 to $14,999 | 29 | 10.9% |
| $15,000 to $24,999 | 0 | 0.0% |
| $25,000 to $34,999 | 10 | 3.8% |
| $35,000 to $49,999 | 48 | 18.1% |
| $50,000 to $74,999 | 36 | 13.6% |
| $75,000 to $99,999 | 45 | 17.0% |
| $100,000 to $149,999 | 79 | 29.8% |
| $150,000 to $199,999 | 5 | 1.9% |
| $200,000+ | 13 | 4.9% |
Family Income by Famaliy Size in Talkeetna
4-person families (68 | 25.7%) account for the highest median family income in Talkeetna with $106,786 per family, while 4-person families (68 | 25.7%) have the highest median income of $26,696 per family member.
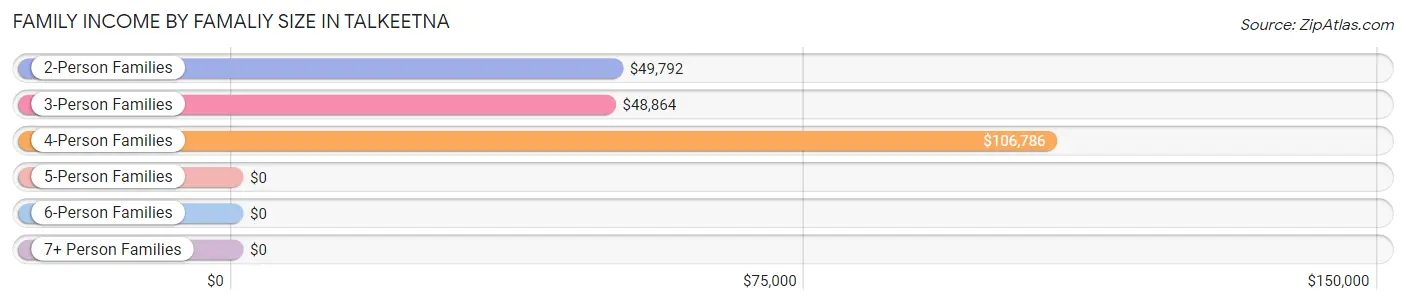
| Income Bracket | # Families | Median Income |
| 2-Person Families | 128 (48.3%) | $49,792 |
| 3-Person Families | 34 (12.8%) | $48,864 |
| 4-Person Families | 68 (25.7%) | $106,786 |
| 5-Person Families | 24 (9.1%) | $0 |
| 6-Person Families | 0 (0.0%) | $0 |
| 7+ Person Families | 11 (4.2%) | $0 |
| Total | 265 (100.0%) | $79,659 |
Family Income by Number of Earners in Talkeetna
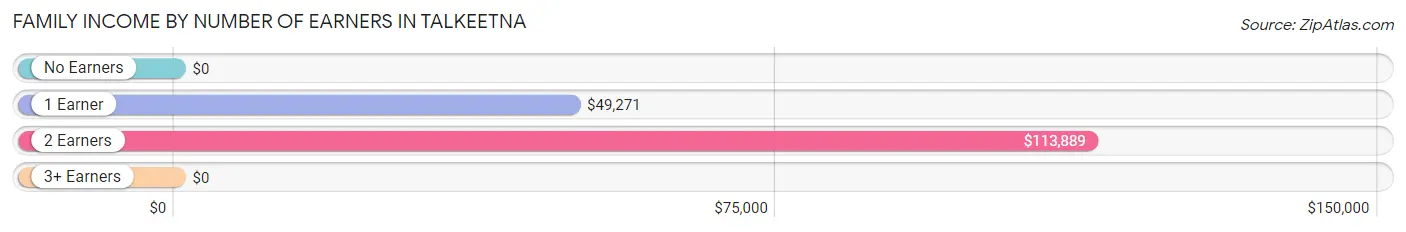
| Number of Earners | # Families | Median Income |
| No Earners | 20 (7.5%) | $0 |
| 1 Earner | 101 (38.1%) | $49,271 |
| 2 Earners | 132 (49.8%) | $113,889 |
| 3+ Earners | 12 (4.5%) | $0 |
| Total | 265 (100.0%) | $79,659 |
Household Income in Talkeetna
Household Income Brackets in Talkeetna
With 132 households falling in the category, the $100,000 to $149,999 income range is the most frequent in Talkeetna, accounting for 32.4% of all households. In contrast, only 10 households (2.5%) fall into the $25,000 to $34,999 income bracket, making it the least populous group.
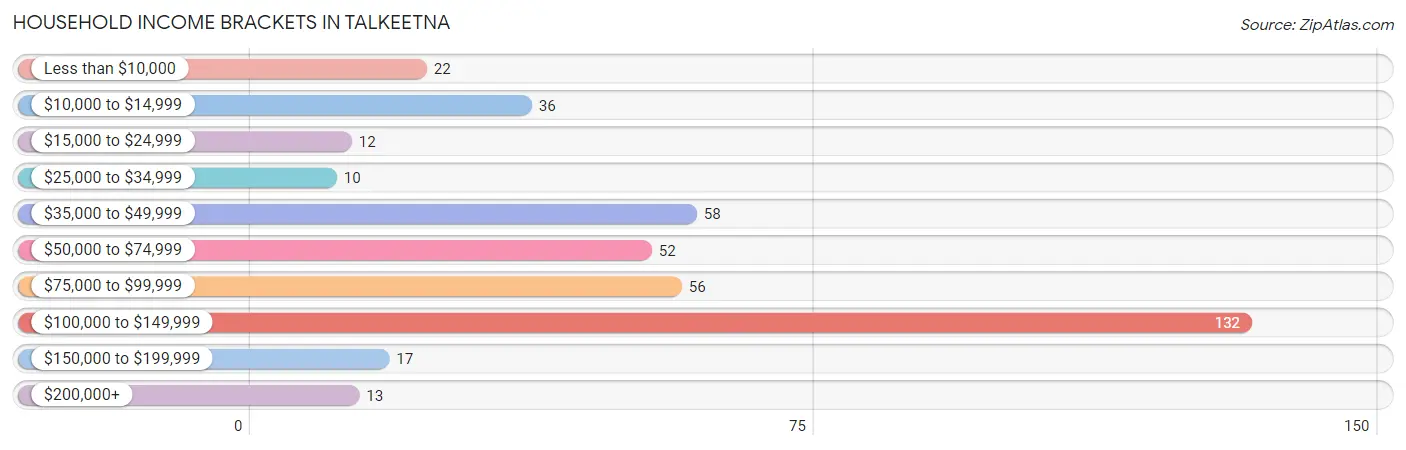
| Income Bracket | # Households | % Households |
| Less than $10,000 | 22 | 5.4% |
| $10,000 to $14,999 | 36 | 8.8% |
| $15,000 to $24,999 | 12 | 2.9% |
| $25,000 to $34,999 | 10 | 2.5% |
| $35,000 to $49,999 | 58 | 14.2% |
| $50,000 to $74,999 | 52 | 12.7% |
| $75,000 to $99,999 | 56 | 13.7% |
| $100,000 to $149,999 | 132 | 32.4% |
| $150,000 to $199,999 | 17 | 4.2% |
| $200,000+ | 13 | 3.2% |
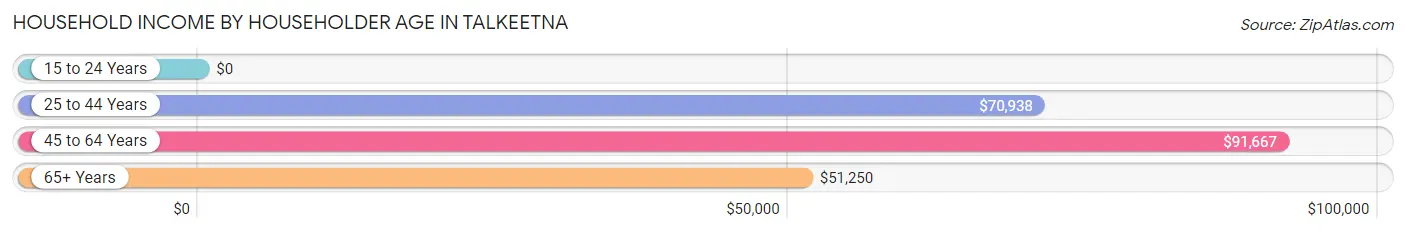
Household Income by Householder Age in Talkeetna
The median household income in Talkeetna is $79,091, with the highest median household income of $91,667 found in the 45 to 64 years age bracket for the primary householder. A total of 194 households (47.5%) fall into this category.
| Income Bracket | # Households | Median Income |
| 15 to 24 Years | 0 (0.0%) | $0 |
| 25 to 44 Years | 136 (33.3%) | $70,938 |
| 45 to 64 Years | 194 (47.5%) | $91,667 |
| 65+ Years | 78 (19.1%) | $51,250 |
| Total | 408 (100.0%) | $79,091 |
Poverty in Talkeetna
Income Below Poverty by Sex and Age in Talkeetna
With 17.2% poverty level for males and 3.5% for females among the residents of Talkeetna, 18 to 24 year old males and 75 year old and over females are the most vulnerable to poverty, with 18 males (100.0%) and 9 females (81.8%) in their respective age groups living below the poverty level.
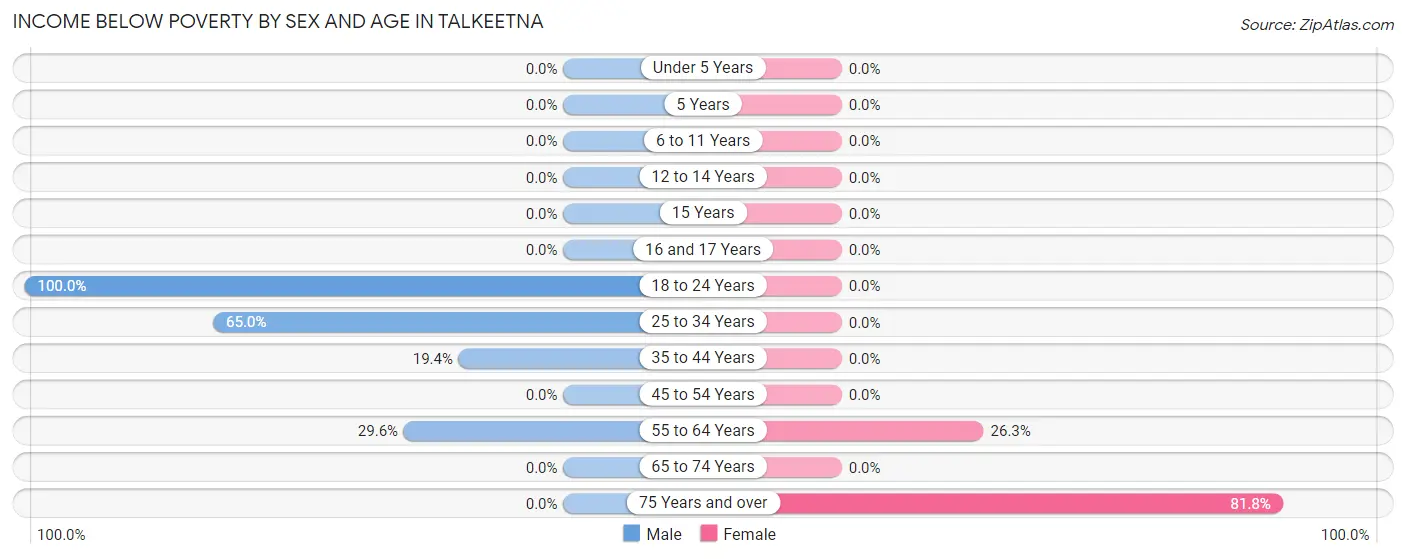
| Age Bracket | Male | Female |
| Under 5 Years | 0 (0.0%) | 0 (0.0%) |
| 5 Years | 0 (0.0%) | 0 (0.0%) |
| 6 to 11 Years | 0 (0.0%) | 0 (0.0%) |
| 12 to 14 Years | 0 (0.0%) | 0 (0.0%) |
| 15 Years | 0 (0.0%) | 0 (0.0%) |
| 16 and 17 Years | 0 (0.0%) | 0 (0.0%) |
| 18 to 24 Years | 18 (100.0%) | 0 (0.0%) |
| 25 to 34 Years | 26 (65.0%) | 0 (0.0%) |
| 35 to 44 Years | 13 (19.4%) | 0 (0.0%) |
| 45 to 54 Years | 0 (0.0%) | 0 (0.0%) |
| 55 to 64 Years | 29 (29.6%) | 10 (26.3%) |
| 65 to 74 Years | 0 (0.0%) | 0 (0.0%) |
| 75 Years and over | 0 (0.0%) | 9 (81.8%) |
| Total | 86 (17.2%) | 19 (3.5%) |
Income Above Poverty by Sex and Age in Talkeetna
According to the poverty statistics in Talkeetna, males aged under 5 years and females aged under 5 years are the age groups that are most secure financially, with 100.0% of males and 100.0% of females in these age groups living above the poverty line.
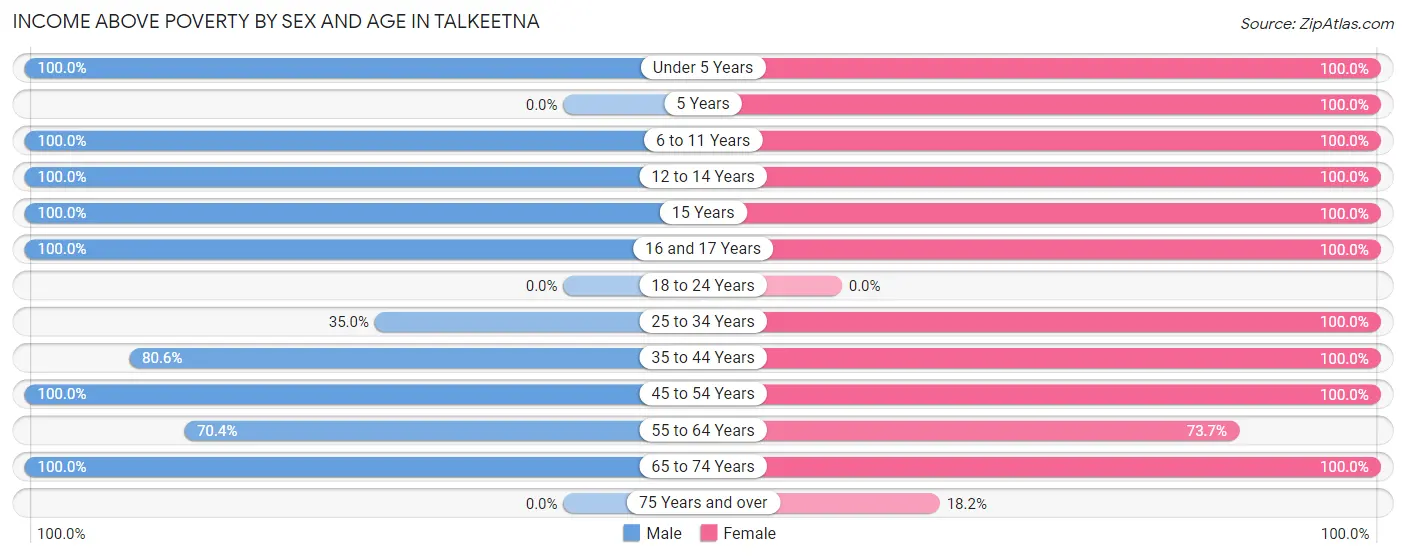
| Age Bracket | Male | Female |
| Under 5 Years | 23 (100.0%) | 19 (100.0%) |
| 5 Years | 0 (0.0%) | 10 (100.0%) |
| 6 to 11 Years | 76 (100.0%) | 87 (100.0%) |
| 12 to 14 Years | 32 (100.0%) | 55 (100.0%) |
| 15 Years | 12 (100.0%) | 26 (100.0%) |
| 16 and 17 Years | 10 (100.0%) | 13 (100.0%) |
| 18 to 24 Years | 0 (0.0%) | 0 (0.0%) |
| 25 to 34 Years | 14 (35.0%) | 28 (100.0%) |
| 35 to 44 Years | 54 (80.6%) | 98 (100.0%) |
| 45 to 54 Years | 56 (100.0%) | 115 (100.0%) |
| 55 to 64 Years | 69 (70.4%) | 28 (73.7%) |
| 65 to 74 Years | 67 (100.0%) | 45 (100.0%) |
| 75 Years and over | 0 (0.0%) | 2 (18.2%) |
| Total | 413 (82.8%) | 526 (96.5%) |
Income Below Poverty Among Married-Couple Families in Talkeetna
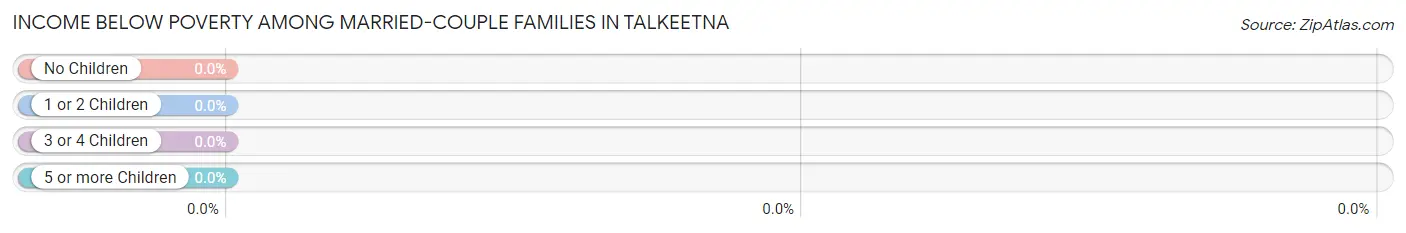
| Children | Above Poverty | Below Poverty |
| No Children | 76 (100.0%) | 0 (0.0%) |
| 1 or 2 Children | 78 (100.0%) | 0 (0.0%) |
| 3 or 4 Children | 24 (100.0%) | 0 (0.0%) |
| 5 or more Children | 11 (100.0%) | 0 (0.0%) |
| Total | 189 (100.0%) | 0 (0.0%) |
Income Below Poverty Among Single-Parent Households in Talkeetna
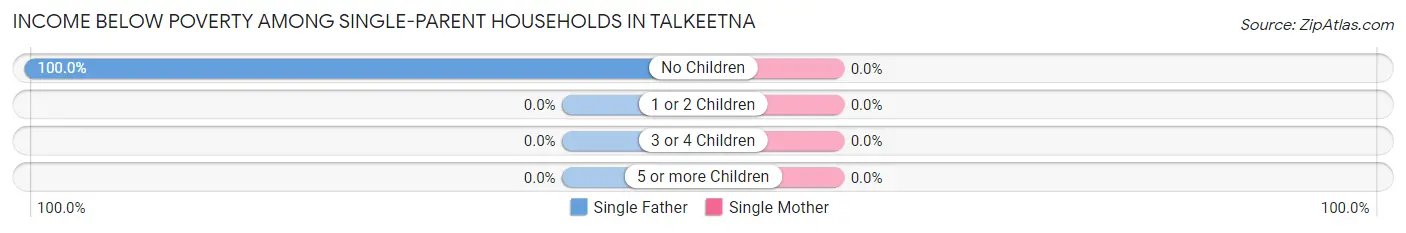
| Children | Single Father | Single Mother |
| No Children | 29 (100.0%) | 0 (0.0%) |
| 1 or 2 Children | 0 (0.0%) | 0 (0.0%) |
| 3 or 4 Children | 0 (0.0%) | 0 (0.0%) |
| 5 or more Children | 0 (0.0%) | 0 (0.0%) |
| Total | 29 (70.7%) | 0 (0.0%) |
Income Below Poverty Among Married-Couple vs Single-Parent Households in Talkeetna
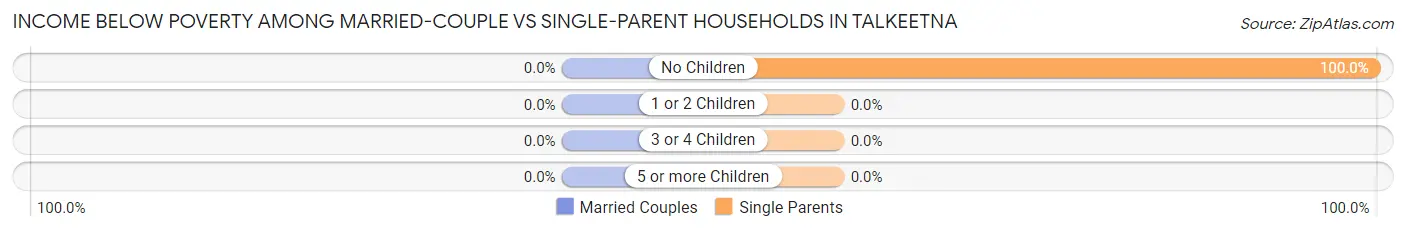
| Children | Married-Couple Families | Single-Parent Households |
| No Children | 0 (0.0%) | 29 (100.0%) |
| 1 or 2 Children | 0 (0.0%) | 0 (0.0%) |
| 3 or 4 Children | 0 (0.0%) | 0 (0.0%) |
| 5 or more Children | 0 (0.0%) | 0 (0.0%) |
| Total | 0 (0.0%) | 29 (38.2%) |
Race in Talkeetna
The most populous races in Talkeetna are White / Caucasian (1,029 | 98.6%), Hispanic or Latino (12 | 1.1%), and Black / African American (11 | 1.1%).
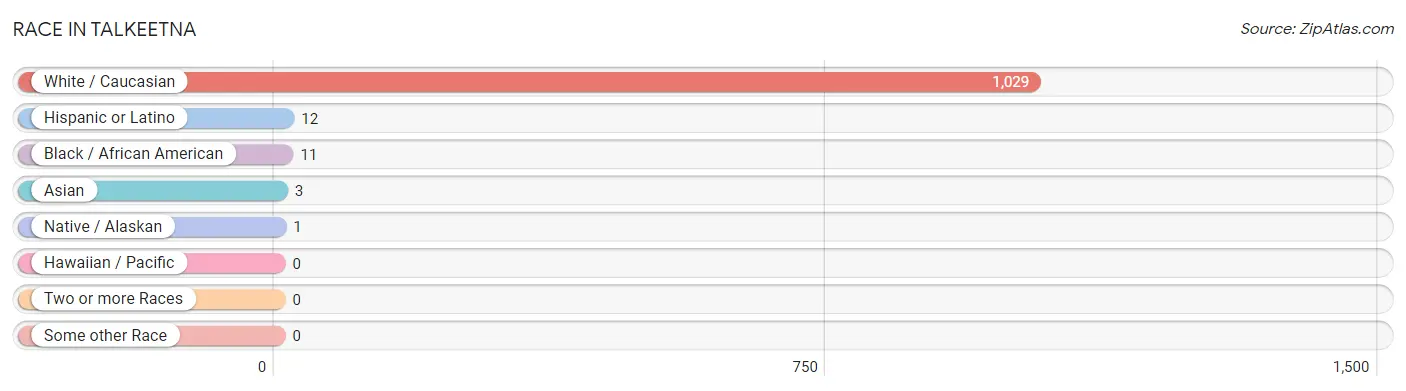
| Race | # Population | % Population |
| Asian | 3 | 0.3% |
| Black / African American | 11 | 1.1% |
| Hawaiian / Pacific | 0 | 0.0% |
| Hispanic or Latino | 12 | 1.1% |
| Native / Alaskan | 1 | 0.1% |
| White / Caucasian | 1,029 | 98.6% |
| Two or more Races | 0 | 0.0% |
| Some other Race | 0 | 0.0% |
| Total | 1,044 | 100.0% |
Ancestry in Talkeetna
The most populous ancestries reported in Talkeetna are Irish (199 | 19.1%), German (157 | 15.0%), Italian (134 | 12.8%), English (85 | 8.1%), and Dutch (83 | 8.0%), together accounting for 63.0% of all Talkeetna residents.
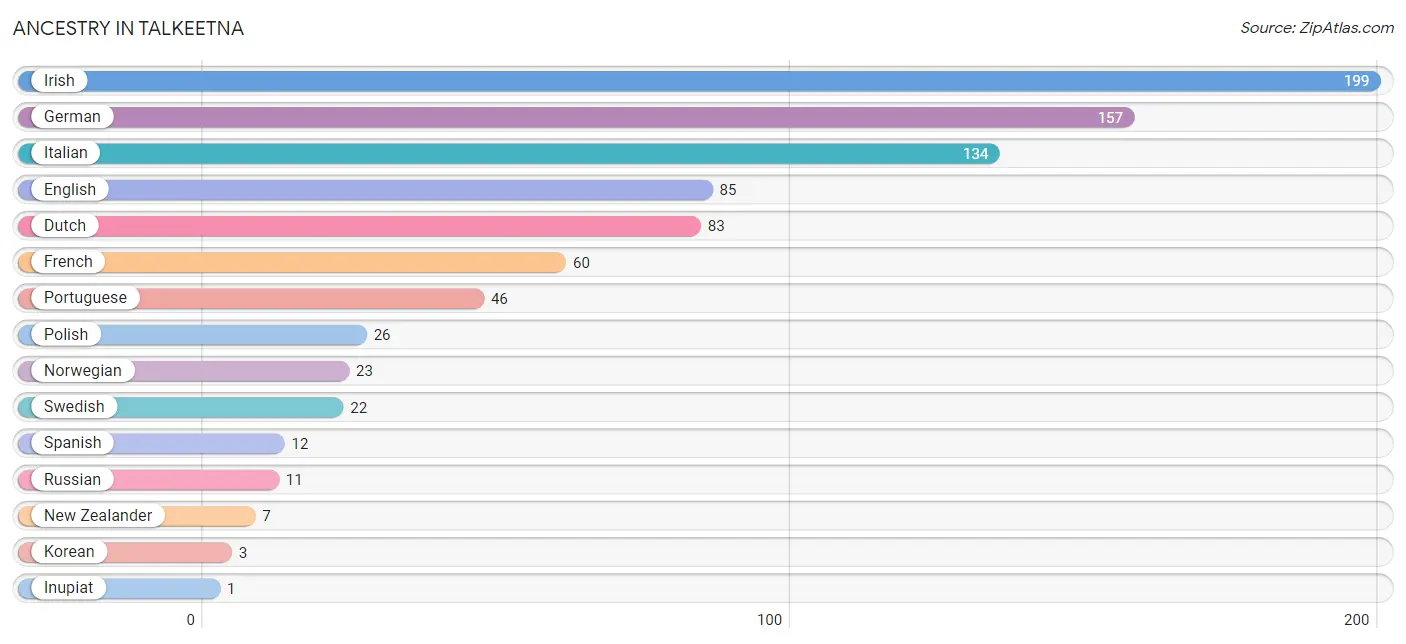
| Ancestry | # Population | % Population |
| Dutch | 83 | 8.0% |
| English | 85 | 8.1% |
| French | 60 | 5.8% |
| German | 157 | 15.0% |
| Inupiat | 1 | 0.1% |
| Irish | 199 | 19.1% |
| Italian | 134 | 12.8% |
| Korean | 3 | 0.3% |
| New Zealander | 7 | 0.7% |
| Norwegian | 23 | 2.2% |
| Polish | 26 | 2.5% |
| Portuguese | 46 | 4.4% |
| Russian | 11 | 1.1% |
| Spanish | 12 | 1.1% |
| Swedish | 22 | 2.1% |
| Welsh | 1 | 0.1% | View All 16 Rows |
Immigrants in Talkeetna
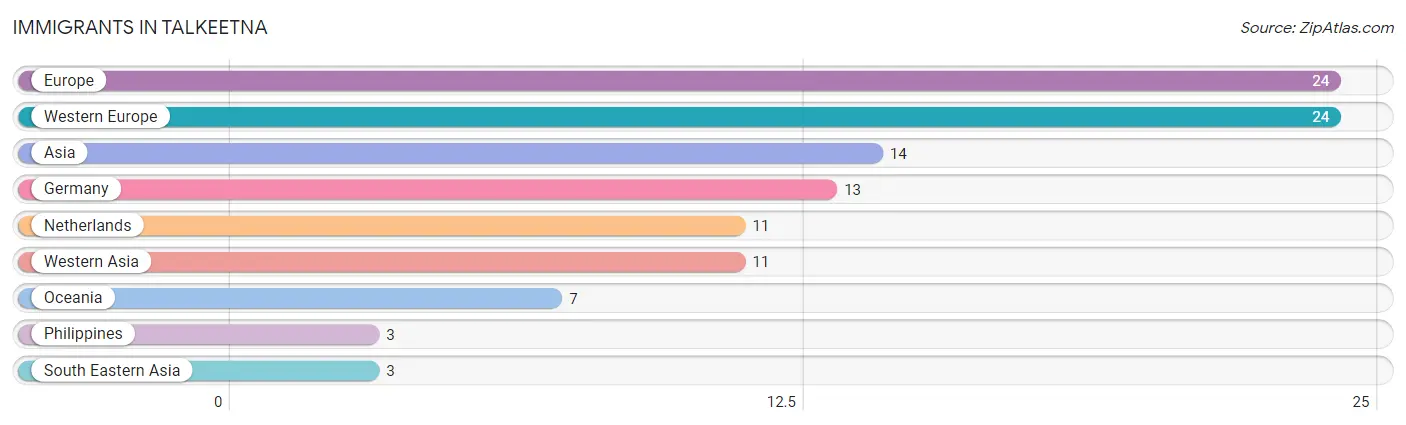
The most numerous immigrant groups reported in Talkeetna came from Europe (24 | 2.3%), Western Europe (24 | 2.3%), Asia (14 | 1.3%), Germany (13 | 1.3%), and Netherlands (11 | 1.1%), together accounting for 8.2% of all Talkeetna residents.
| Immigration Origin | # Population | % Population |
| Asia | 14 | 1.3% |
| Europe | 24 | 2.3% |
| Germany | 13 | 1.3% |
| Netherlands | 11 | 1.1% |
| Oceania | 7 | 0.7% |
| Philippines | 3 | 0.3% |
| South Eastern Asia | 3 | 0.3% |
| Western Asia | 11 | 1.1% |
| Western Europe | 24 | 2.3% | View All 9 Rows |
Sex and Age in Talkeetna
Sex and Age in Talkeetna
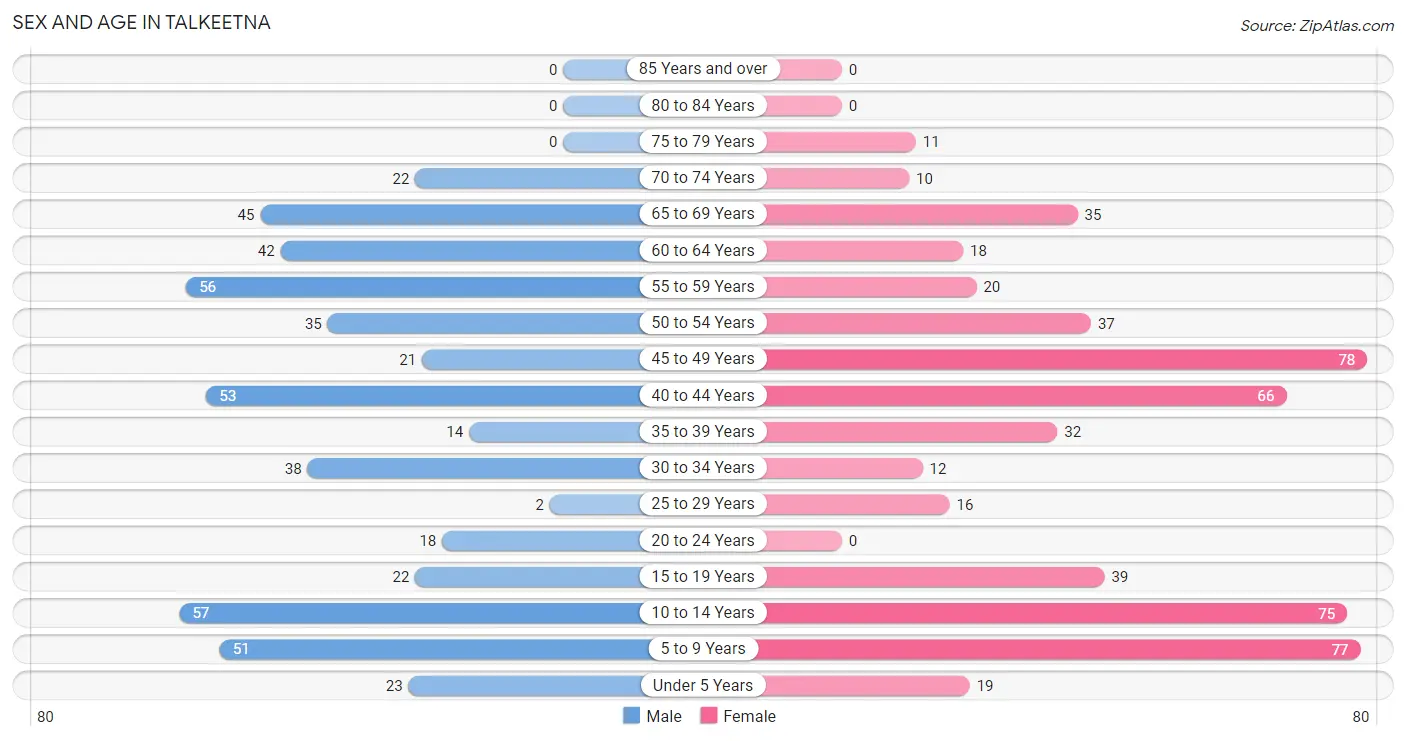
The most populous age groups in Talkeetna are 10 to 14 Years (57 | 11.4%) for men and 45 to 49 Years (78 | 14.3%) for women.
| Age Bracket | Male | Female |
| Under 5 Years | 23 (4.6%) | 19 (3.5%) |
| 5 to 9 Years | 51 (10.2%) | 77 (14.1%) |
| 10 to 14 Years | 57 (11.4%) | 75 (13.8%) |
| 15 to 19 Years | 22 (4.4%) | 39 (7.2%) |
| 20 to 24 Years | 18 (3.6%) | 0 (0.0%) |
| 25 to 29 Years | 2 (0.4%) | 16 (2.9%) |
| 30 to 34 Years | 38 (7.6%) | 12 (2.2%) |
| 35 to 39 Years | 14 (2.8%) | 32 (5.9%) |
| 40 to 44 Years | 53 (10.6%) | 66 (12.1%) |
| 45 to 49 Years | 21 (4.2%) | 78 (14.3%) |
| 50 to 54 Years | 35 (7.0%) | 37 (6.8%) |
| 55 to 59 Years | 56 (11.2%) | 20 (3.7%) |
| 60 to 64 Years | 42 (8.4%) | 18 (3.3%) |
| 65 to 69 Years | 45 (9.0%) | 35 (6.4%) |
| 70 to 74 Years | 22 (4.4%) | 10 (1.8%) |
| 75 to 79 Years | 0 (0.0%) | 11 (2.0%) |
| 80 to 84 Years | 0 (0.0%) | 0 (0.0%) |
| 85 Years and over | 0 (0.0%) | 0 (0.0%) |
| Total | 499 (100.0%) | 545 (100.0%) |
Families and Households in Talkeetna
Median Family Size in Talkeetna
The median family size in Talkeetna is 3.30 persons per family, with married-couple families (189 | 71.3%) accounting for the largest median family size of 3.74 persons per family. On the other hand, single female/mother families (35 | 13.2%) represent the smallest median family size with 2.20 persons per family.

| Family Type | # Families | Family Size |
| Married-Couple | 189 (71.3%) | 3.74 |
| Single Male/Father | 41 (15.5%) | 2.22 |
| Single Female/Mother | 35 (13.2%) | 2.20 |
| Total Families | 265 (100.0%) | 3.30 |
Median Household Size in Talkeetna
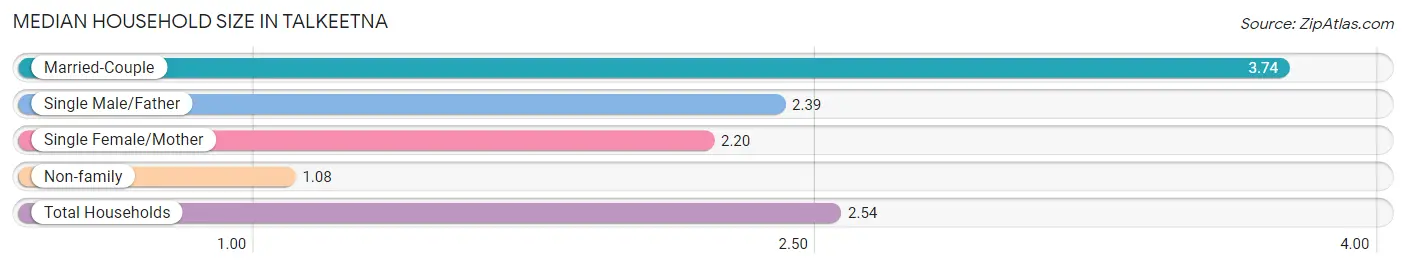
The median household size in Talkeetna is 2.54 persons per household, with married-couple households (189 | 46.3%) accounting for the largest median household size of 3.74 persons per household. non-family households (143 | 35.0%) represent the smallest median household size with 1.08 persons per household.
| Household Type | # Households | Household Size |
| Married-Couple | 189 (46.3%) | 3.74 |
| Single Male/Father | 41 (10.1%) | 2.39 |
| Single Female/Mother | 35 (8.6%) | 2.20 |
| Non-family | 143 (35.0%) | 1.08 |
| Total Households | 408 (100.0%) | 2.54 |
Household Size by Marriage Status in Talkeetna
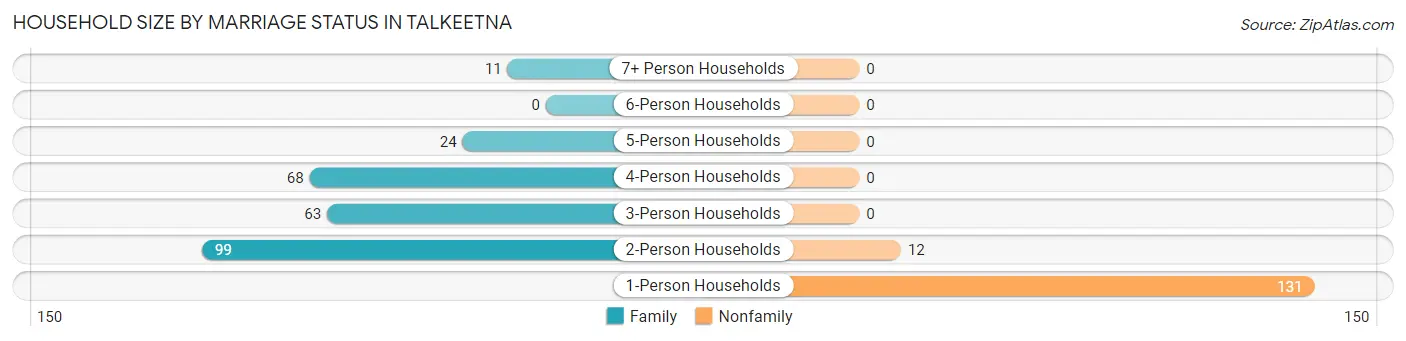
Out of a total of 408 households in Talkeetna, 265 (64.9%) are family households, while 143 (35.0%) are nonfamily households. The most numerous type of family households are 2-person households, comprising 99, and the most common type of nonfamily households are 1-person households, comprising 131.
| Household Size | Family Households | Nonfamily Households |
| 1-Person Households | - | 131 (32.1%) |
| 2-Person Households | 99 (24.3%) | 12 (2.9%) |
| 3-Person Households | 63 (15.4%) | 0 (0.0%) |
| 4-Person Households | 68 (16.7%) | 0 (0.0%) |
| 5-Person Households | 24 (5.9%) | 0 (0.0%) |
| 6-Person Households | 0 (0.0%) | 0 (0.0%) |
| 7+ Person Households | 11 (2.7%) | 0 (0.0%) |
| Total | 265 (64.9%) | 143 (35.0%) |
Female Fertility in Talkeetna
Fertility by Age in Talkeetna
| Age Bracket | Women with Births | Births / 1,000 Women |
| 15 to 19 years | 0 (0.0%) | 0.0 |
| 20 to 34 years | 0 (0.0%) | 0.0 |
| 35 to 50 years | 0 (0.0%) | 0.0 |
| Total | 0 (0.0%) | 0.0 |
Fertility by Age by Marriage Status in Talkeetna
| Age Bracket | Married | Unmarried |
| 15 to 19 years | 0 (0.0%) | 0 (0.0%) |
| 20 to 34 years | 0 (0.0%) | 0 (0.0%) |
| 35 to 50 years | 0 (0.0%) | 0 (0.0%) |
| Total | 0 (0.0%) | 0 (0.0%) |
Fertility by Education in Talkeetna
| Educational Attainment | Women with Births | Births / 1,000 Women |
| Less than High School | 0 (0.0%) | 0.0 |
| High School Diploma | 0 (0.0%) | 0.0 |
| College or Associate's Degree | 0 (0.0%) | 0.0 |
| Bachelor's Degree | 0 (0.0%) | 0.0 |
| Graduate Degree | 0 (0.0%) | 0.0 |
| Total | 0 (0.0%) | 0.0 |
Fertility by Education by Marriage Status in Talkeetna
| Educational Attainment | Married | Unmarried |
| Less than High School | 0 (0.0%) | 0 (0.0%) |
| High School Diploma | 0 (0.0%) | 0 (0.0%) |
| College or Associate's Degree | 0 (0.0%) | 0 (0.0%) |
| Bachelor's Degree | 0 (0.0%) | 0 (0.0%) |
| Graduate Degree | 0 (0.0%) | 0 (0.0%) |
| Total | 0 (0.0%) | 0 (0.0%) |
Employment Characteristics in Talkeetna
Employment by Class of Employer in Talkeetna
Among the 543 employed individuals in Talkeetna, private company employees (194 | 35.7%), self-employed (incorporated) (104 | 19.2%), and self-employed (not incorporated) (99 | 18.2%) make up the most common classes of employment.
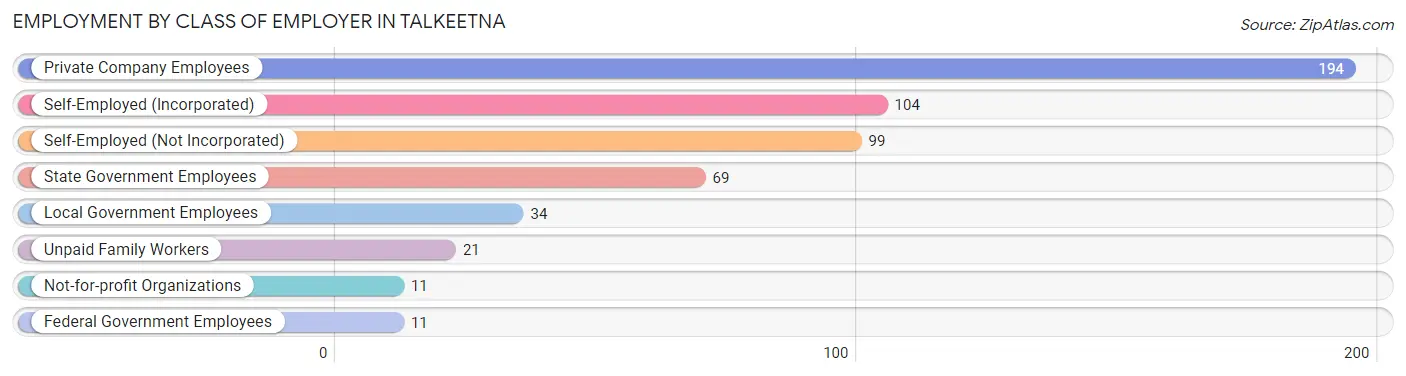
| Employer Class | # Employees | % Employees |
| Private Company Employees | 194 | 35.7% |
| Self-Employed (Incorporated) | 104 | 19.2% |
| Self-Employed (Not Incorporated) | 99 | 18.2% |
| Not-for-profit Organizations | 11 | 2.0% |
| Local Government Employees | 34 | 6.3% |
| State Government Employees | 69 | 12.7% |
| Federal Government Employees | 11 | 2.0% |
| Unpaid Family Workers | 21 | 3.9% |
| Total | 543 | 100.0% |
Employment Status by Age in Talkeetna
According to the labor force statistics for Talkeetna, out of the total population over 16 years of age (704), 80.5% or 567 individuals are in the labor force, with 4.2% or 24 of them unemployed. The age group with the highest labor force participation rate is 25 to 29 years, with 100.0% or 18 individuals in the labor force. Within the labor force, the 65 to 74 years age range has the highest percentage of unemployed individuals, with 40.0% or 24 of them being unemployed.
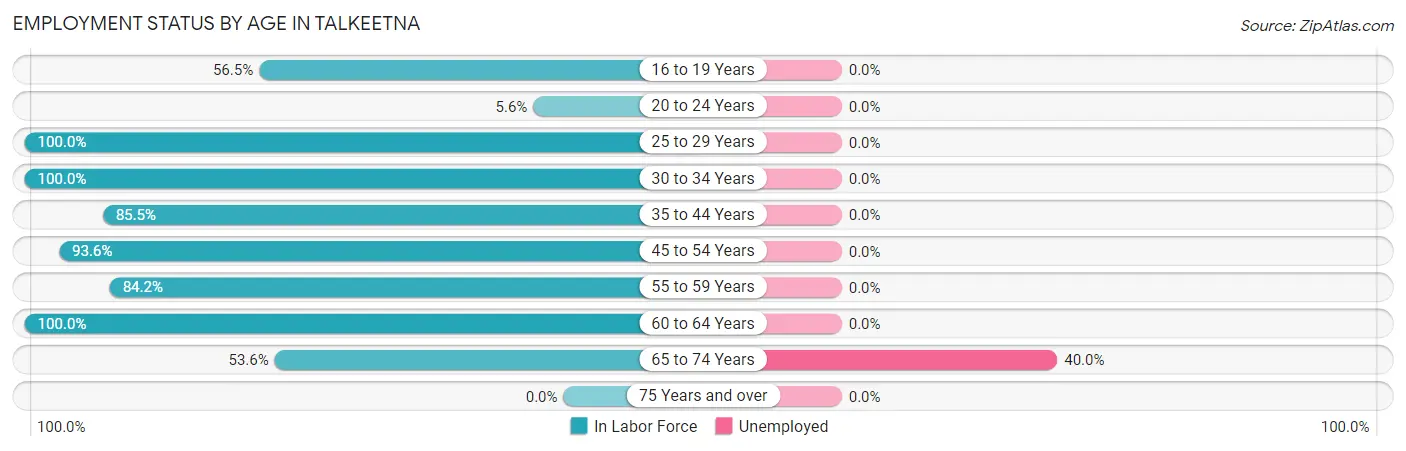
| Age Bracket | In Labor Force | Unemployed |
| 16 to 19 Years | 13 (56.5%) | 0 (0.0%) |
| 20 to 24 Years | 1 (5.6%) | 0 (0.0%) |
| 25 to 29 Years | 18 (100.0%) | 0 (0.0%) |
| 30 to 34 Years | 50 (100.0%) | 0 (0.0%) |
| 35 to 44 Years | 141 (85.5%) | 0 (0.0%) |
| 45 to 54 Years | 160 (93.6%) | 0 (0.0%) |
| 55 to 59 Years | 64 (84.2%) | 0 (0.0%) |
| 60 to 64 Years | 60 (100.0%) | 0 (0.0%) |
| 65 to 74 Years | 60 (53.6%) | 24 (40.0%) |
| 75 Years and over | 0 (0.0%) | 0 (0.0%) |
| Total | 567 (80.5%) | 24 (4.2%) |
Employment Status by Educational Attainment in Talkeetna
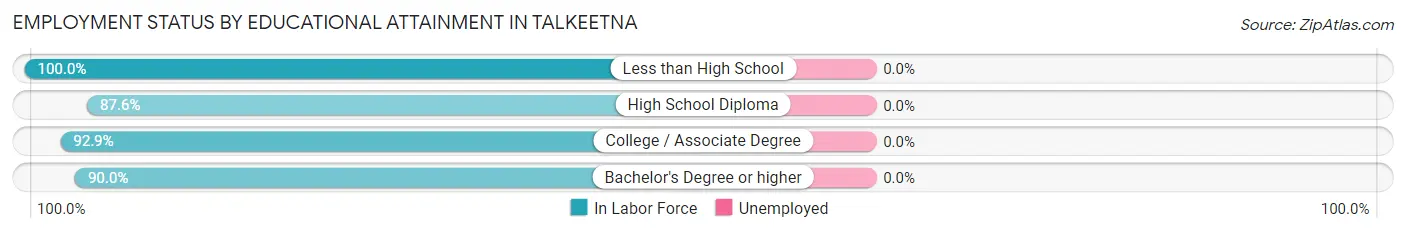
| Educational Attainment | In Labor Force | Unemployed |
| Less than High School | 46 (100.0%) | 0 (0.0%) |
| High School Diploma | 78 (87.6%) | 0 (0.0%) |
| College / Associate Degree | 145 (92.9%) | 0 (0.0%) |
| Bachelor's Degree or higher | 224 (90.0%) | 0 (0.0%) |
| Total | 493 (91.3%) | 0 (0.0%) |
Employment Occupations by Sex in Talkeetna
Management, Business, Science and Arts Occupations
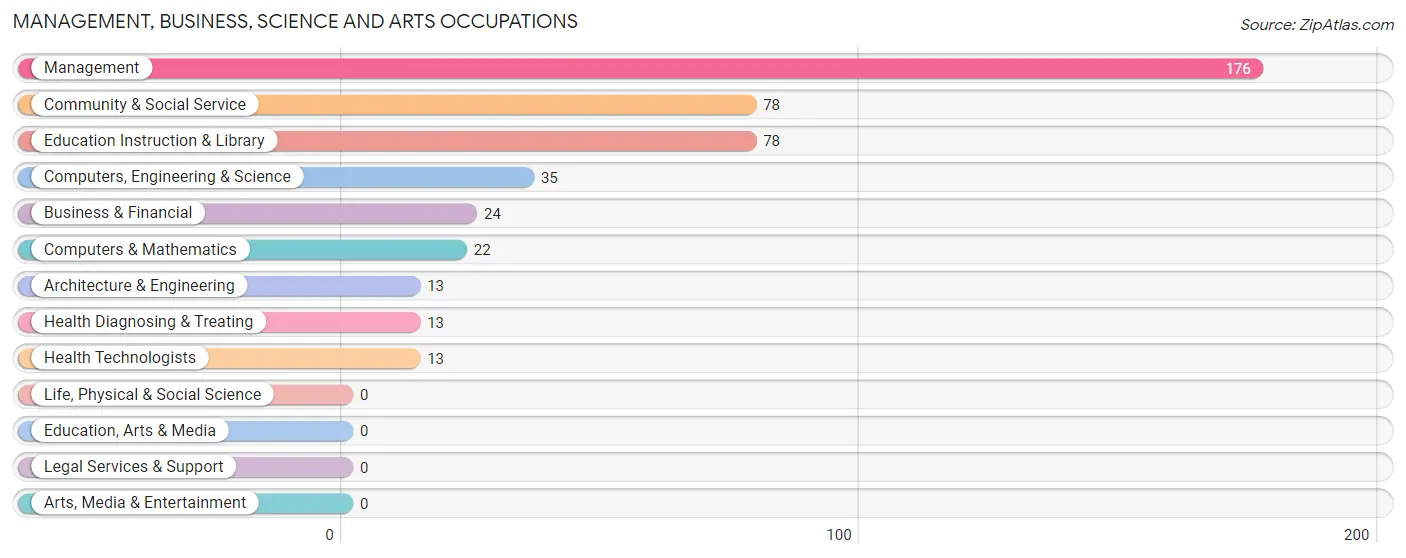
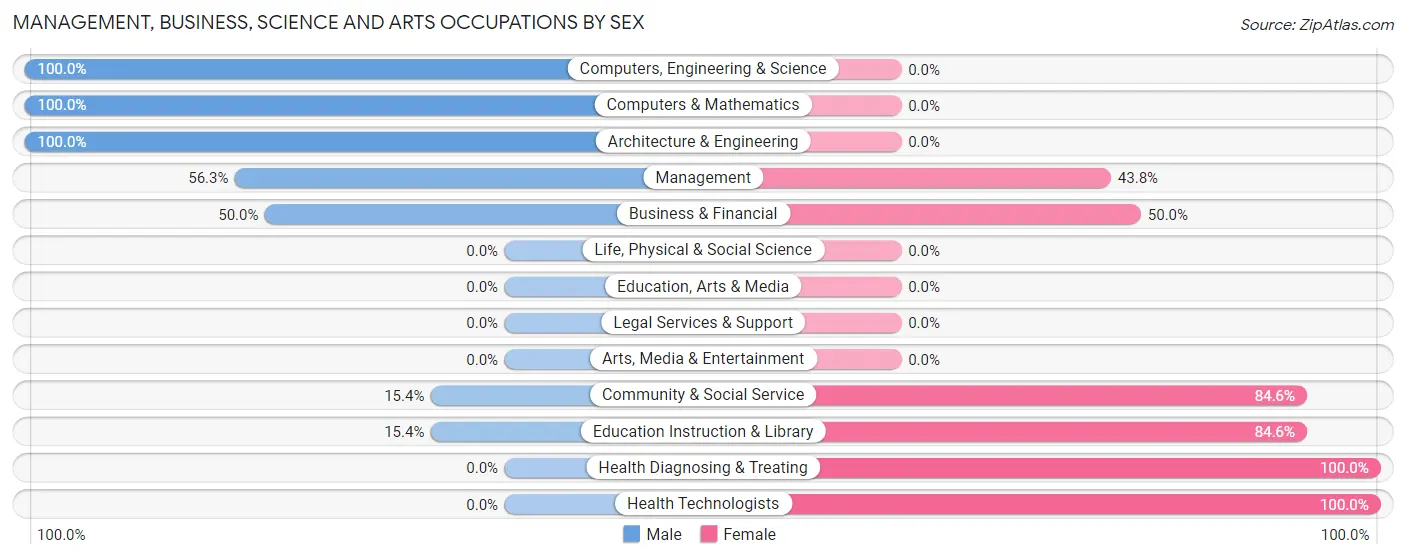
The most common Management, Business, Science and Arts occupations in Talkeetna are Management (176 | 32.4%), Community & Social Service (78 | 14.4%), Education Instruction & Library (78 | 14.4%), Computers, Engineering & Science (35 | 6.5%), and Business & Financial (24 | 4.4%).
Management, Business, Science and Arts Occupations by Sex
Within the Management, Business, Science and Arts occupations in Talkeetna, the most male-oriented occupations are Computers, Engineering & Science (100.0%), Computers & Mathematics (100.0%), and Architecture & Engineering (100.0%), while the most female-oriented occupations are Health Diagnosing & Treating (100.0%), Health Technologists (100.0%), and Community & Social Service (84.6%).
| Occupation | Male | Female |
| Management | 99 (56.2%) | 77 (43.8%) |
| Business & Financial | 12 (50.0%) | 12 (50.0%) |
| Computers, Engineering & Science | 35 (100.0%) | 0 (0.0%) |
| Computers & Mathematics | 22 (100.0%) | 0 (0.0%) |
| Architecture & Engineering | 13 (100.0%) | 0 (0.0%) |
| Life, Physical & Social Science | 0 (0.0%) | 0 (0.0%) |
| Community & Social Service | 12 (15.4%) | 66 (84.6%) |
| Education, Arts & Media | 0 (0.0%) | 0 (0.0%) |
| Legal Services & Support | 0 (0.0%) | 0 (0.0%) |
| Education Instruction & Library | 12 (15.4%) | 66 (84.6%) |
| Arts, Media & Entertainment | 0 (0.0%) | 0 (0.0%) |
| Health Diagnosing & Treating | 0 (0.0%) | 13 (100.0%) |
| Health Technologists | 0 (0.0%) | 13 (100.0%) |
| Total (Category) | 158 (48.5%) | 168 (51.5%) |
| Total (Overall) | 260 (47.9%) | 283 (52.1%) |
Services Occupations
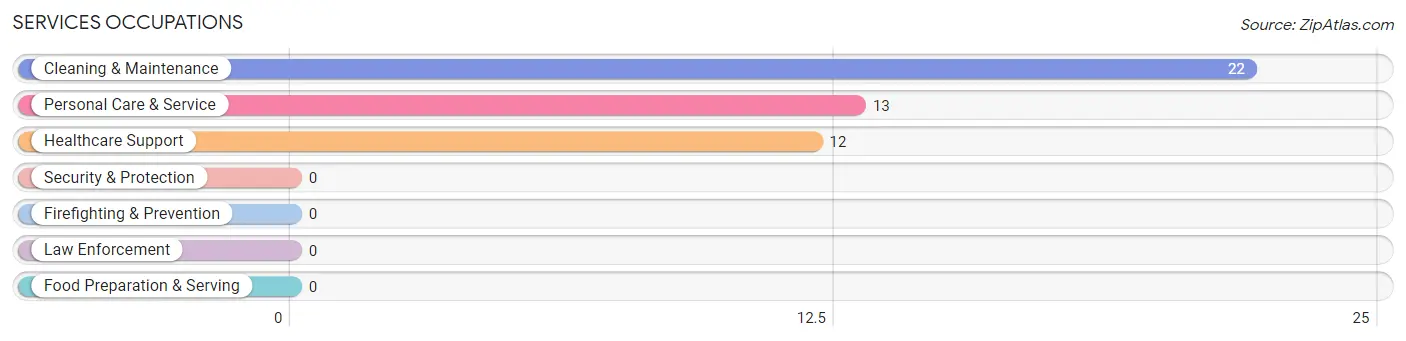
The most common Services occupations in Talkeetna are Cleaning & Maintenance (22 | 4.1%), Personal Care & Service (13 | 2.4%), and Healthcare Support (12 | 2.2%).
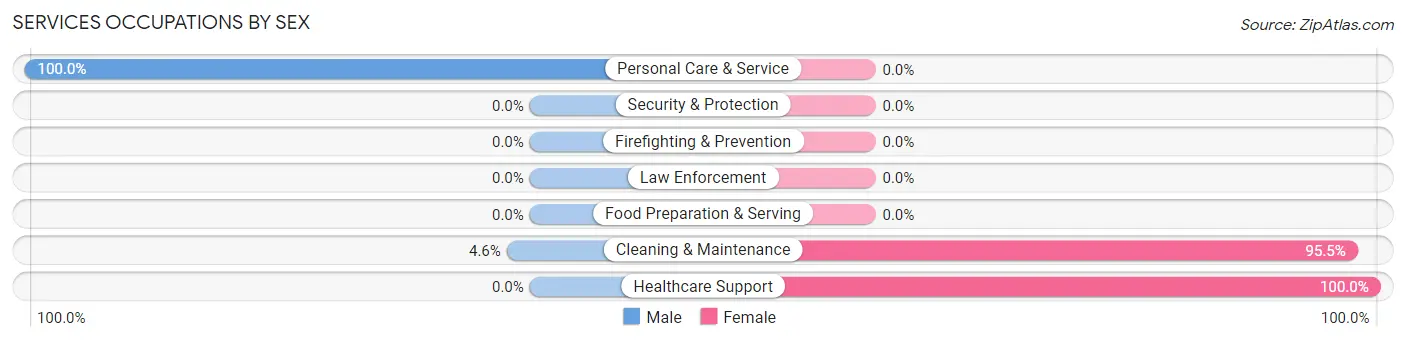
Services Occupations by Sex
Within the Services occupations in Talkeetna, the most male-oriented occupations are Personal Care & Service (100.0%), and Cleaning & Maintenance (4.5%), while the most female-oriented occupations are Healthcare Support (100.0%), and Cleaning & Maintenance (95.5%).
| Occupation | Male | Female |
| Healthcare Support | 0 (0.0%) | 12 (100.0%) |
| Security & Protection | 0 (0.0%) | 0 (0.0%) |
| Firefighting & Prevention | 0 (0.0%) | 0 (0.0%) |
| Law Enforcement | 0 (0.0%) | 0 (0.0%) |
| Food Preparation & Serving | 0 (0.0%) | 0 (0.0%) |
| Cleaning & Maintenance | 1 (4.5%) | 21 (95.5%) |
| Personal Care & Service | 13 (100.0%) | 0 (0.0%) |
| Total (Category) | 14 (29.8%) | 33 (70.2%) |
| Total (Overall) | 260 (47.9%) | 283 (52.1%) |
Sales and Office Occupations
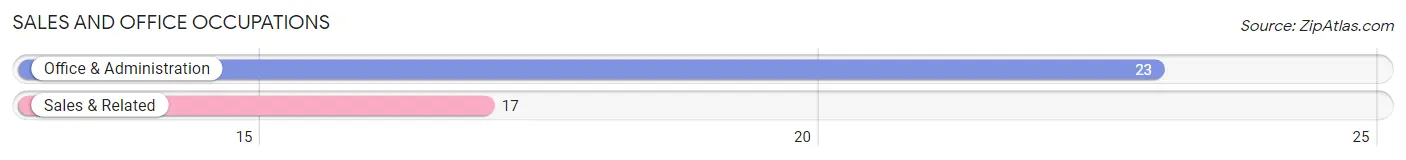
The most common Sales and Office occupations in Talkeetna are Office & Administration (23 | 4.2%), and Sales & Related (17 | 3.1%).
Sales and Office Occupations by Sex
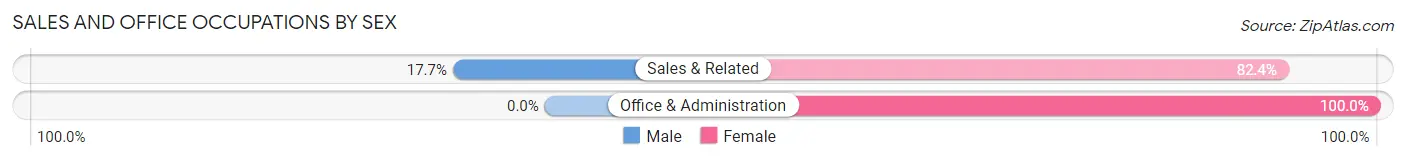
| Occupation | Male | Female |
| Sales & Related | 3 (17.6%) | 14 (82.4%) |
| Office & Administration | 0 (0.0%) | 23 (100.0%) |
| Total (Category) | 3 (7.5%) | 37 (92.5%) |
| Total (Overall) | 260 (47.9%) | 283 (52.1%) |
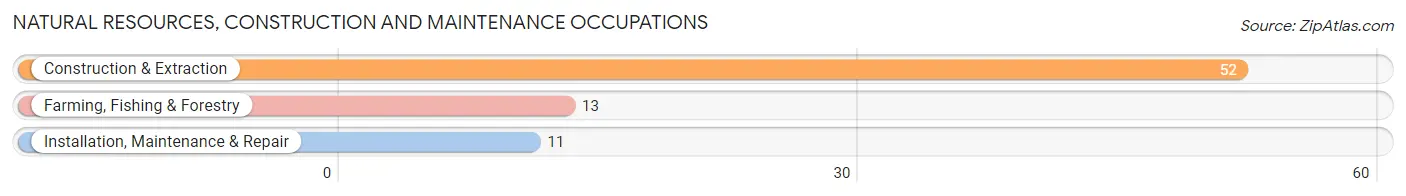
Natural Resources, Construction and Maintenance Occupations
The most common Natural Resources, Construction and Maintenance occupations in Talkeetna are Construction & Extraction (52 | 9.6%), Farming, Fishing & Forestry (13 | 2.4%), and Installation, Maintenance & Repair (11 | 2.0%).
Natural Resources, Construction and Maintenance Occupations by Sex
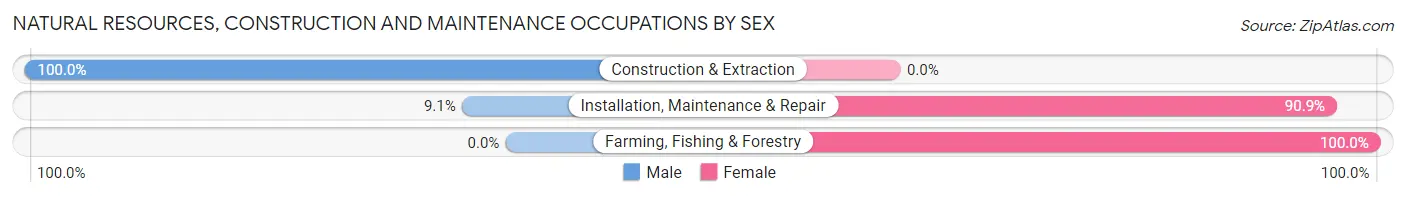
| Occupation | Male | Female |
| Farming, Fishing & Forestry | 0 (0.0%) | 13 (100.0%) |
| Construction & Extraction | 52 (100.0%) | 0 (0.0%) |
| Installation, Maintenance & Repair | 1 (9.1%) | 10 (90.9%) |
| Total (Category) | 53 (69.7%) | 23 (30.3%) |
| Total (Overall) | 260 (47.9%) | 283 (52.1%) |
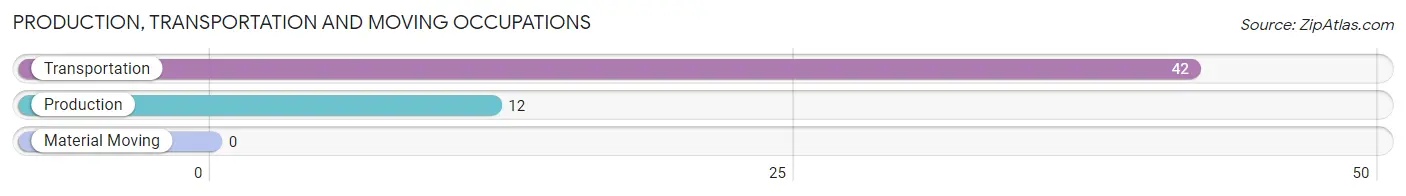
Production, Transportation and Moving Occupations
The most common Production, Transportation and Moving occupations in Talkeetna are Transportation (42 | 7.7%), and Production (12 | 2.2%).
Production, Transportation and Moving Occupations by Sex
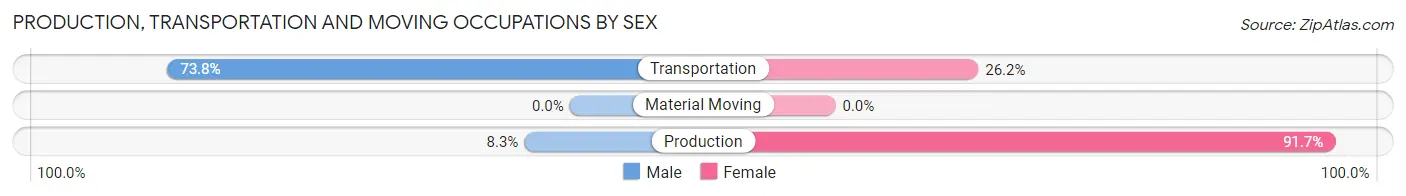
| Occupation | Male | Female |
| Production | 1 (8.3%) | 11 (91.7%) |
| Transportation | 31 (73.8%) | 11 (26.2%) |
| Material Moving | 0 (0.0%) | 0 (0.0%) |
| Total (Category) | 32 (59.3%) | 22 (40.7%) |
| Total (Overall) | 260 (47.9%) | 283 (52.1%) |
Employment Industries by Sex in Talkeetna
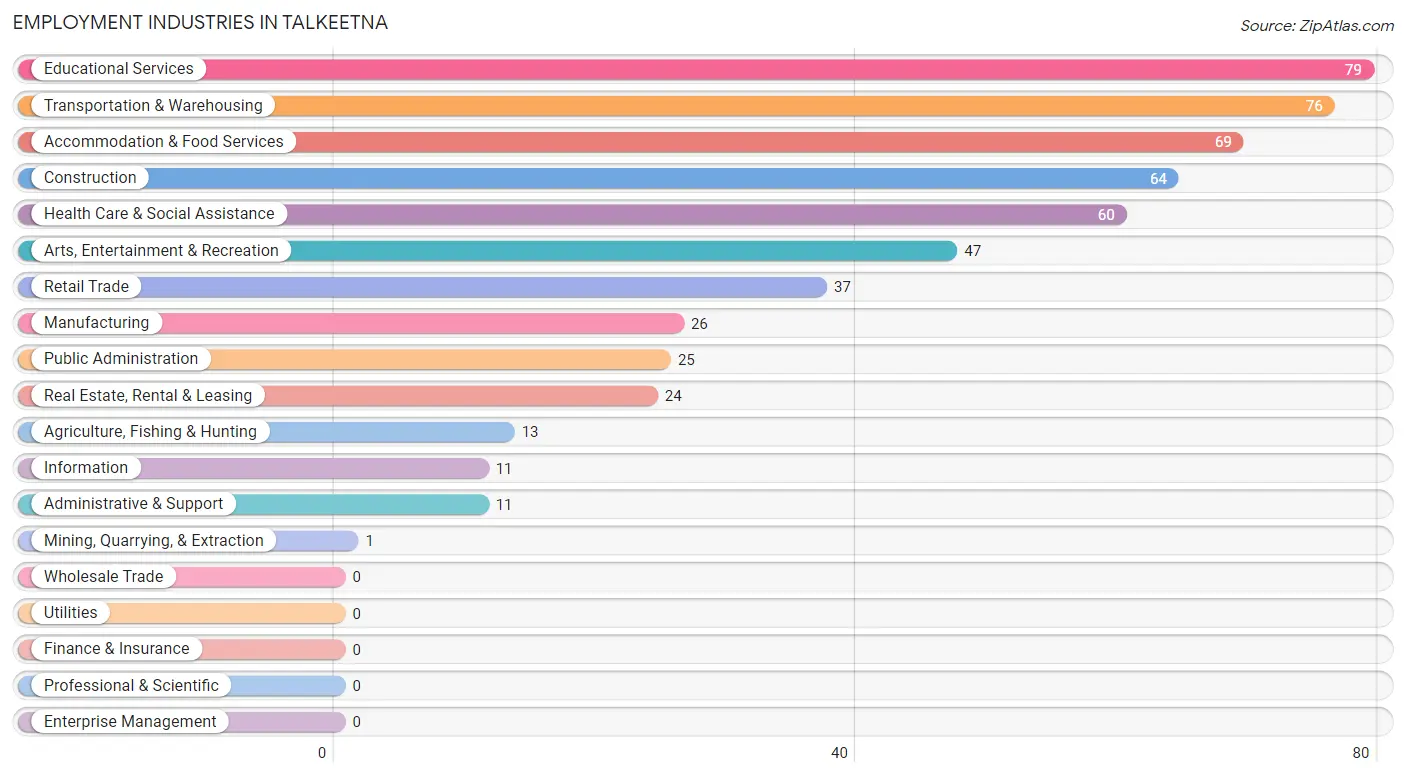
Employment Industries in Talkeetna
The major employment industries in Talkeetna include Educational Services (79 | 14.5%), Transportation & Warehousing (76 | 14.0%), Accommodation & Food Services (69 | 12.7%), Construction (64 | 11.8%), and Health Care & Social Assistance (60 | 11.1%).
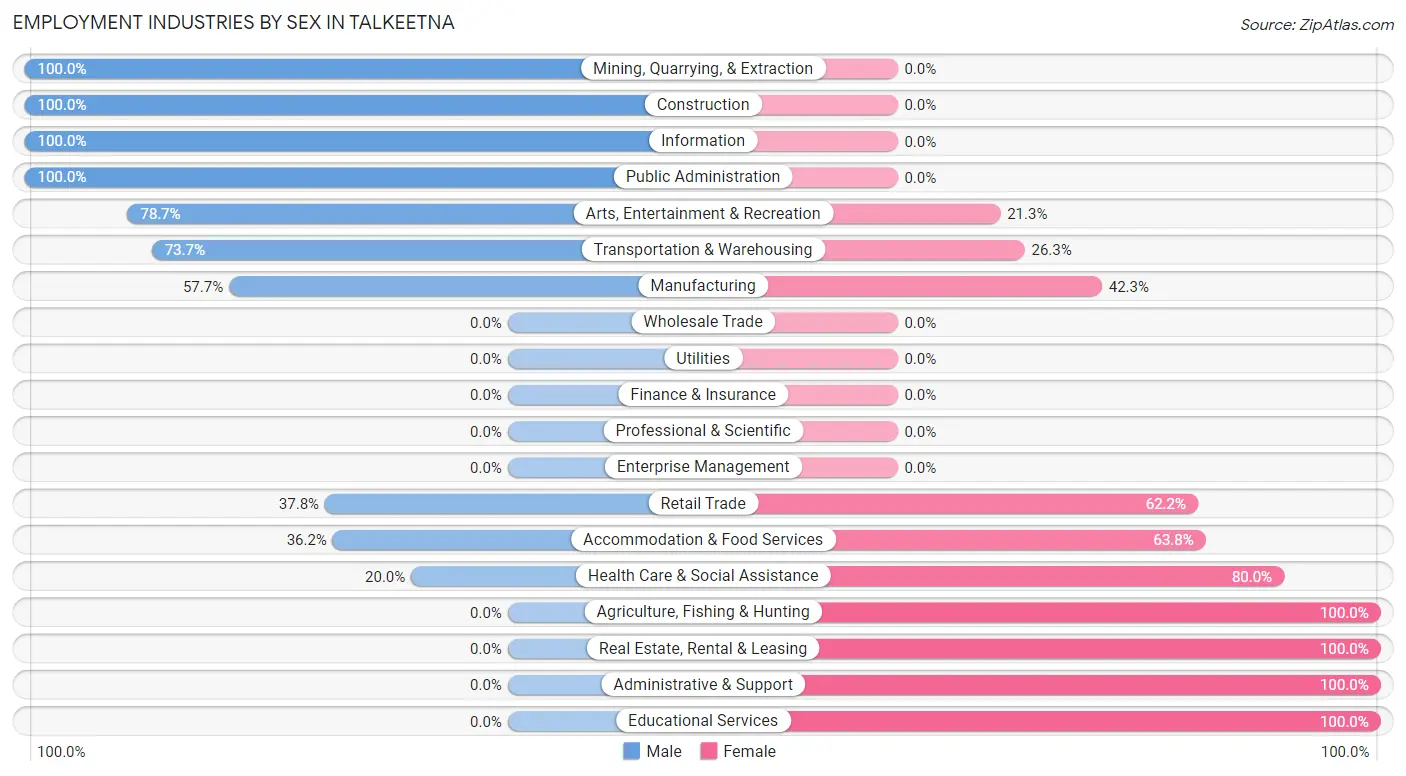
Employment Industries by Sex in Talkeetna
The Talkeetna industries that see more men than women are Mining, Quarrying, & Extraction (100.0%), Construction (100.0%), and Information (100.0%), whereas the industries that tend to have a higher number of women are Agriculture, Fishing & Hunting (100.0%), Real Estate, Rental & Leasing (100.0%), and Administrative & Support (100.0%).
| Industry | Male | Female |
| Agriculture, Fishing & Hunting | 0 (0.0%) | 13 (100.0%) |
| Mining, Quarrying, & Extraction | 1 (100.0%) | 0 (0.0%) |
| Construction | 64 (100.0%) | 0 (0.0%) |
| Manufacturing | 15 (57.7%) | 11 (42.3%) |
| Wholesale Trade | 0 (0.0%) | 0 (0.0%) |
| Retail Trade | 14 (37.8%) | 23 (62.2%) |
| Transportation & Warehousing | 56 (73.7%) | 20 (26.3%) |
| Utilities | 0 (0.0%) | 0 (0.0%) |
| Information | 11 (100.0%) | 0 (0.0%) |
| Finance & Insurance | 0 (0.0%) | 0 (0.0%) |
| Real Estate, Rental & Leasing | 0 (0.0%) | 24 (100.0%) |
| Professional & Scientific | 0 (0.0%) | 0 (0.0%) |
| Enterprise Management | 0 (0.0%) | 0 (0.0%) |
| Administrative & Support | 0 (0.0%) | 11 (100.0%) |
| Educational Services | 0 (0.0%) | 79 (100.0%) |
| Health Care & Social Assistance | 12 (20.0%) | 48 (80.0%) |
| Arts, Entertainment & Recreation | 37 (78.7%) | 10 (21.3%) |
| Accommodation & Food Services | 25 (36.2%) | 44 (63.8%) |
| Public Administration | 25 (100.0%) | 0 (0.0%) |
| Total | 260 (47.9%) | 283 (52.1%) |
Education in Talkeetna
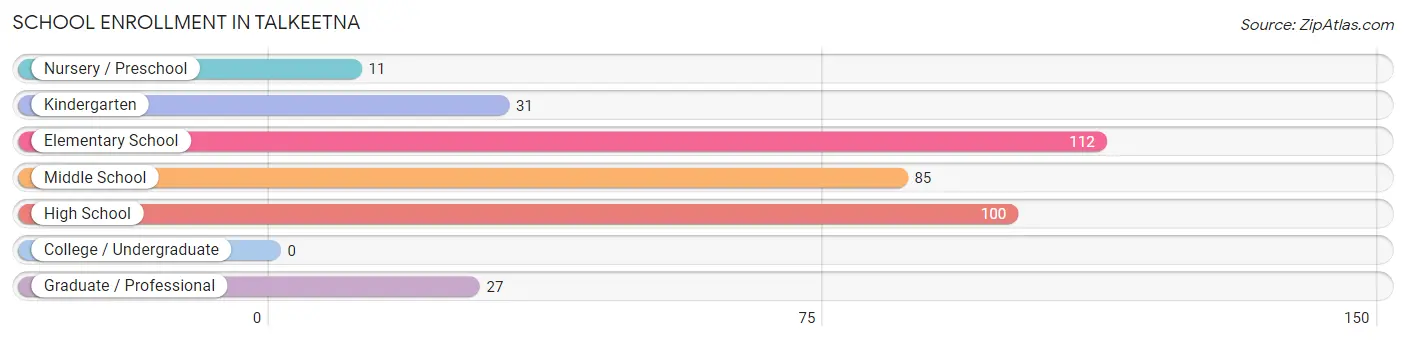
School Enrollment in Talkeetna
The most common levels of schooling among the 366 students in Talkeetna are elementary school (112 | 30.6%), high school (100 | 27.3%), and middle school (85 | 23.2%).
| School Level | # Students | % Students |
| Nursery / Preschool | 11 | 3.0% |
| Kindergarten | 31 | 8.5% |
| Elementary School | 112 | 30.6% |
| Middle School | 85 | 23.2% |
| High School | 100 | 27.3% |
| College / Undergraduate | 0 | 0.0% |
| Graduate / Professional | 27 | 7.4% |
| Total | 366 | 100.0% |
School Enrollment by Age by Funding Source in Talkeetna
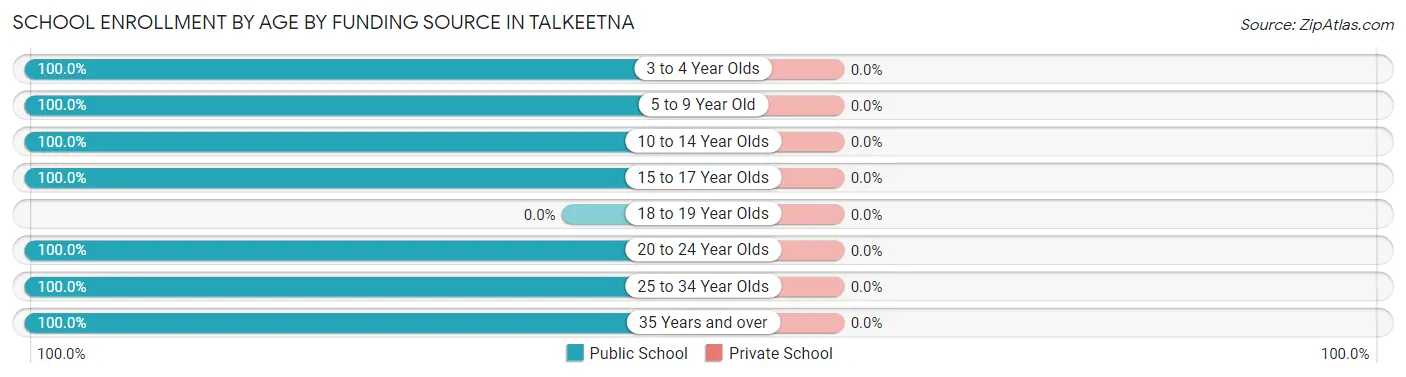
| Age Bracket | Public School | Private School |
| 3 to 4 Year Olds | 11 (100.0%) | 0 (0.0%) |
| 5 to 9 Year Old | 118 (100.0%) | 0 (0.0%) |
| 10 to 14 Year Olds | 132 (100.0%) | 0 (0.0%) |
| 15 to 17 Year Olds | 61 (100.0%) | 0 (0.0%) |
| 18 to 19 Year Olds | 0 (0.0%) | 0 (0.0%) |
| 20 to 24 Year Olds | 17 (100.0%) | 0 (0.0%) |
| 25 to 34 Year Olds | 16 (100.0%) | 0 (0.0%) |
| 35 Years and over | 11 (100.0%) | 0 (0.0%) |
| Total | 366 (100.0%) | 0 (0.0%) |
Educational Attainment by Field of Study in Talkeetna
Social sciences (55 | 18.9%), business (52 | 17.9%), education (49 | 16.8%), literature & languages (28 | 9.6%), and physical & health sciences (27 | 9.3%) are the most common fields of study among 291 individuals in Talkeetna who have obtained a bachelor's degree or higher.
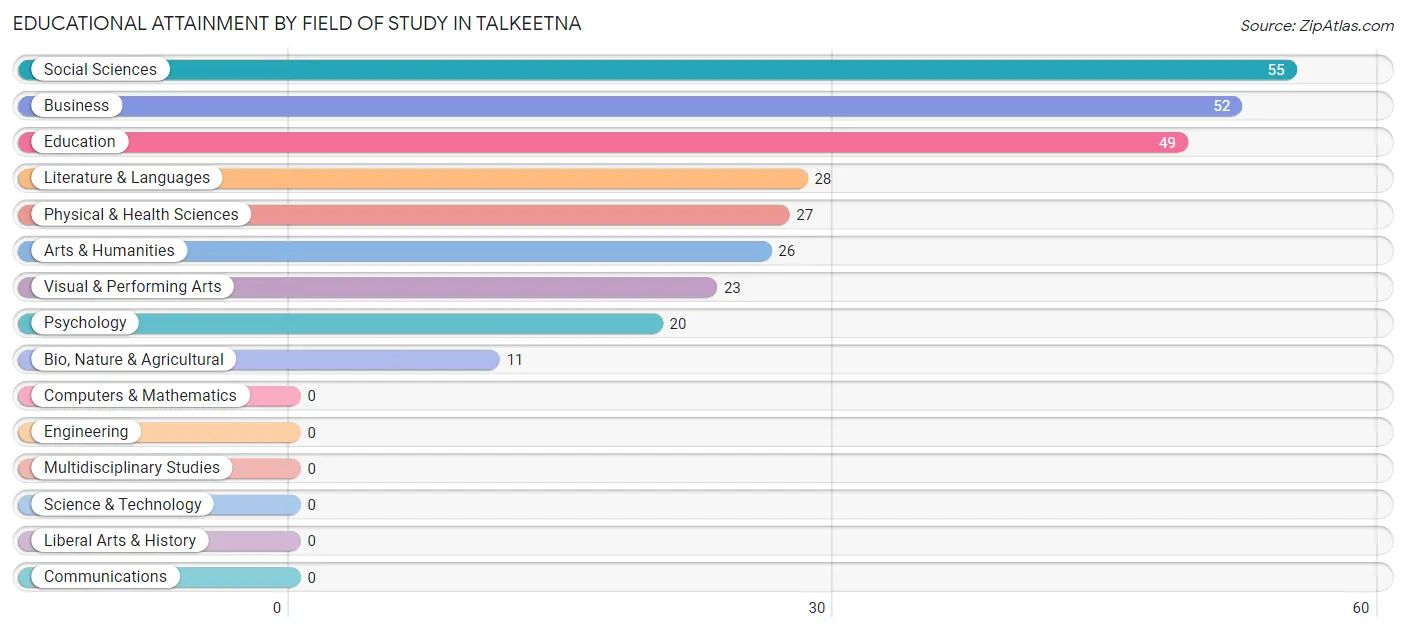
| Field of Study | # Graduates | % Graduates |
| Computers & Mathematics | 0 | 0.0% |
| Bio, Nature & Agricultural | 11 | 3.8% |
| Physical & Health Sciences | 27 | 9.3% |
| Psychology | 20 | 6.9% |
| Social Sciences | 55 | 18.9% |
| Engineering | 0 | 0.0% |
| Multidisciplinary Studies | 0 | 0.0% |
| Science & Technology | 0 | 0.0% |
| Business | 52 | 17.9% |
| Education | 49 | 16.8% |
| Literature & Languages | 28 | 9.6% |
| Liberal Arts & History | 0 | 0.0% |
| Visual & Performing Arts | 23 | 7.9% |
| Communications | 0 | 0.0% |
| Arts & Humanities | 26 | 8.9% |
| Total | 291 | 100.0% |
Transportation & Commute in Talkeetna
Vehicle Availability by Sex in Talkeetna
The most prevalent vehicle ownership categories in Talkeetna are males with 2 vehicles (115, accounting for 45.5%) and females with 2 vehicles (122, making up 40.8%).
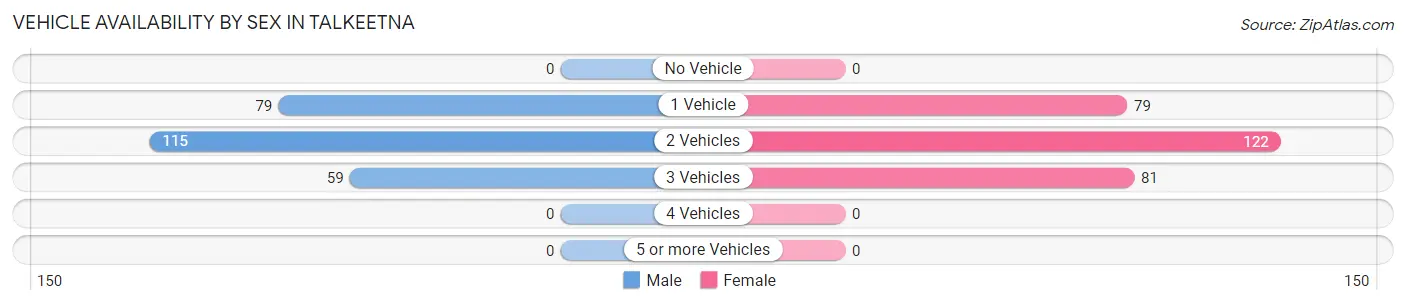
| Vehicles Available | Male | Female |
| No Vehicle | 0 (0.0%) | 0 (0.0%) |
| 1 Vehicle | 79 (31.2%) | 79 (28.0%) |
| 2 Vehicles | 115 (45.5%) | 122 (43.3%) |
| 3 Vehicles | 59 (23.3%) | 81 (28.7%) |
| 4 Vehicles | 0 (0.0%) | 0 (0.0%) |
| 5 or more Vehicles | 0 (0.0%) | 0 (0.0%) |
| Total | 253 (100.0%) | 282 (100.0%) |
Commute Time in Talkeetna
The most frequently occuring commute durations in Talkeetna are 10 to 14 minutes (154 commuters, 37.9%), 15 to 19 minutes (69 commuters, 17.0%), and 90 or more minutes (50 commuters, 12.3%).
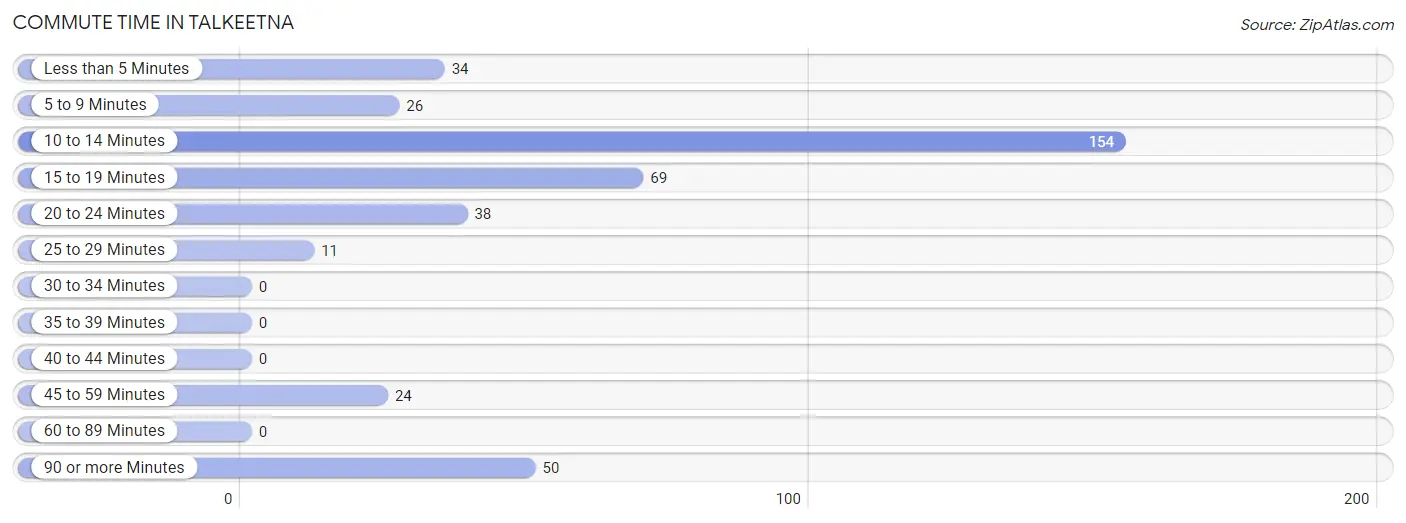
| Commute Time | # Commuters | % Commuters |
| Less than 5 Minutes | 34 | 8.4% |
| 5 to 9 Minutes | 26 | 6.4% |
| 10 to 14 Minutes | 154 | 37.9% |
| 15 to 19 Minutes | 69 | 17.0% |
| 20 to 24 Minutes | 38 | 9.4% |
| 25 to 29 Minutes | 11 | 2.7% |
| 30 to 34 Minutes | 0 | 0.0% |
| 35 to 39 Minutes | 0 | 0.0% |
| 40 to 44 Minutes | 0 | 0.0% |
| 45 to 59 Minutes | 24 | 5.9% |
| 60 to 89 Minutes | 0 | 0.0% |
| 90 or more Minutes | 50 | 12.3% |
Commute Time by Sex in Talkeetna
The most common commute times in Talkeetna are 10 to 14 minutes (81 commuters, 55.1%) for males and 10 to 14 minutes (73 commuters, 28.2%) for females.
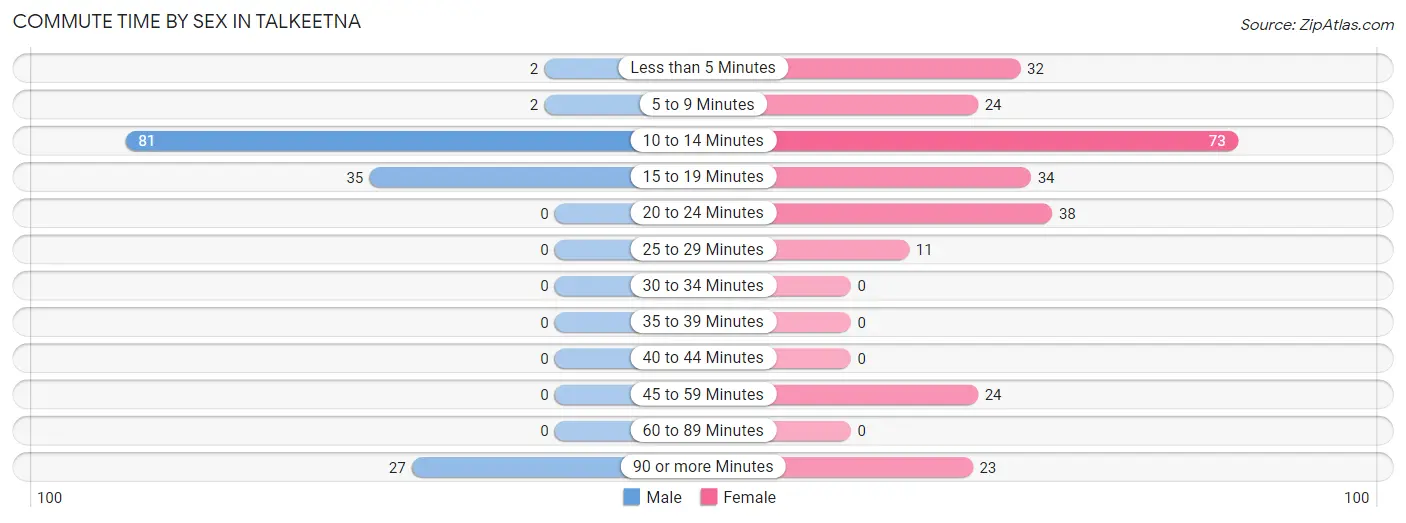
| Commute Time | Male | Female |
| Less than 5 Minutes | 2 (1.4%) | 32 (12.4%) |
| 5 to 9 Minutes | 2 (1.4%) | 24 (9.3%) |
| 10 to 14 Minutes | 81 (55.1%) | 73 (28.2%) |
| 15 to 19 Minutes | 35 (23.8%) | 34 (13.1%) |
| 20 to 24 Minutes | 0 (0.0%) | 38 (14.7%) |
| 25 to 29 Minutes | 0 (0.0%) | 11 (4.3%) |
| 30 to 34 Minutes | 0 (0.0%) | 0 (0.0%) |
| 35 to 39 Minutes | 0 (0.0%) | 0 (0.0%) |
| 40 to 44 Minutes | 0 (0.0%) | 0 (0.0%) |
| 45 to 59 Minutes | 0 (0.0%) | 24 (9.3%) |
| 60 to 89 Minutes | 0 (0.0%) | 0 (0.0%) |
| 90 or more Minutes | 27 (18.4%) | 23 (8.9%) |
Time of Departure to Work by Sex in Talkeetna
The most frequent times of departure to work in Talkeetna are 8:00 AM to 8:29 AM (47, 32.0%) for males and 8:00 AM to 8:29 AM (60, 23.2%) for females.
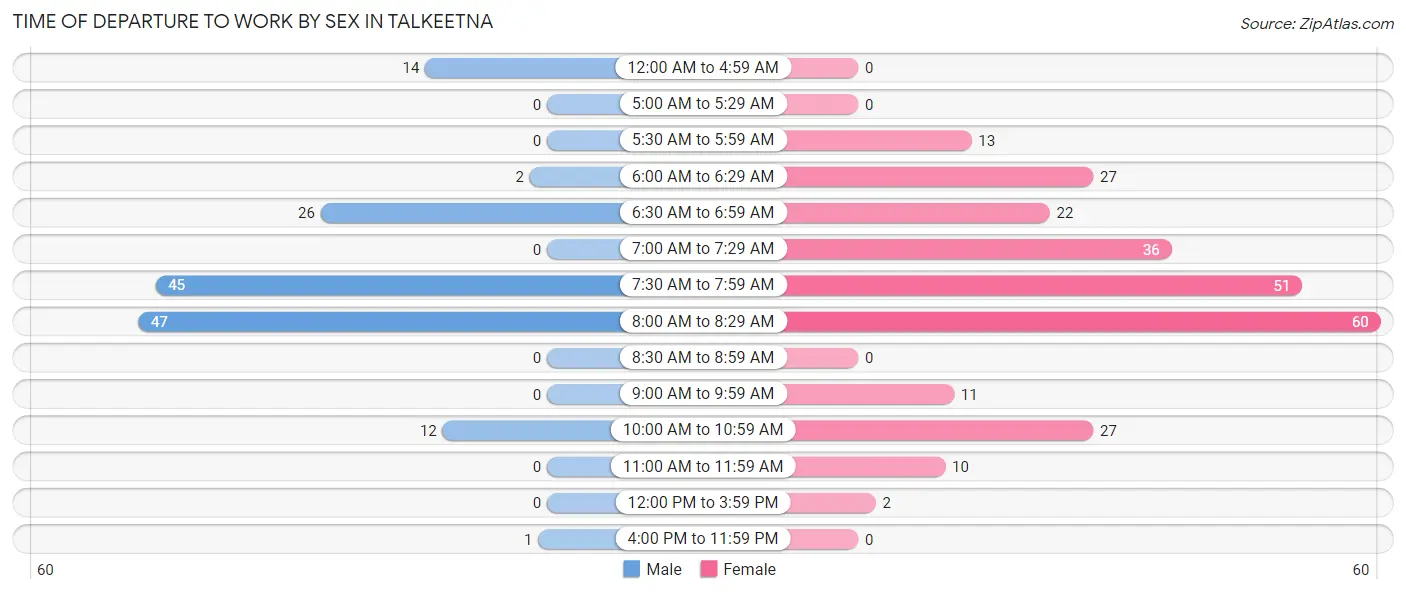
| Time of Departure | Male | Female |
| 12:00 AM to 4:59 AM | 14 (9.5%) | 0 (0.0%) |
| 5:00 AM to 5:29 AM | 0 (0.0%) | 0 (0.0%) |
| 5:30 AM to 5:59 AM | 0 (0.0%) | 13 (5.0%) |
| 6:00 AM to 6:29 AM | 2 (1.4%) | 27 (10.4%) |
| 6:30 AM to 6:59 AM | 26 (17.7%) | 22 (8.5%) |
| 7:00 AM to 7:29 AM | 0 (0.0%) | 36 (13.9%) |
| 7:30 AM to 7:59 AM | 45 (30.6%) | 51 (19.7%) |
| 8:00 AM to 8:29 AM | 47 (32.0%) | 60 (23.2%) |
| 8:30 AM to 8:59 AM | 0 (0.0%) | 0 (0.0%) |
| 9:00 AM to 9:59 AM | 0 (0.0%) | 11 (4.3%) |
| 10:00 AM to 10:59 AM | 12 (8.2%) | 27 (10.4%) |
| 11:00 AM to 11:59 AM | 0 (0.0%) | 10 (3.9%) |
| 12:00 PM to 3:59 PM | 0 (0.0%) | 2 (0.8%) |
| 4:00 PM to 11:59 PM | 1 (0.7%) | 0 (0.0%) |
| Total | 147 (100.0%) | 259 (100.0%) |
Housing Occupancy in Talkeetna
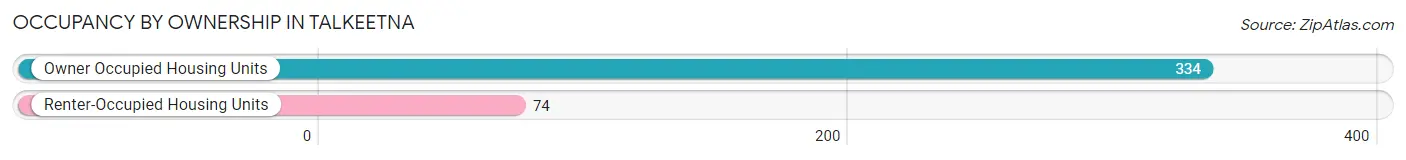
Occupancy by Ownership in Talkeetna
Of the total 408 dwellings in Talkeetna, owner-occupied units account for 334 (81.9%), while renter-occupied units make up 74 (18.1%).
| Occupancy | # Housing Units | % Housing Units |
| Owner Occupied Housing Units | 334 | 81.9% |
| Renter-Occupied Housing Units | 74 | 18.1% |
| Total Occupied Housing Units | 408 | 100.0% |
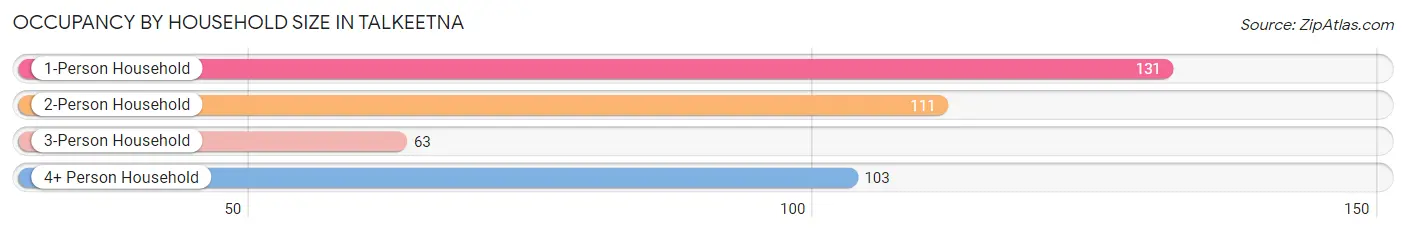
Occupancy by Household Size in Talkeetna
| Household Size | # Housing Units | % Housing Units |
| 1-Person Household | 131 | 32.1% |
| 2-Person Household | 111 | 27.2% |
| 3-Person Household | 63 | 15.4% |
| 4+ Person Household | 103 | 25.3% |
| Total Housing Units | 408 | 100.0% |
Occupancy by Ownership by Household Size in Talkeetna
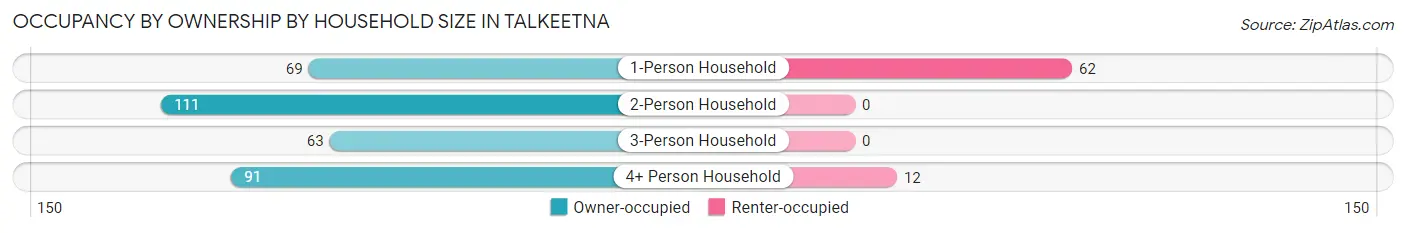
| Household Size | Owner-occupied | Renter-occupied |
| 1-Person Household | 69 (52.7%) | 62 (47.3%) |
| 2-Person Household | 111 (100.0%) | 0 (0.0%) |
| 3-Person Household | 63 (100.0%) | 0 (0.0%) |
| 4+ Person Household | 91 (88.3%) | 12 (11.7%) |
| Total Housing Units | 334 (81.9%) | 74 (18.1%) |
Occupancy by Educational Attainment in Talkeetna
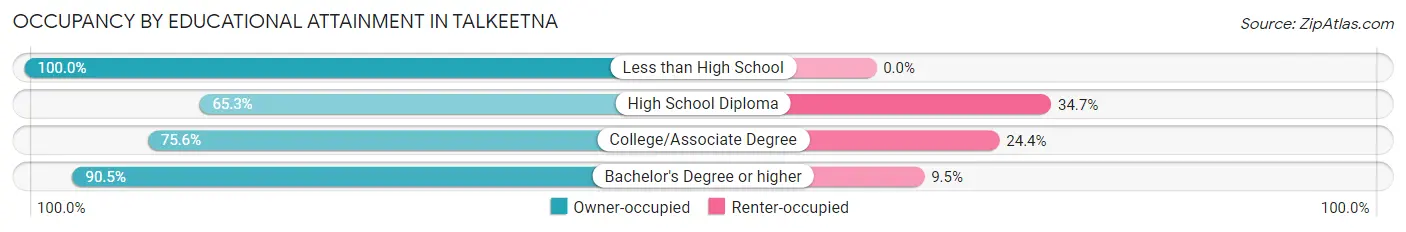
| Household Size | Owner-occupied | Renter-occupied |
| Less than High School | 34 (100.0%) | 0 (0.0%) |
| High School Diploma | 49 (65.3%) | 26 (34.7%) |
| College/Associate Degree | 99 (75.6%) | 32 (24.4%) |
| Bachelor's Degree or higher | 152 (90.5%) | 16 (9.5%) |
Occupancy by Age of Householder in Talkeetna
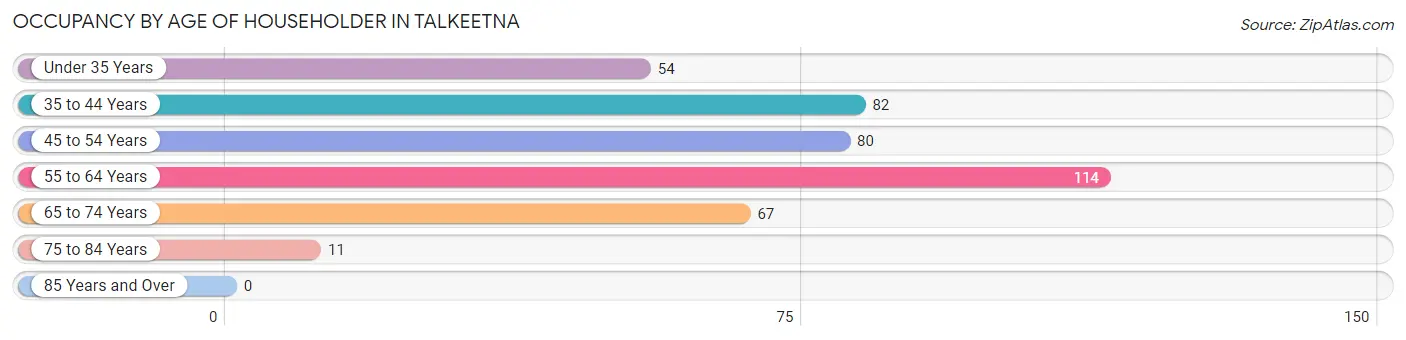
| Age Bracket | # Households | % Households |
| Under 35 Years | 54 | 13.2% |
| 35 to 44 Years | 82 | 20.1% |
| 45 to 54 Years | 80 | 19.6% |
| 55 to 64 Years | 114 | 27.9% |
| 65 to 74 Years | 67 | 16.4% |
| 75 to 84 Years | 11 | 2.7% |
| 85 Years and Over | 0 | 0.0% |
| Total | 408 | 100.0% |
Housing Finances in Talkeetna
Median Income by Occupancy in Talkeetna
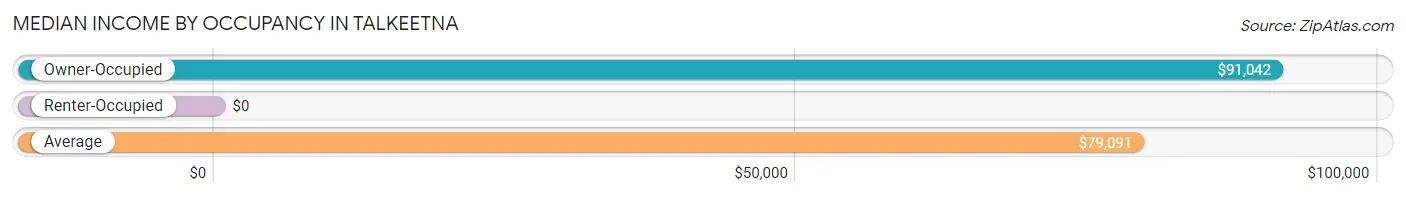
| Occupancy Type | # Households | Median Income |
| Owner-Occupied | 334 (81.9%) | $91,042 |
| Renter-Occupied | 74 (18.1%) | $0 |
| Average | 408 (100.0%) | $79,091 |
Occupancy by Householder Income Bracket in Talkeetna
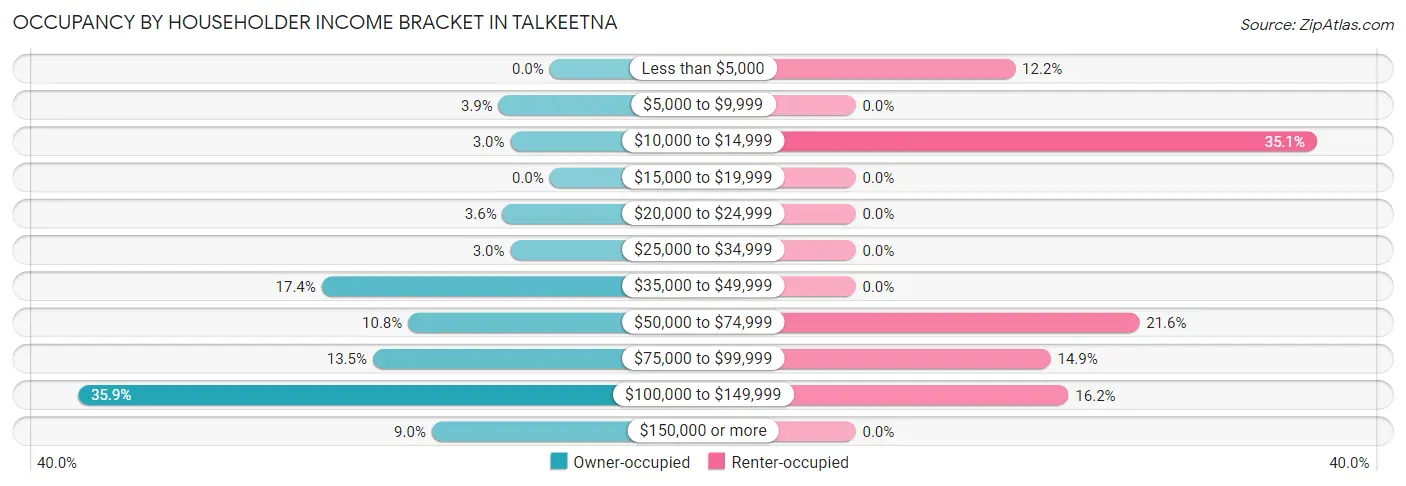
| Income Bracket | Owner-occupied | Renter-occupied |
| Less than $5,000 | 0 (0.0%) | 9 (12.2%) |
| $5,000 to $9,999 | 13 (3.9%) | 0 (0.0%) |
| $10,000 to $14,999 | 10 (3.0%) | 26 (35.1%) |
| $15,000 to $19,999 | 0 (0.0%) | 0 (0.0%) |
| $20,000 to $24,999 | 12 (3.6%) | 0 (0.0%) |
| $25,000 to $34,999 | 10 (3.0%) | 0 (0.0%) |
| $35,000 to $49,999 | 58 (17.4%) | 0 (0.0%) |
| $50,000 to $74,999 | 36 (10.8%) | 16 (21.6%) |
| $75,000 to $99,999 | 45 (13.5%) | 11 (14.9%) |
| $100,000 to $149,999 | 120 (35.9%) | 12 (16.2%) |
| $150,000 or more | 30 (9.0%) | 0 (0.0%) |
| Total | 334 (100.0%) | 74 (100.0%) |
Monthly Housing Cost Tiers in Talkeetna
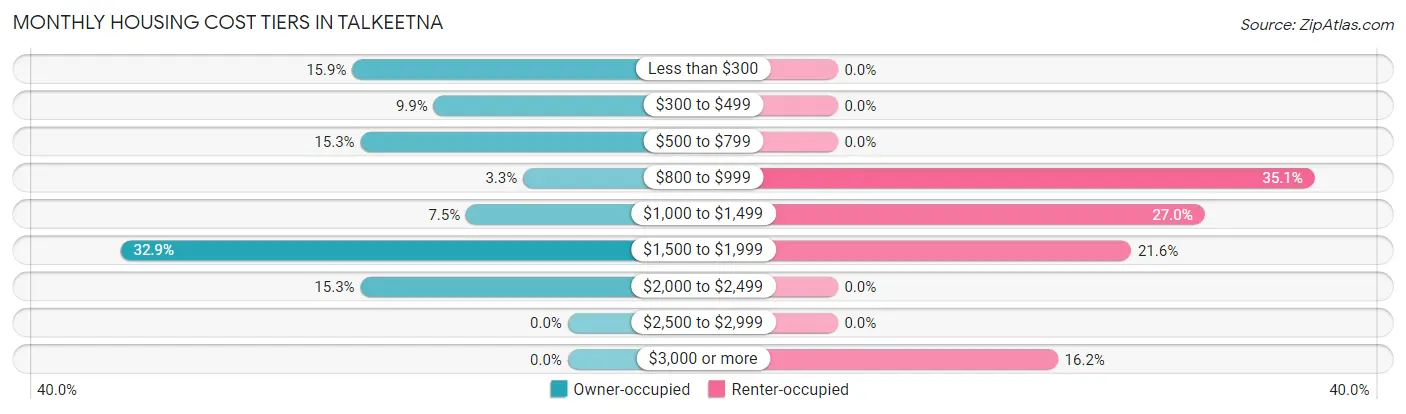
| Monthly Cost | Owner-occupied | Renter-occupied |
| Less than $300 | 53 (15.9%) | 0 (0.0%) |
| $300 to $499 | 33 (9.9%) | 0 (0.0%) |
| $500 to $799 | 51 (15.3%) | 0 (0.0%) |
| $800 to $999 | 11 (3.3%) | 26 (35.1%) |
| $1,000 to $1,499 | 25 (7.5%) | 20 (27.0%) |
| $1,500 to $1,999 | 110 (32.9%) | 16 (21.6%) |
| $2,000 to $2,499 | 51 (15.3%) | 0 (0.0%) |
| $2,500 to $2,999 | 0 (0.0%) | 0 (0.0%) |
| $3,000 or more | 0 (0.0%) | 12 (16.2%) |
| Total | 334 (100.0%) | 74 (100.0%) |
Physical Housing Characteristics in Talkeetna
Housing Structures in Talkeetna
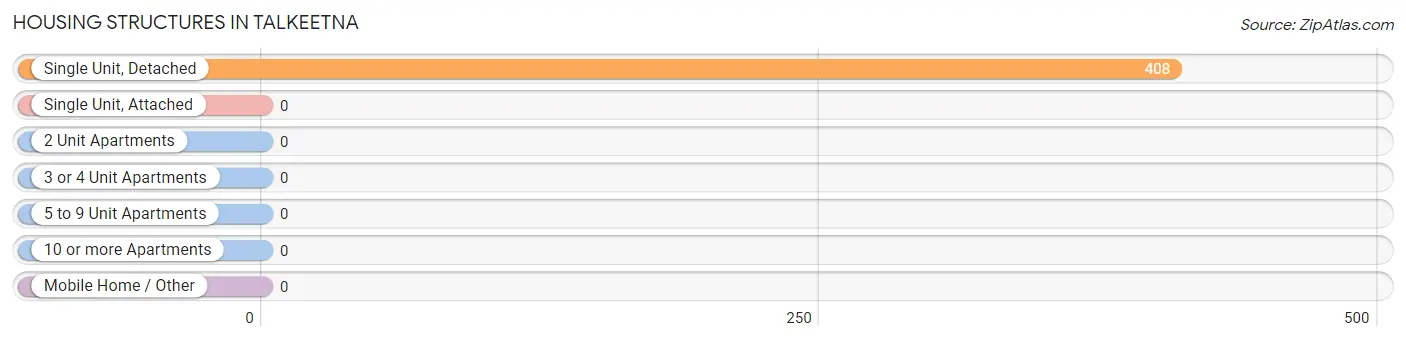
| Structure Type | # Housing Units | % Housing Units |
| Single Unit, Detached | 408 | 100.0% |
| Single Unit, Attached | 0 | 0.0% |
| 2 Unit Apartments | 0 | 0.0% |
| 3 or 4 Unit Apartments | 0 | 0.0% |
| 5 to 9 Unit Apartments | 0 | 0.0% |
| 10 or more Apartments | 0 | 0.0% |
| Mobile Home / Other | 0 | 0.0% |
| Total | 408 | 100.0% |
Housing Structures by Occupancy in Talkeetna
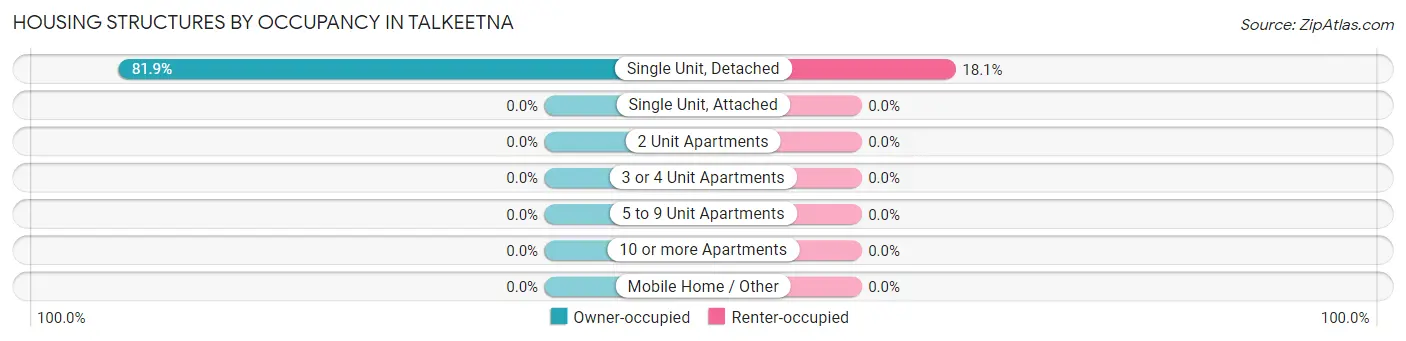
| Structure Type | Owner-occupied | Renter-occupied |
| Single Unit, Detached | 334 (81.9%) | 74 (18.1%) |
| Single Unit, Attached | 0 (0.0%) | 0 (0.0%) |
| 2 Unit Apartments | 0 (0.0%) | 0 (0.0%) |
| 3 or 4 Unit Apartments | 0 (0.0%) | 0 (0.0%) |
| 5 to 9 Unit Apartments | 0 (0.0%) | 0 (0.0%) |
| 10 or more Apartments | 0 (0.0%) | 0 (0.0%) |
| Mobile Home / Other | 0 (0.0%) | 0 (0.0%) |
| Total | 334 (81.9%) | 74 (18.1%) |
Housing Structures by Number of Rooms in Talkeetna
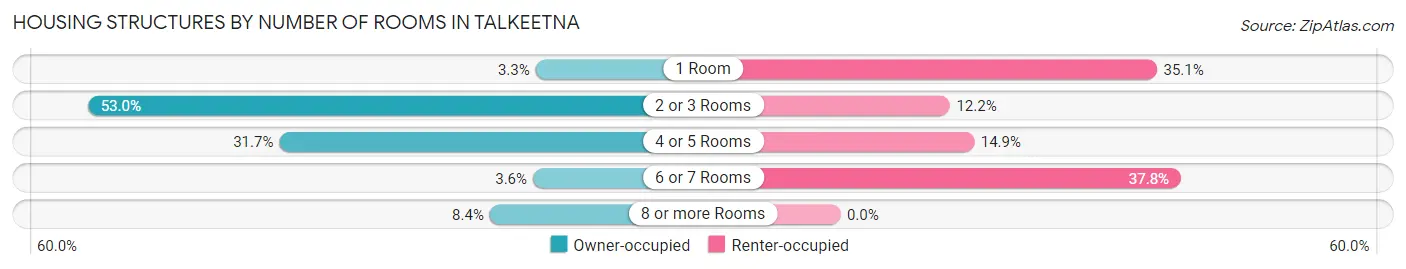
| Number of Rooms | Owner-occupied | Renter-occupied |
| 1 Room | 11 (3.3%) | 26 (35.1%) |
| 2 or 3 Rooms | 177 (53.0%) | 9 (12.2%) |
| 4 or 5 Rooms | 106 (31.7%) | 11 (14.9%) |
| 6 or 7 Rooms | 12 (3.6%) | 28 (37.8%) |
| 8 or more Rooms | 28 (8.4%) | 0 (0.0%) |
| Total | 334 (100.0%) | 74 (100.0%) |
Housing Structure by Heating Type in Talkeetna
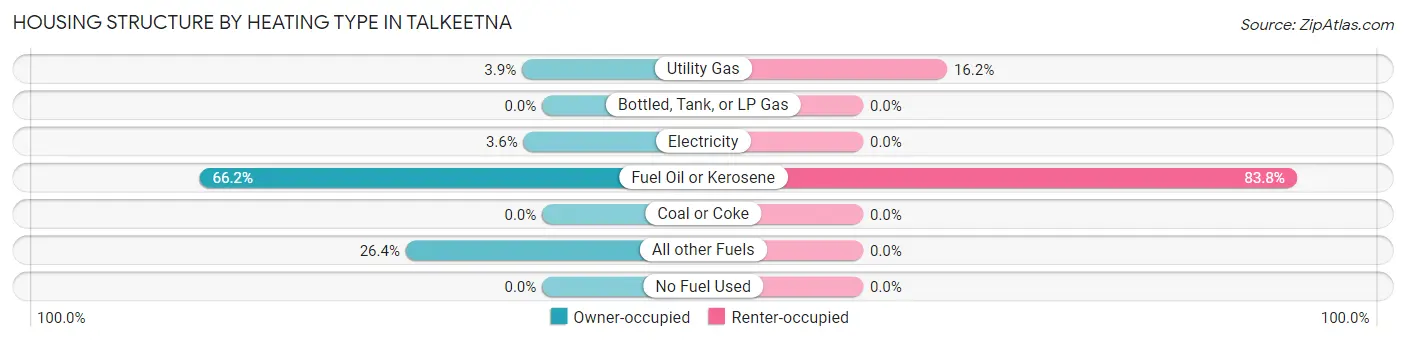
| Heating Type | Owner-occupied | Renter-occupied |
| Utility Gas | 13 (3.9%) | 12 (16.2%) |
| Bottled, Tank, or LP Gas | 0 (0.0%) | 0 (0.0%) |
| Electricity | 12 (3.6%) | 0 (0.0%) |
| Fuel Oil or Kerosene | 221 (66.2%) | 62 (83.8%) |
| Coal or Coke | 0 (0.0%) | 0 (0.0%) |
| All other Fuels | 88 (26.4%) | 0 (0.0%) |
| No Fuel Used | 0 (0.0%) | 0 (0.0%) |
| Total | 334 (100.0%) | 74 (100.0%) |
Household Vehicle Usage in Talkeetna
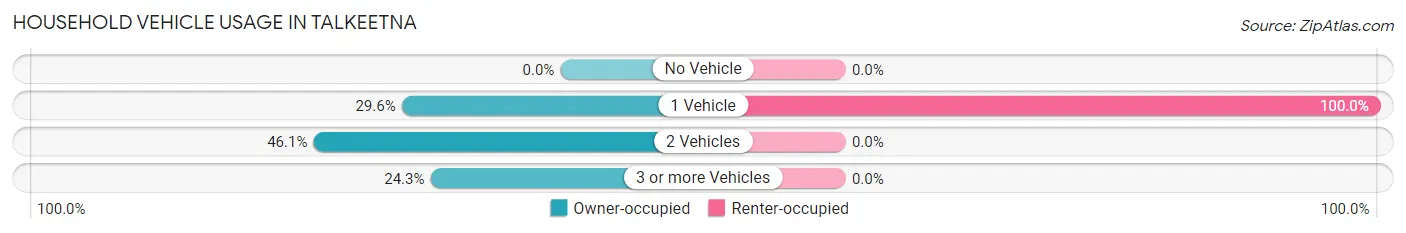
| Vehicles per Household | Owner-occupied | Renter-occupied |
| No Vehicle | 0 (0.0%) | 0 (0.0%) |
| 1 Vehicle | 99 (29.6%) | 74 (100.0%) |
| 2 Vehicles | 154 (46.1%) | 0 (0.0%) |
| 3 or more Vehicles | 81 (24.2%) | 0 (0.0%) |
| Total | 334 (100.0%) | 74 (100.0%) |
Real Estate & Mortgages in Talkeetna
Real Estate and Mortgage Overview in Talkeetna
| Characteristic | Without Mortgage | With Mortgage |
| Housing Units | 136 | 198 |
| Median Property Value | $246,600 | $235,900 |
| Median Household Income | $68,125 | $25 |
| Monthly Housing Costs | $371 | $0 |
| Real Estate Taxes | $1,833 | $26 |
Property Value by Mortgage Status in Talkeetna
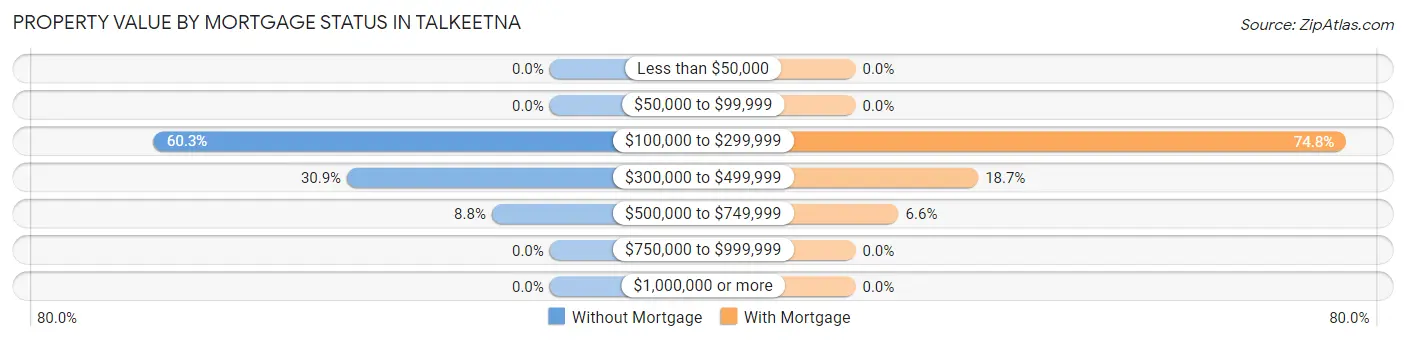
| Property Value | Without Mortgage | With Mortgage |
| Less than $50,000 | 0 (0.0%) | 0 (0.0%) |
| $50,000 to $99,999 | 0 (0.0%) | 0 (0.0%) |
| $100,000 to $299,999 | 82 (60.3%) | 148 (74.8%) |
| $300,000 to $499,999 | 42 (30.9%) | 37 (18.7%) |
| $500,000 to $749,999 | 12 (8.8%) | 13 (6.6%) |
| $750,000 to $999,999 | 0 (0.0%) | 0 (0.0%) |
| $1,000,000 or more | 0 (0.0%) | 0 (0.0%) |
| Total | 136 (100.0%) | 198 (100.0%) |
Household Income by Mortgage Status in Talkeetna
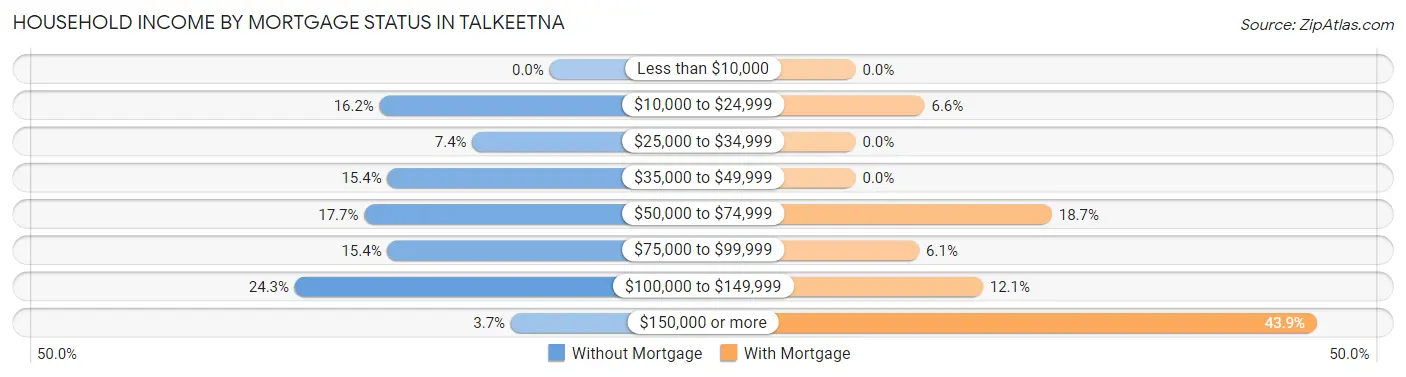
| Household Income | Without Mortgage | With Mortgage |
| Less than $10,000 | 0 (0.0%) | 0 (0.0%) |
| $10,000 to $24,999 | 22 (16.2%) | 13 (6.6%) |
| $25,000 to $34,999 | 10 (7.3%) | 0 (0.0%) |
| $35,000 to $49,999 | 21 (15.4%) | 0 (0.0%) |
| $50,000 to $74,999 | 24 (17.6%) | 37 (18.7%) |
| $75,000 to $99,999 | 21 (15.4%) | 12 (6.1%) |
| $100,000 to $149,999 | 33 (24.3%) | 24 (12.1%) |
| $150,000 or more | 5 (3.7%) | 87 (43.9%) |
| Total | 136 (100.0%) | 198 (100.0%) |
Property Value to Household Income Ratio in Talkeetna
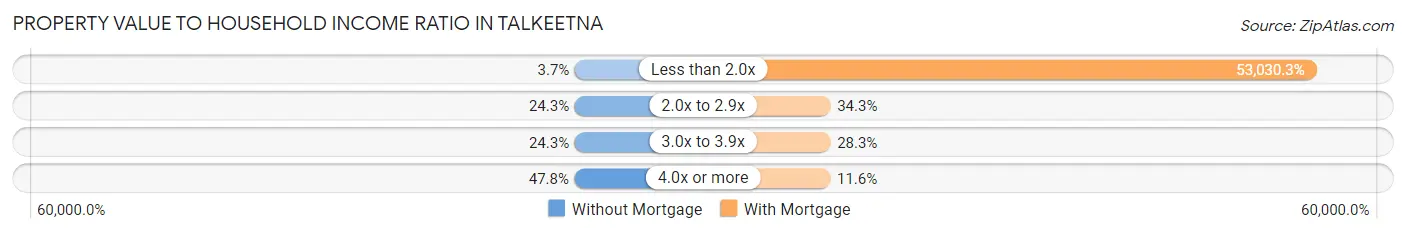
| Value-to-Income Ratio | Without Mortgage | With Mortgage |
| Less than 2.0x | 5 (3.7%) | 105,000 (53,030.3%) |
| 2.0x to 2.9x | 33 (24.3%) | 68 (34.3%) |
| 3.0x to 3.9x | 33 (24.3%) | 56 (28.3%) |
| 4.0x or more | 65 (47.8%) | 23 (11.6%) |
| Total | 136 (100.0%) | 198 (100.0%) |
Real Estate Taxes by Mortgage Status in Talkeetna
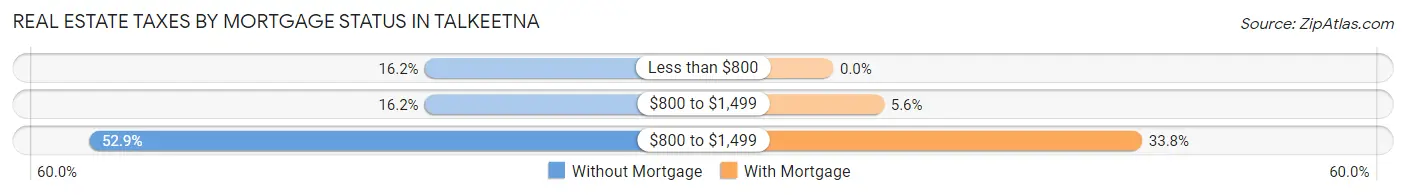
| Property Taxes | Without Mortgage | With Mortgage |
| Less than $800 | 22 (16.2%) | 0 (0.0%) |
| $800 to $1,499 | 22 (16.2%) | 11 (5.6%) |
| $800 to $1,499 | 72 (52.9%) | 67 (33.8%) |
| Total | 136 (100.0%) | 198 (100.0%) |
Health & Disability in Talkeetna
Health Insurance Coverage by Age in Talkeetna
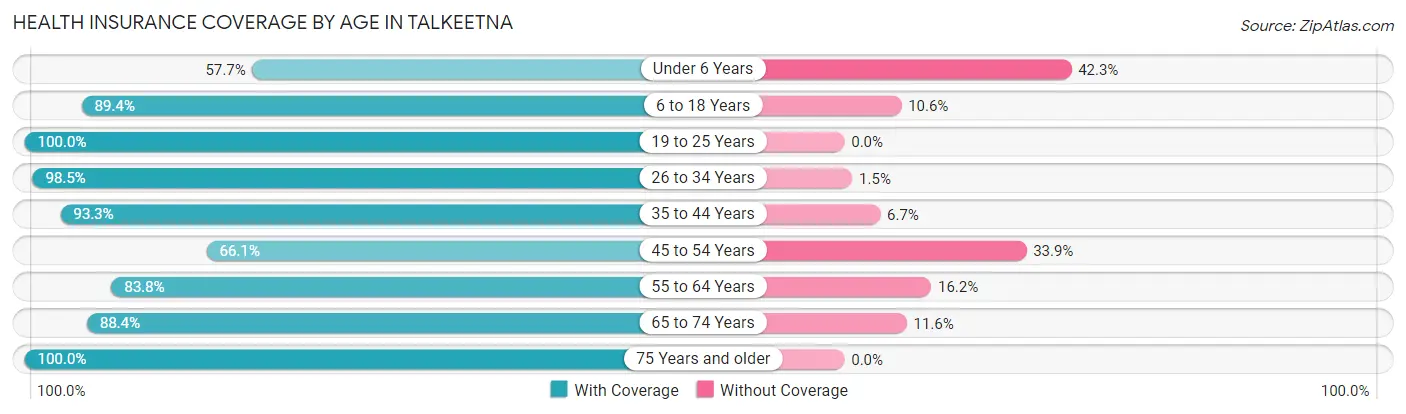
| Age Bracket | With Coverage | Without Coverage |
| Under 6 Years | 30 (57.7%) | 22 (42.3%) |
| 6 to 18 Years | 278 (89.4%) | 33 (10.6%) |
| 19 to 25 Years | 18 (100.0%) | 0 (0.0%) |
| 26 to 34 Years | 67 (98.5%) | 1 (1.5%) |
| 35 to 44 Years | 154 (93.3%) | 11 (6.7%) |
| 45 to 54 Years | 113 (66.1%) | 58 (33.9%) |
| 55 to 64 Years | 114 (83.8%) | 22 (16.2%) |
| 65 to 74 Years | 99 (88.4%) | 13 (11.6%) |
| 75 Years and older | 11 (100.0%) | 0 (0.0%) |
| Total | 884 (84.7%) | 160 (15.3%) |
Health Insurance Coverage by Citizenship Status in Talkeetna
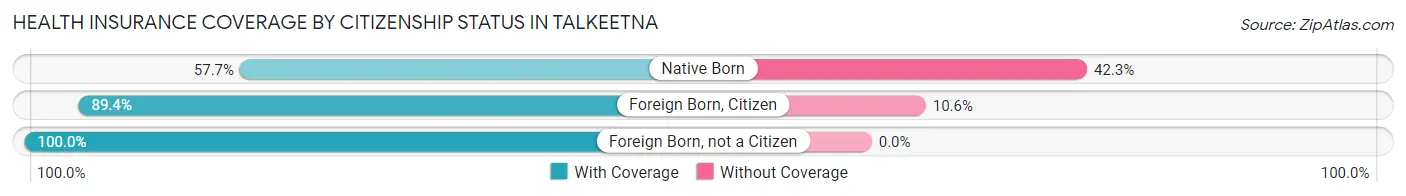
| Citizenship Status | With Coverage | Without Coverage |
| Native Born | 30 (57.7%) | 22 (42.3%) |
| Foreign Born, Citizen | 278 (89.4%) | 33 (10.6%) |
| Foreign Born, not a Citizen | 18 (100.0%) | 0 (0.0%) |
Health Insurance Coverage by Household Income in Talkeetna
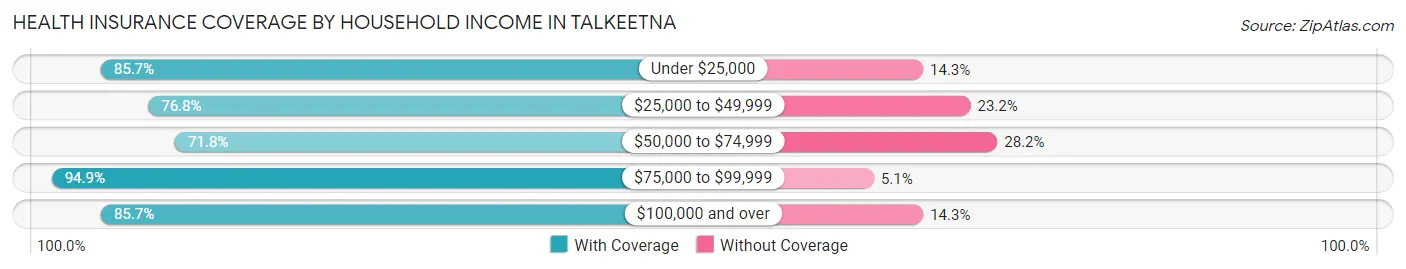
| Household Income | With Coverage | Without Coverage |
| Under $25,000 | 60 (85.7%) | 10 (14.3%) |
| $25,000 to $49,999 | 116 (76.8%) | 35 (23.2%) |
| $50,000 to $74,999 | 84 (71.8%) | 33 (28.2%) |
| $75,000 to $99,999 | 205 (94.9%) | 11 (5.1%) |
| $100,000 and over | 413 (85.7%) | 69 (14.3%) |
Public vs Private Health Insurance Coverage by Age in Talkeetna
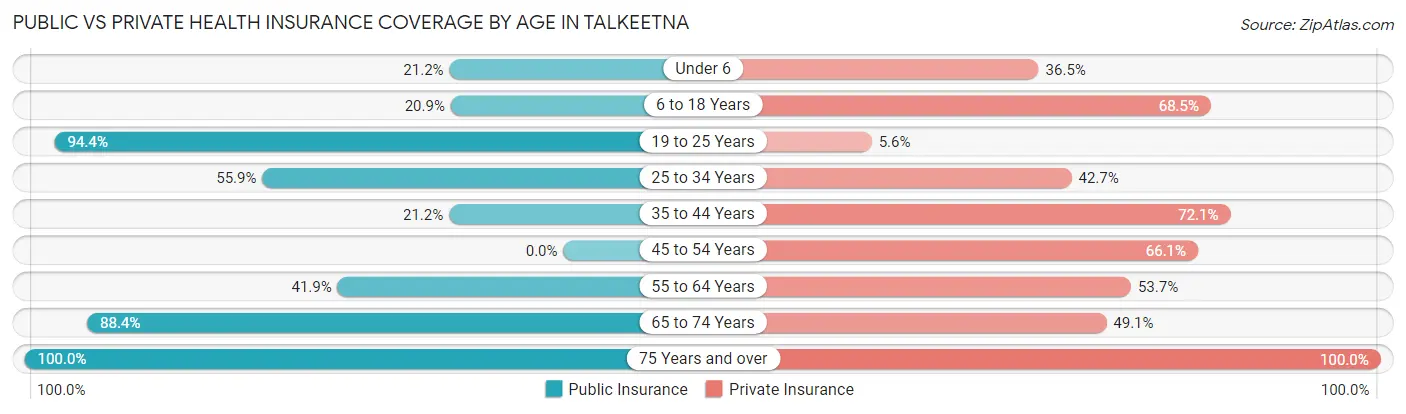
| Age Bracket | Public Insurance | Private Insurance |
| Under 6 | 11 (21.1%) | 19 (36.5%) |
| 6 to 18 Years | 65 (20.9%) | 213 (68.5%) |
| 19 to 25 Years | 17 (94.4%) | 1 (5.6%) |
| 25 to 34 Years | 38 (55.9%) | 29 (42.6%) |
| 35 to 44 Years | 35 (21.2%) | 119 (72.1%) |
| 45 to 54 Years | 0 (0.0%) | 113 (66.1%) |
| 55 to 64 Years | 57 (41.9%) | 73 (53.7%) |
| 65 to 74 Years | 99 (88.4%) | 55 (49.1%) |
| 75 Years and over | 11 (100.0%) | 11 (100.0%) |
| Total | 333 (31.9%) | 633 (60.6%) |
Disability Status by Sex by Age in Talkeetna
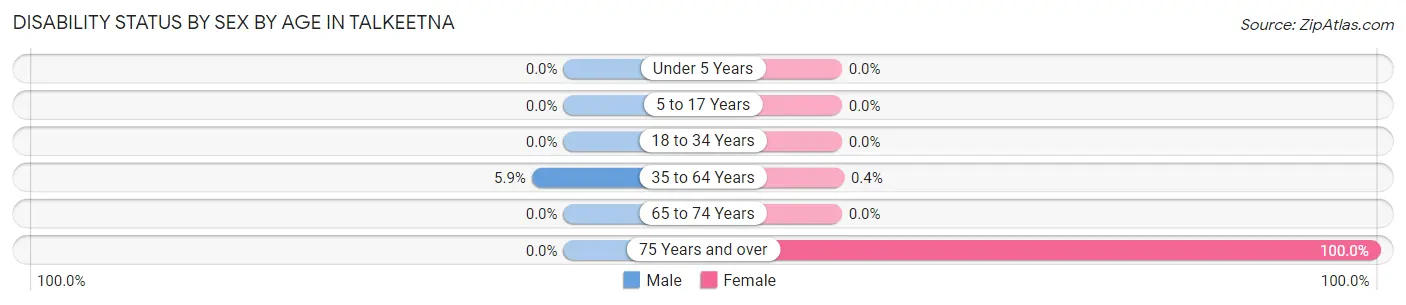
| Age Bracket | Male | Female |
| Under 5 Years | 0 (0.0%) | 0 (0.0%) |
| 5 to 17 Years | 0 (0.0%) | 0 (0.0%) |
| 18 to 34 Years | 0 (0.0%) | 0 (0.0%) |
| 35 to 64 Years | 13 (5.9%) | 1 (0.4%) |
| 65 to 74 Years | 0 (0.0%) | 0 (0.0%) |
| 75 Years and over | 0 (0.0%) | 11 (100.0%) |
Disability Class by Sex by Age in Talkeetna
Disability Class: Hearing Difficulty
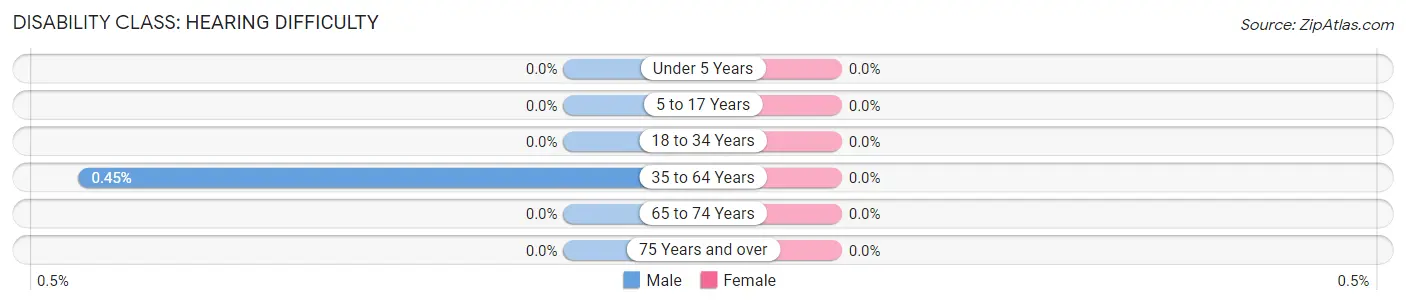
| Age Bracket | Male | Female |
| Under 5 Years | 0 (0.0%) | 0 (0.0%) |
| 5 to 17 Years | 0 (0.0%) | 0 (0.0%) |
| 18 to 34 Years | 0 (0.0%) | 0 (0.0%) |
| 35 to 64 Years | 1 (0.4%) | 0 (0.0%) |
| 65 to 74 Years | 0 (0.0%) | 0 (0.0%) |
| 75 Years and over | 0 (0.0%) | 0 (0.0%) |
Disability Class: Vision Difficulty

| Age Bracket | Male | Female |
| Under 5 Years | 0 (0.0%) | 0 (0.0%) |
| 5 to 17 Years | 0 (0.0%) | 0 (0.0%) |
| 18 to 34 Years | 0 (0.0%) | 0 (0.0%) |
| 35 to 64 Years | 1 (0.4%) | 0 (0.0%) |
| 65 to 74 Years | 0 (0.0%) | 0 (0.0%) |
| 75 Years and over | 0 (0.0%) | 0 (0.0%) |
Disability Class: Cognitive Difficulty
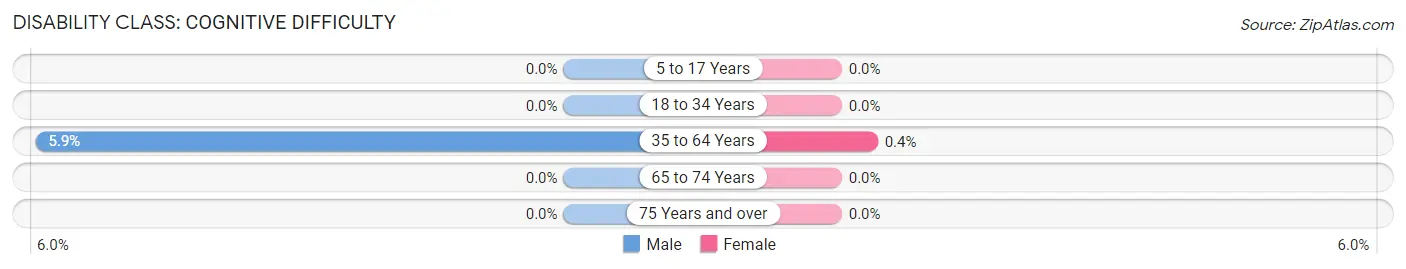
| Age Bracket | Male | Female |
| 5 to 17 Years | 0 (0.0%) | 0 (0.0%) |
| 18 to 34 Years | 0 (0.0%) | 0 (0.0%) |
| 35 to 64 Years | 13 (5.9%) | 1 (0.4%) |
| 65 to 74 Years | 0 (0.0%) | 0 (0.0%) |
| 75 Years and over | 0 (0.0%) | 0 (0.0%) |
Disability Class: Ambulatory Difficulty
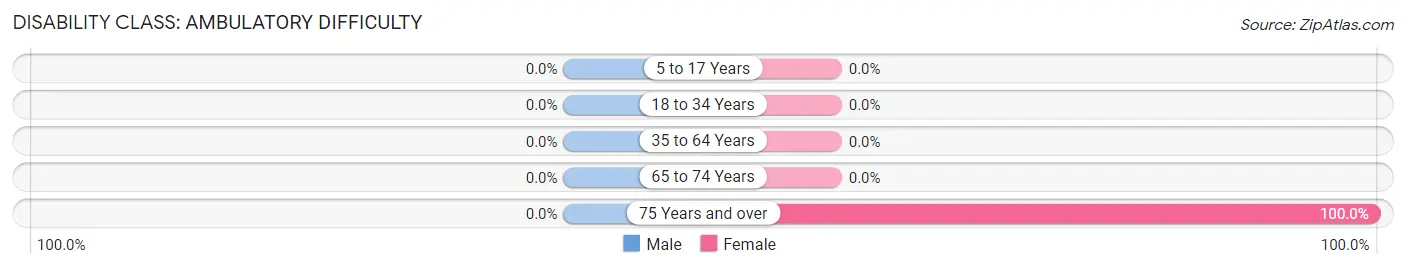
| Age Bracket | Male | Female |
| 5 to 17 Years | 0 (0.0%) | 0 (0.0%) |
| 18 to 34 Years | 0 (0.0%) | 0 (0.0%) |
| 35 to 64 Years | 0 (0.0%) | 0 (0.0%) |
| 65 to 74 Years | 0 (0.0%) | 0 (0.0%) |
| 75 Years and over | 0 (0.0%) | 11 (100.0%) |
Disability Class: Self-Care Difficulty
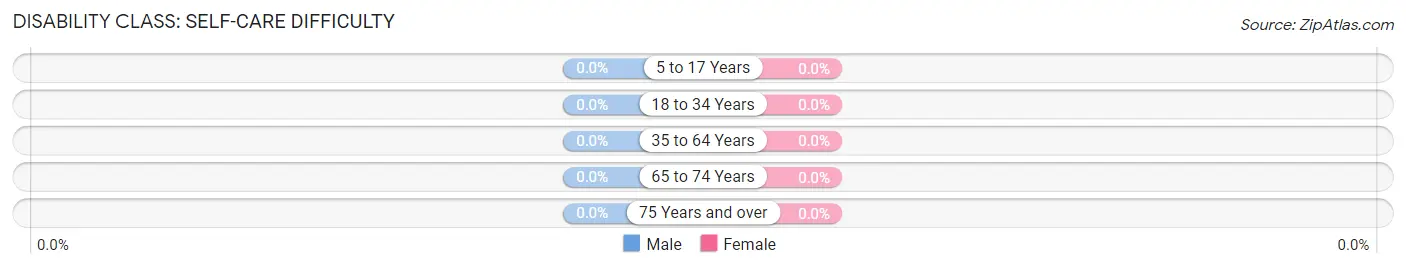
| Age Bracket | Male | Female |
| 5 to 17 Years | 0 (0.0%) | 0 (0.0%) |
| 18 to 34 Years | 0 (0.0%) | 0 (0.0%) |
| 35 to 64 Years | 0 (0.0%) | 0 (0.0%) |
| 65 to 74 Years | 0 (0.0%) | 0 (0.0%) |
| 75 Years and over | 0 (0.0%) | 0 (0.0%) |
Technology Access in Talkeetna
Computing Device Access in Talkeetna
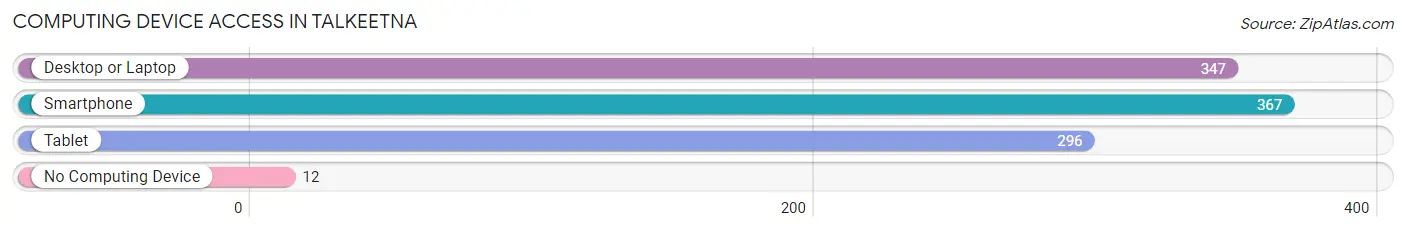
| Device Type | # Households | % Households |
| Desktop or Laptop | 347 | 85.1% |
| Smartphone | 367 | 89.9% |
| Tablet | 296 | 72.6% |
| No Computing Device | 12 | 2.9% |
| Total | 408 | 100.0% |
Internet Access in Talkeetna
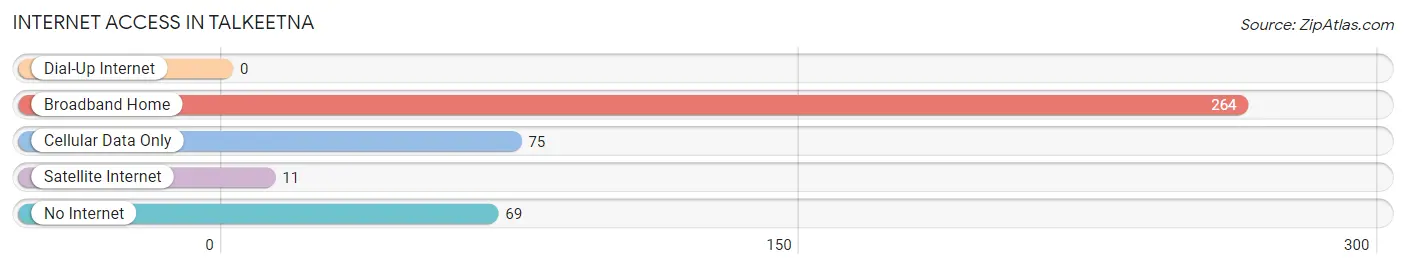
| Internet Type | # Households | % Households |
| Dial-Up Internet | 0 | 0.0% |
| Broadband Home | 264 | 64.7% |
| Cellular Data Only | 75 | 18.4% |
| Satellite Internet | 11 | 2.7% |
| No Internet | 69 | 16.9% |
| Total | 408 | 100.0% |
Talkeetna Summary
Talketna, Alaska is a small town located in the Matanuska-Susitna Borough of Southcentral Alaska. It is situated at the confluence of the Susitna and Chulitna Rivers, approximately 110 miles north of Anchorage. The town is known for its stunning views of the Alaska Range, including Mount McKinley, and its proximity to Denali National Park.
History
The area around Talketna has been inhabited for thousands of years by the Dena’ina Athabascan people. The first European settlers arrived in the area in the late 1800s, and the town was officially founded in 1916. The town was named after the nearby Talkeetna Mountains, which were named by a prospector in the late 1800s.
The town grew slowly over the next few decades, and by the 1950s it had become a popular destination for tourists and outdoor enthusiasts. In the 1960s, the Alaska Railroad extended its line to Talketna, making it easier for visitors to reach the town.
In the 1970s, the town began to experience a population boom as people moved to the area to take advantage of the area’s natural beauty and outdoor recreation opportunities. The population of Talketna has continued to grow since then, and it is now home to over 900 people.
Geography
Talketna is located in the Matanuska-Susitna Borough of Southcentral Alaska. It is situated at the confluence of the Susitna and Chulitna Rivers, approximately 110 miles north of Anchorage. The town is surrounded by the Talkeetna Mountains, which are part of the Alaska Range. The highest peak in the range is Mount McKinley, which is visible from the town.
The climate in Talketna is generally mild, with temperatures ranging from the mid-30s in the winter to the mid-60s in the summer. The area receives an average of 20 inches of precipitation per year, with most of it falling in the form of snow.
Economy
The economy of Talketna is largely based on tourism and outdoor recreation. The town is a popular destination for visitors who come to take advantage of the area’s natural beauty and outdoor activities. The town is also home to several small businesses, including restaurants, shops, and lodging.
The town is also home to several small-scale industries, including a sawmill, a fish processing plant, and a woodworking shop. The town is also home to a small airport, which serves as a hub for air taxi services to other parts of Alaska.
Demographics
As of the 2010 census, the population of Talketna was 922. The racial makeup of the town was 94.3% White, 0.7% Native American, 0.2% Asian, 0.1% Pacific Islander, 0.1% from other races, and 4.6% from two or more races. The median household income in Talketna was $50,000, and the median age was 44.
Conclusion
Talketna, Alaska is a small town located in the Matanuska-Susitna Borough of Southcentral Alaska. It is situated at the confluence of the Susitna and Chulitna Rivers, approximately 110 miles north of Anchorage. The town is known for its stunning views of the Alaska Range, including Mount McKinley, and its proximity to Denali National Park. The economy of Talketna is largely based on tourism and outdoor recreation, and the town is home to several small businesses and industries. As of the 2010 census, the population of Talketna was 922.
Common Questions
What is Per Capita Income in Talkeetna?
Per Capita income in Talkeetna is $32,274.
What is the Median Family Income in Talkeetna?
Median Family Income in Talkeetna is $79,659.
What is the Median Household income in Talkeetna?
Median Household Income in Talkeetna is $79,091.
What is Income or Wage Gap in Talkeetna?
Income or Wage Gap in Talkeetna is 25.8%.
Women in Talkeetna earn 74.2 cents for every dollar earned by a man.
What is Inequality or Gini Index in Talkeetna?
Inequality or Gini Index in Talkeetna is 0.36.
What is the Total Population of Talkeetna?
Total Population of Talkeetna is 1,044.
What is the Total Male Population of Talkeetna?
Total Male Population of Talkeetna is 499.
What is the Total Female Population of Talkeetna?
Total Female Population of Talkeetna is 545.
What is the Ratio of Males per 100 Females in Talkeetna?
There are 91.56 Males per 100 Females in Talkeetna.
What is the Ratio of Females per 100 Males in Talkeetna?
There are 109.22 Females per 100 Males in Talkeetna.
What is the Median Population Age in Talkeetna?
Median Population Age in Talkeetna is 41.5 Years.
What is the Average Family Size in Talkeetna
Average Family Size in Talkeetna is 3.3 People.
What is the Average Household Size in Talkeetna
Average Household Size in Talkeetna is 2.5 People.
How Large is the Labor Force in Talkeetna?
There are 567 People in the Labor Forcein in Talkeetna.
What is the Percentage of People in the Labor Force in Talkeetna?
80.5% of People are in the Labor Force in Talkeetna.
What is the Unemployment Rate in Talkeetna?
Unemployment Rate in Talkeetna is 4.2%.