Stebbins, AK Map & Demographics
Stebbins Map
Stebbins Overview
$20,441
PER CAPITA INCOME
$51,875
AVG FAMILY INCOME
$52,500
AVG HOUSEHOLD INCOME
16.2%
WAGE / INCOME GAP [ % ]
83.8¢/ $1
WAGE / INCOME GAP [ $ ]
$11,838
FAMILY INCOME DEFICIT
0.36
INEQUALITY / GINI INDEX
654
TOTAL POPULATION
334
MALE POPULATION
320
FEMALE POPULATION
104.38
MALES / 100 FEMALES
95.81
FEMALES / 100 MALES
27.5
MEDIAN AGE
4.0
AVG FAMILY SIZE
3.7
AVG HOUSEHOLD SIZE
266
LABOR FORCE [ PEOPLE ]
62.1%
PERCENT IN LABOR FORCE
27.4%
UNEMPLOYMENT RATE
Stebbins Zip Codes
Stebbins Area Codes
Income in Stebbins
Income Overview in Stebbins
Per Capita Income in Stebbins is $20,441, while median incomes of families and households are $51,875 and $52,500 respectively.
| Characteristic | Number | Measure |
| Per Capita Income | 654 | $20,441 |
| Median Family Income | 137 | $51,875 |
| Mean Family Income | 137 | $57,217 |
| Median Household Income | 164 | $52,500 |
| Mean Household Income | 164 | $58,189 |
| Income Deficit | 137 | $11,838 |
| Wage / Income Gap (%) | 654 | 16.18% |
| Wage / Income Gap ($) | 654 | 83.82¢ per $1 |
| Gini / Inequality Index | 654 | 0.36 |
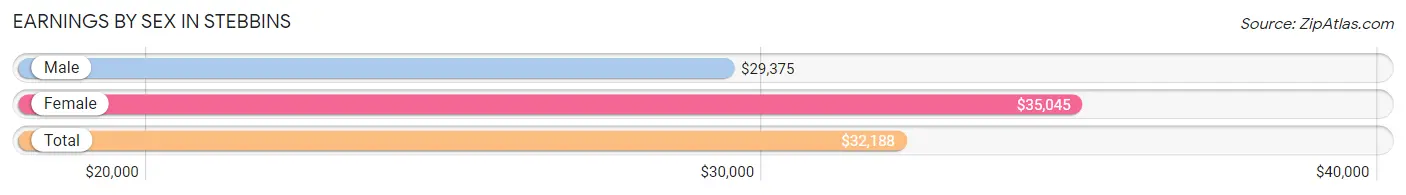
Earnings by Sex in Stebbins
Average Earnings in Stebbins are $32,188, $29,375 for men and $35,045 for women, a difference of 16.2%.
| Sex | Number | Average Earnings |
| Male | 120 (48.2%) | $29,375 |
| Female | 129 (51.8%) | $35,045 |
| Total | 249 (100.0%) | $32,188 |
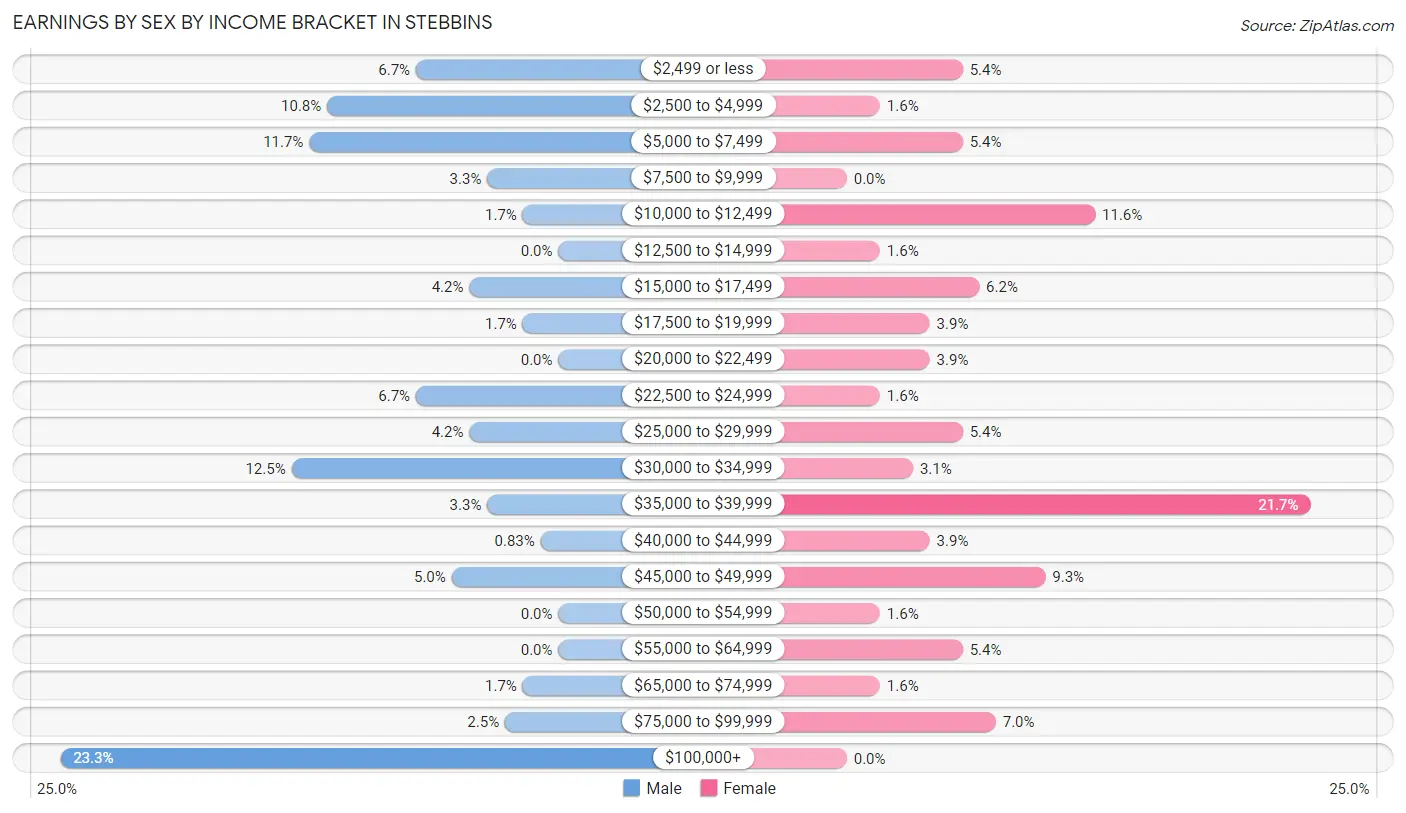
Earnings by Sex by Income Bracket in Stebbins
The most common earnings brackets in Stebbins are $100,000+ for men (28 | 23.3%) and $35,000 to $39,999 for women (28 | 21.7%).
| Income | Male | Female |
| $2,499 or less | 8 (6.7%) | 7 (5.4%) |
| $2,500 to $4,999 | 13 (10.8%) | 2 (1.5%) |
| $5,000 to $7,499 | 14 (11.7%) | 7 (5.4%) |
| $7,500 to $9,999 | 4 (3.3%) | 0 (0.0%) |
| $10,000 to $12,499 | 2 (1.7%) | 15 (11.6%) |
| $12,500 to $14,999 | 0 (0.0%) | 2 (1.5%) |
| $15,000 to $17,499 | 5 (4.2%) | 8 (6.2%) |
| $17,500 to $19,999 | 2 (1.7%) | 5 (3.9%) |
| $20,000 to $22,499 | 0 (0.0%) | 5 (3.9%) |
| $22,500 to $24,999 | 8 (6.7%) | 2 (1.5%) |
| $25,000 to $29,999 | 5 (4.2%) | 7 (5.4%) |
| $30,000 to $34,999 | 15 (12.5%) | 4 (3.1%) |
| $35,000 to $39,999 | 4 (3.3%) | 28 (21.7%) |
| $40,000 to $44,999 | 1 (0.8%) | 5 (3.9%) |
| $45,000 to $49,999 | 6 (5.0%) | 12 (9.3%) |
| $50,000 to $54,999 | 0 (0.0%) | 2 (1.5%) |
| $55,000 to $64,999 | 0 (0.0%) | 7 (5.4%) |
| $65,000 to $74,999 | 2 (1.7%) | 2 (1.5%) |
| $75,000 to $99,999 | 3 (2.5%) | 9 (7.0%) |
| $100,000+ | 28 (23.3%) | 0 (0.0%) |
| Total | 120 (100.0%) | 129 (100.0%) |
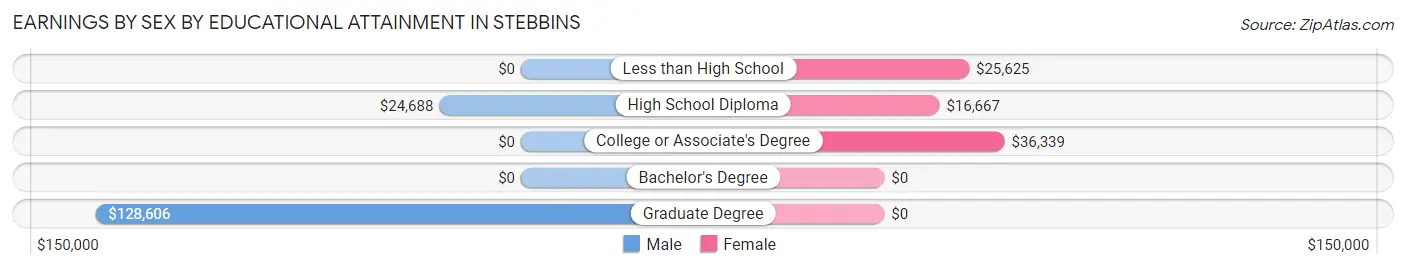
Earnings by Sex by Educational Attainment in Stebbins
| Educational Attainment | Male Income | Female Income |
| Less than High School | - | - |
| High School Diploma | $24,688 | $16,667 |
| College or Associate's Degree | - | - |
| Bachelor's Degree | - | - |
| Graduate Degree | $128,606 | $0 |
| Total | - | - |
Family Income in Stebbins
Family Income Brackets in Stebbins
According to the Stebbins family income data, there are 34 families falling into the $50,000 to $74,999 income range, which is the most common income bracket and makes up 24.8% of all families.
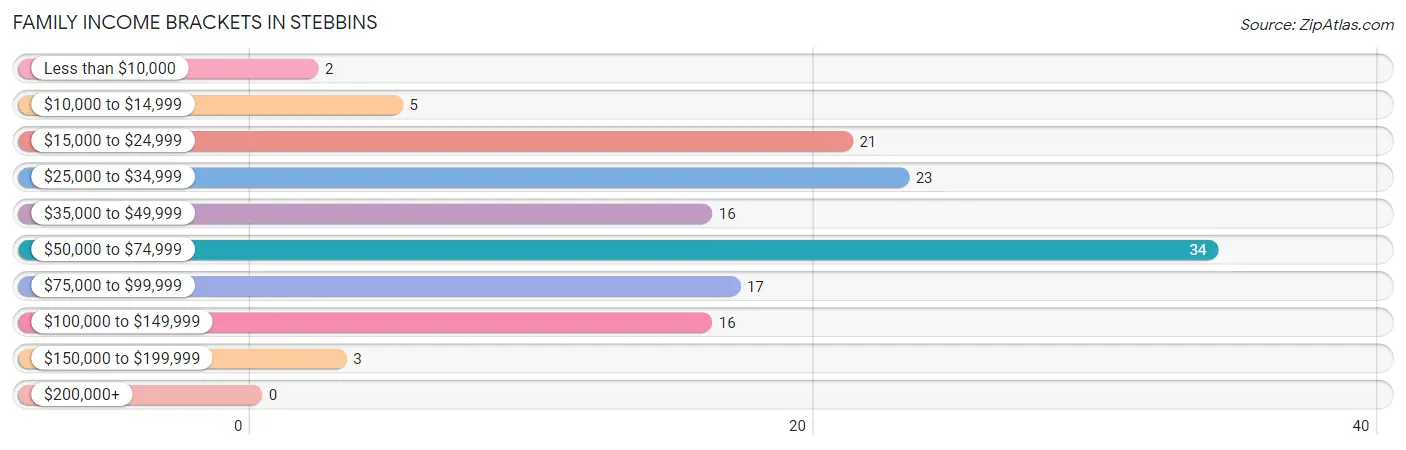
| Income Bracket | # Families | % Families |
| Less than $10,000 | 2 | 1.5% |
| $10,000 to $14,999 | 5 | 3.6% |
| $15,000 to $24,999 | 21 | 15.3% |
| $25,000 to $34,999 | 23 | 16.8% |
| $35,000 to $49,999 | 16 | 11.7% |
| $50,000 to $74,999 | 34 | 24.8% |
| $75,000 to $99,999 | 17 | 12.4% |
| $100,000 to $149,999 | 16 | 11.7% |
| $150,000 to $199,999 | 3 | 2.2% |
| $200,000+ | 0 | 0.0% |
Family Income by Famaliy Size in Stebbins
7+ person families (33 | 24.1%) account for the highest median family income in Stebbins with $83,750 per family, while 2-person families (25 | 18.2%) have the highest median income of $19,062 per family member.
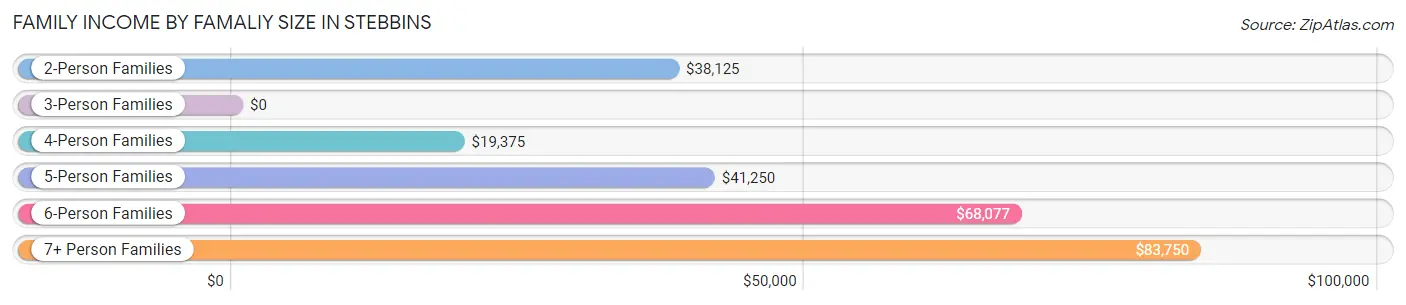
| Income Bracket | # Families | Median Income |
| 2-Person Families | 25 (18.2%) | $38,125 |
| 3-Person Families | 14 (10.2%) | $0 |
| 4-Person Families | 25 (18.2%) | $19,375 |
| 5-Person Families | 10 (7.3%) | $41,250 |
| 6-Person Families | 30 (21.9%) | $68,077 |
| 7+ Person Families | 33 (24.1%) | $83,750 |
| Total | 137 (100.0%) | $51,875 |
Family Income by Number of Earners in Stebbins
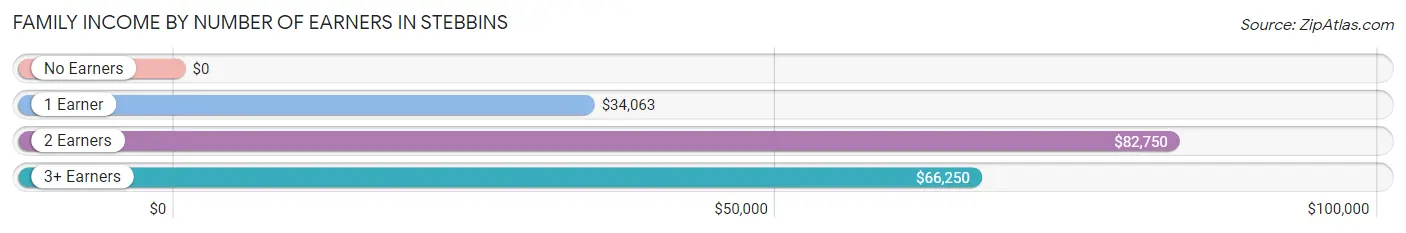
| Number of Earners | # Families | Median Income |
| No Earners | 27 (19.7%) | $0 |
| 1 Earner | 59 (43.1%) | $34,063 |
| 2 Earners | 29 (21.2%) | $82,750 |
| 3+ Earners | 22 (16.1%) | $66,250 |
| Total | 137 (100.0%) | $51,875 |
Household Income in Stebbins
Household Income Brackets in Stebbins
With 38 households falling in the category, the $50,000 to $74,999 income range is the most frequent in Stebbins, accounting for 23.2% of all households.
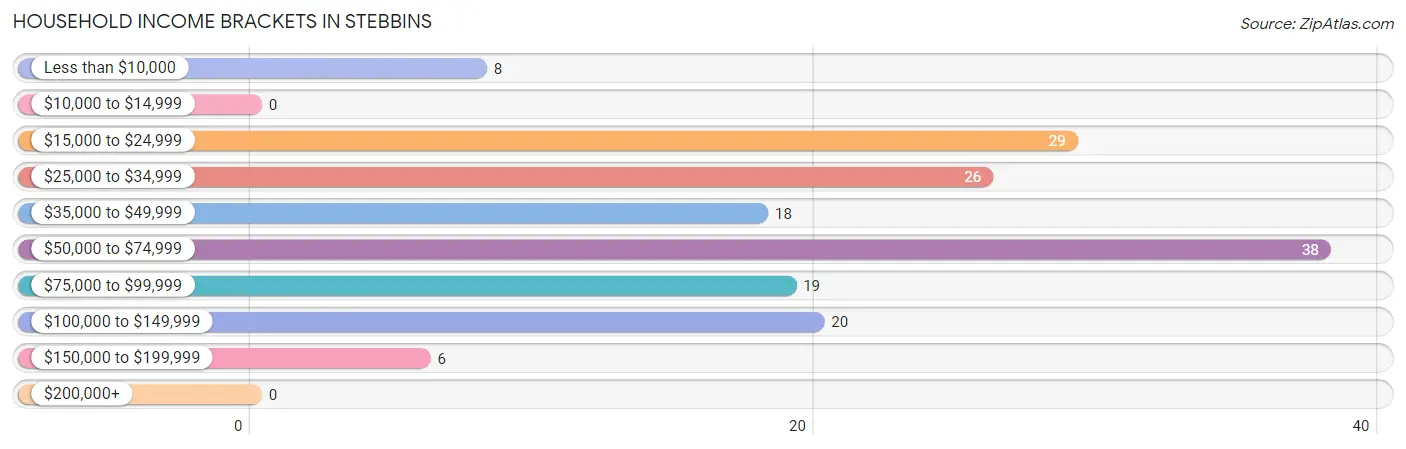
| Income Bracket | # Households | % Households |
| Less than $10,000 | 8 | 4.9% |
| $10,000 to $14,999 | 0 | 0.0% |
| $15,000 to $24,999 | 29 | 17.7% |
| $25,000 to $34,999 | 26 | 15.9% |
| $35,000 to $49,999 | 18 | 11.0% |
| $50,000 to $74,999 | 38 | 23.2% |
| $75,000 to $99,999 | 19 | 11.6% |
| $100,000 to $149,999 | 20 | 12.2% |
| $150,000 to $199,999 | 6 | 3.7% |
| $200,000+ | 0 | 0.0% |
Household Income by Householder Age in Stebbins
The median household income in Stebbins is $52,500, with the highest median household income of $76,250 found in the 25 to 44 years age bracket for the primary householder. A total of 60 households (36.6%) fall into this category. Meanwhile, the 15 to 24 years age bracket for the primary householder has the lowest median household income of $0, with 5 households (3.0%) in this group.
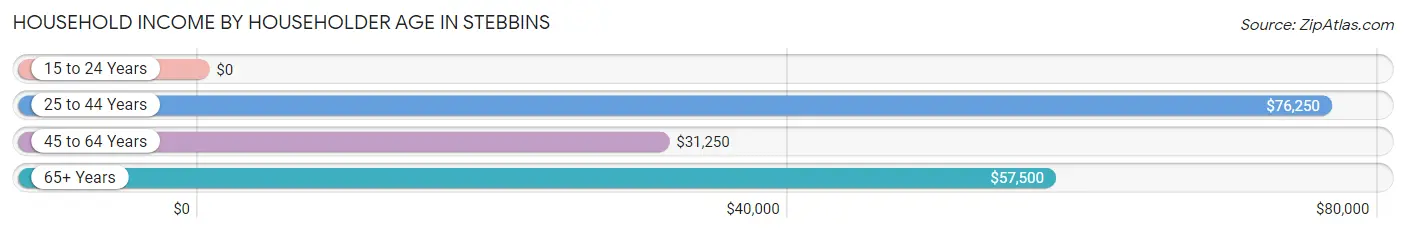
| Income Bracket | # Households | Median Income |
| 15 to 24 Years | 5 (3.0%) | $0 |
| 25 to 44 Years | 60 (36.6%) | $76,250 |
| 45 to 64 Years | 53 (32.3%) | $31,250 |
| 65+ Years | 46 (28.1%) | $57,500 |
| Total | 164 (100.0%) | $52,500 |
Poverty in Stebbins
Income Below Poverty by Sex and Age in Stebbins
With 32.0% poverty level for males and 23.7% for females among the residents of Stebbins, 5 year old males and 16 and 17 year old females are the most vulnerable to poverty, with 3 males (60.0%) and 5 females (83.3%) in their respective age groups living below the poverty level.
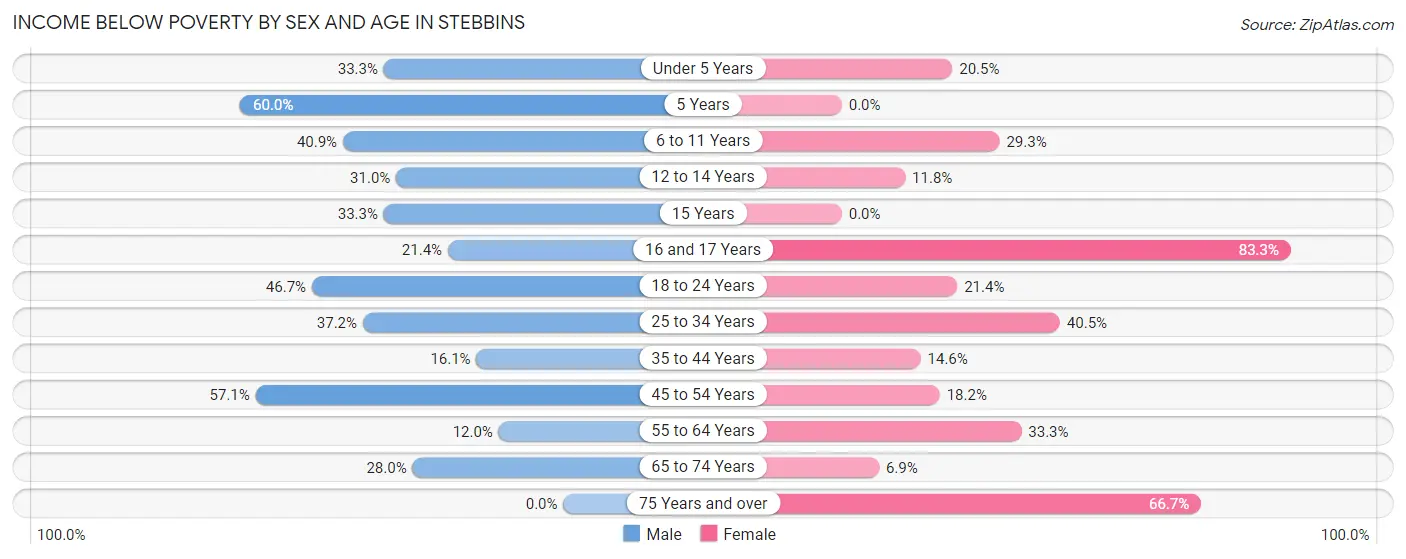
| Age Bracket | Male | Female |
| Under 5 Years | 12 (33.3%) | 8 (20.5%) |
| 5 Years | 3 (60.0%) | 0 (0.0%) |
| 6 to 11 Years | 18 (40.9%) | 12 (29.3%) |
| 12 to 14 Years | 9 (31.0%) | 2 (11.8%) |
| 15 Years | 2 (33.3%) | 0 (0.0%) |
| 16 and 17 Years | 3 (21.4%) | 5 (83.3%) |
| 18 to 24 Years | 14 (46.7%) | 6 (21.4%) |
| 25 to 34 Years | 16 (37.2%) | 17 (40.5%) |
| 35 to 44 Years | 5 (16.1%) | 6 (14.6%) |
| 45 to 54 Years | 12 (57.1%) | 8 (18.2%) |
| 55 to 64 Years | 6 (12.0%) | 7 (33.3%) |
| 65 to 74 Years | 7 (28.0%) | 2 (6.9%) |
| 75 Years and over | 0 (0.0%) | 2 (66.7%) |
| Total | 107 (32.0%) | 75 (23.7%) |
Income Above Poverty by Sex and Age in Stebbins
According to the poverty statistics in Stebbins, males aged 55 to 64 years and females aged 5 years are the age groups that are most secure financially, with 88.0% of males and 100.0% of females in these age groups living above the poverty line.
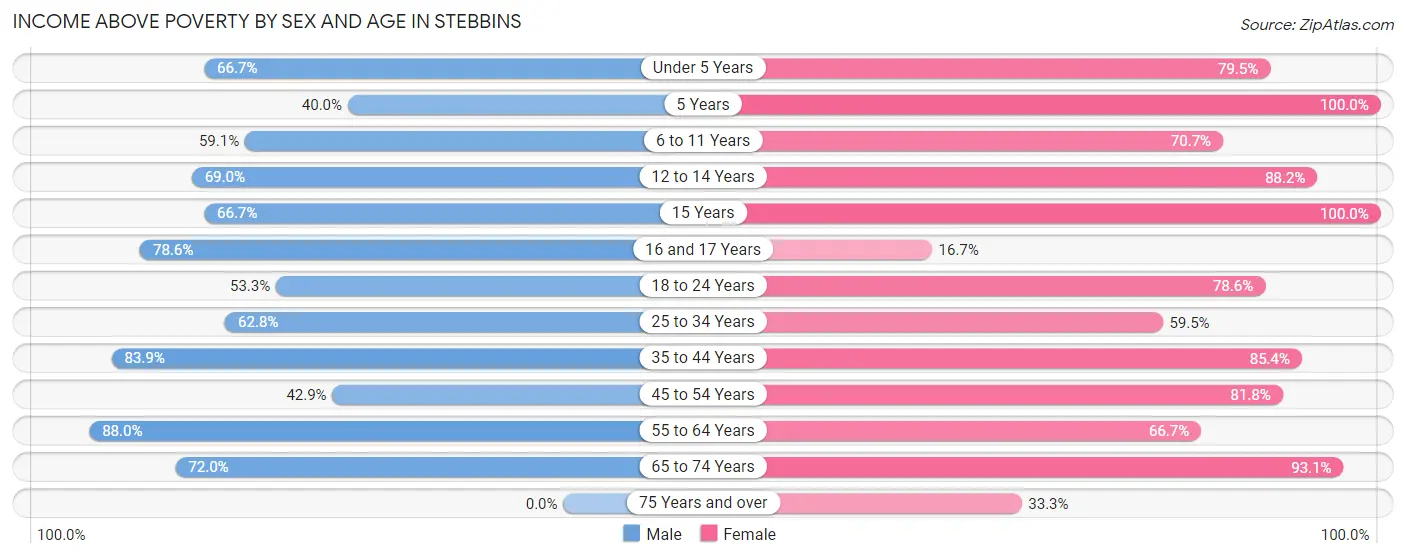
| Age Bracket | Male | Female |
| Under 5 Years | 24 (66.7%) | 31 (79.5%) |
| 5 Years | 2 (40.0%) | 2 (100.0%) |
| 6 to 11 Years | 26 (59.1%) | 29 (70.7%) |
| 12 to 14 Years | 20 (69.0%) | 15 (88.2%) |
| 15 Years | 4 (66.7%) | 3 (100.0%) |
| 16 and 17 Years | 11 (78.6%) | 1 (16.7%) |
| 18 to 24 Years | 16 (53.3%) | 22 (78.6%) |
| 25 to 34 Years | 27 (62.8%) | 25 (59.5%) |
| 35 to 44 Years | 26 (83.9%) | 35 (85.4%) |
| 45 to 54 Years | 9 (42.9%) | 36 (81.8%) |
| 55 to 64 Years | 44 (88.0%) | 14 (66.7%) |
| 65 to 74 Years | 18 (72.0%) | 27 (93.1%) |
| 75 Years and over | 0 (0.0%) | 1 (33.3%) |
| Total | 227 (68.0%) | 241 (76.3%) |
Income Below Poverty Among Married-Couple Families in Stebbins
The poverty statistics for married-couple families in Stebbins show that 12.2% or 9 of the total 74 families live below the poverty line. Families with no children have the highest poverty rate of 30.8%, comprising of 4 families. On the other hand, families with 1 or 2 children have the lowest poverty rate of 0.0%, which includes 0 families.
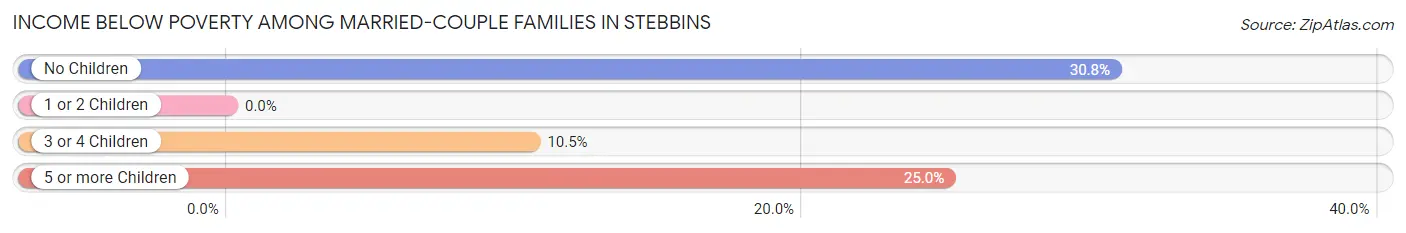
| Children | Above Poverty | Below Poverty |
| No Children | 9 (69.2%) | 4 (30.8%) |
| 1 or 2 Children | 30 (100.0%) | 0 (0.0%) |
| 3 or 4 Children | 17 (89.5%) | 2 (10.5%) |
| 5 or more Children | 9 (75.0%) | 3 (25.0%) |
| Total | 65 (87.8%) | 9 (12.2%) |
Income Below Poverty Among Single-Parent Households in Stebbins
According to the poverty data in Stebbins, 45.8% or 11 single-father households and 43.6% or 17 single-mother households are living below the poverty line. Among single-father households, those with 1 or 2 children have the highest poverty rate, with 9 households (60.0%) experiencing poverty. Likewise, among single-mother households, those with 5 or more children have the highest poverty rate, with 2 households (100.0%) falling below the poverty line.
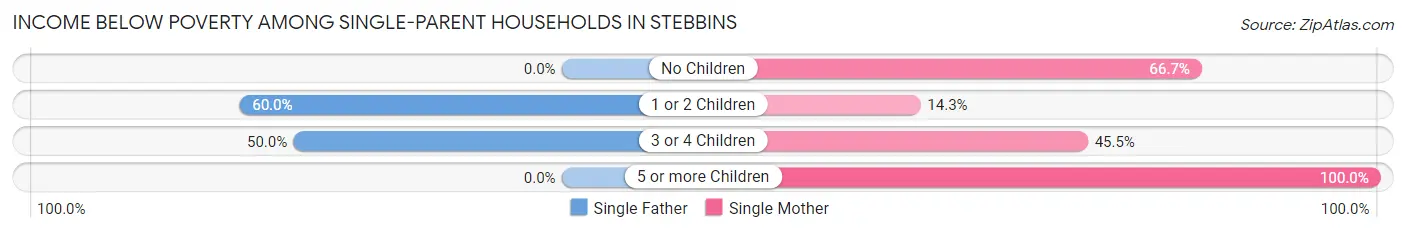
| Children | Single Father | Single Mother |
| No Children | 0 (0.0%) | 8 (66.7%) |
| 1 or 2 Children | 9 (60.0%) | 2 (14.3%) |
| 3 or 4 Children | 2 (50.0%) | 5 (45.5%) |
| 5 or more Children | 0 (0.0%) | 2 (100.0%) |
| Total | 11 (45.8%) | 17 (43.6%) |
Income Below Poverty Among Married-Couple vs Single-Parent Households in Stebbins
The poverty data for Stebbins shows that 9 of the married-couple family households (12.2%) and 28 of the single-parent households (44.4%) are living below the poverty level. Within the married-couple family households, those with no children have the highest poverty rate, with 4 households (30.8%) falling below the poverty line. Among the single-parent households, those with 5 or more children have the highest poverty rate, with 2 household (100.0%) living below poverty.
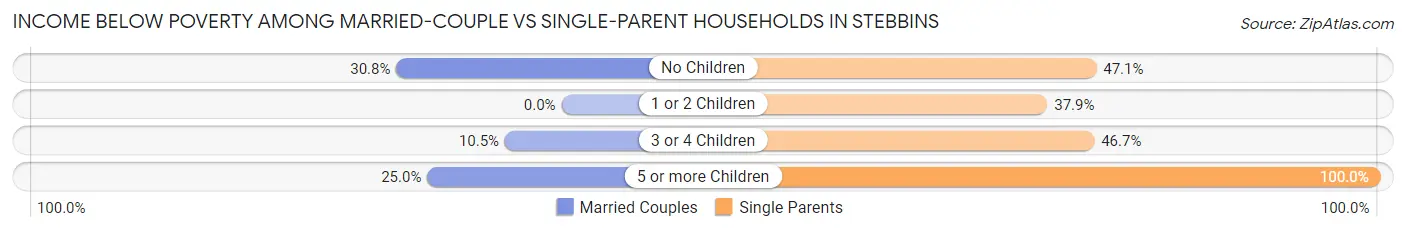
| Children | Married-Couple Families | Single-Parent Households |
| No Children | 4 (30.8%) | 8 (47.1%) |
| 1 or 2 Children | 0 (0.0%) | 11 (37.9%) |
| 3 or 4 Children | 2 (10.5%) | 7 (46.7%) |
| 5 or more Children | 3 (25.0%) | 2 (100.0%) |
| Total | 9 (12.2%) | 28 (44.4%) |
Race in Stebbins
The most populous races in Stebbins are Native / Alaskan (572 | 87.5%), White / Caucasian (37 | 5.7%), and Black / African American (29 | 4.4%).
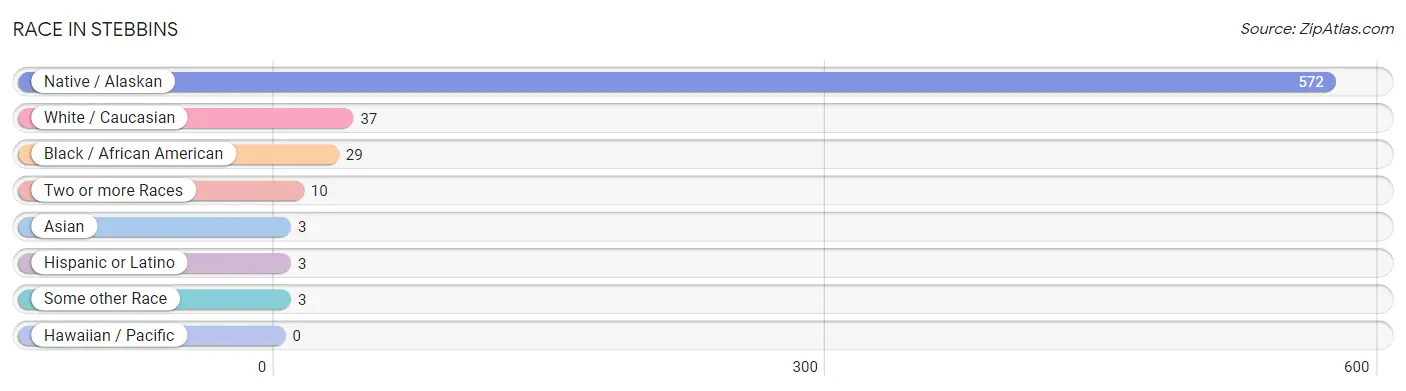
| Race | # Population | % Population |
| Asian | 3 | 0.5% |
| Black / African American | 29 | 4.4% |
| Hawaiian / Pacific | 0 | 0.0% |
| Hispanic or Latino | 3 | 0.5% |
| Native / Alaskan | 572 | 87.5% |
| White / Caucasian | 37 | 5.7% |
| Two or more Races | 10 | 1.5% |
| Some other Race | 3 | 0.5% |
| Total | 654 | 100.0% |
Ancestry in Stebbins
The most populous ancestries reported in Stebbins are Yup'ik (531 | 81.2%), Alaska Native (28 | 4.3%), Norwegian (28 | 4.3%), French (27 | 4.1%), and African (26 | 4.0%), together accounting for 97.9% of all Stebbins residents.
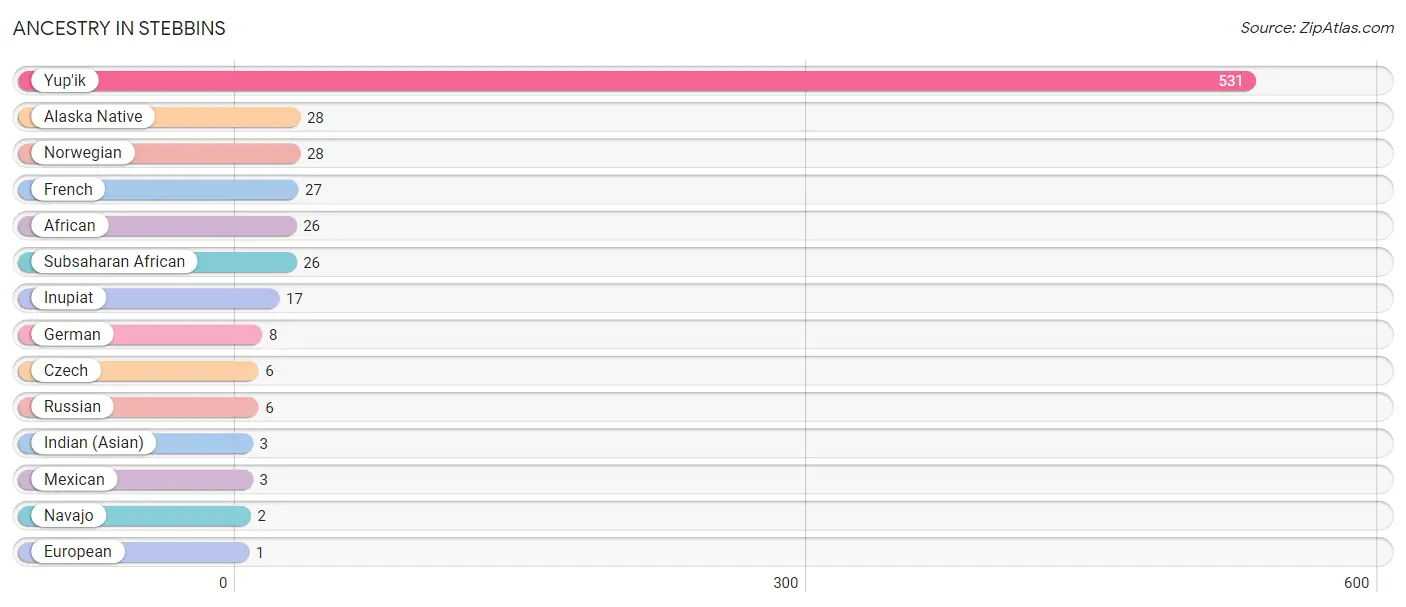
| Ancestry | # Population | % Population |
| African | 26 | 4.0% |
| Alaska Native | 28 | 4.3% |
| Czech | 6 | 0.9% |
| European | 1 | 0.2% |
| French | 27 | 4.1% |
| German | 8 | 1.2% |
| Indian (Asian) | 3 | 0.5% |
| Inupiat | 17 | 2.6% |
| Mexican | 3 | 0.5% |
| Navajo | 2 | 0.3% |
| Norwegian | 28 | 4.3% |
| Russian | 6 | 0.9% |
| Subsaharan African | 26 | 4.0% |
| Yup'ik | 531 | 81.2% | View All 14 Rows |
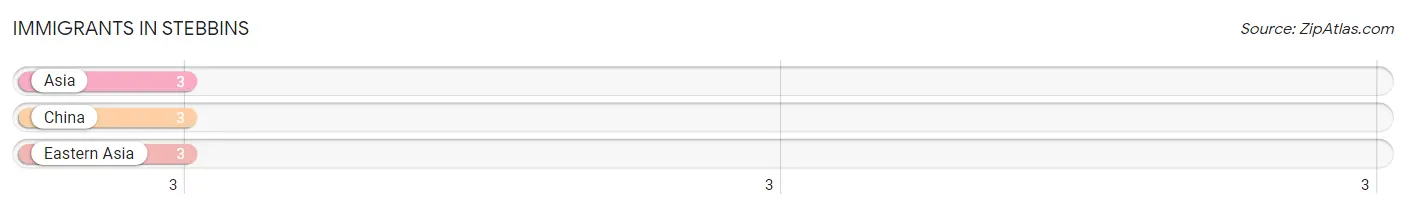
Immigrants in Stebbins
The most numerous immigrant groups reported in Stebbins came from Asia (3 | 0.5%), China (3 | 0.5%), and Eastern Asia (3 | 0.5%), together accounting for 1.4% of all Stebbins residents.
| Immigration Origin | # Population | % Population |
| Asia | 3 | 0.5% |
| China | 3 | 0.5% |
| Eastern Asia | 3 | 0.5% | View All 3 Rows |
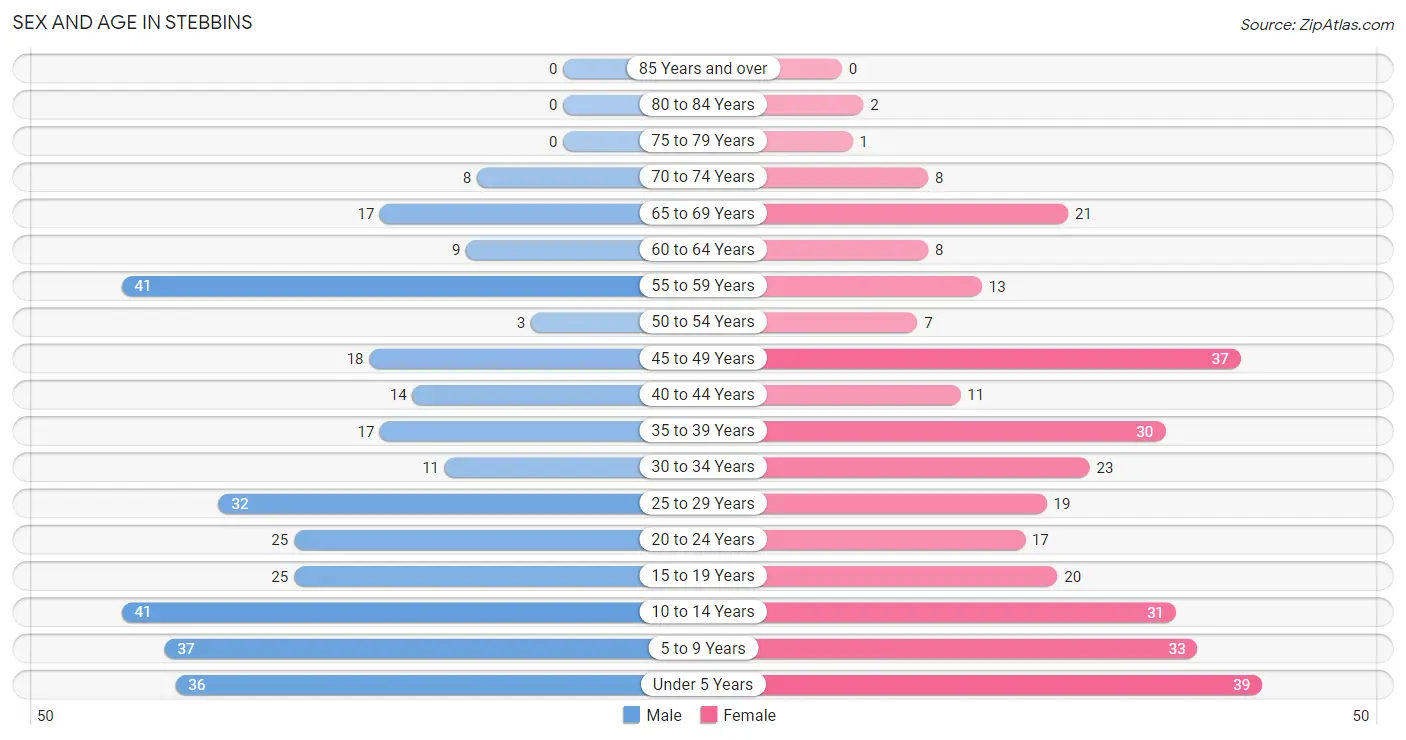
Sex and Age in Stebbins
Sex and Age in Stebbins
The most populous age groups in Stebbins are 10 to 14 Years (41 | 12.3%) for men and Under 5 Years (39 | 12.2%) for women.
| Age Bracket | Male | Female |
| Under 5 Years | 36 (10.8%) | 39 (12.2%) |
| 5 to 9 Years | 37 (11.1%) | 33 (10.3%) |
| 10 to 14 Years | 41 (12.3%) | 31 (9.7%) |
| 15 to 19 Years | 25 (7.5%) | 20 (6.2%) |
| 20 to 24 Years | 25 (7.5%) | 17 (5.3%) |
| 25 to 29 Years | 32 (9.6%) | 19 (5.9%) |
| 30 to 34 Years | 11 (3.3%) | 23 (7.2%) |
| 35 to 39 Years | 17 (5.1%) | 30 (9.4%) |
| 40 to 44 Years | 14 (4.2%) | 11 (3.4%) |
| 45 to 49 Years | 18 (5.4%) | 37 (11.6%) |
| 50 to 54 Years | 3 (0.9%) | 7 (2.2%) |
| 55 to 59 Years | 41 (12.3%) | 13 (4.1%) |
| 60 to 64 Years | 9 (2.7%) | 8 (2.5%) |
| 65 to 69 Years | 17 (5.1%) | 21 (6.6%) |
| 70 to 74 Years | 8 (2.4%) | 8 (2.5%) |
| 75 to 79 Years | 0 (0.0%) | 1 (0.3%) |
| 80 to 84 Years | 0 (0.0%) | 2 (0.6%) |
| 85 Years and over | 0 (0.0%) | 0 (0.0%) |
| Total | 334 (100.0%) | 320 (100.0%) |
Families and Households in Stebbins
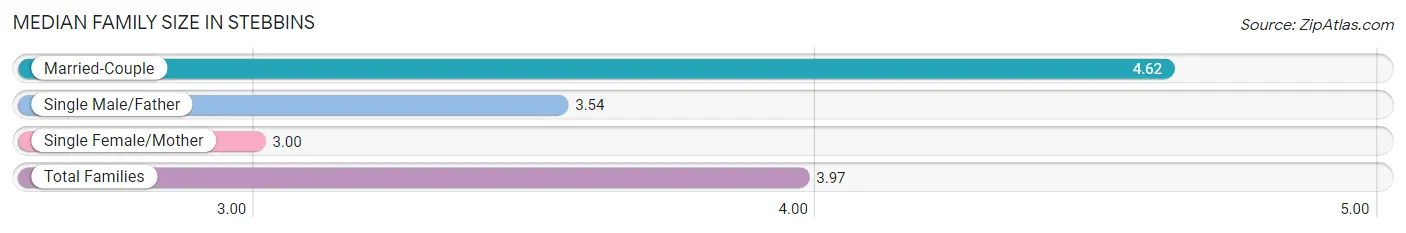
Median Family Size in Stebbins
The median family size in Stebbins is 3.97 persons per family, with married-couple families (74 | 54.0%) accounting for the largest median family size of 4.62 persons per family. On the other hand, single female/mother families (39 | 28.5%) represent the smallest median family size with 3.00 persons per family.
| Family Type | # Families | Family Size |
| Married-Couple | 74 (54.0%) | 4.62 |
| Single Male/Father | 24 (17.5%) | 3.54 |
| Single Female/Mother | 39 (28.5%) | 3.00 |
| Total Families | 137 (100.0%) | 3.97 |
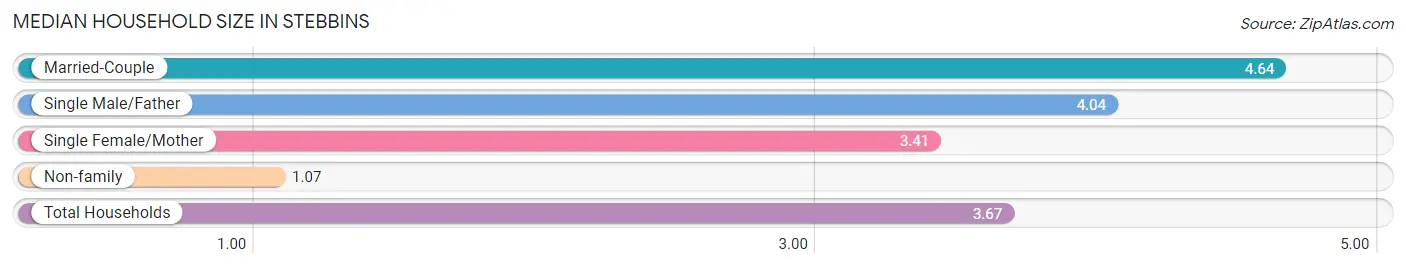
Median Household Size in Stebbins
The median household size in Stebbins is 3.67 persons per household, with married-couple households (74 | 45.1%) accounting for the largest median household size of 4.64 persons per household. non-family households (27 | 16.5%) represent the smallest median household size with 1.07 persons per household.
| Household Type | # Households | Household Size |
| Married-Couple | 74 (45.1%) | 4.64 |
| Single Male/Father | 24 (14.6%) | 4.04 |
| Single Female/Mother | 39 (23.8%) | 3.41 |
| Non-family | 27 (16.5%) | 1.07 |
| Total Households | 164 (100.0%) | 3.67 |
Household Size by Marriage Status in Stebbins
Out of a total of 164 households in Stebbins, 137 (83.5%) are family households, while 27 (16.5%) are nonfamily households. The most numerous type of family households are 7+ person households, comprising 38, and the most common type of nonfamily households are 1-person households, comprising 23.
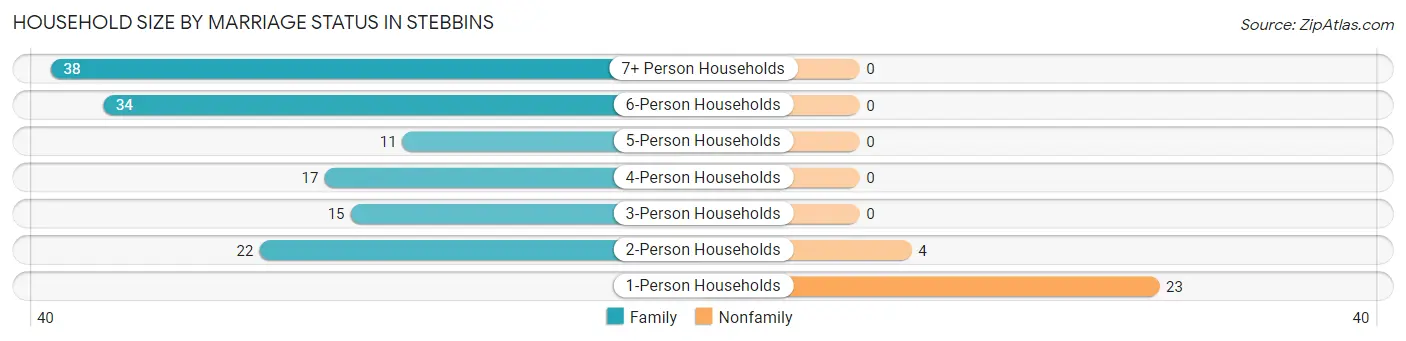
| Household Size | Family Households | Nonfamily Households |
| 1-Person Households | - | 23 (14.0%) |
| 2-Person Households | 22 (13.4%) | 4 (2.4%) |
| 3-Person Households | 15 (9.1%) | 0 (0.0%) |
| 4-Person Households | 17 (10.4%) | 0 (0.0%) |
| 5-Person Households | 11 (6.7%) | 0 (0.0%) |
| 6-Person Households | 34 (20.7%) | 0 (0.0%) |
| 7+ Person Households | 38 (23.2%) | 0 (0.0%) |
| Total | 137 (83.5%) | 27 (16.5%) |
Female Fertility in Stebbins
Fertility by Age in Stebbins
Average fertility rate in Stebbins is 140.0 births per 1,000 women. Women in the age bracket of 15 to 19 years have the highest fertility rate with 400.0 births per 1,000 women. Women in the age bracket of 20 to 34 years acount for 63.6% of all women with births.
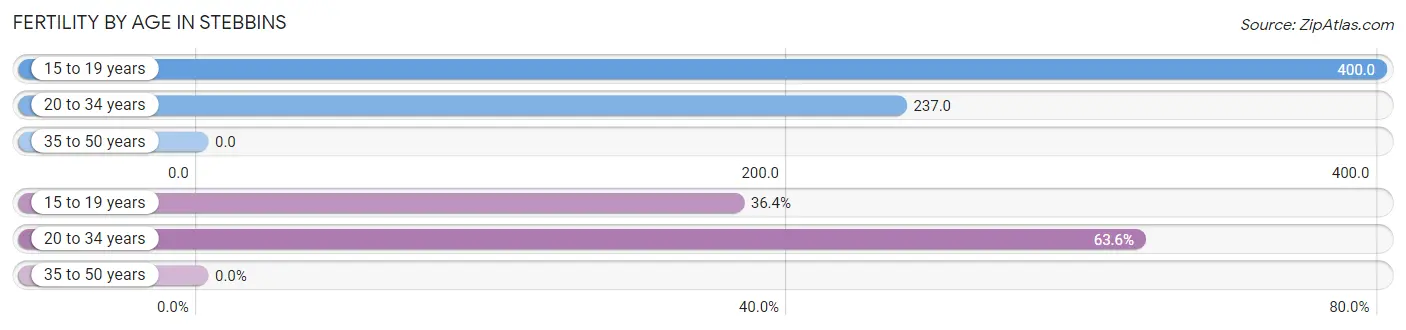
| Age Bracket | Women with Births | Births / 1,000 Women |
| 15 to 19 years | 8 (36.4%) | 400.0 |
| 20 to 34 years | 14 (63.6%) | 237.0 |
| 35 to 50 years | 0 (0.0%) | 0.0 |
| Total | 22 (100.0%) | 140.0 |
Fertility by Age by Marriage Status in Stebbins
27.3% of women with births (22) in Stebbins are married. The highest percentage of unmarried women with births falls into 15 to 19 years age bracket with 100.0% of them unmarried at the time of birth, while the lowest percentage of unmarried women with births belong to 20 to 34 years age bracket with 57.1% of them unmarried.
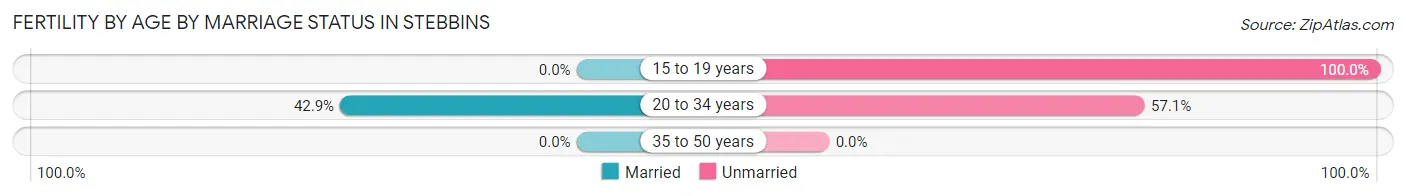
| Age Bracket | Married | Unmarried |
| 15 to 19 years | 0 (0.0%) | 8 (100.0%) |
| 20 to 34 years | 6 (42.9%) | 8 (57.1%) |
| 35 to 50 years | 0 (0.0%) | 0 (0.0%) |
| Total | 6 (27.3%) | 16 (72.7%) |
Fertility by Education in Stebbins
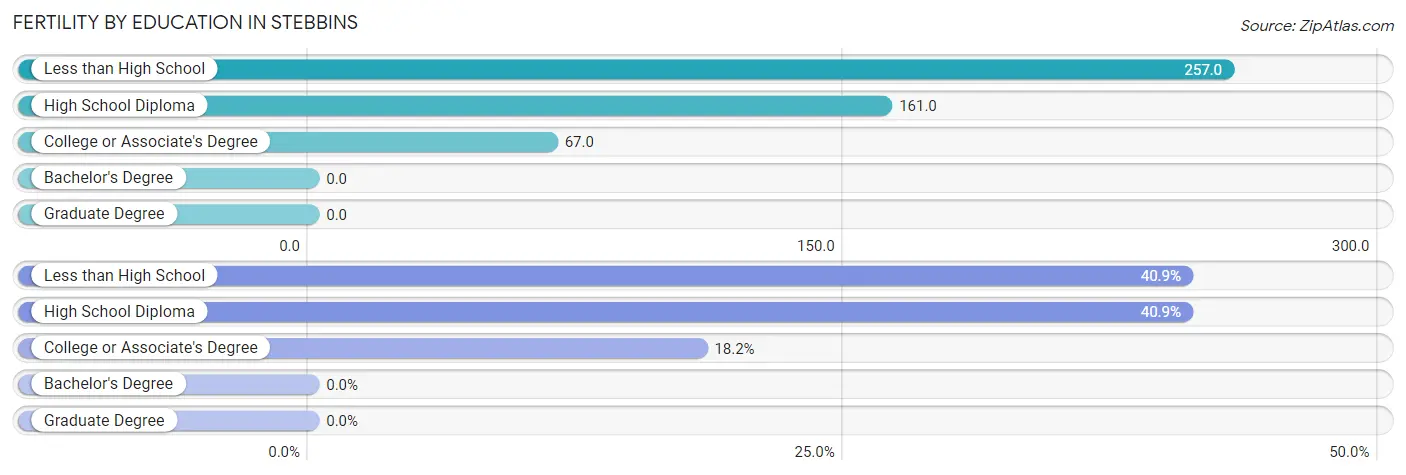
| Educational Attainment | Women with Births | Births / 1,000 Women |
| Less than High School | 9 (40.9%) | 257.0 |
| High School Diploma | 9 (40.9%) | 161.0 |
| College or Associate's Degree | 4 (18.2%) | 67.0 |
| Bachelor's Degree | 0 (0.0%) | 0.0 |
| Graduate Degree | 0 (0.0%) | 0.0 |
| Total | 22 (100.0%) | 140.0 |
Fertility by Education by Marriage Status in Stebbins
72.7% of women with births in Stebbins are unmarried. Women with the educational attainment of college or associate's degree are most likely to be married with 100.0% of them married at childbirth, while women with the educational attainment of less than high school are least likely to be married with 100.0% of them unmarried at childbirth.
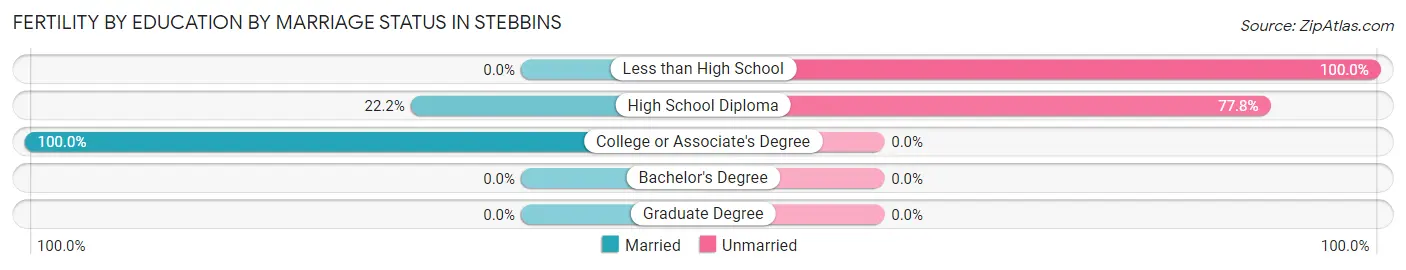
| Educational Attainment | Married | Unmarried |
| Less than High School | 0 (0.0%) | 9 (100.0%) |
| High School Diploma | 2 (22.2%) | 7 (77.8%) |
| College or Associate's Degree | 4 (100.0%) | 0 (0.0%) |
| Bachelor's Degree | 0 (0.0%) | 0 (0.0%) |
| Graduate Degree | 0 (0.0%) | 0 (0.0%) |
| Total | 6 (27.3%) | 16 (72.7%) |
Employment Characteristics in Stebbins
Employment by Class of Employer in Stebbins
Among the 187 employed individuals in Stebbins, state government employees (83 | 44.4%), local government employees (55 | 29.4%), and private company employees (24 | 12.8%) make up the most common classes of employment.
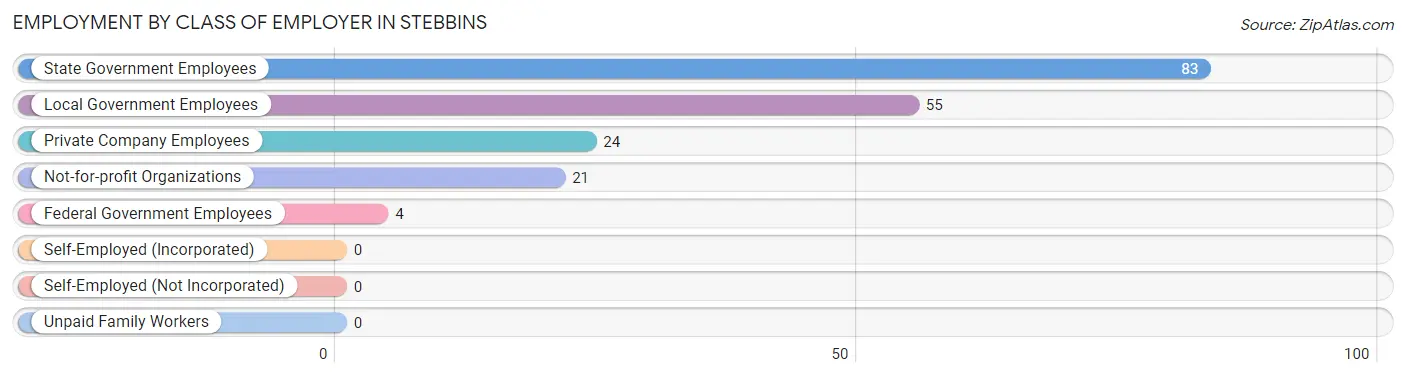
| Employer Class | # Employees | % Employees |
| Private Company Employees | 24 | 12.8% |
| Self-Employed (Incorporated) | 0 | 0.0% |
| Self-Employed (Not Incorporated) | 0 | 0.0% |
| Not-for-profit Organizations | 21 | 11.2% |
| Local Government Employees | 55 | 29.4% |
| State Government Employees | 83 | 44.4% |
| Federal Government Employees | 4 | 2.1% |
| Unpaid Family Workers | 0 | 0.0% |
| Total | 187 | 100.0% |
Employment Status by Age in Stebbins
According to the labor force statistics for Stebbins, out of the total population over 16 years of age (428), 62.1% or 266 individuals are in the labor force, with 27.4% or 73 of them unemployed. The age group with the highest labor force participation rate is 45 to 54 years, with 92.3% or 60 individuals in the labor force. Within the labor force, the 60 to 64 years age range has the highest percentage of unemployed individuals, with 50.0% or 4 of them being unemployed.
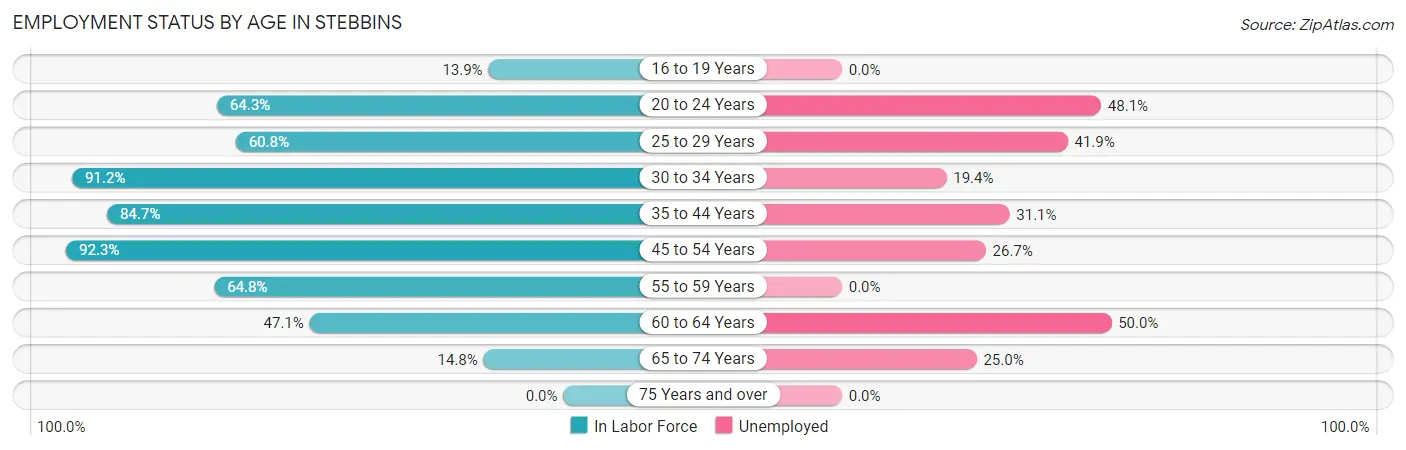
| Age Bracket | In Labor Force | Unemployed |
| 16 to 19 Years | 5 (13.9%) | 0 (0.0%) |
| 20 to 24 Years | 27 (64.3%) | 13 (48.1%) |
| 25 to 29 Years | 31 (60.8%) | 13 (41.9%) |
| 30 to 34 Years | 31 (91.2%) | 6 (19.4%) |
| 35 to 44 Years | 61 (84.7%) | 19 (31.1%) |
| 45 to 54 Years | 60 (92.3%) | 16 (26.7%) |
| 55 to 59 Years | 35 (64.8%) | 0 (0.0%) |
| 60 to 64 Years | 8 (47.1%) | 4 (50.0%) |
| 65 to 74 Years | 8 (14.8%) | 2 (25.0%) |
| 75 Years and over | 0 (0.0%) | 0 (0.0%) |
| Total | 266 (62.1%) | 73 (27.4%) |
Employment Status by Educational Attainment in Stebbins
According to labor force statistics for Stebbins, 77.1% of individuals (226) out of the total population between 25 and 64 years of age (293) are in the labor force, with 25.7% or 58 of them being unemployed. The group with the highest labor force participation rate are those with the educational attainment of bachelor's degree or higher, with 100.0% or 40 individuals in the labor force. Within the labor force, individuals with less than high school education have the highest percentage of unemployment, with 50.0% or 11 of them being unemployed.
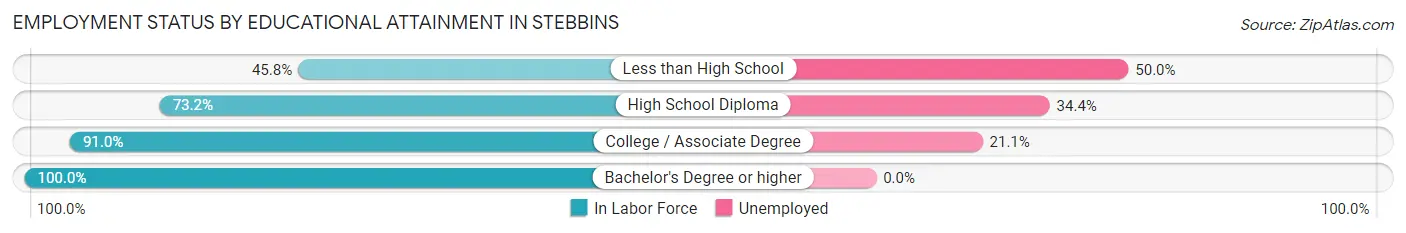
| Educational Attainment | In Labor Force | Unemployed |
| Less than High School | 22 (45.8%) | 24 (50.0%) |
| High School Diploma | 93 (73.2%) | 44 (34.4%) |
| College / Associate Degree | 71 (91.0%) | 16 (21.1%) |
| Bachelor's Degree or higher | 40 (100.0%) | 0 (0.0%) |
| Total | 226 (77.1%) | 75 (25.7%) |
Employment Occupations by Sex in Stebbins
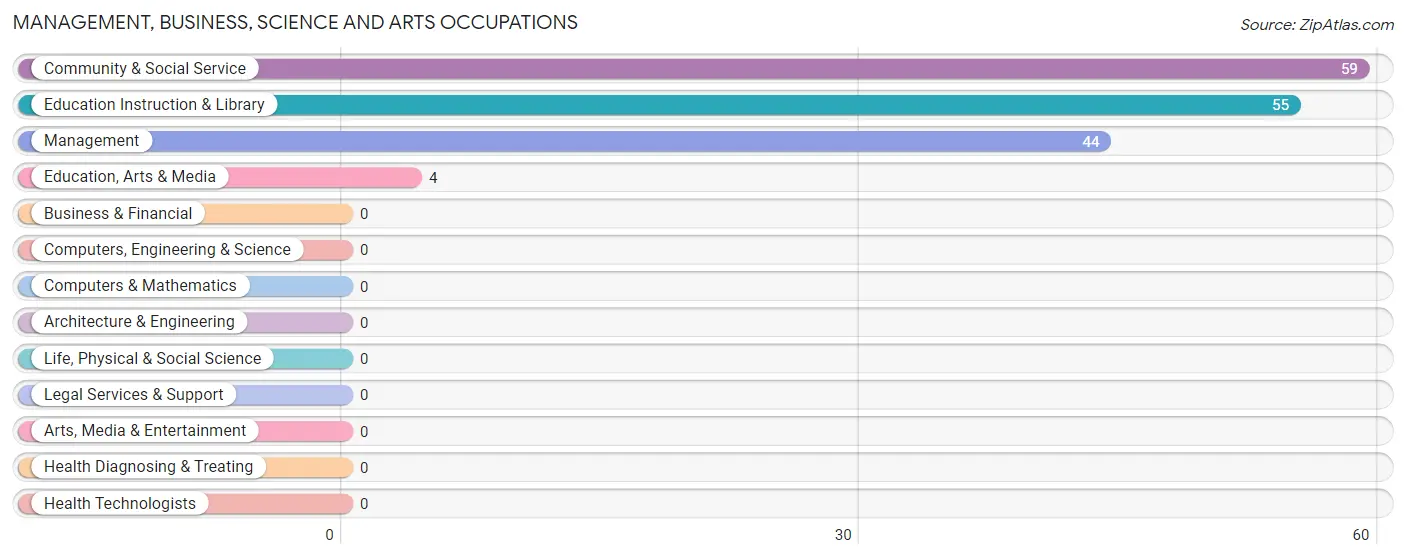
Management, Business, Science and Arts Occupations
The most common Management, Business, Science and Arts occupations in Stebbins are Community & Social Service (59 | 30.6%), Education Instruction & Library (55 | 28.5%), Management (44 | 22.8%), and Education, Arts & Media (4 | 2.1%).
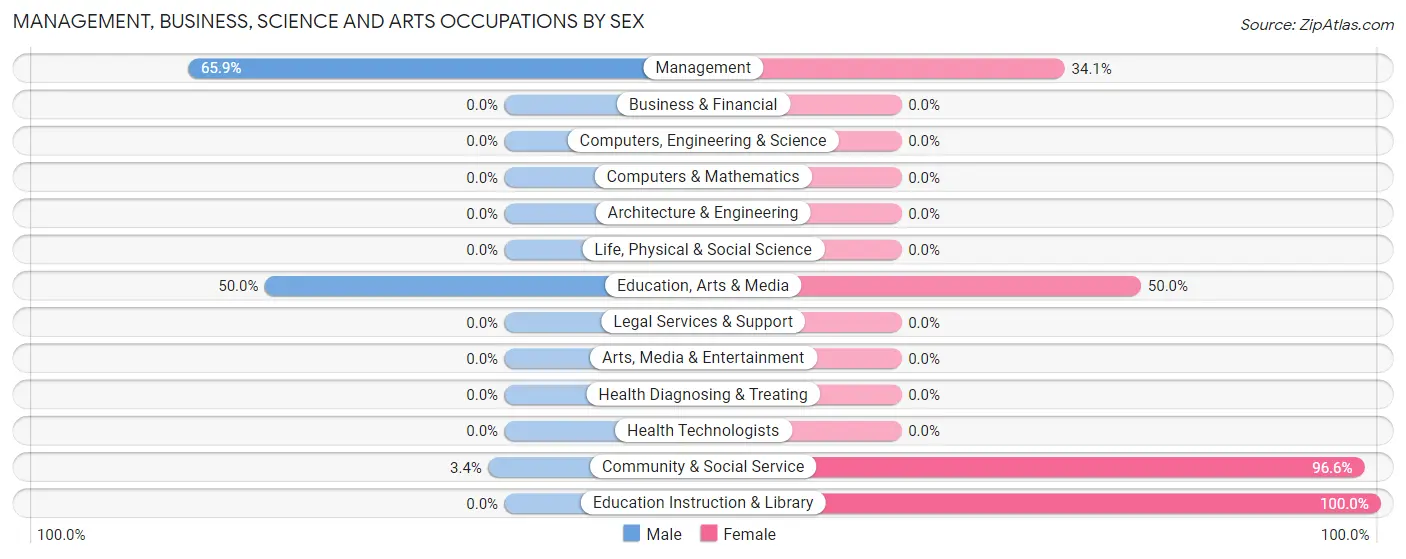
Management, Business, Science and Arts Occupations by Sex
Within the Management, Business, Science and Arts occupations in Stebbins, the most male-oriented occupations are Management (65.9%), Education, Arts & Media (50.0%), and Community & Social Service (3.4%), while the most female-oriented occupations are Education Instruction & Library (100.0%), Community & Social Service (96.6%), and Education, Arts & Media (50.0%).
| Occupation | Male | Female |
| Management | 29 (65.9%) | 15 (34.1%) |
| Business & Financial | 0 (0.0%) | 0 (0.0%) |
| Computers, Engineering & Science | 0 (0.0%) | 0 (0.0%) |
| Computers & Mathematics | 0 (0.0%) | 0 (0.0%) |
| Architecture & Engineering | 0 (0.0%) | 0 (0.0%) |
| Life, Physical & Social Science | 0 (0.0%) | 0 (0.0%) |
| Community & Social Service | 2 (3.4%) | 57 (96.6%) |
| Education, Arts & Media | 2 (50.0%) | 2 (50.0%) |
| Legal Services & Support | 0 (0.0%) | 0 (0.0%) |
| Education Instruction & Library | 0 (0.0%) | 55 (100.0%) |
| Arts, Media & Entertainment | 0 (0.0%) | 0 (0.0%) |
| Health Diagnosing & Treating | 0 (0.0%) | 0 (0.0%) |
| Health Technologists | 0 (0.0%) | 0 (0.0%) |
| Total (Category) | 31 (30.1%) | 72 (69.9%) |
| Total (Overall) | 79 (40.9%) | 114 (59.1%) |
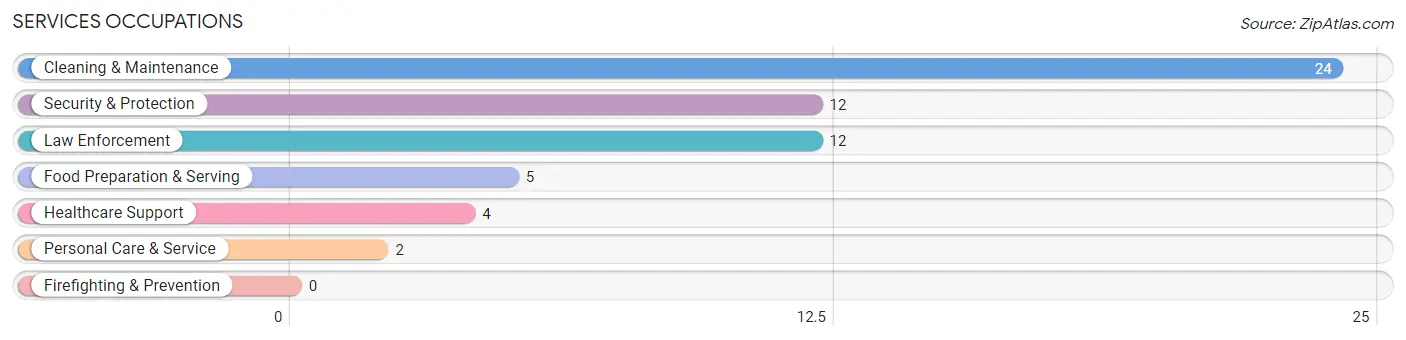
Services Occupations
The most common Services occupations in Stebbins are Cleaning & Maintenance (24 | 12.4%), Security & Protection (12 | 6.2%), Law Enforcement (12 | 6.2%), Food Preparation & Serving (5 | 2.6%), and Healthcare Support (4 | 2.1%).
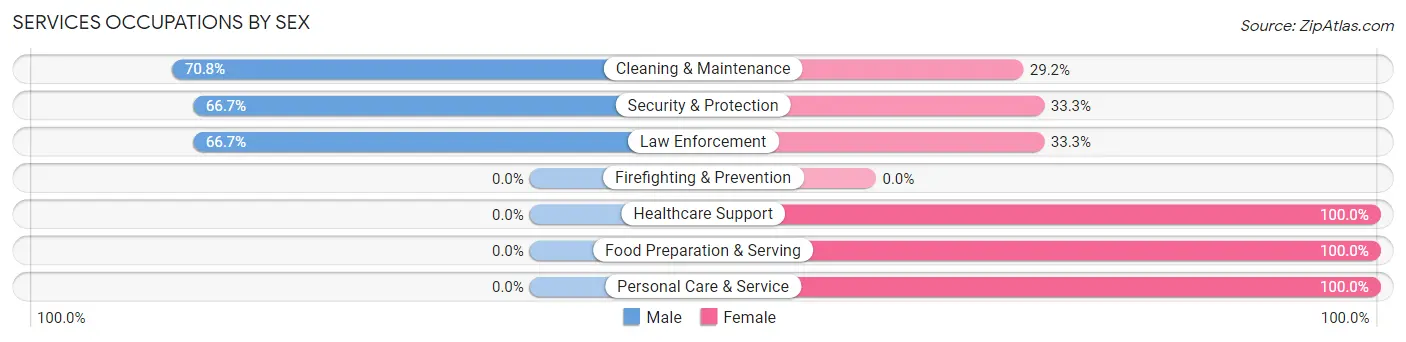
Services Occupations by Sex
Within the Services occupations in Stebbins, the most male-oriented occupations are Cleaning & Maintenance (70.8%), Security & Protection (66.7%), and Law Enforcement (66.7%), while the most female-oriented occupations are Healthcare Support (100.0%), Food Preparation & Serving (100.0%), and Personal Care & Service (100.0%).
| Occupation | Male | Female |
| Healthcare Support | 0 (0.0%) | 4 (100.0%) |
| Security & Protection | 8 (66.7%) | 4 (33.3%) |
| Firefighting & Prevention | 0 (0.0%) | 0 (0.0%) |
| Law Enforcement | 8 (66.7%) | 4 (33.3%) |
| Food Preparation & Serving | 0 (0.0%) | 5 (100.0%) |
| Cleaning & Maintenance | 17 (70.8%) | 7 (29.2%) |
| Personal Care & Service | 0 (0.0%) | 2 (100.0%) |
| Total (Category) | 25 (53.2%) | 22 (46.8%) |
| Total (Overall) | 79 (40.9%) | 114 (59.1%) |
Sales and Office Occupations
The most common Sales and Office occupations in Stebbins are Sales & Related (16 | 8.3%), and Office & Administration (10 | 5.2%).
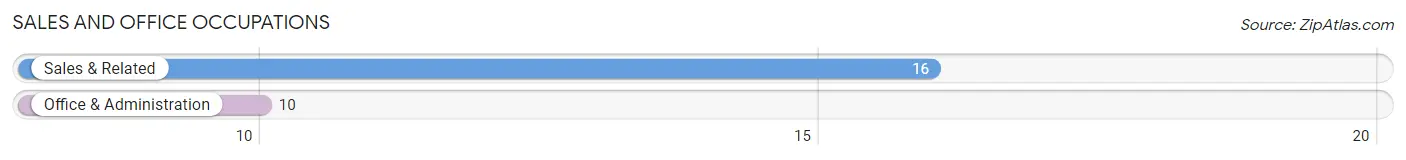
Sales and Office Occupations by Sex
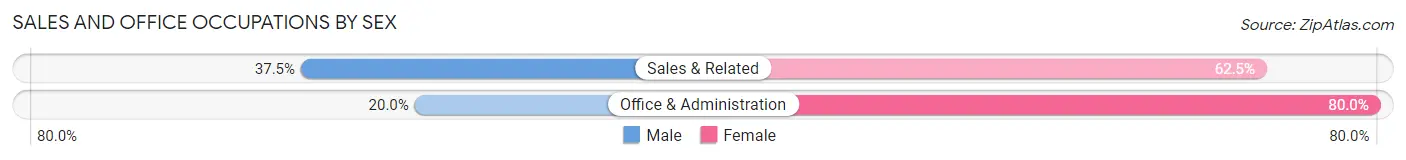
| Occupation | Male | Female |
| Sales & Related | 6 (37.5%) | 10 (62.5%) |
| Office & Administration | 2 (20.0%) | 8 (80.0%) |
| Total (Category) | 8 (30.8%) | 18 (69.2%) |
| Total (Overall) | 79 (40.9%) | 114 (59.1%) |
Natural Resources, Construction and Maintenance Occupations
The most common Natural Resources, Construction and Maintenance occupations in Stebbins are , and Construction & Extraction (4 | 2.1%).
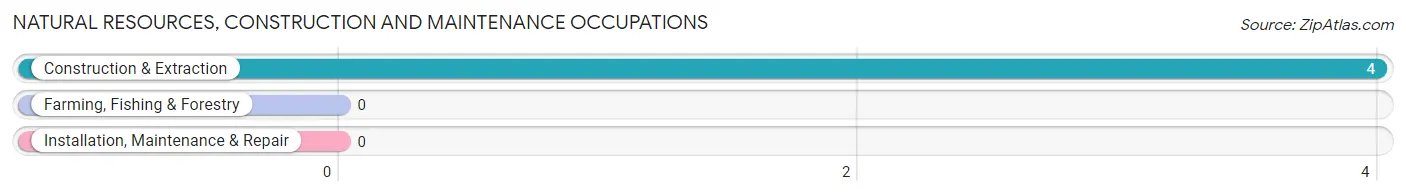
Natural Resources, Construction and Maintenance Occupations by Sex
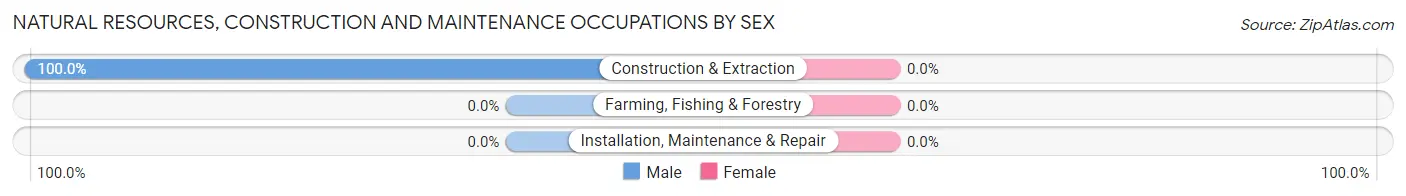
| Occupation | Male | Female |
| Farming, Fishing & Forestry | 0 (0.0%) | 0 (0.0%) |
| Construction & Extraction | 4 (100.0%) | 0 (0.0%) |
| Installation, Maintenance & Repair | 0 (0.0%) | 0 (0.0%) |
| Total (Category) | 4 (100.0%) | 0 (0.0%) |
| Total (Overall) | 79 (40.9%) | 114 (59.1%) |
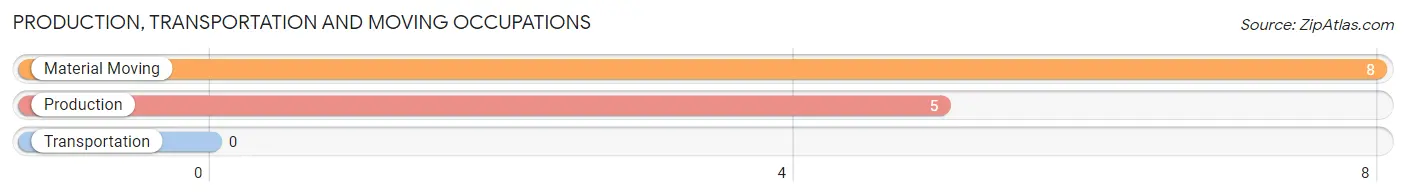
Production, Transportation and Moving Occupations
The most common Production, Transportation and Moving occupations in Stebbins are Material Moving (8 | 4.2%), and Production (5 | 2.6%).
Production, Transportation and Moving Occupations by Sex
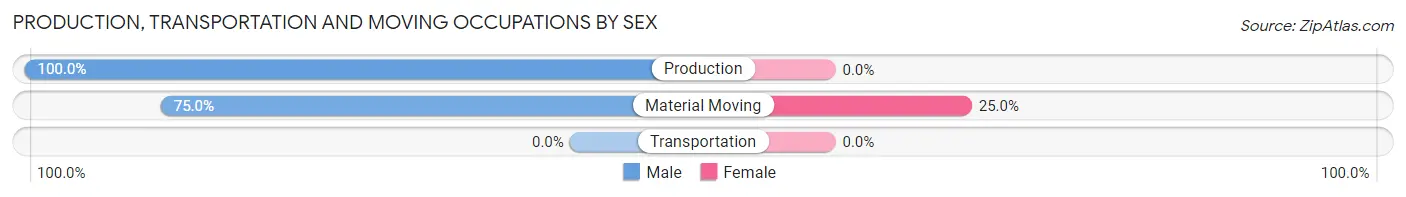
| Occupation | Male | Female |
| Production | 5 (100.0%) | 0 (0.0%) |
| Transportation | 0 (0.0%) | 0 (0.0%) |
| Material Moving | 6 (75.0%) | 2 (25.0%) |
| Total (Category) | 11 (84.6%) | 2 (15.4%) |
| Total (Overall) | 79 (40.9%) | 114 (59.1%) |
Employment Industries by Sex in Stebbins
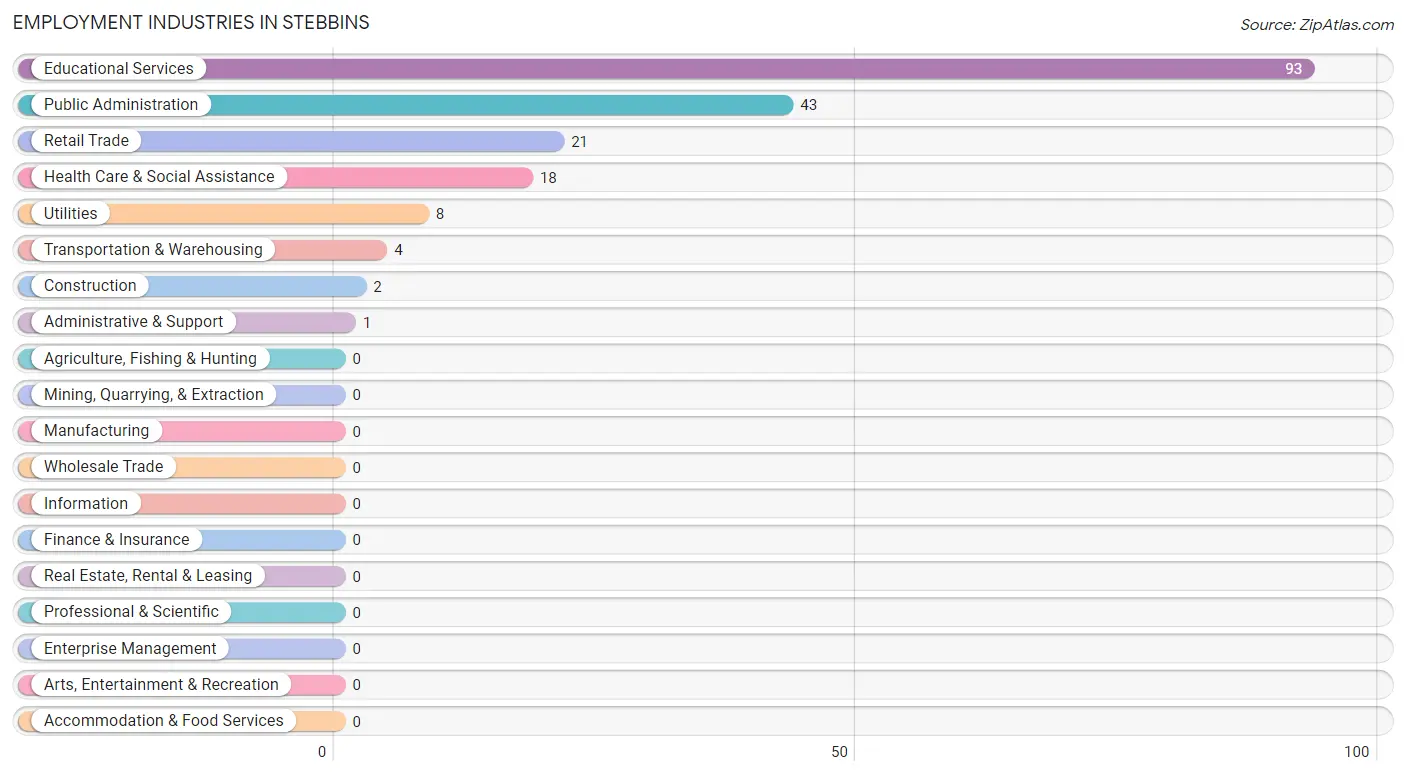
Employment Industries in Stebbins
The major employment industries in Stebbins include Educational Services (93 | 48.2%), Public Administration (43 | 22.3%), Retail Trade (21 | 10.9%), Health Care & Social Assistance (18 | 9.3%), and Utilities (8 | 4.2%).
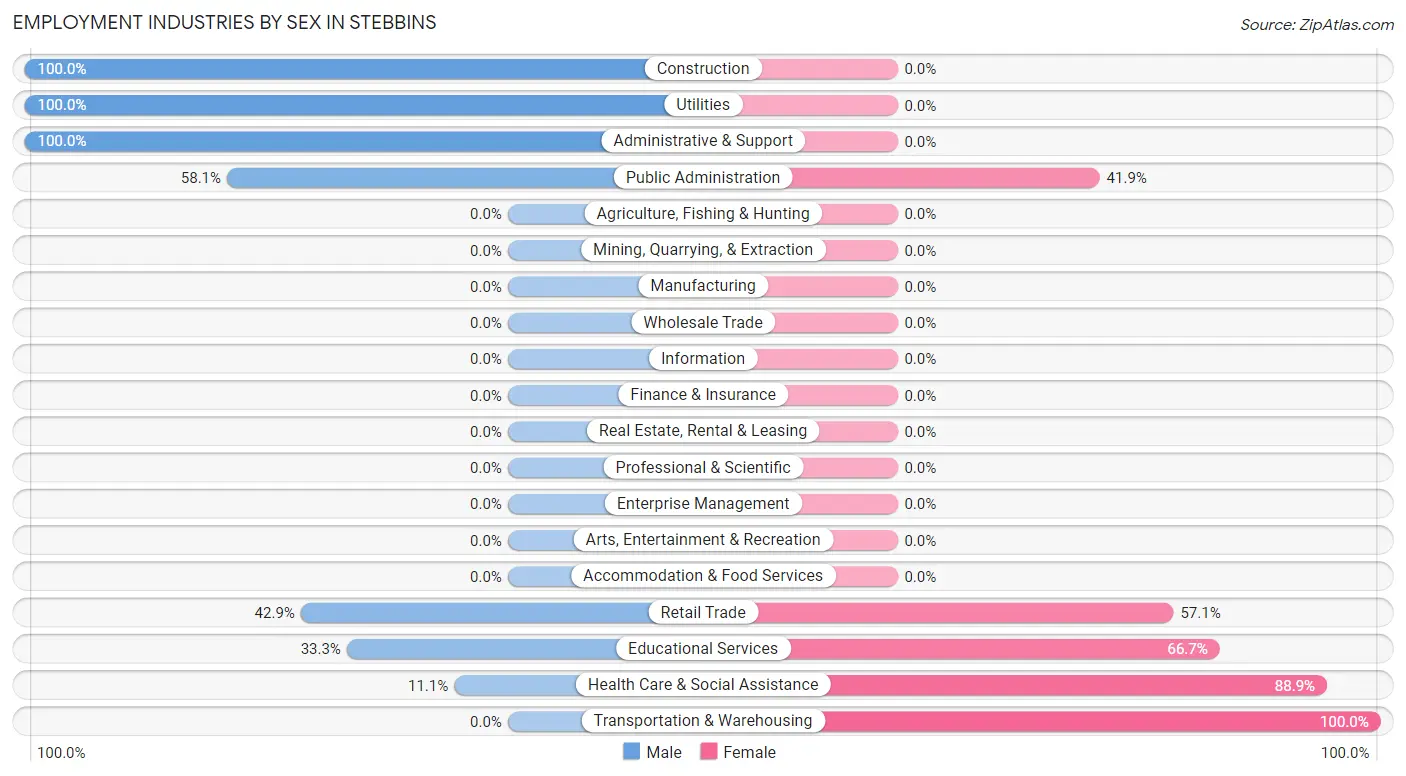
Employment Industries by Sex in Stebbins
The Stebbins industries that see more men than women are Construction (100.0%), Utilities (100.0%), and Administrative & Support (100.0%), whereas the industries that tend to have a higher number of women are Transportation & Warehousing (100.0%), Health Care & Social Assistance (88.9%), and Educational Services (66.7%).
| Industry | Male | Female |
| Agriculture, Fishing & Hunting | 0 (0.0%) | 0 (0.0%) |
| Mining, Quarrying, & Extraction | 0 (0.0%) | 0 (0.0%) |
| Construction | 2 (100.0%) | 0 (0.0%) |
| Manufacturing | 0 (0.0%) | 0 (0.0%) |
| Wholesale Trade | 0 (0.0%) | 0 (0.0%) |
| Retail Trade | 9 (42.9%) | 12 (57.1%) |
| Transportation & Warehousing | 0 (0.0%) | 4 (100.0%) |
| Utilities | 8 (100.0%) | 0 (0.0%) |
| Information | 0 (0.0%) | 0 (0.0%) |
| Finance & Insurance | 0 (0.0%) | 0 (0.0%) |
| Real Estate, Rental & Leasing | 0 (0.0%) | 0 (0.0%) |
| Professional & Scientific | 0 (0.0%) | 0 (0.0%) |
| Enterprise Management | 0 (0.0%) | 0 (0.0%) |
| Administrative & Support | 1 (100.0%) | 0 (0.0%) |
| Educational Services | 31 (33.3%) | 62 (66.7%) |
| Health Care & Social Assistance | 2 (11.1%) | 16 (88.9%) |
| Arts, Entertainment & Recreation | 0 (0.0%) | 0 (0.0%) |
| Accommodation & Food Services | 0 (0.0%) | 0 (0.0%) |
| Public Administration | 25 (58.1%) | 18 (41.9%) |
| Total | 79 (40.9%) | 114 (59.1%) |
Education in Stebbins
School Enrollment in Stebbins
The most common levels of schooling among the 188 students in Stebbins are elementary school (63 | 33.5%), middle school (63 | 33.5%), and high school (42 | 22.3%).
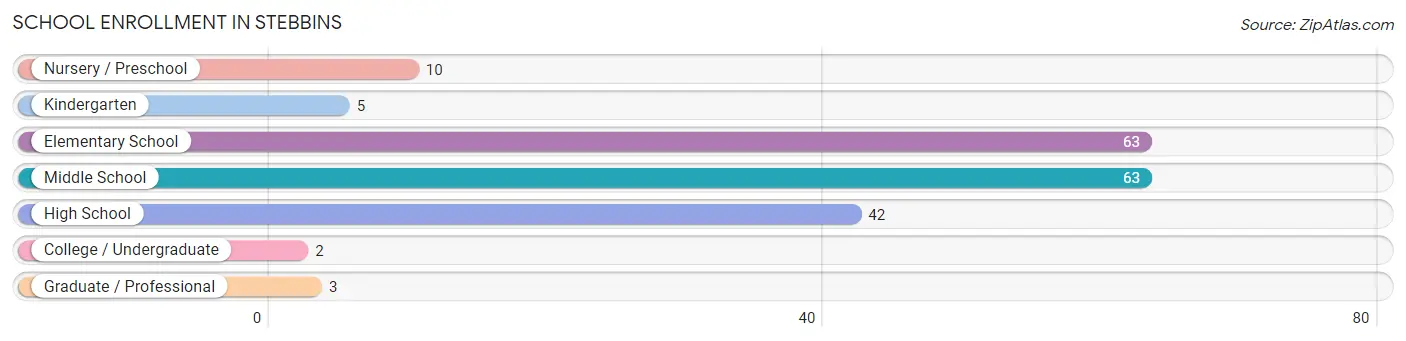
| School Level | # Students | % Students |
| Nursery / Preschool | 10 | 5.3% |
| Kindergarten | 5 | 2.7% |
| Elementary School | 63 | 33.5% |
| Middle School | 63 | 33.5% |
| High School | 42 | 22.3% |
| College / Undergraduate | 2 | 1.1% |
| Graduate / Professional | 3 | 1.6% |
| Total | 188 | 100.0% |
School Enrollment by Age by Funding Source in Stebbins
Out of a total of 188 students who are enrolled in schools in Stebbins, 2 (1.1%) attend a private institution, while the remaining 186 (98.9%) are enrolled in public schools. The age group of 15 to 17 year olds has the highest likelihood of being enrolled in private schools, with 2 (6.9% in the age bracket) enrolled. Conversely, the age group of 3 to 4 year olds has the lowest likelihood of being enrolled in a private school, with 10 (100.0% in the age bracket) attending a public institution.
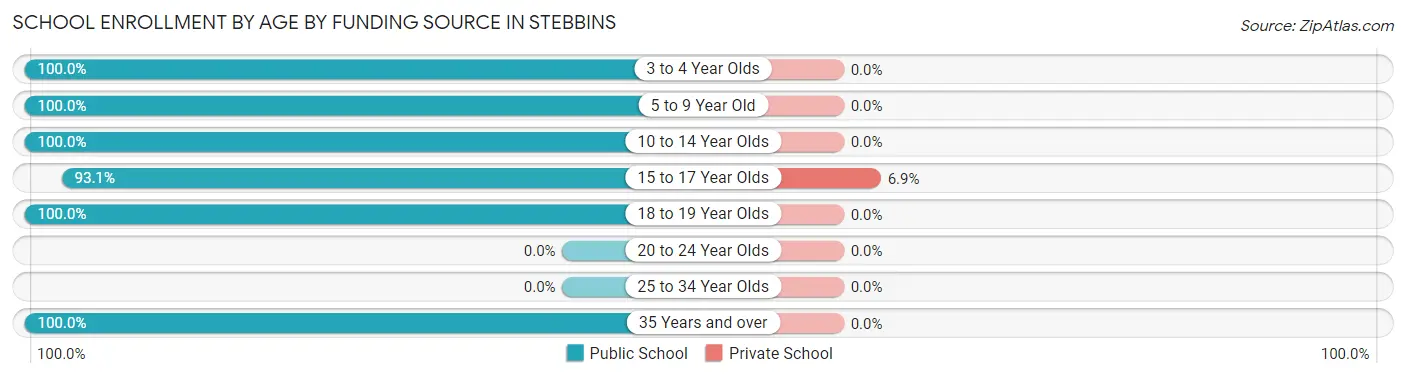
| Age Bracket | Public School | Private School |
| 3 to 4 Year Olds | 10 (100.0%) | 0 (0.0%) |
| 5 to 9 Year Old | 68 (100.0%) | 0 (0.0%) |
| 10 to 14 Year Olds | 72 (100.0%) | 0 (0.0%) |
| 15 to 17 Year Olds | 27 (93.1%) | 2 (6.9%) |
| 18 to 19 Year Olds | 6 (100.0%) | 0 (0.0%) |
| 20 to 24 Year Olds | 0 (0.0%) | 0 (0.0%) |
| 25 to 34 Year Olds | 0 (0.0%) | 0 (0.0%) |
| 35 Years and over | 3 (100.0%) | 0 (0.0%) |
| Total | 186 (98.9%) | 2 (1.1%) |
Educational Attainment by Field of Study in Stebbins
Education (33 | 82.5%), business (6 | 15.0%), and liberal arts & history (1 | 2.5%) are the most common fields of study among 40 individuals in Stebbins who have obtained a bachelor's degree or higher.
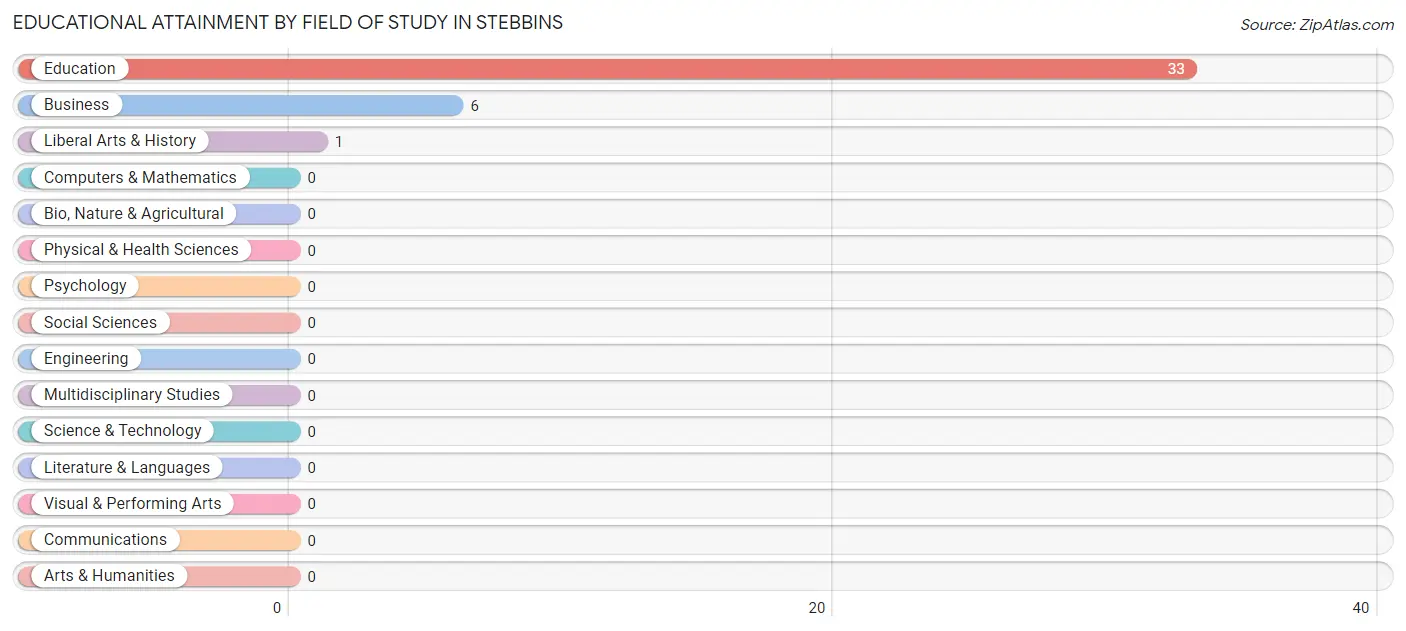
| Field of Study | # Graduates | % Graduates |
| Computers & Mathematics | 0 | 0.0% |
| Bio, Nature & Agricultural | 0 | 0.0% |
| Physical & Health Sciences | 0 | 0.0% |
| Psychology | 0 | 0.0% |
| Social Sciences | 0 | 0.0% |
| Engineering | 0 | 0.0% |
| Multidisciplinary Studies | 0 | 0.0% |
| Science & Technology | 0 | 0.0% |
| Business | 6 | 15.0% |
| Education | 33 | 82.5% |
| Literature & Languages | 0 | 0.0% |
| Liberal Arts & History | 1 | 2.5% |
| Visual & Performing Arts | 0 | 0.0% |
| Communications | 0 | 0.0% |
| Arts & Humanities | 0 | 0.0% |
| Total | 40 | 100.0% |
Transportation & Commute in Stebbins
Vehicle Availability by Sex in Stebbins
The most prevalent vehicle ownership categories in Stebbins are males with no vehicle (47, accounting for 100.0%) and females with no vehicle (71, making up 53.4%).
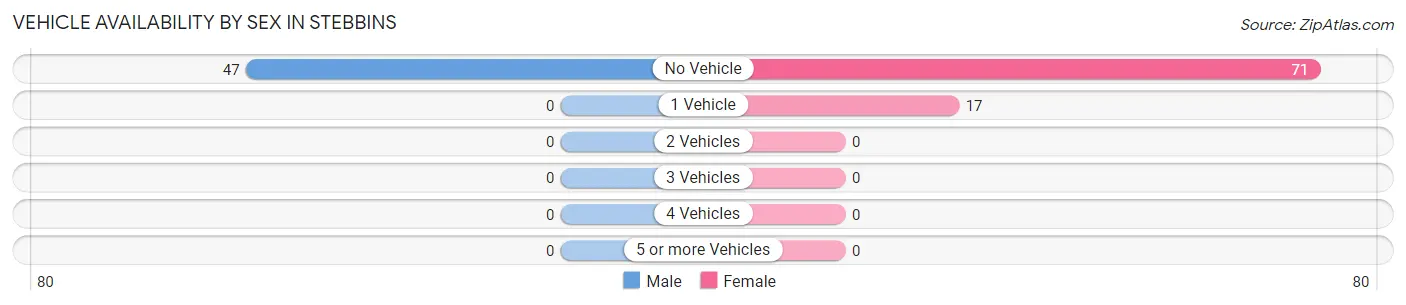
| Vehicles Available | Male | Female |
| No Vehicle | 47 (100.0%) | 71 (80.7%) |
| 1 Vehicle | 0 (0.0%) | 17 (19.3%) |
| 2 Vehicles | 0 (0.0%) | 0 (0.0%) |
| 3 Vehicles | 0 (0.0%) | 0 (0.0%) |
| 4 Vehicles | 0 (0.0%) | 0 (0.0%) |
| 5 or more Vehicles | 0 (0.0%) | 0 (0.0%) |
| Total | 47 (100.0%) | 88 (100.0%) |
Commute Time in Stebbins
The most frequently occuring commute durations in Stebbins are less than 5 minutes (134 commuters, 71.7%), 5 to 9 minutes (35 commuters, 18.7%), and 10 to 14 minutes (11 commuters, 5.9%).
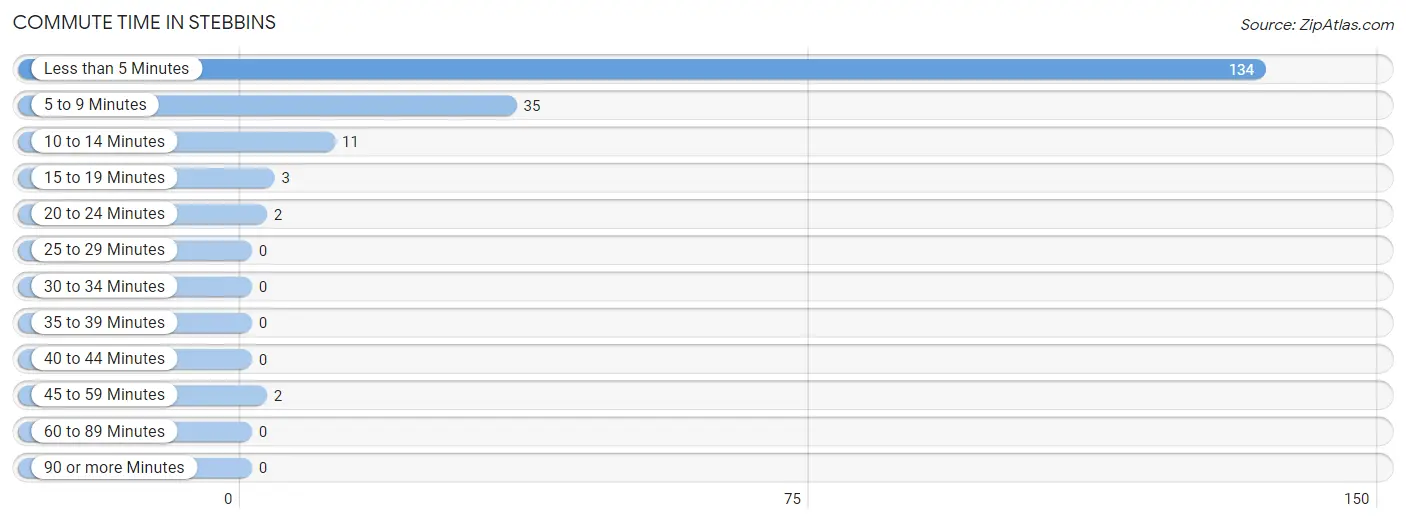
| Commute Time | # Commuters | % Commuters |
| Less than 5 Minutes | 134 | 71.7% |
| 5 to 9 Minutes | 35 | 18.7% |
| 10 to 14 Minutes | 11 | 5.9% |
| 15 to 19 Minutes | 3 | 1.6% |
| 20 to 24 Minutes | 2 | 1.1% |
| 25 to 29 Minutes | 0 | 0.0% |
| 30 to 34 Minutes | 0 | 0.0% |
| 35 to 39 Minutes | 0 | 0.0% |
| 40 to 44 Minutes | 0 | 0.0% |
| 45 to 59 Minutes | 2 | 1.1% |
| 60 to 89 Minutes | 0 | 0.0% |
| 90 or more Minutes | 0 | 0.0% |
Commute Time by Sex in Stebbins
The most common commute times in Stebbins are less than 5 minutes (59 commuters, 80.8%) for males and less than 5 minutes (75 commuters, 65.8%) for females.
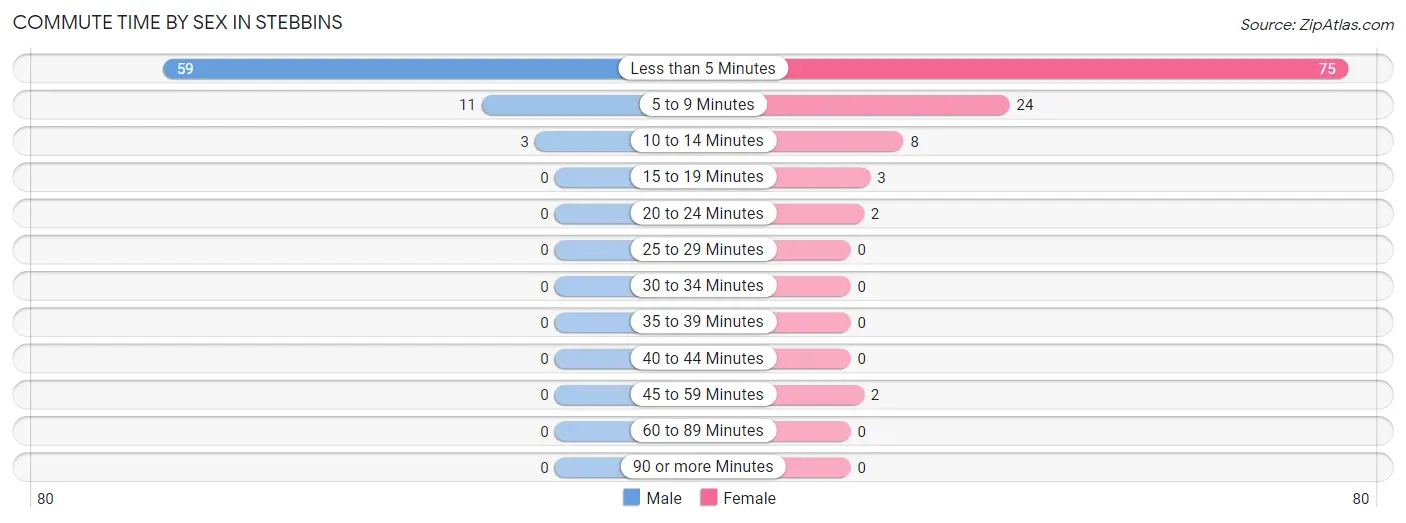
| Commute Time | Male | Female |
| Less than 5 Minutes | 59 (80.8%) | 75 (65.8%) |
| 5 to 9 Minutes | 11 (15.1%) | 24 (21.0%) |
| 10 to 14 Minutes | 3 (4.1%) | 8 (7.0%) |
| 15 to 19 Minutes | 0 (0.0%) | 3 (2.6%) |
| 20 to 24 Minutes | 0 (0.0%) | 2 (1.8%) |
| 25 to 29 Minutes | 0 (0.0%) | 0 (0.0%) |
| 30 to 34 Minutes | 0 (0.0%) | 0 (0.0%) |
| 35 to 39 Minutes | 0 (0.0%) | 0 (0.0%) |
| 40 to 44 Minutes | 0 (0.0%) | 0 (0.0%) |
| 45 to 59 Minutes | 0 (0.0%) | 2 (1.8%) |
| 60 to 89 Minutes | 0 (0.0%) | 0 (0.0%) |
| 90 or more Minutes | 0 (0.0%) | 0 (0.0%) |
Time of Departure to Work by Sex in Stebbins
The most frequent times of departure to work in Stebbins are 7:30 AM to 7:59 AM (27, 37.0%) for males and 11:00 AM to 11:59 AM (32, 28.1%) for females.
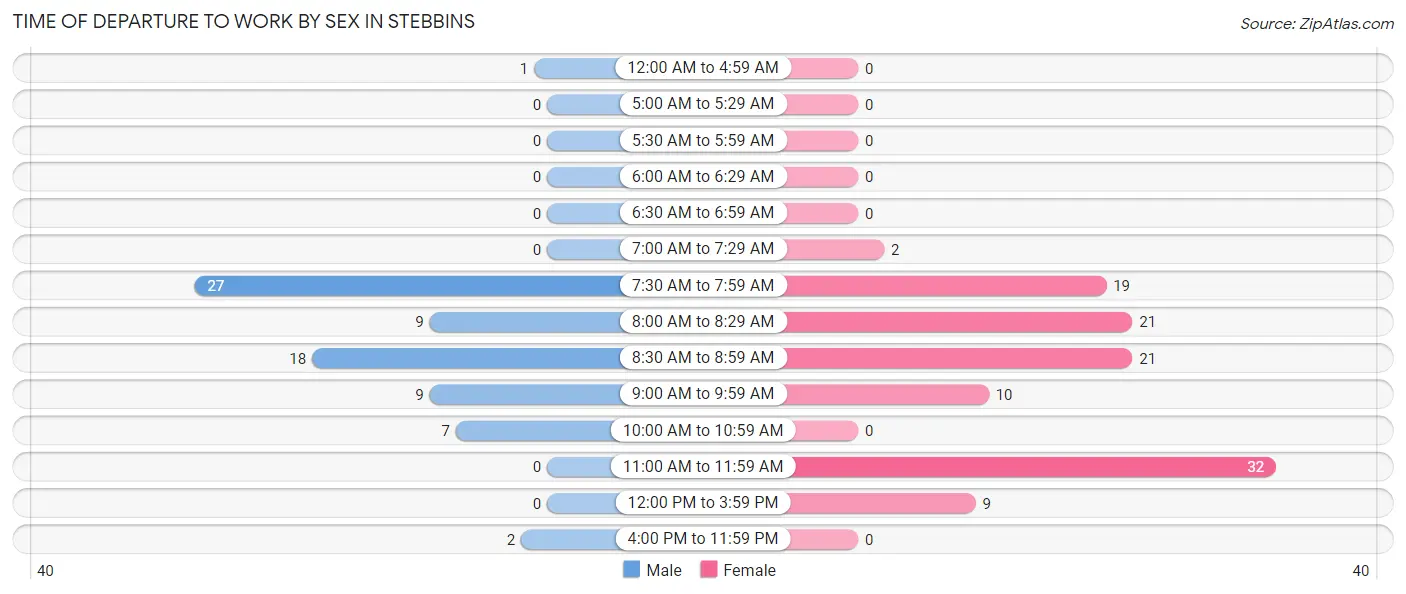
| Time of Departure | Male | Female |
| 12:00 AM to 4:59 AM | 1 (1.4%) | 0 (0.0%) |
| 5:00 AM to 5:29 AM | 0 (0.0%) | 0 (0.0%) |
| 5:30 AM to 5:59 AM | 0 (0.0%) | 0 (0.0%) |
| 6:00 AM to 6:29 AM | 0 (0.0%) | 0 (0.0%) |
| 6:30 AM to 6:59 AM | 0 (0.0%) | 0 (0.0%) |
| 7:00 AM to 7:29 AM | 0 (0.0%) | 2 (1.8%) |
| 7:30 AM to 7:59 AM | 27 (37.0%) | 19 (16.7%) |
| 8:00 AM to 8:29 AM | 9 (12.3%) | 21 (18.4%) |
| 8:30 AM to 8:59 AM | 18 (24.7%) | 21 (18.4%) |
| 9:00 AM to 9:59 AM | 9 (12.3%) | 10 (8.8%) |
| 10:00 AM to 10:59 AM | 7 (9.6%) | 0 (0.0%) |
| 11:00 AM to 11:59 AM | 0 (0.0%) | 32 (28.1%) |
| 12:00 PM to 3:59 PM | 0 (0.0%) | 9 (7.9%) |
| 4:00 PM to 11:59 PM | 2 (2.7%) | 0 (0.0%) |
| Total | 73 (100.0%) | 114 (100.0%) |
Housing Occupancy in Stebbins
Occupancy by Ownership in Stebbins
Of the total 164 dwellings in Stebbins, owner-occupied units account for 120 (73.2%), while renter-occupied units make up 44 (26.8%).
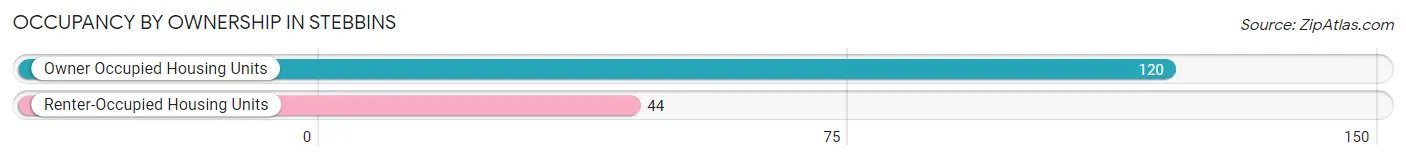
| Occupancy | # Housing Units | % Housing Units |
| Owner Occupied Housing Units | 120 | 73.2% |
| Renter-Occupied Housing Units | 44 | 26.8% |
| Total Occupied Housing Units | 164 | 100.0% |
Occupancy by Household Size in Stebbins
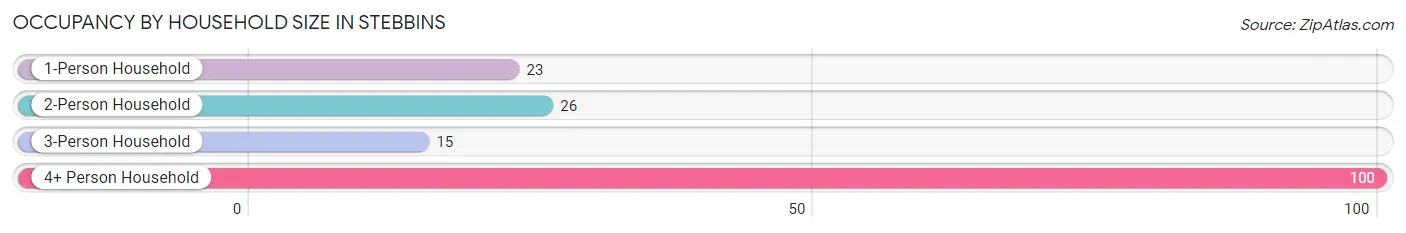
| Household Size | # Housing Units | % Housing Units |
| 1-Person Household | 23 | 14.0% |
| 2-Person Household | 26 | 15.9% |
| 3-Person Household | 15 | 9.1% |
| 4+ Person Household | 100 | 61.0% |
| Total Housing Units | 164 | 100.0% |
Occupancy by Ownership by Household Size in Stebbins
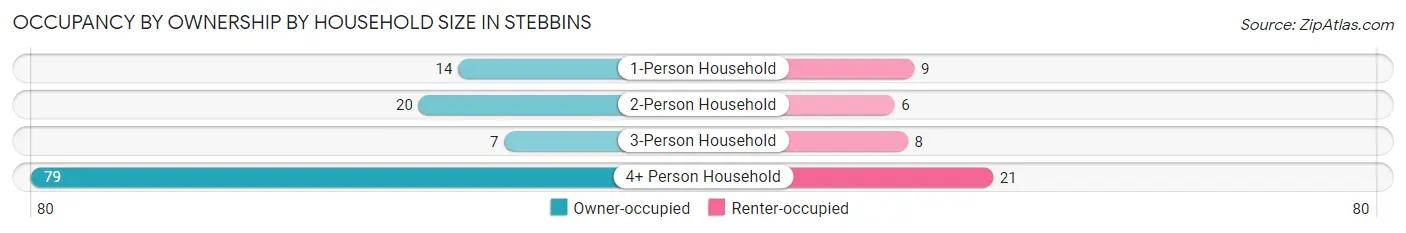
| Household Size | Owner-occupied | Renter-occupied |
| 1-Person Household | 14 (60.9%) | 9 (39.1%) |
| 2-Person Household | 20 (76.9%) | 6 (23.1%) |
| 3-Person Household | 7 (46.7%) | 8 (53.3%) |
| 4+ Person Household | 79 (79.0%) | 21 (21.0%) |
| Total Housing Units | 120 (73.2%) | 44 (26.8%) |
Occupancy by Educational Attainment in Stebbins
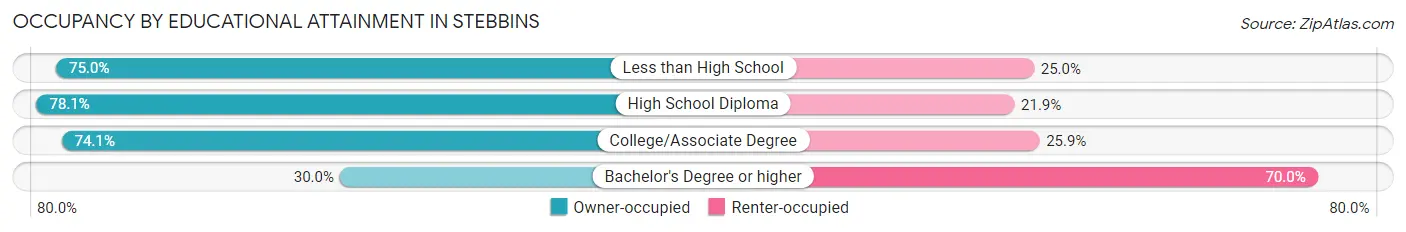
| Household Size | Owner-occupied | Renter-occupied |
| Less than High School | 24 (75.0%) | 8 (25.0%) |
| High School Diploma | 50 (78.1%) | 14 (21.9%) |
| College/Associate Degree | 43 (74.1%) | 15 (25.9%) |
| Bachelor's Degree or higher | 3 (30.0%) | 7 (70.0%) |
Occupancy by Age of Householder in Stebbins
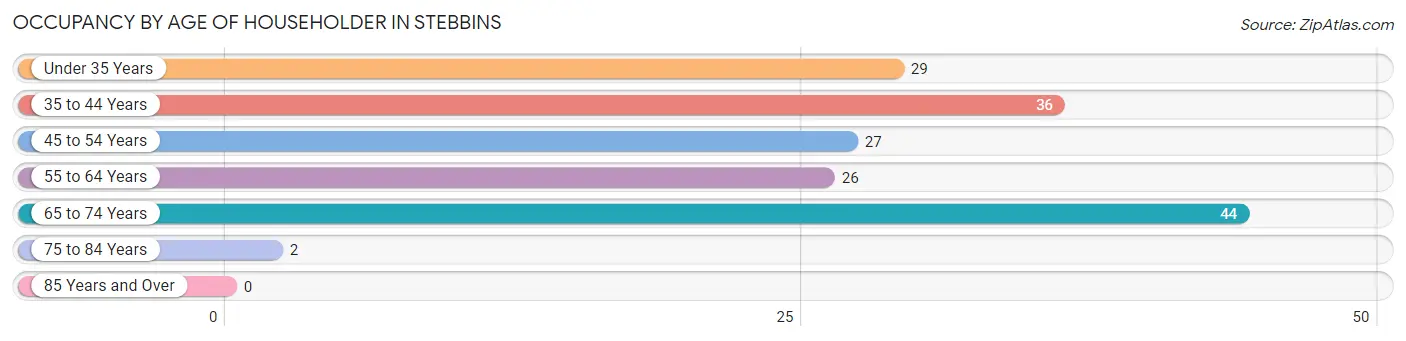
| Age Bracket | # Households | % Households |
| Under 35 Years | 29 | 17.7% |
| 35 to 44 Years | 36 | 22.0% |
| 45 to 54 Years | 27 | 16.5% |
| 55 to 64 Years | 26 | 15.9% |
| 65 to 74 Years | 44 | 26.8% |
| 75 to 84 Years | 2 | 1.2% |
| 85 Years and Over | 0 | 0.0% |
| Total | 164 | 100.0% |
Housing Finances in Stebbins
Median Income by Occupancy in Stebbins
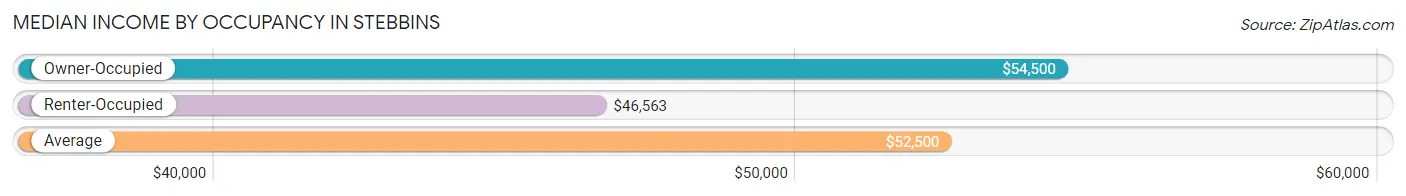
| Occupancy Type | # Households | Median Income |
| Owner-Occupied | 120 (73.2%) | $54,500 |
| Renter-Occupied | 44 (26.8%) | $46,563 |
| Average | 164 (100.0%) | $52,500 |
Occupancy by Householder Income Bracket in Stebbins
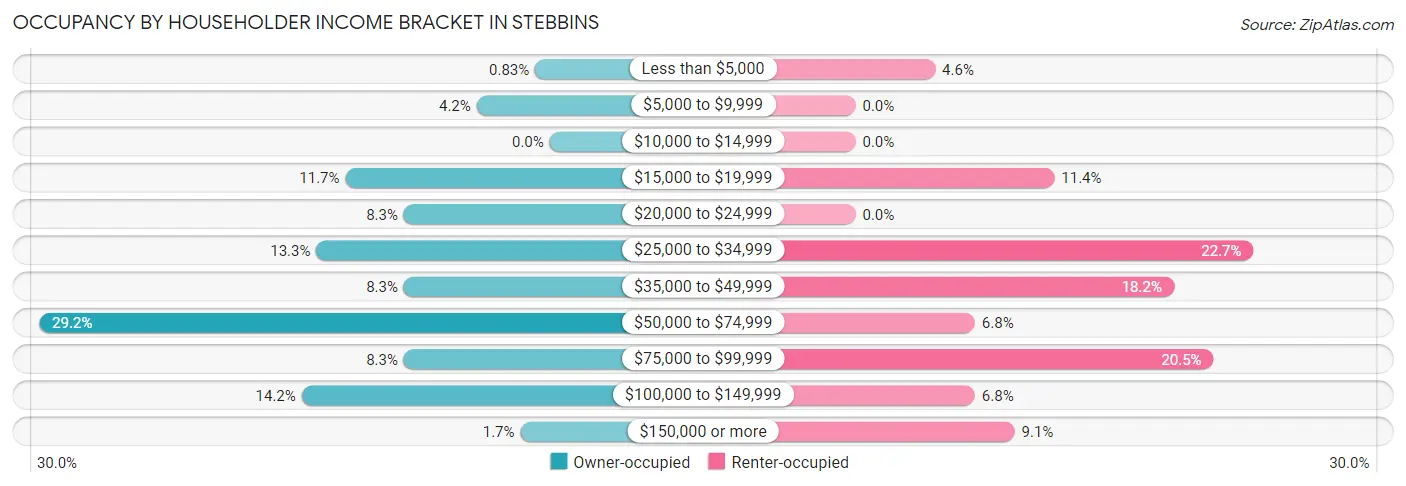
| Income Bracket | Owner-occupied | Renter-occupied |
| Less than $5,000 | 1 (0.8%) | 2 (4.5%) |
| $5,000 to $9,999 | 5 (4.2%) | 0 (0.0%) |
| $10,000 to $14,999 | 0 (0.0%) | 0 (0.0%) |
| $15,000 to $19,999 | 14 (11.7%) | 5 (11.4%) |
| $20,000 to $24,999 | 10 (8.3%) | 0 (0.0%) |
| $25,000 to $34,999 | 16 (13.3%) | 10 (22.7%) |
| $35,000 to $49,999 | 10 (8.3%) | 8 (18.2%) |
| $50,000 to $74,999 | 35 (29.2%) | 3 (6.8%) |
| $75,000 to $99,999 | 10 (8.3%) | 9 (20.4%) |
| $100,000 to $149,999 | 17 (14.2%) | 3 (6.8%) |
| $150,000 or more | 2 (1.7%) | 4 (9.1%) |
| Total | 120 (100.0%) | 44 (100.0%) |
Monthly Housing Cost Tiers in Stebbins
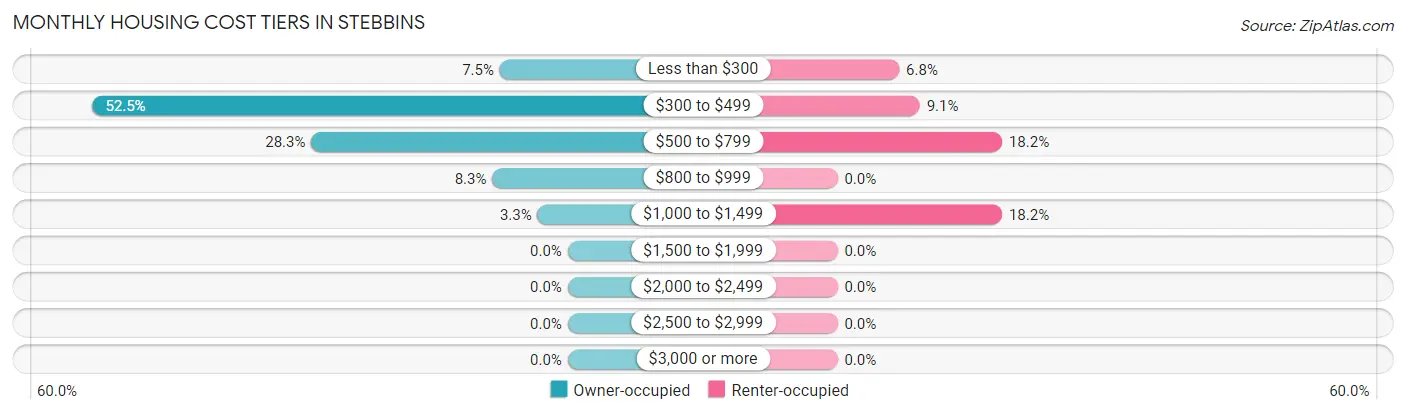
| Monthly Cost | Owner-occupied | Renter-occupied |
| Less than $300 | 9 (7.5%) | 3 (6.8%) |
| $300 to $499 | 63 (52.5%) | 4 (9.1%) |
| $500 to $799 | 34 (28.3%) | 8 (18.2%) |
| $800 to $999 | 10 (8.3%) | 0 (0.0%) |
| $1,000 to $1,499 | 4 (3.3%) | 8 (18.2%) |
| $1,500 to $1,999 | 0 (0.0%) | 0 (0.0%) |
| $2,000 to $2,499 | 0 (0.0%) | 0 (0.0%) |
| $2,500 to $2,999 | 0 (0.0%) | 0 (0.0%) |
| $3,000 or more | 0 (0.0%) | 0 (0.0%) |
| Total | 120 (100.0%) | 44 (100.0%) |
Physical Housing Characteristics in Stebbins
Housing Structures in Stebbins
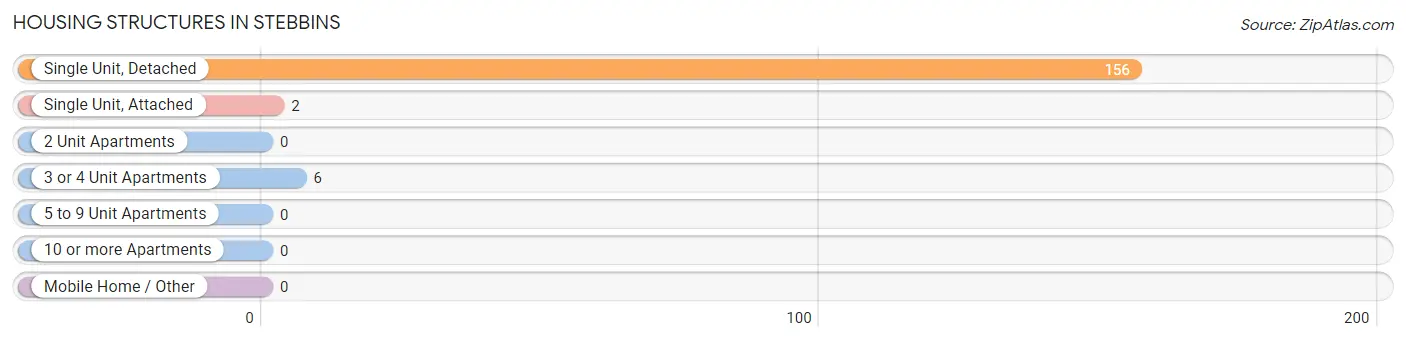
| Structure Type | # Housing Units | % Housing Units |
| Single Unit, Detached | 156 | 95.1% |
| Single Unit, Attached | 2 | 1.2% |
| 2 Unit Apartments | 0 | 0.0% |
| 3 or 4 Unit Apartments | 6 | 3.7% |
| 5 to 9 Unit Apartments | 0 | 0.0% |
| 10 or more Apartments | 0 | 0.0% |
| Mobile Home / Other | 0 | 0.0% |
| Total | 164 | 100.0% |
Housing Structures by Occupancy in Stebbins
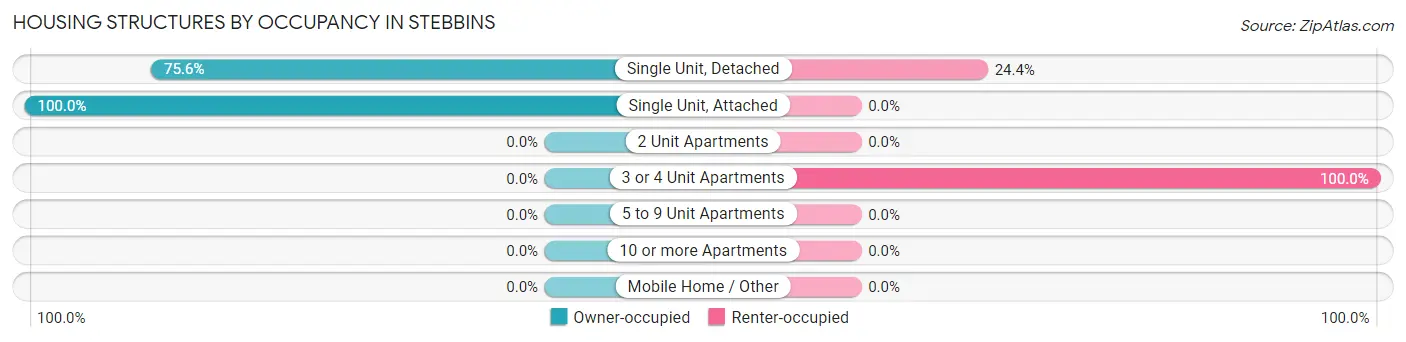
| Structure Type | Owner-occupied | Renter-occupied |
| Single Unit, Detached | 118 (75.6%) | 38 (24.4%) |
| Single Unit, Attached | 2 (100.0%) | 0 (0.0%) |
| 2 Unit Apartments | 0 (0.0%) | 0 (0.0%) |
| 3 or 4 Unit Apartments | 0 (0.0%) | 6 (100.0%) |
| 5 to 9 Unit Apartments | 0 (0.0%) | 0 (0.0%) |
| 10 or more Apartments | 0 (0.0%) | 0 (0.0%) |
| Mobile Home / Other | 0 (0.0%) | 0 (0.0%) |
| Total | 120 (73.2%) | 44 (26.8%) |
Housing Structures by Number of Rooms in Stebbins
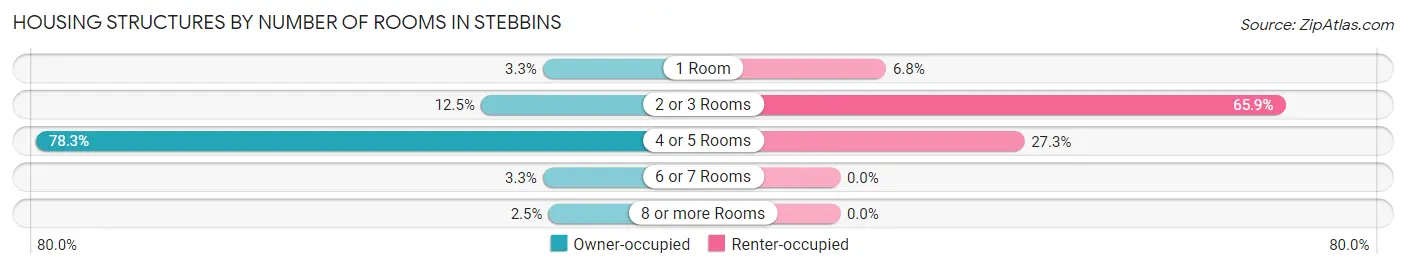
| Number of Rooms | Owner-occupied | Renter-occupied |
| 1 Room | 4 (3.3%) | 3 (6.8%) |
| 2 or 3 Rooms | 15 (12.5%) | 29 (65.9%) |
| 4 or 5 Rooms | 94 (78.3%) | 12 (27.3%) |
| 6 or 7 Rooms | 4 (3.3%) | 0 (0.0%) |
| 8 or more Rooms | 3 (2.5%) | 0 (0.0%) |
| Total | 120 (100.0%) | 44 (100.0%) |
Housing Structure by Heating Type in Stebbins
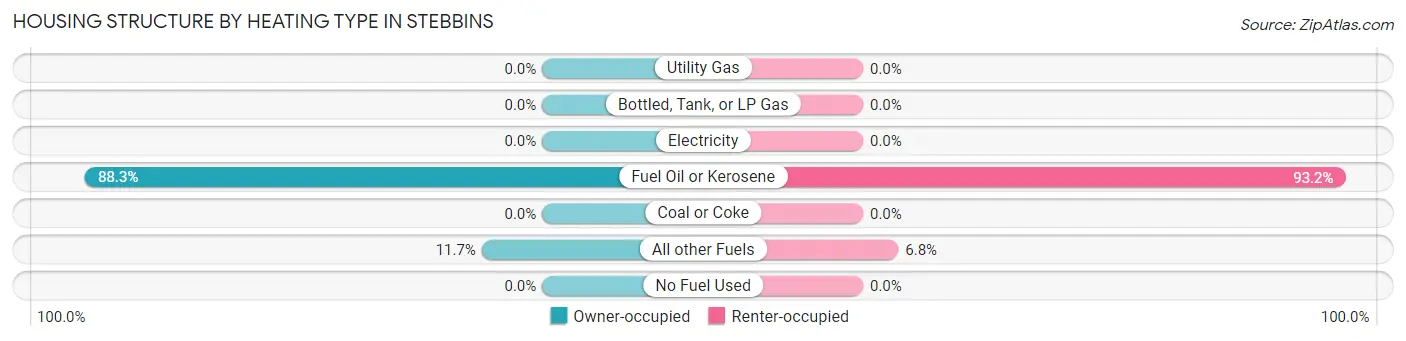
| Heating Type | Owner-occupied | Renter-occupied |
| Utility Gas | 0 (0.0%) | 0 (0.0%) |
| Bottled, Tank, or LP Gas | 0 (0.0%) | 0 (0.0%) |
| Electricity | 0 (0.0%) | 0 (0.0%) |
| Fuel Oil or Kerosene | 106 (88.3%) | 41 (93.2%) |
| Coal or Coke | 0 (0.0%) | 0 (0.0%) |
| All other Fuels | 14 (11.7%) | 3 (6.8%) |
| No Fuel Used | 0 (0.0%) | 0 (0.0%) |
| Total | 120 (100.0%) | 44 (100.0%) |
Household Vehicle Usage in Stebbins
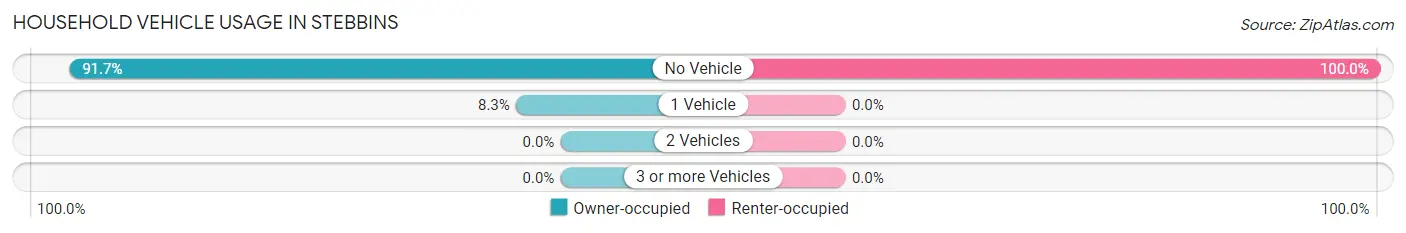
| Vehicles per Household | Owner-occupied | Renter-occupied |
| No Vehicle | 110 (91.7%) | 44 (100.0%) |
| 1 Vehicle | 10 (8.3%) | 0 (0.0%) |
| 2 Vehicles | 0 (0.0%) | 0 (0.0%) |
| 3 or more Vehicles | 0 (0.0%) | 0 (0.0%) |
| Total | 120 (100.0%) | 44 (100.0%) |
Real Estate & Mortgages in Stebbins
Real Estate and Mortgage Overview in Stebbins
| Characteristic | Without Mortgage | With Mortgage |
| Housing Units | 77 | 43 |
| Median Property Value | $104,400 | $0 |
| Median Household Income | $53,750 | $0 |
| Monthly Housing Costs | $448 | $0 |
| Real Estate Taxes | - | - |
Property Value by Mortgage Status in Stebbins
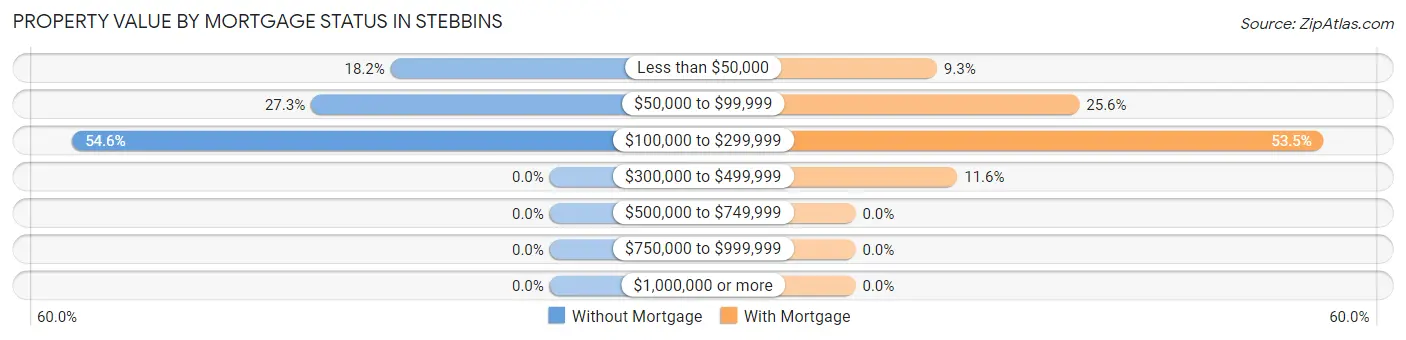
| Property Value | Without Mortgage | With Mortgage |
| Less than $50,000 | 14 (18.2%) | 4 (9.3%) |
| $50,000 to $99,999 | 21 (27.3%) | 11 (25.6%) |
| $100,000 to $299,999 | 42 (54.5%) | 23 (53.5%) |
| $300,000 to $499,999 | 0 (0.0%) | 5 (11.6%) |
| $500,000 to $749,999 | 0 (0.0%) | 0 (0.0%) |
| $750,000 to $999,999 | 0 (0.0%) | 0 (0.0%) |
| $1,000,000 or more | 0 (0.0%) | 0 (0.0%) |
| Total | 77 (100.0%) | 43 (100.0%) |
Household Income by Mortgage Status in Stebbins
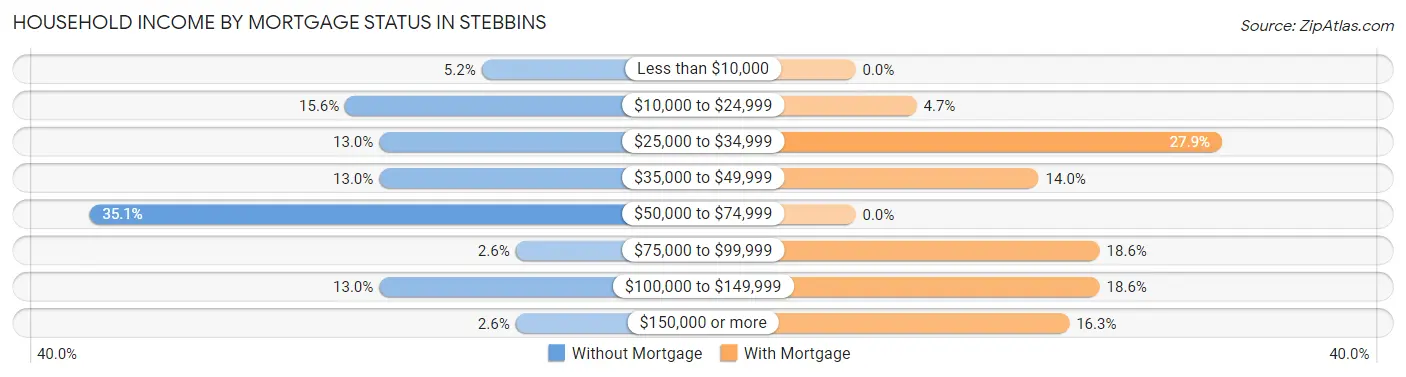
| Household Income | Without Mortgage | With Mortgage |
| Less than $10,000 | 4 (5.2%) | 0 (0.0%) |
| $10,000 to $24,999 | 12 (15.6%) | 2 (4.6%) |
| $25,000 to $34,999 | 10 (13.0%) | 12 (27.9%) |
| $35,000 to $49,999 | 10 (13.0%) | 6 (14.0%) |
| $50,000 to $74,999 | 27 (35.1%) | 0 (0.0%) |
| $75,000 to $99,999 | 2 (2.6%) | 8 (18.6%) |
| $100,000 to $149,999 | 10 (13.0%) | 8 (18.6%) |
| $150,000 or more | 2 (2.6%) | 7 (16.3%) |
| Total | 77 (100.0%) | 43 (100.0%) |
Property Value to Household Income Ratio in Stebbins
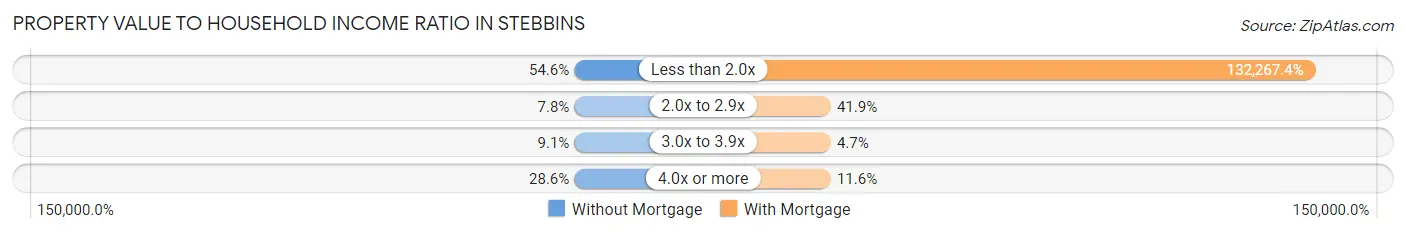
| Value-to-Income Ratio | Without Mortgage | With Mortgage |
| Less than 2.0x | 42 (54.5%) | 56,875 (132,267.4%) |
| 2.0x to 2.9x | 6 (7.8%) | 18 (41.9%) |
| 3.0x to 3.9x | 7 (9.1%) | 2 (4.6%) |
| 4.0x or more | 22 (28.6%) | 5 (11.6%) |
| Total | 77 (100.0%) | 43 (100.0%) |
Real Estate Taxes by Mortgage Status in Stebbins
| Property Taxes | Without Mortgage | With Mortgage |
| Less than $800 | 0 (0.0%) | 0 (0.0%) |
| $800 to $1,499 | 0 (0.0%) | 0 (0.0%) |
| $800 to $1,499 | 0 (0.0%) | 0 (0.0%) |
| Total | 77 (100.0%) | 43 (100.0%) |
Health & Disability in Stebbins
Health Insurance Coverage by Age in Stebbins
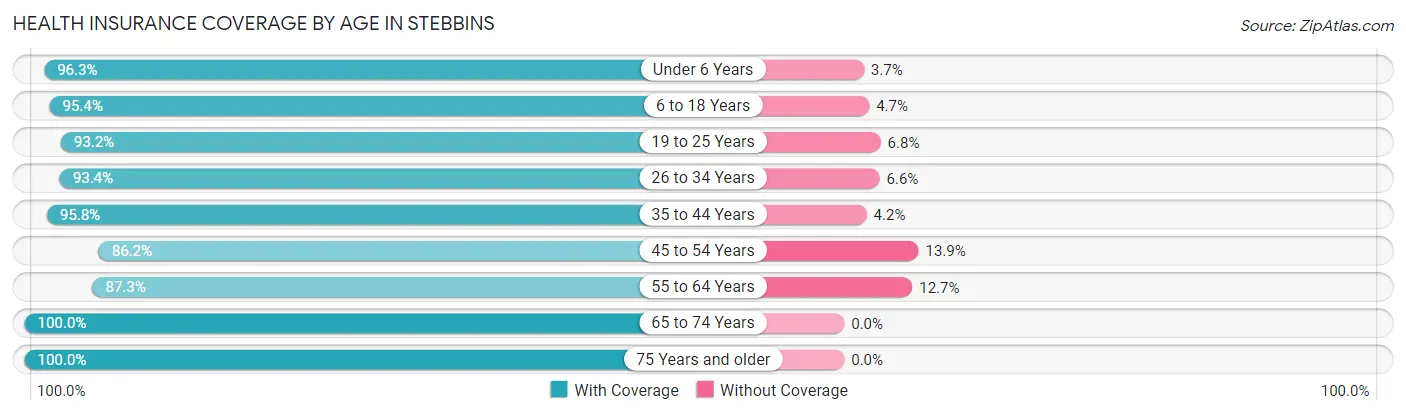
| Age Bracket | With Coverage | Without Coverage |
| Under 6 Years | 79 (96.3%) | 3 (3.7%) |
| 6 to 18 Years | 164 (95.4%) | 8 (4.6%) |
| 19 to 25 Years | 55 (93.2%) | 4 (6.8%) |
| 26 to 34 Years | 71 (93.4%) | 5 (6.6%) |
| 35 to 44 Years | 69 (95.8%) | 3 (4.2%) |
| 45 to 54 Years | 56 (86.2%) | 9 (13.9%) |
| 55 to 64 Years | 62 (87.3%) | 9 (12.7%) |
| 65 to 74 Years | 54 (100.0%) | 0 (0.0%) |
| 75 Years and older | 3 (100.0%) | 0 (0.0%) |
| Total | 613 (93.7%) | 41 (6.3%) |
Health Insurance Coverage by Citizenship Status in Stebbins
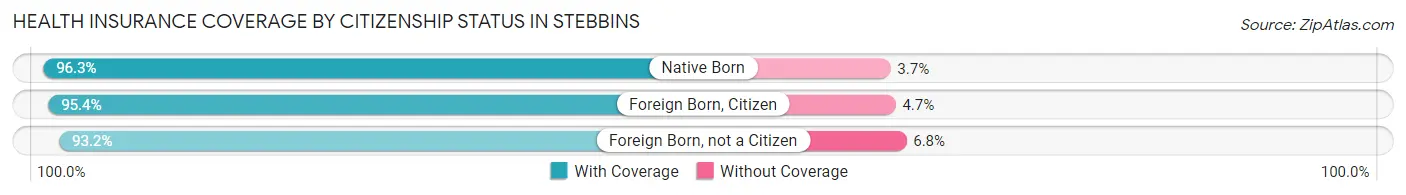
| Citizenship Status | With Coverage | Without Coverage |
| Native Born | 79 (96.3%) | 3 (3.7%) |
| Foreign Born, Citizen | 164 (95.4%) | 8 (4.6%) |
| Foreign Born, not a Citizen | 55 (93.2%) | 4 (6.8%) |
Health Insurance Coverage by Household Income in Stebbins
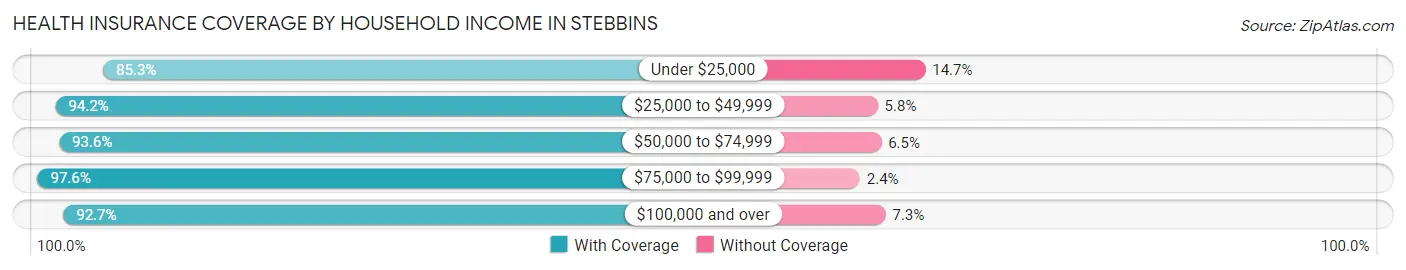
| Household Income | With Coverage | Without Coverage |
| Under $25,000 | 58 (85.3%) | 10 (14.7%) |
| $25,000 to $49,999 | 163 (94.2%) | 10 (5.8%) |
| $50,000 to $74,999 | 145 (93.5%) | 10 (6.5%) |
| $75,000 to $99,999 | 80 (97.6%) | 2 (2.4%) |
| $100,000 and over | 115 (92.7%) | 9 (7.3%) |
Public vs Private Health Insurance Coverage by Age in Stebbins
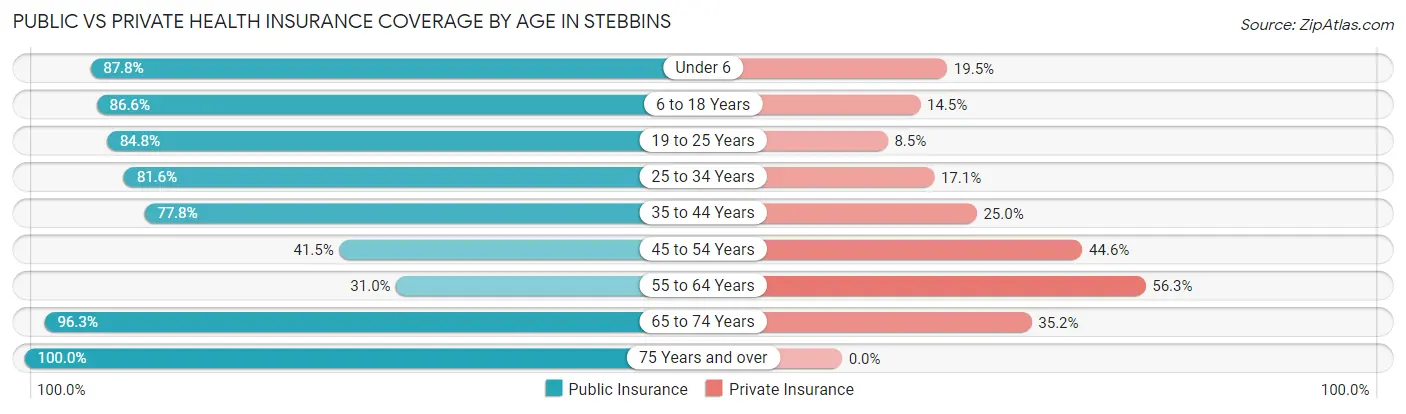
| Age Bracket | Public Insurance | Private Insurance |
| Under 6 | 72 (87.8%) | 16 (19.5%) |
| 6 to 18 Years | 149 (86.6%) | 25 (14.5%) |
| 19 to 25 Years | 50 (84.8%) | 5 (8.5%) |
| 25 to 34 Years | 62 (81.6%) | 13 (17.1%) |
| 35 to 44 Years | 56 (77.8%) | 18 (25.0%) |
| 45 to 54 Years | 27 (41.5%) | 29 (44.6%) |
| 55 to 64 Years | 22 (31.0%) | 40 (56.3%) |
| 65 to 74 Years | 52 (96.3%) | 19 (35.2%) |
| 75 Years and over | 3 (100.0%) | 0 (0.0%) |
| Total | 493 (75.4%) | 165 (25.2%) |
Disability Status by Sex by Age in Stebbins
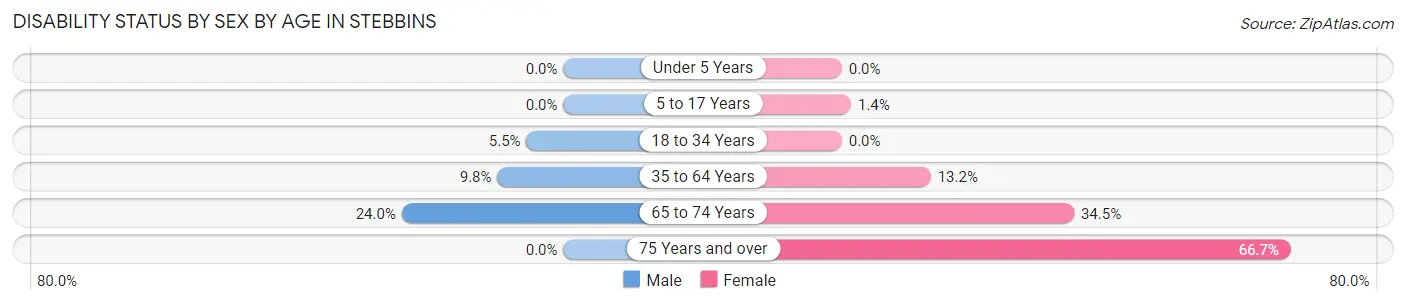
| Age Bracket | Male | Female |
| Under 5 Years | 0 (0.0%) | 0 (0.0%) |
| 5 to 17 Years | 0 (0.0%) | 1 (1.4%) |
| 18 to 34 Years | 4 (5.5%) | 0 (0.0%) |
| 35 to 64 Years | 10 (9.8%) | 14 (13.2%) |
| 65 to 74 Years | 6 (24.0%) | 10 (34.5%) |
| 75 Years and over | 0 (0.0%) | 2 (66.7%) |
Disability Class by Sex by Age in Stebbins
Disability Class: Hearing Difficulty
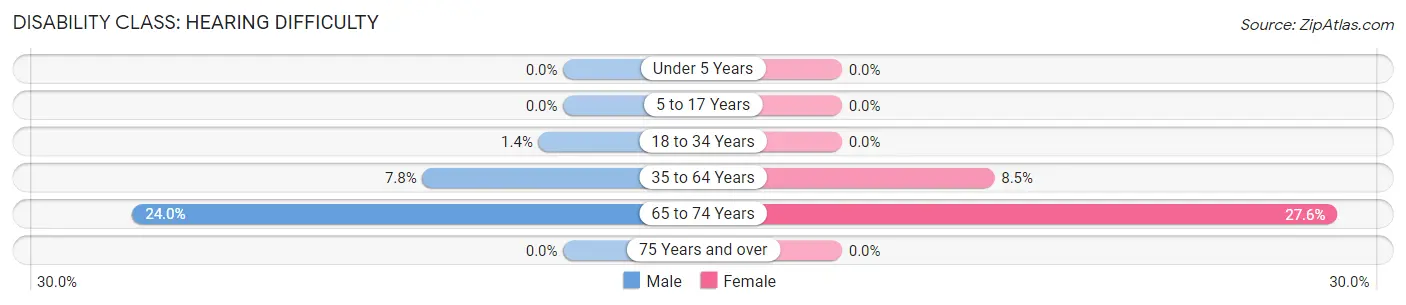
| Age Bracket | Male | Female |
| Under 5 Years | 0 (0.0%) | 0 (0.0%) |
| 5 to 17 Years | 0 (0.0%) | 0 (0.0%) |
| 18 to 34 Years | 1 (1.4%) | 0 (0.0%) |
| 35 to 64 Years | 8 (7.8%) | 9 (8.5%) |
| 65 to 74 Years | 6 (24.0%) | 8 (27.6%) |
| 75 Years and over | 0 (0.0%) | 0 (0.0%) |
Disability Class: Vision Difficulty
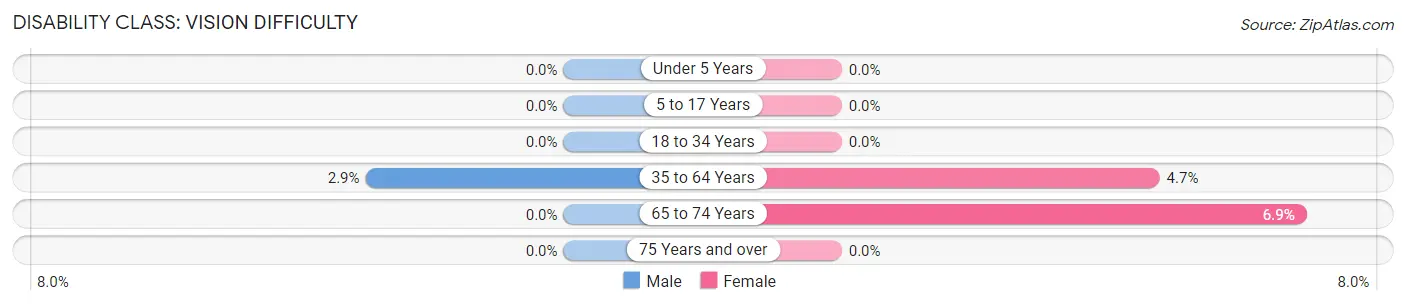
| Age Bracket | Male | Female |
| Under 5 Years | 0 (0.0%) | 0 (0.0%) |
| 5 to 17 Years | 0 (0.0%) | 0 (0.0%) |
| 18 to 34 Years | 0 (0.0%) | 0 (0.0%) |
| 35 to 64 Years | 3 (2.9%) | 5 (4.7%) |
| 65 to 74 Years | 0 (0.0%) | 2 (6.9%) |
| 75 Years and over | 0 (0.0%) | 0 (0.0%) |
Disability Class: Cognitive Difficulty
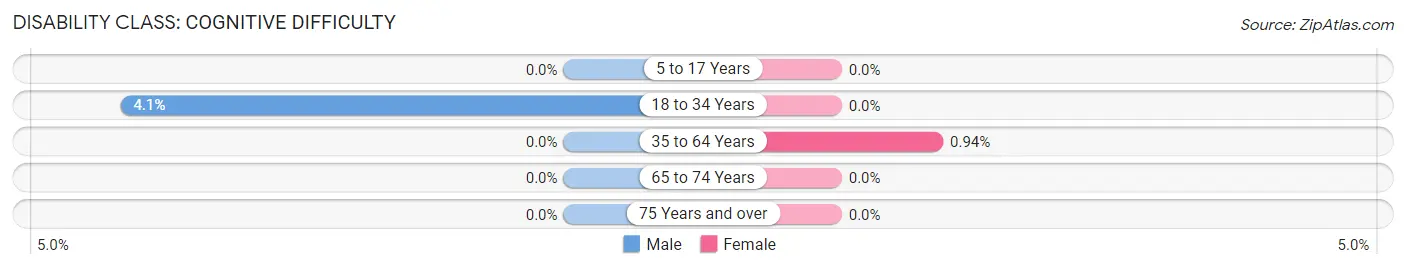
| Age Bracket | Male | Female |
| 5 to 17 Years | 0 (0.0%) | 0 (0.0%) |
| 18 to 34 Years | 3 (4.1%) | 0 (0.0%) |
| 35 to 64 Years | 0 (0.0%) | 1 (0.9%) |
| 65 to 74 Years | 0 (0.0%) | 0 (0.0%) |
| 75 Years and over | 0 (0.0%) | 0 (0.0%) |
Disability Class: Ambulatory Difficulty
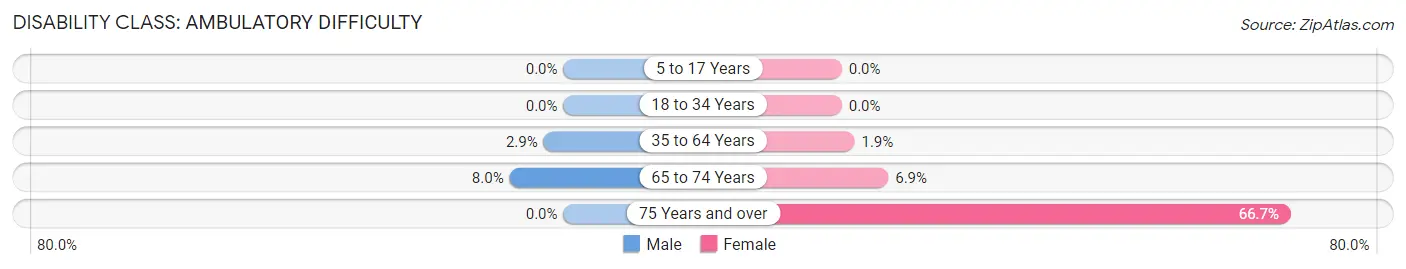
| Age Bracket | Male | Female |
| 5 to 17 Years | 0 (0.0%) | 0 (0.0%) |
| 18 to 34 Years | 0 (0.0%) | 0 (0.0%) |
| 35 to 64 Years | 3 (2.9%) | 2 (1.9%) |
| 65 to 74 Years | 2 (8.0%) | 2 (6.9%) |
| 75 Years and over | 0 (0.0%) | 2 (66.7%) |
Disability Class: Self-Care Difficulty
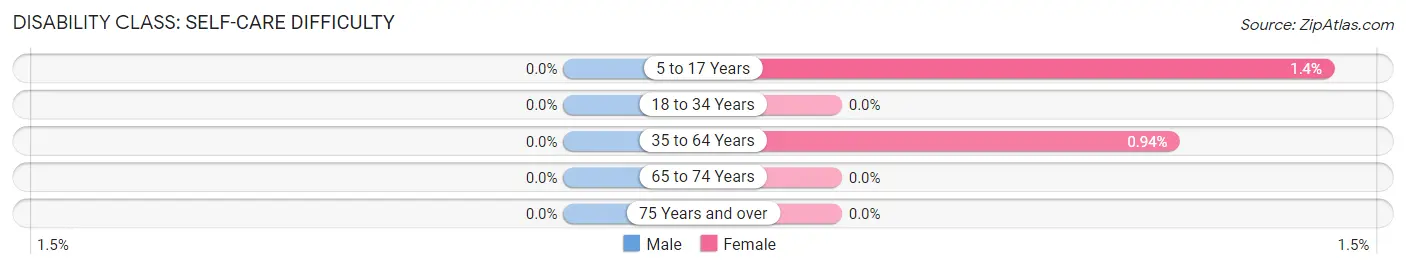
| Age Bracket | Male | Female |
| 5 to 17 Years | 0 (0.0%) | 1 (1.4%) |
| 18 to 34 Years | 0 (0.0%) | 0 (0.0%) |
| 35 to 64 Years | 0 (0.0%) | 1 (0.9%) |
| 65 to 74 Years | 0 (0.0%) | 0 (0.0%) |
| 75 Years and over | 0 (0.0%) | 0 (0.0%) |
Technology Access in Stebbins
Computing Device Access in Stebbins
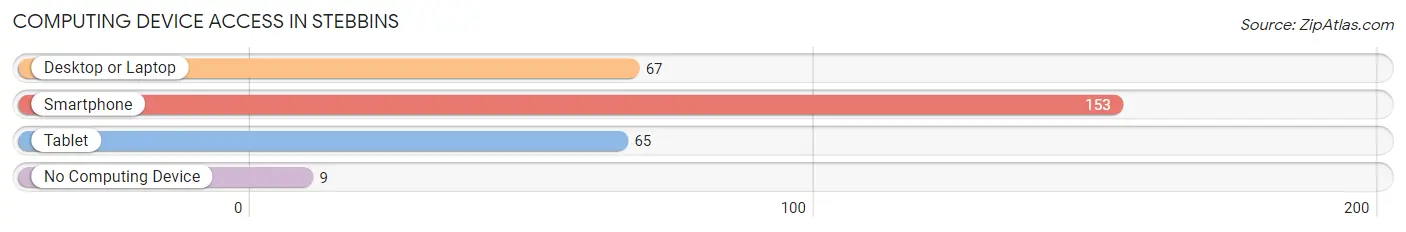
| Device Type | # Households | % Households |
| Desktop or Laptop | 67 | 40.8% |
| Smartphone | 153 | 93.3% |
| Tablet | 65 | 39.6% |
| No Computing Device | 9 | 5.5% |
| Total | 164 | 100.0% |
Internet Access in Stebbins
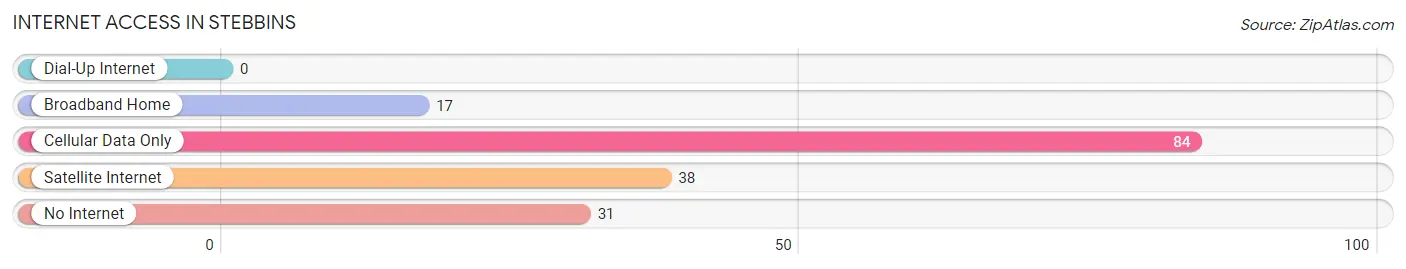
| Internet Type | # Households | % Households |
| Dial-Up Internet | 0 | 0.0% |
| Broadband Home | 17 | 10.4% |
| Cellular Data Only | 84 | 51.2% |
| Satellite Internet | 38 | 23.2% |
| No Internet | 31 | 18.9% |
| Total | 164 | 100.0% |
Stebbins Summary
Stebbins is a small city located in the Northwest Arctic Borough of Alaska. It is situated on the south bank of the Koyukuk River, approximately 40 miles east of the city of Kotzebue. The population of Stebbins was 517 at the 2010 census, making it the smallest incorporated city in Alaska.
History
Stebbins was originally inhabited by the Inupiat people, who have lived in the area for thousands of years. The first non-native settlers arrived in the late 19th century, and the town was officially incorporated in 1912. The town was named after an early settler, William Stebbins, who established a trading post in the area in 1891.
The town was a hub of activity during the gold rush of the early 1900s, and many of the original buildings still stand today. The town was also a major stop on the Iditarod Trail, which was used by miners and prospectors to travel between the gold fields of the interior and the ports of the coast.
Geography
Stebbins is located in the Northwest Arctic Borough of Alaska, on the south bank of the Koyukuk River. The town is situated at an elevation of approximately 30 feet above sea level. The climate is subarctic, with long, cold winters and short, cool summers.
The town is surrounded by tundra and boreal forest, and is home to a variety of wildlife, including moose, caribou, wolves, and bears. The nearby Koyukuk National Wildlife Refuge provides habitat for a variety of migratory birds.
Economy
The economy of Stebbins is largely based on subsistence hunting and fishing. The town is also home to a number of small businesses, including a grocery store, a hardware store, and a restaurant.
The town is served by the Stebbins Airport, which provides scheduled air service to Kotzebue and other nearby communities. The airport also serves as a refueling stop for aircraft traveling to and from the Arctic.
Demographics
As of the 2010 census, the population of Stebbins was 517, of which 97.3% were Native American. The median age was 28.7 years, and the median household income was $37,500.
The town is served by the Stebbins School District, which includes an elementary school, a middle school, and a high school. The town is also home to a branch of the University of Alaska Fairbanks, which offers a variety of degree programs.
Conclusion
Stebbins is a small city located in the Northwest Arctic Borough of Alaska. It is situated on the south bank of the Koyukuk River, and has a population of 517. The economy of Stebbins is largely based on subsistence hunting and fishing, and the town is served by the Stebbins Airport. The population is predominantly Native American, and the median age is 28.7 years. The town is served by the Stebbins School District, and is home to a branch of the University of Alaska Fairbanks.
Common Questions
What is Per Capita Income in Stebbins?
Per Capita income in Stebbins is $20,441.
What is the Median Family Income in Stebbins?
Median Family Income in Stebbins is $51,875.
What is the Median Household income in Stebbins?
Median Household Income in Stebbins is $52,500.
What is Income or Wage Gap in Stebbins?
Income or Wage Gap in Stebbins is 16.2%.
Women in Stebbins earn 83.8 cents for every dollar earned by a man.
What is Family Income Deficit in Stebbins?
Family Income Deficit in Stebbins is $11,838.
Families that are below poverty line in Stebbins earn $11,838 less on average than the poverty threshold level.
What is Inequality or Gini Index in Stebbins?
Inequality or Gini Index in Stebbins is 0.36.
What is the Total Population of Stebbins?
Total Population of Stebbins is 654.
What is the Total Male Population of Stebbins?
Total Male Population of Stebbins is 334.
What is the Total Female Population of Stebbins?
Total Female Population of Stebbins is 320.
What is the Ratio of Males per 100 Females in Stebbins?
There are 104.38 Males per 100 Females in Stebbins.
What is the Ratio of Females per 100 Males in Stebbins?
There are 95.81 Females per 100 Males in Stebbins.
What is the Median Population Age in Stebbins?
Median Population Age in Stebbins is 27.5 Years.
What is the Average Family Size in Stebbins
Average Family Size in Stebbins is 4.0 People.
What is the Average Household Size in Stebbins
Average Household Size in Stebbins is 3.7 People.
How Large is the Labor Force in Stebbins?
There are 266 People in the Labor Forcein in Stebbins.
What is the Percentage of People in the Labor Force in Stebbins?
62.1% of People are in the Labor Force in Stebbins.
What is the Unemployment Rate in Stebbins?
Unemployment Rate in Stebbins is 27.4%.