Shungnak, AK Map & Demographics
Shungnak Map
Shungnak Overview
$21,300
PER CAPITA INCOME
$66,250
AVG FAMILY INCOME
$68,750
AVG HOUSEHOLD INCOME
12.8%
WAGE / INCOME GAP [ % ]
87.2¢/ $1
WAGE / INCOME GAP [ $ ]
0.44
INEQUALITY / GINI INDEX
244
TOTAL POPULATION
125
MALE POPULATION
119
FEMALE POPULATION
105.04
MALES / 100 FEMALES
95.20
FEMALES / 100 MALES
27.1
MEDIAN AGE
5.6
AVG FAMILY SIZE
5.3
AVG HOUSEHOLD SIZE
101
LABOR FORCE [ PEOPLE ]
65.6%
PERCENT IN LABOR FORCE
21.8%
UNEMPLOYMENT RATE
Shungnak Zip Codes
Shungnak Area Codes
Income in Shungnak
Income Overview in Shungnak
Per Capita Income in Shungnak is $21,300, while median incomes of families and households are $66,250 and $68,750 respectively.
| Characteristic | Number | Measure |
| Per Capita Income | 244 | $21,300 |
| Median Family Income | 36 | $66,250 |
| Mean Family Income | 36 | $100,950 |
| Median Household Income | 46 | $68,750 |
| Mean Household Income | 46 | $97,478 |
| Income Deficit | 36 | $0 |
| Wage / Income Gap (%) | 244 | 12.84% |
| Wage / Income Gap ($) | 244 | 87.16¢ per $1 |
| Gini / Inequality Index | 244 | 0.44 |
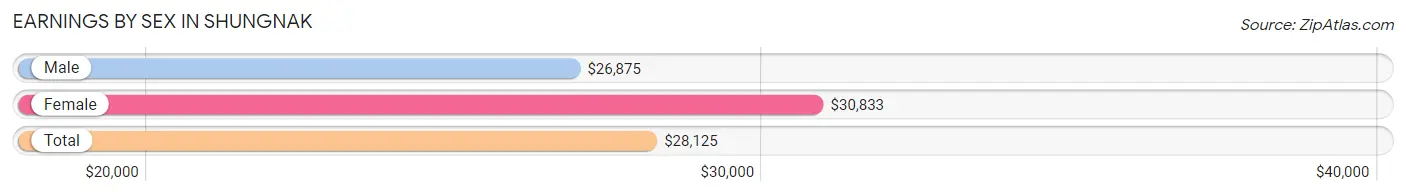
Earnings by Sex in Shungnak
Average Earnings in Shungnak are $28,125, $26,875 for men and $30,833 for women, a difference of 12.8%.
| Sex | Number | Average Earnings |
| Male | 53 (49.5%) | $26,875 |
| Female | 54 (50.5%) | $30,833 |
| Total | 107 (100.0%) | $28,125 |
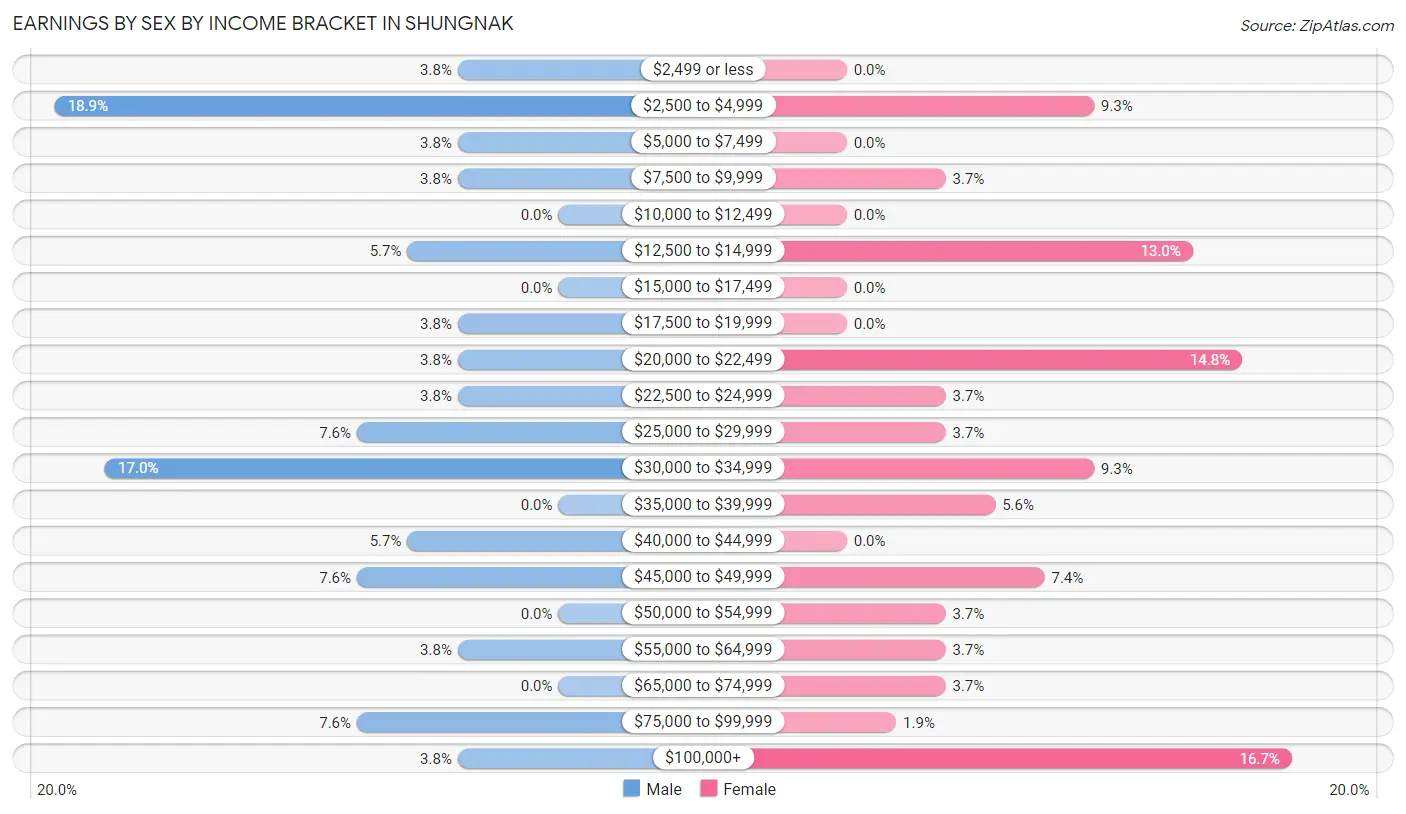
Earnings by Sex by Income Bracket in Shungnak
The most common earnings brackets in Shungnak are $2,500 to $4,999 for men (10 | 18.9%) and $100,000+ for women (9 | 16.7%).
| Income | Male | Female |
| $2,499 or less | 2 (3.8%) | 0 (0.0%) |
| $2,500 to $4,999 | 10 (18.9%) | 5 (9.3%) |
| $5,000 to $7,499 | 2 (3.8%) | 0 (0.0%) |
| $7,500 to $9,999 | 2 (3.8%) | 2 (3.7%) |
| $10,000 to $12,499 | 0 (0.0%) | 0 (0.0%) |
| $12,500 to $14,999 | 3 (5.7%) | 7 (13.0%) |
| $15,000 to $17,499 | 0 (0.0%) | 0 (0.0%) |
| $17,500 to $19,999 | 2 (3.8%) | 0 (0.0%) |
| $20,000 to $22,499 | 2 (3.8%) | 8 (14.8%) |
| $22,500 to $24,999 | 2 (3.8%) | 2 (3.7%) |
| $25,000 to $29,999 | 4 (7.5%) | 2 (3.7%) |
| $30,000 to $34,999 | 9 (17.0%) | 5 (9.3%) |
| $35,000 to $39,999 | 0 (0.0%) | 3 (5.6%) |
| $40,000 to $44,999 | 3 (5.7%) | 0 (0.0%) |
| $45,000 to $49,999 | 4 (7.5%) | 4 (7.4%) |
| $50,000 to $54,999 | 0 (0.0%) | 2 (3.7%) |
| $55,000 to $64,999 | 2 (3.8%) | 2 (3.7%) |
| $65,000 to $74,999 | 0 (0.0%) | 2 (3.7%) |
| $75,000 to $99,999 | 4 (7.5%) | 1 (1.8%) |
| $100,000+ | 2 (3.8%) | 9 (16.7%) |
| Total | 53 (100.0%) | 54 (100.0%) |
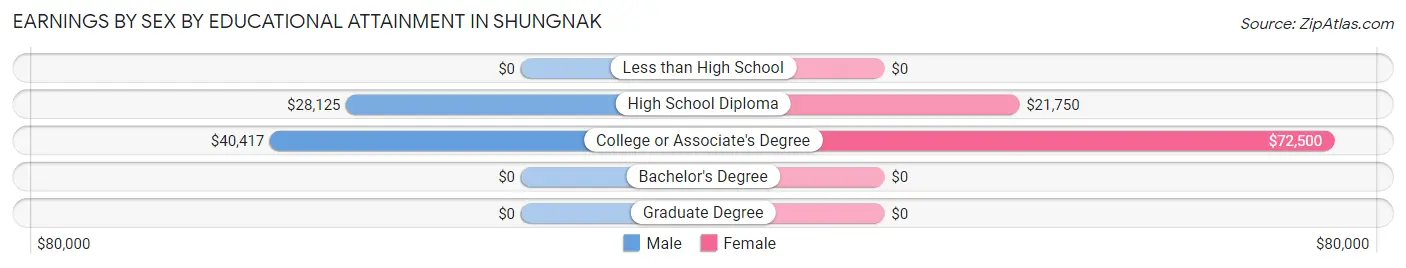
Earnings by Sex by Educational Attainment in Shungnak
Average earnings in Shungnak are $31,667 for men and $26,875 for women, a difference of 15.1%. Men with an educational attainment of college or associate's degree enjoy the highest average annual earnings of $40,417, while those with high school diploma education earn the least with $28,125. Women with an educational attainment of college or associate's degree earn the most with the average annual earnings of $72,500, while those with high school diploma education have the smallest earnings of $21,750.
| Educational Attainment | Male Income | Female Income |
| Less than High School | - | - |
| High School Diploma | $28,125 | $21,750 |
| College or Associate's Degree | $40,417 | $72,500 |
| Bachelor's Degree | - | - |
| Graduate Degree | - | - |
| Total | $31,667 | $26,875 |
Family Income in Shungnak
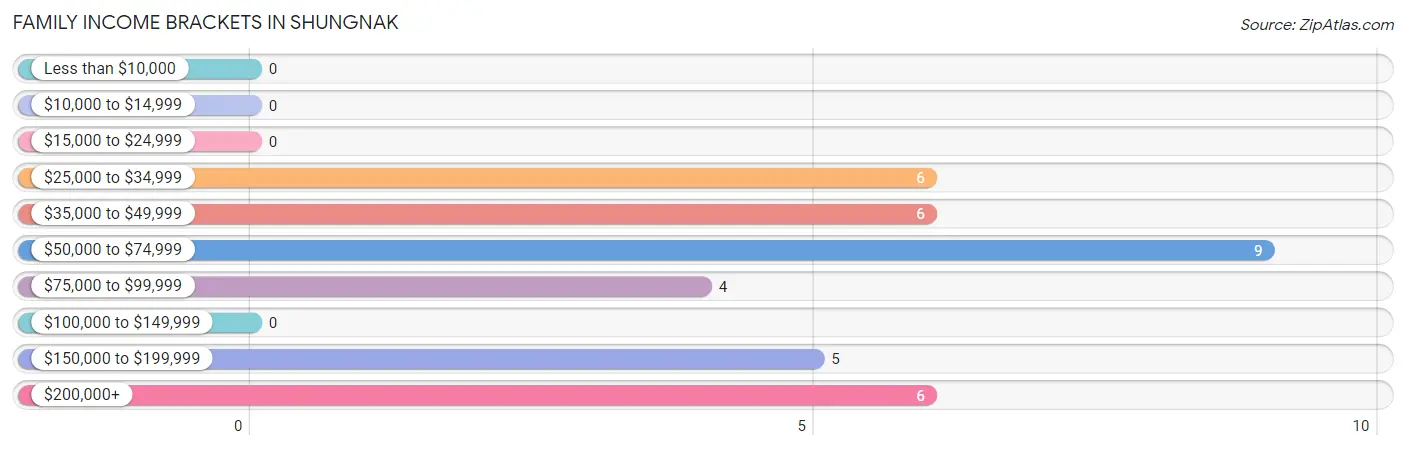
Family Income Brackets in Shungnak
According to the Shungnak family income data, there are 9 families falling into the $50,000 to $74,999 income range, which is the most common income bracket and makes up 25.0% of all families.
| Income Bracket | # Families | % Families |
| Less than $10,000 | 0 | 0.0% |
| $10,000 to $14,999 | 0 | 0.0% |
| $15,000 to $24,999 | 0 | 0.0% |
| $25,000 to $34,999 | 6 | 16.7% |
| $35,000 to $49,999 | 6 | 16.7% |
| $50,000 to $74,999 | 9 | 25.0% |
| $75,000 to $99,999 | 4 | 11.1% |
| $100,000 to $149,999 | 0 | 0.0% |
| $150,000 to $199,999 | 5 | 13.9% |
| $200,000+ | 6 | 16.7% |
Family Income by Famaliy Size in Shungnak
| Income Bracket | # Families | Median Income |
| 2-Person Families | 0 (0.0%) | $0 |
| 3-Person Families | 10 (27.8%) | $0 |
| 4-Person Families | 12 (33.3%) | $0 |
| 5-Person Families | 5 (13.9%) | $0 |
| 6-Person Families | 3 (8.3%) | $0 |
| 7+ Person Families | 6 (16.7%) | $0 |
| Total | 36 (100.0%) | $66,250 |
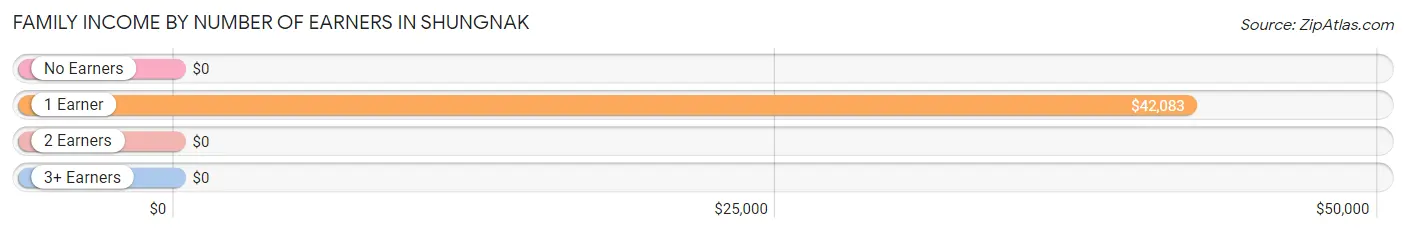
Family Income by Number of Earners in Shungnak
| Number of Earners | # Families | Median Income |
| No Earners | 1 (2.8%) | $0 |
| 1 Earner | 11 (30.6%) | $42,083 |
| 2 Earners | 16 (44.4%) | $0 |
| 3+ Earners | 8 (22.2%) | $0 |
| Total | 36 (100.0%) | $66,250 |
Household Income in Shungnak
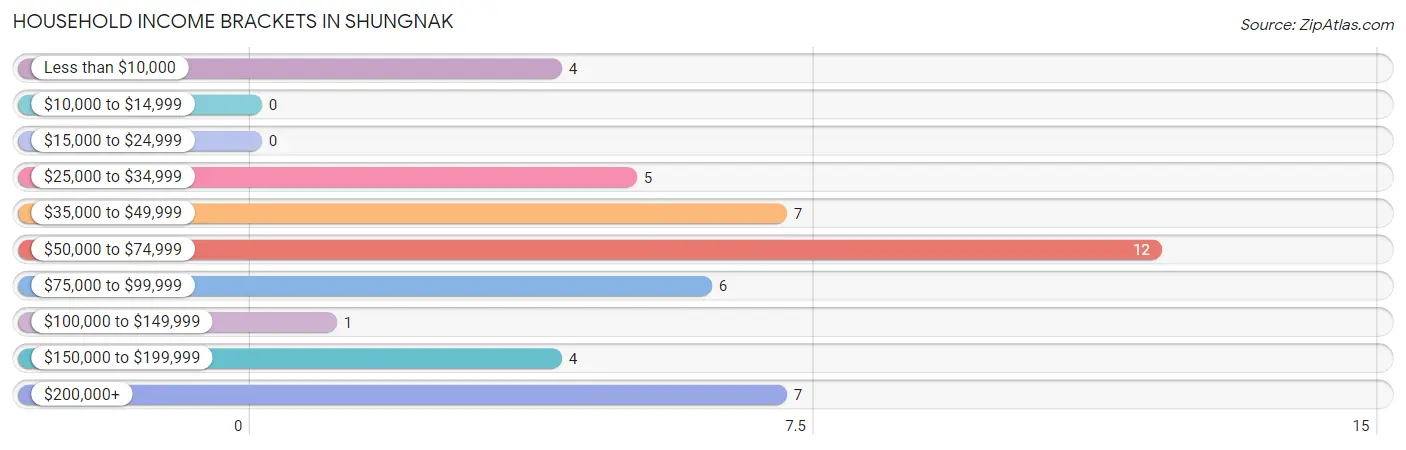
Household Income Brackets in Shungnak
With 12 households falling in the category, the $50,000 to $74,999 income range is the most frequent in Shungnak, accounting for 26.1% of all households.
| Income Bracket | # Households | % Households |
| Less than $10,000 | 4 | 8.7% |
| $10,000 to $14,999 | 0 | 0.0% |
| $15,000 to $24,999 | 0 | 0.0% |
| $25,000 to $34,999 | 5 | 10.9% |
| $35,000 to $49,999 | 7 | 15.2% |
| $50,000 to $74,999 | 12 | 26.1% |
| $75,000 to $99,999 | 6 | 13.0% |
| $100,000 to $149,999 | 1 | 2.2% |
| $150,000 to $199,999 | 4 | 8.7% |
| $200,000+ | 7 | 15.2% |
Household Income by Householder Age in Shungnak
The median household income in Shungnak is $68,750, with the highest median household income of $68,750 found in the 45 to 64 years age bracket for the primary householder. A total of 16 households (34.8%) fall into this category.
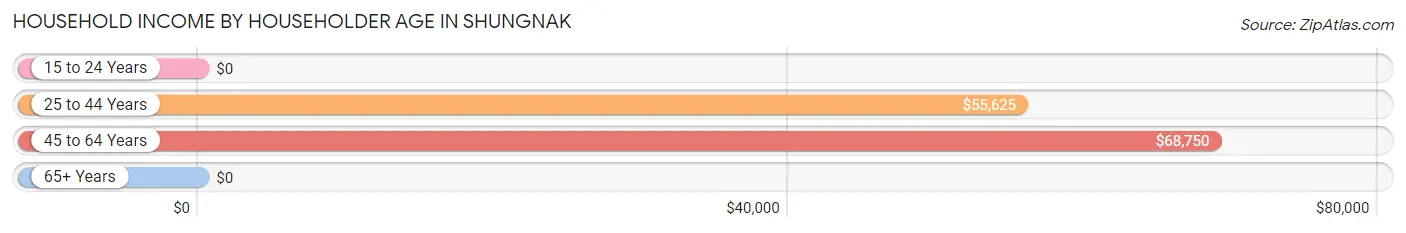
| Income Bracket | # Households | Median Income |
| 15 to 24 Years | 0 (0.0%) | $0 |
| 25 to 44 Years | 17 (37.0%) | $55,625 |
| 45 to 64 Years | 16 (34.8%) | $68,750 |
| 65+ Years | 13 (28.3%) | $0 |
| Total | 46 (100.0%) | $68,750 |
Poverty in Shungnak
Income Below Poverty by Sex and Age in Shungnak
With 25.2% poverty level for males and 40.5% for females among the residents of Shungnak, 45 to 54 year old males and 12 to 14 year old females are the most vulnerable to poverty, with 6 males (60.0%) and 4 females (100.0%) in their respective age groups living below the poverty level.
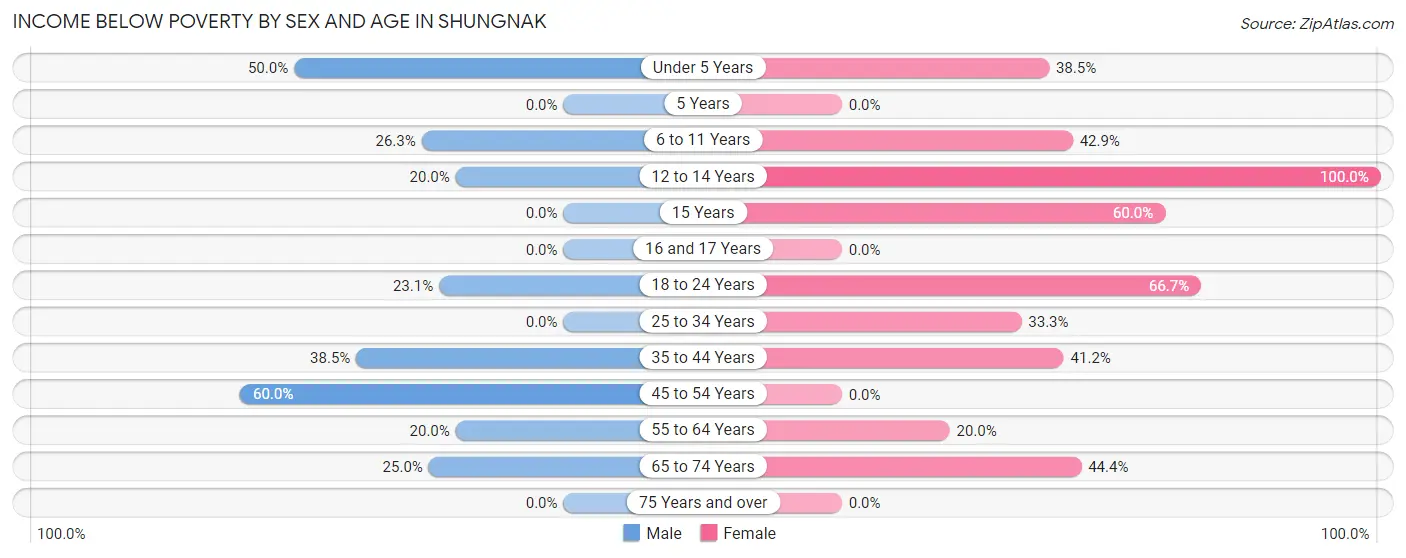
| Age Bracket | Male | Female |
| Under 5 Years | 4 (50.0%) | 5 (38.5%) |
| 5 Years | 0 (0.0%) | 0 (0.0%) |
| 6 to 11 Years | 5 (26.3%) | 9 (42.9%) |
| 12 to 14 Years | 2 (20.0%) | 4 (100.0%) |
| 15 Years | 0 (0.0%) | 3 (60.0%) |
| 16 and 17 Years | 0 (0.0%) | 0 (0.0%) |
| 18 to 24 Years | 3 (23.1%) | 6 (66.7%) |
| 25 to 34 Years | 0 (0.0%) | 7 (33.3%) |
| 35 to 44 Years | 5 (38.5%) | 7 (41.2%) |
| 45 to 54 Years | 6 (60.0%) | 0 (0.0%) |
| 55 to 64 Years | 2 (20.0%) | 2 (20.0%) |
| 65 to 74 Years | 3 (25.0%) | 4 (44.4%) |
| 75 Years and over | 0 (0.0%) | 0 (0.0%) |
| Total | 30 (25.2%) | 47 (40.5%) |
Income Above Poverty by Sex and Age in Shungnak
According to the poverty statistics in Shungnak, males aged 5 years and females aged 16 and 17 years are the age groups that are most secure financially, with 100.0% of males and 100.0% of females in these age groups living above the poverty line.
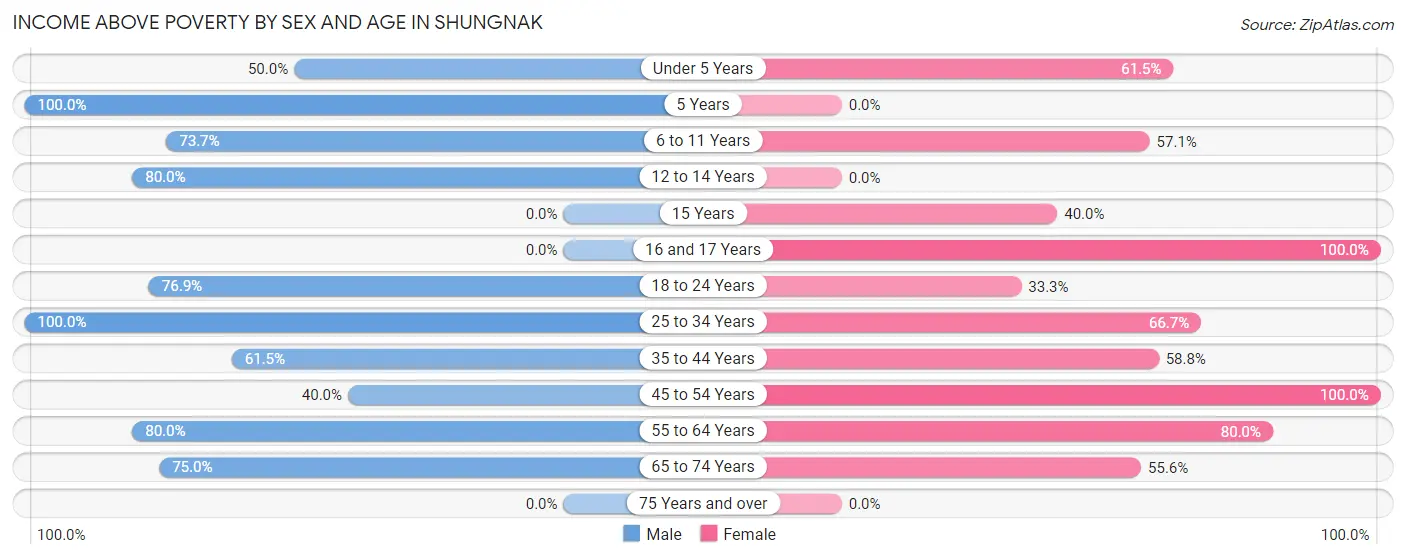
| Age Bracket | Male | Female |
| Under 5 Years | 4 (50.0%) | 8 (61.5%) |
| 5 Years | 1 (100.0%) | 0 (0.0%) |
| 6 to 11 Years | 14 (73.7%) | 12 (57.1%) |
| 12 to 14 Years | 8 (80.0%) | 0 (0.0%) |
| 15 Years | 0 (0.0%) | 2 (40.0%) |
| 16 and 17 Years | 0 (0.0%) | 2 (100.0%) |
| 18 to 24 Years | 10 (76.9%) | 3 (33.3%) |
| 25 to 34 Years | 23 (100.0%) | 14 (66.7%) |
| 35 to 44 Years | 8 (61.5%) | 10 (58.8%) |
| 45 to 54 Years | 4 (40.0%) | 5 (100.0%) |
| 55 to 64 Years | 8 (80.0%) | 8 (80.0%) |
| 65 to 74 Years | 9 (75.0%) | 5 (55.6%) |
| 75 Years and over | 0 (0.0%) | 0 (0.0%) |
| Total | 89 (74.8%) | 69 (59.5%) |
Income Below Poverty Among Married-Couple Families in Shungnak
The poverty statistics for married-couple families in Shungnak show that 31.6% or 6 of the total 19 families live below the poverty line. Families with 3 or 4 children have the highest poverty rate of 100.0%, comprising of 3 families. On the other hand, families with no children have the lowest poverty rate of 0.0%, which includes 0 families.
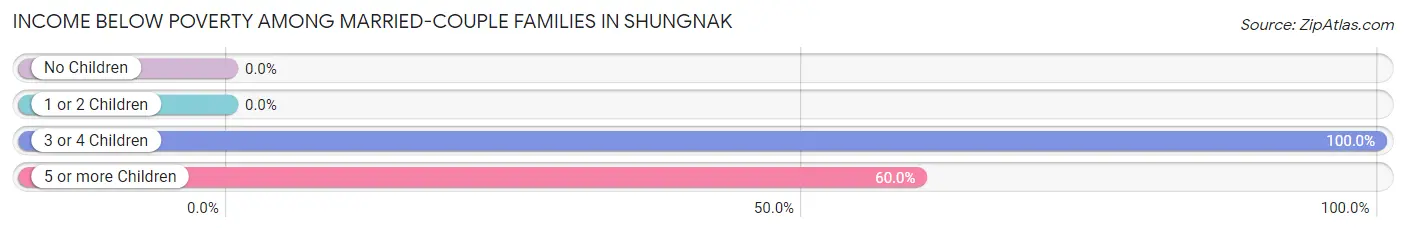
| Children | Above Poverty | Below Poverty |
| No Children | 4 (100.0%) | 0 (0.0%) |
| 1 or 2 Children | 7 (100.0%) | 0 (0.0%) |
| 3 or 4 Children | 0 (0.0%) | 3 (100.0%) |
| 5 or more Children | 2 (40.0%) | 3 (60.0%) |
| Total | 13 (68.4%) | 6 (31.6%) |
Income Below Poverty Among Single-Parent Households in Shungnak
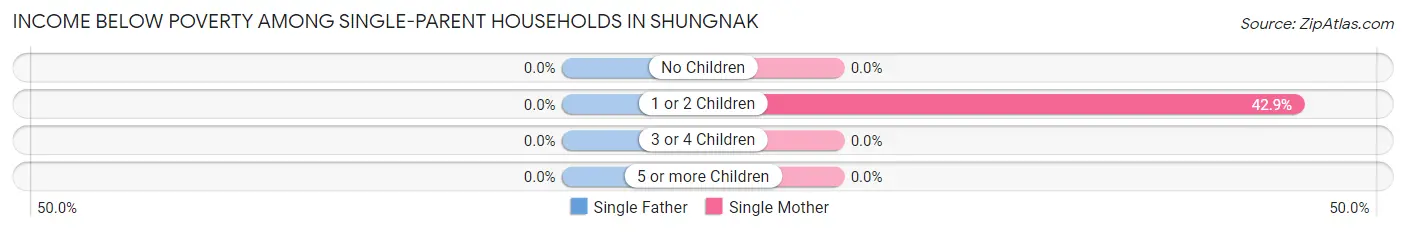
| Children | Single Father | Single Mother |
| No Children | 0 (0.0%) | 0 (0.0%) |
| 1 or 2 Children | 0 (0.0%) | 3 (42.9%) |
| 3 or 4 Children | 0 (0.0%) | 0 (0.0%) |
| 5 or more Children | 0 (0.0%) | 0 (0.0%) |
| Total | 0 (0.0%) | 3 (30.0%) |
Income Below Poverty Among Married-Couple vs Single-Parent Households in Shungnak
The poverty data for Shungnak shows that 6 of the married-couple family households (31.6%) and 3 of the single-parent households (17.6%) are living below the poverty level. Within the married-couple family households, those with 3 or 4 children have the highest poverty rate, with 3 households (100.0%) falling below the poverty line. Among the single-parent households, those with 1 or 2 children have the highest poverty rate, with 3 household (25.0%) living below poverty.
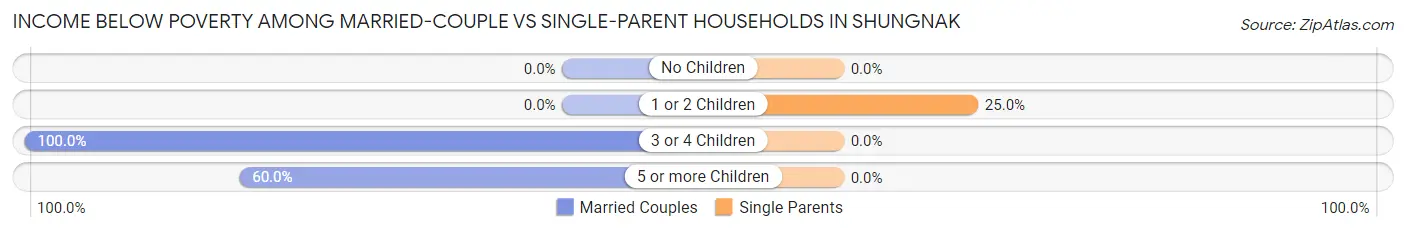
| Children | Married-Couple Families | Single-Parent Households |
| No Children | 0 (0.0%) | 0 (0.0%) |
| 1 or 2 Children | 0 (0.0%) | 3 (25.0%) |
| 3 or 4 Children | 3 (100.0%) | 0 (0.0%) |
| 5 or more Children | 3 (60.0%) | 0 (0.0%) |
| Total | 6 (31.6%) | 3 (17.6%) |
Race in Shungnak
The most populous races in Shungnak are , and Native / Alaskan (244 | 100.0%).
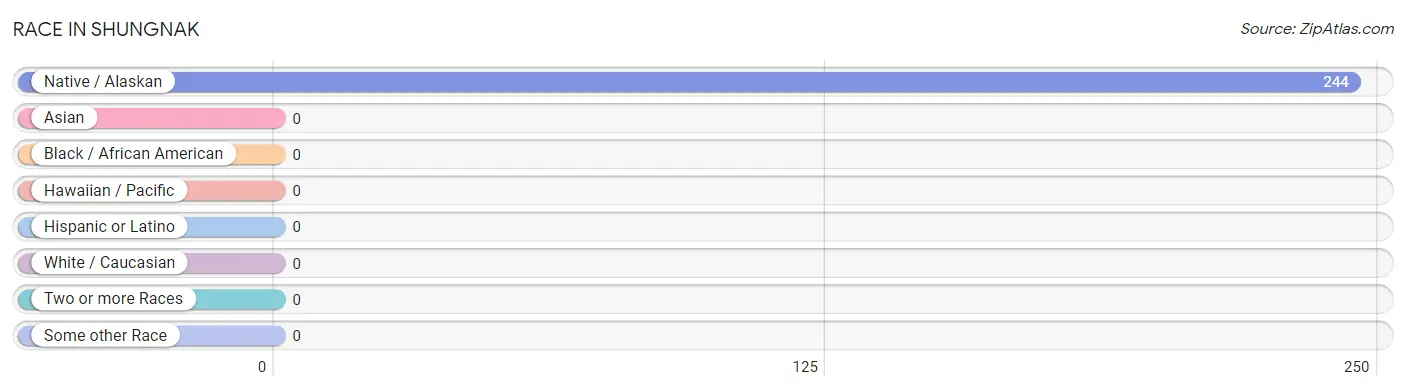
| Race | # Population | % Population |
| Asian | 0 | 0.0% |
| Black / African American | 0 | 0.0% |
| Hawaiian / Pacific | 0 | 0.0% |
| Hispanic or Latino | 0 | 0.0% |
| Native / Alaskan | 244 | 100.0% |
| White / Caucasian | 0 | 0.0% |
| Two or more Races | 0 | 0.0% |
| Some other Race | 0 | 0.0% |
| Total | 244 | 100.0% |
Ancestry in Shungnak
The most populous ancestries reported in Shungnak are , and Inupiat (244 | 100.0%), together accounting for 100.0% of all Shungnak residents.

| Ancestry | # Population | % Population |
| Inupiat | 244 | 100.0% | View All 1 Rows |
Immigrants in Shungnak

| Immigration Origin | # Population | % Population | View All 0 Rows |
Sex and Age in Shungnak
Sex and Age in Shungnak
The most populous age groups in Shungnak are 10 to 14 Years (18 | 14.4%) for men and Under 5 Years (16 | 13.5%) for women.
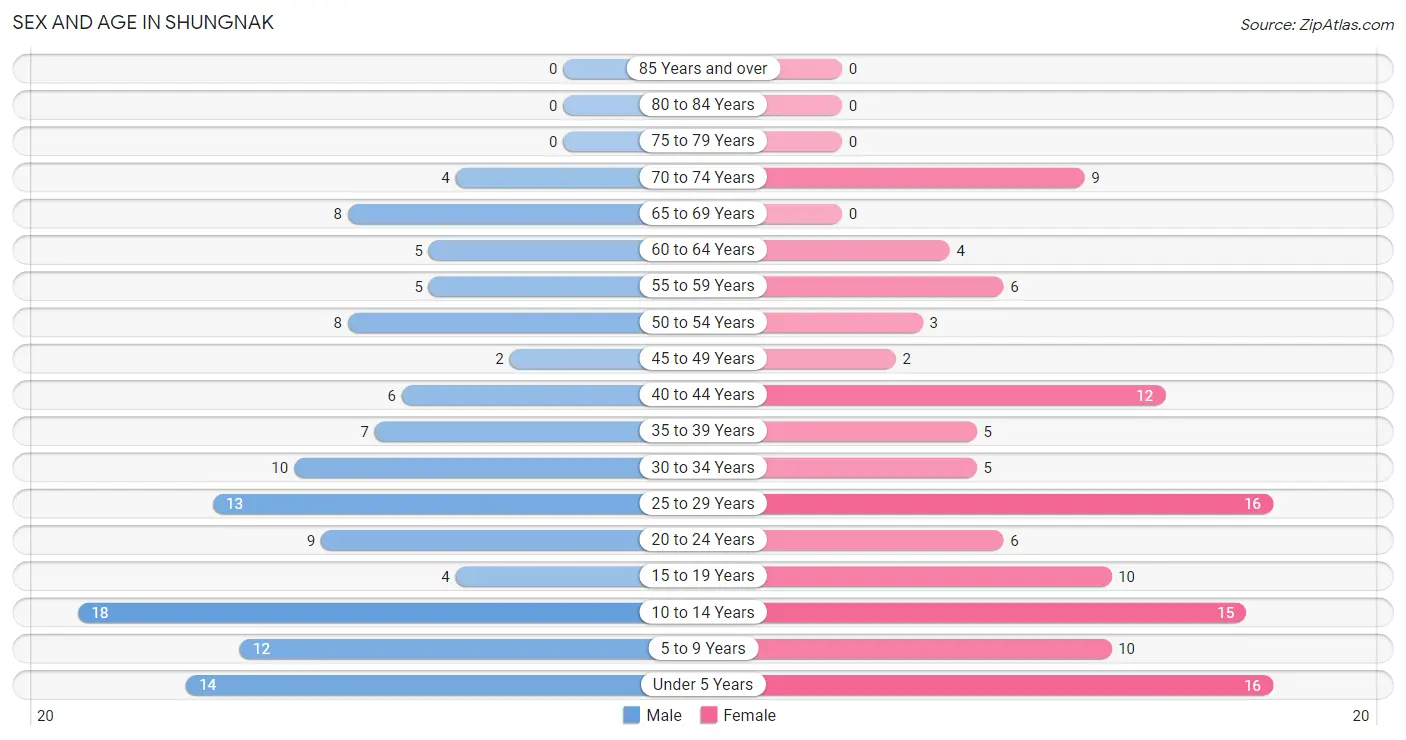
| Age Bracket | Male | Female |
| Under 5 Years | 14 (11.2%) | 16 (13.5%) |
| 5 to 9 Years | 12 (9.6%) | 10 (8.4%) |
| 10 to 14 Years | 18 (14.4%) | 15 (12.6%) |
| 15 to 19 Years | 4 (3.2%) | 10 (8.4%) |
| 20 to 24 Years | 9 (7.2%) | 6 (5.0%) |
| 25 to 29 Years | 13 (10.4%) | 16 (13.5%) |
| 30 to 34 Years | 10 (8.0%) | 5 (4.2%) |
| 35 to 39 Years | 7 (5.6%) | 5 (4.2%) |
| 40 to 44 Years | 6 (4.8%) | 12 (10.1%) |
| 45 to 49 Years | 2 (1.6%) | 2 (1.7%) |
| 50 to 54 Years | 8 (6.4%) | 3 (2.5%) |
| 55 to 59 Years | 5 (4.0%) | 6 (5.0%) |
| 60 to 64 Years | 5 (4.0%) | 4 (3.4%) |
| 65 to 69 Years | 8 (6.4%) | 0 (0.0%) |
| 70 to 74 Years | 4 (3.2%) | 9 (7.6%) |
| 75 to 79 Years | 0 (0.0%) | 0 (0.0%) |
| 80 to 84 Years | 0 (0.0%) | 0 (0.0%) |
| 85 Years and over | 0 (0.0%) | 0 (0.0%) |
| Total | 125 (100.0%) | 119 (100.0%) |
Families and Households in Shungnak
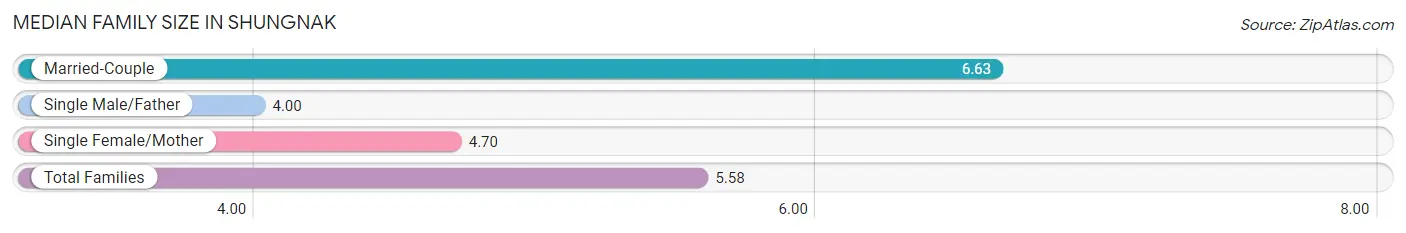
Median Family Size in Shungnak
The median family size in Shungnak is 5.58 persons per family, with married-couple families (19 | 52.8%) accounting for the largest median family size of 6.63 persons per family. On the other hand, single male/father families (7 | 19.4%) represent the smallest median family size with 4.00 persons per family.
| Family Type | # Families | Family Size |
| Married-Couple | 19 (52.8%) | 6.63 |
| Single Male/Father | 7 (19.4%) | 4.00 |
| Single Female/Mother | 10 (27.8%) | 4.70 |
| Total Families | 36 (100.0%) | 5.58 |
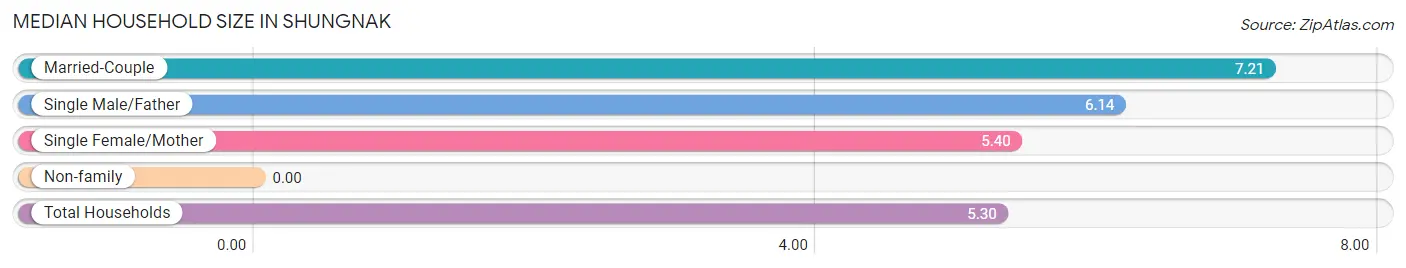
Median Household Size in Shungnak
| Household Type | # Households | Household Size |
| Married-Couple | 19 (41.3%) | 7.21 |
| Single Male/Father | 7 (15.2%) | 6.14 |
| Single Female/Mother | 10 (21.7%) | 5.40 |
| Non-family | 10 (21.7%) | - |
| Total Households | 46 (100.0%) | 5.30 |
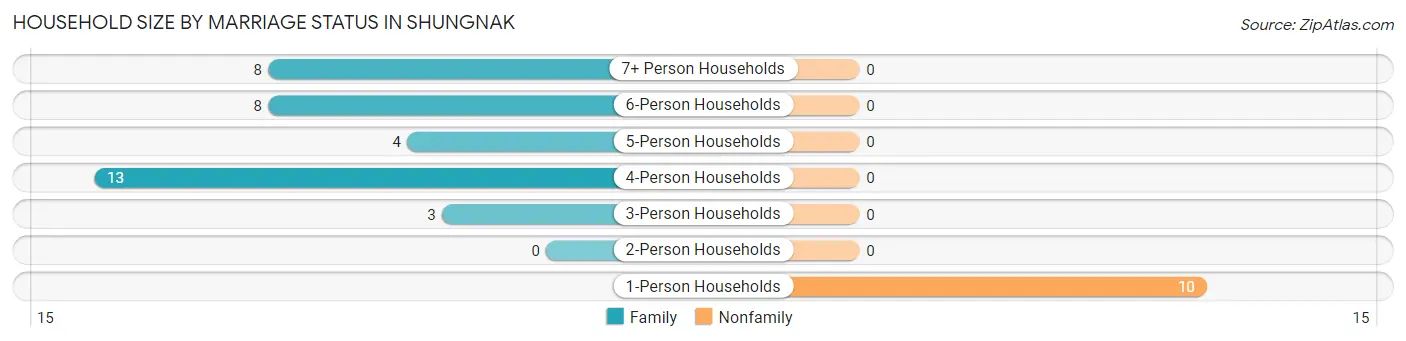
Household Size by Marriage Status in Shungnak
Out of a total of 46 households in Shungnak, 36 (78.3%) are family households, while 10 (21.7%) are nonfamily households. The most numerous type of family households are 4-person households, comprising 13, and the most common type of nonfamily households are 1-person households, comprising 10.
| Household Size | Family Households | Nonfamily Households |
| 1-Person Households | - | 10 (21.7%) |
| 2-Person Households | 0 (0.0%) | 0 (0.0%) |
| 3-Person Households | 3 (6.5%) | 0 (0.0%) |
| 4-Person Households | 13 (28.3%) | 0 (0.0%) |
| 5-Person Households | 4 (8.7%) | 0 (0.0%) |
| 6-Person Households | 8 (17.4%) | 0 (0.0%) |
| 7+ Person Households | 8 (17.4%) | 0 (0.0%) |
| Total | 36 (78.3%) | 10 (21.7%) |
Female Fertility in Shungnak
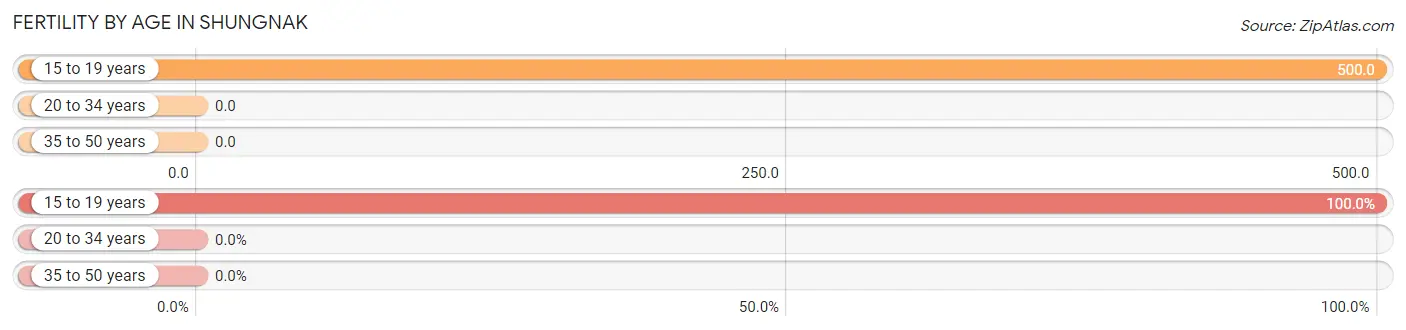
Fertility by Age in Shungnak
Average fertility rate in Shungnak is 89.0 births per 1,000 women. Women in the age bracket of 15 to 19 years have the highest fertility rate with 500.0 births per 1,000 women. Women in the age bracket of 15 to 19 years acount for 100.0% of all women with births.
| Age Bracket | Women with Births | Births / 1,000 Women |
| 15 to 19 years | 5 (100.0%) | 500.0 |
| 20 to 34 years | 0 (0.0%) | 0.0 |
| 35 to 50 years | 0 (0.0%) | 0.0 |
| Total | 5 (100.0%) | 89.0 |
Fertility by Age by Marriage Status in Shungnak
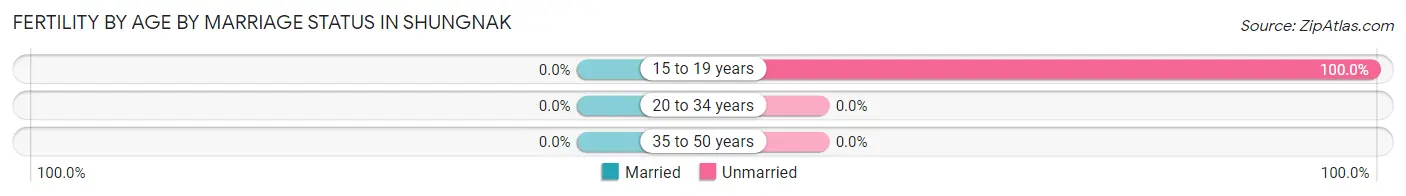
| Age Bracket | Married | Unmarried |
| 15 to 19 years | 0 (0.0%) | 5 (100.0%) |
| 20 to 34 years | 0 (0.0%) | 0 (0.0%) |
| 35 to 50 years | 0 (0.0%) | 0 (0.0%) |
| Total | 0 (0.0%) | 5 (100.0%) |
Fertility by Education in Shungnak
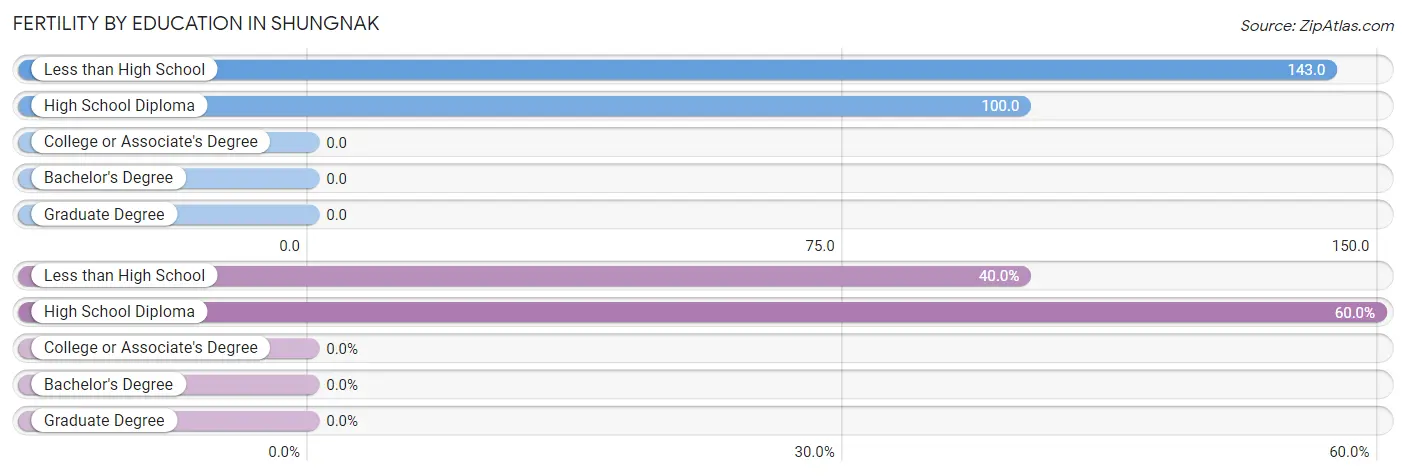
| Educational Attainment | Women with Births | Births / 1,000 Women |
| Less than High School | 2 (40.0%) | 143.0 |
| High School Diploma | 3 (60.0%) | 100.0 |
| College or Associate's Degree | 0 (0.0%) | 0.0 |
| Bachelor's Degree | 0 (0.0%) | 0.0 |
| Graduate Degree | 0 (0.0%) | 0.0 |
| Total | 5 (100.0%) | 89.0 |
Fertility by Education by Marriage Status in Shungnak
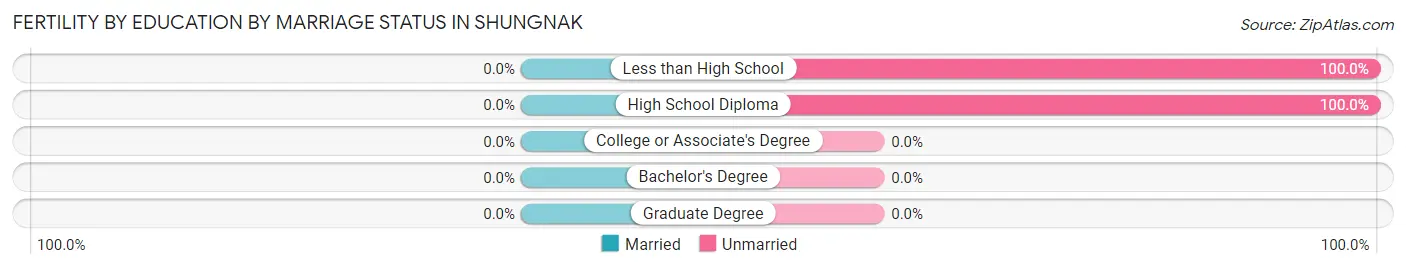
| Educational Attainment | Married | Unmarried |
| Less than High School | 0 (0.0%) | 2 (100.0%) |
| High School Diploma | 0 (0.0%) | 3 (100.0%) |
| College or Associate's Degree | 0 (0.0%) | 0 (0.0%) |
| Bachelor's Degree | 0 (0.0%) | 0 (0.0%) |
| Graduate Degree | 0 (0.0%) | 0 (0.0%) |
| Total | 0 (0.0%) | 5 (100.0%) |
Employment Characteristics in Shungnak
Employment by Class of Employer in Shungnak
Among the 76 employed individuals in Shungnak, private company employees (26 | 34.2%), local government employees (21 | 27.6%), and not-for-profit organizations (18 | 23.7%) make up the most common classes of employment.
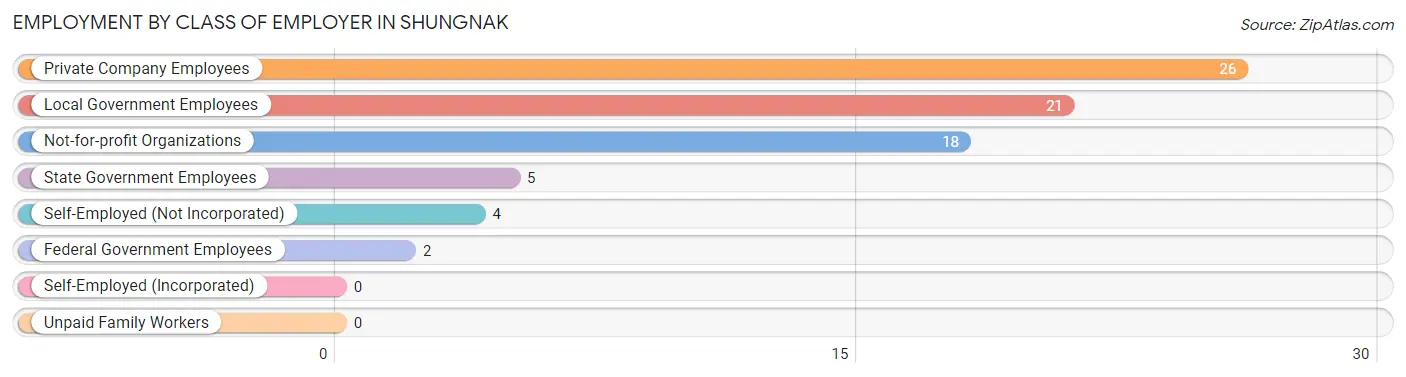
| Employer Class | # Employees | % Employees |
| Private Company Employees | 26 | 34.2% |
| Self-Employed (Incorporated) | 0 | 0.0% |
| Self-Employed (Not Incorporated) | 4 | 5.3% |
| Not-for-profit Organizations | 18 | 23.7% |
| Local Government Employees | 21 | 27.6% |
| State Government Employees | 5 | 6.6% |
| Federal Government Employees | 2 | 2.6% |
| Unpaid Family Workers | 0 | 0.0% |
| Total | 76 | 100.0% |
Employment Status by Age in Shungnak
According to the labor force statistics for Shungnak, out of the total population over 16 years of age (154), 65.6% or 101 individuals are in the labor force, with 21.8% or 22 of them unemployed. The age group with the highest labor force participation rate is 30 to 34 years, with 93.3% or 14 individuals in the labor force. Within the labor force, the 25 to 29 years age range has the highest percentage of unemployed individuals, with 33.3% or 9 of them being unemployed.
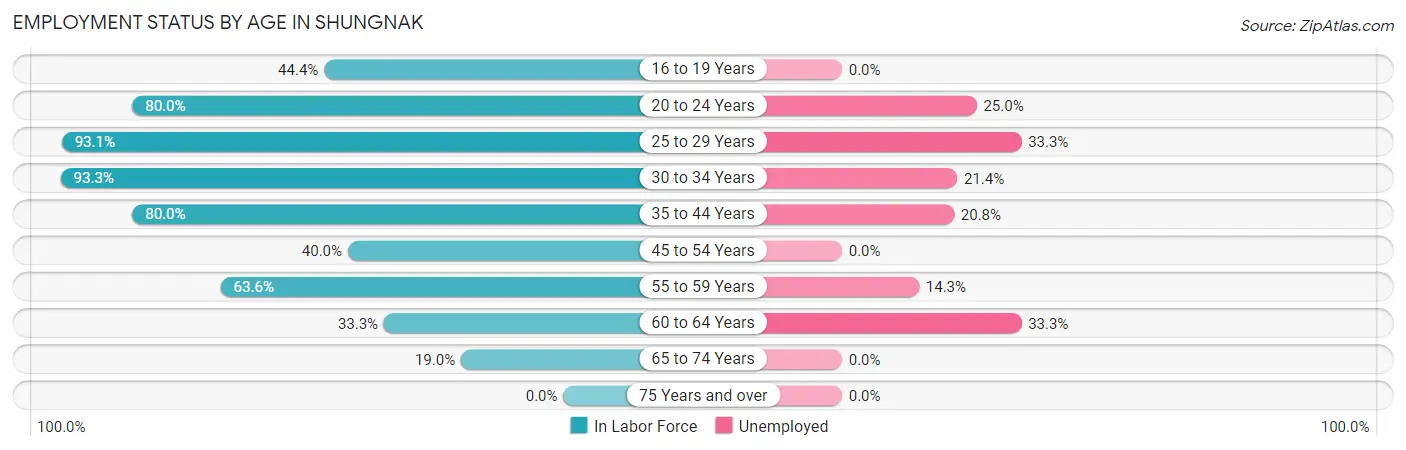
| Age Bracket | In Labor Force | Unemployed |
| 16 to 19 Years | 4 (44.4%) | 0 (0.0%) |
| 20 to 24 Years | 12 (80.0%) | 3 (25.0%) |
| 25 to 29 Years | 27 (93.1%) | 9 (33.3%) |
| 30 to 34 Years | 14 (93.3%) | 3 (21.4%) |
| 35 to 44 Years | 24 (80.0%) | 5 (20.8%) |
| 45 to 54 Years | 6 (40.0%) | 0 (0.0%) |
| 55 to 59 Years | 7 (63.6%) | 1 (14.3%) |
| 60 to 64 Years | 3 (33.3%) | 1 (33.3%) |
| 65 to 74 Years | 4 (19.0%) | 0 (0.0%) |
| 75 Years and over | 0 (0.0%) | 0 (0.0%) |
| Total | 101 (65.6%) | 22 (21.8%) |
Employment Status by Educational Attainment in Shungnak
According to labor force statistics for Shungnak, 74.3% of individuals (81) out of the total population between 25 and 64 years of age (109) are in the labor force, with 23.5% or 19 of them being unemployed. The group with the highest labor force participation rate are those with the educational attainment of bachelor's degree or higher, with 100.0% or 3 individuals in the labor force. Within the labor force, individuals with bachelor's degree or higher education have the highest percentage of unemployment, with 100.0% or 3 of them being unemployed.
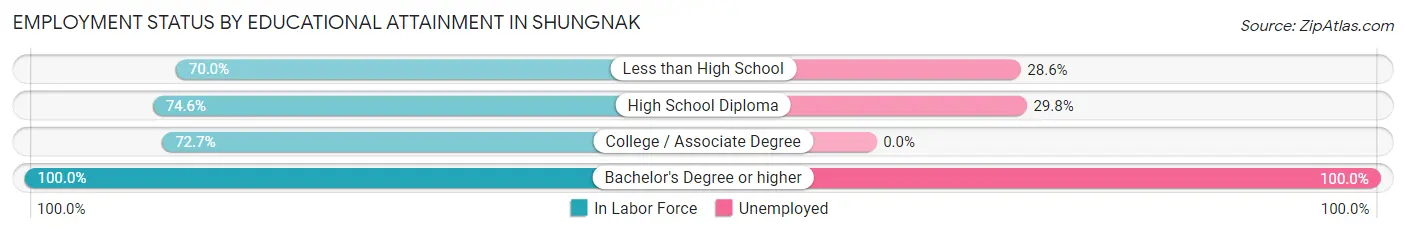
| Educational Attainment | In Labor Force | Unemployed |
| Less than High School | 7 (70.0%) | 3 (28.6%) |
| High School Diploma | 47 (74.6%) | 19 (29.8%) |
| College / Associate Degree | 24 (72.7%) | 0 (0.0%) |
| Bachelor's Degree or higher | 3 (100.0%) | 3 (100.0%) |
| Total | 81 (74.3%) | 26 (23.5%) |
Employment Occupations by Sex in Shungnak
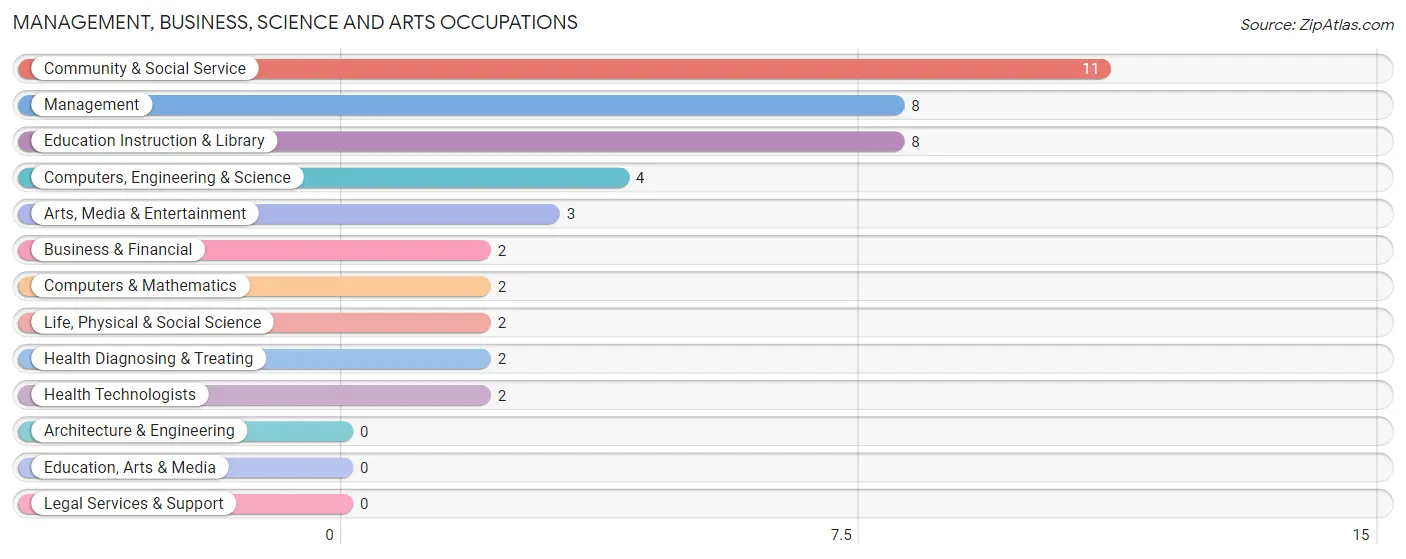
Management, Business, Science and Arts Occupations
The most common Management, Business, Science and Arts occupations in Shungnak are Community & Social Service (11 | 13.9%), Management (8 | 10.1%), Education Instruction & Library (8 | 10.1%), Computers, Engineering & Science (4 | 5.1%), and Arts, Media & Entertainment (3 | 3.8%).
Management, Business, Science and Arts Occupations by Sex
Within the Management, Business, Science and Arts occupations in Shungnak, the most male-oriented occupations are Business & Financial (100.0%), Life, Physical & Social Science (100.0%), and Arts, Media & Entertainment (100.0%), while the most female-oriented occupations are Computers & Mathematics (100.0%), Health Diagnosing & Treating (100.0%), and Health Technologists (100.0%).
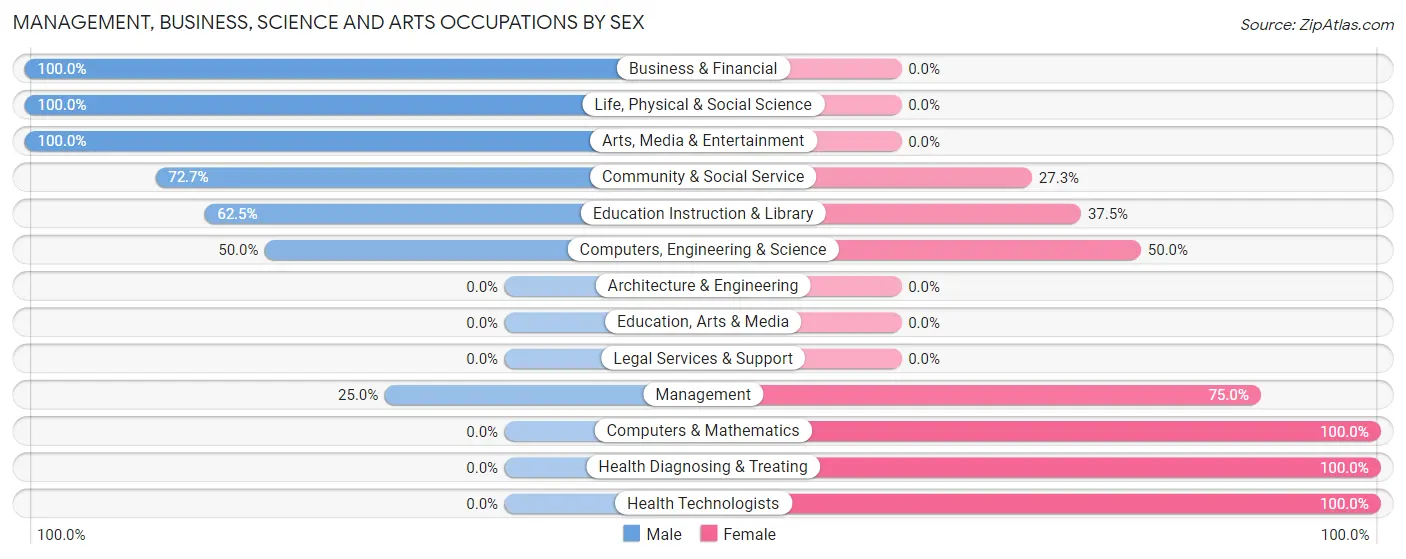
| Occupation | Male | Female |
| Management | 2 (25.0%) | 6 (75.0%) |
| Business & Financial | 2 (100.0%) | 0 (0.0%) |
| Computers, Engineering & Science | 2 (50.0%) | 2 (50.0%) |
| Computers & Mathematics | 0 (0.0%) | 2 (100.0%) |
| Architecture & Engineering | 0 (0.0%) | 0 (0.0%) |
| Life, Physical & Social Science | 2 (100.0%) | 0 (0.0%) |
| Community & Social Service | 8 (72.7%) | 3 (27.3%) |
| Education, Arts & Media | 0 (0.0%) | 0 (0.0%) |
| Legal Services & Support | 0 (0.0%) | 0 (0.0%) |
| Education Instruction & Library | 5 (62.5%) | 3 (37.5%) |
| Arts, Media & Entertainment | 3 (100.0%) | 0 (0.0%) |
| Health Diagnosing & Treating | 0 (0.0%) | 2 (100.0%) |
| Health Technologists | 0 (0.0%) | 2 (100.0%) |
| Total (Category) | 14 (51.8%) | 13 (48.1%) |
| Total (Overall) | 41 (51.9%) | 38 (48.1%) |
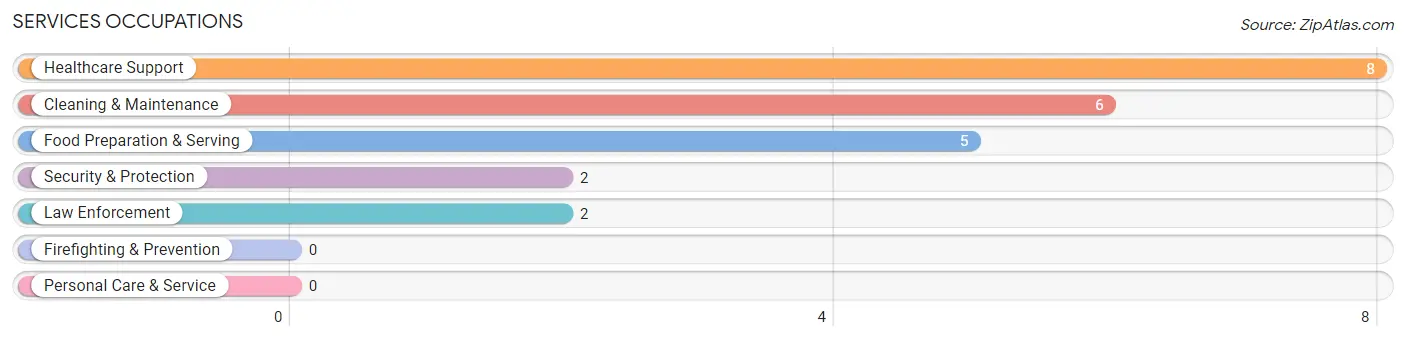
Services Occupations
The most common Services occupations in Shungnak are Healthcare Support (8 | 10.1%), Cleaning & Maintenance (6 | 7.6%), Food Preparation & Serving (5 | 6.3%), Security & Protection (2 | 2.5%), and Law Enforcement (2 | 2.5%).
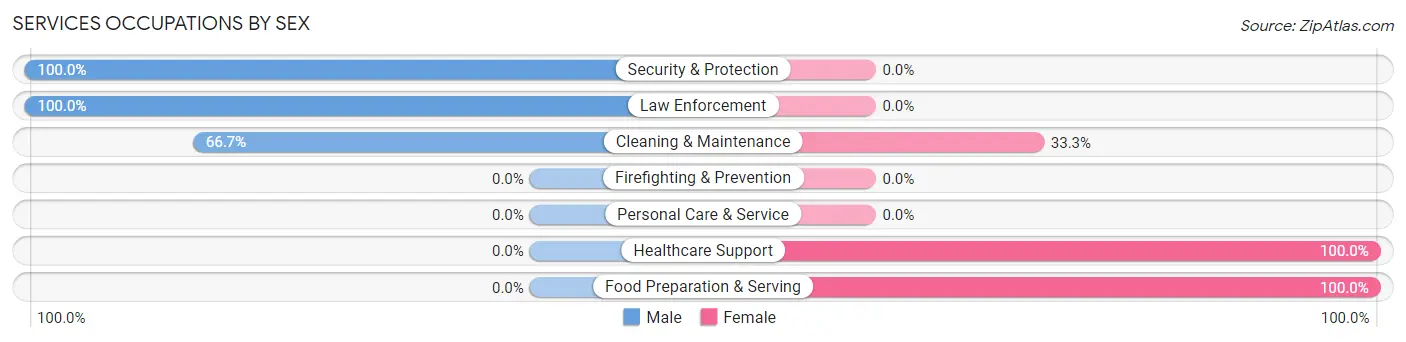
Services Occupations by Sex
Within the Services occupations in Shungnak, the most male-oriented occupations are Security & Protection (100.0%), Law Enforcement (100.0%), and Cleaning & Maintenance (66.7%), while the most female-oriented occupations are Healthcare Support (100.0%), Food Preparation & Serving (100.0%), and Cleaning & Maintenance (33.3%).
| Occupation | Male | Female |
| Healthcare Support | 0 (0.0%) | 8 (100.0%) |
| Security & Protection | 2 (100.0%) | 0 (0.0%) |
| Firefighting & Prevention | 0 (0.0%) | 0 (0.0%) |
| Law Enforcement | 2 (100.0%) | 0 (0.0%) |
| Food Preparation & Serving | 0 (0.0%) | 5 (100.0%) |
| Cleaning & Maintenance | 4 (66.7%) | 2 (33.3%) |
| Personal Care & Service | 0 (0.0%) | 0 (0.0%) |
| Total (Category) | 6 (28.6%) | 15 (71.4%) |
| Total (Overall) | 41 (51.9%) | 38 (48.1%) |
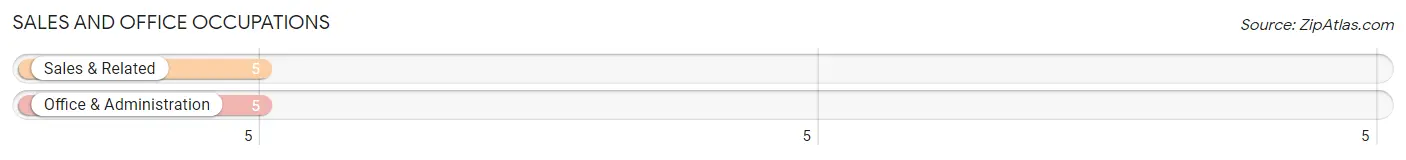
Sales and Office Occupations
The most common Sales and Office occupations in Shungnak are Sales & Related (5 | 6.3%), and Office & Administration (5 | 6.3%).
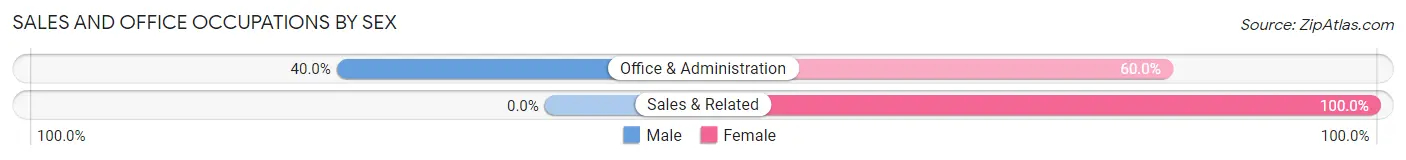
Sales and Office Occupations by Sex
| Occupation | Male | Female |
| Sales & Related | 0 (0.0%) | 5 (100.0%) |
| Office & Administration | 2 (40.0%) | 3 (60.0%) |
| Total (Category) | 2 (20.0%) | 8 (80.0%) |
| Total (Overall) | 41 (51.9%) | 38 (48.1%) |
Natural Resources, Construction and Maintenance Occupations
The most common Natural Resources, Construction and Maintenance occupations in Shungnak are Construction & Extraction (2 | 2.5%), and Installation, Maintenance & Repair (2 | 2.5%).
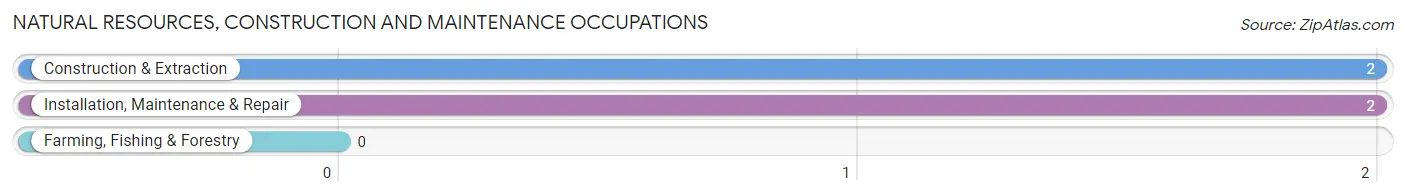
Natural Resources, Construction and Maintenance Occupations by Sex
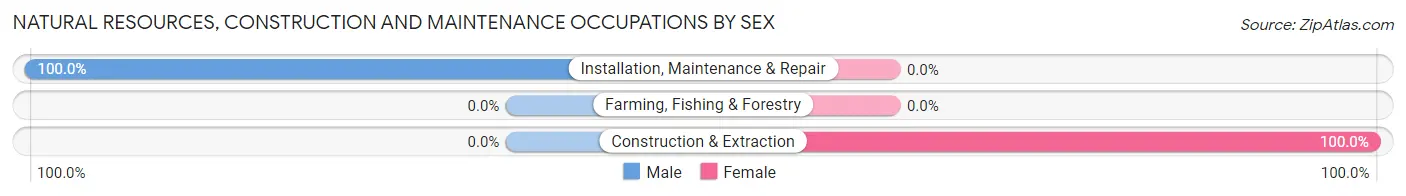
| Occupation | Male | Female |
| Farming, Fishing & Forestry | 0 (0.0%) | 0 (0.0%) |
| Construction & Extraction | 0 (0.0%) | 2 (100.0%) |
| Installation, Maintenance & Repair | 2 (100.0%) | 0 (0.0%) |
| Total (Category) | 2 (50.0%) | 2 (50.0%) |
| Total (Overall) | 41 (51.9%) | 38 (48.1%) |
Production, Transportation and Moving Occupations
The most common Production, Transportation and Moving occupations in Shungnak are Material Moving (9 | 11.4%), Production (6 | 7.6%), and Transportation (2 | 2.5%).
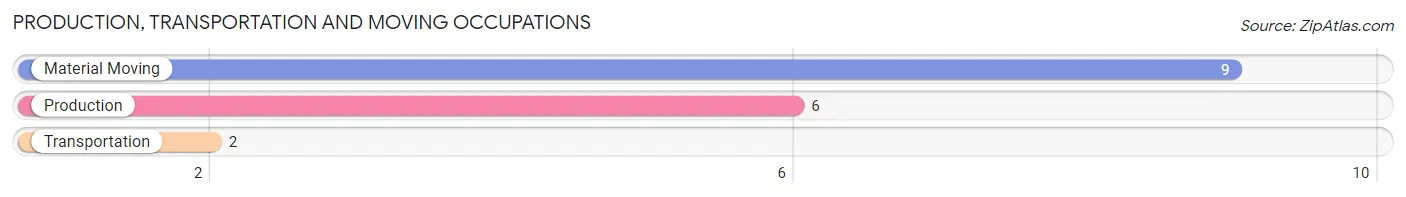
Production, Transportation and Moving Occupations by Sex
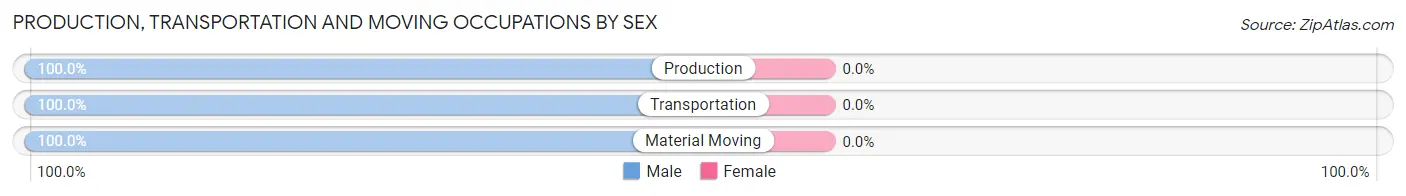
| Occupation | Male | Female |
| Production | 6 (100.0%) | 0 (0.0%) |
| Transportation | 2 (100.0%) | 0 (0.0%) |
| Material Moving | 9 (100.0%) | 0 (0.0%) |
| Total (Category) | 17 (100.0%) | 0 (0.0%) |
| Total (Overall) | 41 (51.9%) | 38 (48.1%) |
Employment Industries by Sex in Shungnak
Employment Industries in Shungnak
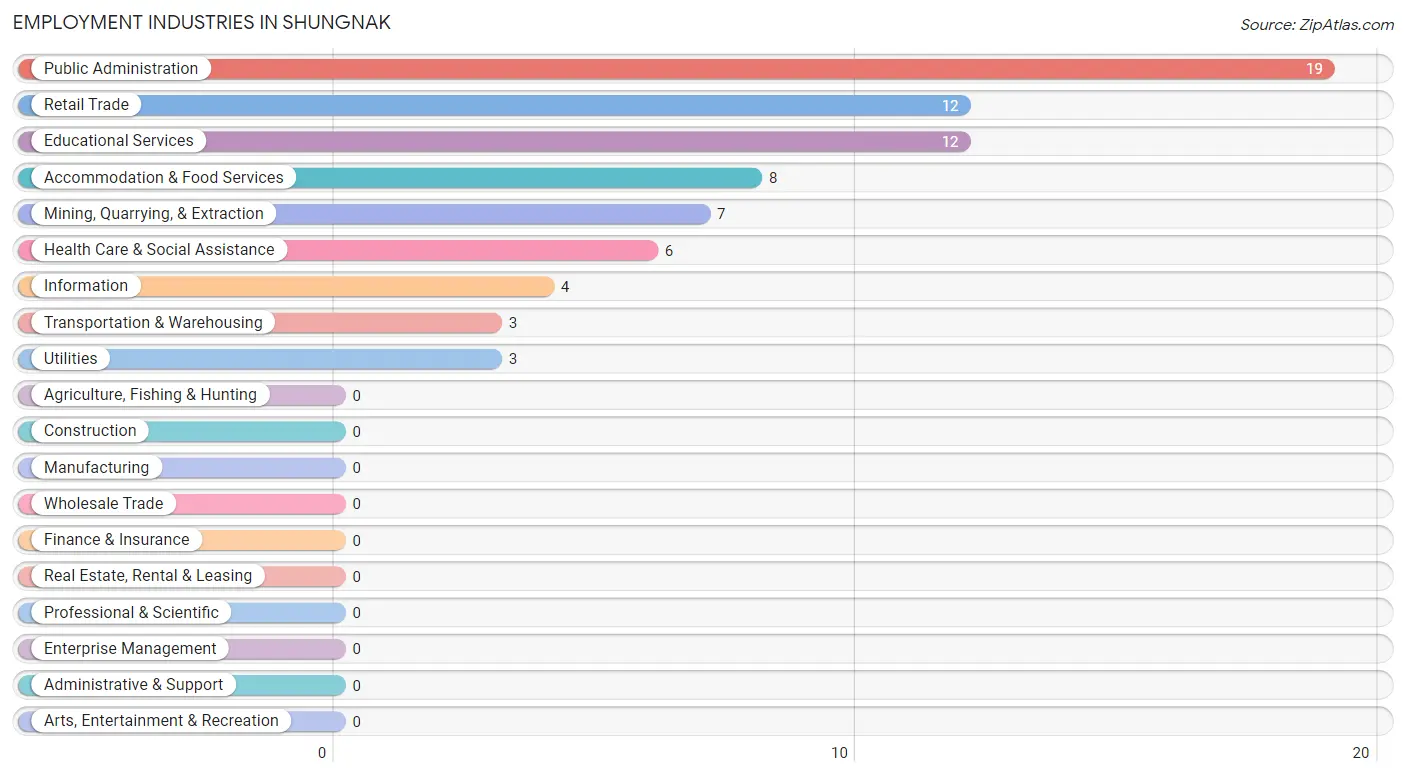
The major employment industries in Shungnak include Public Administration (19 | 24.0%), Retail Trade (12 | 15.2%), Educational Services (12 | 15.2%), Accommodation & Food Services (8 | 10.1%), and Mining, Quarrying, & Extraction (7 | 8.9%).
Employment Industries by Sex in Shungnak
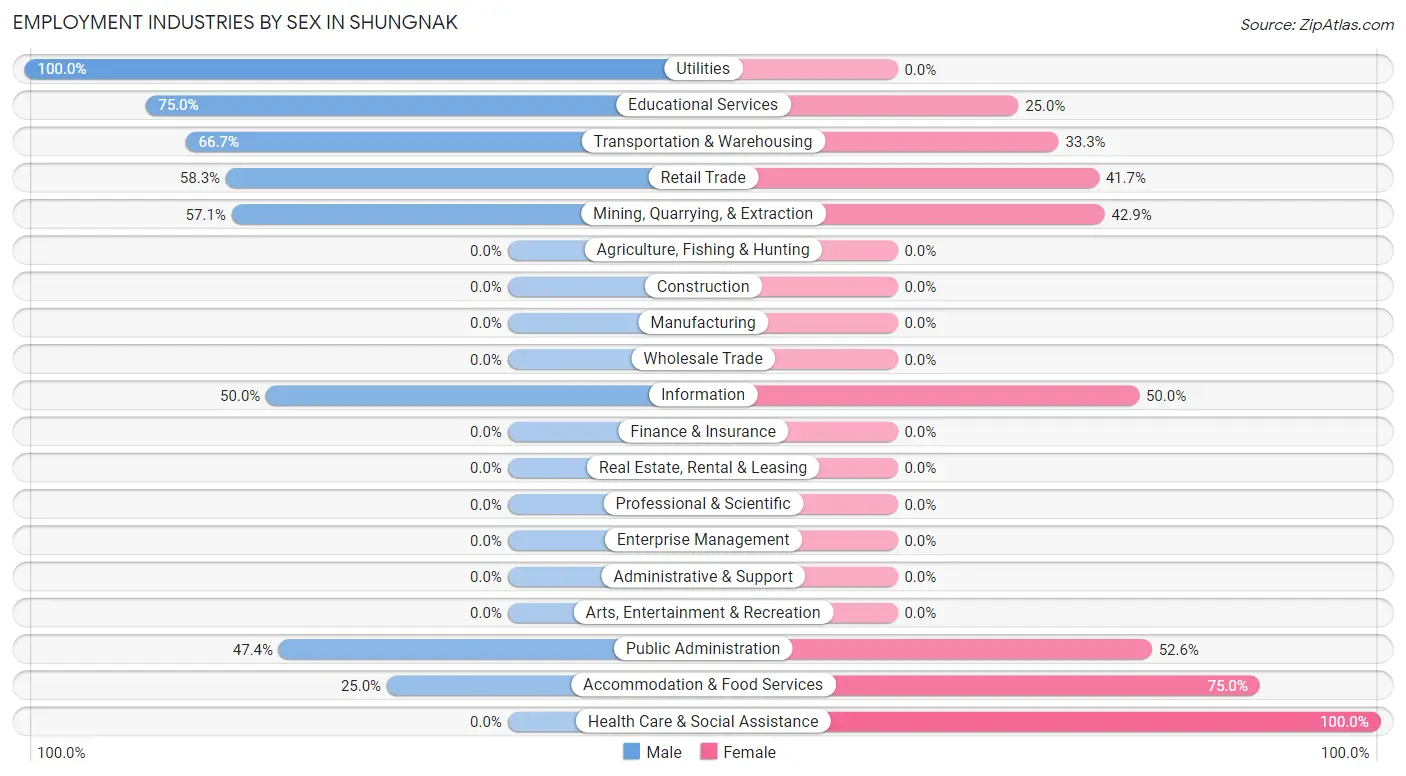
The Shungnak industries that see more men than women are Utilities (100.0%), Educational Services (75.0%), and Transportation & Warehousing (66.7%), whereas the industries that tend to have a higher number of women are Health Care & Social Assistance (100.0%), Accommodation & Food Services (75.0%), and Public Administration (52.6%).
| Industry | Male | Female |
| Agriculture, Fishing & Hunting | 0 (0.0%) | 0 (0.0%) |
| Mining, Quarrying, & Extraction | 4 (57.1%) | 3 (42.9%) |
| Construction | 0 (0.0%) | 0 (0.0%) |
| Manufacturing | 0 (0.0%) | 0 (0.0%) |
| Wholesale Trade | 0 (0.0%) | 0 (0.0%) |
| Retail Trade | 7 (58.3%) | 5 (41.7%) |
| Transportation & Warehousing | 2 (66.7%) | 1 (33.3%) |
| Utilities | 3 (100.0%) | 0 (0.0%) |
| Information | 2 (50.0%) | 2 (50.0%) |
| Finance & Insurance | 0 (0.0%) | 0 (0.0%) |
| Real Estate, Rental & Leasing | 0 (0.0%) | 0 (0.0%) |
| Professional & Scientific | 0 (0.0%) | 0 (0.0%) |
| Enterprise Management | 0 (0.0%) | 0 (0.0%) |
| Administrative & Support | 0 (0.0%) | 0 (0.0%) |
| Educational Services | 9 (75.0%) | 3 (25.0%) |
| Health Care & Social Assistance | 0 (0.0%) | 6 (100.0%) |
| Arts, Entertainment & Recreation | 0 (0.0%) | 0 (0.0%) |
| Accommodation & Food Services | 2 (25.0%) | 6 (75.0%) |
| Public Administration | 9 (47.4%) | 10 (52.6%) |
| Total | 41 (51.9%) | 38 (48.1%) |
Education in Shungnak
School Enrollment in Shungnak
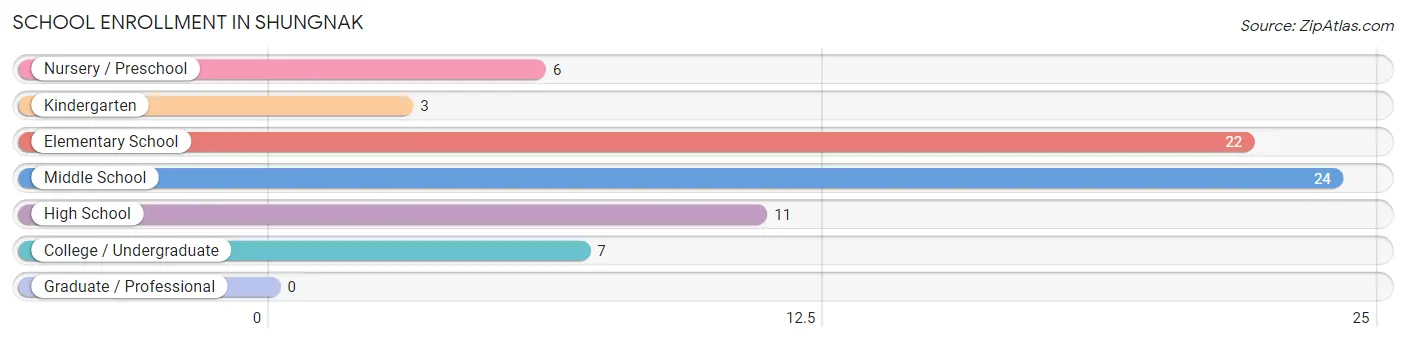
The most common levels of schooling among the 73 students in Shungnak are middle school (24 | 32.9%), elementary school (22 | 30.1%), and high school (11 | 15.1%).
| School Level | # Students | % Students |
| Nursery / Preschool | 6 | 8.2% |
| Kindergarten | 3 | 4.1% |
| Elementary School | 22 | 30.1% |
| Middle School | 24 | 32.9% |
| High School | 11 | 15.1% |
| College / Undergraduate | 7 | 9.6% |
| Graduate / Professional | 0 | 0.0% |
| Total | 73 | 100.0% |
School Enrollment by Age by Funding Source in Shungnak
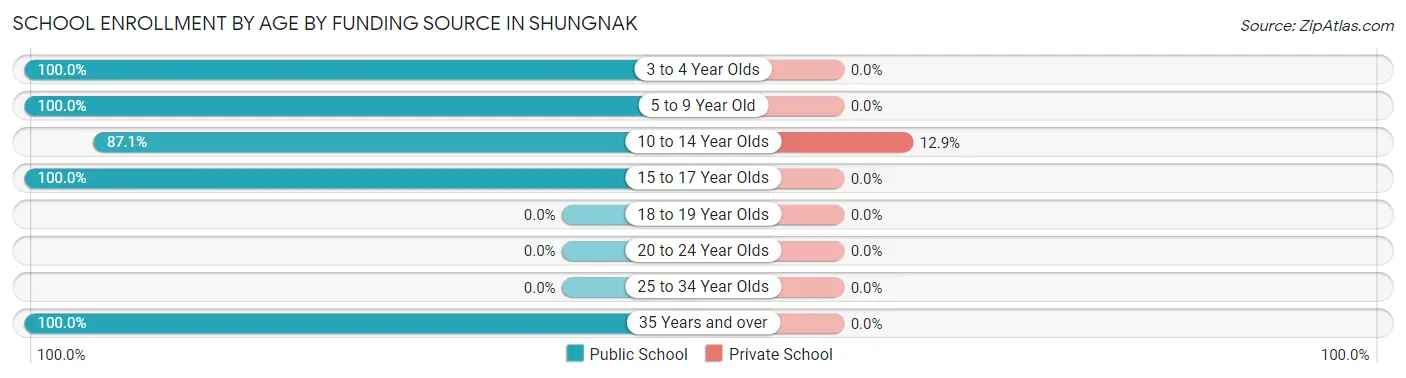
Out of a total of 73 students who are enrolled in schools in Shungnak, 4 (5.5%) attend a private institution, while the remaining 69 (94.5%) are enrolled in public schools. The age group of 10 to 14 year olds has the highest likelihood of being enrolled in private schools, with 4 (12.9% in the age bracket) enrolled. Conversely, the age group of 3 to 4 year olds has the lowest likelihood of being enrolled in a private school, with 6 (100.0% in the age bracket) attending a public institution.
| Age Bracket | Public School | Private School |
| 3 to 4 Year Olds | 6 (100.0%) | 0 (0.0%) |
| 5 to 9 Year Old | 22 (100.0%) | 0 (0.0%) |
| 10 to 14 Year Olds | 27 (87.1%) | 4 (12.9%) |
| 15 to 17 Year Olds | 7 (100.0%) | 0 (0.0%) |
| 18 to 19 Year Olds | 0 (0.0%) | 0 (0.0%) |
| 20 to 24 Year Olds | 0 (0.0%) | 0 (0.0%) |
| 25 to 34 Year Olds | 0 (0.0%) | 0 (0.0%) |
| 35 Years and over | 7 (100.0%) | 0 (0.0%) |
| Total | 69 (94.5%) | 4 (5.5%) |
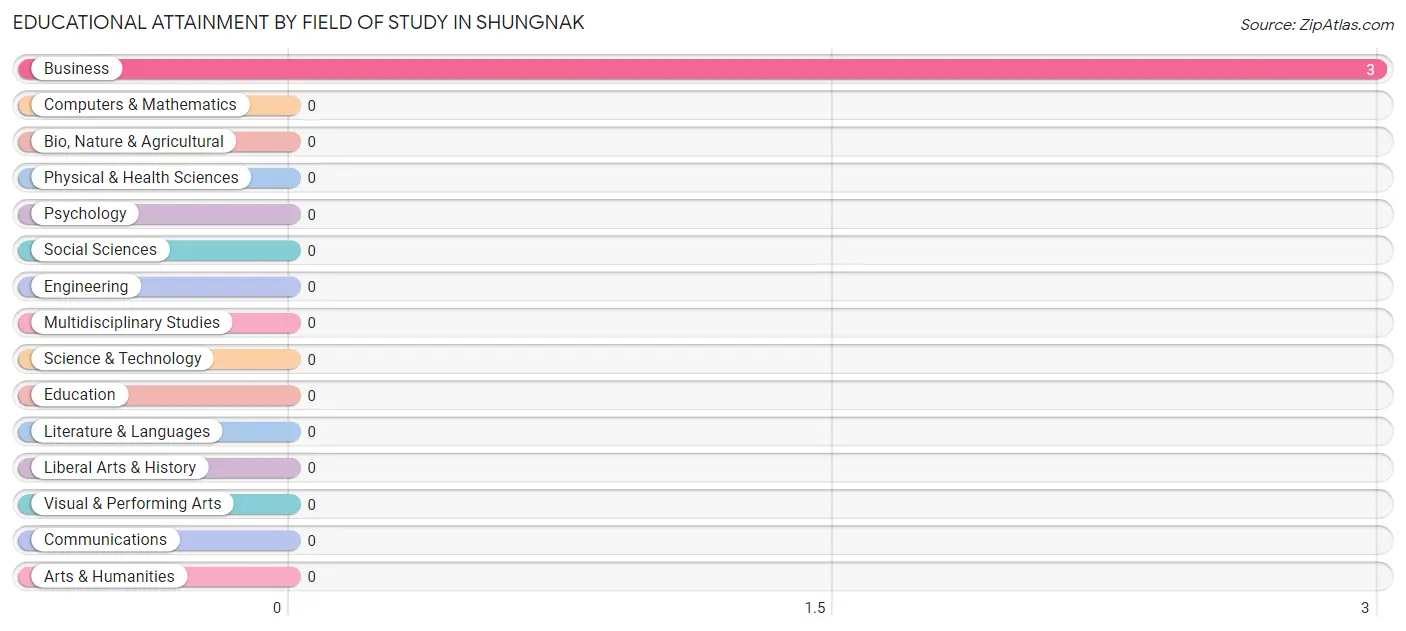
Educational Attainment by Field of Study in Shungnak
, and business (3 | 100.0%) are the most common fields of study among 3 individuals in Shungnak who have obtained a bachelor's degree or higher.
| Field of Study | # Graduates | % Graduates |
| Computers & Mathematics | 0 | 0.0% |
| Bio, Nature & Agricultural | 0 | 0.0% |
| Physical & Health Sciences | 0 | 0.0% |
| Psychology | 0 | 0.0% |
| Social Sciences | 0 | 0.0% |
| Engineering | 0 | 0.0% |
| Multidisciplinary Studies | 0 | 0.0% |
| Science & Technology | 0 | 0.0% |
| Business | 3 | 100.0% |
| Education | 0 | 0.0% |
| Literature & Languages | 0 | 0.0% |
| Liberal Arts & History | 0 | 0.0% |
| Visual & Performing Arts | 0 | 0.0% |
| Communications | 0 | 0.0% |
| Arts & Humanities | 0 | 0.0% |
| Total | 3 | 100.0% |
Transportation & Commute in Shungnak
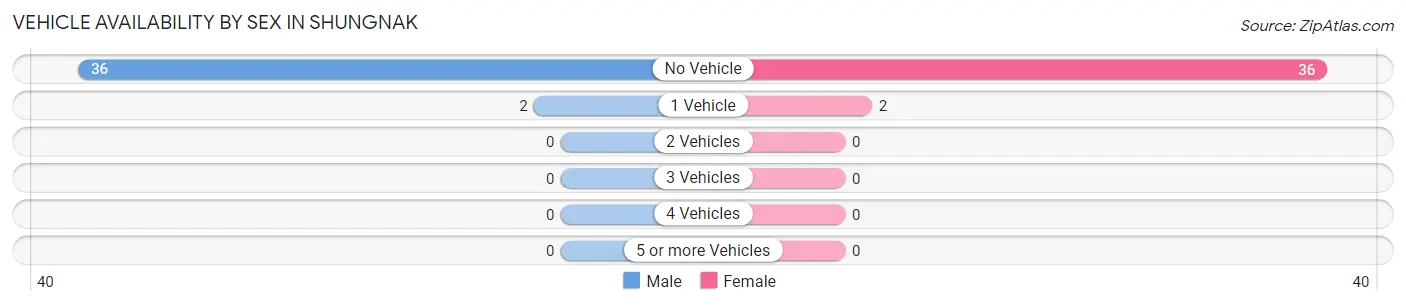
Vehicle Availability by Sex in Shungnak
The most prevalent vehicle ownership categories in Shungnak are males with no vehicle (36, accounting for 94.7%) and females with no vehicle (36, making up 94.7%).
| Vehicles Available | Male | Female |
| No Vehicle | 36 (94.7%) | 36 (94.7%) |
| 1 Vehicle | 2 (5.3%) | 2 (5.3%) |
| 2 Vehicles | 0 (0.0%) | 0 (0.0%) |
| 3 Vehicles | 0 (0.0%) | 0 (0.0%) |
| 4 Vehicles | 0 (0.0%) | 0 (0.0%) |
| 5 or more Vehicles | 0 (0.0%) | 0 (0.0%) |
| Total | 38 (100.0%) | 38 (100.0%) |
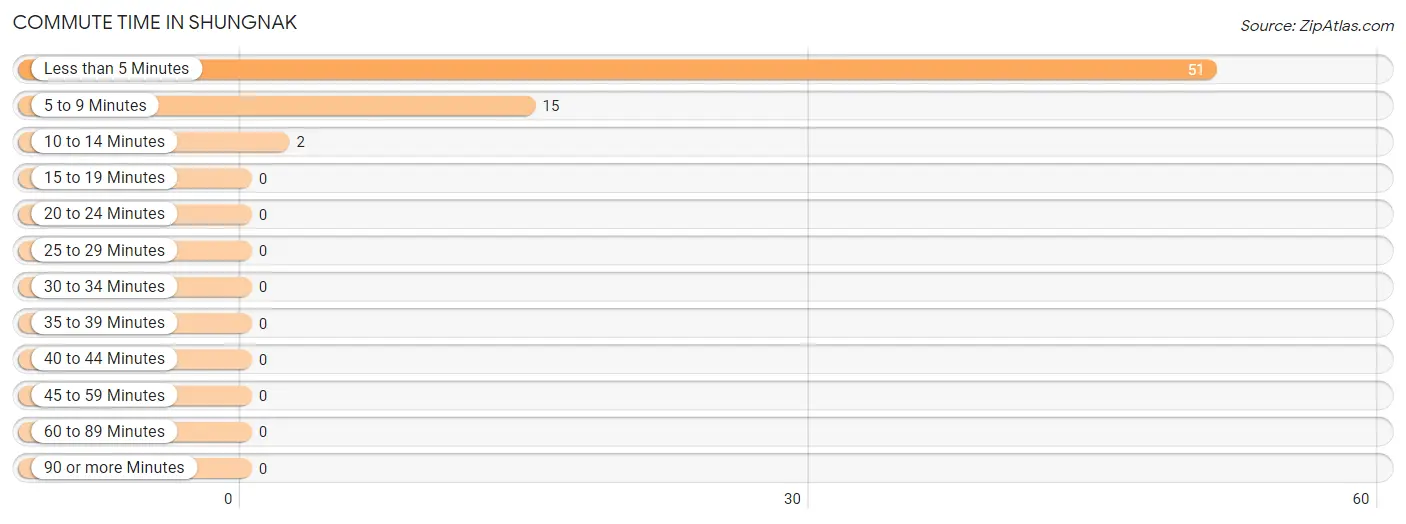
Commute Time in Shungnak
The most frequently occuring commute durations in Shungnak are less than 5 minutes (51 commuters, 75.0%), 5 to 9 minutes (15 commuters, 22.1%), and 10 to 14 minutes (2 commuters, 2.9%).
| Commute Time | # Commuters | % Commuters |
| Less than 5 Minutes | 51 | 75.0% |
| 5 to 9 Minutes | 15 | 22.1% |
| 10 to 14 Minutes | 2 | 2.9% |
| 15 to 19 Minutes | 0 | 0.0% |
| 20 to 24 Minutes | 0 | 0.0% |
| 25 to 29 Minutes | 0 | 0.0% |
| 30 to 34 Minutes | 0 | 0.0% |
| 35 to 39 Minutes | 0 | 0.0% |
| 40 to 44 Minutes | 0 | 0.0% |
| 45 to 59 Minutes | 0 | 0.0% |
| 60 to 89 Minutes | 0 | 0.0% |
| 90 or more Minutes | 0 | 0.0% |
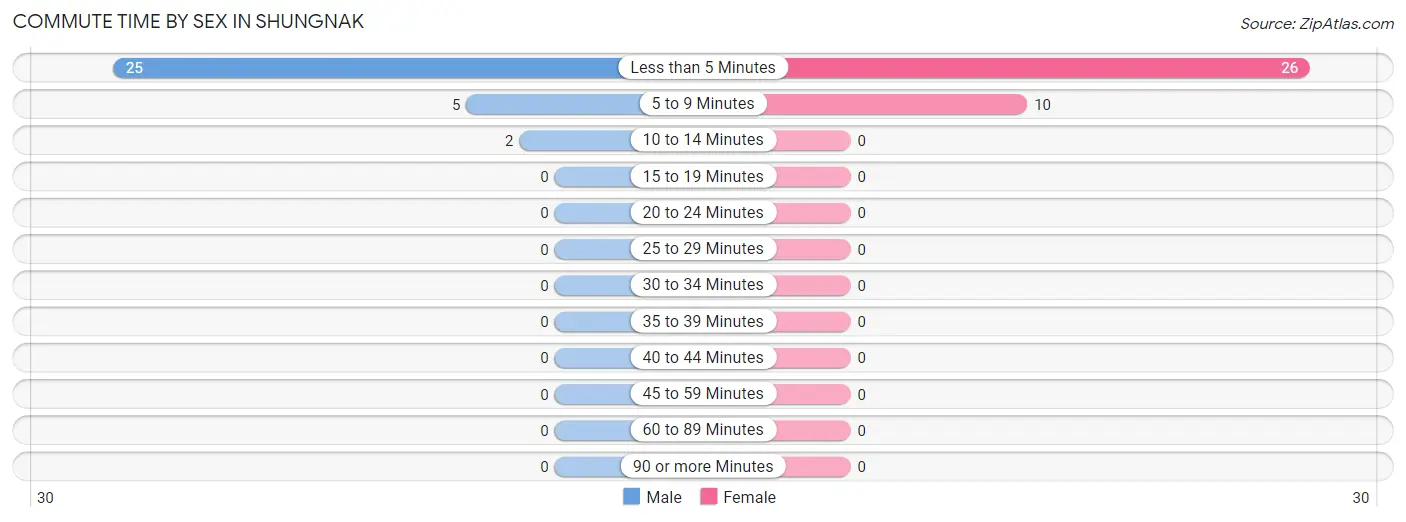
Commute Time by Sex in Shungnak
The most common commute times in Shungnak are less than 5 minutes (25 commuters, 78.1%) for males and less than 5 minutes (26 commuters, 72.2%) for females.
| Commute Time | Male | Female |
| Less than 5 Minutes | 25 (78.1%) | 26 (72.2%) |
| 5 to 9 Minutes | 5 (15.6%) | 10 (27.8%) |
| 10 to 14 Minutes | 2 (6.2%) | 0 (0.0%) |
| 15 to 19 Minutes | 0 (0.0%) | 0 (0.0%) |
| 20 to 24 Minutes | 0 (0.0%) | 0 (0.0%) |
| 25 to 29 Minutes | 0 (0.0%) | 0 (0.0%) |
| 30 to 34 Minutes | 0 (0.0%) | 0 (0.0%) |
| 35 to 39 Minutes | 0 (0.0%) | 0 (0.0%) |
| 40 to 44 Minutes | 0 (0.0%) | 0 (0.0%) |
| 45 to 59 Minutes | 0 (0.0%) | 0 (0.0%) |
| 60 to 89 Minutes | 0 (0.0%) | 0 (0.0%) |
| 90 or more Minutes | 0 (0.0%) | 0 (0.0%) |
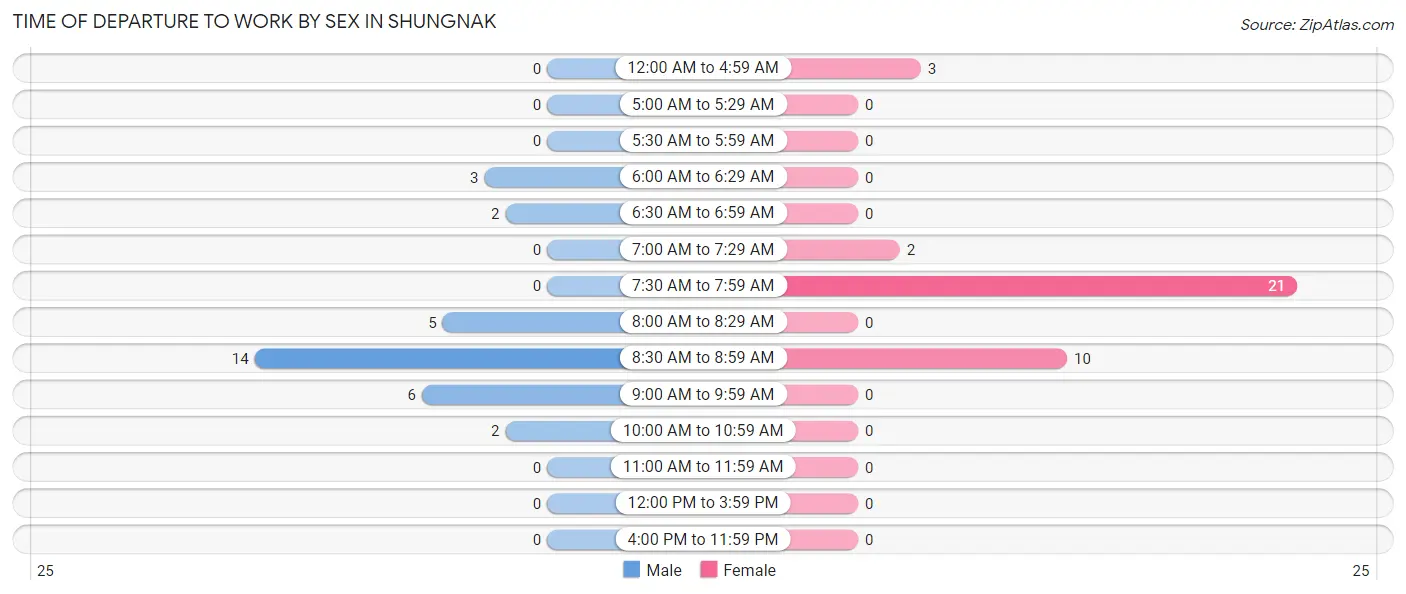
Time of Departure to Work by Sex in Shungnak
The most frequent times of departure to work in Shungnak are 8:30 AM to 8:59 AM (14, 43.8%) for males and 7:30 AM to 7:59 AM (21, 58.3%) for females.
| Time of Departure | Male | Female |
| 12:00 AM to 4:59 AM | 0 (0.0%) | 3 (8.3%) |
| 5:00 AM to 5:29 AM | 0 (0.0%) | 0 (0.0%) |
| 5:30 AM to 5:59 AM | 0 (0.0%) | 0 (0.0%) |
| 6:00 AM to 6:29 AM | 3 (9.4%) | 0 (0.0%) |
| 6:30 AM to 6:59 AM | 2 (6.2%) | 0 (0.0%) |
| 7:00 AM to 7:29 AM | 0 (0.0%) | 2 (5.6%) |
| 7:30 AM to 7:59 AM | 0 (0.0%) | 21 (58.3%) |
| 8:00 AM to 8:29 AM | 5 (15.6%) | 0 (0.0%) |
| 8:30 AM to 8:59 AM | 14 (43.8%) | 10 (27.8%) |
| 9:00 AM to 9:59 AM | 6 (18.8%) | 0 (0.0%) |
| 10:00 AM to 10:59 AM | 2 (6.2%) | 0 (0.0%) |
| 11:00 AM to 11:59 AM | 0 (0.0%) | 0 (0.0%) |
| 12:00 PM to 3:59 PM | 0 (0.0%) | 0 (0.0%) |
| 4:00 PM to 11:59 PM | 0 (0.0%) | 0 (0.0%) |
| Total | 32 (100.0%) | 36 (100.0%) |
Housing Occupancy in Shungnak
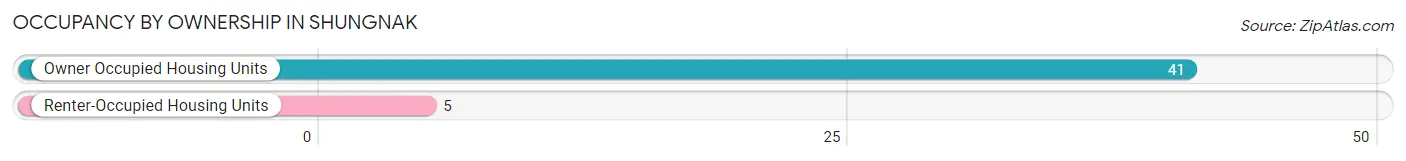
Occupancy by Ownership in Shungnak
Of the total 46 dwellings in Shungnak, owner-occupied units account for 41 (89.1%), while renter-occupied units make up 5 (10.9%).
| Occupancy | # Housing Units | % Housing Units |
| Owner Occupied Housing Units | 41 | 89.1% |
| Renter-Occupied Housing Units | 5 | 10.9% |
| Total Occupied Housing Units | 46 | 100.0% |
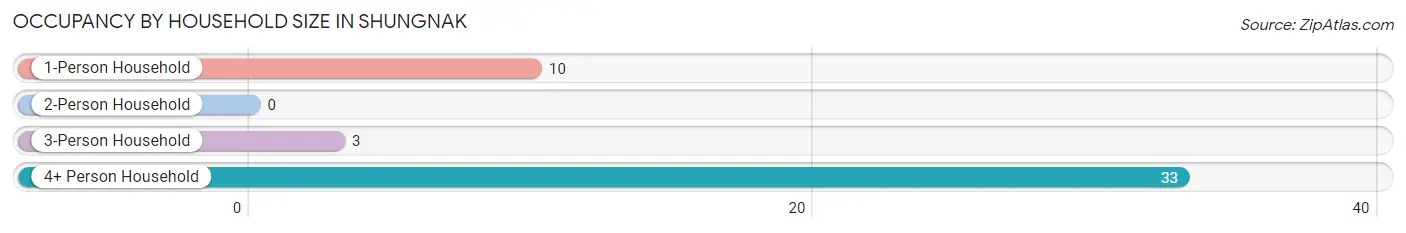
Occupancy by Household Size in Shungnak
| Household Size | # Housing Units | % Housing Units |
| 1-Person Household | 10 | 21.7% |
| 2-Person Household | 0 | 0.0% |
| 3-Person Household | 3 | 6.5% |
| 4+ Person Household | 33 | 71.7% |
| Total Housing Units | 46 | 100.0% |
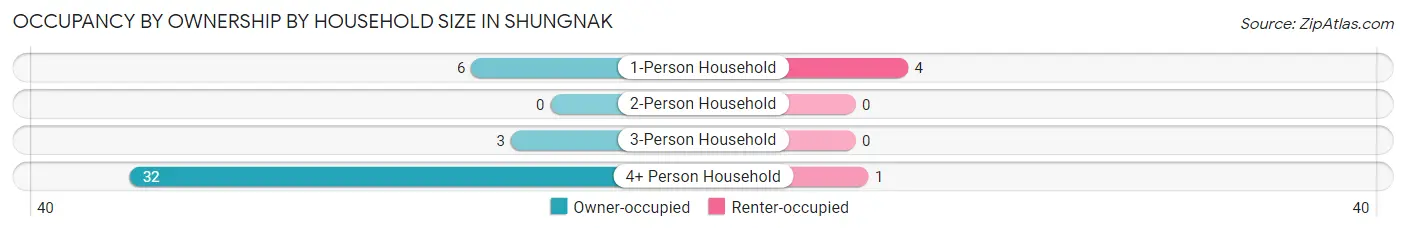
Occupancy by Ownership by Household Size in Shungnak
| Household Size | Owner-occupied | Renter-occupied |
| 1-Person Household | 6 (60.0%) | 4 (40.0%) |
| 2-Person Household | 0 (0.0%) | 0 (0.0%) |
| 3-Person Household | 3 (100.0%) | 0 (0.0%) |
| 4+ Person Household | 32 (97.0%) | 1 (3.0%) |
| Total Housing Units | 41 (89.1%) | 5 (10.9%) |
Occupancy by Educational Attainment in Shungnak
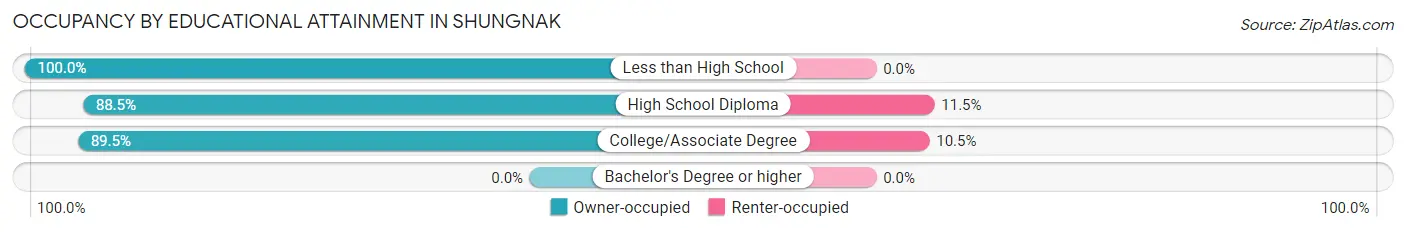
| Household Size | Owner-occupied | Renter-occupied |
| Less than High School | 1 (100.0%) | 0 (0.0%) |
| High School Diploma | 23 (88.5%) | 3 (11.5%) |
| College/Associate Degree | 17 (89.5%) | 2 (10.5%) |
| Bachelor's Degree or higher | 0 (0.0%) | 0 (0.0%) |
Occupancy by Age of Householder in Shungnak
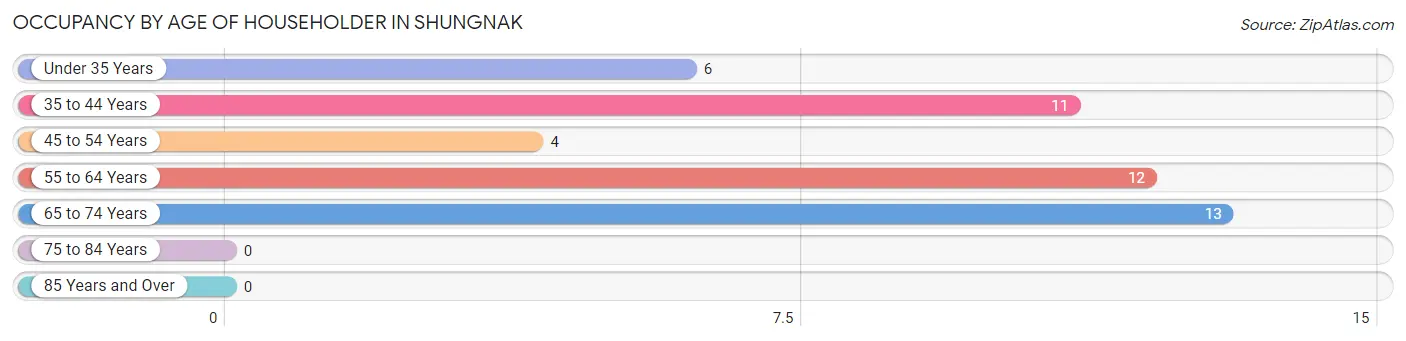
| Age Bracket | # Households | % Households |
| Under 35 Years | 6 | 13.0% |
| 35 to 44 Years | 11 | 23.9% |
| 45 to 54 Years | 4 | 8.7% |
| 55 to 64 Years | 12 | 26.1% |
| 65 to 74 Years | 13 | 28.3% |
| 75 to 84 Years | 0 | 0.0% |
| 85 Years and Over | 0 | 0.0% |
| Total | 46 | 100.0% |
Housing Finances in Shungnak
Median Income by Occupancy in Shungnak
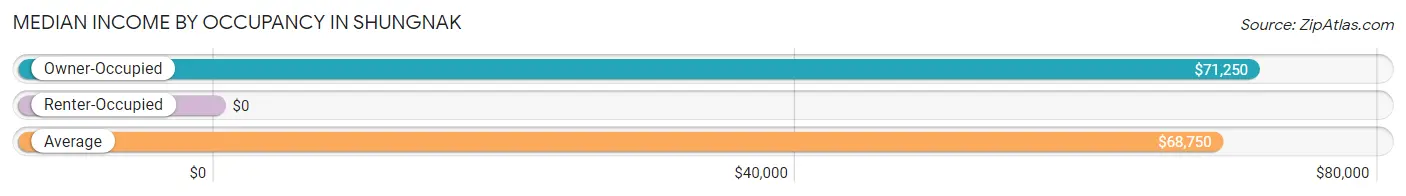
| Occupancy Type | # Households | Median Income |
| Owner-Occupied | 41 (89.1%) | $71,250 |
| Renter-Occupied | 5 (10.9%) | $0 |
| Average | 46 (100.0%) | $68,750 |
Occupancy by Householder Income Bracket in Shungnak
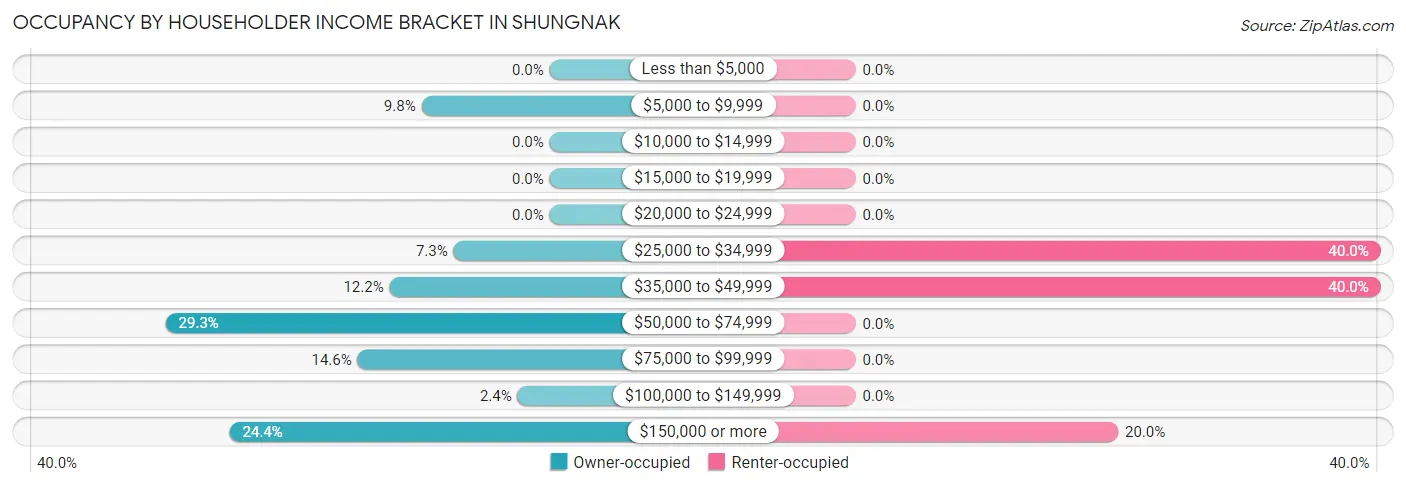
| Income Bracket | Owner-occupied | Renter-occupied |
| Less than $5,000 | 0 (0.0%) | 0 (0.0%) |
| $5,000 to $9,999 | 4 (9.8%) | 0 (0.0%) |
| $10,000 to $14,999 | 0 (0.0%) | 0 (0.0%) |
| $15,000 to $19,999 | 0 (0.0%) | 0 (0.0%) |
| $20,000 to $24,999 | 0 (0.0%) | 0 (0.0%) |
| $25,000 to $34,999 | 3 (7.3%) | 2 (40.0%) |
| $35,000 to $49,999 | 5 (12.2%) | 2 (40.0%) |
| $50,000 to $74,999 | 12 (29.3%) | 0 (0.0%) |
| $75,000 to $99,999 | 6 (14.6%) | 0 (0.0%) |
| $100,000 to $149,999 | 1 (2.4%) | 0 (0.0%) |
| $150,000 or more | 10 (24.4%) | 1 (20.0%) |
| Total | 41 (100.0%) | 5 (100.0%) |
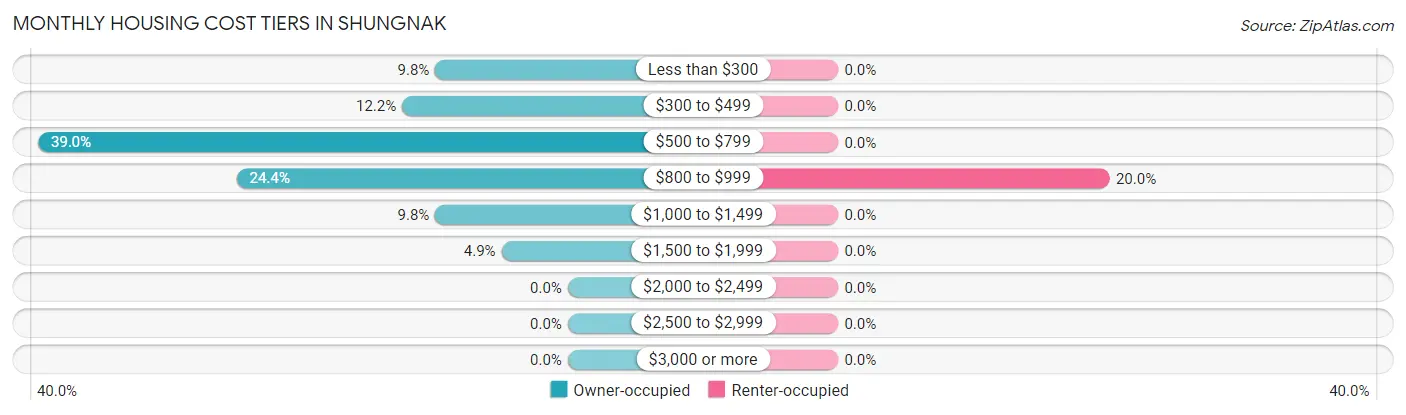
Monthly Housing Cost Tiers in Shungnak
| Monthly Cost | Owner-occupied | Renter-occupied |
| Less than $300 | 4 (9.8%) | 0 (0.0%) |
| $300 to $499 | 5 (12.2%) | 0 (0.0%) |
| $500 to $799 | 16 (39.0%) | 0 (0.0%) |
| $800 to $999 | 10 (24.4%) | 1 (20.0%) |
| $1,000 to $1,499 | 4 (9.8%) | 0 (0.0%) |
| $1,500 to $1,999 | 2 (4.9%) | 0 (0.0%) |
| $2,000 to $2,499 | 0 (0.0%) | 0 (0.0%) |
| $2,500 to $2,999 | 0 (0.0%) | 0 (0.0%) |
| $3,000 or more | 0 (0.0%) | 0 (0.0%) |
| Total | 41 (100.0%) | 5 (100.0%) |
Physical Housing Characteristics in Shungnak
Housing Structures in Shungnak
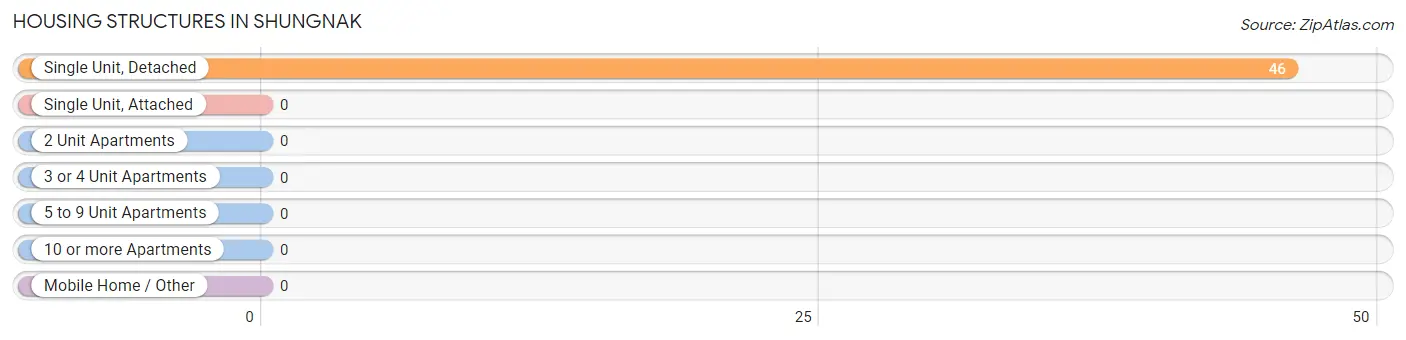
| Structure Type | # Housing Units | % Housing Units |
| Single Unit, Detached | 46 | 100.0% |
| Single Unit, Attached | 0 | 0.0% |
| 2 Unit Apartments | 0 | 0.0% |
| 3 or 4 Unit Apartments | 0 | 0.0% |
| 5 to 9 Unit Apartments | 0 | 0.0% |
| 10 or more Apartments | 0 | 0.0% |
| Mobile Home / Other | 0 | 0.0% |
| Total | 46 | 100.0% |
Housing Structures by Occupancy in Shungnak
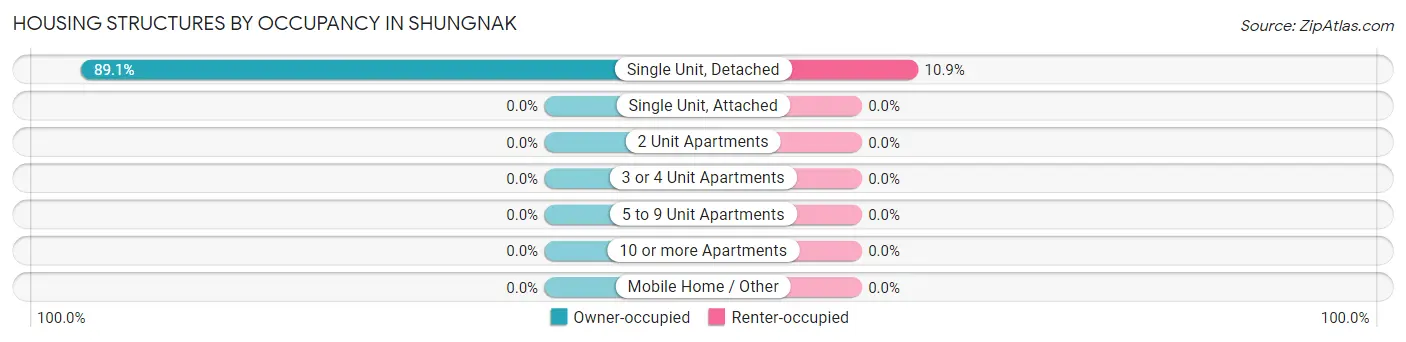
| Structure Type | Owner-occupied | Renter-occupied |
| Single Unit, Detached | 41 (89.1%) | 5 (10.9%) |
| Single Unit, Attached | 0 (0.0%) | 0 (0.0%) |
| 2 Unit Apartments | 0 (0.0%) | 0 (0.0%) |
| 3 or 4 Unit Apartments | 0 (0.0%) | 0 (0.0%) |
| 5 to 9 Unit Apartments | 0 (0.0%) | 0 (0.0%) |
| 10 or more Apartments | 0 (0.0%) | 0 (0.0%) |
| Mobile Home / Other | 0 (0.0%) | 0 (0.0%) |
| Total | 41 (89.1%) | 5 (10.9%) |
Housing Structures by Number of Rooms in Shungnak
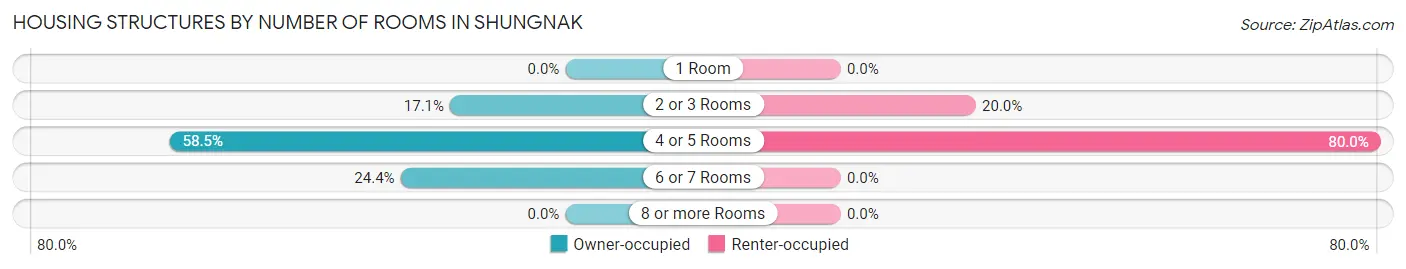
| Number of Rooms | Owner-occupied | Renter-occupied |
| 1 Room | 0 (0.0%) | 0 (0.0%) |
| 2 or 3 Rooms | 7 (17.1%) | 1 (20.0%) |
| 4 or 5 Rooms | 24 (58.5%) | 4 (80.0%) |
| 6 or 7 Rooms | 10 (24.4%) | 0 (0.0%) |
| 8 or more Rooms | 0 (0.0%) | 0 (0.0%) |
| Total | 41 (100.0%) | 5 (100.0%) |
Housing Structure by Heating Type in Shungnak
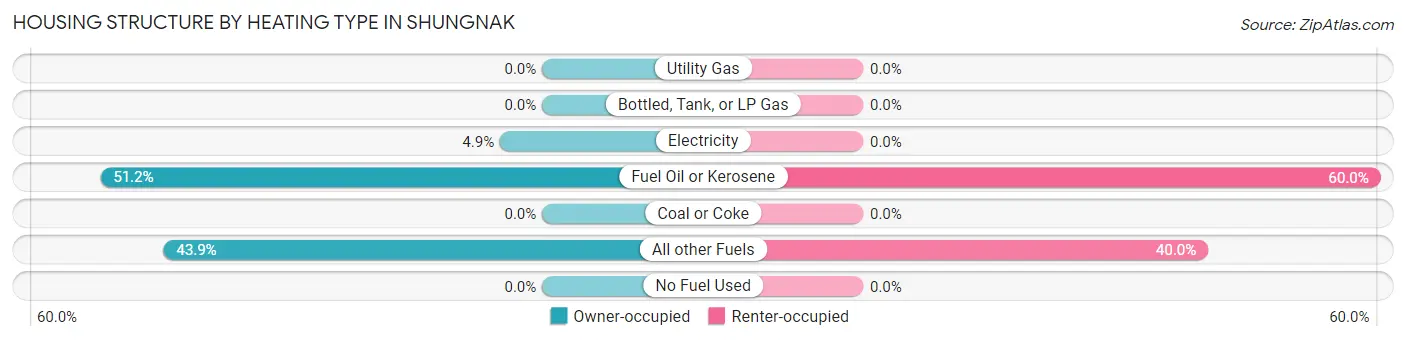
| Heating Type | Owner-occupied | Renter-occupied |
| Utility Gas | 0 (0.0%) | 0 (0.0%) |
| Bottled, Tank, or LP Gas | 0 (0.0%) | 0 (0.0%) |
| Electricity | 2 (4.9%) | 0 (0.0%) |
| Fuel Oil or Kerosene | 21 (51.2%) | 3 (60.0%) |
| Coal or Coke | 0 (0.0%) | 0 (0.0%) |
| All other Fuels | 18 (43.9%) | 2 (40.0%) |
| No Fuel Used | 0 (0.0%) | 0 (0.0%) |
| Total | 41 (100.0%) | 5 (100.0%) |
Household Vehicle Usage in Shungnak
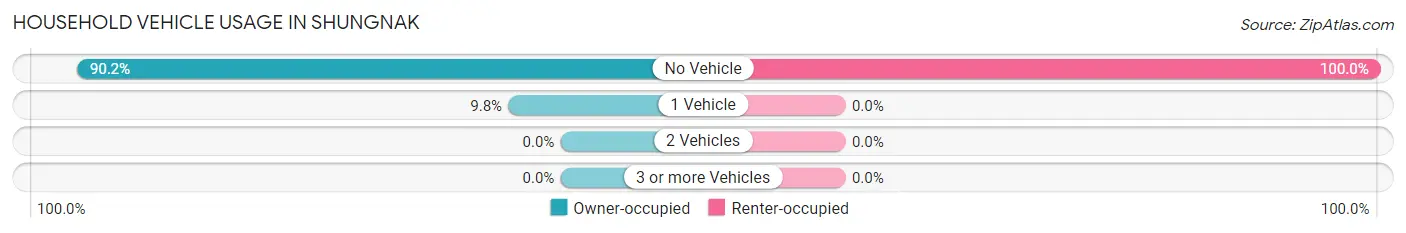
| Vehicles per Household | Owner-occupied | Renter-occupied |
| No Vehicle | 37 (90.2%) | 5 (100.0%) |
| 1 Vehicle | 4 (9.8%) | 0 (0.0%) |
| 2 Vehicles | 0 (0.0%) | 0 (0.0%) |
| 3 or more Vehicles | 0 (0.0%) | 0 (0.0%) |
| Total | 41 (100.0%) | 5 (100.0%) |
Real Estate & Mortgages in Shungnak
Real Estate and Mortgage Overview in Shungnak
| Characteristic | Without Mortgage | With Mortgage |
| Housing Units | 28 | 13 |
| Median Property Value | $88,600 | $0 |
| Median Household Income | $68,750 | $3 |
| Monthly Housing Costs | $675 | $0 |
| Real Estate Taxes | - | - |
Property Value by Mortgage Status in Shungnak
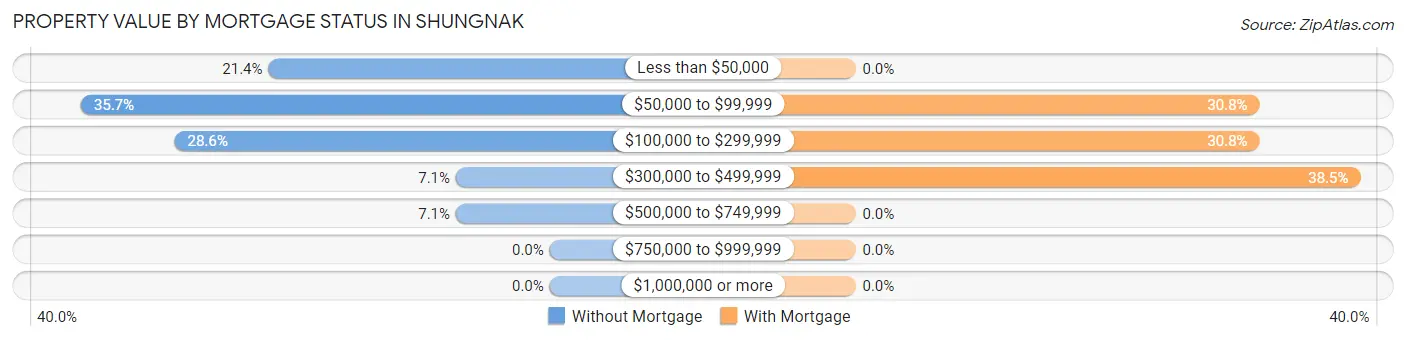
| Property Value | Without Mortgage | With Mortgage |
| Less than $50,000 | 6 (21.4%) | 0 (0.0%) |
| $50,000 to $99,999 | 10 (35.7%) | 4 (30.8%) |
| $100,000 to $299,999 | 8 (28.6%) | 4 (30.8%) |
| $300,000 to $499,999 | 2 (7.1%) | 5 (38.5%) |
| $500,000 to $749,999 | 2 (7.1%) | 0 (0.0%) |
| $750,000 to $999,999 | 0 (0.0%) | 0 (0.0%) |
| $1,000,000 or more | 0 (0.0%) | 0 (0.0%) |
| Total | 28 (100.0%) | 13 (100.0%) |
Household Income by Mortgage Status in Shungnak
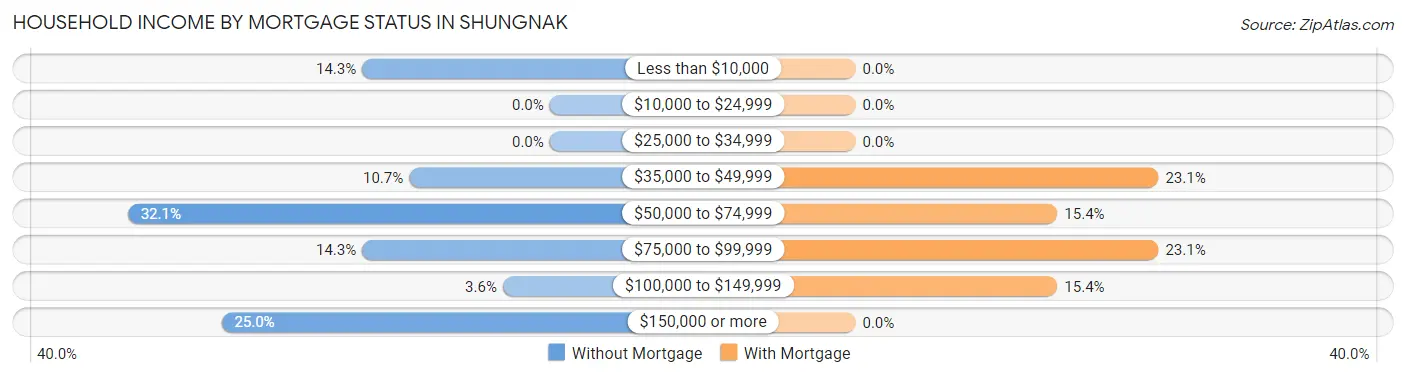
| Household Income | Without Mortgage | With Mortgage |
| Less than $10,000 | 4 (14.3%) | 0 (0.0%) |
| $10,000 to $24,999 | 0 (0.0%) | 0 (0.0%) |
| $25,000 to $34,999 | 0 (0.0%) | 0 (0.0%) |
| $35,000 to $49,999 | 3 (10.7%) | 3 (23.1%) |
| $50,000 to $74,999 | 9 (32.1%) | 2 (15.4%) |
| $75,000 to $99,999 | 4 (14.3%) | 3 (23.1%) |
| $100,000 to $149,999 | 1 (3.6%) | 2 (15.4%) |
| $150,000 or more | 7 (25.0%) | 0 (0.0%) |
| Total | 28 (100.0%) | 13 (100.0%) |
Property Value to Household Income Ratio in Shungnak
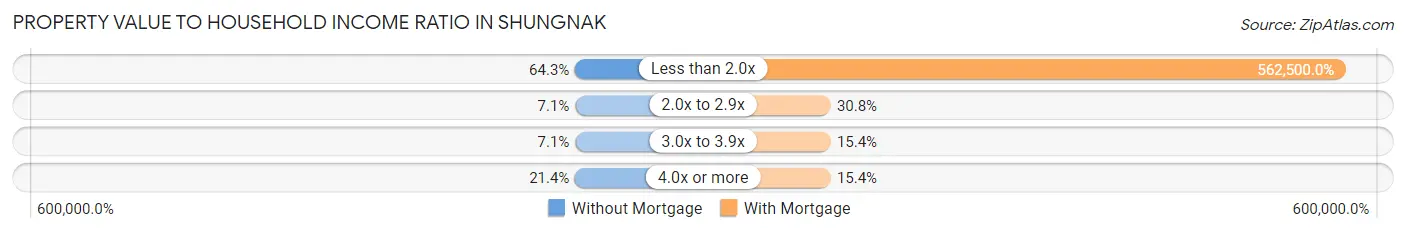
| Value-to-Income Ratio | Without Mortgage | With Mortgage |
| Less than 2.0x | 18 (64.3%) | 73,125 (562,500.0%) |
| 2.0x to 2.9x | 2 (7.1%) | 4 (30.8%) |
| 3.0x to 3.9x | 2 (7.1%) | 2 (15.4%) |
| 4.0x or more | 6 (21.4%) | 2 (15.4%) |
| Total | 28 (100.0%) | 13 (100.0%) |
Real Estate Taxes by Mortgage Status in Shungnak
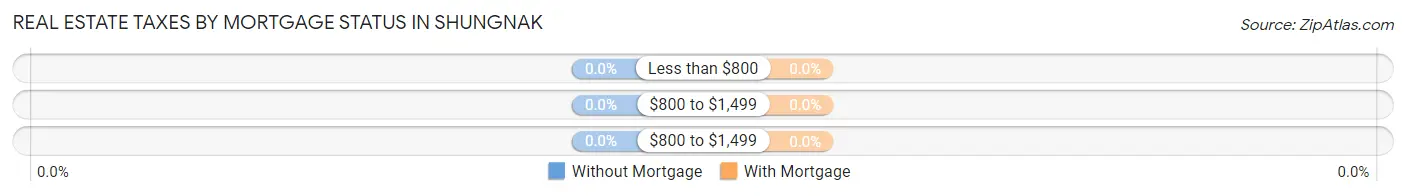
| Property Taxes | Without Mortgage | With Mortgage |
| Less than $800 | 0 (0.0%) | 0 (0.0%) |
| $800 to $1,499 | 0 (0.0%) | 0 (0.0%) |
| $800 to $1,499 | 0 (0.0%) | 0 (0.0%) |
| Total | 28 (100.0%) | 13 (100.0%) |
Health & Disability in Shungnak
Health Insurance Coverage by Age in Shungnak
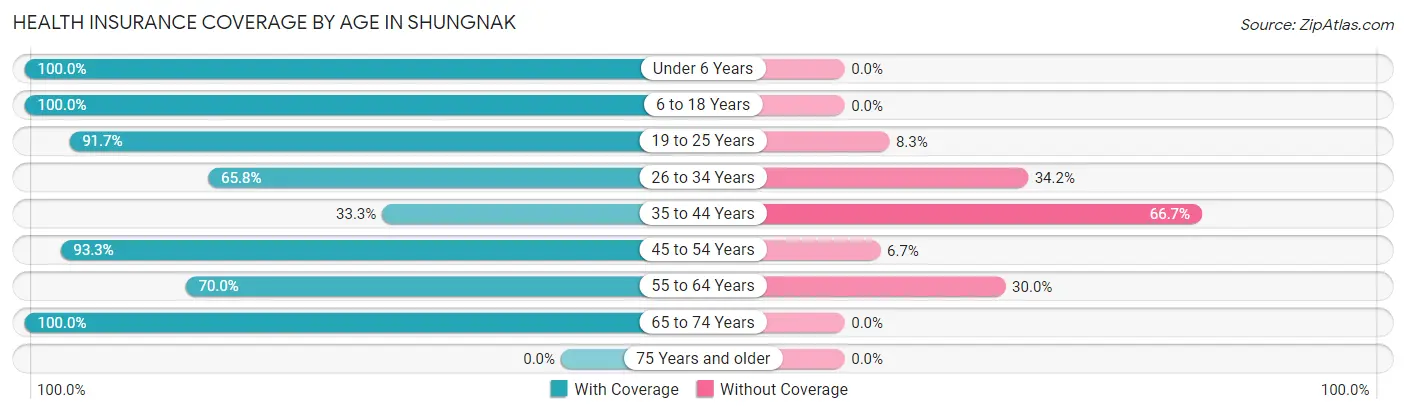
| Age Bracket | With Coverage | Without Coverage |
| Under 6 Years | 31 (100.0%) | 0 (0.0%) |
| 6 to 18 Years | 65 (100.0%) | 0 (0.0%) |
| 19 to 25 Years | 22 (91.7%) | 2 (8.3%) |
| 26 to 34 Years | 25 (65.8%) | 13 (34.2%) |
| 35 to 44 Years | 10 (33.3%) | 20 (66.7%) |
| 45 to 54 Years | 14 (93.3%) | 1 (6.7%) |
| 55 to 64 Years | 14 (70.0%) | 6 (30.0%) |
| 65 to 74 Years | 21 (100.0%) | 0 (0.0%) |
| 75 Years and older | 0 (0.0%) | 0 (0.0%) |
| Total | 202 (82.8%) | 42 (17.2%) |
Health Insurance Coverage by Citizenship Status in Shungnak
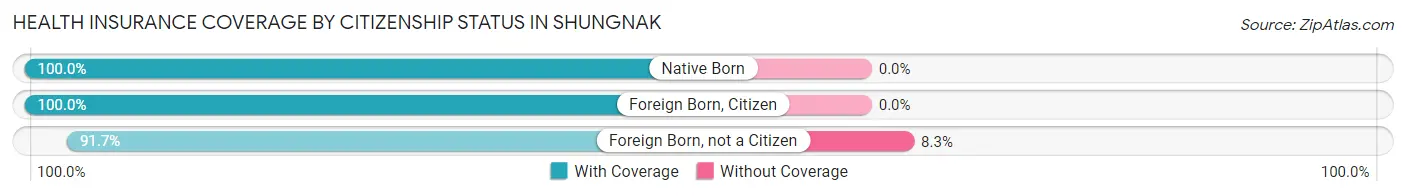
| Citizenship Status | With Coverage | Without Coverage |
| Native Born | 31 (100.0%) | 0 (0.0%) |
| Foreign Born, Citizen | 65 (100.0%) | 0 (0.0%) |
| Foreign Born, not a Citizen | 22 (91.7%) | 2 (8.3%) |
Health Insurance Coverage by Household Income in Shungnak
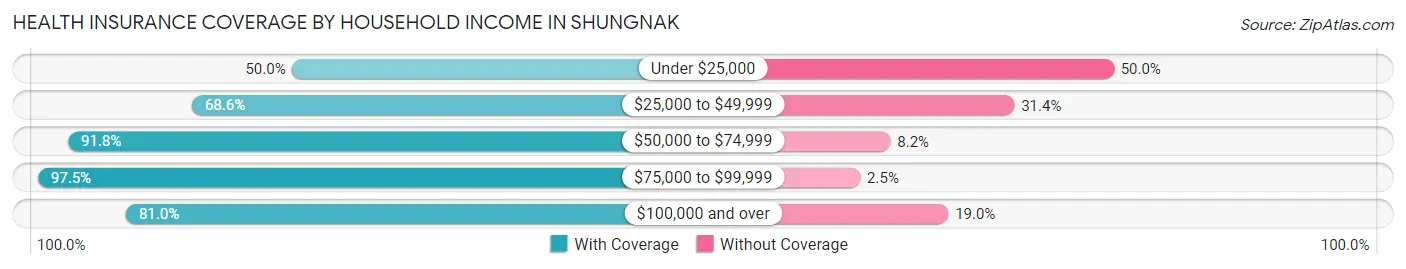
| Household Income | With Coverage | Without Coverage |
| Under $25,000 | 2 (50.0%) | 2 (50.0%) |
| $25,000 to $49,999 | 35 (68.6%) | 16 (31.4%) |
| $50,000 to $74,999 | 45 (91.8%) | 4 (8.2%) |
| $75,000 to $99,999 | 39 (97.5%) | 1 (2.5%) |
| $100,000 and over | 81 (81.0%) | 19 (19.0%) |
Public vs Private Health Insurance Coverage by Age in Shungnak
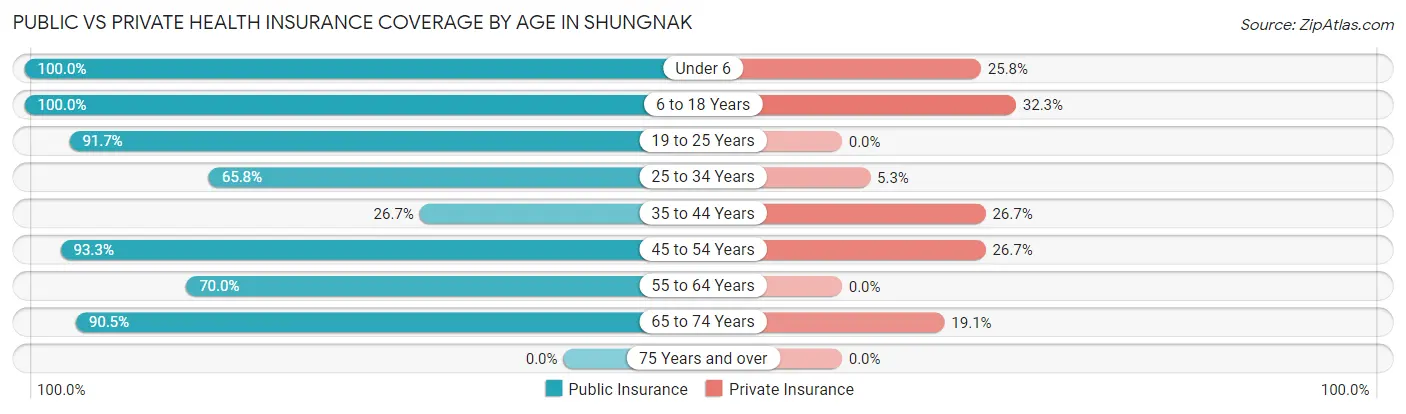
| Age Bracket | Public Insurance | Private Insurance |
| Under 6 | 31 (100.0%) | 8 (25.8%) |
| 6 to 18 Years | 65 (100.0%) | 21 (32.3%) |
| 19 to 25 Years | 22 (91.7%) | 0 (0.0%) |
| 25 to 34 Years | 25 (65.8%) | 2 (5.3%) |
| 35 to 44 Years | 8 (26.7%) | 8 (26.7%) |
| 45 to 54 Years | 14 (93.3%) | 4 (26.7%) |
| 55 to 64 Years | 14 (70.0%) | 0 (0.0%) |
| 65 to 74 Years | 19 (90.5%) | 4 (19.1%) |
| 75 Years and over | 0 (0.0%) | 0 (0.0%) |
| Total | 198 (81.1%) | 47 (19.3%) |
Disability Status by Sex by Age in Shungnak
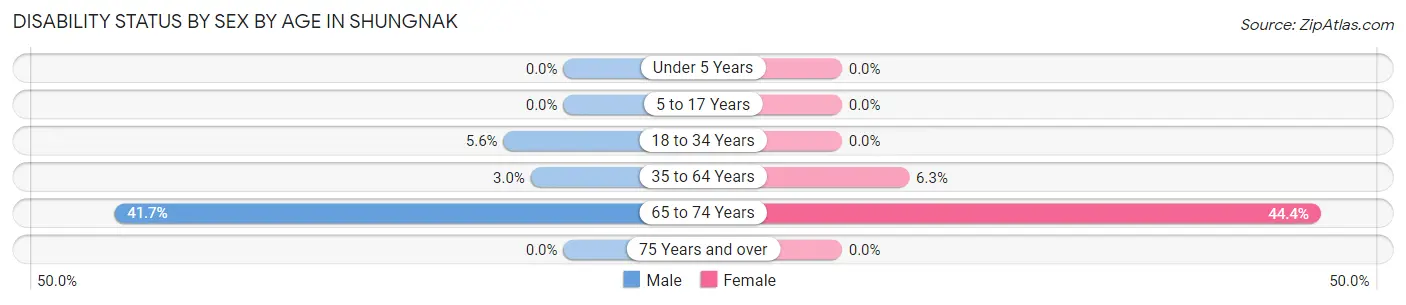
| Age Bracket | Male | Female |
| Under 5 Years | 0 (0.0%) | 0 (0.0%) |
| 5 to 17 Years | 0 (0.0%) | 0 (0.0%) |
| 18 to 34 Years | 2 (5.6%) | 0 (0.0%) |
| 35 to 64 Years | 1 (3.0%) | 2 (6.2%) |
| 65 to 74 Years | 5 (41.7%) | 4 (44.4%) |
| 75 Years and over | 0 (0.0%) | 0 (0.0%) |
Disability Class by Sex by Age in Shungnak
Disability Class: Hearing Difficulty
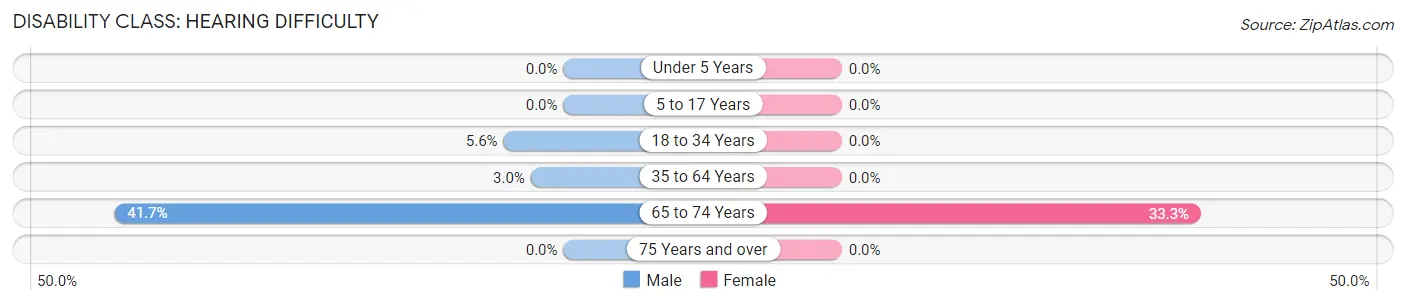
| Age Bracket | Male | Female |
| Under 5 Years | 0 (0.0%) | 0 (0.0%) |
| 5 to 17 Years | 0 (0.0%) | 0 (0.0%) |
| 18 to 34 Years | 2 (5.6%) | 0 (0.0%) |
| 35 to 64 Years | 1 (3.0%) | 0 (0.0%) |
| 65 to 74 Years | 5 (41.7%) | 3 (33.3%) |
| 75 Years and over | 0 (0.0%) | 0 (0.0%) |
Disability Class: Vision Difficulty
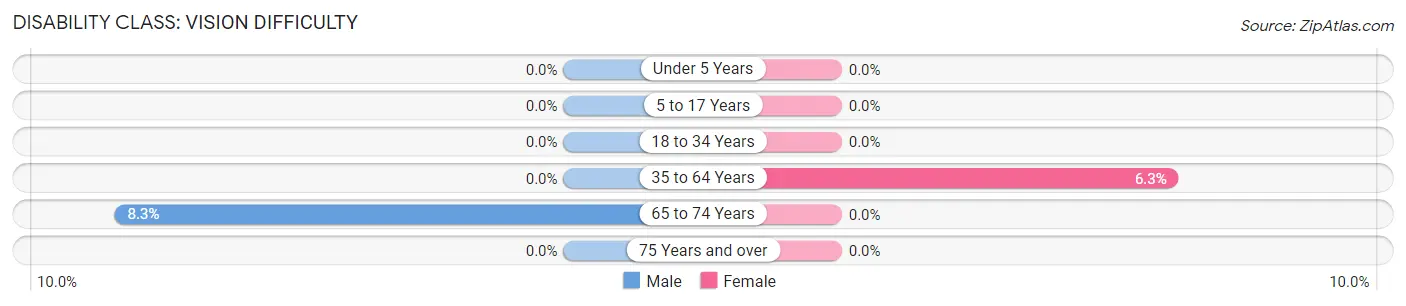
| Age Bracket | Male | Female |
| Under 5 Years | 0 (0.0%) | 0 (0.0%) |
| 5 to 17 Years | 0 (0.0%) | 0 (0.0%) |
| 18 to 34 Years | 0 (0.0%) | 0 (0.0%) |
| 35 to 64 Years | 0 (0.0%) | 2 (6.2%) |
| 65 to 74 Years | 1 (8.3%) | 0 (0.0%) |
| 75 Years and over | 0 (0.0%) | 0 (0.0%) |
Disability Class: Cognitive Difficulty
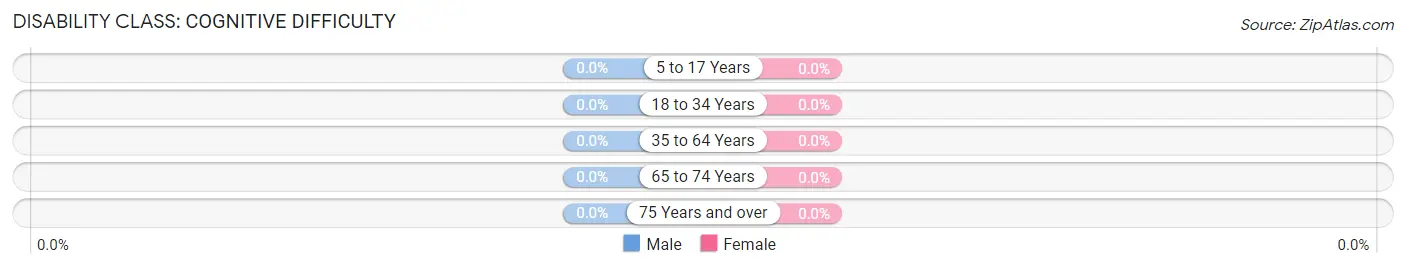
| Age Bracket | Male | Female |
| 5 to 17 Years | 0 (0.0%) | 0 (0.0%) |
| 18 to 34 Years | 0 (0.0%) | 0 (0.0%) |
| 35 to 64 Years | 0 (0.0%) | 0 (0.0%) |
| 65 to 74 Years | 0 (0.0%) | 0 (0.0%) |
| 75 Years and over | 0 (0.0%) | 0 (0.0%) |
Disability Class: Ambulatory Difficulty
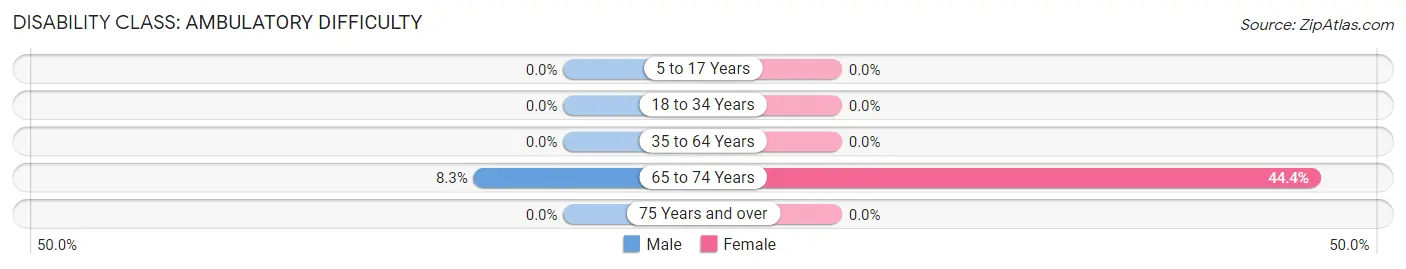
| Age Bracket | Male | Female |
| 5 to 17 Years | 0 (0.0%) | 0 (0.0%) |
| 18 to 34 Years | 0 (0.0%) | 0 (0.0%) |
| 35 to 64 Years | 0 (0.0%) | 0 (0.0%) |
| 65 to 74 Years | 1 (8.3%) | 4 (44.4%) |
| 75 Years and over | 0 (0.0%) | 0 (0.0%) |
Disability Class: Self-Care Difficulty
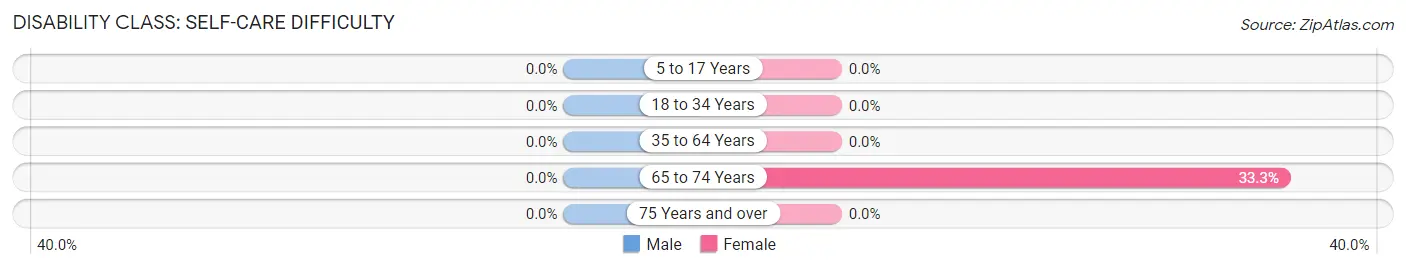
| Age Bracket | Male | Female |
| 5 to 17 Years | 0 (0.0%) | 0 (0.0%) |
| 18 to 34 Years | 0 (0.0%) | 0 (0.0%) |
| 35 to 64 Years | 0 (0.0%) | 0 (0.0%) |
| 65 to 74 Years | 0 (0.0%) | 3 (33.3%) |
| 75 Years and over | 0 (0.0%) | 0 (0.0%) |
Technology Access in Shungnak
Computing Device Access in Shungnak
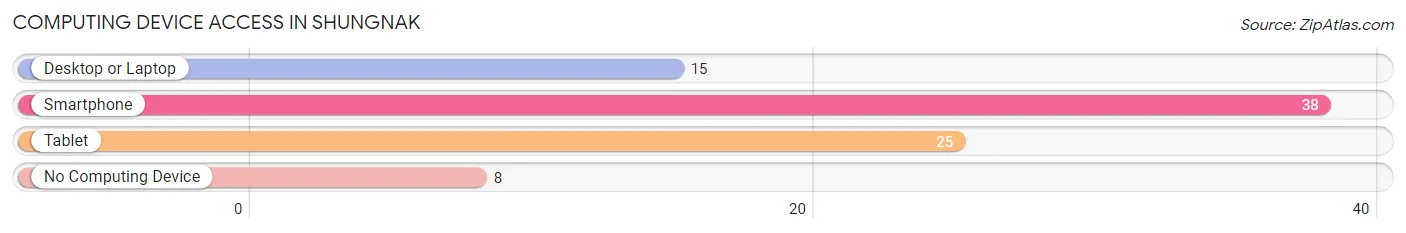
| Device Type | # Households | % Households |
| Desktop or Laptop | 15 | 32.6% |
| Smartphone | 38 | 82.6% |
| Tablet | 25 | 54.3% |
| No Computing Device | 8 | 17.4% |
| Total | 46 | 100.0% |
Internet Access in Shungnak
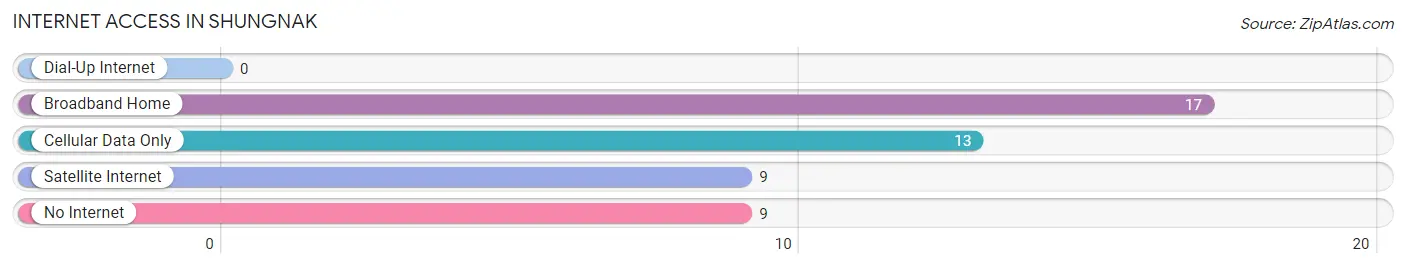
| Internet Type | # Households | % Households |
| Dial-Up Internet | 0 | 0.0% |
| Broadband Home | 17 | 37.0% |
| Cellular Data Only | 13 | 28.3% |
| Satellite Internet | 9 | 19.6% |
| No Internet | 9 | 19.6% |
| Total | 46 | 100.0% |
Shungnak Summary
Shungnak is a small village located in Northwest Alaska, in the region of the Kobuk Valley. It is situated on the Kobuk River, approximately 100 miles north of Kotzebue. The village is home to the Inupiat people, who have lived in the area for thousands of years.
Geography
Shungnak is located in the Kobuk Valley, which is part of the larger Arctic region of Alaska. The village is situated on the banks of the Kobuk River, which is a major tributary of the Noatak River. The area is characterized by rolling hills, tundra, and boreal forests. The climate is subarctic, with long, cold winters and short, cool summers.
Economy
The economy of Shungnak is largely based on subsistence activities, such as hunting, fishing, and trapping. The village is also home to a small commercial fishing industry, which provides employment for some of the residents. Other sources of income include government jobs, such as those in the school system, and seasonal jobs in the tourism industry.
Demographics
As of the 2010 census, the population of Shungnak was 441, with a median age of 24.7 years. The majority of the population (90.2%) is Native American, with the remaining population being of mixed race (7.2%) or white (2.6%). The median household income is $25,000, and the median home value is $50,000.
History
The Inupiat people have lived in the area for thousands of years, and the village of Shungnak was established in the late 19th century. The village was originally a trading post, and it was later used as a supply point for miners and trappers in the area. In the early 20th century, the village was used as a base for fur trading and trapping.
In the 1950s, the village was relocated to its current location, due to the construction of the nearby Shungnak Air Force Station. The station was used as a refueling stop for military aircraft, and it provided employment for many of the villagers. The station was closed in the 1970s, and the village has since become a center for subsistence activities.
Common Questions
What is Per Capita Income in Shungnak?
Per Capita income in Shungnak is $21,300.
What is the Median Family Income in Shungnak?
Median Family Income in Shungnak is $66,250.
What is the Median Household income in Shungnak?
Median Household Income in Shungnak is $68,750.
What is Income or Wage Gap in Shungnak?
Income or Wage Gap in Shungnak is 12.8%.
Women in Shungnak earn 87.2 cents for every dollar earned by a man.
What is Inequality or Gini Index in Shungnak?
Inequality or Gini Index in Shungnak is 0.44.
What is the Total Population of Shungnak?
Total Population of Shungnak is 244.
What is the Total Male Population of Shungnak?
Total Male Population of Shungnak is 125.
What is the Total Female Population of Shungnak?
Total Female Population of Shungnak is 119.
What is the Ratio of Males per 100 Females in Shungnak?
There are 105.04 Males per 100 Females in Shungnak.
What is the Ratio of Females per 100 Males in Shungnak?
There are 95.20 Females per 100 Males in Shungnak.
What is the Median Population Age in Shungnak?
Median Population Age in Shungnak is 27.1 Years.
What is the Average Family Size in Shungnak
Average Family Size in Shungnak is 5.6 People.
What is the Average Household Size in Shungnak
Average Household Size in Shungnak is 5.3 People.
How Large is the Labor Force in Shungnak?
There are 101 People in the Labor Forcein in Shungnak.
What is the Percentage of People in the Labor Force in Shungnak?
65.6% of People are in the Labor Force in Shungnak.
What is the Unemployment Rate in Shungnak?
Unemployment Rate in Shungnak is 21.8%.