Seward, AK Map & Demographics
Seward Map
Seward Overview
$34,044
PER CAPITA INCOME
$113,750
AVG FAMILY INCOME
$77,850
AVG HOUSEHOLD INCOME
1.9%
WAGE / INCOME GAP [ % ]
98.1¢/ $1
WAGE / INCOME GAP [ $ ]
0.39
INEQUALITY / GINI INDEX
2,768
TOTAL POPULATION
1,807
MALE POPULATION
961
FEMALE POPULATION
188.03
MALES / 100 FEMALES
53.18
FEMALES / 100 MALES
43.8
MEDIAN AGE
2.9
AVG FAMILY SIZE
2.1
AVG HOUSEHOLD SIZE
1,146
LABOR FORCE [ PEOPLE ]
50.9%
PERCENT IN LABOR FORCE
4.8%
UNEMPLOYMENT RATE
Seward Zip Codes
Seward Area Codes
Income in Seward
Income Overview in Seward
Per Capita Income in Seward is $34,044, while median incomes of families and households are $113,750 and $77,850 respectively.
| Characteristic | Number | Measure |
| Per Capita Income | 2,768 | $34,044 |
| Median Family Income | 572 | $113,750 |
| Mean Family Income | 572 | $115,265 |
| Median Household Income | 1,017 | $77,850 |
| Mean Household Income | 1,017 | $84,659 |
| Income Deficit | 572 | $0 |
| Wage / Income Gap (%) | 2,768 | 1.93% |
| Wage / Income Gap ($) | 2,768 | 98.07¢ per $1 |
| Gini / Inequality Index | 2,768 | 0.39 |
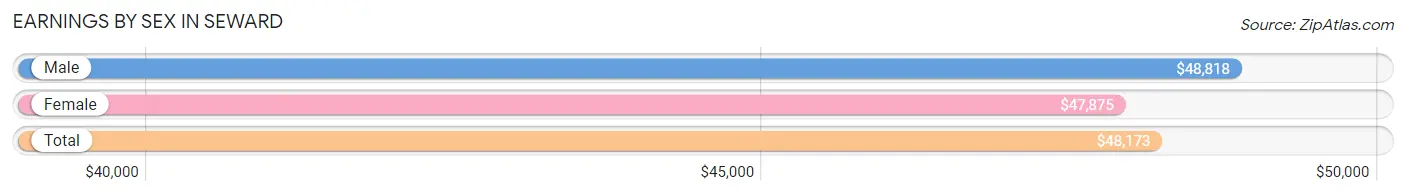
Earnings by Sex in Seward
Average Earnings in Seward are $48,173, $48,818 for men and $47,875 for women, a difference of 1.9%.
| Sex | Number | Average Earnings |
| Male | 699 (56.6%) | $48,818 |
| Female | 536 (43.4%) | $47,875 |
| Total | 1,235 (100.0%) | $48,173 |
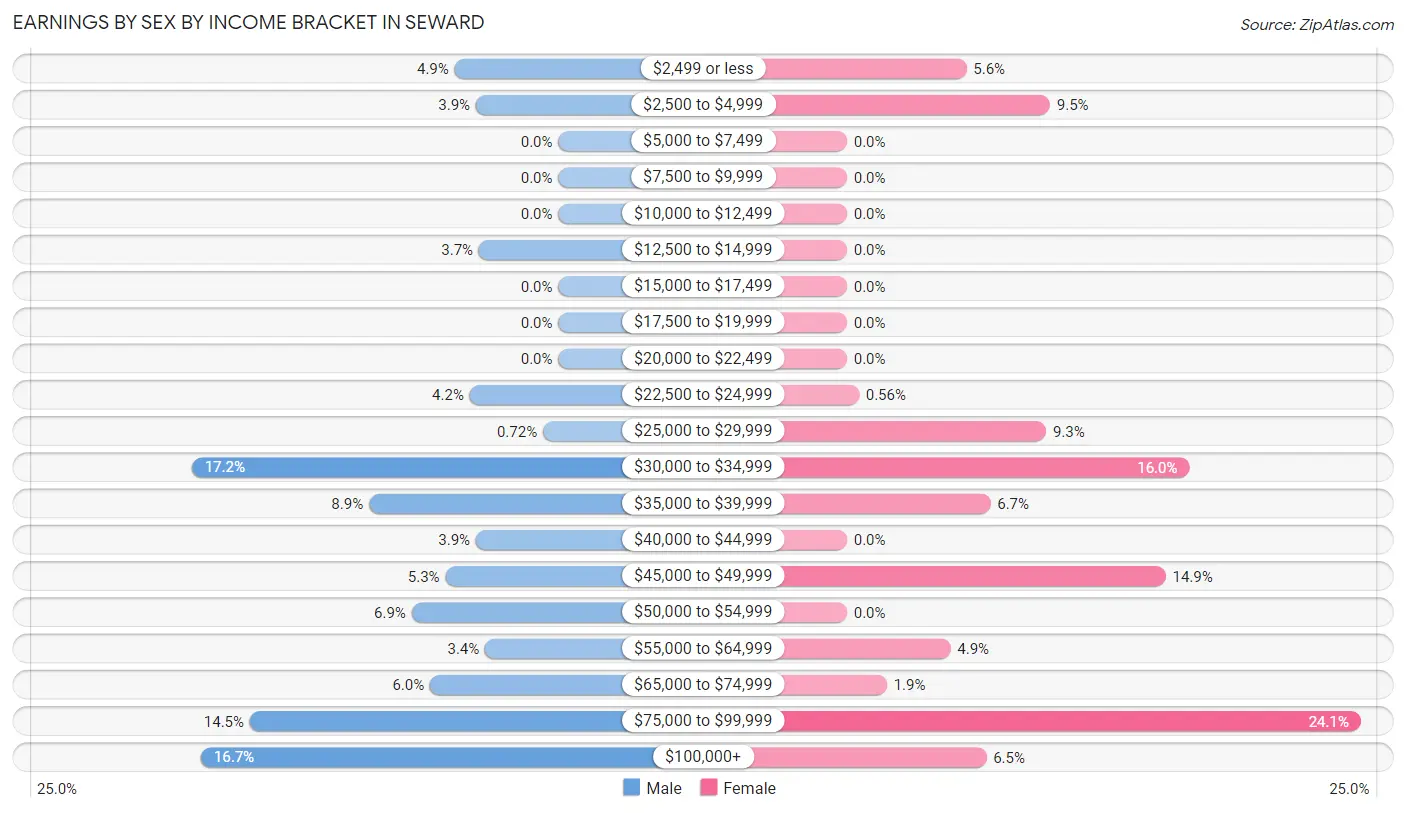
Earnings by Sex by Income Bracket in Seward
The most common earnings brackets in Seward are $30,000 to $34,999 for men (120 | 17.2%) and $75,000 to $99,999 for women (129 | 24.1%).
| Income | Male | Female |
| $2,499 or less | 34 (4.9%) | 30 (5.6%) |
| $2,500 to $4,999 | 27 (3.9%) | 51 (9.5%) |
| $5,000 to $7,499 | 0 (0.0%) | 0 (0.0%) |
| $7,500 to $9,999 | 0 (0.0%) | 0 (0.0%) |
| $10,000 to $12,499 | 0 (0.0%) | 0 (0.0%) |
| $12,500 to $14,999 | 26 (3.7%) | 0 (0.0%) |
| $15,000 to $17,499 | 0 (0.0%) | 0 (0.0%) |
| $17,500 to $19,999 | 0 (0.0%) | 0 (0.0%) |
| $20,000 to $22,499 | 0 (0.0%) | 0 (0.0%) |
| $22,500 to $24,999 | 29 (4.2%) | 3 (0.6%) |
| $25,000 to $29,999 | 5 (0.7%) | 50 (9.3%) |
| $30,000 to $34,999 | 120 (17.2%) | 86 (16.0%) |
| $35,000 to $39,999 | 62 (8.9%) | 36 (6.7%) |
| $40,000 to $44,999 | 27 (3.9%) | 0 (0.0%) |
| $45,000 to $49,999 | 37 (5.3%) | 80 (14.9%) |
| $50,000 to $54,999 | 48 (6.9%) | 0 (0.0%) |
| $55,000 to $64,999 | 24 (3.4%) | 26 (4.9%) |
| $65,000 to $74,999 | 42 (6.0%) | 10 (1.9%) |
| $75,000 to $99,999 | 101 (14.4%) | 129 (24.1%) |
| $100,000+ | 117 (16.7%) | 35 (6.5%) |
| Total | 699 (100.0%) | 536 (100.0%) |
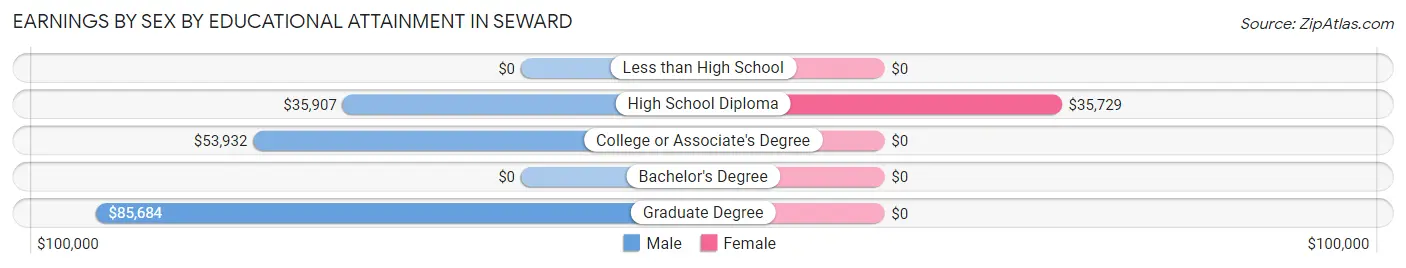
Earnings by Sex by Educational Attainment in Seward
Average earnings in Seward are $48,277 for men and $48,109 for women, a difference of 0.4%. Men with an educational attainment of graduate degree enjoy the highest average annual earnings of $85,684, while those with high school diploma education earn the least with $35,907. Women with an educational attainment of high school diploma earn the most with the average annual earnings of $35,729, while those with high school diploma education have the smallest earnings of $35,729.
| Educational Attainment | Male Income | Female Income |
| Less than High School | - | - |
| High School Diploma | $35,907 | $35,729 |
| College or Associate's Degree | $53,932 | $0 |
| Bachelor's Degree | - | - |
| Graduate Degree | $85,684 | $0 |
| Total | $48,277 | $48,109 |
Family Income in Seward
Family Income Brackets in Seward
According to the Seward family income data, there are 164 families falling into the $100,000 to $149,999 income range, which is the most common income bracket and makes up 28.7% of all families.
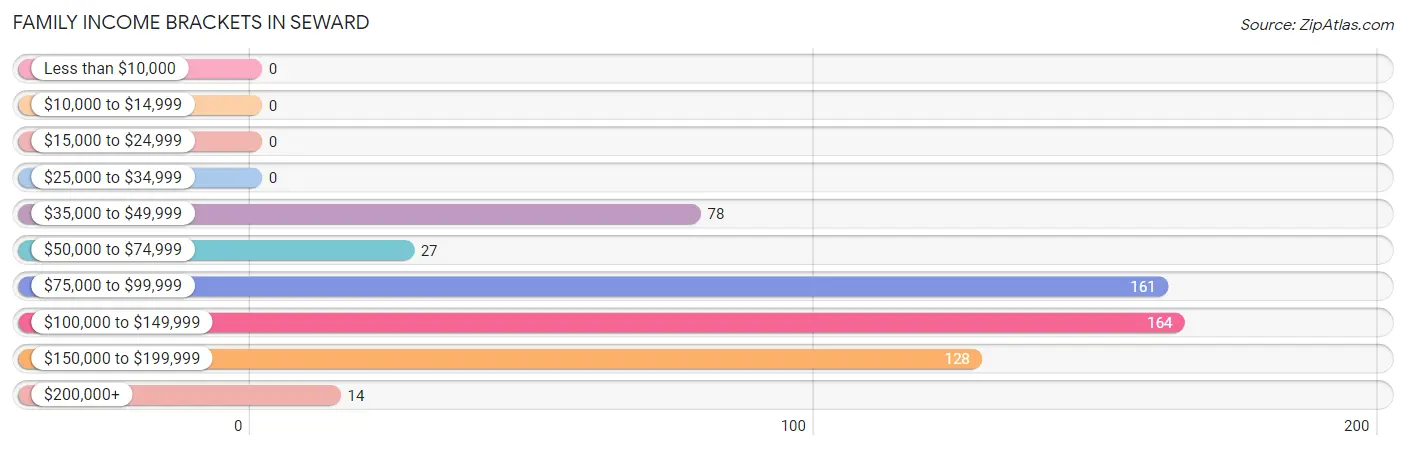
| Income Bracket | # Families | % Families |
| Less than $10,000 | 0 | 0.0% |
| $10,000 to $14,999 | 0 | 0.0% |
| $15,000 to $24,999 | 0 | 0.0% |
| $25,000 to $34,999 | 0 | 0.0% |
| $35,000 to $49,999 | 78 | 13.6% |
| $50,000 to $74,999 | 27 | 4.7% |
| $75,000 to $99,999 | 161 | 28.1% |
| $100,000 to $149,999 | 164 | 28.7% |
| $150,000 to $199,999 | 128 | 22.4% |
| $200,000+ | 14 | 2.4% |
Family Income by Famaliy Size in Seward
4-person families (132 | 23.1%) account for the highest median family income in Seward with $170,463 per family, while 4-person families (132 | 23.1%) have the highest median income of $42,616 per family member.
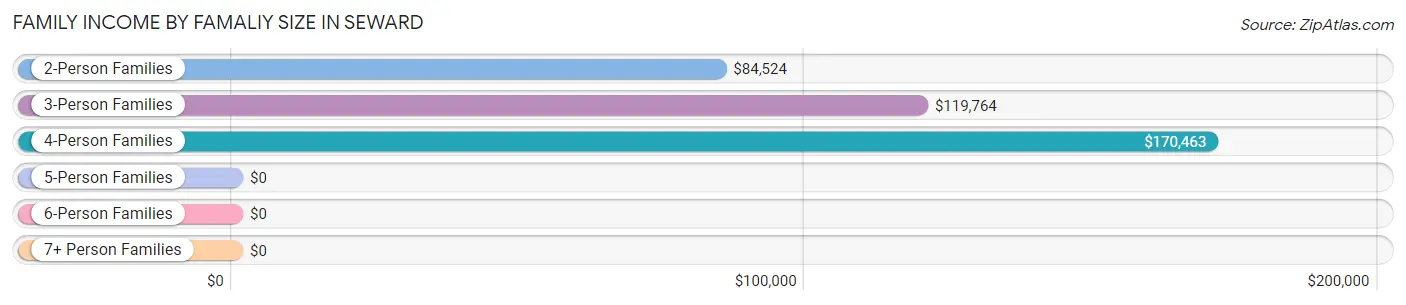
| Income Bracket | # Families | Median Income |
| 2-Person Families | 314 (54.9%) | $84,524 |
| 3-Person Families | 67 (11.7%) | $119,764 |
| 4-Person Families | 132 (23.1%) | $170,463 |
| 5-Person Families | 59 (10.3%) | $0 |
| 6-Person Families | 0 (0.0%) | $0 |
| 7+ Person Families | 0 (0.0%) | $0 |
| Total | 572 (100.0%) | $113,750 |
Family Income by Number of Earners in Seward
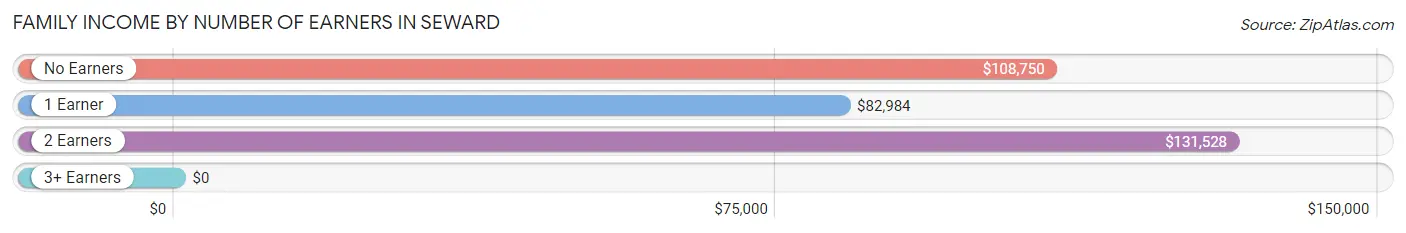
| Number of Earners | # Families | Median Income |
| No Earners | 84 (14.7%) | $108,750 |
| 1 Earner | 176 (30.8%) | $82,984 |
| 2 Earners | 275 (48.1%) | $131,528 |
| 3+ Earners | 37 (6.5%) | $0 |
| Total | 572 (100.0%) | $113,750 |
Household Income in Seward
Household Income Brackets in Seward
With 212 households falling in the category, the $75,000 to $99,999 income range is the most frequent in Seward, accounting for 20.8% of all households. In contrast, only 14 households (1.4%) fall into the $200,000+ income bracket, making it the least populous group.
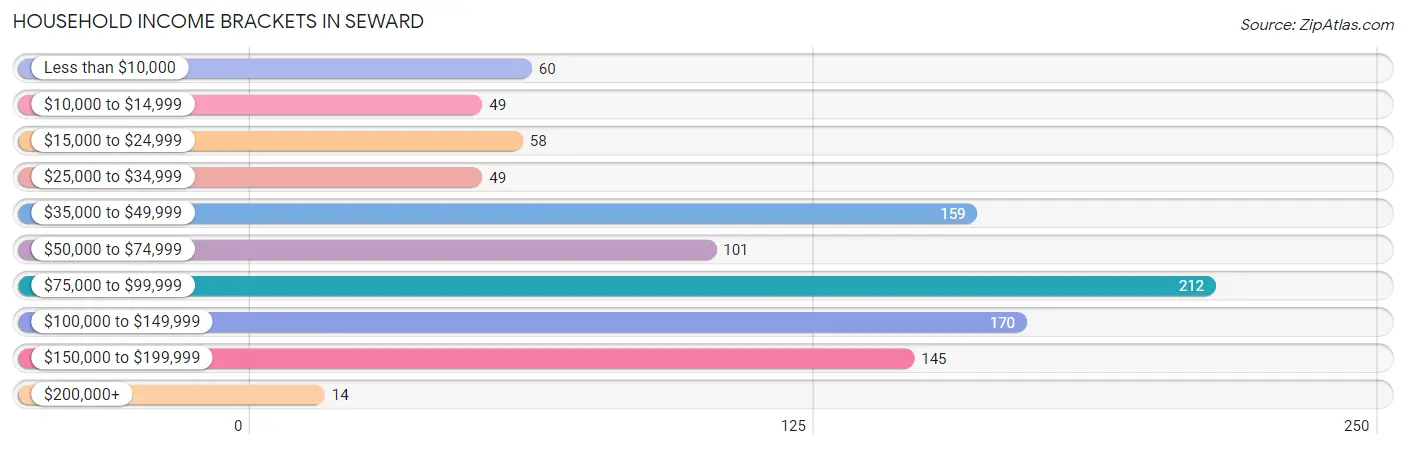
| Income Bracket | # Households | % Households |
| Less than $10,000 | 60 | 5.9% |
| $10,000 to $14,999 | 49 | 4.8% |
| $15,000 to $24,999 | 58 | 5.7% |
| $25,000 to $34,999 | 49 | 4.8% |
| $35,000 to $49,999 | 159 | 15.6% |
| $50,000 to $74,999 | 101 | 9.9% |
| $75,000 to $99,999 | 212 | 20.8% |
| $100,000 to $149,999 | 170 | 16.7% |
| $150,000 to $199,999 | 145 | 14.3% |
| $200,000+ | 14 | 1.4% |
Household Income by Householder Age in Seward
The median household income in Seward is $77,850, with the highest median household income of $75,302 found in the 45 to 64 years age bracket for the primary householder. A total of 369 households (36.3%) fall into this category. Meanwhile, the 15 to 24 years age bracket for the primary householder has the lowest median household income of $0, with 40 households (3.9%) in this group.
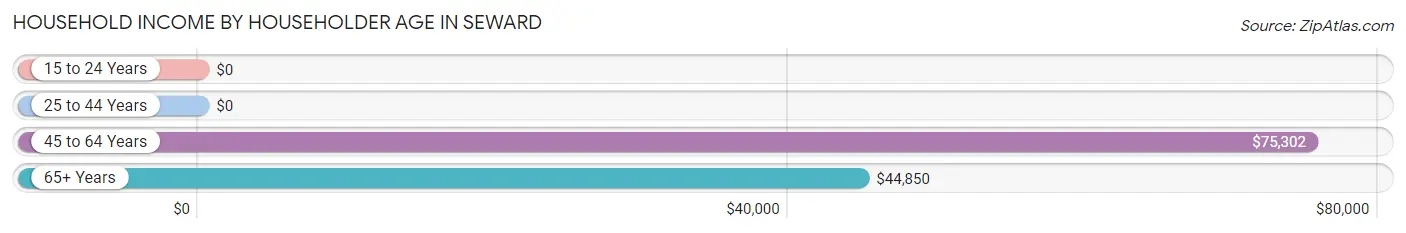
| Income Bracket | # Households | Median Income |
| 15 to 24 Years | 40 (3.9%) | $0 |
| 25 to 44 Years | 299 (29.4%) | $0 |
| 45 to 64 Years | 369 (36.3%) | $75,302 |
| 65+ Years | 309 (30.4%) | $44,850 |
| Total | 1,017 (100.0%) | $77,850 |
Poverty in Seward
Income Below Poverty by Sex and Age in Seward
With 3.5% poverty level for males and 9.9% for females among the residents of Seward, 65 to 74 year old males and 25 to 34 year old females are the most vulnerable to poverty, with 48 males (28.6%) and 29 females (40.3%) in their respective age groups living below the poverty level.
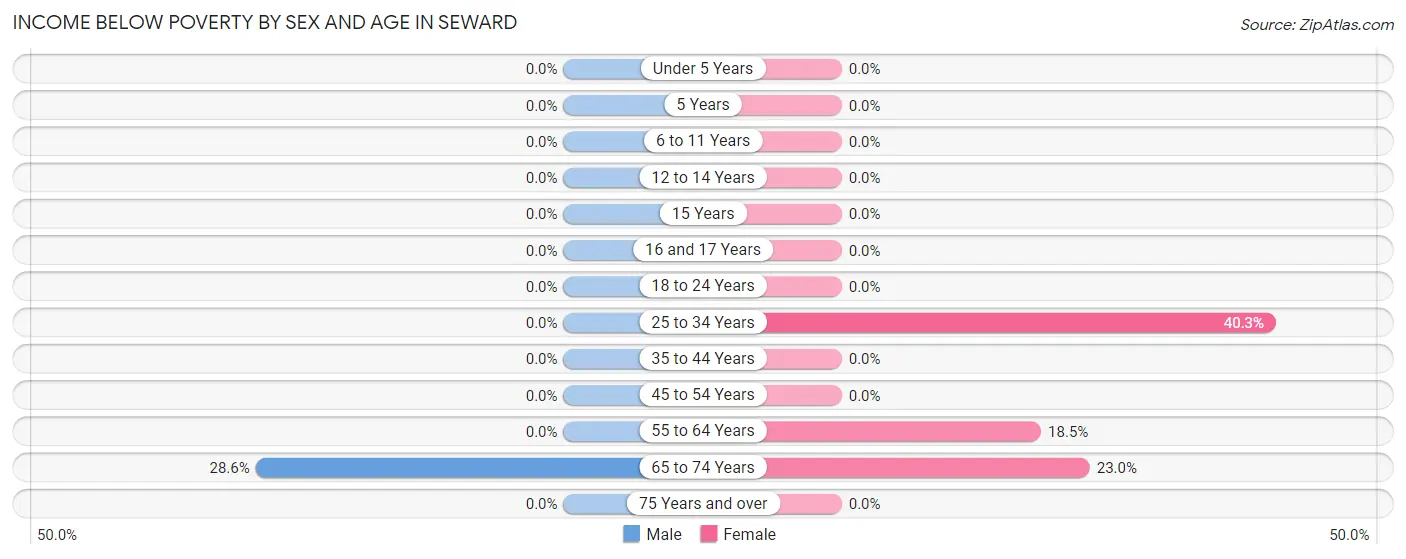
| Age Bracket | Male | Female |
| Under 5 Years | 0 (0.0%) | 0 (0.0%) |
| 5 Years | 0 (0.0%) | 0 (0.0%) |
| 6 to 11 Years | 0 (0.0%) | 0 (0.0%) |
| 12 to 14 Years | 0 (0.0%) | 0 (0.0%) |
| 15 Years | 0 (0.0%) | 0 (0.0%) |
| 16 and 17 Years | 0 (0.0%) | 0 (0.0%) |
| 18 to 24 Years | 0 (0.0%) | 0 (0.0%) |
| 25 to 34 Years | 0 (0.0%) | 29 (40.3%) |
| 35 to 44 Years | 0 (0.0%) | 0 (0.0%) |
| 45 to 54 Years | 0 (0.0%) | 0 (0.0%) |
| 55 to 64 Years | 0 (0.0%) | 32 (18.5%) |
| 65 to 74 Years | 48 (28.6%) | 29 (23.0%) |
| 75 Years and over | 0 (0.0%) | 0 (0.0%) |
| Total | 48 (3.5%) | 90 (9.9%) |
Income Above Poverty by Sex and Age in Seward
According to the poverty statistics in Seward, males aged under 5 years and females aged 6 to 11 years are the age groups that are most secure financially, with 100.0% of males and 100.0% of females in these age groups living above the poverty line.
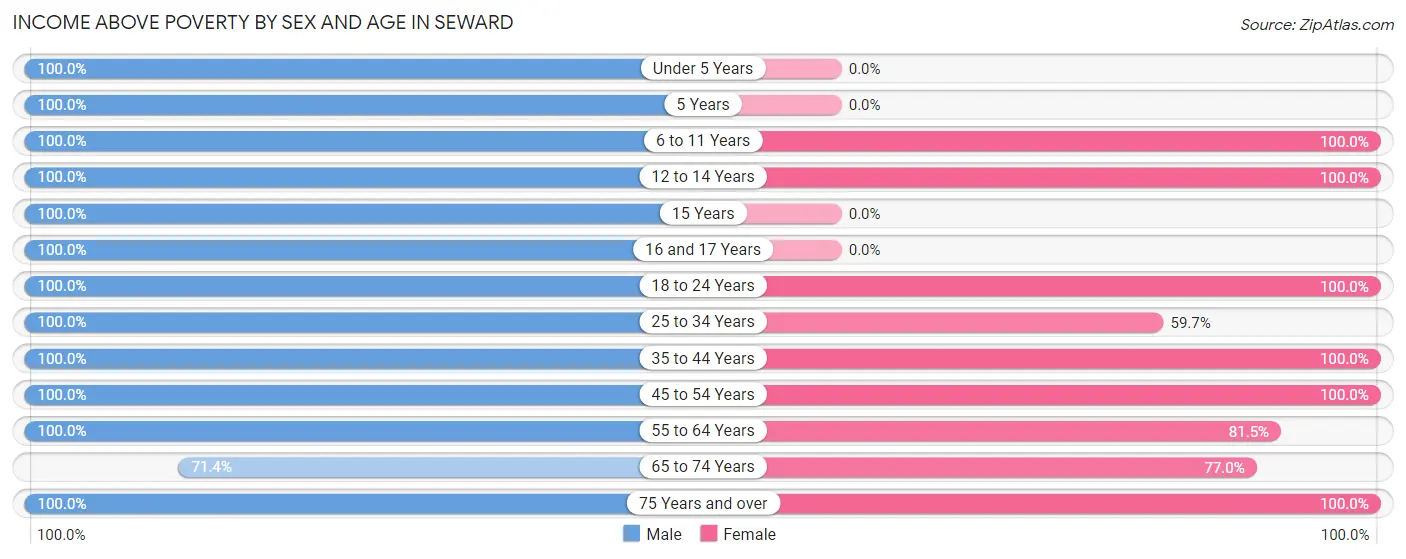
| Age Bracket | Male | Female |
| Under 5 Years | 103 (100.0%) | 0 (0.0%) |
| 5 Years | 15 (100.0%) | 0 (0.0%) |
| 6 to 11 Years | 147 (100.0%) | 26 (100.0%) |
| 12 to 14 Years | 34 (100.0%) | 167 (100.0%) |
| 15 Years | 24 (100.0%) | 0 (0.0%) |
| 16 and 17 Years | 58 (100.0%) | 0 (0.0%) |
| 18 to 24 Years | 17 (100.0%) | 34 (100.0%) |
| 25 to 34 Years | 188 (100.0%) | 43 (59.7%) |
| 35 to 44 Years | 125 (100.0%) | 170 (100.0%) |
| 45 to 54 Years | 187 (100.0%) | 111 (100.0%) |
| 55 to 64 Years | 230 (100.0%) | 141 (81.5%) |
| 65 to 74 Years | 120 (71.4%) | 97 (77.0%) |
| 75 Years and over | 58 (100.0%) | 33 (100.0%) |
| Total | 1,306 (96.5%) | 822 (90.1%) |
Income Below Poverty Among Married-Couple Families in Seward
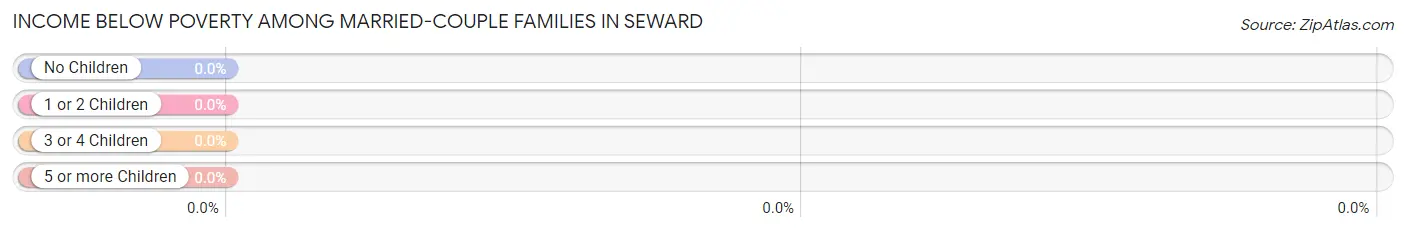
| Children | Above Poverty | Below Poverty |
| No Children | 299 (100.0%) | 0 (0.0%) |
| 1 or 2 Children | 111 (100.0%) | 0 (0.0%) |
| 3 or 4 Children | 33 (100.0%) | 0 (0.0%) |
| 5 or more Children | 0 (0.0%) | 0 (0.0%) |
| Total | 443 (100.0%) | 0 (0.0%) |
Income Below Poverty Among Single-Parent Households in Seward
| Children | Single Father | Single Mother |
| No Children | 0 (0.0%) | 0 (0.0%) |
| 1 or 2 Children | 0 (0.0%) | 0 (0.0%) |
| 3 or 4 Children | 0 (0.0%) | 0 (0.0%) |
| 5 or more Children | 0 (0.0%) | 0 (0.0%) |
| Total | 0 (0.0%) | 0 (0.0%) |
Income Below Poverty Among Married-Couple vs Single-Parent Households in Seward
| Children | Married-Couple Families | Single-Parent Households |
| No Children | 0 (0.0%) | 0 (0.0%) |
| 1 or 2 Children | 0 (0.0%) | 0 (0.0%) |
| 3 or 4 Children | 0 (0.0%) | 0 (0.0%) |
| 5 or more Children | 0 (0.0%) | 0 (0.0%) |
| Total | 0 (0.0%) | 0 (0.0%) |
Race in Seward
The most populous races in Seward are White / Caucasian (1,956 | 70.7%), Native / Alaskan (347 | 12.5%), and Hispanic or Latino (179 | 6.5%).
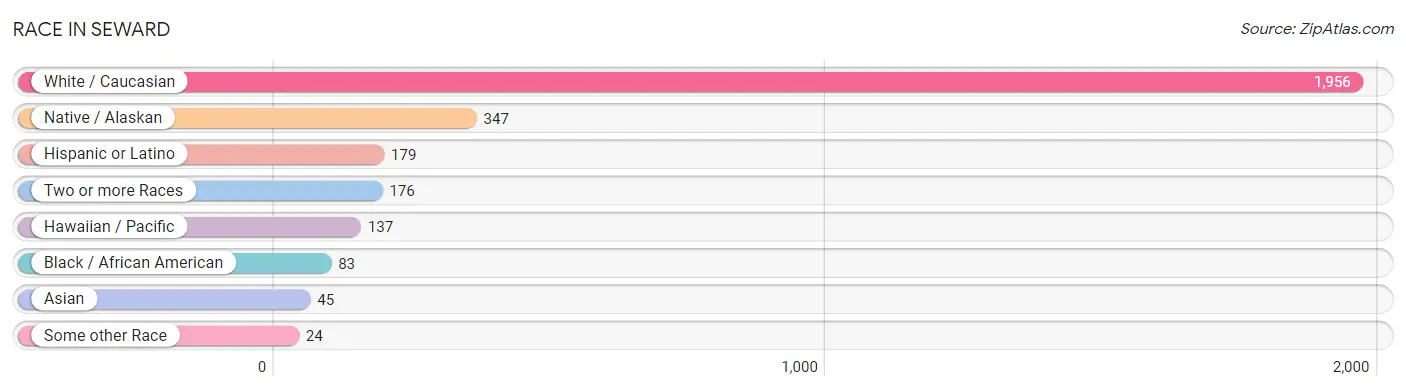
| Race | # Population | % Population |
| Asian | 45 | 1.6% |
| Black / African American | 83 | 3.0% |
| Hawaiian / Pacific | 137 | 5.0% |
| Hispanic or Latino | 179 | 6.5% |
| Native / Alaskan | 347 | 12.5% |
| White / Caucasian | 1,956 | 70.7% |
| Two or more Races | 176 | 6.4% |
| Some other Race | 24 | 0.9% |
| Total | 2,768 | 100.0% |
Ancestry in Seward
The most populous ancestries reported in Seward are German (433 | 15.6%), Norwegian (255 | 9.2%), English (215 | 7.8%), Inupiat (180 | 6.5%), and Yup'ik (157 | 5.7%), together accounting for 44.8% of all Seward residents.
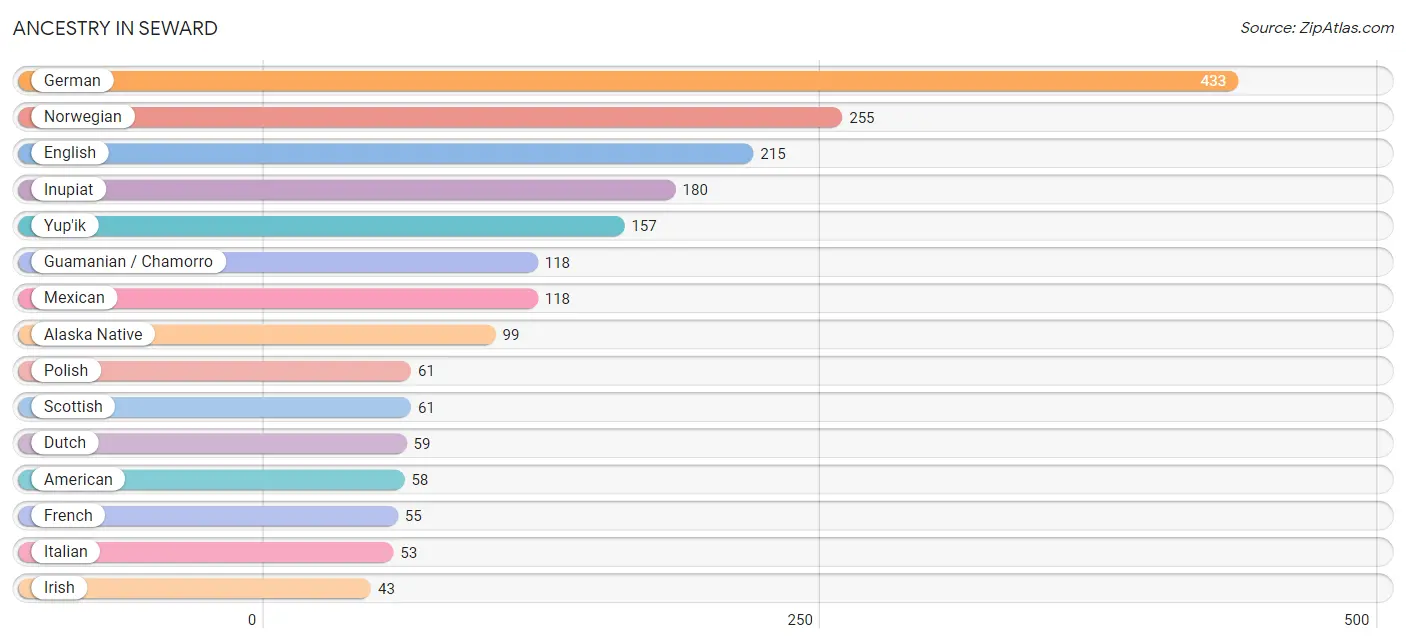
| Ancestry | # Population | % Population |
| African | 1 | 0.0% |
| Alaska Native | 99 | 3.6% |
| Aleut | 32 | 1.2% |
| American | 58 | 2.1% |
| Arab | 23 | 0.8% |
| Australian | 6 | 0.2% |
| Austrian | 11 | 0.4% |
| Burmese | 36 | 1.3% |
| Canadian | 5 | 0.2% |
| Central American | 23 | 0.8% |
| Chippewa | 15 | 0.5% |
| Colombian | 22 | 0.8% |
| Czech | 1 | 0.0% |
| Dutch | 59 | 2.1% |
| English | 215 | 7.8% |
| European | 40 | 1.5% |
| French | 55 | 2.0% |
| German | 433 | 15.6% |
| Guamanian / Chamorro | 118 | 4.3% |
| Honduran | 23 | 0.8% |
| Inupiat | 180 | 6.5% |
| Irish | 43 | 1.5% |
| Italian | 53 | 1.9% |
| Korean | 9 | 0.3% |
| Lithuanian | 8 | 0.3% |
| Mexican | 118 | 4.3% |
| Norwegian | 255 | 9.2% |
| Polish | 61 | 2.2% |
| Russian | 1 | 0.0% |
| Samoan | 19 | 0.7% |
| Scandinavian | 27 | 1.0% |
| Scottish | 61 | 2.2% |
| Slovak | 23 | 0.8% |
| South American | 22 | 0.8% |
| Subsaharan African | 6 | 0.2% |
| Swedish | 21 | 0.8% |
| Tlingit-Haida | 4 | 0.1% |
| Ukrainian | 8 | 0.3% |
| Yup'ik | 157 | 5.7% | View All 39 Rows |
Immigrants in Seward
The most numerous immigrant groups reported in Seward came from Asia (72 | 2.6%), Central America (72 | 2.6%), Latin America (72 | 2.6%), Mexico (49 | 1.8%), and Europe (47 | 1.7%), together accounting for 11.3% of all Seward residents.
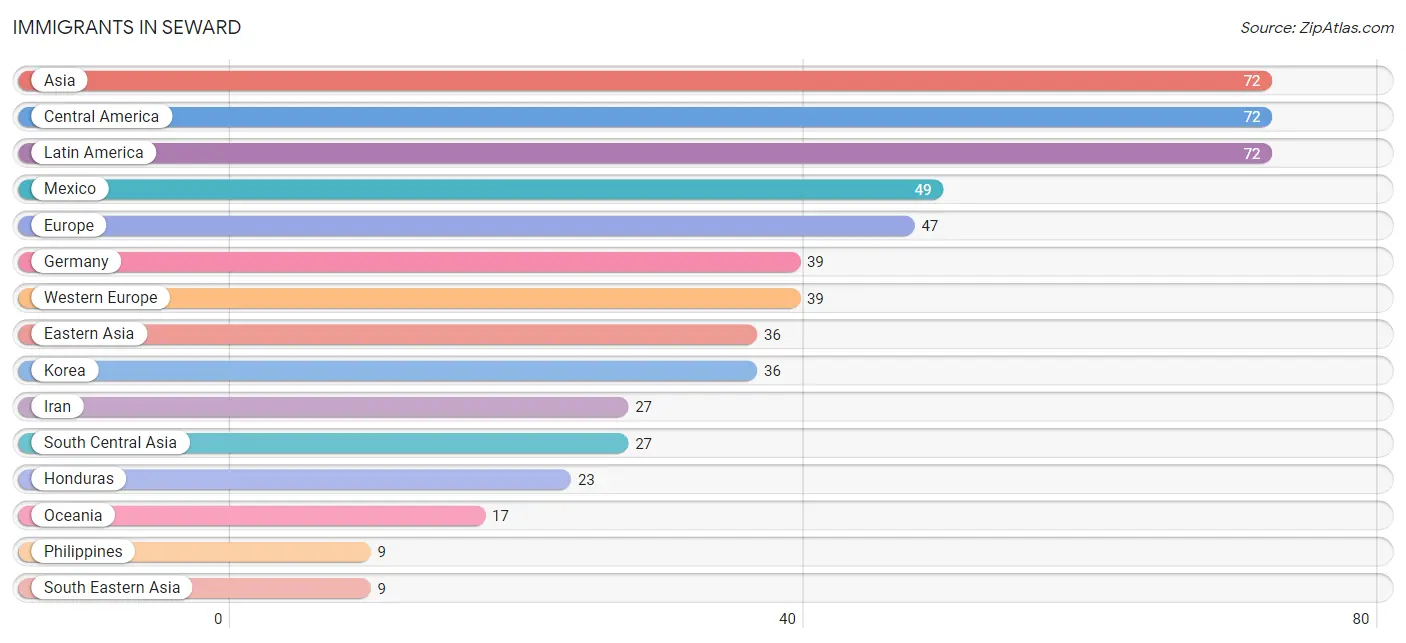
| Immigration Origin | # Population | % Population |
| Africa | 5 | 0.2% |
| Asia | 72 | 2.6% |
| Australia | 6 | 0.2% |
| Canada | 5 | 0.2% |
| Central America | 72 | 2.6% |
| Eastern Asia | 36 | 1.3% |
| Eastern Europe | 8 | 0.3% |
| Europe | 47 | 1.7% |
| Germany | 39 | 1.4% |
| Honduras | 23 | 0.8% |
| Iran | 27 | 1.0% |
| Korea | 36 | 1.3% |
| Latin America | 72 | 2.6% |
| Mexico | 49 | 1.8% |
| Oceania | 17 | 0.6% |
| Philippines | 9 | 0.3% |
| South Central Asia | 27 | 1.0% |
| South Eastern Asia | 9 | 0.3% |
| Ukraine | 8 | 0.3% |
| Western Africa | 5 | 0.2% |
| Western Europe | 39 | 1.4% | View All 21 Rows |
Sex and Age in Seward
Sex and Age in Seward
The most populous age groups in Seward are 45 to 49 Years (179 | 9.9%) for men and 10 to 14 Years (167 | 17.4%) for women.
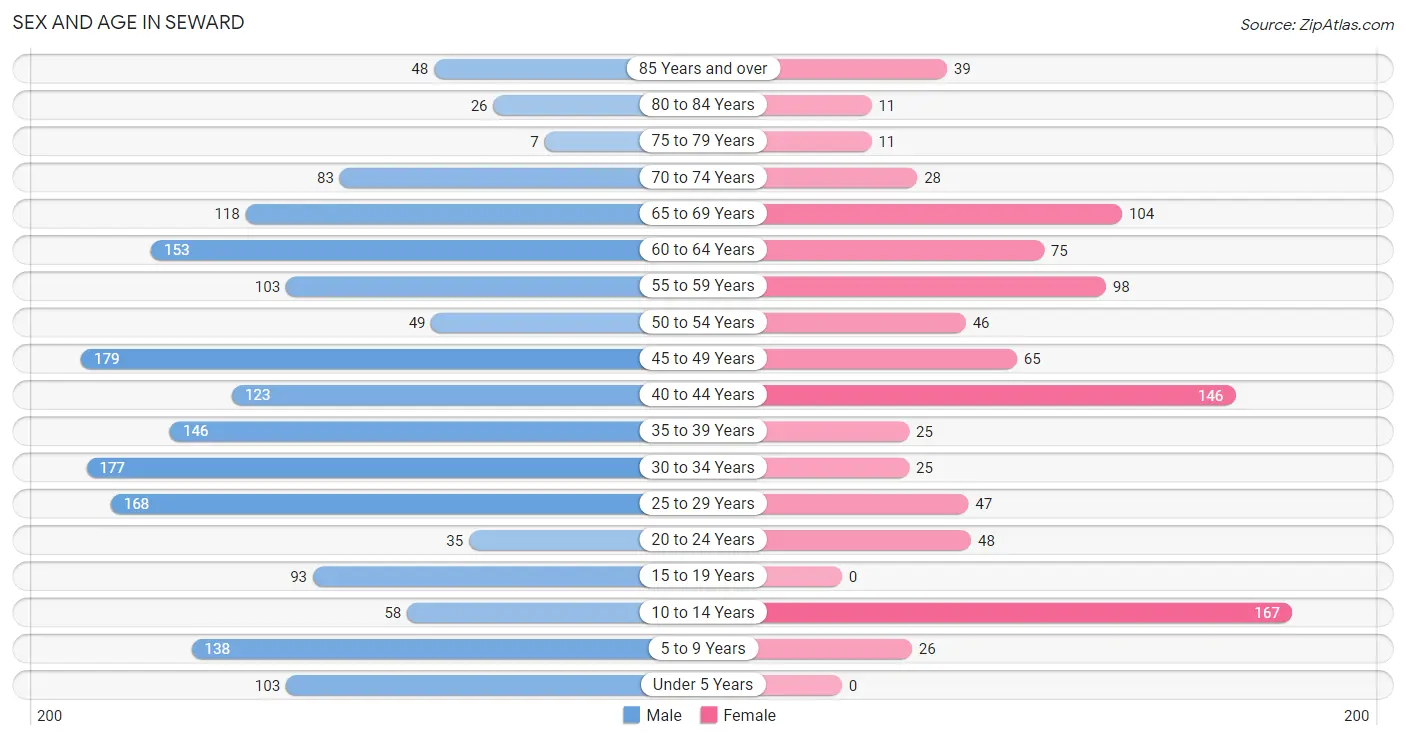
| Age Bracket | Male | Female |
| Under 5 Years | 103 (5.7%) | 0 (0.0%) |
| 5 to 9 Years | 138 (7.6%) | 26 (2.7%) |
| 10 to 14 Years | 58 (3.2%) | 167 (17.4%) |
| 15 to 19 Years | 93 (5.1%) | 0 (0.0%) |
| 20 to 24 Years | 35 (1.9%) | 48 (5.0%) |
| 25 to 29 Years | 168 (9.3%) | 47 (4.9%) |
| 30 to 34 Years | 177 (9.8%) | 25 (2.6%) |
| 35 to 39 Years | 146 (8.1%) | 25 (2.6%) |
| 40 to 44 Years | 123 (6.8%) | 146 (15.2%) |
| 45 to 49 Years | 179 (9.9%) | 65 (6.8%) |
| 50 to 54 Years | 49 (2.7%) | 46 (4.8%) |
| 55 to 59 Years | 103 (5.7%) | 98 (10.2%) |
| 60 to 64 Years | 153 (8.5%) | 75 (7.8%) |
| 65 to 69 Years | 118 (6.5%) | 104 (10.8%) |
| 70 to 74 Years | 83 (4.6%) | 28 (2.9%) |
| 75 to 79 Years | 7 (0.4%) | 11 (1.1%) |
| 80 to 84 Years | 26 (1.4%) | 11 (1.1%) |
| 85 Years and over | 48 (2.7%) | 39 (4.1%) |
| Total | 1,807 (100.0%) | 961 (100.0%) |
Families and Households in Seward
Median Family Size in Seward
The median family size in Seward is 2.91 persons per family, with single male/father families (76 | 13.3%) accounting for the largest median family size of 4.14 persons per family. On the other hand, married-couple families (443 | 77.4%) represent the smallest median family size with 2.59 persons per family.
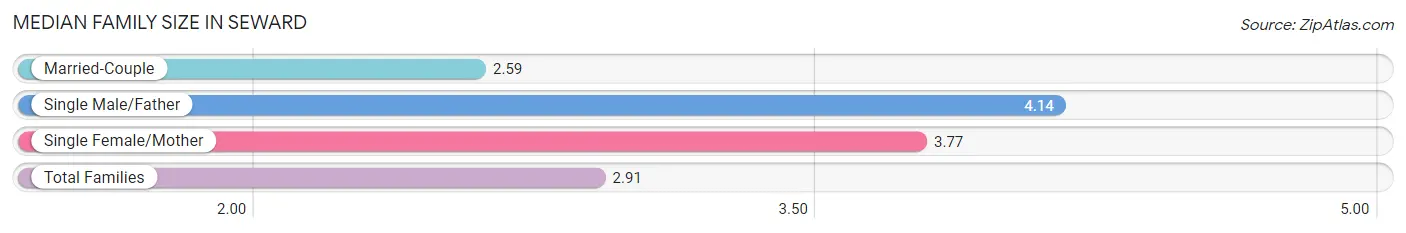
| Family Type | # Families | Family Size |
| Married-Couple | 443 (77.4%) | 2.59 |
| Single Male/Father | 76 (13.3%) | 4.14 |
| Single Female/Mother | 53 (9.3%) | 3.77 |
| Total Families | 572 (100.0%) | 2.91 |
Median Household Size in Seward
The median household size in Seward is 2.11 persons per household, with single male/father households (76 | 7.5%) accounting for the largest median household size of 4.53 persons per household. non-family households (445 | 43.8%) represent the smallest median household size with 1.02 persons per household.
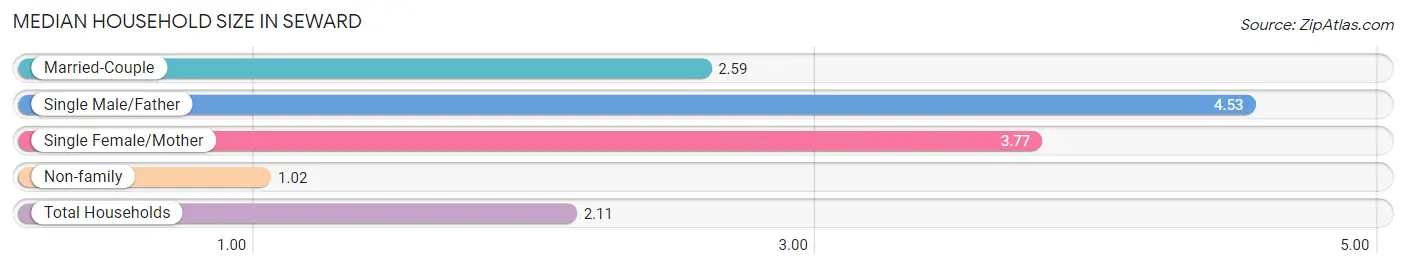
| Household Type | # Households | Household Size |
| Married-Couple | 443 (43.6%) | 2.59 |
| Single Male/Father | 76 (7.5%) | 4.53 |
| Single Female/Mother | 53 (5.2%) | 3.77 |
| Non-family | 445 (43.8%) | 1.02 |
| Total Households | 1,017 (100.0%) | 2.11 |
Household Size by Marriage Status in Seward
Out of a total of 1,017 households in Seward, 572 (56.2%) are family households, while 445 (43.8%) are nonfamily households. The most numerous type of family households are 2-person households, comprising 314, and the most common type of nonfamily households are 1-person households, comprising 428.
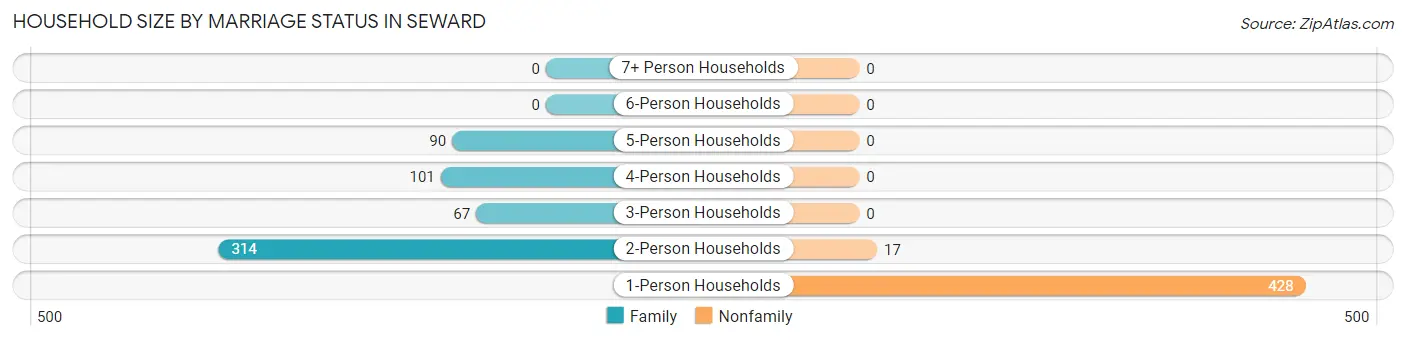
| Household Size | Family Households | Nonfamily Households |
| 1-Person Households | - | 428 (42.1%) |
| 2-Person Households | 314 (30.9%) | 17 (1.7%) |
| 3-Person Households | 67 (6.6%) | 0 (0.0%) |
| 4-Person Households | 101 (9.9%) | 0 (0.0%) |
| 5-Person Households | 90 (8.8%) | 0 (0.0%) |
| 6-Person Households | 0 (0.0%) | 0 (0.0%) |
| 7+ Person Households | 0 (0.0%) | 0 (0.0%) |
| Total | 572 (56.2%) | 445 (43.8%) |
Female Fertility in Seward
Fertility by Age in Seward
Average fertility rate in Seward is 77.0 births per 1,000 women. Women in the age bracket of 20 to 34 years have the highest fertility rate with 242.0 births per 1,000 women. Women in the age bracket of 20 to 34 years acount for 100.0% of all women with births.
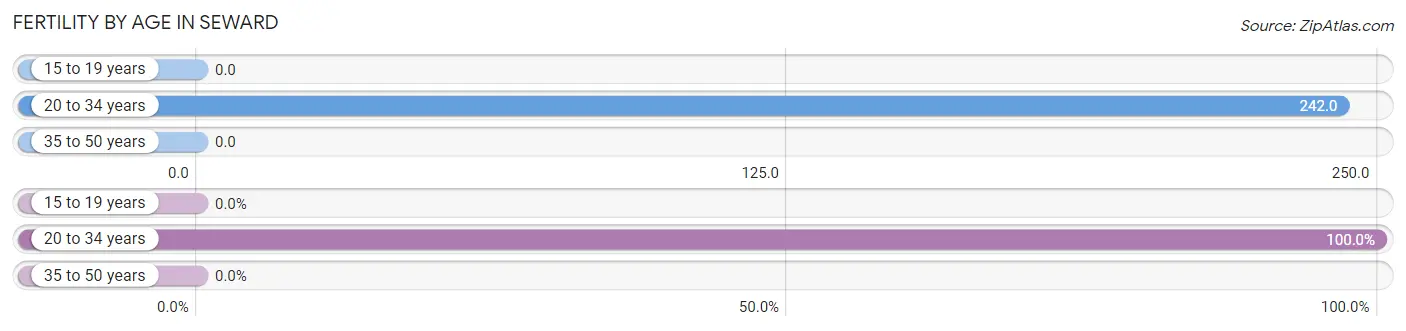
| Age Bracket | Women with Births | Births / 1,000 Women |
| 15 to 19 years | 0 (0.0%) | 0.0 |
| 20 to 34 years | 29 (100.0%) | 242.0 |
| 35 to 50 years | 0 (0.0%) | 0.0 |
| Total | 29 (100.0%) | 77.0 |
Fertility by Age by Marriage Status in Seward
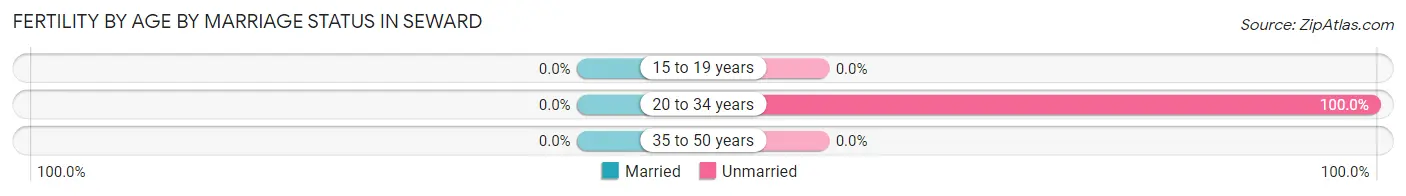
| Age Bracket | Married | Unmarried |
| 15 to 19 years | 0 (0.0%) | 0 (0.0%) |
| 20 to 34 years | 0 (0.0%) | 29 (100.0%) |
| 35 to 50 years | 0 (0.0%) | 0 (0.0%) |
| Total | 0 (0.0%) | 29 (100.0%) |
Fertility by Education in Seward
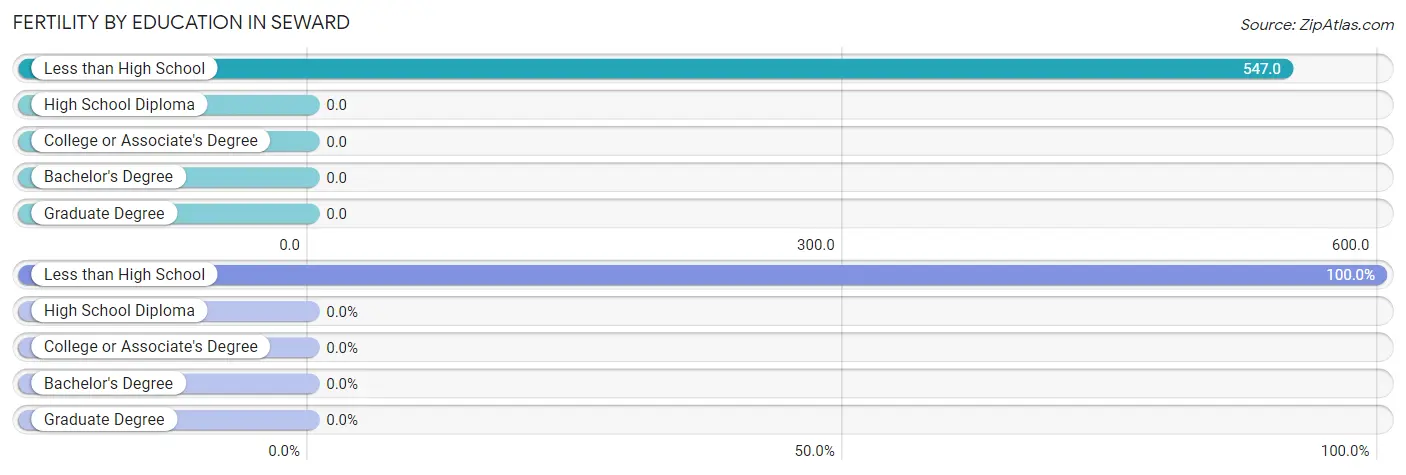
| Educational Attainment | Women with Births | Births / 1,000 Women |
| Less than High School | 29 (100.0%) | 547.0 |
| High School Diploma | 0 (0.0%) | 0.0 |
| College or Associate's Degree | 0 (0.0%) | 0.0 |
| Bachelor's Degree | 0 (0.0%) | 0.0 |
| Graduate Degree | 0 (0.0%) | 0.0 |
| Total | 29 (100.0%) | 77.0 |
Fertility by Education by Marriage Status in Seward
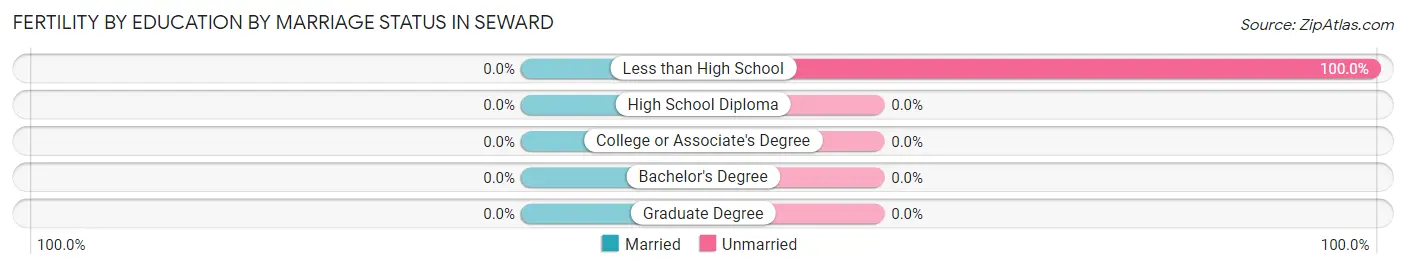
| Educational Attainment | Married | Unmarried |
| Less than High School | 0 (0.0%) | 29 (100.0%) |
| High School Diploma | 0 (0.0%) | 0 (0.0%) |
| College or Associate's Degree | 0 (0.0%) | 0 (0.0%) |
| Bachelor's Degree | 0 (0.0%) | 0 (0.0%) |
| Graduate Degree | 0 (0.0%) | 0 (0.0%) |
| Total | 0 (0.0%) | 29 (100.0%) |
Employment Characteristics in Seward
Employment by Class of Employer in Seward
Among the 1,091 employed individuals in Seward, private company employees (537 | 49.2%), state government employees (171 | 15.7%), and self-employed (not incorporated) (95 | 8.7%) make up the most common classes of employment.
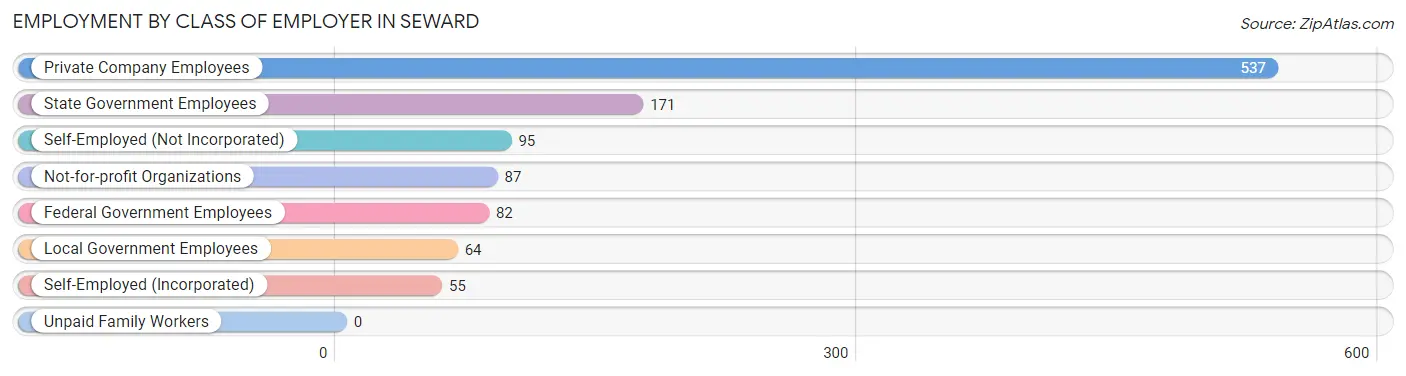
| Employer Class | # Employees | % Employees |
| Private Company Employees | 537 | 49.2% |
| Self-Employed (Incorporated) | 55 | 5.0% |
| Self-Employed (Not Incorporated) | 95 | 8.7% |
| Not-for-profit Organizations | 87 | 8.0% |
| Local Government Employees | 64 | 5.9% |
| State Government Employees | 171 | 15.7% |
| Federal Government Employees | 82 | 7.5% |
| Unpaid Family Workers | 0 | 0.0% |
| Total | 1,091 | 100.0% |
Employment Status by Age in Seward
According to the labor force statistics for Seward, out of the total population over 16 years of age (2,252), 50.9% or 1,146 individuals are in the labor force, with 4.8% or 55 of them unemployed. The age group with the highest labor force participation rate is 45 to 54 years, with 79.1% or 268 individuals in the labor force. Within the labor force, the 20 to 24 years age range has the highest percentage of unemployed individuals, with 42.6% or 23 of them being unemployed.
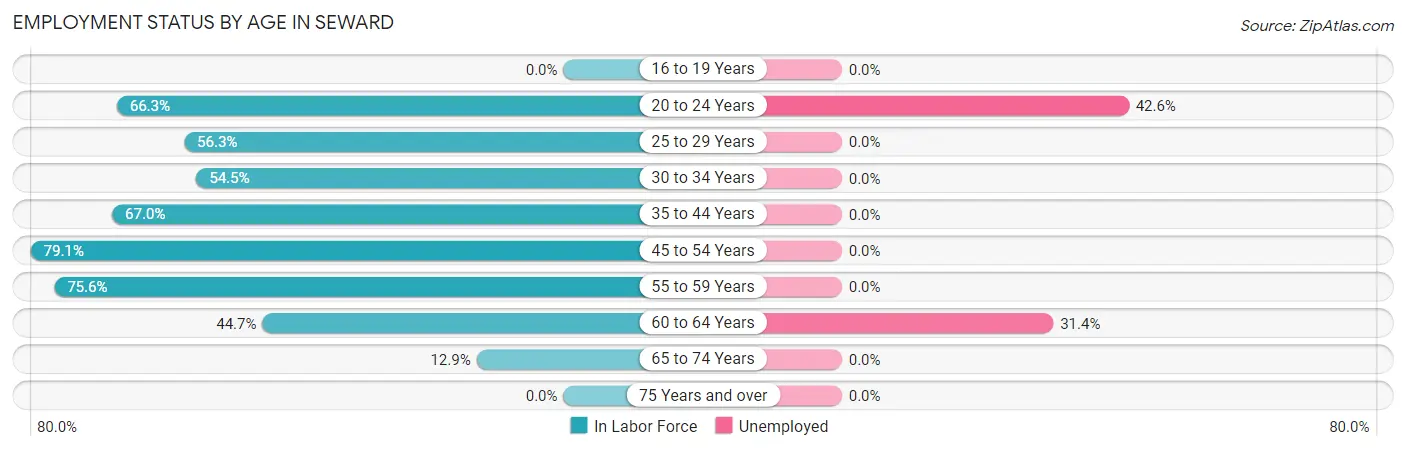
| Age Bracket | In Labor Force | Unemployed |
| 16 to 19 Years | 0 (0.0%) | 0 (0.0%) |
| 20 to 24 Years | 55 (66.3%) | 23 (42.6%) |
| 25 to 29 Years | 121 (56.3%) | 0 (0.0%) |
| 30 to 34 Years | 110 (54.5%) | 0 (0.0%) |
| 35 to 44 Years | 295 (67.0%) | 0 (0.0%) |
| 45 to 54 Years | 268 (79.1%) | 0 (0.0%) |
| 55 to 59 Years | 152 (75.6%) | 0 (0.0%) |
| 60 to 64 Years | 102 (44.7%) | 32 (31.4%) |
| 65 to 74 Years | 43 (12.9%) | 0 (0.0%) |
| 75 Years and over | 0 (0.0%) | 0 (0.0%) |
| Total | 1,146 (50.9%) | 55 (4.8%) |
Employment Status by Educational Attainment in Seward
According to labor force statistics for Seward, 64.5% of individuals (1,048) out of the total population between 25 and 64 years of age (1,625) are in the labor force, with 3.1% or 32 of them being unemployed. The group with the highest labor force participation rate are those with the educational attainment of bachelor's degree or higher, with 88.3% or 470 individuals in the labor force. Within the labor force, individuals with bachelor's degree or higher education have the highest percentage of unemployment, with 6.8% or 32 of them being unemployed.
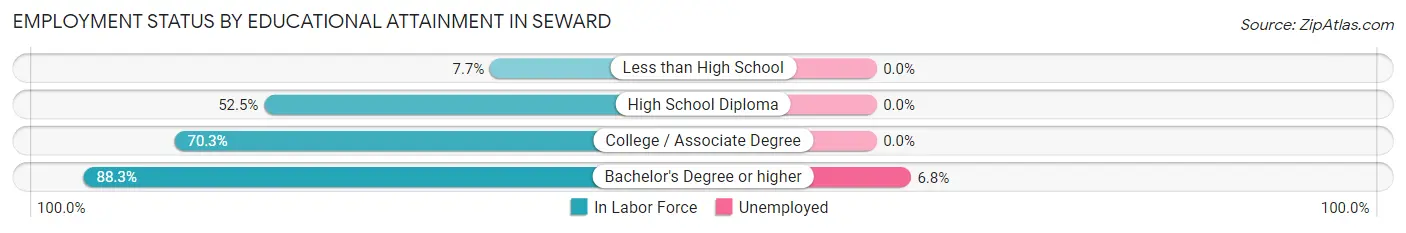
| Educational Attainment | In Labor Force | Unemployed |
| Less than High School | 6 (7.7%) | 0 (0.0%) |
| High School Diploma | 418 (52.5%) | 0 (0.0%) |
| College / Associate Degree | 154 (70.3%) | 0 (0.0%) |
| Bachelor's Degree or higher | 470 (88.3%) | 36 (6.8%) |
| Total | 1,048 (64.5%) | 50 (3.1%) |
Employment Occupations by Sex in Seward
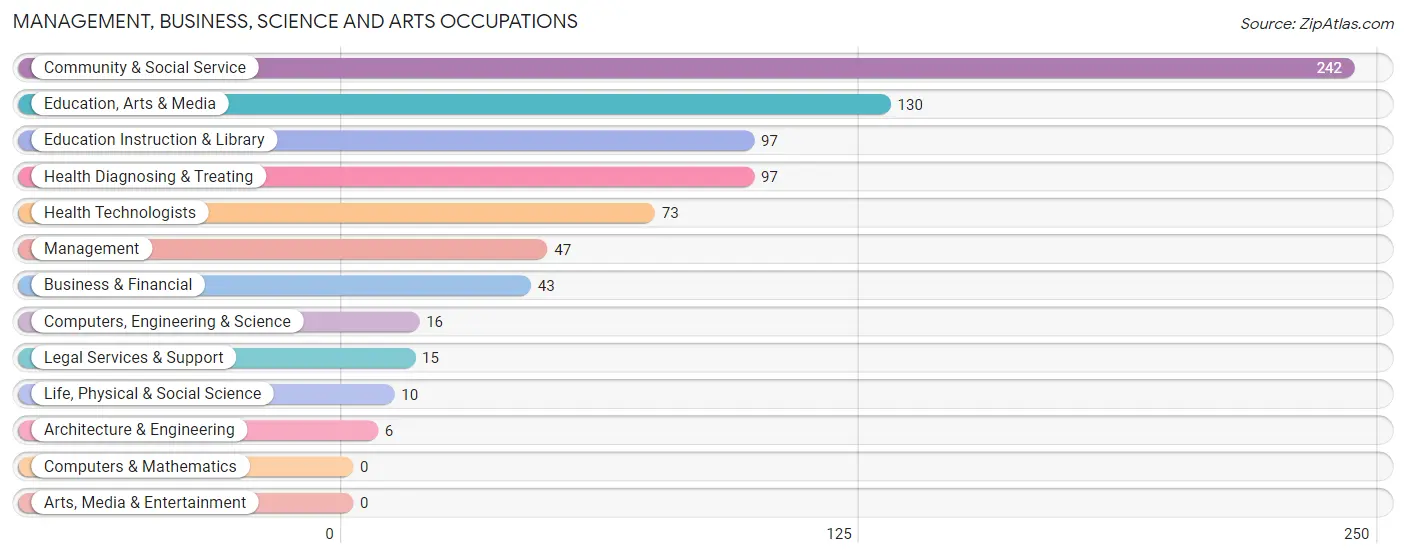
Management, Business, Science and Arts Occupations
The most common Management, Business, Science and Arts occupations in Seward are Community & Social Service (242 | 22.2%), Education, Arts & Media (130 | 11.9%), Education Instruction & Library (97 | 8.9%), Health Diagnosing & Treating (97 | 8.9%), and Health Technologists (73 | 6.7%).
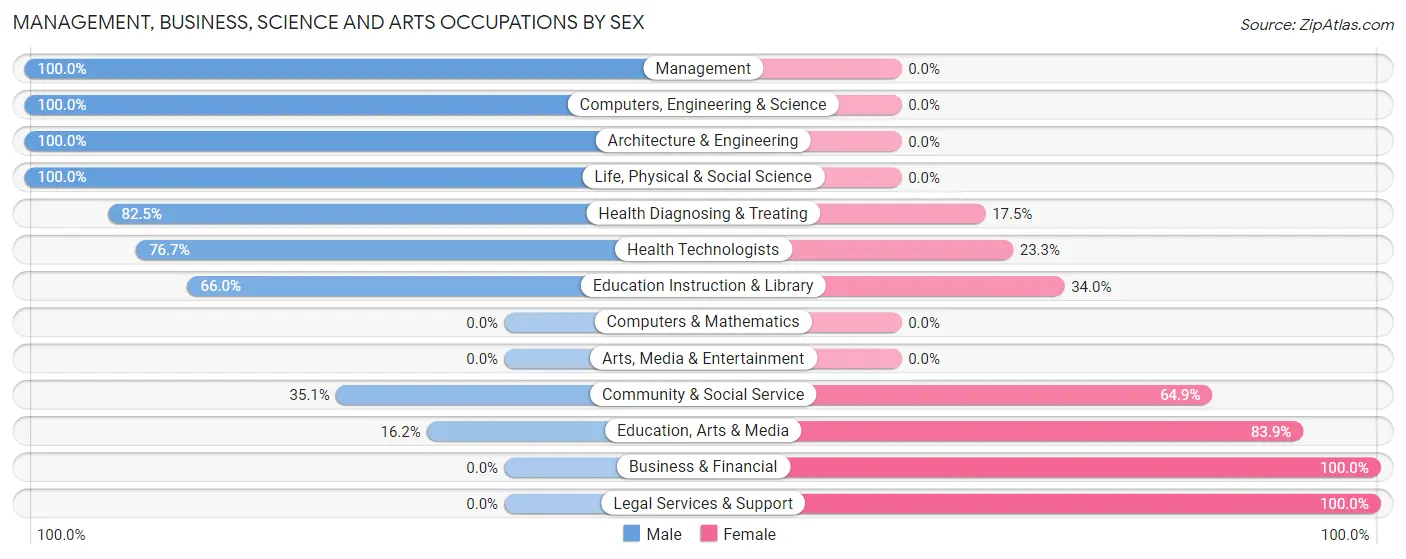
Management, Business, Science and Arts Occupations by Sex
Within the Management, Business, Science and Arts occupations in Seward, the most male-oriented occupations are Management (100.0%), Computers, Engineering & Science (100.0%), and Architecture & Engineering (100.0%), while the most female-oriented occupations are Business & Financial (100.0%), Legal Services & Support (100.0%), and Education, Arts & Media (83.9%).
| Occupation | Male | Female |
| Management | 47 (100.0%) | 0 (0.0%) |
| Business & Financial | 0 (0.0%) | 43 (100.0%) |
| Computers, Engineering & Science | 16 (100.0%) | 0 (0.0%) |
| Computers & Mathematics | 0 (0.0%) | 0 (0.0%) |
| Architecture & Engineering | 6 (100.0%) | 0 (0.0%) |
| Life, Physical & Social Science | 10 (100.0%) | 0 (0.0%) |
| Community & Social Service | 85 (35.1%) | 157 (64.9%) |
| Education, Arts & Media | 21 (16.2%) | 109 (83.9%) |
| Legal Services & Support | 0 (0.0%) | 15 (100.0%) |
| Education Instruction & Library | 64 (66.0%) | 33 (34.0%) |
| Arts, Media & Entertainment | 0 (0.0%) | 0 (0.0%) |
| Health Diagnosing & Treating | 80 (82.5%) | 17 (17.5%) |
| Health Technologists | 56 (76.7%) | 17 (23.3%) |
| Total (Category) | 228 (51.2%) | 217 (48.8%) |
| Total (Overall) | 658 (60.4%) | 432 (39.6%) |
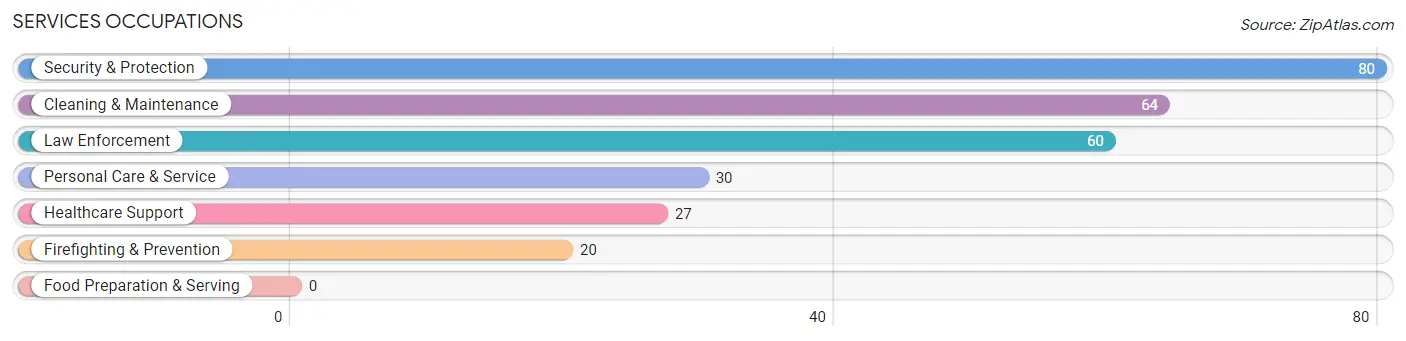
Services Occupations
The most common Services occupations in Seward are Security & Protection (80 | 7.3%), Cleaning & Maintenance (64 | 5.9%), Law Enforcement (60 | 5.5%), Personal Care & Service (30 | 2.8%), and Healthcare Support (27 | 2.5%).
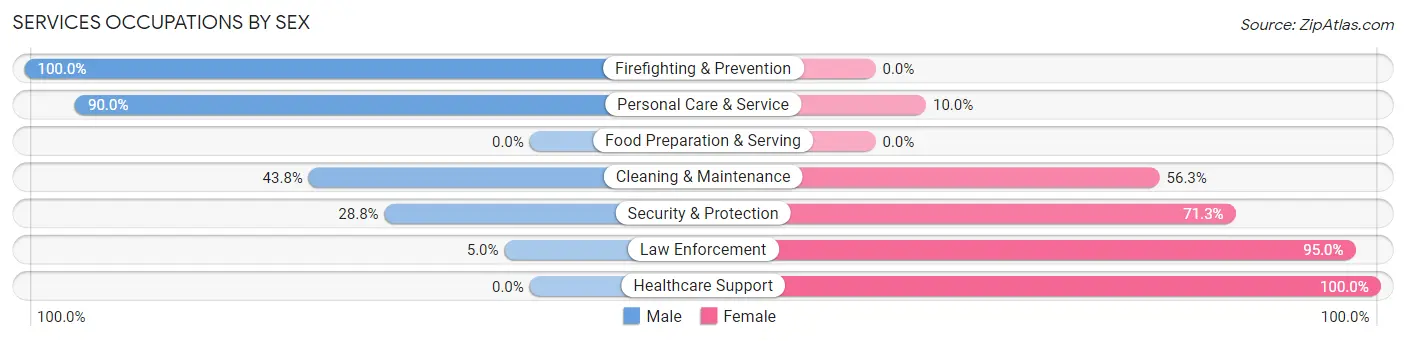
Services Occupations by Sex
Within the Services occupations in Seward, the most male-oriented occupations are Firefighting & Prevention (100.0%), Personal Care & Service (90.0%), and Cleaning & Maintenance (43.8%), while the most female-oriented occupations are Healthcare Support (100.0%), Law Enforcement (95.0%), and Security & Protection (71.3%).
| Occupation | Male | Female |
| Healthcare Support | 0 (0.0%) | 27 (100.0%) |
| Security & Protection | 23 (28.7%) | 57 (71.3%) |
| Firefighting & Prevention | 20 (100.0%) | 0 (0.0%) |
| Law Enforcement | 3 (5.0%) | 57 (95.0%) |
| Food Preparation & Serving | 0 (0.0%) | 0 (0.0%) |
| Cleaning & Maintenance | 28 (43.8%) | 36 (56.2%) |
| Personal Care & Service | 27 (90.0%) | 3 (10.0%) |
| Total (Category) | 78 (38.8%) | 123 (61.2%) |
| Total (Overall) | 658 (60.4%) | 432 (39.6%) |
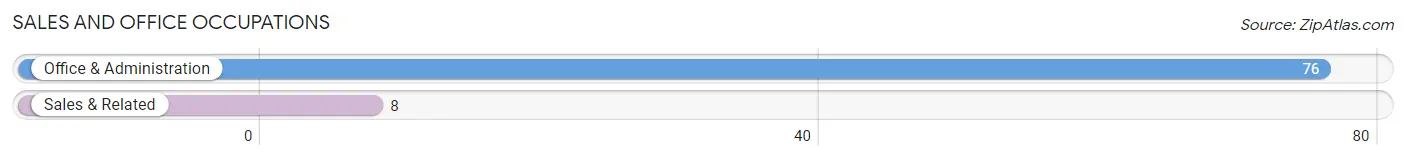
Sales and Office Occupations
The most common Sales and Office occupations in Seward are Office & Administration (76 | 7.0%), and Sales & Related (8 | 0.7%).
Sales and Office Occupations by Sex
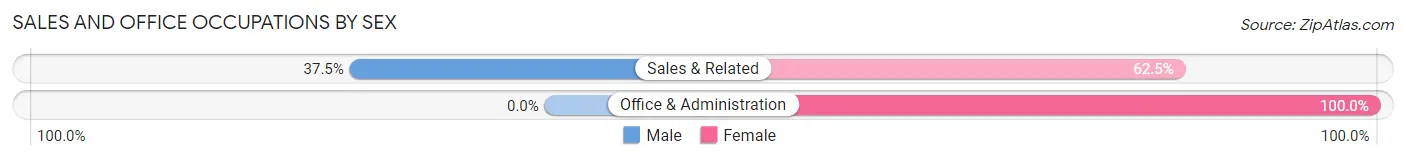
| Occupation | Male | Female |
| Sales & Related | 3 (37.5%) | 5 (62.5%) |
| Office & Administration | 0 (0.0%) | 76 (100.0%) |
| Total (Category) | 3 (3.6%) | 81 (96.4%) |
| Total (Overall) | 658 (60.4%) | 432 (39.6%) |
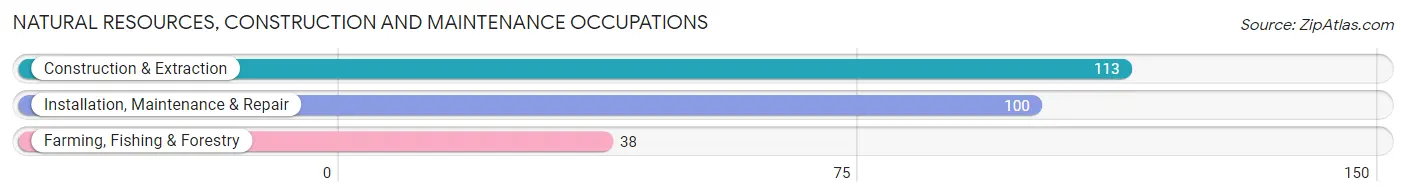
Natural Resources, Construction and Maintenance Occupations
The most common Natural Resources, Construction and Maintenance occupations in Seward are Construction & Extraction (113 | 10.4%), Installation, Maintenance & Repair (100 | 9.2%), and Farming, Fishing & Forestry (38 | 3.5%).
Natural Resources, Construction and Maintenance Occupations by Sex
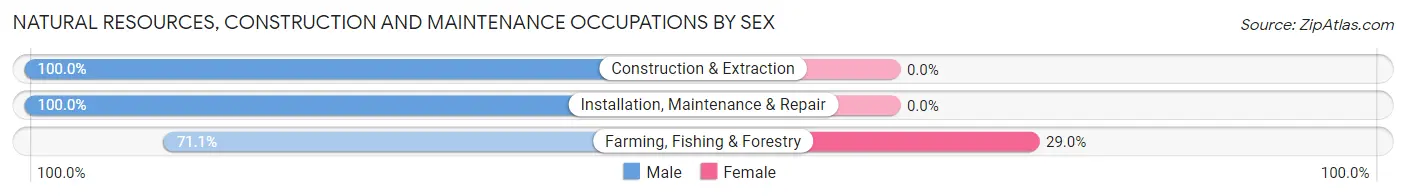
| Occupation | Male | Female |
| Farming, Fishing & Forestry | 27 (71.1%) | 11 (28.9%) |
| Construction & Extraction | 113 (100.0%) | 0 (0.0%) |
| Installation, Maintenance & Repair | 100 (100.0%) | 0 (0.0%) |
| Total (Category) | 240 (95.6%) | 11 (4.4%) |
| Total (Overall) | 658 (60.4%) | 432 (39.6%) |
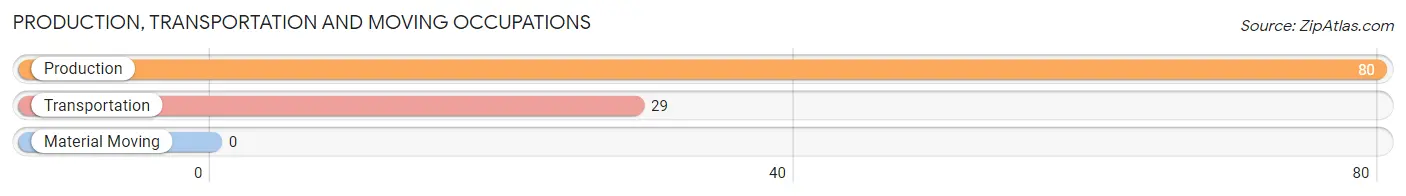
Production, Transportation and Moving Occupations
The most common Production, Transportation and Moving occupations in Seward are Production (80 | 7.3%), and Transportation (29 | 2.7%).
Production, Transportation and Moving Occupations by Sex
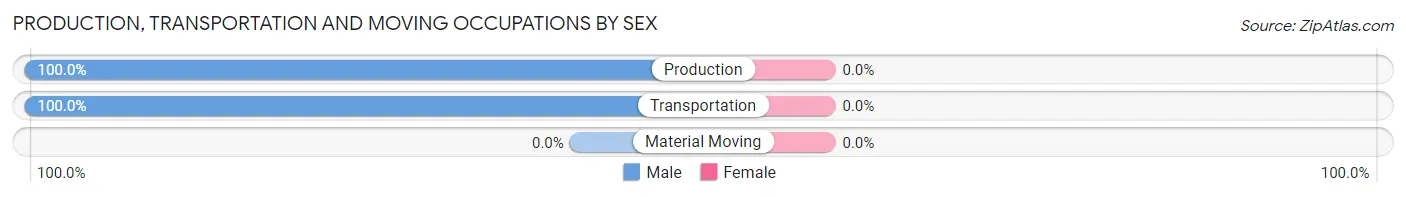
| Occupation | Male | Female |
| Production | 80 (100.0%) | 0 (0.0%) |
| Transportation | 29 (100.0%) | 0 (0.0%) |
| Material Moving | 0 (0.0%) | 0 (0.0%) |
| Total (Category) | 109 (100.0%) | 0 (0.0%) |
| Total (Overall) | 658 (60.4%) | 432 (39.6%) |
Employment Industries by Sex in Seward
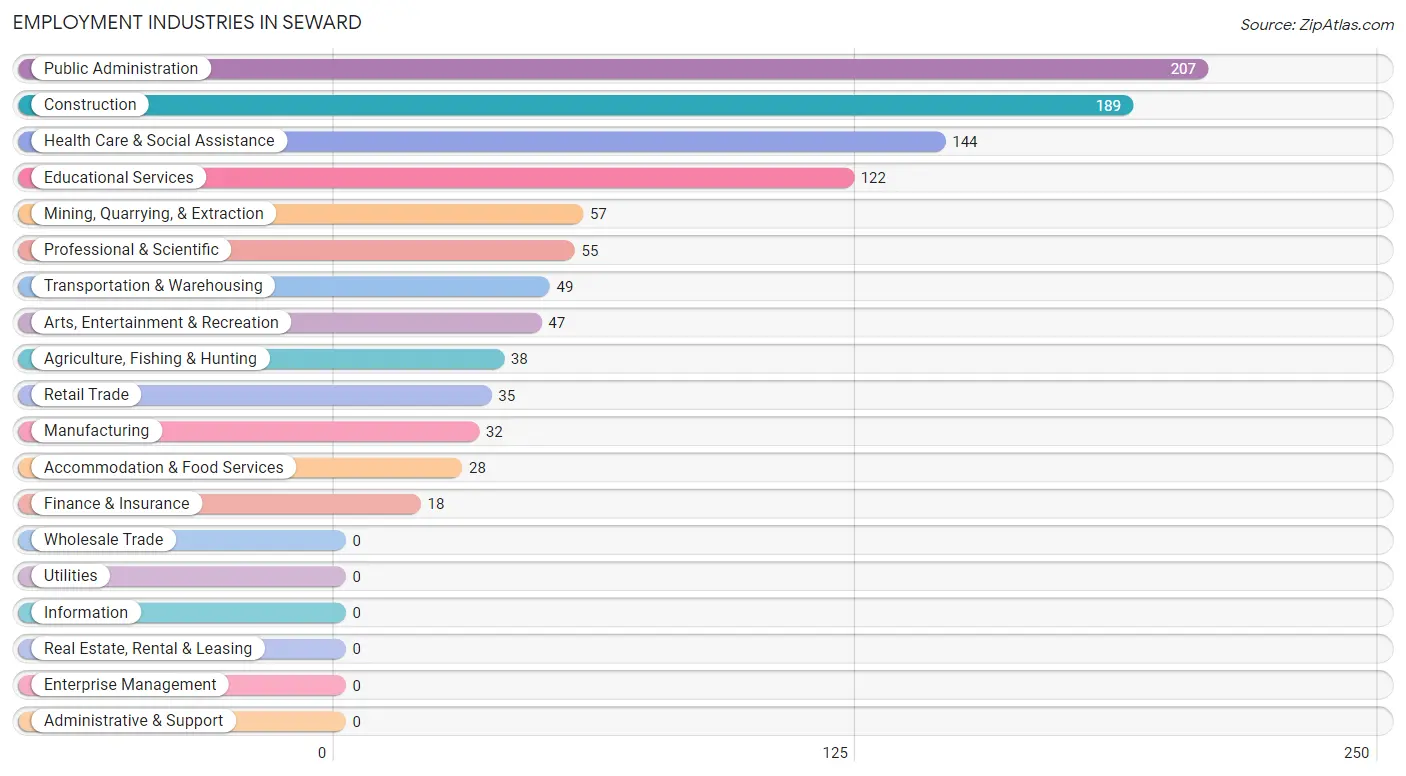
Employment Industries in Seward
The major employment industries in Seward include Public Administration (207 | 19.0%), Construction (189 | 17.3%), Health Care & Social Assistance (144 | 13.2%), Educational Services (122 | 11.2%), and Mining, Quarrying, & Extraction (57 | 5.2%).
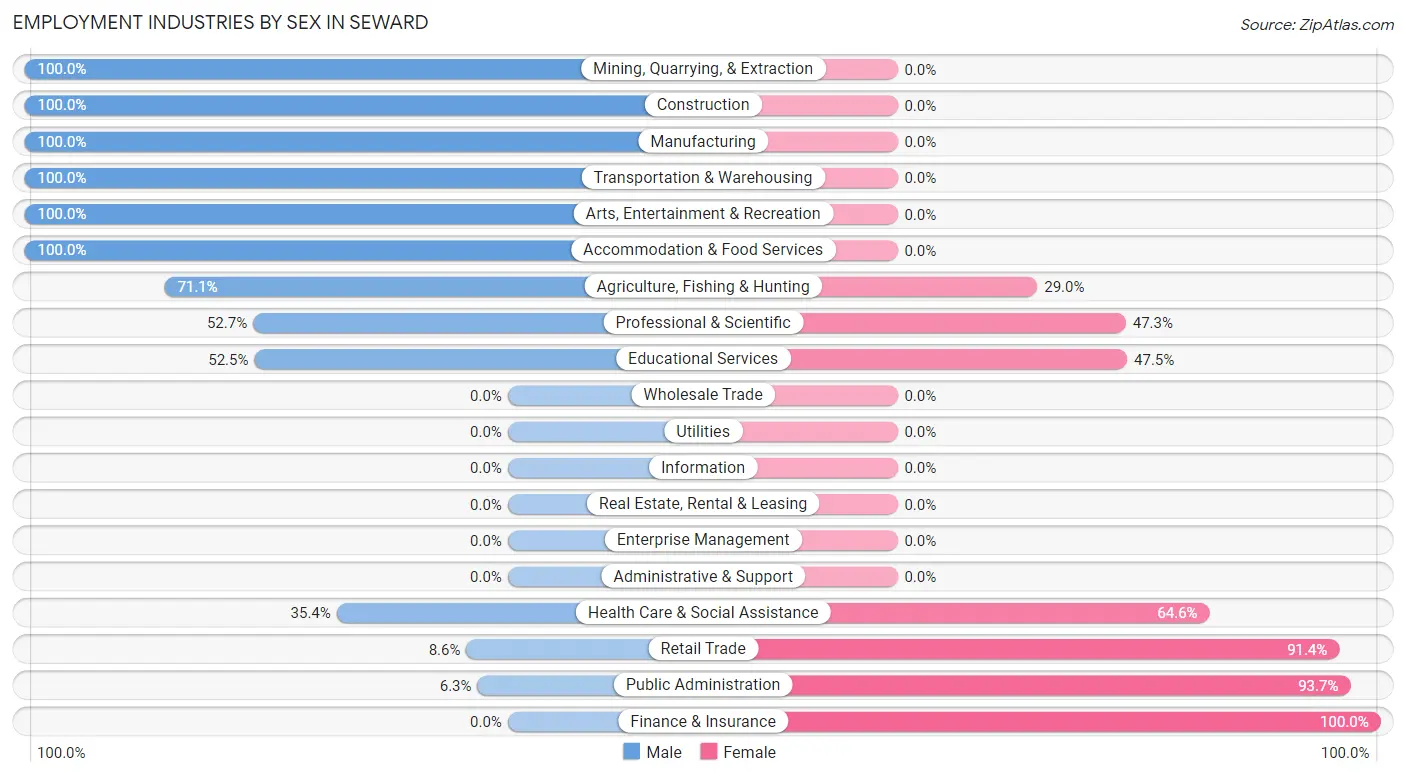
Employment Industries by Sex in Seward
The Seward industries that see more men than women are Mining, Quarrying, & Extraction (100.0%), Construction (100.0%), and Manufacturing (100.0%), whereas the industries that tend to have a higher number of women are Finance & Insurance (100.0%), Public Administration (93.7%), and Retail Trade (91.4%).
| Industry | Male | Female |
| Agriculture, Fishing & Hunting | 27 (71.1%) | 11 (28.9%) |
| Mining, Quarrying, & Extraction | 57 (100.0%) | 0 (0.0%) |
| Construction | 189 (100.0%) | 0 (0.0%) |
| Manufacturing | 32 (100.0%) | 0 (0.0%) |
| Wholesale Trade | 0 (0.0%) | 0 (0.0%) |
| Retail Trade | 3 (8.6%) | 32 (91.4%) |
| Transportation & Warehousing | 49 (100.0%) | 0 (0.0%) |
| Utilities | 0 (0.0%) | 0 (0.0%) |
| Information | 0 (0.0%) | 0 (0.0%) |
| Finance & Insurance | 0 (0.0%) | 18 (100.0%) |
| Real Estate, Rental & Leasing | 0 (0.0%) | 0 (0.0%) |
| Professional & Scientific | 29 (52.7%) | 26 (47.3%) |
| Enterprise Management | 0 (0.0%) | 0 (0.0%) |
| Administrative & Support | 0 (0.0%) | 0 (0.0%) |
| Educational Services | 64 (52.5%) | 58 (47.5%) |
| Health Care & Social Assistance | 51 (35.4%) | 93 (64.6%) |
| Arts, Entertainment & Recreation | 47 (100.0%) | 0 (0.0%) |
| Accommodation & Food Services | 28 (100.0%) | 0 (0.0%) |
| Public Administration | 13 (6.3%) | 194 (93.7%) |
| Total | 658 (60.4%) | 432 (39.6%) |
Education in Seward
School Enrollment in Seward
The most common levels of schooling among the 465 students in Seward are middle school (215 | 46.2%), elementary school (86 | 18.5%), and kindergarten (63 | 13.6%).
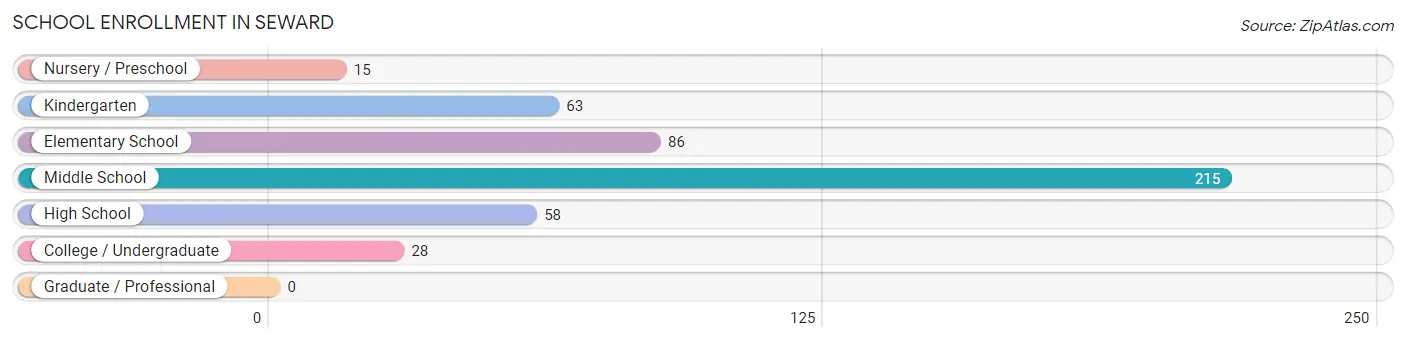
| School Level | # Students | % Students |
| Nursery / Preschool | 15 | 3.2% |
| Kindergarten | 63 | 13.6% |
| Elementary School | 86 | 18.5% |
| Middle School | 215 | 46.2% |
| High School | 58 | 12.5% |
| College / Undergraduate | 28 | 6.0% |
| Graduate / Professional | 0 | 0.0% |
| Total | 465 | 100.0% |
School Enrollment by Age by Funding Source in Seward
Out of a total of 465 students who are enrolled in schools in Seward, 62 (13.3%) attend a private institution, while the remaining 403 (86.7%) are enrolled in public schools. The age group of 15 to 17 year olds has the highest likelihood of being enrolled in private schools, with 29 (35.4% in the age bracket) enrolled. Conversely, the age group of 10 to 14 year olds has the lowest likelihood of being enrolled in a private school, with 191 (100.0% in the age bracket) attending a public institution.
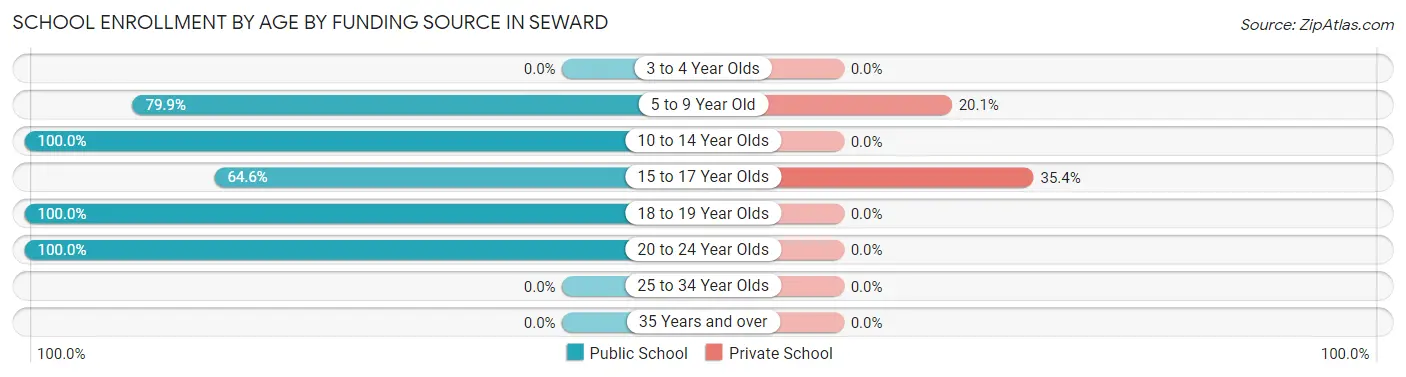
| Age Bracket | Public School | Private School |
| 3 to 4 Year Olds | 0 (0.0%) | 0 (0.0%) |
| 5 to 9 Year Old | 131 (79.9%) | 33 (20.1%) |
| 10 to 14 Year Olds | 191 (100.0%) | 0 (0.0%) |
| 15 to 17 Year Olds | 53 (64.6%) | 29 (35.4%) |
| 18 to 19 Year Olds | 11 (100.0%) | 0 (0.0%) |
| 20 to 24 Year Olds | 17 (100.0%) | 0 (0.0%) |
| 25 to 34 Year Olds | 0 (0.0%) | 0 (0.0%) |
| 35 Years and over | 0 (0.0%) | 0 (0.0%) |
| Total | 403 (86.7%) | 62 (13.3%) |
Educational Attainment by Field of Study in Seward
Bio, nature & agricultural (141 | 20.1%), psychology (99 | 14.1%), business (97 | 13.8%), liberal arts & history (78 | 11.1%), and education (47 | 6.7%) are the most common fields of study among 703 individuals in Seward who have obtained a bachelor's degree or higher.
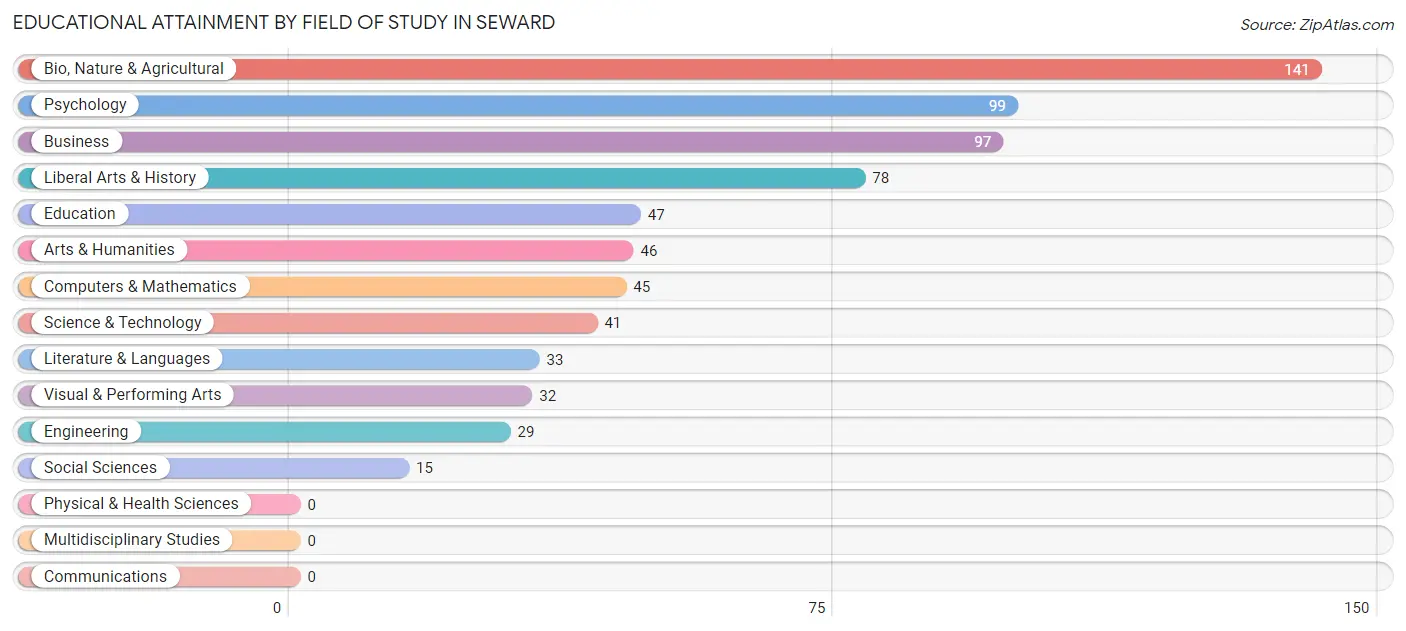
| Field of Study | # Graduates | % Graduates |
| Computers & Mathematics | 45 | 6.4% |
| Bio, Nature & Agricultural | 141 | 20.1% |
| Physical & Health Sciences | 0 | 0.0% |
| Psychology | 99 | 14.1% |
| Social Sciences | 15 | 2.1% |
| Engineering | 29 | 4.1% |
| Multidisciplinary Studies | 0 | 0.0% |
| Science & Technology | 41 | 5.8% |
| Business | 97 | 13.8% |
| Education | 47 | 6.7% |
| Literature & Languages | 33 | 4.7% |
| Liberal Arts & History | 78 | 11.1% |
| Visual & Performing Arts | 32 | 4.5% |
| Communications | 0 | 0.0% |
| Arts & Humanities | 46 | 6.5% |
| Total | 703 | 100.0% |
Transportation & Commute in Seward
Vehicle Availability by Sex in Seward
The most prevalent vehicle ownership categories in Seward are males with 2 vehicles (216, accounting for 39.9%) and females with 2 vehicles (199, making up 50.3%).
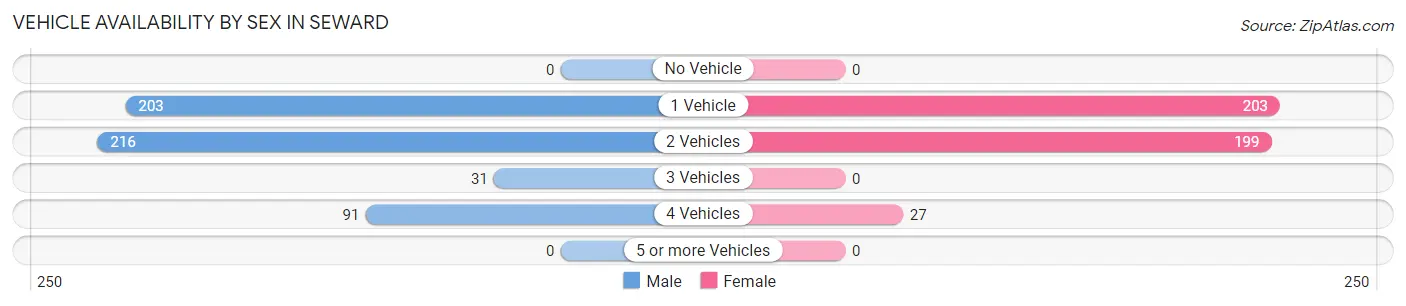
| Vehicles Available | Male | Female |
| No Vehicle | 0 (0.0%) | 0 (0.0%) |
| 1 Vehicle | 203 (37.5%) | 203 (47.3%) |
| 2 Vehicles | 216 (39.9%) | 199 (46.4%) |
| 3 Vehicles | 31 (5.7%) | 0 (0.0%) |
| 4 Vehicles | 91 (16.8%) | 27 (6.3%) |
| 5 or more Vehicles | 0 (0.0%) | 0 (0.0%) |
| Total | 541 (100.0%) | 429 (100.0%) |
Commute Time in Seward
The most frequently occuring commute durations in Seward are 5 to 9 minutes (383 commuters, 38.2%), 15 to 19 minutes (242 commuters, 24.1%), and less than 5 minutes (188 commuters, 18.8%).
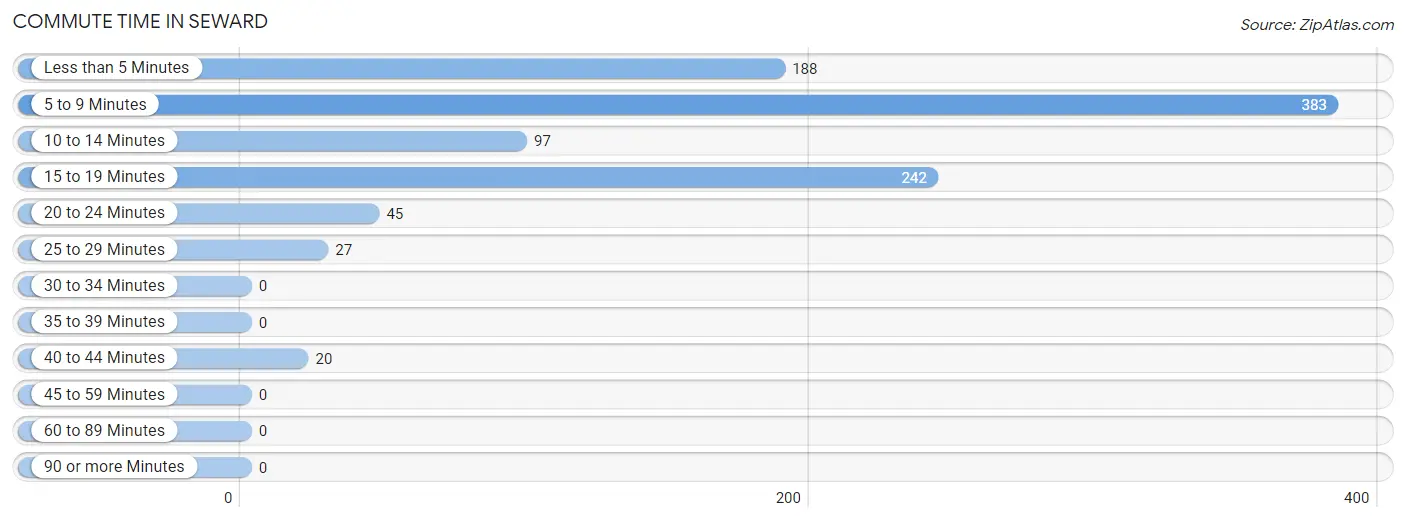
| Commute Time | # Commuters | % Commuters |
| Less than 5 Minutes | 188 | 18.8% |
| 5 to 9 Minutes | 383 | 38.2% |
| 10 to 14 Minutes | 97 | 9.7% |
| 15 to 19 Minutes | 242 | 24.1% |
| 20 to 24 Minutes | 45 | 4.5% |
| 25 to 29 Minutes | 27 | 2.7% |
| 30 to 34 Minutes | 0 | 0.0% |
| 35 to 39 Minutes | 0 | 0.0% |
| 40 to 44 Minutes | 20 | 2.0% |
| 45 to 59 Minutes | 0 | 0.0% |
| 60 to 89 Minutes | 0 | 0.0% |
| 90 or more Minutes | 0 | 0.0% |
Commute Time by Sex in Seward
The most common commute times in Seward are 5 to 9 minutes (271 commuters, 41.1%) for males and 5 to 9 minutes (112 commuters, 32.7%) for females.
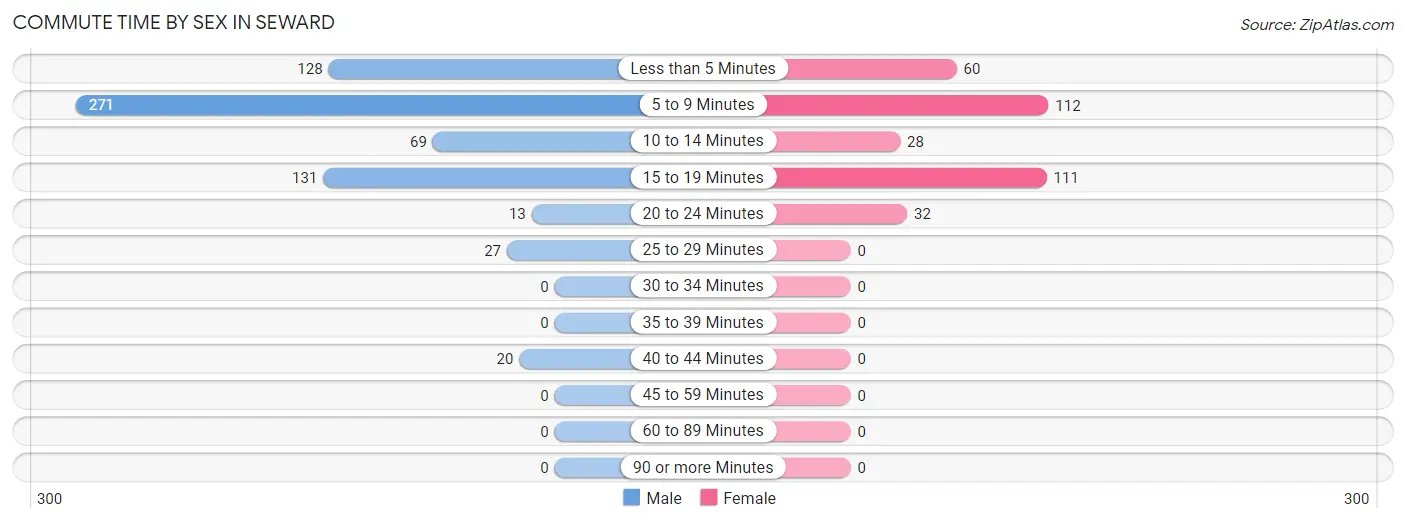
| Commute Time | Male | Female |
| Less than 5 Minutes | 128 (19.4%) | 60 (17.5%) |
| 5 to 9 Minutes | 271 (41.1%) | 112 (32.7%) |
| 10 to 14 Minutes | 69 (10.5%) | 28 (8.2%) |
| 15 to 19 Minutes | 131 (19.9%) | 111 (32.4%) |
| 20 to 24 Minutes | 13 (2.0%) | 32 (9.3%) |
| 25 to 29 Minutes | 27 (4.1%) | 0 (0.0%) |
| 30 to 34 Minutes | 0 (0.0%) | 0 (0.0%) |
| 35 to 39 Minutes | 0 (0.0%) | 0 (0.0%) |
| 40 to 44 Minutes | 20 (3.0%) | 0 (0.0%) |
| 45 to 59 Minutes | 0 (0.0%) | 0 (0.0%) |
| 60 to 89 Minutes | 0 (0.0%) | 0 (0.0%) |
| 90 or more Minutes | 0 (0.0%) | 0 (0.0%) |
Time of Departure to Work by Sex in Seward
The most frequent times of departure to work in Seward are 7:30 AM to 7:59 AM (155, 23.5%) for males and 7:30 AM to 7:59 AM (84, 24.5%) for females.
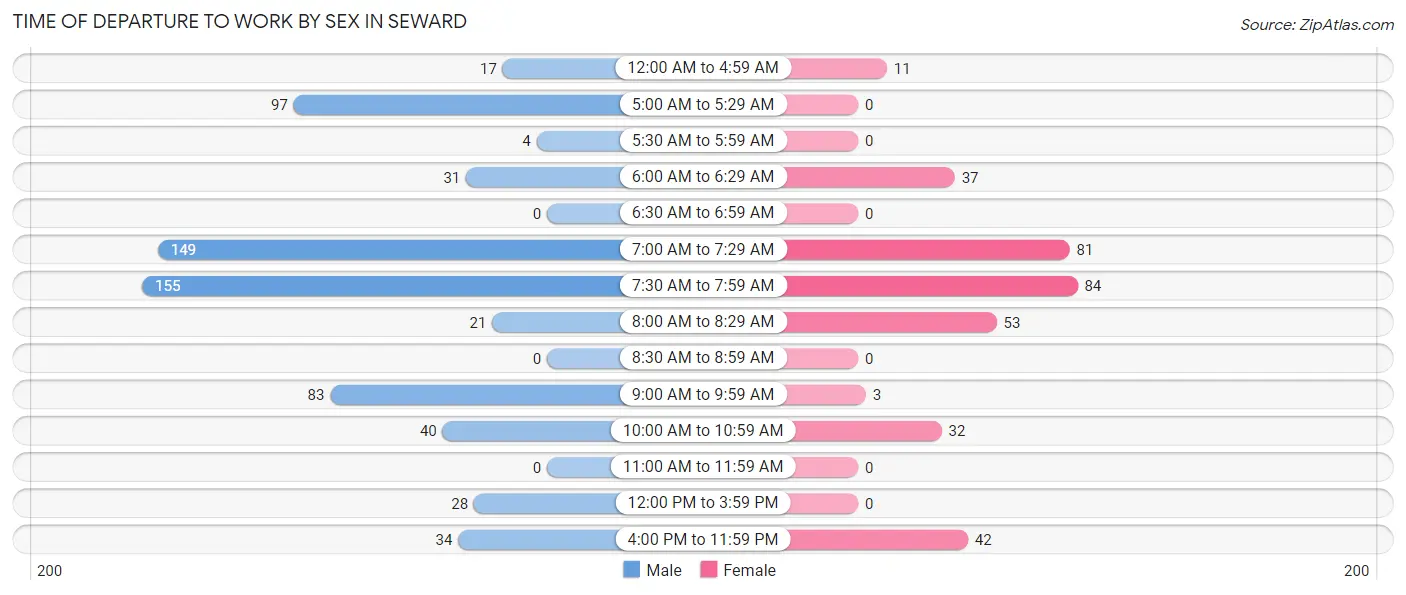
| Time of Departure | Male | Female |
| 12:00 AM to 4:59 AM | 17 (2.6%) | 11 (3.2%) |
| 5:00 AM to 5:29 AM | 97 (14.7%) | 0 (0.0%) |
| 5:30 AM to 5:59 AM | 4 (0.6%) | 0 (0.0%) |
| 6:00 AM to 6:29 AM | 31 (4.7%) | 37 (10.8%) |
| 6:30 AM to 6:59 AM | 0 (0.0%) | 0 (0.0%) |
| 7:00 AM to 7:29 AM | 149 (22.6%) | 81 (23.6%) |
| 7:30 AM to 7:59 AM | 155 (23.5%) | 84 (24.5%) |
| 8:00 AM to 8:29 AM | 21 (3.2%) | 53 (15.4%) |
| 8:30 AM to 8:59 AM | 0 (0.0%) | 0 (0.0%) |
| 9:00 AM to 9:59 AM | 83 (12.6%) | 3 (0.9%) |
| 10:00 AM to 10:59 AM | 40 (6.1%) | 32 (9.3%) |
| 11:00 AM to 11:59 AM | 0 (0.0%) | 0 (0.0%) |
| 12:00 PM to 3:59 PM | 28 (4.3%) | 0 (0.0%) |
| 4:00 PM to 11:59 PM | 34 (5.2%) | 42 (12.2%) |
| Total | 659 (100.0%) | 343 (100.0%) |
Housing Occupancy in Seward
Occupancy by Ownership in Seward
Of the total 1,017 dwellings in Seward, owner-occupied units account for 662 (65.1%), while renter-occupied units make up 355 (34.9%).
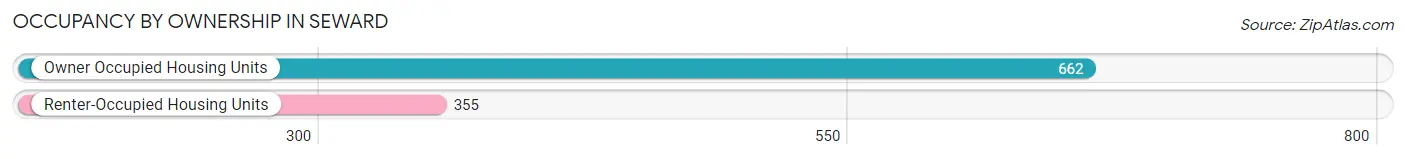
| Occupancy | # Housing Units | % Housing Units |
| Owner Occupied Housing Units | 662 | 65.1% |
| Renter-Occupied Housing Units | 355 | 34.9% |
| Total Occupied Housing Units | 1,017 | 100.0% |
Occupancy by Household Size in Seward
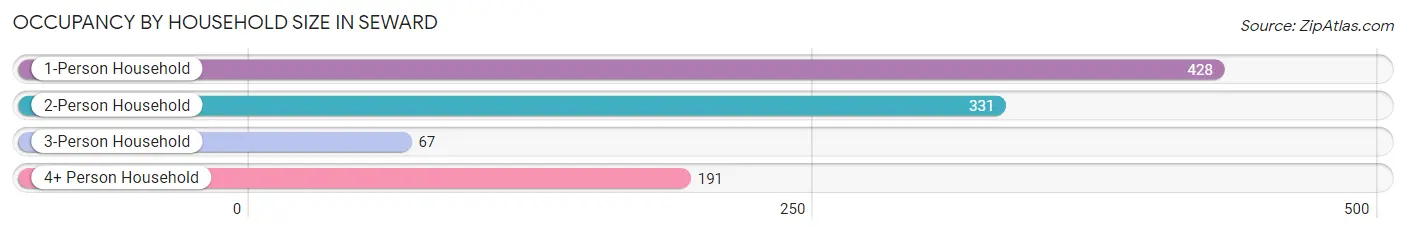
| Household Size | # Housing Units | % Housing Units |
| 1-Person Household | 428 | 42.1% |
| 2-Person Household | 331 | 32.6% |
| 3-Person Household | 67 | 6.6% |
| 4+ Person Household | 191 | 18.8% |
| Total Housing Units | 1,017 | 100.0% |
Occupancy by Ownership by Household Size in Seward

| Household Size | Owner-occupied | Renter-occupied |
| 1-Person Household | 203 (47.4%) | 225 (52.6%) |
| 2-Person Household | 260 (78.5%) | 71 (21.4%) |
| 3-Person Household | 67 (100.0%) | 0 (0.0%) |
| 4+ Person Household | 132 (69.1%) | 59 (30.9%) |
| Total Housing Units | 662 (65.1%) | 355 (34.9%) |
Occupancy by Educational Attainment in Seward
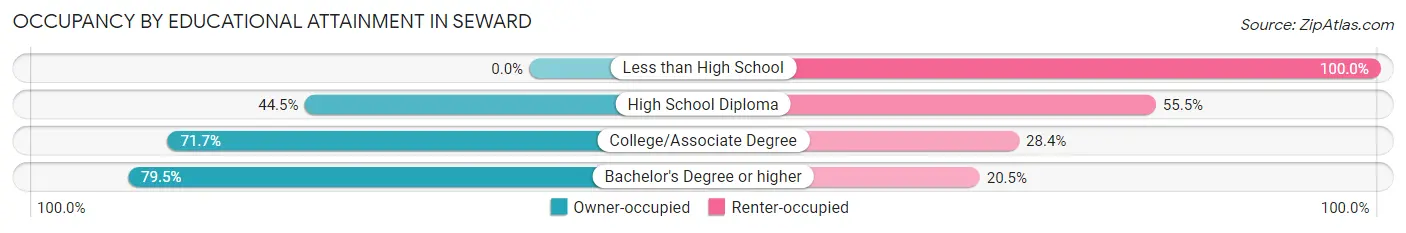
| Household Size | Owner-occupied | Renter-occupied |
| Less than High School | 0 (0.0%) | 51 (100.0%) |
| High School Diploma | 102 (44.5%) | 127 (55.5%) |
| College/Associate Degree | 235 (71.7%) | 93 (28.3%) |
| Bachelor's Degree or higher | 325 (79.5%) | 84 (20.5%) |
Occupancy by Age of Householder in Seward
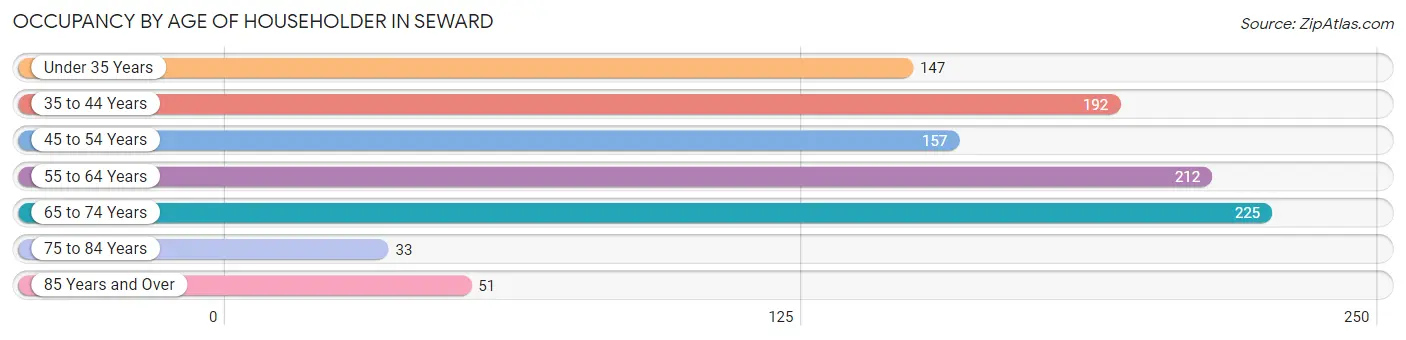
| Age Bracket | # Households | % Households |
| Under 35 Years | 147 | 14.4% |
| 35 to 44 Years | 192 | 18.9% |
| 45 to 54 Years | 157 | 15.4% |
| 55 to 64 Years | 212 | 20.8% |
| 65 to 74 Years | 225 | 22.1% |
| 75 to 84 Years | 33 | 3.2% |
| 85 Years and Over | 51 | 5.0% |
| Total | 1,017 | 100.0% |
Housing Finances in Seward
Median Income by Occupancy in Seward
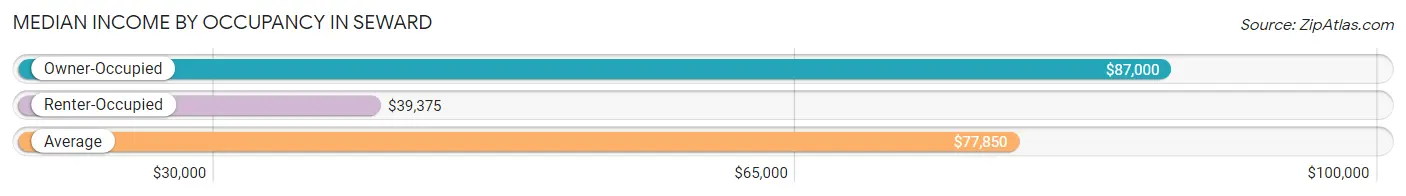
| Occupancy Type | # Households | Median Income |
| Owner-Occupied | 662 (65.1%) | $87,000 |
| Renter-Occupied | 355 (34.9%) | $39,375 |
| Average | 1,017 (100.0%) | $77,850 |
Occupancy by Householder Income Bracket in Seward
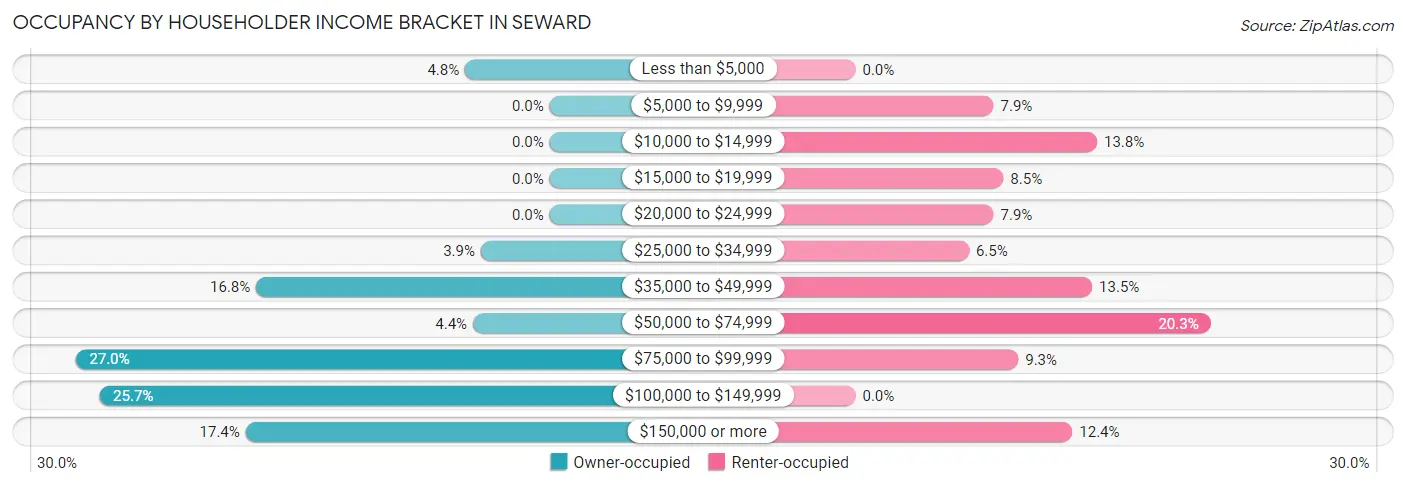
| Income Bracket | Owner-occupied | Renter-occupied |
| Less than $5,000 | 32 (4.8%) | 0 (0.0%) |
| $5,000 to $9,999 | 0 (0.0%) | 28 (7.9%) |
| $10,000 to $14,999 | 0 (0.0%) | 49 (13.8%) |
| $15,000 to $19,999 | 0 (0.0%) | 30 (8.5%) |
| $20,000 to $24,999 | 0 (0.0%) | 28 (7.9%) |
| $25,000 to $34,999 | 26 (3.9%) | 23 (6.5%) |
| $35,000 to $49,999 | 111 (16.8%) | 48 (13.5%) |
| $50,000 to $74,999 | 29 (4.4%) | 72 (20.3%) |
| $75,000 to $99,999 | 179 (27.0%) | 33 (9.3%) |
| $100,000 to $149,999 | 170 (25.7%) | 0 (0.0%) |
| $150,000 or more | 115 (17.4%) | 44 (12.4%) |
| Total | 662 (100.0%) | 355 (100.0%) |
Monthly Housing Cost Tiers in Seward
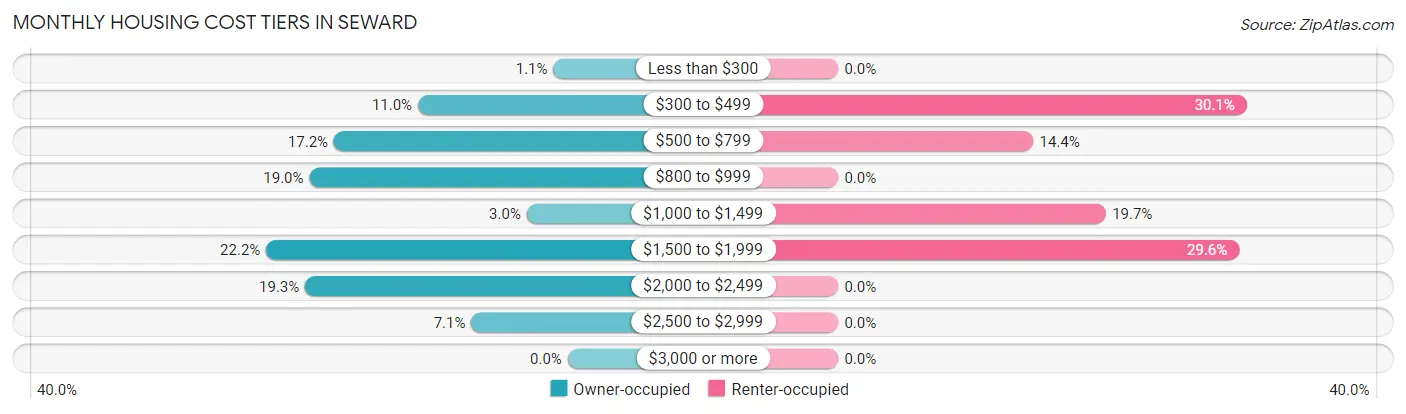
| Monthly Cost | Owner-occupied | Renter-occupied |
| Less than $300 | 7 (1.1%) | 0 (0.0%) |
| $300 to $499 | 73 (11.0%) | 107 (30.1%) |
| $500 to $799 | 114 (17.2%) | 51 (14.4%) |
| $800 to $999 | 126 (19.0%) | 0 (0.0%) |
| $1,000 to $1,499 | 20 (3.0%) | 70 (19.7%) |
| $1,500 to $1,999 | 147 (22.2%) | 105 (29.6%) |
| $2,000 to $2,499 | 128 (19.3%) | 0 (0.0%) |
| $2,500 to $2,999 | 47 (7.1%) | 0 (0.0%) |
| $3,000 or more | 0 (0.0%) | 0 (0.0%) |
| Total | 662 (100.0%) | 355 (100.0%) |
Physical Housing Characteristics in Seward
Housing Structures in Seward
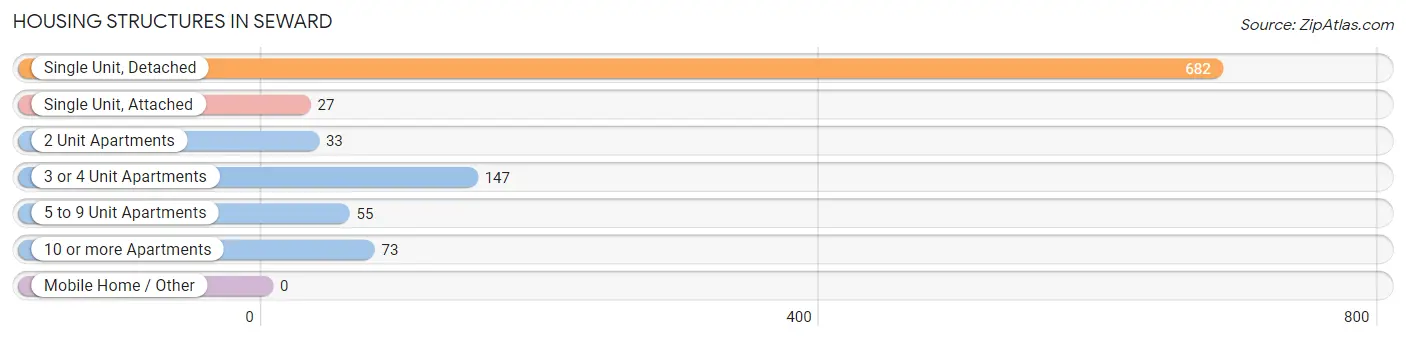
| Structure Type | # Housing Units | % Housing Units |
| Single Unit, Detached | 682 | 67.1% |
| Single Unit, Attached | 27 | 2.6% |
| 2 Unit Apartments | 33 | 3.2% |
| 3 or 4 Unit Apartments | 147 | 14.4% |
| 5 to 9 Unit Apartments | 55 | 5.4% |
| 10 or more Apartments | 73 | 7.2% |
| Mobile Home / Other | 0 | 0.0% |
| Total | 1,017 | 100.0% |
Housing Structures by Occupancy in Seward
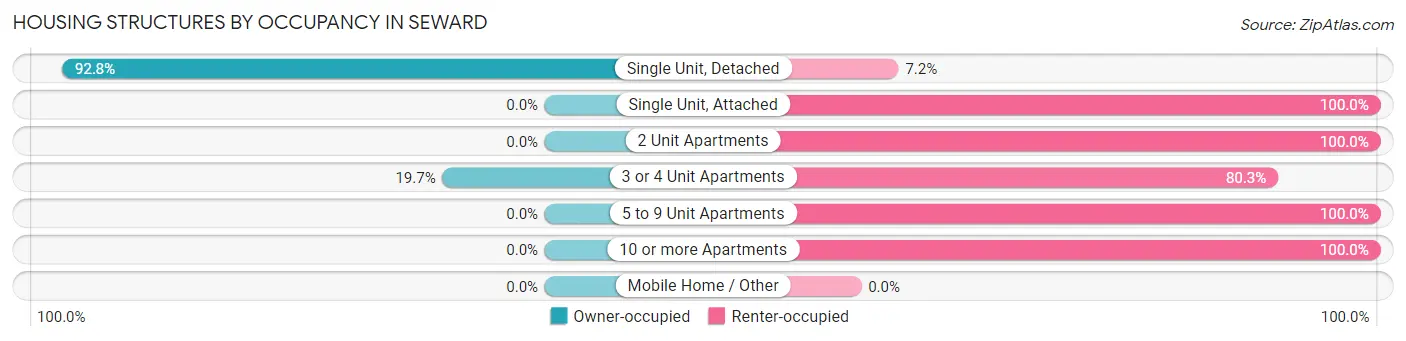
| Structure Type | Owner-occupied | Renter-occupied |
| Single Unit, Detached | 633 (92.8%) | 49 (7.2%) |
| Single Unit, Attached | 0 (0.0%) | 27 (100.0%) |
| 2 Unit Apartments | 0 (0.0%) | 33 (100.0%) |
| 3 or 4 Unit Apartments | 29 (19.7%) | 118 (80.3%) |
| 5 to 9 Unit Apartments | 0 (0.0%) | 55 (100.0%) |
| 10 or more Apartments | 0 (0.0%) | 73 (100.0%) |
| Mobile Home / Other | 0 (0.0%) | 0 (0.0%) |
| Total | 662 (65.1%) | 355 (34.9%) |
Housing Structures by Number of Rooms in Seward
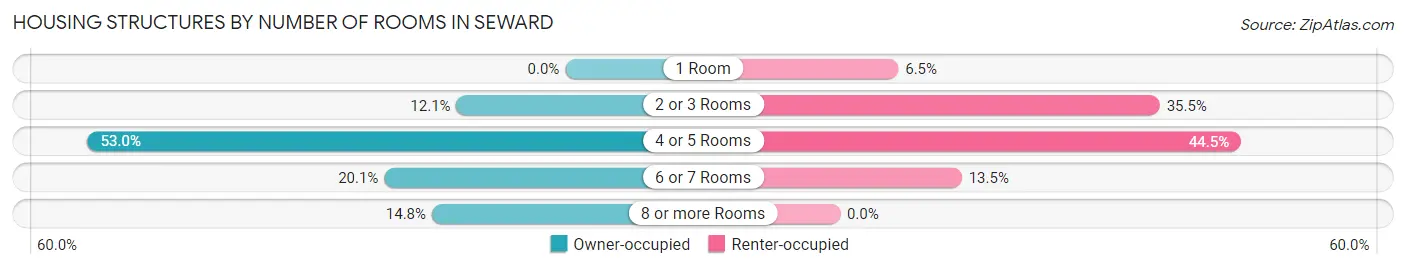
| Number of Rooms | Owner-occupied | Renter-occupied |
| 1 Room | 0 (0.0%) | 23 (6.5%) |
| 2 or 3 Rooms | 80 (12.1%) | 126 (35.5%) |
| 4 or 5 Rooms | 351 (53.0%) | 158 (44.5%) |
| 6 or 7 Rooms | 133 (20.1%) | 48 (13.5%) |
| 8 or more Rooms | 98 (14.8%) | 0 (0.0%) |
| Total | 662 (100.0%) | 355 (100.0%) |
Housing Structure by Heating Type in Seward
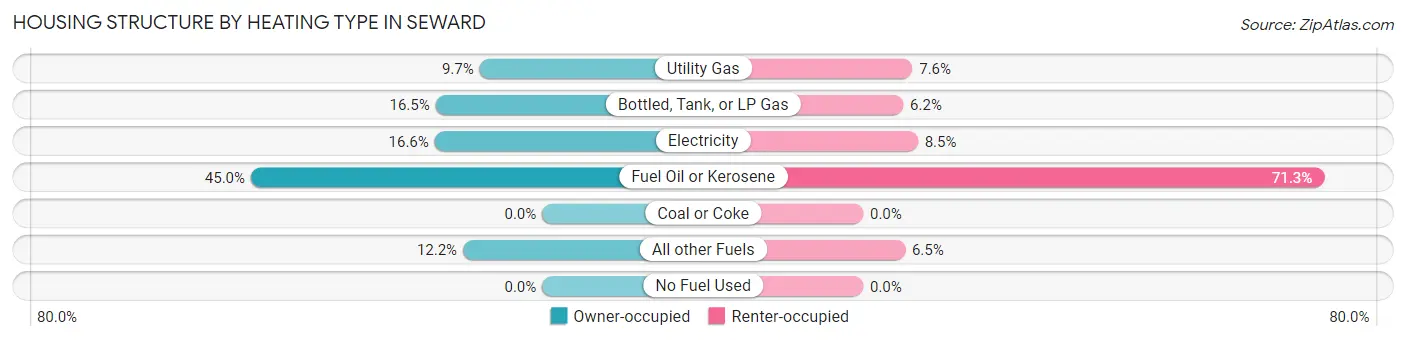
| Heating Type | Owner-occupied | Renter-occupied |
| Utility Gas | 64 (9.7%) | 27 (7.6%) |
| Bottled, Tank, or LP Gas | 109 (16.5%) | 22 (6.2%) |
| Electricity | 110 (16.6%) | 30 (8.5%) |
| Fuel Oil or Kerosene | 298 (45.0%) | 253 (71.3%) |
| Coal or Coke | 0 (0.0%) | 0 (0.0%) |
| All other Fuels | 81 (12.2%) | 23 (6.5%) |
| No Fuel Used | 0 (0.0%) | 0 (0.0%) |
| Total | 662 (100.0%) | 355 (100.0%) |
Household Vehicle Usage in Seward
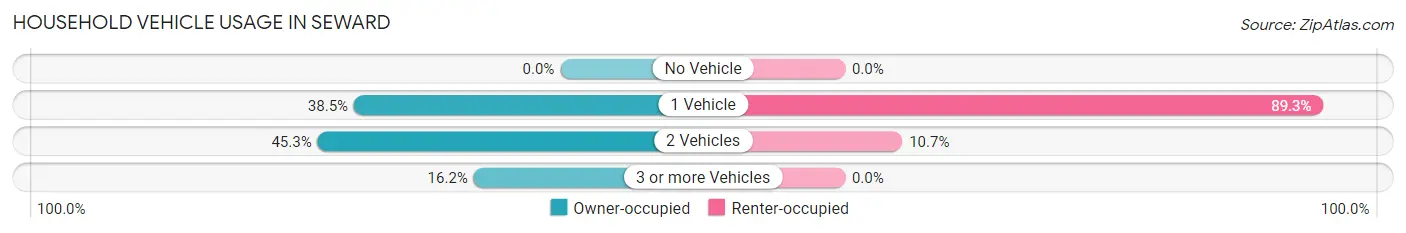
| Vehicles per Household | Owner-occupied | Renter-occupied |
| No Vehicle | 0 (0.0%) | 0 (0.0%) |
| 1 Vehicle | 255 (38.5%) | 317 (89.3%) |
| 2 Vehicles | 300 (45.3%) | 38 (10.7%) |
| 3 or more Vehicles | 107 (16.2%) | 0 (0.0%) |
| Total | 662 (100.0%) | 355 (100.0%) |
Real Estate & Mortgages in Seward
Real Estate and Mortgage Overview in Seward
| Characteristic | Without Mortgage | With Mortgage |
| Housing Units | 255 | 407 |
| Median Property Value | $262,500 | $275,600 |
| Median Household Income | - | - |
| Monthly Housing Costs | $661 | $0 |
| Real Estate Taxes | $1,451 | $0 |
Property Value by Mortgage Status in Seward
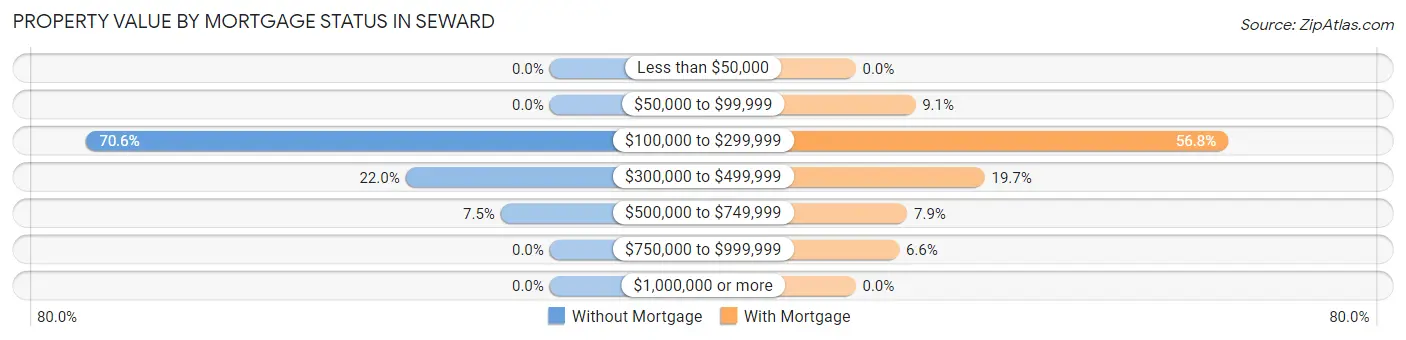
| Property Value | Without Mortgage | With Mortgage |
| Less than $50,000 | 0 (0.0%) | 0 (0.0%) |
| $50,000 to $99,999 | 0 (0.0%) | 37 (9.1%) |
| $100,000 to $299,999 | 180 (70.6%) | 231 (56.8%) |
| $300,000 to $499,999 | 56 (22.0%) | 80 (19.7%) |
| $500,000 to $749,999 | 19 (7.4%) | 32 (7.9%) |
| $750,000 to $999,999 | 0 (0.0%) | 27 (6.6%) |
| $1,000,000 or more | 0 (0.0%) | 0 (0.0%) |
| Total | 255 (100.0%) | 407 (100.0%) |
Household Income by Mortgage Status in Seward
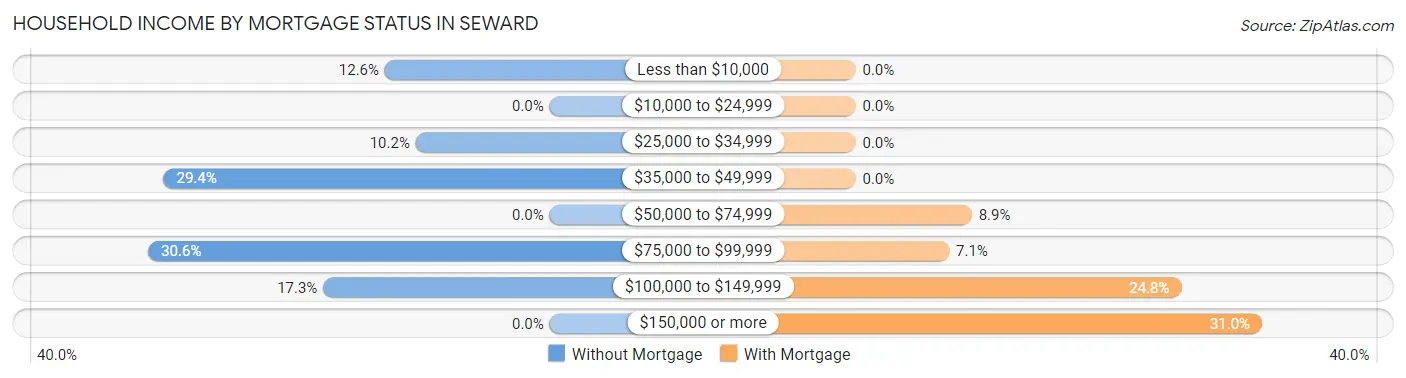
| Household Income | Without Mortgage | With Mortgage |
| Less than $10,000 | 32 (12.6%) | 0 (0.0%) |
| $10,000 to $24,999 | 0 (0.0%) | 0 (0.0%) |
| $25,000 to $34,999 | 26 (10.2%) | 0 (0.0%) |
| $35,000 to $49,999 | 75 (29.4%) | 0 (0.0%) |
| $50,000 to $74,999 | 0 (0.0%) | 36 (8.8%) |
| $75,000 to $99,999 | 78 (30.6%) | 29 (7.1%) |
| $100,000 to $149,999 | 44 (17.2%) | 101 (24.8%) |
| $150,000 or more | 0 (0.0%) | 126 (31.0%) |
| Total | 255 (100.0%) | 407 (100.0%) |
Property Value to Household Income Ratio in Seward
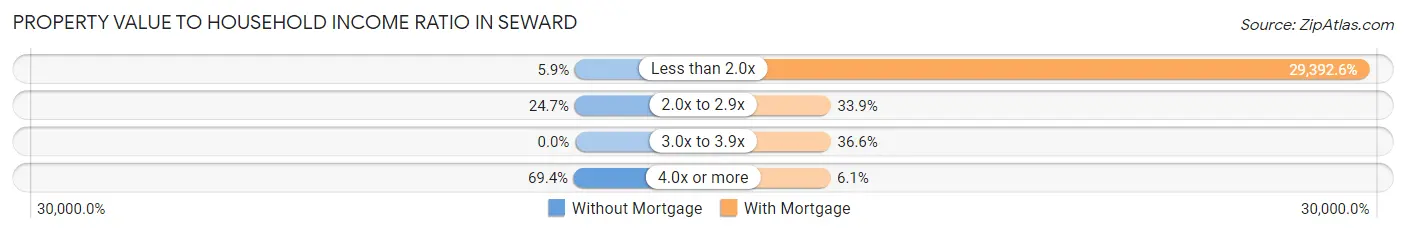
| Value-to-Income Ratio | Without Mortgage | With Mortgage |
| Less than 2.0x | 15 (5.9%) | 119,628 (29,392.6%) |
| 2.0x to 2.9x | 63 (24.7%) | 138 (33.9%) |
| 3.0x to 3.9x | 0 (0.0%) | 149 (36.6%) |
| 4.0x or more | 177 (69.4%) | 25 (6.1%) |
| Total | 255 (100.0%) | 407 (100.0%) |
Real Estate Taxes by Mortgage Status in Seward
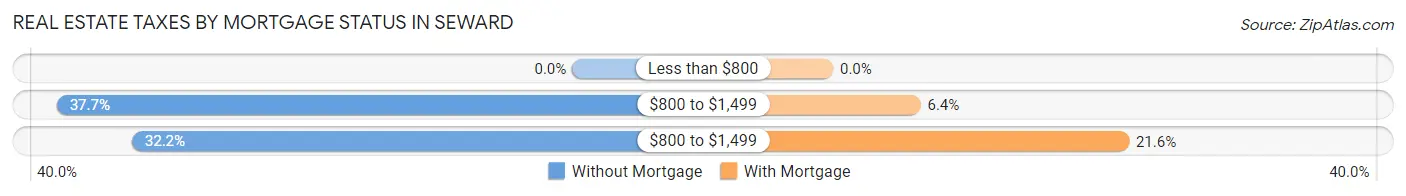
| Property Taxes | Without Mortgage | With Mortgage |
| Less than $800 | 0 (0.0%) | 0 (0.0%) |
| $800 to $1,499 | 96 (37.7%) | 26 (6.4%) |
| $800 to $1,499 | 82 (32.2%) | 88 (21.6%) |
| Total | 255 (100.0%) | 407 (100.0%) |
Health & Disability in Seward
Health Insurance Coverage by Age in Seward
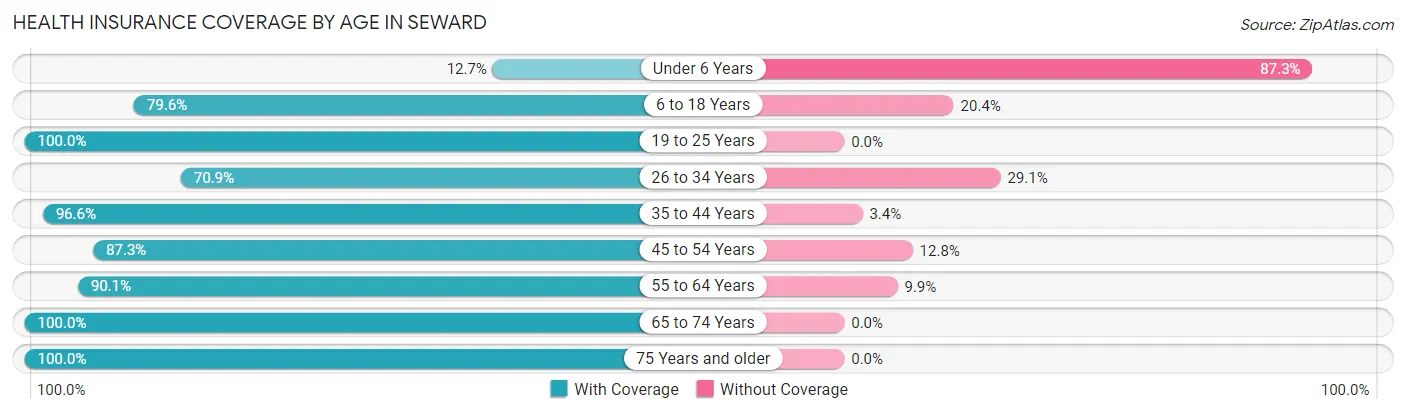
| Age Bracket | With Coverage | Without Coverage |
| Under 6 Years | 15 (12.7%) | 103 (87.3%) |
| 6 to 18 Years | 363 (79.6%) | 93 (20.4%) |
| 19 to 25 Years | 133 (100.0%) | 0 (0.0%) |
| 26 to 34 Years | 146 (70.9%) | 60 (29.1%) |
| 35 to 44 Years | 285 (96.6%) | 10 (3.4%) |
| 45 to 54 Years | 260 (87.3%) | 38 (12.8%) |
| 55 to 64 Years | 363 (90.1%) | 40 (9.9%) |
| 65 to 74 Years | 294 (100.0%) | 0 (0.0%) |
| 75 Years and older | 91 (100.0%) | 0 (0.0%) |
| Total | 1,950 (85.0%) | 344 (15.0%) |
Health Insurance Coverage by Citizenship Status in Seward
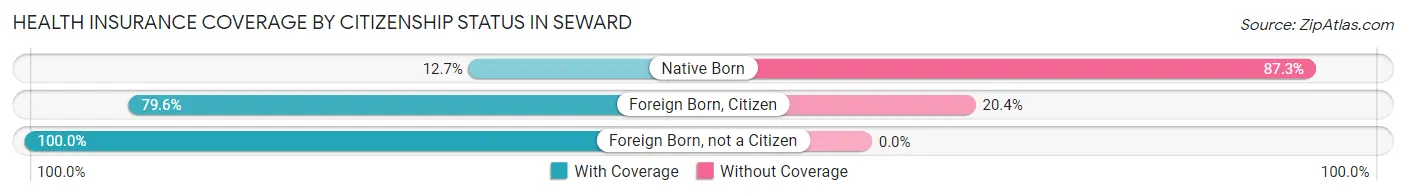
| Citizenship Status | With Coverage | Without Coverage |
| Native Born | 15 (12.7%) | 103 (87.3%) |
| Foreign Born, Citizen | 363 (79.6%) | 93 (20.4%) |
| Foreign Born, not a Citizen | 133 (100.0%) | 0 (0.0%) |
Health Insurance Coverage by Household Income in Seward
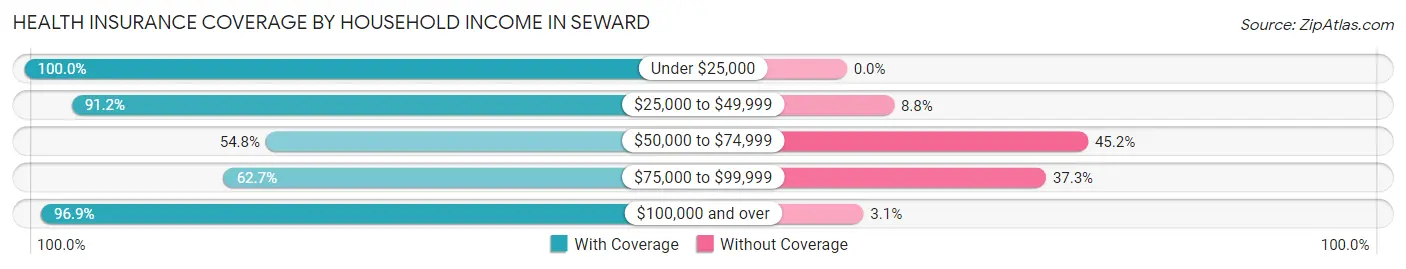
| Household Income | With Coverage | Without Coverage |
| Under $25,000 | 167 (100.0%) | 0 (0.0%) |
| $25,000 to $49,999 | 351 (91.2%) | 34 (8.8%) |
| $50,000 to $74,999 | 74 (54.8%) | 61 (45.2%) |
| $75,000 to $99,999 | 373 (62.7%) | 222 (37.3%) |
| $100,000 and over | 840 (96.9%) | 27 (3.1%) |
Public vs Private Health Insurance Coverage by Age in Seward
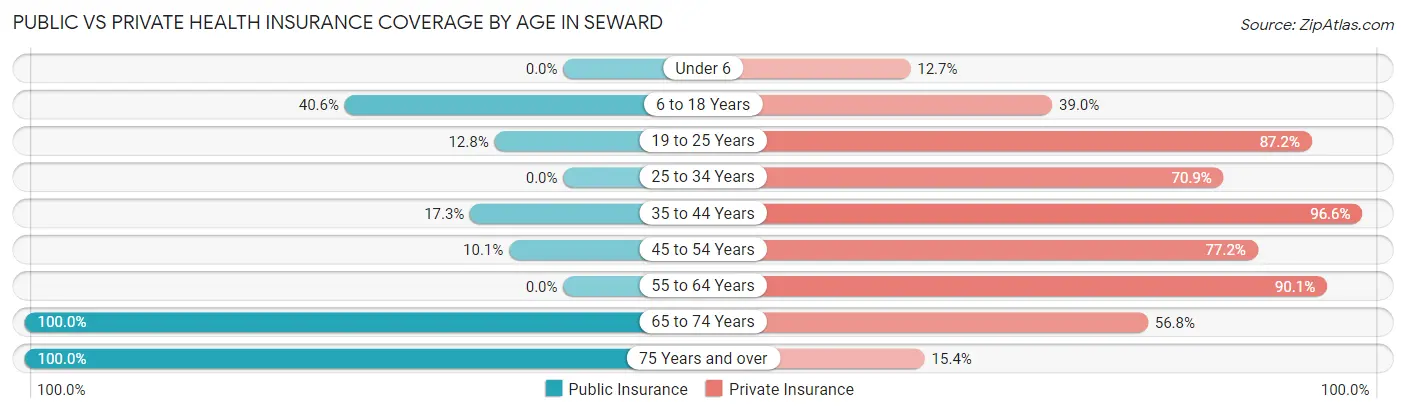
| Age Bracket | Public Insurance | Private Insurance |
| Under 6 | 0 (0.0%) | 15 (12.7%) |
| 6 to 18 Years | 185 (40.6%) | 178 (39.0%) |
| 19 to 25 Years | 17 (12.8%) | 116 (87.2%) |
| 25 to 34 Years | 0 (0.0%) | 146 (70.9%) |
| 35 to 44 Years | 51 (17.3%) | 285 (96.6%) |
| 45 to 54 Years | 30 (10.1%) | 230 (77.2%) |
| 55 to 64 Years | 0 (0.0%) | 363 (90.1%) |
| 65 to 74 Years | 294 (100.0%) | 167 (56.8%) |
| 75 Years and over | 91 (100.0%) | 14 (15.4%) |
| Total | 668 (29.1%) | 1,514 (66.0%) |
Disability Status by Sex by Age in Seward
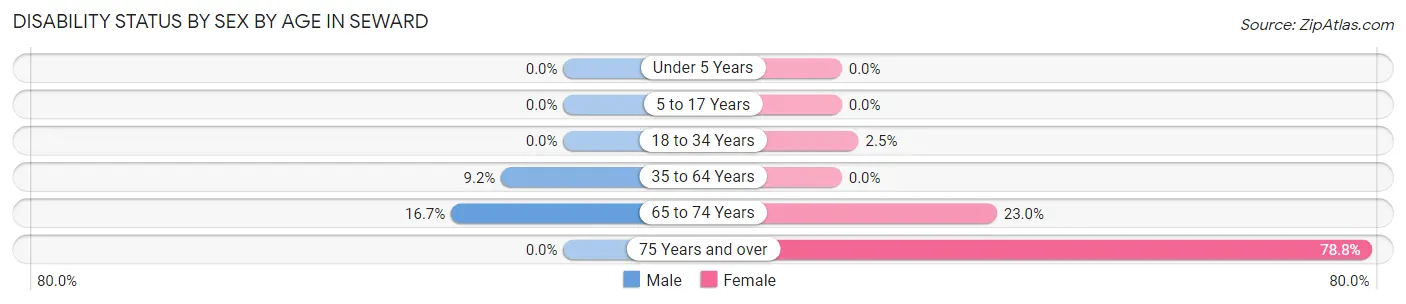
| Age Bracket | Male | Female |
| Under 5 Years | 0 (0.0%) | 0 (0.0%) |
| 5 to 17 Years | 0 (0.0%) | 0 (0.0%) |
| 18 to 34 Years | 0 (0.0%) | 3 (2.5%) |
| 35 to 64 Years | 50 (9.2%) | 0 (0.0%) |
| 65 to 74 Years | 28 (16.7%) | 29 (23.0%) |
| 75 Years and over | 0 (0.0%) | 26 (78.8%) |
Disability Class by Sex by Age in Seward
Disability Class: Hearing Difficulty
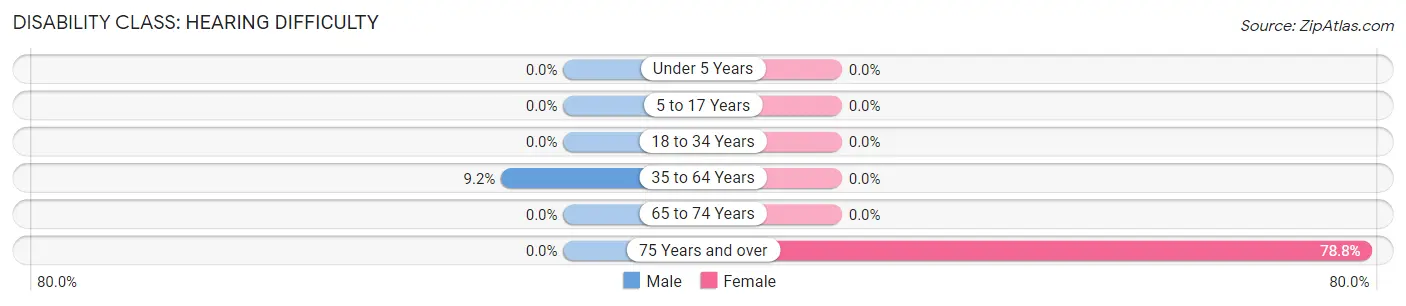
| Age Bracket | Male | Female |
| Under 5 Years | 0 (0.0%) | 0 (0.0%) |
| 5 to 17 Years | 0 (0.0%) | 0 (0.0%) |
| 18 to 34 Years | 0 (0.0%) | 0 (0.0%) |
| 35 to 64 Years | 50 (9.2%) | 0 (0.0%) |
| 65 to 74 Years | 0 (0.0%) | 0 (0.0%) |
| 75 Years and over | 0 (0.0%) | 26 (78.8%) |
Disability Class: Vision Difficulty
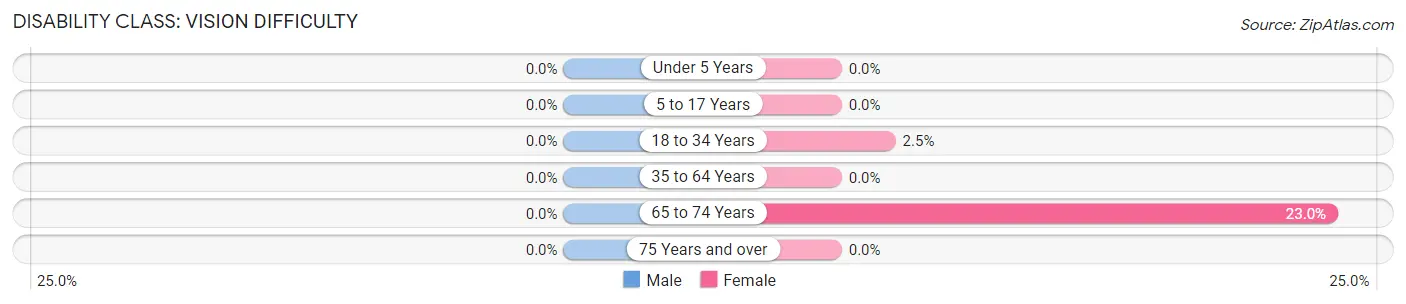
| Age Bracket | Male | Female |
| Under 5 Years | 0 (0.0%) | 0 (0.0%) |
| 5 to 17 Years | 0 (0.0%) | 0 (0.0%) |
| 18 to 34 Years | 0 (0.0%) | 3 (2.5%) |
| 35 to 64 Years | 0 (0.0%) | 0 (0.0%) |
| 65 to 74 Years | 0 (0.0%) | 29 (23.0%) |
| 75 Years and over | 0 (0.0%) | 0 (0.0%) |
Disability Class: Cognitive Difficulty
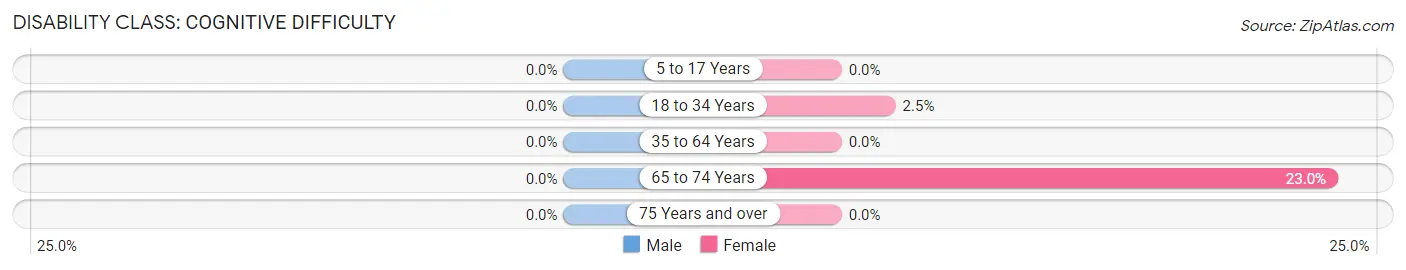
| Age Bracket | Male | Female |
| 5 to 17 Years | 0 (0.0%) | 0 (0.0%) |
| 18 to 34 Years | 0 (0.0%) | 3 (2.5%) |
| 35 to 64 Years | 0 (0.0%) | 0 (0.0%) |
| 65 to 74 Years | 0 (0.0%) | 29 (23.0%) |
| 75 Years and over | 0 (0.0%) | 0 (0.0%) |
Disability Class: Ambulatory Difficulty
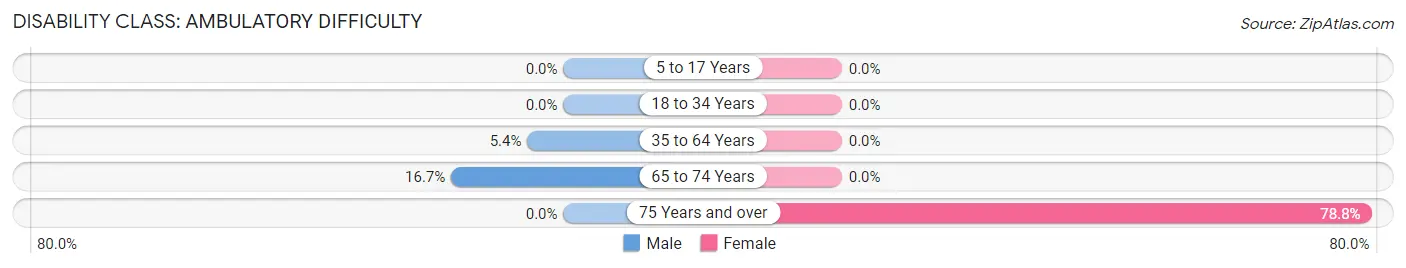
| Age Bracket | Male | Female |
| 5 to 17 Years | 0 (0.0%) | 0 (0.0%) |
| 18 to 34 Years | 0 (0.0%) | 0 (0.0%) |
| 35 to 64 Years | 29 (5.3%) | 0 (0.0%) |
| 65 to 74 Years | 28 (16.7%) | 0 (0.0%) |
| 75 Years and over | 0 (0.0%) | 26 (78.8%) |
Disability Class: Self-Care Difficulty
| Age Bracket | Male | Female |
| 5 to 17 Years | 0 (0.0%) | 0 (0.0%) |
| 18 to 34 Years | 0 (0.0%) | 0 (0.0%) |
| 35 to 64 Years | 0 (0.0%) | 0 (0.0%) |
| 65 to 74 Years | 0 (0.0%) | 0 (0.0%) |
| 75 Years and over | 0 (0.0%) | 0 (0.0%) |
Technology Access in Seward
Computing Device Access in Seward
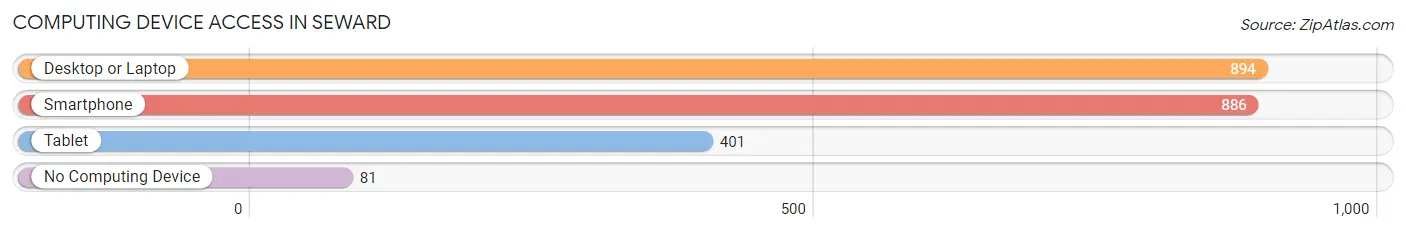
| Device Type | # Households | % Households |
| Desktop or Laptop | 894 | 87.9% |
| Smartphone | 886 | 87.1% |
| Tablet | 401 | 39.4% |
| No Computing Device | 81 | 8.0% |
| Total | 1,017 | 100.0% |
Internet Access in Seward
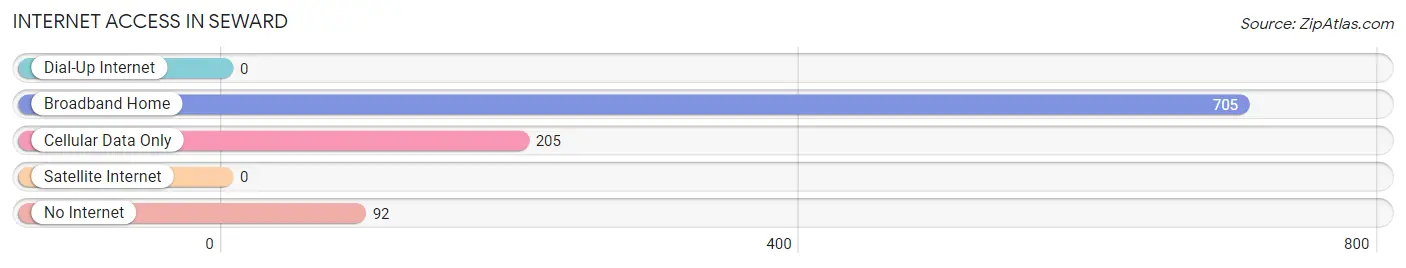
| Internet Type | # Households | % Households |
| Dial-Up Internet | 0 | 0.0% |
| Broadband Home | 705 | 69.3% |
| Cellular Data Only | 205 | 20.2% |
| Satellite Internet | 0 | 0.0% |
| No Internet | 92 | 9.0% |
| Total | 1,017 | 100.0% |
Seward Summary
Seward, Alaska is a small city located on the Kenai Peninsula in the south-central part of the state. It is the gateway to the Kenai Fjords National Park and the Alaska Marine Highway System. Seward is a popular tourist destination, with a population of 2,830 as of the 2010 census.
History
Seward was founded in 1903 by the Alaska Central Railroad, which was built to connect the port of Seward to the interior of Alaska. The city was named after William H. Seward, the U.S. Secretary of State who negotiated the purchase of Alaska from Russia in 1867. The city was incorporated in 1912 and has since grown to become a major port and tourist destination.
Geography
Seward is located on the Kenai Peninsula, at the head of Resurrection Bay. It is surrounded by mountains and is situated on the edge of the Chugach National Forest. The city is located at 60°06'N 149°25'W, and has an elevation of 41 feet.
Economy
Seward's economy is largely based on tourism and fishing. The city is a popular destination for cruise ships, and is home to several seafood processing plants. The city is also home to a number of small businesses, including restaurants, shops, and galleries.
Demographics
As of the 2010 census, Seward had a population of 2,830. The racial makeup of the city was 87.2% White, 0.7% African American, 4.2% Native American, 0.7% Asian, 0.1% Pacific Islander, and 6.8% from two or more races. The median household income was $50,945, and the median family income was $60,945.
Conclusion
Seward, Alaska is a small city located on the Kenai Peninsula in the south-central part of the state. It is the gateway to the Kenai Fjords National Park and the Alaska Marine Highway System. Seward is a popular tourist destination, with a population of 2,830 as of the 2010 census. The city's economy is largely based on tourism and fishing, and it is home to several seafood processing plants. The racial makeup of the city is 87.2% White, 0.7% African American, 4.2% Native American, 0.7% Asian, 0.1% Pacific Islander, and 6.8% from two or more races. The median household income was $50,945, and the median family income was $60,945.
Common Questions
What is Per Capita Income in Seward?
Per Capita income in Seward is $34,044.
What is the Median Family Income in Seward?
Median Family Income in Seward is $113,750.
What is the Median Household income in Seward?
Median Household Income in Seward is $77,850.
What is Income or Wage Gap in Seward?
Income or Wage Gap in Seward is 1.9%.
Women in Seward earn 98.1 cents for every dollar earned by a man.
What is Inequality or Gini Index in Seward?
Inequality or Gini Index in Seward is 0.39.
What is the Total Population of Seward?
Total Population of Seward is 2,768.
What is the Total Male Population of Seward?
Total Male Population of Seward is 1,807.
What is the Total Female Population of Seward?
Total Female Population of Seward is 961.
What is the Ratio of Males per 100 Females in Seward?
There are 188.03 Males per 100 Females in Seward.
What is the Ratio of Females per 100 Males in Seward?
There are 53.18 Females per 100 Males in Seward.
What is the Median Population Age in Seward?
Median Population Age in Seward is 43.8 Years.
What is the Average Family Size in Seward
Average Family Size in Seward is 2.9 People.
What is the Average Household Size in Seward
Average Household Size in Seward is 2.1 People.
How Large is the Labor Force in Seward?
There are 1,146 People in the Labor Forcein in Seward.
What is the Percentage of People in the Labor Force in Seward?
50.9% of People are in the Labor Force in Seward.
What is the Unemployment Rate in Seward?
Unemployment Rate in Seward is 4.8%.