Ruby, AK Map & Demographics
Ruby Map
Ruby Overview
$17,826
PER CAPITA INCOME
$60,125
AVG FAMILY INCOME
$32,500
AVG HOUSEHOLD INCOME
0.43
INEQUALITY / GINI INDEX
194
TOTAL POPULATION
106
MALE POPULATION
88
FEMALE POPULATION
120.45
MALES / 100 FEMALES
83.02
FEMALES / 100 MALES
27.8
MEDIAN AGE
3.9
AVG FAMILY SIZE
2.8
AVG HOUSEHOLD SIZE
79
LABOR FORCE [ PEOPLE ]
57.7%
PERCENT IN LABOR FORCE
Ruby Zip Codes
Ruby Area Codes
Income in Ruby
Income Overview in Ruby
Per Capita Income in Ruby is $17,826, while median incomes of families and households are $60,125 and $32,500 respectively.
| Characteristic | Number | Measure |
| Per Capita Income | 194 | $17,826 |
| Median Family Income | 41 | $60,125 |
| Mean Family Income | 41 | $54,939 |
| Median Household Income | 70 | $32,500 |
| Mean Household Income | 70 | $46,631 |
| Income Deficit | 41 | $0 |
| Wage / Income Gap (%) | 194 | 0.00% |
| Wage / Income Gap ($) | 194 | 100.00¢ per $1 |
| Gini / Inequality Index | 194 | 0.43 |
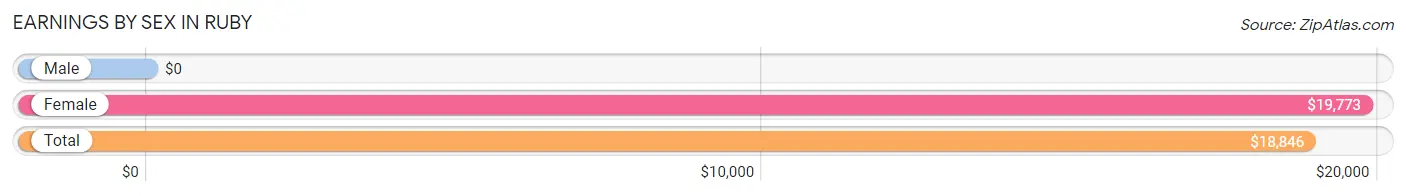
Earnings by Sex in Ruby
| Sex | Number | Average Earnings |
| Male | 38 (43.2%) | $0 |
| Female | 50 (56.8%) | $19,773 |
| Total | 88 (100.0%) | $18,846 |
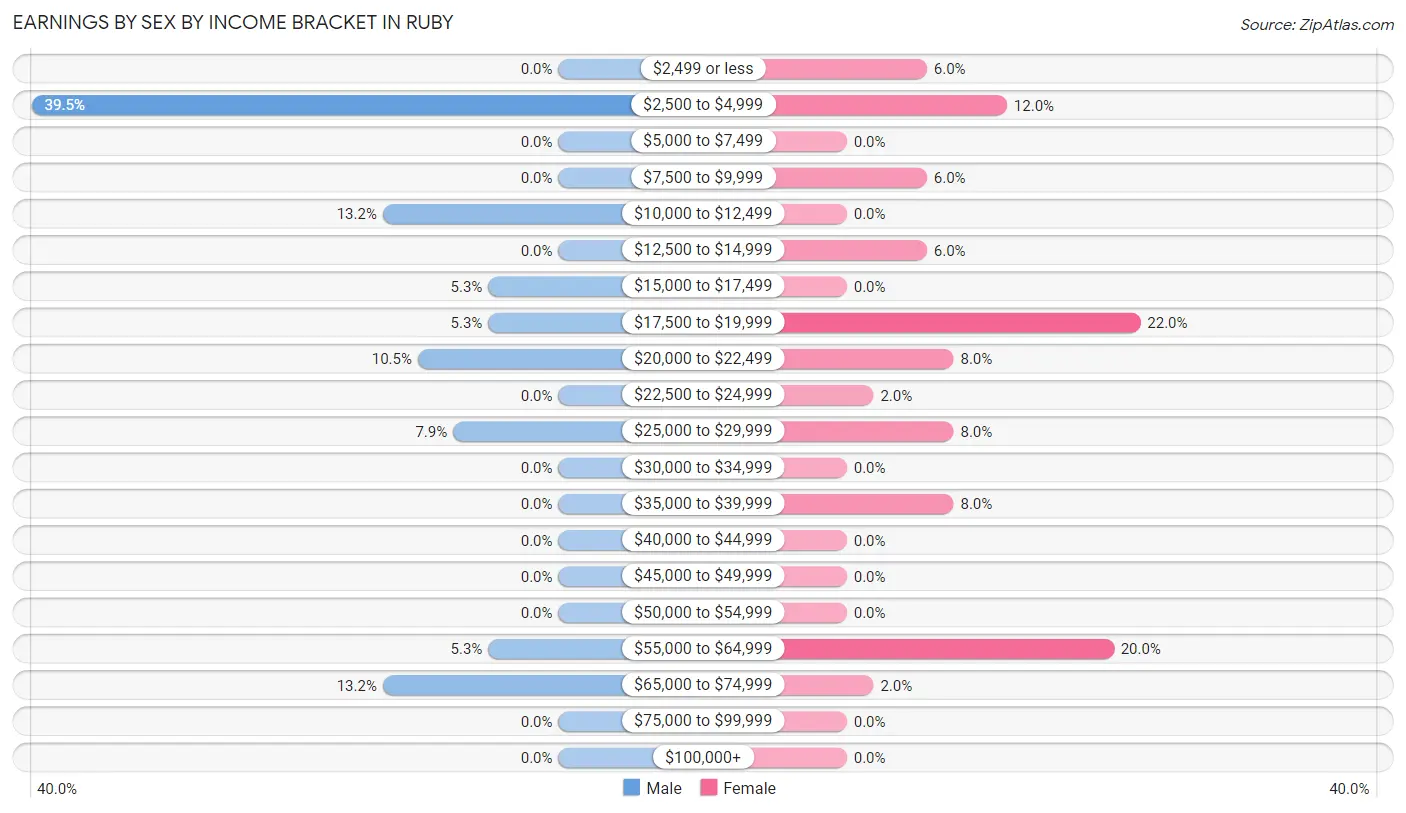
Earnings by Sex by Income Bracket in Ruby
The most common earnings brackets in Ruby are $2,500 to $4,999 for men (15 | 39.5%) and $17,500 to $19,999 for women (11 | 22.0%).
| Income | Male | Female |
| $2,499 or less | 0 (0.0%) | 3 (6.0%) |
| $2,500 to $4,999 | 15 (39.5%) | 6 (12.0%) |
| $5,000 to $7,499 | 0 (0.0%) | 0 (0.0%) |
| $7,500 to $9,999 | 0 (0.0%) | 3 (6.0%) |
| $10,000 to $12,499 | 5 (13.2%) | 0 (0.0%) |
| $12,500 to $14,999 | 0 (0.0%) | 3 (6.0%) |
| $15,000 to $17,499 | 2 (5.3%) | 0 (0.0%) |
| $17,500 to $19,999 | 2 (5.3%) | 11 (22.0%) |
| $20,000 to $22,499 | 4 (10.5%) | 4 (8.0%) |
| $22,500 to $24,999 | 0 (0.0%) | 1 (2.0%) |
| $25,000 to $29,999 | 3 (7.9%) | 4 (8.0%) |
| $30,000 to $34,999 | 0 (0.0%) | 0 (0.0%) |
| $35,000 to $39,999 | 0 (0.0%) | 4 (8.0%) |
| $40,000 to $44,999 | 0 (0.0%) | 0 (0.0%) |
| $45,000 to $49,999 | 0 (0.0%) | 0 (0.0%) |
| $50,000 to $54,999 | 0 (0.0%) | 0 (0.0%) |
| $55,000 to $64,999 | 2 (5.3%) | 10 (20.0%) |
| $65,000 to $74,999 | 5 (13.2%) | 1 (2.0%) |
| $75,000 to $99,999 | 0 (0.0%) | 0 (0.0%) |
| $100,000+ | 0 (0.0%) | 0 (0.0%) |
| Total | 38 (100.0%) | 50 (100.0%) |
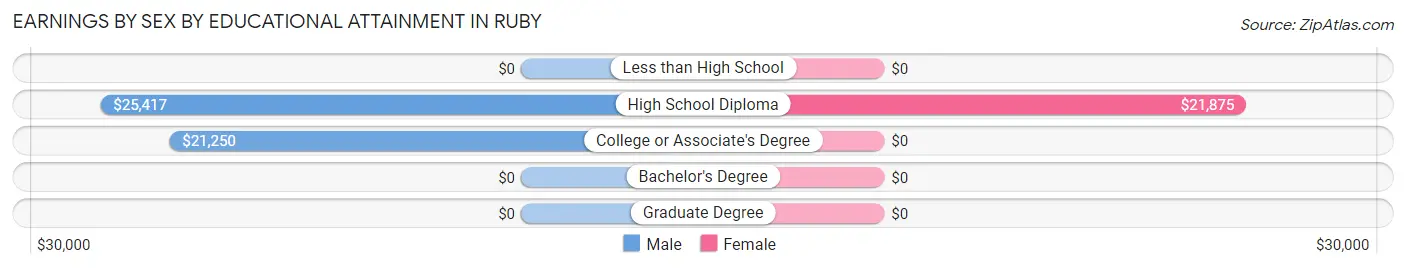
Earnings by Sex by Educational Attainment in Ruby
Average earnings in Ruby are $20,938 for men and $19,167 for women, a difference of 8.5%. Men with an educational attainment of high school diploma enjoy the highest average annual earnings of $25,417, while those with college or associate's degree education earn the least with $21,250. Women with an educational attainment of high school diploma earn the most with the average annual earnings of $21,875, while those with high school diploma education have the smallest earnings of $21,875.
| Educational Attainment | Male Income | Female Income |
| Less than High School | - | - |
| High School Diploma | $25,417 | $21,875 |
| College or Associate's Degree | $21,250 | $0 |
| Bachelor's Degree | - | - |
| Graduate Degree | - | - |
| Total | $20,938 | $19,167 |
Family Income in Ruby
Family Income Brackets in Ruby
According to the Ruby family income data, there are 13 families falling into the $25,000 to $34,999 income range, which is the most common income bracket and makes up 31.7% of all families.
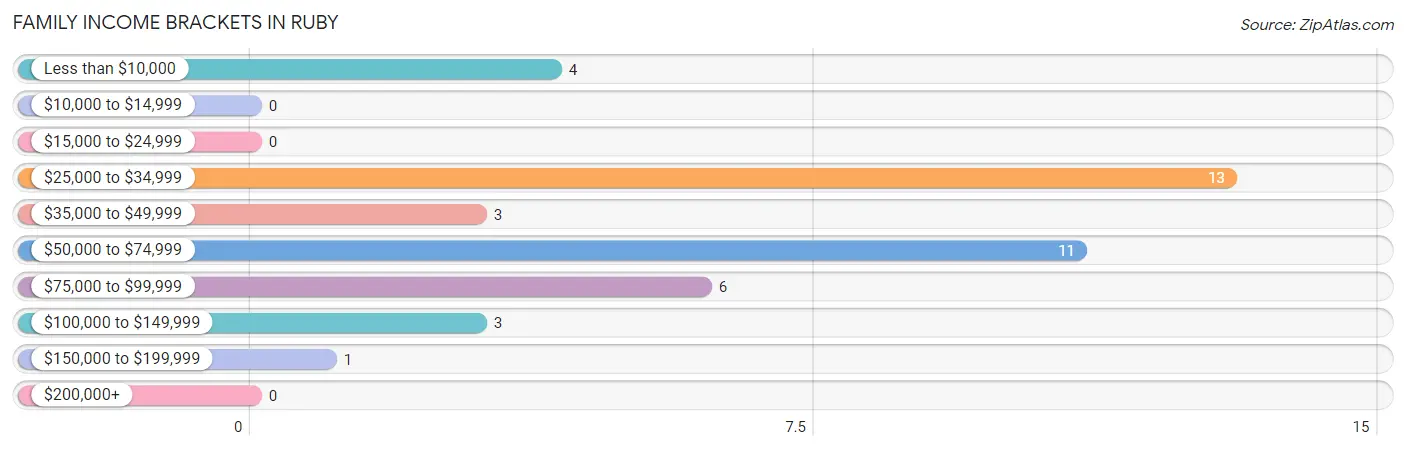
| Income Bracket | # Families | % Families |
| Less than $10,000 | 4 | 9.8% |
| $10,000 to $14,999 | 0 | 0.0% |
| $15,000 to $24,999 | 0 | 0.0% |
| $25,000 to $34,999 | 13 | 31.7% |
| $35,000 to $49,999 | 3 | 7.3% |
| $50,000 to $74,999 | 11 | 26.8% |
| $75,000 to $99,999 | 6 | 14.6% |
| $100,000 to $149,999 | 3 | 7.3% |
| $150,000 to $199,999 | 1 | 2.4% |
| $200,000+ | 0 | 0.0% |
Family Income by Famaliy Size in Ruby
3-person families (18 | 43.9%) account for the highest median family income in Ruby with $60,250 per family, while 3-person families (18 | 43.9%) have the highest median income of $20,083 per family member.
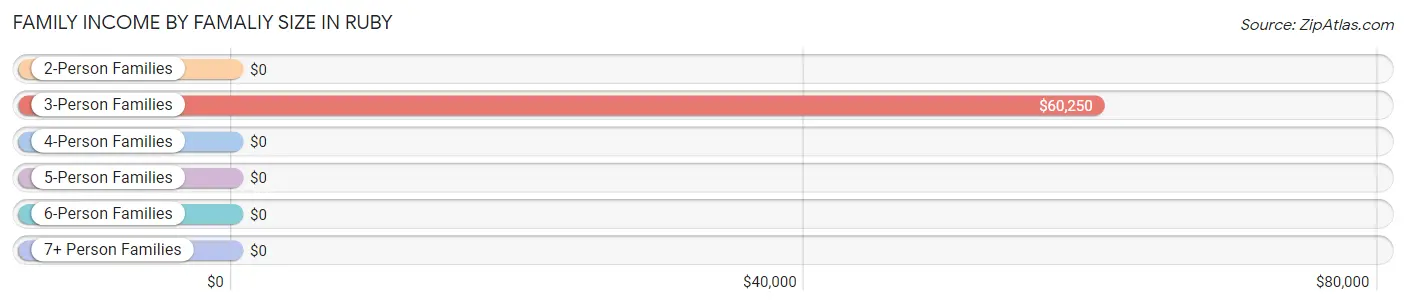
| Income Bracket | # Families | Median Income |
| 2-Person Families | 14 (34.2%) | $0 |
| 3-Person Families | 18 (43.9%) | $60,250 |
| 4-Person Families | 0 (0.0%) | $0 |
| 5-Person Families | 4 (9.8%) | $0 |
| 6-Person Families | 1 (2.4%) | $0 |
| 7+ Person Families | 4 (9.8%) | $0 |
| Total | 41 (100.0%) | $60,125 |
Family Income by Number of Earners in Ruby
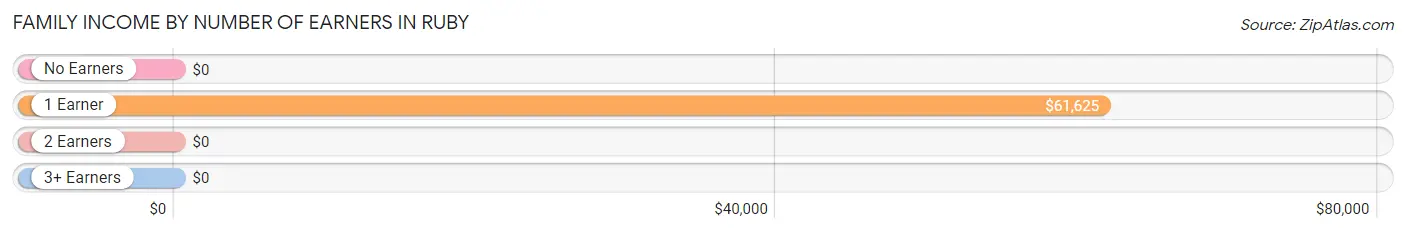
| Number of Earners | # Families | Median Income |
| No Earners | 9 (22.0%) | $0 |
| 1 Earner | 21 (51.2%) | $61,625 |
| 2 Earners | 4 (9.8%) | $0 |
| 3+ Earners | 7 (17.1%) | $0 |
| Total | 41 (100.0%) | $60,125 |
Household Income in Ruby
Household Income Brackets in Ruby
With 15 households falling in the category, the $25,000 to $34,999 income range is the most frequent in Ruby, accounting for 21.4% of all households.
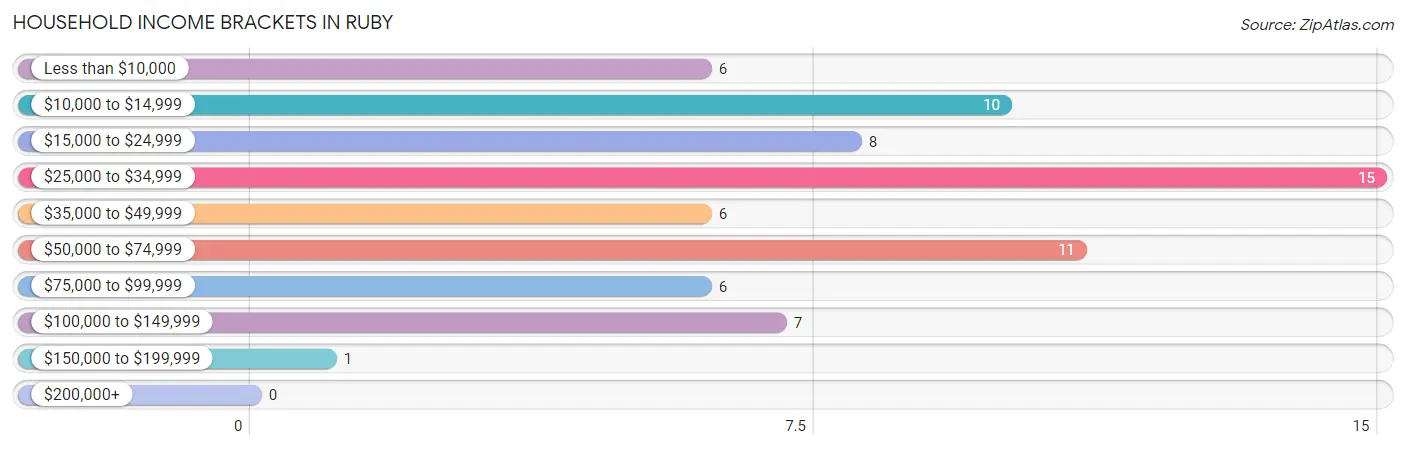
| Income Bracket | # Households | % Households |
| Less than $10,000 | 6 | 8.6% |
| $10,000 to $14,999 | 10 | 14.3% |
| $15,000 to $24,999 | 8 | 11.4% |
| $25,000 to $34,999 | 15 | 21.4% |
| $35,000 to $49,999 | 6 | 8.6% |
| $50,000 to $74,999 | 11 | 15.7% |
| $75,000 to $99,999 | 6 | 8.6% |
| $100,000 to $149,999 | 7 | 10.0% |
| $150,000 to $199,999 | 1 | 1.4% |
| $200,000+ | 0 | 0.0% |
Household Income by Householder Age in Ruby
The median household income in Ruby is $32,500, with the highest median household income of $36,667 found in the 45 to 64 years age bracket for the primary householder. A total of 12 households (17.1%) fall into this category. Meanwhile, the 15 to 24 years age bracket for the primary householder has the lowest median household income of $0, with 10 households (14.3%) in this group.
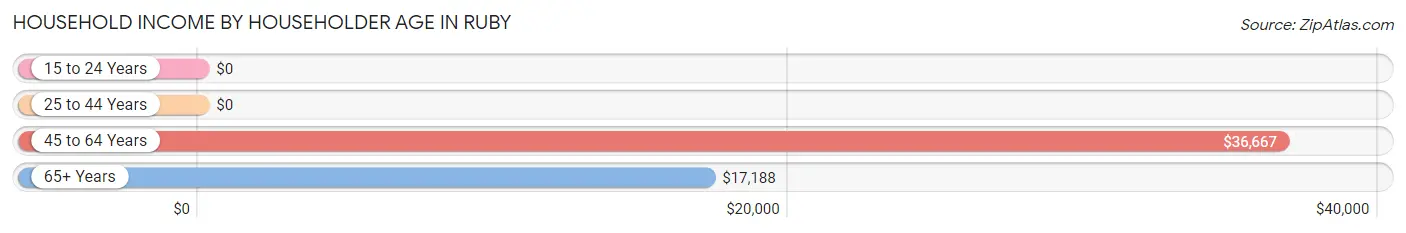
| Income Bracket | # Households | Median Income |
| 15 to 24 Years | 10 (14.3%) | $0 |
| 25 to 44 Years | 13 (18.6%) | $0 |
| 45 to 64 Years | 12 (17.1%) | $36,667 |
| 65+ Years | 35 (50.0%) | $17,188 |
| Total | 70 (100.0%) | $32,500 |
Poverty in Ruby
Income Below Poverty by Sex and Age in Ruby
With 14.1% poverty level for males and 31.8% for females among the residents of Ruby, 6 to 11 year old males and under 5 year old females are the most vulnerable to poverty, with 4 males (30.8%) and 5 females (100.0%) in their respective age groups living below the poverty level.
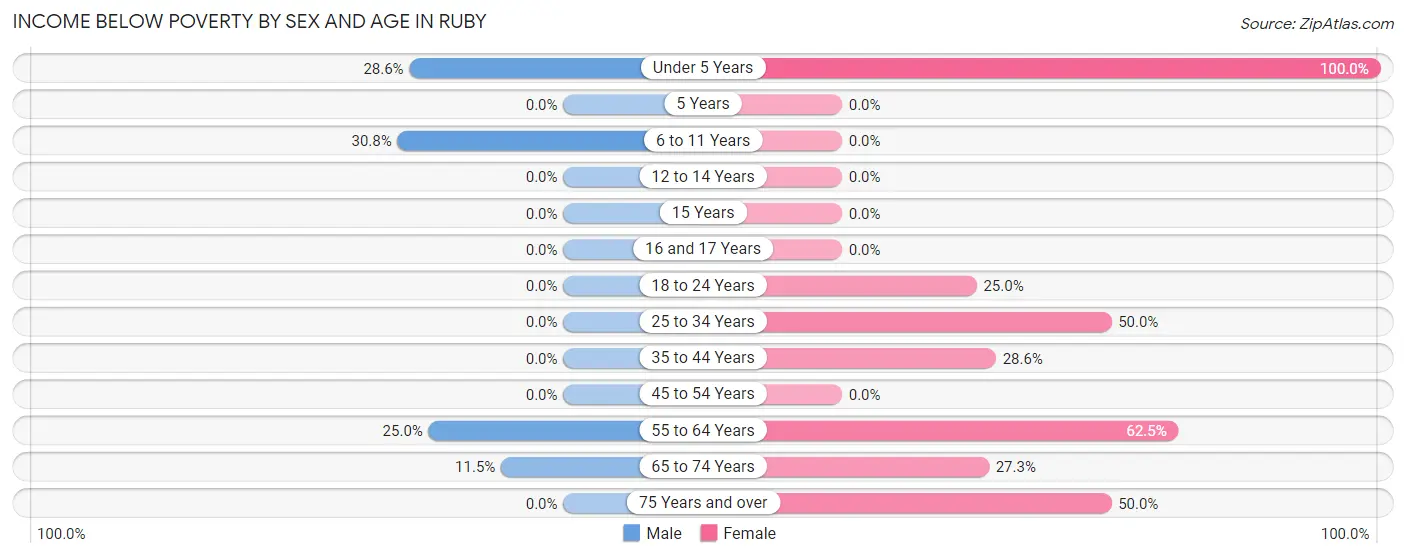
| Age Bracket | Male | Female |
| Under 5 Years | 6 (28.6%) | 5 (100.0%) |
| 5 Years | 0 (0.0%) | 0 (0.0%) |
| 6 to 11 Years | 4 (30.8%) | 0 (0.0%) |
| 12 to 14 Years | 0 (0.0%) | 0 (0.0%) |
| 15 Years | 0 (0.0%) | 0 (0.0%) |
| 16 and 17 Years | 0 (0.0%) | 0 (0.0%) |
| 18 to 24 Years | 0 (0.0%) | 5 (25.0%) |
| 25 to 34 Years | 0 (0.0%) | 2 (50.0%) |
| 35 to 44 Years | 0 (0.0%) | 4 (28.6%) |
| 45 to 54 Years | 0 (0.0%) | 0 (0.0%) |
| 55 to 64 Years | 2 (25.0%) | 5 (62.5%) |
| 65 to 74 Years | 3 (11.5%) | 3 (27.3%) |
| 75 Years and over | 0 (0.0%) | 4 (50.0%) |
| Total | 15 (14.1%) | 28 (31.8%) |
Income Above Poverty by Sex and Age in Ruby
According to the poverty statistics in Ruby, males aged 5 years and females aged 6 to 11 years are the age groups that are most secure financially, with 100.0% of males and 100.0% of females in these age groups living above the poverty line.
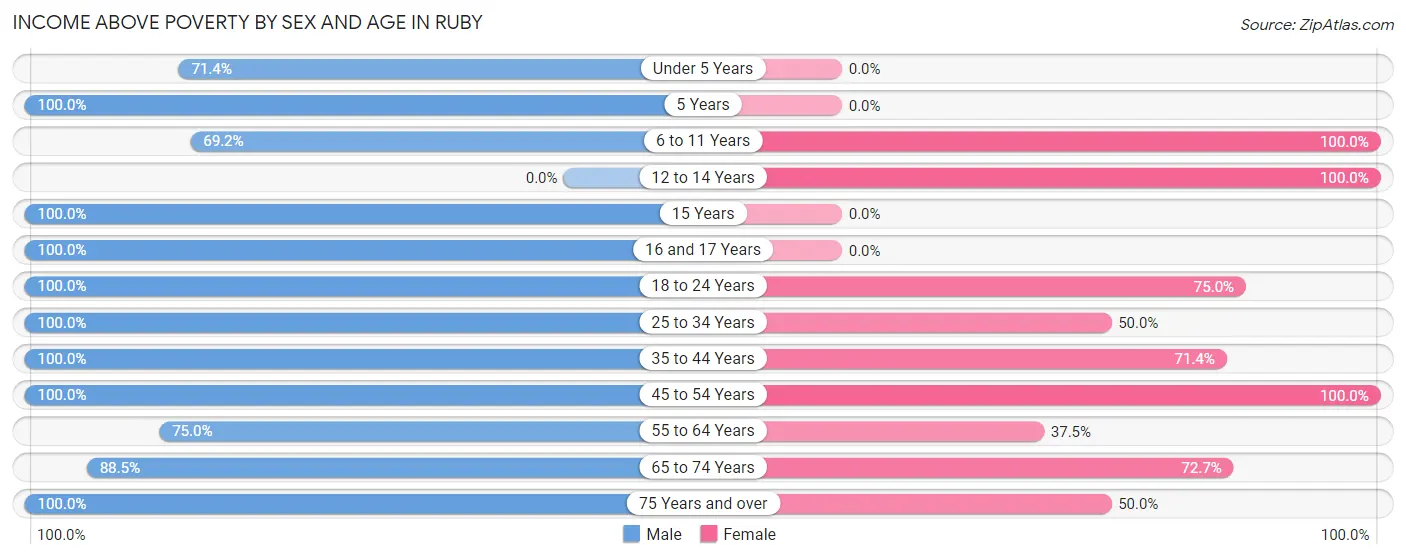
| Age Bracket | Male | Female |
| Under 5 Years | 15 (71.4%) | 0 (0.0%) |
| 5 Years | 3 (100.0%) | 0 (0.0%) |
| 6 to 11 Years | 9 (69.2%) | 7 (100.0%) |
| 12 to 14 Years | 0 (0.0%) | 6 (100.0%) |
| 15 Years | 2 (100.0%) | 0 (0.0%) |
| 16 and 17 Years | 1 (100.0%) | 0 (0.0%) |
| 18 to 24 Years | 13 (100.0%) | 15 (75.0%) |
| 25 to 34 Years | 5 (100.0%) | 2 (50.0%) |
| 35 to 44 Years | 5 (100.0%) | 10 (71.4%) |
| 45 to 54 Years | 5 (100.0%) | 5 (100.0%) |
| 55 to 64 Years | 6 (75.0%) | 3 (37.5%) |
| 65 to 74 Years | 23 (88.5%) | 8 (72.7%) |
| 75 Years and over | 4 (100.0%) | 4 (50.0%) |
| Total | 91 (85.9%) | 60 (68.2%) |
Income Below Poverty Among Married-Couple Families in Ruby
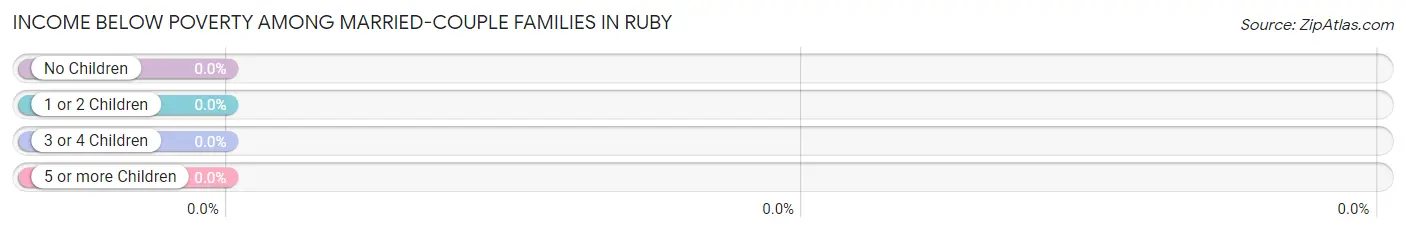
| Children | Above Poverty | Below Poverty |
| No Children | 12 (100.0%) | 0 (0.0%) |
| 1 or 2 Children | 2 (100.0%) | 0 (0.0%) |
| 3 or 4 Children | 3 (100.0%) | 0 (0.0%) |
| 5 or more Children | 0 (0.0%) | 0 (0.0%) |
| Total | 17 (100.0%) | 0 (0.0%) |
Income Below Poverty Among Single-Parent Households in Ruby
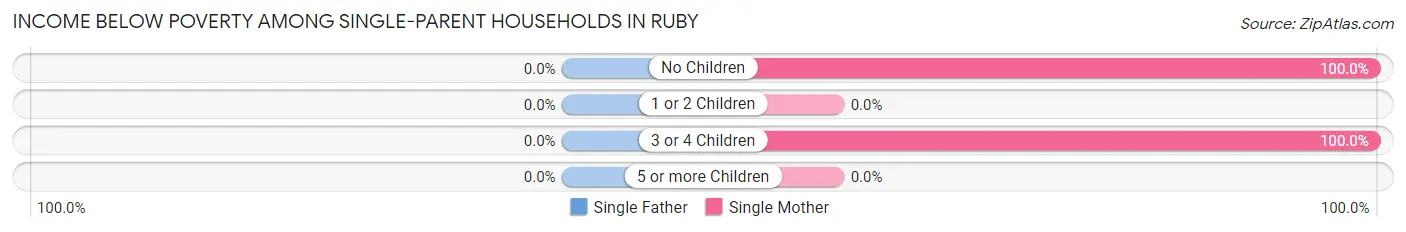
| Children | Single Father | Single Mother |
| No Children | 0 (0.0%) | 4 (100.0%) |
| 1 or 2 Children | 0 (0.0%) | 0 (0.0%) |
| 3 or 4 Children | 0 (0.0%) | 4 (100.0%) |
| 5 or more Children | 0 (0.0%) | 0 (0.0%) |
| Total | 0 (0.0%) | 8 (36.4%) |
Income Below Poverty Among Married-Couple vs Single-Parent Households in Ruby
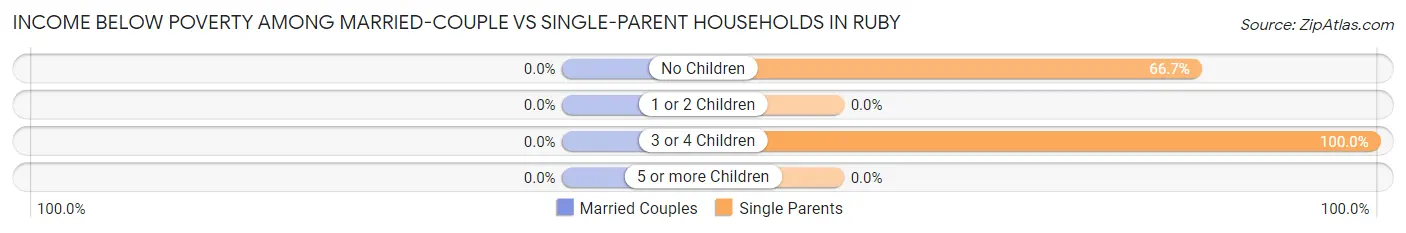
| Children | Married-Couple Families | Single-Parent Households |
| No Children | 0 (0.0%) | 4 (66.7%) |
| 1 or 2 Children | 0 (0.0%) | 0 (0.0%) |
| 3 or 4 Children | 0 (0.0%) | 4 (100.0%) |
| 5 or more Children | 0 (0.0%) | 0 (0.0%) |
| Total | 0 (0.0%) | 8 (33.3%) |
Race in Ruby
The most populous races in Ruby are Native / Alaskan (156 | 80.4%), White / Caucasian (27 | 13.9%), and Two or more Races (11 | 5.7%).
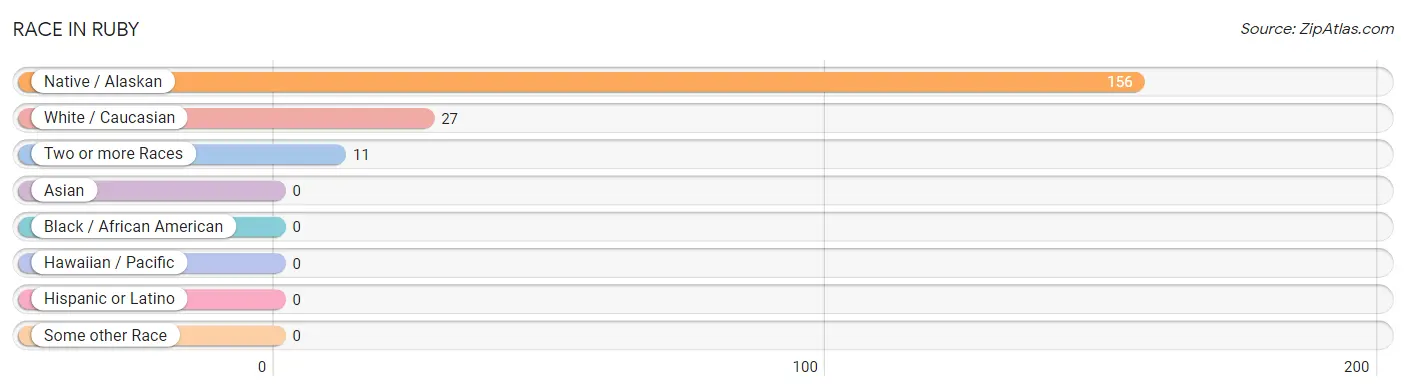
| Race | # Population | % Population |
| Asian | 0 | 0.0% |
| Black / African American | 0 | 0.0% |
| Hawaiian / Pacific | 0 | 0.0% |
| Hispanic or Latino | 0 | 0.0% |
| Native / Alaskan | 156 | 80.4% |
| White / Caucasian | 27 | 13.9% |
| Two or more Races | 11 | 5.7% |
| Some other Race | 0 | 0.0% |
| Total | 194 | 100.0% |
Ancestry in Ruby
The most populous ancestries reported in Ruby are Alaskan Athabascan (149 | 76.8%), German (18 | 9.3%), Pueblo (16 | 8.3%), Chickasaw (15 | 7.7%), and Irish (15 | 7.7%), together accounting for 109.8% of all Ruby residents.
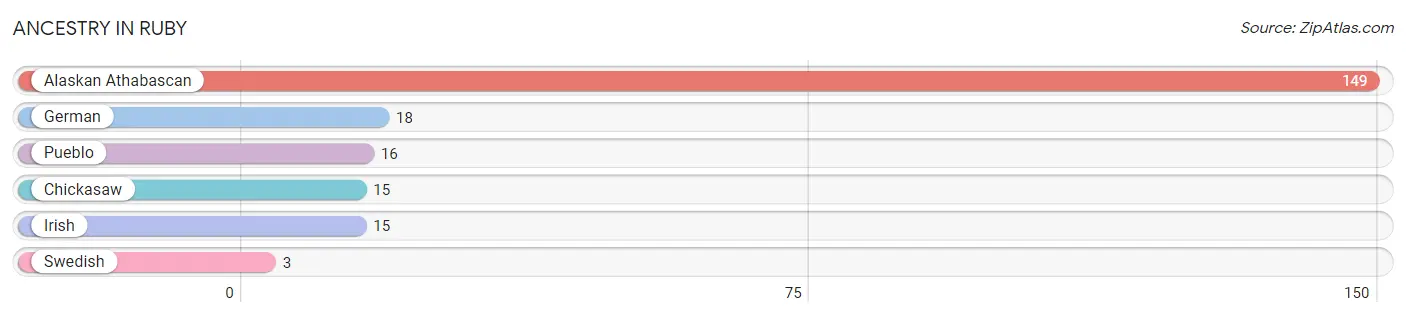
| Ancestry | # Population | % Population |
| Alaskan Athabascan | 149 | 76.8% |
| Chickasaw | 15 | 7.7% |
| German | 18 | 9.3% |
| Irish | 15 | 7.7% |
| Pueblo | 16 | 8.3% |
| Swedish | 3 | 1.5% | View All 6 Rows |
Immigrants in Ruby

| Immigration Origin | # Population | % Population | View All 0 Rows |
Sex and Age in Ruby
Sex and Age in Ruby
The most populous age groups in Ruby are Under 5 Years (21 | 19.8%) for men and 20 to 24 Years (20 | 22.7%) for women.
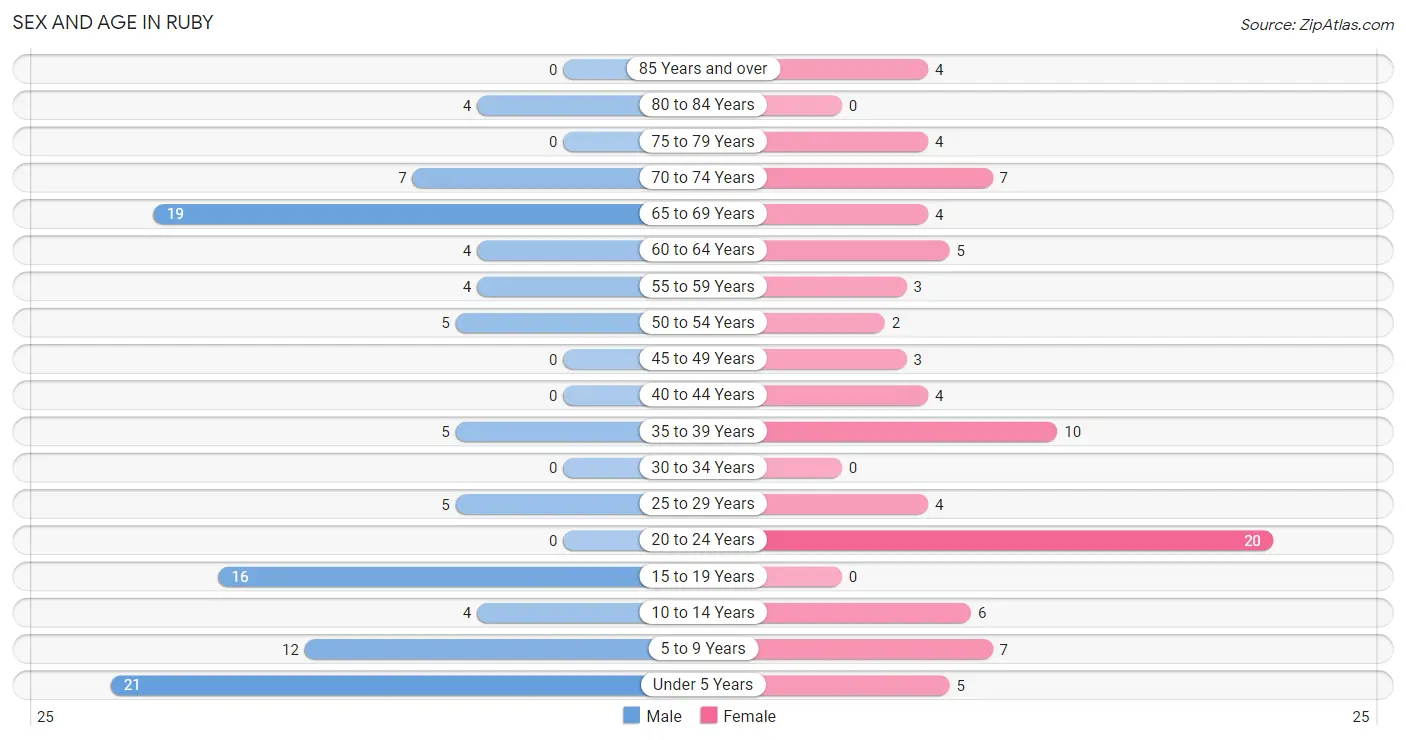
| Age Bracket | Male | Female |
| Under 5 Years | 21 (19.8%) | 5 (5.7%) |
| 5 to 9 Years | 12 (11.3%) | 7 (8.0%) |
| 10 to 14 Years | 4 (3.8%) | 6 (6.8%) |
| 15 to 19 Years | 16 (15.1%) | 0 (0.0%) |
| 20 to 24 Years | 0 (0.0%) | 20 (22.7%) |
| 25 to 29 Years | 5 (4.7%) | 4 (4.5%) |
| 30 to 34 Years | 0 (0.0%) | 0 (0.0%) |
| 35 to 39 Years | 5 (4.7%) | 10 (11.4%) |
| 40 to 44 Years | 0 (0.0%) | 4 (4.5%) |
| 45 to 49 Years | 0 (0.0%) | 3 (3.4%) |
| 50 to 54 Years | 5 (4.7%) | 2 (2.3%) |
| 55 to 59 Years | 4 (3.8%) | 3 (3.4%) |
| 60 to 64 Years | 4 (3.8%) | 5 (5.7%) |
| 65 to 69 Years | 19 (17.9%) | 4 (4.5%) |
| 70 to 74 Years | 7 (6.6%) | 7 (8.0%) |
| 75 to 79 Years | 0 (0.0%) | 4 (4.5%) |
| 80 to 84 Years | 4 (3.8%) | 0 (0.0%) |
| 85 Years and over | 0 (0.0%) | 4 (4.5%) |
| Total | 106 (100.0%) | 88 (100.0%) |
Families and Households in Ruby
Median Family Size in Ruby
The median family size in Ruby is 3.88 persons per family, with married-couple families (17 | 41.5%) accounting for the largest median family size of 5.18 persons per family. On the other hand, single male/father families (2 | 4.9%) represent the smallest median family size with 2.50 persons per family.
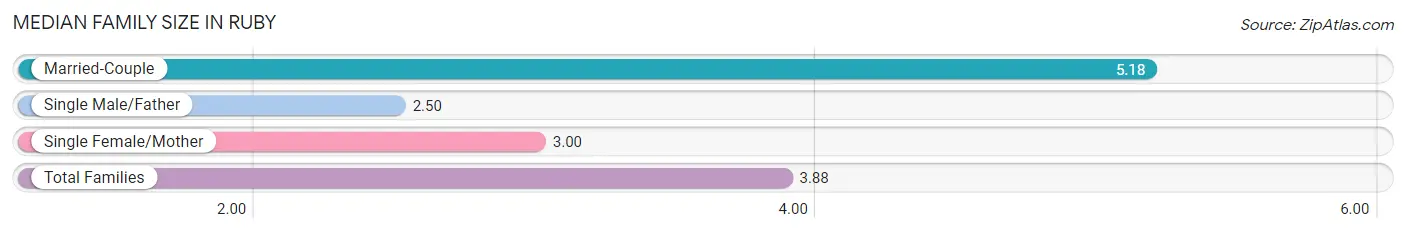
| Family Type | # Families | Family Size |
| Married-Couple | 17 (41.5%) | 5.18 |
| Single Male/Father | 2 (4.9%) | 2.50 |
| Single Female/Mother | 22 (53.7%) | 3.00 |
| Total Families | 41 (100.0%) | 3.88 |
Median Household Size in Ruby
The median household size in Ruby is 2.77 persons per household, with married-couple households (17 | 24.3%) accounting for the largest median household size of 5.18 persons per household. non-family households (29 | 41.4%) represent the smallest median household size with 1.21 persons per household.
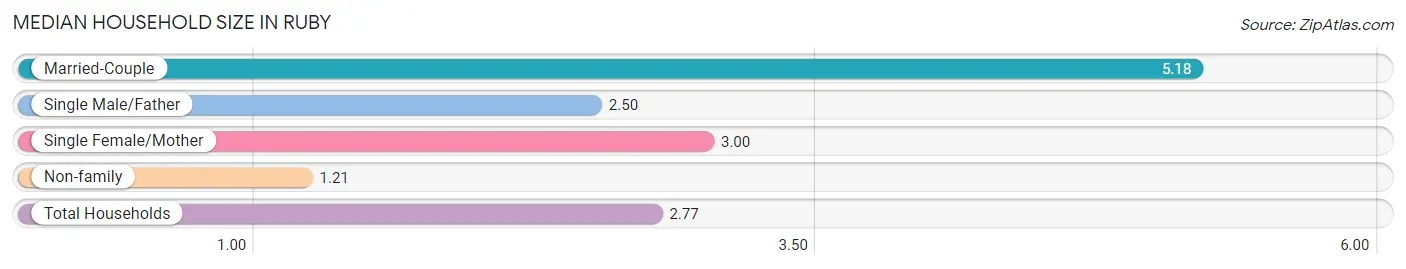
| Household Type | # Households | Household Size |
| Married-Couple | 17 (24.3%) | 5.18 |
| Single Male/Father | 2 (2.9%) | 2.50 |
| Single Female/Mother | 22 (31.4%) | 3.00 |
| Non-family | 29 (41.4%) | 1.21 |
| Total Households | 70 (100.0%) | 2.77 |
Household Size by Marriage Status in Ruby
Out of a total of 70 households in Ruby, 41 (58.6%) are family households, while 29 (41.4%) are nonfamily households. The most numerous type of family households are 3-person households, comprising 18, and the most common type of nonfamily households are 1-person households, comprising 20.
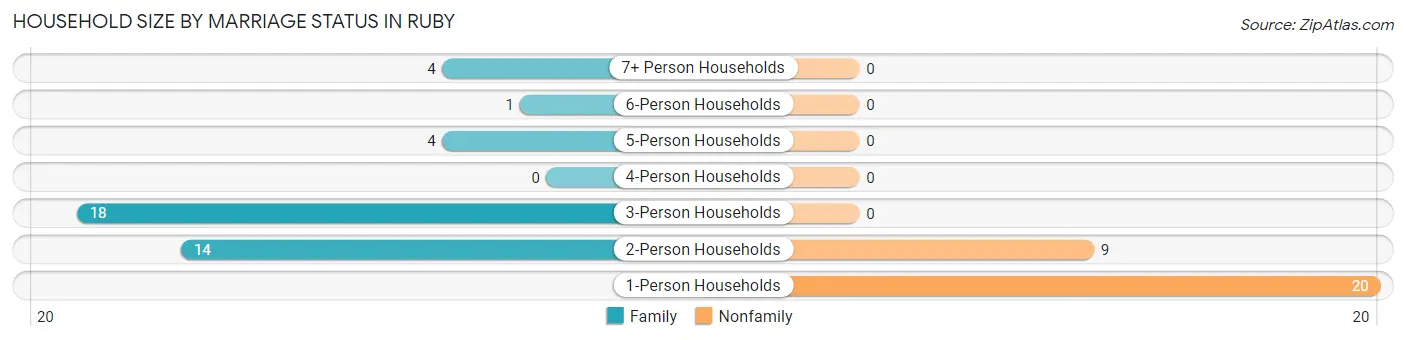
| Household Size | Family Households | Nonfamily Households |
| 1-Person Households | - | 20 (28.6%) |
| 2-Person Households | 14 (20.0%) | 9 (12.9%) |
| 3-Person Households | 18 (25.7%) | 0 (0.0%) |
| 4-Person Households | 0 (0.0%) | 0 (0.0%) |
| 5-Person Households | 4 (5.7%) | 0 (0.0%) |
| 6-Person Households | 1 (1.4%) | 0 (0.0%) |
| 7+ Person Households | 4 (5.7%) | 0 (0.0%) |
| Total | 41 (58.6%) | 29 (41.4%) |
Female Fertility in Ruby
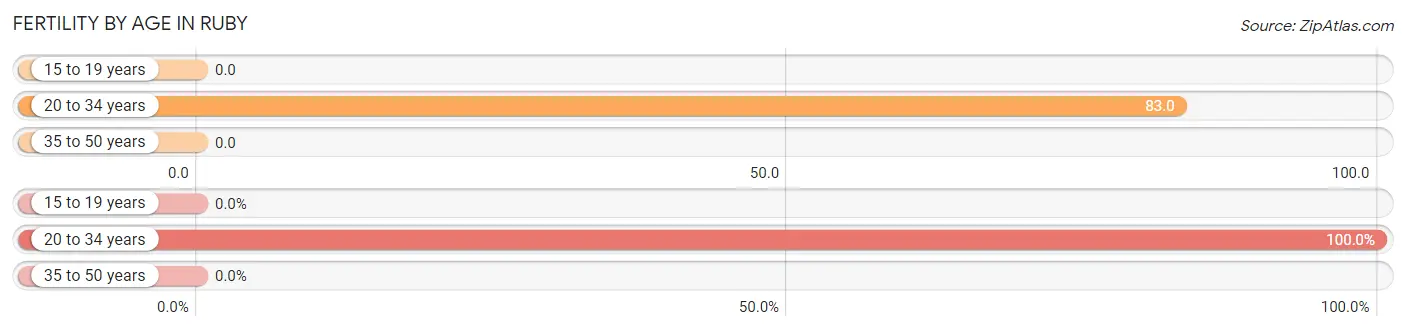
Fertility by Age in Ruby
Average fertility rate in Ruby is 48.0 births per 1,000 women. Women in the age bracket of 20 to 34 years have the highest fertility rate with 83.0 births per 1,000 women. Women in the age bracket of 20 to 34 years acount for 100.0% of all women with births.
| Age Bracket | Women with Births | Births / 1,000 Women |
| 15 to 19 years | 0 (0.0%) | 0.0 |
| 20 to 34 years | 2 (100.0%) | 83.0 |
| 35 to 50 years | 0 (0.0%) | 0.0 |
| Total | 2 (100.0%) | 48.0 |
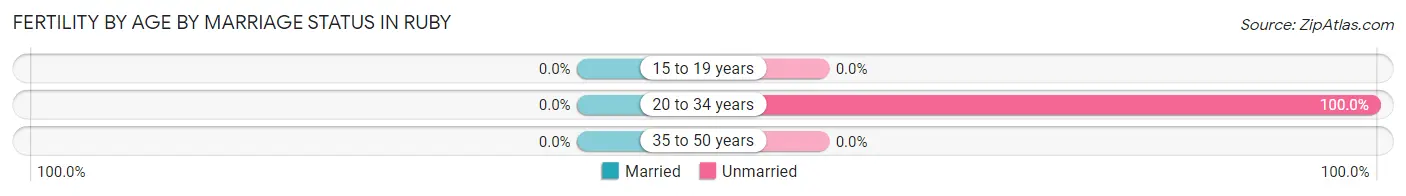
Fertility by Age by Marriage Status in Ruby
| Age Bracket | Married | Unmarried |
| 15 to 19 years | 0 (0.0%) | 0 (0.0%) |
| 20 to 34 years | 0 (0.0%) | 2 (100.0%) |
| 35 to 50 years | 0 (0.0%) | 0 (0.0%) |
| Total | 0 (0.0%) | 2 (100.0%) |
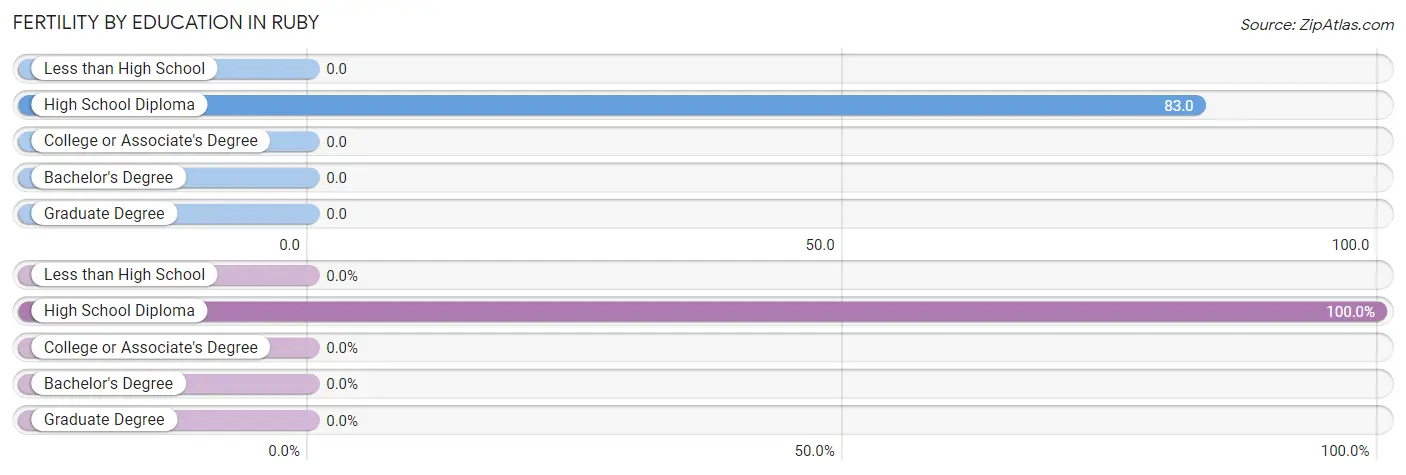
Fertility by Education in Ruby
| Educational Attainment | Women with Births | Births / 1,000 Women |
| Less than High School | 0 (0.0%) | 0.0 |
| High School Diploma | 2 (100.0%) | 83.0 |
| College or Associate's Degree | 0 (0.0%) | 0.0 |
| Bachelor's Degree | 0 (0.0%) | 0.0 |
| Graduate Degree | 0 (0.0%) | 0.0 |
| Total | 2 (100.0%) | 48.0 |
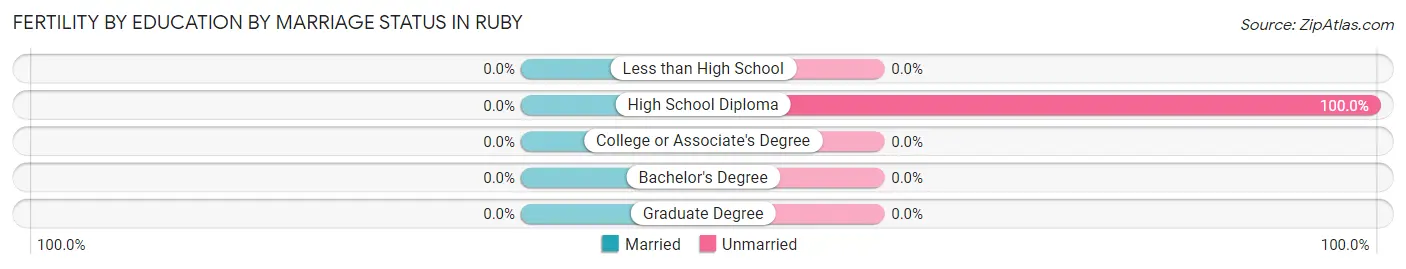
Fertility by Education by Marriage Status in Ruby
| Educational Attainment | Married | Unmarried |
| Less than High School | 0 (0.0%) | 0 (0.0%) |
| High School Diploma | 0 (0.0%) | 2 (100.0%) |
| College or Associate's Degree | 0 (0.0%) | 0 (0.0%) |
| Bachelor's Degree | 0 (0.0%) | 0 (0.0%) |
| Graduate Degree | 0 (0.0%) | 0 (0.0%) |
| Total | 0 (0.0%) | 2 (100.0%) |
Employment Characteristics in Ruby
Employment by Class of Employer in Ruby
Among the 79 employed individuals in Ruby, local government employees (26 | 32.9%), state government employees (19 | 24.0%), and private company employees (11 | 13.9%) make up the most common classes of employment.
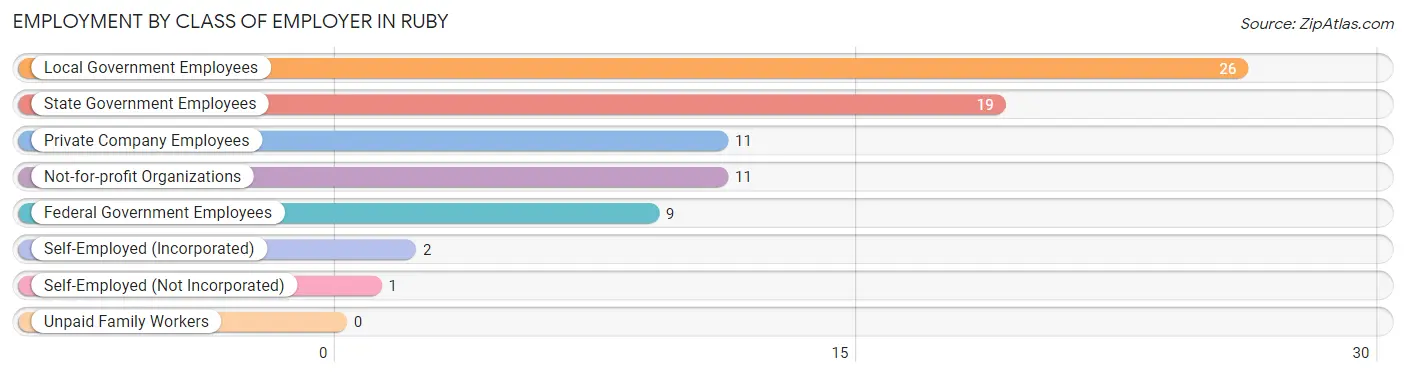
| Employer Class | # Employees | % Employees |
| Private Company Employees | 11 | 13.9% |
| Self-Employed (Incorporated) | 2 | 2.5% |
| Self-Employed (Not Incorporated) | 1 | 1.3% |
| Not-for-profit Organizations | 11 | 13.9% |
| Local Government Employees | 26 | 32.9% |
| State Government Employees | 19 | 24.0% |
| Federal Government Employees | 9 | 11.4% |
| Unpaid Family Workers | 0 | 0.0% |
| Total | 79 | 100.0% |
Employment Status by Age in Ruby
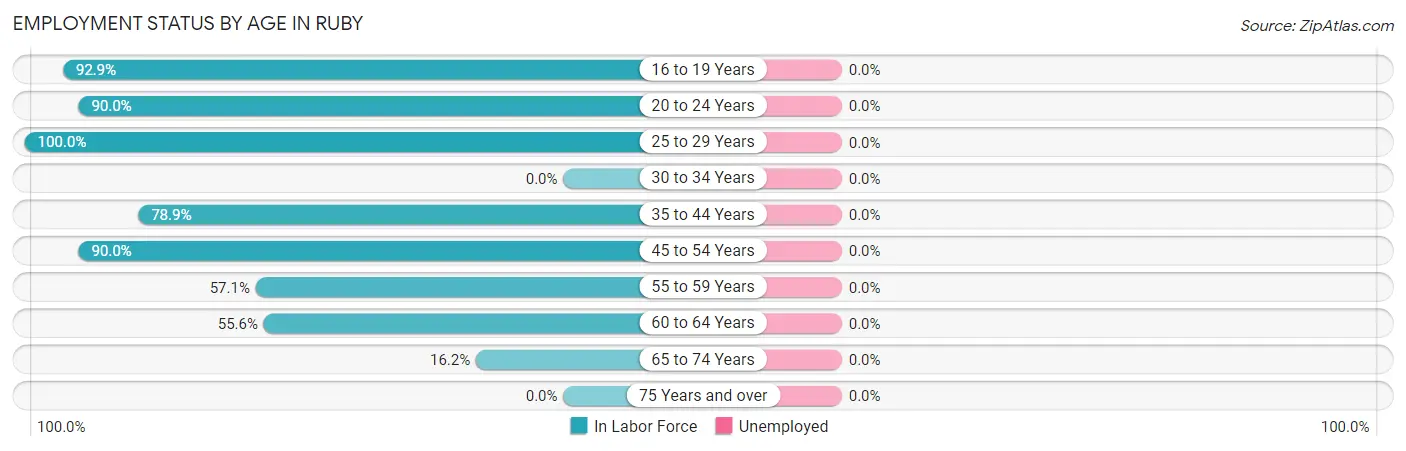
| Age Bracket | In Labor Force | Unemployed |
| 16 to 19 Years | 13 (92.9%) | 0 (0.0%) |
| 20 to 24 Years | 18 (90.0%) | 0 (0.0%) |
| 25 to 29 Years | 9 (100.0%) | 0 (0.0%) |
| 30 to 34 Years | 0 (0.0%) | 0 (0.0%) |
| 35 to 44 Years | 15 (78.9%) | 0 (0.0%) |
| 45 to 54 Years | 9 (90.0%) | 0 (0.0%) |
| 55 to 59 Years | 4 (57.1%) | 0 (0.0%) |
| 60 to 64 Years | 5 (55.6%) | 0 (0.0%) |
| 65 to 74 Years | 6 (16.2%) | 0 (0.0%) |
| 75 Years and over | 0 (0.0%) | 0 (0.0%) |
| Total | 79 (57.7%) | 0 (0.0%) |
Employment Status by Educational Attainment in Ruby
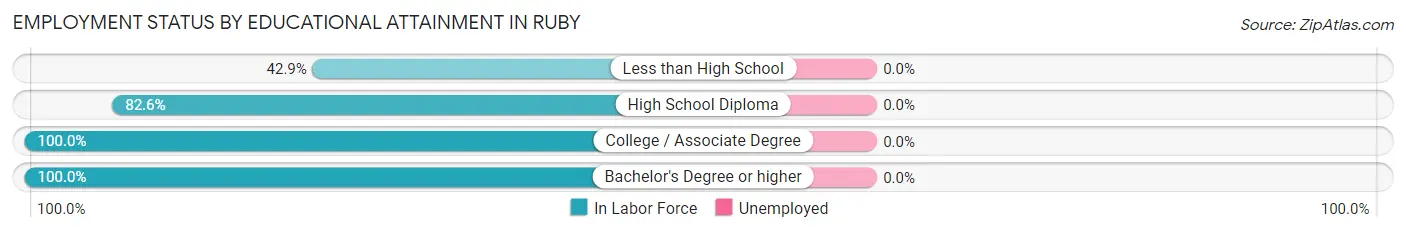
| Educational Attainment | In Labor Force | Unemployed |
| Less than High School | 6 (42.9%) | 0 (0.0%) |
| High School Diploma | 19 (82.6%) | 0 (0.0%) |
| College / Associate Degree | 13 (100.0%) | 0 (0.0%) |
| Bachelor's Degree or higher | 4 (100.0%) | 0 (0.0%) |
| Total | 42 (77.8%) | 0 (0.0%) |
Employment Occupations by Sex in Ruby
Management, Business, Science and Arts Occupations
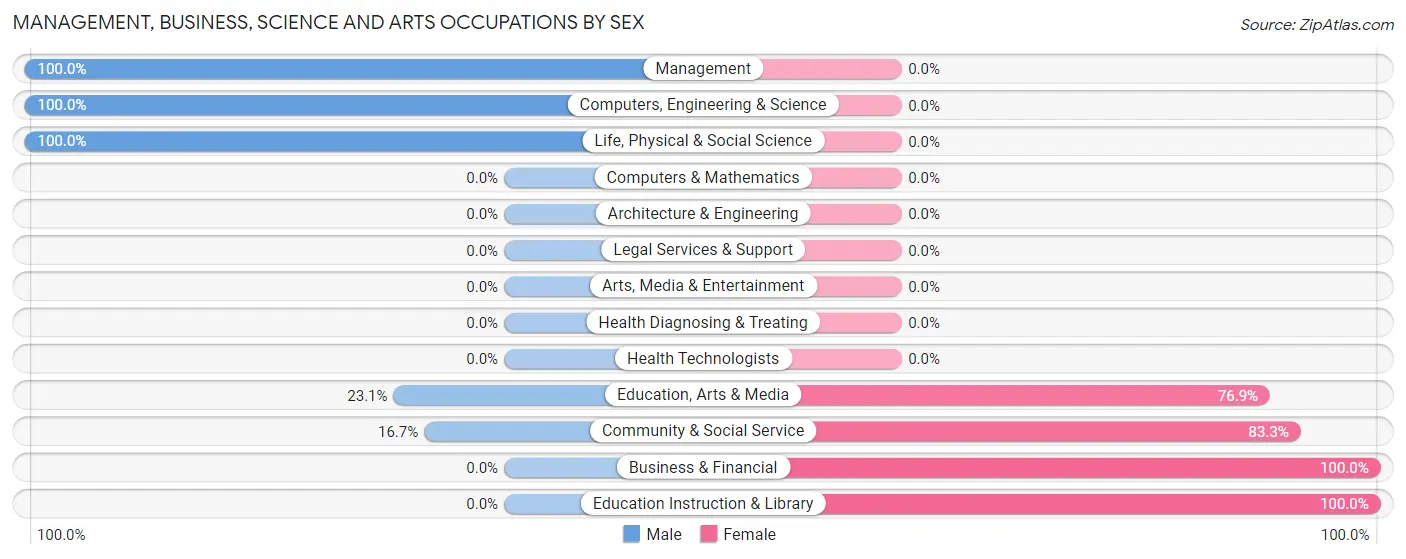
The most common Management, Business, Science and Arts occupations in Ruby are Community & Social Service (18 | 22.8%), Education, Arts & Media (13 | 16.5%), Education Instruction & Library (5 | 6.3%), Management (2 | 2.5%), and Computers, Engineering & Science (2 | 2.5%).
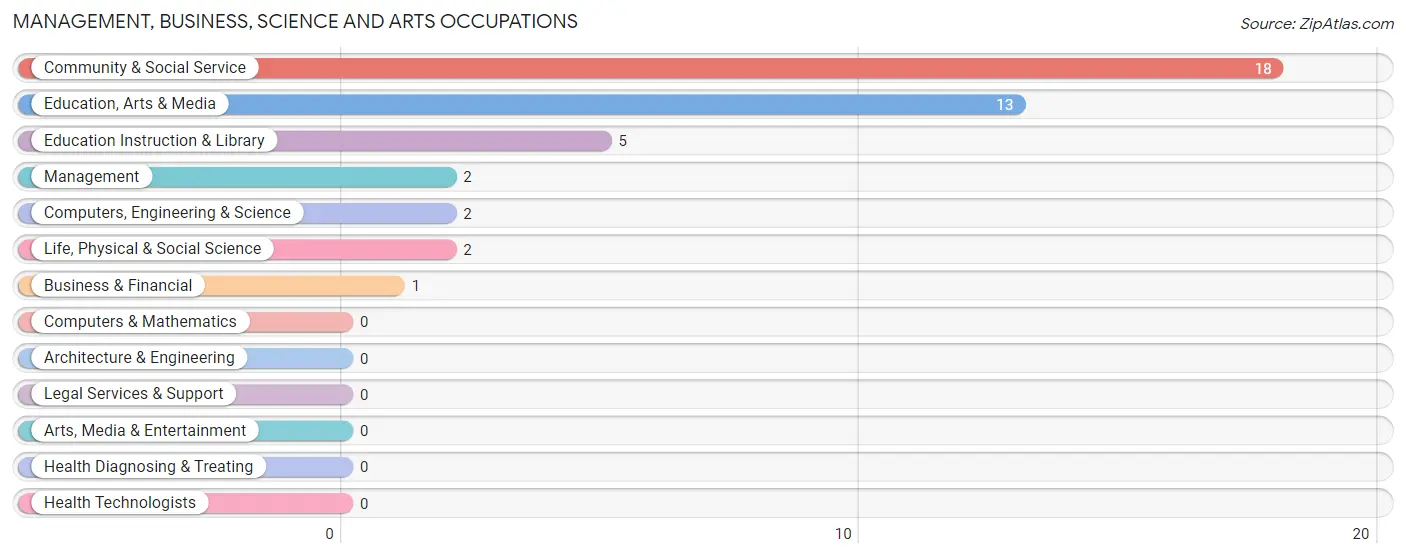
Management, Business, Science and Arts Occupations by Sex
Within the Management, Business, Science and Arts occupations in Ruby, the most male-oriented occupations are Management (100.0%), Computers, Engineering & Science (100.0%), and Life, Physical & Social Science (100.0%), while the most female-oriented occupations are Business & Financial (100.0%), Education Instruction & Library (100.0%), and Community & Social Service (83.3%).
| Occupation | Male | Female |
| Management | 2 (100.0%) | 0 (0.0%) |
| Business & Financial | 0 (0.0%) | 1 (100.0%) |
| Computers, Engineering & Science | 2 (100.0%) | 0 (0.0%) |
| Computers & Mathematics | 0 (0.0%) | 0 (0.0%) |
| Architecture & Engineering | 0 (0.0%) | 0 (0.0%) |
| Life, Physical & Social Science | 2 (100.0%) | 0 (0.0%) |
| Community & Social Service | 3 (16.7%) | 15 (83.3%) |
| Education, Arts & Media | 3 (23.1%) | 10 (76.9%) |
| Legal Services & Support | 0 (0.0%) | 0 (0.0%) |
| Education Instruction & Library | 0 (0.0%) | 5 (100.0%) |
| Arts, Media & Entertainment | 0 (0.0%) | 0 (0.0%) |
| Health Diagnosing & Treating | 0 (0.0%) | 0 (0.0%) |
| Health Technologists | 0 (0.0%) | 0 (0.0%) |
| Total (Category) | 7 (30.4%) | 16 (69.6%) |
| Total (Overall) | 36 (45.6%) | 43 (54.4%) |
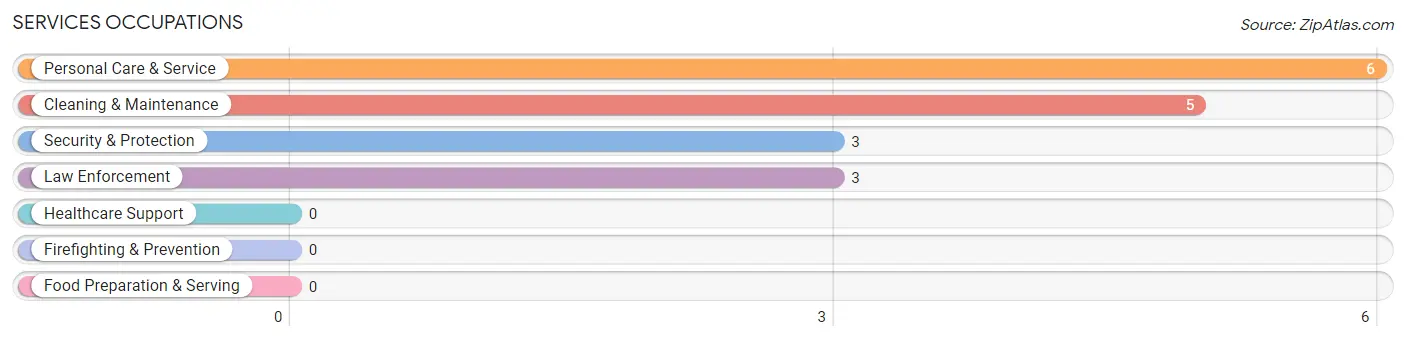
Services Occupations
The most common Services occupations in Ruby are Personal Care & Service (6 | 7.6%), Cleaning & Maintenance (5 | 6.3%), Security & Protection (3 | 3.8%), and Law Enforcement (3 | 3.8%).
Services Occupations by Sex
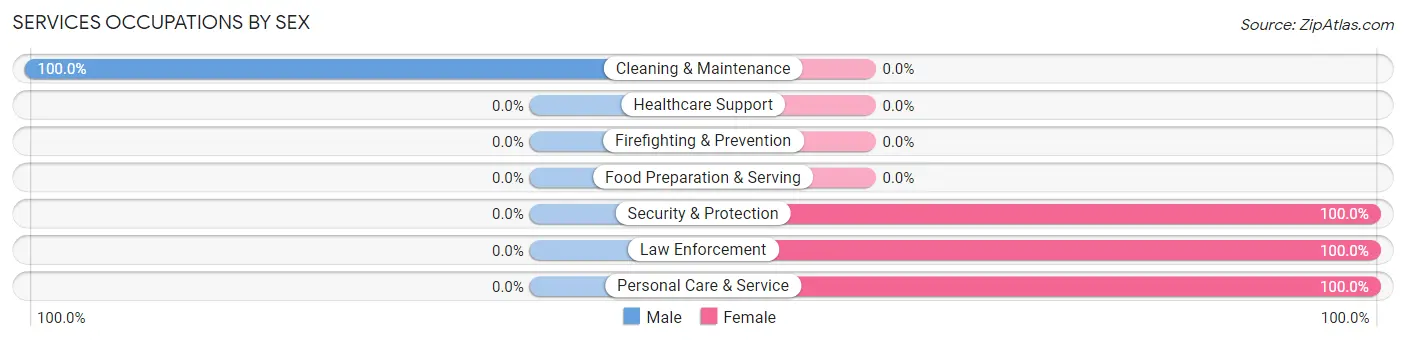
| Occupation | Male | Female |
| Healthcare Support | 0 (0.0%) | 0 (0.0%) |
| Security & Protection | 0 (0.0%) | 3 (100.0%) |
| Firefighting & Prevention | 0 (0.0%) | 0 (0.0%) |
| Law Enforcement | 0 (0.0%) | 3 (100.0%) |
| Food Preparation & Serving | 0 (0.0%) | 0 (0.0%) |
| Cleaning & Maintenance | 5 (100.0%) | 0 (0.0%) |
| Personal Care & Service | 0 (0.0%) | 6 (100.0%) |
| Total (Category) | 5 (35.7%) | 9 (64.3%) |
| Total (Overall) | 36 (45.6%) | 43 (54.4%) |
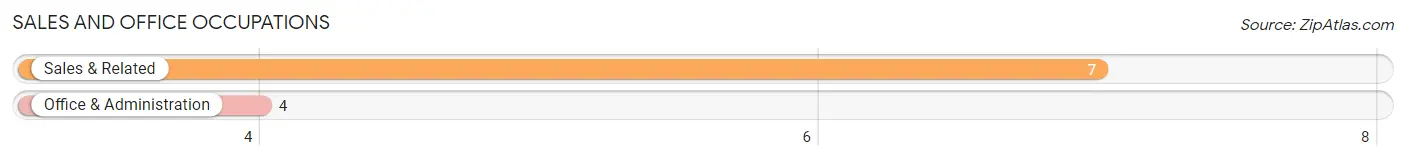
Sales and Office Occupations
The most common Sales and Office occupations in Ruby are Sales & Related (7 | 8.9%), and Office & Administration (4 | 5.1%).
Sales and Office Occupations by Sex
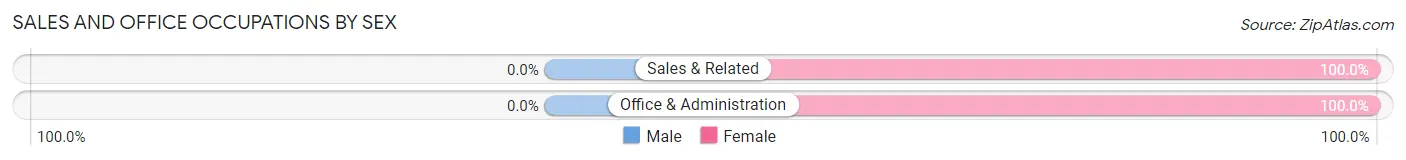
| Occupation | Male | Female |
| Sales & Related | 0 (0.0%) | 7 (100.0%) |
| Office & Administration | 0 (0.0%) | 4 (100.0%) |
| Total (Category) | 0 (0.0%) | 11 (100.0%) |
| Total (Overall) | 36 (45.6%) | 43 (54.4%) |
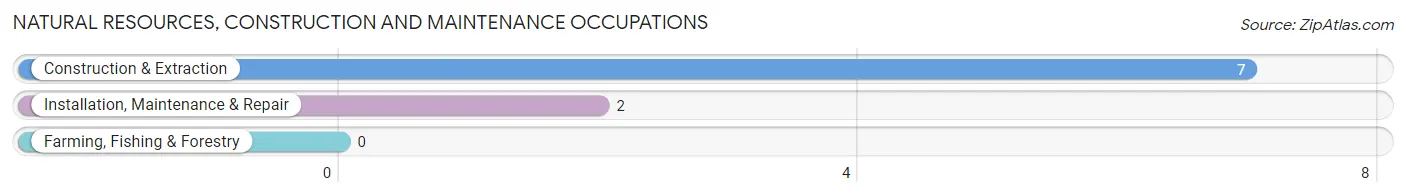
Natural Resources, Construction and Maintenance Occupations
The most common Natural Resources, Construction and Maintenance occupations in Ruby are Construction & Extraction (7 | 8.9%), and Installation, Maintenance & Repair (2 | 2.5%).
Natural Resources, Construction and Maintenance Occupations by Sex
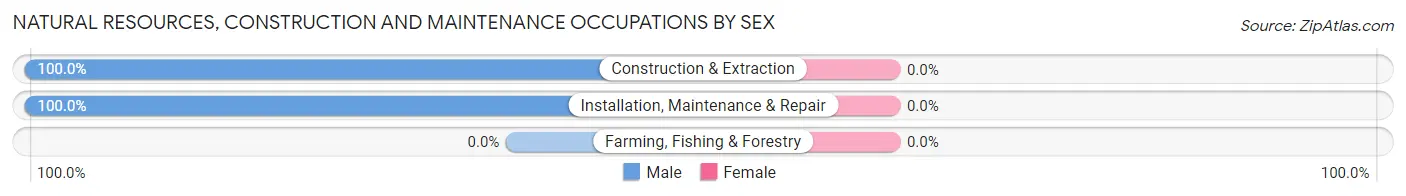
| Occupation | Male | Female |
| Farming, Fishing & Forestry | 0 (0.0%) | 0 (0.0%) |
| Construction & Extraction | 7 (100.0%) | 0 (0.0%) |
| Installation, Maintenance & Repair | 2 (100.0%) | 0 (0.0%) |
| Total (Category) | 9 (100.0%) | 0 (0.0%) |
| Total (Overall) | 36 (45.6%) | 43 (54.4%) |
Production, Transportation and Moving Occupations
The most common Production, Transportation and Moving occupations in Ruby are Production (15 | 19.0%), and Material Moving (7 | 8.9%).
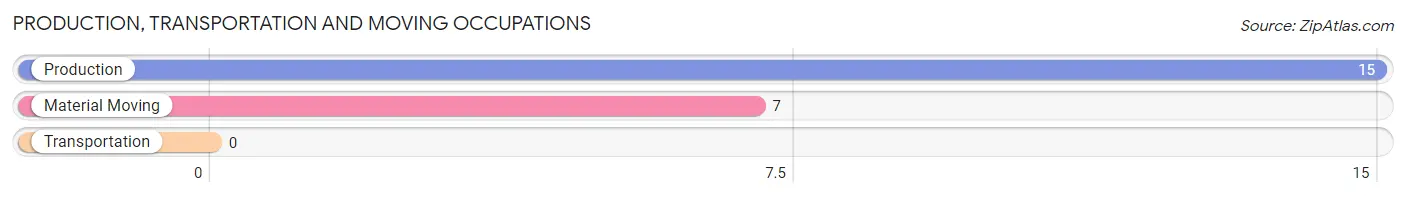
Production, Transportation and Moving Occupations by Sex
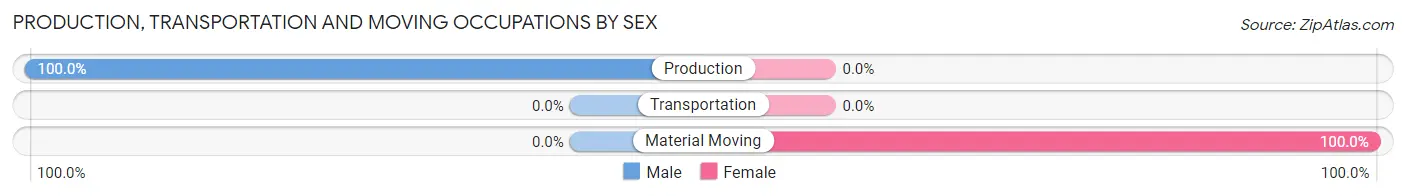
| Occupation | Male | Female |
| Production | 15 (100.0%) | 0 (0.0%) |
| Transportation | 0 (0.0%) | 0 (0.0%) |
| Material Moving | 0 (0.0%) | 7 (100.0%) |
| Total (Category) | 15 (68.2%) | 7 (31.8%) |
| Total (Overall) | 36 (45.6%) | 43 (54.4%) |
Employment Industries by Sex in Ruby
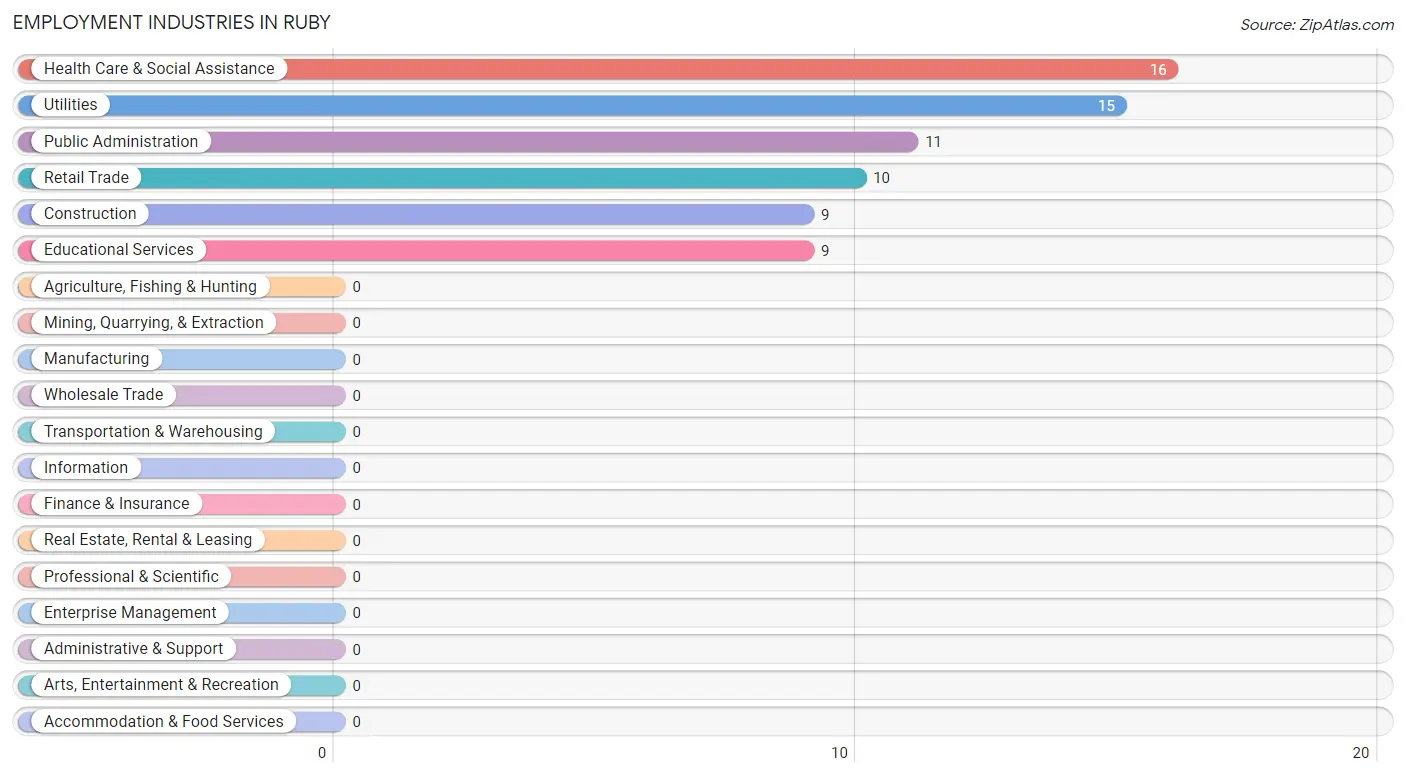
Employment Industries in Ruby
The major employment industries in Ruby include Health Care & Social Assistance (16 | 20.3%), Utilities (15 | 19.0%), Public Administration (11 | 13.9%), Retail Trade (10 | 12.7%), and Construction (9 | 11.4%).
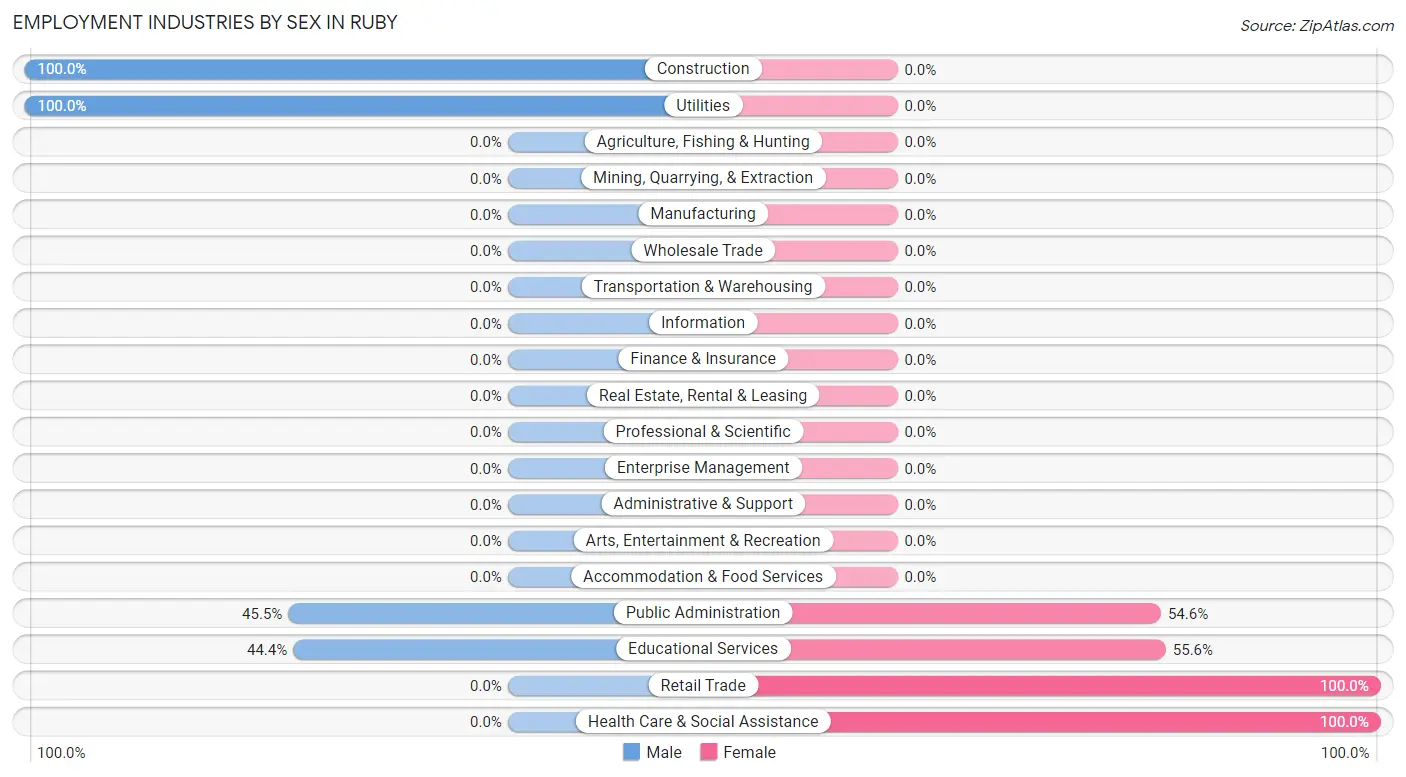
Employment Industries by Sex in Ruby
The Ruby industries that see more men than women are Construction (100.0%), Utilities (100.0%), and Public Administration (45.5%), whereas the industries that tend to have a higher number of women are Retail Trade (100.0%), Health Care & Social Assistance (100.0%), and Educational Services (55.6%).
| Industry | Male | Female |
| Agriculture, Fishing & Hunting | 0 (0.0%) | 0 (0.0%) |
| Mining, Quarrying, & Extraction | 0 (0.0%) | 0 (0.0%) |
| Construction | 9 (100.0%) | 0 (0.0%) |
| Manufacturing | 0 (0.0%) | 0 (0.0%) |
| Wholesale Trade | 0 (0.0%) | 0 (0.0%) |
| Retail Trade | 0 (0.0%) | 10 (100.0%) |
| Transportation & Warehousing | 0 (0.0%) | 0 (0.0%) |
| Utilities | 15 (100.0%) | 0 (0.0%) |
| Information | 0 (0.0%) | 0 (0.0%) |
| Finance & Insurance | 0 (0.0%) | 0 (0.0%) |
| Real Estate, Rental & Leasing | 0 (0.0%) | 0 (0.0%) |
| Professional & Scientific | 0 (0.0%) | 0 (0.0%) |
| Enterprise Management | 0 (0.0%) | 0 (0.0%) |
| Administrative & Support | 0 (0.0%) | 0 (0.0%) |
| Educational Services | 4 (44.4%) | 5 (55.6%) |
| Health Care & Social Assistance | 0 (0.0%) | 16 (100.0%) |
| Arts, Entertainment & Recreation | 0 (0.0%) | 0 (0.0%) |
| Accommodation & Food Services | 0 (0.0%) | 0 (0.0%) |
| Public Administration | 5 (45.5%) | 6 (54.5%) |
| Total | 36 (45.6%) | 43 (54.4%) |
Education in Ruby
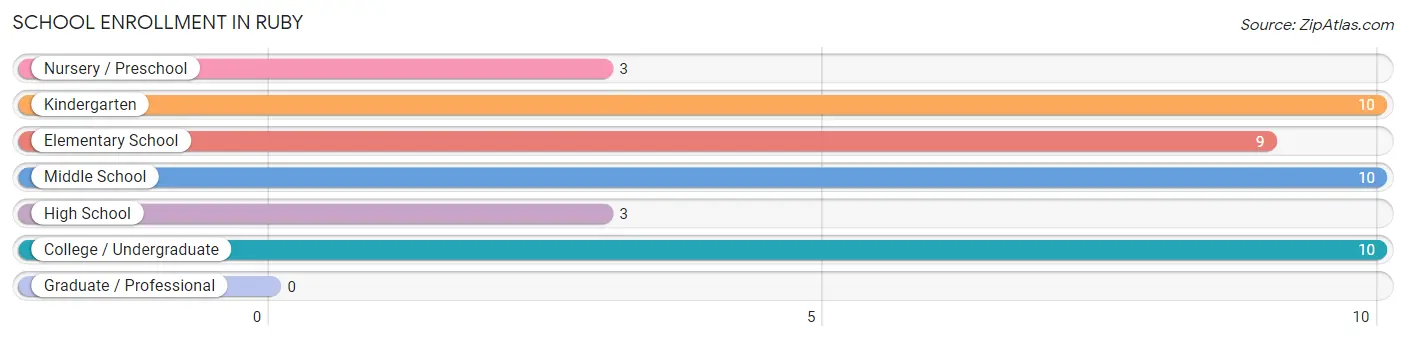
School Enrollment in Ruby
The most common levels of schooling among the 45 students in Ruby are kindergarten (10 | 22.2%), middle school (10 | 22.2%), and college / undergraduate (10 | 22.2%).
| School Level | # Students | % Students |
| Nursery / Preschool | 3 | 6.7% |
| Kindergarten | 10 | 22.2% |
| Elementary School | 9 | 20.0% |
| Middle School | 10 | 22.2% |
| High School | 3 | 6.7% |
| College / Undergraduate | 10 | 22.2% |
| Graduate / Professional | 0 | 0.0% |
| Total | 45 | 100.0% |
School Enrollment by Age by Funding Source in Ruby
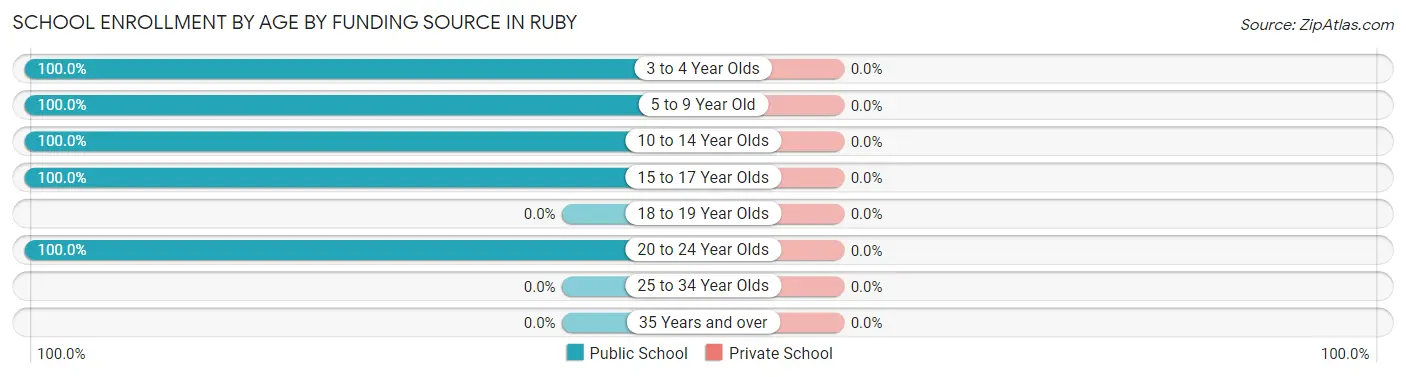
| Age Bracket | Public School | Private School |
| 3 to 4 Year Olds | 3 (100.0%) | 0 (0.0%) |
| 5 to 9 Year Old | 19 (100.0%) | 0 (0.0%) |
| 10 to 14 Year Olds | 10 (100.0%) | 0 (0.0%) |
| 15 to 17 Year Olds | 3 (100.0%) | 0 (0.0%) |
| 18 to 19 Year Olds | 0 (0.0%) | 0 (0.0%) |
| 20 to 24 Year Olds | 10 (100.0%) | 0 (0.0%) |
| 25 to 34 Year Olds | 0 (0.0%) | 0 (0.0%) |
| 35 Years and over | 0 (0.0%) | 0 (0.0%) |
| Total | 45 (100.0%) | 0 (0.0%) |
Educational Attainment by Field of Study in Ruby
Business (3 | 75.0%), and communications (1 | 25.0%) are the most common fields of study among 4 individuals in Ruby who have obtained a bachelor's degree or higher.
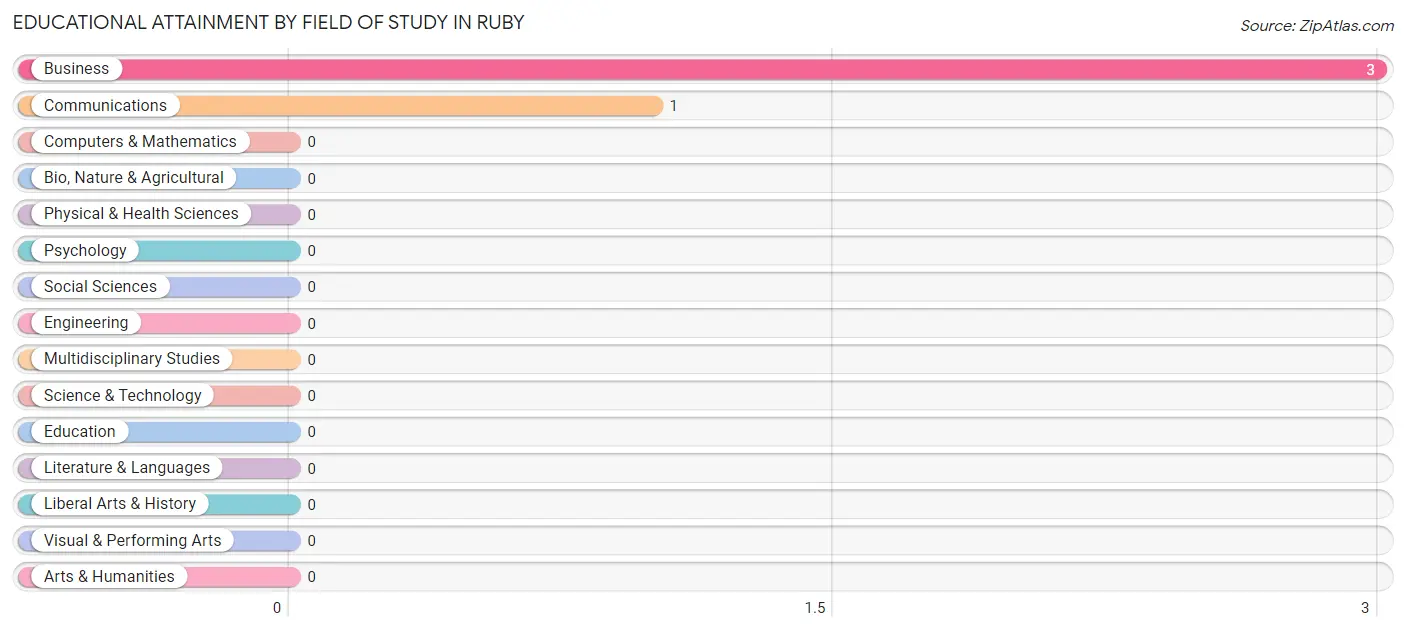
| Field of Study | # Graduates | % Graduates |
| Computers & Mathematics | 0 | 0.0% |
| Bio, Nature & Agricultural | 0 | 0.0% |
| Physical & Health Sciences | 0 | 0.0% |
| Psychology | 0 | 0.0% |
| Social Sciences | 0 | 0.0% |
| Engineering | 0 | 0.0% |
| Multidisciplinary Studies | 0 | 0.0% |
| Science & Technology | 0 | 0.0% |
| Business | 3 | 75.0% |
| Education | 0 | 0.0% |
| Literature & Languages | 0 | 0.0% |
| Liberal Arts & History | 0 | 0.0% |
| Visual & Performing Arts | 0 | 0.0% |
| Communications | 1 | 25.0% |
| Arts & Humanities | 0 | 0.0% |
| Total | 4 | 100.0% |
Transportation & Commute in Ruby
Vehicle Availability by Sex in Ruby
The most prevalent vehicle ownership categories in Ruby are males with 1 vehicle (22, accounting for 61.1%) and females with 1 vehicle (11, making up 51.2%).
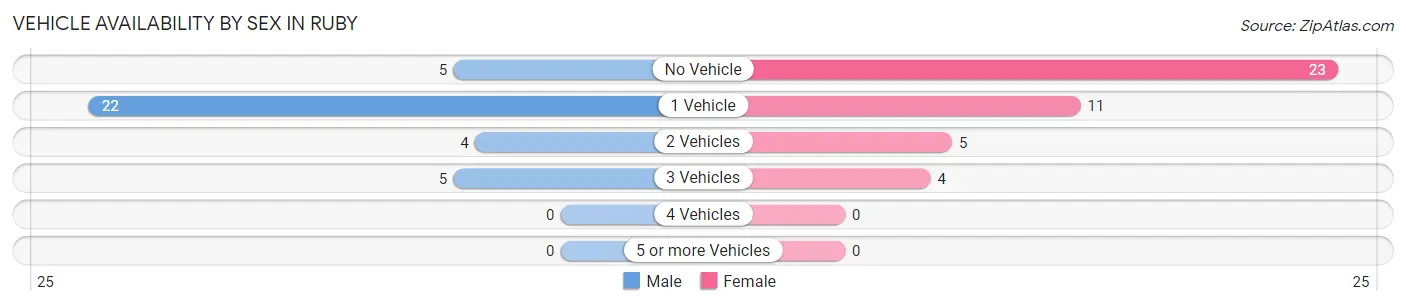
| Vehicles Available | Male | Female |
| No Vehicle | 5 (13.9%) | 23 (53.5%) |
| 1 Vehicle | 22 (61.1%) | 11 (25.6%) |
| 2 Vehicles | 4 (11.1%) | 5 (11.6%) |
| 3 Vehicles | 5 (13.9%) | 4 (9.3%) |
| 4 Vehicles | 0 (0.0%) | 0 (0.0%) |
| 5 or more Vehicles | 0 (0.0%) | 0 (0.0%) |
| Total | 36 (100.0%) | 43 (100.0%) |
Commute Time in Ruby
The most frequently occuring commute durations in Ruby are less than 5 minutes (24 commuters, 34.8%), 5 to 9 minutes (15 commuters, 21.7%), and 15 to 19 minutes (15 commuters, 21.7%).
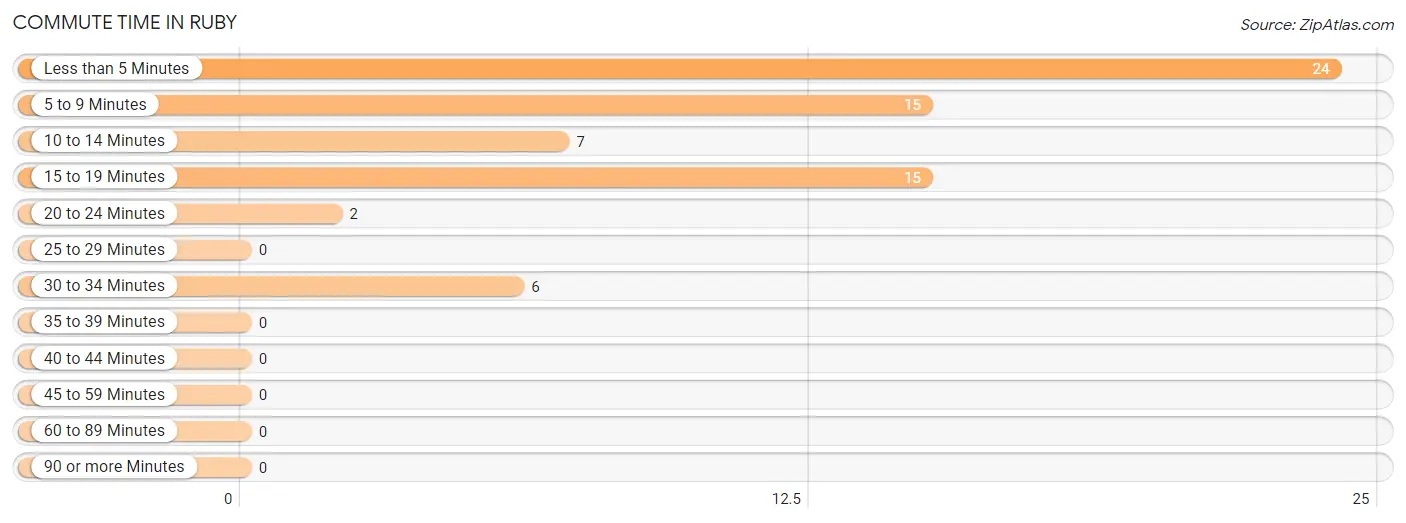
| Commute Time | # Commuters | % Commuters |
| Less than 5 Minutes | 24 | 34.8% |
| 5 to 9 Minutes | 15 | 21.7% |
| 10 to 14 Minutes | 7 | 10.1% |
| 15 to 19 Minutes | 15 | 21.7% |
| 20 to 24 Minutes | 2 | 2.9% |
| 25 to 29 Minutes | 0 | 0.0% |
| 30 to 34 Minutes | 6 | 8.7% |
| 35 to 39 Minutes | 0 | 0.0% |
| 40 to 44 Minutes | 0 | 0.0% |
| 45 to 59 Minutes | 0 | 0.0% |
| 60 to 89 Minutes | 0 | 0.0% |
| 90 or more Minutes | 0 | 0.0% |
Commute Time by Sex in Ruby
The most common commute times in Ruby are 15 to 19 minutes (15 commuters, 45.5%) for males and less than 5 minutes (17 commuters, 47.2%) for females.
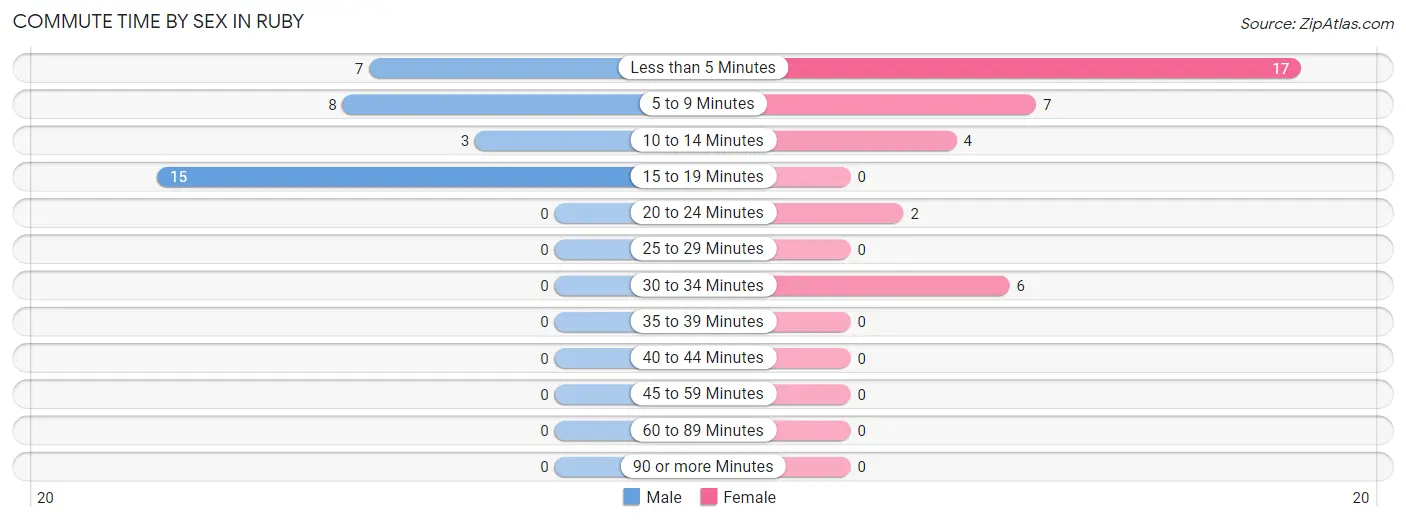
| Commute Time | Male | Female |
| Less than 5 Minutes | 7 (21.2%) | 17 (47.2%) |
| 5 to 9 Minutes | 8 (24.2%) | 7 (19.4%) |
| 10 to 14 Minutes | 3 (9.1%) | 4 (11.1%) |
| 15 to 19 Minutes | 15 (45.5%) | 0 (0.0%) |
| 20 to 24 Minutes | 0 (0.0%) | 2 (5.6%) |
| 25 to 29 Minutes | 0 (0.0%) | 0 (0.0%) |
| 30 to 34 Minutes | 0 (0.0%) | 6 (16.7%) |
| 35 to 39 Minutes | 0 (0.0%) | 0 (0.0%) |
| 40 to 44 Minutes | 0 (0.0%) | 0 (0.0%) |
| 45 to 59 Minutes | 0 (0.0%) | 0 (0.0%) |
| 60 to 89 Minutes | 0 (0.0%) | 0 (0.0%) |
| 90 or more Minutes | 0 (0.0%) | 0 (0.0%) |
Time of Departure to Work by Sex in Ruby
The most frequent times of departure to work in Ruby are 9:00 AM to 9:59 AM (15, 45.5%) for males and 8:30 AM to 8:59 AM (11, 30.6%) for females.
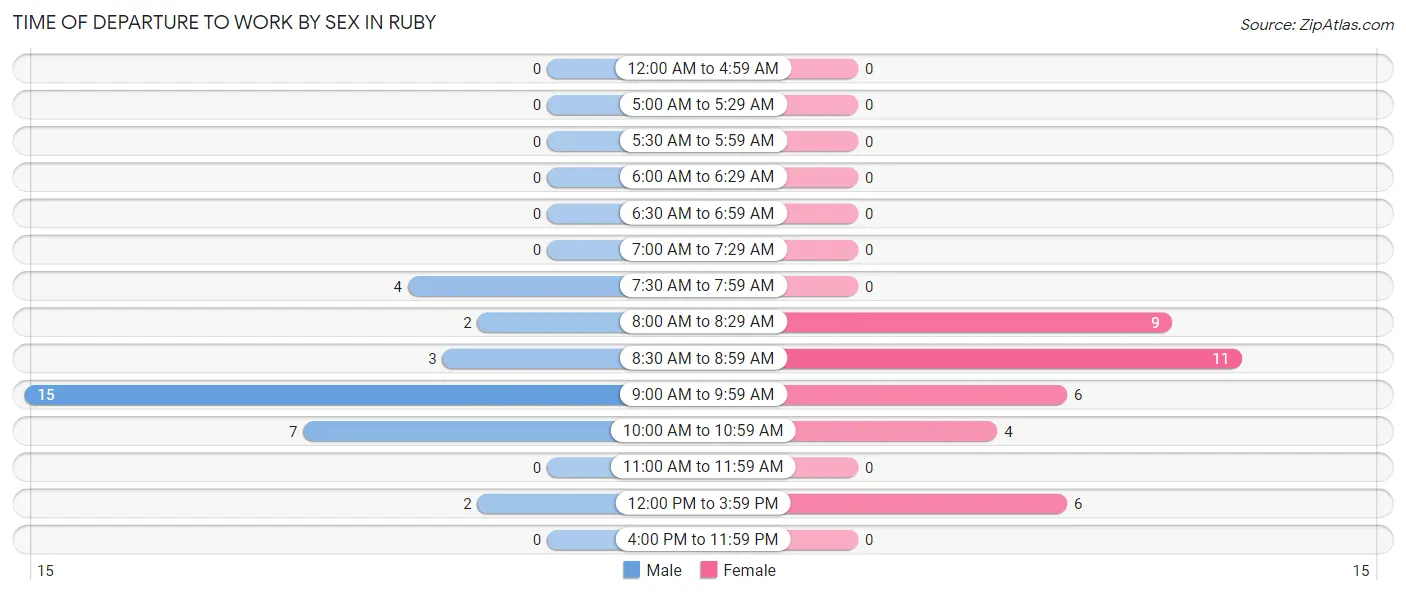
| Time of Departure | Male | Female |
| 12:00 AM to 4:59 AM | 0 (0.0%) | 0 (0.0%) |
| 5:00 AM to 5:29 AM | 0 (0.0%) | 0 (0.0%) |
| 5:30 AM to 5:59 AM | 0 (0.0%) | 0 (0.0%) |
| 6:00 AM to 6:29 AM | 0 (0.0%) | 0 (0.0%) |
| 6:30 AM to 6:59 AM | 0 (0.0%) | 0 (0.0%) |
| 7:00 AM to 7:29 AM | 0 (0.0%) | 0 (0.0%) |
| 7:30 AM to 7:59 AM | 4 (12.1%) | 0 (0.0%) |
| 8:00 AM to 8:29 AM | 2 (6.1%) | 9 (25.0%) |
| 8:30 AM to 8:59 AM | 3 (9.1%) | 11 (30.6%) |
| 9:00 AM to 9:59 AM | 15 (45.5%) | 6 (16.7%) |
| 10:00 AM to 10:59 AM | 7 (21.2%) | 4 (11.1%) |
| 11:00 AM to 11:59 AM | 0 (0.0%) | 0 (0.0%) |
| 12:00 PM to 3:59 PM | 2 (6.1%) | 6 (16.7%) |
| 4:00 PM to 11:59 PM | 0 (0.0%) | 0 (0.0%) |
| Total | 33 (100.0%) | 36 (100.0%) |
Housing Occupancy in Ruby
Occupancy by Ownership in Ruby
Of the total 70 dwellings in Ruby, owner-occupied units account for 57 (81.4%), while renter-occupied units make up 13 (18.6%).
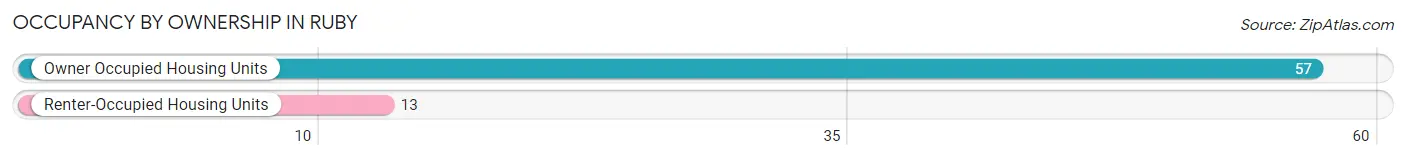
| Occupancy | # Housing Units | % Housing Units |
| Owner Occupied Housing Units | 57 | 81.4% |
| Renter-Occupied Housing Units | 13 | 18.6% |
| Total Occupied Housing Units | 70 | 100.0% |
Occupancy by Household Size in Ruby
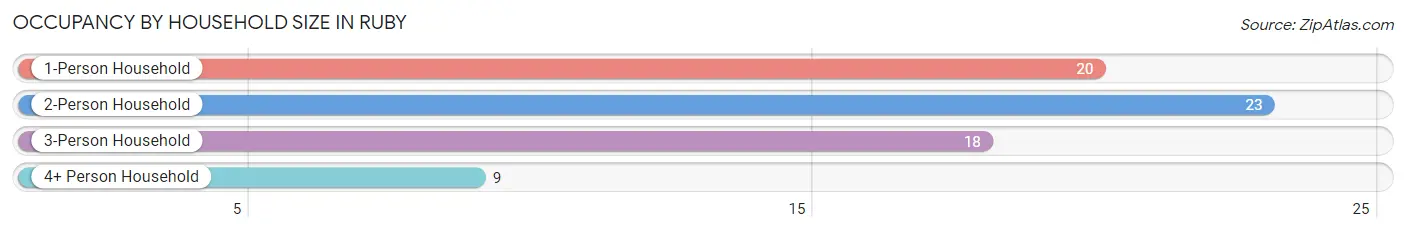
| Household Size | # Housing Units | % Housing Units |
| 1-Person Household | 20 | 28.6% |
| 2-Person Household | 23 | 32.9% |
| 3-Person Household | 18 | 25.7% |
| 4+ Person Household | 9 | 12.9% |
| Total Housing Units | 70 | 100.0% |
Occupancy by Ownership by Household Size in Ruby
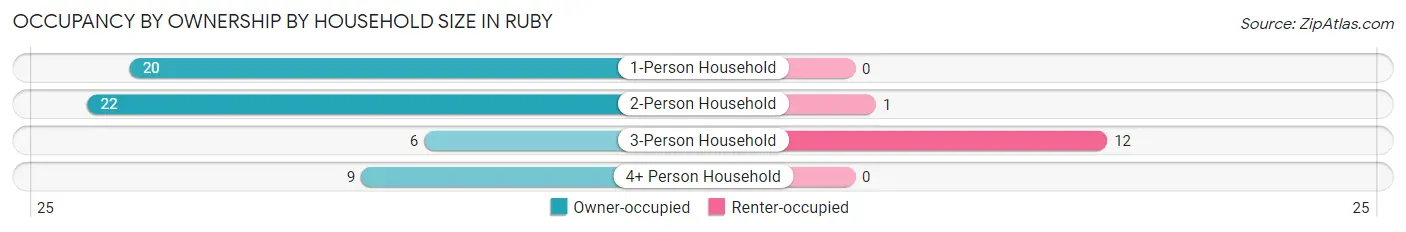
| Household Size | Owner-occupied | Renter-occupied |
| 1-Person Household | 20 (100.0%) | 0 (0.0%) |
| 2-Person Household | 22 (95.7%) | 1 (4.3%) |
| 3-Person Household | 6 (33.3%) | 12 (66.7%) |
| 4+ Person Household | 9 (100.0%) | 0 (0.0%) |
| Total Housing Units | 57 (81.4%) | 13 (18.6%) |
Occupancy by Educational Attainment in Ruby
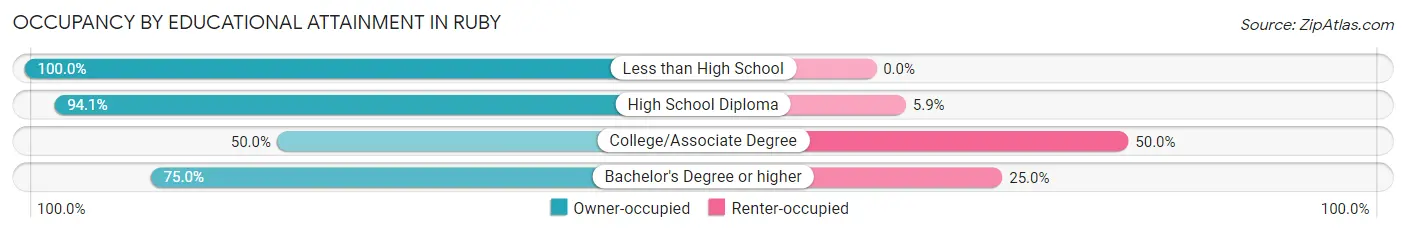
| Household Size | Owner-occupied | Renter-occupied |
| Less than High School | 12 (100.0%) | 0 (0.0%) |
| High School Diploma | 32 (94.1%) | 2 (5.9%) |
| College/Associate Degree | 10 (50.0%) | 10 (50.0%) |
| Bachelor's Degree or higher | 3 (75.0%) | 1 (25.0%) |
Occupancy by Age of Householder in Ruby
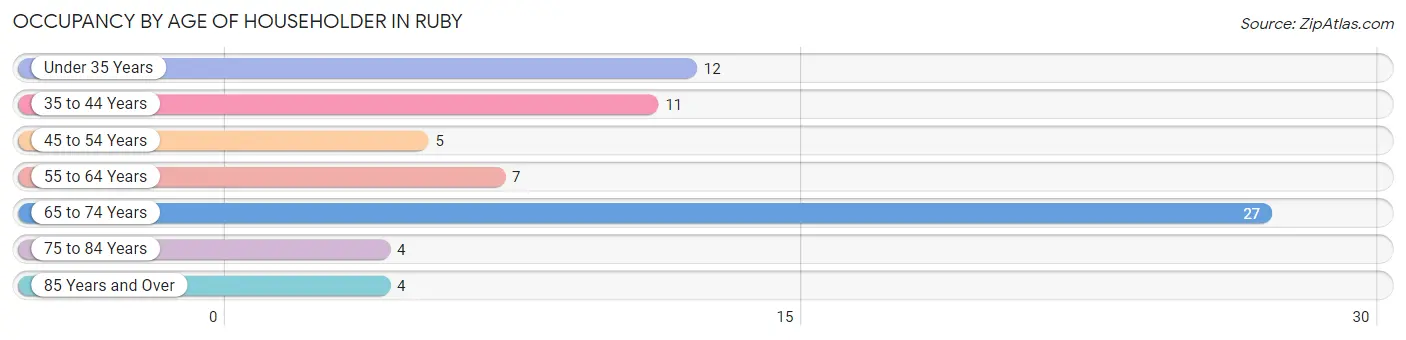
| Age Bracket | # Households | % Households |
| Under 35 Years | 12 | 17.1% |
| 35 to 44 Years | 11 | 15.7% |
| 45 to 54 Years | 5 | 7.1% |
| 55 to 64 Years | 7 | 10.0% |
| 65 to 74 Years | 27 | 38.6% |
| 75 to 84 Years | 4 | 5.7% |
| 85 Years and Over | 4 | 5.7% |
| Total | 70 | 100.0% |
Housing Finances in Ruby
Median Income by Occupancy in Ruby

| Occupancy Type | # Households | Median Income |
| Owner-Occupied | 57 (81.4%) | $27,250 |
| Renter-Occupied | 13 (18.6%) | $60,875 |
| Average | 70 (100.0%) | $32,500 |
Occupancy by Householder Income Bracket in Ruby
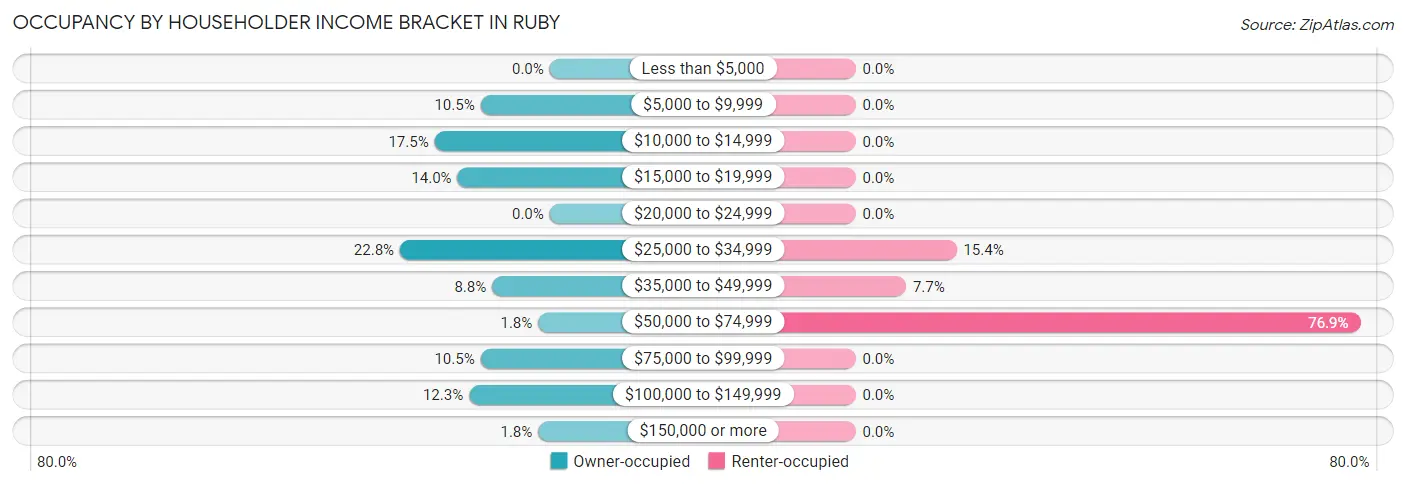
| Income Bracket | Owner-occupied | Renter-occupied |
| Less than $5,000 | 0 (0.0%) | 0 (0.0%) |
| $5,000 to $9,999 | 6 (10.5%) | 0 (0.0%) |
| $10,000 to $14,999 | 10 (17.5%) | 0 (0.0%) |
| $15,000 to $19,999 | 8 (14.0%) | 0 (0.0%) |
| $20,000 to $24,999 | 0 (0.0%) | 0 (0.0%) |
| $25,000 to $34,999 | 13 (22.8%) | 2 (15.4%) |
| $35,000 to $49,999 | 5 (8.8%) | 1 (7.7%) |
| $50,000 to $74,999 | 1 (1.8%) | 10 (76.9%) |
| $75,000 to $99,999 | 6 (10.5%) | 0 (0.0%) |
| $100,000 to $149,999 | 7 (12.3%) | 0 (0.0%) |
| $150,000 or more | 1 (1.8%) | 0 (0.0%) |
| Total | 57 (100.0%) | 13 (100.0%) |
Monthly Housing Cost Tiers in Ruby
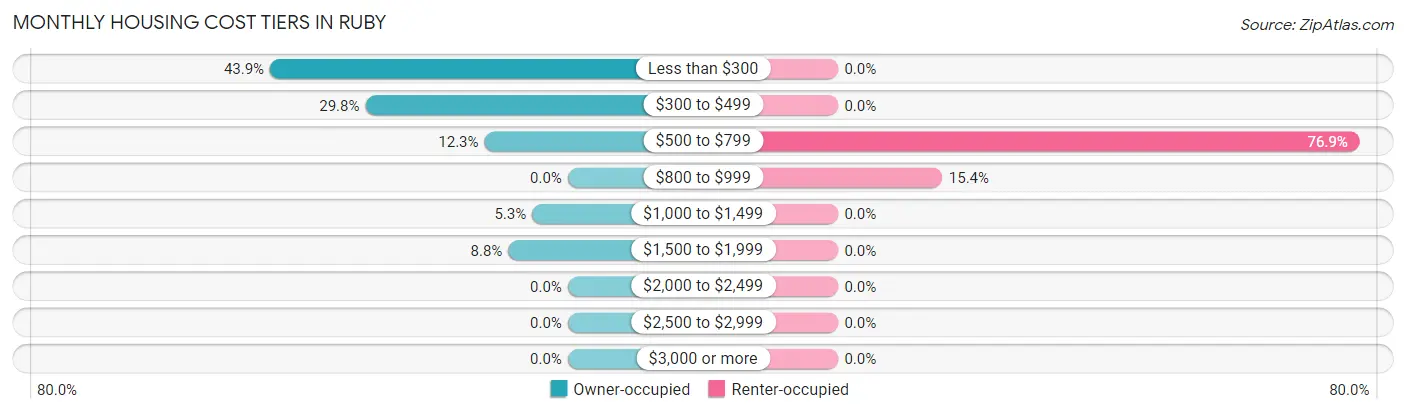
| Monthly Cost | Owner-occupied | Renter-occupied |
| Less than $300 | 25 (43.9%) | 0 (0.0%) |
| $300 to $499 | 17 (29.8%) | 0 (0.0%) |
| $500 to $799 | 7 (12.3%) | 10 (76.9%) |
| $800 to $999 | 0 (0.0%) | 2 (15.4%) |
| $1,000 to $1,499 | 3 (5.3%) | 0 (0.0%) |
| $1,500 to $1,999 | 5 (8.8%) | 0 (0.0%) |
| $2,000 to $2,499 | 0 (0.0%) | 0 (0.0%) |
| $2,500 to $2,999 | 0 (0.0%) | 0 (0.0%) |
| $3,000 or more | 0 (0.0%) | 0 (0.0%) |
| Total | 57 (100.0%) | 13 (100.0%) |
Physical Housing Characteristics in Ruby
Housing Structures in Ruby
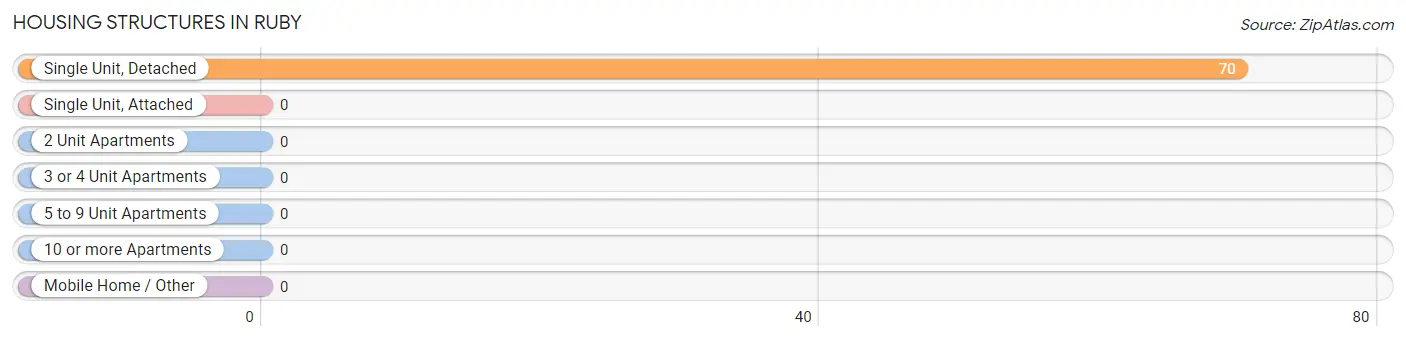
| Structure Type | # Housing Units | % Housing Units |
| Single Unit, Detached | 70 | 100.0% |
| Single Unit, Attached | 0 | 0.0% |
| 2 Unit Apartments | 0 | 0.0% |
| 3 or 4 Unit Apartments | 0 | 0.0% |
| 5 to 9 Unit Apartments | 0 | 0.0% |
| 10 or more Apartments | 0 | 0.0% |
| Mobile Home / Other | 0 | 0.0% |
| Total | 70 | 100.0% |
Housing Structures by Occupancy in Ruby
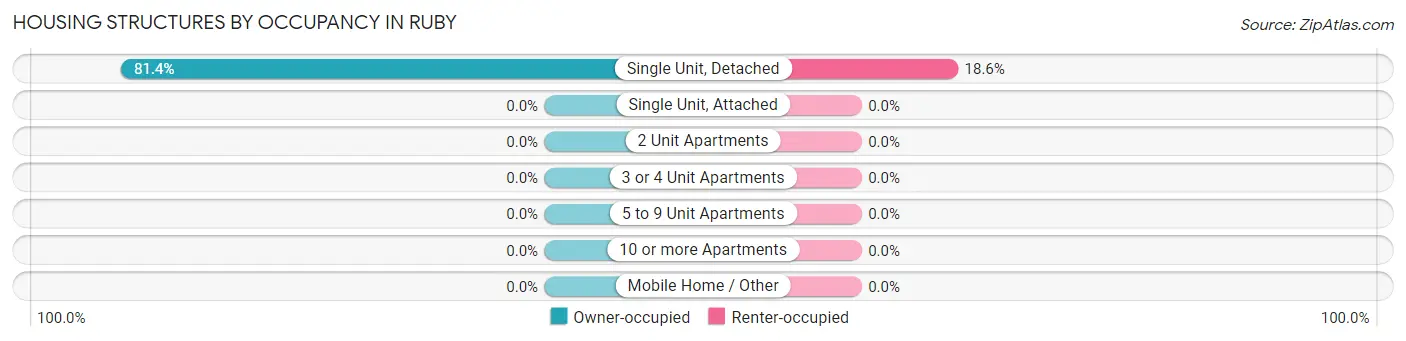
| Structure Type | Owner-occupied | Renter-occupied |
| Single Unit, Detached | 57 (81.4%) | 13 (18.6%) |
| Single Unit, Attached | 0 (0.0%) | 0 (0.0%) |
| 2 Unit Apartments | 0 (0.0%) | 0 (0.0%) |
| 3 or 4 Unit Apartments | 0 (0.0%) | 0 (0.0%) |
| 5 to 9 Unit Apartments | 0 (0.0%) | 0 (0.0%) |
| 10 or more Apartments | 0 (0.0%) | 0 (0.0%) |
| Mobile Home / Other | 0 (0.0%) | 0 (0.0%) |
| Total | 57 (81.4%) | 13 (18.6%) |
Housing Structures by Number of Rooms in Ruby
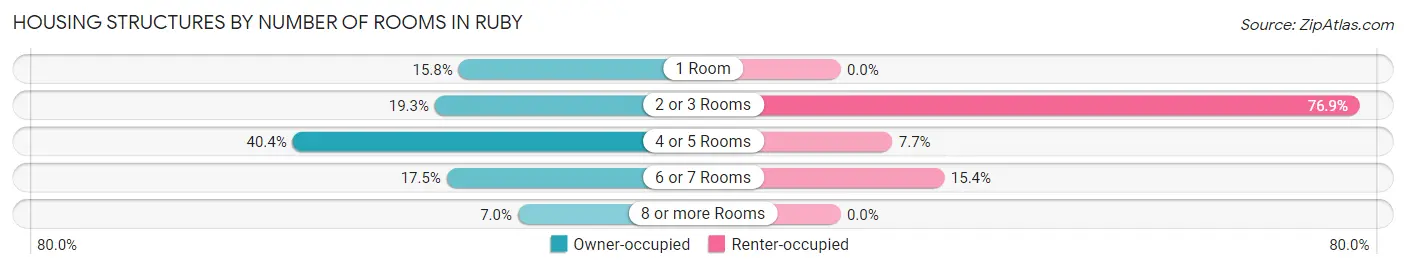
| Number of Rooms | Owner-occupied | Renter-occupied |
| 1 Room | 9 (15.8%) | 0 (0.0%) |
| 2 or 3 Rooms | 11 (19.3%) | 10 (76.9%) |
| 4 or 5 Rooms | 23 (40.4%) | 1 (7.7%) |
| 6 or 7 Rooms | 10 (17.5%) | 2 (15.4%) |
| 8 or more Rooms | 4 (7.0%) | 0 (0.0%) |
| Total | 57 (100.0%) | 13 (100.0%) |
Housing Structure by Heating Type in Ruby
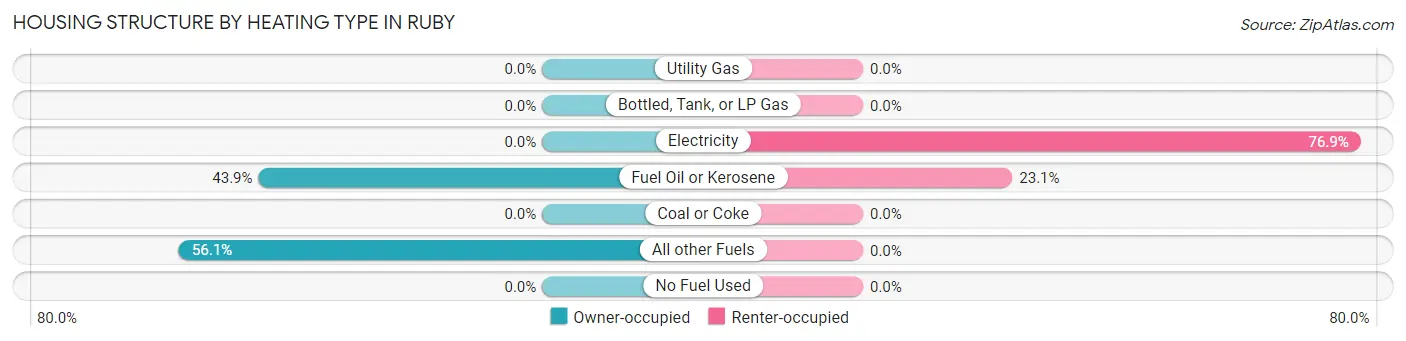
| Heating Type | Owner-occupied | Renter-occupied |
| Utility Gas | 0 (0.0%) | 0 (0.0%) |
| Bottled, Tank, or LP Gas | 0 (0.0%) | 0 (0.0%) |
| Electricity | 0 (0.0%) | 10 (76.9%) |
| Fuel Oil or Kerosene | 25 (43.9%) | 3 (23.1%) |
| Coal or Coke | 0 (0.0%) | 0 (0.0%) |
| All other Fuels | 32 (56.1%) | 0 (0.0%) |
| No Fuel Used | 0 (0.0%) | 0 (0.0%) |
| Total | 57 (100.0%) | 13 (100.0%) |
Household Vehicle Usage in Ruby
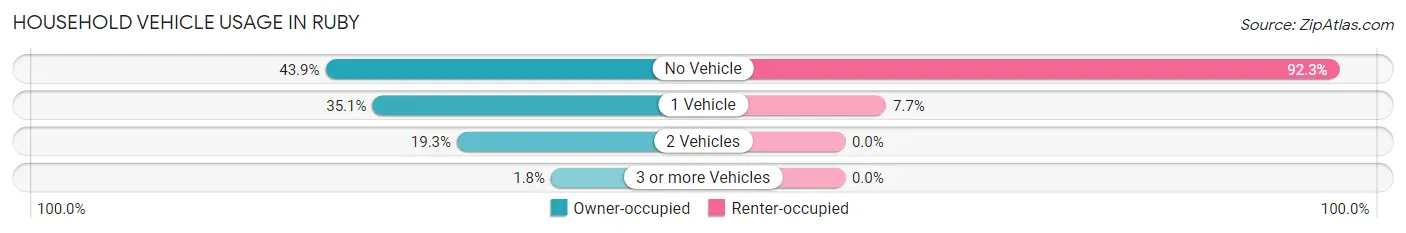
| Vehicles per Household | Owner-occupied | Renter-occupied |
| No Vehicle | 25 (43.9%) | 12 (92.3%) |
| 1 Vehicle | 20 (35.1%) | 1 (7.7%) |
| 2 Vehicles | 11 (19.3%) | 0 (0.0%) |
| 3 or more Vehicles | 1 (1.8%) | 0 (0.0%) |
| Total | 57 (100.0%) | 13 (100.0%) |
Real Estate & Mortgages in Ruby
Real Estate and Mortgage Overview in Ruby
| Characteristic | Without Mortgage | With Mortgage |
| Housing Units | 47 | 10 |
| Median Property Value | $56,300 | $0 |
| Median Household Income | $26,750 | $1 |
| Monthly Housing Costs | $294 | $0 |
| Real Estate Taxes | - | - |
Property Value by Mortgage Status in Ruby
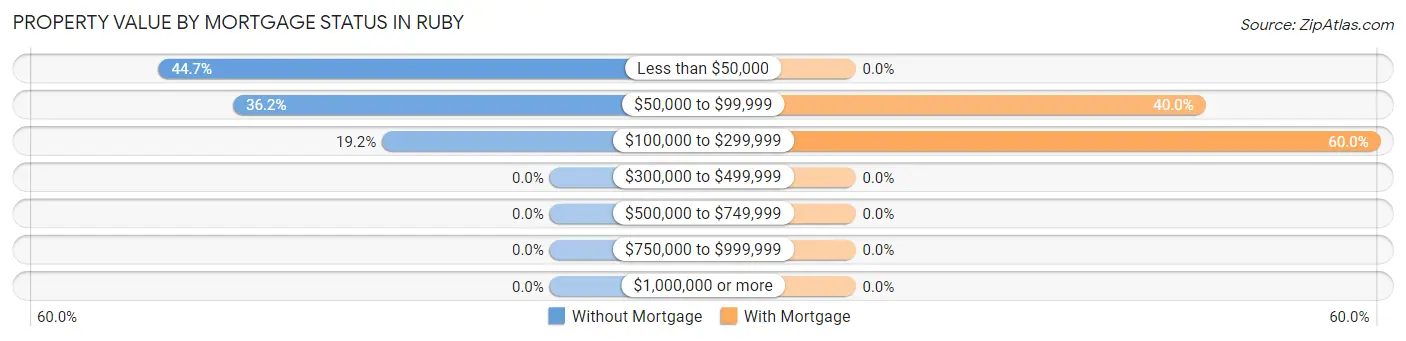
| Property Value | Without Mortgage | With Mortgage |
| Less than $50,000 | 21 (44.7%) | 0 (0.0%) |
| $50,000 to $99,999 | 17 (36.2%) | 4 (40.0%) |
| $100,000 to $299,999 | 9 (19.2%) | 6 (60.0%) |
| $300,000 to $499,999 | 0 (0.0%) | 0 (0.0%) |
| $500,000 to $749,999 | 0 (0.0%) | 0 (0.0%) |
| $750,000 to $999,999 | 0 (0.0%) | 0 (0.0%) |
| $1,000,000 or more | 0 (0.0%) | 0 (0.0%) |
| Total | 47 (100.0%) | 10 (100.0%) |
Household Income by Mortgage Status in Ruby
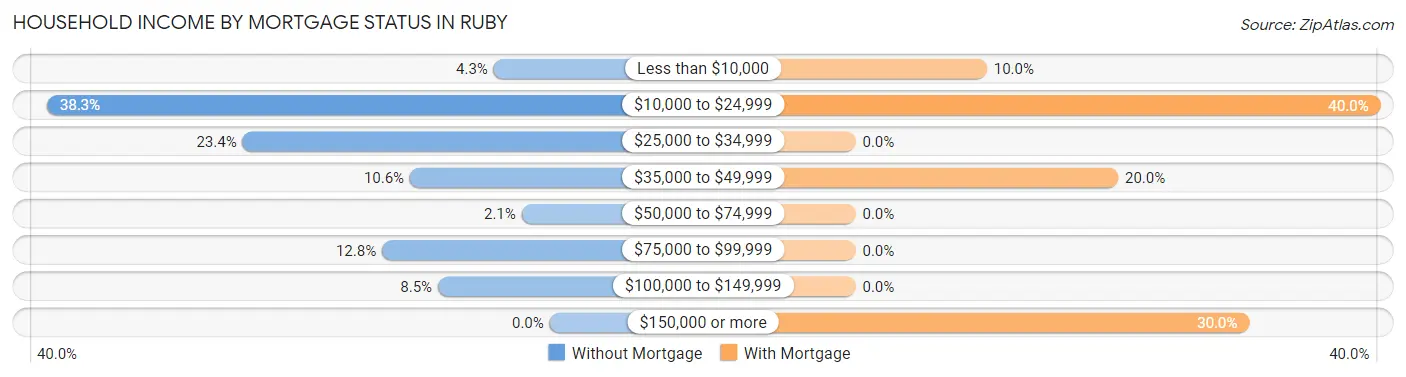
| Household Income | Without Mortgage | With Mortgage |
| Less than $10,000 | 2 (4.3%) | 1 (10.0%) |
| $10,000 to $24,999 | 18 (38.3%) | 4 (40.0%) |
| $25,000 to $34,999 | 11 (23.4%) | 0 (0.0%) |
| $35,000 to $49,999 | 5 (10.6%) | 2 (20.0%) |
| $50,000 to $74,999 | 1 (2.1%) | 0 (0.0%) |
| $75,000 to $99,999 | 6 (12.8%) | 0 (0.0%) |
| $100,000 to $149,999 | 4 (8.5%) | 0 (0.0%) |
| $150,000 or more | 0 (0.0%) | 3 (30.0%) |
| Total | 47 (100.0%) | 10 (100.0%) |
Property Value to Household Income Ratio in Ruby
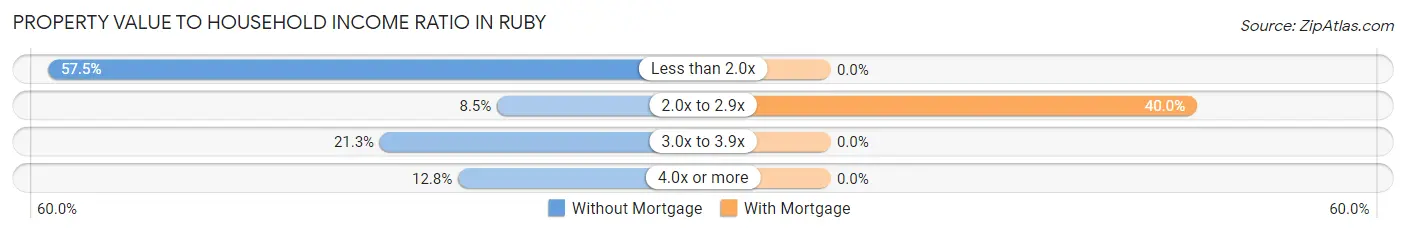
| Value-to-Income Ratio | Without Mortgage | With Mortgage |
| Less than 2.0x | 27 (57.5%) | 0 (0.0%) |
| 2.0x to 2.9x | 4 (8.5%) | 4 (40.0%) |
| 3.0x to 3.9x | 10 (21.3%) | 0 (0.0%) |
| 4.0x or more | 6 (12.8%) | 0 (0.0%) |
| Total | 47 (100.0%) | 10 (100.0%) |
Real Estate Taxes by Mortgage Status in Ruby
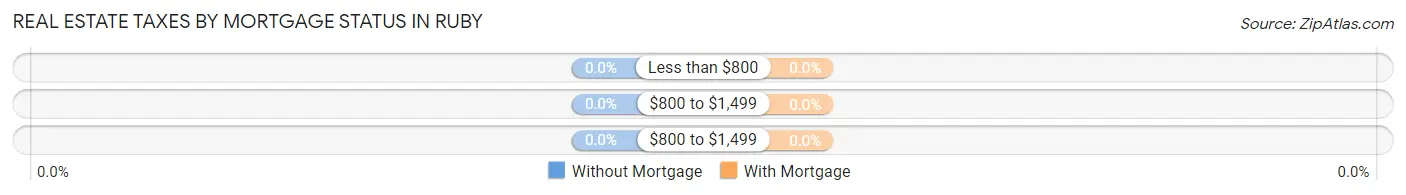
| Property Taxes | Without Mortgage | With Mortgage |
| Less than $800 | 0 (0.0%) | 0 (0.0%) |
| $800 to $1,499 | 0 (0.0%) | 0 (0.0%) |
| $800 to $1,499 | 0 (0.0%) | 0 (0.0%) |
| Total | 47 (100.0%) | 10 (100.0%) |
Health & Disability in Ruby
Health Insurance Coverage by Age in Ruby
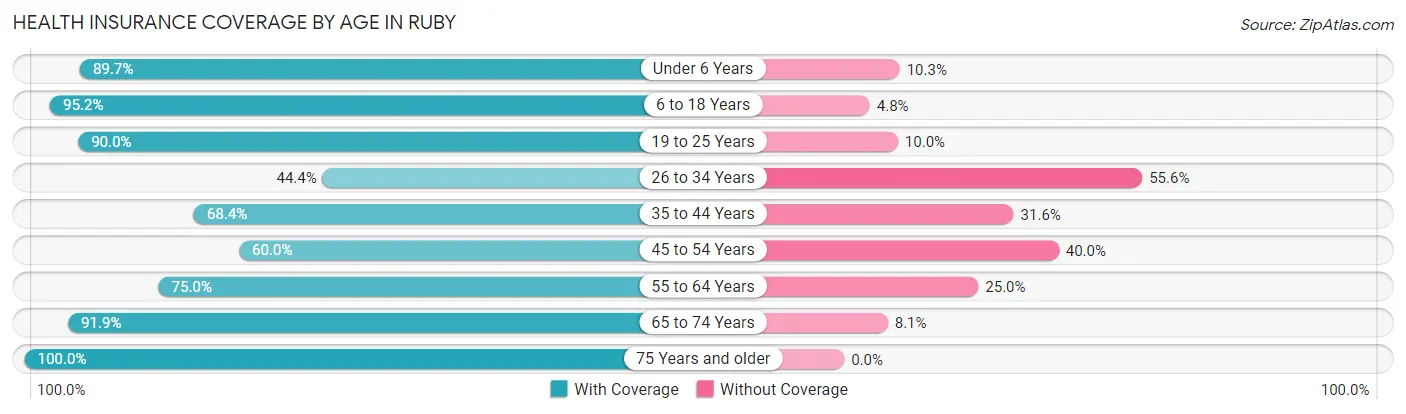
| Age Bracket | With Coverage | Without Coverage |
| Under 6 Years | 26 (89.7%) | 3 (10.3%) |
| 6 to 18 Years | 40 (95.2%) | 2 (4.8%) |
| 19 to 25 Years | 18 (90.0%) | 2 (10.0%) |
| 26 to 34 Years | 4 (44.4%) | 5 (55.6%) |
| 35 to 44 Years | 13 (68.4%) | 6 (31.6%) |
| 45 to 54 Years | 6 (60.0%) | 4 (40.0%) |
| 55 to 64 Years | 12 (75.0%) | 4 (25.0%) |
| 65 to 74 Years | 34 (91.9%) | 3 (8.1%) |
| 75 Years and older | 12 (100.0%) | 0 (0.0%) |
| Total | 165 (85.1%) | 29 (14.9%) |
Health Insurance Coverage by Citizenship Status in Ruby
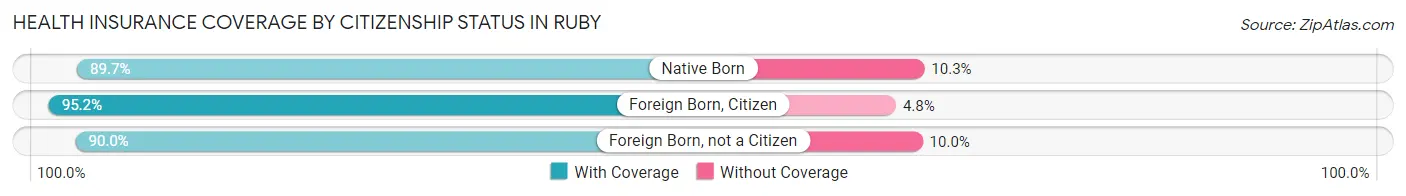
| Citizenship Status | With Coverage | Without Coverage |
| Native Born | 26 (89.7%) | 3 (10.3%) |
| Foreign Born, Citizen | 40 (95.2%) | 2 (4.8%) |
| Foreign Born, not a Citizen | 18 (90.0%) | 2 (10.0%) |
Health Insurance Coverage by Household Income in Ruby
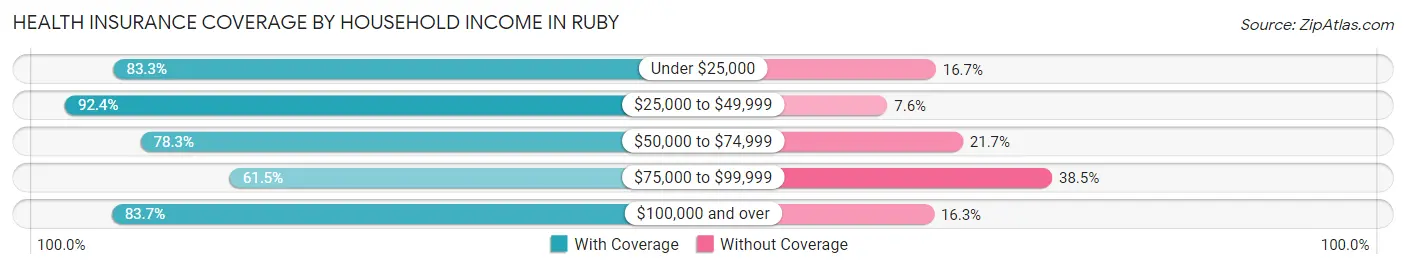
| Household Income | With Coverage | Without Coverage |
| Under $25,000 | 25 (83.3%) | 5 (16.7%) |
| $25,000 to $49,999 | 73 (92.4%) | 6 (7.6%) |
| $50,000 to $74,999 | 18 (78.3%) | 5 (21.7%) |
| $75,000 to $99,999 | 8 (61.5%) | 5 (38.5%) |
| $100,000 and over | 41 (83.7%) | 8 (16.3%) |
Public vs Private Health Insurance Coverage by Age in Ruby
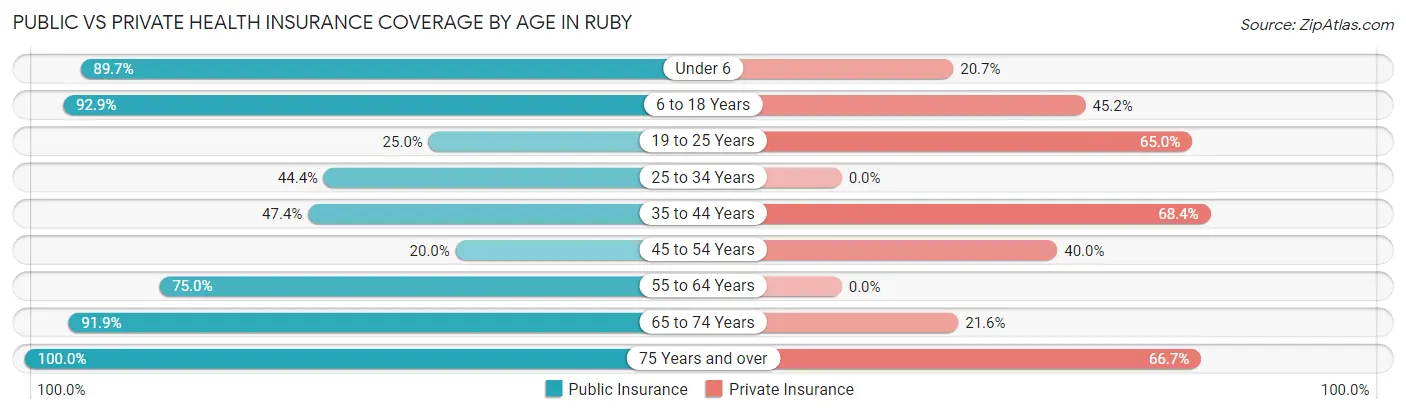
| Age Bracket | Public Insurance | Private Insurance |
| Under 6 | 26 (89.7%) | 6 (20.7%) |
| 6 to 18 Years | 39 (92.9%) | 19 (45.2%) |
| 19 to 25 Years | 5 (25.0%) | 13 (65.0%) |
| 25 to 34 Years | 4 (44.4%) | 0 (0.0%) |
| 35 to 44 Years | 9 (47.4%) | 13 (68.4%) |
| 45 to 54 Years | 2 (20.0%) | 4 (40.0%) |
| 55 to 64 Years | 12 (75.0%) | 0 (0.0%) |
| 65 to 74 Years | 34 (91.9%) | 8 (21.6%) |
| 75 Years and over | 12 (100.0%) | 8 (66.7%) |
| Total | 143 (73.7%) | 71 (36.6%) |
Disability Status by Sex by Age in Ruby
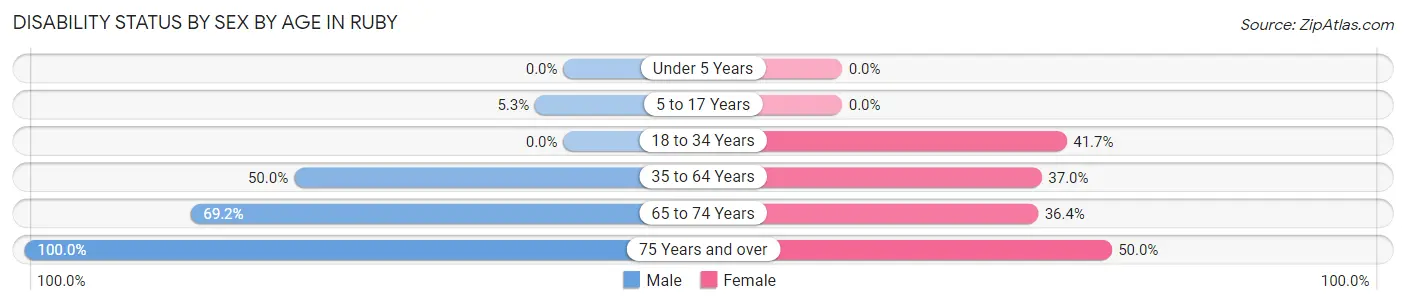
| Age Bracket | Male | Female |
| Under 5 Years | 0 (0.0%) | 0 (0.0%) |
| 5 to 17 Years | 1 (5.3%) | 0 (0.0%) |
| 18 to 34 Years | 0 (0.0%) | 10 (41.7%) |
| 35 to 64 Years | 9 (50.0%) | 10 (37.0%) |
| 65 to 74 Years | 18 (69.2%) | 4 (36.4%) |
| 75 Years and over | 4 (100.0%) | 4 (50.0%) |
Disability Class by Sex by Age in Ruby
Disability Class: Hearing Difficulty
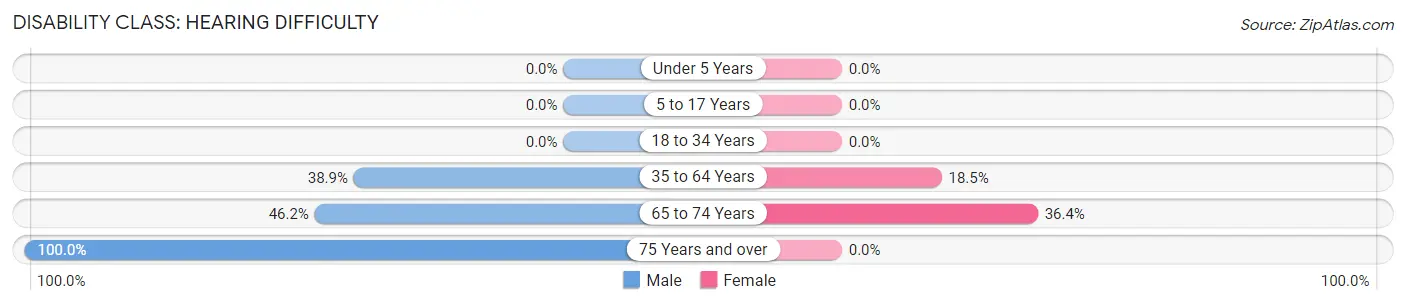
| Age Bracket | Male | Female |
| Under 5 Years | 0 (0.0%) | 0 (0.0%) |
| 5 to 17 Years | 0 (0.0%) | 0 (0.0%) |
| 18 to 34 Years | 0 (0.0%) | 0 (0.0%) |
| 35 to 64 Years | 7 (38.9%) | 5 (18.5%) |
| 65 to 74 Years | 12 (46.2%) | 4 (36.4%) |
| 75 Years and over | 4 (100.0%) | 0 (0.0%) |
Disability Class: Vision Difficulty
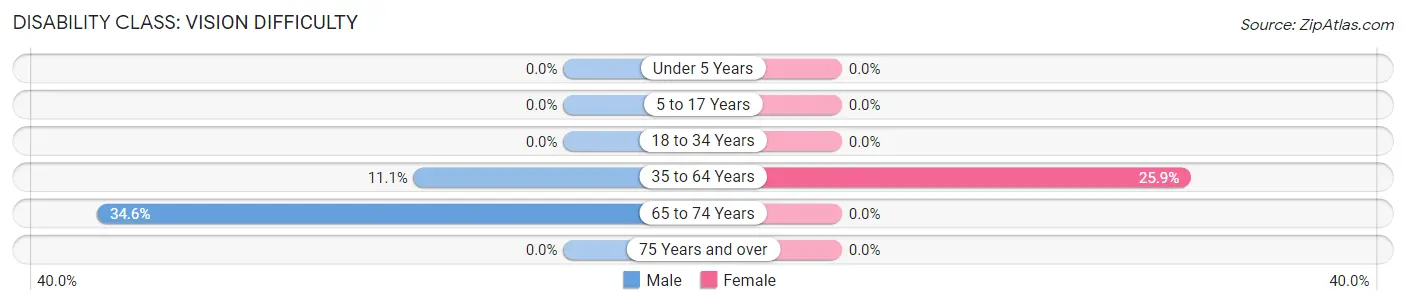
| Age Bracket | Male | Female |
| Under 5 Years | 0 (0.0%) | 0 (0.0%) |
| 5 to 17 Years | 0 (0.0%) | 0 (0.0%) |
| 18 to 34 Years | 0 (0.0%) | 0 (0.0%) |
| 35 to 64 Years | 2 (11.1%) | 7 (25.9%) |
| 65 to 74 Years | 9 (34.6%) | 0 (0.0%) |
| 75 Years and over | 0 (0.0%) | 0 (0.0%) |
Disability Class: Cognitive Difficulty
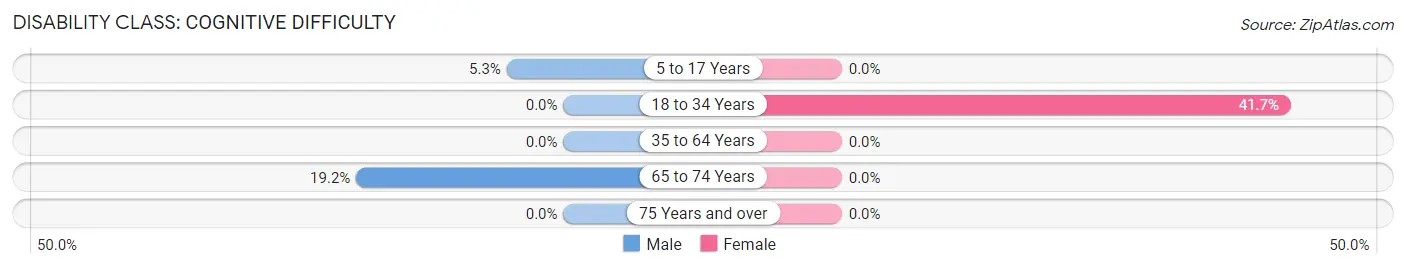
| Age Bracket | Male | Female |
| 5 to 17 Years | 1 (5.3%) | 0 (0.0%) |
| 18 to 34 Years | 0 (0.0%) | 10 (41.7%) |
| 35 to 64 Years | 0 (0.0%) | 0 (0.0%) |
| 65 to 74 Years | 5 (19.2%) | 0 (0.0%) |
| 75 Years and over | 0 (0.0%) | 0 (0.0%) |
Disability Class: Ambulatory Difficulty
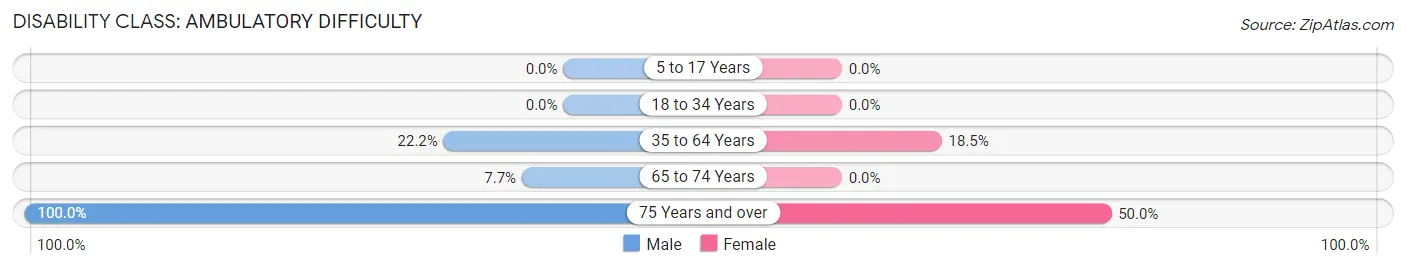
| Age Bracket | Male | Female |
| 5 to 17 Years | 0 (0.0%) | 0 (0.0%) |
| 18 to 34 Years | 0 (0.0%) | 0 (0.0%) |
| 35 to 64 Years | 4 (22.2%) | 5 (18.5%) |
| 65 to 74 Years | 2 (7.7%) | 0 (0.0%) |
| 75 Years and over | 4 (100.0%) | 4 (50.0%) |
Disability Class: Self-Care Difficulty
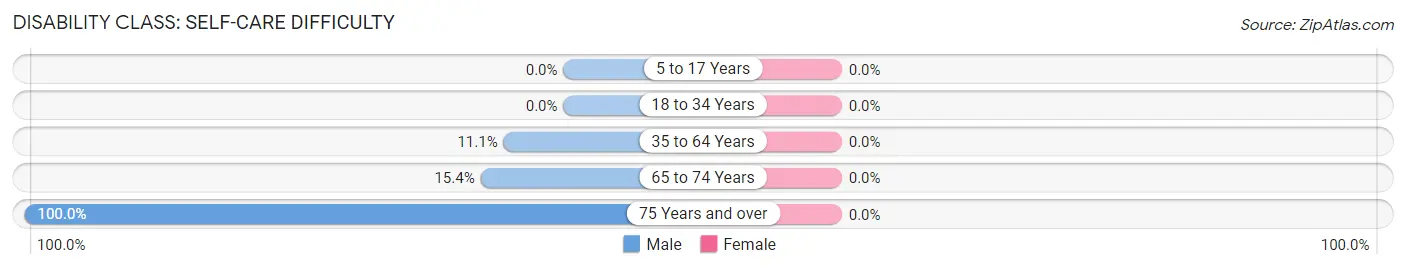
| Age Bracket | Male | Female |
| 5 to 17 Years | 0 (0.0%) | 0 (0.0%) |
| 18 to 34 Years | 0 (0.0%) | 0 (0.0%) |
| 35 to 64 Years | 2 (11.1%) | 0 (0.0%) |
| 65 to 74 Years | 4 (15.4%) | 0 (0.0%) |
| 75 Years and over | 4 (100.0%) | 0 (0.0%) |
Technology Access in Ruby
Computing Device Access in Ruby
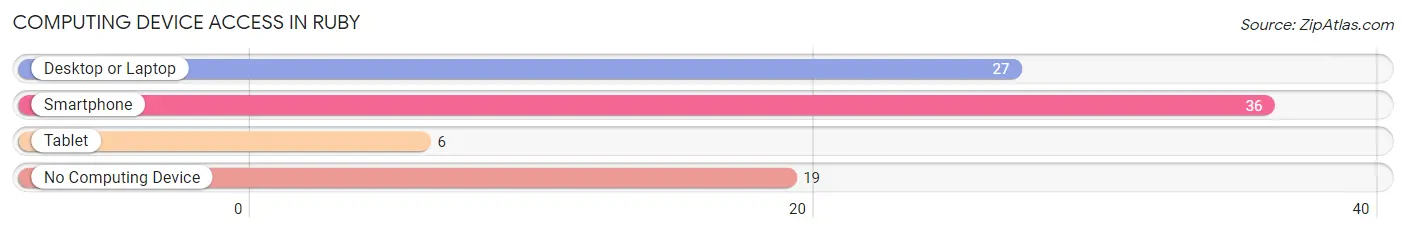
| Device Type | # Households | % Households |
| Desktop or Laptop | 27 | 38.6% |
| Smartphone | 36 | 51.4% |
| Tablet | 6 | 8.6% |
| No Computing Device | 19 | 27.1% |
| Total | 70 | 100.0% |
Internet Access in Ruby
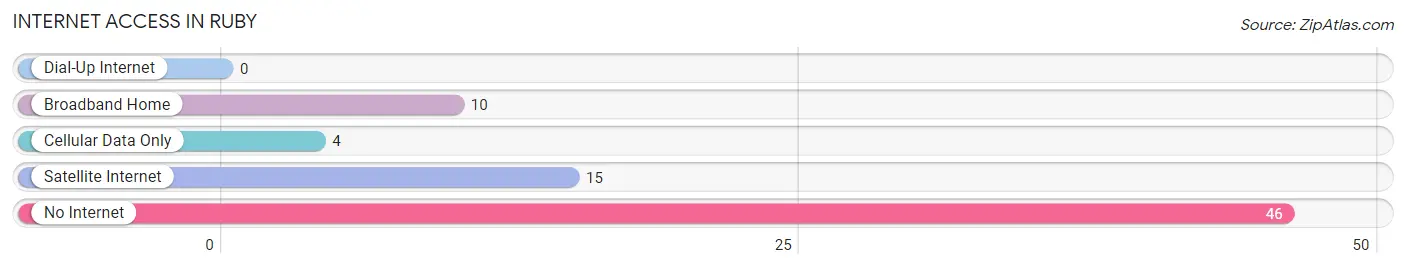
| Internet Type | # Households | % Households |
| Dial-Up Internet | 0 | 0.0% |
| Broadband Home | 10 | 14.3% |
| Cellular Data Only | 4 | 5.7% |
| Satellite Internet | 15 | 21.4% |
| No Internet | 46 | 65.7% |
| Total | 70 | 100.0% |
Ruby Summary
Ruby, Alaska is a small city located in the Yukon-Koyukuk Census Area of Alaska. It is situated on the Yukon River, approximately 40 miles northeast of Galena. The city was established in 1901 as a trading post and was incorporated in 1962. As of the 2010 census, the population of Ruby was 128.
History
The area around Ruby was first inhabited by the Koyukon Athabascan people. The first non-native settlers arrived in the area in the late 19th century, and the trading post was established in 1901. The post was named after the daughter of the post's owner, John J. Healy. The post was a popular stop for miners and trappers, and it was also used as a supply point for riverboats.
In the early 20th century, Ruby became a center for gold mining. The Ruby Mining Company was established in 1906, and the Ruby Gold Mining Company was established in 1908. The Ruby Gold Mining Company operated until the late 1920s, when the gold deposits were depleted.
In 1962, Ruby was incorporated as a city. The city was named after the daughter of the post's owner, John J. Healy.
Geography
Ruby is located in the Yukon-Koyukuk Census Area of Alaska. It is situated on the Yukon River, approximately 40 miles northeast of Galena. The city has a total area of 0.7 square miles, all of which is land.
The climate in Ruby is subarctic, with long, cold winters and short, cool summers. The average temperature in January is -17°F, and the average temperature in July is 57°F.
Economy
The economy of Ruby is largely based on subsistence activities, such as fishing, hunting, and trapping. The city also has a small tourism industry, with visitors coming to the area to take advantage of the fishing and hunting opportunities.
The city also has a small retail sector, with a few stores and restaurants. The city is home to a small airport, which serves as a hub for air travel in the region.
Demographics
As of the 2010 census, the population of Ruby was 128. The racial makeup of the city was 95.3% Native American, 2.3% White, 0.8% Asian, and 1.6% from other races.
The median household income in Ruby was $25,000, and the median family income was $30,000. The per capita income in the city was $14,000. Approximately 25.5% of the population was below the poverty line.
Common Questions
What is Per Capita Income in Ruby?
Per Capita income in Ruby is $17,826.
What is the Median Family Income in Ruby?
Median Family Income in Ruby is $60,125.
What is the Median Household income in Ruby?
Median Household Income in Ruby is $32,500.
What is Inequality or Gini Index in Ruby?
Inequality or Gini Index in Ruby is 0.43.
What is the Total Population of Ruby?
Total Population of Ruby is 194.
What is the Total Male Population of Ruby?
Total Male Population of Ruby is 106.
What is the Total Female Population of Ruby?
Total Female Population of Ruby is 88.
What is the Ratio of Males per 100 Females in Ruby?
There are 120.45 Males per 100 Females in Ruby.
What is the Ratio of Females per 100 Males in Ruby?
There are 83.02 Females per 100 Males in Ruby.
What is the Median Population Age in Ruby?
Median Population Age in Ruby is 27.8 Years.
What is the Average Family Size in Ruby
Average Family Size in Ruby is 3.9 People.
What is the Average Household Size in Ruby
Average Household Size in Ruby is 2.8 People.
How Large is the Labor Force in Ruby?
There are 79 People in the Labor Forcein in Ruby.
What is the Percentage of People in the Labor Force in Ruby?
57.7% of People are in the Labor Force in Ruby.