Quinhagak, AK Map & Demographics
Quinhagak Map
Quinhagak Overview
$13,783
PER CAPITA INCOME
$48,750
AVG FAMILY INCOME
$42,083
AVG HOUSEHOLD INCOME
37.8%
WAGE / INCOME GAP [ % ]
62.2¢/ $1
WAGE / INCOME GAP [ $ ]
0.46
INEQUALITY / GINI INDEX
1,079
TOTAL POPULATION
532
MALE POPULATION
547
FEMALE POPULATION
97.26
MALES / 100 FEMALES
102.82
FEMALES / 100 MALES
25.6
MEDIAN AGE
5.3
AVG FAMILY SIZE
4.5
AVG HOUSEHOLD SIZE
344
LABOR FORCE [ PEOPLE ]
50.8%
PERCENT IN LABOR FORCE
25.3%
UNEMPLOYMENT RATE
Quinhagak Zip Codes
Quinhagak Area Codes
Income in Quinhagak
Income Overview in Quinhagak
Per Capita Income in Quinhagak is $13,783, while median incomes of families and households are $48,750 and $42,083 respectively.
| Characteristic | Number | Measure |
| Per Capita Income | 1,079 | $13,783 |
| Median Family Income | 189 | $48,750 |
| Mean Family Income | 189 | $64,700 |
| Median Household Income | 237 | $42,083 |
| Mean Household Income | 237 | $58,675 |
| Income Deficit | 189 | $0 |
| Wage / Income Gap (%) | 1,079 | 37.78% |
| Wage / Income Gap ($) | 1,079 | 62.22¢ per $1 |
| Gini / Inequality Index | 1,079 | 0.46 |
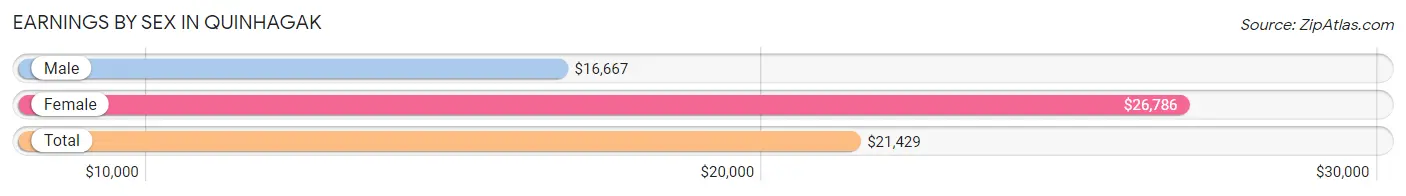
Earnings by Sex in Quinhagak
Average Earnings in Quinhagak are $21,429, $16,667 for men and $26,786 for women, a difference of 37.8%.
| Sex | Number | Average Earnings |
| Male | 180 (49.4%) | $16,667 |
| Female | 184 (50.5%) | $26,786 |
| Total | 364 (100.0%) | $21,429 |
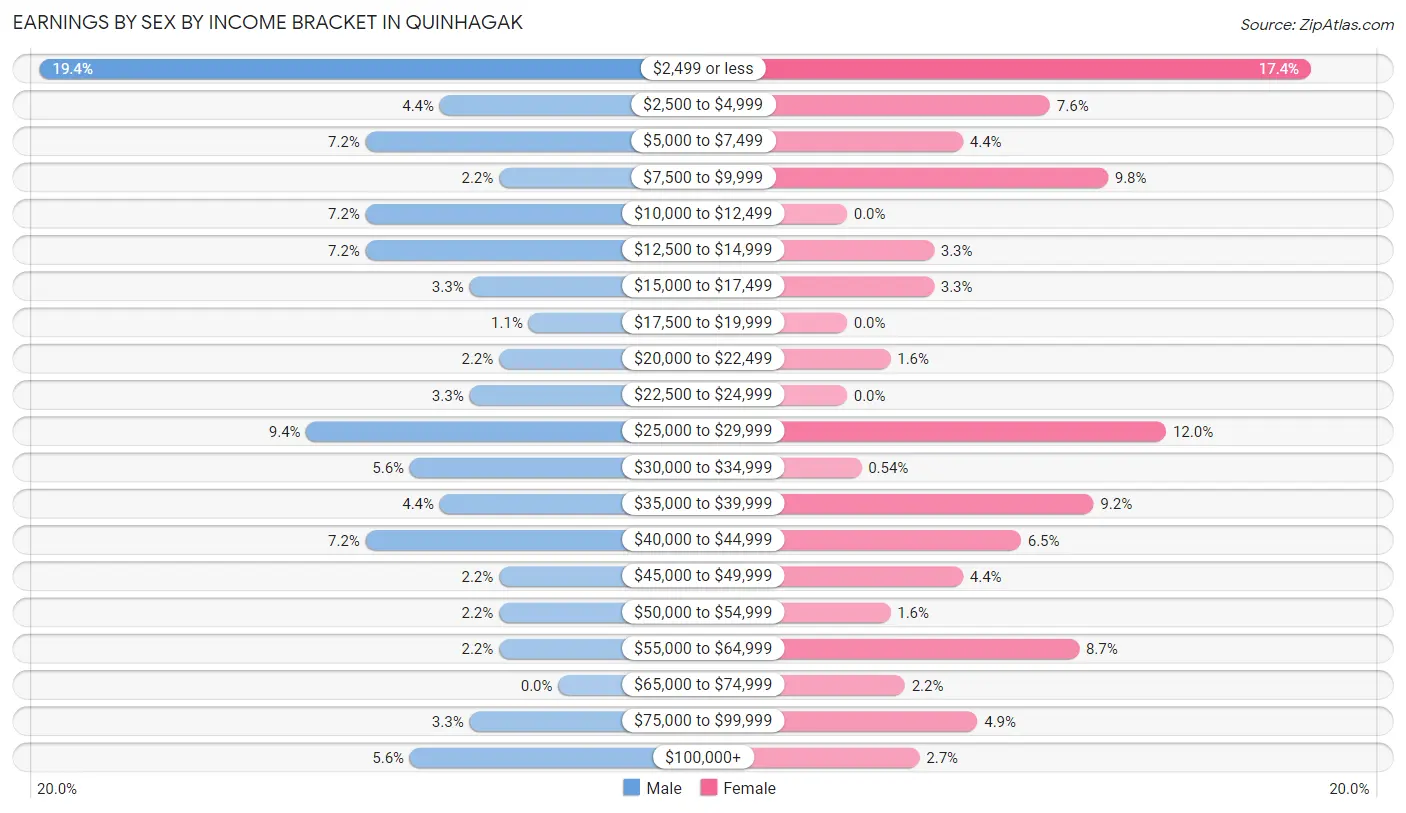
Earnings by Sex by Income Bracket in Quinhagak
The most common earnings brackets in Quinhagak are $2,499 or less for men (35 | 19.4%) and $2,499 or less for women (32 | 17.4%).
| Income | Male | Female |
| $2,499 or less | 35 (19.4%) | 32 (17.4%) |
| $2,500 to $4,999 | 8 (4.4%) | 14 (7.6%) |
| $5,000 to $7,499 | 13 (7.2%) | 8 (4.3%) |
| $7,500 to $9,999 | 4 (2.2%) | 18 (9.8%) |
| $10,000 to $12,499 | 13 (7.2%) | 0 (0.0%) |
| $12,500 to $14,999 | 13 (7.2%) | 6 (3.3%) |
| $15,000 to $17,499 | 6 (3.3%) | 6 (3.3%) |
| $17,500 to $19,999 | 2 (1.1%) | 0 (0.0%) |
| $20,000 to $22,499 | 4 (2.2%) | 3 (1.6%) |
| $22,500 to $24,999 | 6 (3.3%) | 0 (0.0%) |
| $25,000 to $29,999 | 17 (9.4%) | 22 (12.0%) |
| $30,000 to $34,999 | 10 (5.6%) | 1 (0.5%) |
| $35,000 to $39,999 | 8 (4.4%) | 17 (9.2%) |
| $40,000 to $44,999 | 13 (7.2%) | 12 (6.5%) |
| $45,000 to $49,999 | 4 (2.2%) | 8 (4.3%) |
| $50,000 to $54,999 | 4 (2.2%) | 3 (1.6%) |
| $55,000 to $64,999 | 4 (2.2%) | 16 (8.7%) |
| $65,000 to $74,999 | 0 (0.0%) | 4 (2.2%) |
| $75,000 to $99,999 | 6 (3.3%) | 9 (4.9%) |
| $100,000+ | 10 (5.6%) | 5 (2.7%) |
| Total | 180 (100.0%) | 184 (100.0%) |
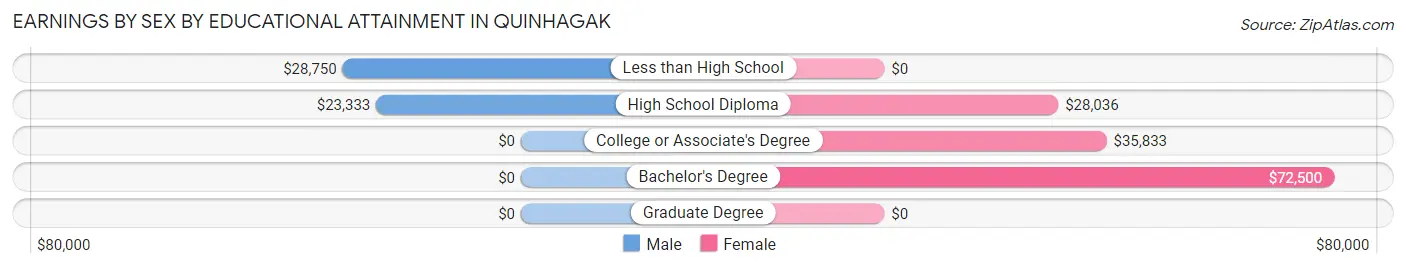
Earnings by Sex by Educational Attainment in Quinhagak
Average earnings in Quinhagak are $24,792 for men and $28,875 for women, a difference of 14.1%. Men with an educational attainment of less than high school enjoy the highest average annual earnings of $28,750, while those with high school diploma education earn the least with $23,333. Women with an educational attainment of bachelor's degree earn the most with the average annual earnings of $72,500, while those with high school diploma education have the smallest earnings of $28,036.
| Educational Attainment | Male Income | Female Income |
| Less than High School | $28,750 | $0 |
| High School Diploma | $23,333 | $28,036 |
| College or Associate's Degree | - | - |
| Bachelor's Degree | - | - |
| Graduate Degree | - | - |
| Total | $24,792 | $28,875 |
Family Income in Quinhagak
Family Income Brackets in Quinhagak
According to the Quinhagak family income data, there are 35 families falling into the $50,000 to $74,999 income range, which is the most common income bracket and makes up 18.5% of all families. Conversely, the $200,000+ income bracket is the least frequent group with only 4 families (2.1%) belonging to this category.
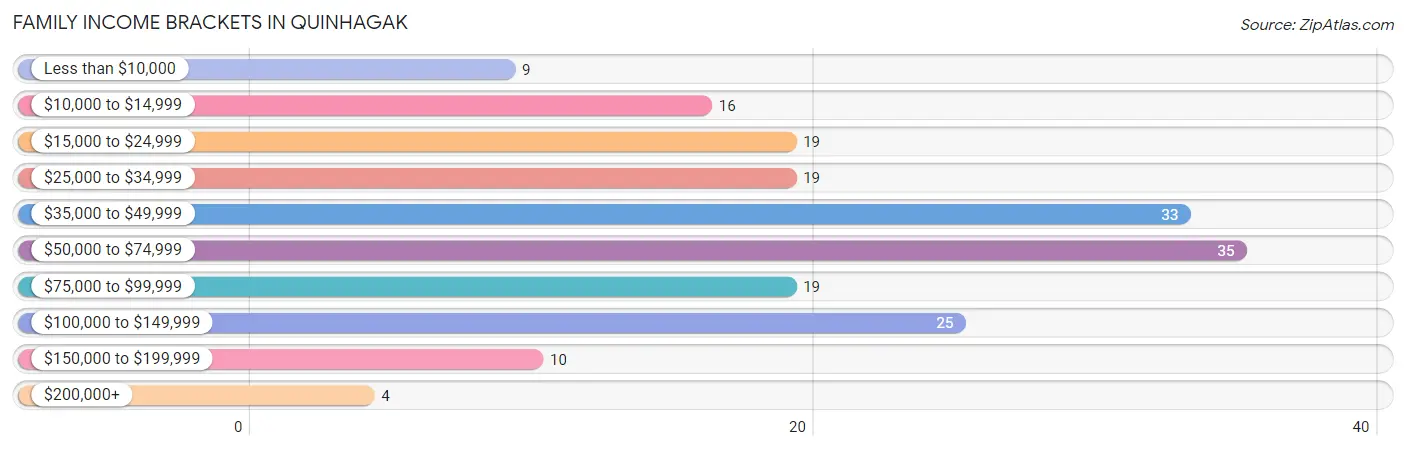
| Income Bracket | # Families | % Families |
| Less than $10,000 | 9 | 4.8% |
| $10,000 to $14,999 | 16 | 8.5% |
| $15,000 to $24,999 | 19 | 10.1% |
| $25,000 to $34,999 | 19 | 10.1% |
| $35,000 to $49,999 | 33 | 17.5% |
| $50,000 to $74,999 | 35 | 18.5% |
| $75,000 to $99,999 | 19 | 10.1% |
| $100,000 to $149,999 | 25 | 13.2% |
| $150,000 to $199,999 | 10 | 5.3% |
| $200,000+ | 4 | 2.1% |
Family Income by Famaliy Size in Quinhagak
5-person families (22 | 11.6%) account for the highest median family income in Quinhagak with $97,500 per family, while 5-person families (22 | 11.6%) have the highest median income of $19,500 per family member.
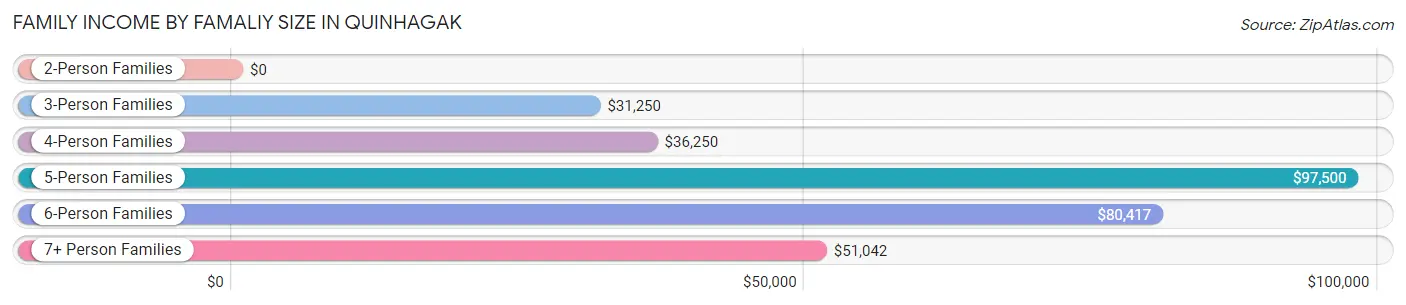
| Income Bracket | # Families | Median Income |
| 2-Person Families | 26 (13.8%) | $0 |
| 3-Person Families | 35 (18.5%) | $31,250 |
| 4-Person Families | 42 (22.2%) | $36,250 |
| 5-Person Families | 22 (11.6%) | $97,500 |
| 6-Person Families | 27 (14.3%) | $80,417 |
| 7+ Person Families | 37 (19.6%) | $51,042 |
| Total | 189 (100.0%) | $48,750 |
Family Income by Number of Earners in Quinhagak
The median family income in Quinhagak is $48,750, with families comprising 3+ earners (42) having the highest median family income of $98,750, while families with no earners (18) have the lowest median family income of $25,000, accounting for 22.2% and 9.5% of families, respectively.
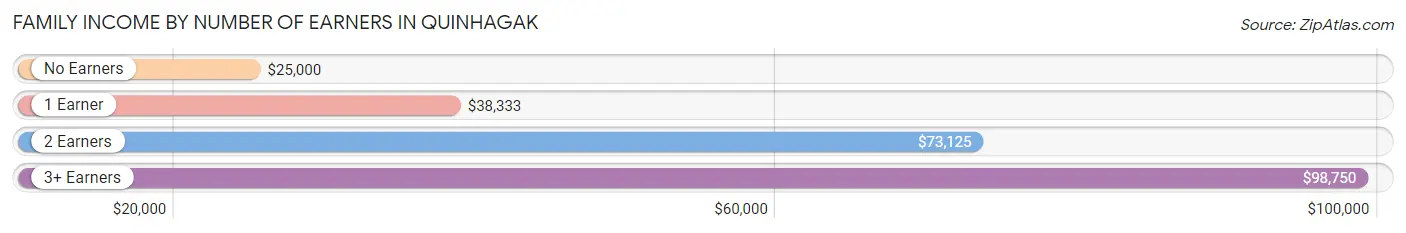
| Number of Earners | # Families | Median Income |
| No Earners | 18 (9.5%) | $25,000 |
| 1 Earner | 80 (42.3%) | $38,333 |
| 2 Earners | 49 (25.9%) | $73,125 |
| 3+ Earners | 42 (22.2%) | $98,750 |
| Total | 189 (100.0%) | $48,750 |
Household Income in Quinhagak
Household Income Brackets in Quinhagak
With 45 households falling in the category, the $50,000 to $74,999 income range is the most frequent in Quinhagak, accounting for 19.0% of all households. In contrast, only 4 households (1.7%) fall into the $200,000+ income bracket, making it the least populous group.
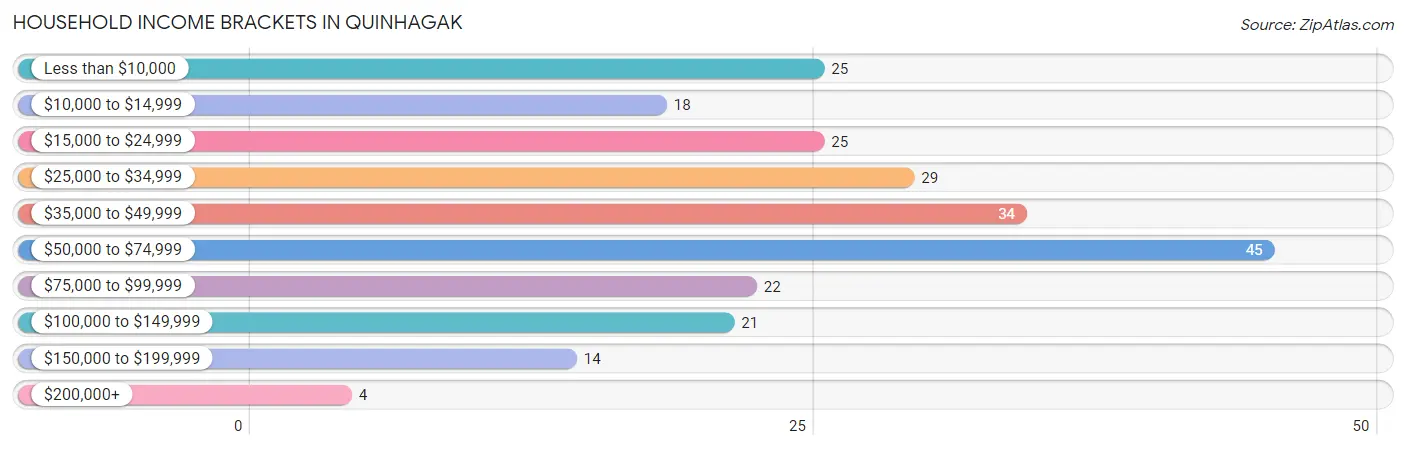
| Income Bracket | # Households | % Households |
| Less than $10,000 | 25 | 10.5% |
| $10,000 to $14,999 | 18 | 7.6% |
| $15,000 to $24,999 | 25 | 10.5% |
| $25,000 to $34,999 | 29 | 12.2% |
| $35,000 to $49,999 | 34 | 14.3% |
| $50,000 to $74,999 | 45 | 19.0% |
| $75,000 to $99,999 | 22 | 9.3% |
| $100,000 to $149,999 | 21 | 8.9% |
| $150,000 to $199,999 | 14 | 5.9% |
| $200,000+ | 4 | 1.7% |
Household Income by Householder Age in Quinhagak
The median household income in Quinhagak is $42,083, with the highest median household income of $46,250 found in the 25 to 44 years age bracket for the primary householder. A total of 67 households (28.3%) fall into this category. Meanwhile, the 15 to 24 years age bracket for the primary householder has the lowest median household income of $0, with 3 households (1.3%) in this group.
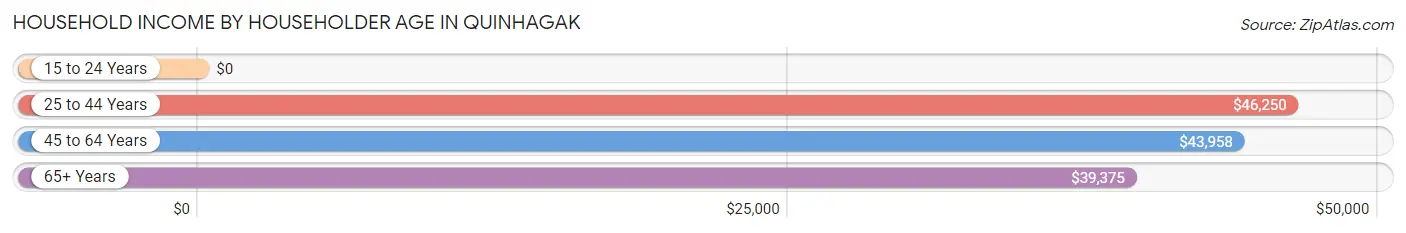
| Income Bracket | # Households | Median Income |
| 15 to 24 Years | 3 (1.3%) | $0 |
| 25 to 44 Years | 67 (28.3%) | $46,250 |
| 45 to 64 Years | 117 (49.4%) | $43,958 |
| 65+ Years | 50 (21.1%) | $39,375 |
| Total | 237 (100.0%) | $42,083 |
Poverty in Quinhagak
Income Below Poverty by Sex and Age in Quinhagak
With 37.2% poverty level for males and 31.4% for females among the residents of Quinhagak, 5 year old males and 16 and 17 year old females are the most vulnerable to poverty, with 7 males (70.0%) and 11 females (64.7%) in their respective age groups living below the poverty level.
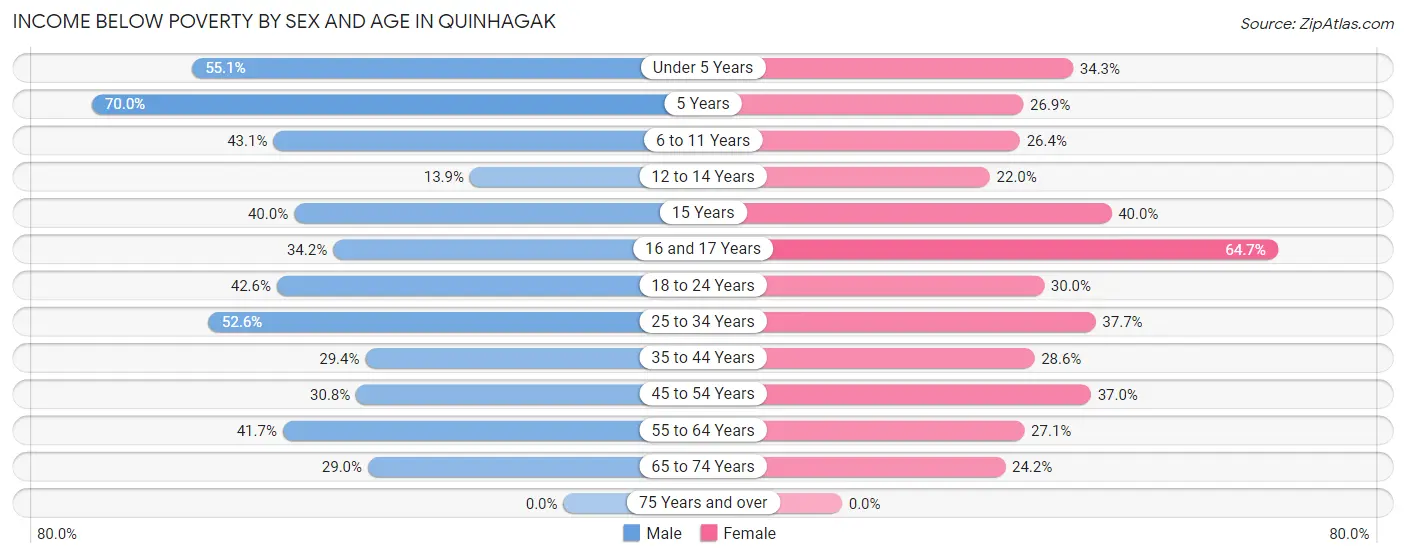
| Age Bracket | Male | Female |
| Under 5 Years | 27 (55.1%) | 35 (34.3%) |
| 5 Years | 7 (70.0%) | 7 (26.9%) |
| 6 to 11 Years | 28 (43.1%) | 14 (26.4%) |
| 12 to 14 Years | 5 (13.9%) | 9 (22.0%) |
| 15 Years | 2 (40.0%) | 6 (40.0%) |
| 16 and 17 Years | 13 (34.2%) | 11 (64.7%) |
| 18 to 24 Years | 20 (42.5%) | 9 (30.0%) |
| 25 to 34 Years | 30 (52.6%) | 29 (37.7%) |
| 35 to 44 Years | 20 (29.4%) | 14 (28.6%) |
| 45 to 54 Years | 12 (30.8%) | 17 (37.0%) |
| 55 to 64 Years | 25 (41.7%) | 13 (27.1%) |
| 65 to 74 Years | 9 (29.0%) | 8 (24.2%) |
| 75 Years and over | 0 (0.0%) | 0 (0.0%) |
| Total | 198 (37.2%) | 172 (31.4%) |
Income Above Poverty by Sex and Age in Quinhagak
According to the poverty statistics in Quinhagak, males aged 75 years and over and females aged 75 years and over are the age groups that are most secure financially, with 100.0% of males and 100.0% of females in these age groups living above the poverty line.
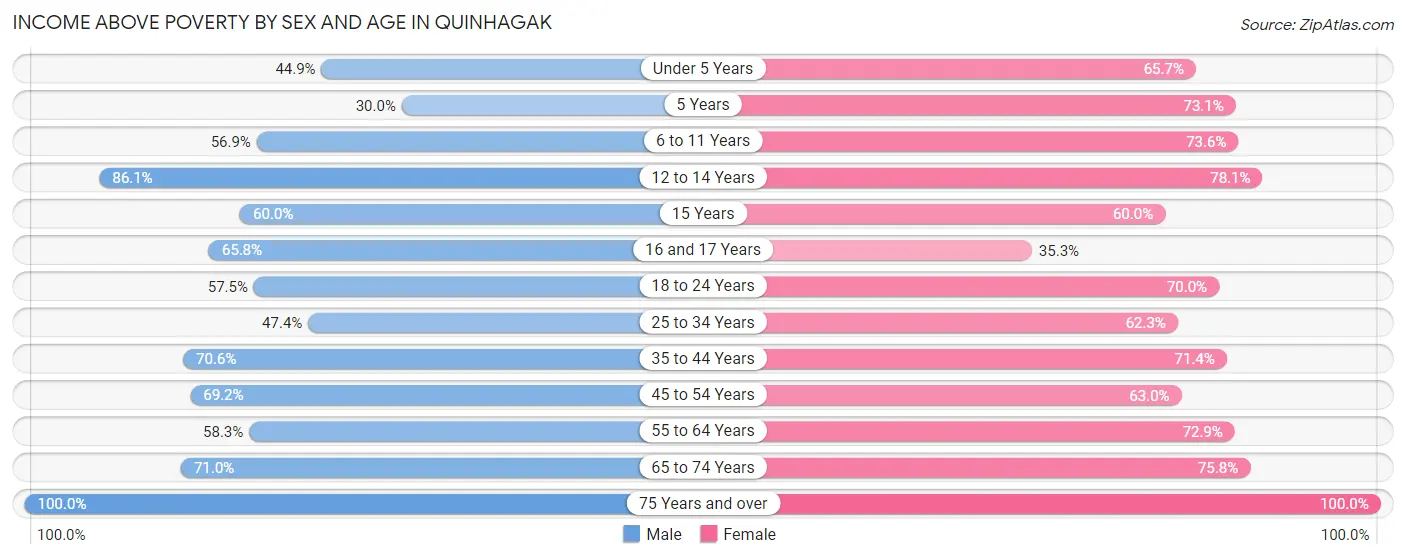
| Age Bracket | Male | Female |
| Under 5 Years | 22 (44.9%) | 67 (65.7%) |
| 5 Years | 3 (30.0%) | 19 (73.1%) |
| 6 to 11 Years | 37 (56.9%) | 39 (73.6%) |
| 12 to 14 Years | 31 (86.1%) | 32 (78.0%) |
| 15 Years | 3 (60.0%) | 9 (60.0%) |
| 16 and 17 Years | 25 (65.8%) | 6 (35.3%) |
| 18 to 24 Years | 27 (57.5%) | 21 (70.0%) |
| 25 to 34 Years | 27 (47.4%) | 48 (62.3%) |
| 35 to 44 Years | 48 (70.6%) | 35 (71.4%) |
| 45 to 54 Years | 27 (69.2%) | 29 (63.0%) |
| 55 to 64 Years | 35 (58.3%) | 35 (72.9%) |
| 65 to 74 Years | 22 (71.0%) | 25 (75.8%) |
| 75 Years and over | 27 (100.0%) | 10 (100.0%) |
| Total | 334 (62.8%) | 375 (68.6%) |
Income Below Poverty Among Married-Couple Families in Quinhagak
The poverty statistics for married-couple families in Quinhagak show that 28.8% or 30 of the total 104 families live below the poverty line. Families with 5 or more children have the highest poverty rate of 78.6%, comprising of 11 families. On the other hand, families with no children have the lowest poverty rate of 12.5%, which includes 2 families.
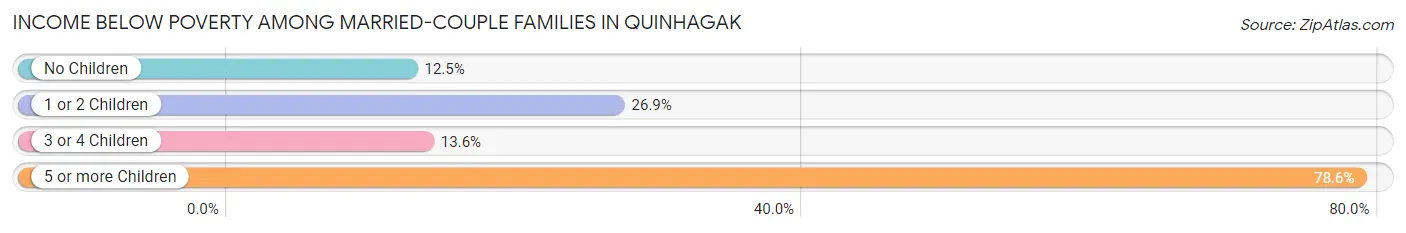
| Children | Above Poverty | Below Poverty |
| No Children | 14 (87.5%) | 2 (12.5%) |
| 1 or 2 Children | 38 (73.1%) | 14 (26.9%) |
| 3 or 4 Children | 19 (86.4%) | 3 (13.6%) |
| 5 or more Children | 3 (21.4%) | 11 (78.6%) |
| Total | 74 (71.2%) | 30 (28.8%) |
Income Below Poverty Among Single-Parent Households in Quinhagak
According to the poverty data in Quinhagak, 18.8% or 3 single-father households and 34.8% or 24 single-mother households are living below the poverty line. Among single-father households, those with 3 or 4 children have the highest poverty rate, with 3 households (33.3%) experiencing poverty. Likewise, among single-mother households, those with 1 or 2 children have the highest poverty rate, with 17 households (43.6%) falling below the poverty line.
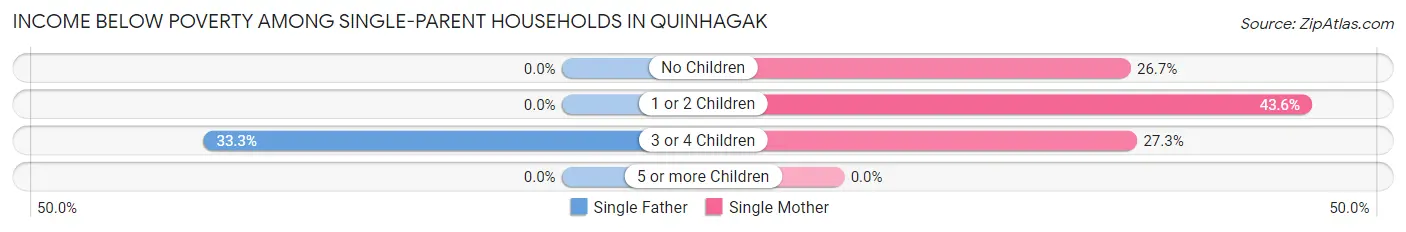
| Children | Single Father | Single Mother |
| No Children | 0 (0.0%) | 4 (26.7%) |
| 1 or 2 Children | 0 (0.0%) | 17 (43.6%) |
| 3 or 4 Children | 3 (33.3%) | 3 (27.3%) |
| 5 or more Children | 0 (0.0%) | 0 (0.0%) |
| Total | 3 (18.8%) | 24 (34.8%) |
Income Below Poverty Among Married-Couple vs Single-Parent Households in Quinhagak
The poverty data for Quinhagak shows that 30 of the married-couple family households (28.8%) and 27 of the single-parent households (31.8%) are living below the poverty level. Within the married-couple family households, those with 5 or more children have the highest poverty rate, with 11 households (78.6%) falling below the poverty line. Among the single-parent households, those with 1 or 2 children have the highest poverty rate, with 17 household (41.5%) living below poverty.
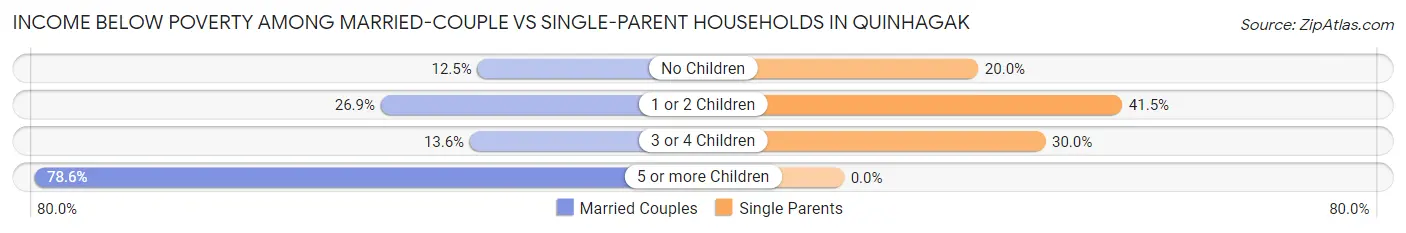
| Children | Married-Couple Families | Single-Parent Households |
| No Children | 2 (12.5%) | 4 (20.0%) |
| 1 or 2 Children | 14 (26.9%) | 17 (41.5%) |
| 3 or 4 Children | 3 (13.6%) | 6 (30.0%) |
| 5 or more Children | 11 (78.6%) | 0 (0.0%) |
| Total | 30 (28.8%) | 27 (31.8%) |
Race in Quinhagak
The most populous races in Quinhagak are Native / Alaskan (980 | 90.8%), Two or more Races (75 | 7.0%), and White / Caucasian (20 | 1.8%).
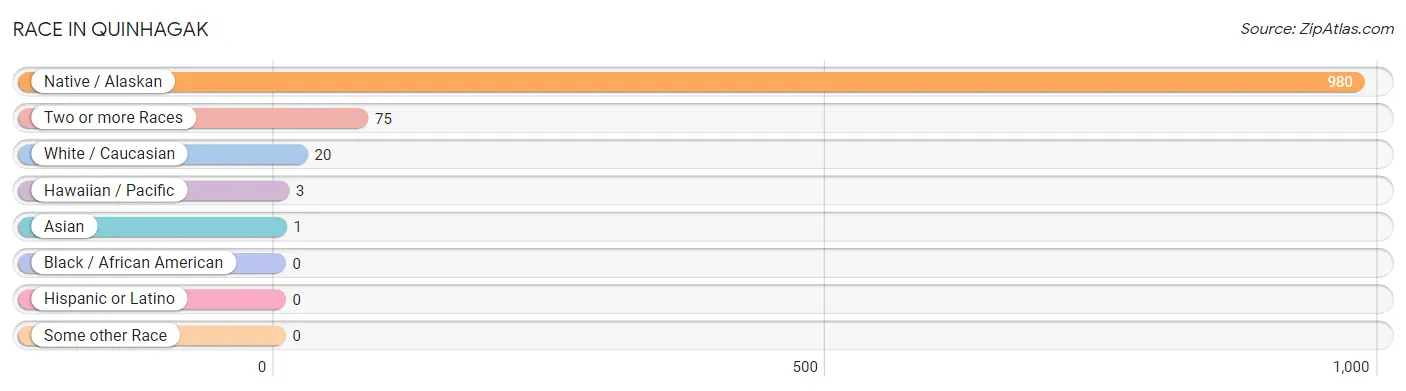
| Race | # Population | % Population |
| Asian | 1 | 0.1% |
| Black / African American | 0 | 0.0% |
| Hawaiian / Pacific | 3 | 0.3% |
| Hispanic or Latino | 0 | 0.0% |
| Native / Alaskan | 980 | 90.8% |
| White / Caucasian | 20 | 1.8% |
| Two or more Races | 75 | 7.0% |
| Some other Race | 0 | 0.0% |
| Total | 1,079 | 100.0% |
Ancestry in Quinhagak
The most populous ancestries reported in Quinhagak are Yup'ik (959 | 88.9%), Alaska Native (47 | 4.4%), Inupiat (35 | 3.2%), Polish (27 | 2.5%), and German (14 | 1.3%), together accounting for 100.3% of all Quinhagak residents.
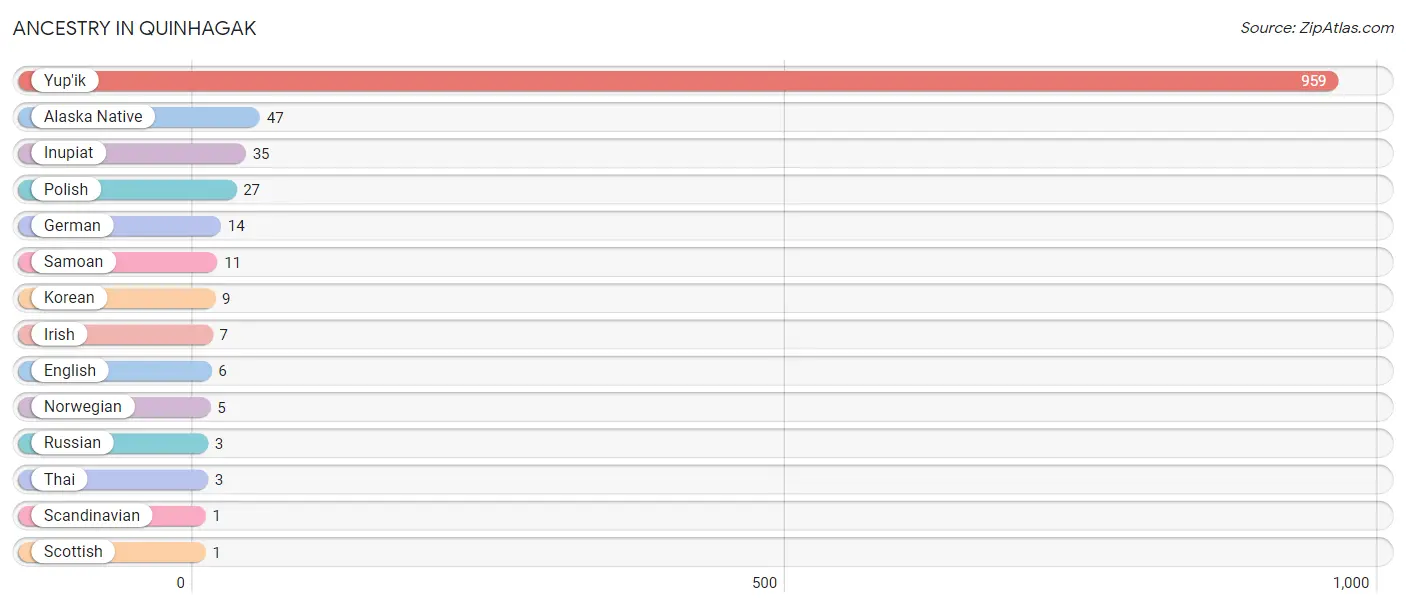
| Ancestry | # Population | % Population |
| Alaska Native | 47 | 4.4% |
| English | 6 | 0.6% |
| German | 14 | 1.3% |
| Inupiat | 35 | 3.2% |
| Irish | 7 | 0.6% |
| Korean | 9 | 0.8% |
| Norwegian | 5 | 0.5% |
| Polish | 27 | 2.5% |
| Russian | 3 | 0.3% |
| Samoan | 11 | 1.0% |
| Scandinavian | 1 | 0.1% |
| Scottish | 1 | 0.1% |
| Thai | 3 | 0.3% |
| Yup'ik | 959 | 88.9% | View All 14 Rows |
Immigrants in Quinhagak

| Immigration Origin | # Population | % Population | View All 0 Rows |
Sex and Age in Quinhagak
Sex and Age in Quinhagak
The most populous age groups in Quinhagak are 10 to 14 Years (68 | 12.8%) for men and Under 5 Years (102 | 18.6%) for women.
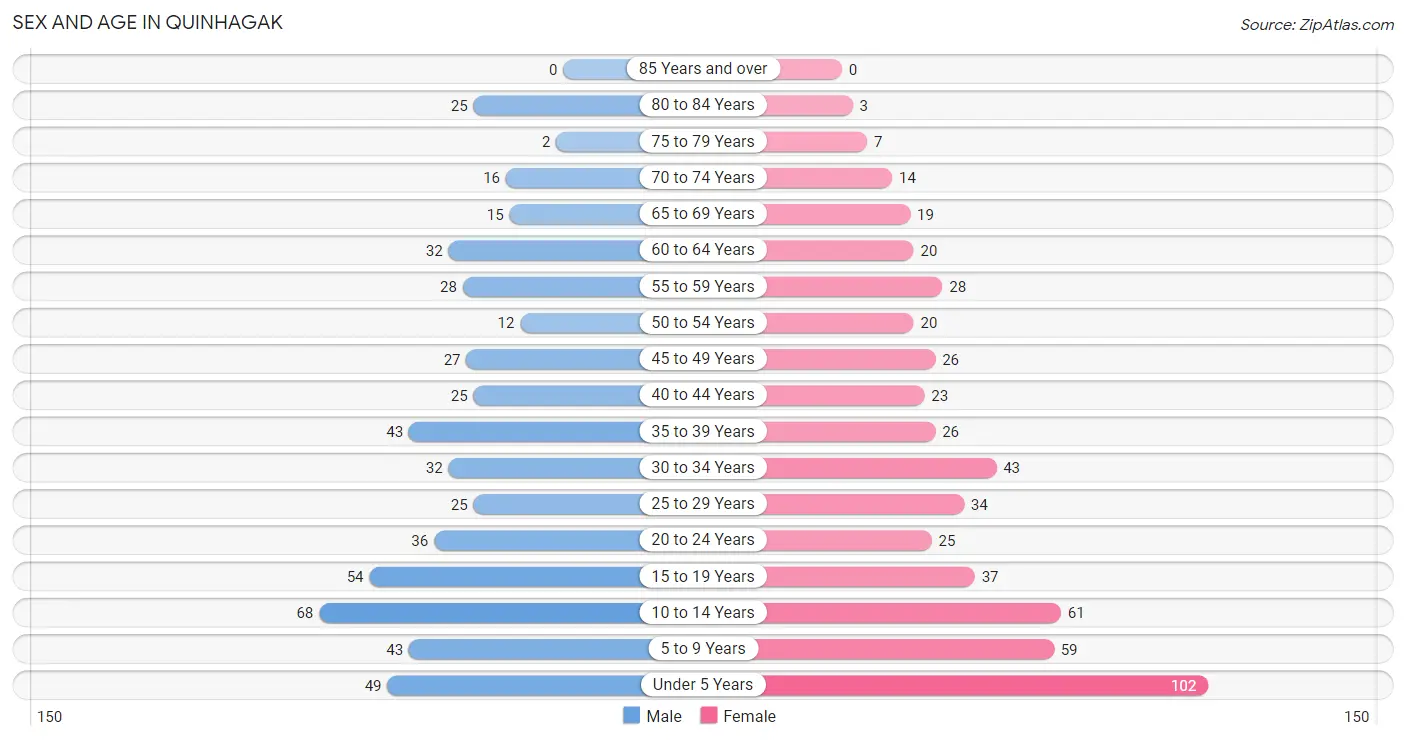
| Age Bracket | Male | Female |
| Under 5 Years | 49 (9.2%) | 102 (18.6%) |
| 5 to 9 Years | 43 (8.1%) | 59 (10.8%) |
| 10 to 14 Years | 68 (12.8%) | 61 (11.2%) |
| 15 to 19 Years | 54 (10.2%) | 37 (6.8%) |
| 20 to 24 Years | 36 (6.8%) | 25 (4.6%) |
| 25 to 29 Years | 25 (4.7%) | 34 (6.2%) |
| 30 to 34 Years | 32 (6.0%) | 43 (7.9%) |
| 35 to 39 Years | 43 (8.1%) | 26 (4.8%) |
| 40 to 44 Years | 25 (4.7%) | 23 (4.2%) |
| 45 to 49 Years | 27 (5.1%) | 26 (4.8%) |
| 50 to 54 Years | 12 (2.3%) | 20 (3.7%) |
| 55 to 59 Years | 28 (5.3%) | 28 (5.1%) |
| 60 to 64 Years | 32 (6.0%) | 20 (3.7%) |
| 65 to 69 Years | 15 (2.8%) | 19 (3.5%) |
| 70 to 74 Years | 16 (3.0%) | 14 (2.6%) |
| 75 to 79 Years | 2 (0.4%) | 7 (1.3%) |
| 80 to 84 Years | 25 (4.7%) | 3 (0.5%) |
| 85 Years and over | 0 (0.0%) | 0 (0.0%) |
| Total | 532 (100.0%) | 547 (100.0%) |
Families and Households in Quinhagak
Median Family Size in Quinhagak
The median family size in Quinhagak is 5.27 persons per family, with married-couple families (104 | 55.0%) accounting for the largest median family size of 5.76 persons per family. On the other hand, single male/father families (16 | 8.5%) represent the smallest median family size with 4.63 persons per family.
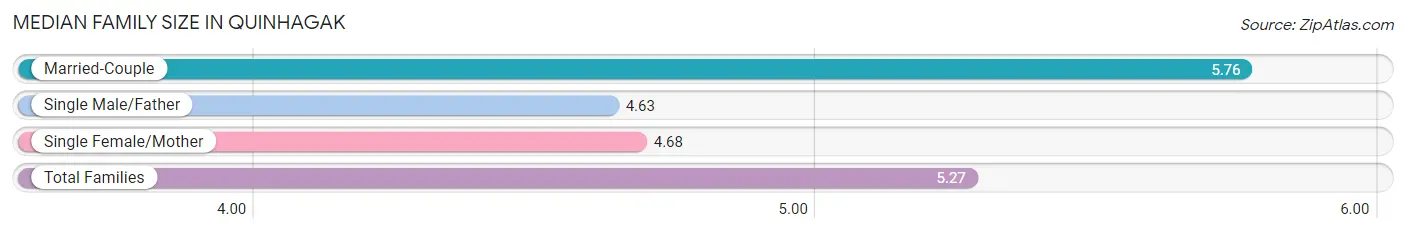
| Family Type | # Families | Family Size |
| Married-Couple | 104 (55.0%) | 5.76 |
| Single Male/Father | 16 (8.5%) | 4.63 |
| Single Female/Mother | 69 (36.5%) | 4.68 |
| Total Families | 189 (100.0%) | 5.27 |
Median Household Size in Quinhagak
The median household size in Quinhagak is 4.55 persons per household, with married-couple households (104 | 43.9%) accounting for the largest median household size of 5.81 persons per household. non-family households (48 | 20.3%) represent the smallest median household size with 1.13 persons per household.
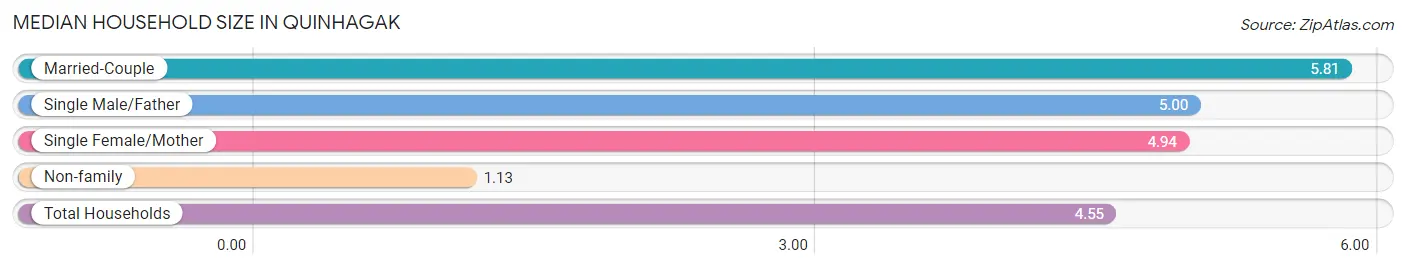
| Household Type | # Households | Household Size |
| Married-Couple | 104 (43.9%) | 5.81 |
| Single Male/Father | 16 (6.8%) | 5.00 |
| Single Female/Mother | 69 (29.1%) | 4.94 |
| Non-family | 48 (20.3%) | 1.13 |
| Total Households | 237 (100.0%) | 4.55 |
Household Size by Marriage Status in Quinhagak
Out of a total of 237 households in Quinhagak, 189 (79.7%) are family households, while 48 (20.3%) are nonfamily households. The most numerous type of family households are 4-person households, comprising 50, and the most common type of nonfamily households are 1-person households, comprising 43.
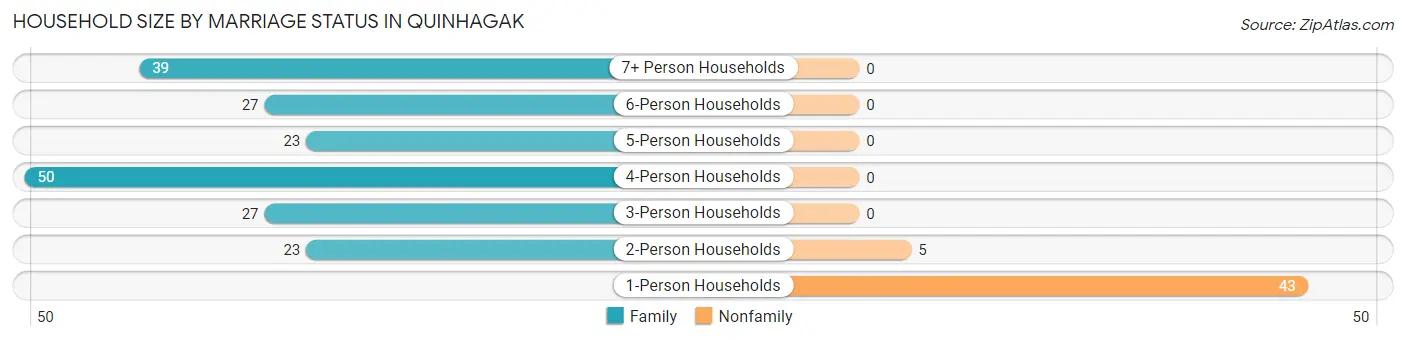
| Household Size | Family Households | Nonfamily Households |
| 1-Person Households | - | 43 (18.1%) |
| 2-Person Households | 23 (9.7%) | 5 (2.1%) |
| 3-Person Households | 27 (11.4%) | 0 (0.0%) |
| 4-Person Households | 50 (21.1%) | 0 (0.0%) |
| 5-Person Households | 23 (9.7%) | 0 (0.0%) |
| 6-Person Households | 27 (11.4%) | 0 (0.0%) |
| 7+ Person Households | 39 (16.5%) | 0 (0.0%) |
| Total | 189 (79.7%) | 48 (20.3%) |
Female Fertility in Quinhagak
Fertility by Age in Quinhagak
Average fertility rate in Quinhagak is 131.0 births per 1,000 women. Women in the age bracket of 20 to 34 years have the highest fertility rate with 206.0 births per 1,000 women. Women in the age bracket of 20 to 34 years acount for 75.0% of all women with births.
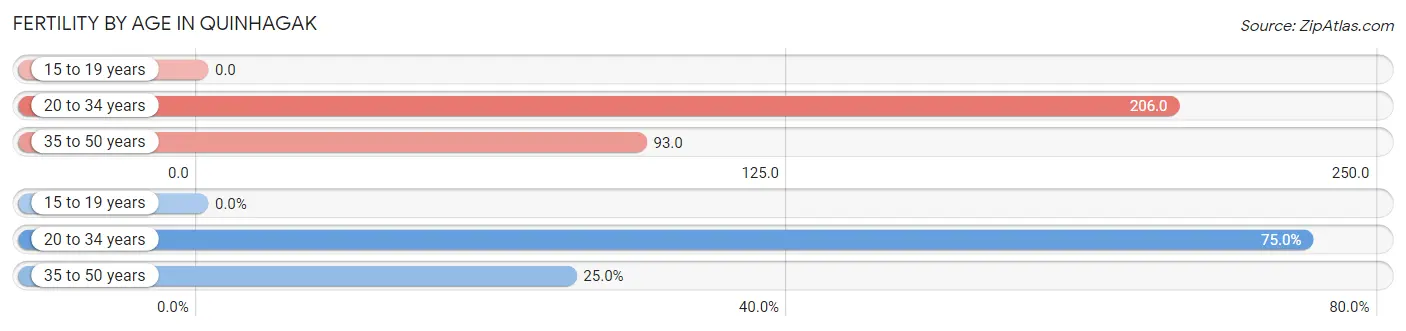
| Age Bracket | Women with Births | Births / 1,000 Women |
| 15 to 19 years | 0 (0.0%) | 0.0 |
| 20 to 34 years | 21 (75.0%) | 206.0 |
| 35 to 50 years | 7 (25.0%) | 93.0 |
| Total | 28 (100.0%) | 131.0 |
Fertility by Age by Marriage Status in Quinhagak
42.9% of women with births (28) in Quinhagak are married. The highest percentage of unmarried women with births falls into 20 to 34 years age bracket with 76.2% of them unmarried at the time of birth, while the lowest percentage of unmarried women with births belong to 35 to 50 years age bracket with 0.0% of them unmarried.
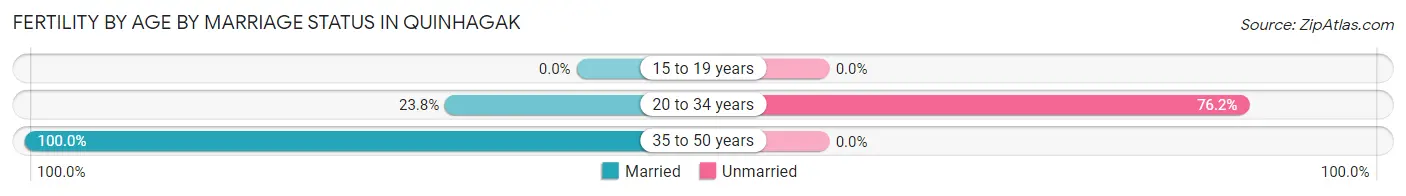
| Age Bracket | Married | Unmarried |
| 15 to 19 years | 0 (0.0%) | 0 (0.0%) |
| 20 to 34 years | 5 (23.8%) | 16 (76.2%) |
| 35 to 50 years | 7 (100.0%) | 0 (0.0%) |
| Total | 12 (42.9%) | 16 (57.1%) |
Fertility by Education in Quinhagak
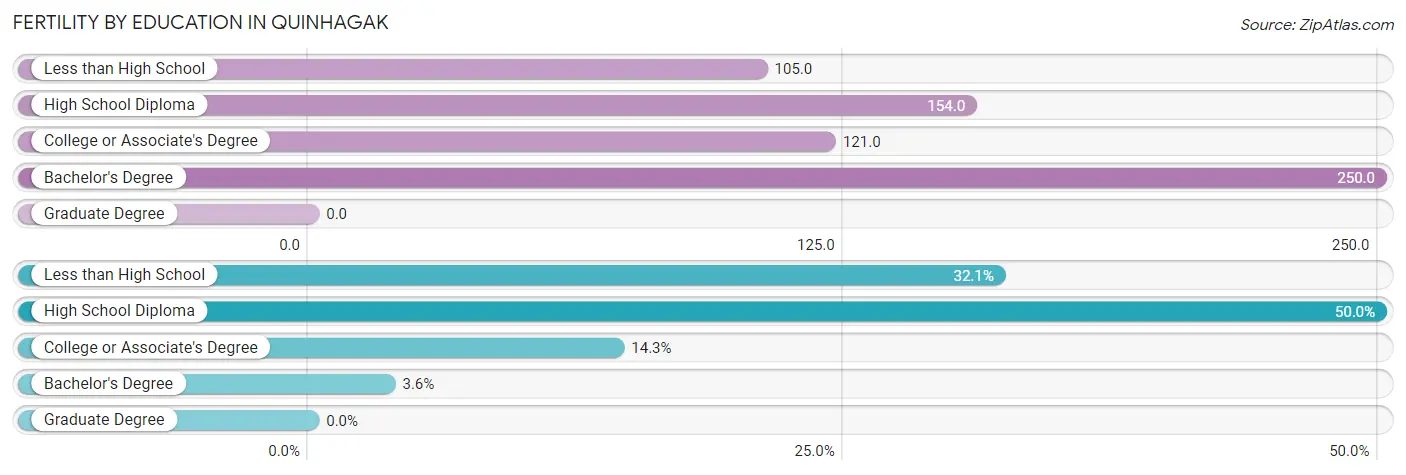
| Educational Attainment | Women with Births | Births / 1,000 Women |
| Less than High School | 9 (32.1%) | 105.0 |
| High School Diploma | 14 (50.0%) | 154.0 |
| College or Associate's Degree | 4 (14.3%) | 121.0 |
| Bachelor's Degree | 1 (3.6%) | 250.0 |
| Graduate Degree | 0 (0.0%) | 0.0 |
| Total | 28 (100.0%) | 131.0 |
Fertility by Education by Marriage Status in Quinhagak
57.1% of women with births in Quinhagak are unmarried. Women with the educational attainment of bachelor's degree are most likely to be married with 100.0% of them married at childbirth, while women with the educational attainment of college or associate's degree are least likely to be married with 100.0% of them unmarried at childbirth.
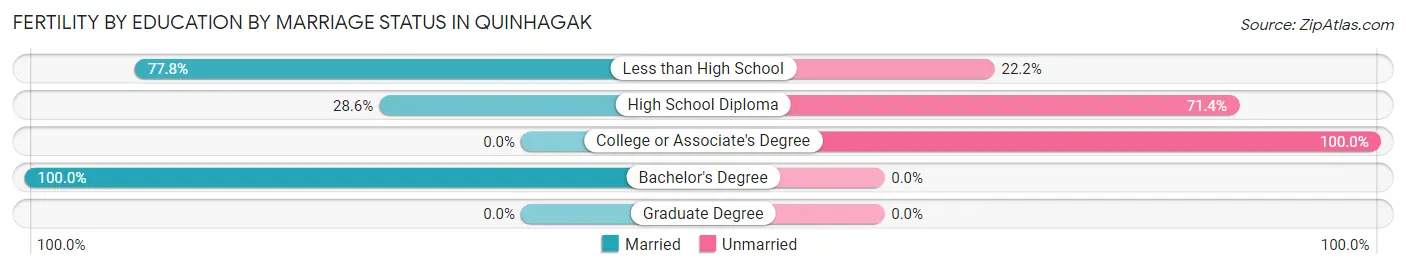
| Educational Attainment | Married | Unmarried |
| Less than High School | 7 (77.8%) | 2 (22.2%) |
| High School Diploma | 4 (28.6%) | 10 (71.4%) |
| College or Associate's Degree | 0 (0.0%) | 4 (100.0%) |
| Bachelor's Degree | 1 (100.0%) | 0 (0.0%) |
| Graduate Degree | 0 (0.0%) | 0 (0.0%) |
| Total | 12 (42.9%) | 16 (57.1%) |
Employment Characteristics in Quinhagak
Employment by Class of Employer in Quinhagak
Among the 245 employed individuals in Quinhagak, local government employees (86 | 35.1%), private company employees (73 | 29.8%), and not-for-profit organizations (35 | 14.3%) make up the most common classes of employment.
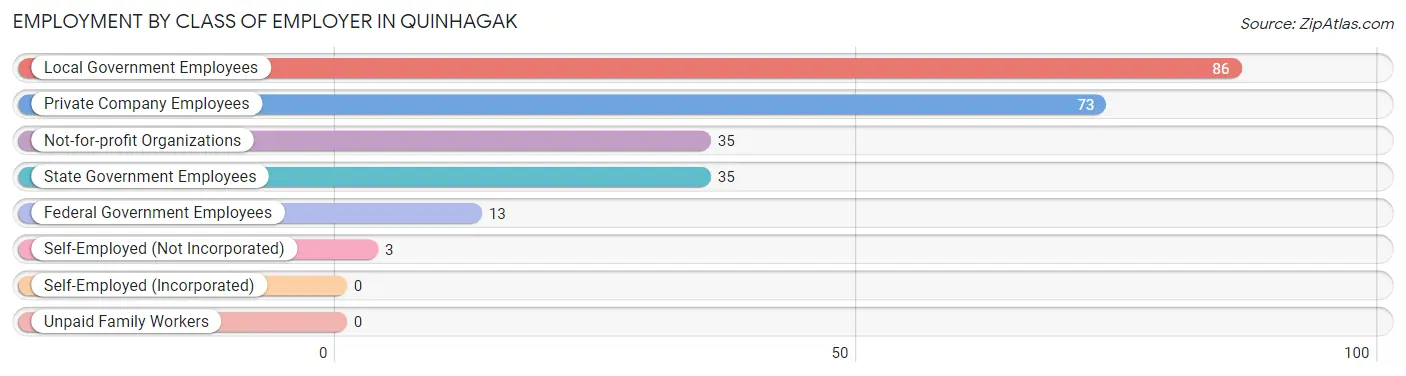
| Employer Class | # Employees | % Employees |
| Private Company Employees | 73 | 29.8% |
| Self-Employed (Incorporated) | 0 | 0.0% |
| Self-Employed (Not Incorporated) | 3 | 1.2% |
| Not-for-profit Organizations | 35 | 14.3% |
| Local Government Employees | 86 | 35.1% |
| State Government Employees | 35 | 14.3% |
| Federal Government Employees | 13 | 5.3% |
| Unpaid Family Workers | 0 | 0.0% |
| Total | 245 | 100.0% |
Employment Status by Age in Quinhagak
According to the labor force statistics for Quinhagak, out of the total population over 16 years of age (677), 50.8% or 344 individuals are in the labor force, with 25.3% or 87 of them unemployed. The age group with the highest labor force participation rate is 25 to 29 years, with 76.3% or 45 individuals in the labor force. Within the labor force, the 16 to 19 years age range has the highest percentage of unemployed individuals, with 100.0% or 7 of them being unemployed.
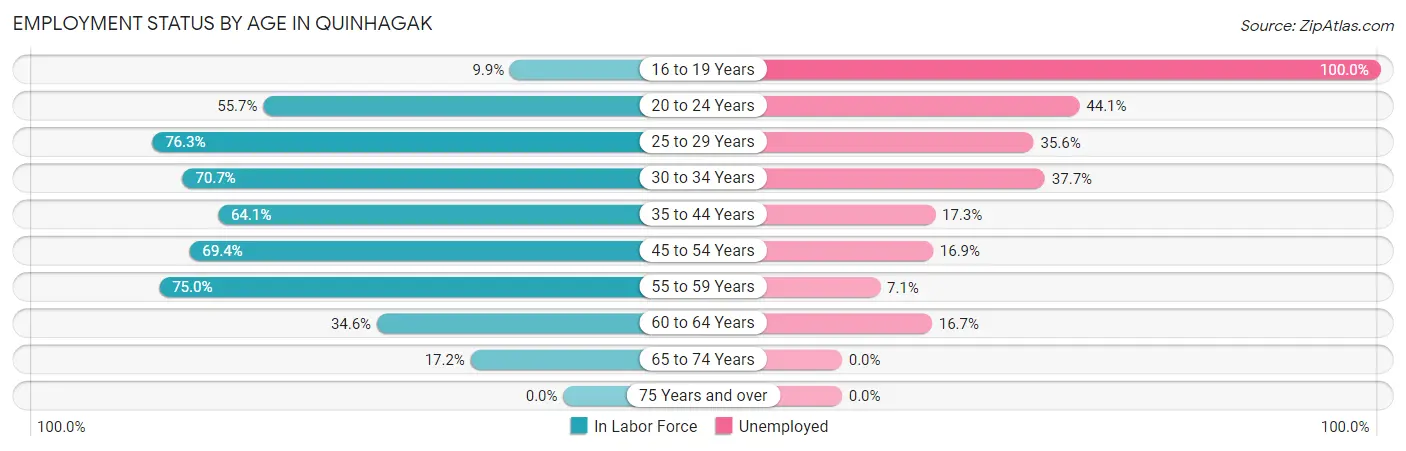
| Age Bracket | In Labor Force | Unemployed |
| 16 to 19 Years | 7 (9.9%) | 7 (100.0%) |
| 20 to 24 Years | 34 (55.7%) | 15 (44.1%) |
| 25 to 29 Years | 45 (76.3%) | 16 (35.6%) |
| 30 to 34 Years | 53 (70.7%) | 20 (37.7%) |
| 35 to 44 Years | 75 (64.1%) | 13 (17.3%) |
| 45 to 54 Years | 59 (69.4%) | 10 (16.9%) |
| 55 to 59 Years | 42 (75.0%) | 3 (7.1%) |
| 60 to 64 Years | 18 (34.6%) | 3 (16.7%) |
| 65 to 74 Years | 11 (17.2%) | 0 (0.0%) |
| 75 Years and over | 0 (0.0%) | 0 (0.0%) |
| Total | 344 (50.8%) | 87 (25.3%) |
Employment Status by Educational Attainment in Quinhagak
According to labor force statistics for Quinhagak, 65.8% of individuals (292) out of the total population between 25 and 64 years of age (444) are in the labor force, with 22.3% or 65 of them being unemployed. The group with the highest labor force participation rate are those with the educational attainment of college / associate degree, with 76.3% or 61 individuals in the labor force. Within the labor force, individuals with less than high school education have the highest percentage of unemployment, with 36.1% or 26 of them being unemployed.
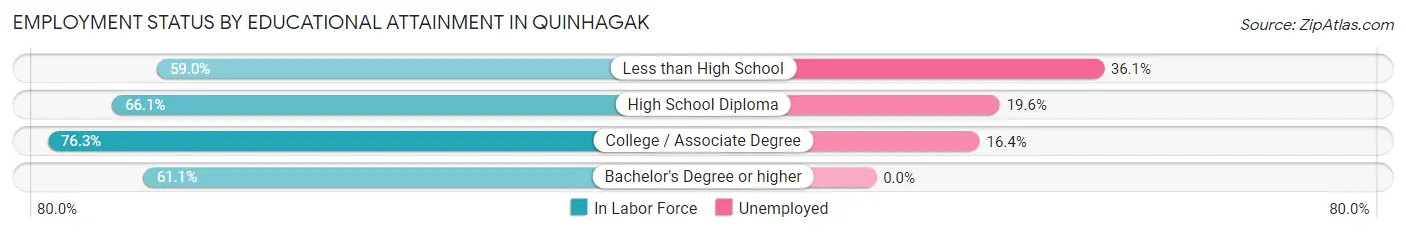
| Educational Attainment | In Labor Force | Unemployed |
| Less than High School | 72 (59.0%) | 44 (36.1%) |
| High School Diploma | 148 (66.1%) | 44 (19.6%) |
| College / Associate Degree | 61 (76.3%) | 13 (16.4%) |
| Bachelor's Degree or higher | 11 (61.1%) | 0 (0.0%) |
| Total | 292 (65.8%) | 99 (22.3%) |
Employment Occupations by Sex in Quinhagak
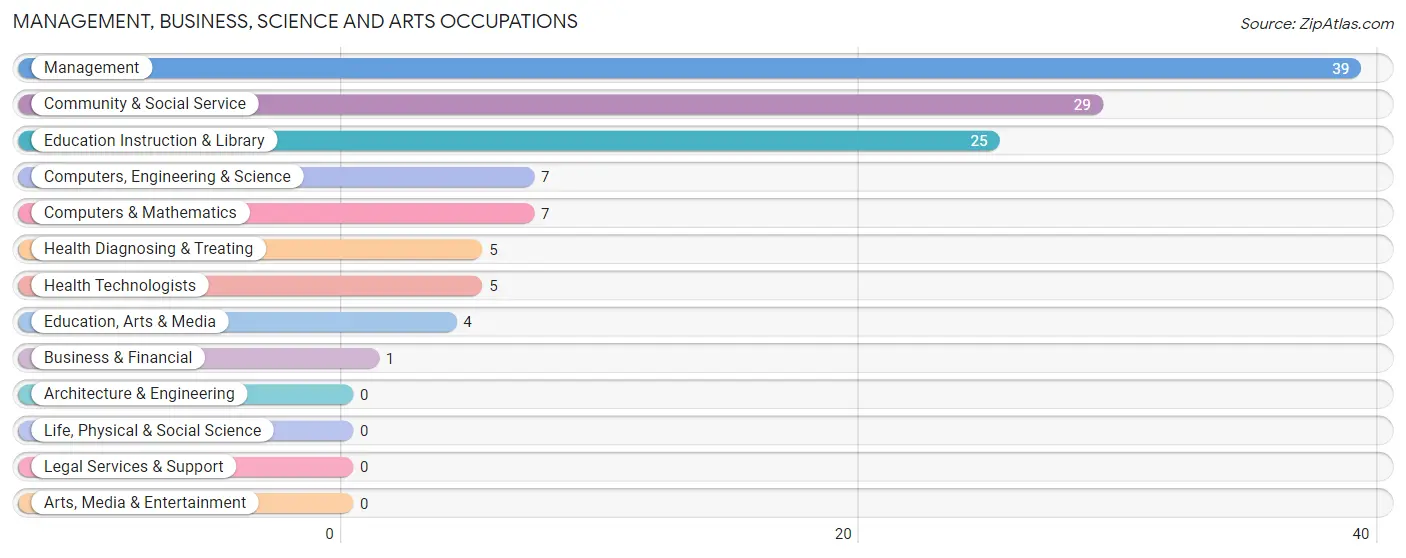
Management, Business, Science and Arts Occupations
The most common Management, Business, Science and Arts occupations in Quinhagak are Management (39 | 15.2%), Community & Social Service (29 | 11.3%), Education Instruction & Library (25 | 9.7%), Computers, Engineering & Science (7 | 2.7%), and Computers & Mathematics (7 | 2.7%).
Management, Business, Science and Arts Occupations by Sex
Within the Management, Business, Science and Arts occupations in Quinhagak, the most male-oriented occupations are Business & Financial (100.0%), Computers, Engineering & Science (100.0%), and Computers & Mathematics (100.0%), while the most female-oriented occupations are Education, Arts & Media (100.0%), Health Diagnosing & Treating (100.0%), and Health Technologists (100.0%).
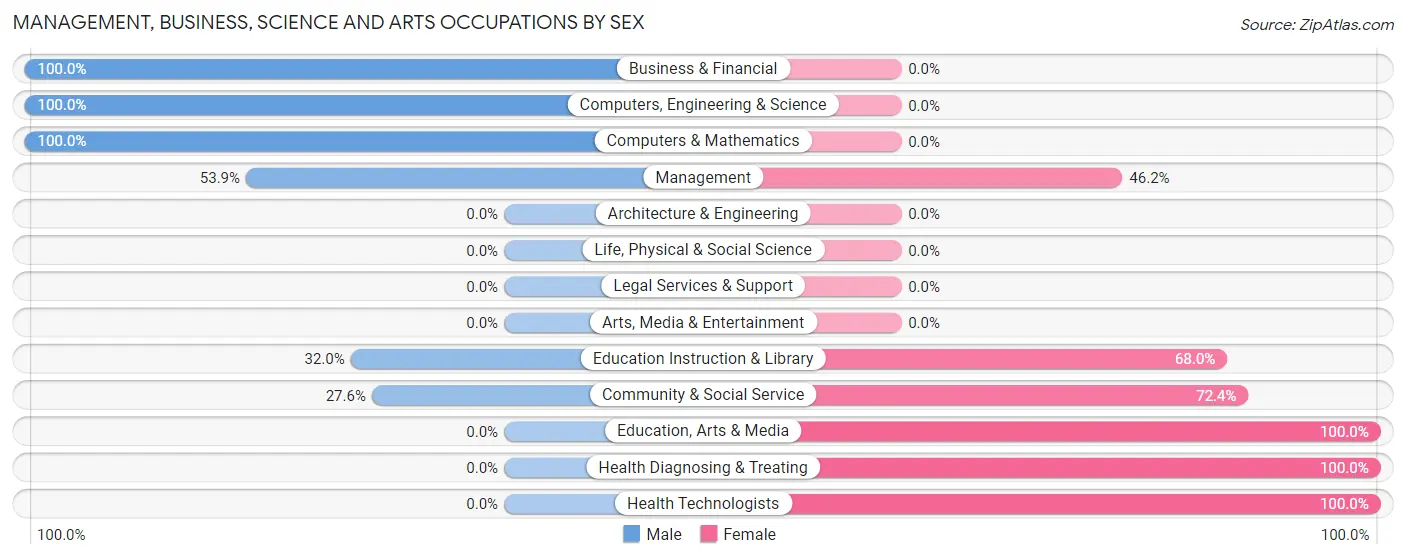
| Occupation | Male | Female |
| Management | 21 (53.8%) | 18 (46.2%) |
| Business & Financial | 1 (100.0%) | 0 (0.0%) |
| Computers, Engineering & Science | 7 (100.0%) | 0 (0.0%) |
| Computers & Mathematics | 7 (100.0%) | 0 (0.0%) |
| Architecture & Engineering | 0 (0.0%) | 0 (0.0%) |
| Life, Physical & Social Science | 0 (0.0%) | 0 (0.0%) |
| Community & Social Service | 8 (27.6%) | 21 (72.4%) |
| Education, Arts & Media | 0 (0.0%) | 4 (100.0%) |
| Legal Services & Support | 0 (0.0%) | 0 (0.0%) |
| Education Instruction & Library | 8 (32.0%) | 17 (68.0%) |
| Arts, Media & Entertainment | 0 (0.0%) | 0 (0.0%) |
| Health Diagnosing & Treating | 0 (0.0%) | 5 (100.0%) |
| Health Technologists | 0 (0.0%) | 5 (100.0%) |
| Total (Category) | 37 (45.7%) | 44 (54.3%) |
| Total (Overall) | 120 (46.7%) | 137 (53.3%) |
Services Occupations
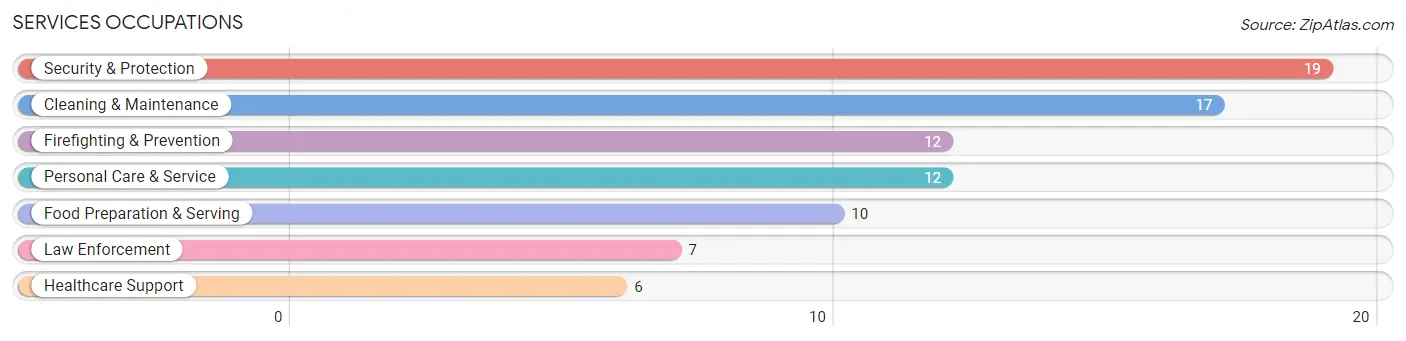
The most common Services occupations in Quinhagak are Security & Protection (19 | 7.4%), Cleaning & Maintenance (17 | 6.6%), Firefighting & Prevention (12 | 4.7%), Personal Care & Service (12 | 4.7%), and Food Preparation & Serving (10 | 3.9%).
Services Occupations by Sex
Within the Services occupations in Quinhagak, the most male-oriented occupations are Cleaning & Maintenance (58.8%), Law Enforcement (57.1%), and Security & Protection (21.0%), while the most female-oriented occupations are Healthcare Support (100.0%), Firefighting & Prevention (100.0%), and Food Preparation & Serving (100.0%).
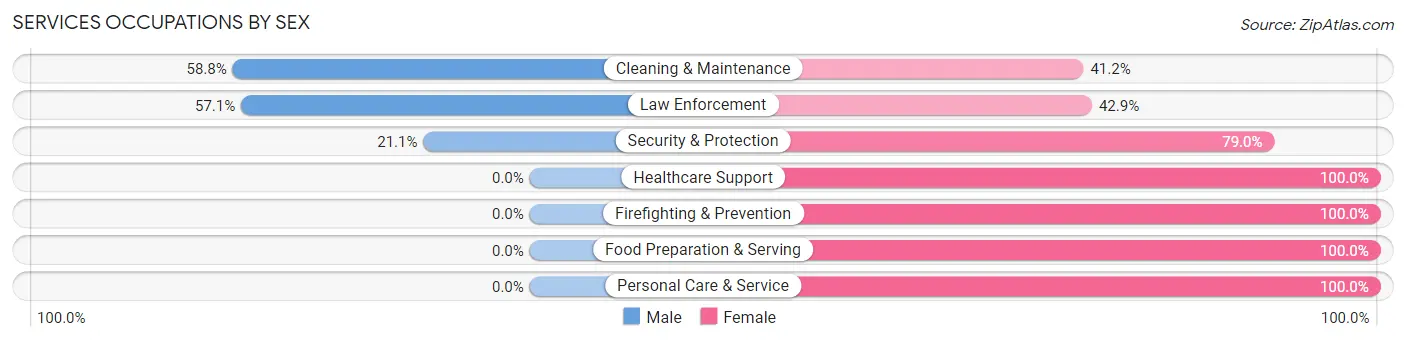
| Occupation | Male | Female |
| Healthcare Support | 0 (0.0%) | 6 (100.0%) |
| Security & Protection | 4 (21.0%) | 15 (78.9%) |
| Firefighting & Prevention | 0 (0.0%) | 12 (100.0%) |
| Law Enforcement | 4 (57.1%) | 3 (42.9%) |
| Food Preparation & Serving | 0 (0.0%) | 10 (100.0%) |
| Cleaning & Maintenance | 10 (58.8%) | 7 (41.2%) |
| Personal Care & Service | 0 (0.0%) | 12 (100.0%) |
| Total (Category) | 14 (21.9%) | 50 (78.1%) |
| Total (Overall) | 120 (46.7%) | 137 (53.3%) |
Sales and Office Occupations
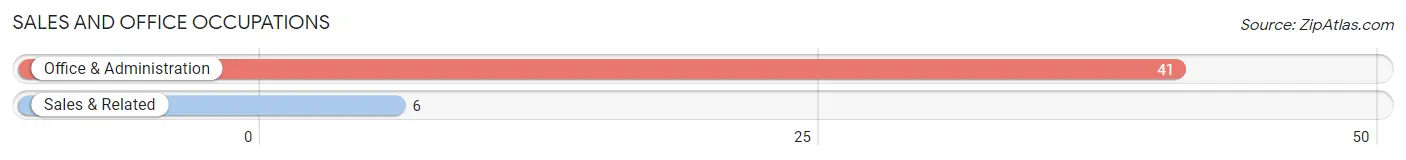
The most common Sales and Office occupations in Quinhagak are Office & Administration (41 | 16.0%), and Sales & Related (6 | 2.3%).
Sales and Office Occupations by Sex
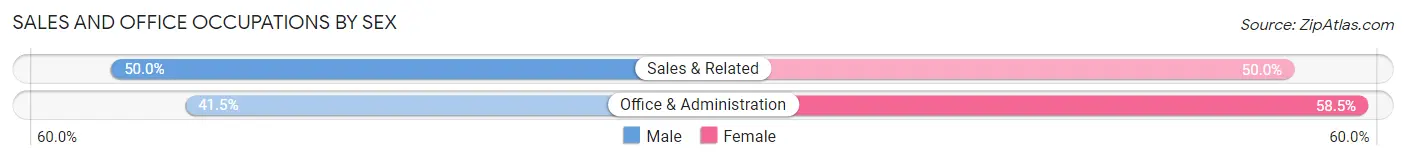
| Occupation | Male | Female |
| Sales & Related | 3 (50.0%) | 3 (50.0%) |
| Office & Administration | 17 (41.5%) | 24 (58.5%) |
| Total (Category) | 20 (42.5%) | 27 (57.5%) |
| Total (Overall) | 120 (46.7%) | 137 (53.3%) |
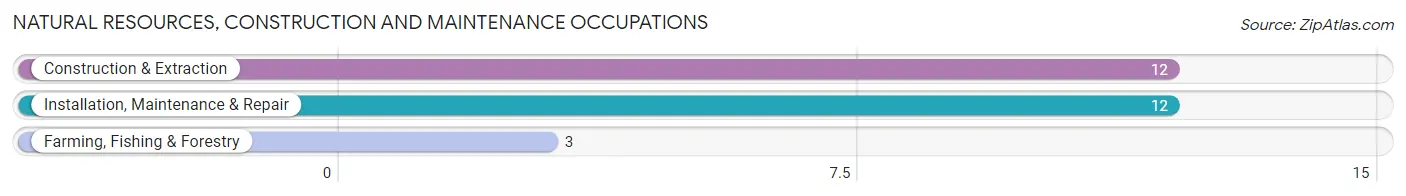
Natural Resources, Construction and Maintenance Occupations
The most common Natural Resources, Construction and Maintenance occupations in Quinhagak are Construction & Extraction (12 | 4.7%), Installation, Maintenance & Repair (12 | 4.7%), and Farming, Fishing & Forestry (3 | 1.2%).
Natural Resources, Construction and Maintenance Occupations by Sex
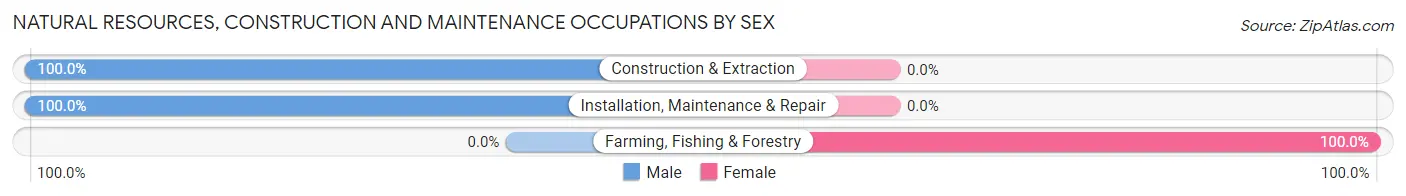
| Occupation | Male | Female |
| Farming, Fishing & Forestry | 0 (0.0%) | 3 (100.0%) |
| Construction & Extraction | 12 (100.0%) | 0 (0.0%) |
| Installation, Maintenance & Repair | 12 (100.0%) | 0 (0.0%) |
| Total (Category) | 24 (88.9%) | 3 (11.1%) |
| Total (Overall) | 120 (46.7%) | 137 (53.3%) |
Production, Transportation and Moving Occupations
The most common Production, Transportation and Moving occupations in Quinhagak are Material Moving (15 | 5.8%), Production (12 | 4.7%), and Transportation (11 | 4.3%).
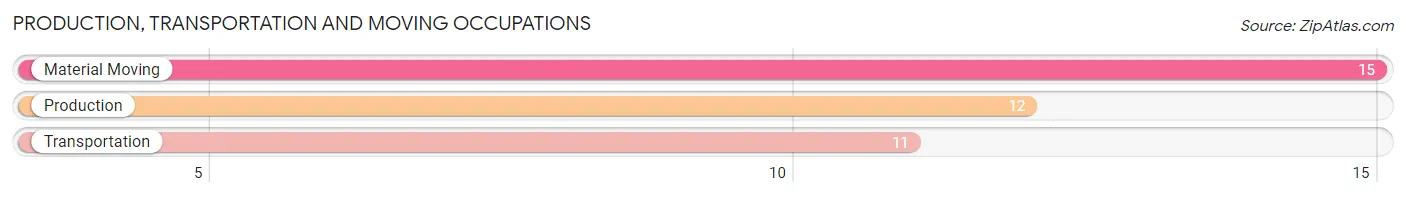
Production, Transportation and Moving Occupations by Sex
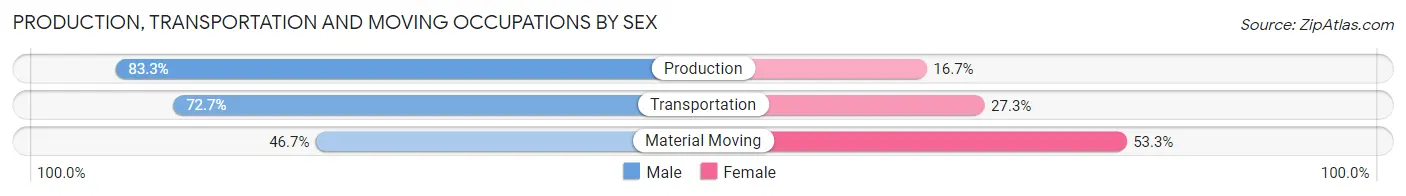
| Occupation | Male | Female |
| Production | 10 (83.3%) | 2 (16.7%) |
| Transportation | 8 (72.7%) | 3 (27.3%) |
| Material Moving | 7 (46.7%) | 8 (53.3%) |
| Total (Category) | 25 (65.8%) | 13 (34.2%) |
| Total (Overall) | 120 (46.7%) | 137 (53.3%) |
Employment Industries by Sex in Quinhagak
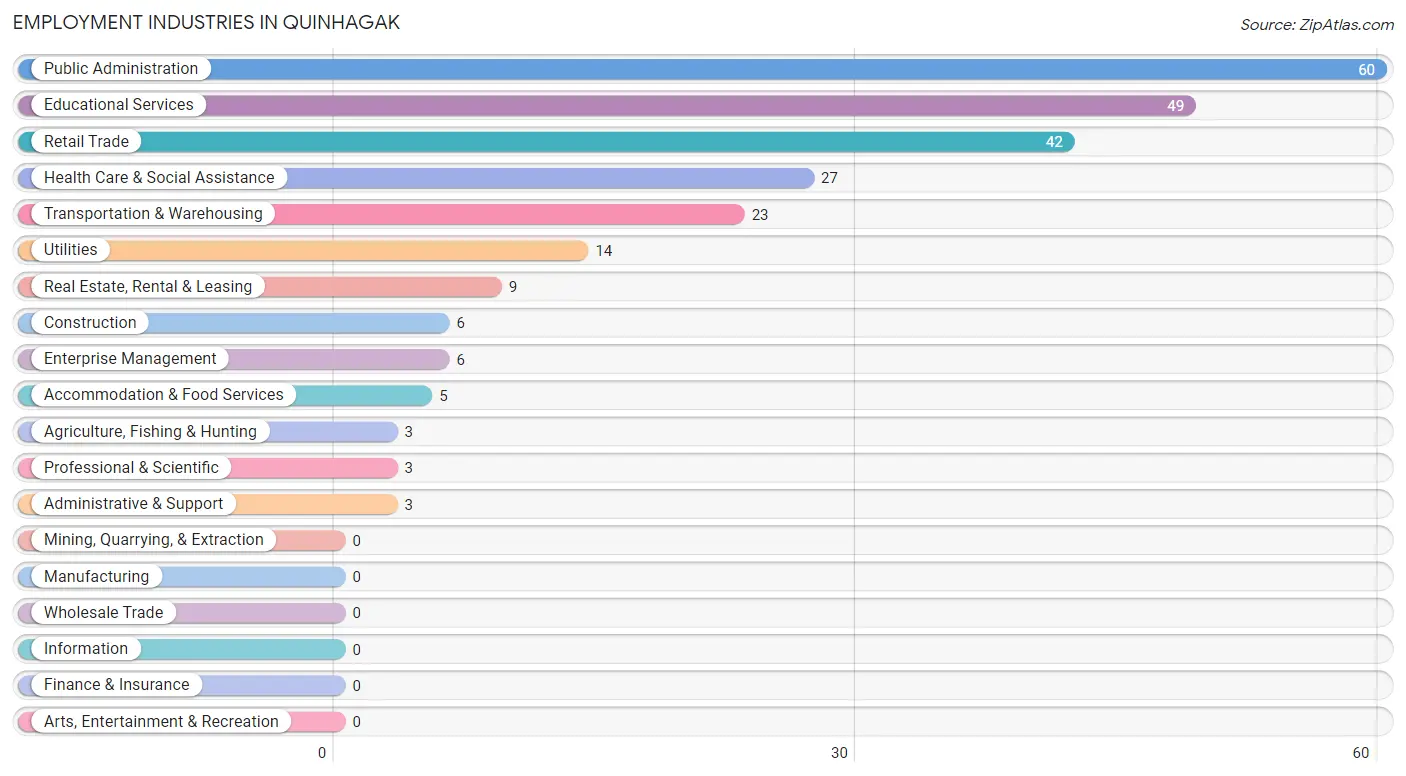
Employment Industries in Quinhagak
The major employment industries in Quinhagak include Public Administration (60 | 23.4%), Educational Services (49 | 19.1%), Retail Trade (42 | 16.3%), Health Care & Social Assistance (27 | 10.5%), and Transportation & Warehousing (23 | 8.9%).
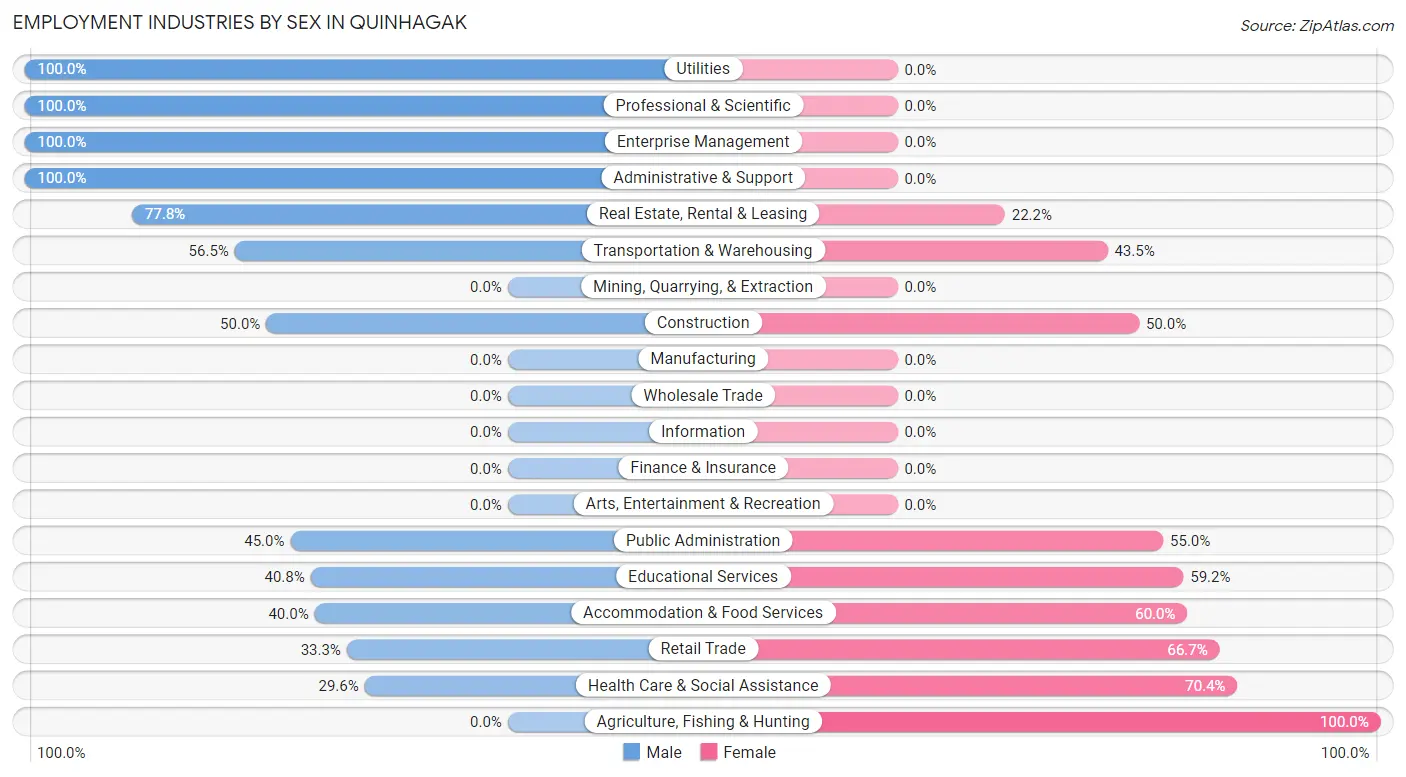
Employment Industries by Sex in Quinhagak
The Quinhagak industries that see more men than women are Utilities (100.0%), Professional & Scientific (100.0%), and Enterprise Management (100.0%), whereas the industries that tend to have a higher number of women are Agriculture, Fishing & Hunting (100.0%), Health Care & Social Assistance (70.4%), and Retail Trade (66.7%).
| Industry | Male | Female |
| Agriculture, Fishing & Hunting | 0 (0.0%) | 3 (100.0%) |
| Mining, Quarrying, & Extraction | 0 (0.0%) | 0 (0.0%) |
| Construction | 3 (50.0%) | 3 (50.0%) |
| Manufacturing | 0 (0.0%) | 0 (0.0%) |
| Wholesale Trade | 0 (0.0%) | 0 (0.0%) |
| Retail Trade | 14 (33.3%) | 28 (66.7%) |
| Transportation & Warehousing | 13 (56.5%) | 10 (43.5%) |
| Utilities | 14 (100.0%) | 0 (0.0%) |
| Information | 0 (0.0%) | 0 (0.0%) |
| Finance & Insurance | 0 (0.0%) | 0 (0.0%) |
| Real Estate, Rental & Leasing | 7 (77.8%) | 2 (22.2%) |
| Professional & Scientific | 3 (100.0%) | 0 (0.0%) |
| Enterprise Management | 6 (100.0%) | 0 (0.0%) |
| Administrative & Support | 3 (100.0%) | 0 (0.0%) |
| Educational Services | 20 (40.8%) | 29 (59.2%) |
| Health Care & Social Assistance | 8 (29.6%) | 19 (70.4%) |
| Arts, Entertainment & Recreation | 0 (0.0%) | 0 (0.0%) |
| Accommodation & Food Services | 2 (40.0%) | 3 (60.0%) |
| Public Administration | 27 (45.0%) | 33 (55.0%) |
| Total | 120 (46.7%) | 137 (53.3%) |
Education in Quinhagak
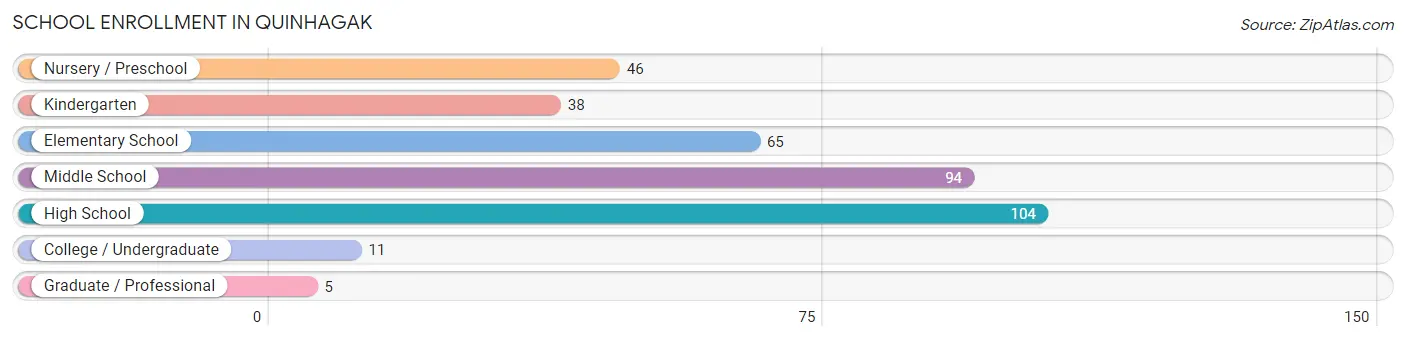
School Enrollment in Quinhagak
The most common levels of schooling among the 363 students in Quinhagak are high school (104 | 28.6%), middle school (94 | 25.9%), and elementary school (65 | 17.9%).
| School Level | # Students | % Students |
| Nursery / Preschool | 46 | 12.7% |
| Kindergarten | 38 | 10.5% |
| Elementary School | 65 | 17.9% |
| Middle School | 94 | 25.9% |
| High School | 104 | 28.6% |
| College / Undergraduate | 11 | 3.0% |
| Graduate / Professional | 5 | 1.4% |
| Total | 363 | 100.0% |
School Enrollment by Age by Funding Source in Quinhagak
Out of a total of 363 students who are enrolled in schools in Quinhagak, 1 (0.3%) attend a private institution, while the remaining 362 (99.7%) are enrolled in public schools. The age group of 20 to 24 year olds has the highest likelihood of being enrolled in private schools, with 1 (100.0% in the age bracket) enrolled. Conversely, the age group of 3 to 4 year olds has the lowest likelihood of being enrolled in a private school, with 48 (100.0% in the age bracket) attending a public institution.
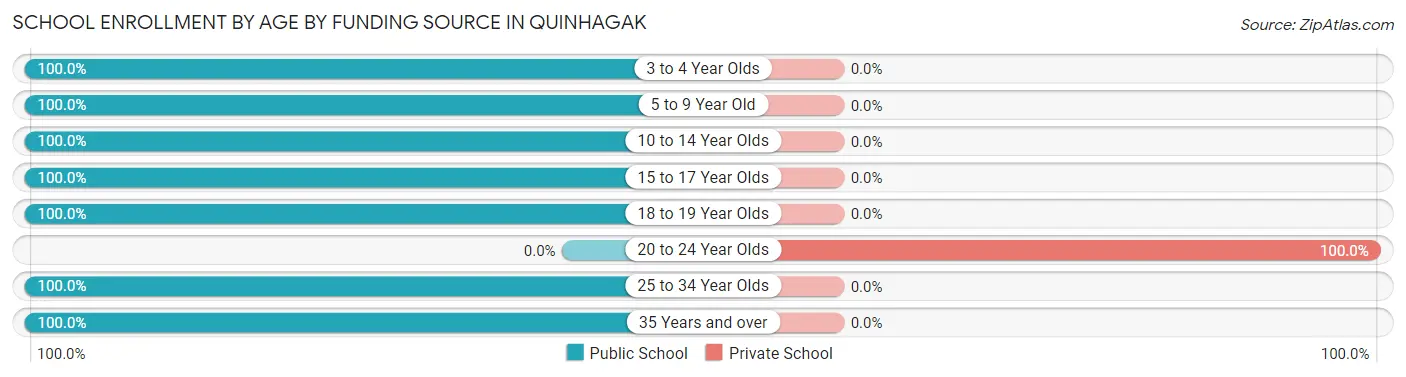
| Age Bracket | Public School | Private School |
| 3 to 4 Year Olds | 48 (100.0%) | 0 (0.0%) |
| 5 to 9 Year Old | 99 (100.0%) | 0 (0.0%) |
| 10 to 14 Year Olds | 122 (100.0%) | 0 (0.0%) |
| 15 to 17 Year Olds | 75 (100.0%) | 0 (0.0%) |
| 18 to 19 Year Olds | 3 (100.0%) | 0 (0.0%) |
| 20 to 24 Year Olds | 0 (0.0%) | 1 (100.0%) |
| 25 to 34 Year Olds | 6 (100.0%) | 0 (0.0%) |
| 35 Years and over | 9 (100.0%) | 0 (0.0%) |
| Total | 362 (99.7%) | 1 (0.3%) |
Educational Attainment by Field of Study in Quinhagak
Education (6 | 33.3%), business (5 | 27.8%), science & technology (4 | 22.2%), and bio, nature & agricultural (3 | 16.7%) are the most common fields of study among 18 individuals in Quinhagak who have obtained a bachelor's degree or higher.
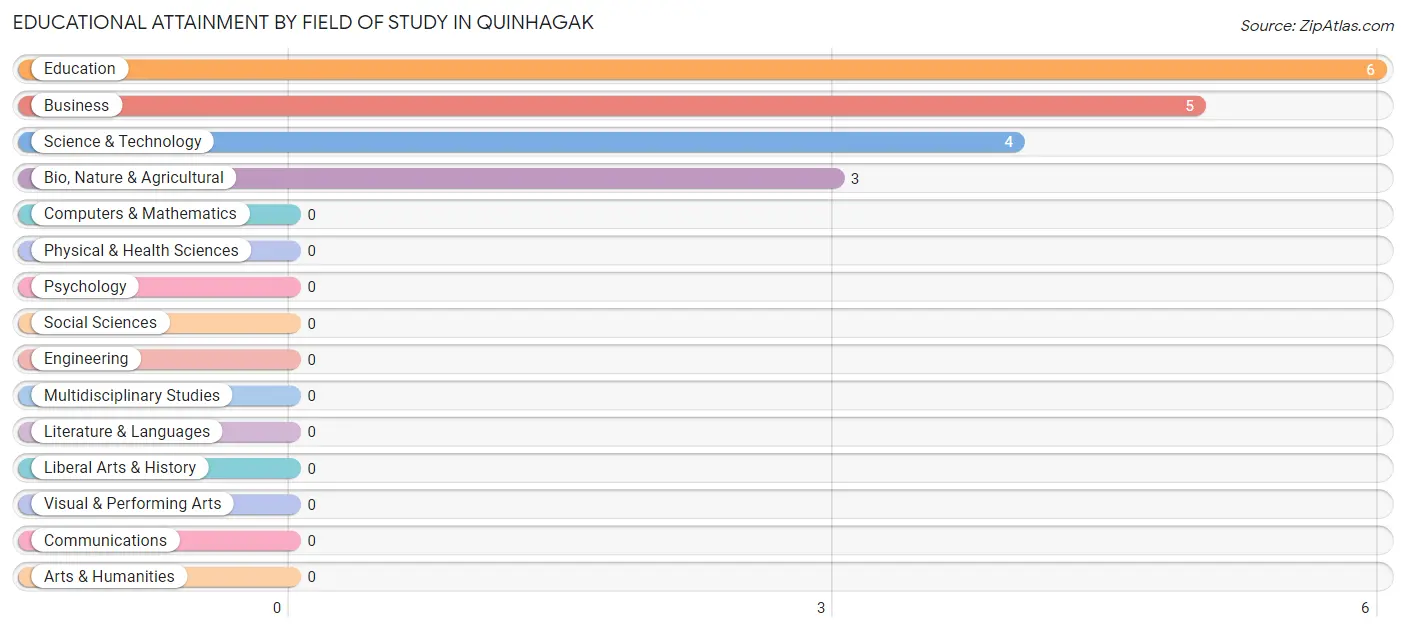
| Field of Study | # Graduates | % Graduates |
| Computers & Mathematics | 0 | 0.0% |
| Bio, Nature & Agricultural | 3 | 16.7% |
| Physical & Health Sciences | 0 | 0.0% |
| Psychology | 0 | 0.0% |
| Social Sciences | 0 | 0.0% |
| Engineering | 0 | 0.0% |
| Multidisciplinary Studies | 0 | 0.0% |
| Science & Technology | 4 | 22.2% |
| Business | 5 | 27.8% |
| Education | 6 | 33.3% |
| Literature & Languages | 0 | 0.0% |
| Liberal Arts & History | 0 | 0.0% |
| Visual & Performing Arts | 0 | 0.0% |
| Communications | 0 | 0.0% |
| Arts & Humanities | 0 | 0.0% |
| Total | 18 | 100.0% |
Transportation & Commute in Quinhagak
Vehicle Availability by Sex in Quinhagak
The most prevalent vehicle ownership categories in Quinhagak are males with no vehicle (87, accounting for 76.3%) and females with no vehicle (117, making up 66.4%).
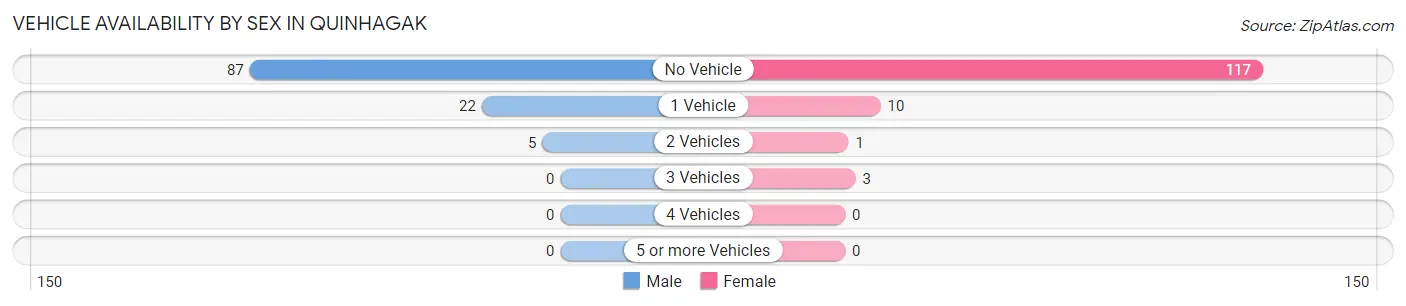
| Vehicles Available | Male | Female |
| No Vehicle | 87 (76.3%) | 117 (89.3%) |
| 1 Vehicle | 22 (19.3%) | 10 (7.6%) |
| 2 Vehicles | 5 (4.4%) | 1 (0.8%) |
| 3 Vehicles | 0 (0.0%) | 3 (2.3%) |
| 4 Vehicles | 0 (0.0%) | 0 (0.0%) |
| 5 or more Vehicles | 0 (0.0%) | 0 (0.0%) |
| Total | 114 (100.0%) | 131 (100.0%) |
Commute Time in Quinhagak
The most frequently occuring commute durations in Quinhagak are less than 5 minutes (150 commuters, 63.0%), 5 to 9 minutes (68 commuters, 28.6%), and 20 to 24 minutes (9 commuters, 3.8%).
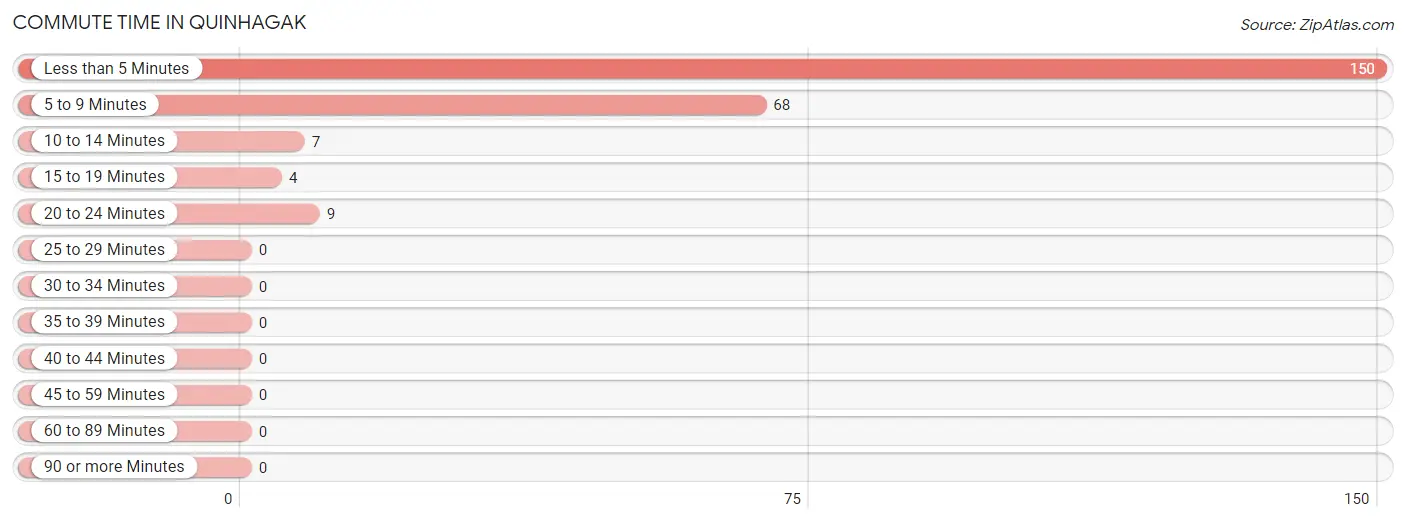
| Commute Time | # Commuters | % Commuters |
| Less than 5 Minutes | 150 | 63.0% |
| 5 to 9 Minutes | 68 | 28.6% |
| 10 to 14 Minutes | 7 | 2.9% |
| 15 to 19 Minutes | 4 | 1.7% |
| 20 to 24 Minutes | 9 | 3.8% |
| 25 to 29 Minutes | 0 | 0.0% |
| 30 to 34 Minutes | 0 | 0.0% |
| 35 to 39 Minutes | 0 | 0.0% |
| 40 to 44 Minutes | 0 | 0.0% |
| 45 to 59 Minutes | 0 | 0.0% |
| 60 to 89 Minutes | 0 | 0.0% |
| 90 or more Minutes | 0 | 0.0% |
Commute Time by Sex in Quinhagak
The most common commute times in Quinhagak are less than 5 minutes (73 commuters, 65.8%) for males and less than 5 minutes (77 commuters, 60.6%) for females.
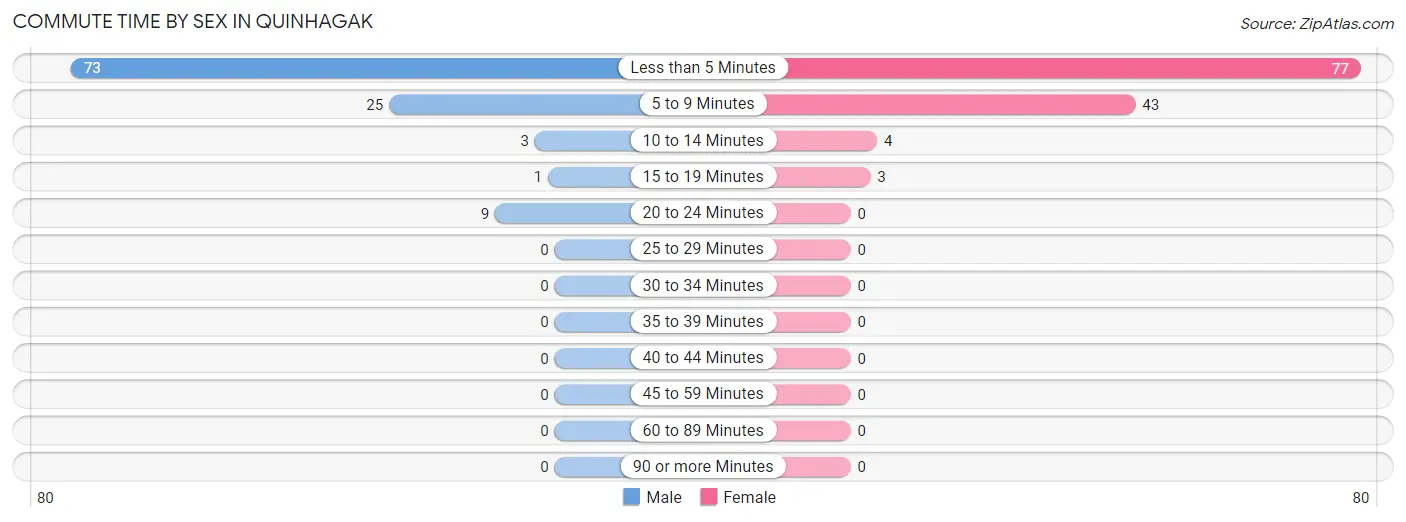
| Commute Time | Male | Female |
| Less than 5 Minutes | 73 (65.8%) | 77 (60.6%) |
| 5 to 9 Minutes | 25 (22.5%) | 43 (33.9%) |
| 10 to 14 Minutes | 3 (2.7%) | 4 (3.2%) |
| 15 to 19 Minutes | 1 (0.9%) | 3 (2.4%) |
| 20 to 24 Minutes | 9 (8.1%) | 0 (0.0%) |
| 25 to 29 Minutes | 0 (0.0%) | 0 (0.0%) |
| 30 to 34 Minutes | 0 (0.0%) | 0 (0.0%) |
| 35 to 39 Minutes | 0 (0.0%) | 0 (0.0%) |
| 40 to 44 Minutes | 0 (0.0%) | 0 (0.0%) |
| 45 to 59 Minutes | 0 (0.0%) | 0 (0.0%) |
| 60 to 89 Minutes | 0 (0.0%) | 0 (0.0%) |
| 90 or more Minutes | 0 (0.0%) | 0 (0.0%) |
Time of Departure to Work by Sex in Quinhagak
The most frequent times of departure to work in Quinhagak are 8:30 AM to 8:59 AM (41, 36.9%) for males and 9:00 AM to 9:59 AM (42, 33.1%) for females.
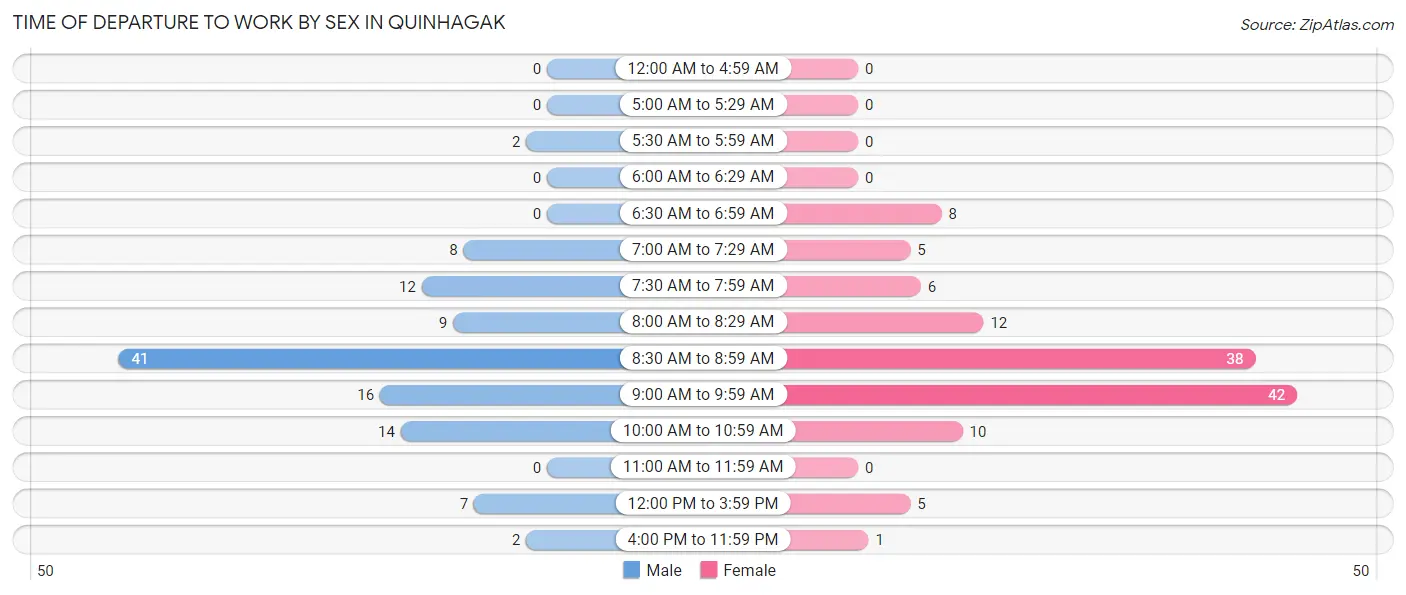
| Time of Departure | Male | Female |
| 12:00 AM to 4:59 AM | 0 (0.0%) | 0 (0.0%) |
| 5:00 AM to 5:29 AM | 0 (0.0%) | 0 (0.0%) |
| 5:30 AM to 5:59 AM | 2 (1.8%) | 0 (0.0%) |
| 6:00 AM to 6:29 AM | 0 (0.0%) | 0 (0.0%) |
| 6:30 AM to 6:59 AM | 0 (0.0%) | 8 (6.3%) |
| 7:00 AM to 7:29 AM | 8 (7.2%) | 5 (3.9%) |
| 7:30 AM to 7:59 AM | 12 (10.8%) | 6 (4.7%) |
| 8:00 AM to 8:29 AM | 9 (8.1%) | 12 (9.5%) |
| 8:30 AM to 8:59 AM | 41 (36.9%) | 38 (29.9%) |
| 9:00 AM to 9:59 AM | 16 (14.4%) | 42 (33.1%) |
| 10:00 AM to 10:59 AM | 14 (12.6%) | 10 (7.9%) |
| 11:00 AM to 11:59 AM | 0 (0.0%) | 0 (0.0%) |
| 12:00 PM to 3:59 PM | 7 (6.3%) | 5 (3.9%) |
| 4:00 PM to 11:59 PM | 2 (1.8%) | 1 (0.8%) |
| Total | 111 (100.0%) | 127 (100.0%) |
Housing Occupancy in Quinhagak
Occupancy by Ownership in Quinhagak
Of the total 237 dwellings in Quinhagak, owner-occupied units account for 196 (82.7%), while renter-occupied units make up 41 (17.3%).
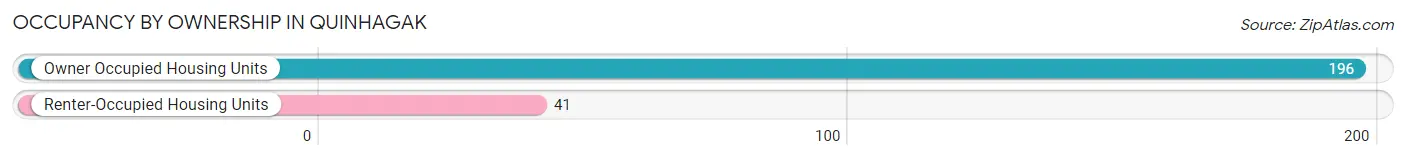
| Occupancy | # Housing Units | % Housing Units |
| Owner Occupied Housing Units | 196 | 82.7% |
| Renter-Occupied Housing Units | 41 | 17.3% |
| Total Occupied Housing Units | 237 | 100.0% |
Occupancy by Household Size in Quinhagak
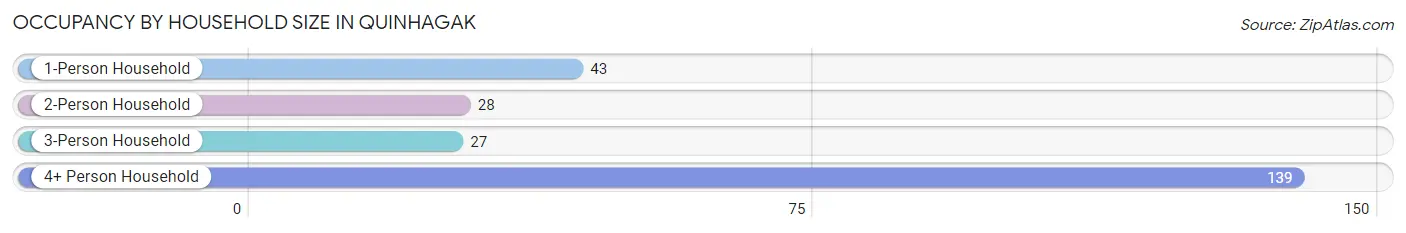
| Household Size | # Housing Units | % Housing Units |
| 1-Person Household | 43 | 18.1% |
| 2-Person Household | 28 | 11.8% |
| 3-Person Household | 27 | 11.4% |
| 4+ Person Household | 139 | 58.7% |
| Total Housing Units | 237 | 100.0% |
Occupancy by Ownership by Household Size in Quinhagak
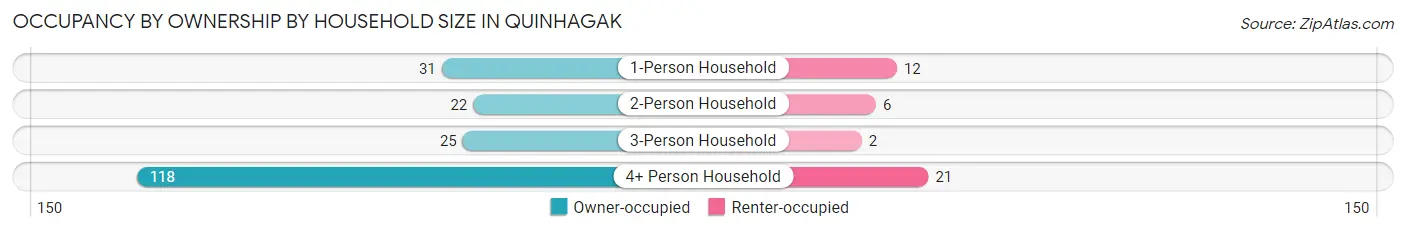
| Household Size | Owner-occupied | Renter-occupied |
| 1-Person Household | 31 (72.1%) | 12 (27.9%) |
| 2-Person Household | 22 (78.6%) | 6 (21.4%) |
| 3-Person Household | 25 (92.6%) | 2 (7.4%) |
| 4+ Person Household | 118 (84.9%) | 21 (15.1%) |
| Total Housing Units | 196 (82.7%) | 41 (17.3%) |
Occupancy by Educational Attainment in Quinhagak
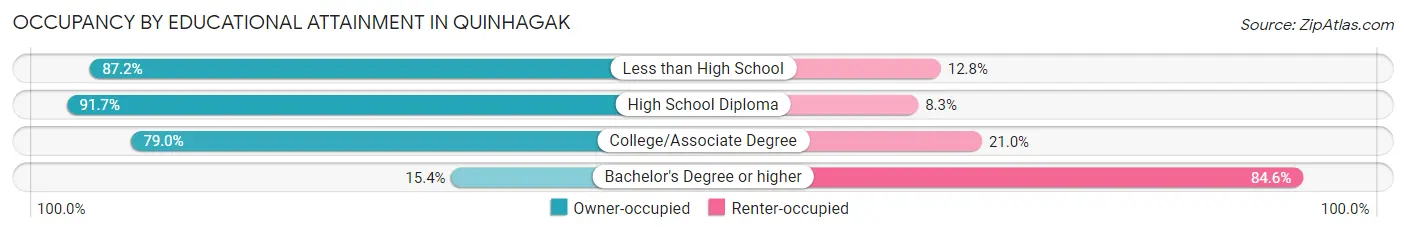
| Household Size | Owner-occupied | Renter-occupied |
| Less than High School | 68 (87.2%) | 10 (12.8%) |
| High School Diploma | 77 (91.7%) | 7 (8.3%) |
| College/Associate Degree | 49 (79.0%) | 13 (21.0%) |
| Bachelor's Degree or higher | 2 (15.4%) | 11 (84.6%) |
Occupancy by Age of Householder in Quinhagak
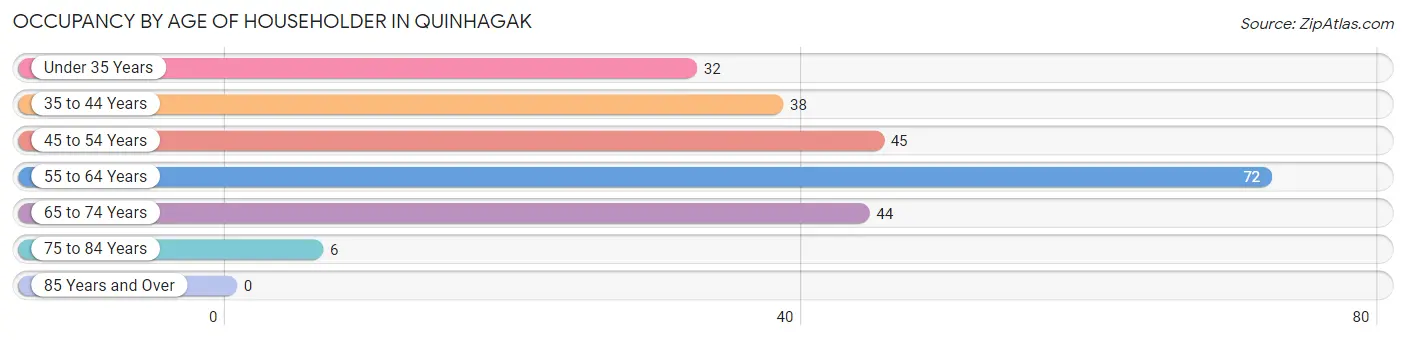
| Age Bracket | # Households | % Households |
| Under 35 Years | 32 | 13.5% |
| 35 to 44 Years | 38 | 16.0% |
| 45 to 54 Years | 45 | 19.0% |
| 55 to 64 Years | 72 | 30.4% |
| 65 to 74 Years | 44 | 18.6% |
| 75 to 84 Years | 6 | 2.5% |
| 85 Years and Over | 0 | 0.0% |
| Total | 237 | 100.0% |
Housing Finances in Quinhagak
Median Income by Occupancy in Quinhagak
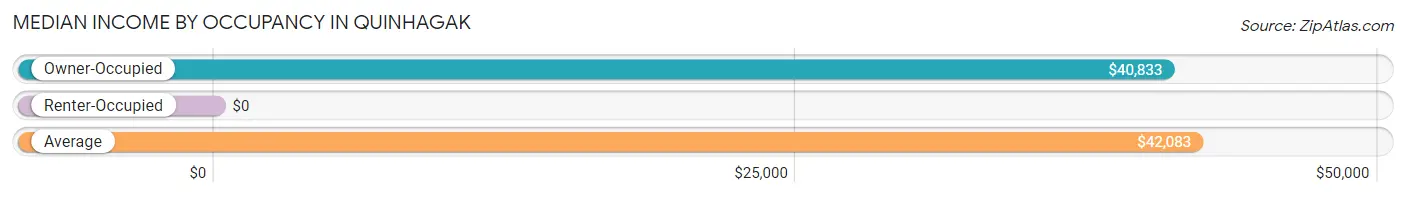
| Occupancy Type | # Households | Median Income |
| Owner-Occupied | 196 (82.7%) | $40,833 |
| Renter-Occupied | 41 (17.3%) | $0 |
| Average | 237 (100.0%) | $42,083 |
Occupancy by Householder Income Bracket in Quinhagak
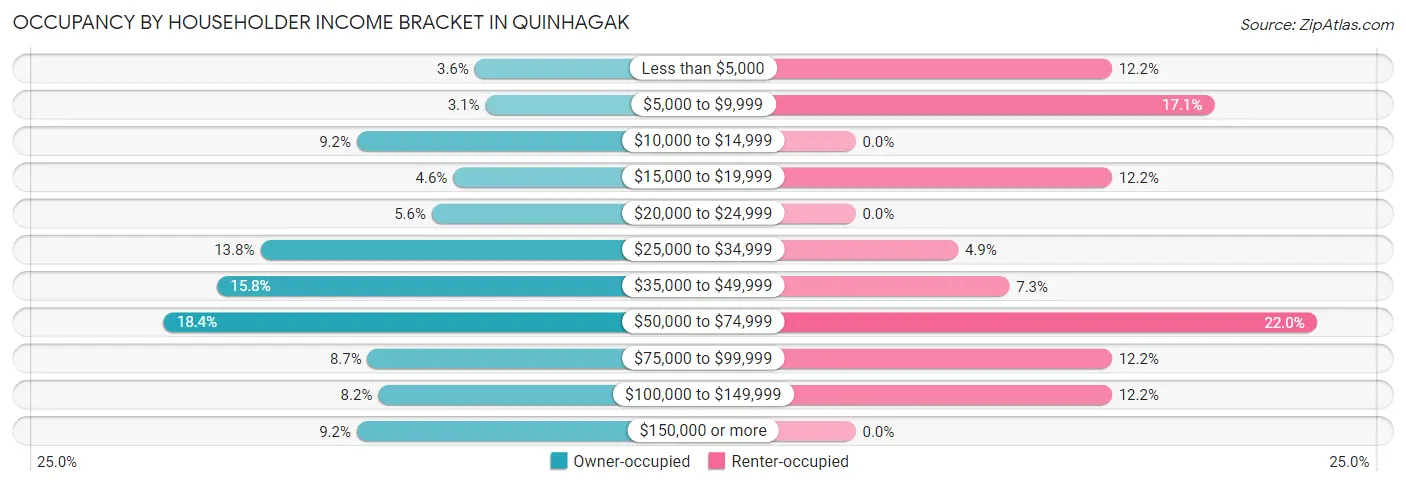
| Income Bracket | Owner-occupied | Renter-occupied |
| Less than $5,000 | 7 (3.6%) | 5 (12.2%) |
| $5,000 to $9,999 | 6 (3.1%) | 7 (17.1%) |
| $10,000 to $14,999 | 18 (9.2%) | 0 (0.0%) |
| $15,000 to $19,999 | 9 (4.6%) | 5 (12.2%) |
| $20,000 to $24,999 | 11 (5.6%) | 0 (0.0%) |
| $25,000 to $34,999 | 27 (13.8%) | 2 (4.9%) |
| $35,000 to $49,999 | 31 (15.8%) | 3 (7.3%) |
| $50,000 to $74,999 | 36 (18.4%) | 9 (22.0%) |
| $75,000 to $99,999 | 17 (8.7%) | 5 (12.2%) |
| $100,000 to $149,999 | 16 (8.2%) | 5 (12.2%) |
| $150,000 or more | 18 (9.2%) | 0 (0.0%) |
| Total | 196 (100.0%) | 41 (100.0%) |
Monthly Housing Cost Tiers in Quinhagak
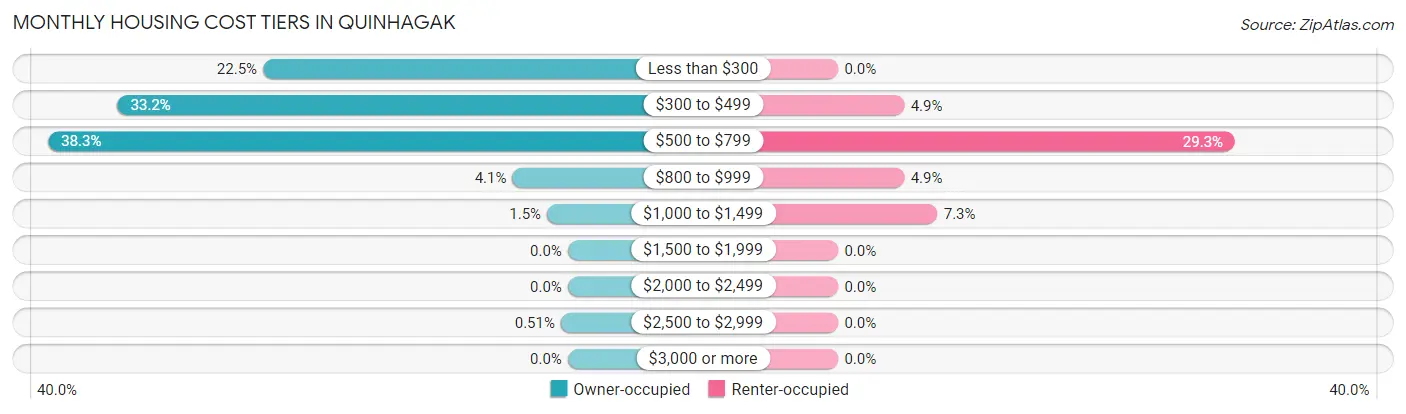
| Monthly Cost | Owner-occupied | Renter-occupied |
| Less than $300 | 44 (22.5%) | 0 (0.0%) |
| $300 to $499 | 65 (33.2%) | 2 (4.9%) |
| $500 to $799 | 75 (38.3%) | 12 (29.3%) |
| $800 to $999 | 8 (4.1%) | 2 (4.9%) |
| $1,000 to $1,499 | 3 (1.5%) | 3 (7.3%) |
| $1,500 to $1,999 | 0 (0.0%) | 0 (0.0%) |
| $2,000 to $2,499 | 0 (0.0%) | 0 (0.0%) |
| $2,500 to $2,999 | 1 (0.5%) | 0 (0.0%) |
| $3,000 or more | 0 (0.0%) | 0 (0.0%) |
| Total | 196 (100.0%) | 41 (100.0%) |
Physical Housing Characteristics in Quinhagak
Housing Structures in Quinhagak
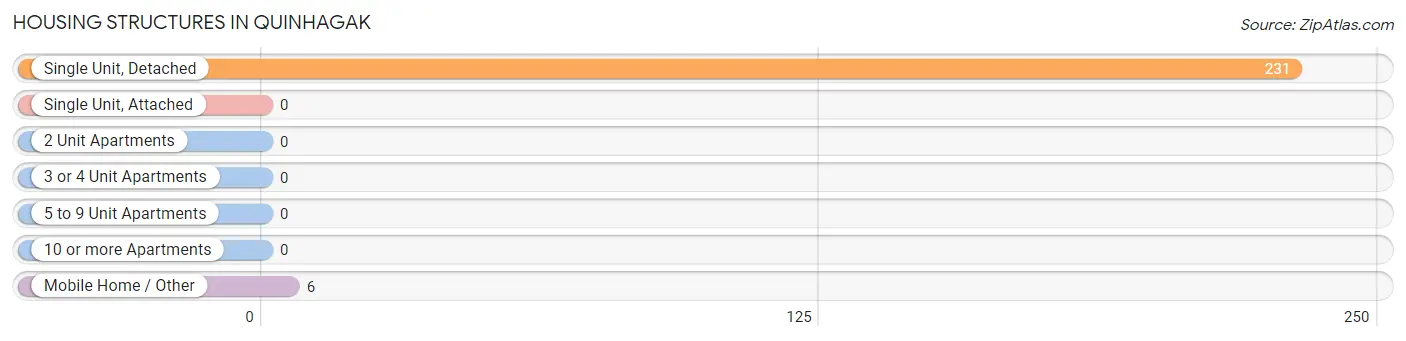
| Structure Type | # Housing Units | % Housing Units |
| Single Unit, Detached | 231 | 97.5% |
| Single Unit, Attached | 0 | 0.0% |
| 2 Unit Apartments | 0 | 0.0% |
| 3 or 4 Unit Apartments | 0 | 0.0% |
| 5 to 9 Unit Apartments | 0 | 0.0% |
| 10 or more Apartments | 0 | 0.0% |
| Mobile Home / Other | 6 | 2.5% |
| Total | 237 | 100.0% |
Housing Structures by Occupancy in Quinhagak
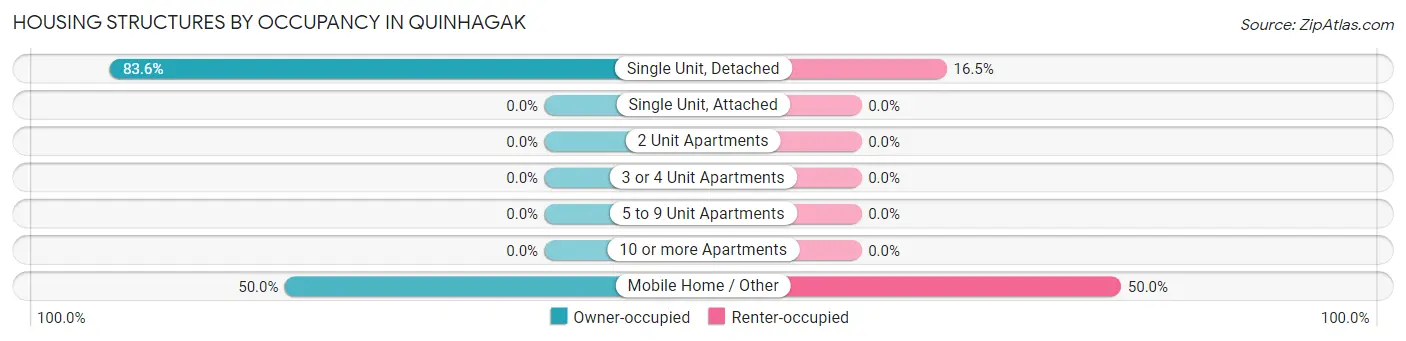
| Structure Type | Owner-occupied | Renter-occupied |
| Single Unit, Detached | 193 (83.6%) | 38 (16.5%) |
| Single Unit, Attached | 0 (0.0%) | 0 (0.0%) |
| 2 Unit Apartments | 0 (0.0%) | 0 (0.0%) |
| 3 or 4 Unit Apartments | 0 (0.0%) | 0 (0.0%) |
| 5 to 9 Unit Apartments | 0 (0.0%) | 0 (0.0%) |
| 10 or more Apartments | 0 (0.0%) | 0 (0.0%) |
| Mobile Home / Other | 3 (50.0%) | 3 (50.0%) |
| Total | 196 (82.7%) | 41 (17.3%) |
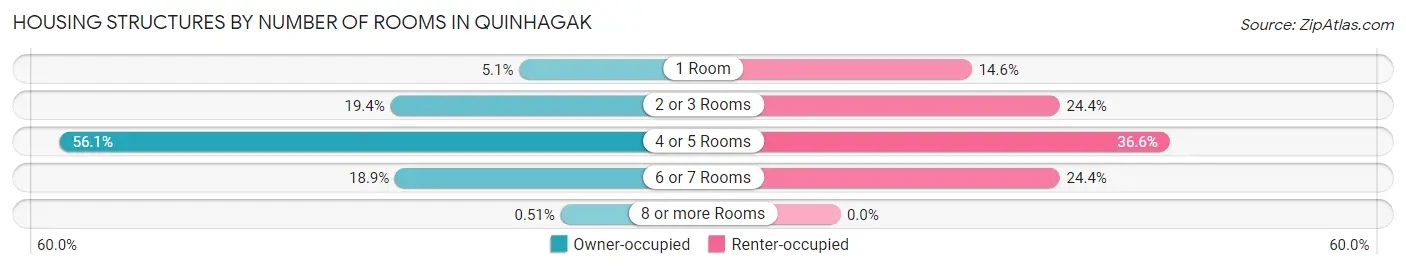
Housing Structures by Number of Rooms in Quinhagak
| Number of Rooms | Owner-occupied | Renter-occupied |
| 1 Room | 10 (5.1%) | 6 (14.6%) |
| 2 or 3 Rooms | 38 (19.4%) | 10 (24.4%) |
| 4 or 5 Rooms | 110 (56.1%) | 15 (36.6%) |
| 6 or 7 Rooms | 37 (18.9%) | 10 (24.4%) |
| 8 or more Rooms | 1 (0.5%) | 0 (0.0%) |
| Total | 196 (100.0%) | 41 (100.0%) |
Housing Structure by Heating Type in Quinhagak
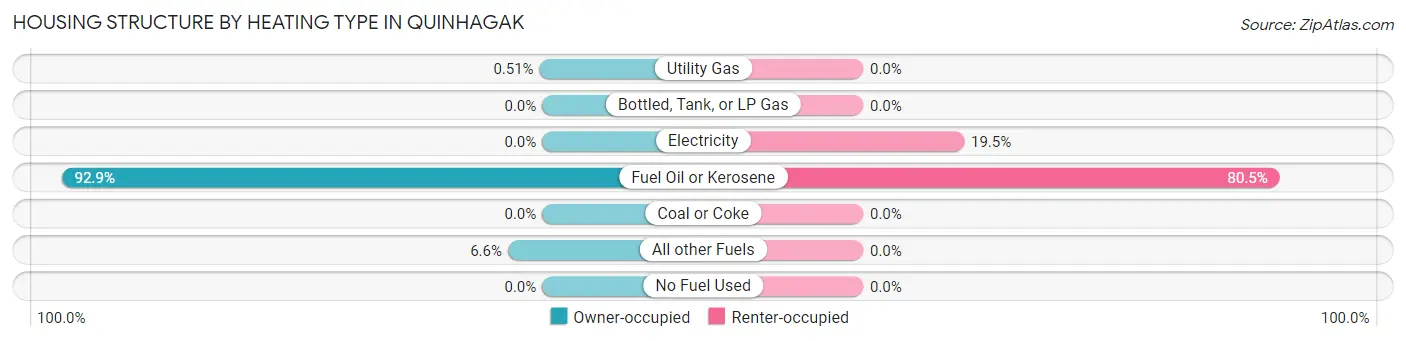
| Heating Type | Owner-occupied | Renter-occupied |
| Utility Gas | 1 (0.5%) | 0 (0.0%) |
| Bottled, Tank, or LP Gas | 0 (0.0%) | 0 (0.0%) |
| Electricity | 0 (0.0%) | 8 (19.5%) |
| Fuel Oil or Kerosene | 182 (92.9%) | 33 (80.5%) |
| Coal or Coke | 0 (0.0%) | 0 (0.0%) |
| All other Fuels | 13 (6.6%) | 0 (0.0%) |
| No Fuel Used | 0 (0.0%) | 0 (0.0%) |
| Total | 196 (100.0%) | 41 (100.0%) |
Household Vehicle Usage in Quinhagak
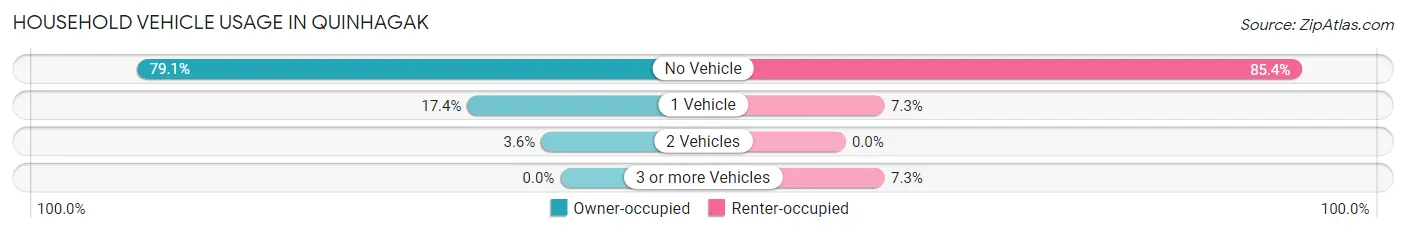
| Vehicles per Household | Owner-occupied | Renter-occupied |
| No Vehicle | 155 (79.1%) | 35 (85.4%) |
| 1 Vehicle | 34 (17.3%) | 3 (7.3%) |
| 2 Vehicles | 7 (3.6%) | 0 (0.0%) |
| 3 or more Vehicles | 0 (0.0%) | 3 (7.3%) |
| Total | 196 (100.0%) | 41 (100.0%) |
Real Estate & Mortgages in Quinhagak
Real Estate and Mortgage Overview in Quinhagak
| Characteristic | Without Mortgage | With Mortgage |
| Housing Units | 168 | 28 |
| Median Property Value | $16,400 | $141,700 |
| Median Household Income | $40,833 | $11 |
| Monthly Housing Costs | $454 | $0 |
| Real Estate Taxes | - | - |
Property Value by Mortgage Status in Quinhagak
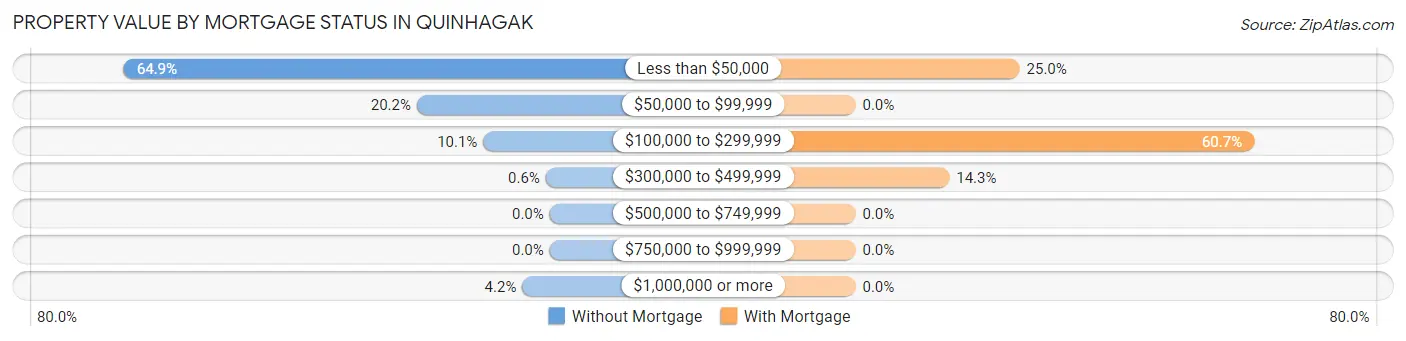
| Property Value | Without Mortgage | With Mortgage |
| Less than $50,000 | 109 (64.9%) | 7 (25.0%) |
| $50,000 to $99,999 | 34 (20.2%) | 0 (0.0%) |
| $100,000 to $299,999 | 17 (10.1%) | 17 (60.7%) |
| $300,000 to $499,999 | 1 (0.6%) | 4 (14.3%) |
| $500,000 to $749,999 | 0 (0.0%) | 0 (0.0%) |
| $750,000 to $999,999 | 0 (0.0%) | 0 (0.0%) |
| $1,000,000 or more | 7 (4.2%) | 0 (0.0%) |
| Total | 168 (100.0%) | 28 (100.0%) |
Household Income by Mortgage Status in Quinhagak
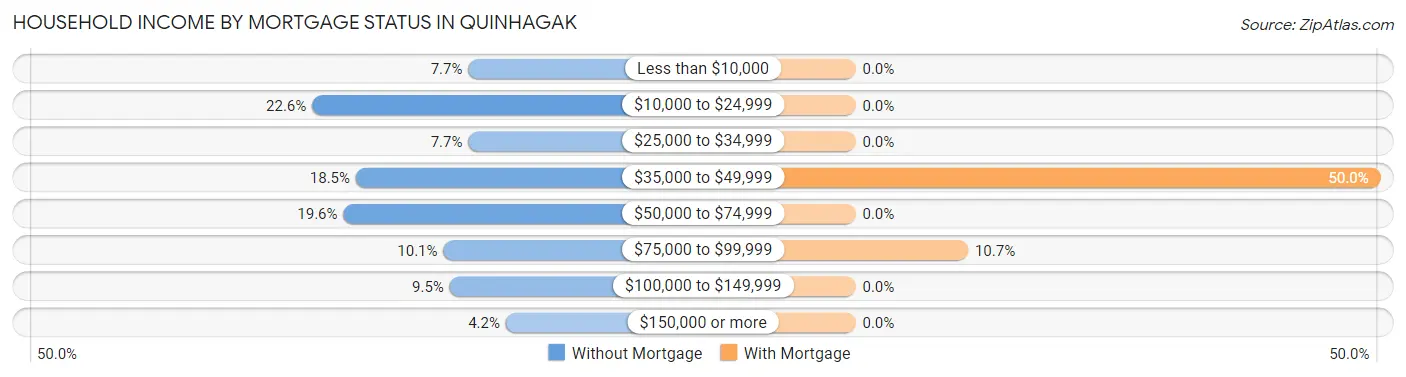
| Household Income | Without Mortgage | With Mortgage |
| Less than $10,000 | 13 (7.7%) | 0 (0.0%) |
| $10,000 to $24,999 | 38 (22.6%) | 0 (0.0%) |
| $25,000 to $34,999 | 13 (7.7%) | 0 (0.0%) |
| $35,000 to $49,999 | 31 (18.4%) | 14 (50.0%) |
| $50,000 to $74,999 | 33 (19.6%) | 0 (0.0%) |
| $75,000 to $99,999 | 17 (10.1%) | 3 (10.7%) |
| $100,000 to $149,999 | 16 (9.5%) | 0 (0.0%) |
| $150,000 or more | 7 (4.2%) | 0 (0.0%) |
| Total | 168 (100.0%) | 28 (100.0%) |
Property Value to Household Income Ratio in Quinhagak
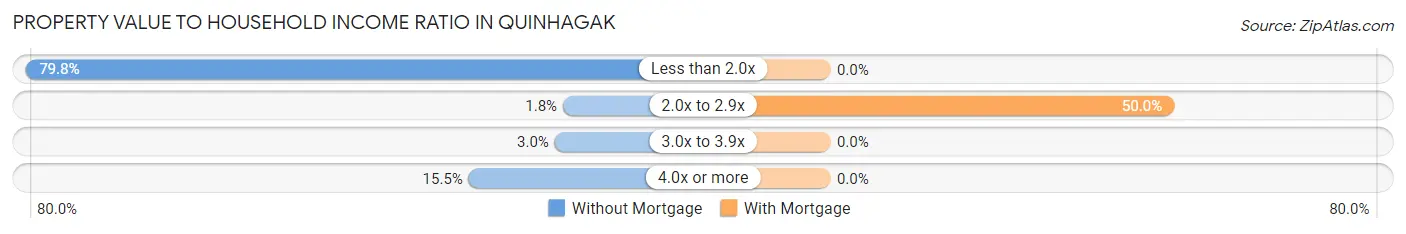
| Value-to-Income Ratio | Without Mortgage | With Mortgage |
| Less than 2.0x | 134 (79.8%) | 0 (0.0%) |
| 2.0x to 2.9x | 3 (1.8%) | 14 (50.0%) |
| 3.0x to 3.9x | 5 (3.0%) | 0 (0.0%) |
| 4.0x or more | 26 (15.5%) | 0 (0.0%) |
| Total | 168 (100.0%) | 28 (100.0%) |
Real Estate Taxes by Mortgage Status in Quinhagak
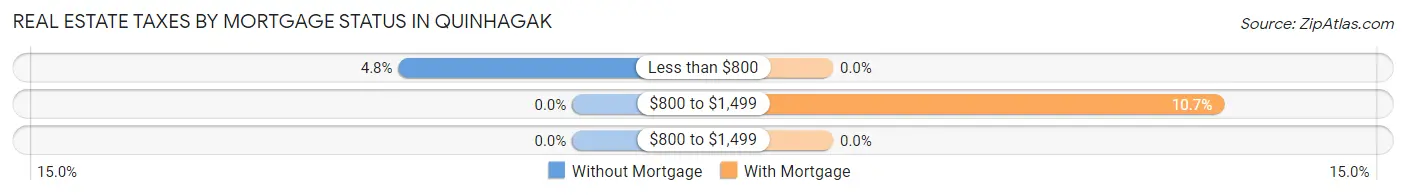
| Property Taxes | Without Mortgage | With Mortgage |
| Less than $800 | 8 (4.8%) | 0 (0.0%) |
| $800 to $1,499 | 0 (0.0%) | 3 (10.7%) |
| $800 to $1,499 | 0 (0.0%) | 0 (0.0%) |
| Total | 168 (100.0%) | 28 (100.0%) |
Health & Disability in Quinhagak
Health Insurance Coverage by Age in Quinhagak
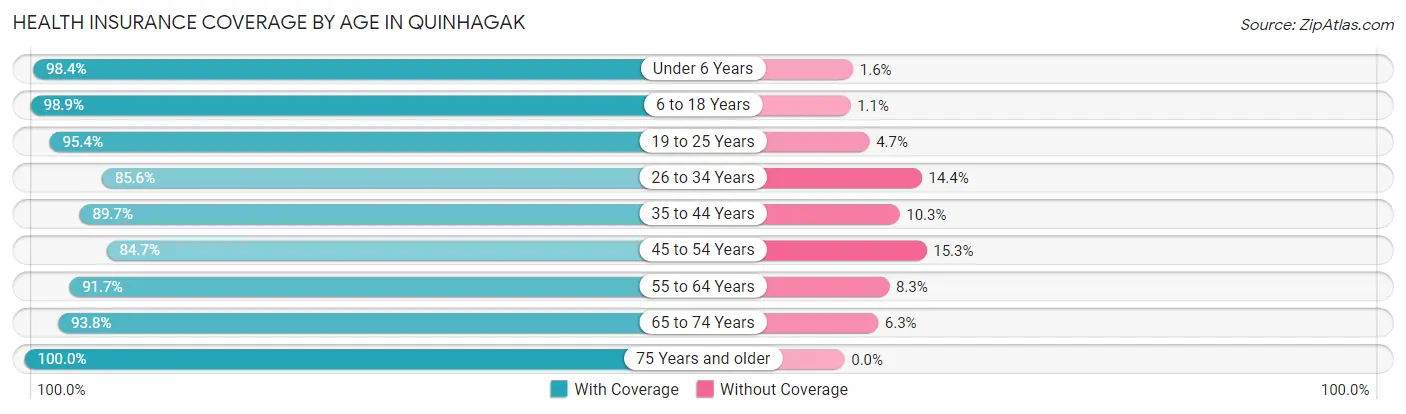
| Age Bracket | With Coverage | Without Coverage |
| Under 6 Years | 184 (98.4%) | 3 (1.6%) |
| 6 to 18 Years | 267 (98.9%) | 3 (1.1%) |
| 19 to 25 Years | 82 (95.4%) | 4 (4.6%) |
| 26 to 34 Years | 107 (85.6%) | 18 (14.4%) |
| 35 to 44 Years | 105 (89.7%) | 12 (10.3%) |
| 45 to 54 Years | 72 (84.7%) | 13 (15.3%) |
| 55 to 64 Years | 99 (91.7%) | 9 (8.3%) |
| 65 to 74 Years | 60 (93.8%) | 4 (6.2%) |
| 75 Years and older | 37 (100.0%) | 0 (0.0%) |
| Total | 1,013 (93.9%) | 66 (6.1%) |
Health Insurance Coverage by Citizenship Status in Quinhagak
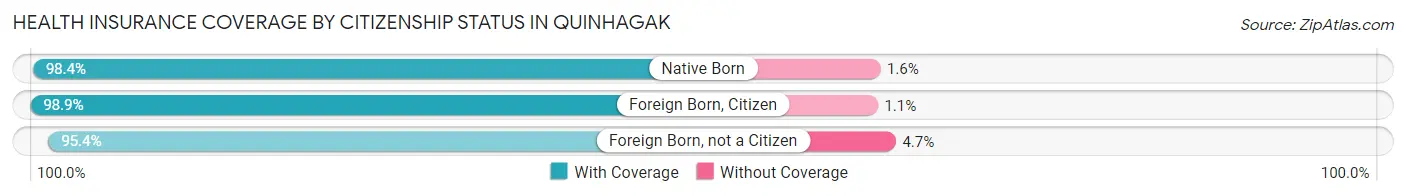
| Citizenship Status | With Coverage | Without Coverage |
| Native Born | 184 (98.4%) | 3 (1.6%) |
| Foreign Born, Citizen | 267 (98.9%) | 3 (1.1%) |
| Foreign Born, not a Citizen | 82 (95.4%) | 4 (4.6%) |
Health Insurance Coverage by Household Income in Quinhagak
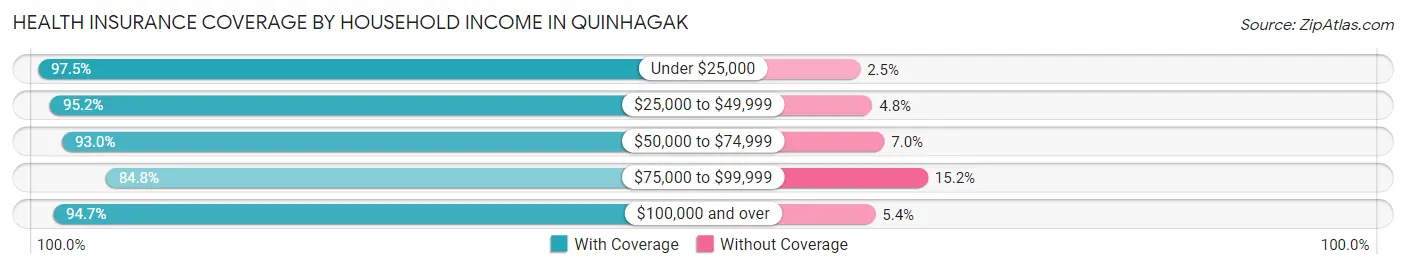
| Household Income | With Coverage | Without Coverage |
| Under $25,000 | 194 (97.5%) | 5 (2.5%) |
| $25,000 to $49,999 | 298 (95.2%) | 15 (4.8%) |
| $50,000 to $74,999 | 185 (93.0%) | 14 (7.0%) |
| $75,000 to $99,999 | 106 (84.8%) | 19 (15.2%) |
| $100,000 and over | 230 (94.7%) | 13 (5.3%) |
Public vs Private Health Insurance Coverage by Age in Quinhagak
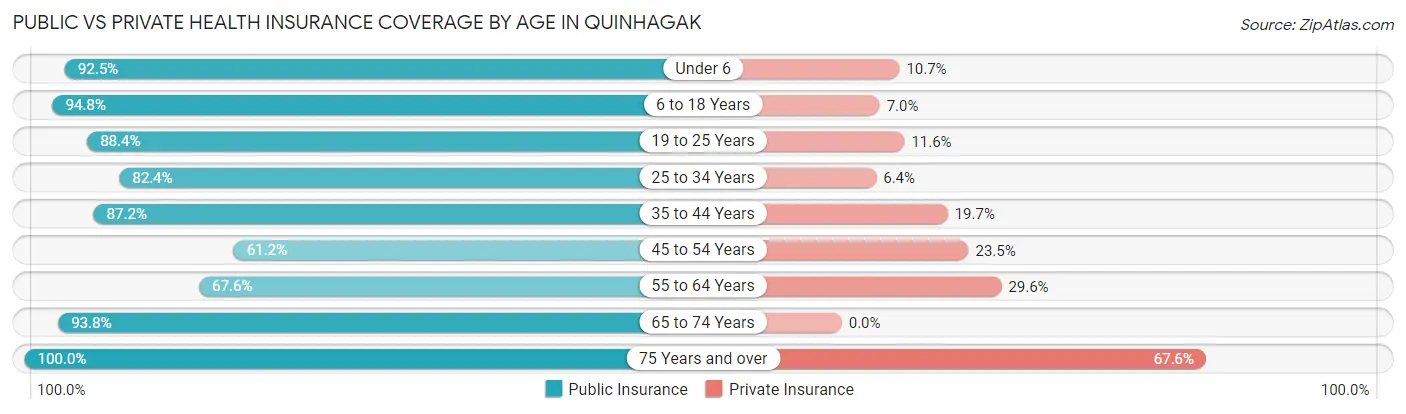
| Age Bracket | Public Insurance | Private Insurance |
| Under 6 | 173 (92.5%) | 20 (10.7%) |
| 6 to 18 Years | 256 (94.8%) | 19 (7.0%) |
| 19 to 25 Years | 76 (88.4%) | 10 (11.6%) |
| 25 to 34 Years | 103 (82.4%) | 8 (6.4%) |
| 35 to 44 Years | 102 (87.2%) | 23 (19.7%) |
| 45 to 54 Years | 52 (61.2%) | 20 (23.5%) |
| 55 to 64 Years | 73 (67.6%) | 32 (29.6%) |
| 65 to 74 Years | 60 (93.8%) | 0 (0.0%) |
| 75 Years and over | 37 (100.0%) | 25 (67.6%) |
| Total | 932 (86.4%) | 157 (14.5%) |
Disability Status by Sex by Age in Quinhagak
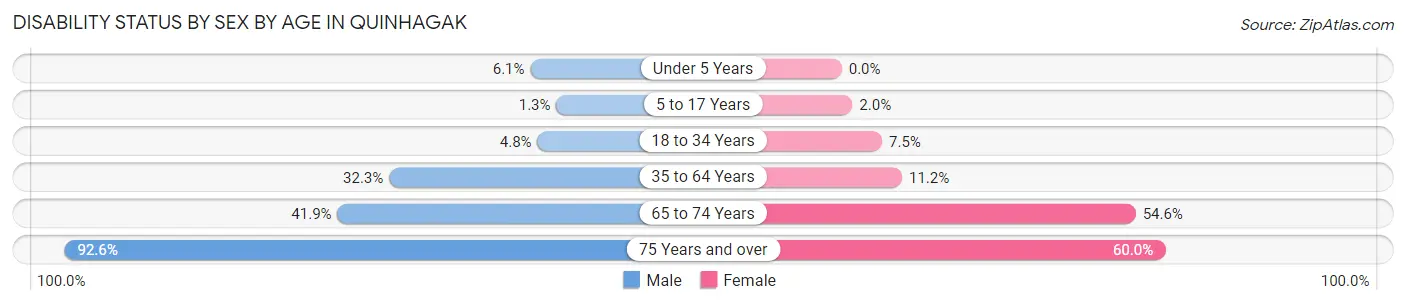
| Age Bracket | Male | Female |
| Under 5 Years | 3 (6.1%) | 0 (0.0%) |
| 5 to 17 Years | 2 (1.3%) | 3 (2.0%) |
| 18 to 34 Years | 5 (4.8%) | 8 (7.5%) |
| 35 to 64 Years | 54 (32.3%) | 16 (11.2%) |
| 65 to 74 Years | 13 (41.9%) | 18 (54.5%) |
| 75 Years and over | 25 (92.6%) | 6 (60.0%) |
Disability Class by Sex by Age in Quinhagak
Disability Class: Hearing Difficulty
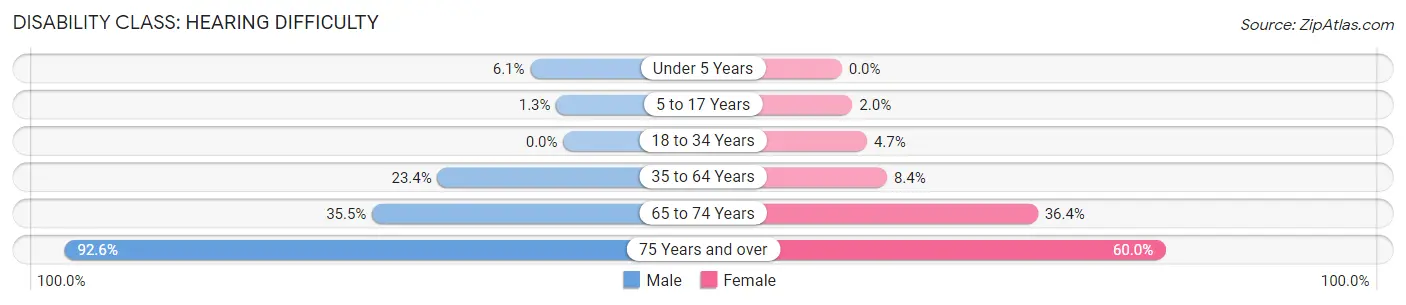
| Age Bracket | Male | Female |
| Under 5 Years | 3 (6.1%) | 0 (0.0%) |
| 5 to 17 Years | 2 (1.3%) | 3 (2.0%) |
| 18 to 34 Years | 0 (0.0%) | 5 (4.7%) |
| 35 to 64 Years | 39 (23.4%) | 12 (8.4%) |
| 65 to 74 Years | 11 (35.5%) | 12 (36.4%) |
| 75 Years and over | 25 (92.6%) | 6 (60.0%) |
Disability Class: Vision Difficulty
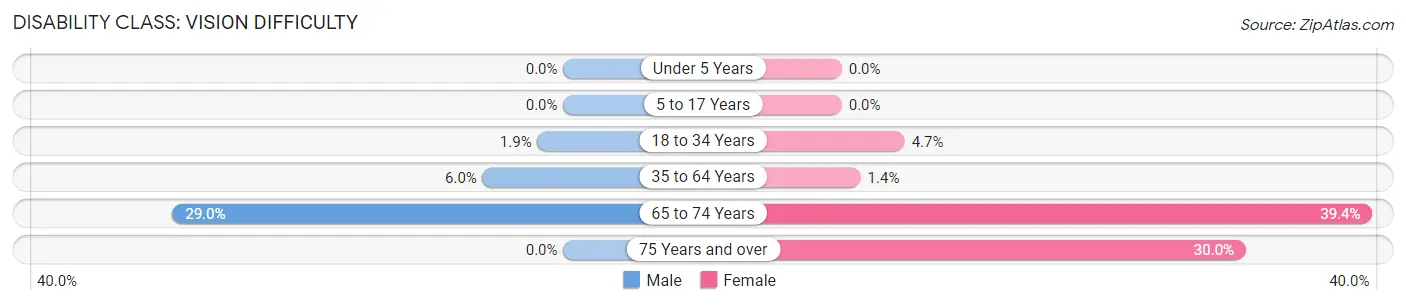
| Age Bracket | Male | Female |
| Under 5 Years | 0 (0.0%) | 0 (0.0%) |
| 5 to 17 Years | 0 (0.0%) | 0 (0.0%) |
| 18 to 34 Years | 2 (1.9%) | 5 (4.7%) |
| 35 to 64 Years | 10 (6.0%) | 2 (1.4%) |
| 65 to 74 Years | 9 (29.0%) | 13 (39.4%) |
| 75 Years and over | 0 (0.0%) | 3 (30.0%) |
Disability Class: Cognitive Difficulty
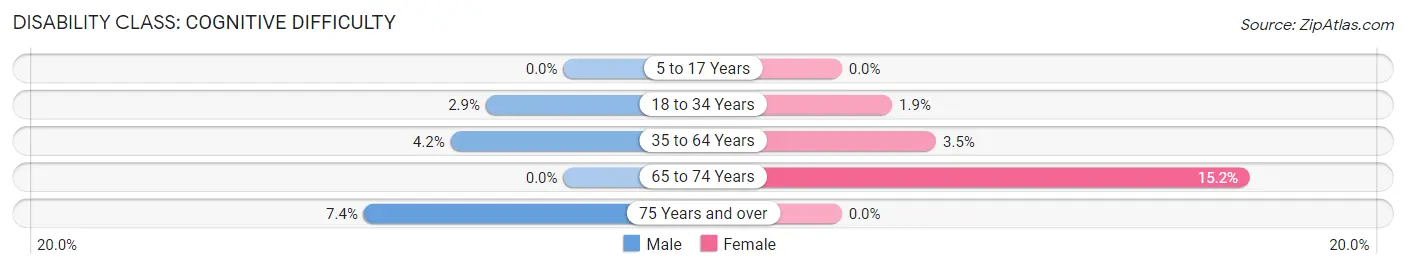
| Age Bracket | Male | Female |
| 5 to 17 Years | 0 (0.0%) | 0 (0.0%) |
| 18 to 34 Years | 3 (2.9%) | 2 (1.9%) |
| 35 to 64 Years | 7 (4.2%) | 5 (3.5%) |
| 65 to 74 Years | 0 (0.0%) | 5 (15.1%) |
| 75 Years and over | 2 (7.4%) | 0 (0.0%) |
Disability Class: Ambulatory Difficulty
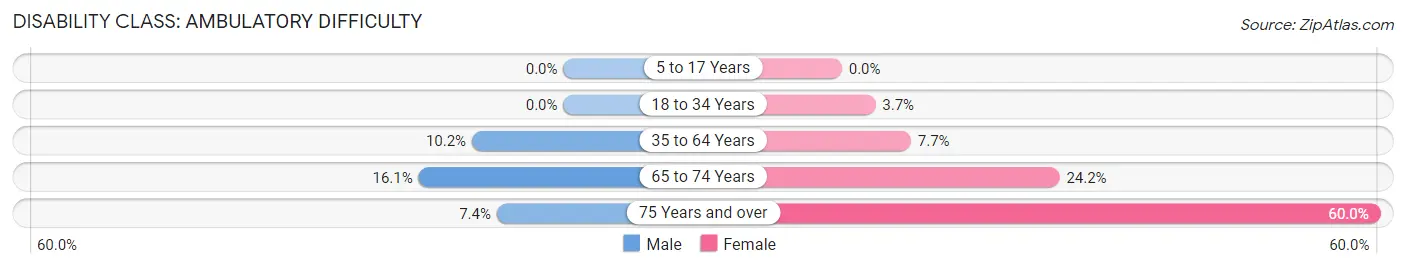
| Age Bracket | Male | Female |
| 5 to 17 Years | 0 (0.0%) | 0 (0.0%) |
| 18 to 34 Years | 0 (0.0%) | 4 (3.7%) |
| 35 to 64 Years | 17 (10.2%) | 11 (7.7%) |
| 65 to 74 Years | 5 (16.1%) | 8 (24.2%) |
| 75 Years and over | 2 (7.4%) | 6 (60.0%) |
Disability Class: Self-Care Difficulty
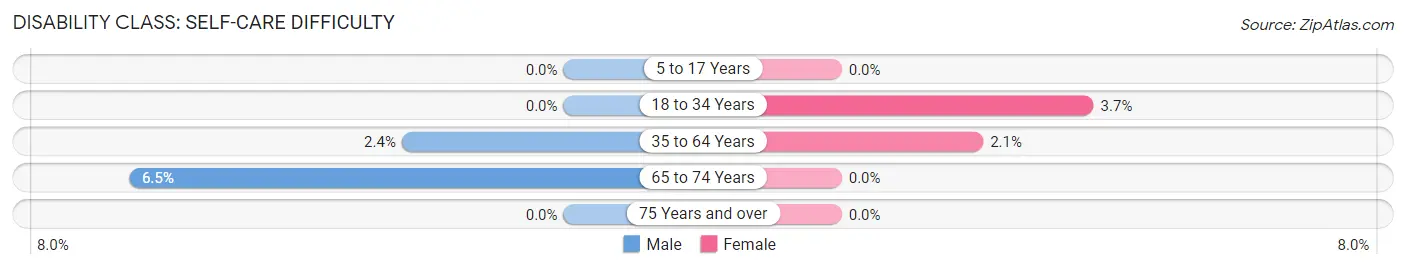
| Age Bracket | Male | Female |
| 5 to 17 Years | 0 (0.0%) | 0 (0.0%) |
| 18 to 34 Years | 0 (0.0%) | 4 (3.7%) |
| 35 to 64 Years | 4 (2.4%) | 3 (2.1%) |
| 65 to 74 Years | 2 (6.5%) | 0 (0.0%) |
| 75 Years and over | 0 (0.0%) | 0 (0.0%) |
Technology Access in Quinhagak
Computing Device Access in Quinhagak
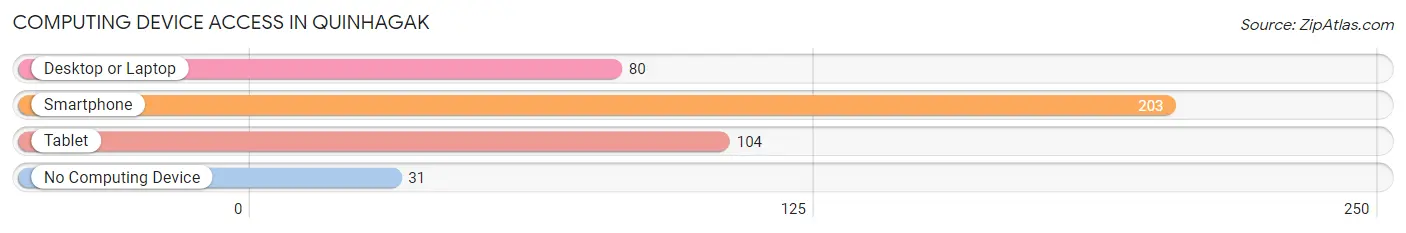
| Device Type | # Households | % Households |
| Desktop or Laptop | 80 | 33.8% |
| Smartphone | 203 | 85.7% |
| Tablet | 104 | 43.9% |
| No Computing Device | 31 | 13.1% |
| Total | 237 | 100.0% |
Internet Access in Quinhagak
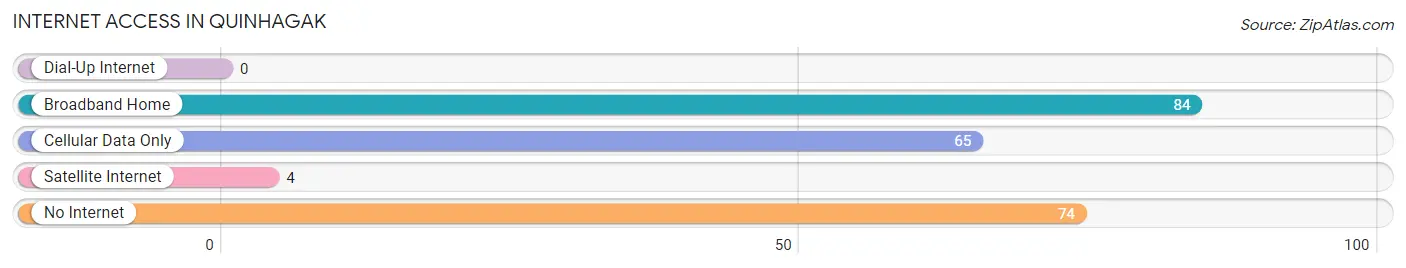
| Internet Type | # Households | % Households |
| Dial-Up Internet | 0 | 0.0% |
| Broadband Home | 84 | 35.4% |
| Cellular Data Only | 65 | 27.4% |
| Satellite Internet | 4 | 1.7% |
| No Internet | 74 | 31.2% |
| Total | 237 | 100.0% |
Quinhagak Summary
Quinhagak is a small city located in the Bethel Census Area of Alaska. It is situated on the Kuskokwim River, approximately 40 miles from the Bering Sea. The city has a population of approximately 690 people, according to the 2010 census. The majority of the population is Alaska Native, with the majority being Yup'ik Eskimos.
Geography
Quinhagak is located in the Yukon-Kuskokwim Delta, which is the largest delta in the United States. The delta is made up of numerous small islands, and the city is located on the mainland. The city is surrounded by tundra and wetlands, and is home to a variety of wildlife, including caribou, moose, and bears. The climate in Quinhagak is subarctic, with cold winters and mild summers.
History
Quinhagak was first settled by the Yup'ik Eskimos in the late 1800s. The city was originally known as Kwinhagak, which means "big lake" in Yup'ik. The city was a traditional fishing and hunting village, and the Yup'ik people relied on the Kuskokwim River for sustenance. In the early 1900s, the city was renamed Quinhagak, which means "place of many fish."
In the 1950s, the city was connected to the outside world by the Alaska Railroad. This allowed for the development of a commercial fishing industry, which has been the mainstay of the local economy ever since.
Economy
The economy of Quinhagak is largely based on commercial fishing. The city is home to several fish processing plants, which process salmon, cod, and other fish for sale in the United States and abroad. The city also has a small tourism industry, with visitors coming to fish and hunt in the area.
The city is also home to a number of small businesses, including a grocery store, a hardware store, and a restaurant. The city is served by the Quinhagak Airport, which offers flights to Anchorage and other cities in Alaska.
Demographics
According to the 2010 census, the population of Quinhagak was 690. The majority of the population is Alaska Native, with the majority being Yup'ik Eskimos. The median age of the population is 28.7 years, and the median household income is $37,500.
The city is served by the Quinhagak School District, which serves students from kindergarten through 12th grade. The school district is part of the Lower Kuskokwim School District, which serves students from several other communities in the region.
Conclusion
Quinhagak is a small city located in the Bethel Census Area of Alaska. It is situated on the Kuskokwim River, approximately 40 miles from the Bering Sea. The city has a population of approximately 690 people, according to the 2010 census. The majority of the population is Alaska Native, with the majority being Yup'ik Eskimos. The economy of Quinhagak is largely based on commercial fishing, and the city is also home to a number of small businesses. The city is served by the Quinhagak School District, which serves students from kindergarten through 12th grade.
Common Questions
What is Per Capita Income in Quinhagak?
Per Capita income in Quinhagak is $13,783.
What is the Median Family Income in Quinhagak?
Median Family Income in Quinhagak is $48,750.
What is the Median Household income in Quinhagak?
Median Household Income in Quinhagak is $42,083.
What is Income or Wage Gap in Quinhagak?
Income or Wage Gap in Quinhagak is 37.8%.
Women in Quinhagak earn 62.2 cents for every dollar earned by a man.
What is Inequality or Gini Index in Quinhagak?
Inequality or Gini Index in Quinhagak is 0.46.
What is the Total Population of Quinhagak?
Total Population of Quinhagak is 1,079.
What is the Total Male Population of Quinhagak?
Total Male Population of Quinhagak is 532.
What is the Total Female Population of Quinhagak?
Total Female Population of Quinhagak is 547.
What is the Ratio of Males per 100 Females in Quinhagak?
There are 97.26 Males per 100 Females in Quinhagak.
What is the Ratio of Females per 100 Males in Quinhagak?
There are 102.82 Females per 100 Males in Quinhagak.
What is the Median Population Age in Quinhagak?
Median Population Age in Quinhagak is 25.6 Years.
What is the Average Family Size in Quinhagak
Average Family Size in Quinhagak is 5.3 People.
What is the Average Household Size in Quinhagak
Average Household Size in Quinhagak is 4.5 People.
How Large is the Labor Force in Quinhagak?
There are 344 People in the Labor Forcein in Quinhagak.
What is the Percentage of People in the Labor Force in Quinhagak?
50.8% of People are in the Labor Force in Quinhagak.
What is the Unemployment Rate in Quinhagak?
Unemployment Rate in Quinhagak is 25.3%.