Pleasant Valley, AK Map & Demographics
Pleasant Valley Map
Pleasant Valley Overview
$54,446
PER CAPITA INCOME
$202,739
AVG FAMILY INCOME
0.33
INEQUALITY / GINI INDEX
623
TOTAL POPULATION
337
MALE POPULATION
286
FEMALE POPULATION
117.83
MALES / 100 FEMALES
84.87
FEMALES / 100 MALES
46.1
MEDIAN AGE
3.0
AVG FAMILY SIZE
2.4
AVG HOUSEHOLD SIZE
365
LABOR FORCE [ PEOPLE ]
82.6%
PERCENT IN LABOR FORCE
Income in Pleasant Valley
Income Overview in Pleasant Valley
| Characteristic | Number | Measure |
| Per Capita Income | 623 | $54,446 |
| Median Family Income | 183 | $202,739 |
| Mean Family Income | 183 | $162,172 |
| Median Household Income | 260 | $0 |
| Mean Household Income | 260 | $132,013 |
| Income Deficit | 183 | $0 |
| Wage / Income Gap (%) | 623 | 0.00% |
| Wage / Income Gap ($) | 623 | 100.00¢ per $1 |
| Gini / Inequality Index | 623 | 0.33 |
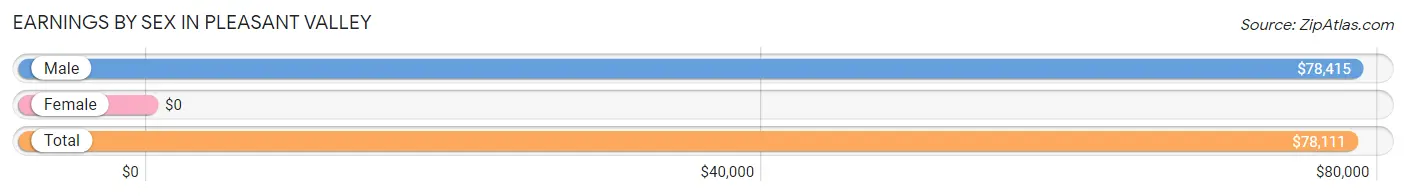
Earnings by Sex in Pleasant Valley
| Sex | Number | Average Earnings |
| Male | 282 (71.2%) | $78,415 |
| Female | 114 (28.8%) | $0 |
| Total | 396 (100.0%) | $78,111 |
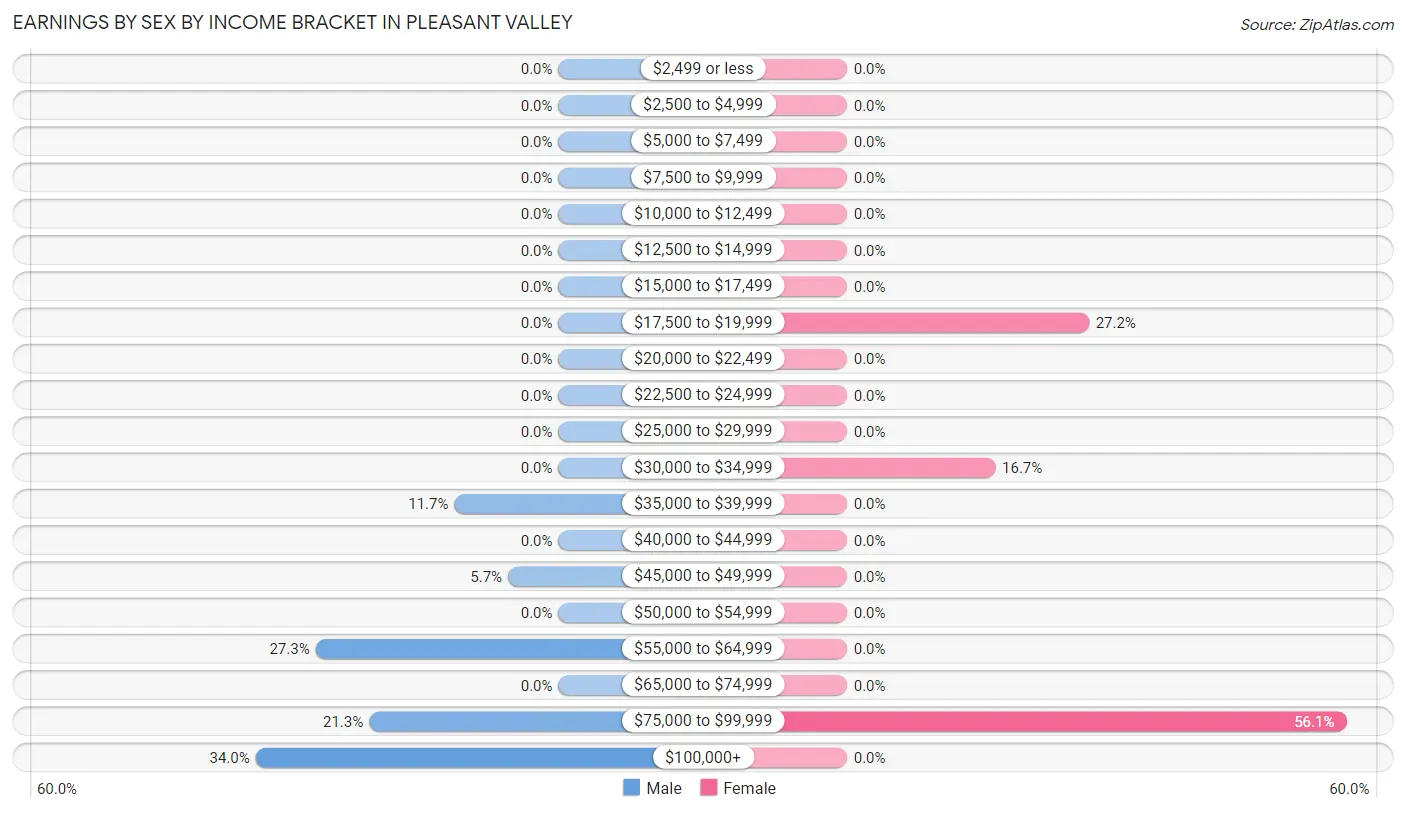
Earnings by Sex by Income Bracket in Pleasant Valley
The most common earnings brackets in Pleasant Valley are $100,000+ for men (96 | 34.0%) and $75,000 to $99,999 for women (64 | 56.1%).
| Income | Male | Female |
| $2,499 or less | 0 (0.0%) | 0 (0.0%) |
| $2,500 to $4,999 | 0 (0.0%) | 0 (0.0%) |
| $5,000 to $7,499 | 0 (0.0%) | 0 (0.0%) |
| $7,500 to $9,999 | 0 (0.0%) | 0 (0.0%) |
| $10,000 to $12,499 | 0 (0.0%) | 0 (0.0%) |
| $12,500 to $14,999 | 0 (0.0%) | 0 (0.0%) |
| $15,000 to $17,499 | 0 (0.0%) | 0 (0.0%) |
| $17,500 to $19,999 | 0 (0.0%) | 31 (27.2%) |
| $20,000 to $22,499 | 0 (0.0%) | 0 (0.0%) |
| $22,500 to $24,999 | 0 (0.0%) | 0 (0.0%) |
| $25,000 to $29,999 | 0 (0.0%) | 0 (0.0%) |
| $30,000 to $34,999 | 0 (0.0%) | 19 (16.7%) |
| $35,000 to $39,999 | 33 (11.7%) | 0 (0.0%) |
| $40,000 to $44,999 | 0 (0.0%) | 0 (0.0%) |
| $45,000 to $49,999 | 16 (5.7%) | 0 (0.0%) |
| $50,000 to $54,999 | 0 (0.0%) | 0 (0.0%) |
| $55,000 to $64,999 | 77 (27.3%) | 0 (0.0%) |
| $65,000 to $74,999 | 0 (0.0%) | 0 (0.0%) |
| $75,000 to $99,999 | 60 (21.3%) | 64 (56.1%) |
| $100,000+ | 96 (34.0%) | 0 (0.0%) |
| Total | 282 (100.0%) | 114 (100.0%) |
Earnings by Sex by Educational Attainment in Pleasant Valley
| Educational Attainment | Male Income | Female Income |
| Less than High School | - | - |
| High School Diploma | - | - |
| College or Associate's Degree | - | - |
| Bachelor's Degree | - | - |
| Graduate Degree | - | - |
| Total | $78,415 | $0 |
Family Income in Pleasant Valley
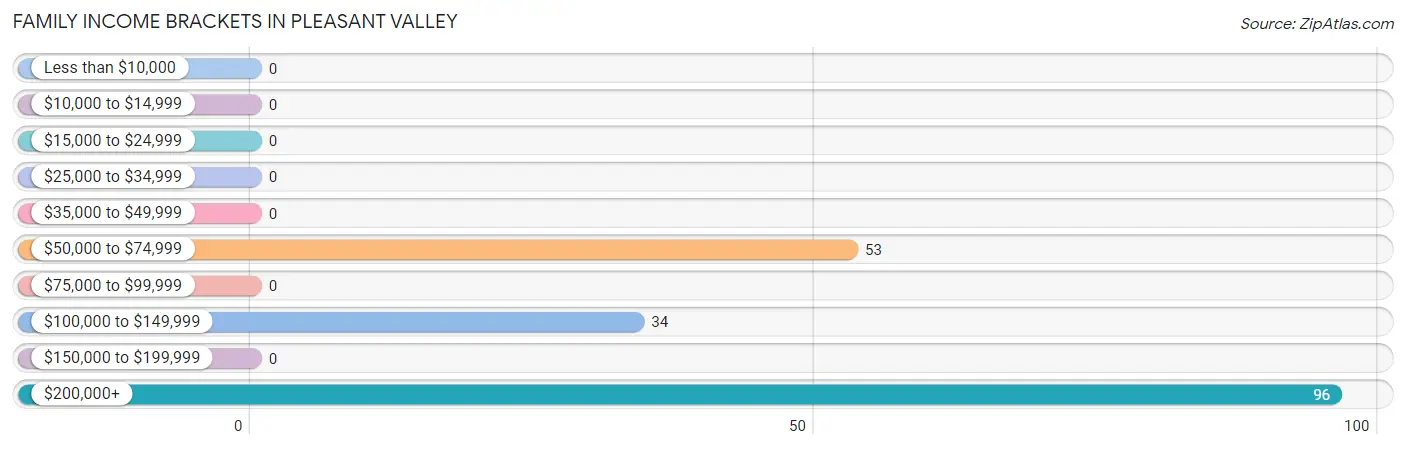
Family Income Brackets in Pleasant Valley
According to the Pleasant Valley family income data, there are 96 families falling into the $200,000+ income range, which is the most common income bracket and makes up 52.5% of all families.
| Income Bracket | # Families | % Families |
| Less than $10,000 | 0 | 0.0% |
| $10,000 to $14,999 | 0 | 0.0% |
| $15,000 to $24,999 | 0 | 0.0% |
| $25,000 to $34,999 | 0 | 0.0% |
| $35,000 to $49,999 | 0 | 0.0% |
| $50,000 to $74,999 | 53 | 29.0% |
| $75,000 to $99,999 | 0 | 0.0% |
| $100,000 to $149,999 | 34 | 18.6% |
| $150,000 to $199,999 | 0 | 0.0% |
| $200,000+ | 96 | 52.5% |
Family Income by Famaliy Size in Pleasant Valley
| Income Bracket | # Families | Median Income |
| 2-Person Families | 119 (65.0%) | $0 |
| 3-Person Families | 0 (0.0%) | $0 |
| 4-Person Families | 49 (26.8%) | $0 |
| 5-Person Families | 15 (8.2%) | $0 |
| 6-Person Families | 0 (0.0%) | $0 |
| 7+ Person Families | 0 (0.0%) | $0 |
| Total | 183 (100.0%) | $202,739 |
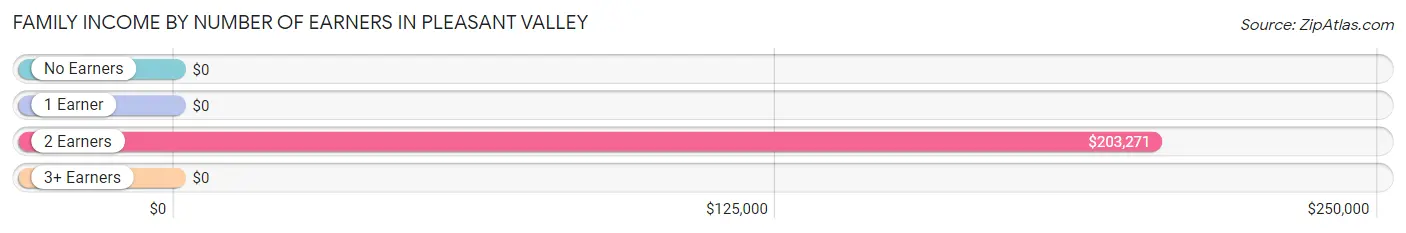
Family Income by Number of Earners in Pleasant Valley
| Number of Earners | # Families | Median Income |
| No Earners | 20 (10.9%) | $0 |
| 1 Earner | 0 (0.0%) | $0 |
| 2 Earners | 163 (89.1%) | $203,271 |
| 3+ Earners | 0 (0.0%) | $0 |
| Total | 183 (100.0%) | $202,739 |
Household Income in Pleasant Valley
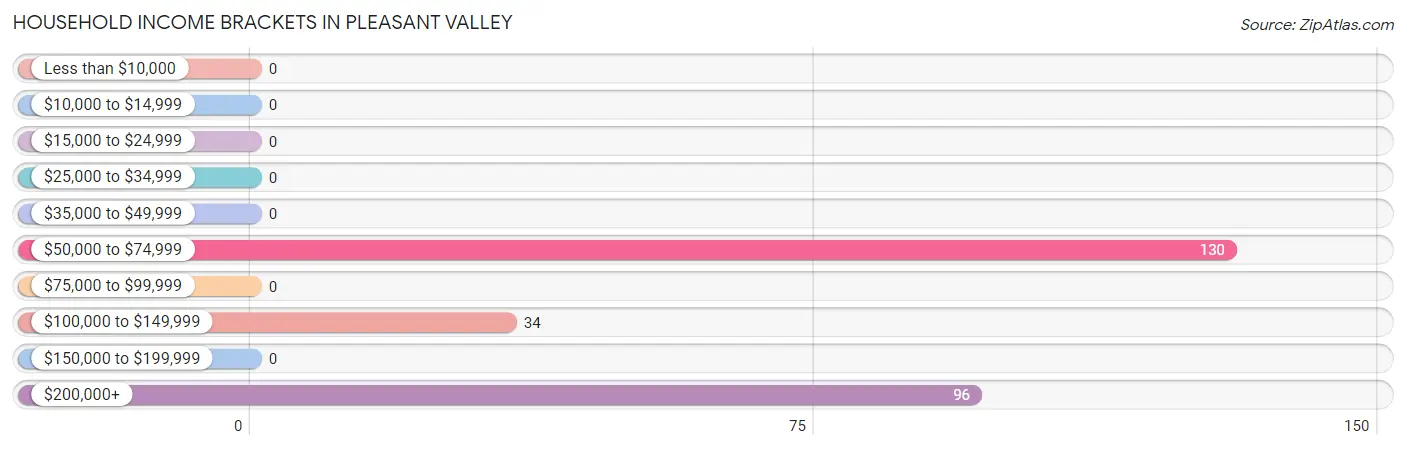
Household Income Brackets in Pleasant Valley
With 130 households falling in the category, the $50,000 to $74,999 income range is the most frequent in Pleasant Valley, accounting for 50.0% of all households.
| Income Bracket | # Households | % Households |
| Less than $10,000 | 0 | 0.0% |
| $10,000 to $14,999 | 0 | 0.0% |
| $15,000 to $24,999 | 0 | 0.0% |
| $25,000 to $34,999 | 0 | 0.0% |
| $35,000 to $49,999 | 0 | 0.0% |
| $50,000 to $74,999 | 130 | 50.0% |
| $75,000 to $99,999 | 0 | 0.0% |
| $100,000 to $149,999 | 34 | 13.1% |
| $150,000 to $199,999 | 0 | 0.0% |
| $200,000+ | 96 | 36.9% |
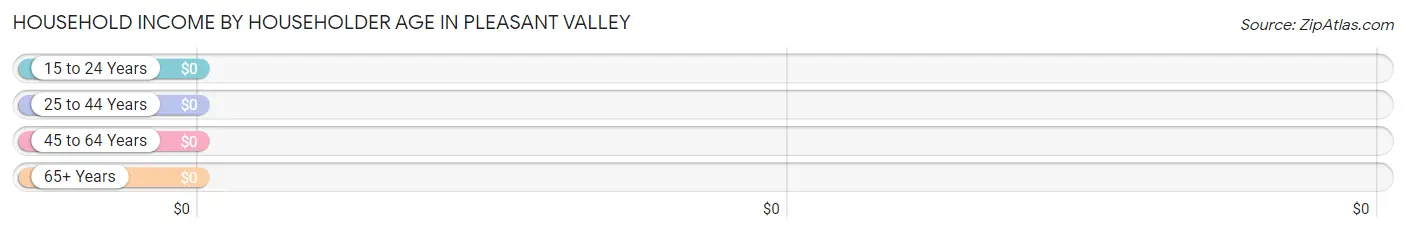
Household Income by Householder Age in Pleasant Valley
| Income Bracket | # Households | Median Income |
| 15 to 24 Years | 0 (0.0%) | $0 |
| 25 to 44 Years | 48 (18.5%) | $0 |
| 45 to 64 Years | 192 (73.9%) | $0 |
| 65+ Years | 20 (7.7%) | $0 |
| Total | 260 (100.0%) | $0 |
Poverty in Pleasant Valley
Income Below Poverty by Sex and Age in Pleasant Valley
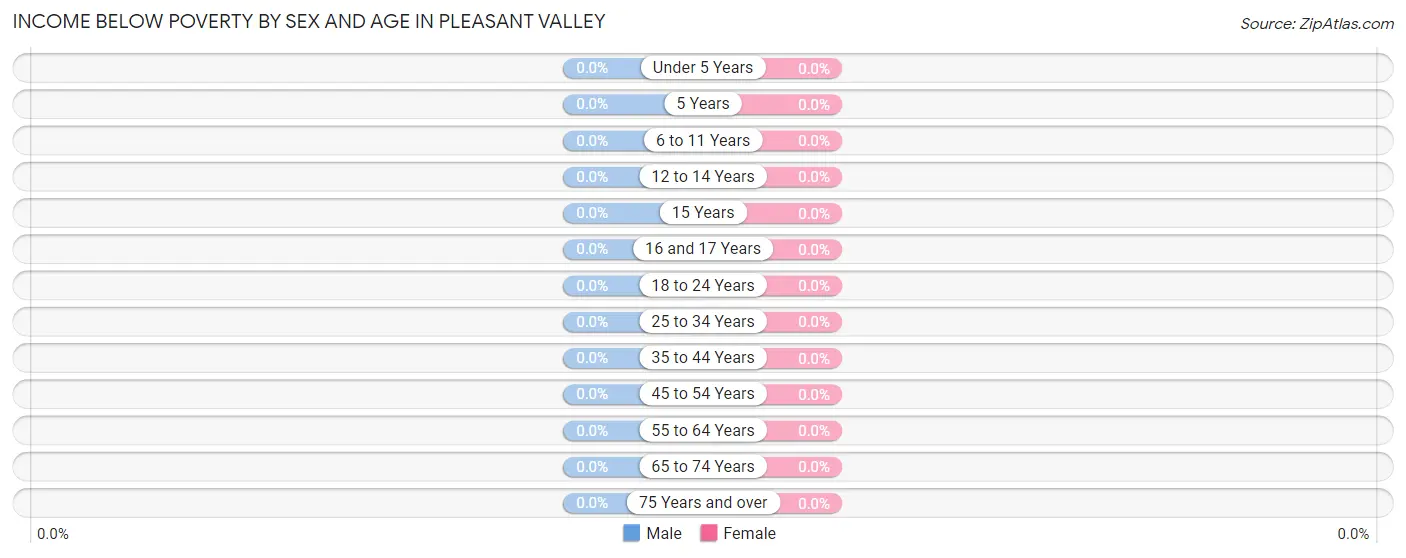
| Age Bracket | Male | Female |
| Under 5 Years | 0 (0.0%) | 0 (0.0%) |
| 5 Years | 0 (0.0%) | 0 (0.0%) |
| 6 to 11 Years | 0 (0.0%) | 0 (0.0%) |
| 12 to 14 Years | 0 (0.0%) | 0 (0.0%) |
| 15 Years | 0 (0.0%) | 0 (0.0%) |
| 16 and 17 Years | 0 (0.0%) | 0 (0.0%) |
| 18 to 24 Years | 0 (0.0%) | 0 (0.0%) |
| 25 to 34 Years | 0 (0.0%) | 0 (0.0%) |
| 35 to 44 Years | 0 (0.0%) | 0 (0.0%) |
| 45 to 54 Years | 0 (0.0%) | 0 (0.0%) |
| 55 to 64 Years | 0 (0.0%) | 0 (0.0%) |
| 65 to 74 Years | 0 (0.0%) | 0 (0.0%) |
| 75 Years and over | 0 (0.0%) | 0 (0.0%) |
| Total | 0 (0.0%) | 0 (0.0%) |
Income Above Poverty by Sex and Age in Pleasant Valley
According to the poverty statistics in Pleasant Valley, males aged 6 to 11 years and females aged 12 to 14 years are the age groups that are most secure financially, with 100.0% of males and 100.0% of females in these age groups living above the poverty line.
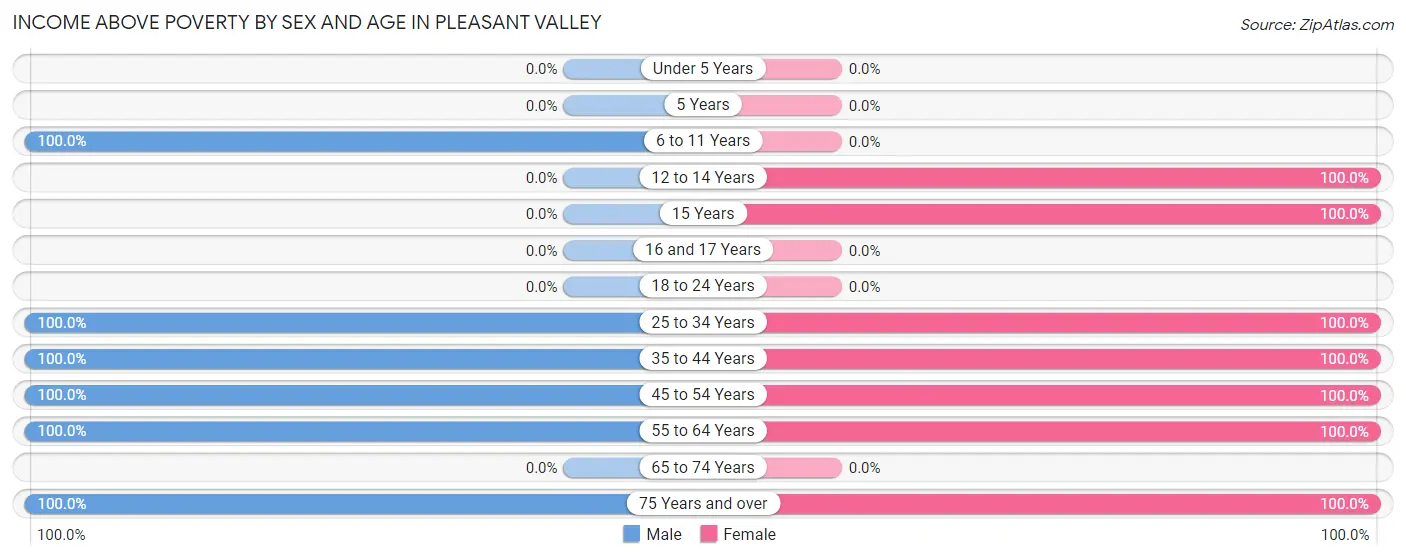
| Age Bracket | Male | Female |
| Under 5 Years | 0 (0.0%) | 0 (0.0%) |
| 5 Years | 0 (0.0%) | 0 (0.0%) |
| 6 to 11 Years | 35 (100.0%) | 0 (0.0%) |
| 12 to 14 Years | 0 (0.0%) | 101 (100.0%) |
| 15 Years | 0 (0.0%) | 45 (100.0%) |
| 16 and 17 Years | 0 (0.0%) | 0 (0.0%) |
| 18 to 24 Years | 0 (0.0%) | 0 (0.0%) |
| 25 to 34 Years | 33 (100.0%) | 31 (100.0%) |
| 35 to 44 Years | 41 (100.0%) | 15 (100.0%) |
| 45 to 54 Years | 189 (100.0%) | 49 (100.0%) |
| 55 to 64 Years | 19 (100.0%) | 19 (100.0%) |
| 65 to 74 Years | 0 (0.0%) | 0 (0.0%) |
| 75 Years and over | 20 (100.0%) | 26 (100.0%) |
| Total | 337 (100.0%) | 286 (100.0%) |
Income Below Poverty Among Married-Couple Families in Pleasant Valley
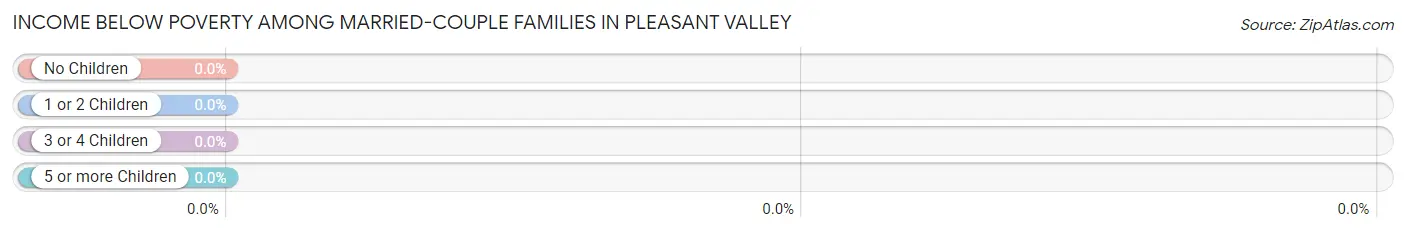
| Children | Above Poverty | Below Poverty |
| No Children | 72 (100.0%) | 0 (0.0%) |
| 1 or 2 Children | 49 (100.0%) | 0 (0.0%) |
| 3 or 4 Children | 15 (100.0%) | 0 (0.0%) |
| 5 or more Children | 0 (0.0%) | 0 (0.0%) |
| Total | 136 (100.0%) | 0 (0.0%) |
Income Below Poverty Among Single-Parent Households in Pleasant Valley
| Children | Single Father | Single Mother |
| No Children | 0 (0.0%) | 0 (0.0%) |
| 1 or 2 Children | 0 (0.0%) | 0 (0.0%) |
| 3 or 4 Children | 0 (0.0%) | 0 (0.0%) |
| 5 or more Children | 0 (0.0%) | 0 (0.0%) |
| Total | 0 (0.0%) | 0 (0.0%) |
Income Below Poverty Among Married-Couple vs Single-Parent Households in Pleasant Valley
| Children | Married-Couple Families | Single-Parent Households |
| No Children | 0 (0.0%) | 0 (0.0%) |
| 1 or 2 Children | 0 (0.0%) | 0 (0.0%) |
| 3 or 4 Children | 0 (0.0%) | 0 (0.0%) |
| 5 or more Children | 0 (0.0%) | 0 (0.0%) |
| Total | 0 (0.0%) | 0 (0.0%) |
Race in Pleasant Valley
The most populous races in Pleasant Valley are White / Caucasian (545 | 87.5%), and Two or more Races (78 | 12.5%).
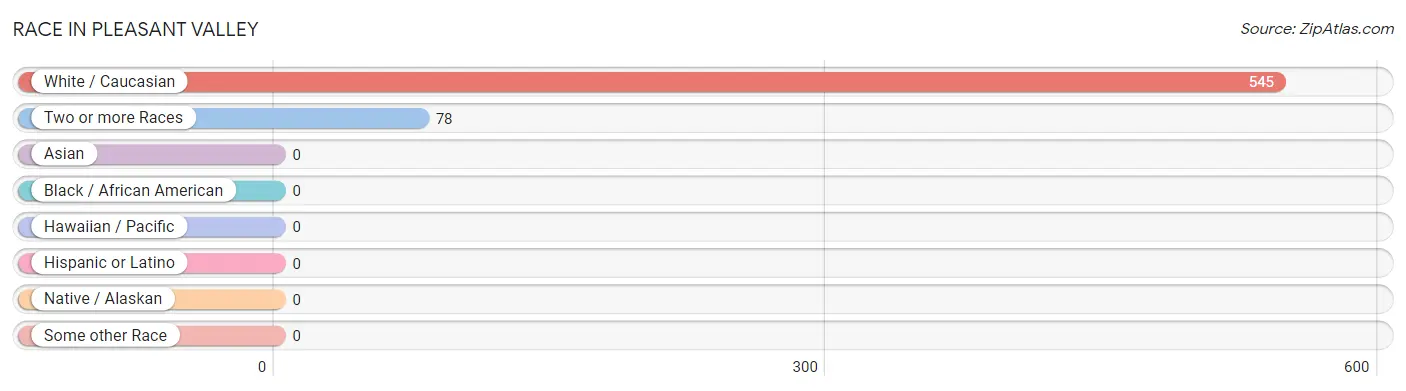
| Race | # Population | % Population |
| Asian | 0 | 0.0% |
| Black / African American | 0 | 0.0% |
| Hawaiian / Pacific | 0 | 0.0% |
| Hispanic or Latino | 0 | 0.0% |
| Native / Alaskan | 0 | 0.0% |
| White / Caucasian | 545 | 87.5% |
| Two or more Races | 78 | 12.5% |
| Some other Race | 0 | 0.0% |
| Total | 623 | 100.0% |
Ancestry in Pleasant Valley
The most populous ancestries reported in Pleasant Valley are French Canadian (165 | 26.5%), German (159 | 25.5%), English (125 | 20.1%), Irish (94 | 15.1%), and Scottish (88 | 14.1%), together accounting for 101.3% of all Pleasant Valley residents.
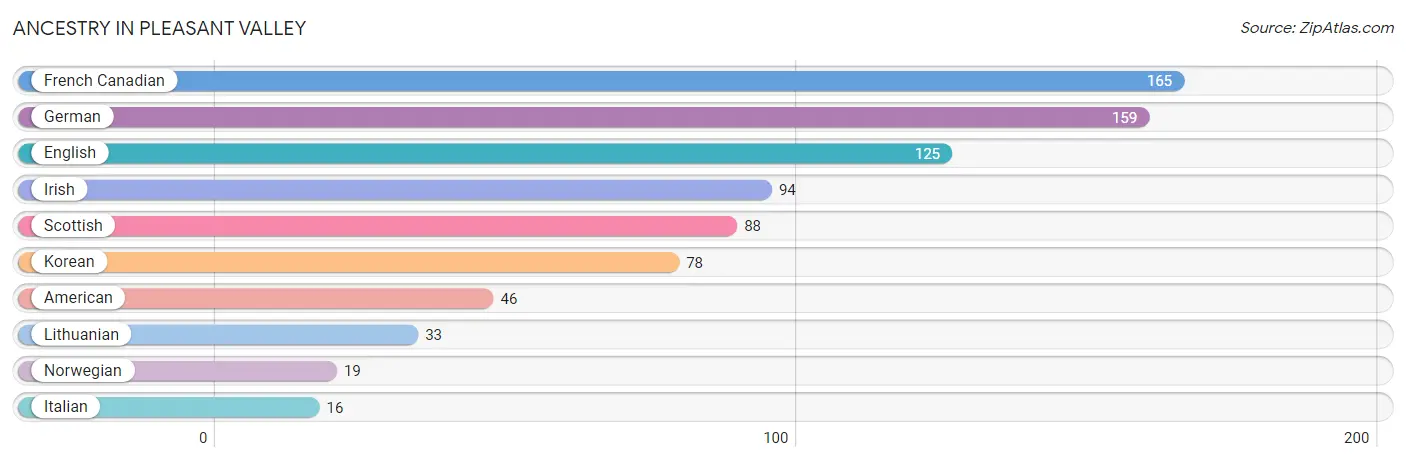
| Ancestry | # Population | % Population |
| American | 46 | 7.4% |
| English | 125 | 20.1% |
| French Canadian | 165 | 26.5% |
| German | 159 | 25.5% |
| Irish | 94 | 15.1% |
| Italian | 16 | 2.6% |
| Korean | 78 | 12.5% |
| Lithuanian | 33 | 5.3% |
| Norwegian | 19 | 3.0% |
| Scottish | 88 | 14.1% | View All 10 Rows |
Immigrants in Pleasant Valley

| Immigration Origin | # Population | % Population | View All 0 Rows |
Sex and Age in Pleasant Valley
Sex and Age in Pleasant Valley
The most populous age groups in Pleasant Valley are 45 to 49 Years (124 | 36.8%) for men and 10 to 14 Years (101 | 35.3%) for women.
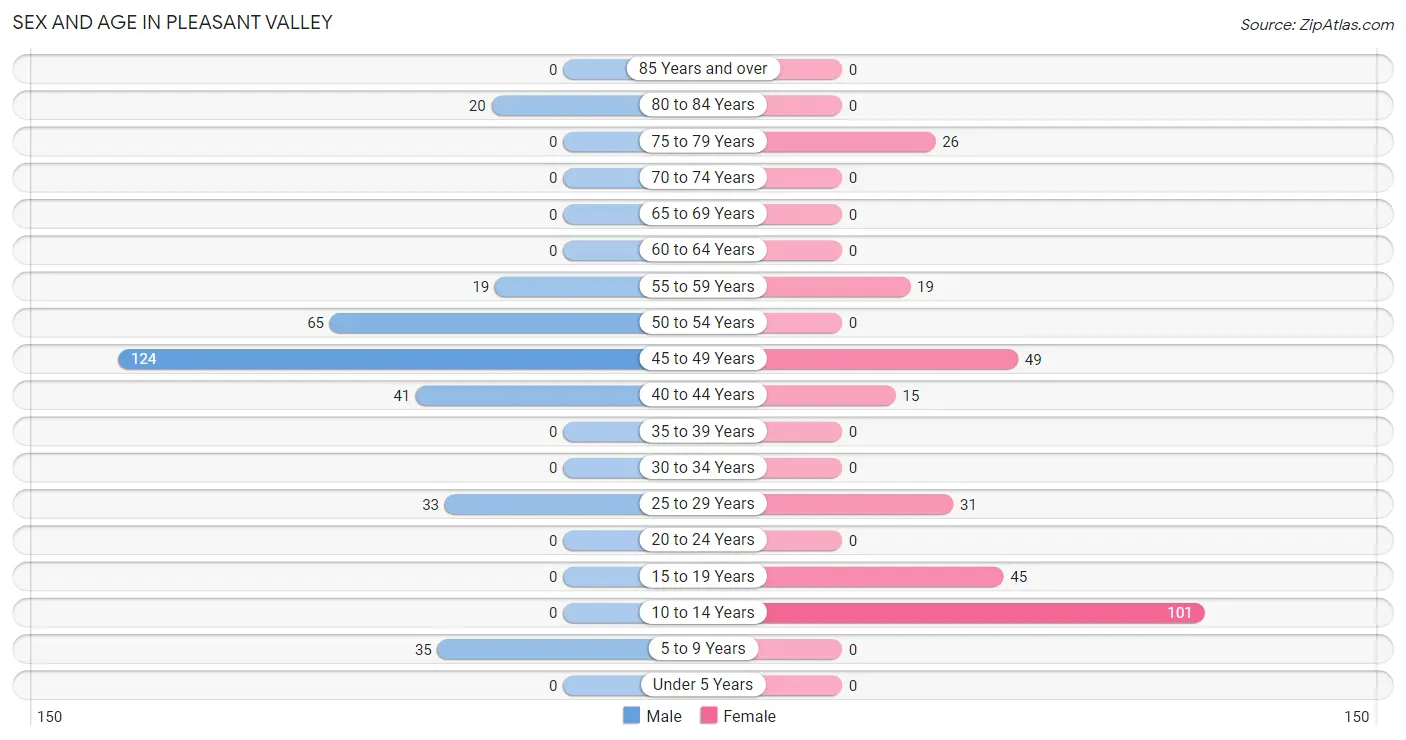
| Age Bracket | Male | Female |
| Under 5 Years | 0 (0.0%) | 0 (0.0%) |
| 5 to 9 Years | 35 (10.4%) | 0 (0.0%) |
| 10 to 14 Years | 0 (0.0%) | 101 (35.3%) |
| 15 to 19 Years | 0 (0.0%) | 45 (15.7%) |
| 20 to 24 Years | 0 (0.0%) | 0 (0.0%) |
| 25 to 29 Years | 33 (9.8%) | 31 (10.8%) |
| 30 to 34 Years | 0 (0.0%) | 0 (0.0%) |
| 35 to 39 Years | 0 (0.0%) | 0 (0.0%) |
| 40 to 44 Years | 41 (12.2%) | 15 (5.2%) |
| 45 to 49 Years | 124 (36.8%) | 49 (17.1%) |
| 50 to 54 Years | 65 (19.3%) | 0 (0.0%) |
| 55 to 59 Years | 19 (5.6%) | 19 (6.6%) |
| 60 to 64 Years | 0 (0.0%) | 0 (0.0%) |
| 65 to 69 Years | 0 (0.0%) | 0 (0.0%) |
| 70 to 74 Years | 0 (0.0%) | 0 (0.0%) |
| 75 to 79 Years | 0 (0.0%) | 26 (9.1%) |
| 80 to 84 Years | 20 (5.9%) | 0 (0.0%) |
| 85 Years and over | 0 (0.0%) | 0 (0.0%) |
| Total | 337 (100.0%) | 286 (100.0%) |
Families and Households in Pleasant Valley
Median Family Size in Pleasant Valley
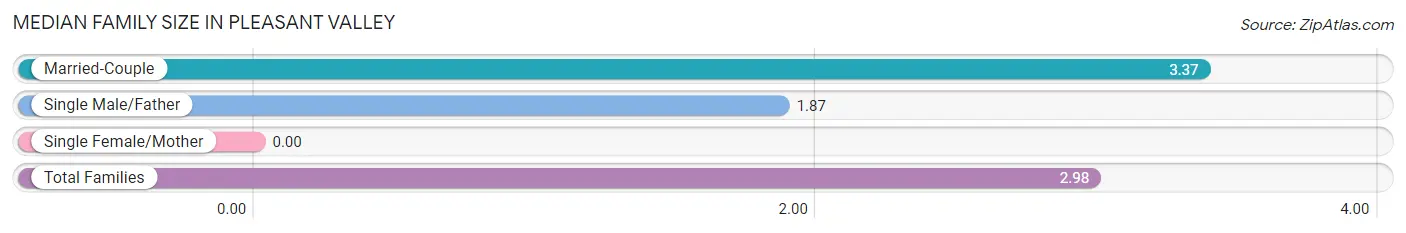
| Family Type | # Families | Family Size |
| Married-Couple | 136 (74.3%) | 3.37 |
| Single Male/Father | 47 (25.7%) | 1.87 |
| Single Female/Mother | 0 (0.0%) | - |
| Total Families | 183 (100.0%) | 2.98 |
Median Household Size in Pleasant Valley
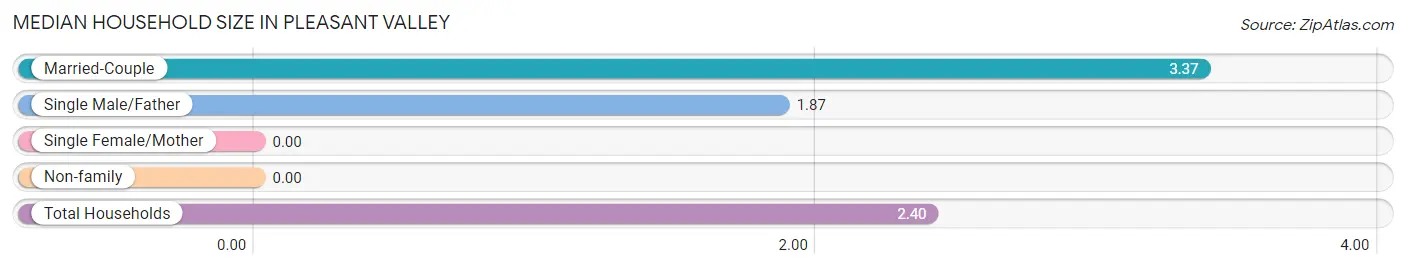
| Household Type | # Households | Household Size |
| Married-Couple | 136 (52.3%) | 3.37 |
| Single Male/Father | 47 (18.1%) | 1.87 |
| Single Female/Mother | 0 (0.0%) | - |
| Non-family | 77 (29.6%) | - |
| Total Households | 260 (100.0%) | 2.40 |
Household Size by Marriage Status in Pleasant Valley
Out of a total of 260 households in Pleasant Valley, 183 (70.4%) are family households, while 77 (29.6%) are nonfamily households. The most numerous type of family households are 2-person households, comprising 119, and the most common type of nonfamily households are 1-person households, comprising 77.
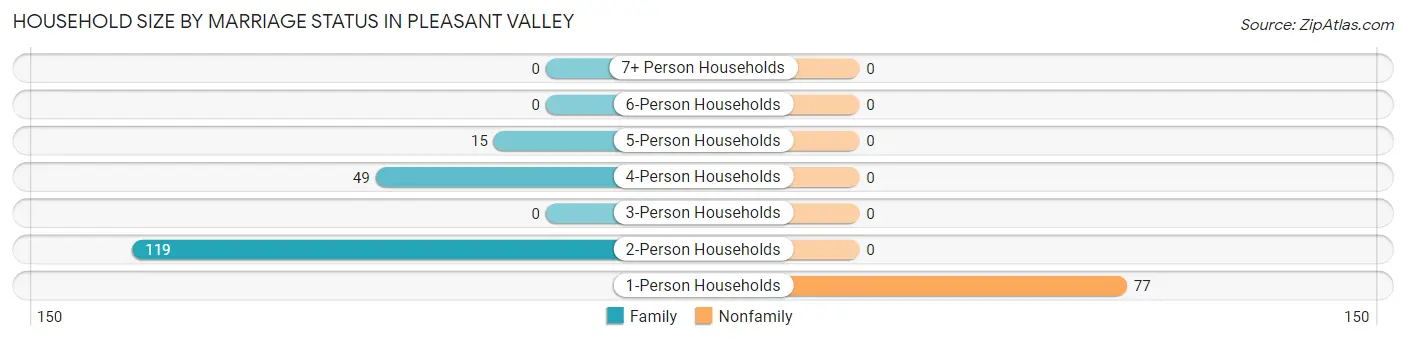
| Household Size | Family Households | Nonfamily Households |
| 1-Person Households | - | 77 (29.6%) |
| 2-Person Households | 119 (45.8%) | 0 (0.0%) |
| 3-Person Households | 0 (0.0%) | 0 (0.0%) |
| 4-Person Households | 49 (18.9%) | 0 (0.0%) |
| 5-Person Households | 15 (5.8%) | 0 (0.0%) |
| 6-Person Households | 0 (0.0%) | 0 (0.0%) |
| 7+ Person Households | 0 (0.0%) | 0 (0.0%) |
| Total | 183 (70.4%) | 77 (29.6%) |
Female Fertility in Pleasant Valley
Fertility by Age in Pleasant Valley
| Age Bracket | Women with Births | Births / 1,000 Women |
| 15 to 19 years | 0 (0.0%) | 0.0 |
| 20 to 34 years | 0 (0.0%) | 0.0 |
| 35 to 50 years | 0 (0.0%) | 0.0 |
| Total | 0 (0.0%) | 0.0 |
Fertility by Age by Marriage Status in Pleasant Valley
| Age Bracket | Married | Unmarried |
| 15 to 19 years | 0 (0.0%) | 0 (0.0%) |
| 20 to 34 years | 0 (0.0%) | 0 (0.0%) |
| 35 to 50 years | 0 (0.0%) | 0 (0.0%) |
| Total | 0 (0.0%) | 0 (0.0%) |
Fertility by Education in Pleasant Valley
| Educational Attainment | Women with Births | Births / 1,000 Women |
| Less than High School | 0 (0.0%) | 0.0 |
| High School Diploma | 0 (0.0%) | 0.0 |
| College or Associate's Degree | 0 (0.0%) | 0.0 |
| Bachelor's Degree | 0 (0.0%) | 0.0 |
| Graduate Degree | 0 (0.0%) | 0.0 |
| Total | 0 (0.0%) | 0.0 |
Fertility by Education by Marriage Status in Pleasant Valley
| Educational Attainment | Married | Unmarried |
| Less than High School | 0 (0.0%) | 0 (0.0%) |
| High School Diploma | 0 (0.0%) | 0 (0.0%) |
| College or Associate's Degree | 0 (0.0%) | 0 (0.0%) |
| Bachelor's Degree | 0 (0.0%) | 0 (0.0%) |
| Graduate Degree | 0 (0.0%) | 0 (0.0%) |
| Total | 0 (0.0%) | 0 (0.0%) |
Employment Characteristics in Pleasant Valley
Employment by Class of Employer in Pleasant Valley
Among the 365 employed individuals in Pleasant Valley, private company employees (126 | 34.5%), local government employees (77 | 21.1%), and state government employees (64 | 17.5%) make up the most common classes of employment.
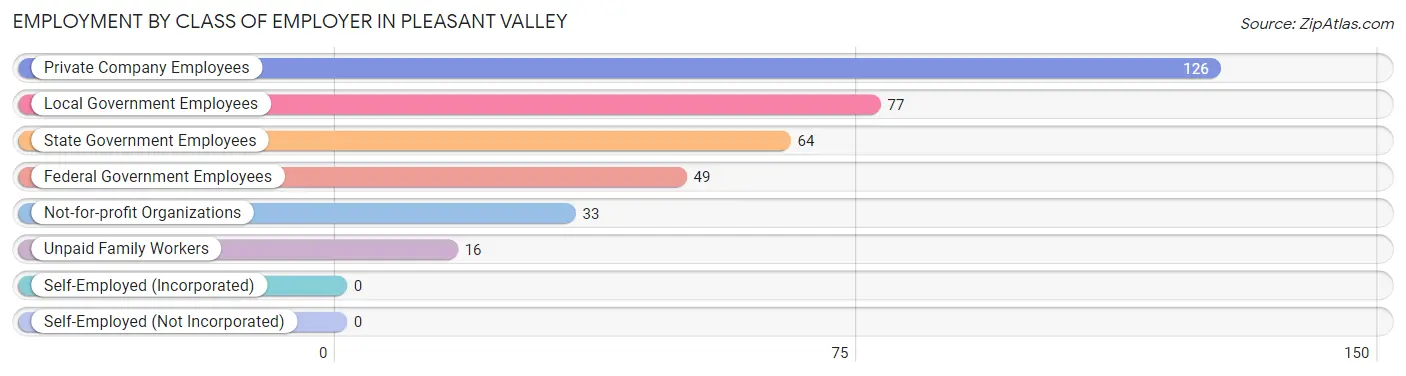
| Employer Class | # Employees | % Employees |
| Private Company Employees | 126 | 34.5% |
| Self-Employed (Incorporated) | 0 | 0.0% |
| Self-Employed (Not Incorporated) | 0 | 0.0% |
| Not-for-profit Organizations | 33 | 9.0% |
| Local Government Employees | 77 | 21.1% |
| State Government Employees | 64 | 17.5% |
| Federal Government Employees | 49 | 13.4% |
| Unpaid Family Workers | 16 | 4.4% |
| Total | 365 | 100.0% |
Employment Status by Age in Pleasant Valley
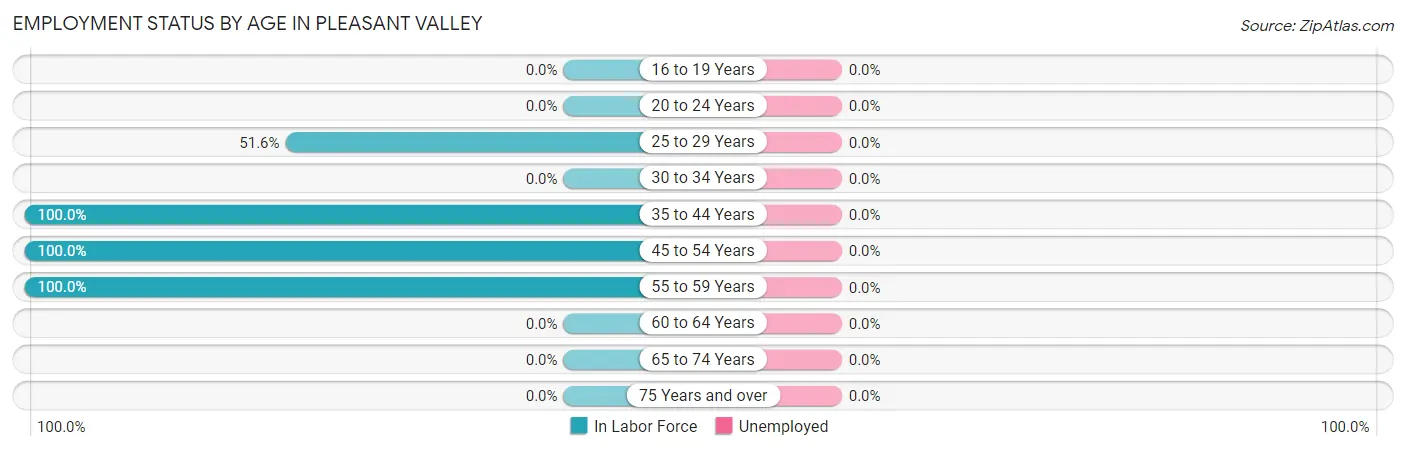
| Age Bracket | In Labor Force | Unemployed |
| 16 to 19 Years | 0 (0.0%) | 0 (0.0%) |
| 20 to 24 Years | 0 (0.0%) | 0 (0.0%) |
| 25 to 29 Years | 33 (51.6%) | 0 (0.0%) |
| 30 to 34 Years | 0 (0.0%) | 0 (0.0%) |
| 35 to 44 Years | 56 (100.0%) | 0 (0.0%) |
| 45 to 54 Years | 238 (100.0%) | 0 (0.0%) |
| 55 to 59 Years | 38 (100.0%) | 0 (0.0%) |
| 60 to 64 Years | 0 (0.0%) | 0 (0.0%) |
| 65 to 74 Years | 0 (0.0%) | 0 (0.0%) |
| 75 Years and over | 0 (0.0%) | 0 (0.0%) |
| Total | 365 (82.6%) | 0 (0.0%) |
Employment Status by Educational Attainment in Pleasant Valley
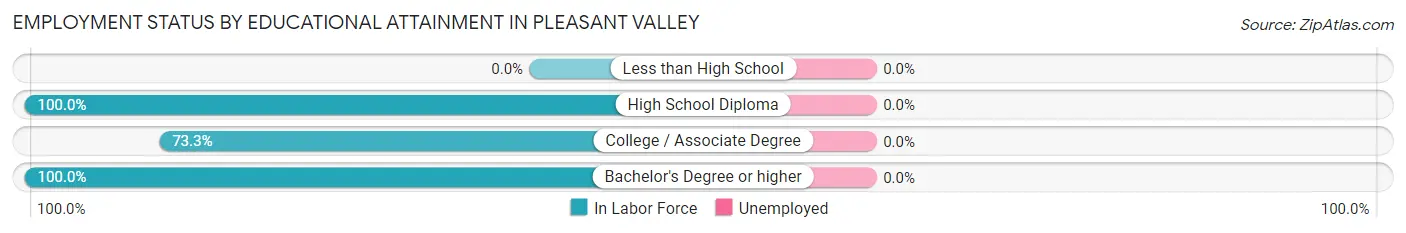
| Educational Attainment | In Labor Force | Unemployed |
| Less than High School | 0 (0.0%) | 0 (0.0%) |
| High School Diploma | 57 (100.0%) | 0 (0.0%) |
| College / Associate Degree | 85 (73.3%) | 0 (0.0%) |
| Bachelor's Degree or higher | 223 (100.0%) | 0 (0.0%) |
| Total | 365 (92.2%) | 0 (0.0%) |
Employment Occupations by Sex in Pleasant Valley
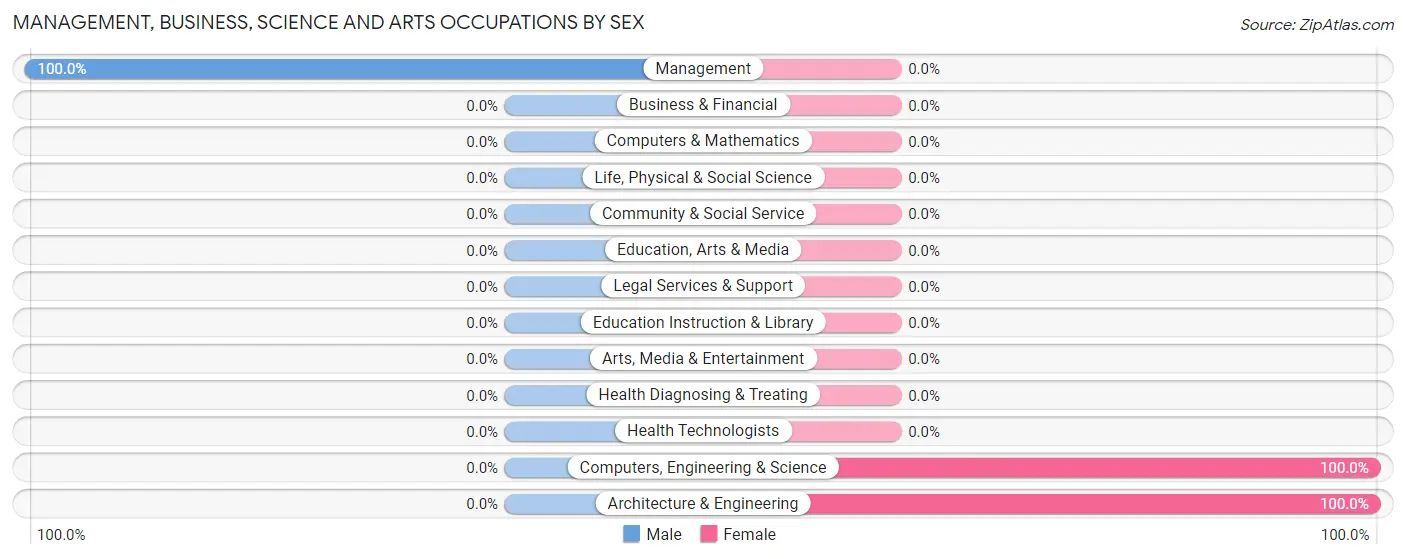
Management, Business, Science and Arts Occupations
The most common Management, Business, Science and Arts occupations in Pleasant Valley are Management (49 | 15.5%), Computers, Engineering & Science (15 | 4.8%), and Architecture & Engineering (15 | 4.8%).
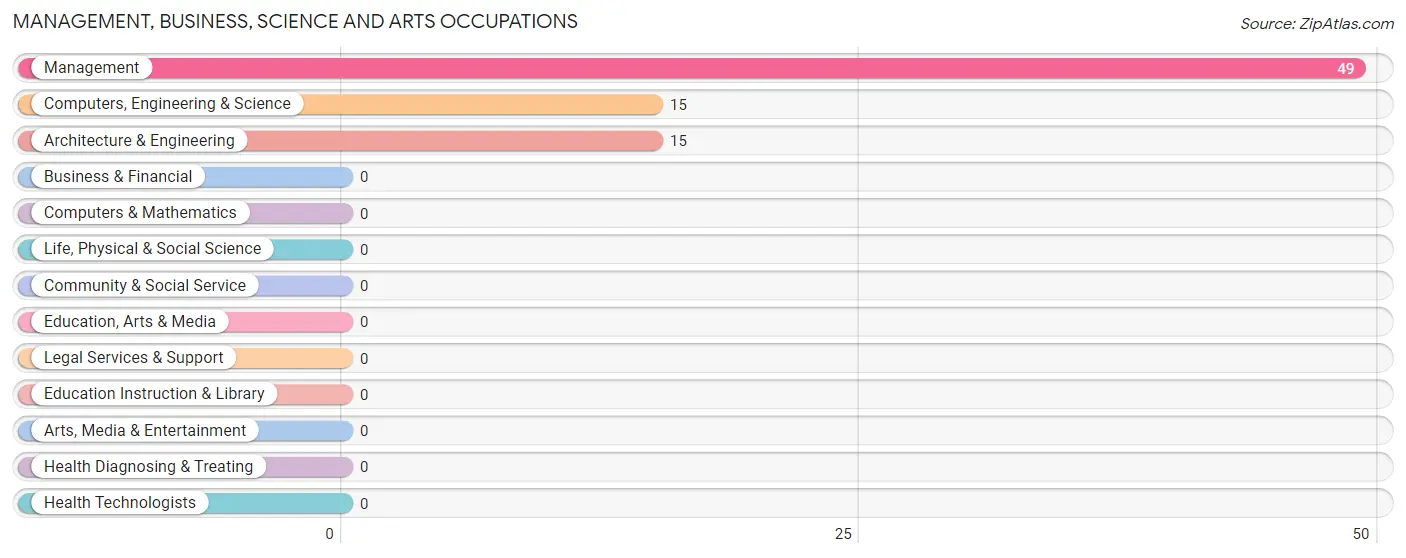
Management, Business, Science and Arts Occupations by Sex
| Occupation | Male | Female |
| Management | 49 (100.0%) | 0 (0.0%) |
| Business & Financial | 0 (0.0%) | 0 (0.0%) |
| Computers, Engineering & Science | 0 (0.0%) | 15 (100.0%) |
| Computers & Mathematics | 0 (0.0%) | 0 (0.0%) |
| Architecture & Engineering | 0 (0.0%) | 15 (100.0%) |
| Life, Physical & Social Science | 0 (0.0%) | 0 (0.0%) |
| Community & Social Service | 0 (0.0%) | 0 (0.0%) |
| Education, Arts & Media | 0 (0.0%) | 0 (0.0%) |
| Legal Services & Support | 0 (0.0%) | 0 (0.0%) |
| Education Instruction & Library | 0 (0.0%) | 0 (0.0%) |
| Arts, Media & Entertainment | 0 (0.0%) | 0 (0.0%) |
| Health Diagnosing & Treating | 0 (0.0%) | 0 (0.0%) |
| Health Technologists | 0 (0.0%) | 0 (0.0%) |
| Total (Category) | 49 (76.6%) | 15 (23.4%) |
| Total (Overall) | 282 (89.2%) | 34 (10.8%) |
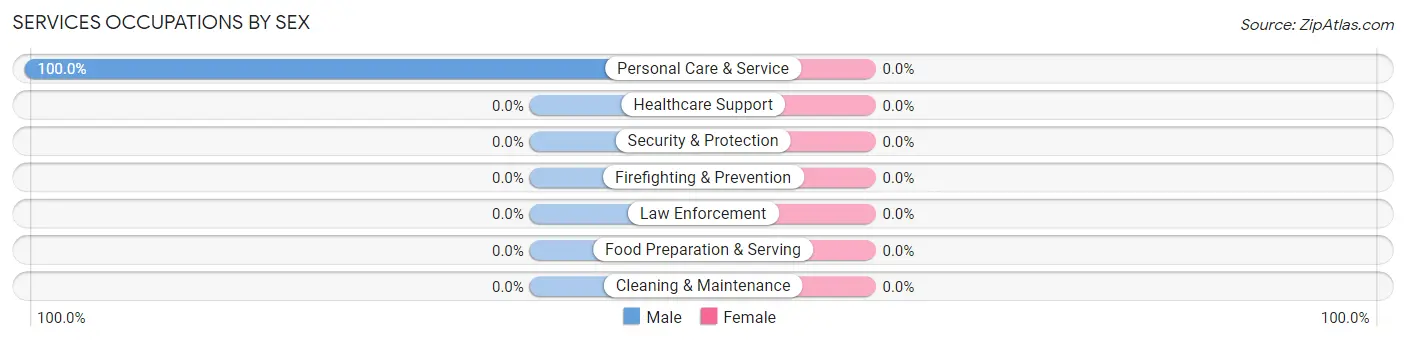
Services Occupations
The most common Services occupations in Pleasant Valley are , and Personal Care & Service (33 | 10.4%).
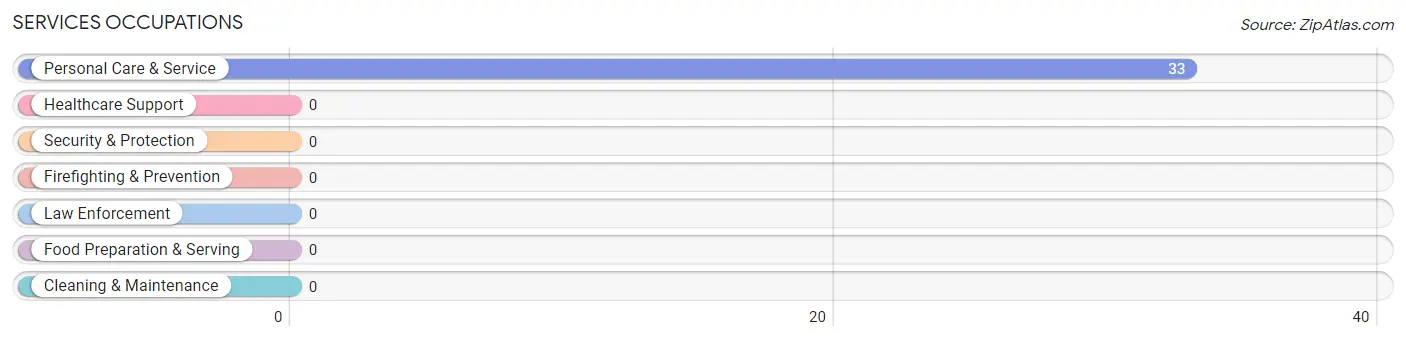
Services Occupations by Sex
| Occupation | Male | Female |
| Healthcare Support | 0 (0.0%) | 0 (0.0%) |
| Security & Protection | 0 (0.0%) | 0 (0.0%) |
| Firefighting & Prevention | 0 (0.0%) | 0 (0.0%) |
| Law Enforcement | 0 (0.0%) | 0 (0.0%) |
| Food Preparation & Serving | 0 (0.0%) | 0 (0.0%) |
| Cleaning & Maintenance | 0 (0.0%) | 0 (0.0%) |
| Personal Care & Service | 33 (100.0%) | 0 (0.0%) |
| Total (Category) | 33 (100.0%) | 0 (0.0%) |
| Total (Overall) | 282 (89.2%) | 34 (10.8%) |
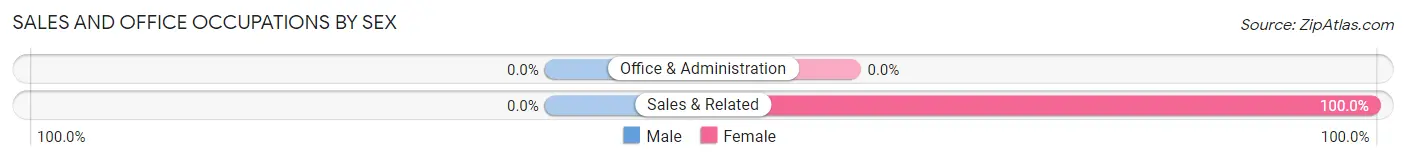
Sales and Office Occupations
The most common Sales and Office occupations in Pleasant Valley are , and Sales & Related (19 | 6.0%).
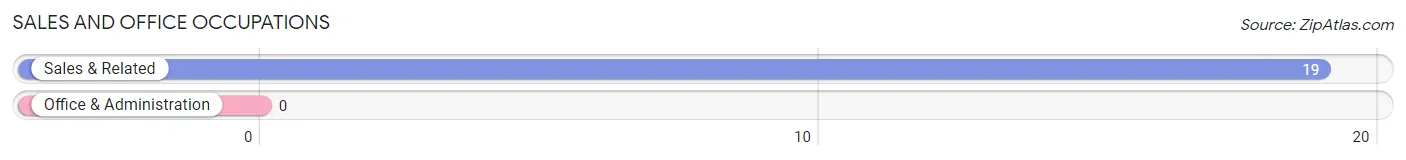
Sales and Office Occupations by Sex
| Occupation | Male | Female |
| Sales & Related | 0 (0.0%) | 19 (100.0%) |
| Office & Administration | 0 (0.0%) | 0 (0.0%) |
| Total (Category) | 0 (0.0%) | 19 (100.0%) |
| Total (Overall) | 282 (89.2%) | 34 (10.8%) |
Natural Resources, Construction and Maintenance Occupations
The most common Natural Resources, Construction and Maintenance occupations in Pleasant Valley are Construction & Extraction (165 | 52.2%), and Farming, Fishing & Forestry (16 | 5.1%).
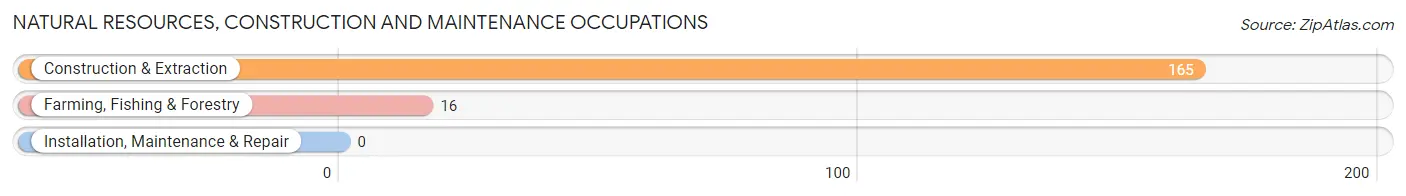
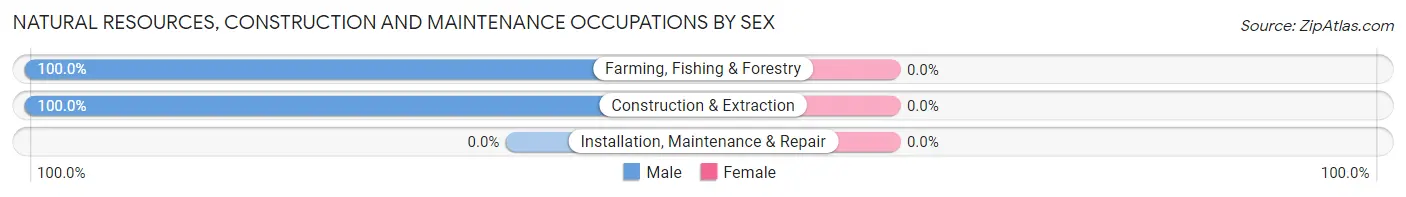
Natural Resources, Construction and Maintenance Occupations by Sex
| Occupation | Male | Female |
| Farming, Fishing & Forestry | 16 (100.0%) | 0 (0.0%) |
| Construction & Extraction | 165 (100.0%) | 0 (0.0%) |
| Installation, Maintenance & Repair | 0 (0.0%) | 0 (0.0%) |
| Total (Category) | 181 (100.0%) | 0 (0.0%) |
| Total (Overall) | 282 (89.2%) | 34 (10.8%) |
Production, Transportation and Moving Occupations
The most common Production, Transportation and Moving occupations in Pleasant Valley are , and Production (19 | 6.0%).
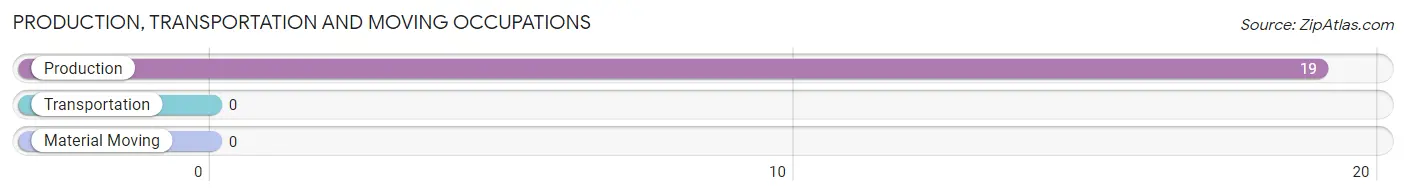
Production, Transportation and Moving Occupations by Sex
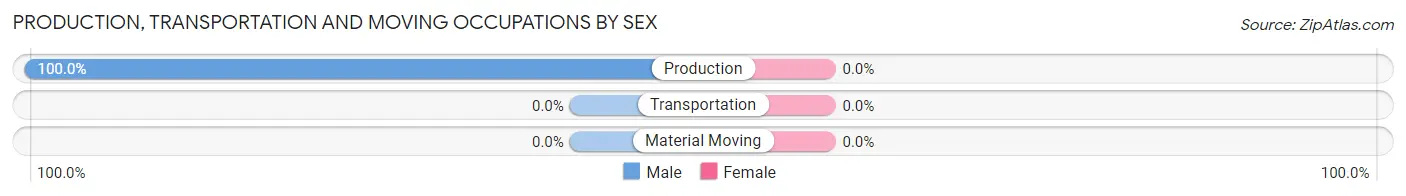
| Occupation | Male | Female |
| Production | 19 (100.0%) | 0 (0.0%) |
| Transportation | 0 (0.0%) | 0 (0.0%) |
| Material Moving | 0 (0.0%) | 0 (0.0%) |
| Total (Category) | 19 (100.0%) | 0 (0.0%) |
| Total (Overall) | 282 (89.2%) | 34 (10.8%) |
Employment Industries by Sex in Pleasant Valley
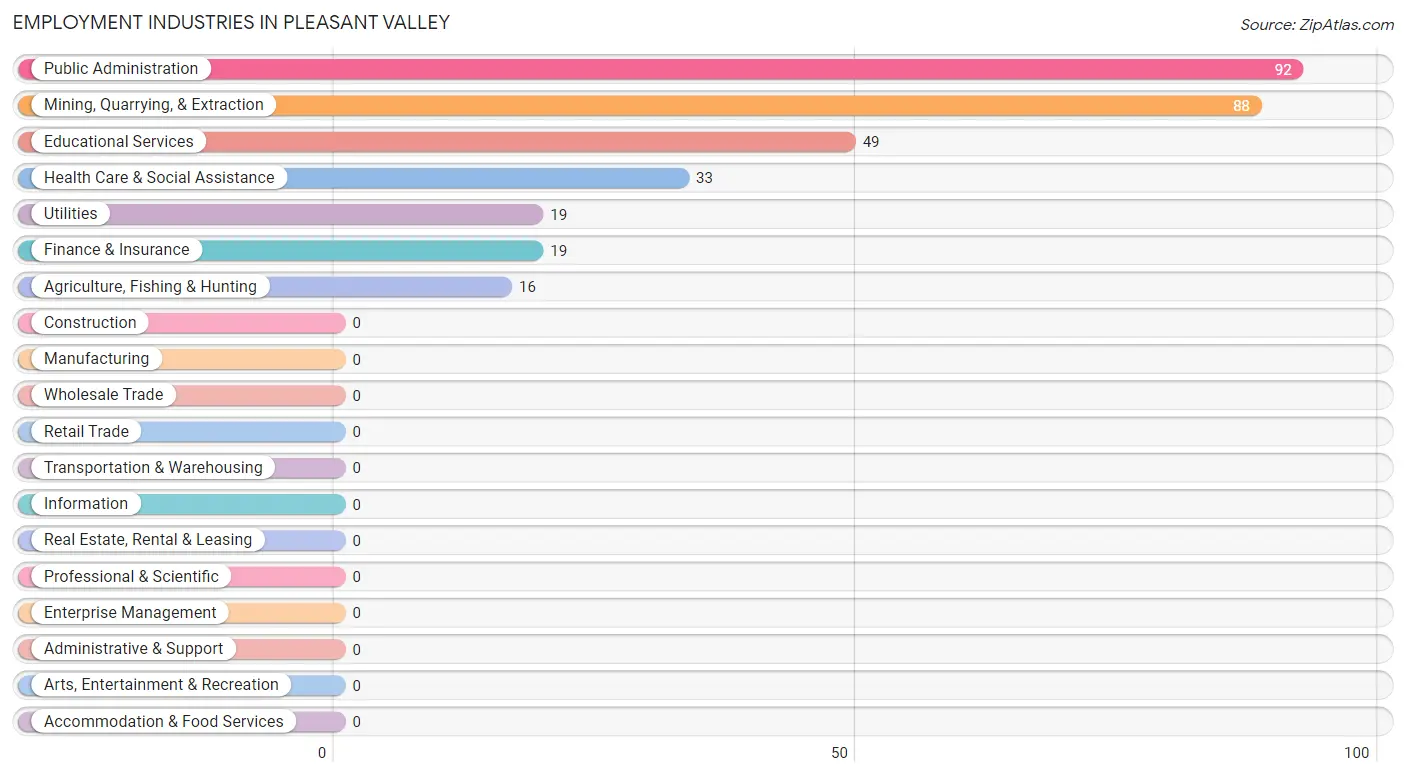
Employment Industries in Pleasant Valley
The major employment industries in Pleasant Valley include Public Administration (92 | 29.1%), Mining, Quarrying, & Extraction (88 | 27.9%), Educational Services (49 | 15.5%), Health Care & Social Assistance (33 | 10.4%), and Utilities (19 | 6.0%).
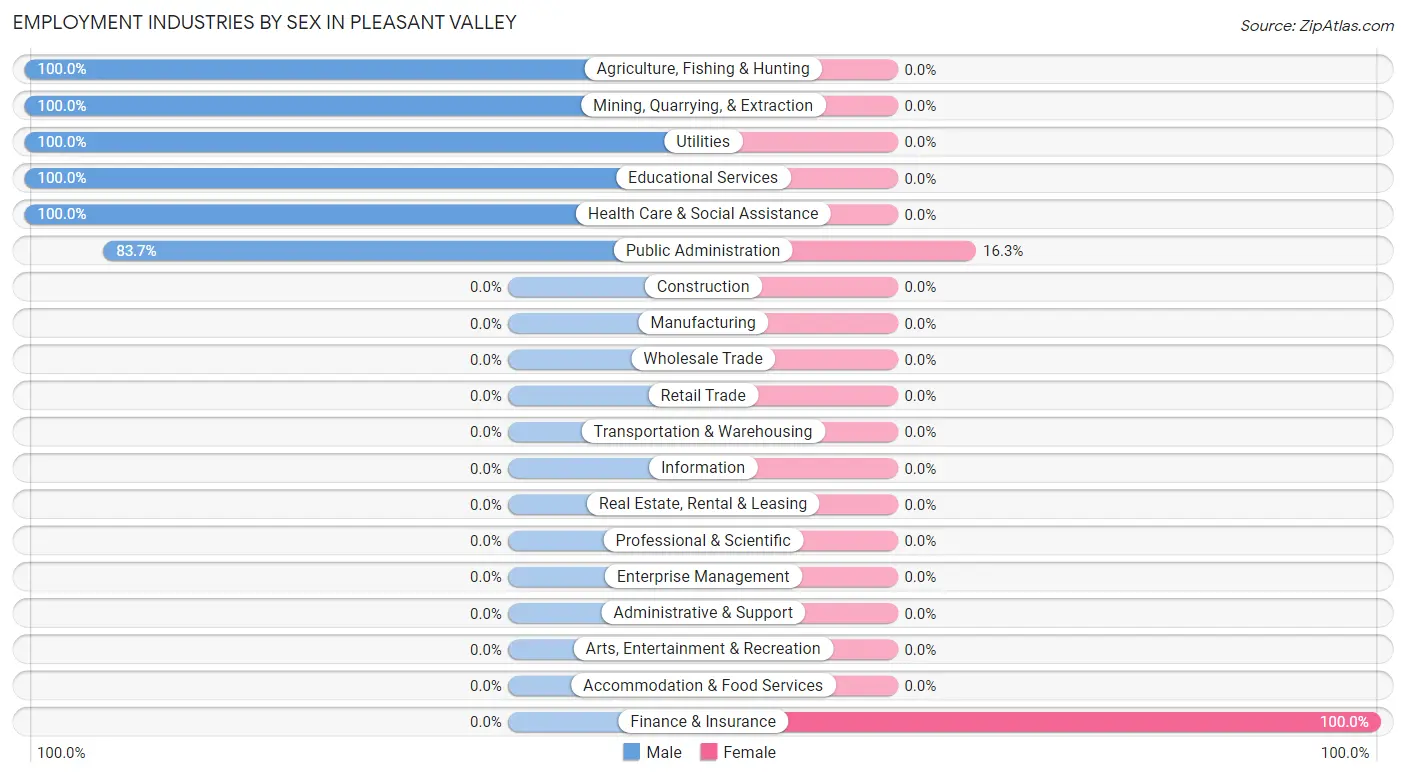
Employment Industries by Sex in Pleasant Valley
The Pleasant Valley industries that see more men than women are Agriculture, Fishing & Hunting (100.0%), Mining, Quarrying, & Extraction (100.0%), and Utilities (100.0%), whereas the industries that tend to have a higher number of women are Finance & Insurance (100.0%), and Public Administration (16.3%).
| Industry | Male | Female |
| Agriculture, Fishing & Hunting | 16 (100.0%) | 0 (0.0%) |
| Mining, Quarrying, & Extraction | 88 (100.0%) | 0 (0.0%) |
| Construction | 0 (0.0%) | 0 (0.0%) |
| Manufacturing | 0 (0.0%) | 0 (0.0%) |
| Wholesale Trade | 0 (0.0%) | 0 (0.0%) |
| Retail Trade | 0 (0.0%) | 0 (0.0%) |
| Transportation & Warehousing | 0 (0.0%) | 0 (0.0%) |
| Utilities | 19 (100.0%) | 0 (0.0%) |
| Information | 0 (0.0%) | 0 (0.0%) |
| Finance & Insurance | 0 (0.0%) | 19 (100.0%) |
| Real Estate, Rental & Leasing | 0 (0.0%) | 0 (0.0%) |
| Professional & Scientific | 0 (0.0%) | 0 (0.0%) |
| Enterprise Management | 0 (0.0%) | 0 (0.0%) |
| Administrative & Support | 0 (0.0%) | 0 (0.0%) |
| Educational Services | 49 (100.0%) | 0 (0.0%) |
| Health Care & Social Assistance | 33 (100.0%) | 0 (0.0%) |
| Arts, Entertainment & Recreation | 0 (0.0%) | 0 (0.0%) |
| Accommodation & Food Services | 0 (0.0%) | 0 (0.0%) |
| Public Administration | 77 (83.7%) | 15 (16.3%) |
| Total | 282 (89.2%) | 34 (10.8%) |
Education in Pleasant Valley
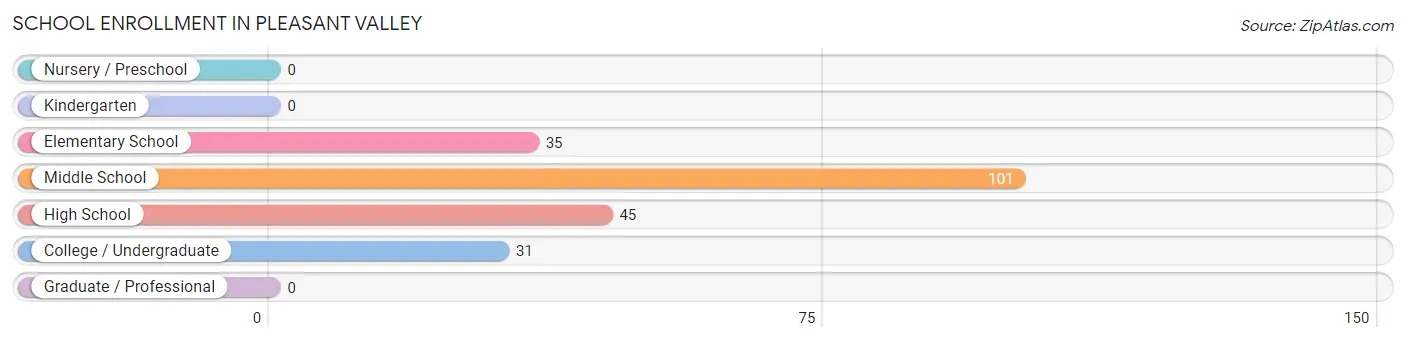
School Enrollment in Pleasant Valley
The most common levels of schooling among the 212 students in Pleasant Valley are middle school (101 | 47.6%), high school (45 | 21.2%), and elementary school (35 | 16.5%).
| School Level | # Students | % Students |
| Nursery / Preschool | 0 | 0.0% |
| Kindergarten | 0 | 0.0% |
| Elementary School | 35 | 16.5% |
| Middle School | 101 | 47.6% |
| High School | 45 | 21.2% |
| College / Undergraduate | 31 | 14.6% |
| Graduate / Professional | 0 | 0.0% |
| Total | 212 | 100.0% |
School Enrollment by Age by Funding Source in Pleasant Valley
Out of a total of 212 students who are enrolled in schools in Pleasant Valley, 108 (50.9%) attend a private institution, while the remaining 104 (49.1%) are enrolled in public schools. The age group of 5 to 9 year old has the highest likelihood of being enrolled in private schools, with 35 (100.0% in the age bracket) enrolled. Conversely, the age group of 25 to 34 year olds has the lowest likelihood of being enrolled in a private school, with 31 (100.0% in the age bracket) attending a public institution.
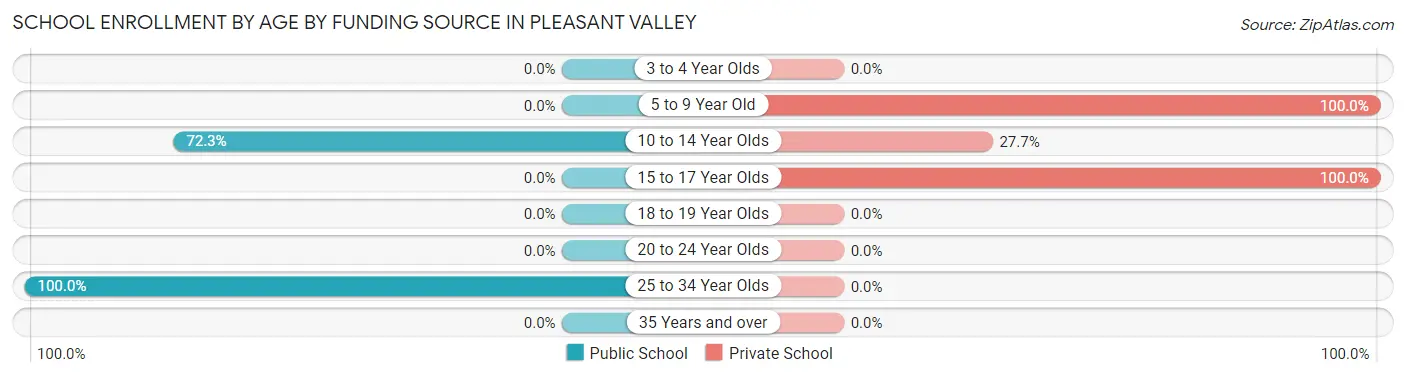
| Age Bracket | Public School | Private School |
| 3 to 4 Year Olds | 0 (0.0%) | 0 (0.0%) |
| 5 to 9 Year Old | 0 (0.0%) | 35 (100.0%) |
| 10 to 14 Year Olds | 73 (72.3%) | 28 (27.7%) |
| 15 to 17 Year Olds | 0 (0.0%) | 45 (100.0%) |
| 18 to 19 Year Olds | 0 (0.0%) | 0 (0.0%) |
| 20 to 24 Year Olds | 0 (0.0%) | 0 (0.0%) |
| 25 to 34 Year Olds | 31 (100.0%) | 0 (0.0%) |
| 35 Years and over | 0 (0.0%) | 0 (0.0%) |
| Total | 104 (49.1%) | 108 (50.9%) |
Educational Attainment by Field of Study in Pleasant Valley
Bio, nature & agricultural (151 | 54.7%), business (77 | 27.9%), psychology (33 | 12.0%), and engineering (15 | 5.4%) are the most common fields of study among 276 individuals in Pleasant Valley who have obtained a bachelor's degree or higher.
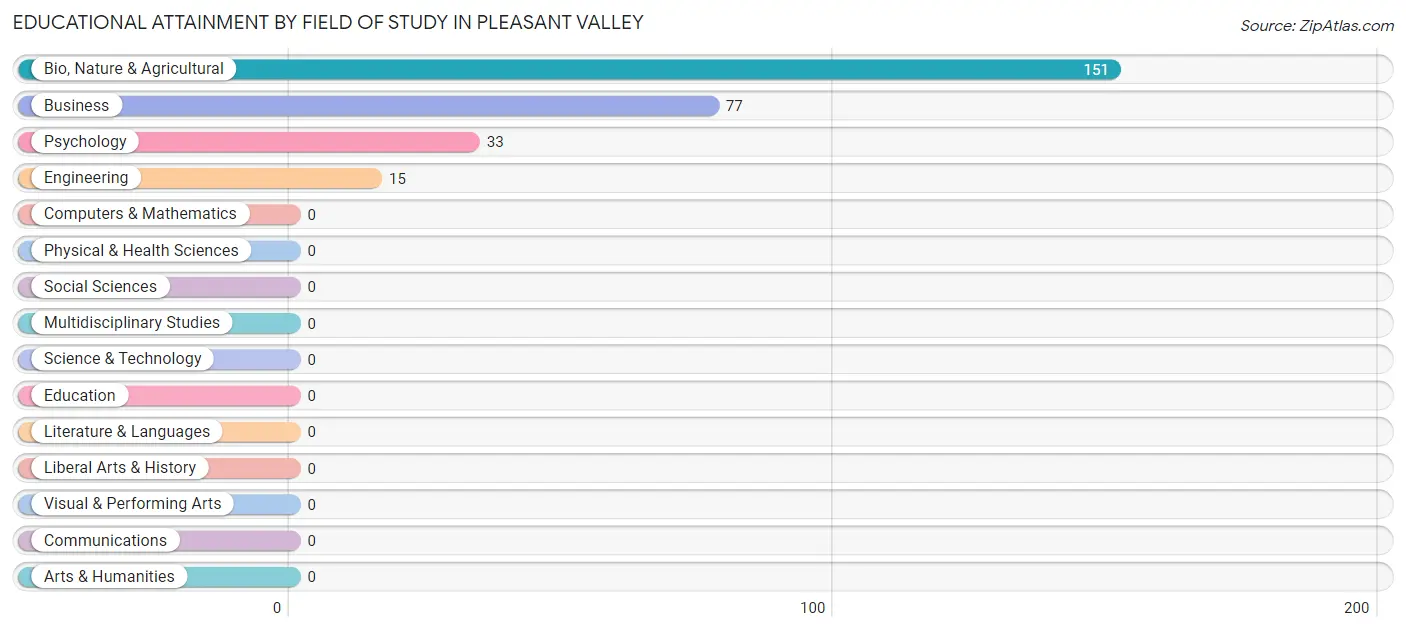
| Field of Study | # Graduates | % Graduates |
| Computers & Mathematics | 0 | 0.0% |
| Bio, Nature & Agricultural | 151 | 54.7% |
| Physical & Health Sciences | 0 | 0.0% |
| Psychology | 33 | 12.0% |
| Social Sciences | 0 | 0.0% |
| Engineering | 15 | 5.4% |
| Multidisciplinary Studies | 0 | 0.0% |
| Science & Technology | 0 | 0.0% |
| Business | 77 | 27.9% |
| Education | 0 | 0.0% |
| Literature & Languages | 0 | 0.0% |
| Liberal Arts & History | 0 | 0.0% |
| Visual & Performing Arts | 0 | 0.0% |
| Communications | 0 | 0.0% |
| Arts & Humanities | 0 | 0.0% |
| Total | 276 | 100.0% |
Transportation & Commute in Pleasant Valley
Vehicle Availability by Sex in Pleasant Valley
The most prevalent vehicle ownership categories in Pleasant Valley are males with 1 vehicle (110, accounting for 39.0%) and females with 1 vehicle (0, making up 132.5%).
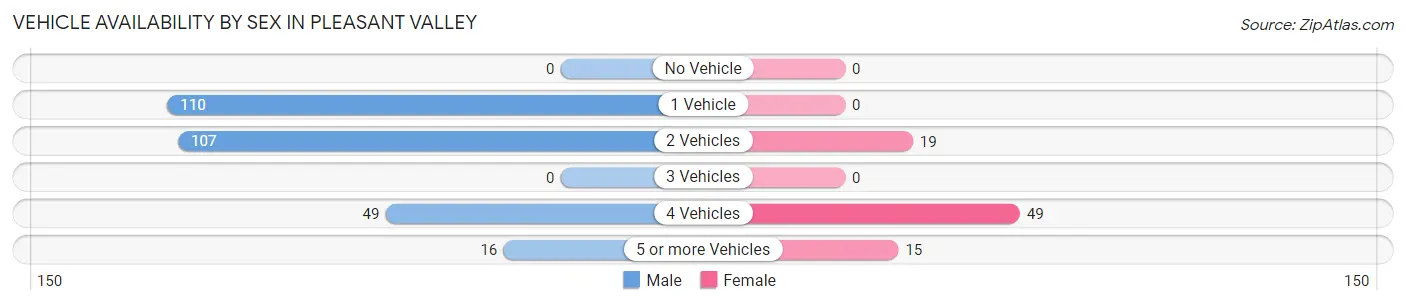
| Vehicles Available | Male | Female |
| No Vehicle | 0 (0.0%) | 0 (0.0%) |
| 1 Vehicle | 110 (39.0%) | 0 (0.0%) |
| 2 Vehicles | 107 (37.9%) | 19 (22.9%) |
| 3 Vehicles | 0 (0.0%) | 0 (0.0%) |
| 4 Vehicles | 49 (17.4%) | 49 (59.0%) |
| 5 or more Vehicles | 16 (5.7%) | 15 (18.1%) |
| Total | 282 (100.0%) | 83 (100.0%) |
Commute Time in Pleasant Valley
The most frequently occuring commute durations in Pleasant Valley are 45 to 59 minutes (130 commuters, 37.2%), 60 to 89 minutes (90 commuters, 25.8%), and 40 to 44 minutes (80 commuters, 22.9%).
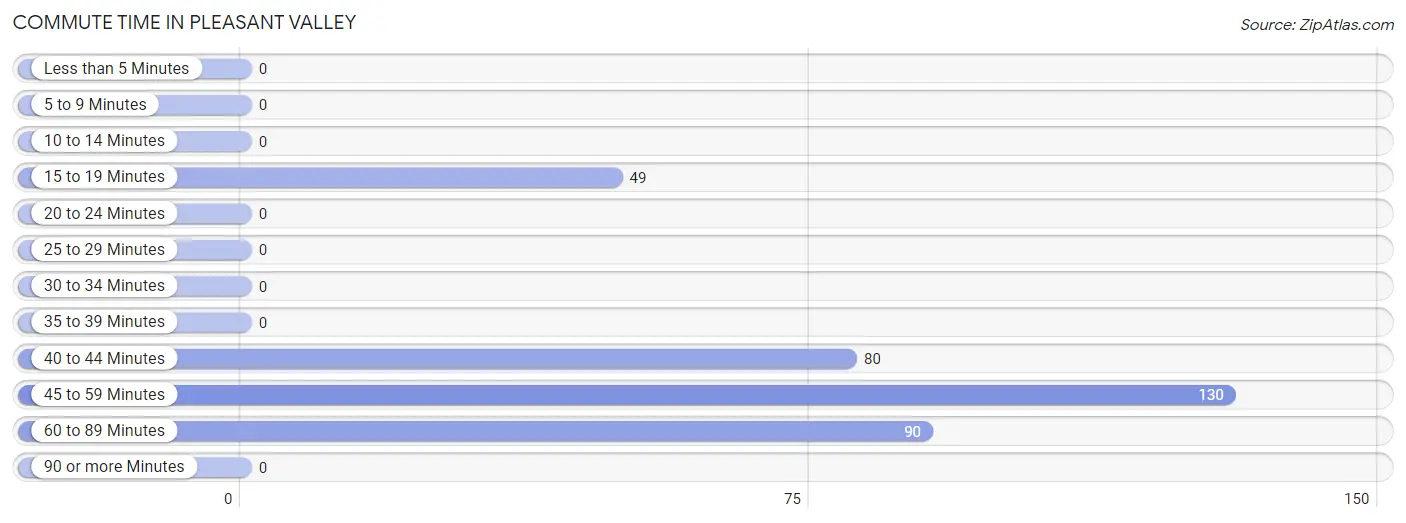
| Commute Time | # Commuters | % Commuters |
| Less than 5 Minutes | 0 | 0.0% |
| 5 to 9 Minutes | 0 | 0.0% |
| 10 to 14 Minutes | 0 | 0.0% |
| 15 to 19 Minutes | 49 | 14.0% |
| 20 to 24 Minutes | 0 | 0.0% |
| 25 to 29 Minutes | 0 | 0.0% |
| 30 to 34 Minutes | 0 | 0.0% |
| 35 to 39 Minutes | 0 | 0.0% |
| 40 to 44 Minutes | 80 | 22.9% |
| 45 to 59 Minutes | 130 | 37.2% |
| 60 to 89 Minutes | 90 | 25.8% |
| 90 or more Minutes | 0 | 0.0% |
Commute Time by Sex in Pleasant Valley
The most common commute times in Pleasant Valley are 45 to 59 minutes (96 commuters, 36.1%) for males and 15 to 19 minutes (49 commuters, 59.0%) for females.
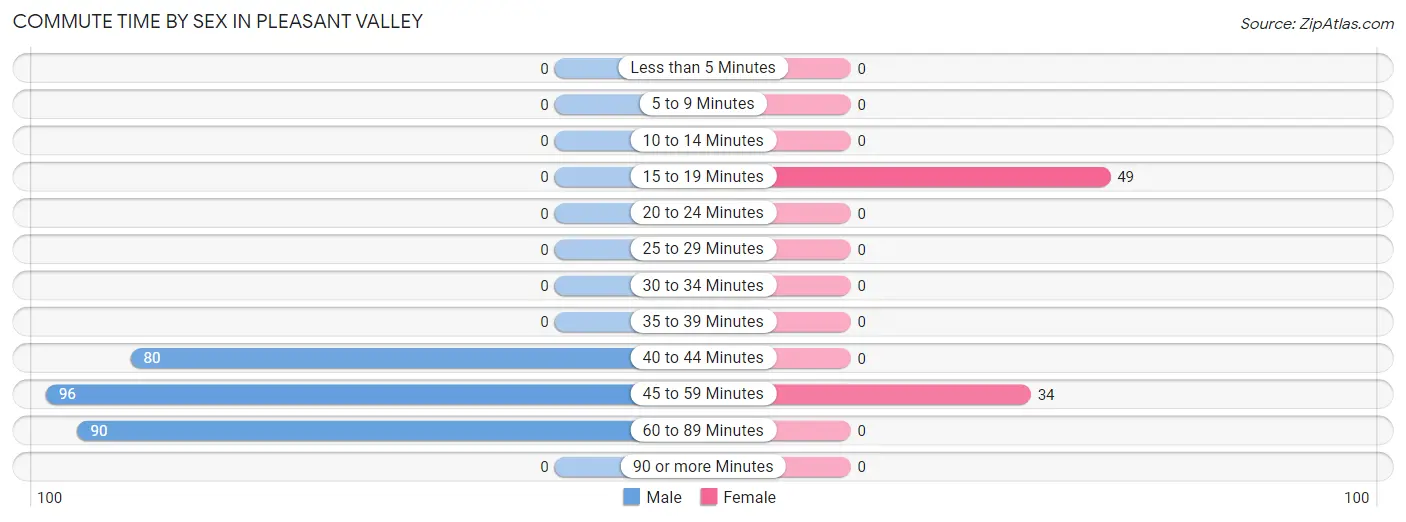
| Commute Time | Male | Female |
| Less than 5 Minutes | 0 (0.0%) | 0 (0.0%) |
| 5 to 9 Minutes | 0 (0.0%) | 0 (0.0%) |
| 10 to 14 Minutes | 0 (0.0%) | 0 (0.0%) |
| 15 to 19 Minutes | 0 (0.0%) | 49 (59.0%) |
| 20 to 24 Minutes | 0 (0.0%) | 0 (0.0%) |
| 25 to 29 Minutes | 0 (0.0%) | 0 (0.0%) |
| 30 to 34 Minutes | 0 (0.0%) | 0 (0.0%) |
| 35 to 39 Minutes | 0 (0.0%) | 0 (0.0%) |
| 40 to 44 Minutes | 80 (30.1%) | 0 (0.0%) |
| 45 to 59 Minutes | 96 (36.1%) | 34 (41.0%) |
| 60 to 89 Minutes | 90 (33.8%) | 0 (0.0%) |
| 90 or more Minutes | 0 (0.0%) | 0 (0.0%) |
Time of Departure to Work by Sex in Pleasant Valley
The most frequent times of departure to work in Pleasant Valley are 5:00 AM to 5:29 AM (88, 33.1%) for males and 12:00 AM to 4:59 AM (49, 59.0%) for females.
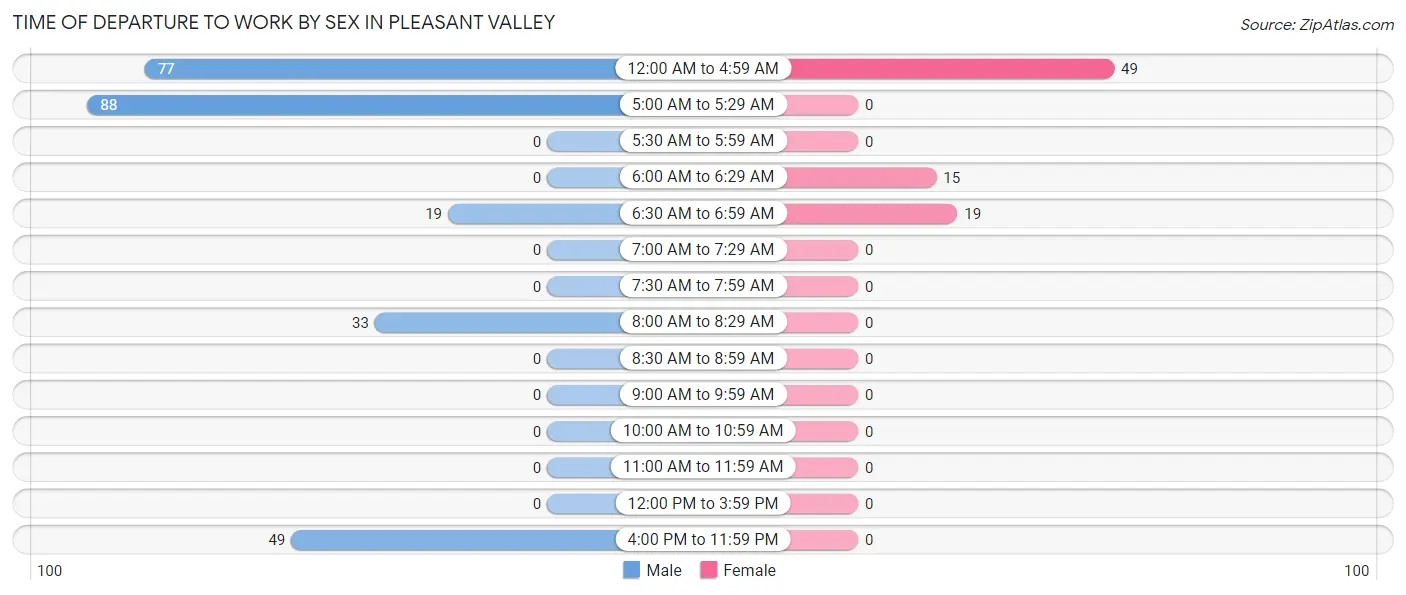
| Time of Departure | Male | Female |
| 12:00 AM to 4:59 AM | 77 (28.9%) | 49 (59.0%) |
| 5:00 AM to 5:29 AM | 88 (33.1%) | 0 (0.0%) |
| 5:30 AM to 5:59 AM | 0 (0.0%) | 0 (0.0%) |
| 6:00 AM to 6:29 AM | 0 (0.0%) | 15 (18.1%) |
| 6:30 AM to 6:59 AM | 19 (7.1%) | 19 (22.9%) |
| 7:00 AM to 7:29 AM | 0 (0.0%) | 0 (0.0%) |
| 7:30 AM to 7:59 AM | 0 (0.0%) | 0 (0.0%) |
| 8:00 AM to 8:29 AM | 33 (12.4%) | 0 (0.0%) |
| 8:30 AM to 8:59 AM | 0 (0.0%) | 0 (0.0%) |
| 9:00 AM to 9:59 AM | 0 (0.0%) | 0 (0.0%) |
| 10:00 AM to 10:59 AM | 0 (0.0%) | 0 (0.0%) |
| 11:00 AM to 11:59 AM | 0 (0.0%) | 0 (0.0%) |
| 12:00 PM to 3:59 PM | 0 (0.0%) | 0 (0.0%) |
| 4:00 PM to 11:59 PM | 49 (18.4%) | 0 (0.0%) |
| Total | 266 (100.0%) | 83 (100.0%) |
Housing Occupancy in Pleasant Valley
Occupancy by Ownership in Pleasant Valley
Of the total 260 dwellings in Pleasant Valley, owner-occupied units account for 241 (92.7%), while renter-occupied units make up 19 (7.3%).
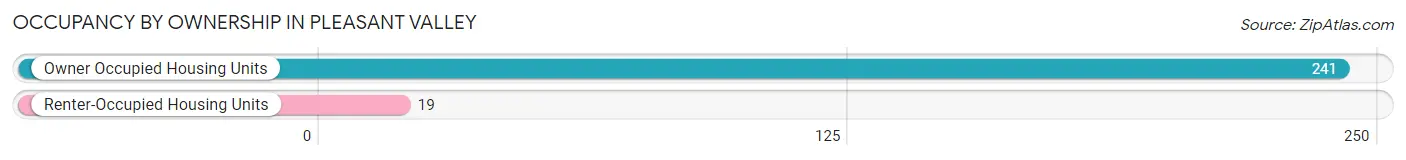
| Occupancy | # Housing Units | % Housing Units |
| Owner Occupied Housing Units | 241 | 92.7% |
| Renter-Occupied Housing Units | 19 | 7.3% |
| Total Occupied Housing Units | 260 | 100.0% |
Occupancy by Household Size in Pleasant Valley
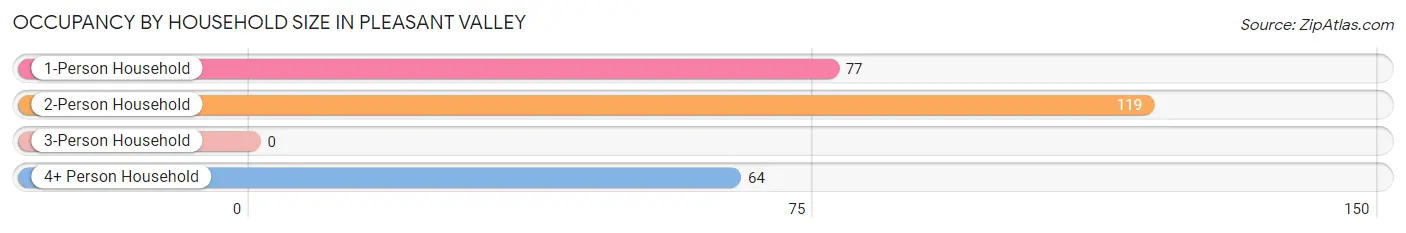
| Household Size | # Housing Units | % Housing Units |
| 1-Person Household | 77 | 29.6% |
| 2-Person Household | 119 | 45.8% |
| 3-Person Household | 0 | 0.0% |
| 4+ Person Household | 64 | 24.6% |
| Total Housing Units | 260 | 100.0% |
Occupancy by Ownership by Household Size in Pleasant Valley
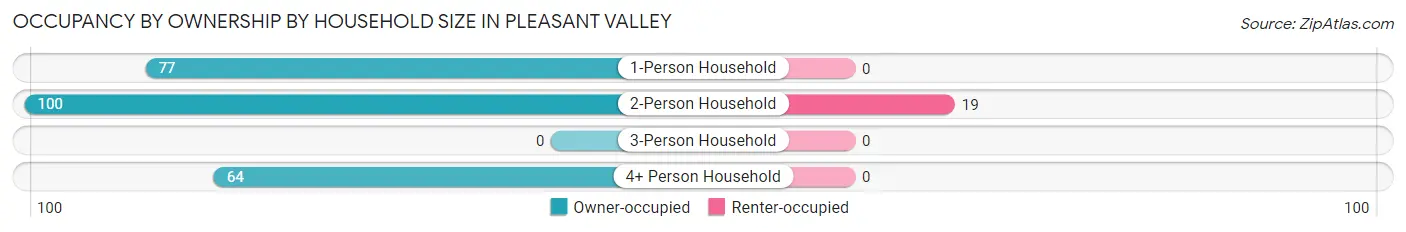
| Household Size | Owner-occupied | Renter-occupied |
| 1-Person Household | 77 (100.0%) | 0 (0.0%) |
| 2-Person Household | 100 (84.0%) | 19 (16.0%) |
| 3-Person Household | 0 (0.0%) | 0 (0.0%) |
| 4+ Person Household | 64 (100.0%) | 0 (0.0%) |
| Total Housing Units | 241 (92.7%) | 19 (7.3%) |
Occupancy by Educational Attainment in Pleasant Valley
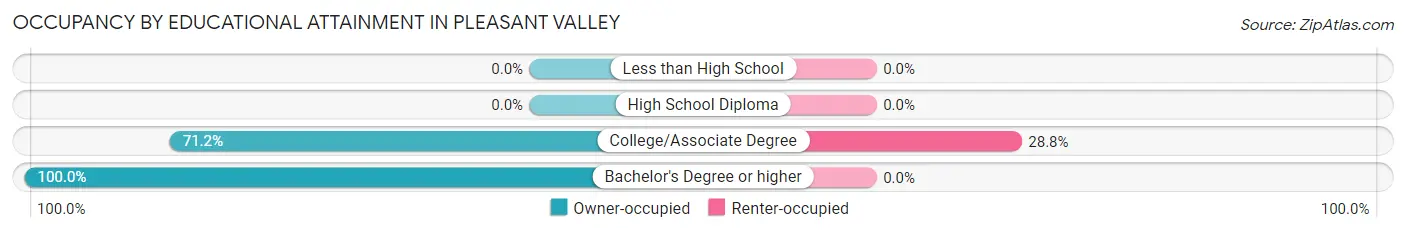
| Household Size | Owner-occupied | Renter-occupied |
| Less than High School | 0 (0.0%) | 0 (0.0%) |
| High School Diploma | 0 (0.0%) | 0 (0.0%) |
| College/Associate Degree | 47 (71.2%) | 19 (28.8%) |
| Bachelor's Degree or higher | 194 (100.0%) | 0 (0.0%) |
Occupancy by Age of Householder in Pleasant Valley
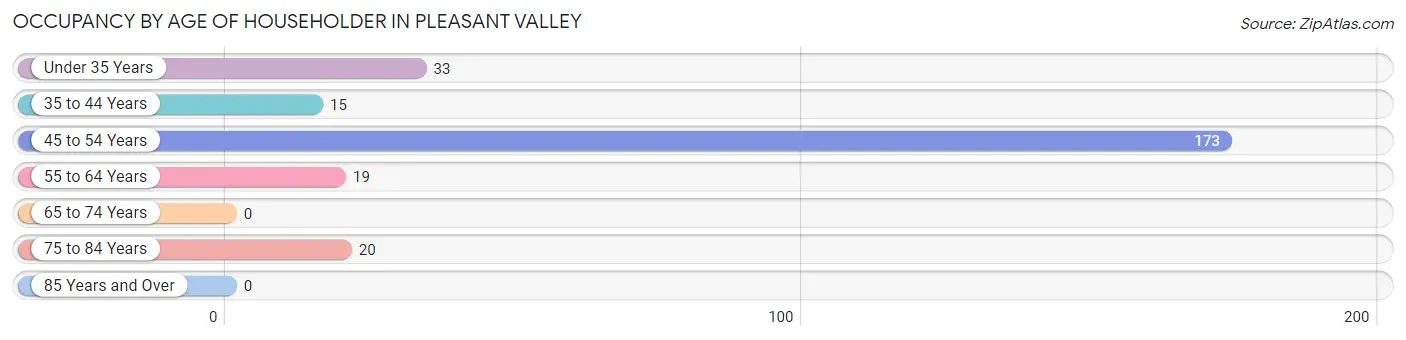
| Age Bracket | # Households | % Households |
| Under 35 Years | 33 | 12.7% |
| 35 to 44 Years | 15 | 5.8% |
| 45 to 54 Years | 173 | 66.5% |
| 55 to 64 Years | 19 | 7.3% |
| 65 to 74 Years | 0 | 0.0% |
| 75 to 84 Years | 20 | 7.7% |
| 85 Years and Over | 0 | 0.0% |
| Total | 260 | 100.0% |
Housing Finances in Pleasant Valley
Median Income by Occupancy in Pleasant Valley
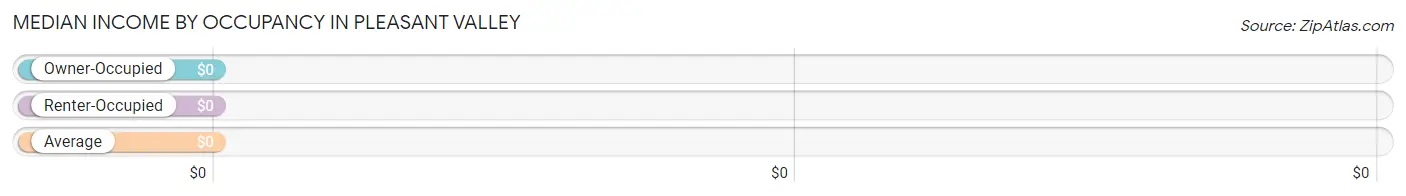
| Occupancy Type | # Households | Median Income |
| Owner-Occupied | 241 (92.7%) | $0 |
| Renter-Occupied | 19 (7.3%) | $0 |
| Average | 260 (100.0%) | $0 |
Occupancy by Householder Income Bracket in Pleasant Valley
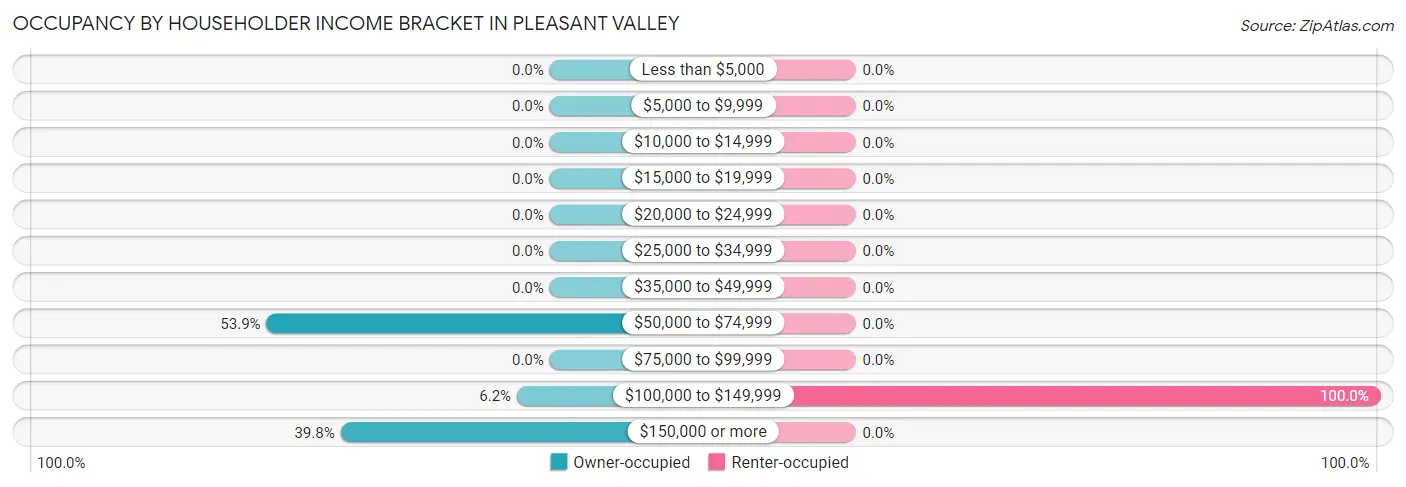
| Income Bracket | Owner-occupied | Renter-occupied |
| Less than $5,000 | 0 (0.0%) | 0 (0.0%) |
| $5,000 to $9,999 | 0 (0.0%) | 0 (0.0%) |
| $10,000 to $14,999 | 0 (0.0%) | 0 (0.0%) |
| $15,000 to $19,999 | 0 (0.0%) | 0 (0.0%) |
| $20,000 to $24,999 | 0 (0.0%) | 0 (0.0%) |
| $25,000 to $34,999 | 0 (0.0%) | 0 (0.0%) |
| $35,000 to $49,999 | 0 (0.0%) | 0 (0.0%) |
| $50,000 to $74,999 | 130 (53.9%) | 0 (0.0%) |
| $75,000 to $99,999 | 0 (0.0%) | 0 (0.0%) |
| $100,000 to $149,999 | 15 (6.2%) | 19 (100.0%) |
| $150,000 or more | 96 (39.8%) | 0 (0.0%) |
| Total | 241 (100.0%) | 19 (100.0%) |
Monthly Housing Cost Tiers in Pleasant Valley
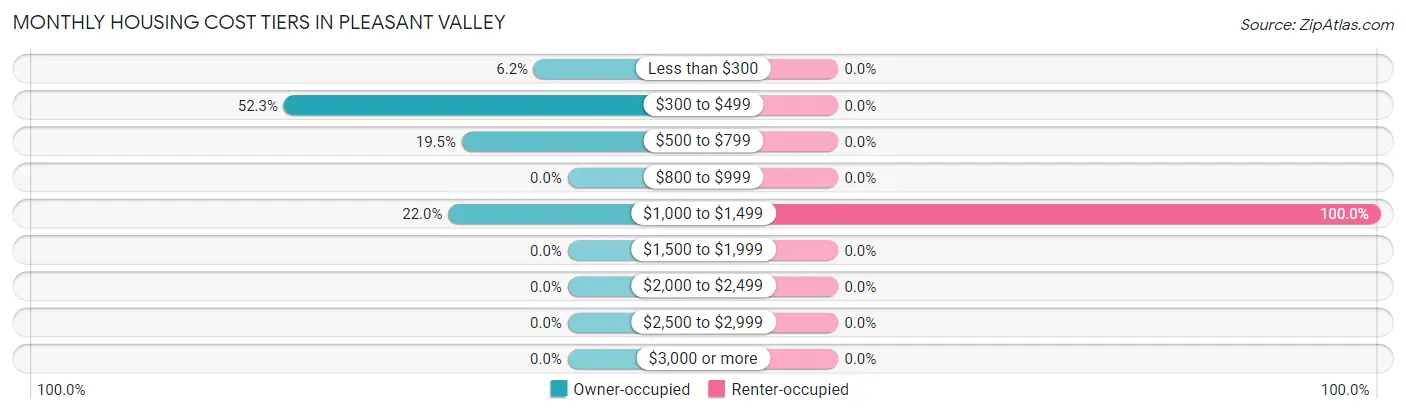
| Monthly Cost | Owner-occupied | Renter-occupied |
| Less than $300 | 15 (6.2%) | 0 (0.0%) |
| $300 to $499 | 126 (52.3%) | 0 (0.0%) |
| $500 to $799 | 47 (19.5%) | 0 (0.0%) |
| $800 to $999 | 0 (0.0%) | 0 (0.0%) |
| $1,000 to $1,499 | 53 (22.0%) | 19 (100.0%) |
| $1,500 to $1,999 | 0 (0.0%) | 0 (0.0%) |
| $2,000 to $2,499 | 0 (0.0%) | 0 (0.0%) |
| $2,500 to $2,999 | 0 (0.0%) | 0 (0.0%) |
| $3,000 or more | 0 (0.0%) | 0 (0.0%) |
| Total | 241 (100.0%) | 19 (100.0%) |
Physical Housing Characteristics in Pleasant Valley
Housing Structures in Pleasant Valley
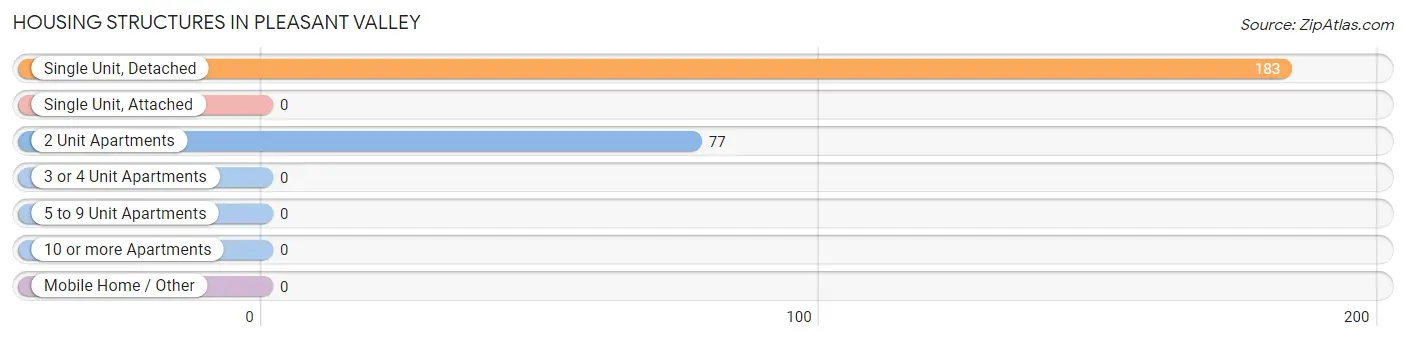
| Structure Type | # Housing Units | % Housing Units |
| Single Unit, Detached | 183 | 70.4% |
| Single Unit, Attached | 0 | 0.0% |
| 2 Unit Apartments | 77 | 29.6% |
| 3 or 4 Unit Apartments | 0 | 0.0% |
| 5 to 9 Unit Apartments | 0 | 0.0% |
| 10 or more Apartments | 0 | 0.0% |
| Mobile Home / Other | 0 | 0.0% |
| Total | 260 | 100.0% |
Housing Structures by Occupancy in Pleasant Valley
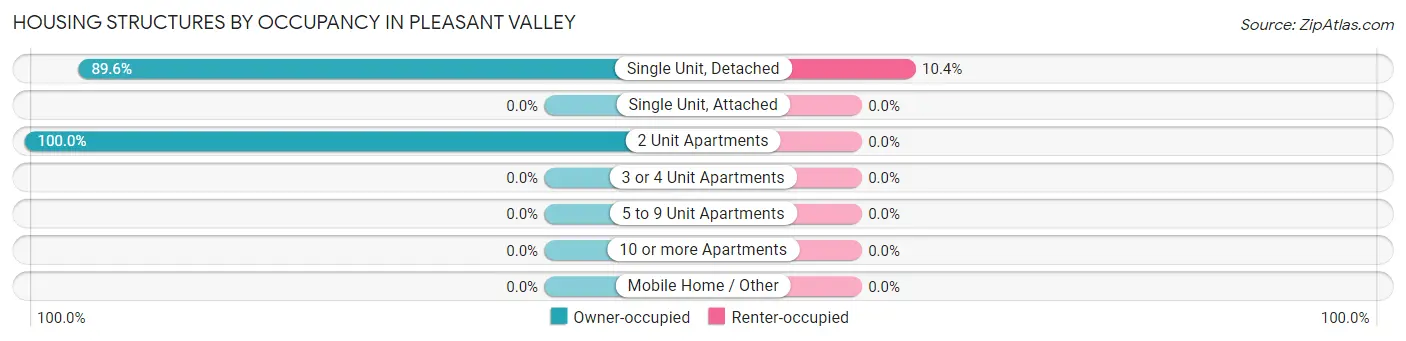
| Structure Type | Owner-occupied | Renter-occupied |
| Single Unit, Detached | 164 (89.6%) | 19 (10.4%) |
| Single Unit, Attached | 0 (0.0%) | 0 (0.0%) |
| 2 Unit Apartments | 77 (100.0%) | 0 (0.0%) |
| 3 or 4 Unit Apartments | 0 (0.0%) | 0 (0.0%) |
| 5 to 9 Unit Apartments | 0 (0.0%) | 0 (0.0%) |
| 10 or more Apartments | 0 (0.0%) | 0 (0.0%) |
| Mobile Home / Other | 0 (0.0%) | 0 (0.0%) |
| Total | 241 (92.7%) | 19 (7.3%) |
Housing Structures by Number of Rooms in Pleasant Valley
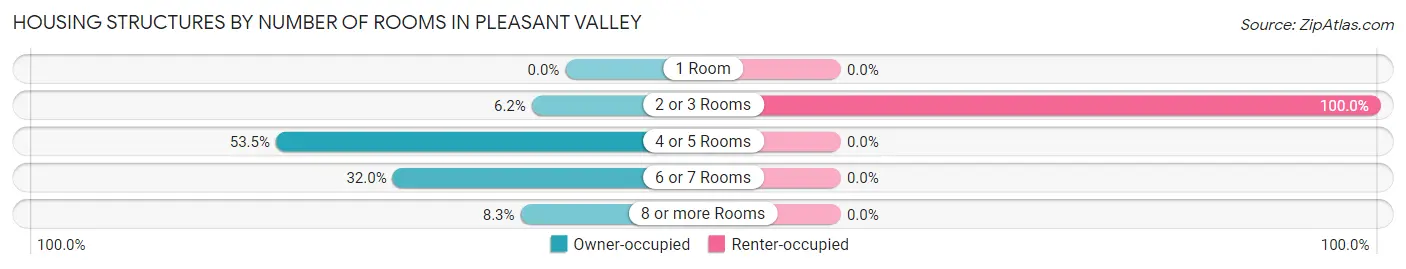
| Number of Rooms | Owner-occupied | Renter-occupied |
| 1 Room | 0 (0.0%) | 0 (0.0%) |
| 2 or 3 Rooms | 15 (6.2%) | 19 (100.0%) |
| 4 or 5 Rooms | 129 (53.5%) | 0 (0.0%) |
| 6 or 7 Rooms | 77 (32.0%) | 0 (0.0%) |
| 8 or more Rooms | 20 (8.3%) | 0 (0.0%) |
| Total | 241 (100.0%) | 19 (100.0%) |
Housing Structure by Heating Type in Pleasant Valley
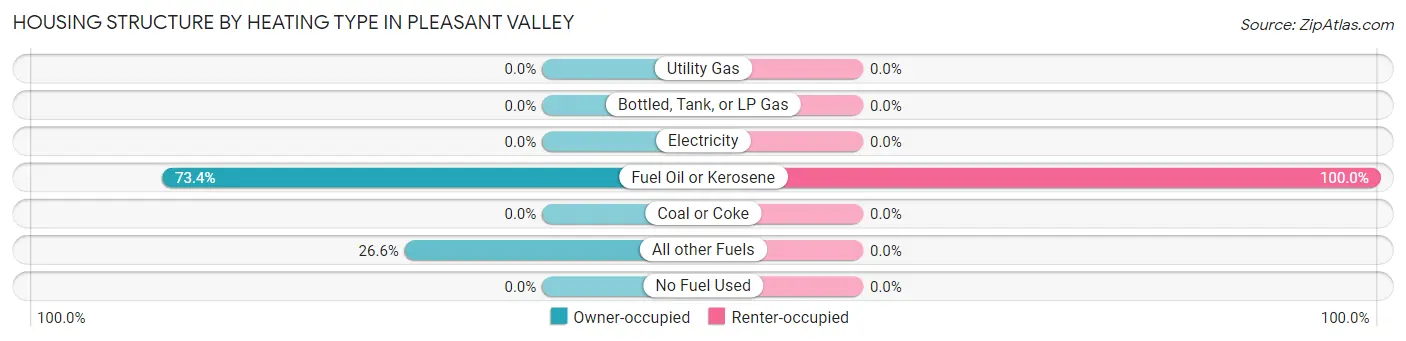
| Heating Type | Owner-occupied | Renter-occupied |
| Utility Gas | 0 (0.0%) | 0 (0.0%) |
| Bottled, Tank, or LP Gas | 0 (0.0%) | 0 (0.0%) |
| Electricity | 0 (0.0%) | 0 (0.0%) |
| Fuel Oil or Kerosene | 177 (73.4%) | 19 (100.0%) |
| Coal or Coke | 0 (0.0%) | 0 (0.0%) |
| All other Fuels | 64 (26.6%) | 0 (0.0%) |
| No Fuel Used | 0 (0.0%) | 0 (0.0%) |
| Total | 241 (100.0%) | 19 (100.0%) |
Household Vehicle Usage in Pleasant Valley
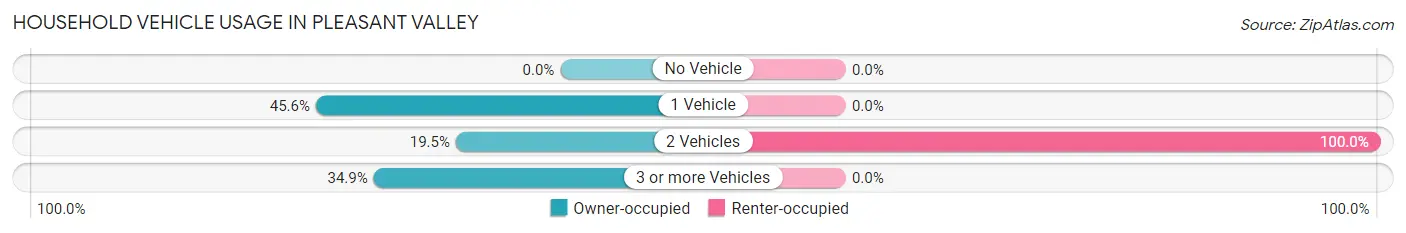
| Vehicles per Household | Owner-occupied | Renter-occupied |
| No Vehicle | 0 (0.0%) | 0 (0.0%) |
| 1 Vehicle | 110 (45.6%) | 0 (0.0%) |
| 2 Vehicles | 47 (19.5%) | 19 (100.0%) |
| 3 or more Vehicles | 84 (34.8%) | 0 (0.0%) |
| Total | 241 (100.0%) | 19 (100.0%) |
Real Estate & Mortgages in Pleasant Valley
Real Estate and Mortgage Overview in Pleasant Valley
| Characteristic | Without Mortgage | With Mortgage |
| Housing Units | 208 | 33 |
| Median Property Value | - | - |
| Median Household Income | - | - |
| Monthly Housing Costs | $471 | $0 |
| Real Estate Taxes | $1,637 | $0 |
Property Value by Mortgage Status in Pleasant Valley
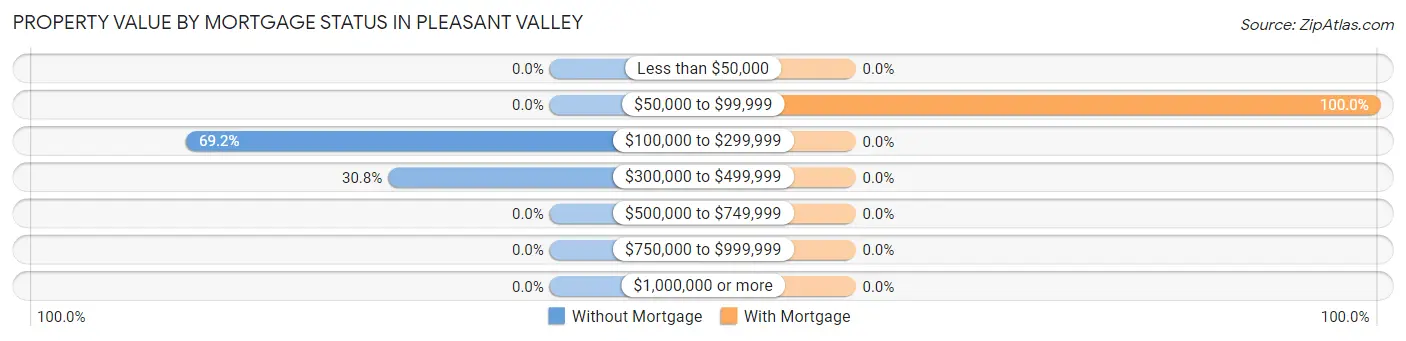
| Property Value | Without Mortgage | With Mortgage |
| Less than $50,000 | 0 (0.0%) | 0 (0.0%) |
| $50,000 to $99,999 | 0 (0.0%) | 33 (100.0%) |
| $100,000 to $299,999 | 144 (69.2%) | 0 (0.0%) |
| $300,000 to $499,999 | 64 (30.8%) | 0 (0.0%) |
| $500,000 to $749,999 | 0 (0.0%) | 0 (0.0%) |
| $750,000 to $999,999 | 0 (0.0%) | 0 (0.0%) |
| $1,000,000 or more | 0 (0.0%) | 0 (0.0%) |
| Total | 208 (100.0%) | 33 (100.0%) |
Household Income by Mortgage Status in Pleasant Valley
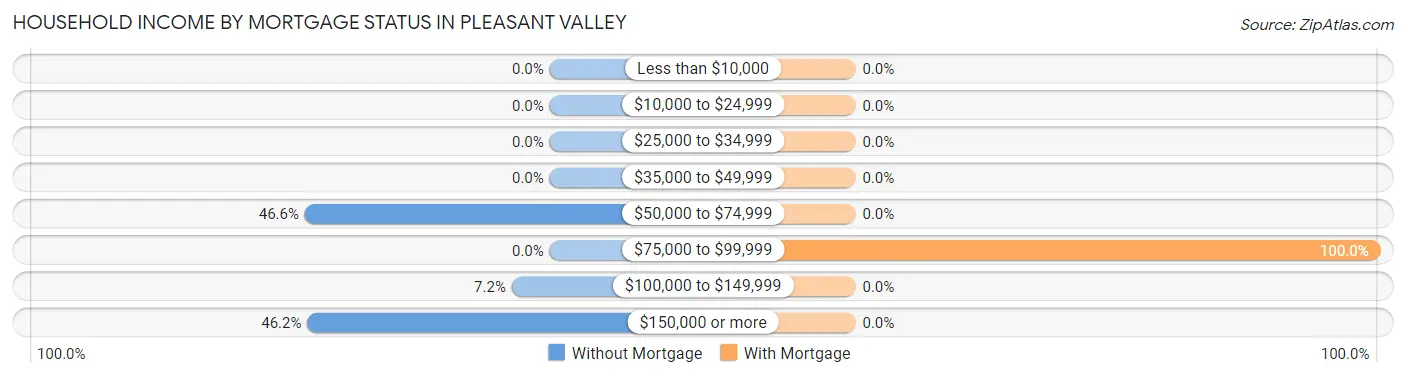
| Household Income | Without Mortgage | With Mortgage |
| Less than $10,000 | 0 (0.0%) | 0 (0.0%) |
| $10,000 to $24,999 | 0 (0.0%) | 0 (0.0%) |
| $25,000 to $34,999 | 0 (0.0%) | 0 (0.0%) |
| $35,000 to $49,999 | 0 (0.0%) | 0 (0.0%) |
| $50,000 to $74,999 | 97 (46.6%) | 0 (0.0%) |
| $75,000 to $99,999 | 0 (0.0%) | 33 (100.0%) |
| $100,000 to $149,999 | 15 (7.2%) | 0 (0.0%) |
| $150,000 or more | 96 (46.2%) | 0 (0.0%) |
| Total | 208 (100.0%) | 33 (100.0%) |
Property Value to Household Income Ratio in Pleasant Valley
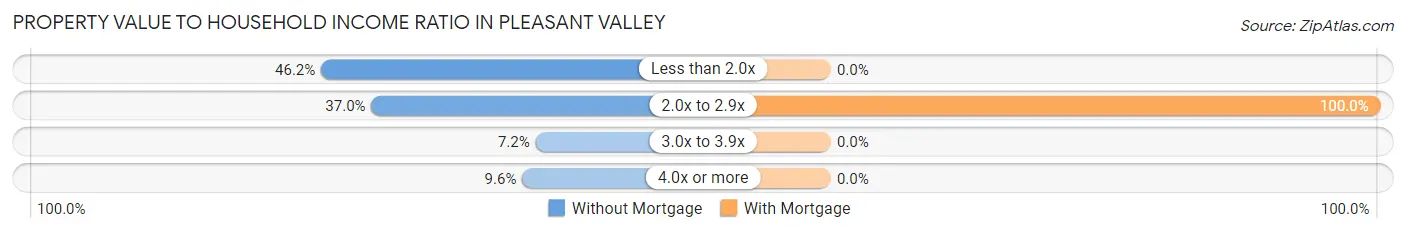
| Value-to-Income Ratio | Without Mortgage | With Mortgage |
| Less than 2.0x | 96 (46.2%) | 0 (0.0%) |
| 2.0x to 2.9x | 77 (37.0%) | 33 (100.0%) |
| 3.0x to 3.9x | 15 (7.2%) | 0 (0.0%) |
| 4.0x or more | 20 (9.6%) | 0 (0.0%) |
| Total | 208 (100.0%) | 33 (100.0%) |
Real Estate Taxes by Mortgage Status in Pleasant Valley
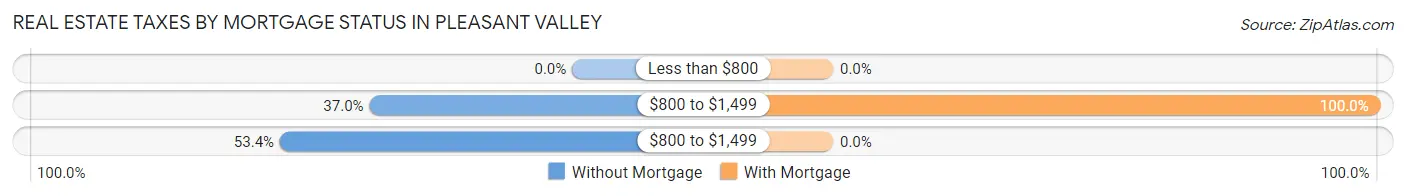
| Property Taxes | Without Mortgage | With Mortgage |
| Less than $800 | 0 (0.0%) | 0 (0.0%) |
| $800 to $1,499 | 77 (37.0%) | 33 (100.0%) |
| $800 to $1,499 | 111 (53.4%) | 0 (0.0%) |
| Total | 208 (100.0%) | 33 (100.0%) |
Health & Disability in Pleasant Valley
Health Insurance Coverage by Age in Pleasant Valley
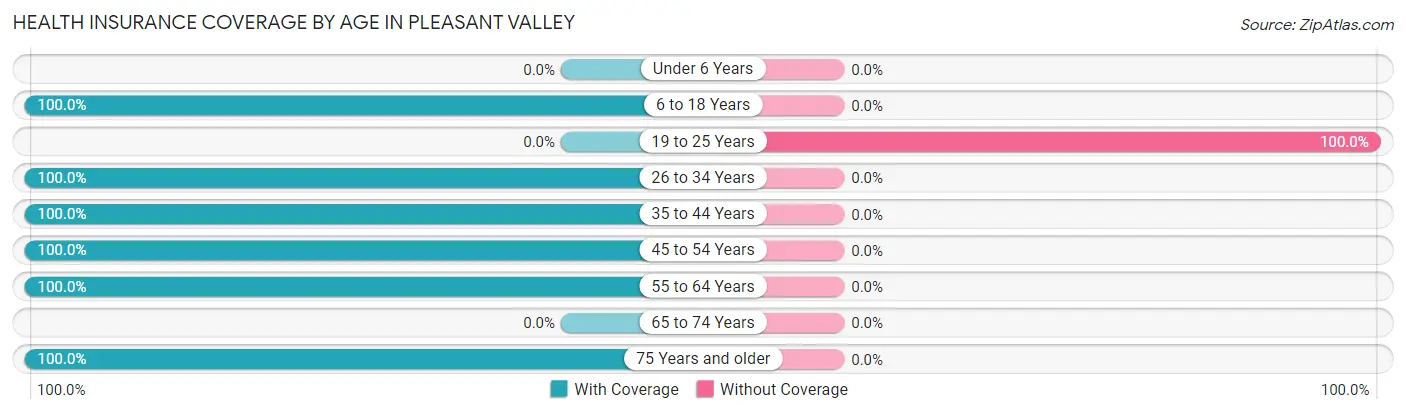
| Age Bracket | With Coverage | Without Coverage |
| Under 6 Years | 0 (0.0%) | 0 (0.0%) |
| 6 to 18 Years | 181 (100.0%) | 0 (0.0%) |
| 19 to 25 Years | 0 (0.0%) | 31 (100.0%) |
| 26 to 34 Years | 33 (100.0%) | 0 (0.0%) |
| 35 to 44 Years | 56 (100.0%) | 0 (0.0%) |
| 45 to 54 Years | 189 (100.0%) | 0 (0.0%) |
| 55 to 64 Years | 38 (100.0%) | 0 (0.0%) |
| 65 to 74 Years | 0 (0.0%) | 0 (0.0%) |
| 75 Years and older | 46 (100.0%) | 0 (0.0%) |
| Total | 543 (94.6%) | 31 (5.4%) |
Health Insurance Coverage by Citizenship Status in Pleasant Valley
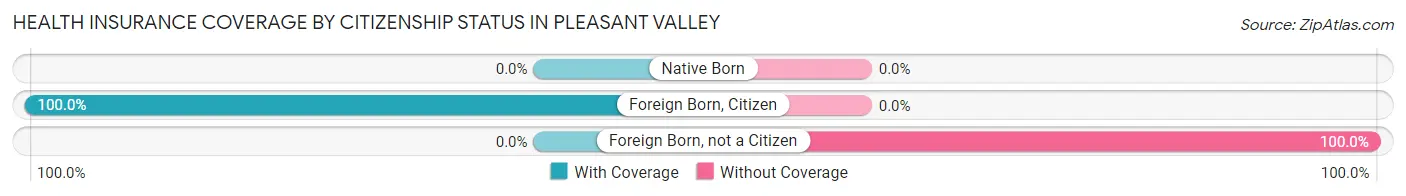
| Citizenship Status | With Coverage | Without Coverage |
| Native Born | 0 (0.0%) | 0 (0.0%) |
| Foreign Born, Citizen | 181 (100.0%) | 0 (0.0%) |
| Foreign Born, not a Citizen | 0 (0.0%) | 31 (100.0%) |
Health Insurance Coverage by Household Income in Pleasant Valley
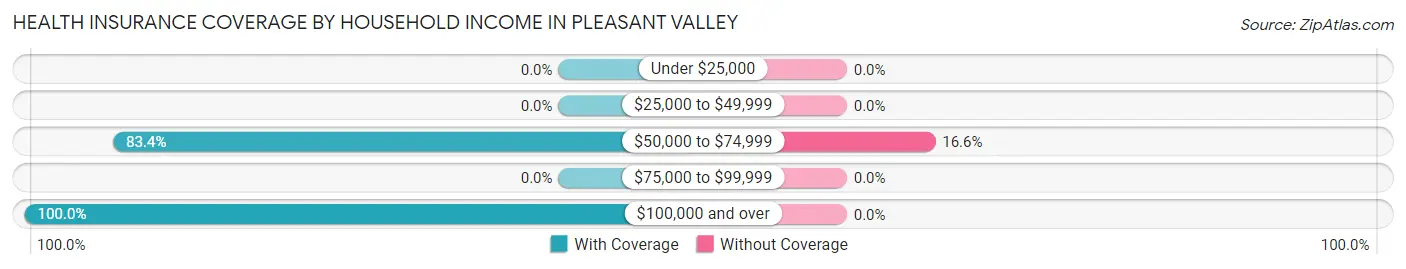
| Household Income | With Coverage | Without Coverage |
| Under $25,000 | 0 (0.0%) | 0 (0.0%) |
| $25,000 to $49,999 | 0 (0.0%) | 0 (0.0%) |
| $50,000 to $74,999 | 156 (83.4%) | 31 (16.6%) |
| $75,000 to $99,999 | 0 (0.0%) | 0 (0.0%) |
| $100,000 and over | 387 (100.0%) | 0 (0.0%) |
Public vs Private Health Insurance Coverage by Age in Pleasant Valley
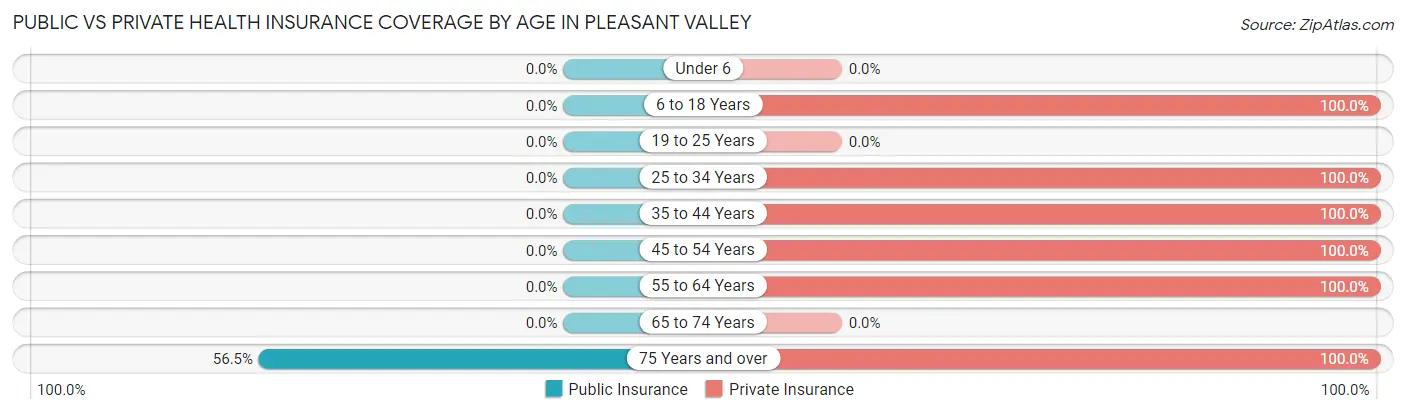
| Age Bracket | Public Insurance | Private Insurance |
| Under 6 | 0 (0.0%) | 0 (0.0%) |
| 6 to 18 Years | 0 (0.0%) | 181 (100.0%) |
| 19 to 25 Years | 0 (0.0%) | 0 (0.0%) |
| 25 to 34 Years | 0 (0.0%) | 33 (100.0%) |
| 35 to 44 Years | 0 (0.0%) | 56 (100.0%) |
| 45 to 54 Years | 0 (0.0%) | 189 (100.0%) |
| 55 to 64 Years | 0 (0.0%) | 38 (100.0%) |
| 65 to 74 Years | 0 (0.0%) | 0 (0.0%) |
| 75 Years and over | 26 (56.5%) | 46 (100.0%) |
| Total | 26 (4.5%) | 543 (94.6%) |
Disability Status by Sex by Age in Pleasant Valley
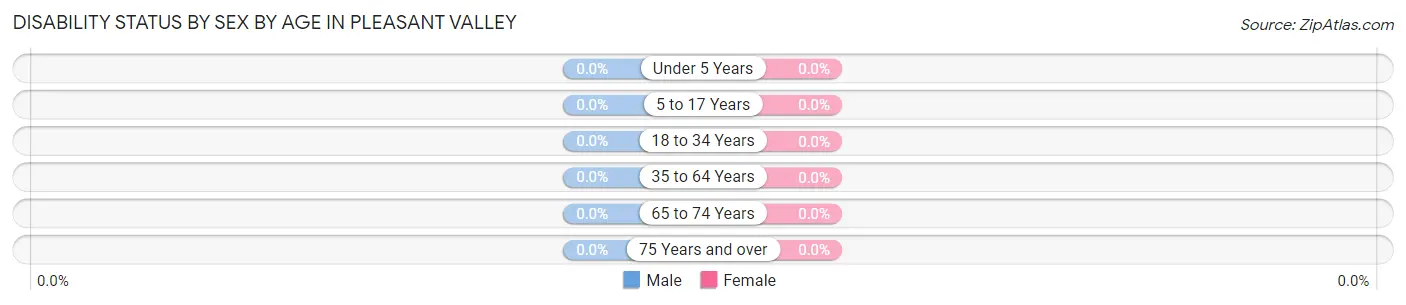
| Age Bracket | Male | Female |
| Under 5 Years | 0 (0.0%) | 0 (0.0%) |
| 5 to 17 Years | 0 (0.0%) | 0 (0.0%) |
| 18 to 34 Years | 0 (0.0%) | 0 (0.0%) |
| 35 to 64 Years | 0 (0.0%) | 0 (0.0%) |
| 65 to 74 Years | 0 (0.0%) | 0 (0.0%) |
| 75 Years and over | 0 (0.0%) | 0 (0.0%) |
Disability Class by Sex by Age in Pleasant Valley
Disability Class: Hearing Difficulty
| Age Bracket | Male | Female |
| Under 5 Years | 0 (0.0%) | 0 (0.0%) |
| 5 to 17 Years | 0 (0.0%) | 0 (0.0%) |
| 18 to 34 Years | 0 (0.0%) | 0 (0.0%) |
| 35 to 64 Years | 0 (0.0%) | 0 (0.0%) |
| 65 to 74 Years | 0 (0.0%) | 0 (0.0%) |
| 75 Years and over | 0 (0.0%) | 0 (0.0%) |
Disability Class: Vision Difficulty
| Age Bracket | Male | Female |
| Under 5 Years | 0 (0.0%) | 0 (0.0%) |
| 5 to 17 Years | 0 (0.0%) | 0 (0.0%) |
| 18 to 34 Years | 0 (0.0%) | 0 (0.0%) |
| 35 to 64 Years | 0 (0.0%) | 0 (0.0%) |
| 65 to 74 Years | 0 (0.0%) | 0 (0.0%) |
| 75 Years and over | 0 (0.0%) | 0 (0.0%) |
Disability Class: Cognitive Difficulty
| Age Bracket | Male | Female |
| 5 to 17 Years | 0 (0.0%) | 0 (0.0%) |
| 18 to 34 Years | 0 (0.0%) | 0 (0.0%) |
| 35 to 64 Years | 0 (0.0%) | 0 (0.0%) |
| 65 to 74 Years | 0 (0.0%) | 0 (0.0%) |
| 75 Years and over | 0 (0.0%) | 0 (0.0%) |
Disability Class: Ambulatory Difficulty
| Age Bracket | Male | Female |
| 5 to 17 Years | 0 (0.0%) | 0 (0.0%) |
| 18 to 34 Years | 0 (0.0%) | 0 (0.0%) |
| 35 to 64 Years | 0 (0.0%) | 0 (0.0%) |
| 65 to 74 Years | 0 (0.0%) | 0 (0.0%) |
| 75 Years and over | 0 (0.0%) | 0 (0.0%) |
Disability Class: Self-Care Difficulty
| Age Bracket | Male | Female |
| 5 to 17 Years | 0 (0.0%) | 0 (0.0%) |
| 18 to 34 Years | 0 (0.0%) | 0 (0.0%) |
| 35 to 64 Years | 0 (0.0%) | 0 (0.0%) |
| 65 to 74 Years | 0 (0.0%) | 0 (0.0%) |
| 75 Years and over | 0 (0.0%) | 0 (0.0%) |
Technology Access in Pleasant Valley
Computing Device Access in Pleasant Valley
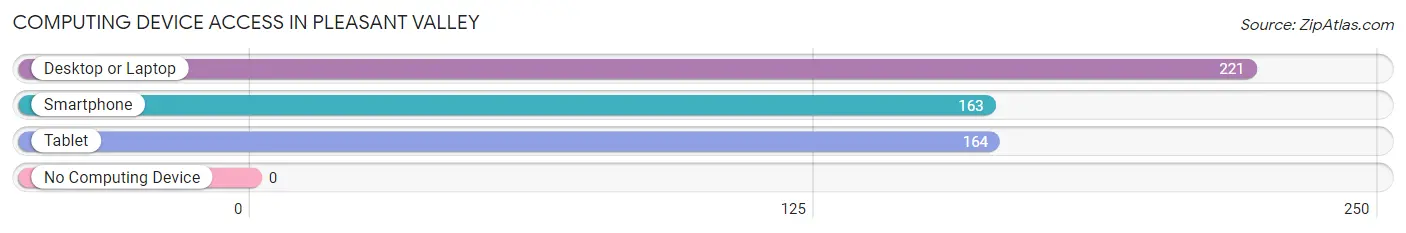
| Device Type | # Households | % Households |
| Desktop or Laptop | 221 | 85.0% |
| Smartphone | 163 | 62.7% |
| Tablet | 164 | 63.1% |
| No Computing Device | 0 | 0.0% |
| Total | 260 | 100.0% |
Internet Access in Pleasant Valley
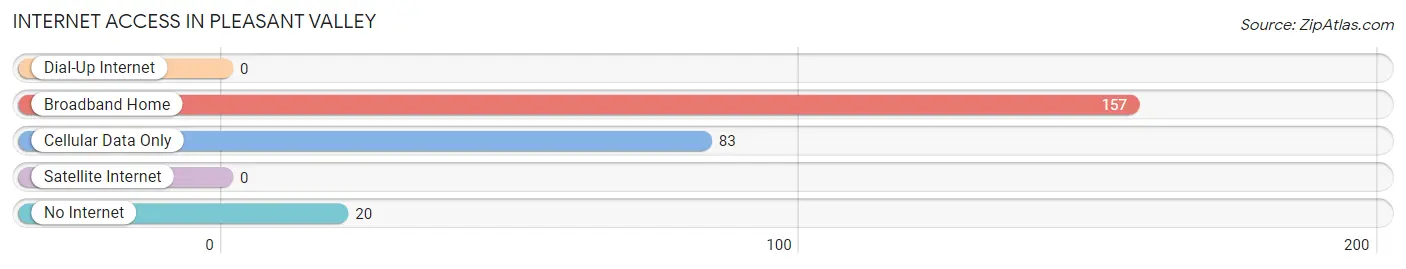
| Internet Type | # Households | % Households |
| Dial-Up Internet | 0 | 0.0% |
| Broadband Home | 157 | 60.4% |
| Cellular Data Only | 83 | 31.9% |
| Satellite Internet | 0 | 0.0% |
| No Internet | 20 | 7.7% |
| Total | 260 | 100.0% |
Pleasant Valley Summary
Pleasant Valley, Alaska is a small unincorporated community located in the Matanuska-Susitna Borough of Alaska. It is situated in the Matanuska Valley, approximately 40 miles northeast of Anchorage. The community is home to approximately 200 people, and is known for its rural lifestyle and close-knit community.
History
Pleasant Valley was first settled in the early 1900s by homesteaders who were drawn to the area by its fertile soil and abundant wildlife. The first settlers were mostly of Scandinavian descent, and the community was originally known as “Scandinavian Valley.” The name was changed to Pleasant Valley in the 1920s.
The community was largely agricultural, with many of the settlers growing potatoes, carrots, and other vegetables. The area was also known for its dairy farms, which provided milk and other dairy products to the local population.
In the 1950s, the Alaska Railroad was extended to Pleasant Valley, providing the community with access to the rest of the state. This allowed for the development of a small tourism industry, as well as the growth of the local economy.
Geography
Pleasant Valley is located in the Matanuska Valley, which is part of the larger Matanuska-Susitna Borough. The valley is surrounded by the Talkeetna Mountains to the north, the Chugach Mountains to the east, and the Alaska Range to the south. The valley is approximately 40 miles long and 10 miles wide, and is home to several small lakes and rivers.
The climate in Pleasant Valley is mild and temperate, with warm summers and cold winters. The average temperature in the summer is around 60°F, and the average temperature in the winter is around 20°F. The area receives an average of 20 inches of precipitation per year, with most of it falling in the form of snow.
Economy
The economy of Pleasant Valley is largely based on agriculture and tourism. The area is known for its dairy farms, which provide milk and other dairy products to the local population. The area is also home to several small farms, which grow potatoes, carrots, and other vegetables.
In addition, the area is home to several small businesses, including restaurants, stores, and lodges. The tourism industry is also an important part of the local economy, as the area is a popular destination for outdoor activities such as fishing, hunting, and hiking.
Demographics
As of the 2010 census, the population of Pleasant Valley was approximately 200 people. The racial makeup of the community was 95.5% White, 0.5% Native American, 0.5% Asian, and 3.5% from other races. The median household income was $50,000, and the median age was 44.
Conclusion
Pleasant Valley, Alaska is a small unincorporated community located in the Matanuska-Susitna Borough of Alaska. It is situated in the Matanuska Valley, approximately 40 miles northeast of Anchorage. The community is home to approximately 200 people, and is known for its rural lifestyle and close-knit community. The economy of Pleasant Valley is largely based on agriculture and tourism, and the area is a popular destination for outdoor activities such as fishing, hunting, and hiking. The population of Pleasant Valley is mostly White, with a small percentage of Native American and Asian residents. The median household income is $50,000, and the median age is 44.
Common Questions
What is Per Capita Income in Pleasant Valley?
Per Capita income in Pleasant Valley is $54,446.
What is the Median Family Income in Pleasant Valley?
Median Family Income in Pleasant Valley is $202,739.
What is Inequality or Gini Index in Pleasant Valley?
Inequality or Gini Index in Pleasant Valley is 0.33.
What is the Total Population of Pleasant Valley?
Total Population of Pleasant Valley is 623.
What is the Total Male Population of Pleasant Valley?
Total Male Population of Pleasant Valley is 337.
What is the Total Female Population of Pleasant Valley?
Total Female Population of Pleasant Valley is 286.
What is the Ratio of Males per 100 Females in Pleasant Valley?
There are 117.83 Males per 100 Females in Pleasant Valley.
What is the Ratio of Females per 100 Males in Pleasant Valley?
There are 84.87 Females per 100 Males in Pleasant Valley.
What is the Median Population Age in Pleasant Valley?
Median Population Age in Pleasant Valley is 46.1 Years.
What is the Average Family Size in Pleasant Valley
Average Family Size in Pleasant Valley is 3.0 People.
What is the Average Household Size in Pleasant Valley
Average Household Size in Pleasant Valley is 2.4 People.
How Large is the Labor Force in Pleasant Valley?
There are 365 People in the Labor Forcein in Pleasant Valley.
What is the Percentage of People in the Labor Force in Pleasant Valley?
82.6% of People are in the Labor Force in Pleasant Valley.