Perryville, AK Map & Demographics
Perryville Map
Perryville Overview
$13,447
PER CAPITA INCOME
$26,500
AVG FAMILY INCOME
$27,000
AVG HOUSEHOLD INCOME
53.3%
WAGE / INCOME GAP [ % ]
46.7¢/ $1
WAGE / INCOME GAP [ $ ]
0.37
INEQUALITY / GINI INDEX
85
TOTAL POPULATION
33
MALE POPULATION
52
FEMALE POPULATION
63.46
MALES / 100 FEMALES
157.58
FEMALES / 100 MALES
20.3
MEDIAN AGE
3.9
AVG FAMILY SIZE
3.5
AVG HOUSEHOLD SIZE
38
LABOR FORCE [ PEOPLE ]
67.9%
PERCENT IN LABOR FORCE
23.7%
UNEMPLOYMENT RATE
Perryville Zip Codes
Perryville Area Codes
Income in Perryville
Income Overview in Perryville
Per Capita Income in Perryville is $13,447, while median incomes of families and households are $26,500 and $27,000 respectively.
| Characteristic | Number | Measure |
| Per Capita Income | 85 | $13,447 |
| Median Family Income | 18 | $26,500 |
| Mean Family Income | 18 | $50,289 |
| Median Household Income | 24 | $27,000 |
| Mean Household Income | 24 | $48,221 |
| Income Deficit | 18 | $0 |
| Wage / Income Gap (%) | 85 | 53.33% |
| Wage / Income Gap ($) | 85 | 46.67¢ per $1 |
| Gini / Inequality Index | 85 | 0.37 |
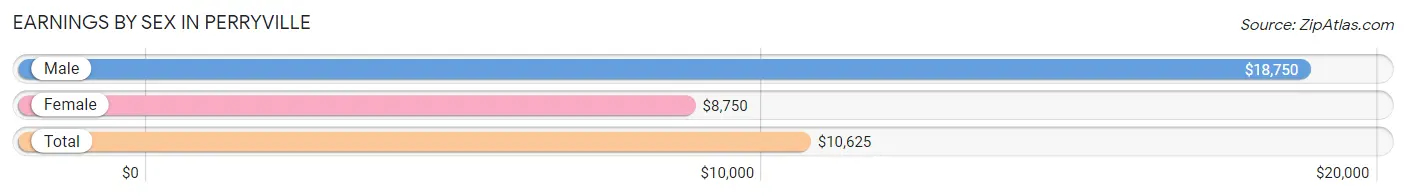
Earnings by Sex in Perryville
Average Earnings in Perryville are $10,625, $18,750 for men and $8,750 for women, a difference of 53.3%.
| Sex | Number | Average Earnings |
| Male | 14 (34.2%) | $18,750 |
| Female | 27 (65.8%) | $8,750 |
| Total | 41 (100.0%) | $10,625 |
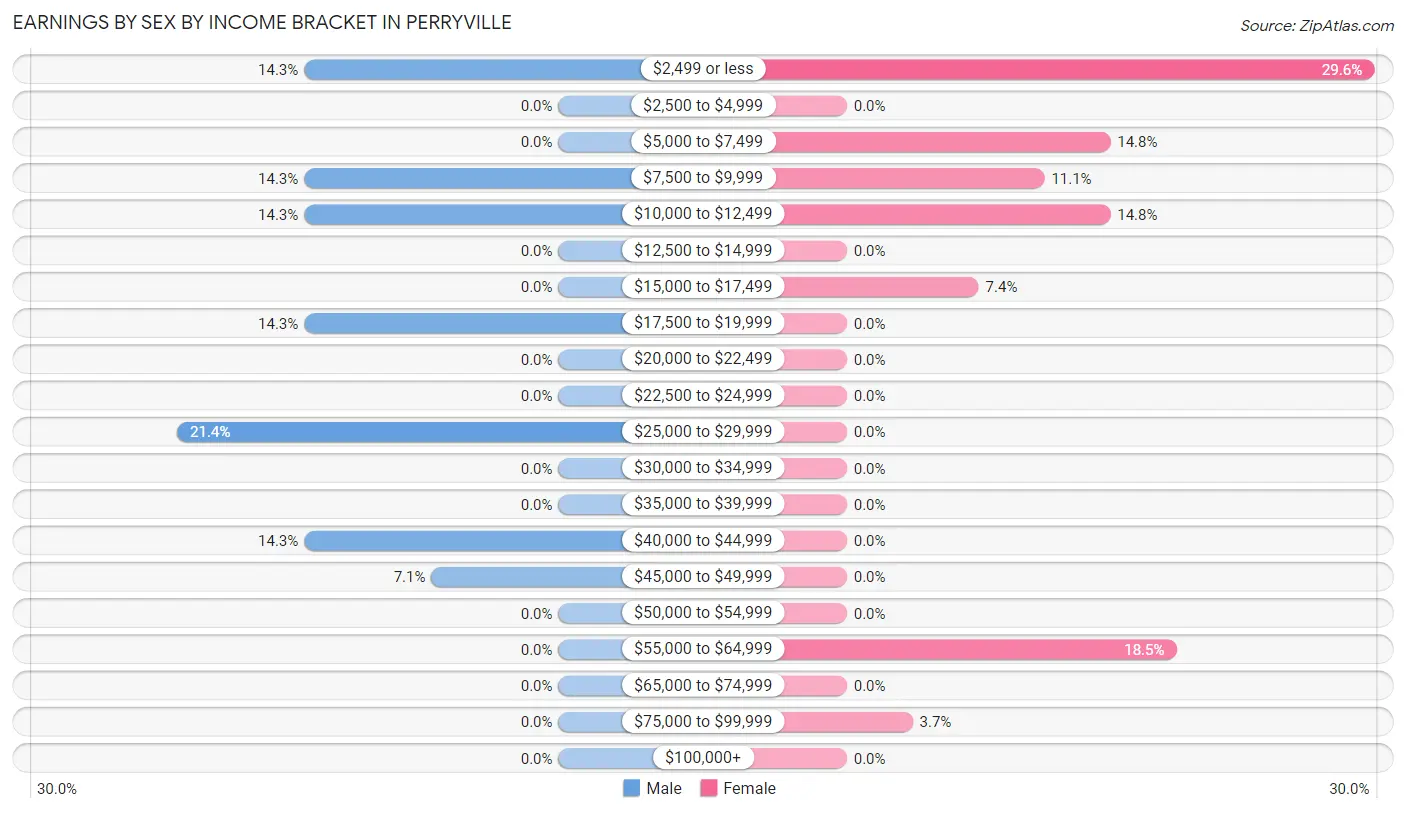
Earnings by Sex by Income Bracket in Perryville
The most common earnings brackets in Perryville are $25,000 to $29,999 for men (3 | 21.4%) and $2,499 or less for women (8 | 29.6%).
| Income | Male | Female |
| $2,499 or less | 2 (14.3%) | 8 (29.6%) |
| $2,500 to $4,999 | 0 (0.0%) | 0 (0.0%) |
| $5,000 to $7,499 | 0 (0.0%) | 4 (14.8%) |
| $7,500 to $9,999 | 2 (14.3%) | 3 (11.1%) |
| $10,000 to $12,499 | 2 (14.3%) | 4 (14.8%) |
| $12,500 to $14,999 | 0 (0.0%) | 0 (0.0%) |
| $15,000 to $17,499 | 0 (0.0%) | 2 (7.4%) |
| $17,500 to $19,999 | 2 (14.3%) | 0 (0.0%) |
| $20,000 to $22,499 | 0 (0.0%) | 0 (0.0%) |
| $22,500 to $24,999 | 0 (0.0%) | 0 (0.0%) |
| $25,000 to $29,999 | 3 (21.4%) | 0 (0.0%) |
| $30,000 to $34,999 | 0 (0.0%) | 0 (0.0%) |
| $35,000 to $39,999 | 0 (0.0%) | 0 (0.0%) |
| $40,000 to $44,999 | 2 (14.3%) | 0 (0.0%) |
| $45,000 to $49,999 | 1 (7.1%) | 0 (0.0%) |
| $50,000 to $54,999 | 0 (0.0%) | 0 (0.0%) |
| $55,000 to $64,999 | 0 (0.0%) | 5 (18.5%) |
| $65,000 to $74,999 | 0 (0.0%) | 0 (0.0%) |
| $75,000 to $99,999 | 0 (0.0%) | 1 (3.7%) |
| $100,000+ | 0 (0.0%) | 0 (0.0%) |
| Total | 14 (100.0%) | 27 (100.0%) |
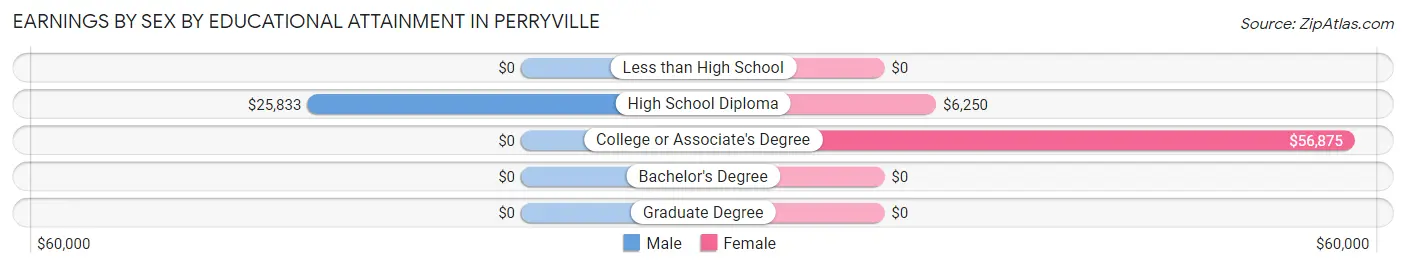
Earnings by Sex by Educational Attainment in Perryville
| Educational Attainment | Male Income | Female Income |
| Less than High School | - | - |
| High School Diploma | $25,833 | $6,250 |
| College or Associate's Degree | - | - |
| Bachelor's Degree | - | - |
| Graduate Degree | - | - |
| Total | $22,500 | $0 |
Family Income in Perryville
Family Income Brackets in Perryville
According to the Perryville family income data, there are 5 families falling into the $25,000 to $34,999 income range, which is the most common income bracket and makes up 27.8% of all families.
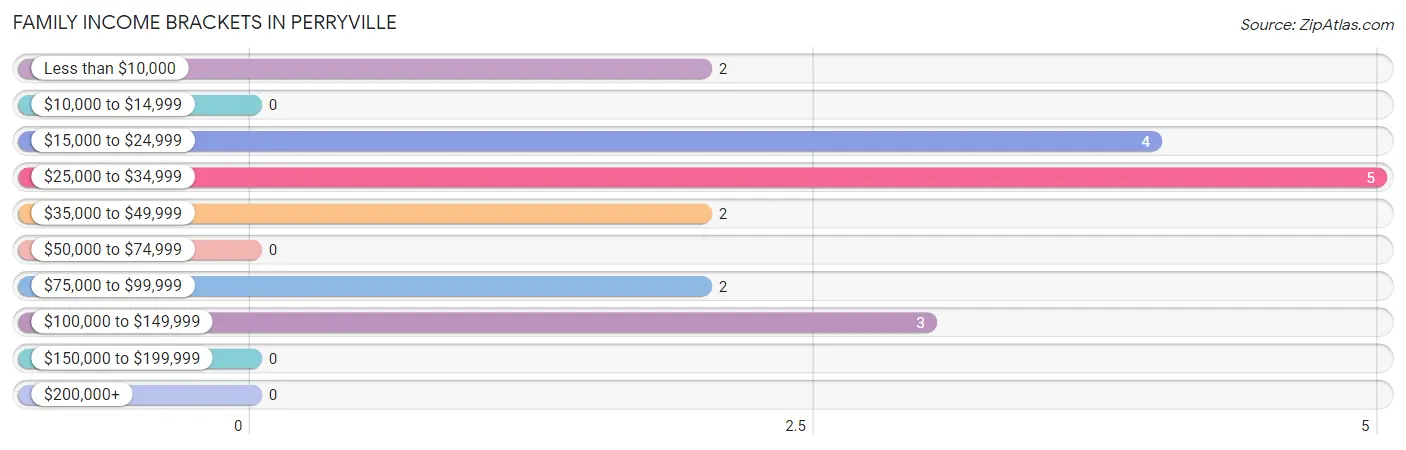
| Income Bracket | # Families | % Families |
| Less than $10,000 | 2 | 11.1% |
| $10,000 to $14,999 | 0 | 0.0% |
| $15,000 to $24,999 | 4 | 22.2% |
| $25,000 to $34,999 | 5 | 27.8% |
| $35,000 to $49,999 | 2 | 11.1% |
| $50,000 to $74,999 | 0 | 0.0% |
| $75,000 to $99,999 | 2 | 11.1% |
| $100,000 to $149,999 | 3 | 16.7% |
| $150,000 to $199,999 | 0 | 0.0% |
| $200,000+ | 0 | 0.0% |
Family Income by Famaliy Size in Perryville
| Income Bracket | # Families | Median Income |
| 2-Person Families | 5 (27.8%) | $0 |
| 3-Person Families | 4 (22.2%) | $0 |
| 4-Person Families | 4 (22.2%) | $0 |
| 5-Person Families | 0 (0.0%) | $0 |
| 6-Person Families | 0 (0.0%) | $0 |
| 7+ Person Families | 5 (27.8%) | $0 |
| Total | 18 (100.0%) | $26,500 |
Family Income by Number of Earners in Perryville
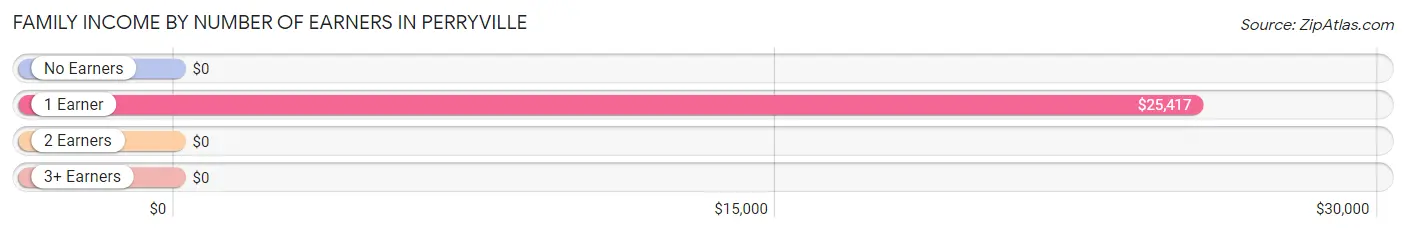
| Number of Earners | # Families | Median Income |
| No Earners | 0 (0.0%) | $0 |
| 1 Earner | 9 (50.0%) | $25,417 |
| 2 Earners | 4 (22.2%) | $0 |
| 3+ Earners | 5 (27.8%) | $0 |
| Total | 18 (100.0%) | $26,500 |
Household Income in Perryville
Household Income Brackets in Perryville
With 8 households falling in the category, the $15,000 to $24,999 income range is the most frequent in Perryville, accounting for 33.3% of all households.
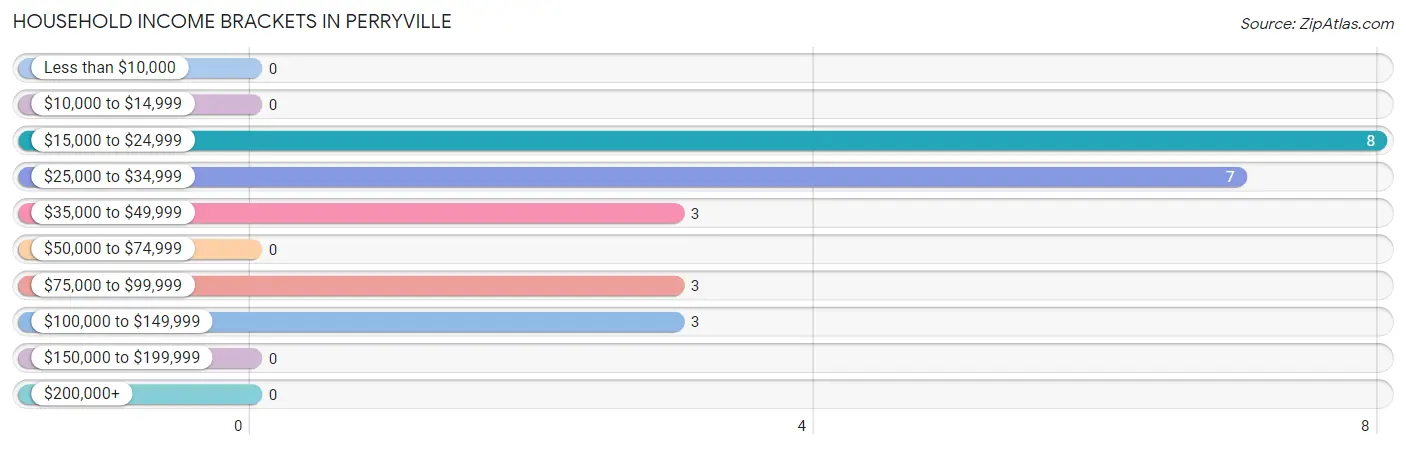
| Income Bracket | # Households | % Households |
| Less than $10,000 | 0 | 0.0% |
| $10,000 to $14,999 | 0 | 0.0% |
| $15,000 to $24,999 | 8 | 33.3% |
| $25,000 to $34,999 | 7 | 29.2% |
| $35,000 to $49,999 | 3 | 12.5% |
| $50,000 to $74,999 | 0 | 0.0% |
| $75,000 to $99,999 | 3 | 12.5% |
| $100,000 to $149,999 | 3 | 12.5% |
| $150,000 to $199,999 | 0 | 0.0% |
| $200,000+ | 0 | 0.0% |
Household Income by Householder Age in Perryville
The median household income in Perryville is $27,000, with the highest median household income of $98,125 found in the 25 to 44 years age bracket for the primary householder. A total of 9 households (37.5%) fall into this category.
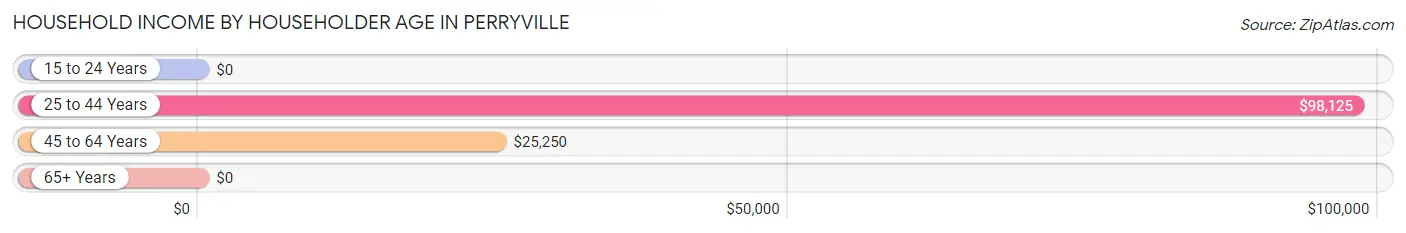
| Income Bracket | # Households | Median Income |
| 15 to 24 Years | 0 (0.0%) | $0 |
| 25 to 44 Years | 9 (37.5%) | $98,125 |
| 45 to 64 Years | 13 (54.2%) | $25,250 |
| 65+ Years | 2 (8.3%) | $0 |
| Total | 24 (100.0%) | $27,000 |
Poverty in Perryville
Income Below Poverty by Sex and Age in Perryville
With 12.1% poverty level for males and 46.0% for females among the residents of Perryville, 25 to 34 year old males and 6 to 11 year old females are the most vulnerable to poverty, with 2 males (66.7%) and 2 females (100.0%) in their respective age groups living below the poverty level.
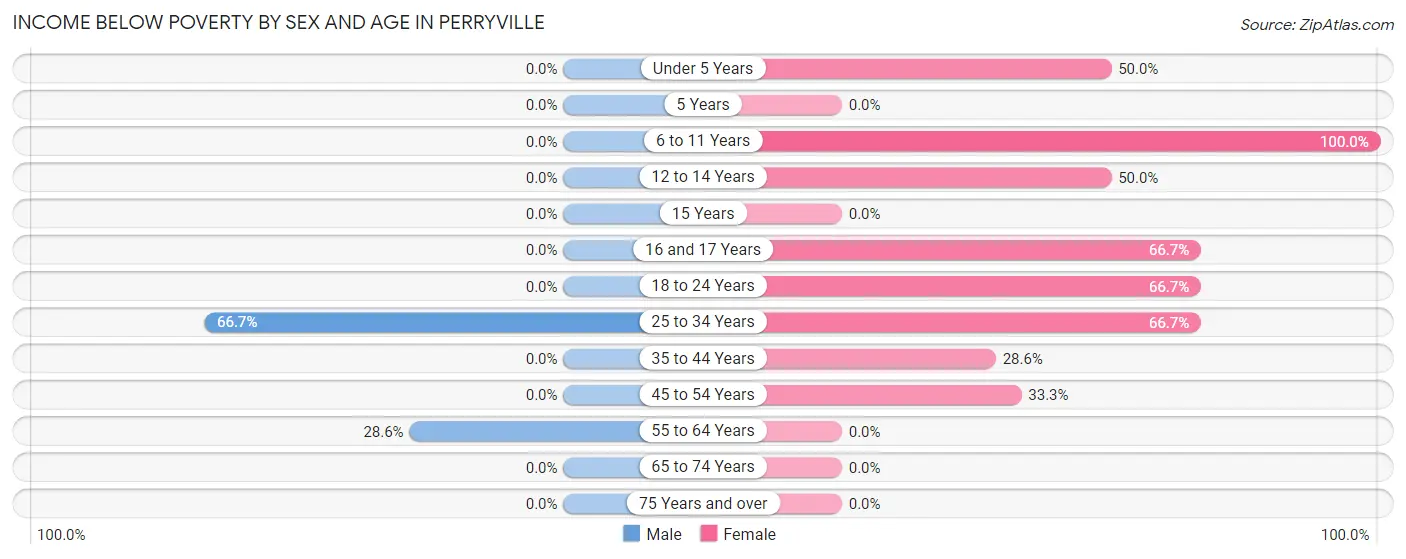
| Age Bracket | Male | Female |
| Under 5 Years | 0 (0.0%) | 3 (50.0%) |
| 5 Years | 0 (0.0%) | 0 (0.0%) |
| 6 to 11 Years | 0 (0.0%) | 2 (100.0%) |
| 12 to 14 Years | 0 (0.0%) | 2 (50.0%) |
| 15 Years | 0 (0.0%) | 0 (0.0%) |
| 16 and 17 Years | 0 (0.0%) | 4 (66.7%) |
| 18 to 24 Years | 0 (0.0%) | 6 (66.7%) |
| 25 to 34 Years | 2 (66.7%) | 2 (66.7%) |
| 35 to 44 Years | 0 (0.0%) | 2 (28.6%) |
| 45 to 54 Years | 0 (0.0%) | 2 (33.3%) |
| 55 to 64 Years | 2 (28.6%) | 0 (0.0%) |
| 65 to 74 Years | 0 (0.0%) | 0 (0.0%) |
| 75 Years and over | 0 (0.0%) | 0 (0.0%) |
| Total | 4 (12.1%) | 23 (46.0%) |
Income Above Poverty by Sex and Age in Perryville
According to the poverty statistics in Perryville, males aged under 5 years and females aged 55 to 64 years are the age groups that are most secure financially, with 100.0% of males and 100.0% of females in these age groups living above the poverty line.
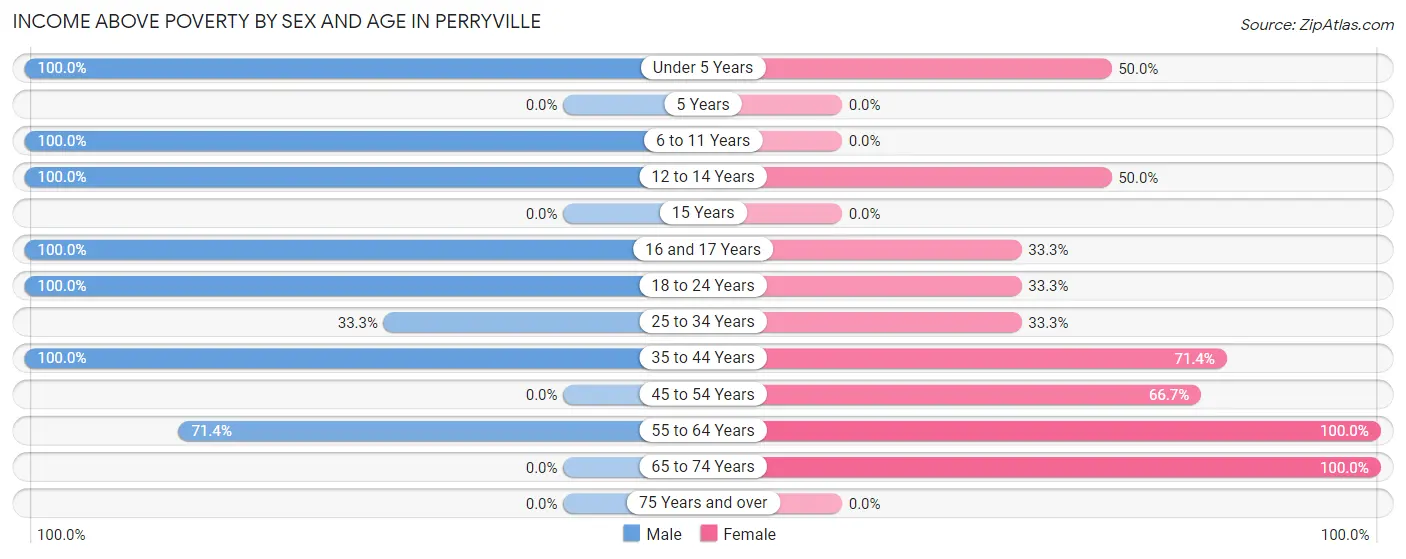
| Age Bracket | Male | Female |
| Under 5 Years | 4 (100.0%) | 3 (50.0%) |
| 5 Years | 0 (0.0%) | 0 (0.0%) |
| 6 to 11 Years | 8 (100.0%) | 0 (0.0%) |
| 12 to 14 Years | 3 (100.0%) | 2 (50.0%) |
| 15 Years | 0 (0.0%) | 0 (0.0%) |
| 16 and 17 Years | 1 (100.0%) | 2 (33.3%) |
| 18 to 24 Years | 2 (100.0%) | 3 (33.3%) |
| 25 to 34 Years | 1 (33.3%) | 1 (33.3%) |
| 35 to 44 Years | 5 (100.0%) | 5 (71.4%) |
| 45 to 54 Years | 0 (0.0%) | 4 (66.7%) |
| 55 to 64 Years | 5 (71.4%) | 2 (100.0%) |
| 65 to 74 Years | 0 (0.0%) | 5 (100.0%) |
| 75 Years and over | 0 (0.0%) | 0 (0.0%) |
| Total | 29 (87.9%) | 27 (54.0%) |
Income Below Poverty Among Married-Couple Families in Perryville
The poverty statistics for married-couple families in Perryville show that 16.7% or 2 of the total 12 families live below the poverty line. Families with 1 or 2 children have the highest poverty rate of 100.0%, comprising of 2 families. On the other hand, families with no children have the lowest poverty rate of 0.0%, which includes 0 families.
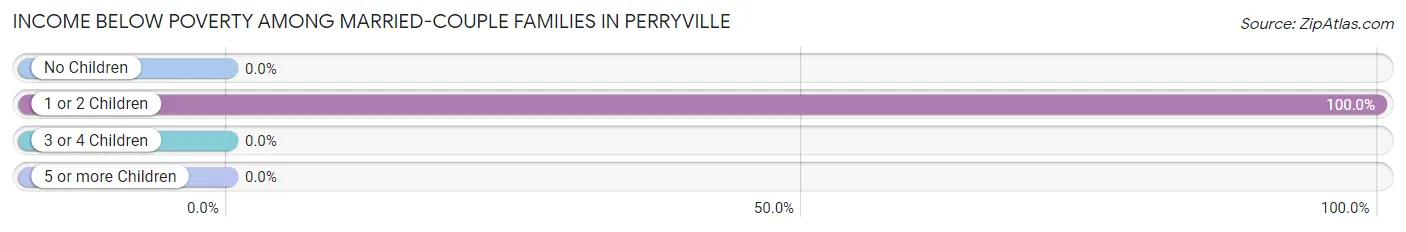
| Children | Above Poverty | Below Poverty |
| No Children | 5 (100.0%) | 0 (0.0%) |
| 1 or 2 Children | 0 (0.0%) | 2 (100.0%) |
| 3 or 4 Children | 0 (0.0%) | 0 (0.0%) |
| 5 or more Children | 5 (100.0%) | 0 (0.0%) |
| Total | 10 (83.3%) | 2 (16.7%) |
Income Below Poverty Among Single-Parent Households in Perryville
According to the poverty data in Perryville, 100.0% or 2 single-father households and 50.0% or 2 single-mother households are living below the poverty line. Among single-father households, those with 3 or 4 children have the highest poverty rate, with 2 households (100.0%) experiencing poverty. Likewise, among single-mother households, those with no children have the highest poverty rate, with 2 households (100.0%) falling below the poverty line.
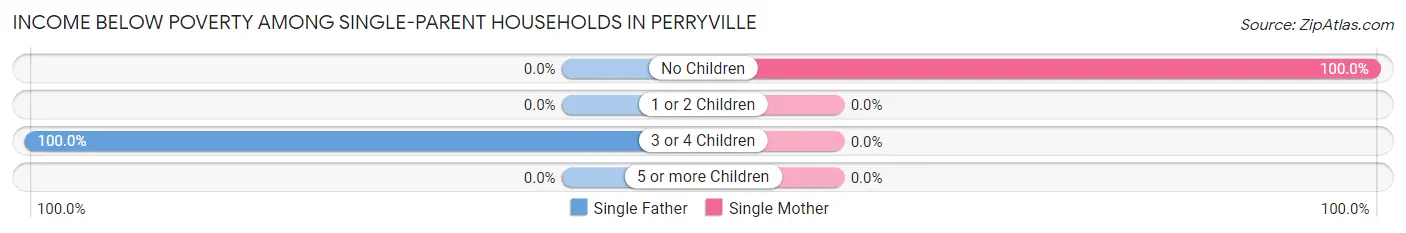
| Children | Single Father | Single Mother |
| No Children | 0 (0.0%) | 2 (100.0%) |
| 1 or 2 Children | 0 (0.0%) | 0 (0.0%) |
| 3 or 4 Children | 2 (100.0%) | 0 (0.0%) |
| 5 or more Children | 0 (0.0%) | 0 (0.0%) |
| Total | 2 (100.0%) | 2 (50.0%) |
Income Below Poverty Among Married-Couple vs Single-Parent Households in Perryville
The poverty data for Perryville shows that 2 of the married-couple family households (16.7%) and 4 of the single-parent households (66.7%) are living below the poverty level. Within the married-couple family households, those with 1 or 2 children have the highest poverty rate, with 2 households (100.0%) falling below the poverty line. Among the single-parent households, those with no children have the highest poverty rate, with 2 household (100.0%) living below poverty.
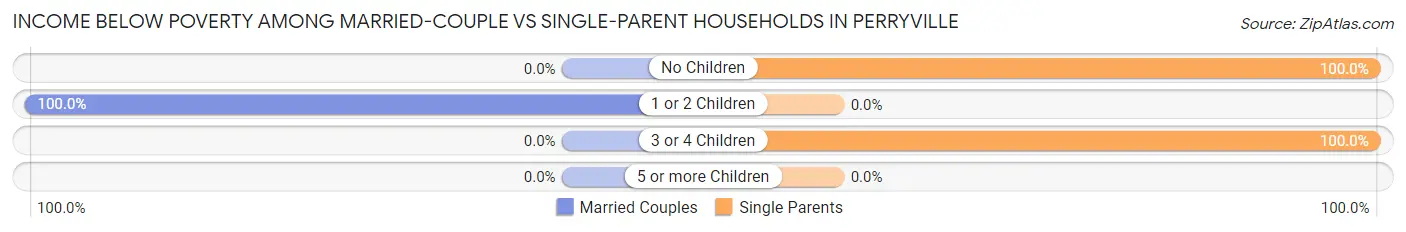
| Children | Married-Couple Families | Single-Parent Households |
| No Children | 0 (0.0%) | 2 (100.0%) |
| 1 or 2 Children | 2 (100.0%) | 0 (0.0%) |
| 3 or 4 Children | 0 (0.0%) | 2 (100.0%) |
| 5 or more Children | 0 (0.0%) | 0 (0.0%) |
| Total | 2 (16.7%) | 4 (66.7%) |
Race in Perryville
The most populous races in Perryville are Native / Alaskan (82 | 96.5%), Two or more Races (2 | 2.4%), and White / Caucasian (1 | 1.2%).
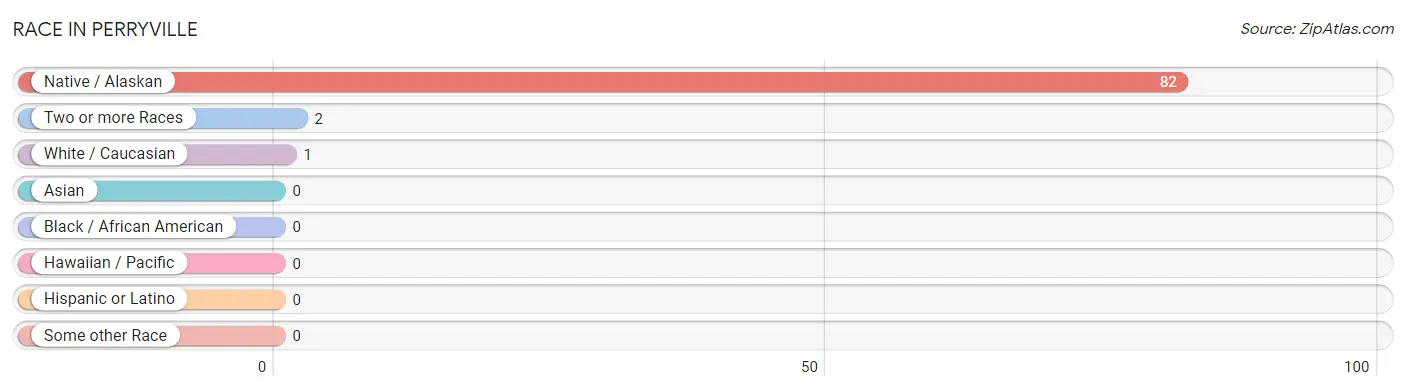
| Race | # Population | % Population |
| Asian | 0 | 0.0% |
| Black / African American | 0 | 0.0% |
| Hawaiian / Pacific | 0 | 0.0% |
| Hispanic or Latino | 0 | 0.0% |
| Native / Alaskan | 82 | 96.5% |
| White / Caucasian | 1 | 1.2% |
| Two or more Races | 2 | 2.4% |
| Some other Race | 0 | 0.0% |
| Total | 85 | 100.0% |
Ancestry in Perryville
The most populous ancestries reported in Perryville are Aleut (69 | 81.2%), Alaska Native (13 | 15.3%), Alaskan Athabascan (2 | 2.4%), and Irish (2 | 2.4%), together accounting for 101.2% of all Perryville residents.
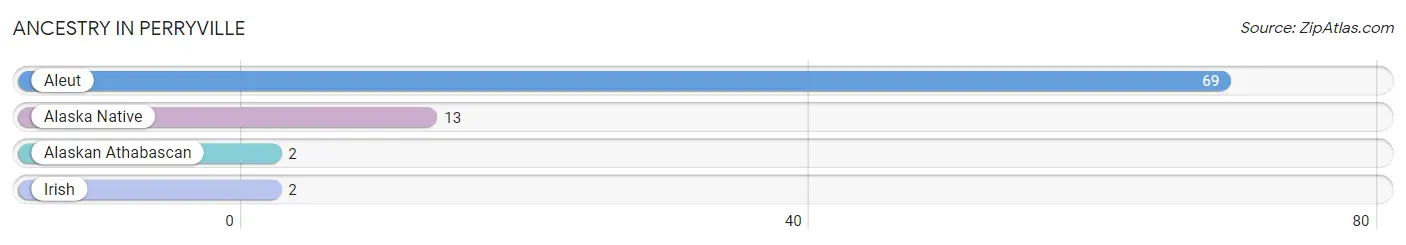
| Ancestry | # Population | % Population |
| Alaska Native | 13 | 15.3% |
| Alaskan Athabascan | 2 | 2.4% |
| Aleut | 69 | 81.2% |
| Irish | 2 | 2.4% | View All 4 Rows |
Immigrants in Perryville

| Immigration Origin | # Population | % Population | View All 0 Rows |
Sex and Age in Perryville
Sex and Age in Perryville
The most populous age groups in Perryville are 10 to 14 Years (7 | 21.2%) for men and 15 to 19 Years (12 | 23.1%) for women.
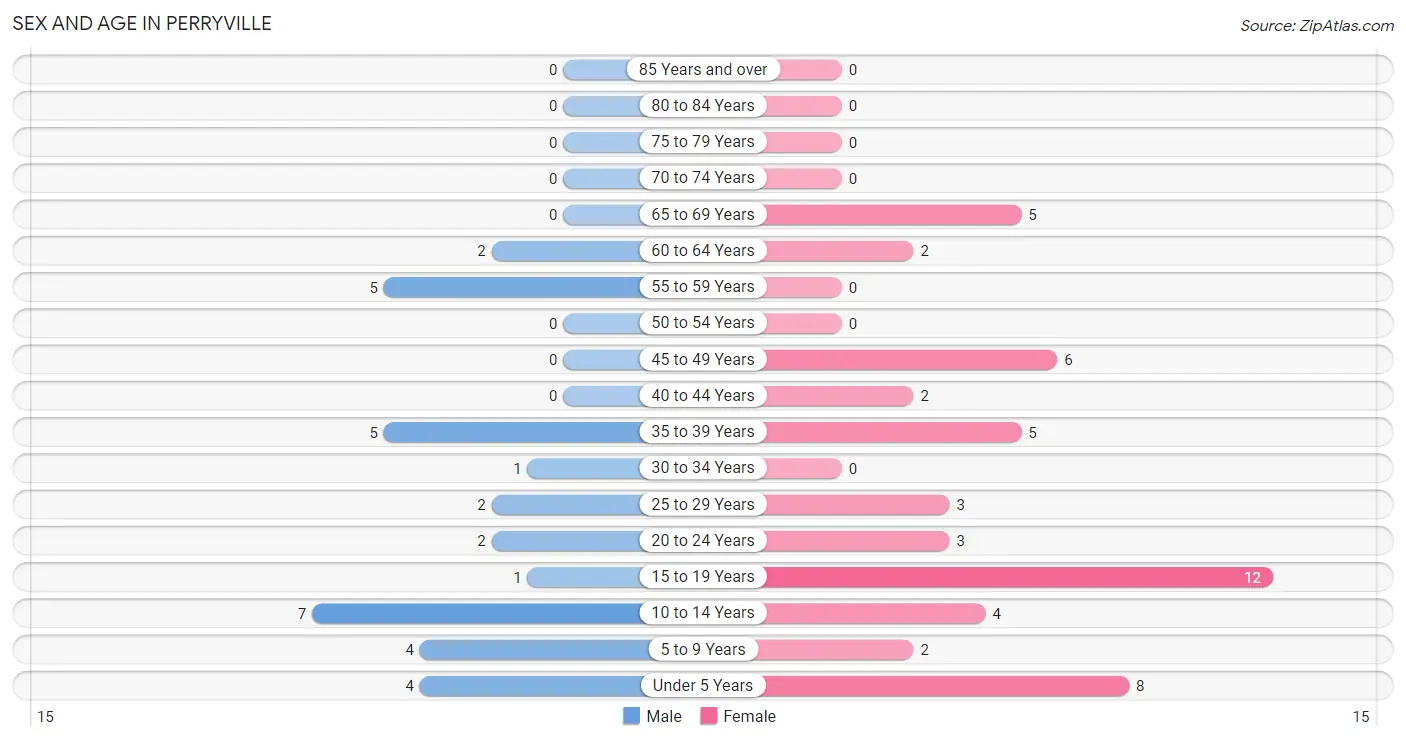
| Age Bracket | Male | Female |
| Under 5 Years | 4 (12.1%) | 8 (15.4%) |
| 5 to 9 Years | 4 (12.1%) | 2 (3.8%) |
| 10 to 14 Years | 7 (21.2%) | 4 (7.7%) |
| 15 to 19 Years | 1 (3.0%) | 12 (23.1%) |
| 20 to 24 Years | 2 (6.1%) | 3 (5.8%) |
| 25 to 29 Years | 2 (6.1%) | 3 (5.8%) |
| 30 to 34 Years | 1 (3.0%) | 0 (0.0%) |
| 35 to 39 Years | 5 (15.1%) | 5 (9.6%) |
| 40 to 44 Years | 0 (0.0%) | 2 (3.8%) |
| 45 to 49 Years | 0 (0.0%) | 6 (11.5%) |
| 50 to 54 Years | 0 (0.0%) | 0 (0.0%) |
| 55 to 59 Years | 5 (15.1%) | 0 (0.0%) |
| 60 to 64 Years | 2 (6.1%) | 2 (3.8%) |
| 65 to 69 Years | 0 (0.0%) | 5 (9.6%) |
| 70 to 74 Years | 0 (0.0%) | 0 (0.0%) |
| 75 to 79 Years | 0 (0.0%) | 0 (0.0%) |
| 80 to 84 Years | 0 (0.0%) | 0 (0.0%) |
| 85 Years and over | 0 (0.0%) | 0 (0.0%) |
| Total | 33 (100.0%) | 52 (100.0%) |
Families and Households in Perryville
Median Family Size in Perryville
The median family size in Perryville is 3.89 persons per family, with married-couple families (12 | 66.7%) accounting for the largest median family size of 4.42 persons per family. On the other hand, single female/mother families (4 | 22.2%) represent the smallest median family size with 2.50 persons per family.
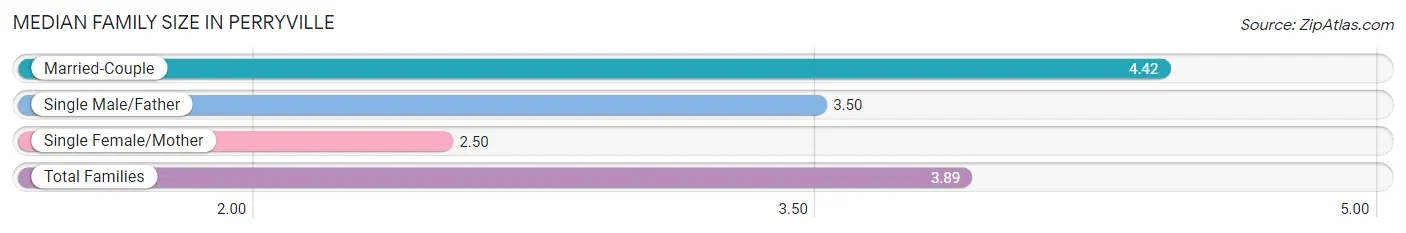
| Family Type | # Families | Family Size |
| Married-Couple | 12 (66.7%) | 4.42 |
| Single Male/Father | 2 (11.1%) | 3.50 |
| Single Female/Mother | 4 (22.2%) | 2.50 |
| Total Families | 18 (100.0%) | 3.89 |
Median Household Size in Perryville
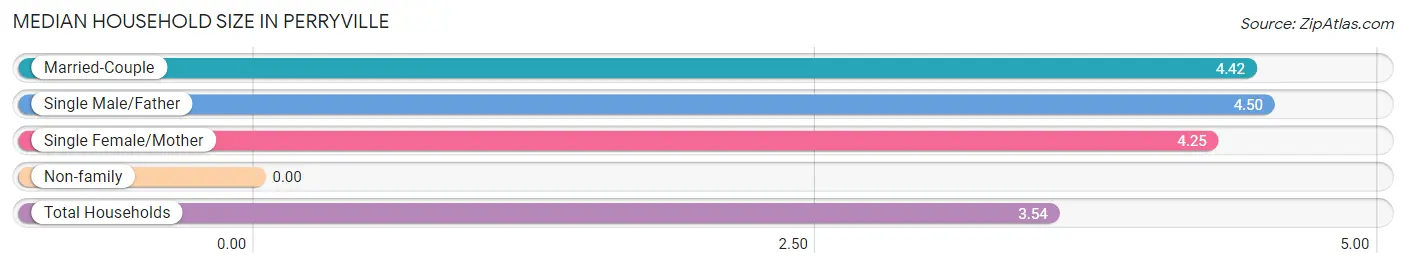
| Household Type | # Households | Household Size |
| Married-Couple | 12 (50.0%) | 4.42 |
| Single Male/Father | 2 (8.3%) | 4.50 |
| Single Female/Mother | 4 (16.7%) | 4.25 |
| Non-family | 6 (25.0%) | - |
| Total Households | 24 (100.0%) | 3.54 |
Household Size by Marriage Status in Perryville
Out of a total of 24 households in Perryville, 18 (75.0%) are family households, while 6 (25.0%) are nonfamily households. The most numerous type of family households are 7+ person households, comprising 5, and the most common type of nonfamily households are 1-person households, comprising 6.
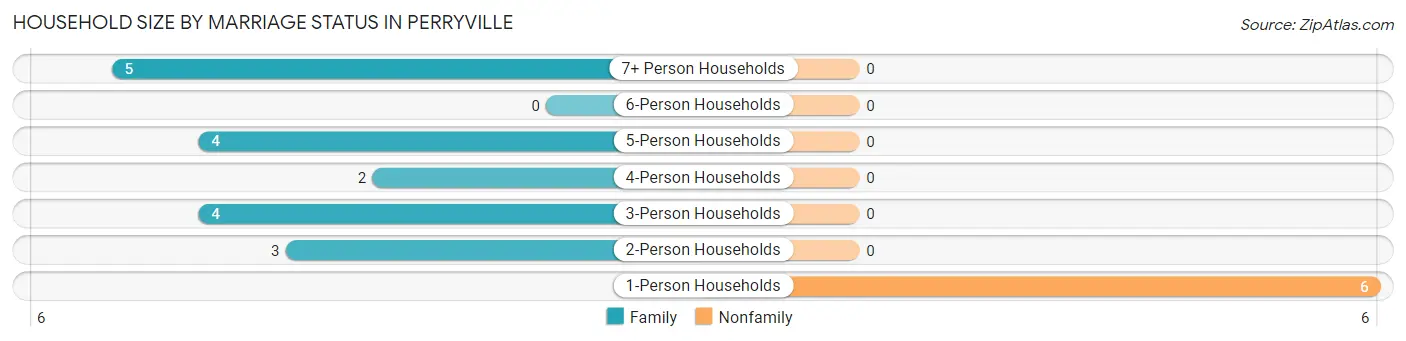
| Household Size | Family Households | Nonfamily Households |
| 1-Person Households | - | 6 (25.0%) |
| 2-Person Households | 3 (12.5%) | 0 (0.0%) |
| 3-Person Households | 4 (16.7%) | 0 (0.0%) |
| 4-Person Households | 2 (8.3%) | 0 (0.0%) |
| 5-Person Households | 4 (16.7%) | 0 (0.0%) |
| 6-Person Households | 0 (0.0%) | 0 (0.0%) |
| 7+ Person Households | 5 (20.8%) | 0 (0.0%) |
| Total | 18 (75.0%) | 6 (25.0%) |
Female Fertility in Perryville
Fertility by Age in Perryville
Average fertility rate in Perryville is 65.0 births per 1,000 women. Women in the age bracket of 20 to 34 years have the highest fertility rate with 333.0 births per 1,000 women. Women in the age bracket of 20 to 34 years acount for 100.0% of all women with births.
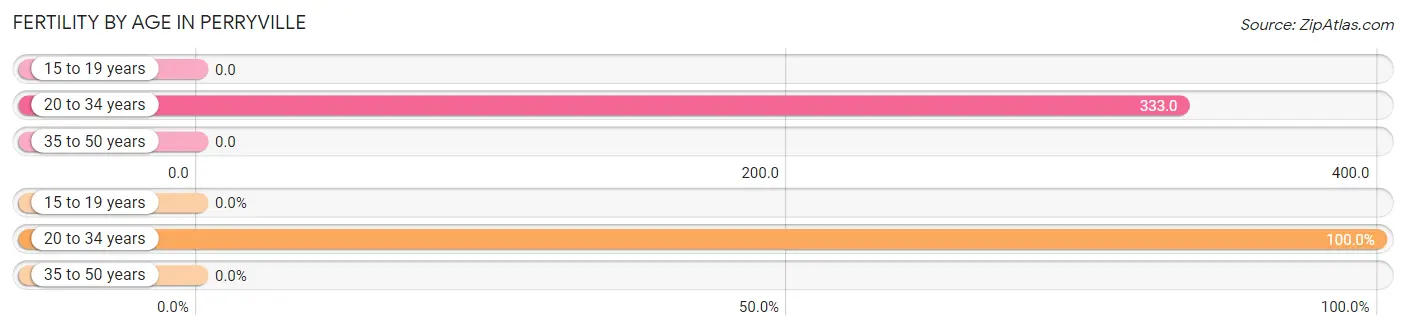
| Age Bracket | Women with Births | Births / 1,000 Women |
| 15 to 19 years | 0 (0.0%) | 0.0 |
| 20 to 34 years | 2 (100.0%) | 333.0 |
| 35 to 50 years | 0 (0.0%) | 0.0 |
| Total | 2 (100.0%) | 65.0 |
Fertility by Age by Marriage Status in Perryville
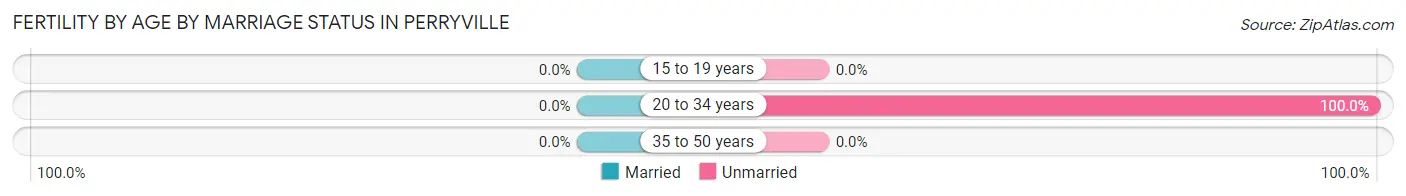
| Age Bracket | Married | Unmarried |
| 15 to 19 years | 0 (0.0%) | 0 (0.0%) |
| 20 to 34 years | 0 (0.0%) | 2 (100.0%) |
| 35 to 50 years | 0 (0.0%) | 0 (0.0%) |
| Total | 0 (0.0%) | 2 (100.0%) |
Fertility by Education in Perryville
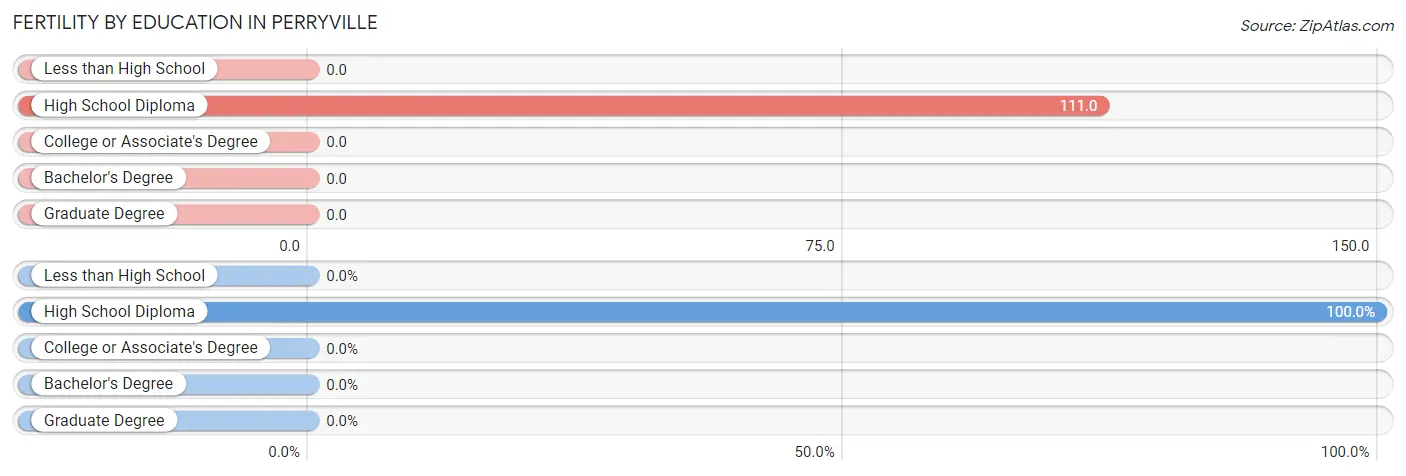
| Educational Attainment | Women with Births | Births / 1,000 Women |
| Less than High School | 0 (0.0%) | 0.0 |
| High School Diploma | 2 (100.0%) | 111.0 |
| College or Associate's Degree | 0 (0.0%) | 0.0 |
| Bachelor's Degree | 0 (0.0%) | 0.0 |
| Graduate Degree | 0 (0.0%) | 0.0 |
| Total | 2 (100.0%) | 65.0 |
Fertility by Education by Marriage Status in Perryville
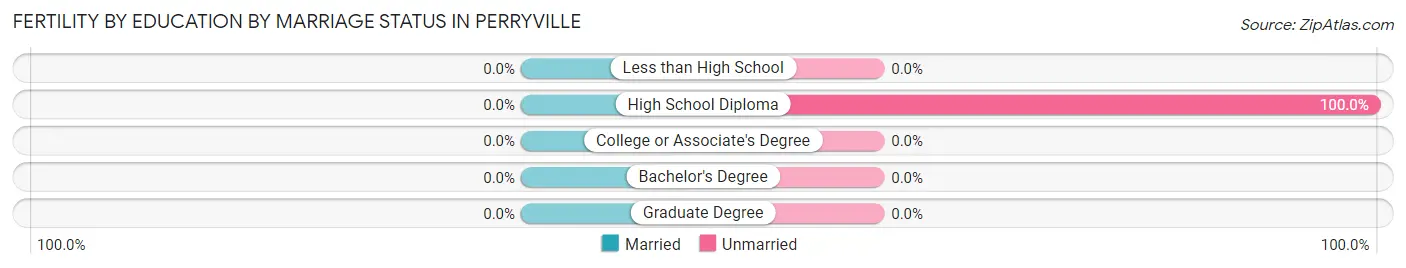
| Educational Attainment | Married | Unmarried |
| Less than High School | 0 (0.0%) | 0 (0.0%) |
| High School Diploma | 0 (0.0%) | 2 (100.0%) |
| College or Associate's Degree | 0 (0.0%) | 0 (0.0%) |
| Bachelor's Degree | 0 (0.0%) | 0 (0.0%) |
| Graduate Degree | 0 (0.0%) | 0 (0.0%) |
| Total | 0 (0.0%) | 2 (100.0%) |
Employment Characteristics in Perryville
Employment by Class of Employer in Perryville
Among the 26 employed individuals in Perryville, local government employees (17 | 65.4%), federal government employees (5 | 19.2%), and private company employees (2 | 7.7%) make up the most common classes of employment.
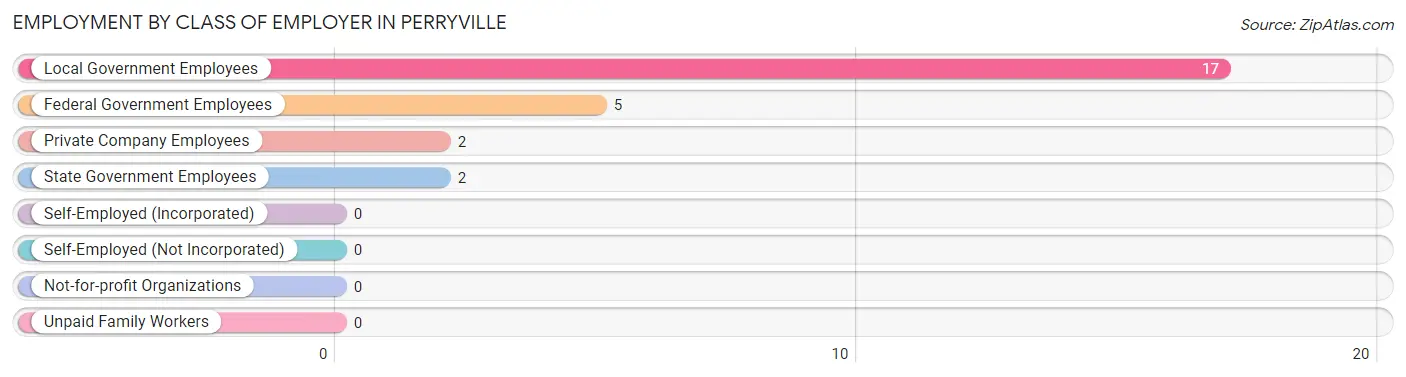
| Employer Class | # Employees | % Employees |
| Private Company Employees | 2 | 7.7% |
| Self-Employed (Incorporated) | 0 | 0.0% |
| Self-Employed (Not Incorporated) | 0 | 0.0% |
| Not-for-profit Organizations | 0 | 0.0% |
| Local Government Employees | 17 | 65.4% |
| State Government Employees | 2 | 7.7% |
| Federal Government Employees | 5 | 19.2% |
| Unpaid Family Workers | 0 | 0.0% |
| Total | 26 | 100.0% |
Employment Status by Age in Perryville
According to the labor force statistics for Perryville, out of the total population over 16 years of age (56), 67.9% or 38 individuals are in the labor force, with 23.7% or 9 of them unemployed. The age group with the highest labor force participation rate is 20 to 24 years, with 100.0% or 5 individuals in the labor force. Within the labor force, the 20 to 24 years age range has the highest percentage of unemployed individuals, with 100.0% or 5 of them being unemployed.
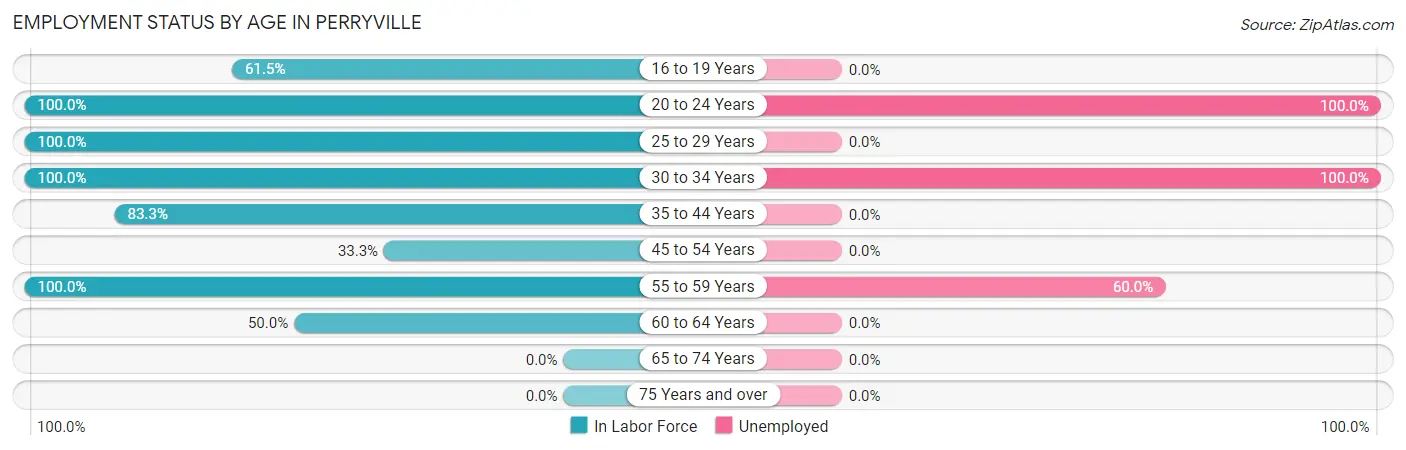
| Age Bracket | In Labor Force | Unemployed |
| 16 to 19 Years | 8 (61.5%) | 0 (0.0%) |
| 20 to 24 Years | 5 (100.0%) | 5 (100.0%) |
| 25 to 29 Years | 5 (100.0%) | 0 (0.0%) |
| 30 to 34 Years | 1 (100.0%) | 1 (100.0%) |
| 35 to 44 Years | 10 (83.3%) | 0 (0.0%) |
| 45 to 54 Years | 2 (33.3%) | 0 (0.0%) |
| 55 to 59 Years | 5 (100.0%) | 3 (60.0%) |
| 60 to 64 Years | 2 (50.0%) | 0 (0.0%) |
| 65 to 74 Years | 0 (0.0%) | 0 (0.0%) |
| 75 Years and over | 0 (0.0%) | 0 (0.0%) |
| Total | 38 (67.9%) | 9 (23.7%) |
Employment Status by Educational Attainment in Perryville
According to labor force statistics for Perryville, 75.8% of individuals (25) out of the total population between 25 and 64 years of age (33) are in the labor force, with 16.0% or 4 of them being unemployed. The group with the highest labor force participation rate are those with the educational attainment of bachelor's degree or higher, with 100.0% or 1 individuals in the labor force. Within the labor force, individuals with high school diploma education have the highest percentage of unemployment, with 23.5% or 4 of them being unemployed.
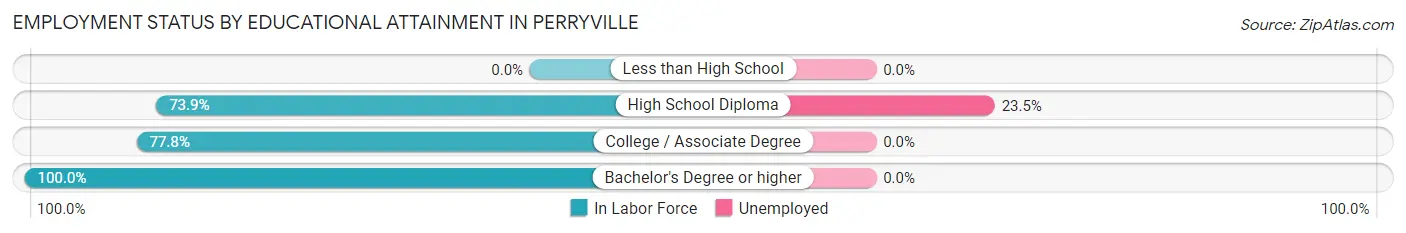
| Educational Attainment | In Labor Force | Unemployed |
| Less than High School | 0 (0.0%) | 0 (0.0%) |
| High School Diploma | 17 (73.9%) | 5 (23.5%) |
| College / Associate Degree | 7 (77.8%) | 0 (0.0%) |
| Bachelor's Degree or higher | 1 (100.0%) | 0 (0.0%) |
| Total | 25 (75.8%) | 5 (16.0%) |
Employment Occupations by Sex in Perryville
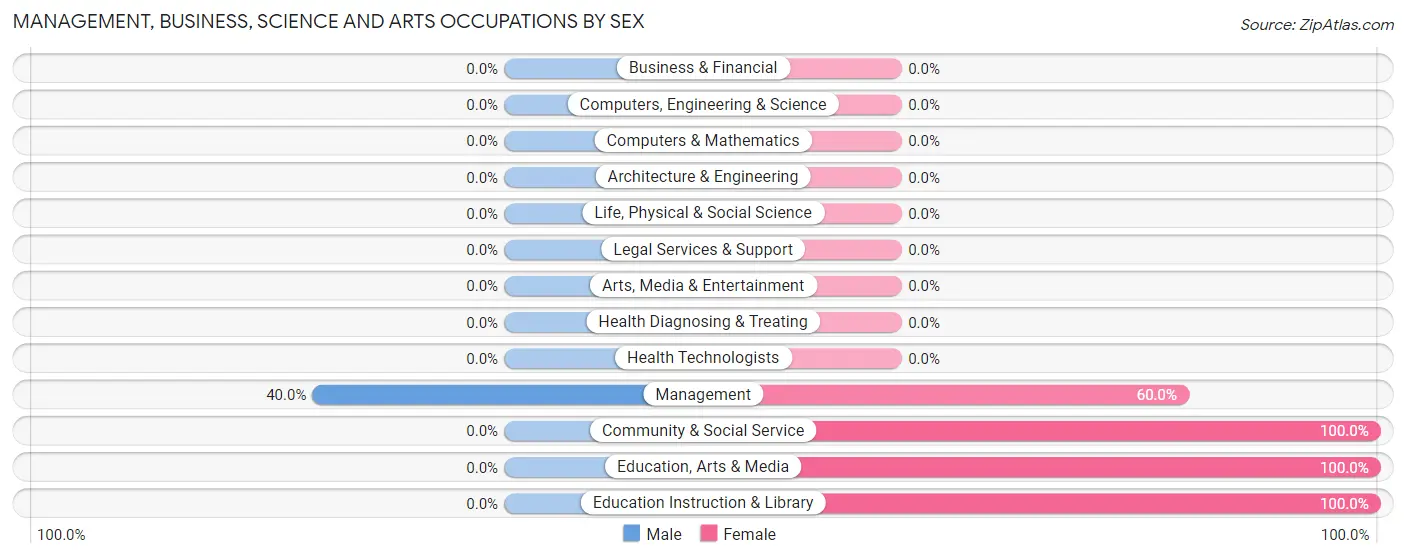
Management, Business, Science and Arts Occupations
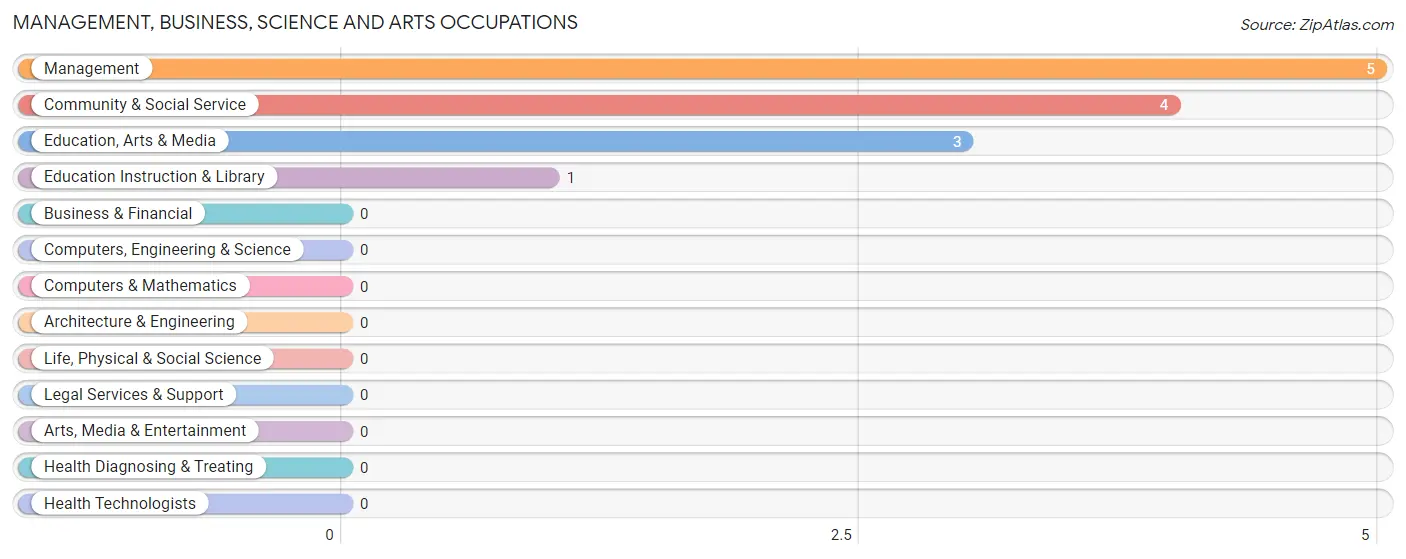
The most common Management, Business, Science and Arts occupations in Perryville are Management (5 | 17.2%), Community & Social Service (4 | 13.8%), Education, Arts & Media (3 | 10.3%), and Education Instruction & Library (1 | 3.5%).
Management, Business, Science and Arts Occupations by Sex
| Occupation | Male | Female |
| Management | 2 (40.0%) | 3 (60.0%) |
| Business & Financial | 0 (0.0%) | 0 (0.0%) |
| Computers, Engineering & Science | 0 (0.0%) | 0 (0.0%) |
| Computers & Mathematics | 0 (0.0%) | 0 (0.0%) |
| Architecture & Engineering | 0 (0.0%) | 0 (0.0%) |
| Life, Physical & Social Science | 0 (0.0%) | 0 (0.0%) |
| Community & Social Service | 0 (0.0%) | 4 (100.0%) |
| Education, Arts & Media | 0 (0.0%) | 3 (100.0%) |
| Legal Services & Support | 0 (0.0%) | 0 (0.0%) |
| Education Instruction & Library | 0 (0.0%) | 1 (100.0%) |
| Arts, Media & Entertainment | 0 (0.0%) | 0 (0.0%) |
| Health Diagnosing & Treating | 0 (0.0%) | 0 (0.0%) |
| Health Technologists | 0 (0.0%) | 0 (0.0%) |
| Total (Category) | 2 (22.2%) | 7 (77.8%) |
| Total (Overall) | 11 (37.9%) | 18 (62.1%) |
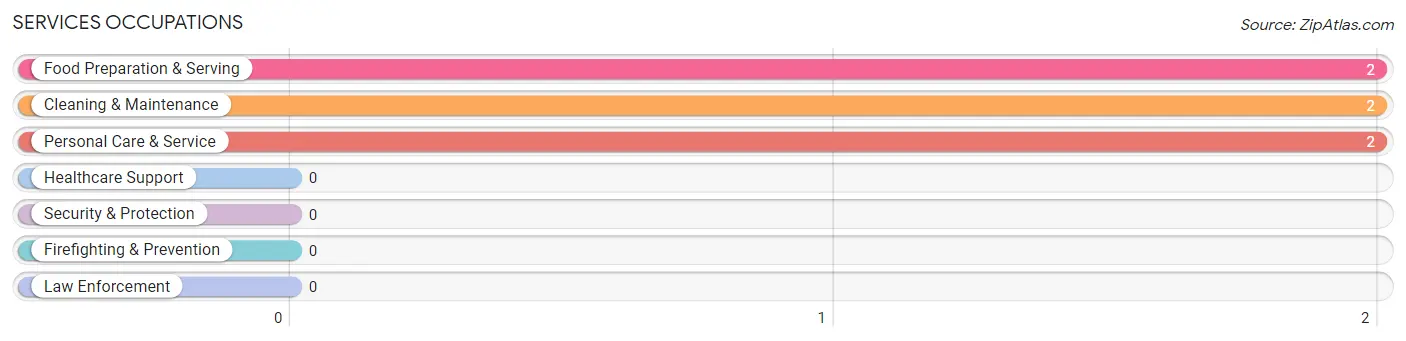
Services Occupations
The most common Services occupations in Perryville are Food Preparation & Serving (2 | 6.9%), Cleaning & Maintenance (2 | 6.9%), and Personal Care & Service (2 | 6.9%).
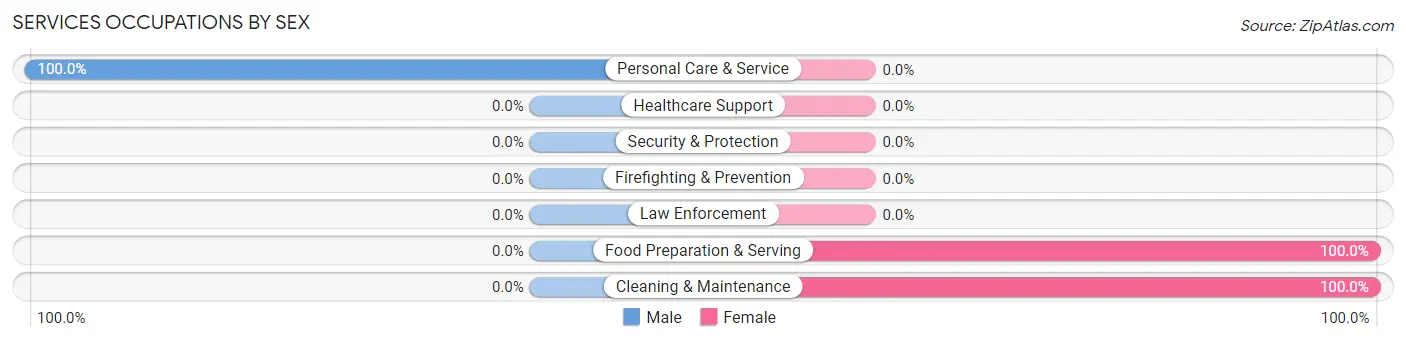
Services Occupations by Sex
| Occupation | Male | Female |
| Healthcare Support | 0 (0.0%) | 0 (0.0%) |
| Security & Protection | 0 (0.0%) | 0 (0.0%) |
| Firefighting & Prevention | 0 (0.0%) | 0 (0.0%) |
| Law Enforcement | 0 (0.0%) | 0 (0.0%) |
| Food Preparation & Serving | 0 (0.0%) | 2 (100.0%) |
| Cleaning & Maintenance | 0 (0.0%) | 2 (100.0%) |
| Personal Care & Service | 2 (100.0%) | 0 (0.0%) |
| Total (Category) | 2 (33.3%) | 4 (66.7%) |
| Total (Overall) | 11 (37.9%) | 18 (62.1%) |
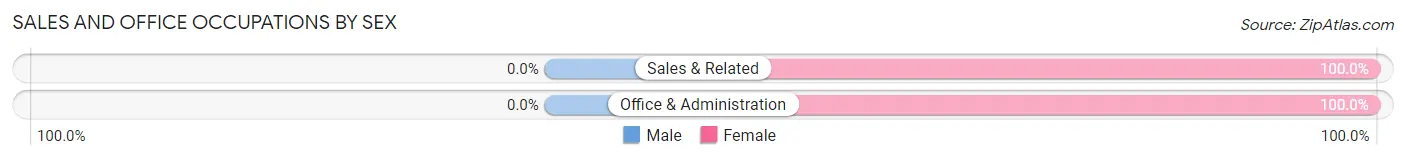
Sales and Office Occupations
The most common Sales and Office occupations in Perryville are Sales & Related (2 | 6.9%), and Office & Administration (2 | 6.9%).

Sales and Office Occupations by Sex
| Occupation | Male | Female |
| Sales & Related | 0 (0.0%) | 2 (100.0%) |
| Office & Administration | 0 (0.0%) | 2 (100.0%) |
| Total (Category) | 0 (0.0%) | 4 (100.0%) |
| Total (Overall) | 11 (37.9%) | 18 (62.1%) |
Natural Resources, Construction and Maintenance Occupations
The most common Natural Resources, Construction and Maintenance occupations in Perryville are , and Construction & Extraction (3 | 10.3%).
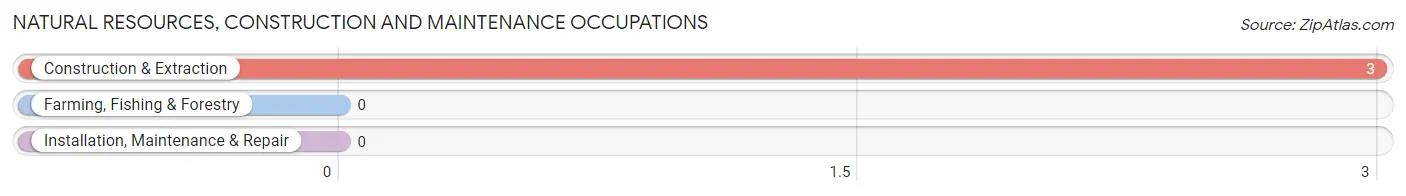
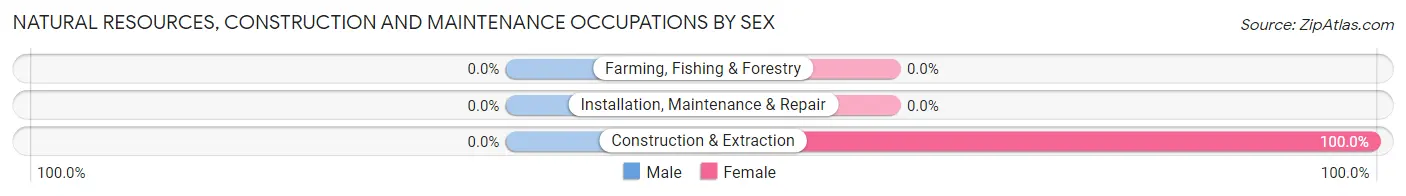
Natural Resources, Construction and Maintenance Occupations by Sex
| Occupation | Male | Female |
| Farming, Fishing & Forestry | 0 (0.0%) | 0 (0.0%) |
| Construction & Extraction | 0 (0.0%) | 3 (100.0%) |
| Installation, Maintenance & Repair | 0 (0.0%) | 0 (0.0%) |
| Total (Category) | 0 (0.0%) | 3 (100.0%) |
| Total (Overall) | 11 (37.9%) | 18 (62.1%) |
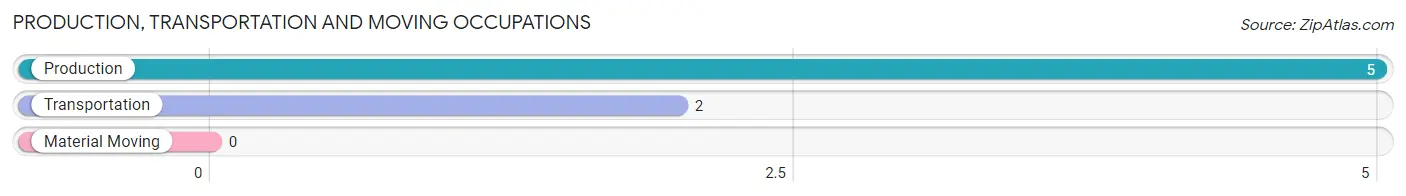
Production, Transportation and Moving Occupations
The most common Production, Transportation and Moving occupations in Perryville are Production (5 | 17.2%), and Transportation (2 | 6.9%).
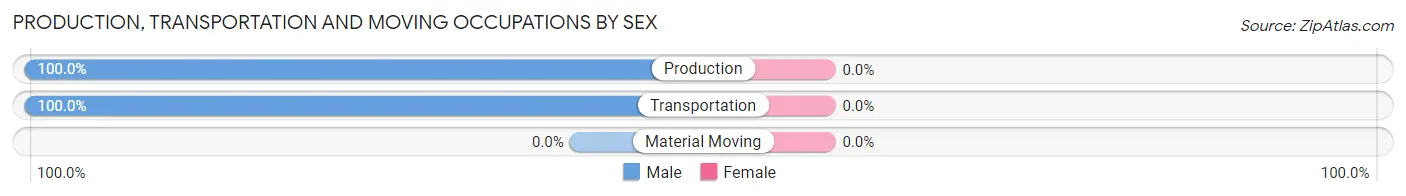
Production, Transportation and Moving Occupations by Sex
| Occupation | Male | Female |
| Production | 5 (100.0%) | 0 (0.0%) |
| Transportation | 2 (100.0%) | 0 (0.0%) |
| Material Moving | 0 (0.0%) | 0 (0.0%) |
| Total (Category) | 7 (100.0%) | 0 (0.0%) |
| Total (Overall) | 11 (37.9%) | 18 (62.1%) |
Employment Industries by Sex in Perryville
Employment Industries in Perryville
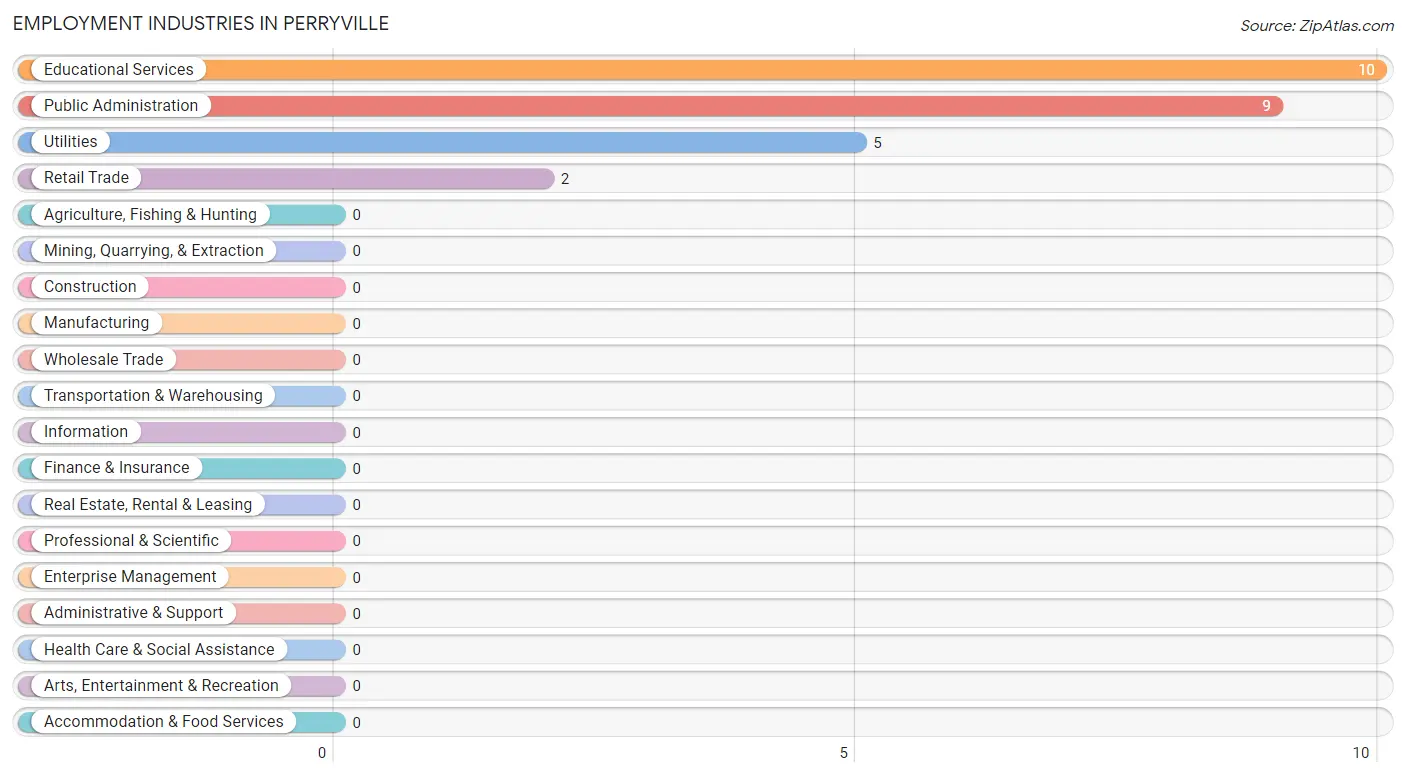
The major employment industries in Perryville include Educational Services (10 | 34.5%), Public Administration (9 | 31.0%), Utilities (5 | 17.2%), and Retail Trade (2 | 6.9%).
Employment Industries by Sex in Perryville
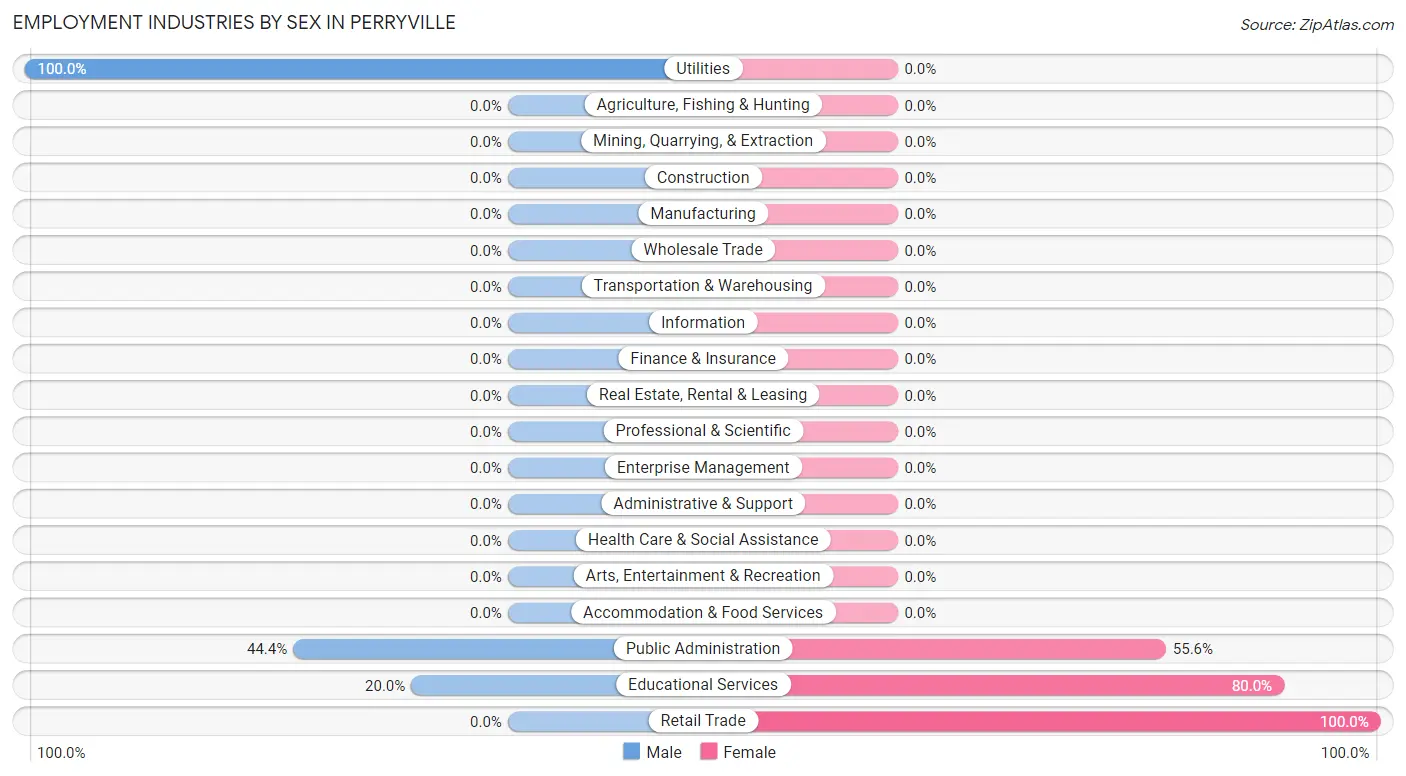
The Perryville industries that see more men than women are Utilities (100.0%), Public Administration (44.4%), and Educational Services (20.0%), whereas the industries that tend to have a higher number of women are Retail Trade (100.0%), Educational Services (80.0%), and Public Administration (55.6%).
| Industry | Male | Female |
| Agriculture, Fishing & Hunting | 0 (0.0%) | 0 (0.0%) |
| Mining, Quarrying, & Extraction | 0 (0.0%) | 0 (0.0%) |
| Construction | 0 (0.0%) | 0 (0.0%) |
| Manufacturing | 0 (0.0%) | 0 (0.0%) |
| Wholesale Trade | 0 (0.0%) | 0 (0.0%) |
| Retail Trade | 0 (0.0%) | 2 (100.0%) |
| Transportation & Warehousing | 0 (0.0%) | 0 (0.0%) |
| Utilities | 5 (100.0%) | 0 (0.0%) |
| Information | 0 (0.0%) | 0 (0.0%) |
| Finance & Insurance | 0 (0.0%) | 0 (0.0%) |
| Real Estate, Rental & Leasing | 0 (0.0%) | 0 (0.0%) |
| Professional & Scientific | 0 (0.0%) | 0 (0.0%) |
| Enterprise Management | 0 (0.0%) | 0 (0.0%) |
| Administrative & Support | 0 (0.0%) | 0 (0.0%) |
| Educational Services | 2 (20.0%) | 8 (80.0%) |
| Health Care & Social Assistance | 0 (0.0%) | 0 (0.0%) |
| Arts, Entertainment & Recreation | 0 (0.0%) | 0 (0.0%) |
| Accommodation & Food Services | 0 (0.0%) | 0 (0.0%) |
| Public Administration | 4 (44.4%) | 5 (55.6%) |
| Total | 11 (37.9%) | 18 (62.1%) |
Education in Perryville
School Enrollment in Perryville
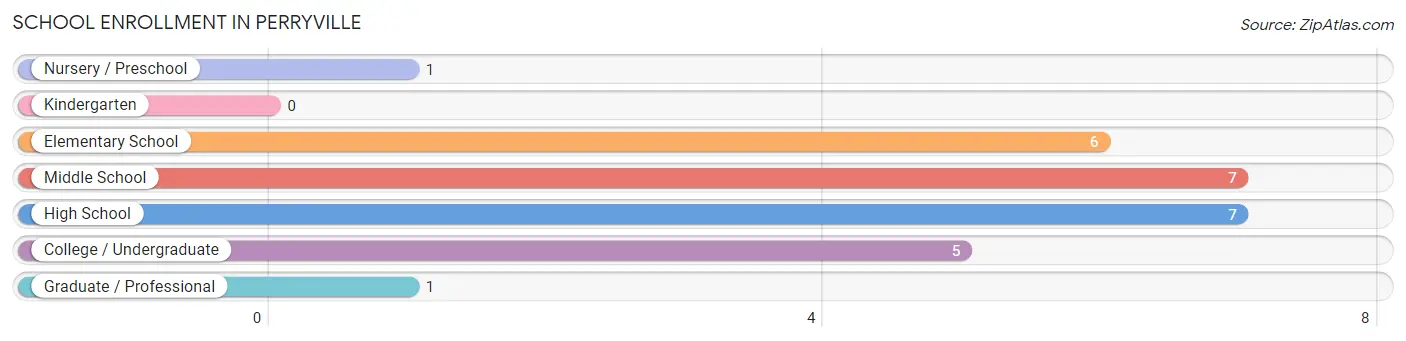
The most common levels of schooling among the 27 students in Perryville are middle school (7 | 25.9%), high school (7 | 25.9%), and elementary school (6 | 22.2%).
| School Level | # Students | % Students |
| Nursery / Preschool | 1 | 3.7% |
| Kindergarten | 0 | 0.0% |
| Elementary School | 6 | 22.2% |
| Middle School | 7 | 25.9% |
| High School | 7 | 25.9% |
| College / Undergraduate | 5 | 18.5% |
| Graduate / Professional | 1 | 3.7% |
| Total | 27 | 100.0% |
School Enrollment by Age by Funding Source in Perryville
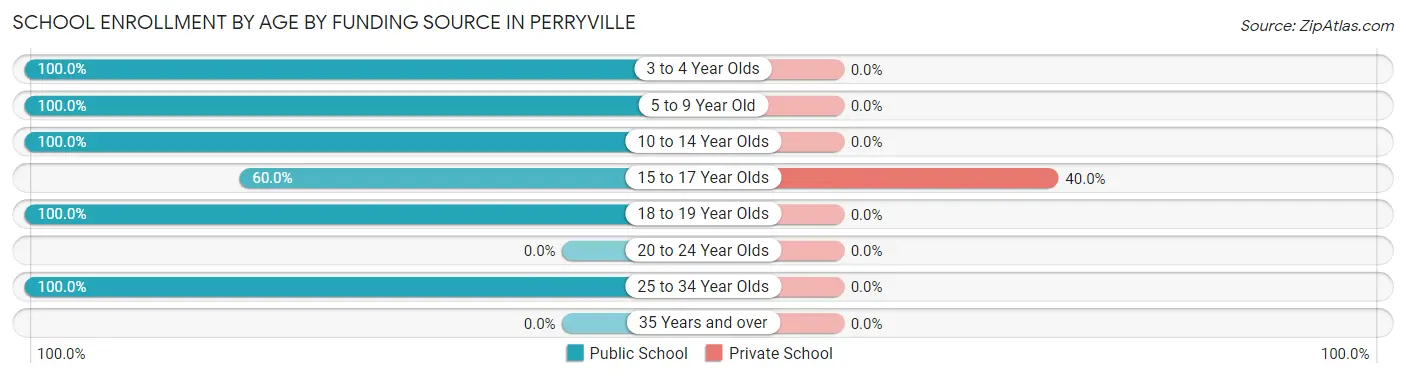
Out of a total of 27 students who are enrolled in schools in Perryville, 2 (7.4%) attend a private institution, while the remaining 25 (92.6%) are enrolled in public schools. The age group of 15 to 17 year olds has the highest likelihood of being enrolled in private schools, with 2 (40.0% in the age bracket) enrolled. Conversely, the age group of 3 to 4 year olds has the lowest likelihood of being enrolled in a private school, with 1 (100.0% in the age bracket) attending a public institution.
| Age Bracket | Public School | Private School |
| 3 to 4 Year Olds | 1 (100.0%) | 0 (0.0%) |
| 5 to 9 Year Old | 6 (100.0%) | 0 (0.0%) |
| 10 to 14 Year Olds | 11 (100.0%) | 0 (0.0%) |
| 15 to 17 Year Olds | 3 (60.0%) | 2 (40.0%) |
| 18 to 19 Year Olds | 3 (100.0%) | 0 (0.0%) |
| 20 to 24 Year Olds | 0 (0.0%) | 0 (0.0%) |
| 25 to 34 Year Olds | 1 (100.0%) | 0 (0.0%) |
| 35 Years and over | 0 (0.0%) | 0 (0.0%) |
| Total | 25 (92.6%) | 2 (7.4%) |
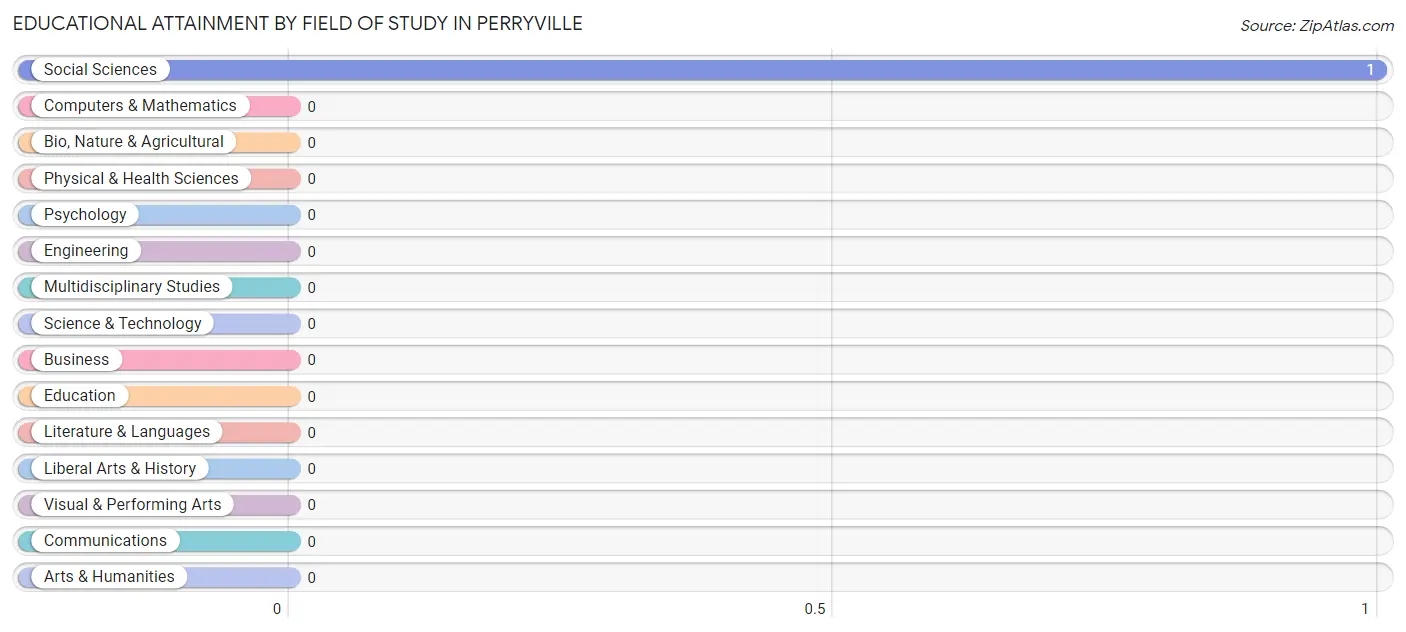
Educational Attainment by Field of Study in Perryville
, and social sciences (1 | 100.0%) are the most common fields of study among 1 individuals in Perryville who have obtained a bachelor's degree or higher.
| Field of Study | # Graduates | % Graduates |
| Computers & Mathematics | 0 | 0.0% |
| Bio, Nature & Agricultural | 0 | 0.0% |
| Physical & Health Sciences | 0 | 0.0% |
| Psychology | 0 | 0.0% |
| Social Sciences | 1 | 100.0% |
| Engineering | 0 | 0.0% |
| Multidisciplinary Studies | 0 | 0.0% |
| Science & Technology | 0 | 0.0% |
| Business | 0 | 0.0% |
| Education | 0 | 0.0% |
| Literature & Languages | 0 | 0.0% |
| Liberal Arts & History | 0 | 0.0% |
| Visual & Performing Arts | 0 | 0.0% |
| Communications | 0 | 0.0% |
| Arts & Humanities | 0 | 0.0% |
| Total | 1 | 100.0% |
Transportation & Commute in Perryville
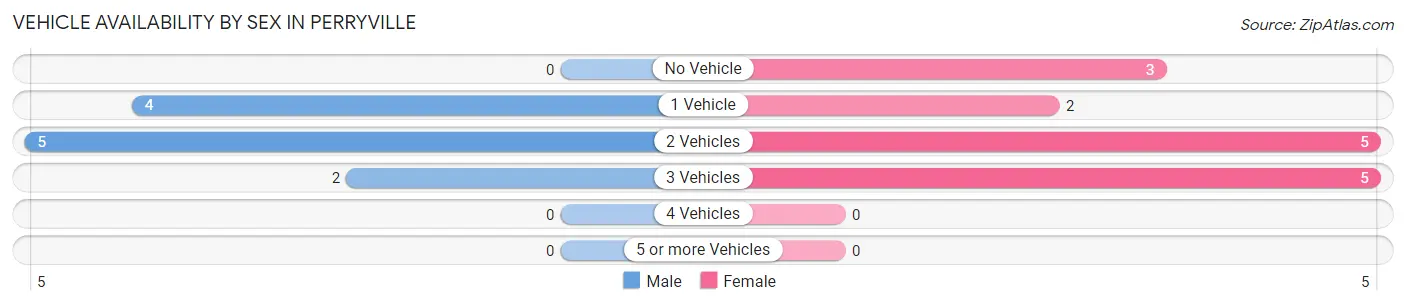
Vehicle Availability by Sex in Perryville
The most prevalent vehicle ownership categories in Perryville are males with 2 vehicles (5, accounting for 45.5%) and females with 2 vehicles (5, making up 33.3%).
| Vehicles Available | Male | Female |
| No Vehicle | 0 (0.0%) | 3 (20.0%) |
| 1 Vehicle | 4 (36.4%) | 2 (13.3%) |
| 2 Vehicles | 5 (45.5%) | 5 (33.3%) |
| 3 Vehicles | 2 (18.2%) | 5 (33.3%) |
| 4 Vehicles | 0 (0.0%) | 0 (0.0%) |
| 5 or more Vehicles | 0 (0.0%) | 0 (0.0%) |
| Total | 11 (100.0%) | 15 (100.0%) |
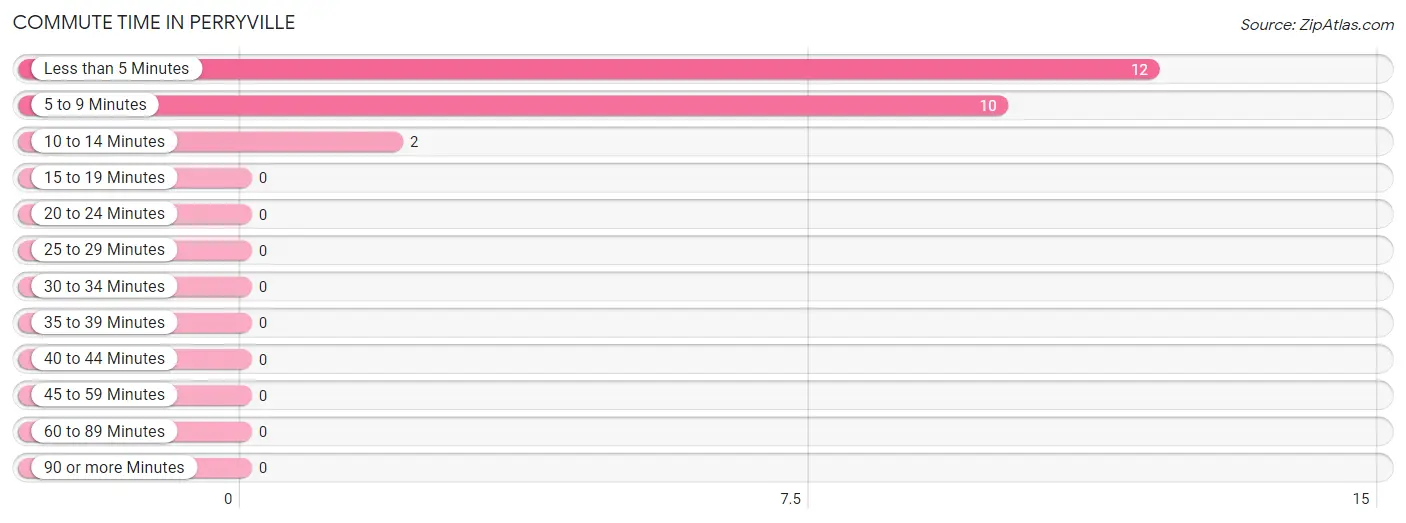
Commute Time in Perryville
The most frequently occuring commute durations in Perryville are less than 5 minutes (12 commuters, 50.0%), 5 to 9 minutes (10 commuters, 41.7%), and 10 to 14 minutes (2 commuters, 8.3%).
| Commute Time | # Commuters | % Commuters |
| Less than 5 Minutes | 12 | 50.0% |
| 5 to 9 Minutes | 10 | 41.7% |
| 10 to 14 Minutes | 2 | 8.3% |
| 15 to 19 Minutes | 0 | 0.0% |
| 20 to 24 Minutes | 0 | 0.0% |
| 25 to 29 Minutes | 0 | 0.0% |
| 30 to 34 Minutes | 0 | 0.0% |
| 35 to 39 Minutes | 0 | 0.0% |
| 40 to 44 Minutes | 0 | 0.0% |
| 45 to 59 Minutes | 0 | 0.0% |
| 60 to 89 Minutes | 0 | 0.0% |
| 90 or more Minutes | 0 | 0.0% |
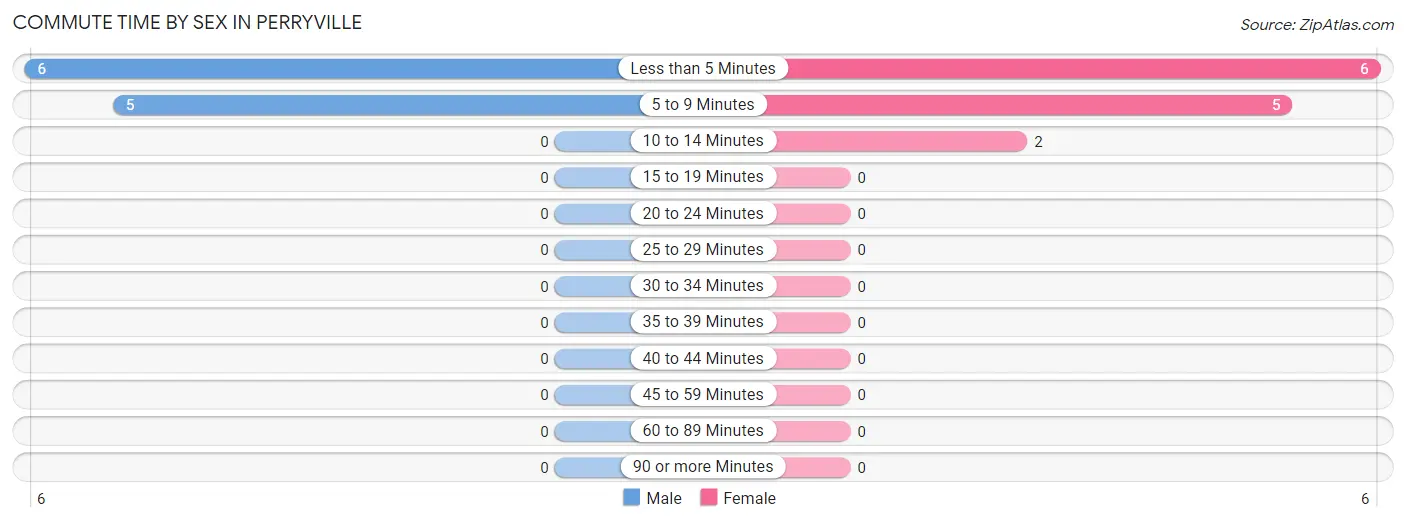
Commute Time by Sex in Perryville
The most common commute times in Perryville are less than 5 minutes (6 commuters, 54.5%) for males and less than 5 minutes (6 commuters, 46.2%) for females.
| Commute Time | Male | Female |
| Less than 5 Minutes | 6 (54.5%) | 6 (46.2%) |
| 5 to 9 Minutes | 5 (45.5%) | 5 (38.5%) |
| 10 to 14 Minutes | 0 (0.0%) | 2 (15.4%) |
| 15 to 19 Minutes | 0 (0.0%) | 0 (0.0%) |
| 20 to 24 Minutes | 0 (0.0%) | 0 (0.0%) |
| 25 to 29 Minutes | 0 (0.0%) | 0 (0.0%) |
| 30 to 34 Minutes | 0 (0.0%) | 0 (0.0%) |
| 35 to 39 Minutes | 0 (0.0%) | 0 (0.0%) |
| 40 to 44 Minutes | 0 (0.0%) | 0 (0.0%) |
| 45 to 59 Minutes | 0 (0.0%) | 0 (0.0%) |
| 60 to 89 Minutes | 0 (0.0%) | 0 (0.0%) |
| 90 or more Minutes | 0 (0.0%) | 0 (0.0%) |
Time of Departure to Work by Sex in Perryville
The most frequent times of departure to work in Perryville are 8:00 AM to 8:29 AM (5, 45.5%) for males and 9:00 AM to 9:59 AM (5, 38.5%) for females.
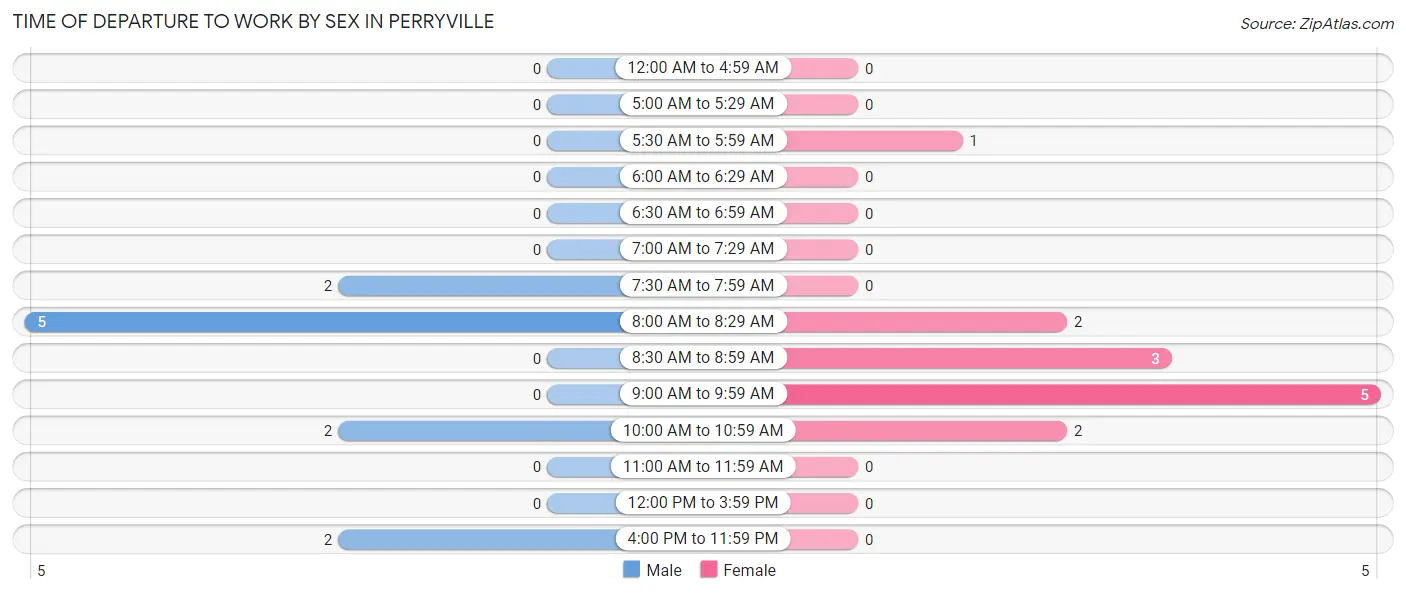
| Time of Departure | Male | Female |
| 12:00 AM to 4:59 AM | 0 (0.0%) | 0 (0.0%) |
| 5:00 AM to 5:29 AM | 0 (0.0%) | 0 (0.0%) |
| 5:30 AM to 5:59 AM | 0 (0.0%) | 1 (7.7%) |
| 6:00 AM to 6:29 AM | 0 (0.0%) | 0 (0.0%) |
| 6:30 AM to 6:59 AM | 0 (0.0%) | 0 (0.0%) |
| 7:00 AM to 7:29 AM | 0 (0.0%) | 0 (0.0%) |
| 7:30 AM to 7:59 AM | 2 (18.2%) | 0 (0.0%) |
| 8:00 AM to 8:29 AM | 5 (45.5%) | 2 (15.4%) |
| 8:30 AM to 8:59 AM | 0 (0.0%) | 3 (23.1%) |
| 9:00 AM to 9:59 AM | 0 (0.0%) | 5 (38.5%) |
| 10:00 AM to 10:59 AM | 2 (18.2%) | 2 (15.4%) |
| 11:00 AM to 11:59 AM | 0 (0.0%) | 0 (0.0%) |
| 12:00 PM to 3:59 PM | 0 (0.0%) | 0 (0.0%) |
| 4:00 PM to 11:59 PM | 2 (18.2%) | 0 (0.0%) |
| Total | 11 (100.0%) | 13 (100.0%) |
Housing Occupancy in Perryville
Occupancy by Ownership in Perryville
Of the total 24 dwellings in Perryville, owner-occupied units account for 15 (62.5%), while renter-occupied units make up 9 (37.5%).
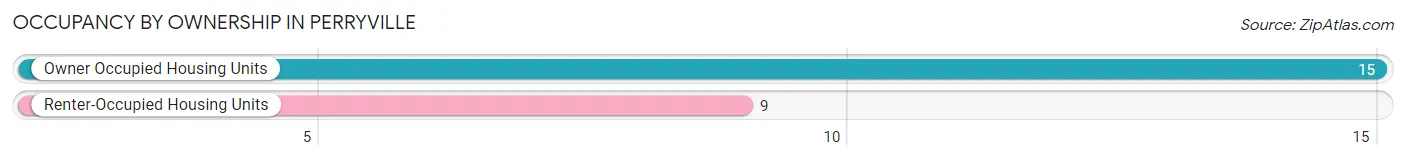
| Occupancy | # Housing Units | % Housing Units |
| Owner Occupied Housing Units | 15 | 62.5% |
| Renter-Occupied Housing Units | 9 | 37.5% |
| Total Occupied Housing Units | 24 | 100.0% |
Occupancy by Household Size in Perryville
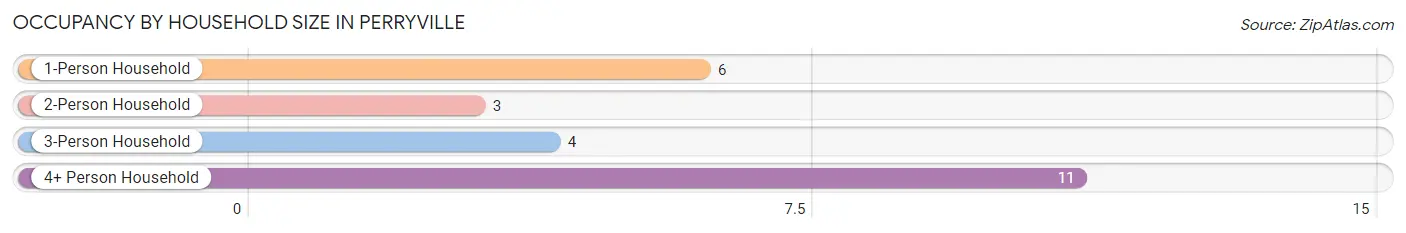
| Household Size | # Housing Units | % Housing Units |
| 1-Person Household | 6 | 25.0% |
| 2-Person Household | 3 | 12.5% |
| 3-Person Household | 4 | 16.7% |
| 4+ Person Household | 11 | 45.8% |
| Total Housing Units | 24 | 100.0% |
Occupancy by Ownership by Household Size in Perryville
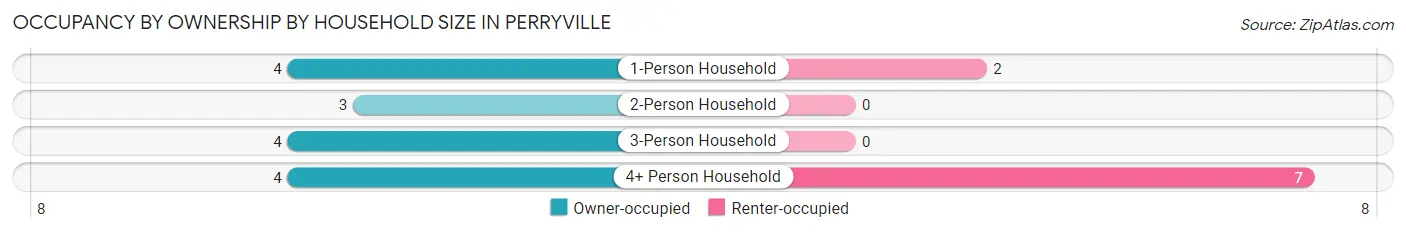
| Household Size | Owner-occupied | Renter-occupied |
| 1-Person Household | 4 (66.7%) | 2 (33.3%) |
| 2-Person Household | 3 (100.0%) | 0 (0.0%) |
| 3-Person Household | 4 (100.0%) | 0 (0.0%) |
| 4+ Person Household | 4 (36.4%) | 7 (63.6%) |
| Total Housing Units | 15 (62.5%) | 9 (37.5%) |
Occupancy by Educational Attainment in Perryville
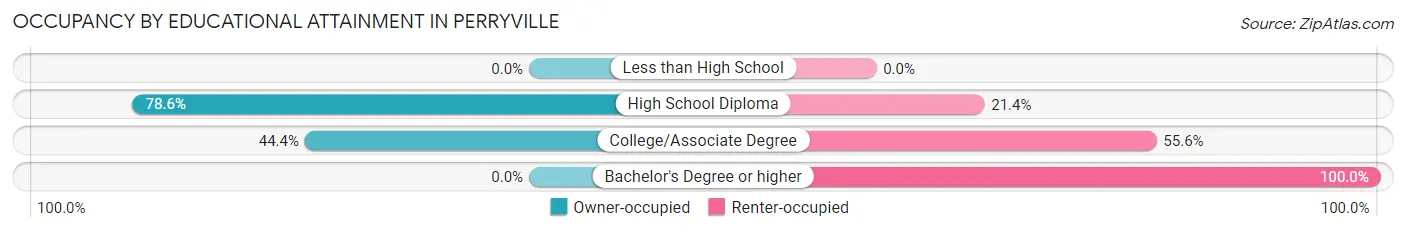
| Household Size | Owner-occupied | Renter-occupied |
| Less than High School | 0 (0.0%) | 0 (0.0%) |
| High School Diploma | 11 (78.6%) | 3 (21.4%) |
| College/Associate Degree | 4 (44.4%) | 5 (55.6%) |
| Bachelor's Degree or higher | 0 (0.0%) | 1 (100.0%) |
Occupancy by Age of Householder in Perryville
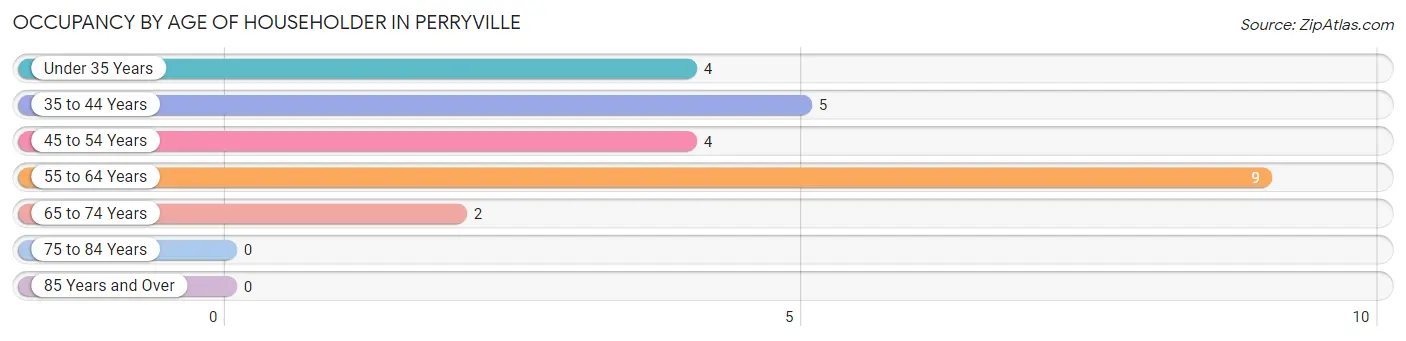
| Age Bracket | # Households | % Households |
| Under 35 Years | 4 | 16.7% |
| 35 to 44 Years | 5 | 20.8% |
| 45 to 54 Years | 4 | 16.7% |
| 55 to 64 Years | 9 | 37.5% |
| 65 to 74 Years | 2 | 8.3% |
| 75 to 84 Years | 0 | 0.0% |
| 85 Years and Over | 0 | 0.0% |
| Total | 24 | 100.0% |
Housing Finances in Perryville
Median Income by Occupancy in Perryville
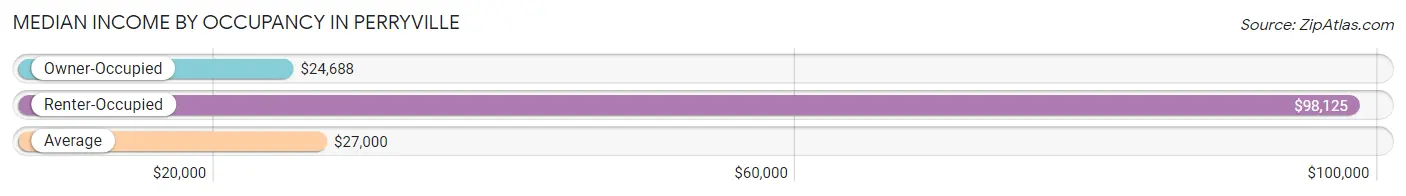
| Occupancy Type | # Households | Median Income |
| Owner-Occupied | 15 (62.5%) | $24,688 |
| Renter-Occupied | 9 (37.5%) | $98,125 |
| Average | 24 (100.0%) | $27,000 |
Occupancy by Householder Income Bracket in Perryville
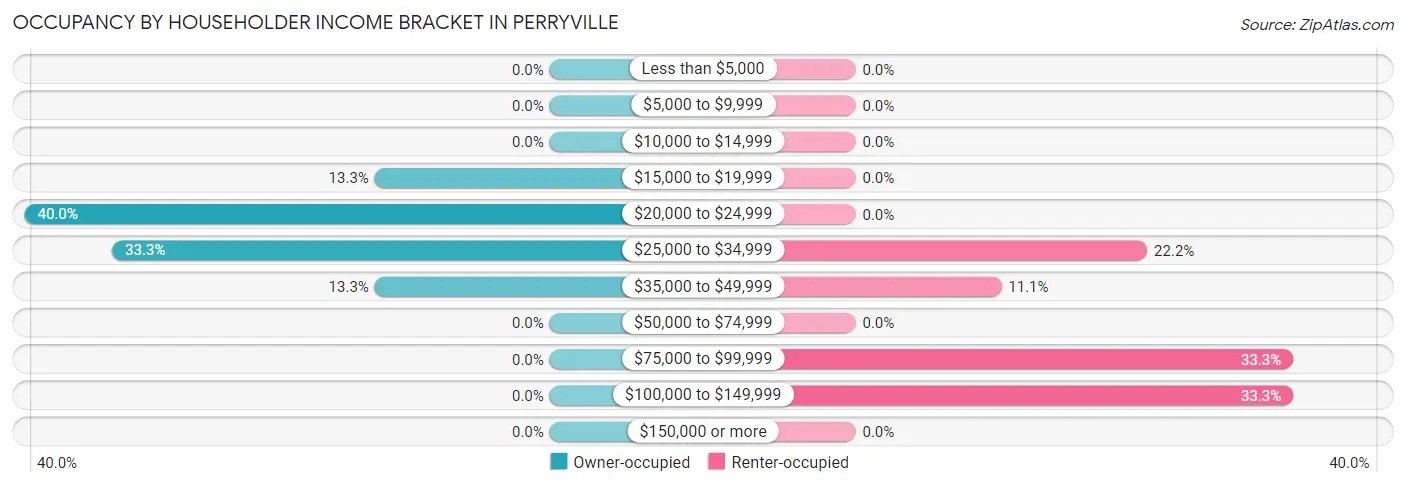
| Income Bracket | Owner-occupied | Renter-occupied |
| Less than $5,000 | 0 (0.0%) | 0 (0.0%) |
| $5,000 to $9,999 | 0 (0.0%) | 0 (0.0%) |
| $10,000 to $14,999 | 0 (0.0%) | 0 (0.0%) |
| $15,000 to $19,999 | 2 (13.3%) | 0 (0.0%) |
| $20,000 to $24,999 | 6 (40.0%) | 0 (0.0%) |
| $25,000 to $34,999 | 5 (33.3%) | 2 (22.2%) |
| $35,000 to $49,999 | 2 (13.3%) | 1 (11.1%) |
| $50,000 to $74,999 | 0 (0.0%) | 0 (0.0%) |
| $75,000 to $99,999 | 0 (0.0%) | 3 (33.3%) |
| $100,000 to $149,999 | 0 (0.0%) | 3 (33.3%) |
| $150,000 or more | 0 (0.0%) | 0 (0.0%) |
| Total | 15 (100.0%) | 9 (100.0%) |
Monthly Housing Cost Tiers in Perryville
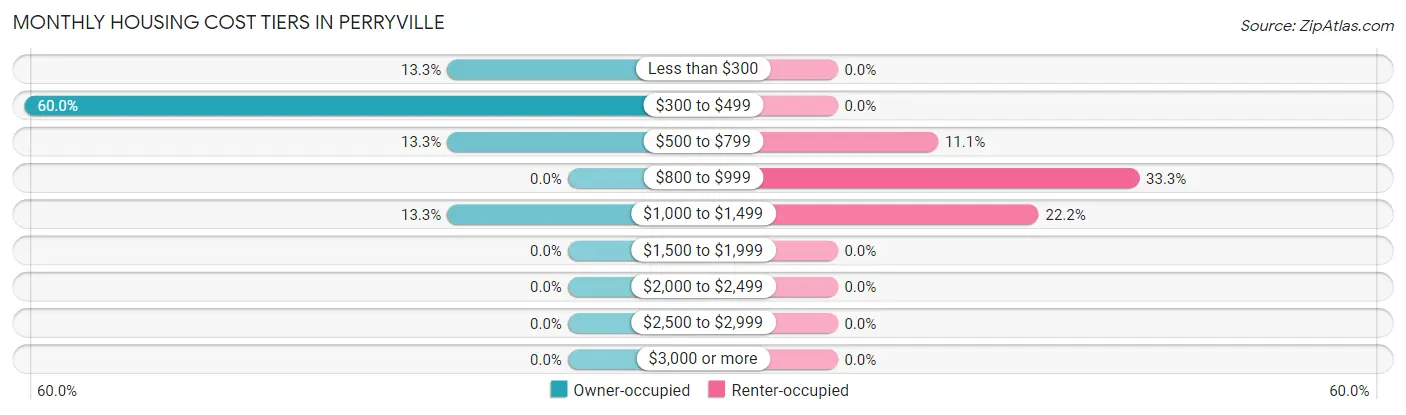
| Monthly Cost | Owner-occupied | Renter-occupied |
| Less than $300 | 2 (13.3%) | 0 (0.0%) |
| $300 to $499 | 9 (60.0%) | 0 (0.0%) |
| $500 to $799 | 2 (13.3%) | 1 (11.1%) |
| $800 to $999 | 0 (0.0%) | 3 (33.3%) |
| $1,000 to $1,499 | 2 (13.3%) | 2 (22.2%) |
| $1,500 to $1,999 | 0 (0.0%) | 0 (0.0%) |
| $2,000 to $2,499 | 0 (0.0%) | 0 (0.0%) |
| $2,500 to $2,999 | 0 (0.0%) | 0 (0.0%) |
| $3,000 or more | 0 (0.0%) | 0 (0.0%) |
| Total | 15 (100.0%) | 9 (100.0%) |
Physical Housing Characteristics in Perryville
Housing Structures in Perryville
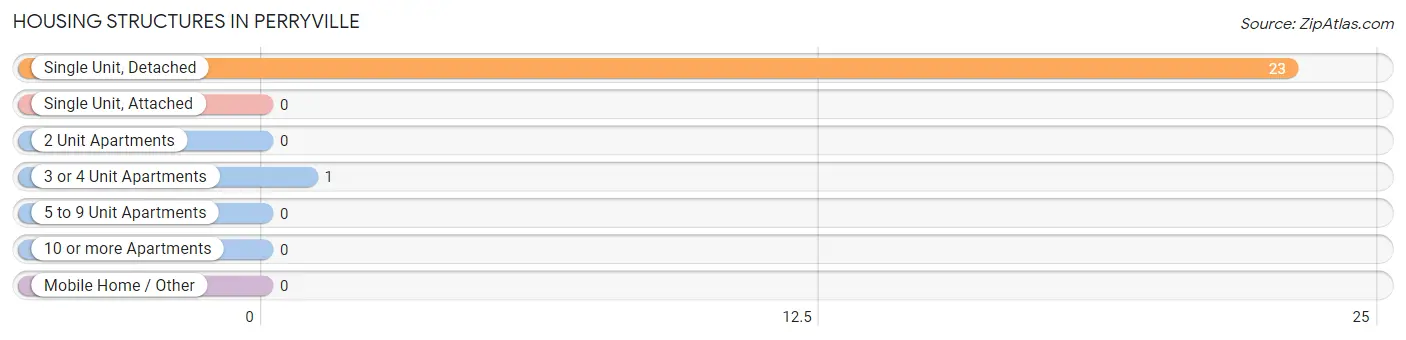
| Structure Type | # Housing Units | % Housing Units |
| Single Unit, Detached | 23 | 95.8% |
| Single Unit, Attached | 0 | 0.0% |
| 2 Unit Apartments | 0 | 0.0% |
| 3 or 4 Unit Apartments | 1 | 4.2% |
| 5 to 9 Unit Apartments | 0 | 0.0% |
| 10 or more Apartments | 0 | 0.0% |
| Mobile Home / Other | 0 | 0.0% |
| Total | 24 | 100.0% |
Housing Structures by Occupancy in Perryville
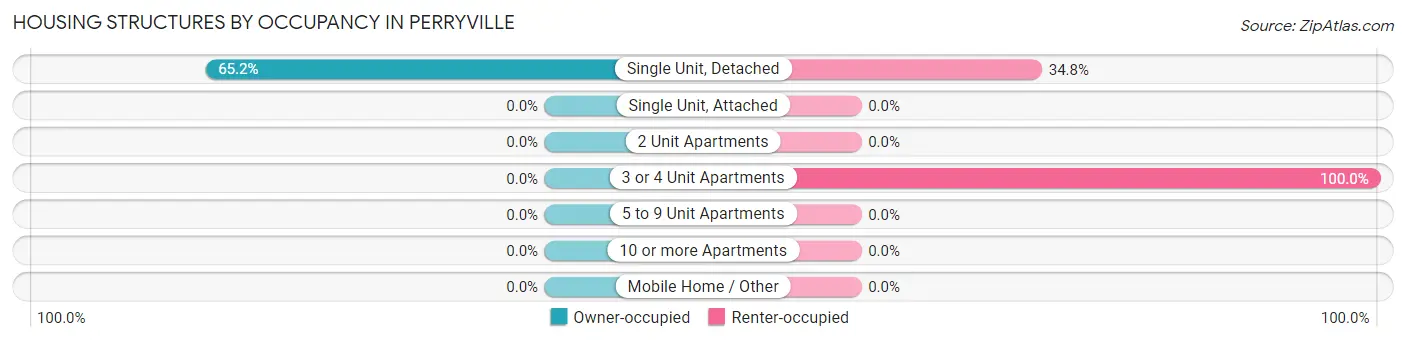
| Structure Type | Owner-occupied | Renter-occupied |
| Single Unit, Detached | 15 (65.2%) | 8 (34.8%) |
| Single Unit, Attached | 0 (0.0%) | 0 (0.0%) |
| 2 Unit Apartments | 0 (0.0%) | 0 (0.0%) |
| 3 or 4 Unit Apartments | 0 (0.0%) | 1 (100.0%) |
| 5 to 9 Unit Apartments | 0 (0.0%) | 0 (0.0%) |
| 10 or more Apartments | 0 (0.0%) | 0 (0.0%) |
| Mobile Home / Other | 0 (0.0%) | 0 (0.0%) |
| Total | 15 (62.5%) | 9 (37.5%) |
Housing Structures by Number of Rooms in Perryville
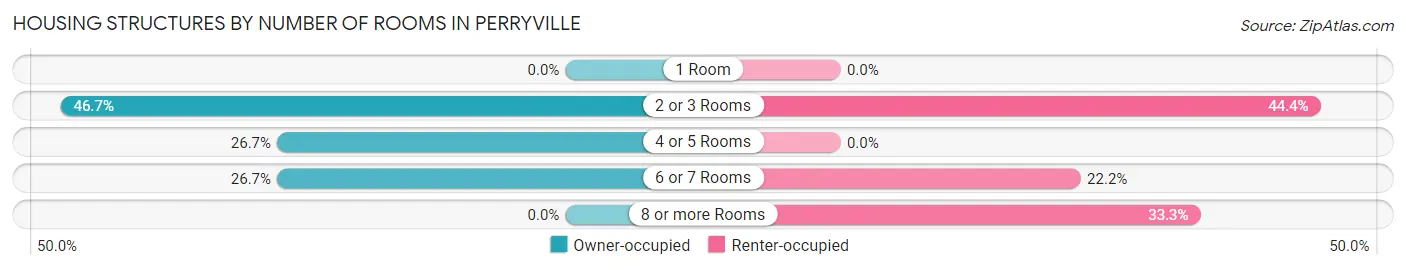
| Number of Rooms | Owner-occupied | Renter-occupied |
| 1 Room | 0 (0.0%) | 0 (0.0%) |
| 2 or 3 Rooms | 7 (46.7%) | 4 (44.4%) |
| 4 or 5 Rooms | 4 (26.7%) | 0 (0.0%) |
| 6 or 7 Rooms | 4 (26.7%) | 2 (22.2%) |
| 8 or more Rooms | 0 (0.0%) | 3 (33.3%) |
| Total | 15 (100.0%) | 9 (100.0%) |
Housing Structure by Heating Type in Perryville
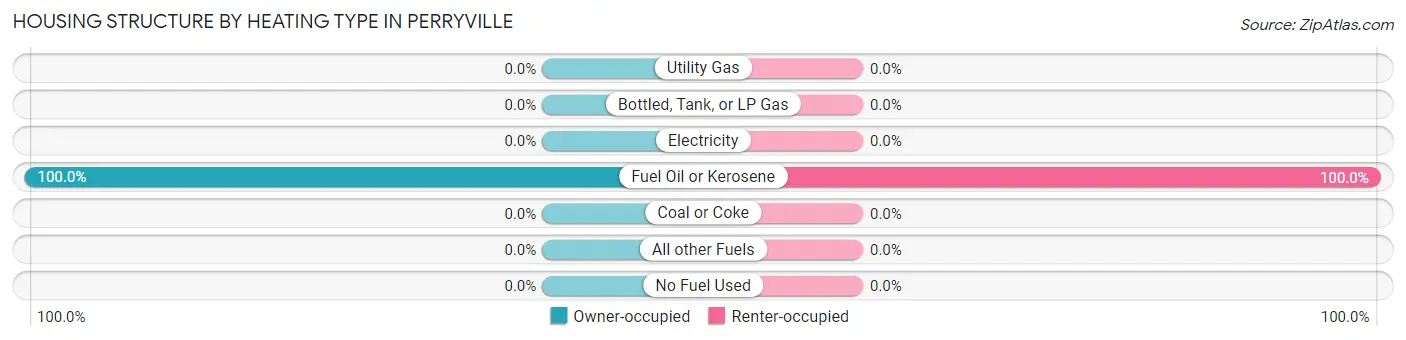
| Heating Type | Owner-occupied | Renter-occupied |
| Utility Gas | 0 (0.0%) | 0 (0.0%) |
| Bottled, Tank, or LP Gas | 0 (0.0%) | 0 (0.0%) |
| Electricity | 0 (0.0%) | 0 (0.0%) |
| Fuel Oil or Kerosene | 15 (100.0%) | 9 (100.0%) |
| Coal or Coke | 0 (0.0%) | 0 (0.0%) |
| All other Fuels | 0 (0.0%) | 0 (0.0%) |
| No Fuel Used | 0 (0.0%) | 0 (0.0%) |
| Total | 15 (100.0%) | 9 (100.0%) |
Household Vehicle Usage in Perryville
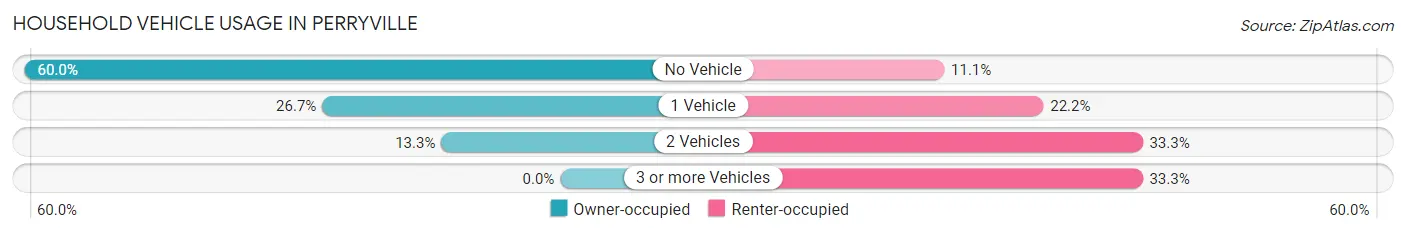
| Vehicles per Household | Owner-occupied | Renter-occupied |
| No Vehicle | 9 (60.0%) | 1 (11.1%) |
| 1 Vehicle | 4 (26.7%) | 2 (22.2%) |
| 2 Vehicles | 2 (13.3%) | 3 (33.3%) |
| 3 or more Vehicles | 0 (0.0%) | 3 (33.3%) |
| Total | 15 (100.0%) | 9 (100.0%) |
Real Estate & Mortgages in Perryville
Real Estate and Mortgage Overview in Perryville
| Characteristic | Without Mortgage | With Mortgage |
| Housing Units | 15 | 0 |
| Median Property Value | $168,800 | $0 |
| Median Household Income | $24,688 | $0 |
| Monthly Housing Costs | $356 | $0 |
| Real Estate Taxes | - | - |
Property Value by Mortgage Status in Perryville
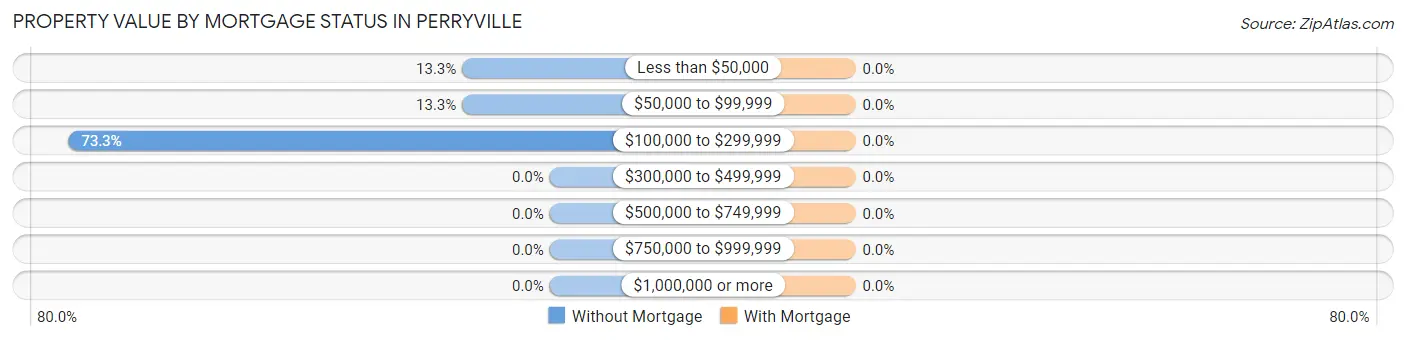
| Property Value | Without Mortgage | With Mortgage |
| Less than $50,000 | 2 (13.3%) | 0 (0.0%) |
| $50,000 to $99,999 | 2 (13.3%) | 0 (0.0%) |
| $100,000 to $299,999 | 11 (73.3%) | 0 (0.0%) |
| $300,000 to $499,999 | 0 (0.0%) | 0 (0.0%) |
| $500,000 to $749,999 | 0 (0.0%) | 0 (0.0%) |
| $750,000 to $999,999 | 0 (0.0%) | 0 (0.0%) |
| $1,000,000 or more | 0 (0.0%) | 0 (0.0%) |
| Total | 15 (100.0%) | 0 (0.0%) |
Household Income by Mortgage Status in Perryville
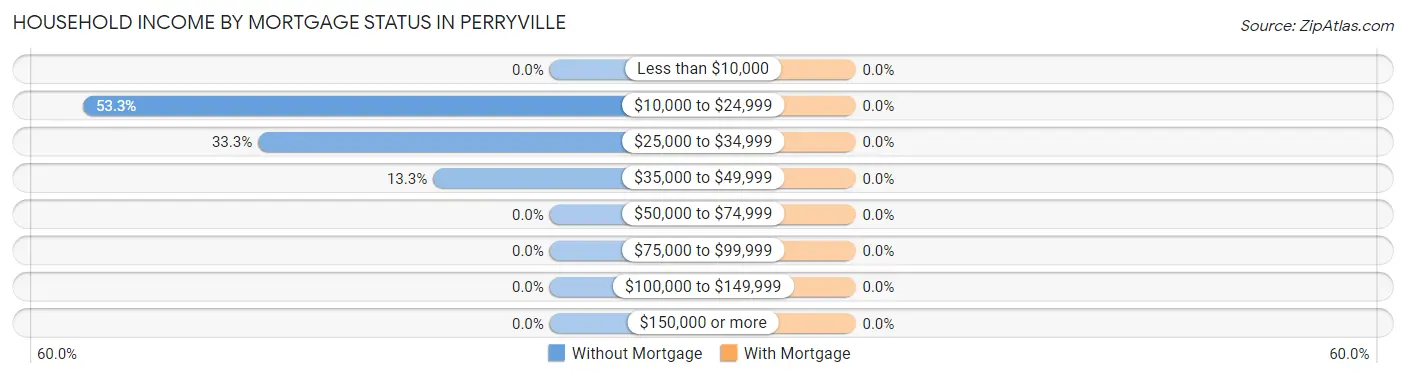
| Household Income | Without Mortgage | With Mortgage |
| Less than $10,000 | 0 (0.0%) | 0 (0.0%) |
| $10,000 to $24,999 | 8 (53.3%) | 0 (0.0%) |
| $25,000 to $34,999 | 5 (33.3%) | 0 (0.0%) |
| $35,000 to $49,999 | 2 (13.3%) | 0 (0.0%) |
| $50,000 to $74,999 | 0 (0.0%) | 0 (0.0%) |
| $75,000 to $99,999 | 0 (0.0%) | 0 (0.0%) |
| $100,000 to $149,999 | 0 (0.0%) | 0 (0.0%) |
| $150,000 or more | 0 (0.0%) | 0 (0.0%) |
| Total | 15 (100.0%) | 0 (0.0%) |
Property Value to Household Income Ratio in Perryville
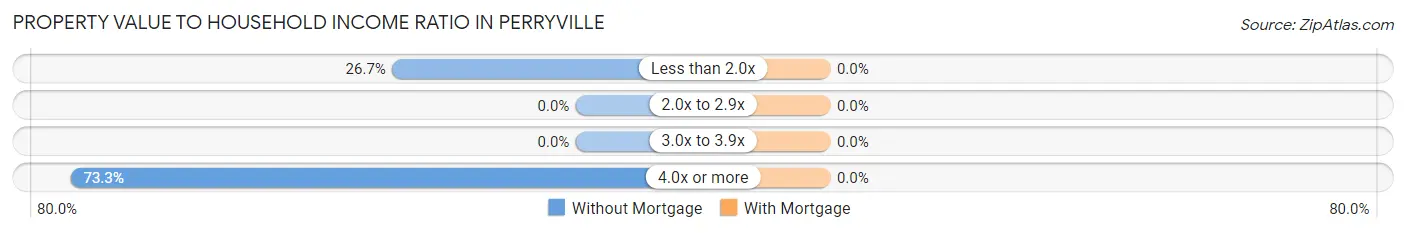
| Value-to-Income Ratio | Without Mortgage | With Mortgage |
| Less than 2.0x | 4 (26.7%) | 0 (0.0%) |
| 2.0x to 2.9x | 0 (0.0%) | 0 (0.0%) |
| 3.0x to 3.9x | 0 (0.0%) | 0 (0.0%) |
| 4.0x or more | 11 (73.3%) | 0 (0.0%) |
| Total | 15 (100.0%) | 0 (0.0%) |
Real Estate Taxes by Mortgage Status in Perryville
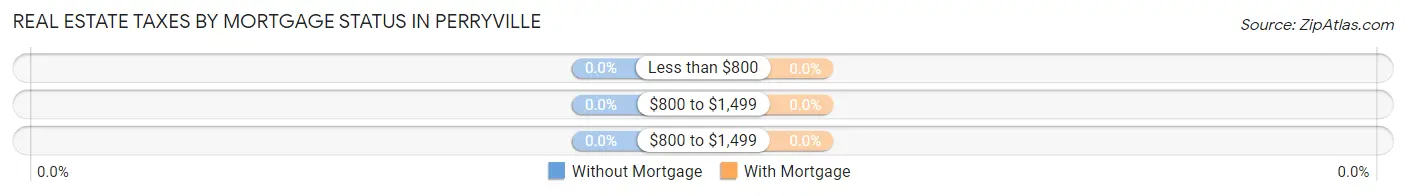
| Property Taxes | Without Mortgage | With Mortgage |
| Less than $800 | 0 (0.0%) | 0 (0.0%) |
| $800 to $1,499 | 0 (0.0%) | 0 (0.0%) |
| $800 to $1,499 | 0 (0.0%) | 0 (0.0%) |
| Total | 15 (100.0%) | 0 (0.0%) |
Health & Disability in Perryville
Health Insurance Coverage by Age in Perryville
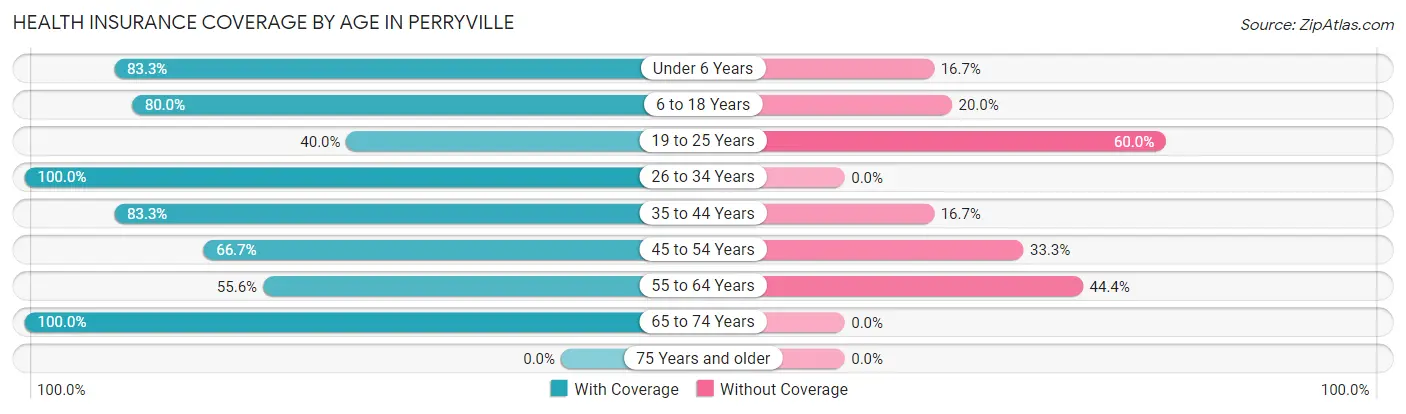
| Age Bracket | With Coverage | Without Coverage |
| Under 6 Years | 10 (83.3%) | 2 (16.7%) |
| 6 to 18 Years | 24 (80.0%) | 6 (20.0%) |
| 19 to 25 Years | 2 (40.0%) | 3 (60.0%) |
| 26 to 34 Years | 6 (100.0%) | 0 (0.0%) |
| 35 to 44 Years | 10 (83.3%) | 2 (16.7%) |
| 45 to 54 Years | 4 (66.7%) | 2 (33.3%) |
| 55 to 64 Years | 5 (55.6%) | 4 (44.4%) |
| 65 to 74 Years | 5 (100.0%) | 0 (0.0%) |
| 75 Years and older | 0 (0.0%) | 0 (0.0%) |
| Total | 66 (77.6%) | 19 (22.4%) |
Health Insurance Coverage by Citizenship Status in Perryville
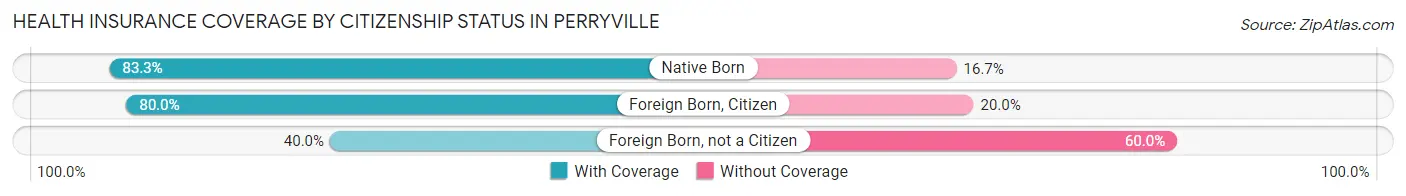
| Citizenship Status | With Coverage | Without Coverage |
| Native Born | 10 (83.3%) | 2 (16.7%) |
| Foreign Born, Citizen | 24 (80.0%) | 6 (20.0%) |
| Foreign Born, not a Citizen | 2 (40.0%) | 3 (60.0%) |
Health Insurance Coverage by Household Income in Perryville
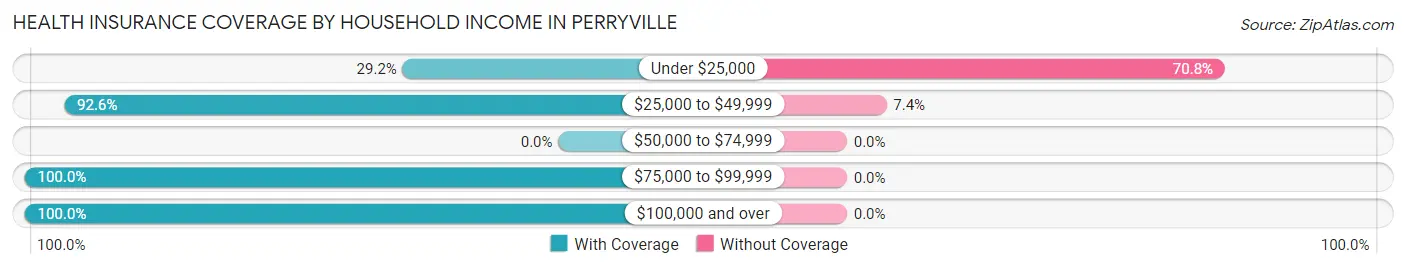
| Household Income | With Coverage | Without Coverage |
| Under $25,000 | 7 (29.2%) | 17 (70.8%) |
| $25,000 to $49,999 | 25 (92.6%) | 2 (7.4%) |
| $50,000 to $74,999 | 0 (0.0%) | 0 (0.0%) |
| $75,000 to $99,999 | 19 (100.0%) | 0 (0.0%) |
| $100,000 and over | 15 (100.0%) | 0 (0.0%) |
Public vs Private Health Insurance Coverage by Age in Perryville
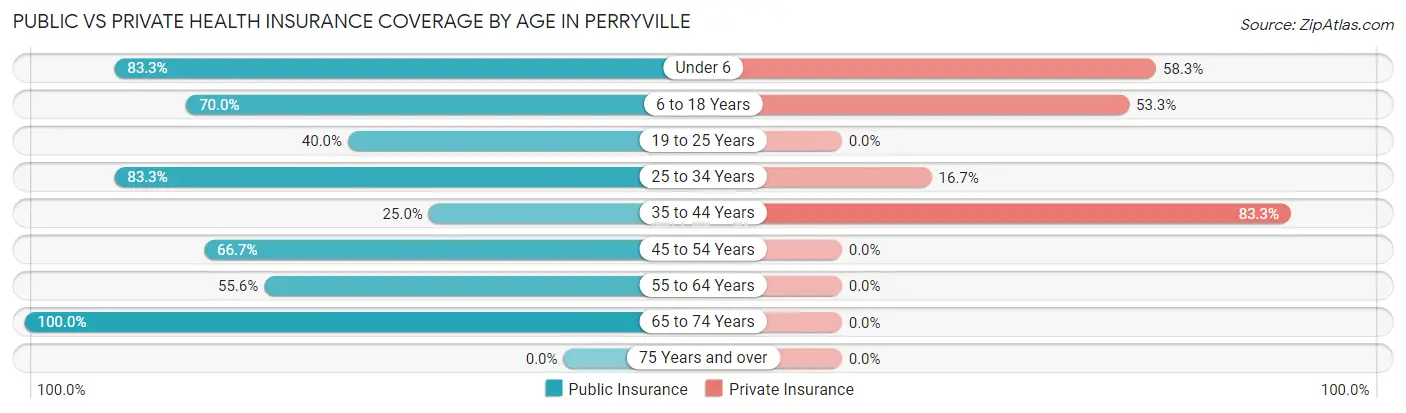
| Age Bracket | Public Insurance | Private Insurance |
| Under 6 | 10 (83.3%) | 7 (58.3%) |
| 6 to 18 Years | 21 (70.0%) | 16 (53.3%) |
| 19 to 25 Years | 2 (40.0%) | 0 (0.0%) |
| 25 to 34 Years | 5 (83.3%) | 1 (16.7%) |
| 35 to 44 Years | 3 (25.0%) | 10 (83.3%) |
| 45 to 54 Years | 4 (66.7%) | 0 (0.0%) |
| 55 to 64 Years | 5 (55.6%) | 0 (0.0%) |
| 65 to 74 Years | 5 (100.0%) | 0 (0.0%) |
| 75 Years and over | 0 (0.0%) | 0 (0.0%) |
| Total | 55 (64.7%) | 34 (40.0%) |
Disability Status by Sex by Age in Perryville
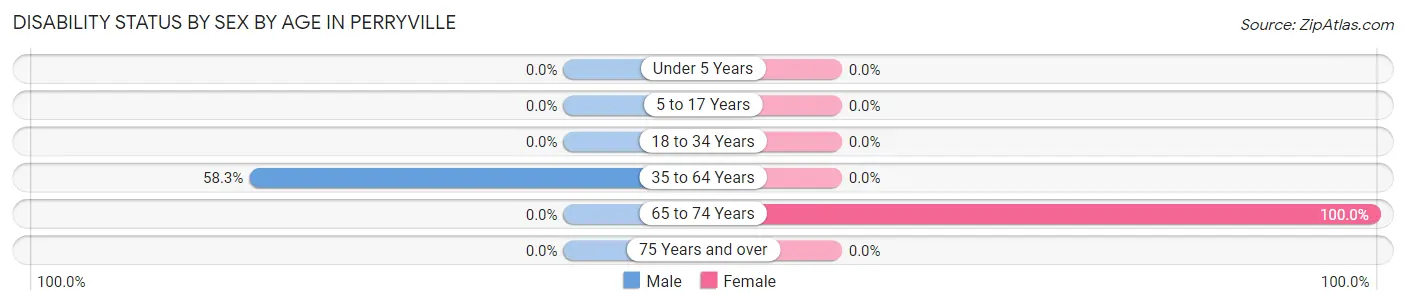
| Age Bracket | Male | Female |
| Under 5 Years | 0 (0.0%) | 0 (0.0%) |
| 5 to 17 Years | 0 (0.0%) | 0 (0.0%) |
| 18 to 34 Years | 0 (0.0%) | 0 (0.0%) |
| 35 to 64 Years | 7 (58.3%) | 0 (0.0%) |
| 65 to 74 Years | 0 (0.0%) | 5 (100.0%) |
| 75 Years and over | 0 (0.0%) | 0 (0.0%) |
Disability Class by Sex by Age in Perryville
Disability Class: Hearing Difficulty
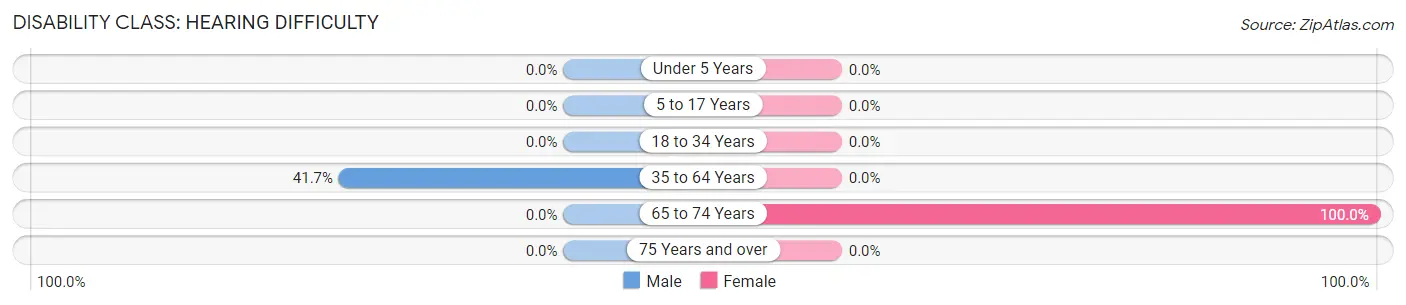
| Age Bracket | Male | Female |
| Under 5 Years | 0 (0.0%) | 0 (0.0%) |
| 5 to 17 Years | 0 (0.0%) | 0 (0.0%) |
| 18 to 34 Years | 0 (0.0%) | 0 (0.0%) |
| 35 to 64 Years | 5 (41.7%) | 0 (0.0%) |
| 65 to 74 Years | 0 (0.0%) | 5 (100.0%) |
| 75 Years and over | 0 (0.0%) | 0 (0.0%) |
Disability Class: Vision Difficulty
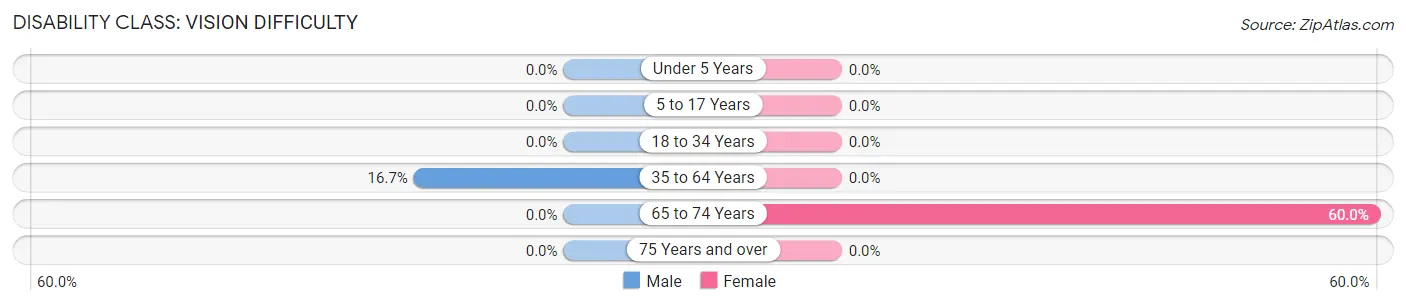
| Age Bracket | Male | Female |
| Under 5 Years | 0 (0.0%) | 0 (0.0%) |
| 5 to 17 Years | 0 (0.0%) | 0 (0.0%) |
| 18 to 34 Years | 0 (0.0%) | 0 (0.0%) |
| 35 to 64 Years | 2 (16.7%) | 0 (0.0%) |
| 65 to 74 Years | 0 (0.0%) | 3 (60.0%) |
| 75 Years and over | 0 (0.0%) | 0 (0.0%) |
Disability Class: Cognitive Difficulty
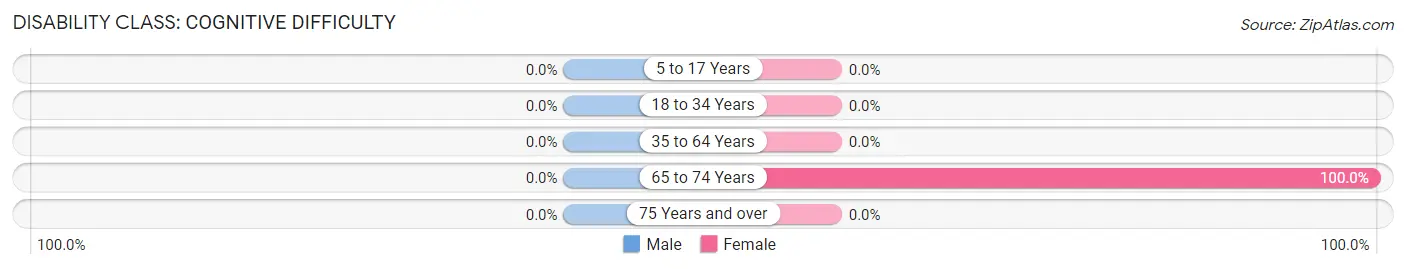
| Age Bracket | Male | Female |
| 5 to 17 Years | 0 (0.0%) | 0 (0.0%) |
| 18 to 34 Years | 0 (0.0%) | 0 (0.0%) |
| 35 to 64 Years | 0 (0.0%) | 0 (0.0%) |
| 65 to 74 Years | 0 (0.0%) | 5 (100.0%) |
| 75 Years and over | 0 (0.0%) | 0 (0.0%) |
Disability Class: Ambulatory Difficulty
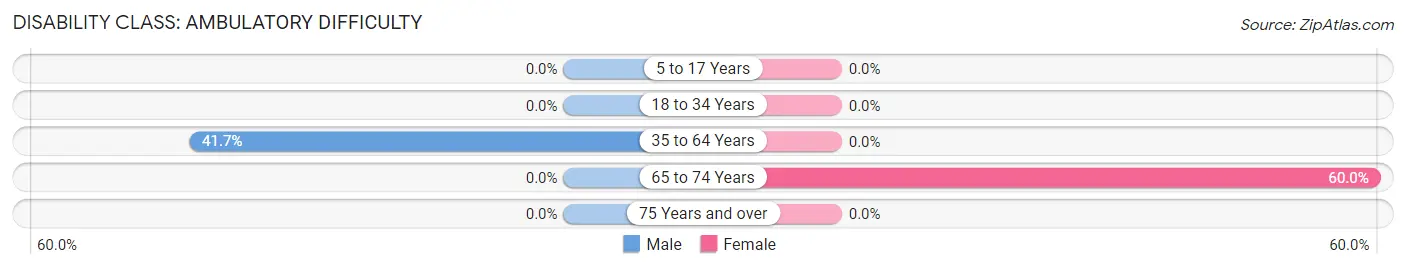
| Age Bracket | Male | Female |
| 5 to 17 Years | 0 (0.0%) | 0 (0.0%) |
| 18 to 34 Years | 0 (0.0%) | 0 (0.0%) |
| 35 to 64 Years | 5 (41.7%) | 0 (0.0%) |
| 65 to 74 Years | 0 (0.0%) | 3 (60.0%) |
| 75 Years and over | 0 (0.0%) | 0 (0.0%) |
Disability Class: Self-Care Difficulty
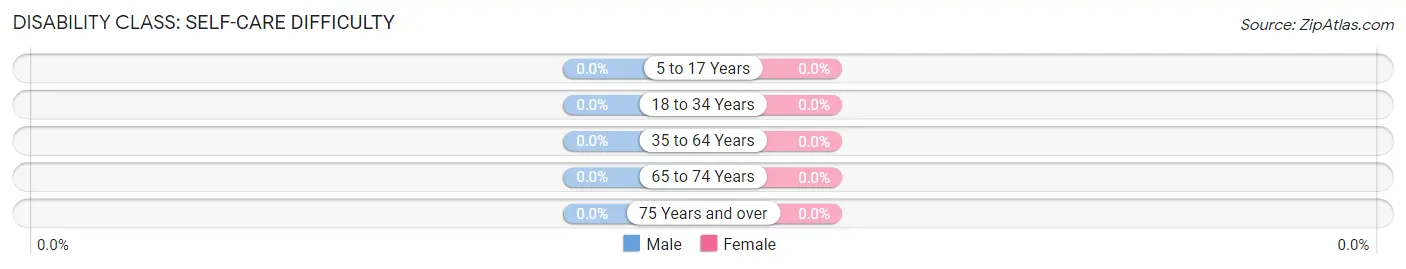
| Age Bracket | Male | Female |
| 5 to 17 Years | 0 (0.0%) | 0 (0.0%) |
| 18 to 34 Years | 0 (0.0%) | 0 (0.0%) |
| 35 to 64 Years | 0 (0.0%) | 0 (0.0%) |
| 65 to 74 Years | 0 (0.0%) | 0 (0.0%) |
| 75 Years and over | 0 (0.0%) | 0 (0.0%) |
Technology Access in Perryville
Computing Device Access in Perryville
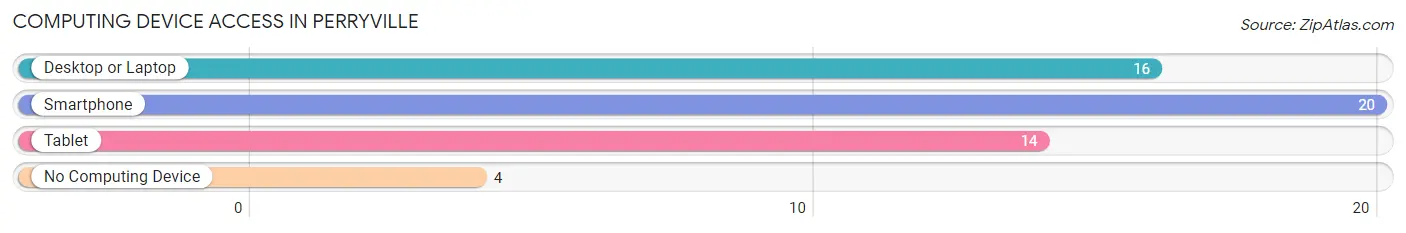
| Device Type | # Households | % Households |
| Desktop or Laptop | 16 | 66.7% |
| Smartphone | 20 | 83.3% |
| Tablet | 14 | 58.3% |
| No Computing Device | 4 | 16.7% |
| Total | 24 | 100.0% |
Internet Access in Perryville
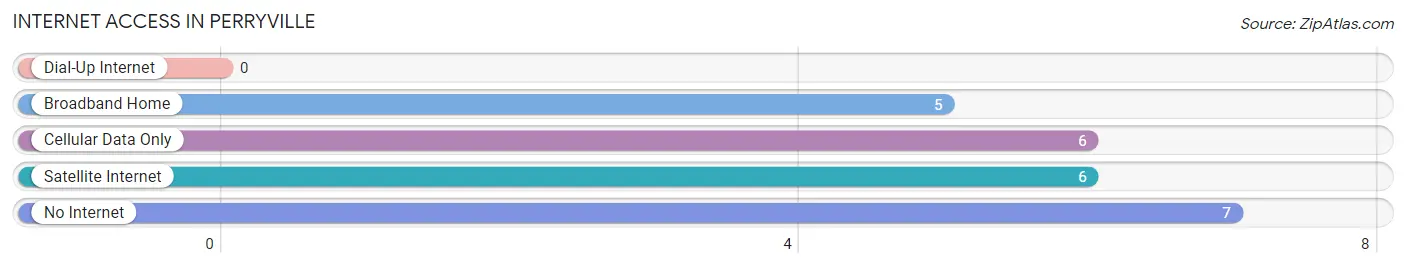
| Internet Type | # Households | % Households |
| Dial-Up Internet | 0 | 0.0% |
| Broadband Home | 5 | 20.8% |
| Cellular Data Only | 6 | 25.0% |
| Satellite Internet | 6 | 25.0% |
| No Internet | 7 | 29.2% |
| Total | 24 | 100.0% |
Perryville Summary
Perryville, Alaska is a small city located on the south-central coast of Alaska, in the Prince William Sound region. It is the only incorporated city in the area, and is the largest city in the region. The city is located on the eastern shore of the Chugach Bay, and is surrounded by the Chugach National Forest. The city has a population of approximately 1,000 people, and is the only incorporated city in the region.
History
The area that is now Perryville was first inhabited by the Dena’ina Athabascan people, who lived in the area for thousands of years before the arrival of Europeans. The first Europeans to explore the area were Russian fur traders, who arrived in the late 1700s. The area was later explored by the British, who established a trading post in the area in 1867.
In the late 1800s, the area was settled by miners and fishermen, who established the town of Perryville in 1898. The town was named after the Perry family, who were among the first settlers in the area. The town quickly grew, and by the early 1900s, it had become a major fishing and canning center.
In the early 1900s, the town was also a major center for the Alaska Native population, who had been living in the area for centuries. The town was home to a large number of Native Americans, who worked in the canneries and fishing industry.
In the 1950s, the town began to decline, as the fishing industry began to decline. The town was also affected by the 1964 Good Friday Earthquake, which caused extensive damage to the town. In the 1970s, the town began to recover, and the population began to grow again.
Geography
Perryville is located on the eastern shore of the Chugach Bay, in the Prince William Sound region of Alaska. The city is surrounded by the Chugach National Forest, and is located approximately 60 miles south of Anchorage. The city is located at an elevation of approximately 20 feet above sea level.
The climate in Perryville is mild and temperate, with average temperatures ranging from the mid-30s in the winter to the mid-60s in the summer. The city receives an average of approximately 20 inches of precipitation per year, with most of the precipitation falling in the winter months.
Economy
The economy of Perryville is largely based on fishing and tourism. The city is home to a number of seafood processing plants, which process and can salmon, halibut, and other fish. The city is also home to a number of tourist attractions, including the Alaska SeaLife Center, which is a popular tourist destination.
The city is also home to a number of small businesses, including restaurants, retail stores, and other services. The city is also home to a number of government offices, including the Alaska Department of Fish and Game, the Alaska Department of Transportation, and the Alaska State Troopers.
Demographics
As of the 2010 census, the population of Perryville was 1,000 people. The racial makeup of the city was 95.2% White, 0.7% Native American, 0.3% Asian, 0.2% Pacific Islander, 0.1% from other races, and 3.5% from two or more races. The median household income in the city was $50,000, and the median family income was $60,000.
Conclusion
Perryville, Alaska is a small city located on the south-central coast of Alaska, in the Prince William Sound region. It is the only incorporated city in the area, and is the largest city in the region. The city has a population of approximately 1,000 people, and is the only incorporated city in the region. The economy of Perryville is largely based on fishing and tourism, and the city is home to a number of small businesses, government offices, and tourist attractions. The racial makeup of the city is 95.2% White, 0.7% Native American, 0.3% Asian, 0.2% Pacific Islander, 0.1% from other races, and 3.5% from two or more races. The median household income in the city was $50,000, and the median family income was $60,000.
Common Questions
What is Per Capita Income in Perryville?
Per Capita income in Perryville is $13,447.
What is the Median Family Income in Perryville?
Median Family Income in Perryville is $26,500.
What is the Median Household income in Perryville?
Median Household Income in Perryville is $27,000.
What is Income or Wage Gap in Perryville?
Income or Wage Gap in Perryville is 53.3%.
Women in Perryville earn 46.7 cents for every dollar earned by a man.
What is Inequality or Gini Index in Perryville?
Inequality or Gini Index in Perryville is 0.37.
What is the Total Population of Perryville?
Total Population of Perryville is 85.
What is the Total Male Population of Perryville?
Total Male Population of Perryville is 33.
What is the Total Female Population of Perryville?
Total Female Population of Perryville is 52.
What is the Ratio of Males per 100 Females in Perryville?
There are 63.46 Males per 100 Females in Perryville.
What is the Ratio of Females per 100 Males in Perryville?
There are 157.58 Females per 100 Males in Perryville.
What is the Median Population Age in Perryville?
Median Population Age in Perryville is 20.3 Years.
What is the Average Family Size in Perryville
Average Family Size in Perryville is 3.9 People.
What is the Average Household Size in Perryville
Average Household Size in Perryville is 3.5 People.
How Large is the Labor Force in Perryville?
There are 38 People in the Labor Forcein in Perryville.
What is the Percentage of People in the Labor Force in Perryville?
67.9% of People are in the Labor Force in Perryville.
What is the Unemployment Rate in Perryville?
Unemployment Rate in Perryville is 23.7%.