Old Harbor, AK Map & Demographics
Old Harbor Map
Old Harbor Overview
$21,641
PER CAPITA INCOME
$40,156
AVG HOUSEHOLD INCOME
31.9%
WAGE / INCOME GAP [ % ]
68.1¢/ $1
WAGE / INCOME GAP [ $ ]
0.52
INEQUALITY / GINI INDEX
155
TOTAL POPULATION
85
MALE POPULATION
70
FEMALE POPULATION
121.43
MALES / 100 FEMALES
82.35
FEMALES / 100 MALES
32.8
MEDIAN AGE
2.6
AVG FAMILY SIZE
2.1
AVG HOUSEHOLD SIZE
78
LABOR FORCE [ PEOPLE ]
65.5%
PERCENT IN LABOR FORCE
28.2%
UNEMPLOYMENT RATE
Old Harbor Zip Codes
Old Harbor Area Codes
Income in Old Harbor
Income Overview in Old Harbor
| Characteristic | Number | Measure |
| Per Capita Income | 155 | $21,641 |
| Median Family Income | 41 | $0 |
| Mean Family Income | 41 | $70,380 |
| Median Household Income | 75 | $40,156 |
| Mean Household Income | 75 | $49,753 |
| Income Deficit | 41 | $0 |
| Wage / Income Gap (%) | 155 | 31.94% |
| Wage / Income Gap ($) | 155 | 68.06¢ per $1 |
| Gini / Inequality Index | 155 | 0.52 |
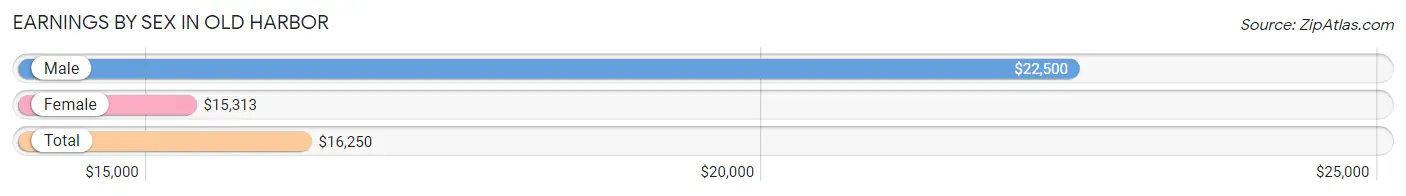
Earnings by Sex in Old Harbor
Average Earnings in Old Harbor are $16,250, $22,500 for men and $15,313 for women, a difference of 31.9%.
| Sex | Number | Average Earnings |
| Male | 46 (52.3%) | $22,500 |
| Female | 42 (47.7%) | $15,313 |
| Total | 88 (100.0%) | $16,250 |
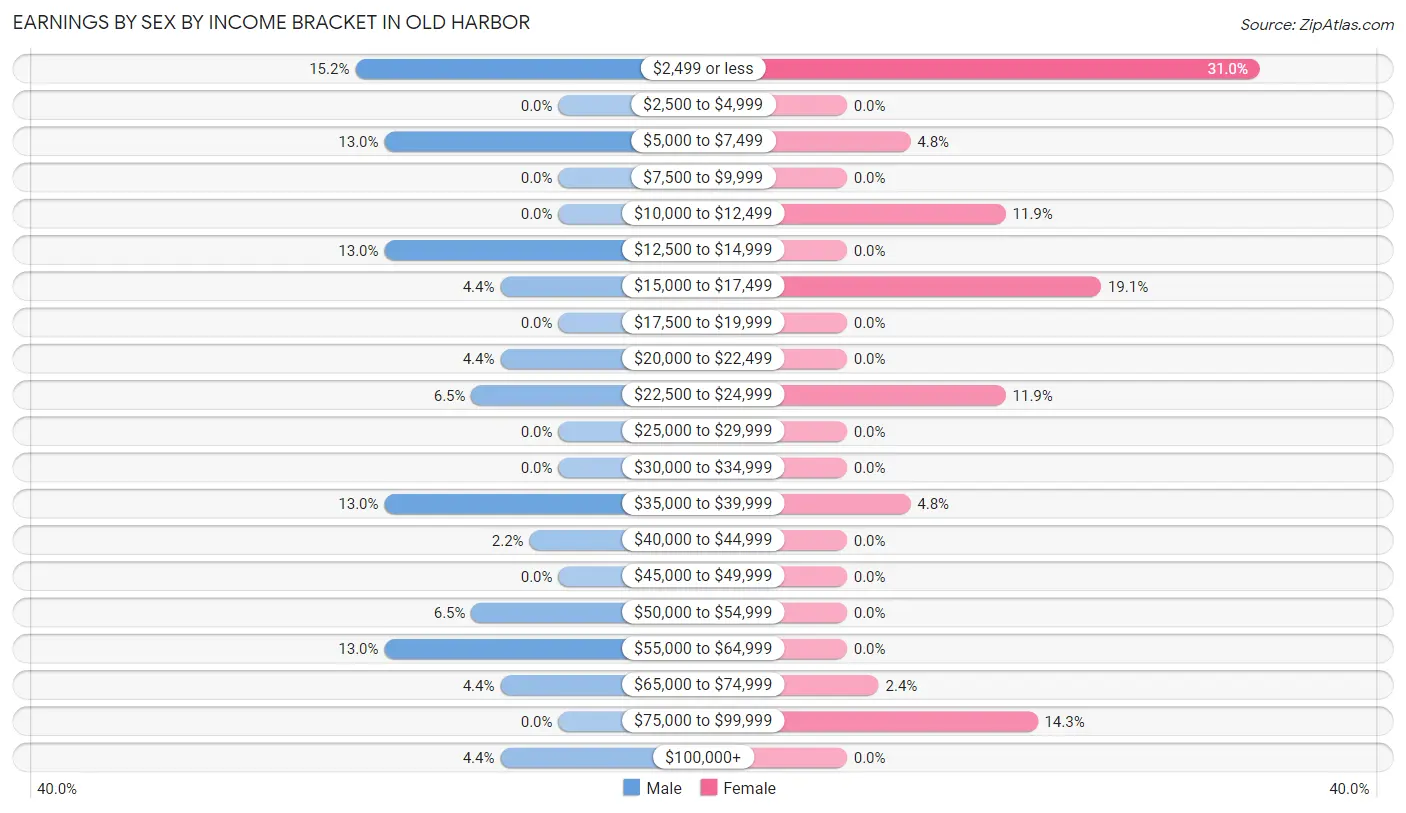
Earnings by Sex by Income Bracket in Old Harbor
The most common earnings brackets in Old Harbor are $2,499 or less for men (7 | 15.2%) and $2,499 or less for women (13 | 30.9%).
| Income | Male | Female |
| $2,499 or less | 7 (15.2%) | 13 (30.9%) |
| $2,500 to $4,999 | 0 (0.0%) | 0 (0.0%) |
| $5,000 to $7,499 | 6 (13.0%) | 2 (4.8%) |
| $7,500 to $9,999 | 0 (0.0%) | 0 (0.0%) |
| $10,000 to $12,499 | 0 (0.0%) | 5 (11.9%) |
| $12,500 to $14,999 | 6 (13.0%) | 0 (0.0%) |
| $15,000 to $17,499 | 2 (4.3%) | 8 (19.1%) |
| $17,500 to $19,999 | 0 (0.0%) | 0 (0.0%) |
| $20,000 to $22,499 | 2 (4.3%) | 0 (0.0%) |
| $22,500 to $24,999 | 3 (6.5%) | 5 (11.9%) |
| $25,000 to $29,999 | 0 (0.0%) | 0 (0.0%) |
| $30,000 to $34,999 | 0 (0.0%) | 0 (0.0%) |
| $35,000 to $39,999 | 6 (13.0%) | 2 (4.8%) |
| $40,000 to $44,999 | 1 (2.2%) | 0 (0.0%) |
| $45,000 to $49,999 | 0 (0.0%) | 0 (0.0%) |
| $50,000 to $54,999 | 3 (6.5%) | 0 (0.0%) |
| $55,000 to $64,999 | 6 (13.0%) | 0 (0.0%) |
| $65,000 to $74,999 | 2 (4.3%) | 1 (2.4%) |
| $75,000 to $99,999 | 0 (0.0%) | 6 (14.3%) |
| $100,000+ | 2 (4.3%) | 0 (0.0%) |
| Total | 46 (100.0%) | 42 (100.0%) |
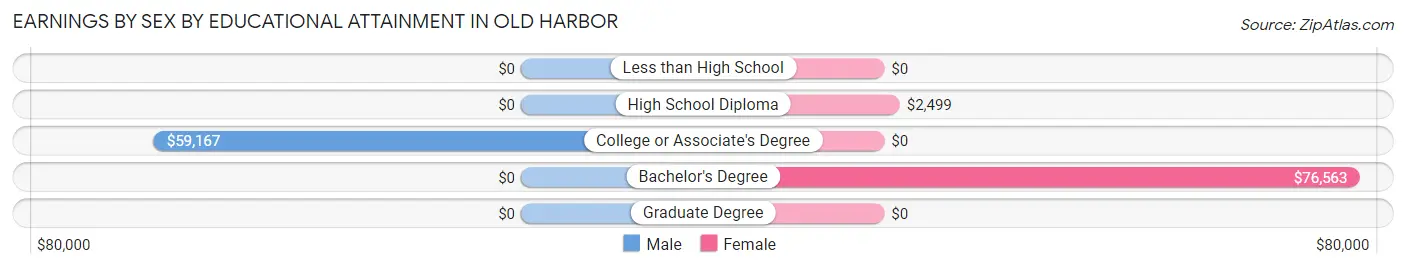
Earnings by Sex by Educational Attainment in Old Harbor
| Educational Attainment | Male Income | Female Income |
| Less than High School | - | - |
| High School Diploma | - | - |
| College or Associate's Degree | $59,167 | $0 |
| Bachelor's Degree | - | - |
| Graduate Degree | - | - |
| Total | $35,417 | $0 |
Family Income in Old Harbor
Family Income Brackets in Old Harbor
According to the Old Harbor family income data, there are 11 families falling into the $25,000 to $34,999 income range, which is the most common income bracket and makes up 26.8% of all families.
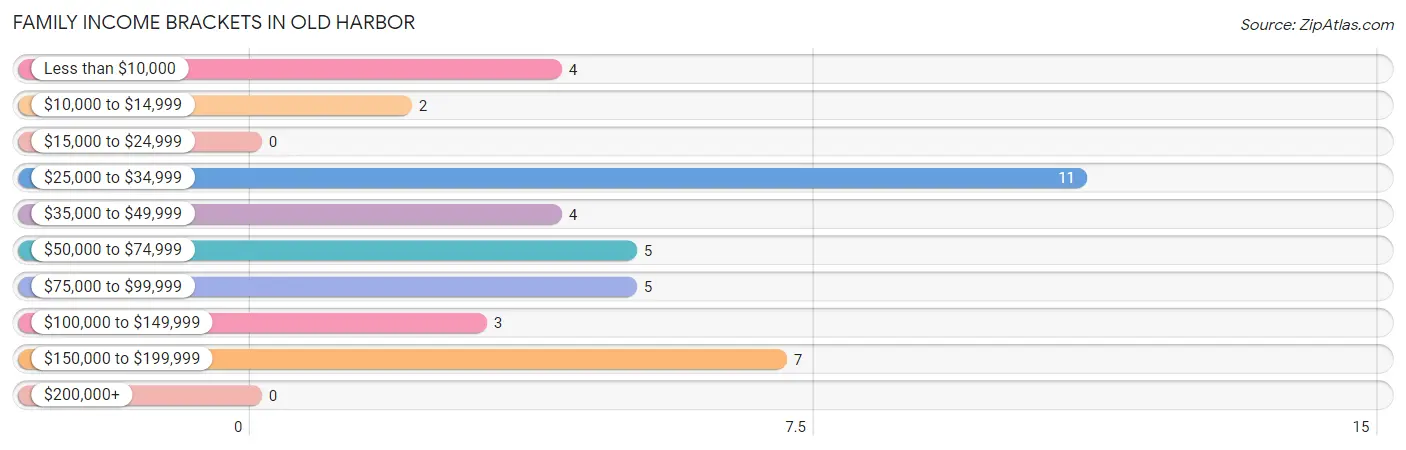
| Income Bracket | # Families | % Families |
| Less than $10,000 | 4 | 9.8% |
| $10,000 to $14,999 | 2 | 4.9% |
| $15,000 to $24,999 | 0 | 0.0% |
| $25,000 to $34,999 | 11 | 26.8% |
| $35,000 to $49,999 | 4 | 9.8% |
| $50,000 to $74,999 | 5 | 12.2% |
| $75,000 to $99,999 | 5 | 12.2% |
| $100,000 to $149,999 | 3 | 7.3% |
| $150,000 to $199,999 | 7 | 17.1% |
| $200,000+ | 0 | 0.0% |
Family Income by Famaliy Size in Old Harbor
| Income Bracket | # Families | Median Income |
| 2-Person Families | 17 (41.5%) | $0 |
| 3-Person Families | 9 (22.0%) | $0 |
| 4-Person Families | 7 (17.1%) | $0 |
| 5-Person Families | 8 (19.5%) | $0 |
| 6-Person Families | 0 (0.0%) | $0 |
| 7+ Person Families | 0 (0.0%) | $0 |
| Total | 41 (100.0%) | $0 |
Family Income by Number of Earners in Old Harbor
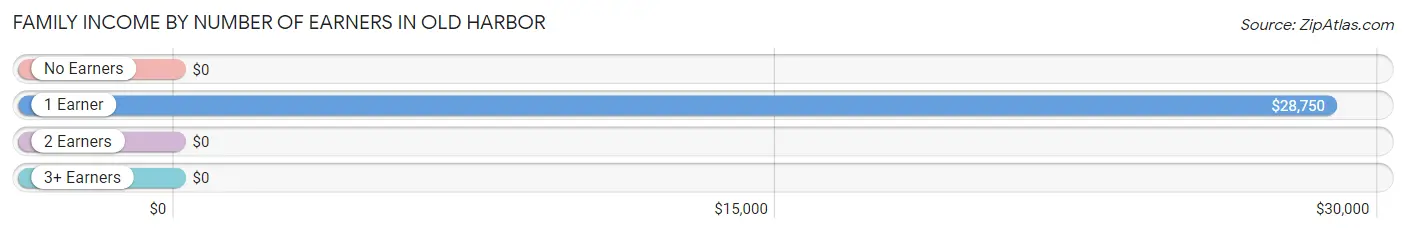
| Number of Earners | # Families | Median Income |
| No Earners | 0 (0.0%) | $0 |
| 1 Earner | 26 (63.4%) | $28,750 |
| 2 Earners | 12 (29.3%) | $0 |
| 3+ Earners | 3 (7.3%) | $0 |
| Total | 41 (100.0%) | $0 |
Household Income in Old Harbor
Household Income Brackets in Old Harbor
With 19 households falling in the category, the $35,000 to $49,999 income range is the most frequent in Old Harbor, accounting for 25.3% of all households.
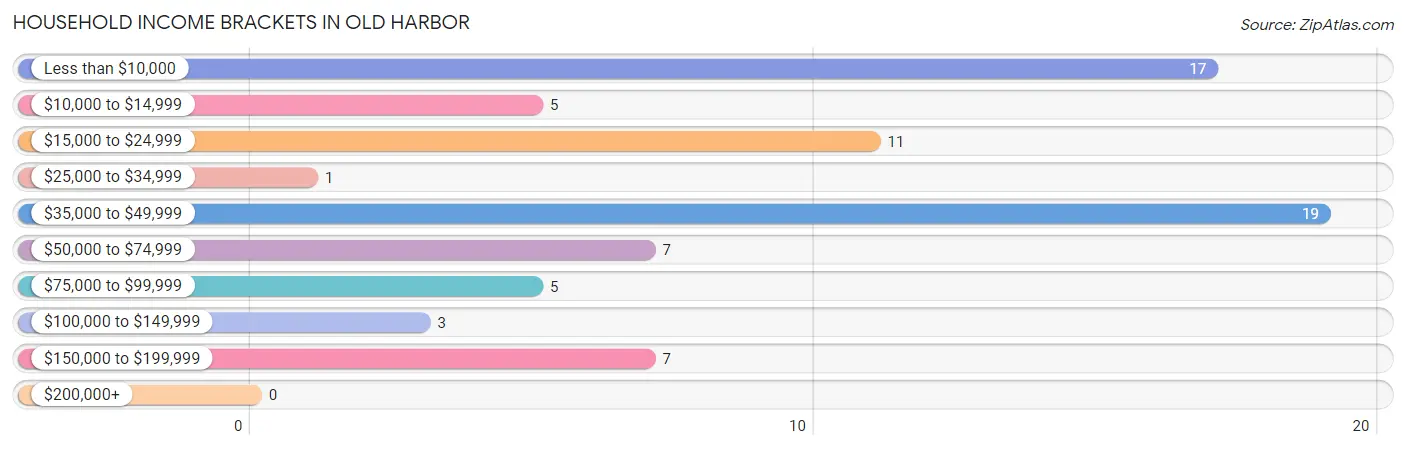
| Income Bracket | # Households | % Households |
| Less than $10,000 | 17 | 22.7% |
| $10,000 to $14,999 | 5 | 6.7% |
| $15,000 to $24,999 | 11 | 14.7% |
| $25,000 to $34,999 | 1 | 1.3% |
| $35,000 to $49,999 | 19 | 25.3% |
| $50,000 to $74,999 | 7 | 9.3% |
| $75,000 to $99,999 | 5 | 6.7% |
| $100,000 to $149,999 | 3 | 4.0% |
| $150,000 to $199,999 | 7 | 9.3% |
| $200,000+ | 0 | 0.0% |
Household Income by Householder Age in Old Harbor
The median household income in Old Harbor is $40,156, with the highest median household income of $42,031 found in the 15 to 24 years age bracket for the primary householder. A total of 13 households (17.3%) fall into this category. Meanwhile, the 25 to 44 years age bracket for the primary householder has the lowest median household income of $0, with 14 households (18.7%) in this group.
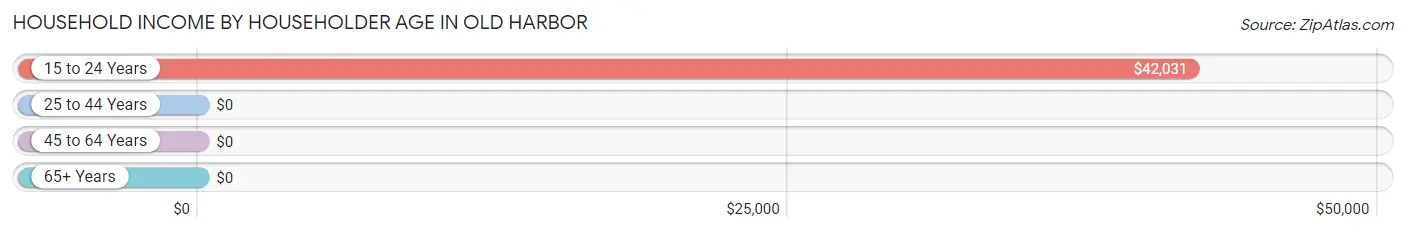
| Income Bracket | # Households | Median Income |
| 15 to 24 Years | 13 (17.3%) | $42,031 |
| 25 to 44 Years | 14 (18.7%) | $0 |
| 45 to 64 Years | 33 (44.0%) | $0 |
| 65+ Years | 15 (20.0%) | $0 |
| Total | 75 (100.0%) | $40,156 |
Poverty in Old Harbor
Income Below Poverty by Sex and Age in Old Harbor
With 49.4% poverty level for males and 38.6% for females among the residents of Old Harbor, 6 to 11 year old males and under 5 year old females are the most vulnerable to poverty, with 7 males (100.0%) and 1 females (100.0%) in their respective age groups living below the poverty level.
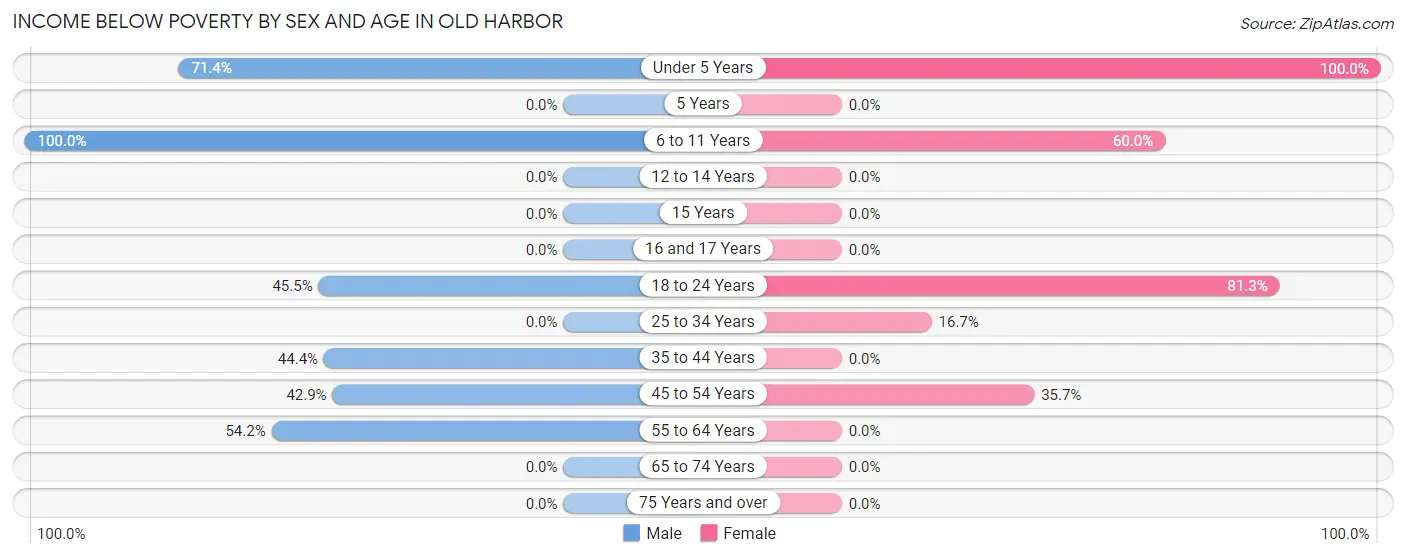
| Age Bracket | Male | Female |
| Under 5 Years | 10 (71.4%) | 1 (100.0%) |
| 5 Years | 0 (0.0%) | 0 (0.0%) |
| 6 to 11 Years | 7 (100.0%) | 6 (60.0%) |
| 12 to 14 Years | 0 (0.0%) | 0 (0.0%) |
| 15 Years | 0 (0.0%) | 0 (0.0%) |
| 16 and 17 Years | 0 (0.0%) | 0 (0.0%) |
| 18 to 24 Years | 5 (45.5%) | 13 (81.2%) |
| 25 to 34 Years | 0 (0.0%) | 2 (16.7%) |
| 35 to 44 Years | 4 (44.4%) | 0 (0.0%) |
| 45 to 54 Years | 3 (42.9%) | 5 (35.7%) |
| 55 to 64 Years | 13 (54.2%) | 0 (0.0%) |
| 65 to 74 Years | 0 (0.0%) | 0 (0.0%) |
| 75 Years and over | 0 (0.0%) | 0 (0.0%) |
| Total | 42 (49.4%) | 27 (38.6%) |
Income Above Poverty by Sex and Age in Old Harbor
According to the poverty statistics in Old Harbor, males aged 12 to 14 years and females aged 15 years are the age groups that are most secure financially, with 100.0% of males and 100.0% of females in these age groups living above the poverty line.
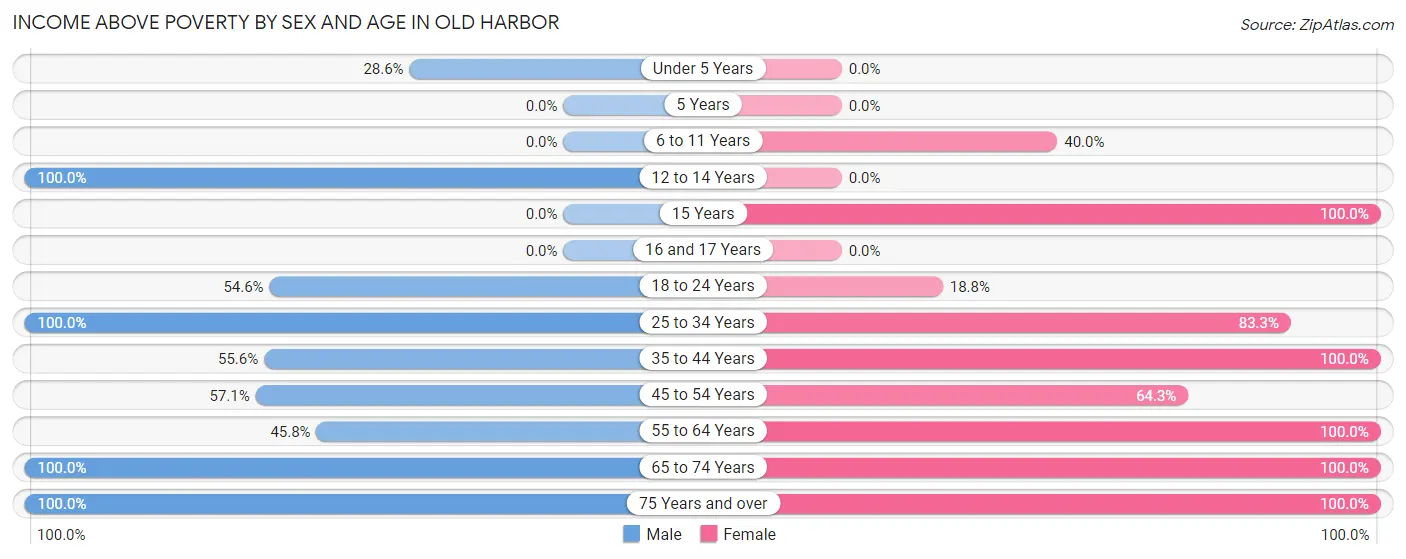
| Age Bracket | Male | Female |
| Under 5 Years | 4 (28.6%) | 0 (0.0%) |
| 5 Years | 0 (0.0%) | 0 (0.0%) |
| 6 to 11 Years | 0 (0.0%) | 4 (40.0%) |
| 12 to 14 Years | 1 (100.0%) | 0 (0.0%) |
| 15 Years | 0 (0.0%) | 3 (100.0%) |
| 16 and 17 Years | 0 (0.0%) | 0 (0.0%) |
| 18 to 24 Years | 6 (54.5%) | 3 (18.8%) |
| 25 to 34 Years | 5 (100.0%) | 10 (83.3%) |
| 35 to 44 Years | 5 (55.6%) | 2 (100.0%) |
| 45 to 54 Years | 4 (57.1%) | 9 (64.3%) |
| 55 to 64 Years | 11 (45.8%) | 4 (100.0%) |
| 65 to 74 Years | 6 (100.0%) | 5 (100.0%) |
| 75 Years and over | 1 (100.0%) | 3 (100.0%) |
| Total | 43 (50.6%) | 43 (61.4%) |
Income Below Poverty Among Married-Couple Families in Old Harbor
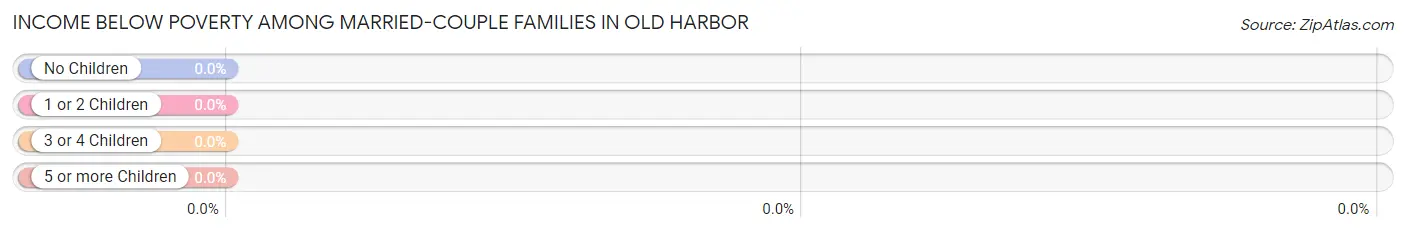
| Children | Above Poverty | Below Poverty |
| No Children | 8 (100.0%) | 0 (0.0%) |
| 1 or 2 Children | 7 (100.0%) | 0 (0.0%) |
| 3 or 4 Children | 0 (0.0%) | 0 (0.0%) |
| 5 or more Children | 0 (0.0%) | 0 (0.0%) |
| Total | 15 (100.0%) | 0 (0.0%) |
Income Below Poverty Among Single-Parent Households in Old Harbor
According to the poverty data in Old Harbor, 40.0% or 4 single-father households and 81.2% or 13 single-mother households are living below the poverty line. Among single-father households, those with 1 or 2 children have the highest poverty rate, with 4 households (57.1%) experiencing poverty. Likewise, among single-mother households, those with 3 or 4 children have the highest poverty rate, with 11 households (100.0%) falling below the poverty line.
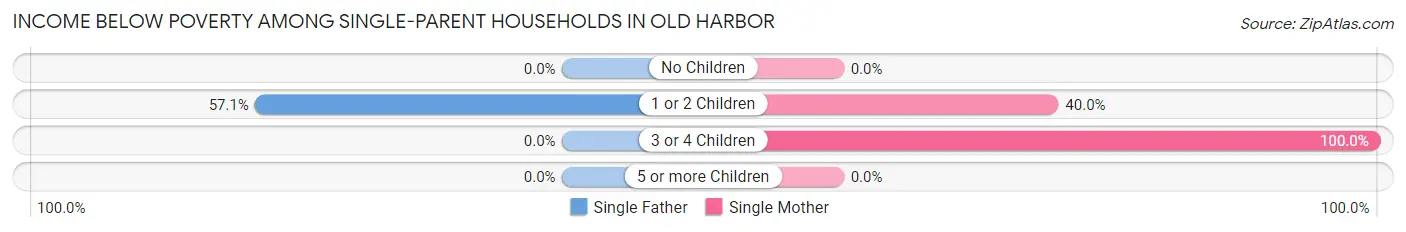
| Children | Single Father | Single Mother |
| No Children | 0 (0.0%) | 0 (0.0%) |
| 1 or 2 Children | 4 (57.1%) | 2 (40.0%) |
| 3 or 4 Children | 0 (0.0%) | 11 (100.0%) |
| 5 or more Children | 0 (0.0%) | 0 (0.0%) |
| Total | 4 (40.0%) | 13 (81.2%) |
Income Below Poverty Among Married-Couple vs Single-Parent Households in Old Harbor
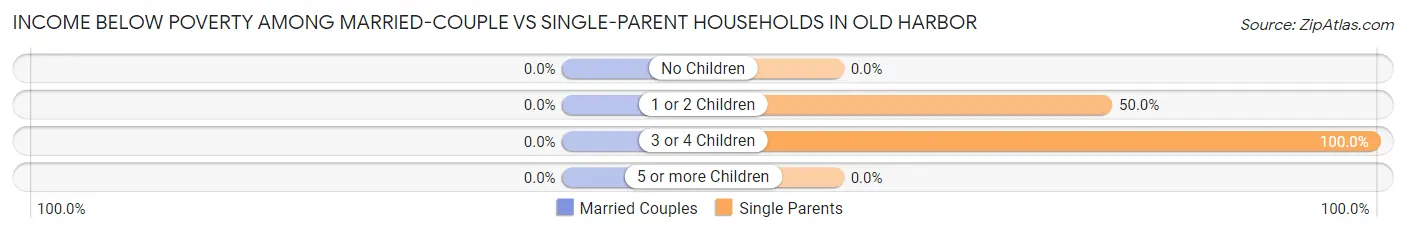
| Children | Married-Couple Families | Single-Parent Households |
| No Children | 0 (0.0%) | 0 (0.0%) |
| 1 or 2 Children | 0 (0.0%) | 6 (50.0%) |
| 3 or 4 Children | 0 (0.0%) | 11 (100.0%) |
| 5 or more Children | 0 (0.0%) | 0 (0.0%) |
| Total | 0 (0.0%) | 17 (65.4%) |
Race in Old Harbor
The most populous races in Old Harbor are Native / Alaskan (98 | 63.2%), White / Caucasian (29 | 18.7%), and Two or more Races (26 | 16.8%).
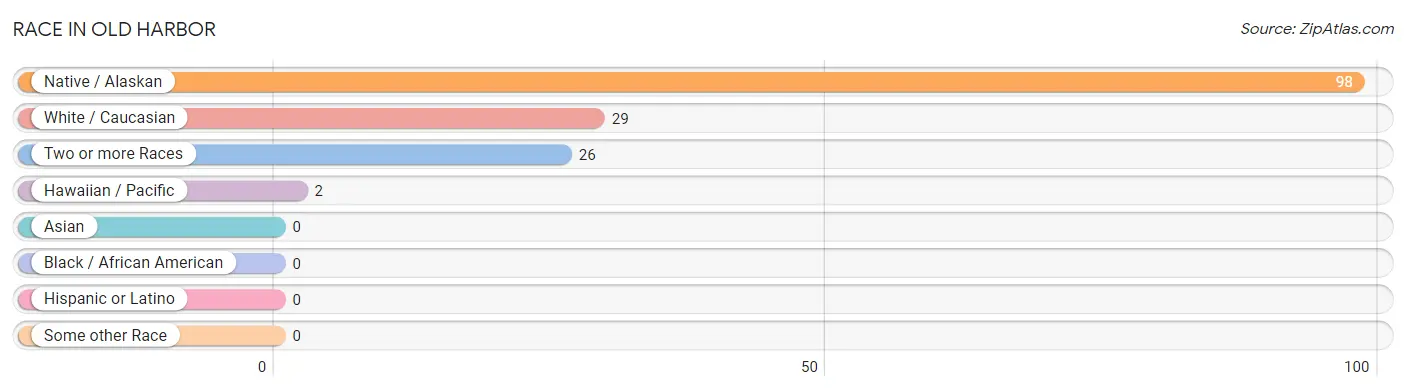
| Race | # Population | % Population |
| Asian | 0 | 0.0% |
| Black / African American | 0 | 0.0% |
| Hawaiian / Pacific | 2 | 1.3% |
| Hispanic or Latino | 0 | 0.0% |
| Native / Alaskan | 98 | 63.2% |
| White / Caucasian | 29 | 18.7% |
| Two or more Races | 26 | 16.8% |
| Some other Race | 0 | 0.0% |
| Total | 155 | 100.0% |
Ancestry in Old Harbor
The most populous ancestries reported in Old Harbor are Aleut (97 | 62.6%), German (17 | 11.0%), Alaska Native (11 | 7.1%), Yup'ik (11 | 7.1%), and Norwegian (10 | 6.5%), together accounting for 94.2% of all Old Harbor residents.
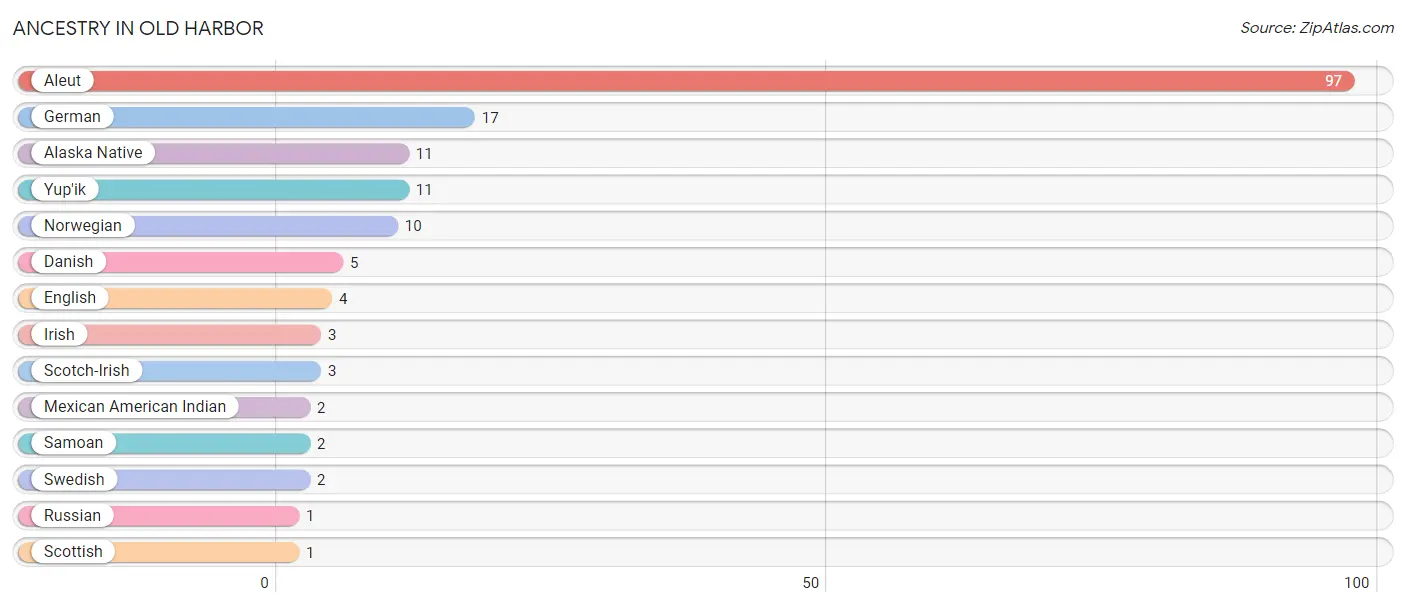
| Ancestry | # Population | % Population |
| Alaska Native | 11 | 7.1% |
| Aleut | 97 | 62.6% |
| Danish | 5 | 3.2% |
| English | 4 | 2.6% |
| German | 17 | 11.0% |
| Irish | 3 | 1.9% |
| Mexican American Indian | 2 | 1.3% |
| Norwegian | 10 | 6.5% |
| Russian | 1 | 0.6% |
| Samoan | 2 | 1.3% |
| Scotch-Irish | 3 | 1.9% |
| Scottish | 1 | 0.6% |
| Swedish | 2 | 1.3% |
| Yup'ik | 11 | 7.1% | View All 14 Rows |
Immigrants in Old Harbor
The most numerous immigrant groups reported in Old Harbor came from , and Oceania (2 | 1.3%), together accounting for 1.3% of all Old Harbor residents.

| Immigration Origin | # Population | % Population |
| Oceania | 2 | 1.3% | View All 1 Rows |
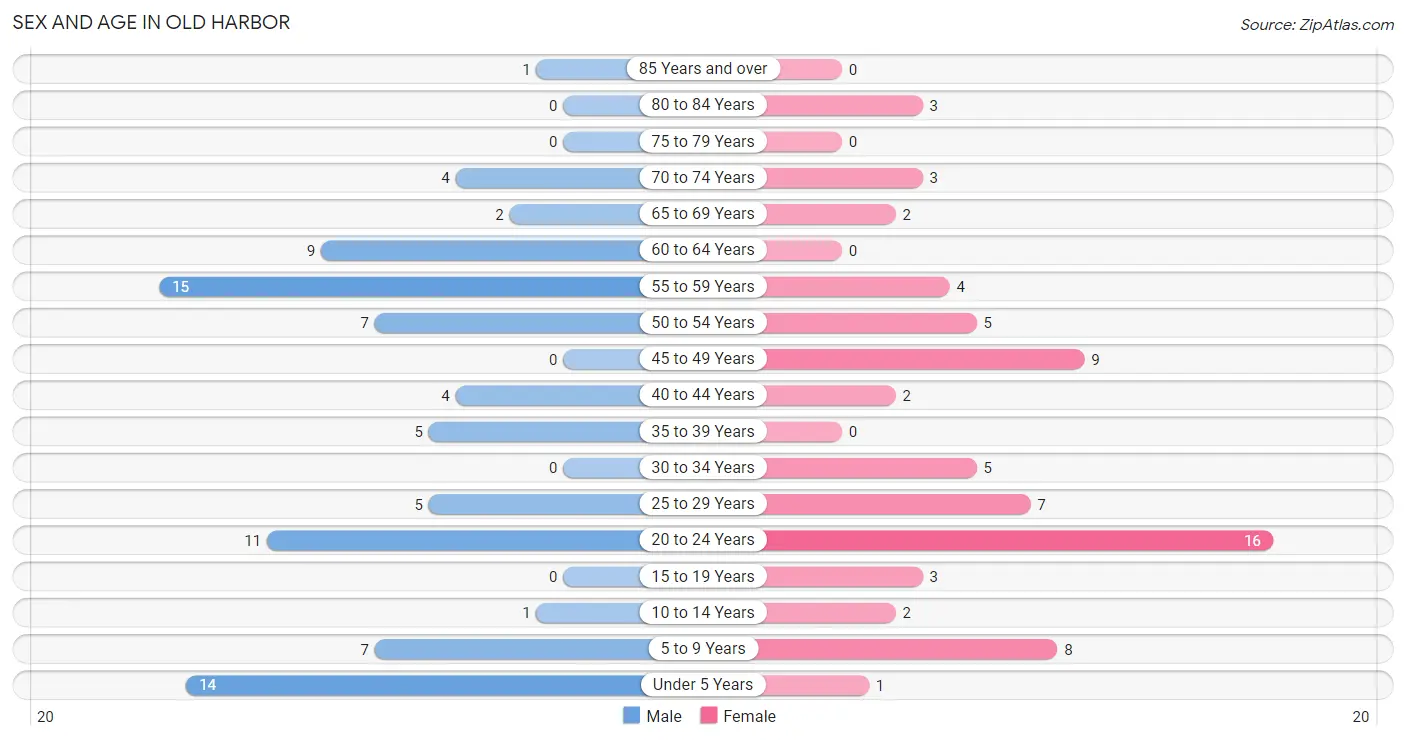
Sex and Age in Old Harbor
Sex and Age in Old Harbor
The most populous age groups in Old Harbor are 55 to 59 Years (15 | 17.6%) for men and 20 to 24 Years (16 | 22.9%) for women.
| Age Bracket | Male | Female |
| Under 5 Years | 14 (16.5%) | 1 (1.4%) |
| 5 to 9 Years | 7 (8.2%) | 8 (11.4%) |
| 10 to 14 Years | 1 (1.2%) | 2 (2.9%) |
| 15 to 19 Years | 0 (0.0%) | 3 (4.3%) |
| 20 to 24 Years | 11 (12.9%) | 16 (22.9%) |
| 25 to 29 Years | 5 (5.9%) | 7 (10.0%) |
| 30 to 34 Years | 0 (0.0%) | 5 (7.1%) |
| 35 to 39 Years | 5 (5.9%) | 0 (0.0%) |
| 40 to 44 Years | 4 (4.7%) | 2 (2.9%) |
| 45 to 49 Years | 0 (0.0%) | 9 (12.9%) |
| 50 to 54 Years | 7 (8.2%) | 5 (7.1%) |
| 55 to 59 Years | 15 (17.6%) | 4 (5.7%) |
| 60 to 64 Years | 9 (10.6%) | 0 (0.0%) |
| 65 to 69 Years | 2 (2.4%) | 2 (2.9%) |
| 70 to 74 Years | 4 (4.7%) | 3 (4.3%) |
| 75 to 79 Years | 0 (0.0%) | 0 (0.0%) |
| 80 to 84 Years | 0 (0.0%) | 3 (4.3%) |
| 85 Years and over | 1 (1.2%) | 0 (0.0%) |
| Total | 85 (100.0%) | 70 (100.0%) |
Families and Households in Old Harbor
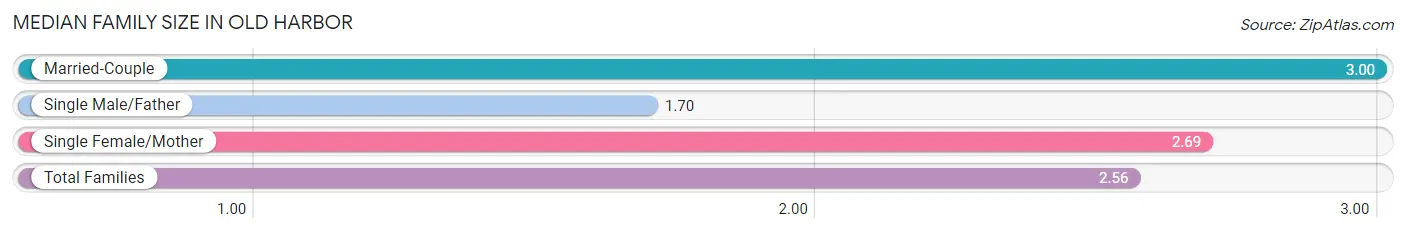
Median Family Size in Old Harbor
The median family size in Old Harbor is 2.56 persons per family, with married-couple families (15 | 36.6%) accounting for the largest median family size of 3 persons per family. On the other hand, single male/father families (10 | 24.4%) represent the smallest median family size with 1.70 persons per family.
| Family Type | # Families | Family Size |
| Married-Couple | 15 (36.6%) | 3.00 |
| Single Male/Father | 10 (24.4%) | 1.70 |
| Single Female/Mother | 16 (39.0%) | 2.69 |
| Total Families | 41 (100.0%) | 2.56 |
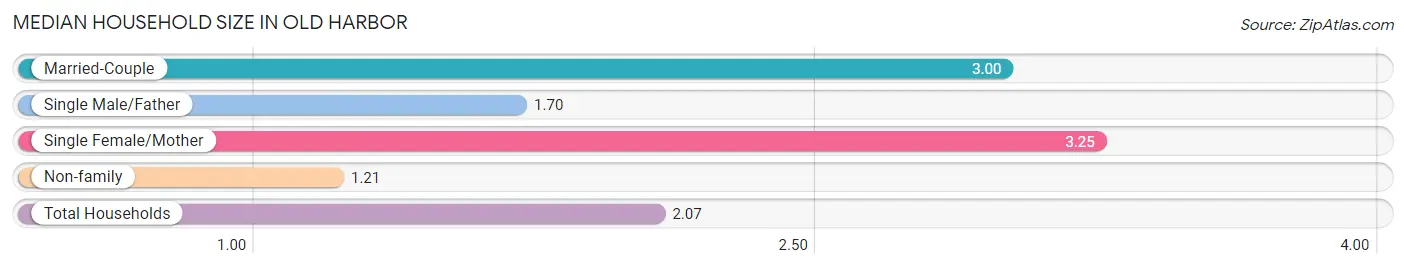
Median Household Size in Old Harbor
The median household size in Old Harbor is 2.07 persons per household, with single female/mother households (16 | 21.3%) accounting for the largest median household size of 3.25 persons per household. non-family households (34 | 45.3%) represent the smallest median household size with 1.21 persons per household.
| Household Type | # Households | Household Size |
| Married-Couple | 15 (20.0%) | 3.00 |
| Single Male/Father | 10 (13.3%) | 1.70 |
| Single Female/Mother | 16 (21.3%) | 3.25 |
| Non-family | 34 (45.3%) | 1.21 |
| Total Households | 75 (100.0%) | 2.07 |
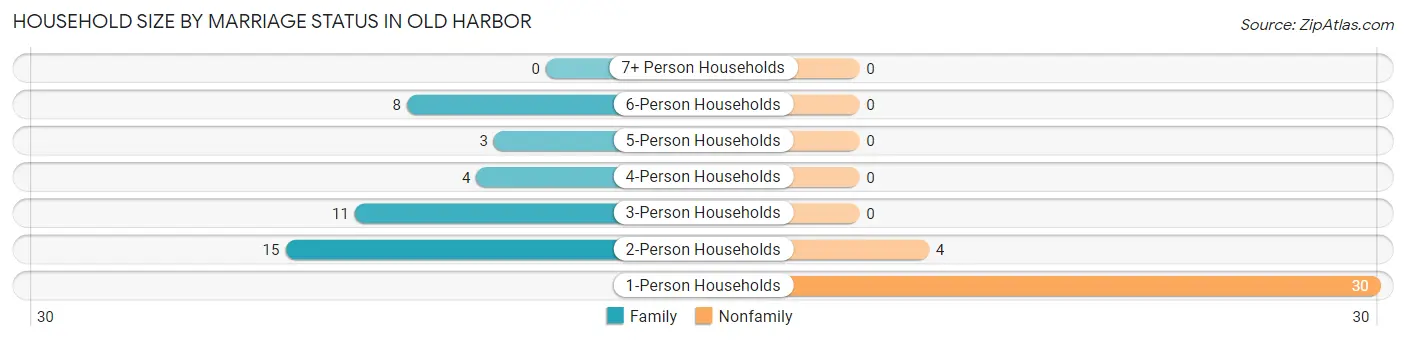
Household Size by Marriage Status in Old Harbor
Out of a total of 75 households in Old Harbor, 41 (54.7%) are family households, while 34 (45.3%) are nonfamily households. The most numerous type of family households are 2-person households, comprising 15, and the most common type of nonfamily households are 1-person households, comprising 30.
| Household Size | Family Households | Nonfamily Households |
| 1-Person Households | - | 30 (40.0%) |
| 2-Person Households | 15 (20.0%) | 4 (5.3%) |
| 3-Person Households | 11 (14.7%) | 0 (0.0%) |
| 4-Person Households | 4 (5.3%) | 0 (0.0%) |
| 5-Person Households | 3 (4.0%) | 0 (0.0%) |
| 6-Person Households | 8 (10.7%) | 0 (0.0%) |
| 7+ Person Households | 0 (0.0%) | 0 (0.0%) |
| Total | 41 (54.7%) | 34 (45.3%) |
Female Fertility in Old Harbor
Fertility by Age in Old Harbor
Average fertility rate in Old Harbor is 227.0 births per 1,000 women. Women in the age bracket of 20 to 34 years have the highest fertility rate with 357.0 births per 1,000 women. Women in the age bracket of 20 to 34 years acount for 100.0% of all women with births.
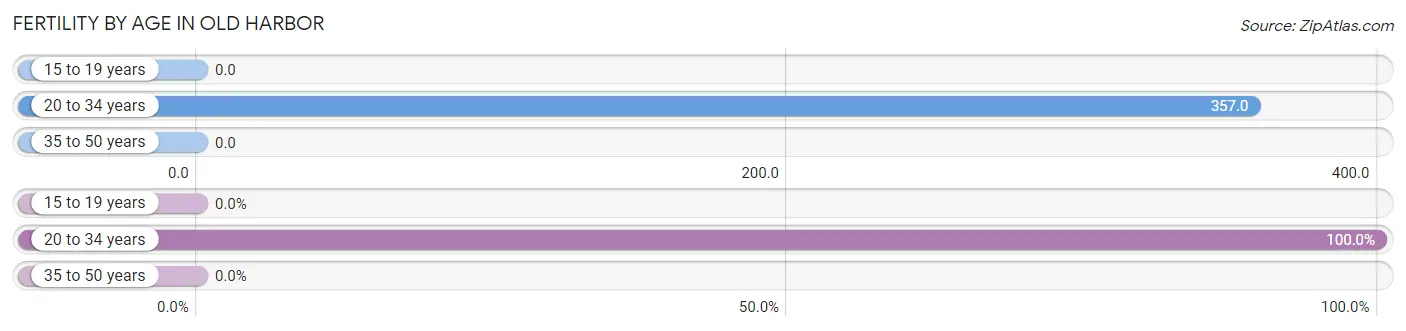
| Age Bracket | Women with Births | Births / 1,000 Women |
| 15 to 19 years | 0 (0.0%) | 0.0 |
| 20 to 34 years | 10 (100.0%) | 357.0 |
| 35 to 50 years | 0 (0.0%) | 0.0 |
| Total | 10 (100.0%) | 227.0 |
Fertility by Age by Marriage Status in Old Harbor
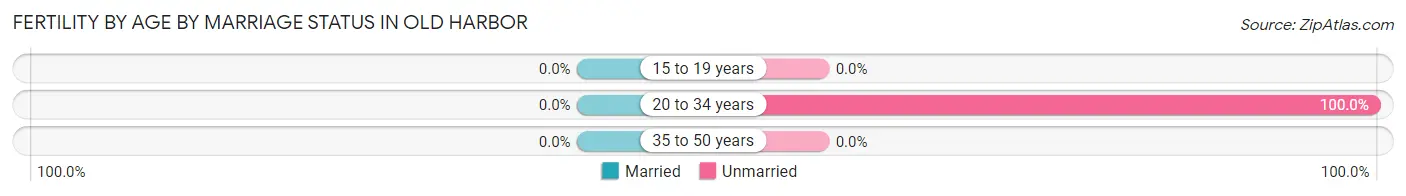
| Age Bracket | Married | Unmarried |
| 15 to 19 years | 0 (0.0%) | 0 (0.0%) |
| 20 to 34 years | 0 (0.0%) | 10 (100.0%) |
| 35 to 50 years | 0 (0.0%) | 0 (0.0%) |
| Total | 0 (0.0%) | 10 (100.0%) |
Fertility by Education in Old Harbor
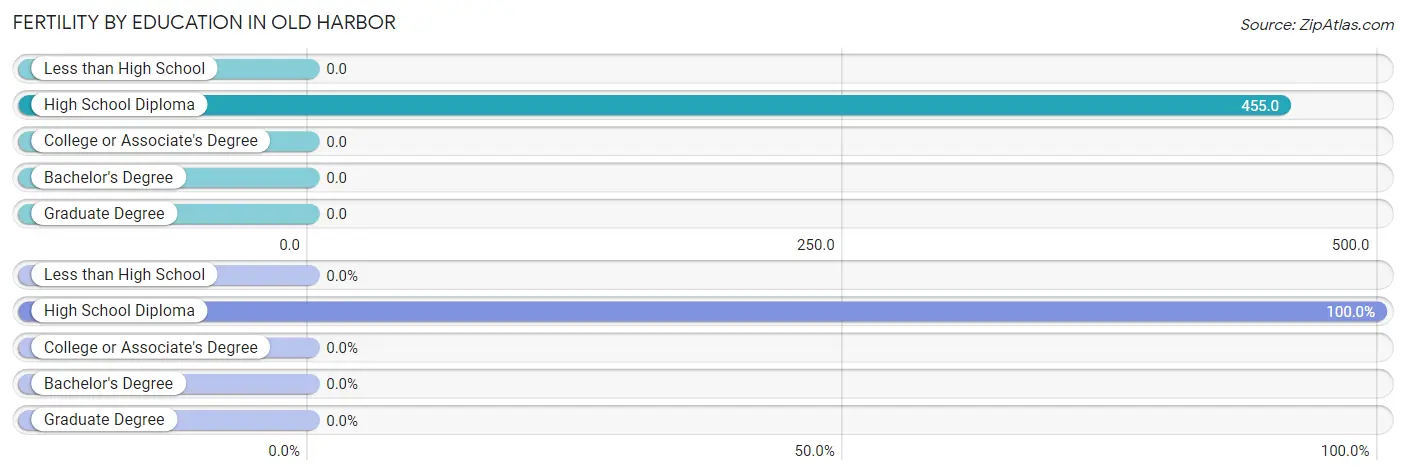
| Educational Attainment | Women with Births | Births / 1,000 Women |
| Less than High School | 0 (0.0%) | 0.0 |
| High School Diploma | 10 (100.0%) | 455.0 |
| College or Associate's Degree | 0 (0.0%) | 0.0 |
| Bachelor's Degree | 0 (0.0%) | 0.0 |
| Graduate Degree | 0 (0.0%) | 0.0 |
| Total | 10 (100.0%) | 227.0 |
Fertility by Education by Marriage Status in Old Harbor
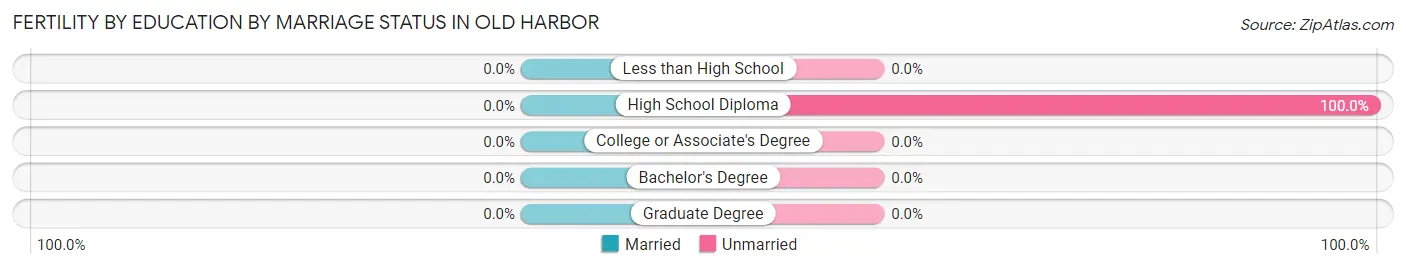
| Educational Attainment | Married | Unmarried |
| Less than High School | 0 (0.0%) | 0 (0.0%) |
| High School Diploma | 0 (0.0%) | 10 (100.0%) |
| College or Associate's Degree | 0 (0.0%) | 0 (0.0%) |
| Bachelor's Degree | 0 (0.0%) | 0 (0.0%) |
| Graduate Degree | 0 (0.0%) | 0 (0.0%) |
| Total | 0 (0.0%) | 10 (100.0%) |
Employment Characteristics in Old Harbor
Employment by Class of Employer in Old Harbor
Among the 54 employed individuals in Old Harbor, local government employees (18 | 33.3%), self-employed (not incorporated) (10 | 18.5%), and state government employees (9 | 16.7%) make up the most common classes of employment.
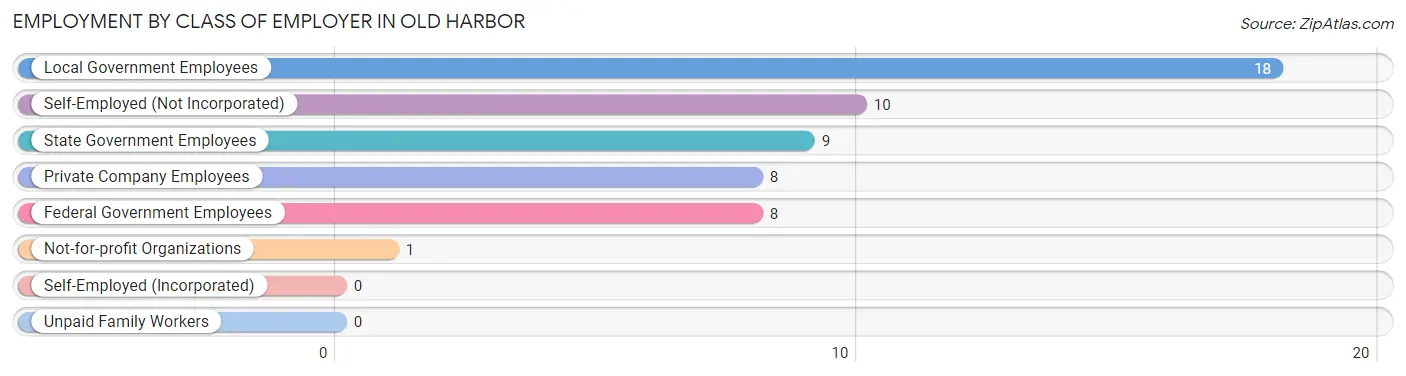
| Employer Class | # Employees | % Employees |
| Private Company Employees | 8 | 14.8% |
| Self-Employed (Incorporated) | 0 | 0.0% |
| Self-Employed (Not Incorporated) | 10 | 18.5% |
| Not-for-profit Organizations | 1 | 1.8% |
| Local Government Employees | 18 | 33.3% |
| State Government Employees | 9 | 16.7% |
| Federal Government Employees | 8 | 14.8% |
| Unpaid Family Workers | 0 | 0.0% |
| Total | 54 | 100.0% |
Employment Status by Age in Old Harbor
According to the labor force statistics for Old Harbor, out of the total population over 16 years of age (119), 65.5% or 78 individuals are in the labor force, with 28.2% or 22 of them unemployed. The age group with the highest labor force participation rate is 25 to 29 years, with 100.0% or 12 individuals in the labor force. Within the labor force, the 30 to 34 years age range has the highest percentage of unemployed individuals, with 100.0% or 2 of them being unemployed.
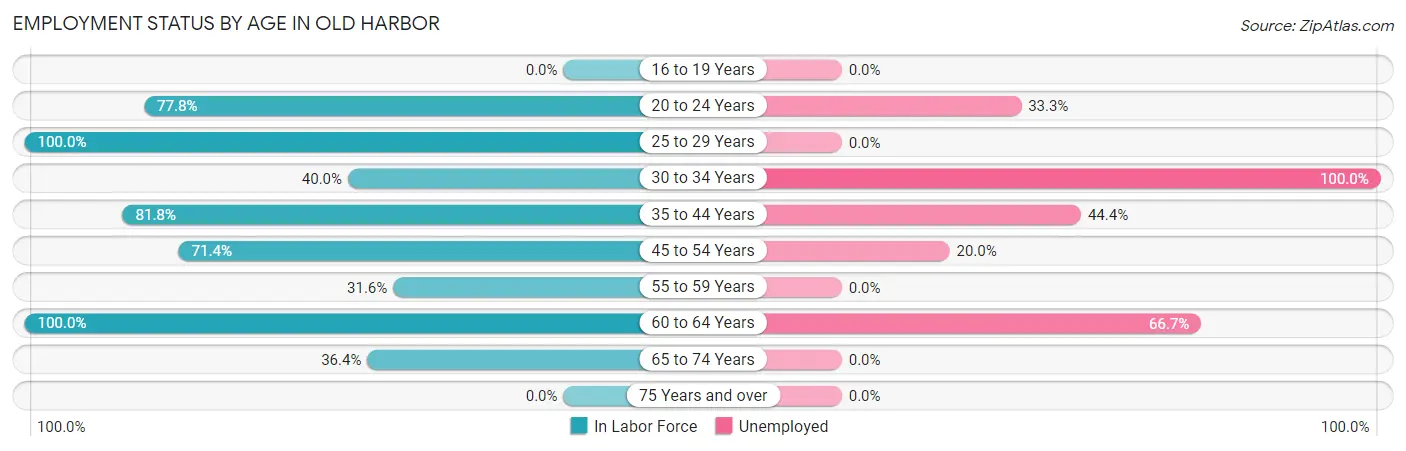
| Age Bracket | In Labor Force | Unemployed |
| 16 to 19 Years | 0 (0.0%) | 0 (0.0%) |
| 20 to 24 Years | 21 (77.8%) | 7 (33.3%) |
| 25 to 29 Years | 12 (100.0%) | 0 (0.0%) |
| 30 to 34 Years | 2 (40.0%) | 2 (100.0%) |
| 35 to 44 Years | 9 (81.8%) | 4 (44.4%) |
| 45 to 54 Years | 15 (71.4%) | 3 (20.0%) |
| 55 to 59 Years | 6 (31.6%) | 0 (0.0%) |
| 60 to 64 Years | 9 (100.0%) | 6 (66.7%) |
| 65 to 74 Years | 4 (36.4%) | 0 (0.0%) |
| 75 Years and over | 0 (0.0%) | 0 (0.0%) |
| Total | 78 (65.5%) | 22 (28.2%) |
Employment Status by Educational Attainment in Old Harbor
According to labor force statistics for Old Harbor, 68.8% of individuals (53) out of the total population between 25 and 64 years of age (77) are in the labor force, with 28.3% or 15 of them being unemployed. The group with the highest labor force participation rate are those with the educational attainment of bachelor's degree or higher, with 100.0% or 7 individuals in the labor force. Within the labor force, individuals with less than high school education have the highest percentage of unemployment, with 100.0% or 3 of them being unemployed.
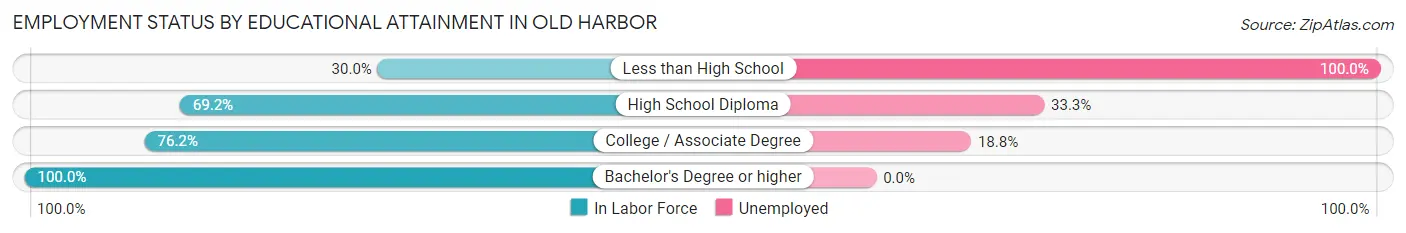
| Educational Attainment | In Labor Force | Unemployed |
| Less than High School | 3 (30.0%) | 10 (100.0%) |
| High School Diploma | 27 (69.2%) | 13 (33.3%) |
| College / Associate Degree | 16 (76.2%) | 4 (18.8%) |
| Bachelor's Degree or higher | 7 (100.0%) | 0 (0.0%) |
| Total | 53 (68.8%) | 22 (28.3%) |
Employment Occupations by Sex in Old Harbor
Management, Business, Science and Arts Occupations
The most common Management, Business, Science and Arts occupations in Old Harbor are Management (2 | 3.6%), Community & Social Service (2 | 3.6%), Education, Arts & Media (1 | 1.8%), and Education Instruction & Library (1 | 1.8%).
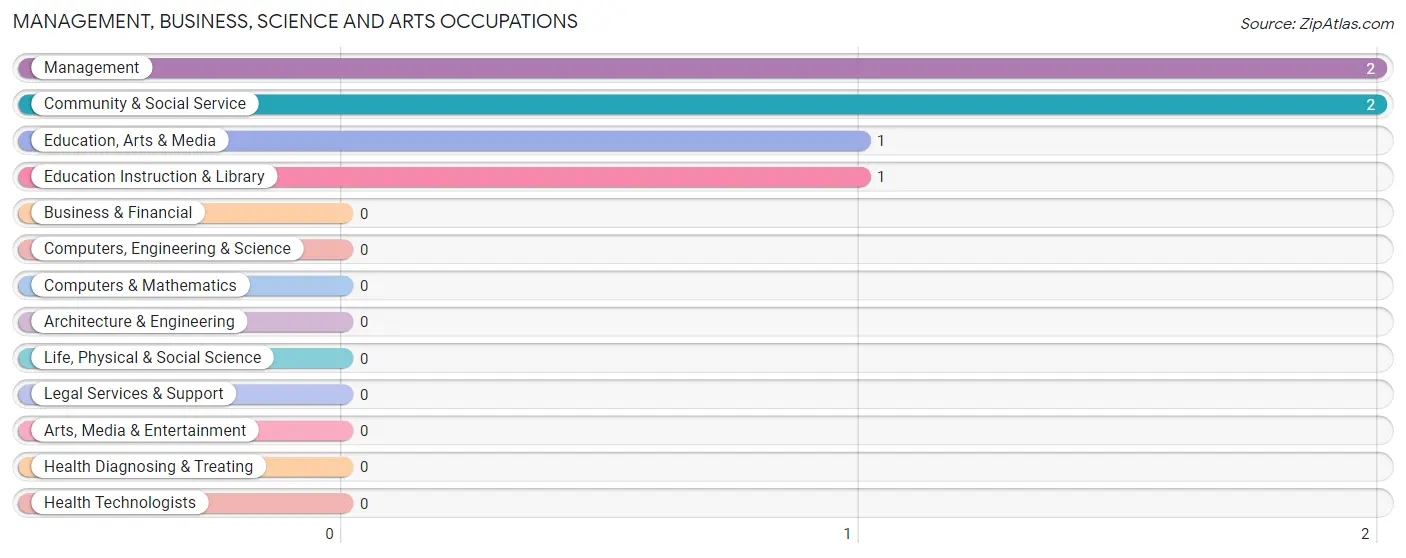
Management, Business, Science and Arts Occupations by Sex
Within the Management, Business, Science and Arts occupations in Old Harbor, the most male-oriented occupations are Education, Arts & Media (100.0%), and Community & Social Service (50.0%), while the most female-oriented occupations are Management (100.0%), Education Instruction & Library (100.0%), and Community & Social Service (50.0%).
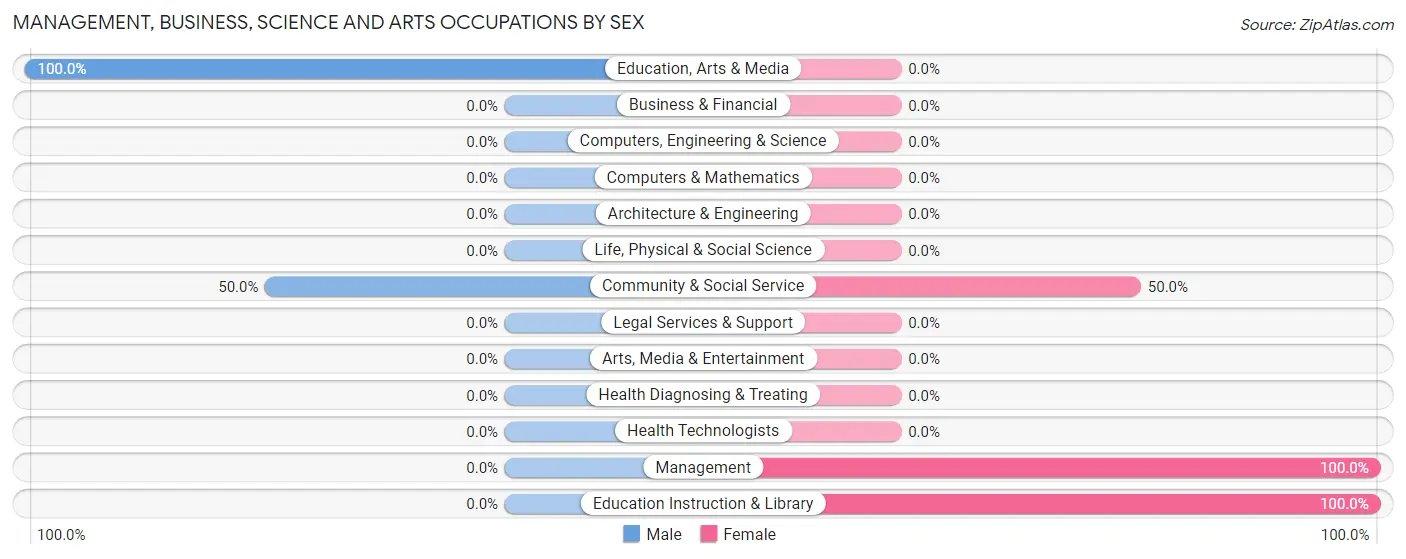
| Occupation | Male | Female |
| Management | 0 (0.0%) | 2 (100.0%) |
| Business & Financial | 0 (0.0%) | 0 (0.0%) |
| Computers, Engineering & Science | 0 (0.0%) | 0 (0.0%) |
| Computers & Mathematics | 0 (0.0%) | 0 (0.0%) |
| Architecture & Engineering | 0 (0.0%) | 0 (0.0%) |
| Life, Physical & Social Science | 0 (0.0%) | 0 (0.0%) |
| Community & Social Service | 1 (50.0%) | 1 (50.0%) |
| Education, Arts & Media | 1 (100.0%) | 0 (0.0%) |
| Legal Services & Support | 0 (0.0%) | 0 (0.0%) |
| Education Instruction & Library | 0 (0.0%) | 1 (100.0%) |
| Arts, Media & Entertainment | 0 (0.0%) | 0 (0.0%) |
| Health Diagnosing & Treating | 0 (0.0%) | 0 (0.0%) |
| Health Technologists | 0 (0.0%) | 0 (0.0%) |
| Total (Category) | 1 (25.0%) | 3 (75.0%) |
| Total (Overall) | 28 (50.0%) | 28 (50.0%) |
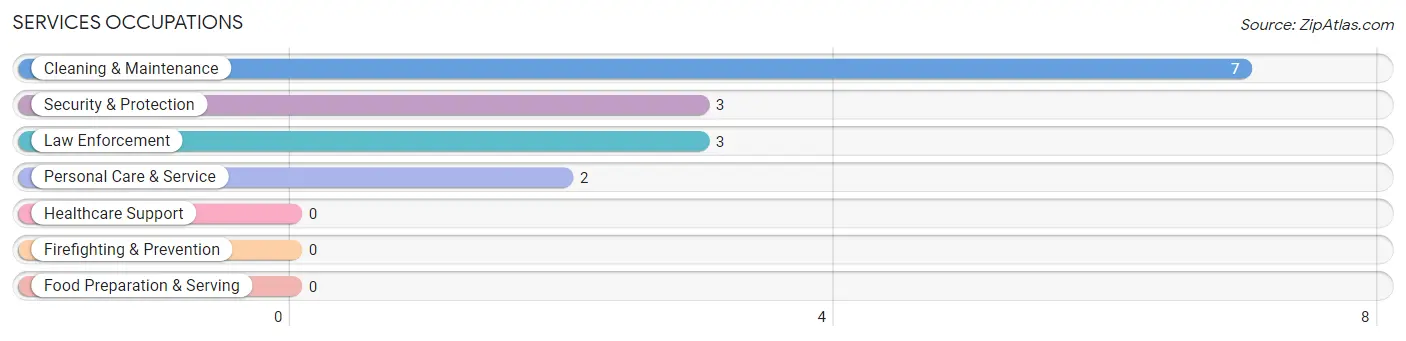
Services Occupations
The most common Services occupations in Old Harbor are Cleaning & Maintenance (7 | 12.5%), Security & Protection (3 | 5.4%), Law Enforcement (3 | 5.4%), and Personal Care & Service (2 | 3.6%).
Services Occupations by Sex
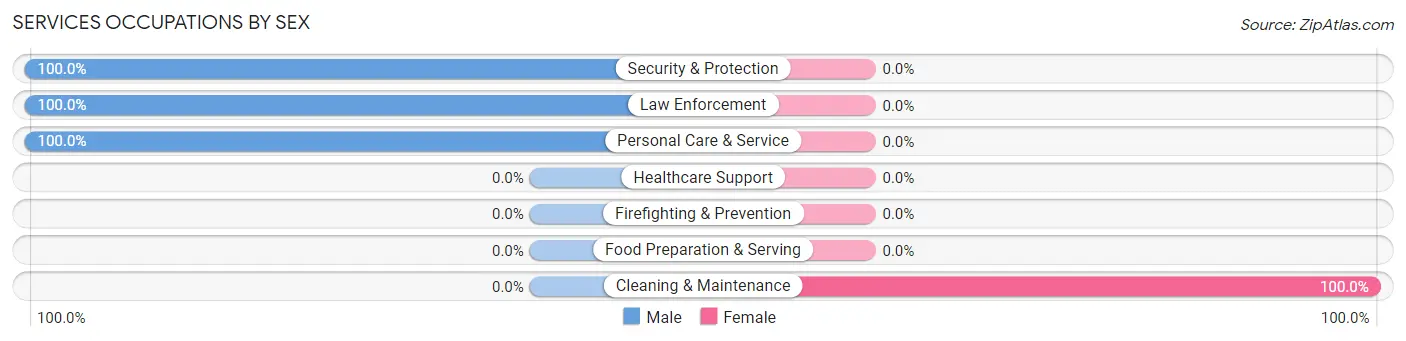
| Occupation | Male | Female |
| Healthcare Support | 0 (0.0%) | 0 (0.0%) |
| Security & Protection | 3 (100.0%) | 0 (0.0%) |
| Firefighting & Prevention | 0 (0.0%) | 0 (0.0%) |
| Law Enforcement | 3 (100.0%) | 0 (0.0%) |
| Food Preparation & Serving | 0 (0.0%) | 0 (0.0%) |
| Cleaning & Maintenance | 0 (0.0%) | 7 (100.0%) |
| Personal Care & Service | 2 (100.0%) | 0 (0.0%) |
| Total (Category) | 5 (41.7%) | 7 (58.3%) |
| Total (Overall) | 28 (50.0%) | 28 (50.0%) |
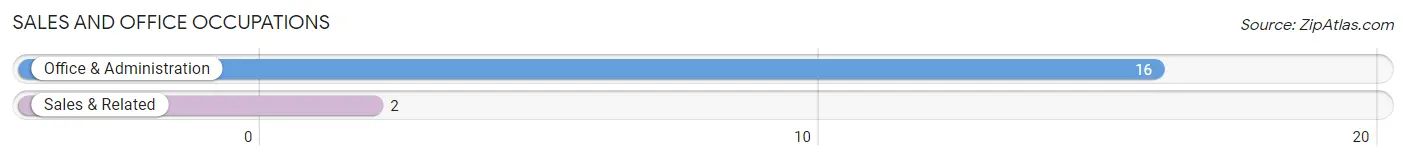
Sales and Office Occupations
The most common Sales and Office occupations in Old Harbor are Office & Administration (16 | 28.6%), and Sales & Related (2 | 3.6%).
Sales and Office Occupations by Sex
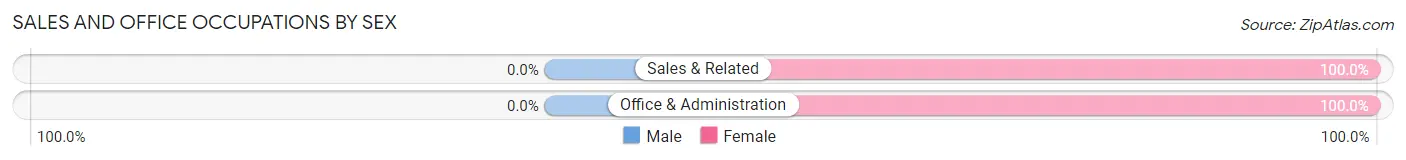
| Occupation | Male | Female |
| Sales & Related | 0 (0.0%) | 2 (100.0%) |
| Office & Administration | 0 (0.0%) | 16 (100.0%) |
| Total (Category) | 0 (0.0%) | 18 (100.0%) |
| Total (Overall) | 28 (50.0%) | 28 (50.0%) |
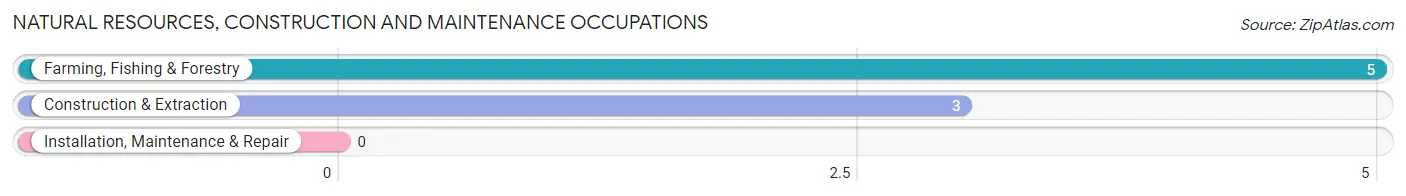
Natural Resources, Construction and Maintenance Occupations
The most common Natural Resources, Construction and Maintenance occupations in Old Harbor are Farming, Fishing & Forestry (5 | 8.9%), and Construction & Extraction (3 | 5.4%).
Natural Resources, Construction and Maintenance Occupations by Sex
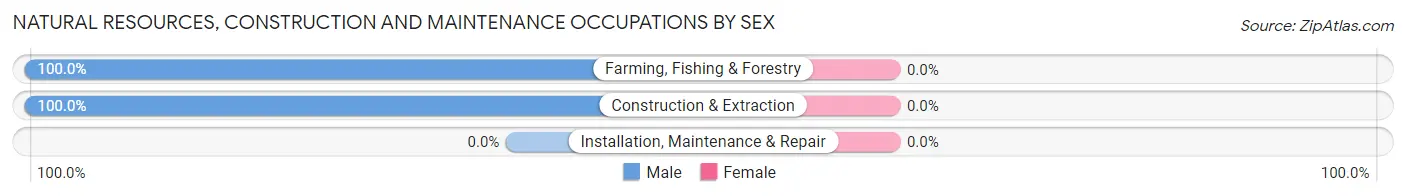
| Occupation | Male | Female |
| Farming, Fishing & Forestry | 5 (100.0%) | 0 (0.0%) |
| Construction & Extraction | 3 (100.0%) | 0 (0.0%) |
| Installation, Maintenance & Repair | 0 (0.0%) | 0 (0.0%) |
| Total (Category) | 8 (100.0%) | 0 (0.0%) |
| Total (Overall) | 28 (50.0%) | 28 (50.0%) |
Production, Transportation and Moving Occupations
The most common Production, Transportation and Moving occupations in Old Harbor are Transportation (6 | 10.7%), Production (4 | 7.1%), and Material Moving (4 | 7.1%).
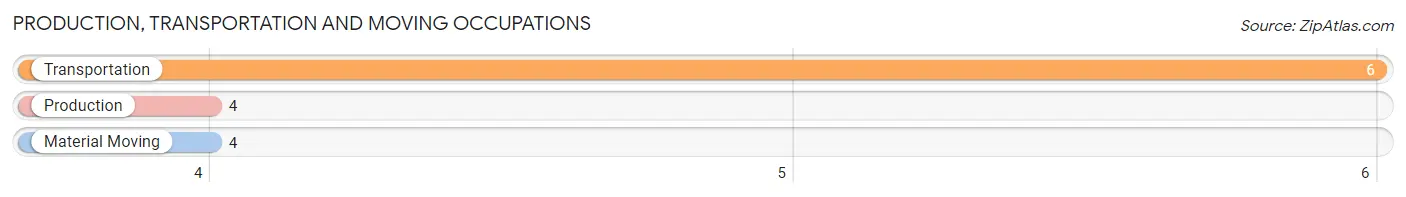
Production, Transportation and Moving Occupations by Sex
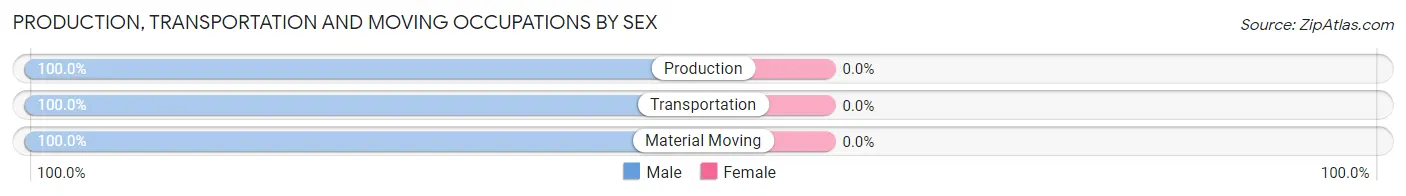
| Occupation | Male | Female |
| Production | 4 (100.0%) | 0 (0.0%) |
| Transportation | 6 (100.0%) | 0 (0.0%) |
| Material Moving | 4 (100.0%) | 0 (0.0%) |
| Total (Category) | 14 (100.0%) | 0 (0.0%) |
| Total (Overall) | 28 (50.0%) | 28 (50.0%) |
Employment Industries by Sex in Old Harbor
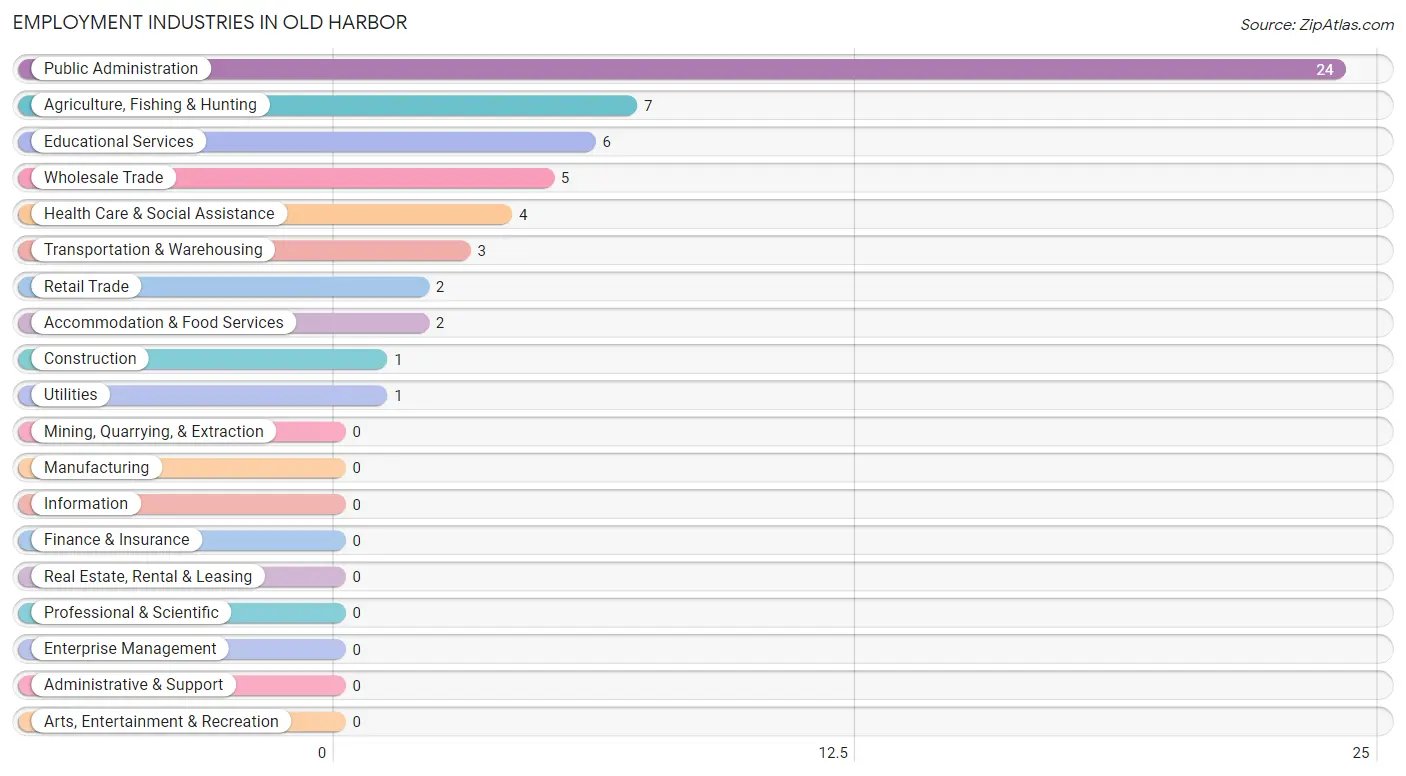
Employment Industries in Old Harbor
The major employment industries in Old Harbor include Public Administration (24 | 42.9%), Agriculture, Fishing & Hunting (7 | 12.5%), Educational Services (6 | 10.7%), Wholesale Trade (5 | 8.9%), and Health Care & Social Assistance (4 | 7.1%).
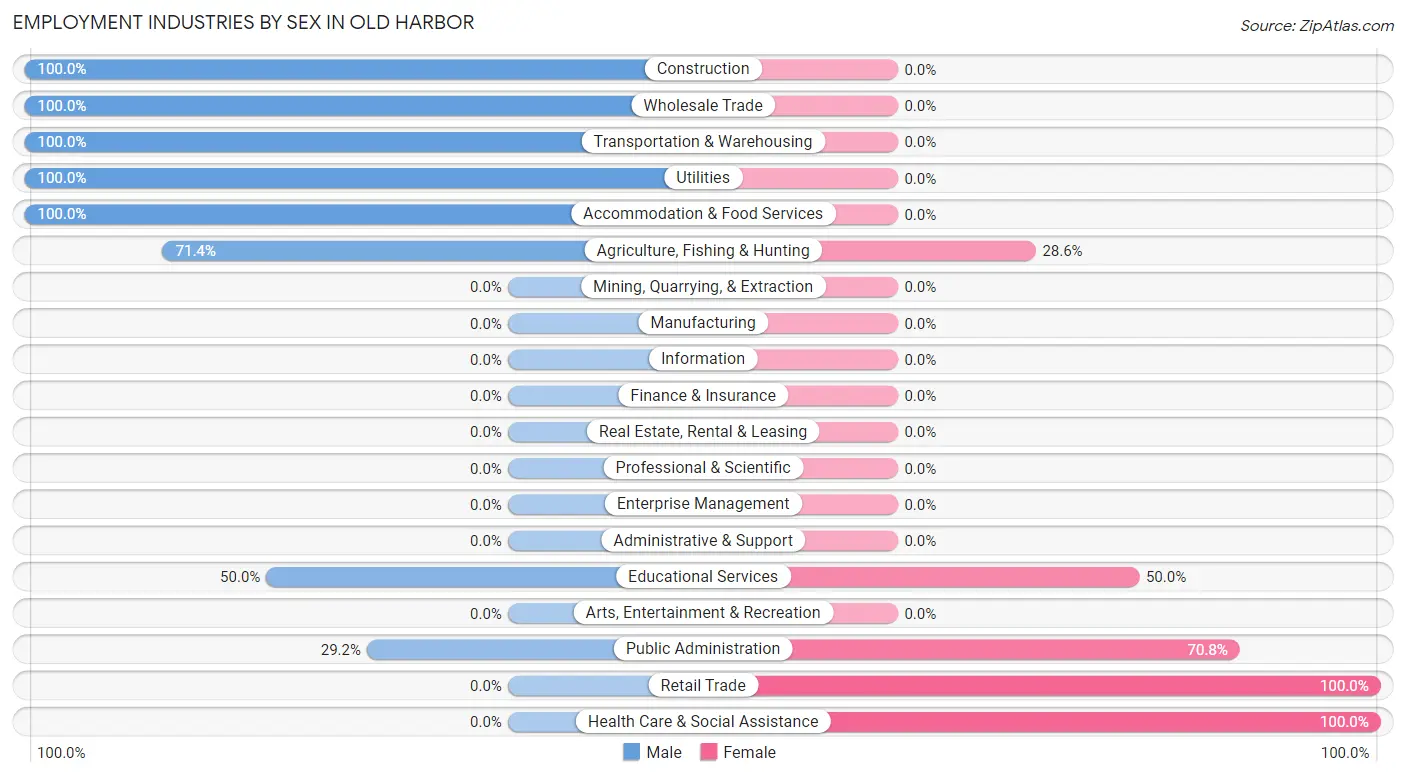
Employment Industries by Sex in Old Harbor
The Old Harbor industries that see more men than women are Construction (100.0%), Wholesale Trade (100.0%), and Transportation & Warehousing (100.0%), whereas the industries that tend to have a higher number of women are Retail Trade (100.0%), Health Care & Social Assistance (100.0%), and Public Administration (70.8%).
| Industry | Male | Female |
| Agriculture, Fishing & Hunting | 5 (71.4%) | 2 (28.6%) |
| Mining, Quarrying, & Extraction | 0 (0.0%) | 0 (0.0%) |
| Construction | 1 (100.0%) | 0 (0.0%) |
| Manufacturing | 0 (0.0%) | 0 (0.0%) |
| Wholesale Trade | 5 (100.0%) | 0 (0.0%) |
| Retail Trade | 0 (0.0%) | 2 (100.0%) |
| Transportation & Warehousing | 3 (100.0%) | 0 (0.0%) |
| Utilities | 1 (100.0%) | 0 (0.0%) |
| Information | 0 (0.0%) | 0 (0.0%) |
| Finance & Insurance | 0 (0.0%) | 0 (0.0%) |
| Real Estate, Rental & Leasing | 0 (0.0%) | 0 (0.0%) |
| Professional & Scientific | 0 (0.0%) | 0 (0.0%) |
| Enterprise Management | 0 (0.0%) | 0 (0.0%) |
| Administrative & Support | 0 (0.0%) | 0 (0.0%) |
| Educational Services | 3 (50.0%) | 3 (50.0%) |
| Health Care & Social Assistance | 0 (0.0%) | 4 (100.0%) |
| Arts, Entertainment & Recreation | 0 (0.0%) | 0 (0.0%) |
| Accommodation & Food Services | 2 (100.0%) | 0 (0.0%) |
| Public Administration | 7 (29.2%) | 17 (70.8%) |
| Total | 28 (50.0%) | 28 (50.0%) |
Education in Old Harbor
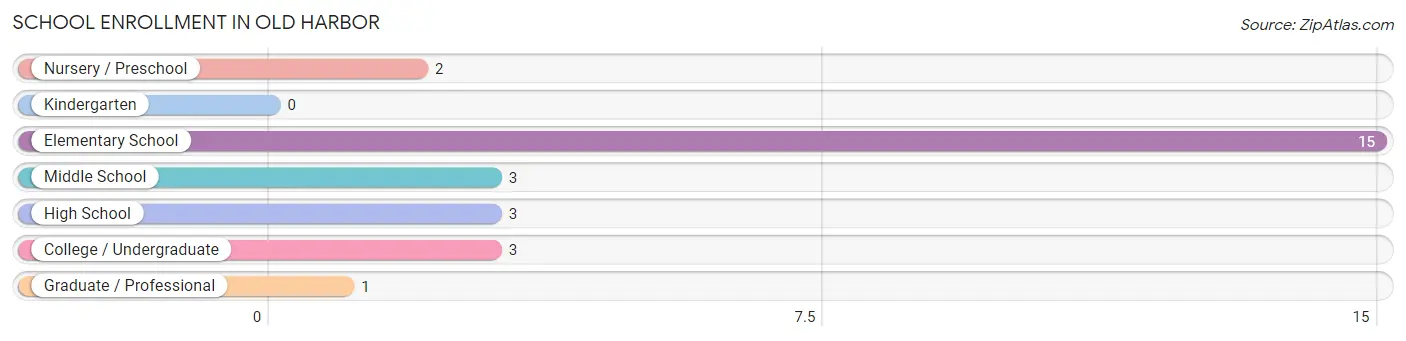
School Enrollment in Old Harbor
The most common levels of schooling among the 27 students in Old Harbor are elementary school (15 | 55.6%), middle school (3 | 11.1%), and high school (3 | 11.1%).
| School Level | # Students | % Students |
| Nursery / Preschool | 2 | 7.4% |
| Kindergarten | 0 | 0.0% |
| Elementary School | 15 | 55.6% |
| Middle School | 3 | 11.1% |
| High School | 3 | 11.1% |
| College / Undergraduate | 3 | 11.1% |
| Graduate / Professional | 1 | 3.7% |
| Total | 27 | 100.0% |
School Enrollment by Age by Funding Source in Old Harbor
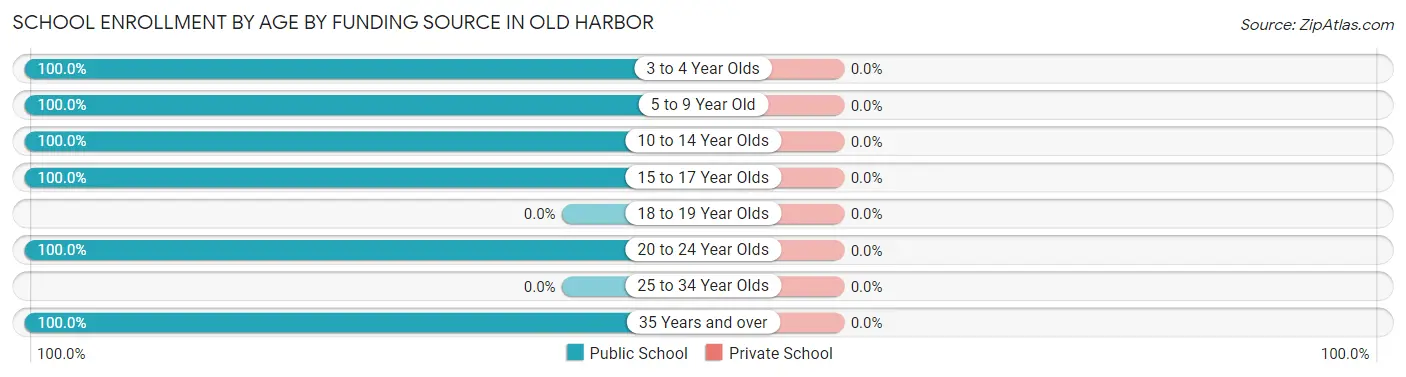
| Age Bracket | Public School | Private School |
| 3 to 4 Year Olds | 2 (100.0%) | 0 (0.0%) |
| 5 to 9 Year Old | 15 (100.0%) | 0 (0.0%) |
| 10 to 14 Year Olds | 3 (100.0%) | 0 (0.0%) |
| 15 to 17 Year Olds | 3 (100.0%) | 0 (0.0%) |
| 18 to 19 Year Olds | 0 (0.0%) | 0 (0.0%) |
| 20 to 24 Year Olds | 3 (100.0%) | 0 (0.0%) |
| 25 to 34 Year Olds | 0 (0.0%) | 0 (0.0%) |
| 35 Years and over | 1 (100.0%) | 0 (0.0%) |
| Total | 27 (100.0%) | 0 (0.0%) |
Educational Attainment by Field of Study in Old Harbor
Social sciences (4 | 57.1%), bio, nature & agricultural (2 | 28.6%), and education (1 | 14.3%) are the most common fields of study among 7 individuals in Old Harbor who have obtained a bachelor's degree or higher.
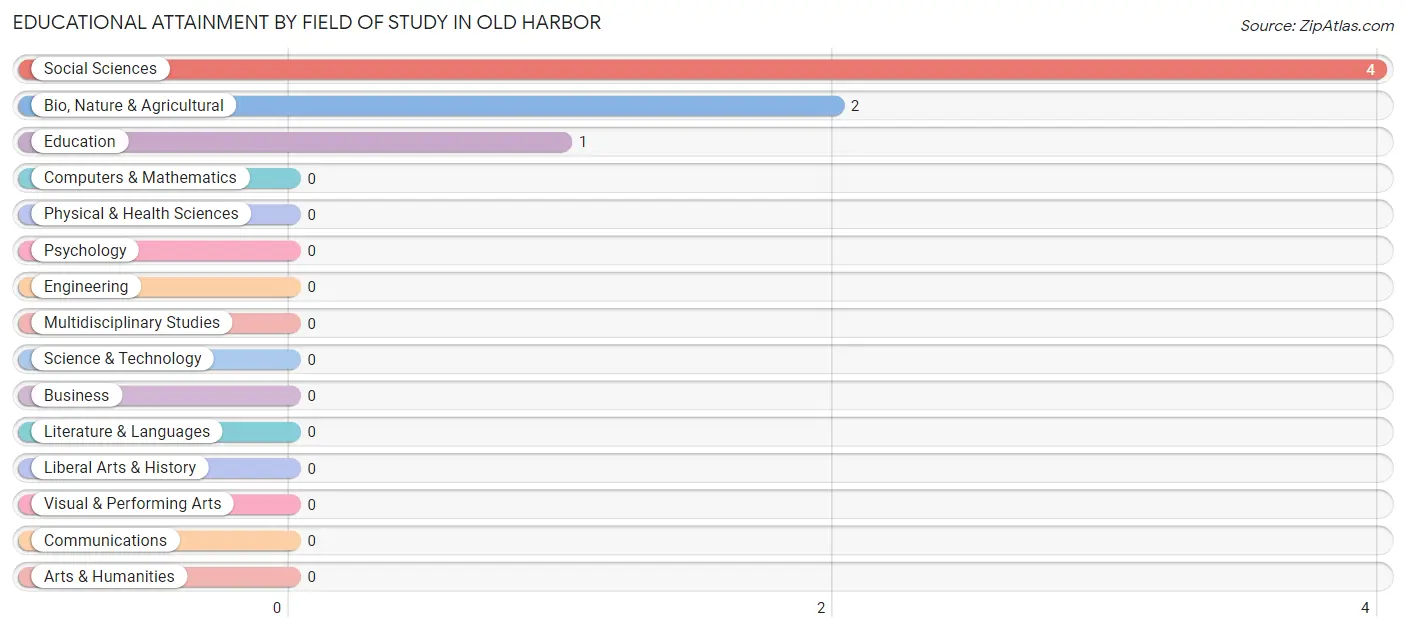
| Field of Study | # Graduates | % Graduates |
| Computers & Mathematics | 0 | 0.0% |
| Bio, Nature & Agricultural | 2 | 28.6% |
| Physical & Health Sciences | 0 | 0.0% |
| Psychology | 0 | 0.0% |
| Social Sciences | 4 | 57.1% |
| Engineering | 0 | 0.0% |
| Multidisciplinary Studies | 0 | 0.0% |
| Science & Technology | 0 | 0.0% |
| Business | 0 | 0.0% |
| Education | 1 | 14.3% |
| Literature & Languages | 0 | 0.0% |
| Liberal Arts & History | 0 | 0.0% |
| Visual & Performing Arts | 0 | 0.0% |
| Communications | 0 | 0.0% |
| Arts & Humanities | 0 | 0.0% |
| Total | 7 | 100.0% |
Transportation & Commute in Old Harbor
Vehicle Availability by Sex in Old Harbor
The most prevalent vehicle ownership categories in Old Harbor are males with 3 vehicles (10, accounting for 38.5%) and females with 3 vehicles (6, making up 35.7%).
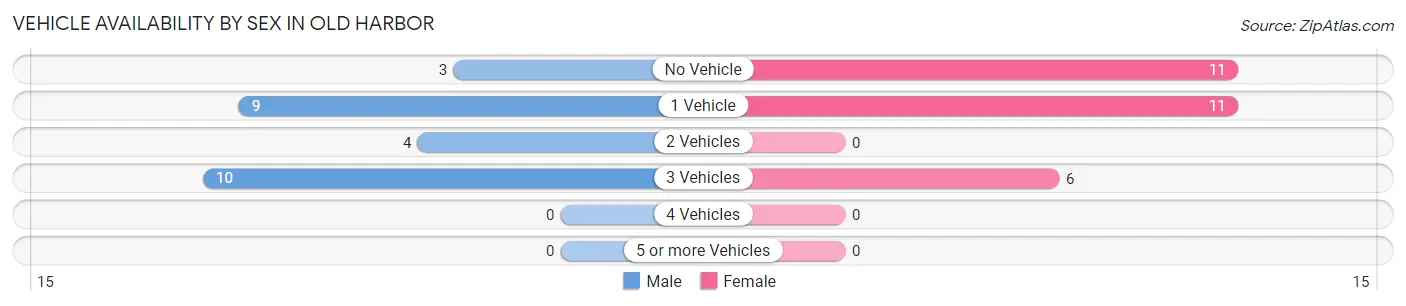
| Vehicles Available | Male | Female |
| No Vehicle | 3 (11.5%) | 11 (39.3%) |
| 1 Vehicle | 9 (34.6%) | 11 (39.3%) |
| 2 Vehicles | 4 (15.4%) | 0 (0.0%) |
| 3 Vehicles | 10 (38.5%) | 6 (21.4%) |
| 4 Vehicles | 0 (0.0%) | 0 (0.0%) |
| 5 or more Vehicles | 0 (0.0%) | 0 (0.0%) |
| Total | 26 (100.0%) | 28 (100.0%) |
Commute Time in Old Harbor
The most frequently occuring commute durations in Old Harbor are 5 to 9 minutes (37 commuters, 75.5%), less than 5 minutes (12 commuters, 24.5%), and 10 to 14 minutes (0 commuters, 0.0%).
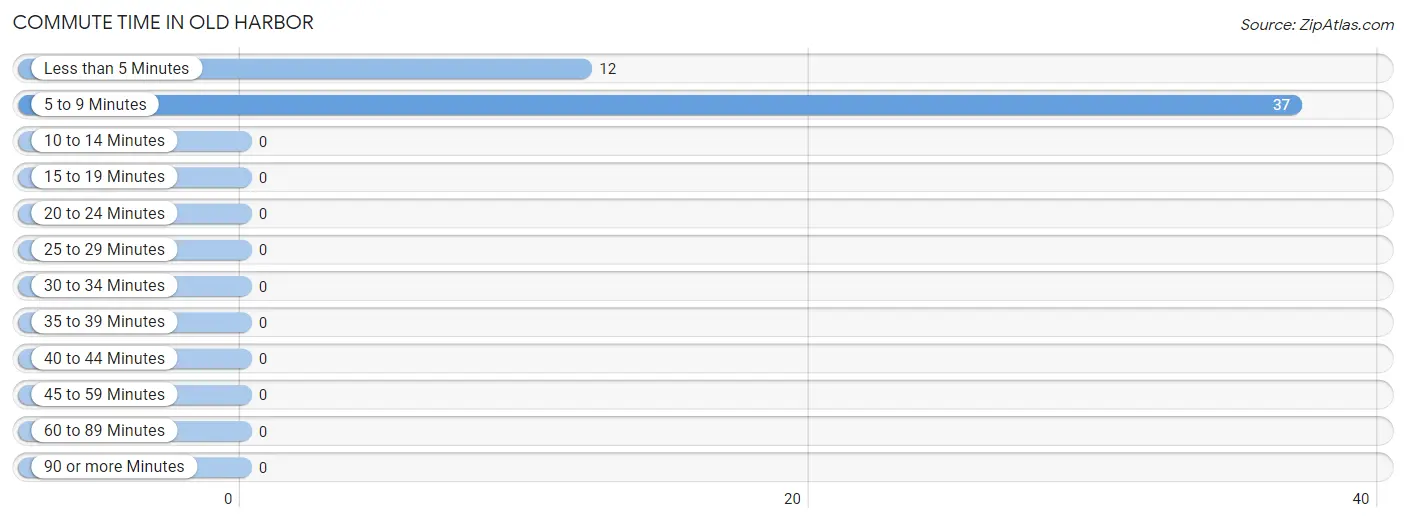
| Commute Time | # Commuters | % Commuters |
| Less than 5 Minutes | 12 | 24.5% |
| 5 to 9 Minutes | 37 | 75.5% |
| 10 to 14 Minutes | 0 | 0.0% |
| 15 to 19 Minutes | 0 | 0.0% |
| 20 to 24 Minutes | 0 | 0.0% |
| 25 to 29 Minutes | 0 | 0.0% |
| 30 to 34 Minutes | 0 | 0.0% |
| 35 to 39 Minutes | 0 | 0.0% |
| 40 to 44 Minutes | 0 | 0.0% |
| 45 to 59 Minutes | 0 | 0.0% |
| 60 to 89 Minutes | 0 | 0.0% |
| 90 or more Minutes | 0 | 0.0% |
Commute Time by Sex in Old Harbor
The most common commute times in Old Harbor are 5 to 9 minutes (14 commuters, 60.9%) for males and 5 to 9 minutes (23 commuters, 88.5%) for females.
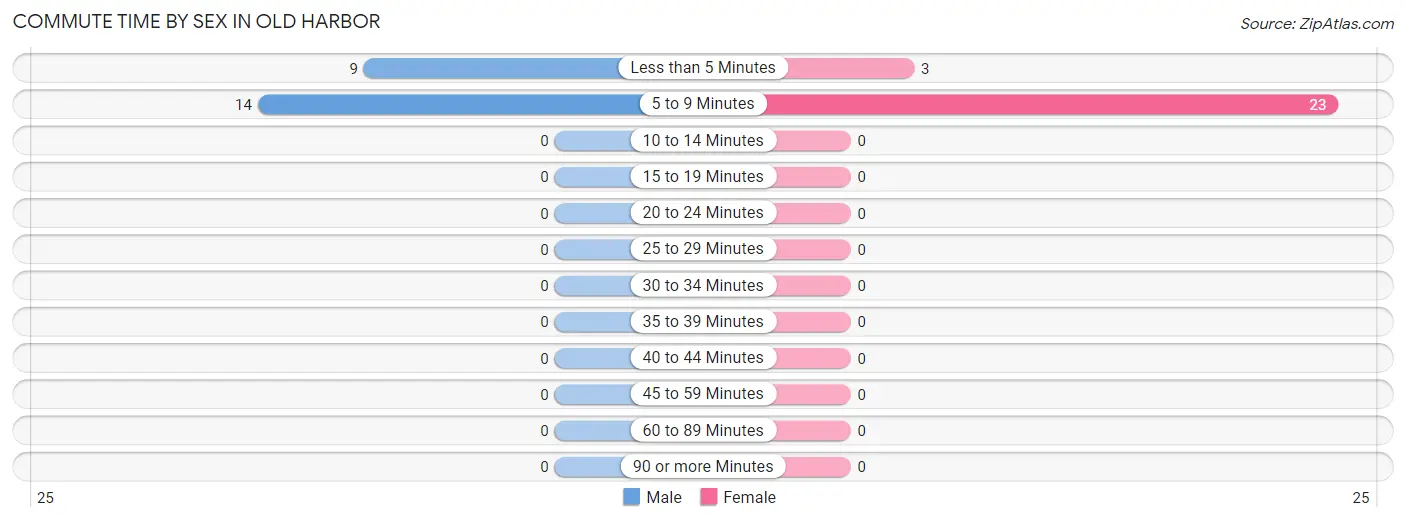
| Commute Time | Male | Female |
| Less than 5 Minutes | 9 (39.1%) | 3 (11.5%) |
| 5 to 9 Minutes | 14 (60.9%) | 23 (88.5%) |
| 10 to 14 Minutes | 0 (0.0%) | 0 (0.0%) |
| 15 to 19 Minutes | 0 (0.0%) | 0 (0.0%) |
| 20 to 24 Minutes | 0 (0.0%) | 0 (0.0%) |
| 25 to 29 Minutes | 0 (0.0%) | 0 (0.0%) |
| 30 to 34 Minutes | 0 (0.0%) | 0 (0.0%) |
| 35 to 39 Minutes | 0 (0.0%) | 0 (0.0%) |
| 40 to 44 Minutes | 0 (0.0%) | 0 (0.0%) |
| 45 to 59 Minutes | 0 (0.0%) | 0 (0.0%) |
| 60 to 89 Minutes | 0 (0.0%) | 0 (0.0%) |
| 90 or more Minutes | 0 (0.0%) | 0 (0.0%) |
Time of Departure to Work by Sex in Old Harbor
The most frequent times of departure to work in Old Harbor are 7:30 AM to 7:59 AM (8, 34.8%) for males and 9:00 AM to 9:59 AM (8, 30.8%) for females.
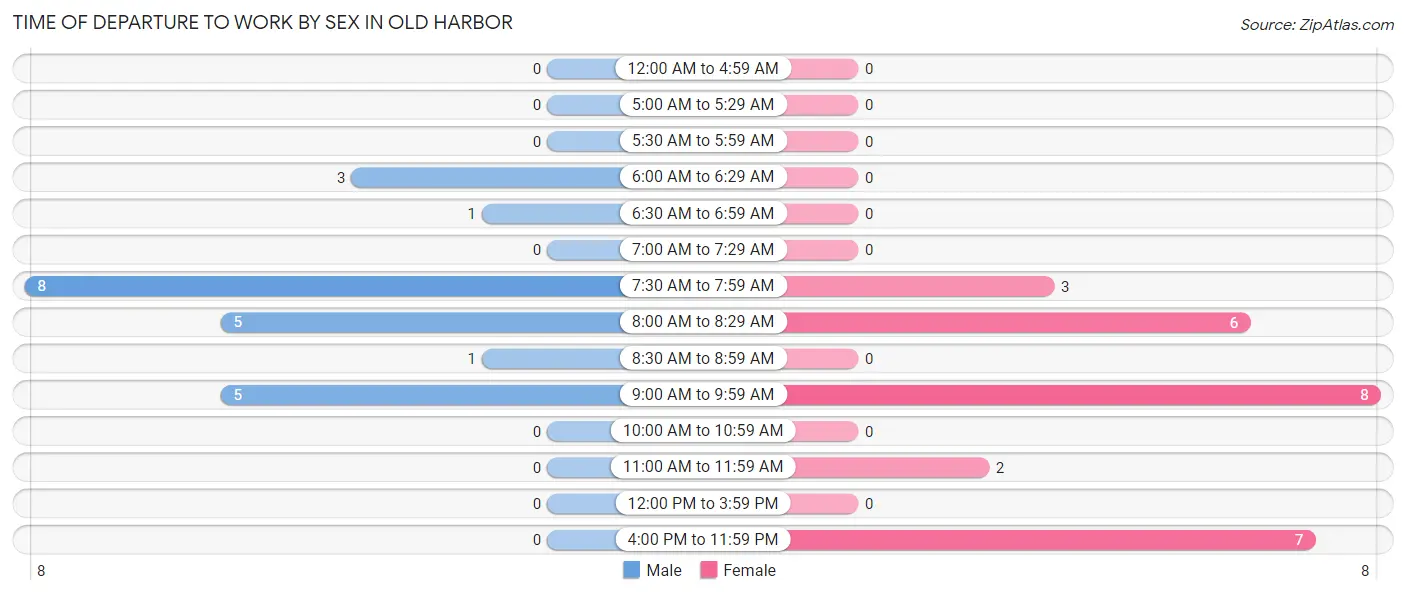
| Time of Departure | Male | Female |
| 12:00 AM to 4:59 AM | 0 (0.0%) | 0 (0.0%) |
| 5:00 AM to 5:29 AM | 0 (0.0%) | 0 (0.0%) |
| 5:30 AM to 5:59 AM | 0 (0.0%) | 0 (0.0%) |
| 6:00 AM to 6:29 AM | 3 (13.0%) | 0 (0.0%) |
| 6:30 AM to 6:59 AM | 1 (4.3%) | 0 (0.0%) |
| 7:00 AM to 7:29 AM | 0 (0.0%) | 0 (0.0%) |
| 7:30 AM to 7:59 AM | 8 (34.8%) | 3 (11.5%) |
| 8:00 AM to 8:29 AM | 5 (21.7%) | 6 (23.1%) |
| 8:30 AM to 8:59 AM | 1 (4.3%) | 0 (0.0%) |
| 9:00 AM to 9:59 AM | 5 (21.7%) | 8 (30.8%) |
| 10:00 AM to 10:59 AM | 0 (0.0%) | 0 (0.0%) |
| 11:00 AM to 11:59 AM | 0 (0.0%) | 2 (7.7%) |
| 12:00 PM to 3:59 PM | 0 (0.0%) | 0 (0.0%) |
| 4:00 PM to 11:59 PM | 0 (0.0%) | 7 (26.9%) |
| Total | 23 (100.0%) | 26 (100.0%) |
Housing Occupancy in Old Harbor
Occupancy by Ownership in Old Harbor
Of the total 75 dwellings in Old Harbor, owner-occupied units account for 49 (65.3%), while renter-occupied units make up 26 (34.7%).
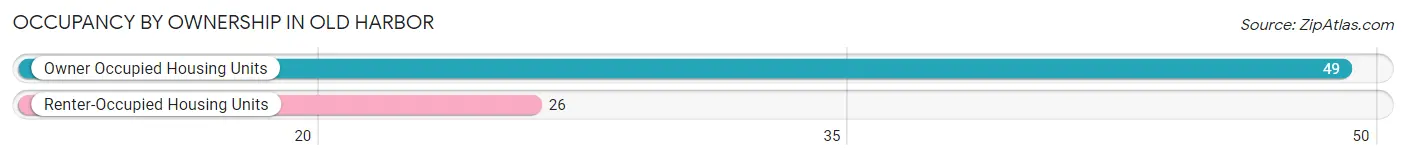
| Occupancy | # Housing Units | % Housing Units |
| Owner Occupied Housing Units | 49 | 65.3% |
| Renter-Occupied Housing Units | 26 | 34.7% |
| Total Occupied Housing Units | 75 | 100.0% |
Occupancy by Household Size in Old Harbor
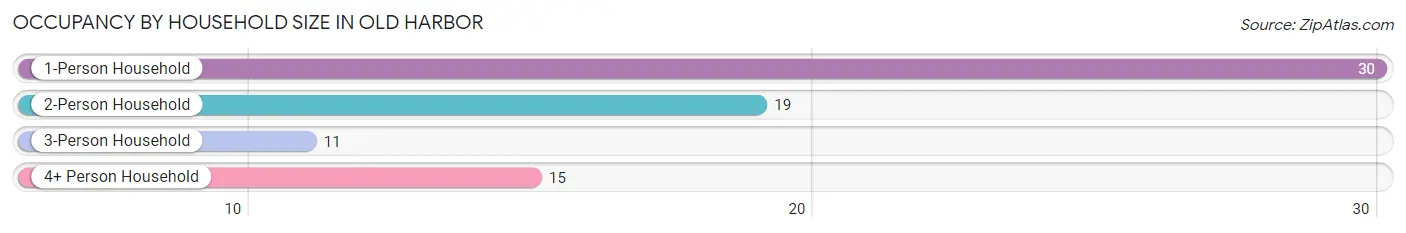
| Household Size | # Housing Units | % Housing Units |
| 1-Person Household | 30 | 40.0% |
| 2-Person Household | 19 | 25.3% |
| 3-Person Household | 11 | 14.7% |
| 4+ Person Household | 15 | 20.0% |
| Total Housing Units | 75 | 100.0% |
Occupancy by Ownership by Household Size in Old Harbor
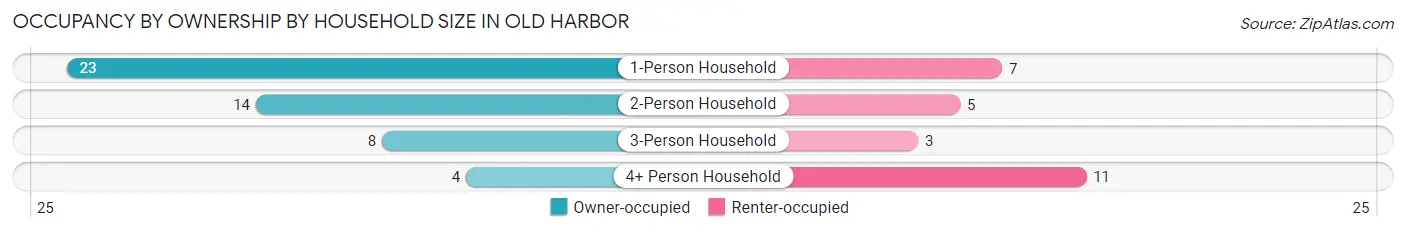
| Household Size | Owner-occupied | Renter-occupied |
| 1-Person Household | 23 (76.7%) | 7 (23.3%) |
| 2-Person Household | 14 (73.7%) | 5 (26.3%) |
| 3-Person Household | 8 (72.7%) | 3 (27.3%) |
| 4+ Person Household | 4 (26.7%) | 11 (73.3%) |
| Total Housing Units | 49 (65.3%) | 26 (34.7%) |
Occupancy by Educational Attainment in Old Harbor
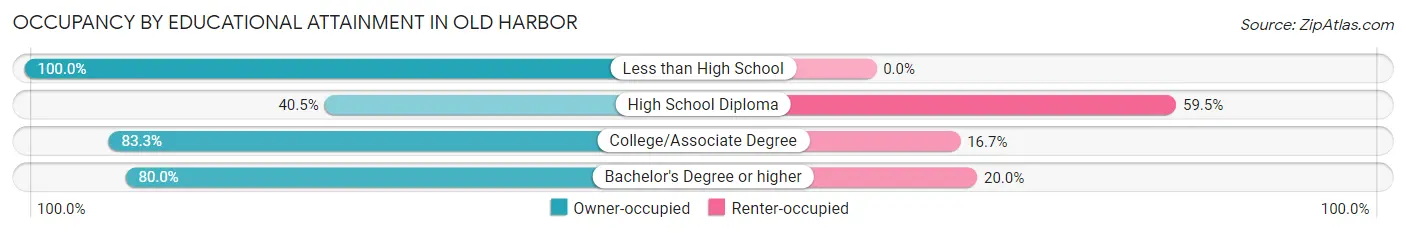
| Household Size | Owner-occupied | Renter-occupied |
| Less than High School | 15 (100.0%) | 0 (0.0%) |
| High School Diploma | 15 (40.5%) | 22 (59.5%) |
| College/Associate Degree | 15 (83.3%) | 3 (16.7%) |
| Bachelor's Degree or higher | 4 (80.0%) | 1 (20.0%) |
Occupancy by Age of Householder in Old Harbor
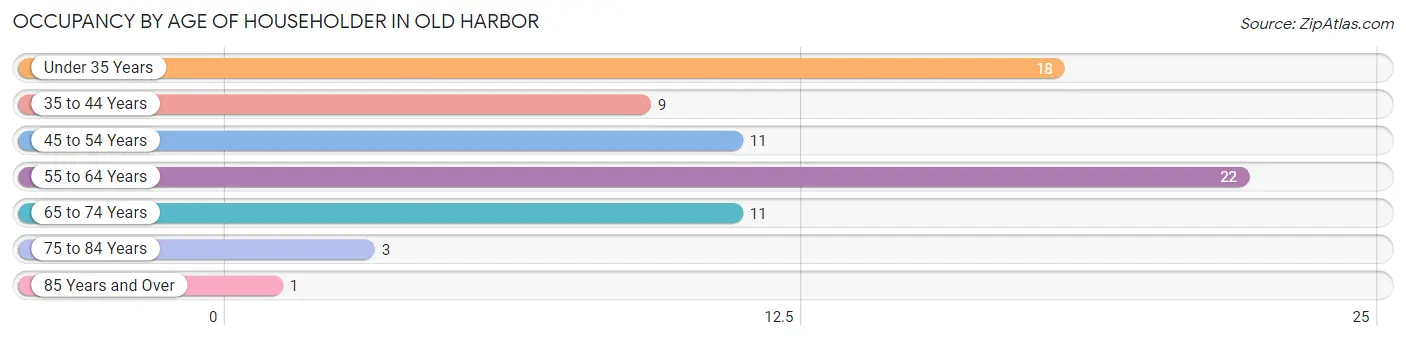
| Age Bracket | # Households | % Households |
| Under 35 Years | 18 | 24.0% |
| 35 to 44 Years | 9 | 12.0% |
| 45 to 54 Years | 11 | 14.7% |
| 55 to 64 Years | 22 | 29.3% |
| 65 to 74 Years | 11 | 14.7% |
| 75 to 84 Years | 3 | 4.0% |
| 85 Years and Over | 1 | 1.3% |
| Total | 75 | 100.0% |
Housing Finances in Old Harbor
Median Income by Occupancy in Old Harbor
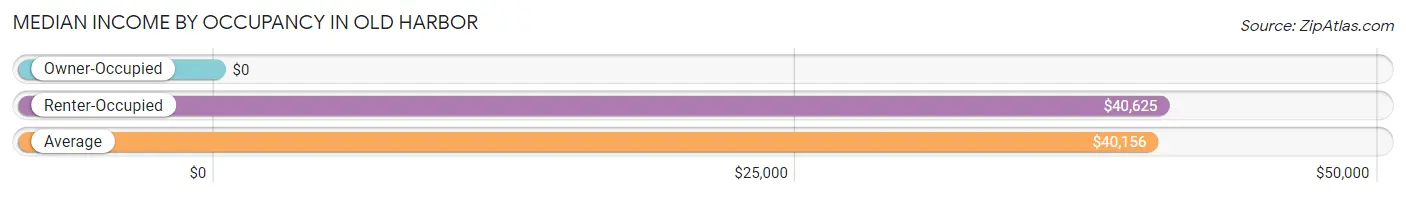
| Occupancy Type | # Households | Median Income |
| Owner-Occupied | 49 (65.3%) | $0 |
| Renter-Occupied | 26 (34.7%) | $40,625 |
| Average | 75 (100.0%) | $40,156 |
Occupancy by Householder Income Bracket in Old Harbor
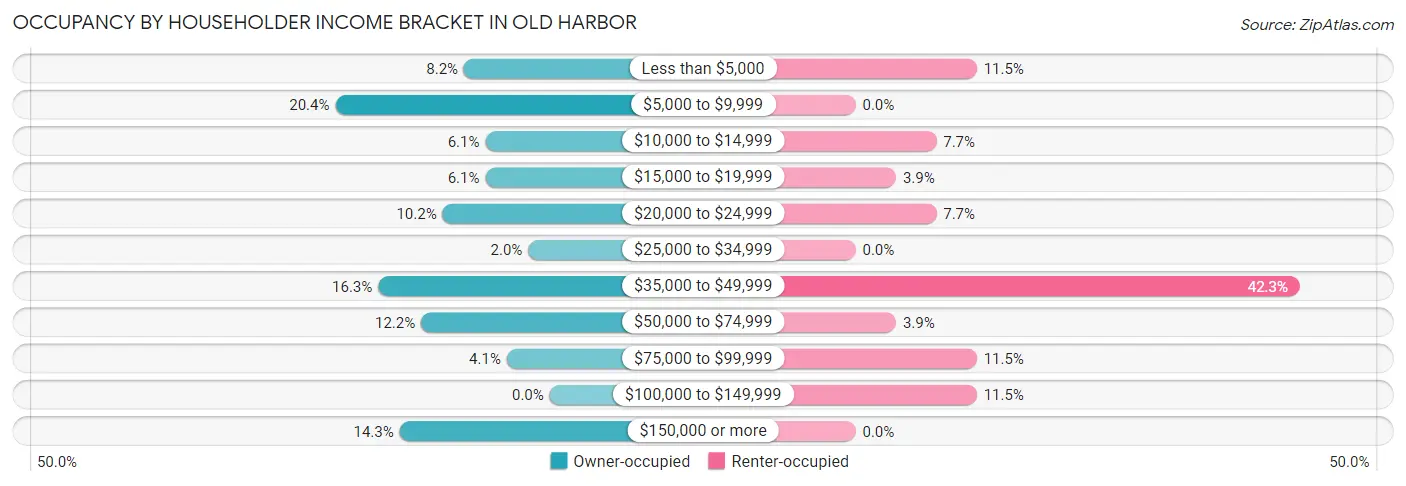
| Income Bracket | Owner-occupied | Renter-occupied |
| Less than $5,000 | 4 (8.2%) | 3 (11.5%) |
| $5,000 to $9,999 | 10 (20.4%) | 0 (0.0%) |
| $10,000 to $14,999 | 3 (6.1%) | 2 (7.7%) |
| $15,000 to $19,999 | 3 (6.1%) | 1 (3.8%) |
| $20,000 to $24,999 | 5 (10.2%) | 2 (7.7%) |
| $25,000 to $34,999 | 1 (2.0%) | 0 (0.0%) |
| $35,000 to $49,999 | 8 (16.3%) | 11 (42.3%) |
| $50,000 to $74,999 | 6 (12.2%) | 1 (3.8%) |
| $75,000 to $99,999 | 2 (4.1%) | 3 (11.5%) |
| $100,000 to $149,999 | 0 (0.0%) | 3 (11.5%) |
| $150,000 or more | 7 (14.3%) | 0 (0.0%) |
| Total | 49 (100.0%) | 26 (100.0%) |
Monthly Housing Cost Tiers in Old Harbor
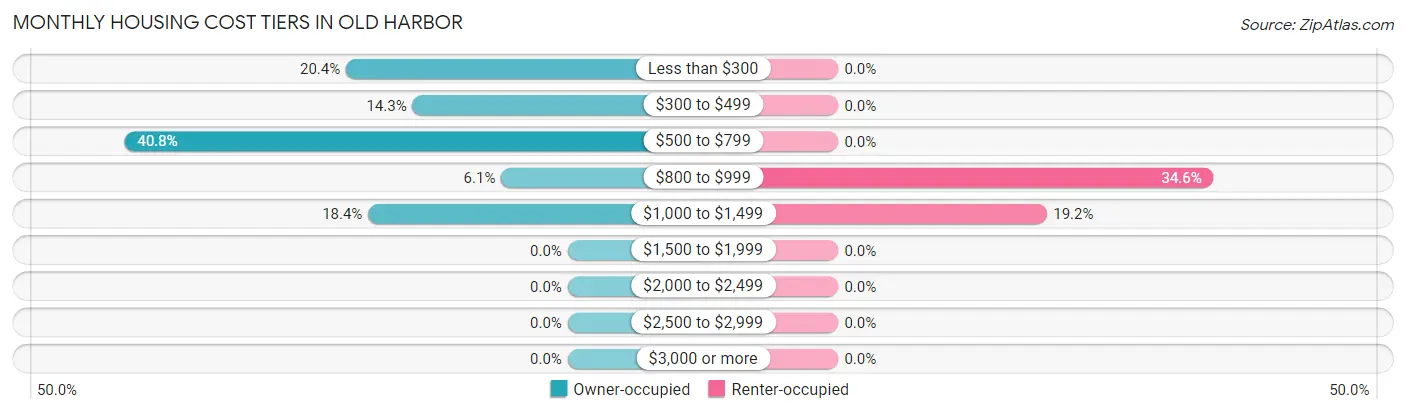
| Monthly Cost | Owner-occupied | Renter-occupied |
| Less than $300 | 10 (20.4%) | 0 (0.0%) |
| $300 to $499 | 7 (14.3%) | 0 (0.0%) |
| $500 to $799 | 20 (40.8%) | 0 (0.0%) |
| $800 to $999 | 3 (6.1%) | 9 (34.6%) |
| $1,000 to $1,499 | 9 (18.4%) | 5 (19.2%) |
| $1,500 to $1,999 | 0 (0.0%) | 0 (0.0%) |
| $2,000 to $2,499 | 0 (0.0%) | 0 (0.0%) |
| $2,500 to $2,999 | 0 (0.0%) | 0 (0.0%) |
| $3,000 or more | 0 (0.0%) | 0 (0.0%) |
| Total | 49 (100.0%) | 26 (100.0%) |
Physical Housing Characteristics in Old Harbor
Housing Structures in Old Harbor
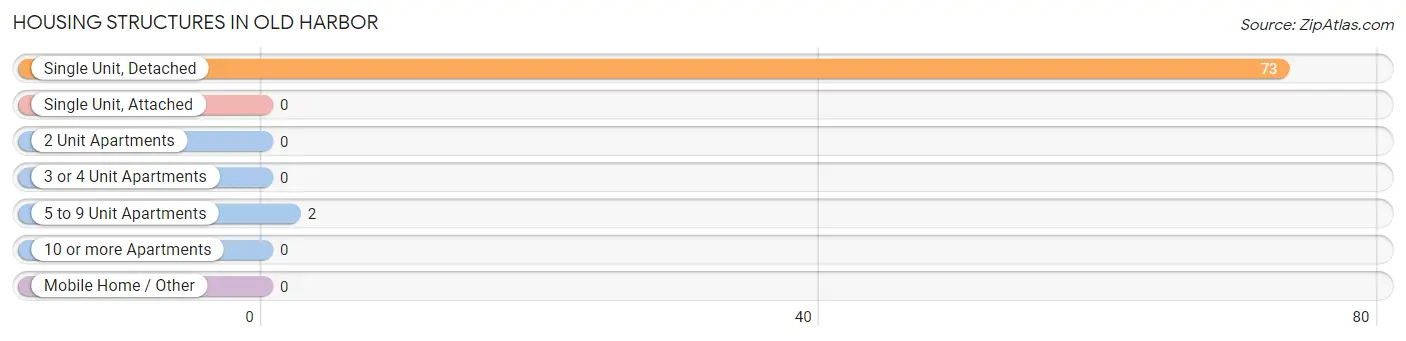
| Structure Type | # Housing Units | % Housing Units |
| Single Unit, Detached | 73 | 97.3% |
| Single Unit, Attached | 0 | 0.0% |
| 2 Unit Apartments | 0 | 0.0% |
| 3 or 4 Unit Apartments | 0 | 0.0% |
| 5 to 9 Unit Apartments | 2 | 2.7% |
| 10 or more Apartments | 0 | 0.0% |
| Mobile Home / Other | 0 | 0.0% |
| Total | 75 | 100.0% |
Housing Structures by Occupancy in Old Harbor
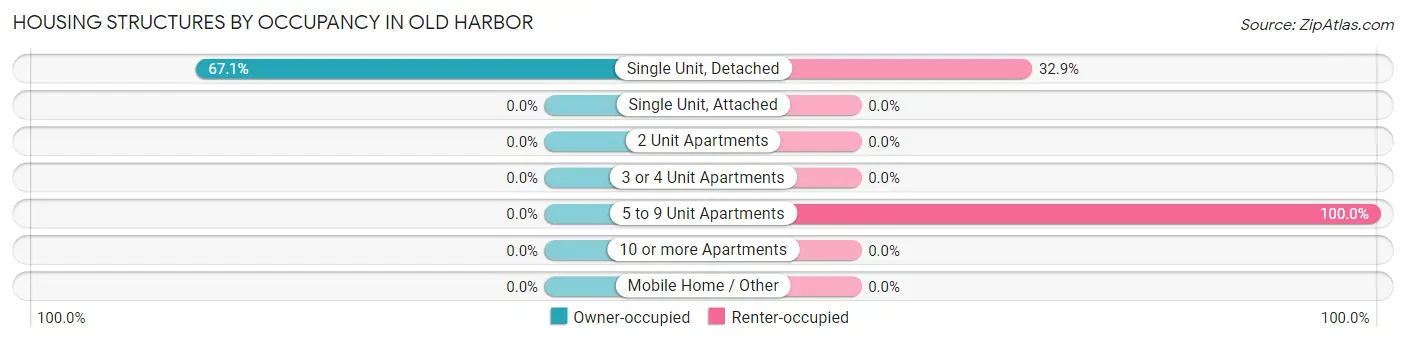
| Structure Type | Owner-occupied | Renter-occupied |
| Single Unit, Detached | 49 (67.1%) | 24 (32.9%) |
| Single Unit, Attached | 0 (0.0%) | 0 (0.0%) |
| 2 Unit Apartments | 0 (0.0%) | 0 (0.0%) |
| 3 or 4 Unit Apartments | 0 (0.0%) | 0 (0.0%) |
| 5 to 9 Unit Apartments | 0 (0.0%) | 2 (100.0%) |
| 10 or more Apartments | 0 (0.0%) | 0 (0.0%) |
| Mobile Home / Other | 0 (0.0%) | 0 (0.0%) |
| Total | 49 (65.3%) | 26 (34.7%) |
Housing Structures by Number of Rooms in Old Harbor
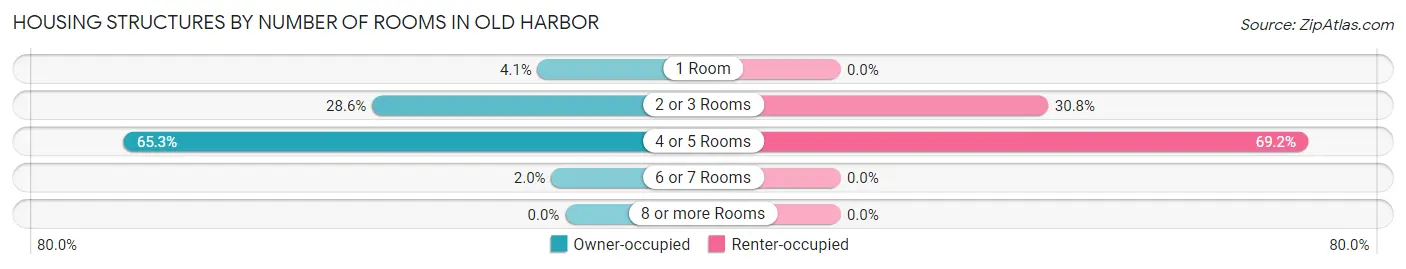
| Number of Rooms | Owner-occupied | Renter-occupied |
| 1 Room | 2 (4.1%) | 0 (0.0%) |
| 2 or 3 Rooms | 14 (28.6%) | 8 (30.8%) |
| 4 or 5 Rooms | 32 (65.3%) | 18 (69.2%) |
| 6 or 7 Rooms | 1 (2.0%) | 0 (0.0%) |
| 8 or more Rooms | 0 (0.0%) | 0 (0.0%) |
| Total | 49 (100.0%) | 26 (100.0%) |
Housing Structure by Heating Type in Old Harbor
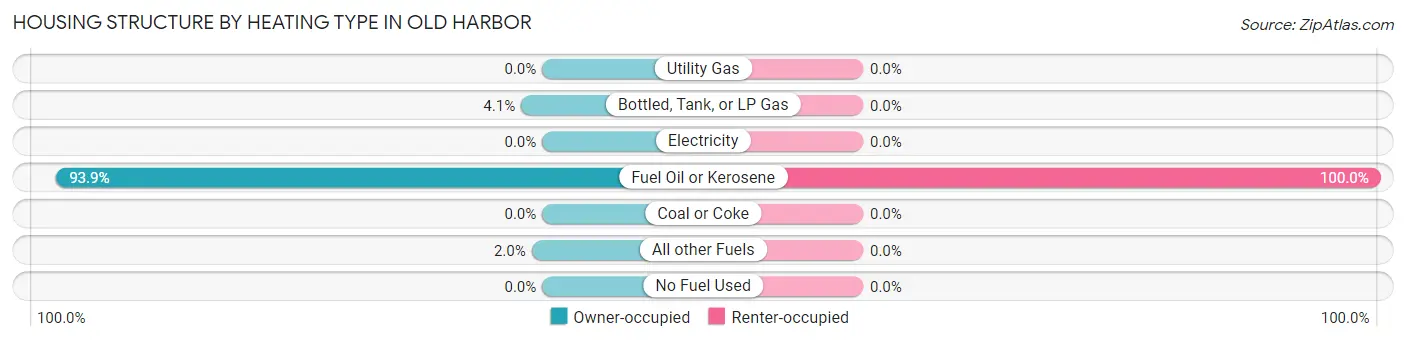
| Heating Type | Owner-occupied | Renter-occupied |
| Utility Gas | 0 (0.0%) | 0 (0.0%) |
| Bottled, Tank, or LP Gas | 2 (4.1%) | 0 (0.0%) |
| Electricity | 0 (0.0%) | 0 (0.0%) |
| Fuel Oil or Kerosene | 46 (93.9%) | 26 (100.0%) |
| Coal or Coke | 0 (0.0%) | 0 (0.0%) |
| All other Fuels | 1 (2.0%) | 0 (0.0%) |
| No Fuel Used | 0 (0.0%) | 0 (0.0%) |
| Total | 49 (100.0%) | 26 (100.0%) |
Household Vehicle Usage in Old Harbor
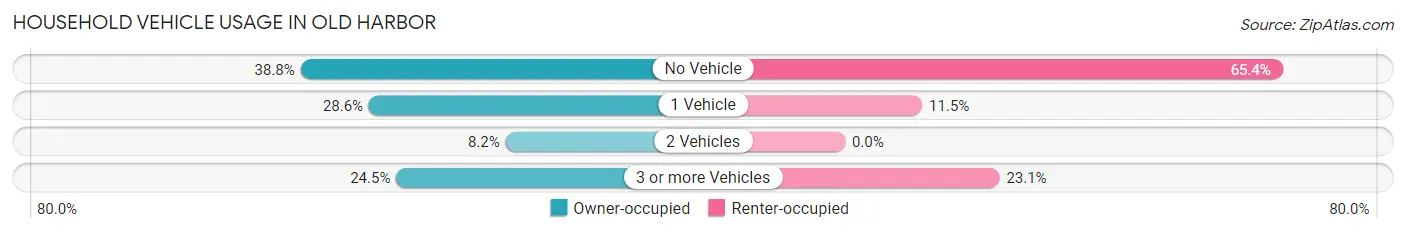
| Vehicles per Household | Owner-occupied | Renter-occupied |
| No Vehicle | 19 (38.8%) | 17 (65.4%) |
| 1 Vehicle | 14 (28.6%) | 3 (11.5%) |
| 2 Vehicles | 4 (8.2%) | 0 (0.0%) |
| 3 or more Vehicles | 12 (24.5%) | 6 (23.1%) |
| Total | 49 (100.0%) | 26 (100.0%) |
Real Estate & Mortgages in Old Harbor
Real Estate and Mortgage Overview in Old Harbor
| Characteristic | Without Mortgage | With Mortgage |
| Housing Units | 37 | 12 |
| Median Property Value | $97,500 | $340,000 |
| Median Household Income | - | - |
| Monthly Housing Costs | $517 | $0 |
| Real Estate Taxes | $773 | $4 |
Property Value by Mortgage Status in Old Harbor
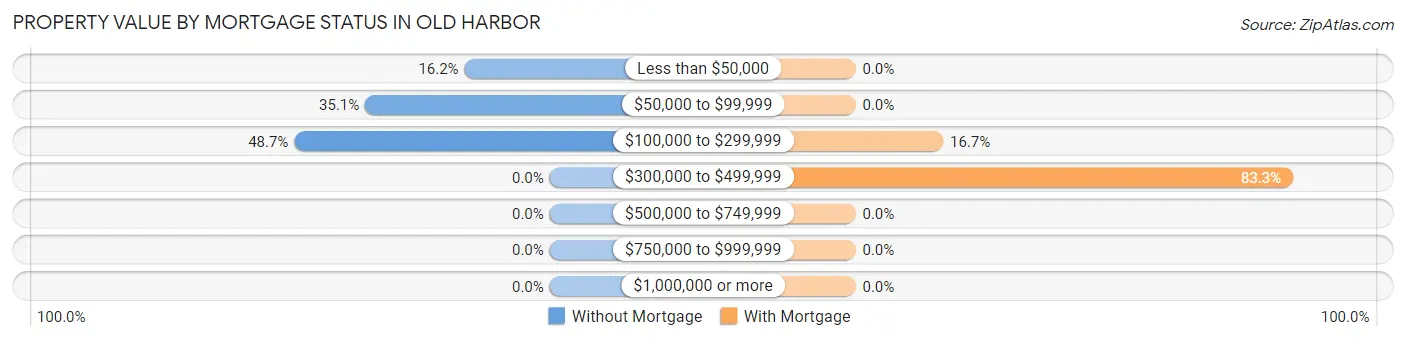
| Property Value | Without Mortgage | With Mortgage |
| Less than $50,000 | 6 (16.2%) | 0 (0.0%) |
| $50,000 to $99,999 | 13 (35.1%) | 0 (0.0%) |
| $100,000 to $299,999 | 18 (48.6%) | 2 (16.7%) |
| $300,000 to $499,999 | 0 (0.0%) | 10 (83.3%) |
| $500,000 to $749,999 | 0 (0.0%) | 0 (0.0%) |
| $750,000 to $999,999 | 0 (0.0%) | 0 (0.0%) |
| $1,000,000 or more | 0 (0.0%) | 0 (0.0%) |
| Total | 37 (100.0%) | 12 (100.0%) |
Household Income by Mortgage Status in Old Harbor
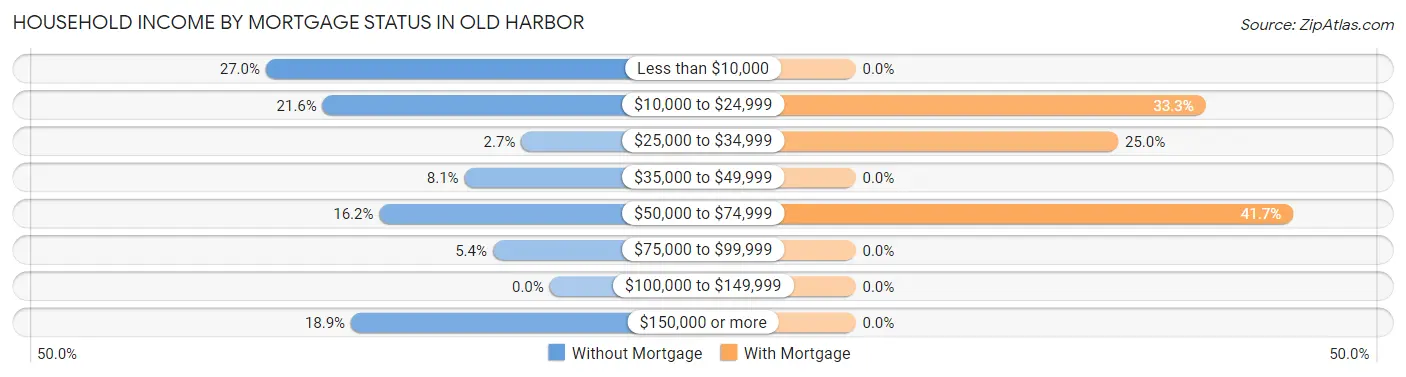
| Household Income | Without Mortgage | With Mortgage |
| Less than $10,000 | 10 (27.0%) | 0 (0.0%) |
| $10,000 to $24,999 | 8 (21.6%) | 4 (33.3%) |
| $25,000 to $34,999 | 1 (2.7%) | 3 (25.0%) |
| $35,000 to $49,999 | 3 (8.1%) | 0 (0.0%) |
| $50,000 to $74,999 | 6 (16.2%) | 5 (41.7%) |
| $75,000 to $99,999 | 2 (5.4%) | 0 (0.0%) |
| $100,000 to $149,999 | 0 (0.0%) | 0 (0.0%) |
| $150,000 or more | 7 (18.9%) | 0 (0.0%) |
| Total | 37 (100.0%) | 12 (100.0%) |
Property Value to Household Income Ratio in Old Harbor
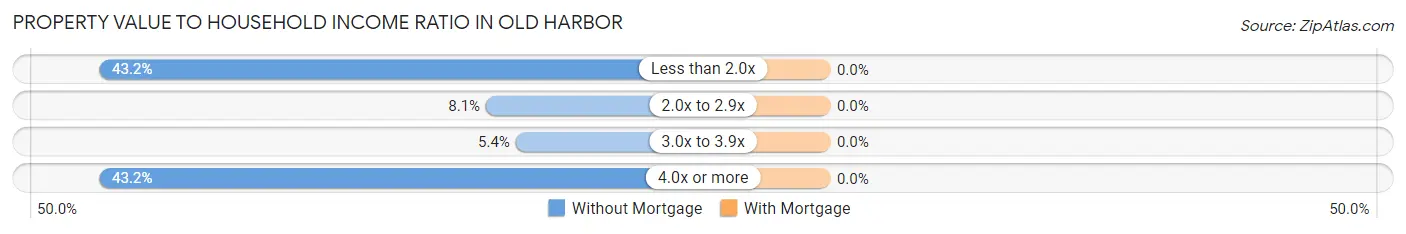
| Value-to-Income Ratio | Without Mortgage | With Mortgage |
| Less than 2.0x | 16 (43.2%) | 0 (0.0%) |
| 2.0x to 2.9x | 3 (8.1%) | 0 (0.0%) |
| 3.0x to 3.9x | 2 (5.4%) | 0 (0.0%) |
| 4.0x or more | 16 (43.2%) | 0 (0.0%) |
| Total | 37 (100.0%) | 12 (100.0%) |
Real Estate Taxes by Mortgage Status in Old Harbor
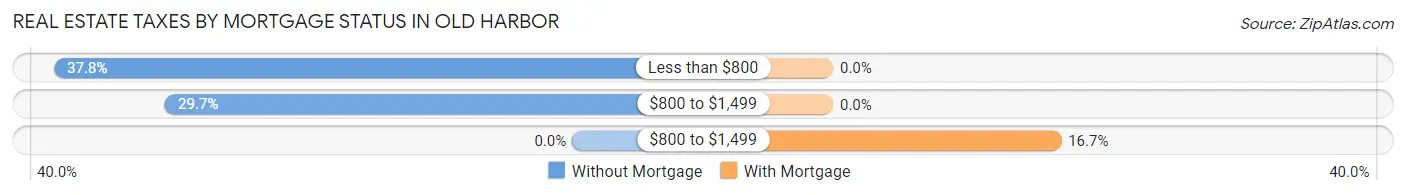
| Property Taxes | Without Mortgage | With Mortgage |
| Less than $800 | 14 (37.8%) | 0 (0.0%) |
| $800 to $1,499 | 11 (29.7%) | 0 (0.0%) |
| $800 to $1,499 | 0 (0.0%) | 2 (16.7%) |
| Total | 37 (100.0%) | 12 (100.0%) |
Health & Disability in Old Harbor
Health Insurance Coverage by Age in Old Harbor
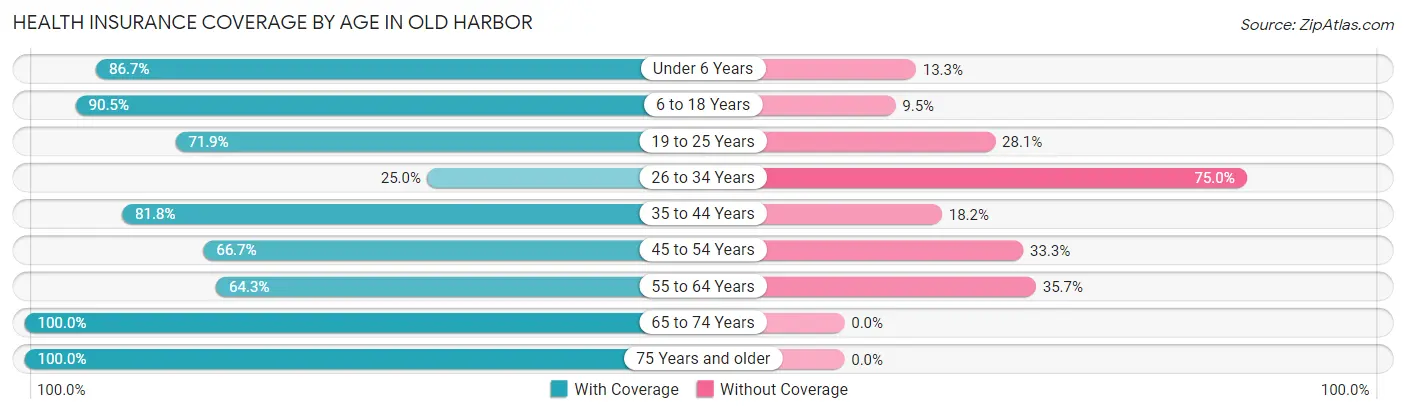
| Age Bracket | With Coverage | Without Coverage |
| Under 6 Years | 13 (86.7%) | 2 (13.3%) |
| 6 to 18 Years | 19 (90.5%) | 2 (9.5%) |
| 19 to 25 Years | 23 (71.9%) | 9 (28.1%) |
| 26 to 34 Years | 3 (25.0%) | 9 (75.0%) |
| 35 to 44 Years | 9 (81.8%) | 2 (18.2%) |
| 45 to 54 Years | 14 (66.7%) | 7 (33.3%) |
| 55 to 64 Years | 18 (64.3%) | 10 (35.7%) |
| 65 to 74 Years | 11 (100.0%) | 0 (0.0%) |
| 75 Years and older | 4 (100.0%) | 0 (0.0%) |
| Total | 114 (73.6%) | 41 (26.5%) |
Health Insurance Coverage by Citizenship Status in Old Harbor
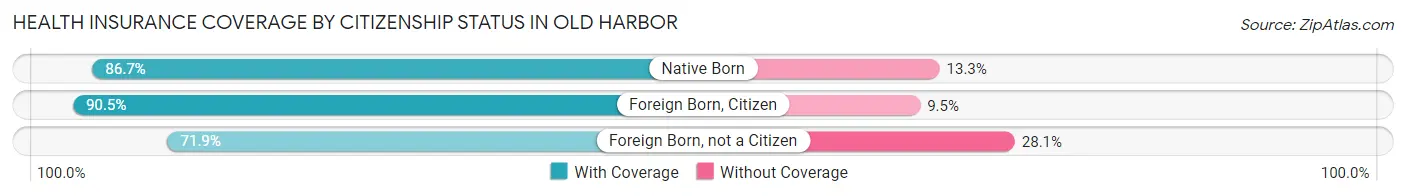
| Citizenship Status | With Coverage | Without Coverage |
| Native Born | 13 (86.7%) | 2 (13.3%) |
| Foreign Born, Citizen | 19 (90.5%) | 2 (9.5%) |
| Foreign Born, not a Citizen | 23 (71.9%) | 9 (28.1%) |
Health Insurance Coverage by Household Income in Old Harbor
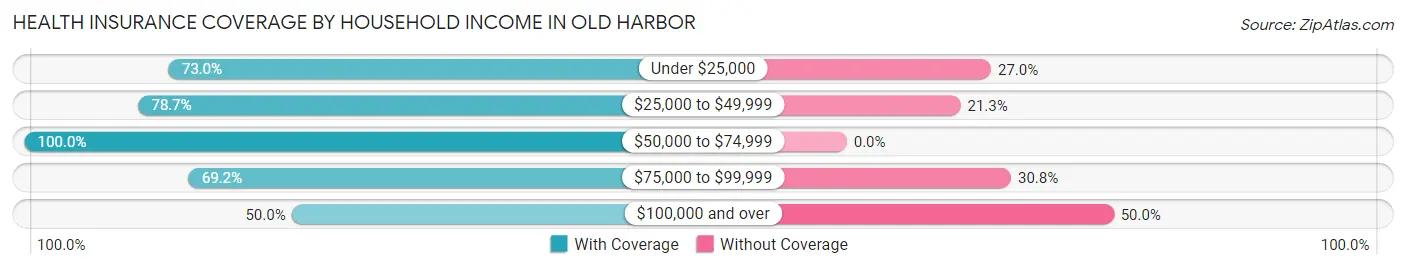
| Household Income | With Coverage | Without Coverage |
| Under $25,000 | 27 (73.0%) | 10 (27.0%) |
| $25,000 to $49,999 | 48 (78.7%) | 13 (21.3%) |
| $50,000 to $74,999 | 16 (100.0%) | 0 (0.0%) |
| $75,000 to $99,999 | 9 (69.2%) | 4 (30.8%) |
| $100,000 and over | 14 (50.0%) | 14 (50.0%) |
Public vs Private Health Insurance Coverage by Age in Old Harbor
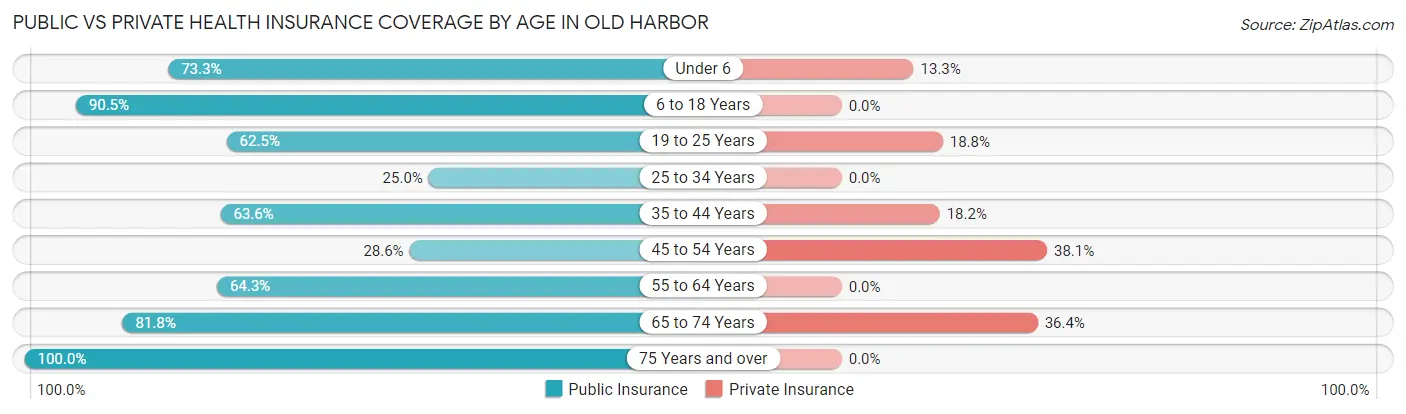
| Age Bracket | Public Insurance | Private Insurance |
| Under 6 | 11 (73.3%) | 2 (13.3%) |
| 6 to 18 Years | 19 (90.5%) | 0 (0.0%) |
| 19 to 25 Years | 20 (62.5%) | 6 (18.8%) |
| 25 to 34 Years | 3 (25.0%) | 0 (0.0%) |
| 35 to 44 Years | 7 (63.6%) | 2 (18.2%) |
| 45 to 54 Years | 6 (28.6%) | 8 (38.1%) |
| 55 to 64 Years | 18 (64.3%) | 0 (0.0%) |
| 65 to 74 Years | 9 (81.8%) | 4 (36.4%) |
| 75 Years and over | 4 (100.0%) | 0 (0.0%) |
| Total | 97 (62.6%) | 22 (14.2%) |
Disability Status by Sex by Age in Old Harbor
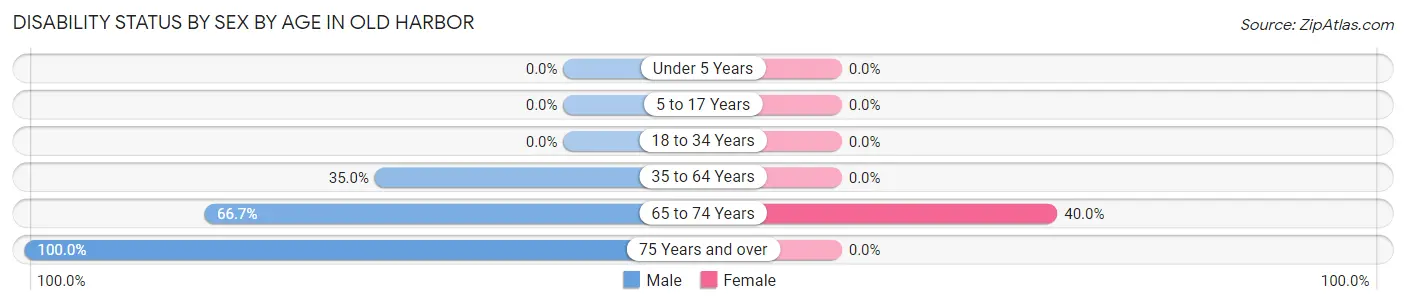
| Age Bracket | Male | Female |
| Under 5 Years | 0 (0.0%) | 0 (0.0%) |
| 5 to 17 Years | 0 (0.0%) | 0 (0.0%) |
| 18 to 34 Years | 0 (0.0%) | 0 (0.0%) |
| 35 to 64 Years | 14 (35.0%) | 0 (0.0%) |
| 65 to 74 Years | 4 (66.7%) | 2 (40.0%) |
| 75 Years and over | 1 (100.0%) | 0 (0.0%) |
Disability Class by Sex by Age in Old Harbor
Disability Class: Hearing Difficulty
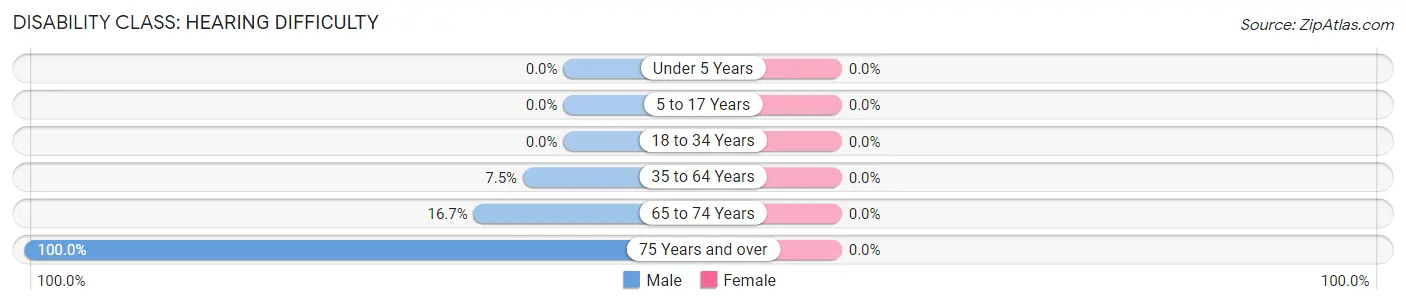
| Age Bracket | Male | Female |
| Under 5 Years | 0 (0.0%) | 0 (0.0%) |
| 5 to 17 Years | 0 (0.0%) | 0 (0.0%) |
| 18 to 34 Years | 0 (0.0%) | 0 (0.0%) |
| 35 to 64 Years | 3 (7.5%) | 0 (0.0%) |
| 65 to 74 Years | 1 (16.7%) | 0 (0.0%) |
| 75 Years and over | 1 (100.0%) | 0 (0.0%) |
Disability Class: Vision Difficulty
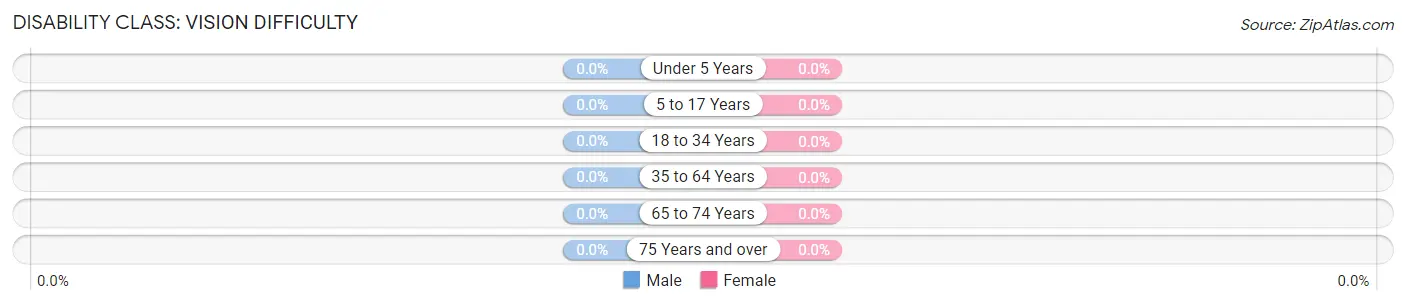
| Age Bracket | Male | Female |
| Under 5 Years | 0 (0.0%) | 0 (0.0%) |
| 5 to 17 Years | 0 (0.0%) | 0 (0.0%) |
| 18 to 34 Years | 0 (0.0%) | 0 (0.0%) |
| 35 to 64 Years | 0 (0.0%) | 0 (0.0%) |
| 65 to 74 Years | 0 (0.0%) | 0 (0.0%) |
| 75 Years and over | 0 (0.0%) | 0 (0.0%) |
Disability Class: Cognitive Difficulty
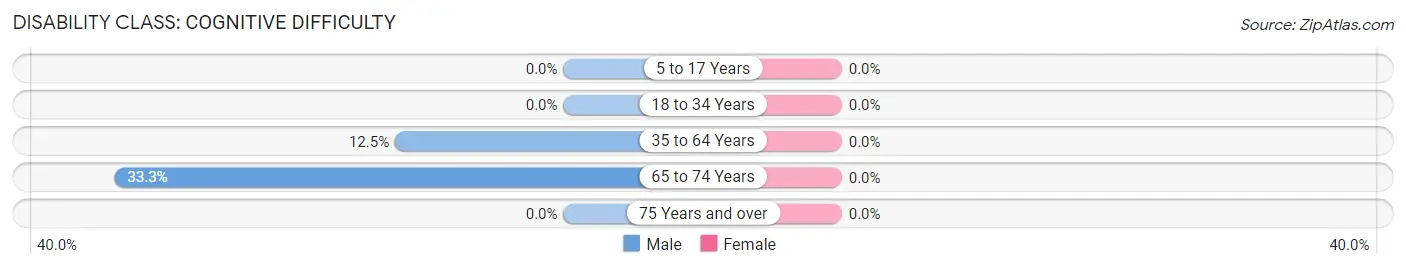
| Age Bracket | Male | Female |
| 5 to 17 Years | 0 (0.0%) | 0 (0.0%) |
| 18 to 34 Years | 0 (0.0%) | 0 (0.0%) |
| 35 to 64 Years | 5 (12.5%) | 0 (0.0%) |
| 65 to 74 Years | 2 (33.3%) | 0 (0.0%) |
| 75 Years and over | 0 (0.0%) | 0 (0.0%) |
Disability Class: Ambulatory Difficulty
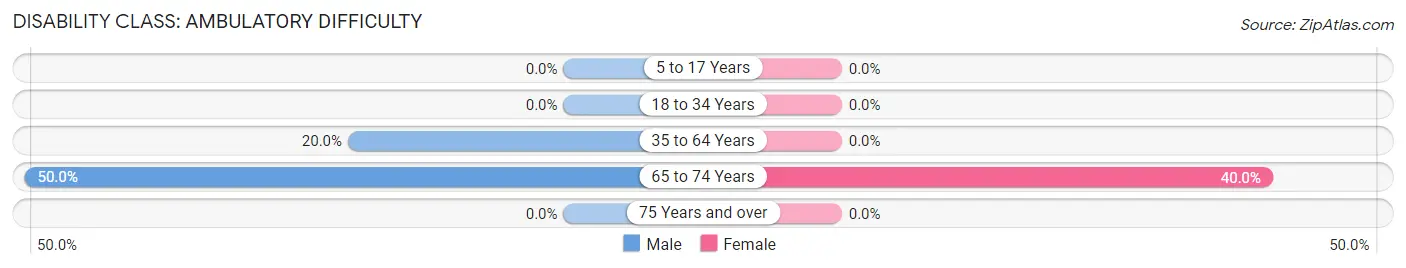
| Age Bracket | Male | Female |
| 5 to 17 Years | 0 (0.0%) | 0 (0.0%) |
| 18 to 34 Years | 0 (0.0%) | 0 (0.0%) |
| 35 to 64 Years | 8 (20.0%) | 0 (0.0%) |
| 65 to 74 Years | 3 (50.0%) | 2 (40.0%) |
| 75 Years and over | 0 (0.0%) | 0 (0.0%) |
Disability Class: Self-Care Difficulty
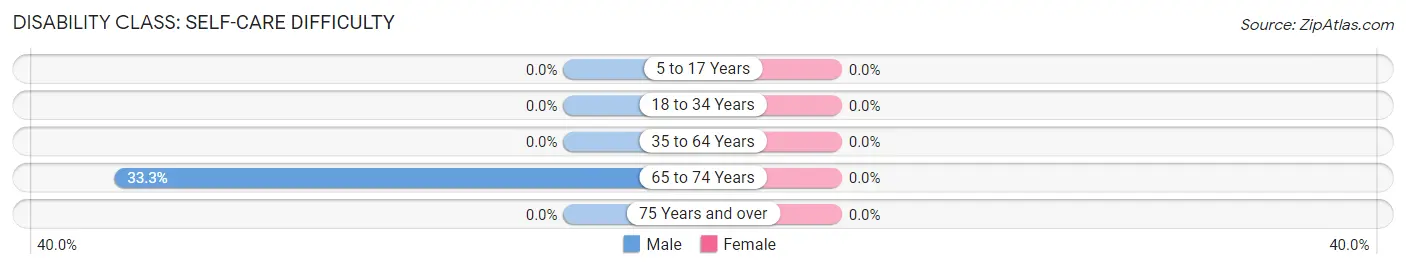
| Age Bracket | Male | Female |
| 5 to 17 Years | 0 (0.0%) | 0 (0.0%) |
| 18 to 34 Years | 0 (0.0%) | 0 (0.0%) |
| 35 to 64 Years | 0 (0.0%) | 0 (0.0%) |
| 65 to 74 Years | 2 (33.3%) | 0 (0.0%) |
| 75 Years and over | 0 (0.0%) | 0 (0.0%) |
Technology Access in Old Harbor
Computing Device Access in Old Harbor
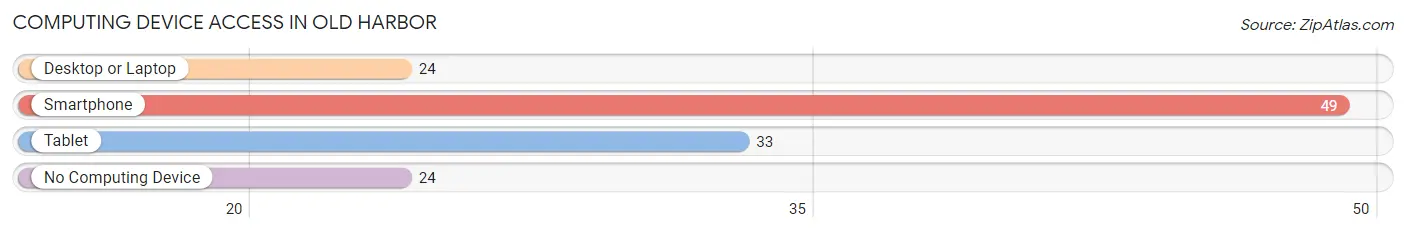
| Device Type | # Households | % Households |
| Desktop or Laptop | 24 | 32.0% |
| Smartphone | 49 | 65.3% |
| Tablet | 33 | 44.0% |
| No Computing Device | 24 | 32.0% |
| Total | 75 | 100.0% |
Internet Access in Old Harbor
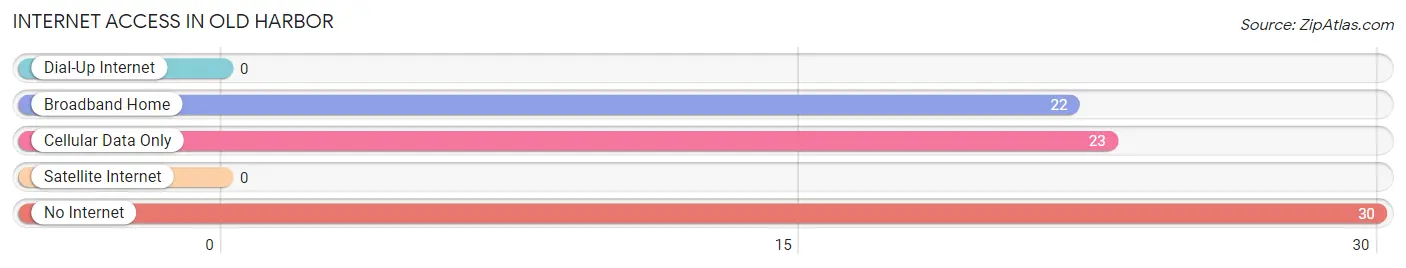
| Internet Type | # Households | % Households |
| Dial-Up Internet | 0 | 0.0% |
| Broadband Home | 22 | 29.3% |
| Cellular Data Only | 23 | 30.7% |
| Satellite Internet | 0 | 0.0% |
| No Internet | 30 | 40.0% |
| Total | 75 | 100.0% |
Old Harbor Summary
Old Harbor, Alaska is a small fishing village located on Kodiak Island in the Gulf of Alaska. It is the oldest permanent settlement on the island, and has a population of about 200 people. The village is located on the eastern shore of Chiniak Bay, and is surrounded by mountains and forests.
History
Old Harbor was first settled by the Alutiiq people, who have lived in the area for thousands of years. The first recorded contact with Europeans was in 1784, when the Russian explorer Grigory Shelikhov arrived in the area. He established a trading post in the area, and the Alutiiq people began to trade with the Russians. In 1867, the United States purchased Alaska from Russia, and the area became part of the United States.
In the late 1800s, the area around Old Harbor began to be settled by non-Native Americans. The first settlers were fishermen, who established a cannery in the area. The cannery was the first industry in the area, and it provided employment for many of the local residents.
In the early 1900s, the area around Old Harbor began to be developed for commercial fishing. The first commercial fishing boats arrived in the area in the 1920s, and the industry has been a major part of the local economy ever since.
Geography
Old Harbor is located on the eastern shore of Chiniak Bay, on Kodiak Island in the Gulf of Alaska. The village is surrounded by mountains and forests, and is located about 25 miles from the city of Kodiak. The area around Old Harbor is known for its rugged beauty, and is a popular destination for outdoor enthusiasts.
The climate in Old Harbor is mild and wet, with temperatures rarely dropping below freezing. The area receives an average of about 50 inches of rain per year, and is known for its frequent fog and mist.
Economy
The economy of Old Harbor is largely based on fishing and tourism. The local fishing industry is the main source of employment for the residents of the village, and the area is known for its abundant salmon and halibut. The fishing industry is supported by a number of processing plants and canneries in the area.
Tourism is also an important part of the local economy. The area is known for its rugged beauty, and is a popular destination for outdoor enthusiasts. The village is also home to a number of lodges and resorts, which provide accommodations for visitors.
Demographics
As of the 2010 census, the population of Old Harbor was 197. The population is largely Native American, with the majority of the population being of Alutiiq descent. The village is also home to a small number of non-Native Americans, mostly fishermen and other workers in the fishing industry.
The median household income in Old Harbor is $37,500, and the median home value is $150,000. The village has a high rate of poverty, with about 40% of the population living below the poverty line.
Conclusion
Old Harbor, Alaska is a small fishing village located on Kodiak Island in the Gulf of Alaska. It is the oldest permanent settlement on the island, and has a population of about 200 people. The village is surrounded by mountains and forests, and is known for its rugged beauty and abundant fishing. The economy of Old Harbor is largely based on fishing and tourism, and the population is largely Native American. The village has a high rate of poverty, but is a popular destination for outdoor enthusiasts.
Common Questions
What is Per Capita Income in Old Harbor?
Per Capita income in Old Harbor is $21,641.
What is the Median Household income in Old Harbor?
Median Household Income in Old Harbor is $40,156.
What is Income or Wage Gap in Old Harbor?
Income or Wage Gap in Old Harbor is 31.9%.
Women in Old Harbor earn 68.1 cents for every dollar earned by a man.
What is Inequality or Gini Index in Old Harbor?
Inequality or Gini Index in Old Harbor is 0.52.
What is the Total Population of Old Harbor?
Total Population of Old Harbor is 155.
What is the Total Male Population of Old Harbor?
Total Male Population of Old Harbor is 85.
What is the Total Female Population of Old Harbor?
Total Female Population of Old Harbor is 70.
What is the Ratio of Males per 100 Females in Old Harbor?
There are 121.43 Males per 100 Females in Old Harbor.
What is the Ratio of Females per 100 Males in Old Harbor?
There are 82.35 Females per 100 Males in Old Harbor.
What is the Median Population Age in Old Harbor?
Median Population Age in Old Harbor is 32.8 Years.
What is the Average Family Size in Old Harbor
Average Family Size in Old Harbor is 2.6 People.
What is the Average Household Size in Old Harbor
Average Household Size in Old Harbor is 2.1 People.
How Large is the Labor Force in Old Harbor?
There are 78 People in the Labor Forcein in Old Harbor.
What is the Percentage of People in the Labor Force in Old Harbor?
65.5% of People are in the Labor Force in Old Harbor.
What is the Unemployment Rate in Old Harbor?
Unemployment Rate in Old Harbor is 28.2%.