Nunapitchuk, AK Map & Demographics
Nunapitchuk Map
Nunapitchuk Overview
$13,326
PER CAPITA INCOME
$44,375
AVG FAMILY INCOME
$43,352
AVG HOUSEHOLD INCOME
61.6%
WAGE / INCOME GAP [ % ]
38.4¢/ $1
WAGE / INCOME GAP [ $ ]
0.50
INEQUALITY / GINI INDEX
827
TOTAL POPULATION
398
MALE POPULATION
429
FEMALE POPULATION
92.77
MALES / 100 FEMALES
107.79
FEMALES / 100 MALES
21.9
MEDIAN AGE
5.9
AVG FAMILY SIZE
5.4
AVG HOUSEHOLD SIZE
289
LABOR FORCE [ PEOPLE ]
59.2%
PERCENT IN LABOR FORCE
16.6%
UNEMPLOYMENT RATE
Nunapitchuk Zip Codes
Nunapitchuk Area Codes
Income in Nunapitchuk
Income Overview in Nunapitchuk
Per Capita Income in Nunapitchuk is $13,326, while median incomes of families and households are $44,375 and $43,352 respectively.
| Characteristic | Number | Measure |
| Per Capita Income | 827 | $13,326 |
| Median Family Income | 135 | $44,375 |
| Mean Family Income | 135 | $77,053 |
| Median Household Income | 153 | $43,352 |
| Mean Household Income | 153 | $70,460 |
| Income Deficit | 135 | $0 |
| Wage / Income Gap (%) | 827 | 61.65% |
| Wage / Income Gap ($) | 827 | 38.35¢ per $1 |
| Gini / Inequality Index | 827 | 0.50 |
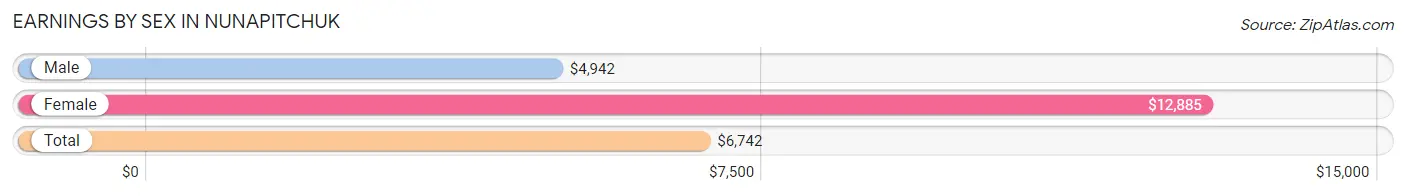
Earnings by Sex in Nunapitchuk
Average Earnings in Nunapitchuk are $6,742, $4,942 for men and $12,885 for women, a difference of 61.7%.
| Sex | Number | Average Earnings |
| Male | 144 (49.7%) | $4,942 |
| Female | 146 (50.3%) | $12,885 |
| Total | 290 (100.0%) | $6,742 |
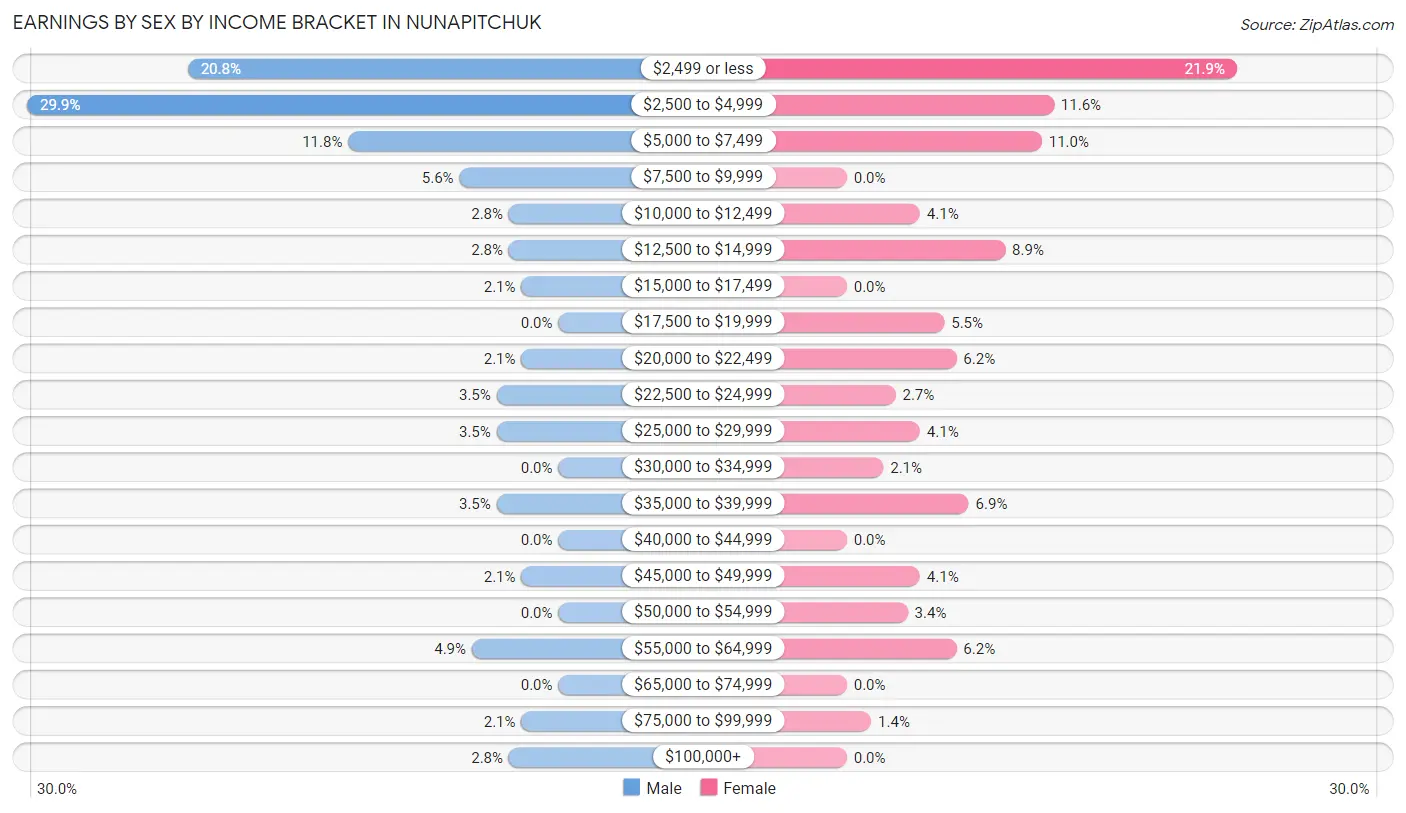
Earnings by Sex by Income Bracket in Nunapitchuk
The most common earnings brackets in Nunapitchuk are $2,500 to $4,999 for men (43 | 29.9%) and $2,499 or less for women (32 | 21.9%).
| Income | Male | Female |
| $2,499 or less | 30 (20.8%) | 32 (21.9%) |
| $2,500 to $4,999 | 43 (29.9%) | 17 (11.6%) |
| $5,000 to $7,499 | 17 (11.8%) | 16 (11.0%) |
| $7,500 to $9,999 | 8 (5.6%) | 0 (0.0%) |
| $10,000 to $12,499 | 4 (2.8%) | 6 (4.1%) |
| $12,500 to $14,999 | 4 (2.8%) | 13 (8.9%) |
| $15,000 to $17,499 | 3 (2.1%) | 0 (0.0%) |
| $17,500 to $19,999 | 0 (0.0%) | 8 (5.5%) |
| $20,000 to $22,499 | 3 (2.1%) | 9 (6.2%) |
| $22,500 to $24,999 | 5 (3.5%) | 4 (2.7%) |
| $25,000 to $29,999 | 5 (3.5%) | 6 (4.1%) |
| $30,000 to $34,999 | 0 (0.0%) | 3 (2.1%) |
| $35,000 to $39,999 | 5 (3.5%) | 10 (6.9%) |
| $40,000 to $44,999 | 0 (0.0%) | 0 (0.0%) |
| $45,000 to $49,999 | 3 (2.1%) | 6 (4.1%) |
| $50,000 to $54,999 | 0 (0.0%) | 5 (3.4%) |
| $55,000 to $64,999 | 7 (4.9%) | 9 (6.2%) |
| $65,000 to $74,999 | 0 (0.0%) | 0 (0.0%) |
| $75,000 to $99,999 | 3 (2.1%) | 2 (1.4%) |
| $100,000+ | 4 (2.8%) | 0 (0.0%) |
| Total | 144 (100.0%) | 146 (100.0%) |
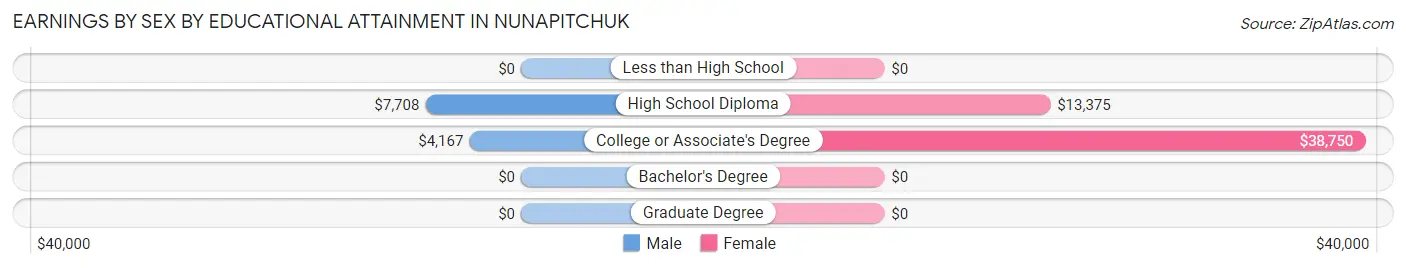
Earnings by Sex by Educational Attainment in Nunapitchuk
Average earnings in Nunapitchuk are $4,712 for men and $14,231 for women, a difference of 66.9%. Men with an educational attainment of high school diploma enjoy the highest average annual earnings of $7,708, while those with college or associate's degree education earn the least with $4,167. Women with an educational attainment of college or associate's degree earn the most with the average annual earnings of $38,750, while those with high school diploma education have the smallest earnings of $13,375.
| Educational Attainment | Male Income | Female Income |
| Less than High School | - | - |
| High School Diploma | $7,708 | $13,375 |
| College or Associate's Degree | $4,167 | $38,750 |
| Bachelor's Degree | - | - |
| Graduate Degree | - | - |
| Total | $4,712 | $14,231 |
Family Income in Nunapitchuk
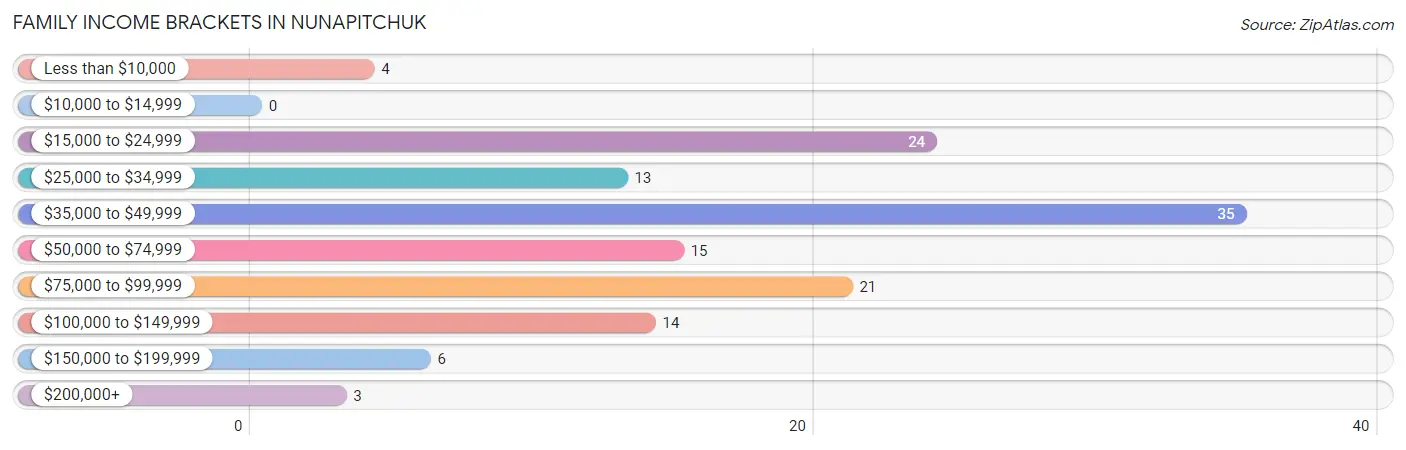
Family Income Brackets in Nunapitchuk
According to the Nunapitchuk family income data, there are 35 families falling into the $35,000 to $49,999 income range, which is the most common income bracket and makes up 25.9% of all families.
| Income Bracket | # Families | % Families |
| Less than $10,000 | 4 | 3.0% |
| $10,000 to $14,999 | 0 | 0.0% |
| $15,000 to $24,999 | 24 | 17.8% |
| $25,000 to $34,999 | 13 | 9.6% |
| $35,000 to $49,999 | 35 | 25.9% |
| $50,000 to $74,999 | 15 | 11.1% |
| $75,000 to $99,999 | 21 | 15.6% |
| $100,000 to $149,999 | 14 | 10.4% |
| $150,000 to $199,999 | 6 | 4.4% |
| $200,000+ | 3 | 2.2% |
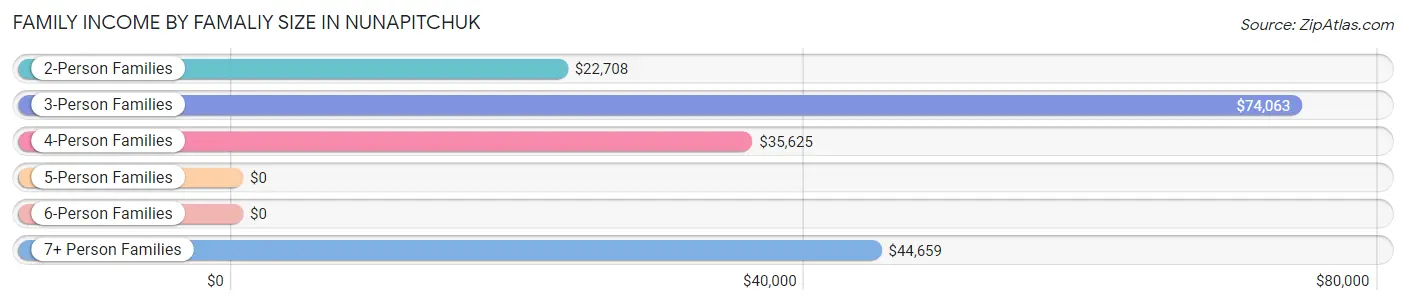
Family Income by Famaliy Size in Nunapitchuk
3-person families (7 | 5.2%) account for the highest median family income in Nunapitchuk with $74,063 per family, while 3-person families (7 | 5.2%) have the highest median income of $24,688 per family member.
| Income Bracket | # Families | Median Income |
| 2-Person Families | 11 (8.2%) | $22,708 |
| 3-Person Families | 7 (5.2%) | $74,063 |
| 4-Person Families | 25 (18.5%) | $35,625 |
| 5-Person Families | 17 (12.6%) | $0 |
| 6-Person Families | 15 (11.1%) | $0 |
| 7+ Person Families | 60 (44.4%) | $44,659 |
| Total | 135 (100.0%) | $44,375 |
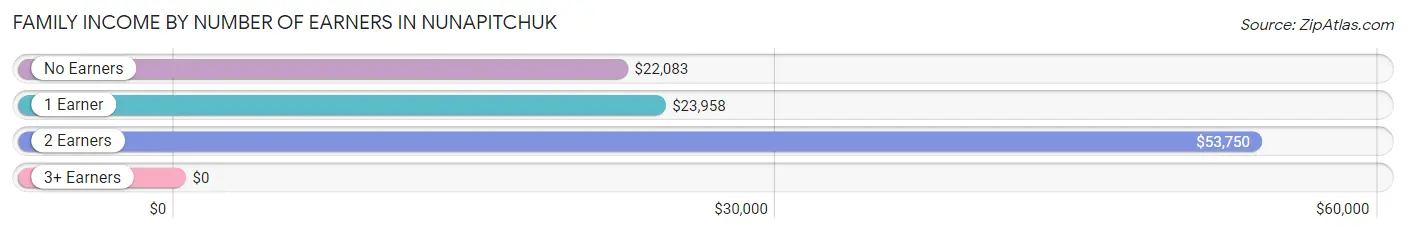
Family Income by Number of Earners in Nunapitchuk
| Number of Earners | # Families | Median Income |
| No Earners | 13 (9.6%) | $22,083 |
| 1 Earner | 21 (15.6%) | $23,958 |
| 2 Earners | 53 (39.3%) | $53,750 |
| 3+ Earners | 48 (35.6%) | $0 |
| Total | 135 (100.0%) | $44,375 |
Household Income in Nunapitchuk
Household Income Brackets in Nunapitchuk
With 39 households falling in the category, the $35,000 to $49,999 income range is the most frequent in Nunapitchuk, accounting for 25.5% of all households. In contrast, only 3 households (2.0%) fall into the $10,000 to $14,999 income bracket, making it the least populous group.

| Income Bracket | # Households | % Households |
| Less than $10,000 | 10 | 6.5% |
| $10,000 to $14,999 | 3 | 2.0% |
| $15,000 to $24,999 | 29 | 19.0% |
| $25,000 to $34,999 | 12 | 7.8% |
| $35,000 to $49,999 | 39 | 25.5% |
| $50,000 to $74,999 | 16 | 10.5% |
| $75,000 to $99,999 | 21 | 13.7% |
| $100,000 to $149,999 | 14 | 9.2% |
| $150,000 to $199,999 | 6 | 3.9% |
| $200,000+ | 3 | 2.0% |
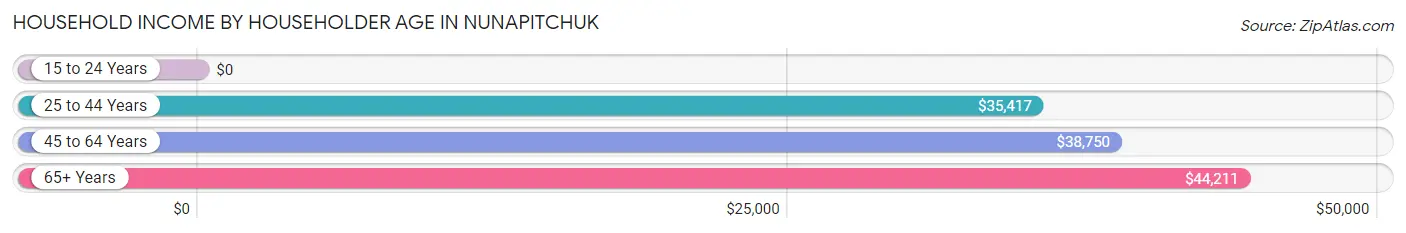
Household Income by Householder Age in Nunapitchuk
The median household income in Nunapitchuk is $43,352, with the highest median household income of $44,211 found in the 65+ years age bracket for the primary householder. A total of 66 households (43.1%) fall into this category.
| Income Bracket | # Households | Median Income |
| 15 to 24 Years | 0 (0.0%) | $0 |
| 25 to 44 Years | 19 (12.4%) | $35,417 |
| 45 to 64 Years | 68 (44.4%) | $38,750 |
| 65+ Years | 66 (43.1%) | $44,211 |
| Total | 153 (100.0%) | $43,352 |
Poverty in Nunapitchuk
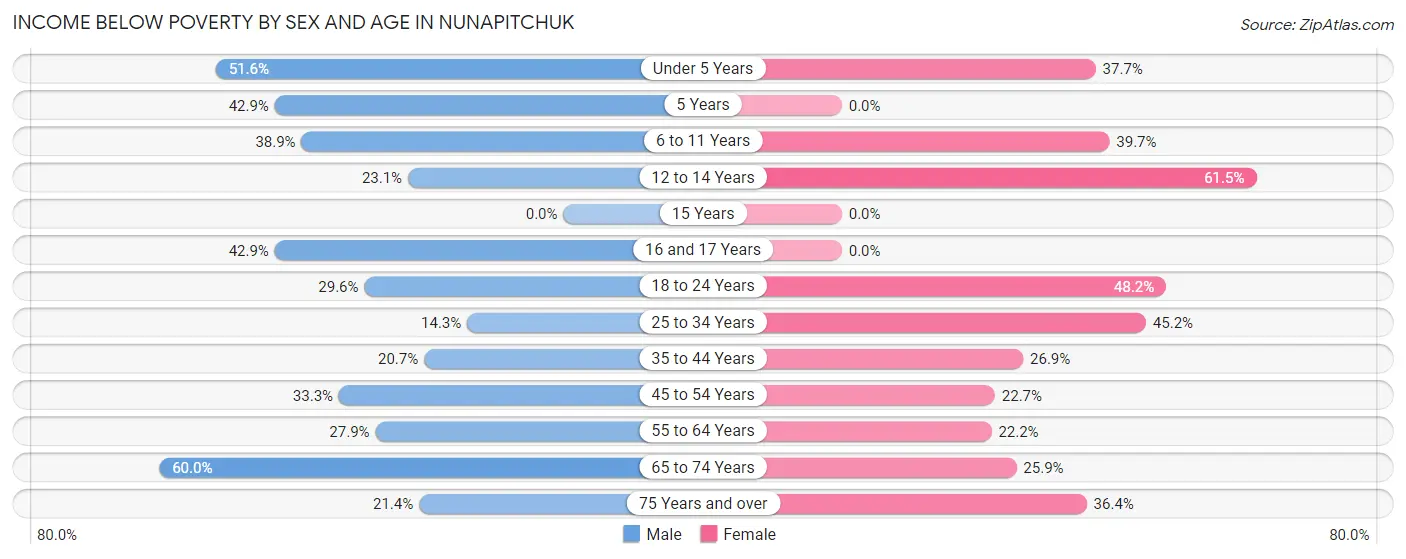
Income Below Poverty by Sex and Age in Nunapitchuk
With 34.4% poverty level for males and 35.9% for females among the residents of Nunapitchuk, 65 to 74 year old males and 12 to 14 year old females are the most vulnerable to poverty, with 21 males (60.0%) and 24 females (61.5%) in their respective age groups living below the poverty level.
| Age Bracket | Male | Female |
| Under 5 Years | 32 (51.6%) | 23 (37.7%) |
| 5 Years | 3 (42.9%) | 0 (0.0%) |
| 6 to 11 Years | 21 (38.9%) | 29 (39.7%) |
| 12 to 14 Years | 6 (23.1%) | 24 (61.5%) |
| 15 Years | 0 (0.0%) | 0 (0.0%) |
| 16 and 17 Years | 6 (42.9%) | 0 (0.0%) |
| 18 to 24 Years | 13 (29.5%) | 26 (48.1%) |
| 25 to 34 Years | 7 (14.3%) | 14 (45.2%) |
| 35 to 44 Years | 6 (20.7%) | 14 (26.9%) |
| 45 to 54 Years | 6 (33.3%) | 5 (22.7%) |
| 55 to 64 Years | 12 (27.9%) | 8 (22.2%) |
| 65 to 74 Years | 21 (60.0%) | 7 (25.9%) |
| 75 Years and over | 3 (21.4%) | 4 (36.4%) |
| Total | 136 (34.4%) | 154 (35.9%) |
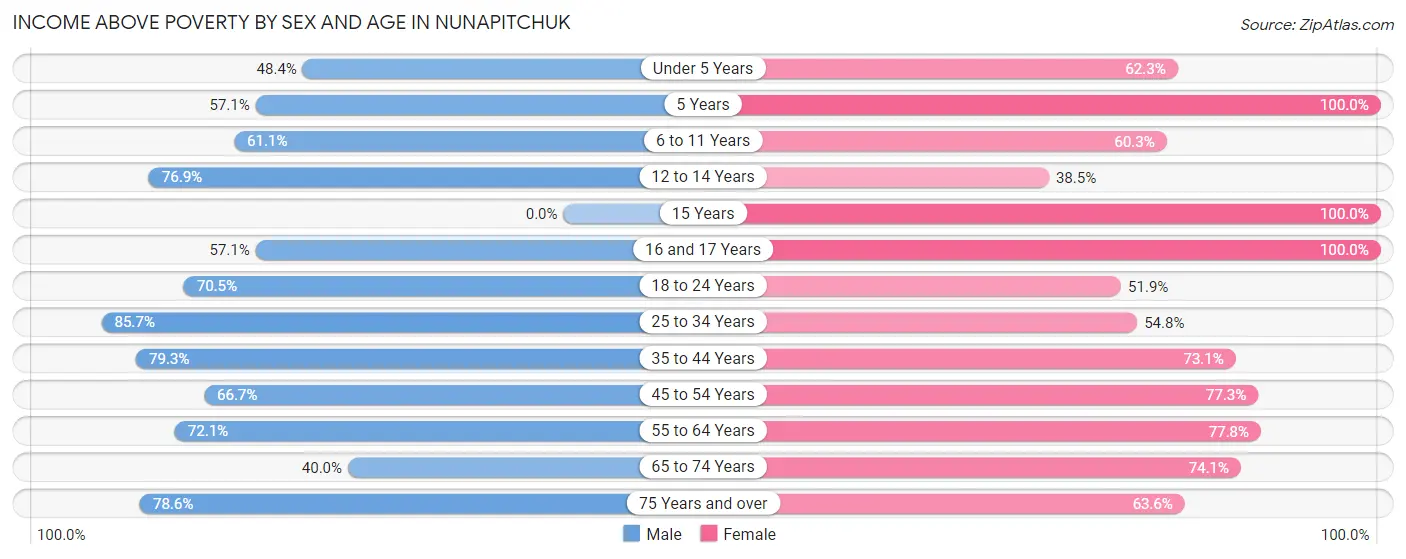
Income Above Poverty by Sex and Age in Nunapitchuk
According to the poverty statistics in Nunapitchuk, males aged 25 to 34 years and females aged 5 years are the age groups that are most secure financially, with 85.7% of males and 100.0% of females in these age groups living above the poverty line.
| Age Bracket | Male | Female |
| Under 5 Years | 30 (48.4%) | 38 (62.3%) |
| 5 Years | 4 (57.1%) | 13 (100.0%) |
| 6 to 11 Years | 33 (61.1%) | 44 (60.3%) |
| 12 to 14 Years | 20 (76.9%) | 15 (38.5%) |
| 15 Years | 0 (0.0%) | 1 (100.0%) |
| 16 and 17 Years | 8 (57.1%) | 9 (100.0%) |
| 18 to 24 Years | 31 (70.5%) | 28 (51.8%) |
| 25 to 34 Years | 42 (85.7%) | 17 (54.8%) |
| 35 to 44 Years | 23 (79.3%) | 38 (73.1%) |
| 45 to 54 Years | 12 (66.7%) | 17 (77.3%) |
| 55 to 64 Years | 31 (72.1%) | 28 (77.8%) |
| 65 to 74 Years | 14 (40.0%) | 20 (74.1%) |
| 75 Years and over | 11 (78.6%) | 7 (63.6%) |
| Total | 259 (65.6%) | 275 (64.1%) |
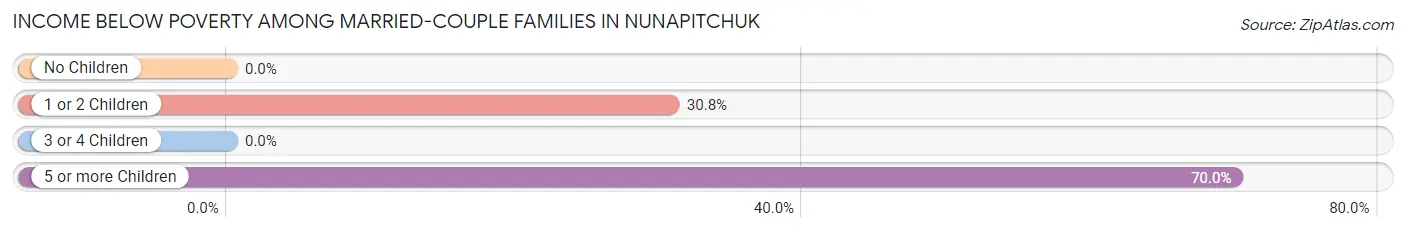
Income Below Poverty Among Married-Couple Families in Nunapitchuk
The poverty statistics for married-couple families in Nunapitchuk show that 45.0% or 36 of the total 80 families live below the poverty line. Families with 5 or more children have the highest poverty rate of 70.0%, comprising of 28 families. On the other hand, families with no children have the lowest poverty rate of 0.0%, which includes 0 families.
| Children | Above Poverty | Below Poverty |
| No Children | 7 (100.0%) | 0 (0.0%) |
| 1 or 2 Children | 18 (69.2%) | 8 (30.8%) |
| 3 or 4 Children | 7 (100.0%) | 0 (0.0%) |
| 5 or more Children | 12 (30.0%) | 28 (70.0%) |
| Total | 44 (55.0%) | 36 (45.0%) |
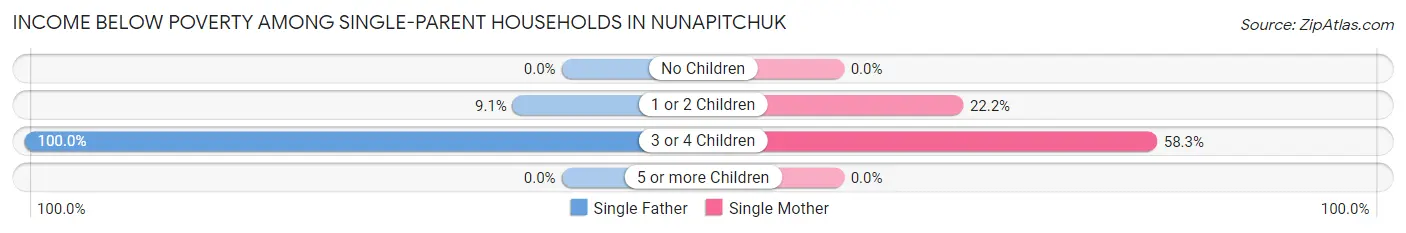
Income Below Poverty Among Single-Parent Households in Nunapitchuk
According to the poverty data in Nunapitchuk, 16.7% or 4 single-father households and 29.0% or 9 single-mother households are living below the poverty line. Among single-father households, those with 3 or 4 children have the highest poverty rate, with 3 households (100.0%) experiencing poverty. Likewise, among single-mother households, those with 3 or 4 children have the highest poverty rate, with 7 households (58.3%) falling below the poverty line.
| Children | Single Father | Single Mother |
| No Children | 0 (0.0%) | 0 (0.0%) |
| 1 or 2 Children | 1 (9.1%) | 2 (22.2%) |
| 3 or 4 Children | 3 (100.0%) | 7 (58.3%) |
| 5 or more Children | 0 (0.0%) | 0 (0.0%) |
| Total | 4 (16.7%) | 9 (29.0%) |
Income Below Poverty Among Married-Couple vs Single-Parent Households in Nunapitchuk
The poverty data for Nunapitchuk shows that 36 of the married-couple family households (45.0%) and 13 of the single-parent households (23.6%) are living below the poverty level. Within the married-couple family households, those with 5 or more children have the highest poverty rate, with 28 households (70.0%) falling below the poverty line. Among the single-parent households, those with 3 or 4 children have the highest poverty rate, with 10 household (66.7%) living below poverty.
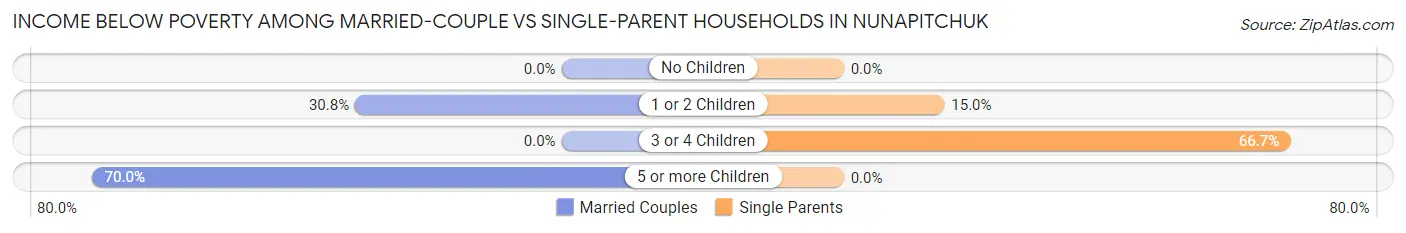
| Children | Married-Couple Families | Single-Parent Households |
| No Children | 0 (0.0%) | 0 (0.0%) |
| 1 or 2 Children | 8 (30.8%) | 3 (15.0%) |
| 3 or 4 Children | 0 (0.0%) | 10 (66.7%) |
| 5 or more Children | 28 (70.0%) | 0 (0.0%) |
| Total | 36 (45.0%) | 13 (23.6%) |
Race in Nunapitchuk
The most populous races in Nunapitchuk are Native / Alaskan (816 | 98.7%), Hispanic or Latino (14 | 1.7%), and Two or more Races (11 | 1.3%).
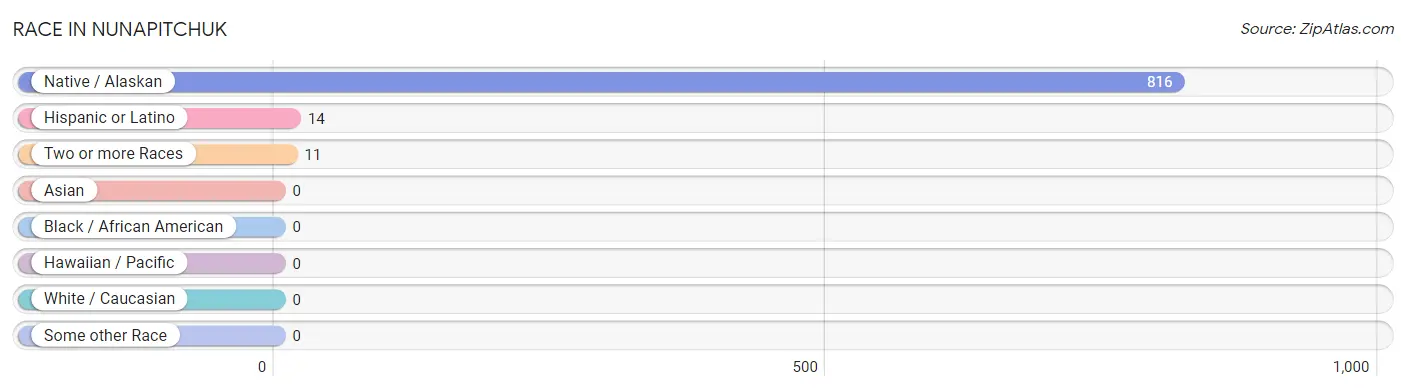
| Race | # Population | % Population |
| Asian | 0 | 0.0% |
| Black / African American | 0 | 0.0% |
| Hawaiian / Pacific | 0 | 0.0% |
| Hispanic or Latino | 14 | 1.7% |
| Native / Alaskan | 816 | 98.7% |
| White / Caucasian | 0 | 0.0% |
| Two or more Races | 11 | 1.3% |
| Some other Race | 0 | 0.0% |
| Total | 827 | 100.0% |
Ancestry in Nunapitchuk
The most populous ancestries reported in Nunapitchuk are Yup'ik (767 | 92.7%), Inupiat (50 | 6.0%), Alaska Native (6 | 0.7%), Mexican (3 | 0.4%), and Aleut (2 | 0.2%), together accounting for 100.1% of all Nunapitchuk residents.
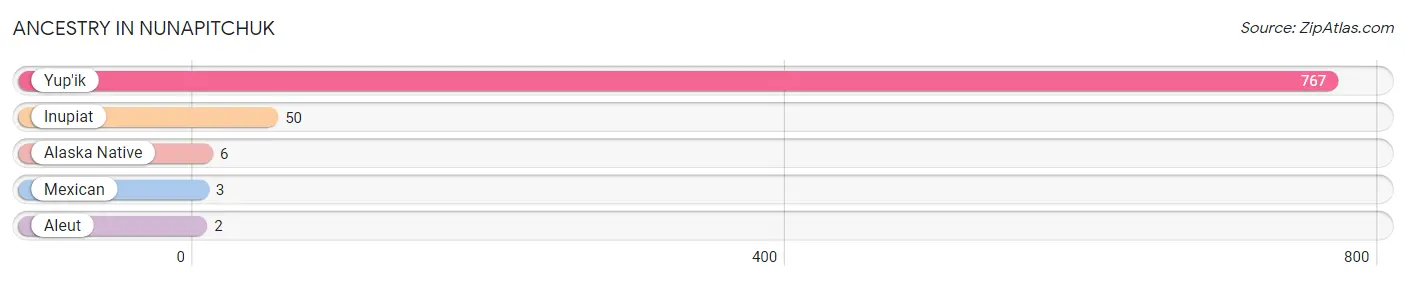
| Ancestry | # Population | % Population |
| Alaska Native | 6 | 0.7% |
| Aleut | 2 | 0.2% |
| Inupiat | 50 | 6.0% |
| Mexican | 3 | 0.4% |
| Yup'ik | 767 | 92.7% | View All 5 Rows |
Immigrants in Nunapitchuk

| Immigration Origin | # Population | % Population | View All 0 Rows |
Sex and Age in Nunapitchuk
Sex and Age in Nunapitchuk
The most populous age groups in Nunapitchuk are Under 5 Years (65 | 16.3%) for men and 5 to 9 Years (70 | 16.3%) for women.
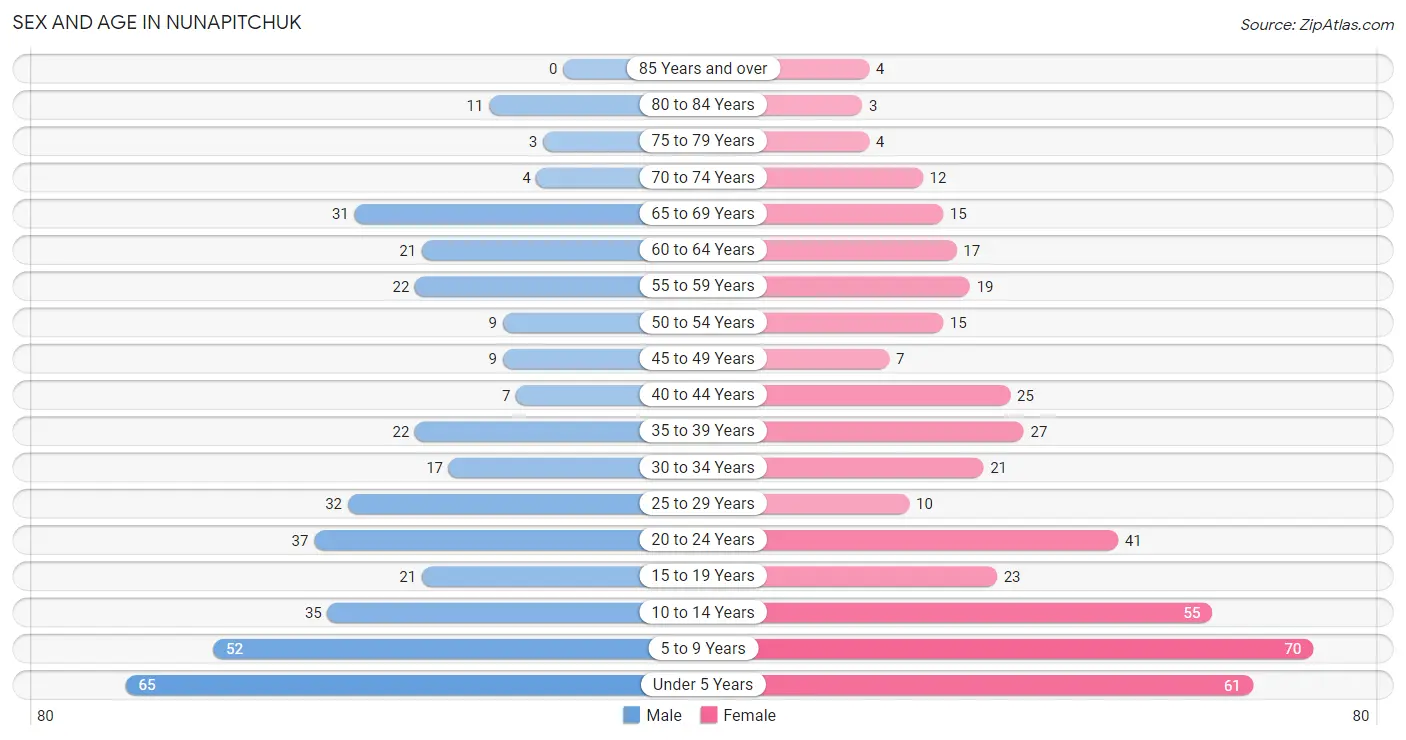
| Age Bracket | Male | Female |
| Under 5 Years | 65 (16.3%) | 61 (14.2%) |
| 5 to 9 Years | 52 (13.1%) | 70 (16.3%) |
| 10 to 14 Years | 35 (8.8%) | 55 (12.8%) |
| 15 to 19 Years | 21 (5.3%) | 23 (5.4%) |
| 20 to 24 Years | 37 (9.3%) | 41 (9.6%) |
| 25 to 29 Years | 32 (8.0%) | 10 (2.3%) |
| 30 to 34 Years | 17 (4.3%) | 21 (4.9%) |
| 35 to 39 Years | 22 (5.5%) | 27 (6.3%) |
| 40 to 44 Years | 7 (1.8%) | 25 (5.8%) |
| 45 to 49 Years | 9 (2.3%) | 7 (1.6%) |
| 50 to 54 Years | 9 (2.3%) | 15 (3.5%) |
| 55 to 59 Years | 22 (5.5%) | 19 (4.4%) |
| 60 to 64 Years | 21 (5.3%) | 17 (4.0%) |
| 65 to 69 Years | 31 (7.8%) | 15 (3.5%) |
| 70 to 74 Years | 4 (1.0%) | 12 (2.8%) |
| 75 to 79 Years | 3 (0.7%) | 4 (0.9%) |
| 80 to 84 Years | 11 (2.8%) | 3 (0.7%) |
| 85 Years and over | 0 (0.0%) | 4 (0.9%) |
| Total | 398 (100.0%) | 429 (100.0%) |
Families and Households in Nunapitchuk
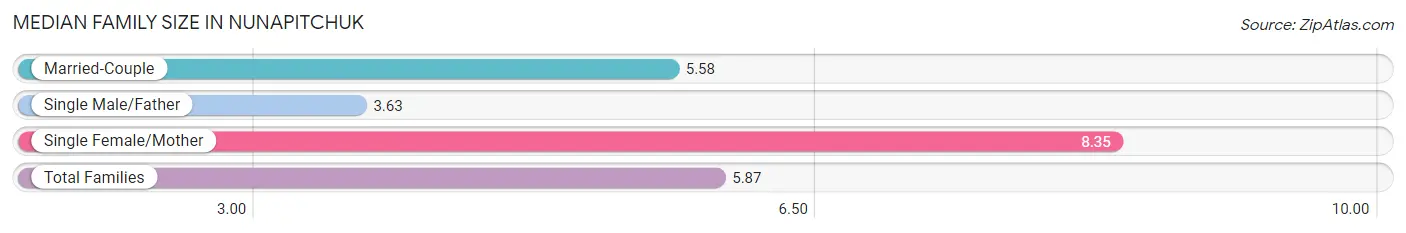
Median Family Size in Nunapitchuk
The median family size in Nunapitchuk is 5.87 persons per family, with single female/mother families (31 | 23.0%) accounting for the largest median family size of 8.35 persons per family. On the other hand, single male/father families (24 | 17.8%) represent the smallest median family size with 3.63 persons per family.
| Family Type | # Families | Family Size |
| Married-Couple | 80 (59.3%) | 5.58 |
| Single Male/Father | 24 (17.8%) | 3.63 |
| Single Female/Mother | 31 (23.0%) | 8.35 |
| Total Families | 135 (100.0%) | 5.87 |
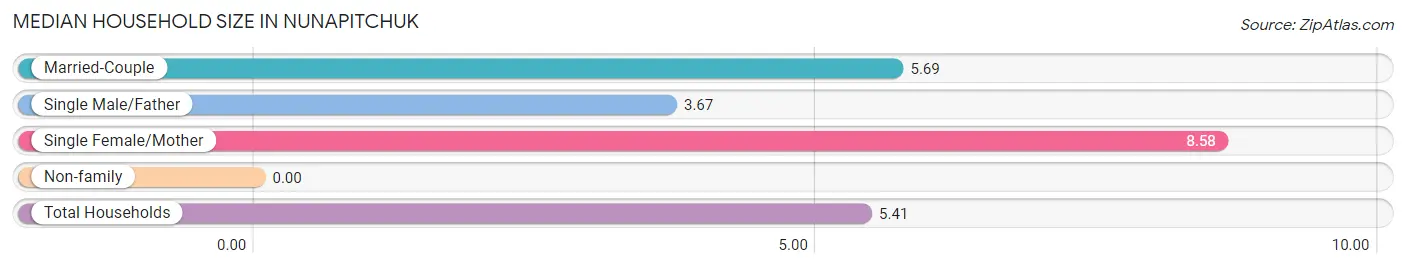
Median Household Size in Nunapitchuk
| Household Type | # Households | Household Size |
| Married-Couple | 80 (52.3%) | 5.69 |
| Single Male/Father | 24 (15.7%) | 3.67 |
| Single Female/Mother | 31 (20.3%) | 8.58 |
| Non-family | 18 (11.8%) | - |
| Total Households | 153 (100.0%) | 5.41 |
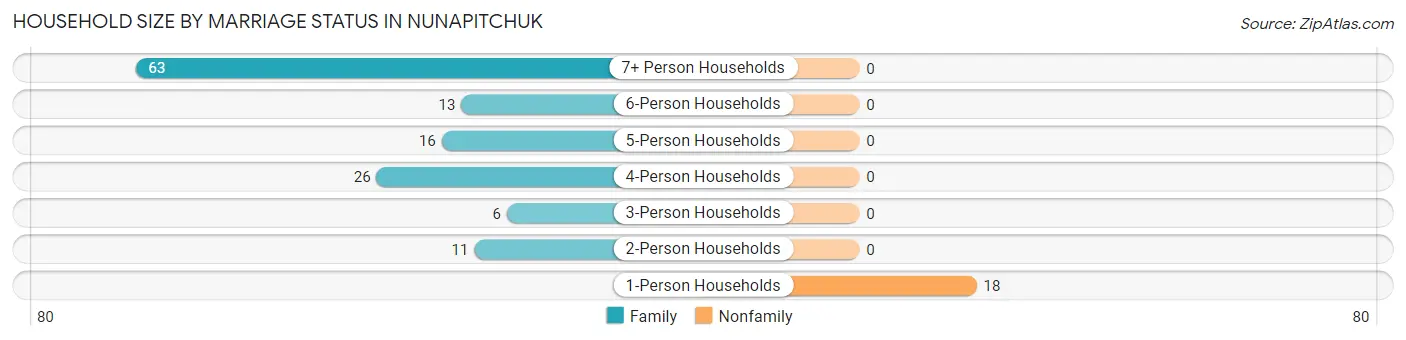
Household Size by Marriage Status in Nunapitchuk
Out of a total of 153 households in Nunapitchuk, 135 (88.2%) are family households, while 18 (11.8%) are nonfamily households. The most numerous type of family households are 7+ person households, comprising 63, and the most common type of nonfamily households are 1-person households, comprising 18.
| Household Size | Family Households | Nonfamily Households |
| 1-Person Households | - | 18 (11.8%) |
| 2-Person Households | 11 (7.2%) | 0 (0.0%) |
| 3-Person Households | 6 (3.9%) | 0 (0.0%) |
| 4-Person Households | 26 (17.0%) | 0 (0.0%) |
| 5-Person Households | 16 (10.5%) | 0 (0.0%) |
| 6-Person Households | 13 (8.5%) | 0 (0.0%) |
| 7+ Person Households | 63 (41.2%) | 0 (0.0%) |
| Total | 135 (88.2%) | 18 (11.8%) |
Female Fertility in Nunapitchuk
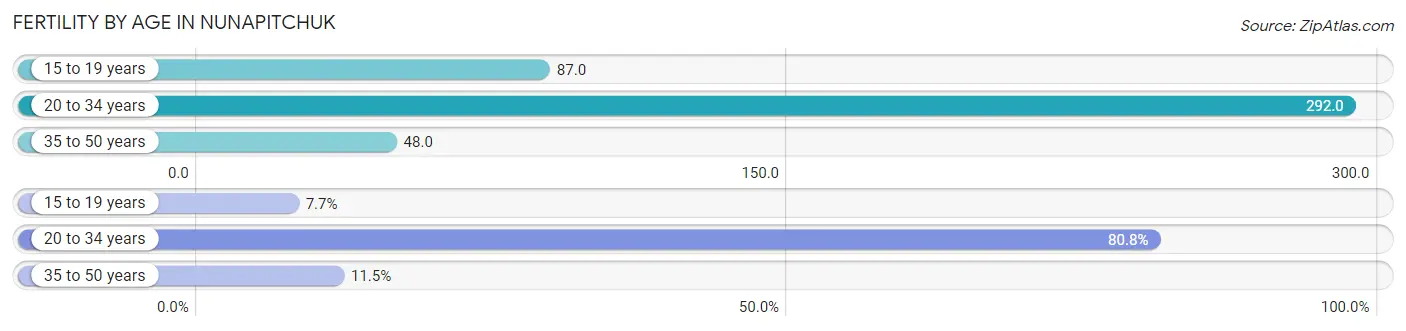
Fertility by Age in Nunapitchuk
Average fertility rate in Nunapitchuk is 165.0 births per 1,000 women. Women in the age bracket of 20 to 34 years have the highest fertility rate with 292.0 births per 1,000 women. Women in the age bracket of 20 to 34 years acount for 80.8% of all women with births.
| Age Bracket | Women with Births | Births / 1,000 Women |
| 15 to 19 years | 2 (7.7%) | 87.0 |
| 20 to 34 years | 21 (80.8%) | 292.0 |
| 35 to 50 years | 3 (11.5%) | 48.0 |
| Total | 26 (100.0%) | 165.0 |
Fertility by Age by Marriage Status in Nunapitchuk
26.9% of women with births (26) in Nunapitchuk are married. The highest percentage of unmarried women with births falls into 15 to 19 years age bracket with 100.0% of them unmarried at the time of birth, while the lowest percentage of unmarried women with births belong to 35 to 50 years age bracket with 0.0% of them unmarried.
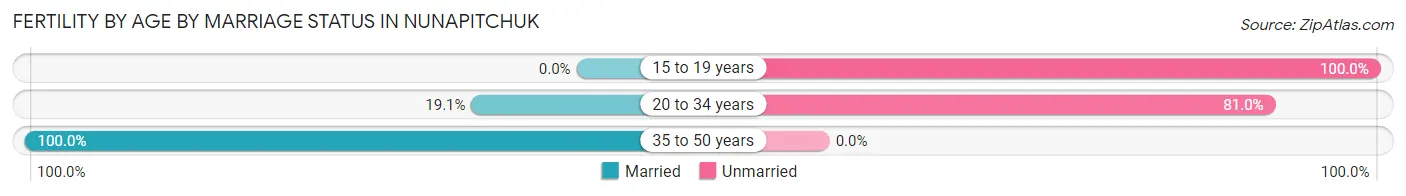
| Age Bracket | Married | Unmarried |
| 15 to 19 years | 0 (0.0%) | 2 (100.0%) |
| 20 to 34 years | 4 (19.1%) | 17 (80.9%) |
| 35 to 50 years | 3 (100.0%) | 0 (0.0%) |
| Total | 7 (26.9%) | 19 (73.1%) |
Fertility by Education in Nunapitchuk
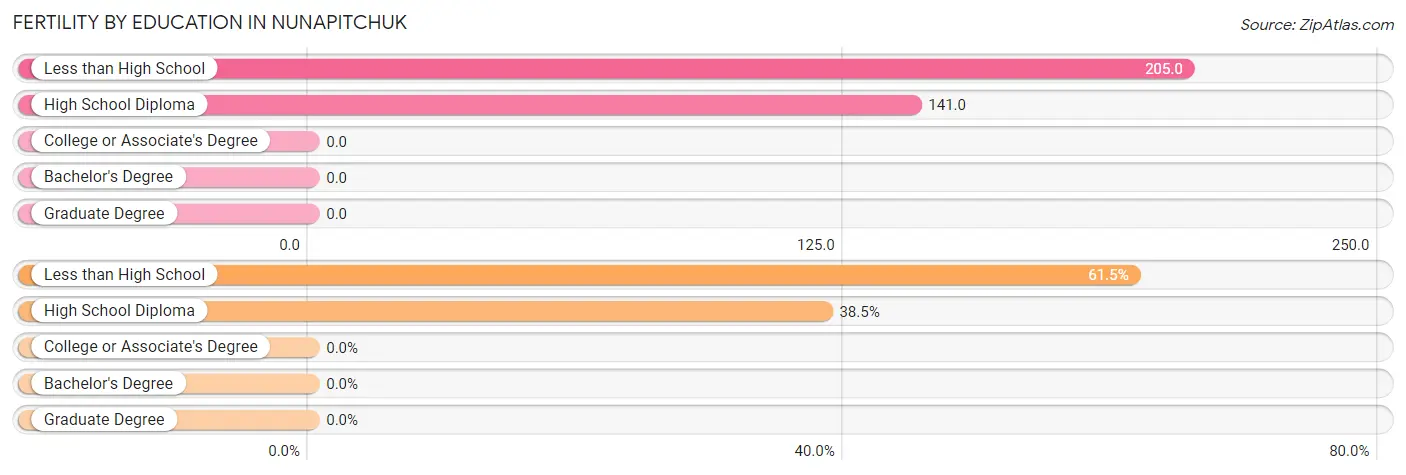
| Educational Attainment | Women with Births | Births / 1,000 Women |
| Less than High School | 16 (61.5%) | 205.0 |
| High School Diploma | 10 (38.5%) | 141.0 |
| College or Associate's Degree | 0 (0.0%) | 0.0 |
| Bachelor's Degree | 0 (0.0%) | 0.0 |
| Graduate Degree | 0 (0.0%) | 0.0 |
| Total | 26 (100.0%) | 165.0 |
Fertility by Education by Marriage Status in Nunapitchuk
73.1% of women with births in Nunapitchuk are unmarried. Women with the educational attainment of high school diploma are most likely to be married with 30.0% of them married at childbirth, while women with the educational attainment of less than high school are least likely to be married with 75.0% of them unmarried at childbirth.
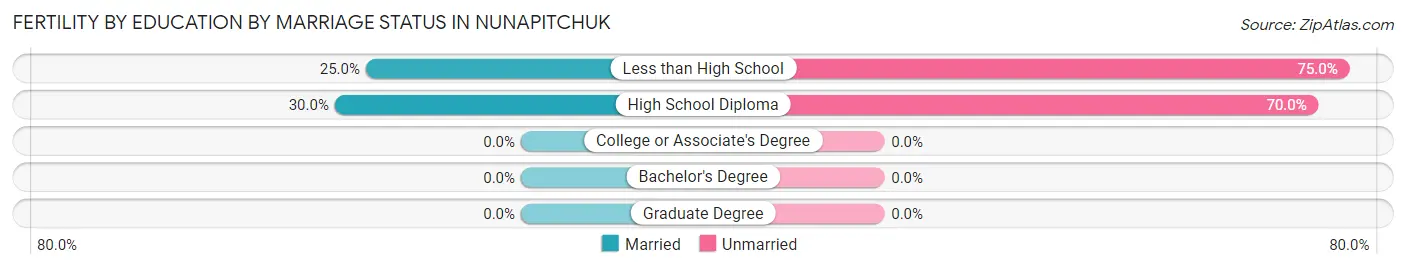
| Educational Attainment | Married | Unmarried |
| Less than High School | 4 (25.0%) | 12 (75.0%) |
| High School Diploma | 3 (30.0%) | 7 (70.0%) |
| College or Associate's Degree | 0 (0.0%) | 0 (0.0%) |
| Bachelor's Degree | 0 (0.0%) | 0 (0.0%) |
| Graduate Degree | 0 (0.0%) | 0 (0.0%) |
| Total | 7 (26.9%) | 19 (73.1%) |
Employment Characteristics in Nunapitchuk
Employment by Class of Employer in Nunapitchuk
Among the 241 employed individuals in Nunapitchuk, local government employees (169 | 70.1%), state government employees (24 | 10.0%), and private company employees (23 | 9.5%) make up the most common classes of employment.
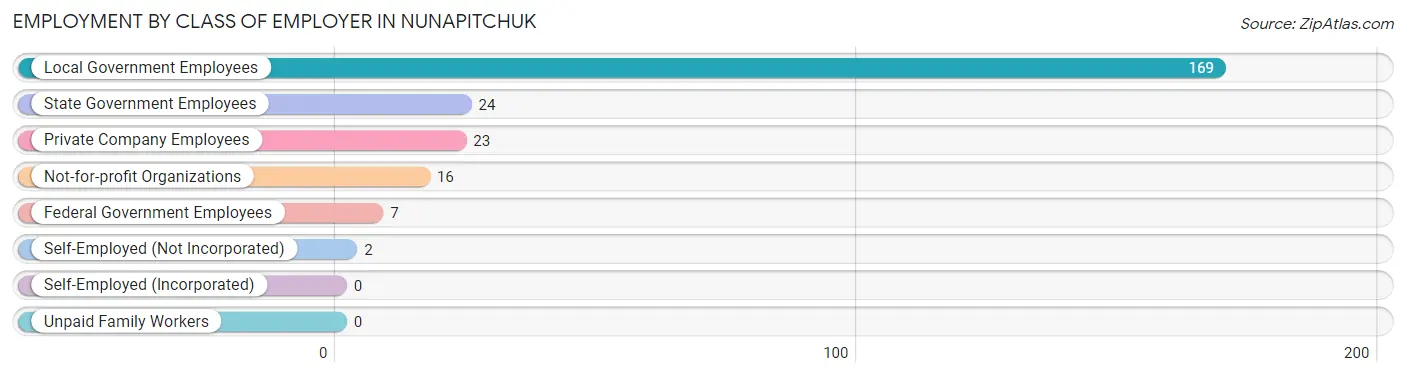
| Employer Class | # Employees | % Employees |
| Private Company Employees | 23 | 9.5% |
| Self-Employed (Incorporated) | 0 | 0.0% |
| Self-Employed (Not Incorporated) | 2 | 0.8% |
| Not-for-profit Organizations | 16 | 6.6% |
| Local Government Employees | 169 | 70.1% |
| State Government Employees | 24 | 10.0% |
| Federal Government Employees | 7 | 2.9% |
| Unpaid Family Workers | 0 | 0.0% |
| Total | 241 | 100.0% |
Employment Status by Age in Nunapitchuk
According to the labor force statistics for Nunapitchuk, out of the total population over 16 years of age (488), 59.2% or 289 individuals are in the labor force, with 16.6% or 48 of them unemployed. The age group with the highest labor force participation rate is 35 to 44 years, with 92.6% or 75 individuals in the labor force. Within the labor force, the 16 to 19 years age range has the highest percentage of unemployed individuals, with 100.0% or 4 of them being unemployed.
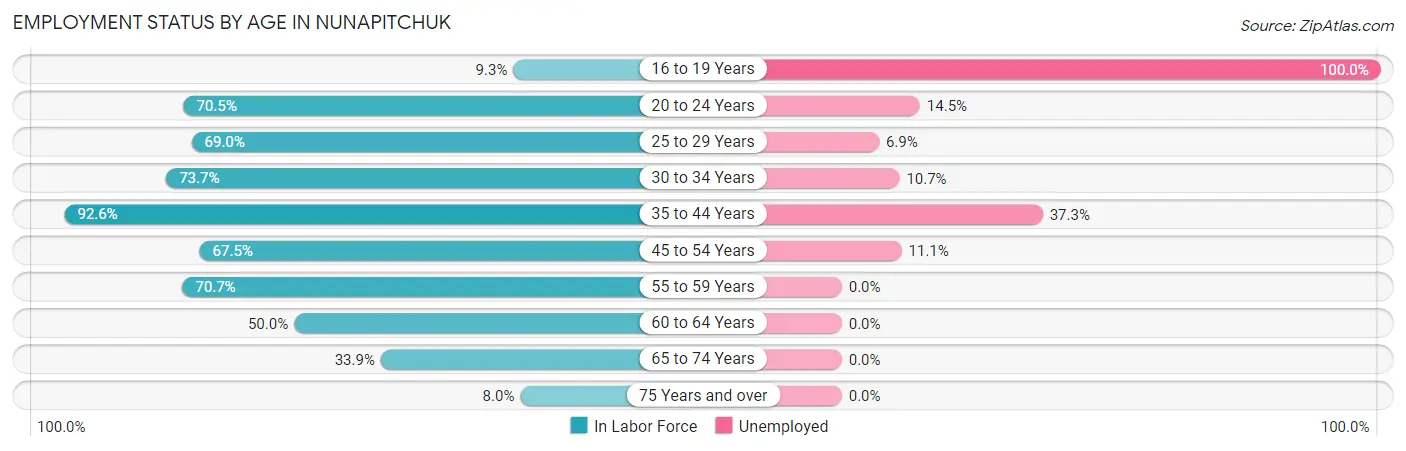
| Age Bracket | In Labor Force | Unemployed |
| 16 to 19 Years | 4 (9.3%) | 4 (100.0%) |
| 20 to 24 Years | 55 (70.5%) | 8 (14.5%) |
| 25 to 29 Years | 29 (69.0%) | 2 (6.9%) |
| 30 to 34 Years | 28 (73.7%) | 3 (10.7%) |
| 35 to 44 Years | 75 (92.6%) | 28 (37.3%) |
| 45 to 54 Years | 27 (67.5%) | 3 (11.1%) |
| 55 to 59 Years | 29 (70.7%) | 0 (0.0%) |
| 60 to 64 Years | 19 (50.0%) | 0 (0.0%) |
| 65 to 74 Years | 21 (33.9%) | 0 (0.0%) |
| 75 Years and over | 2 (8.0%) | 0 (0.0%) |
| Total | 289 (59.2%) | 48 (16.6%) |
Employment Status by Educational Attainment in Nunapitchuk
According to labor force statistics for Nunapitchuk, 73.9% of individuals (207) out of the total population between 25 and 64 years of age (280) are in the labor force, with 17.4% or 36 of them being unemployed. The group with the highest labor force participation rate are those with the educational attainment of bachelor's degree or higher, with 100.0% or 8 individuals in the labor force. Within the labor force, individuals with less than high school education have the highest percentage of unemployment, with 39.6% or 19 of them being unemployed.
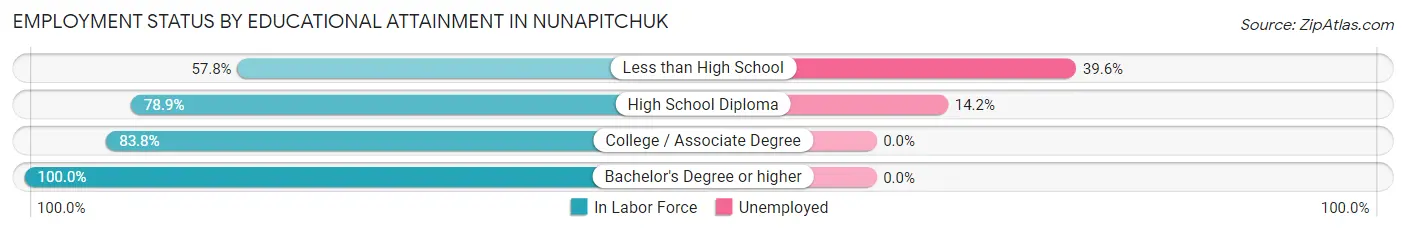
| Educational Attainment | In Labor Force | Unemployed |
| Less than High School | 48 (57.8%) | 33 (39.6%) |
| High School Diploma | 120 (78.9%) | 22 (14.2%) |
| College / Associate Degree | 31 (83.8%) | 0 (0.0%) |
| Bachelor's Degree or higher | 8 (100.0%) | 0 (0.0%) |
| Total | 207 (73.9%) | 49 (17.4%) |
Employment Occupations by Sex in Nunapitchuk
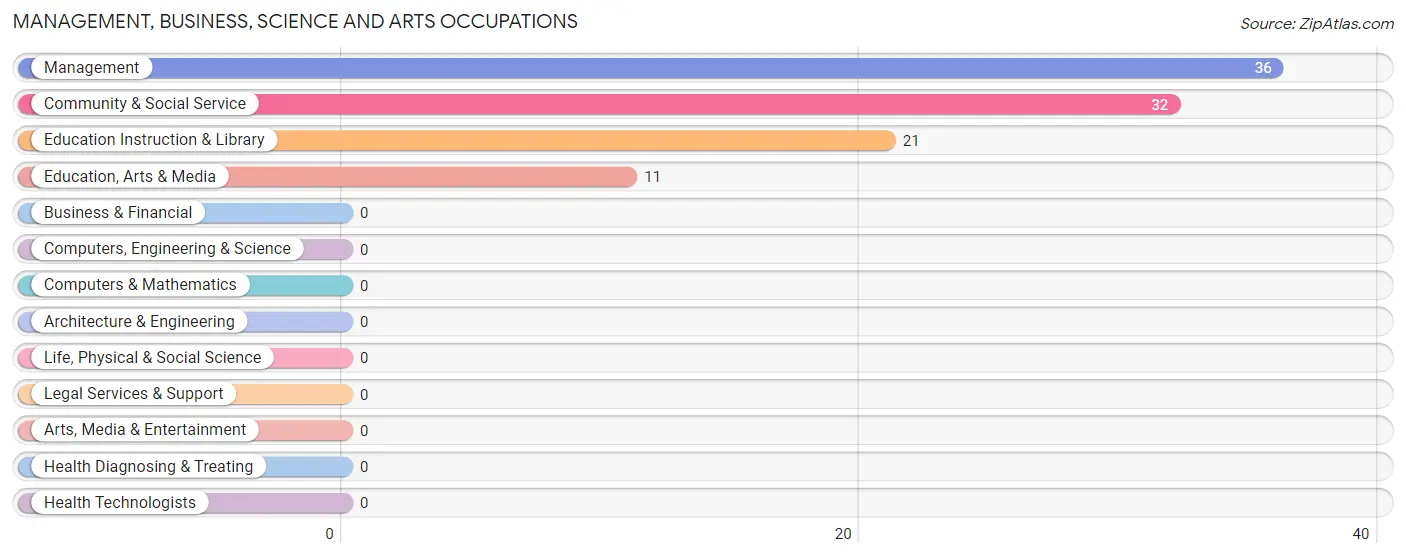
Management, Business, Science and Arts Occupations
The most common Management, Business, Science and Arts occupations in Nunapitchuk are Management (36 | 14.9%), Community & Social Service (32 | 13.3%), Education Instruction & Library (21 | 8.7%), and Education, Arts & Media (11 | 4.6%).
Management, Business, Science and Arts Occupations by Sex
Within the Management, Business, Science and Arts occupations in Nunapitchuk, the most male-oriented occupations are Management (83.3%), Education Instruction & Library (14.3%), and Community & Social Service (9.4%), while the most female-oriented occupations are Education, Arts & Media (100.0%), Community & Social Service (90.6%), and Education Instruction & Library (85.7%).
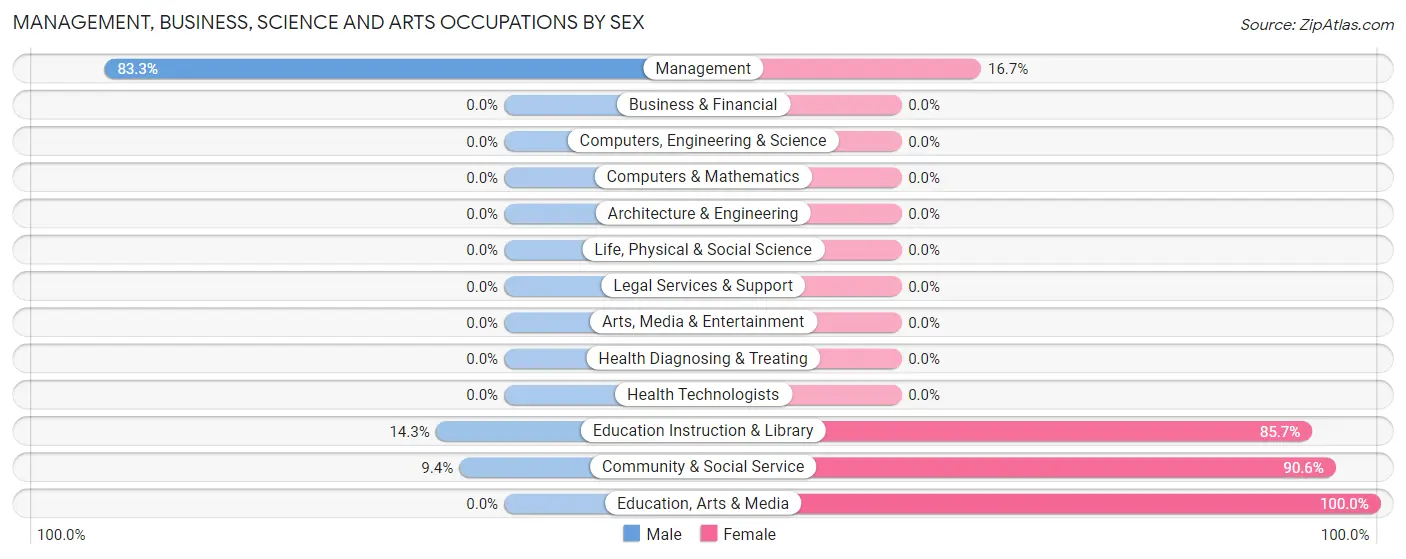
| Occupation | Male | Female |
| Management | 30 (83.3%) | 6 (16.7%) |
| Business & Financial | 0 (0.0%) | 0 (0.0%) |
| Computers, Engineering & Science | 0 (0.0%) | 0 (0.0%) |
| Computers & Mathematics | 0 (0.0%) | 0 (0.0%) |
| Architecture & Engineering | 0 (0.0%) | 0 (0.0%) |
| Life, Physical & Social Science | 0 (0.0%) | 0 (0.0%) |
| Community & Social Service | 3 (9.4%) | 29 (90.6%) |
| Education, Arts & Media | 0 (0.0%) | 11 (100.0%) |
| Legal Services & Support | 0 (0.0%) | 0 (0.0%) |
| Education Instruction & Library | 3 (14.3%) | 18 (85.7%) |
| Arts, Media & Entertainment | 0 (0.0%) | 0 (0.0%) |
| Health Diagnosing & Treating | 0 (0.0%) | 0 (0.0%) |
| Health Technologists | 0 (0.0%) | 0 (0.0%) |
| Total (Category) | 33 (48.5%) | 35 (51.5%) |
| Total (Overall) | 118 (49.0%) | 123 (51.0%) |
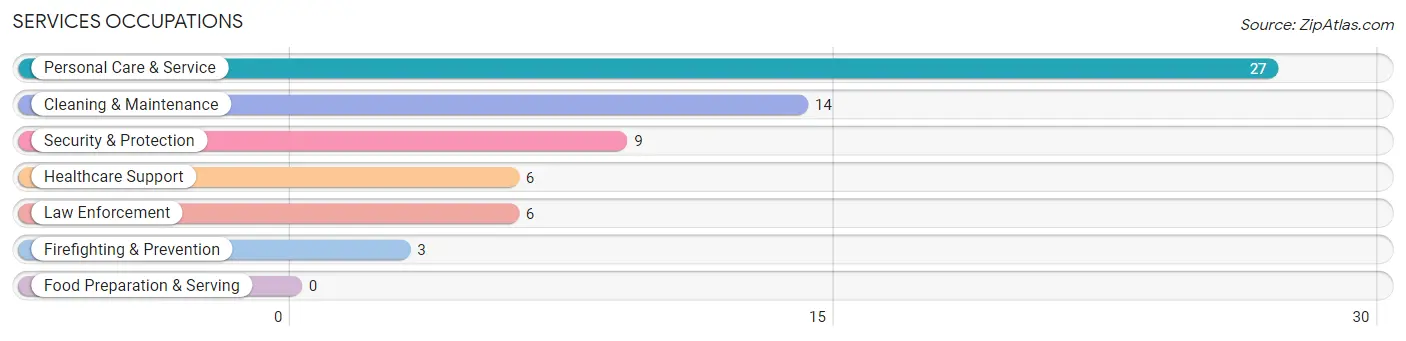
Services Occupations
The most common Services occupations in Nunapitchuk are Personal Care & Service (27 | 11.2%), Cleaning & Maintenance (14 | 5.8%), Security & Protection (9 | 3.7%), Healthcare Support (6 | 2.5%), and Law Enforcement (6 | 2.5%).
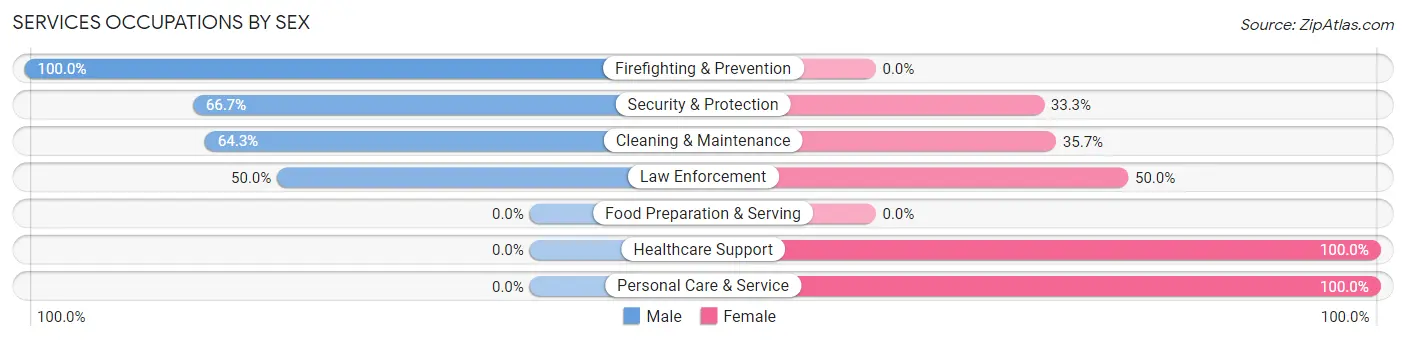
Services Occupations by Sex
Within the Services occupations in Nunapitchuk, the most male-oriented occupations are Firefighting & Prevention (100.0%), Security & Protection (66.7%), and Cleaning & Maintenance (64.3%), while the most female-oriented occupations are Healthcare Support (100.0%), Personal Care & Service (100.0%), and Law Enforcement (50.0%).
| Occupation | Male | Female |
| Healthcare Support | 0 (0.0%) | 6 (100.0%) |
| Security & Protection | 6 (66.7%) | 3 (33.3%) |
| Firefighting & Prevention | 3 (100.0%) | 0 (0.0%) |
| Law Enforcement | 3 (50.0%) | 3 (50.0%) |
| Food Preparation & Serving | 0 (0.0%) | 0 (0.0%) |
| Cleaning & Maintenance | 9 (64.3%) | 5 (35.7%) |
| Personal Care & Service | 0 (0.0%) | 27 (100.0%) |
| Total (Category) | 15 (26.8%) | 41 (73.2%) |
| Total (Overall) | 118 (49.0%) | 123 (51.0%) |
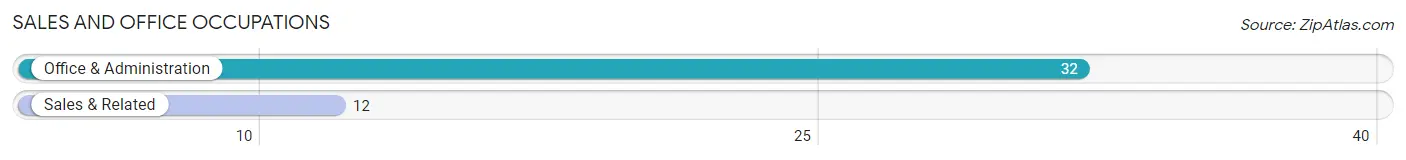
Sales and Office Occupations
The most common Sales and Office occupations in Nunapitchuk are Office & Administration (32 | 13.3%), and Sales & Related (12 | 5.0%).
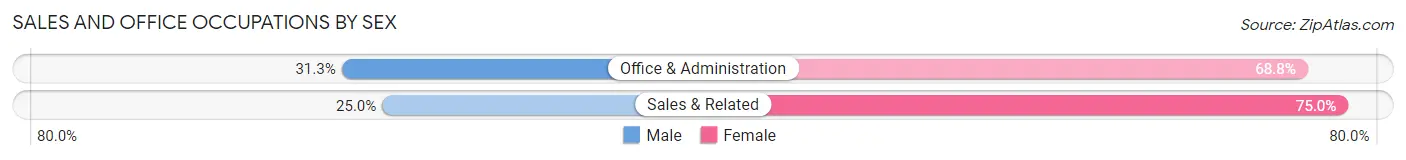
Sales and Office Occupations by Sex
| Occupation | Male | Female |
| Sales & Related | 3 (25.0%) | 9 (75.0%) |
| Office & Administration | 10 (31.2%) | 22 (68.8%) |
| Total (Category) | 13 (29.5%) | 31 (70.5%) |
| Total (Overall) | 118 (49.0%) | 123 (51.0%) |
Natural Resources, Construction and Maintenance Occupations
The most common Natural Resources, Construction and Maintenance occupations in Nunapitchuk are Construction & Extraction (8 | 3.3%), and Installation, Maintenance & Repair (3 | 1.2%).
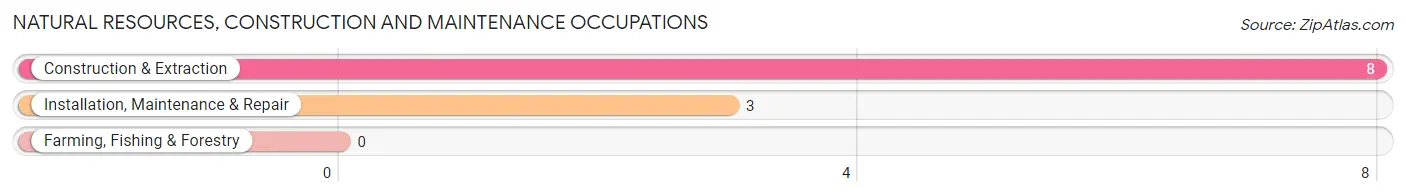
Natural Resources, Construction and Maintenance Occupations by Sex
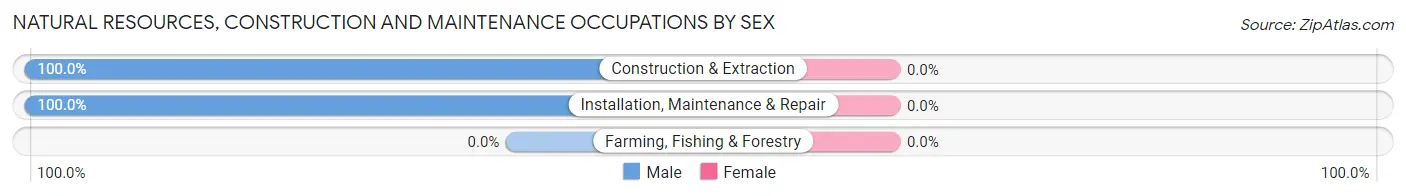
| Occupation | Male | Female |
| Farming, Fishing & Forestry | 0 (0.0%) | 0 (0.0%) |
| Construction & Extraction | 8 (100.0%) | 0 (0.0%) |
| Installation, Maintenance & Repair | 3 (100.0%) | 0 (0.0%) |
| Total (Category) | 11 (100.0%) | 0 (0.0%) |
| Total (Overall) | 118 (49.0%) | 123 (51.0%) |
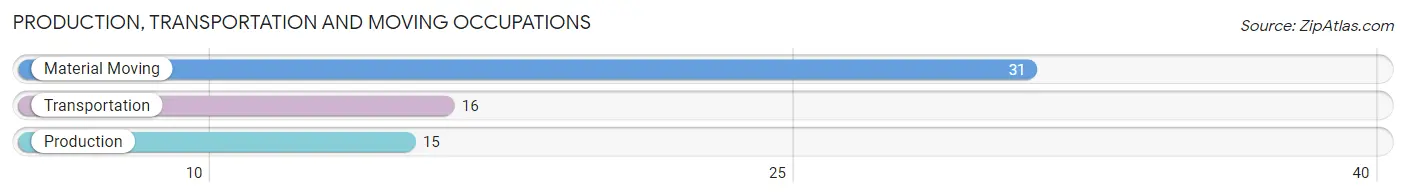
Production, Transportation and Moving Occupations
The most common Production, Transportation and Moving occupations in Nunapitchuk are Material Moving (31 | 12.9%), Transportation (16 | 6.6%), and Production (15 | 6.2%).
Production, Transportation and Moving Occupations by Sex
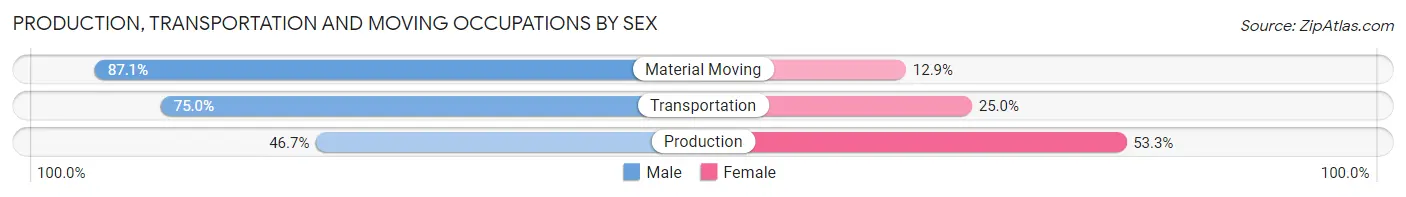
| Occupation | Male | Female |
| Production | 7 (46.7%) | 8 (53.3%) |
| Transportation | 12 (75.0%) | 4 (25.0%) |
| Material Moving | 27 (87.1%) | 4 (12.9%) |
| Total (Category) | 46 (74.2%) | 16 (25.8%) |
| Total (Overall) | 118 (49.0%) | 123 (51.0%) |
Employment Industries by Sex in Nunapitchuk
Employment Industries in Nunapitchuk
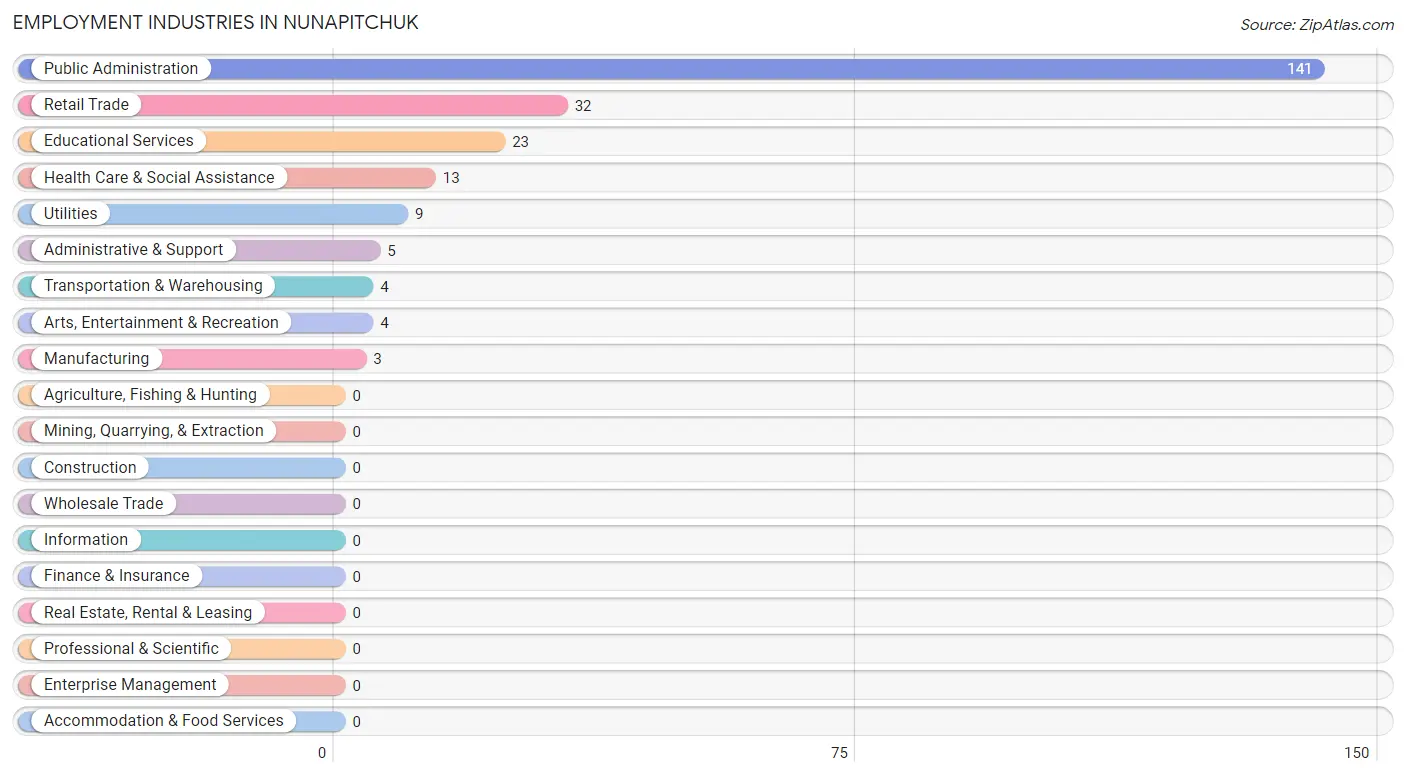
The major employment industries in Nunapitchuk include Public Administration (141 | 58.5%), Retail Trade (32 | 13.3%), Educational Services (23 | 9.5%), Health Care & Social Assistance (13 | 5.4%), and Utilities (9 | 3.7%).
Employment Industries by Sex in Nunapitchuk
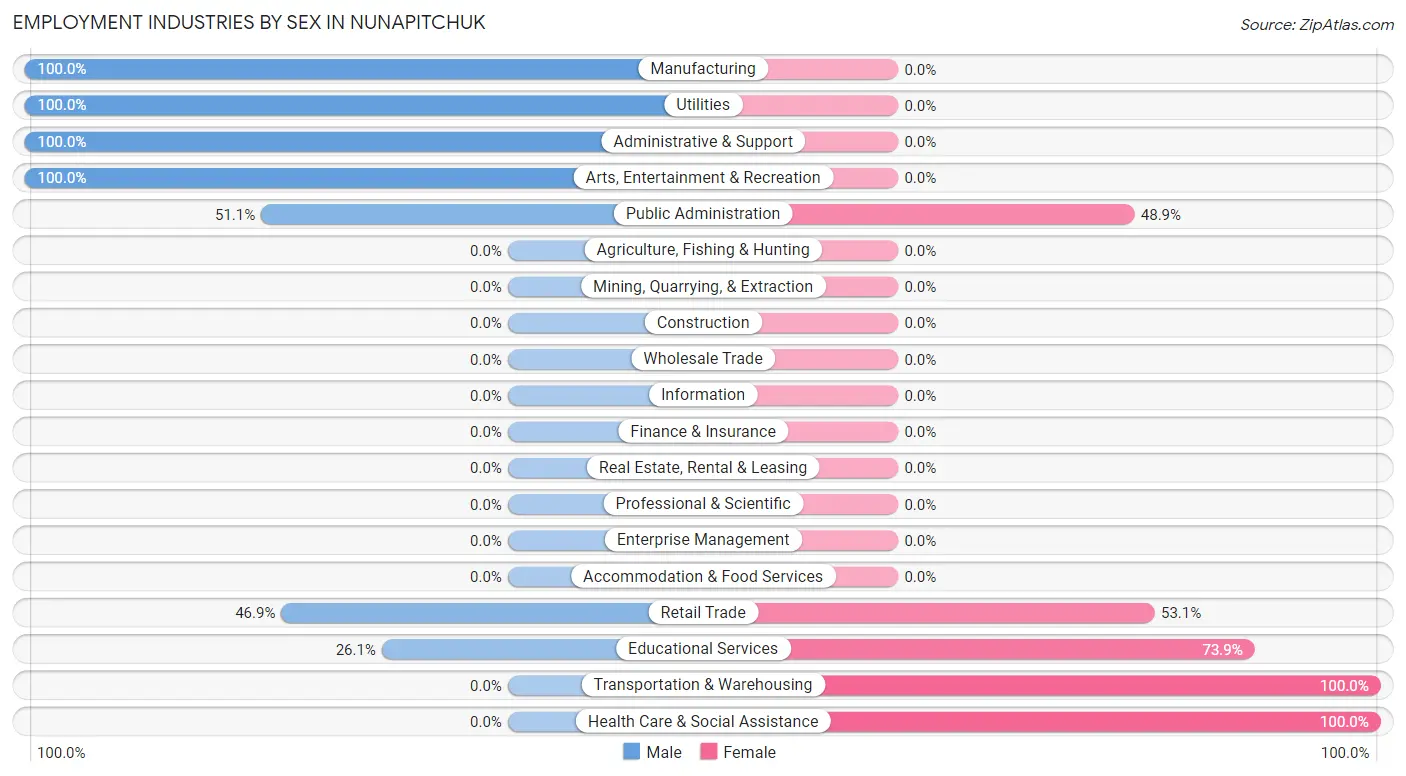
The Nunapitchuk industries that see more men than women are Manufacturing (100.0%), Utilities (100.0%), and Administrative & Support (100.0%), whereas the industries that tend to have a higher number of women are Transportation & Warehousing (100.0%), Health Care & Social Assistance (100.0%), and Educational Services (73.9%).
| Industry | Male | Female |
| Agriculture, Fishing & Hunting | 0 (0.0%) | 0 (0.0%) |
| Mining, Quarrying, & Extraction | 0 (0.0%) | 0 (0.0%) |
| Construction | 0 (0.0%) | 0 (0.0%) |
| Manufacturing | 3 (100.0%) | 0 (0.0%) |
| Wholesale Trade | 0 (0.0%) | 0 (0.0%) |
| Retail Trade | 15 (46.9%) | 17 (53.1%) |
| Transportation & Warehousing | 0 (0.0%) | 4 (100.0%) |
| Utilities | 9 (100.0%) | 0 (0.0%) |
| Information | 0 (0.0%) | 0 (0.0%) |
| Finance & Insurance | 0 (0.0%) | 0 (0.0%) |
| Real Estate, Rental & Leasing | 0 (0.0%) | 0 (0.0%) |
| Professional & Scientific | 0 (0.0%) | 0 (0.0%) |
| Enterprise Management | 0 (0.0%) | 0 (0.0%) |
| Administrative & Support | 5 (100.0%) | 0 (0.0%) |
| Educational Services | 6 (26.1%) | 17 (73.9%) |
| Health Care & Social Assistance | 0 (0.0%) | 13 (100.0%) |
| Arts, Entertainment & Recreation | 4 (100.0%) | 0 (0.0%) |
| Accommodation & Food Services | 0 (0.0%) | 0 (0.0%) |
| Public Administration | 72 (51.1%) | 69 (48.9%) |
| Total | 118 (49.0%) | 123 (51.0%) |
Education in Nunapitchuk
School Enrollment in Nunapitchuk
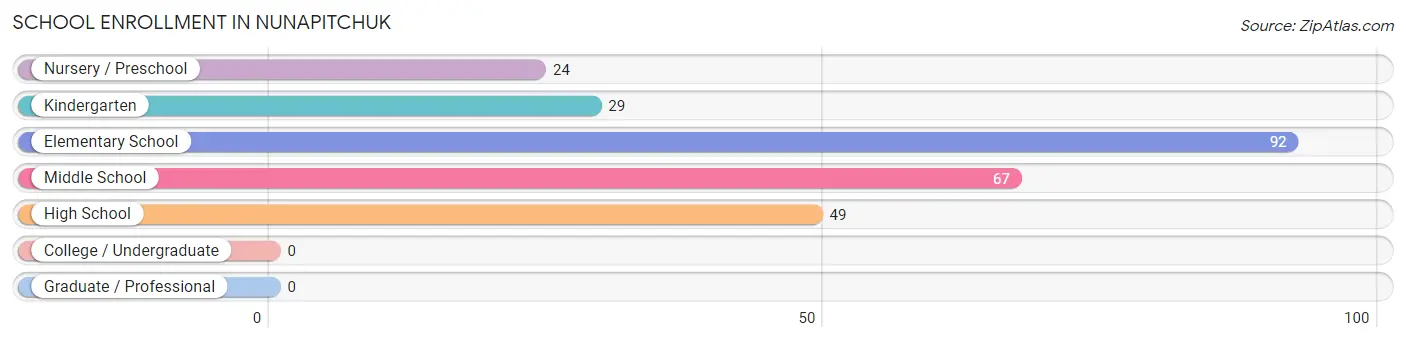
The most common levels of schooling among the 261 students in Nunapitchuk are elementary school (92 | 35.2%), middle school (67 | 25.7%), and high school (49 | 18.8%).
| School Level | # Students | % Students |
| Nursery / Preschool | 24 | 9.2% |
| Kindergarten | 29 | 11.1% |
| Elementary School | 92 | 35.2% |
| Middle School | 67 | 25.7% |
| High School | 49 | 18.8% |
| College / Undergraduate | 0 | 0.0% |
| Graduate / Professional | 0 | 0.0% |
| Total | 261 | 100.0% |
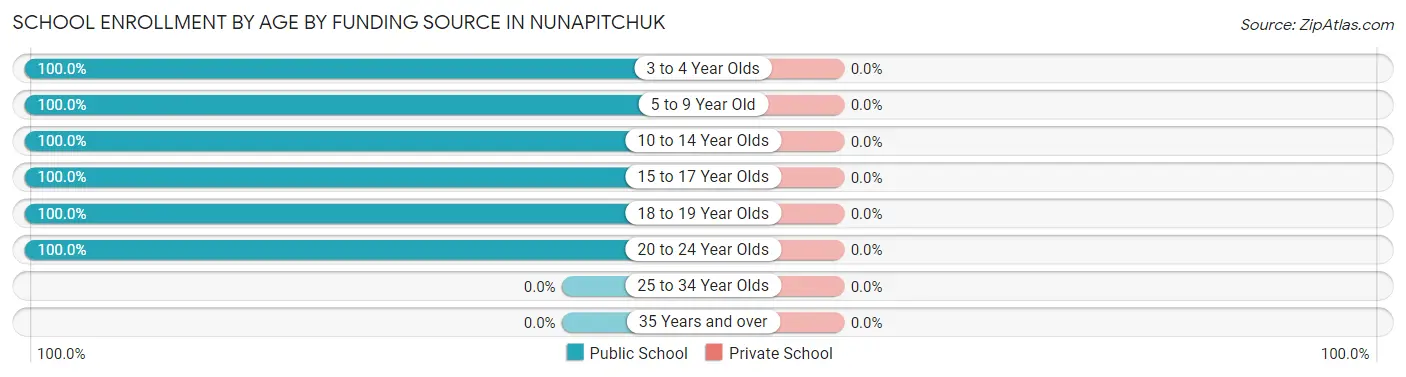
School Enrollment by Age by Funding Source in Nunapitchuk
| Age Bracket | Public School | Private School |
| 3 to 4 Year Olds | 25 (100.0%) | 0 (0.0%) |
| 5 to 9 Year Old | 116 (100.0%) | 0 (0.0%) |
| 10 to 14 Year Olds | 87 (100.0%) | 0 (0.0%) |
| 15 to 17 Year Olds | 21 (100.0%) | 0 (0.0%) |
| 18 to 19 Year Olds | 7 (100.0%) | 0 (0.0%) |
| 20 to 24 Year Olds | 5 (100.0%) | 0 (0.0%) |
| 25 to 34 Year Olds | 0 (0.0%) | 0 (0.0%) |
| 35 Years and over | 0 (0.0%) | 0 (0.0%) |
| Total | 261 (100.0%) | 0 (0.0%) |
Educational Attainment by Field of Study in Nunapitchuk
Education (7 | 53.8%), and business (6 | 46.2%) are the most common fields of study among 13 individuals in Nunapitchuk who have obtained a bachelor's degree or higher.
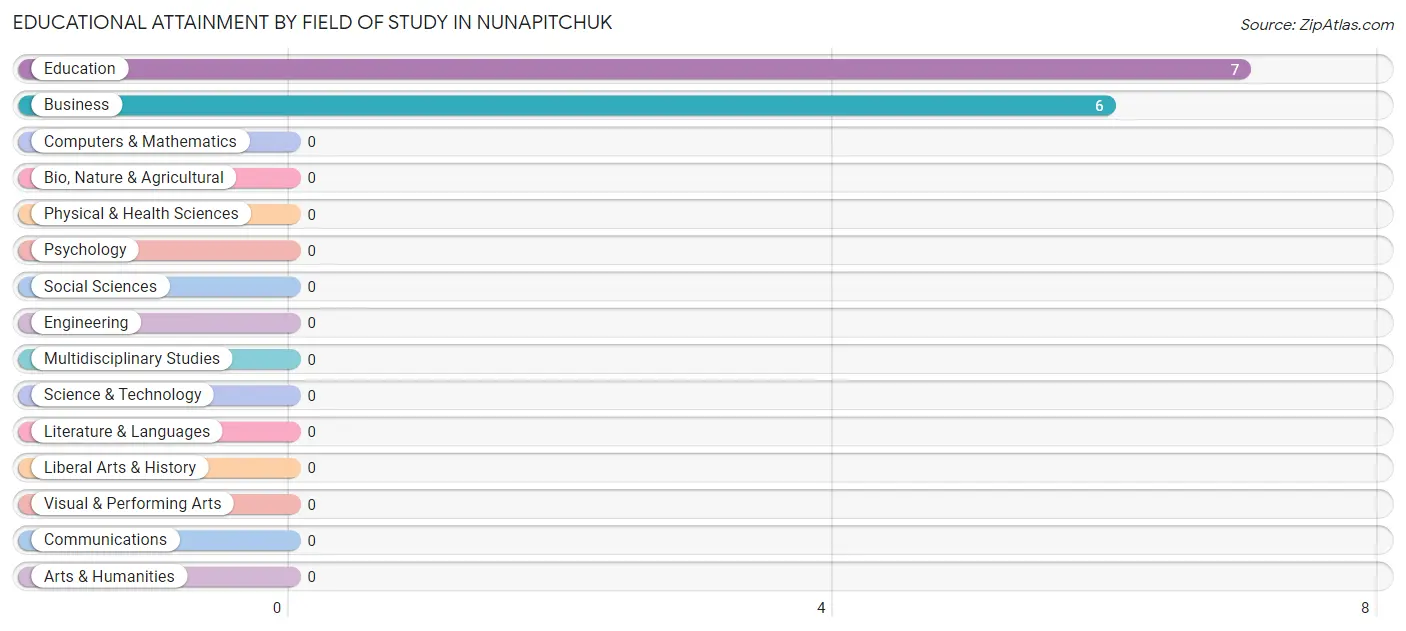
| Field of Study | # Graduates | % Graduates |
| Computers & Mathematics | 0 | 0.0% |
| Bio, Nature & Agricultural | 0 | 0.0% |
| Physical & Health Sciences | 0 | 0.0% |
| Psychology | 0 | 0.0% |
| Social Sciences | 0 | 0.0% |
| Engineering | 0 | 0.0% |
| Multidisciplinary Studies | 0 | 0.0% |
| Science & Technology | 0 | 0.0% |
| Business | 6 | 46.2% |
| Education | 7 | 53.8% |
| Literature & Languages | 0 | 0.0% |
| Liberal Arts & History | 0 | 0.0% |
| Visual & Performing Arts | 0 | 0.0% |
| Communications | 0 | 0.0% |
| Arts & Humanities | 0 | 0.0% |
| Total | 13 | 100.0% |
Transportation & Commute in Nunapitchuk
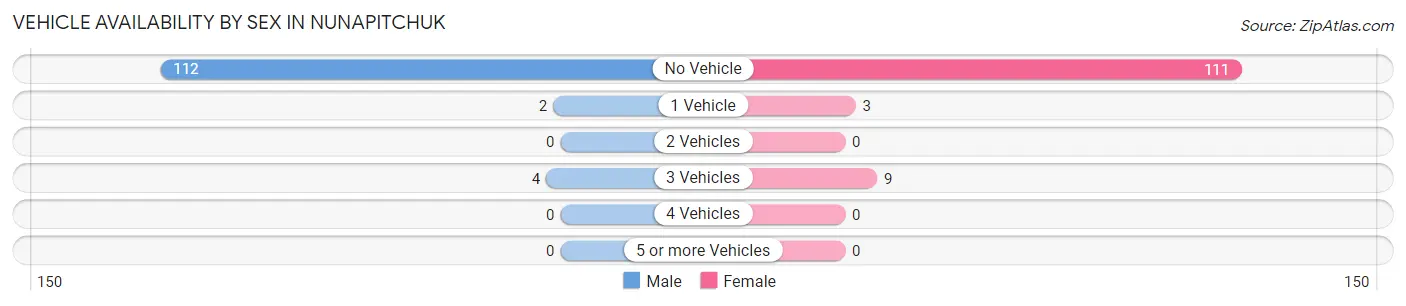
Vehicle Availability by Sex in Nunapitchuk
The most prevalent vehicle ownership categories in Nunapitchuk are males with no vehicle (112, accounting for 94.9%) and females with no vehicle (111, making up 91.1%).
| Vehicles Available | Male | Female |
| No Vehicle | 112 (94.9%) | 111 (90.2%) |
| 1 Vehicle | 2 (1.7%) | 3 (2.4%) |
| 2 Vehicles | 0 (0.0%) | 0 (0.0%) |
| 3 Vehicles | 4 (3.4%) | 9 (7.3%) |
| 4 Vehicles | 0 (0.0%) | 0 (0.0%) |
| 5 or more Vehicles | 0 (0.0%) | 0 (0.0%) |
| Total | 118 (100.0%) | 123 (100.0%) |
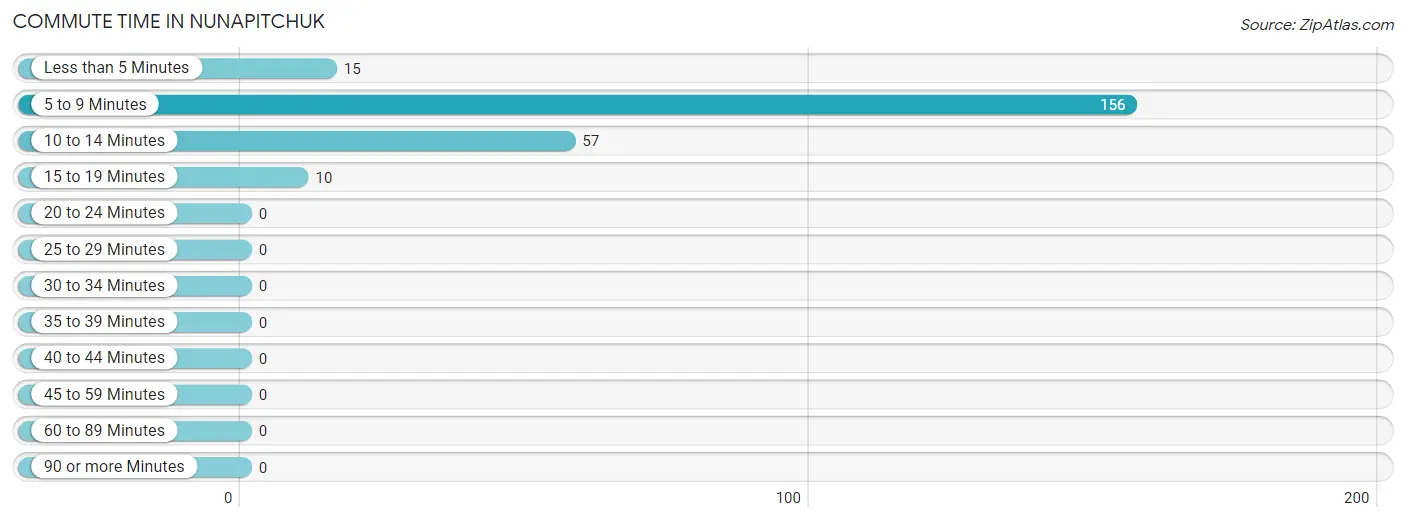
Commute Time in Nunapitchuk
The most frequently occuring commute durations in Nunapitchuk are 5 to 9 minutes (156 commuters, 65.5%), 10 to 14 minutes (57 commuters, 23.9%), and less than 5 minutes (15 commuters, 6.3%).
| Commute Time | # Commuters | % Commuters |
| Less than 5 Minutes | 15 | 6.3% |
| 5 to 9 Minutes | 156 | 65.5% |
| 10 to 14 Minutes | 57 | 23.9% |
| 15 to 19 Minutes | 10 | 4.2% |
| 20 to 24 Minutes | 0 | 0.0% |
| 25 to 29 Minutes | 0 | 0.0% |
| 30 to 34 Minutes | 0 | 0.0% |
| 35 to 39 Minutes | 0 | 0.0% |
| 40 to 44 Minutes | 0 | 0.0% |
| 45 to 59 Minutes | 0 | 0.0% |
| 60 to 89 Minutes | 0 | 0.0% |
| 90 or more Minutes | 0 | 0.0% |
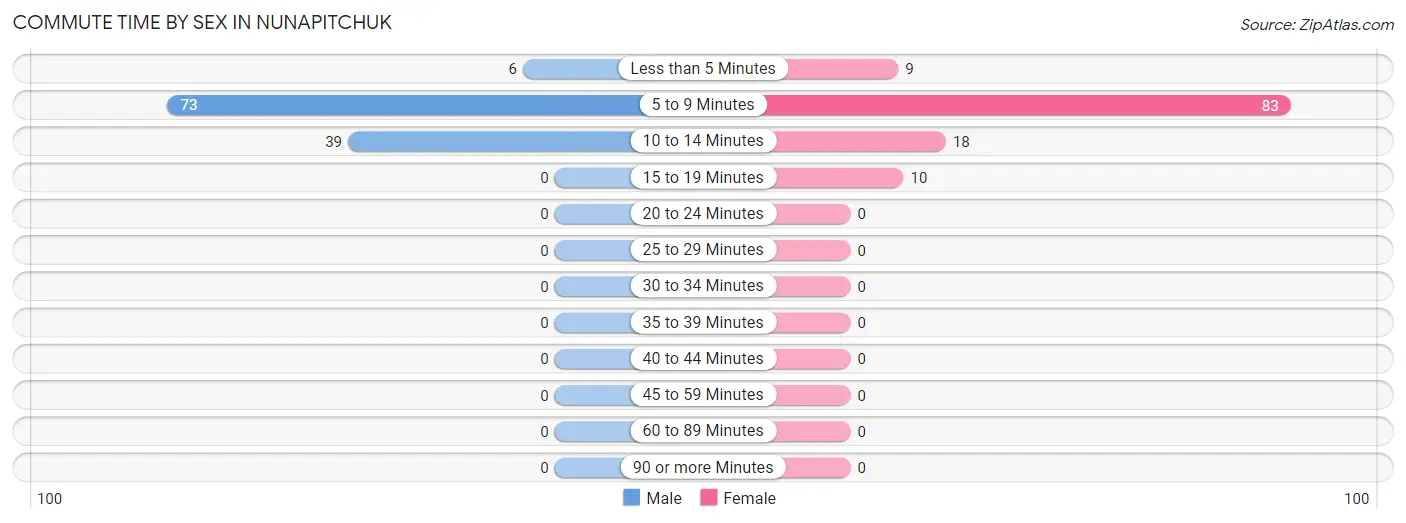
Commute Time by Sex in Nunapitchuk
The most common commute times in Nunapitchuk are 5 to 9 minutes (73 commuters, 61.9%) for males and 5 to 9 minutes (83 commuters, 69.2%) for females.
| Commute Time | Male | Female |
| Less than 5 Minutes | 6 (5.1%) | 9 (7.5%) |
| 5 to 9 Minutes | 73 (61.9%) | 83 (69.2%) |
| 10 to 14 Minutes | 39 (33.1%) | 18 (15.0%) |
| 15 to 19 Minutes | 0 (0.0%) | 10 (8.3%) |
| 20 to 24 Minutes | 0 (0.0%) | 0 (0.0%) |
| 25 to 29 Minutes | 0 (0.0%) | 0 (0.0%) |
| 30 to 34 Minutes | 0 (0.0%) | 0 (0.0%) |
| 35 to 39 Minutes | 0 (0.0%) | 0 (0.0%) |
| 40 to 44 Minutes | 0 (0.0%) | 0 (0.0%) |
| 45 to 59 Minutes | 0 (0.0%) | 0 (0.0%) |
| 60 to 89 Minutes | 0 (0.0%) | 0 (0.0%) |
| 90 or more Minutes | 0 (0.0%) | 0 (0.0%) |
Time of Departure to Work by Sex in Nunapitchuk
The most frequent times of departure to work in Nunapitchuk are 9:00 AM to 9:59 AM (35, 29.7%) for males and 9:00 AM to 9:59 AM (49, 40.8%) for females.
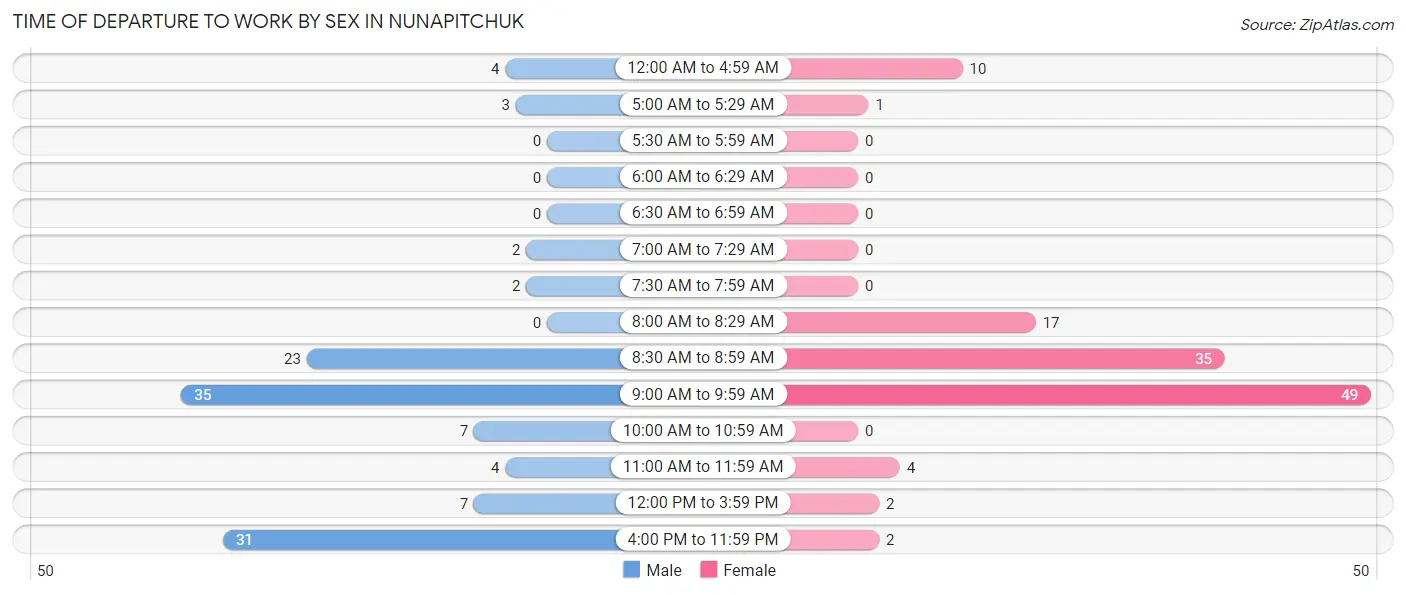
| Time of Departure | Male | Female |
| 12:00 AM to 4:59 AM | 4 (3.4%) | 10 (8.3%) |
| 5:00 AM to 5:29 AM | 3 (2.5%) | 1 (0.8%) |
| 5:30 AM to 5:59 AM | 0 (0.0%) | 0 (0.0%) |
| 6:00 AM to 6:29 AM | 0 (0.0%) | 0 (0.0%) |
| 6:30 AM to 6:59 AM | 0 (0.0%) | 0 (0.0%) |
| 7:00 AM to 7:29 AM | 2 (1.7%) | 0 (0.0%) |
| 7:30 AM to 7:59 AM | 2 (1.7%) | 0 (0.0%) |
| 8:00 AM to 8:29 AM | 0 (0.0%) | 17 (14.2%) |
| 8:30 AM to 8:59 AM | 23 (19.5%) | 35 (29.2%) |
| 9:00 AM to 9:59 AM | 35 (29.7%) | 49 (40.8%) |
| 10:00 AM to 10:59 AM | 7 (5.9%) | 0 (0.0%) |
| 11:00 AM to 11:59 AM | 4 (3.4%) | 4 (3.3%) |
| 12:00 PM to 3:59 PM | 7 (5.9%) | 2 (1.7%) |
| 4:00 PM to 11:59 PM | 31 (26.3%) | 2 (1.7%) |
| Total | 118 (100.0%) | 120 (100.0%) |
Housing Occupancy in Nunapitchuk
Occupancy by Ownership in Nunapitchuk
Of the total 153 dwellings in Nunapitchuk, owner-occupied units account for 120 (78.4%), while renter-occupied units make up 33 (21.6%).
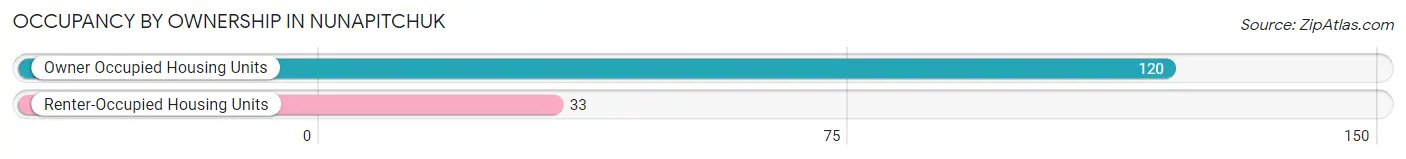
| Occupancy | # Housing Units | % Housing Units |
| Owner Occupied Housing Units | 120 | 78.4% |
| Renter-Occupied Housing Units | 33 | 21.6% |
| Total Occupied Housing Units | 153 | 100.0% |
Occupancy by Household Size in Nunapitchuk
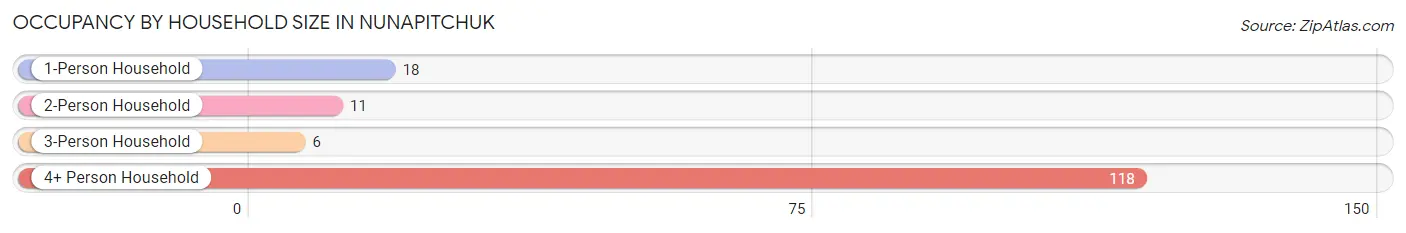
| Household Size | # Housing Units | % Housing Units |
| 1-Person Household | 18 | 11.8% |
| 2-Person Household | 11 | 7.2% |
| 3-Person Household | 6 | 3.9% |
| 4+ Person Household | 118 | 77.1% |
| Total Housing Units | 153 | 100.0% |
Occupancy by Ownership by Household Size in Nunapitchuk
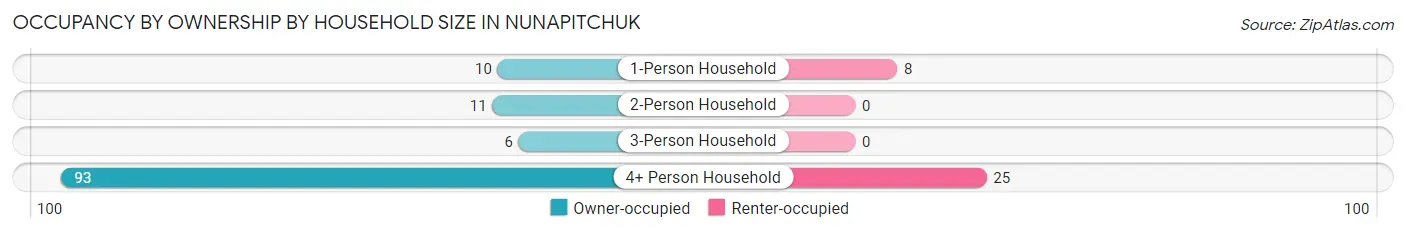
| Household Size | Owner-occupied | Renter-occupied |
| 1-Person Household | 10 (55.6%) | 8 (44.4%) |
| 2-Person Household | 11 (100.0%) | 0 (0.0%) |
| 3-Person Household | 6 (100.0%) | 0 (0.0%) |
| 4+ Person Household | 93 (78.8%) | 25 (21.2%) |
| Total Housing Units | 120 (78.4%) | 33 (21.6%) |
Occupancy by Educational Attainment in Nunapitchuk
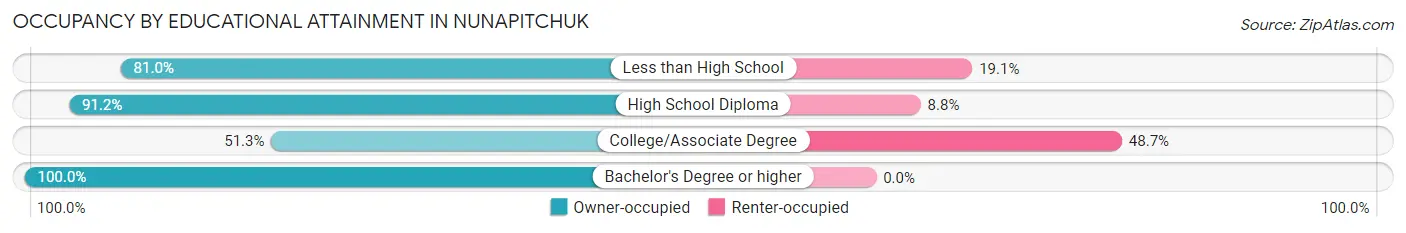
| Household Size | Owner-occupied | Renter-occupied |
| Less than High School | 34 (80.9%) | 8 (19.1%) |
| High School Diploma | 62 (91.2%) | 6 (8.8%) |
| College/Associate Degree | 20 (51.3%) | 19 (48.7%) |
| Bachelor's Degree or higher | 4 (100.0%) | 0 (0.0%) |
Occupancy by Age of Householder in Nunapitchuk
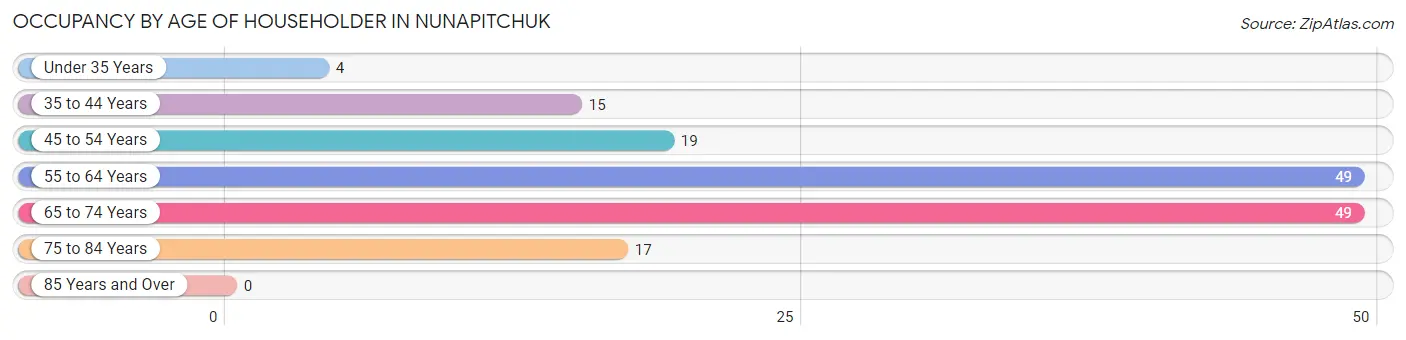
| Age Bracket | # Households | % Households |
| Under 35 Years | 4 | 2.6% |
| 35 to 44 Years | 15 | 9.8% |
| 45 to 54 Years | 19 | 12.4% |
| 55 to 64 Years | 49 | 32.0% |
| 65 to 74 Years | 49 | 32.0% |
| 75 to 84 Years | 17 | 11.1% |
| 85 Years and Over | 0 | 0.0% |
| Total | 153 | 100.0% |
Housing Finances in Nunapitchuk
Median Income by Occupancy in Nunapitchuk
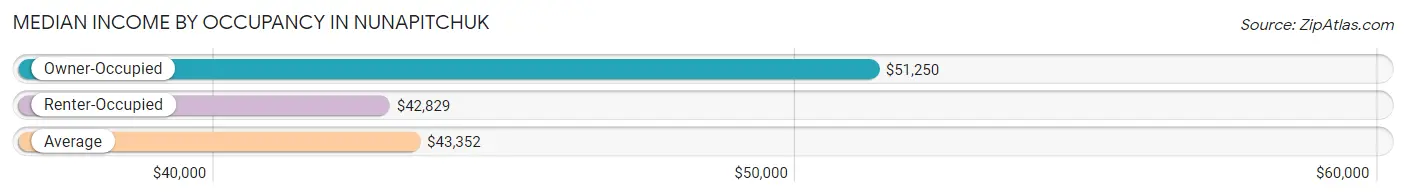
| Occupancy Type | # Households | Median Income |
| Owner-Occupied | 120 (78.4%) | $51,250 |
| Renter-Occupied | 33 (21.6%) | $42,829 |
| Average | 153 (100.0%) | $43,352 |
Occupancy by Householder Income Bracket in Nunapitchuk
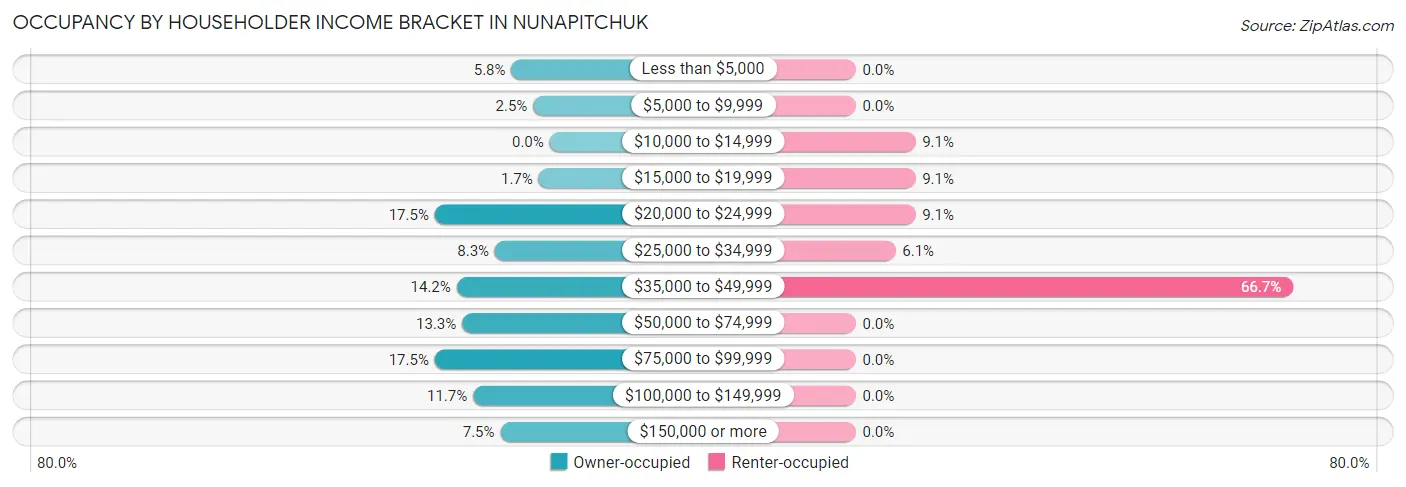
| Income Bracket | Owner-occupied | Renter-occupied |
| Less than $5,000 | 7 (5.8%) | 0 (0.0%) |
| $5,000 to $9,999 | 3 (2.5%) | 0 (0.0%) |
| $10,000 to $14,999 | 0 (0.0%) | 3 (9.1%) |
| $15,000 to $19,999 | 2 (1.7%) | 3 (9.1%) |
| $20,000 to $24,999 | 21 (17.5%) | 3 (9.1%) |
| $25,000 to $34,999 | 10 (8.3%) | 2 (6.1%) |
| $35,000 to $49,999 | 17 (14.2%) | 22 (66.7%) |
| $50,000 to $74,999 | 16 (13.3%) | 0 (0.0%) |
| $75,000 to $99,999 | 21 (17.5%) | 0 (0.0%) |
| $100,000 to $149,999 | 14 (11.7%) | 0 (0.0%) |
| $150,000 or more | 9 (7.5%) | 0 (0.0%) |
| Total | 120 (100.0%) | 33 (100.0%) |
Monthly Housing Cost Tiers in Nunapitchuk
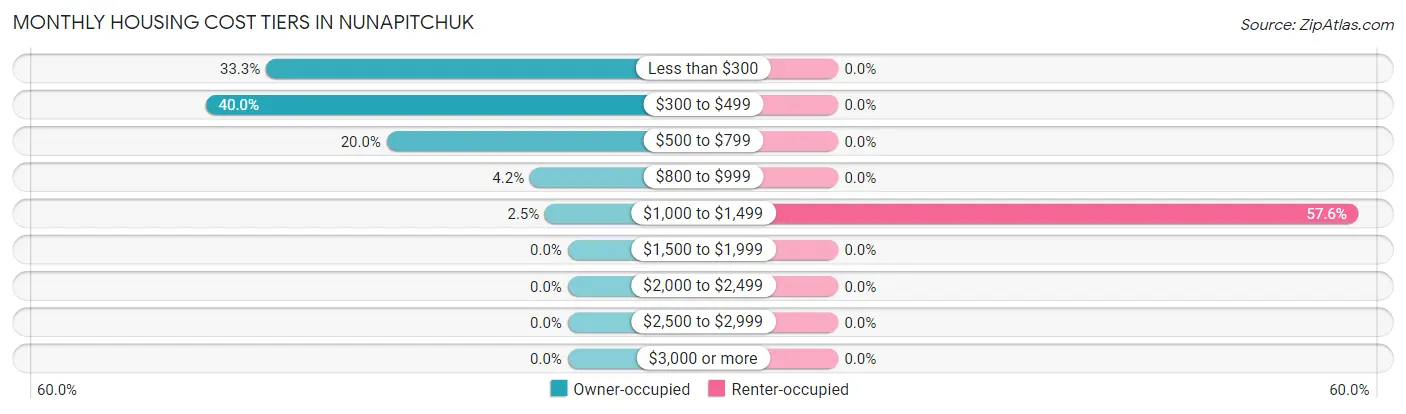
| Monthly Cost | Owner-occupied | Renter-occupied |
| Less than $300 | 40 (33.3%) | 0 (0.0%) |
| $300 to $499 | 48 (40.0%) | 0 (0.0%) |
| $500 to $799 | 24 (20.0%) | 0 (0.0%) |
| $800 to $999 | 5 (4.2%) | 0 (0.0%) |
| $1,000 to $1,499 | 3 (2.5%) | 19 (57.6%) |
| $1,500 to $1,999 | 0 (0.0%) | 0 (0.0%) |
| $2,000 to $2,499 | 0 (0.0%) | 0 (0.0%) |
| $2,500 to $2,999 | 0 (0.0%) | 0 (0.0%) |
| $3,000 or more | 0 (0.0%) | 0 (0.0%) |
| Total | 120 (100.0%) | 33 (100.0%) |
Physical Housing Characteristics in Nunapitchuk
Housing Structures in Nunapitchuk
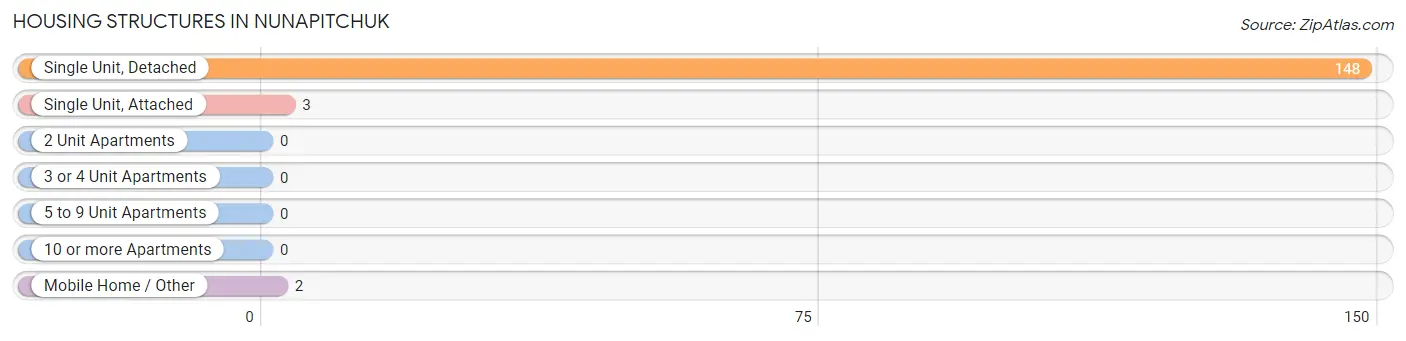
| Structure Type | # Housing Units | % Housing Units |
| Single Unit, Detached | 148 | 96.7% |
| Single Unit, Attached | 3 | 2.0% |
| 2 Unit Apartments | 0 | 0.0% |
| 3 or 4 Unit Apartments | 0 | 0.0% |
| 5 to 9 Unit Apartments | 0 | 0.0% |
| 10 or more Apartments | 0 | 0.0% |
| Mobile Home / Other | 2 | 1.3% |
| Total | 153 | 100.0% |
Housing Structures by Occupancy in Nunapitchuk
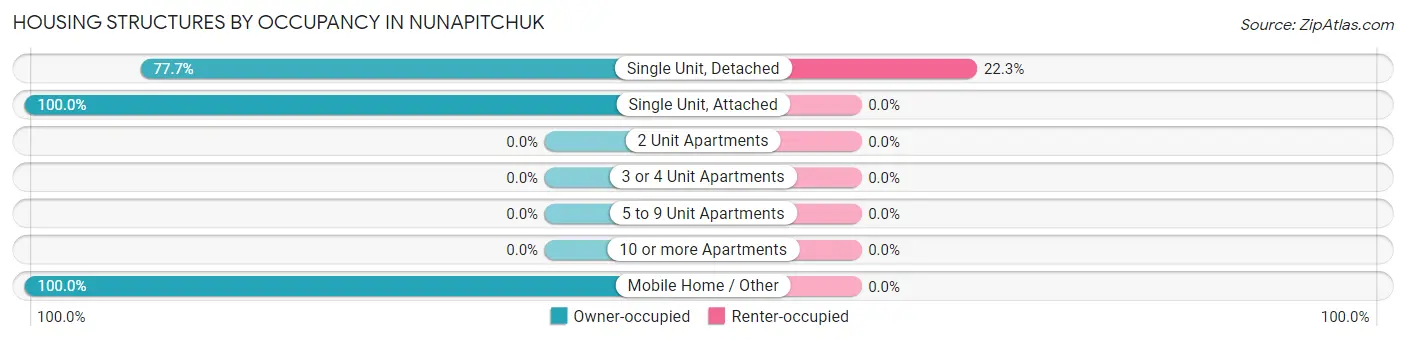
| Structure Type | Owner-occupied | Renter-occupied |
| Single Unit, Detached | 115 (77.7%) | 33 (22.3%) |
| Single Unit, Attached | 3 (100.0%) | 0 (0.0%) |
| 2 Unit Apartments | 0 (0.0%) | 0 (0.0%) |
| 3 or 4 Unit Apartments | 0 (0.0%) | 0 (0.0%) |
| 5 to 9 Unit Apartments | 0 (0.0%) | 0 (0.0%) |
| 10 or more Apartments | 0 (0.0%) | 0 (0.0%) |
| Mobile Home / Other | 2 (100.0%) | 0 (0.0%) |
| Total | 120 (78.4%) | 33 (21.6%) |
Housing Structures by Number of Rooms in Nunapitchuk
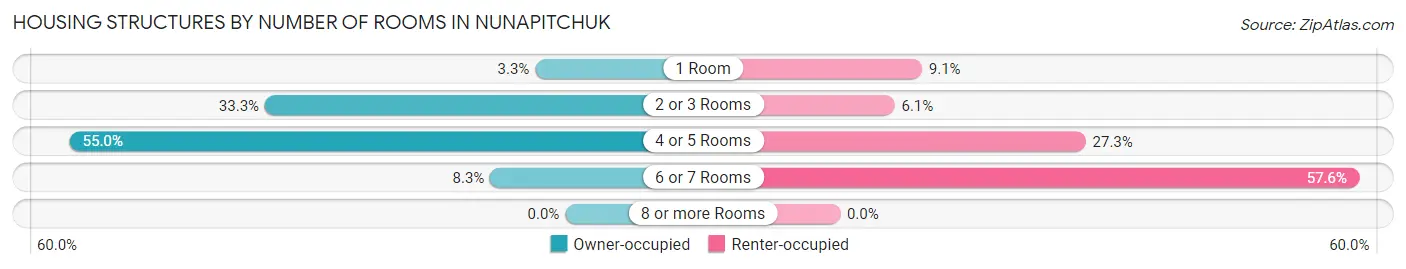
| Number of Rooms | Owner-occupied | Renter-occupied |
| 1 Room | 4 (3.3%) | 3 (9.1%) |
| 2 or 3 Rooms | 40 (33.3%) | 2 (6.1%) |
| 4 or 5 Rooms | 66 (55.0%) | 9 (27.3%) |
| 6 or 7 Rooms | 10 (8.3%) | 19 (57.6%) |
| 8 or more Rooms | 0 (0.0%) | 0 (0.0%) |
| Total | 120 (100.0%) | 33 (100.0%) |
Housing Structure by Heating Type in Nunapitchuk
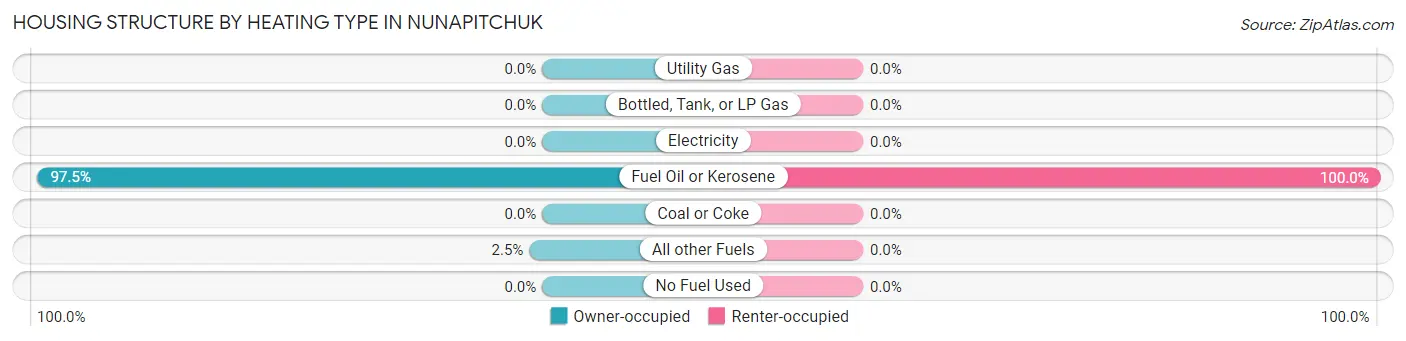
| Heating Type | Owner-occupied | Renter-occupied |
| Utility Gas | 0 (0.0%) | 0 (0.0%) |
| Bottled, Tank, or LP Gas | 0 (0.0%) | 0 (0.0%) |
| Electricity | 0 (0.0%) | 0 (0.0%) |
| Fuel Oil or Kerosene | 117 (97.5%) | 33 (100.0%) |
| Coal or Coke | 0 (0.0%) | 0 (0.0%) |
| All other Fuels | 3 (2.5%) | 0 (0.0%) |
| No Fuel Used | 0 (0.0%) | 0 (0.0%) |
| Total | 120 (100.0%) | 33 (100.0%) |
Household Vehicle Usage in Nunapitchuk
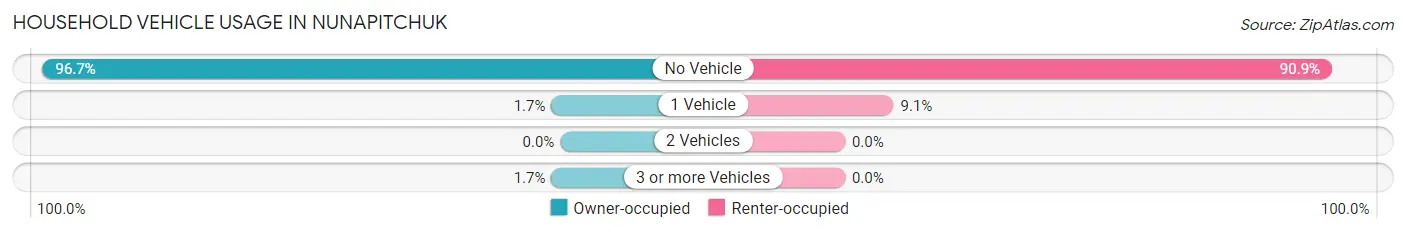
| Vehicles per Household | Owner-occupied | Renter-occupied |
| No Vehicle | 116 (96.7%) | 30 (90.9%) |
| 1 Vehicle | 2 (1.7%) | 3 (9.1%) |
| 2 Vehicles | 0 (0.0%) | 0 (0.0%) |
| 3 or more Vehicles | 2 (1.7%) | 0 (0.0%) |
| Total | 120 (100.0%) | 33 (100.0%) |
Real Estate & Mortgages in Nunapitchuk
Real Estate and Mortgage Overview in Nunapitchuk
| Characteristic | Without Mortgage | With Mortgage |
| Housing Units | 112 | 8 |
| Median Property Value | $84,600 | $191,700 |
| Median Household Income | $55,357 | $0 |
| Monthly Housing Costs | $373 | $0 |
| Real Estate Taxes | - | - |
Property Value by Mortgage Status in Nunapitchuk
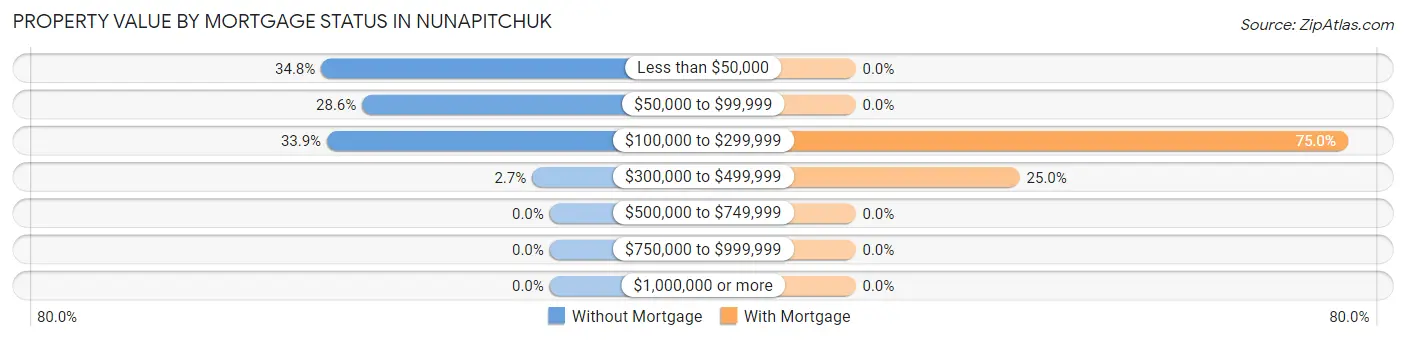
| Property Value | Without Mortgage | With Mortgage |
| Less than $50,000 | 39 (34.8%) | 0 (0.0%) |
| $50,000 to $99,999 | 32 (28.6%) | 0 (0.0%) |
| $100,000 to $299,999 | 38 (33.9%) | 6 (75.0%) |
| $300,000 to $499,999 | 3 (2.7%) | 2 (25.0%) |
| $500,000 to $749,999 | 0 (0.0%) | 0 (0.0%) |
| $750,000 to $999,999 | 0 (0.0%) | 0 (0.0%) |
| $1,000,000 or more | 0 (0.0%) | 0 (0.0%) |
| Total | 112 (100.0%) | 8 (100.0%) |
Household Income by Mortgage Status in Nunapitchuk
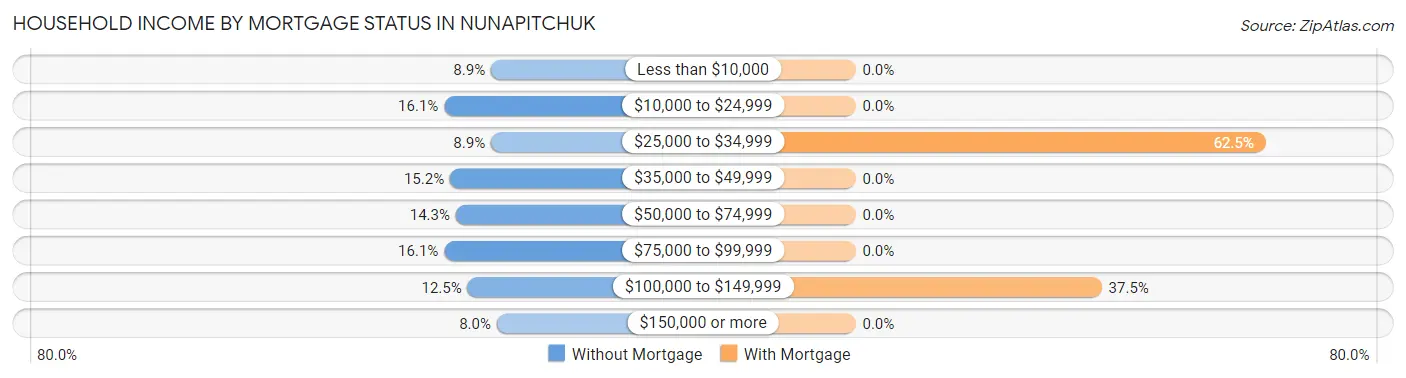
| Household Income | Without Mortgage | With Mortgage |
| Less than $10,000 | 10 (8.9%) | 0 (0.0%) |
| $10,000 to $24,999 | 18 (16.1%) | 0 (0.0%) |
| $25,000 to $34,999 | 10 (8.9%) | 5 (62.5%) |
| $35,000 to $49,999 | 17 (15.2%) | 0 (0.0%) |
| $50,000 to $74,999 | 16 (14.3%) | 0 (0.0%) |
| $75,000 to $99,999 | 18 (16.1%) | 0 (0.0%) |
| $100,000 to $149,999 | 14 (12.5%) | 3 (37.5%) |
| $150,000 or more | 9 (8.0%) | 0 (0.0%) |
| Total | 112 (100.0%) | 8 (100.0%) |
Property Value to Household Income Ratio in Nunapitchuk
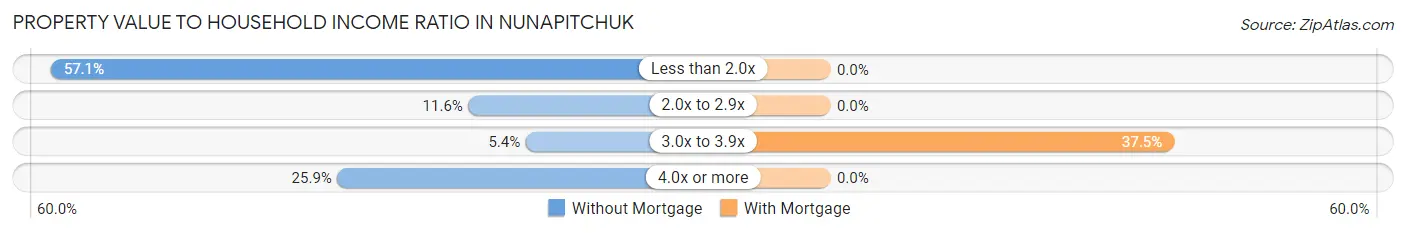
| Value-to-Income Ratio | Without Mortgage | With Mortgage |
| Less than 2.0x | 64 (57.1%) | 0 (0.0%) |
| 2.0x to 2.9x | 13 (11.6%) | 0 (0.0%) |
| 3.0x to 3.9x | 6 (5.4%) | 3 (37.5%) |
| 4.0x or more | 29 (25.9%) | 0 (0.0%) |
| Total | 112 (100.0%) | 8 (100.0%) |
Real Estate Taxes by Mortgage Status in Nunapitchuk
| Property Taxes | Without Mortgage | With Mortgage |
| Less than $800 | 0 (0.0%) | 0 (0.0%) |
| $800 to $1,499 | 0 (0.0%) | 0 (0.0%) |
| $800 to $1,499 | 0 (0.0%) | 0 (0.0%) |
| Total | 112 (100.0%) | 8 (100.0%) |
Health & Disability in Nunapitchuk
Health Insurance Coverage by Age in Nunapitchuk
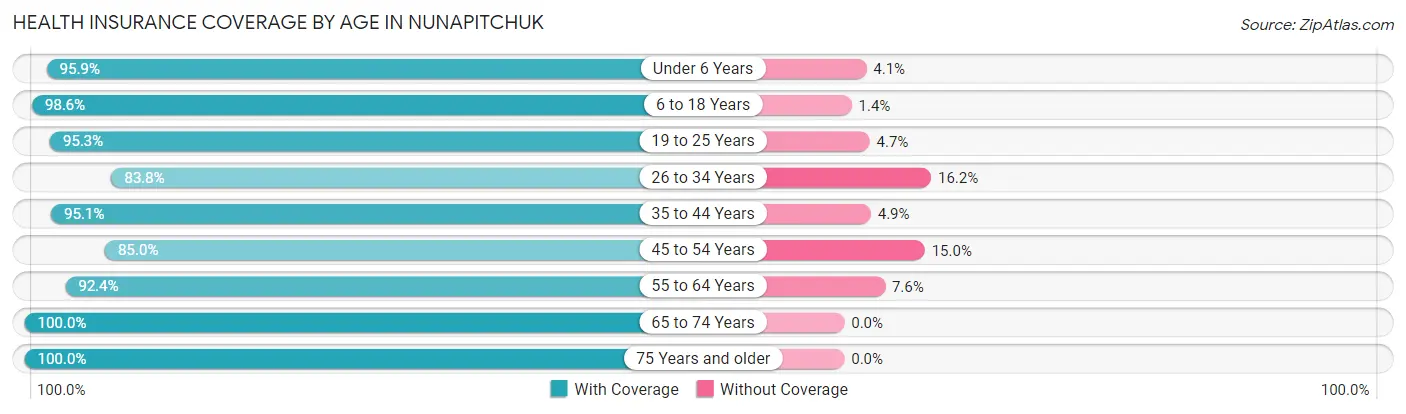
| Age Bracket | With Coverage | Without Coverage |
| Under 6 Years | 140 (95.9%) | 6 (4.1%) |
| 6 to 18 Years | 217 (98.6%) | 3 (1.4%) |
| 19 to 25 Years | 101 (95.3%) | 5 (4.7%) |
| 26 to 34 Years | 57 (83.8%) | 11 (16.2%) |
| 35 to 44 Years | 77 (95.1%) | 4 (4.9%) |
| 45 to 54 Years | 34 (85.0%) | 6 (15.0%) |
| 55 to 64 Years | 73 (92.4%) | 6 (7.6%) |
| 65 to 74 Years | 62 (100.0%) | 0 (0.0%) |
| 75 Years and older | 25 (100.0%) | 0 (0.0%) |
| Total | 786 (95.0%) | 41 (5.0%) |
Health Insurance Coverage by Citizenship Status in Nunapitchuk
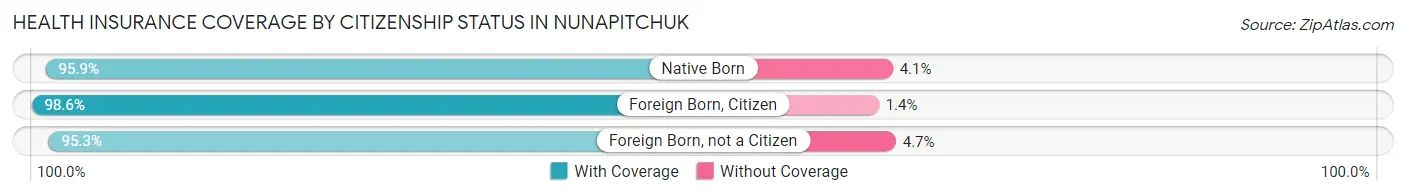
| Citizenship Status | With Coverage | Without Coverage |
| Native Born | 140 (95.9%) | 6 (4.1%) |
| Foreign Born, Citizen | 217 (98.6%) | 3 (1.4%) |
| Foreign Born, not a Citizen | 101 (95.3%) | 5 (4.7%) |
Health Insurance Coverage by Household Income in Nunapitchuk
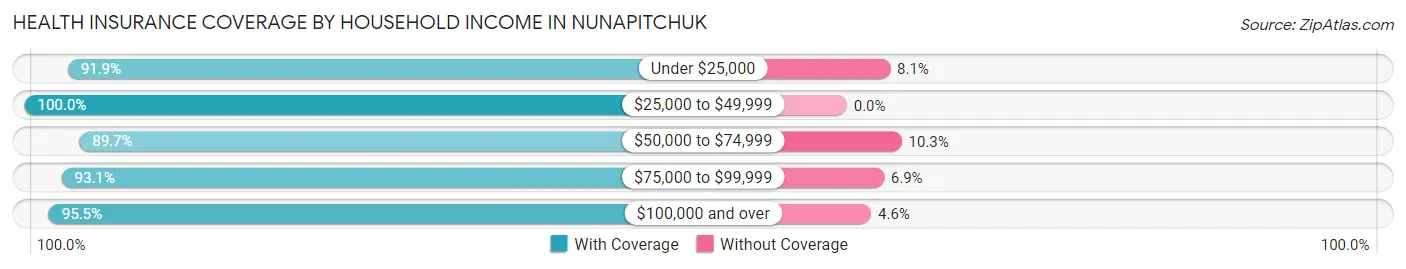
| Household Income | With Coverage | Without Coverage |
| Under $25,000 | 136 (91.9%) | 12 (8.1%) |
| $25,000 to $49,999 | 253 (100.0%) | 0 (0.0%) |
| $50,000 to $74,999 | 70 (89.7%) | 8 (10.3%) |
| $75,000 to $99,999 | 201 (93.1%) | 15 (6.9%) |
| $100,000 and over | 126 (95.5%) | 6 (4.5%) |
Public vs Private Health Insurance Coverage by Age in Nunapitchuk
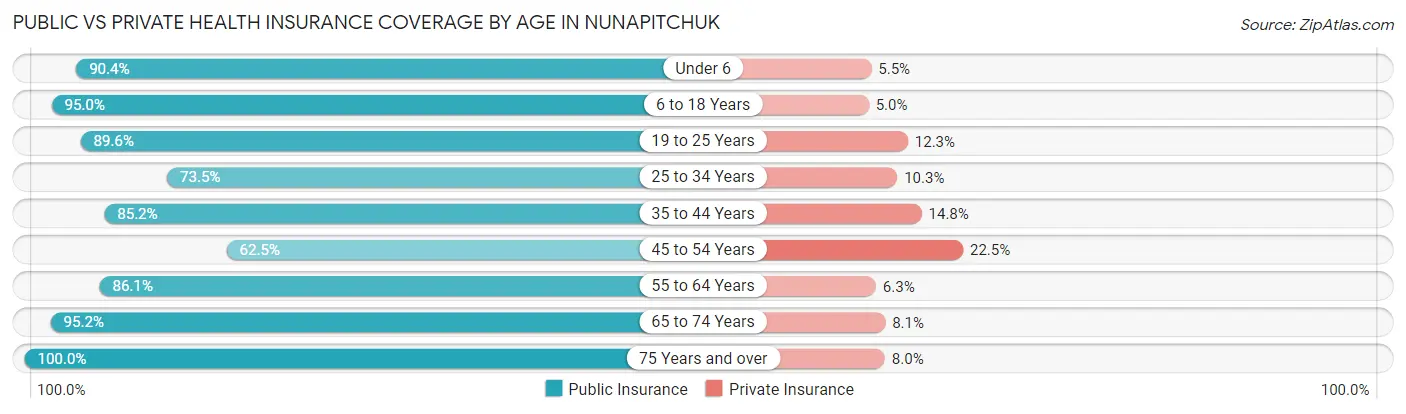
| Age Bracket | Public Insurance | Private Insurance |
| Under 6 | 132 (90.4%) | 8 (5.5%) |
| 6 to 18 Years | 209 (95.0%) | 11 (5.0%) |
| 19 to 25 Years | 95 (89.6%) | 13 (12.3%) |
| 25 to 34 Years | 50 (73.5%) | 7 (10.3%) |
| 35 to 44 Years | 69 (85.2%) | 12 (14.8%) |
| 45 to 54 Years | 25 (62.5%) | 9 (22.5%) |
| 55 to 64 Years | 68 (86.1%) | 5 (6.3%) |
| 65 to 74 Years | 59 (95.2%) | 5 (8.1%) |
| 75 Years and over | 25 (100.0%) | 2 (8.0%) |
| Total | 732 (88.5%) | 72 (8.7%) |
Disability Status by Sex by Age in Nunapitchuk
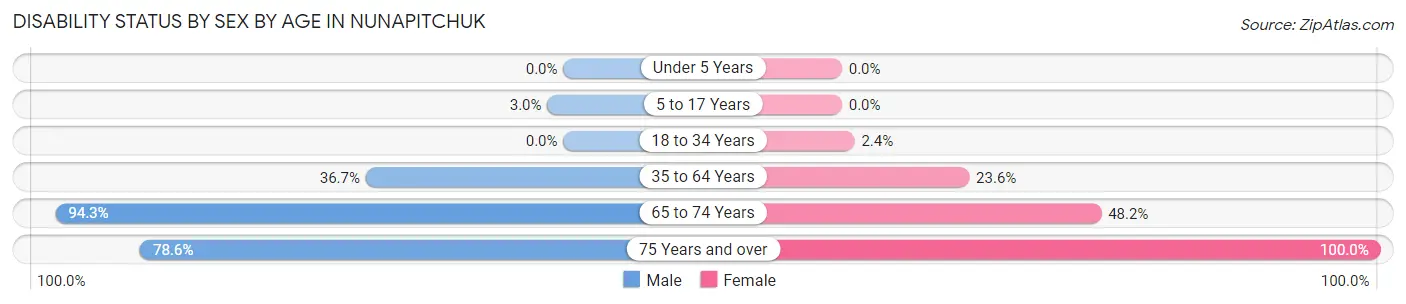
| Age Bracket | Male | Female |
| Under 5 Years | 0 (0.0%) | 0 (0.0%) |
| 5 to 17 Years | 3 (3.0%) | 0 (0.0%) |
| 18 to 34 Years | 0 (0.0%) | 2 (2.4%) |
| 35 to 64 Years | 33 (36.7%) | 26 (23.6%) |
| 65 to 74 Years | 33 (94.3%) | 13 (48.1%) |
| 75 Years and over | 11 (78.6%) | 11 (100.0%) |
Disability Class by Sex by Age in Nunapitchuk
Disability Class: Hearing Difficulty
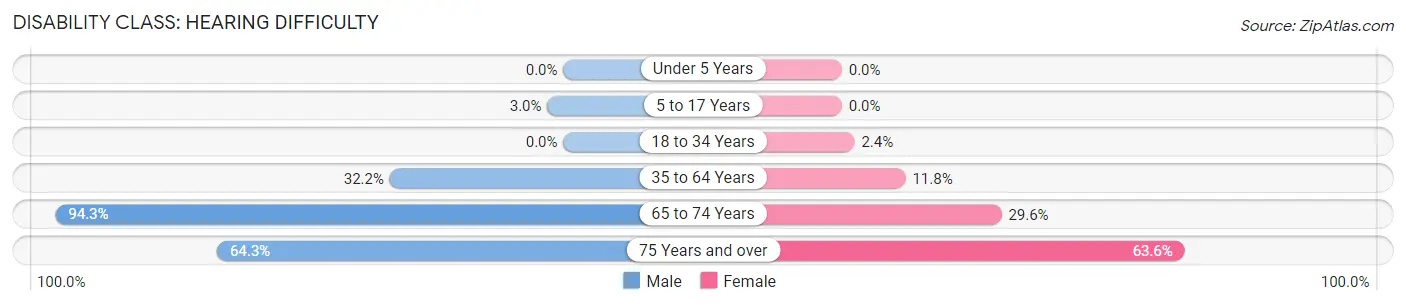
| Age Bracket | Male | Female |
| Under 5 Years | 0 (0.0%) | 0 (0.0%) |
| 5 to 17 Years | 3 (3.0%) | 0 (0.0%) |
| 18 to 34 Years | 0 (0.0%) | 2 (2.4%) |
| 35 to 64 Years | 29 (32.2%) | 13 (11.8%) |
| 65 to 74 Years | 33 (94.3%) | 8 (29.6%) |
| 75 Years and over | 9 (64.3%) | 7 (63.6%) |
Disability Class: Vision Difficulty
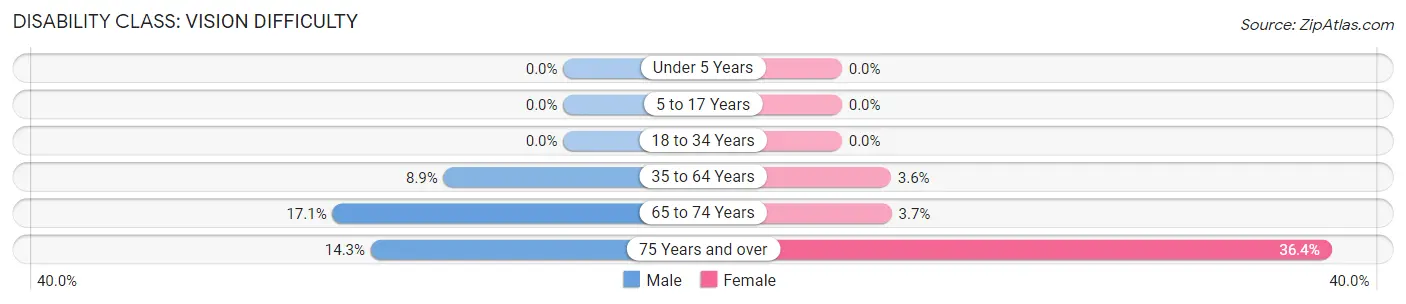
| Age Bracket | Male | Female |
| Under 5 Years | 0 (0.0%) | 0 (0.0%) |
| 5 to 17 Years | 0 (0.0%) | 0 (0.0%) |
| 18 to 34 Years | 0 (0.0%) | 0 (0.0%) |
| 35 to 64 Years | 8 (8.9%) | 4 (3.6%) |
| 65 to 74 Years | 6 (17.1%) | 1 (3.7%) |
| 75 Years and over | 2 (14.3%) | 4 (36.4%) |
Disability Class: Cognitive Difficulty
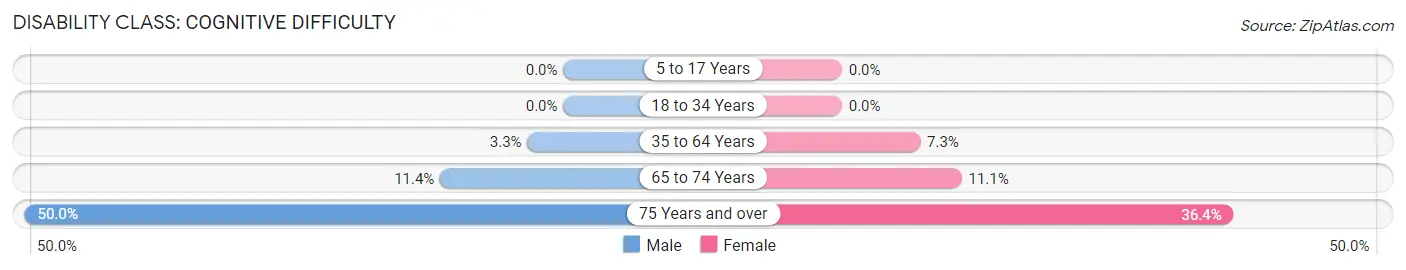
| Age Bracket | Male | Female |
| 5 to 17 Years | 0 (0.0%) | 0 (0.0%) |
| 18 to 34 Years | 0 (0.0%) | 0 (0.0%) |
| 35 to 64 Years | 3 (3.3%) | 8 (7.3%) |
| 65 to 74 Years | 4 (11.4%) | 3 (11.1%) |
| 75 Years and over | 7 (50.0%) | 4 (36.4%) |
Disability Class: Ambulatory Difficulty
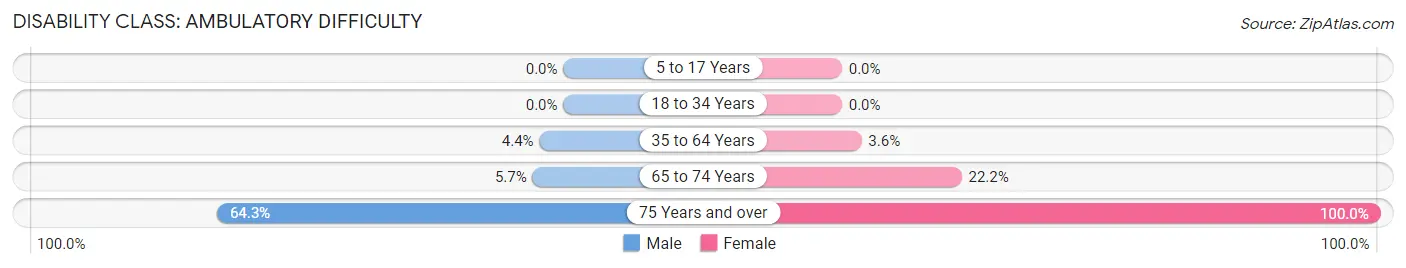
| Age Bracket | Male | Female |
| 5 to 17 Years | 0 (0.0%) | 0 (0.0%) |
| 18 to 34 Years | 0 (0.0%) | 0 (0.0%) |
| 35 to 64 Years | 4 (4.4%) | 4 (3.6%) |
| 65 to 74 Years | 2 (5.7%) | 6 (22.2%) |
| 75 Years and over | 9 (64.3%) | 11 (100.0%) |
Disability Class: Self-Care Difficulty
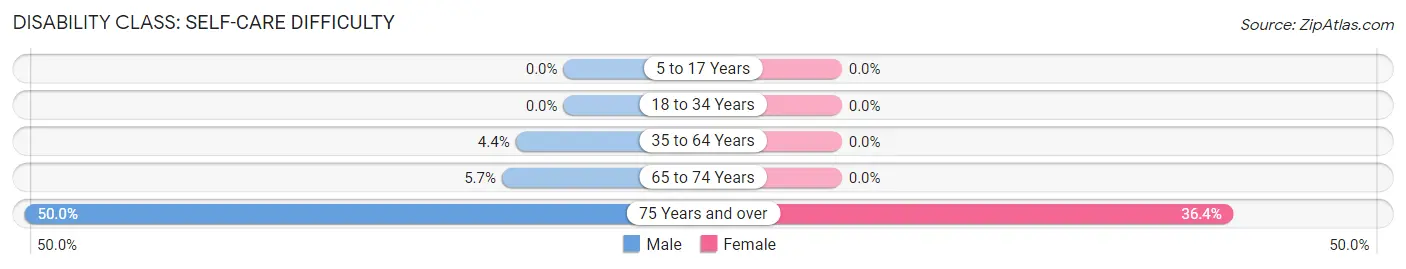
| Age Bracket | Male | Female |
| 5 to 17 Years | 0 (0.0%) | 0 (0.0%) |
| 18 to 34 Years | 0 (0.0%) | 0 (0.0%) |
| 35 to 64 Years | 4 (4.4%) | 0 (0.0%) |
| 65 to 74 Years | 2 (5.7%) | 0 (0.0%) |
| 75 Years and over | 7 (50.0%) | 4 (36.4%) |
Technology Access in Nunapitchuk
Computing Device Access in Nunapitchuk
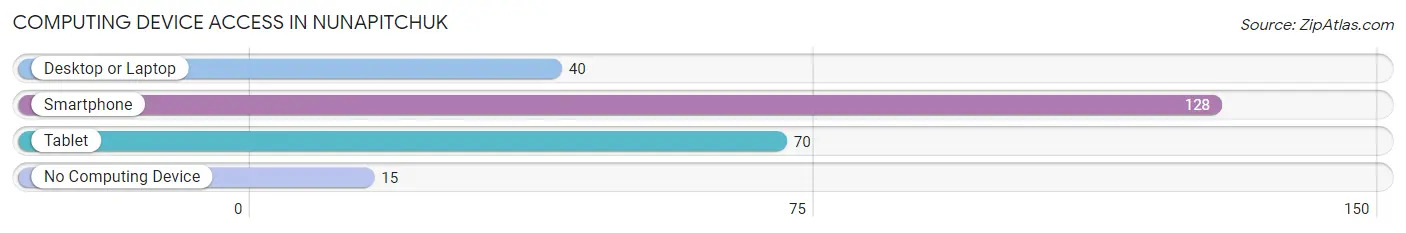
| Device Type | # Households | % Households |
| Desktop or Laptop | 40 | 26.1% |
| Smartphone | 128 | 83.7% |
| Tablet | 70 | 45.8% |
| No Computing Device | 15 | 9.8% |
| Total | 153 | 100.0% |
Internet Access in Nunapitchuk
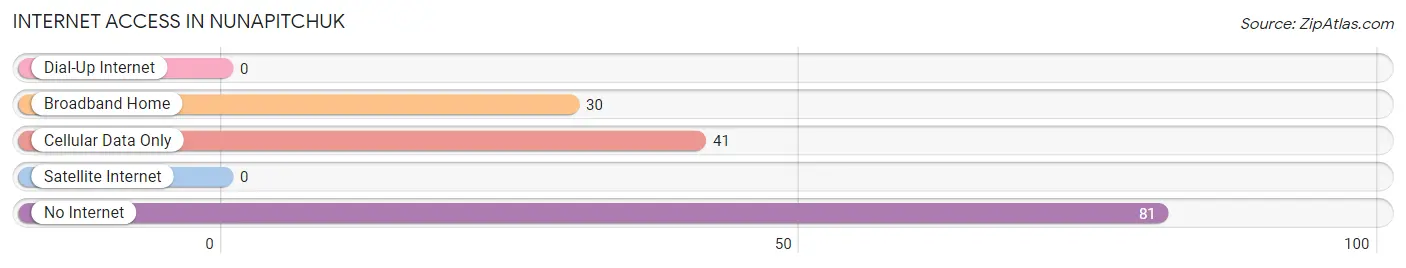
| Internet Type | # Households | % Households |
| Dial-Up Internet | 0 | 0.0% |
| Broadband Home | 30 | 19.6% |
| Cellular Data Only | 41 | 26.8% |
| Satellite Internet | 0 | 0.0% |
| No Internet | 81 | 52.9% |
| Total | 153 | 100.0% |
Nunapitchuk Summary
Nunapitchuk is a small city located in the Bethel Census Area of Alaska. It is situated on the Nunapitchuk Lake, which is part of the Kuskokwim River Delta. The city is home to a population of approximately 590 people, as of the 2010 census. The majority of the population is of Yup'ik Eskimo descent.
History
Nunapitchuk has a long history of human habitation. Archaeological evidence suggests that the area has been inhabited for at least 4,000 years. The Yup'ik Eskimos have been living in the area for centuries, and the city was first established in the late 19th century. The name Nunapitchuk is derived from the Yup'ik word for "place of many fish."
The city was originally a trading post, and it was a major hub for the fur trade in the region. In the early 20th century, the city was a major center for the commercial fishing industry. In the 1950s, the city was connected to the rest of Alaska by the Alaska Railroad.
Geography
Nunapitchuk is located in the Bethel Census Area of Alaska. It is situated on the Nunapitchuk Lake, which is part of the Kuskokwim River Delta. The city is located at an elevation of 10 feet above sea level. The climate is subarctic, with cold winters and mild summers.
The city is surrounded by tundra and wetlands. The nearby Nunapitchuk Lake is a popular destination for fishing and hunting. The lake is home to a variety of fish, including salmon, whitefish, and grayling.
Economy
The economy of Nunapitchuk is largely based on subsistence activities, such as fishing and hunting. The city is also home to a number of small businesses, including a grocery store, a hardware store, and a restaurant.
The city is also home to a number of government services, including a post office, a health clinic, and a school. The school is part of the Lower Kuskokwim School District.
Demographics
As of the 2010 census, the population of Nunapitchuk was 590. The majority of the population is of Yup'ik Eskimo descent. The median age of the population is 24.7 years, and the median household income is $25,000.
The city is served by the Lower Kuskokwim School District, which operates a K-12 school in the city. The school has an enrollment of approximately 200 students.
Conclusion
Nunapitchuk is a small city located in the Bethel Census Area of Alaska. It is situated on the Nunapitchuk Lake, which is part of the Kuskokwim River Delta. The city has a long history of human habitation, and the majority of the population is of Yup'ik Eskimo descent. The economy of the city is largely based on subsistence activities, such as fishing and hunting. The city is served by the Lower Kuskokwim School District, which operates a K-12 school in the city. As of the 2010 census, the population of Nunapitchuk was 590.
Common Questions
What is Per Capita Income in Nunapitchuk?
Per Capita income in Nunapitchuk is $13,326.
What is the Median Family Income in Nunapitchuk?
Median Family Income in Nunapitchuk is $44,375.
What is the Median Household income in Nunapitchuk?
Median Household Income in Nunapitchuk is $43,352.
What is Income or Wage Gap in Nunapitchuk?
Income or Wage Gap in Nunapitchuk is 61.6%.
Women in Nunapitchuk earn 38.4 cents for every dollar earned by a man.
What is Inequality or Gini Index in Nunapitchuk?
Inequality or Gini Index in Nunapitchuk is 0.50.
What is the Total Population of Nunapitchuk?
Total Population of Nunapitchuk is 827.
What is the Total Male Population of Nunapitchuk?
Total Male Population of Nunapitchuk is 398.
What is the Total Female Population of Nunapitchuk?
Total Female Population of Nunapitchuk is 429.
What is the Ratio of Males per 100 Females in Nunapitchuk?
There are 92.77 Males per 100 Females in Nunapitchuk.
What is the Ratio of Females per 100 Males in Nunapitchuk?
There are 107.79 Females per 100 Males in Nunapitchuk.
What is the Median Population Age in Nunapitchuk?
Median Population Age in Nunapitchuk is 21.9 Years.
What is the Average Family Size in Nunapitchuk
Average Family Size in Nunapitchuk is 5.9 People.
What is the Average Household Size in Nunapitchuk
Average Household Size in Nunapitchuk is 5.4 People.
How Large is the Labor Force in Nunapitchuk?
There are 289 People in the Labor Forcein in Nunapitchuk.
What is the Percentage of People in the Labor Force in Nunapitchuk?
59.2% of People are in the Labor Force in Nunapitchuk.
What is the Unemployment Rate in Nunapitchuk?
Unemployment Rate in Nunapitchuk is 16.6%.