Northway, AK Map & Demographics
Northway Map
Northway Overview
$13,238
PER CAPITA INCOME
$47,250
AVG FAMILY INCOME
0.56
INEQUALITY / GINI INDEX
252
TOTAL POPULATION
136
MALE POPULATION
116
FEMALE POPULATION
117.24
MALES / 100 FEMALES
85.29
FEMALES / 100 MALES
37.0
MEDIAN AGE
6.8
AVG FAMILY SIZE
4.8
AVG HOUSEHOLD SIZE
38
LABOR FORCE [ PEOPLE ]
27.1%
PERCENT IN LABOR FORCE
Northway Zip Codes
Northway Area Codes
Income in Northway
Income Overview in Northway
| Characteristic | Number | Measure |
| Per Capita Income | 252 | $13,238 |
| Median Family Income | 29 | $47,250 |
| Mean Family Income | 29 | $64,545 |
| Median Household Income | 53 | $0 |
| Mean Household Income | 53 | $45,938 |
| Income Deficit | 29 | $0 |
| Wage / Income Gap (%) | 252 | 0.00% |
| Wage / Income Gap ($) | 252 | 100.00¢ per $1 |
| Gini / Inequality Index | 252 | 0.56 |
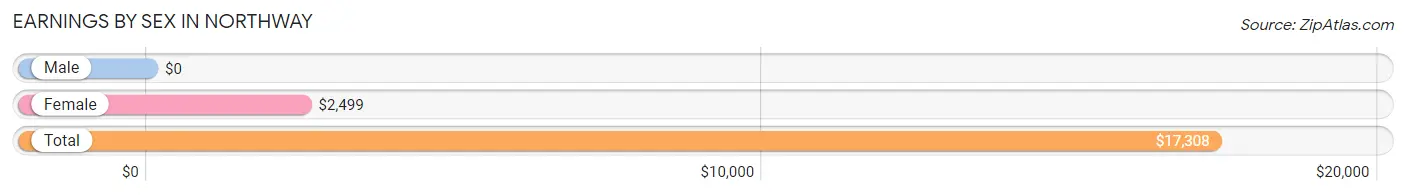
Earnings by Sex in Northway
| Sex | Number | Average Earnings |
| Male | 44 (61.1%) | $0 |
| Female | 28 (38.9%) | $2,499 |
| Total | 72 (100.0%) | $17,308 |
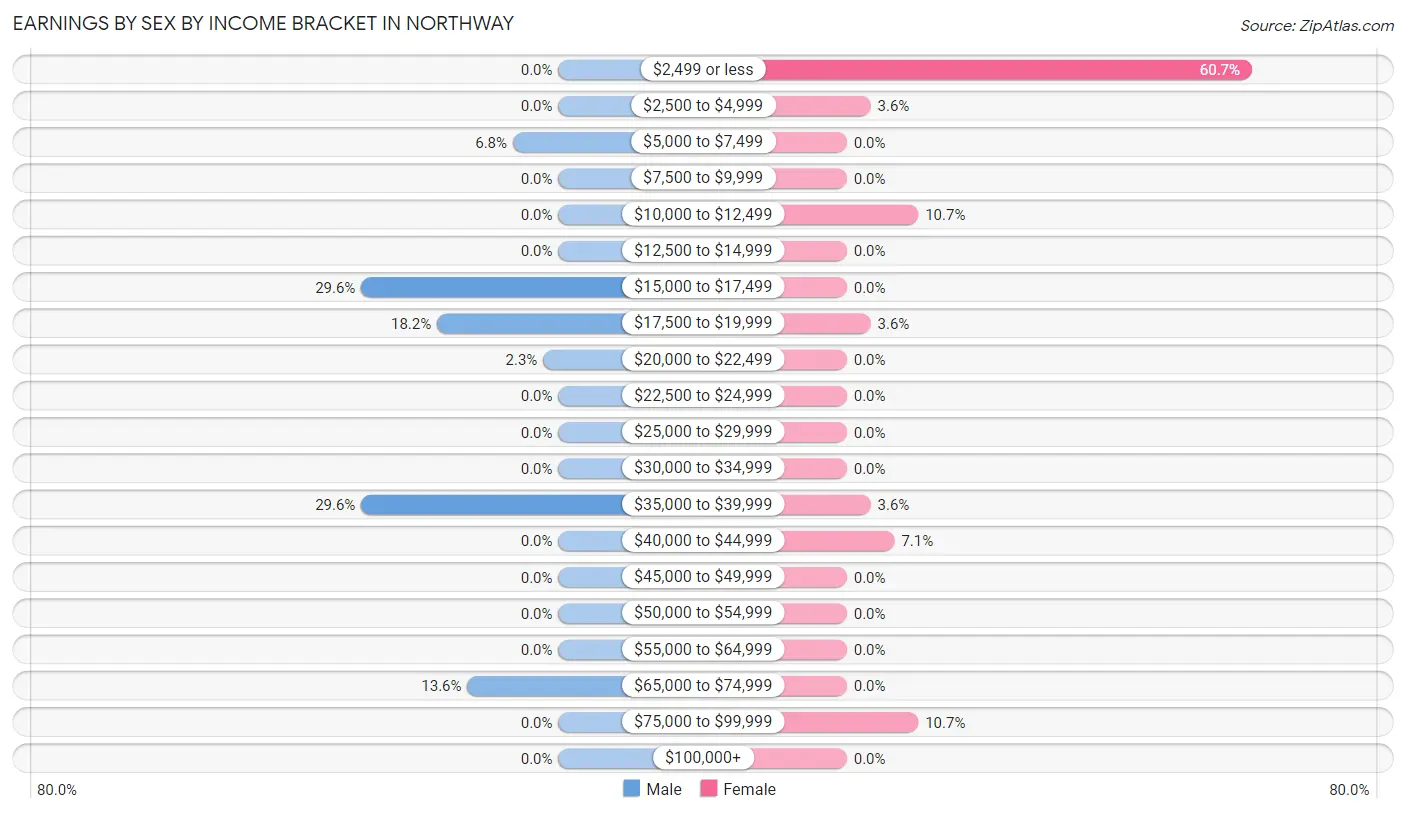
Earnings by Sex by Income Bracket in Northway
The most common earnings brackets in Northway are $15,000 to $17,499 for men (13 | 29.5%) and $2,499 or less for women (17 | 60.7%).
| Income | Male | Female |
| $2,499 or less | 0 (0.0%) | 17 (60.7%) |
| $2,500 to $4,999 | 0 (0.0%) | 1 (3.6%) |
| $5,000 to $7,499 | 3 (6.8%) | 0 (0.0%) |
| $7,500 to $9,999 | 0 (0.0%) | 0 (0.0%) |
| $10,000 to $12,499 | 0 (0.0%) | 3 (10.7%) |
| $12,500 to $14,999 | 0 (0.0%) | 0 (0.0%) |
| $15,000 to $17,499 | 13 (29.5%) | 0 (0.0%) |
| $17,500 to $19,999 | 8 (18.2%) | 1 (3.6%) |
| $20,000 to $22,499 | 1 (2.3%) | 0 (0.0%) |
| $22,500 to $24,999 | 0 (0.0%) | 0 (0.0%) |
| $25,000 to $29,999 | 0 (0.0%) | 0 (0.0%) |
| $30,000 to $34,999 | 0 (0.0%) | 0 (0.0%) |
| $35,000 to $39,999 | 13 (29.5%) | 1 (3.6%) |
| $40,000 to $44,999 | 0 (0.0%) | 2 (7.1%) |
| $45,000 to $49,999 | 0 (0.0%) | 0 (0.0%) |
| $50,000 to $54,999 | 0 (0.0%) | 0 (0.0%) |
| $55,000 to $64,999 | 0 (0.0%) | 0 (0.0%) |
| $65,000 to $74,999 | 6 (13.6%) | 0 (0.0%) |
| $75,000 to $99,999 | 0 (0.0%) | 3 (10.7%) |
| $100,000+ | 0 (0.0%) | 0 (0.0%) |
| Total | 44 (100.0%) | 28 (100.0%) |
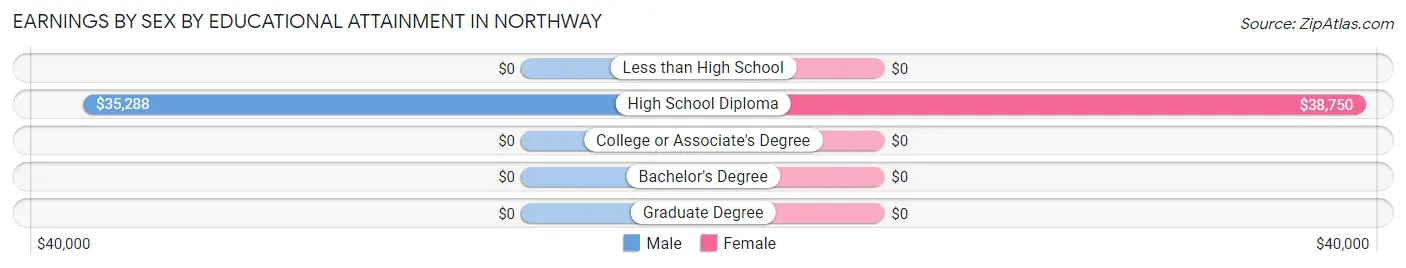
Earnings by Sex by Educational Attainment in Northway
| Educational Attainment | Male Income | Female Income |
| Less than High School | - | - |
| High School Diploma | $35,288 | $38,750 |
| College or Associate's Degree | - | - |
| Bachelor's Degree | - | - |
| Graduate Degree | - | - |
| Total | - | - |
Family Income in Northway
Family Income Brackets in Northway
According to the Northway family income data, there are 7 families falling into the $50,000 to $74,999 income range, which is the most common income bracket and makes up 24.1% of all families.
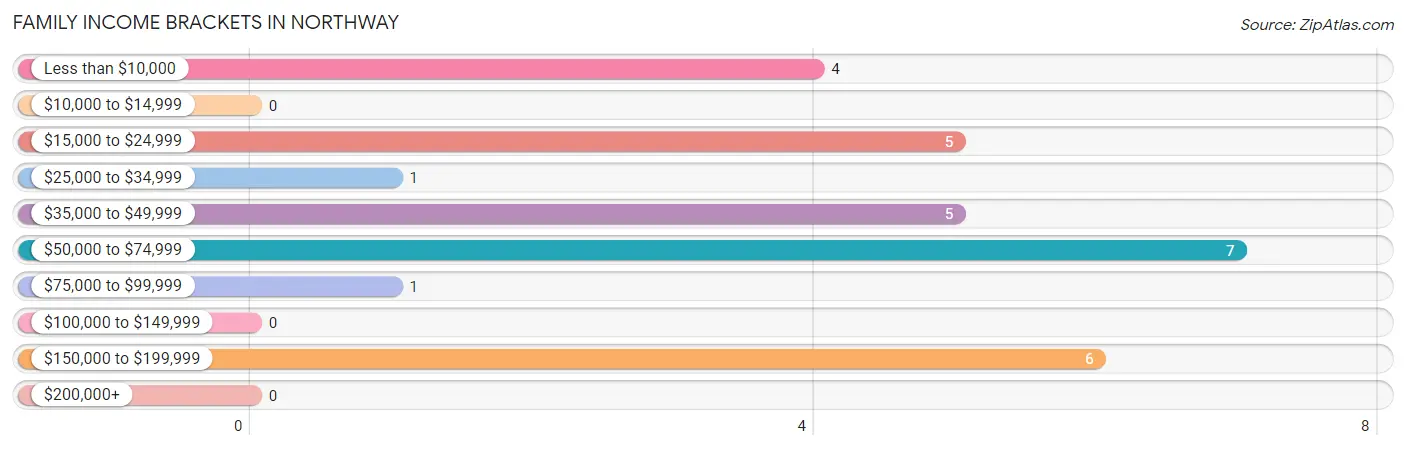
| Income Bracket | # Families | % Families |
| Less than $10,000 | 4 | 13.8% |
| $10,000 to $14,999 | 0 | 0.0% |
| $15,000 to $24,999 | 5 | 17.2% |
| $25,000 to $34,999 | 1 | 3.4% |
| $35,000 to $49,999 | 5 | 17.2% |
| $50,000 to $74,999 | 7 | 24.1% |
| $75,000 to $99,999 | 1 | 3.4% |
| $100,000 to $149,999 | 0 | 0.0% |
| $150,000 to $199,999 | 6 | 20.7% |
| $200,000+ | 0 | 0.0% |
Family Income by Famaliy Size in Northway
4-person families (12 | 41.4%) account for the highest median family income in Northway with $46,667 per family, while 4-person families (12 | 41.4%) have the highest median income of $11,667 per family member.
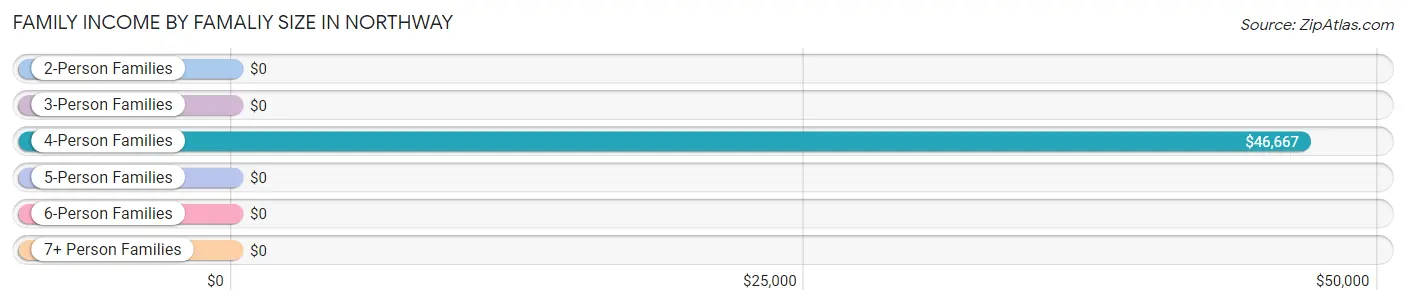
| Income Bracket | # Families | Median Income |
| 2-Person Families | 9 (31.0%) | $0 |
| 3-Person Families | 2 (6.9%) | $0 |
| 4-Person Families | 12 (41.4%) | $46,667 |
| 5-Person Families | 5 (17.2%) | $0 |
| 6-Person Families | 0 (0.0%) | $0 |
| 7+ Person Families | 1 (3.5%) | $0 |
| Total | 29 (100.0%) | $47,250 |
Family Income by Number of Earners in Northway
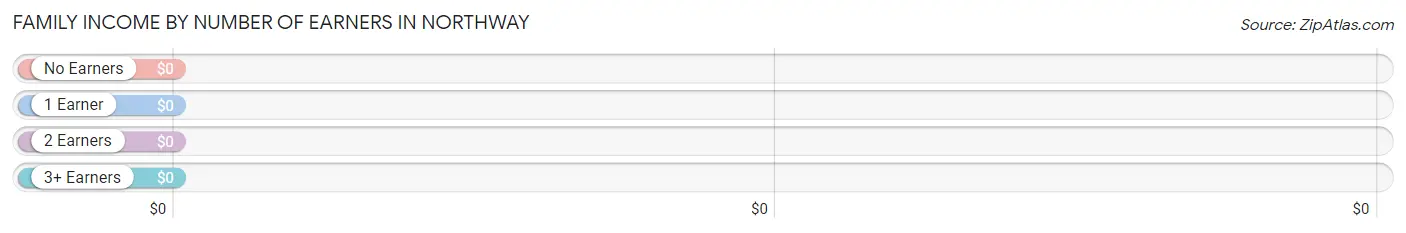
| Number of Earners | # Families | Median Income |
| No Earners | 12 (41.4%) | $0 |
| 1 Earner | 7 (24.1%) | $0 |
| 2 Earners | 5 (17.2%) | $0 |
| 3+ Earners | 5 (17.2%) | $0 |
| Total | 29 (100.0%) | $47,250 |
Household Income in Northway
Household Income Brackets in Northway
With 13 households falling in the category, the less than $10,000 income range is the most frequent in Northway, accounting for 24.5% of all households.
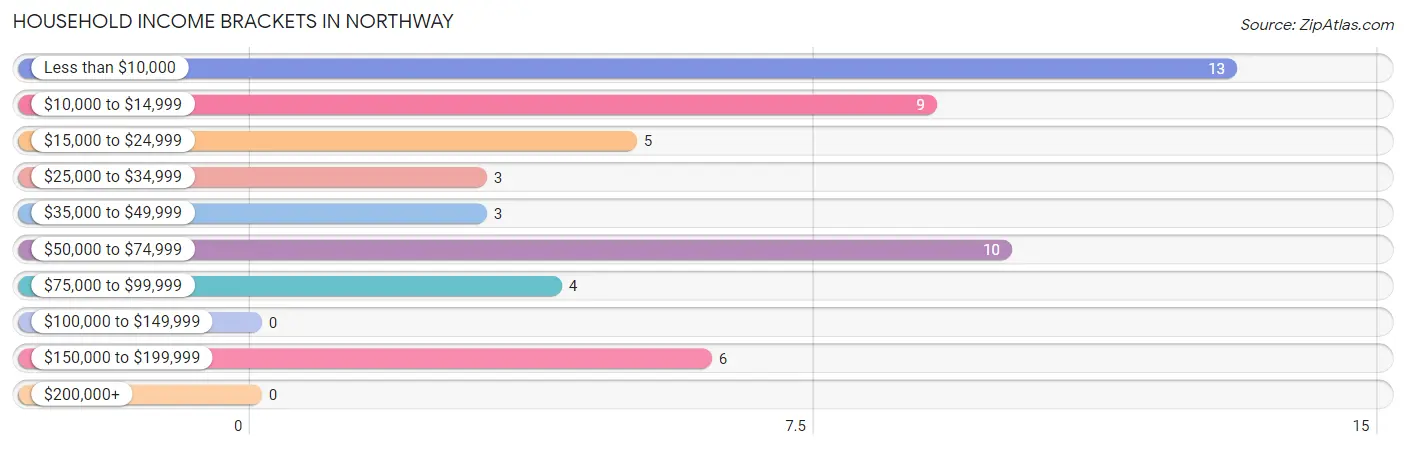
| Income Bracket | # Households | % Households |
| Less than $10,000 | 13 | 24.5% |
| $10,000 to $14,999 | 9 | 17.0% |
| $15,000 to $24,999 | 5 | 9.4% |
| $25,000 to $34,999 | 3 | 5.7% |
| $35,000 to $49,999 | 3 | 5.7% |
| $50,000 to $74,999 | 10 | 18.9% |
| $75,000 to $99,999 | 4 | 7.5% |
| $100,000 to $149,999 | 0 | 0.0% |
| $150,000 to $199,999 | 6 | 11.3% |
| $200,000+ | 0 | 0.0% |
Household Income by Householder Age in Northway
The median household income in Northway is $0, with the highest median household income of $57,500 found in the 25 to 44 years age bracket for the primary householder. A total of 10 households (18.9%) fall into this category.
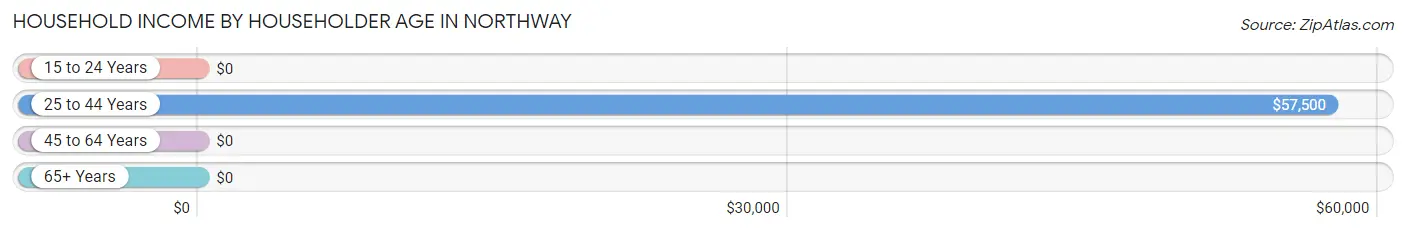
| Income Bracket | # Households | Median Income |
| 15 to 24 Years | 0 (0.0%) | $0 |
| 25 to 44 Years | 10 (18.9%) | $57,500 |
| 45 to 64 Years | 6 (11.3%) | $0 |
| 65+ Years | 37 (69.8%) | $0 |
| Total | 53 (100.0%) | $0 |
Poverty in Northway
Income Below Poverty by Sex and Age in Northway
With 33.1% poverty level for males and 26.7% for females among the residents of Northway, under 5 year old males and 15 year old females are the most vulnerable to poverty, with 8 males (100.0%) and 8 females (100.0%) in their respective age groups living below the poverty level.
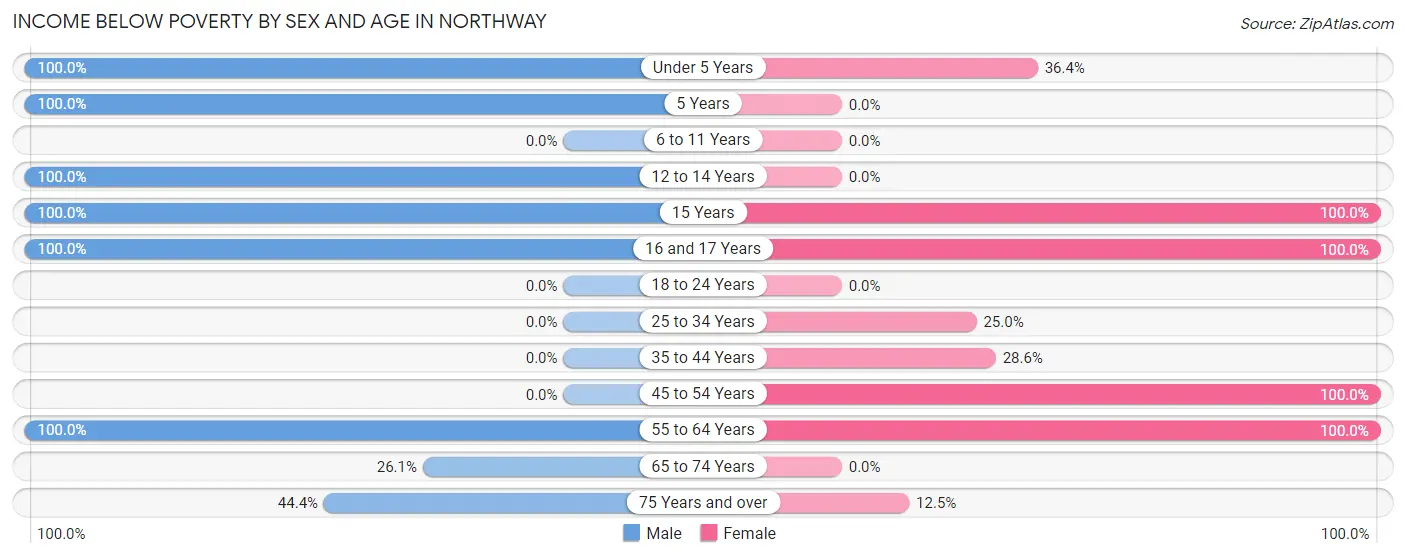
| Age Bracket | Male | Female |
| Under 5 Years | 8 (100.0%) | 8 (36.4%) |
| 5 Years | 6 (100.0%) | 0 (0.0%) |
| 6 to 11 Years | 0 (0.0%) | 0 (0.0%) |
| 12 to 14 Years | 4 (100.0%) | 0 (0.0%) |
| 15 Years | 1 (100.0%) | 8 (100.0%) |
| 16 and 17 Years | 4 (100.0%) | 3 (100.0%) |
| 18 to 24 Years | 0 (0.0%) | 0 (0.0%) |
| 25 to 34 Years | 0 (0.0%) | 1 (25.0%) |
| 35 to 44 Years | 0 (0.0%) | 2 (28.6%) |
| 45 to 54 Years | 0 (0.0%) | 6 (100.0%) |
| 55 to 64 Years | 4 (100.0%) | 2 (100.0%) |
| 65 to 74 Years | 6 (26.1%) | 0 (0.0%) |
| 75 Years and over | 12 (44.4%) | 1 (12.5%) |
| Total | 45 (33.1%) | 31 (26.7%) |
Income Above Poverty by Sex and Age in Northway
According to the poverty statistics in Northway, males aged 6 to 11 years and females aged 6 to 11 years are the age groups that are most secure financially, with 100.0% of males and 100.0% of females in these age groups living above the poverty line.
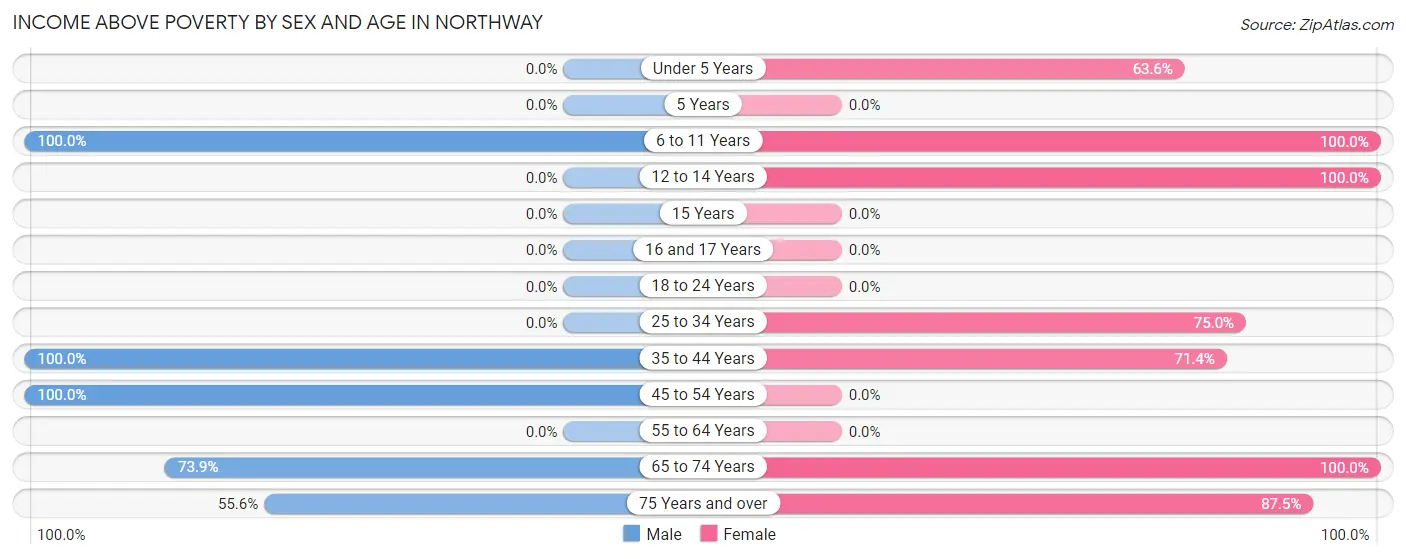
| Age Bracket | Male | Female |
| Under 5 Years | 0 (0.0%) | 14 (63.6%) |
| 5 Years | 0 (0.0%) | 0 (0.0%) |
| 6 to 11 Years | 24 (100.0%) | 16 (100.0%) |
| 12 to 14 Years | 0 (0.0%) | 23 (100.0%) |
| 15 Years | 0 (0.0%) | 0 (0.0%) |
| 16 and 17 Years | 0 (0.0%) | 0 (0.0%) |
| 18 to 24 Years | 0 (0.0%) | 0 (0.0%) |
| 25 to 34 Years | 0 (0.0%) | 3 (75.0%) |
| 35 to 44 Years | 16 (100.0%) | 5 (71.4%) |
| 45 to 54 Years | 19 (100.0%) | 0 (0.0%) |
| 55 to 64 Years | 0 (0.0%) | 0 (0.0%) |
| 65 to 74 Years | 17 (73.9%) | 17 (100.0%) |
| 75 Years and over | 15 (55.6%) | 7 (87.5%) |
| Total | 91 (66.9%) | 85 (73.3%) |
Income Below Poverty Among Married-Couple Families in Northway
The poverty statistics for married-couple families in Northway show that 26.1% or 6 of the total 23 families live below the poverty line. Families with no children have the highest poverty rate of 37.5%, comprising of 3 families. On the other hand, families with 1 or 2 children have the lowest poverty rate of 20.0%, which includes 3 families.
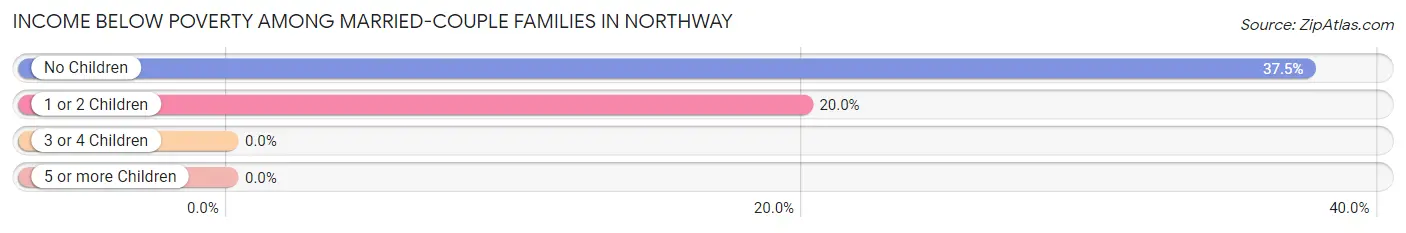
| Children | Above Poverty | Below Poverty |
| No Children | 5 (62.5%) | 3 (37.5%) |
| 1 or 2 Children | 12 (80.0%) | 3 (20.0%) |
| 3 or 4 Children | 0 (0.0%) | 0 (0.0%) |
| 5 or more Children | 0 (0.0%) | 0 (0.0%) |
| Total | 17 (73.9%) | 6 (26.1%) |
Income Below Poverty Among Single-Parent Households in Northway
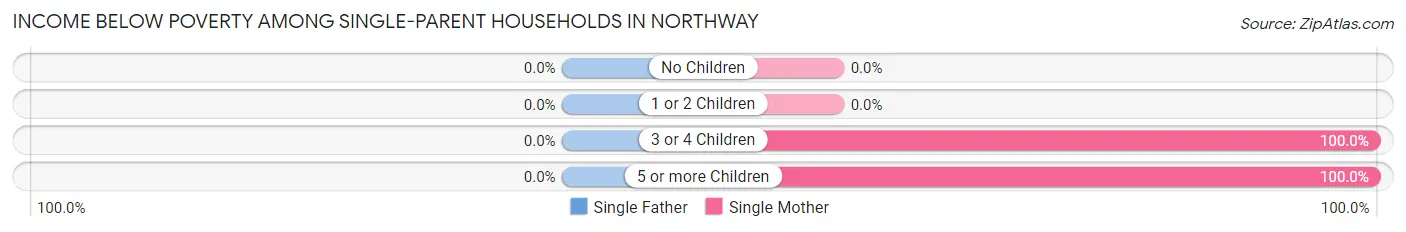
| Children | Single Father | Single Mother |
| No Children | 0 (0.0%) | 0 (0.0%) |
| 1 or 2 Children | 0 (0.0%) | 0 (0.0%) |
| 3 or 4 Children | 0 (0.0%) | 1 (100.0%) |
| 5 or more Children | 0 (0.0%) | 1 (100.0%) |
| Total | 0 (0.0%) | 2 (33.3%) |
Income Below Poverty Among Married-Couple vs Single-Parent Households in Northway
The poverty data for Northway shows that 6 of the married-couple family households (26.1%) and 2 of the single-parent households (33.3%) are living below the poverty level. Within the married-couple family households, those with no children have the highest poverty rate, with 3 households (37.5%) falling below the poverty line. Among the single-parent households, those with 3 or 4 children have the highest poverty rate, with 1 household (100.0%) living below poverty.
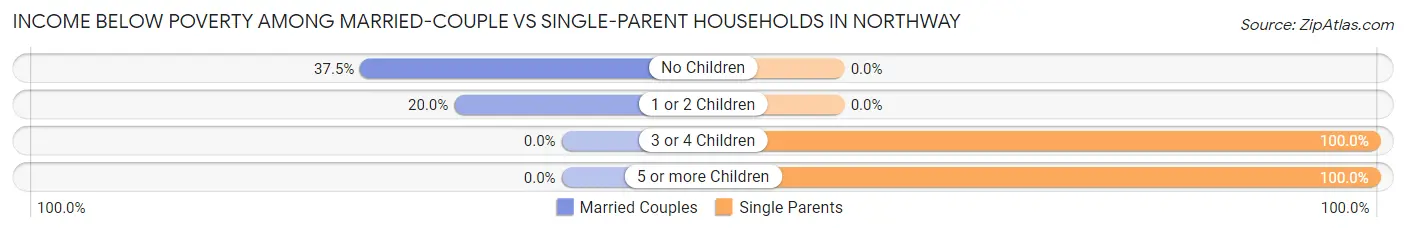
| Children | Married-Couple Families | Single-Parent Households |
| No Children | 3 (37.5%) | 0 (0.0%) |
| 1 or 2 Children | 3 (20.0%) | 0 (0.0%) |
| 3 or 4 Children | 0 (0.0%) | 1 (100.0%) |
| 5 or more Children | 0 (0.0%) | 1 (100.0%) |
| Total | 6 (26.1%) | 2 (33.3%) |
Race in Northway
The most populous races in Northway are Native / Alaskan (184 | 73.0%), White / Caucasian (41 | 16.3%), and Two or more Races (27 | 10.7%).
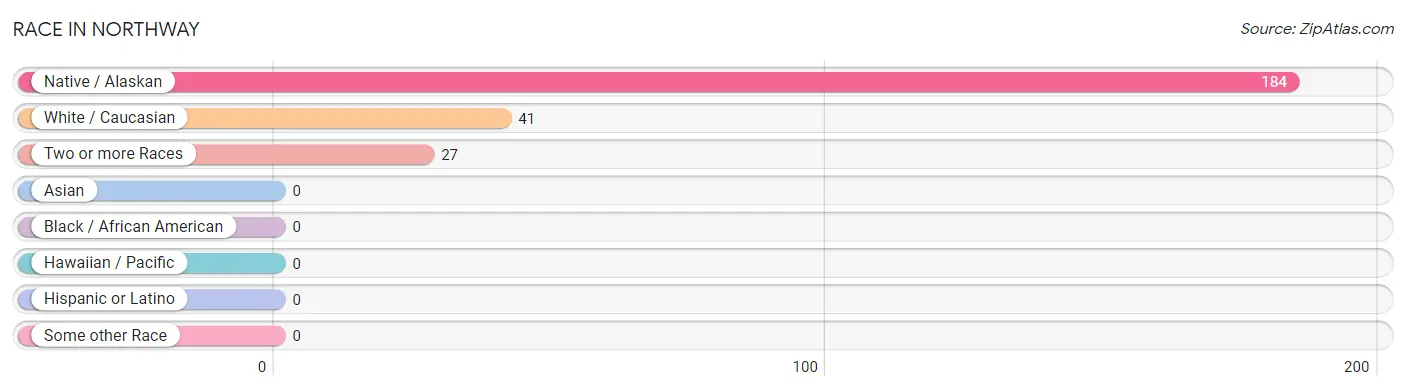
| Race | # Population | % Population |
| Asian | 0 | 0.0% |
| Black / African American | 0 | 0.0% |
| Hawaiian / Pacific | 0 | 0.0% |
| Hispanic or Latino | 0 | 0.0% |
| Native / Alaskan | 184 | 73.0% |
| White / Caucasian | 41 | 16.3% |
| Two or more Races | 27 | 10.7% |
| Some other Race | 0 | 0.0% |
| Total | 252 | 100.0% |
Ancestry in Northway
The most populous ancestries reported in Northway are Alaskan Athabascan (200 | 79.4%), Yup'ik (27 | 10.7%), English (11 | 4.4%), German (9 | 3.6%), and Irish (8 | 3.2%), together accounting for 101.2% of all Northway residents.
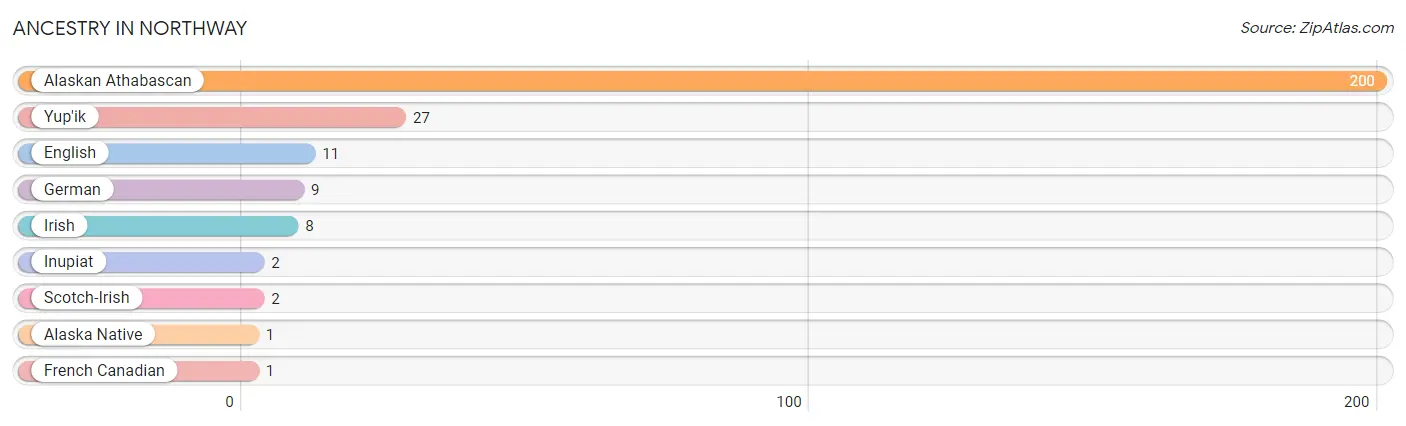
| Ancestry | # Population | % Population |
| Alaska Native | 1 | 0.4% |
| Alaskan Athabascan | 200 | 79.4% |
| English | 11 | 4.4% |
| French Canadian | 1 | 0.4% |
| German | 9 | 3.6% |
| Inupiat | 2 | 0.8% |
| Irish | 8 | 3.2% |
| Scotch-Irish | 2 | 0.8% |
| Yup'ik | 27 | 10.7% | View All 9 Rows |
Immigrants in Northway

| Immigration Origin | # Population | % Population | View All 0 Rows |
Sex and Age in Northway
Sex and Age in Northway
The most populous age groups in Northway are 5 to 9 Years (30 | 22.1%) for men and 10 to 14 Years (39 | 33.6%) for women.
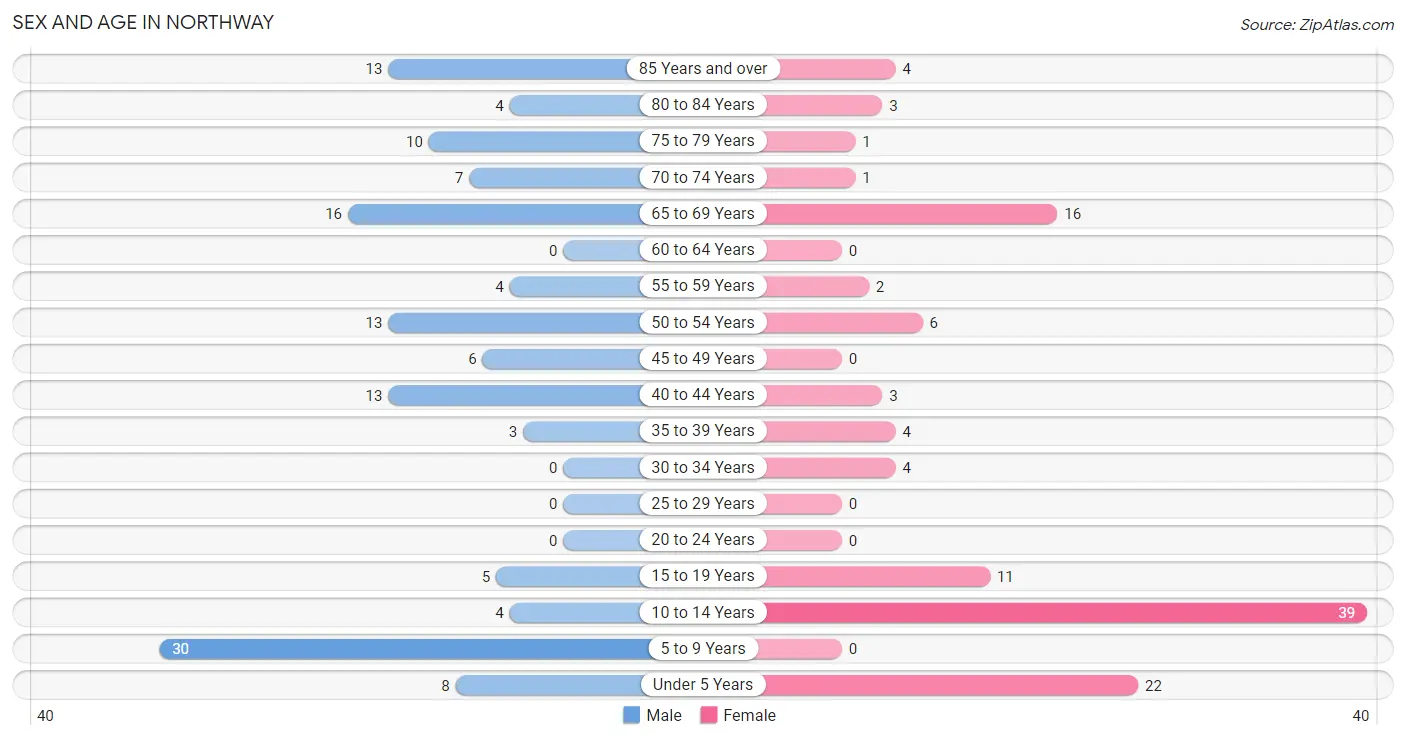
| Age Bracket | Male | Female |
| Under 5 Years | 8 (5.9%) | 22 (19.0%) |
| 5 to 9 Years | 30 (22.1%) | 0 (0.0%) |
| 10 to 14 Years | 4 (2.9%) | 39 (33.6%) |
| 15 to 19 Years | 5 (3.7%) | 11 (9.5%) |
| 20 to 24 Years | 0 (0.0%) | 0 (0.0%) |
| 25 to 29 Years | 0 (0.0%) | 0 (0.0%) |
| 30 to 34 Years | 0 (0.0%) | 4 (3.5%) |
| 35 to 39 Years | 3 (2.2%) | 4 (3.5%) |
| 40 to 44 Years | 13 (9.6%) | 3 (2.6%) |
| 45 to 49 Years | 6 (4.4%) | 0 (0.0%) |
| 50 to 54 Years | 13 (9.6%) | 6 (5.2%) |
| 55 to 59 Years | 4 (2.9%) | 2 (1.7%) |
| 60 to 64 Years | 0 (0.0%) | 0 (0.0%) |
| 65 to 69 Years | 16 (11.8%) | 16 (13.8%) |
| 70 to 74 Years | 7 (5.1%) | 1 (0.9%) |
| 75 to 79 Years | 10 (7.3%) | 1 (0.9%) |
| 80 to 84 Years | 4 (2.9%) | 3 (2.6%) |
| 85 Years and over | 13 (9.6%) | 4 (3.5%) |
| Total | 136 (100.0%) | 116 (100.0%) |
Families and Households in Northway
Median Family Size in Northway
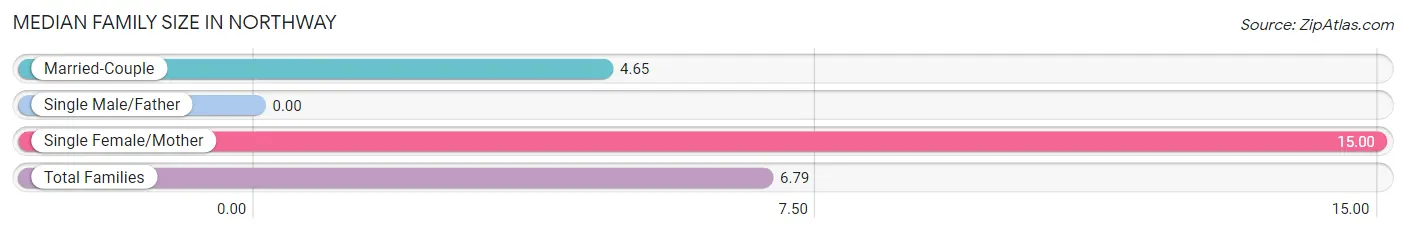
| Family Type | # Families | Family Size |
| Married-Couple | 23 (79.3%) | 4.65 |
| Single Male/Father | 0 (0.0%) | - |
| Single Female/Mother | 6 (20.7%) | 15.00 |
| Total Families | 29 (100.0%) | 6.79 |
Median Household Size in Northway
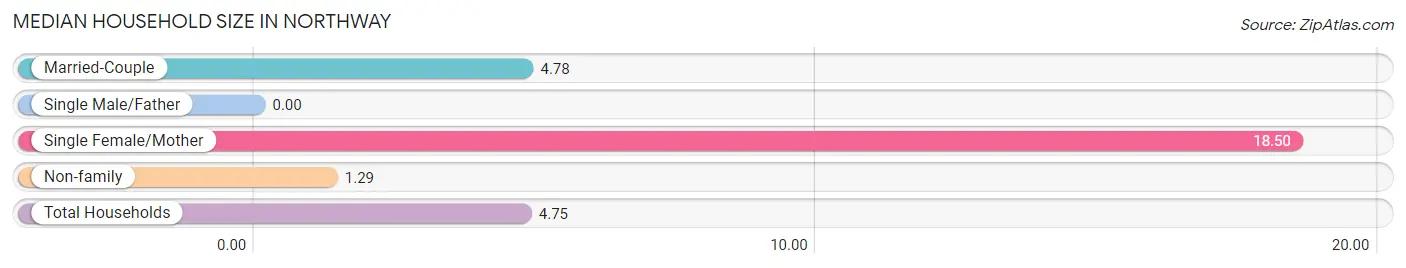
| Household Type | # Households | Household Size |
| Married-Couple | 23 (43.4%) | 4.78 |
| Single Male/Father | 0 (0.0%) | - |
| Single Female/Mother | 6 (11.3%) | 18.50 |
| Non-family | 24 (45.3%) | 1.29 |
| Total Households | 53 (100.0%) | 4.75 |
Household Size by Marriage Status in Northway
Out of a total of 53 households in Northway, 29 (54.7%) are family households, while 24 (45.3%) are nonfamily households. The most numerous type of family households are 4-person households, comprising 11, and the most common type of nonfamily households are 1-person households, comprising 21.
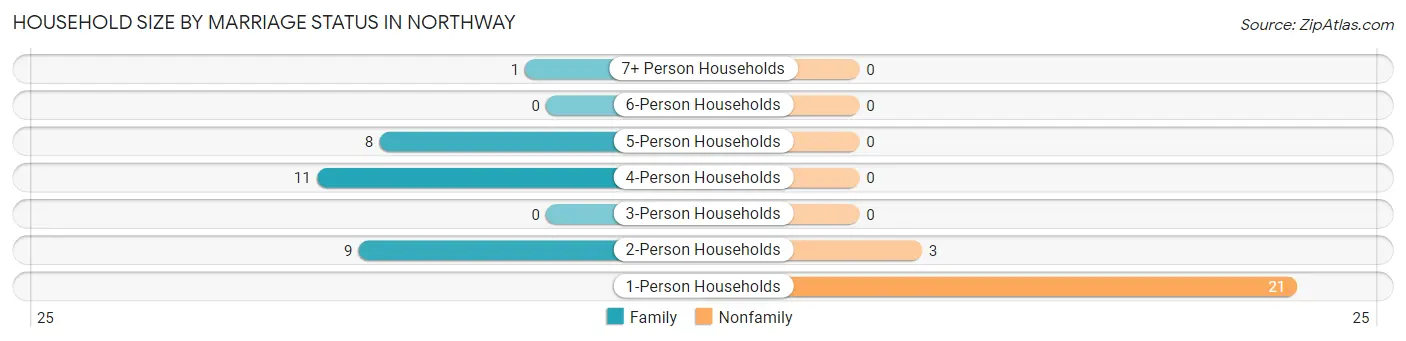
| Household Size | Family Households | Nonfamily Households |
| 1-Person Households | - | 21 (39.6%) |
| 2-Person Households | 9 (17.0%) | 3 (5.7%) |
| 3-Person Households | 0 (0.0%) | 0 (0.0%) |
| 4-Person Households | 11 (20.7%) | 0 (0.0%) |
| 5-Person Households | 8 (15.1%) | 0 (0.0%) |
| 6-Person Households | 0 (0.0%) | 0 (0.0%) |
| 7+ Person Households | 1 (1.9%) | 0 (0.0%) |
| Total | 29 (54.7%) | 24 (45.3%) |
Female Fertility in Northway
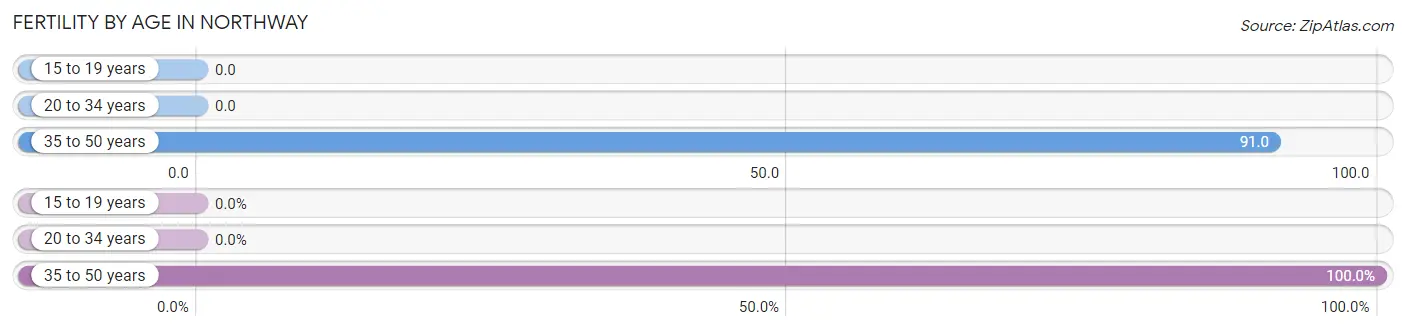
Fertility by Age in Northway
Average fertility rate in Northway is 38.0 births per 1,000 women. Women in the age bracket of 35 to 50 years have the highest fertility rate with 91.0 births per 1,000 women. Women in the age bracket of 35 to 50 years acount for 100.0% of all women with births.
| Age Bracket | Women with Births | Births / 1,000 Women |
| 15 to 19 years | 0 (0.0%) | 0.0 |
| 20 to 34 years | 0 (0.0%) | 0.0 |
| 35 to 50 years | 1 (100.0%) | 91.0 |
| Total | 1 (100.0%) | 38.0 |
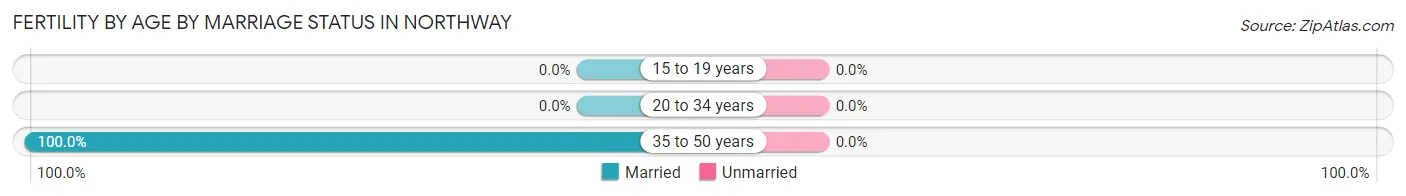
Fertility by Age by Marriage Status in Northway
| Age Bracket | Married | Unmarried |
| 15 to 19 years | 0 (0.0%) | 0 (0.0%) |
| 20 to 34 years | 0 (0.0%) | 0 (0.0%) |
| 35 to 50 years | 1 (100.0%) | 0 (0.0%) |
| Total | 1 (100.0%) | 0 (0.0%) |
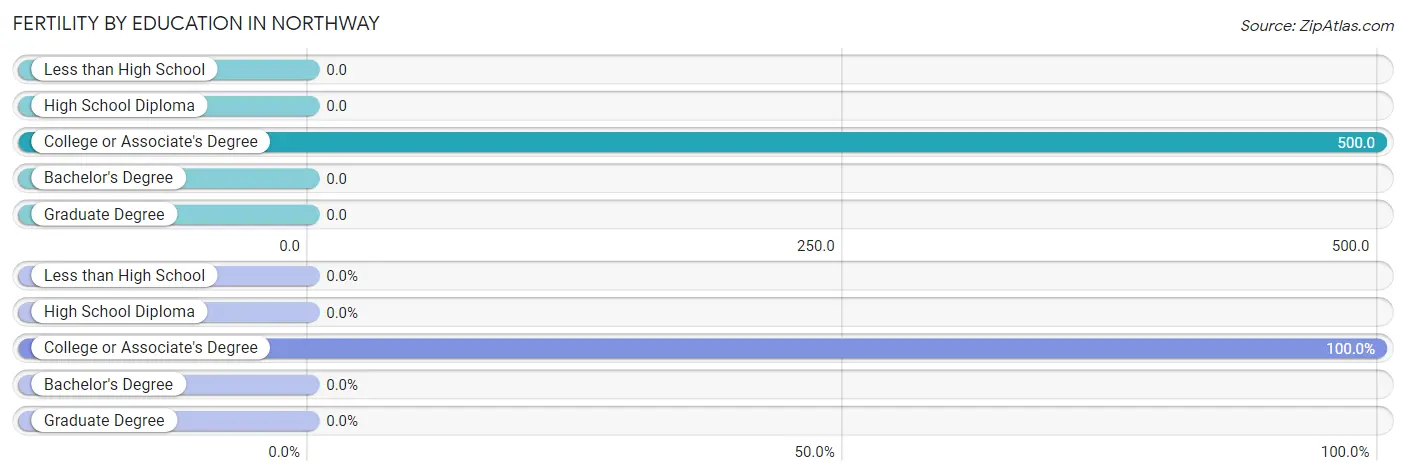
Fertility by Education in Northway
| Educational Attainment | Women with Births | Births / 1,000 Women |
| Less than High School | 0 (0.0%) | 0.0 |
| High School Diploma | 0 (0.0%) | 0.0 |
| College or Associate's Degree | 1 (100.0%) | 500.0 |
| Bachelor's Degree | 0 (0.0%) | 0.0 |
| Graduate Degree | 0 (0.0%) | 0.0 |
| Total | 1 (100.0%) | 38.0 |
Fertility by Education by Marriage Status in Northway

| Educational Attainment | Married | Unmarried |
| Less than High School | 0 (0.0%) | 0 (0.0%) |
| High School Diploma | 0 (0.0%) | 0 (0.0%) |
| College or Associate's Degree | 1 (100.0%) | 0 (0.0%) |
| Bachelor's Degree | 0 (0.0%) | 0 (0.0%) |
| Graduate Degree | 0 (0.0%) | 0 (0.0%) |
| Total | 1 (100.0%) | 0 (0.0%) |
Employment Characteristics in Northway
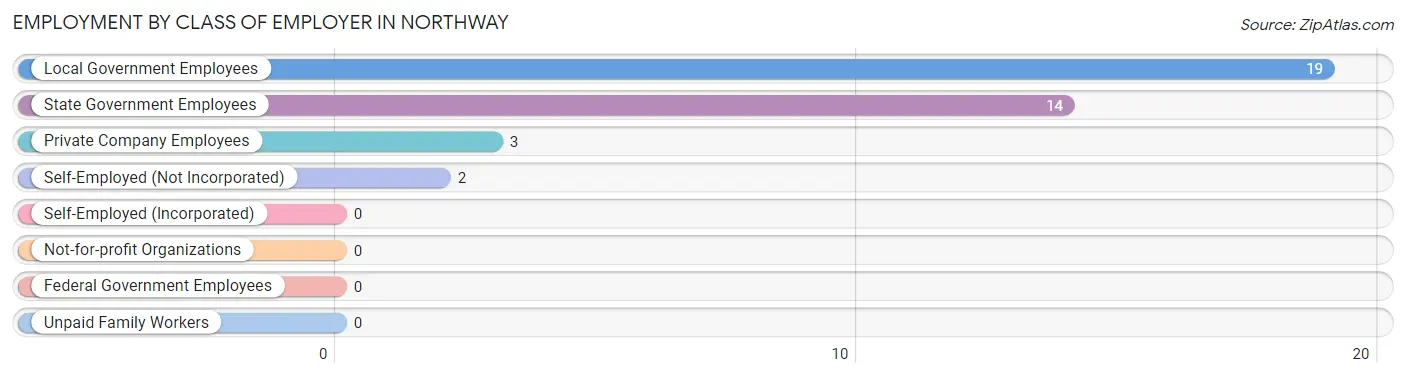
Employment by Class of Employer in Northway
Among the 38 employed individuals in Northway, local government employees (19 | 50.0%), state government employees (14 | 36.8%), and private company employees (3 | 7.9%) make up the most common classes of employment.
| Employer Class | # Employees | % Employees |
| Private Company Employees | 3 | 7.9% |
| Self-Employed (Incorporated) | 0 | 0.0% |
| Self-Employed (Not Incorporated) | 2 | 5.3% |
| Not-for-profit Organizations | 0 | 0.0% |
| Local Government Employees | 19 | 50.0% |
| State Government Employees | 14 | 36.8% |
| Federal Government Employees | 0 | 0.0% |
| Unpaid Family Workers | 0 | 0.0% |
| Total | 38 | 100.0% |
Employment Status by Age in Northway
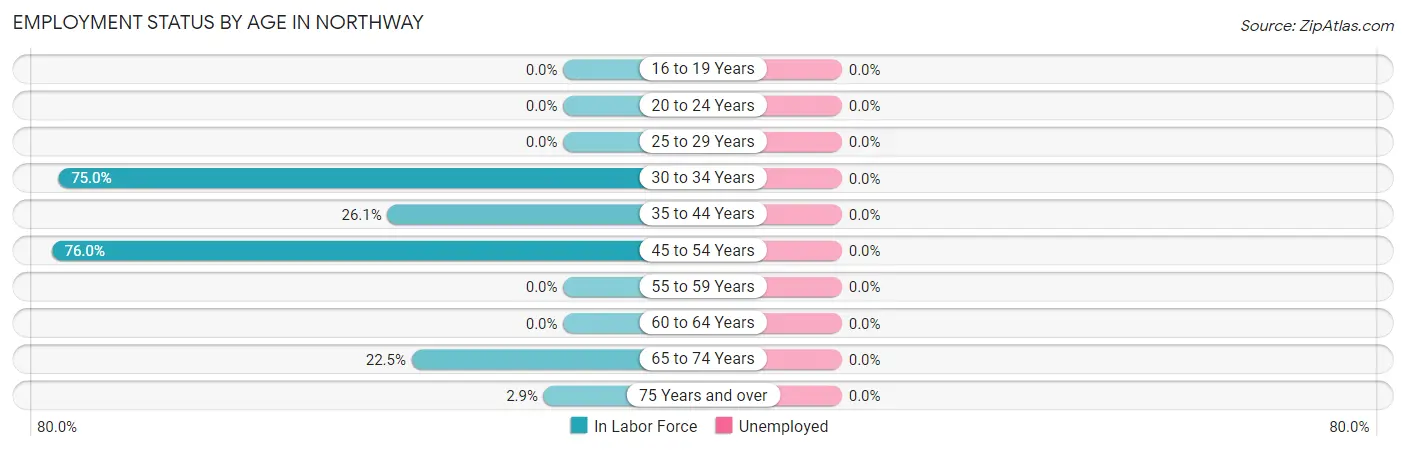
| Age Bracket | In Labor Force | Unemployed |
| 16 to 19 Years | 0 (0.0%) | 0 (0.0%) |
| 20 to 24 Years | 0 (0.0%) | 0 (0.0%) |
| 25 to 29 Years | 0 (0.0%) | 0 (0.0%) |
| 30 to 34 Years | 3 (75.0%) | 0 (0.0%) |
| 35 to 44 Years | 6 (26.1%) | 0 (0.0%) |
| 45 to 54 Years | 19 (76.0%) | 0 (0.0%) |
| 55 to 59 Years | 0 (0.0%) | 0 (0.0%) |
| 60 to 64 Years | 0 (0.0%) | 0 (0.0%) |
| 65 to 74 Years | 9 (22.5%) | 0 (0.0%) |
| 75 Years and over | 1 (2.9%) | 0 (0.0%) |
| Total | 38 (27.1%) | 0 (0.0%) |
Employment Status by Educational Attainment in Northway
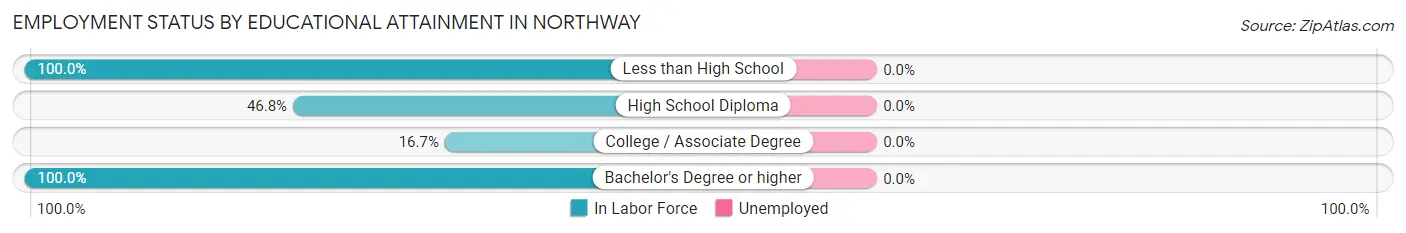
| Educational Attainment | In Labor Force | Unemployed |
| Less than High School | 2 (100.0%) | 0 (0.0%) |
| High School Diploma | 22 (46.8%) | 0 (0.0%) |
| College / Associate Degree | 1 (16.7%) | 0 (0.0%) |
| Bachelor's Degree or higher | 3 (100.0%) | 0 (0.0%) |
| Total | 28 (48.3%) | 0 (0.0%) |
Employment Occupations by Sex in Northway
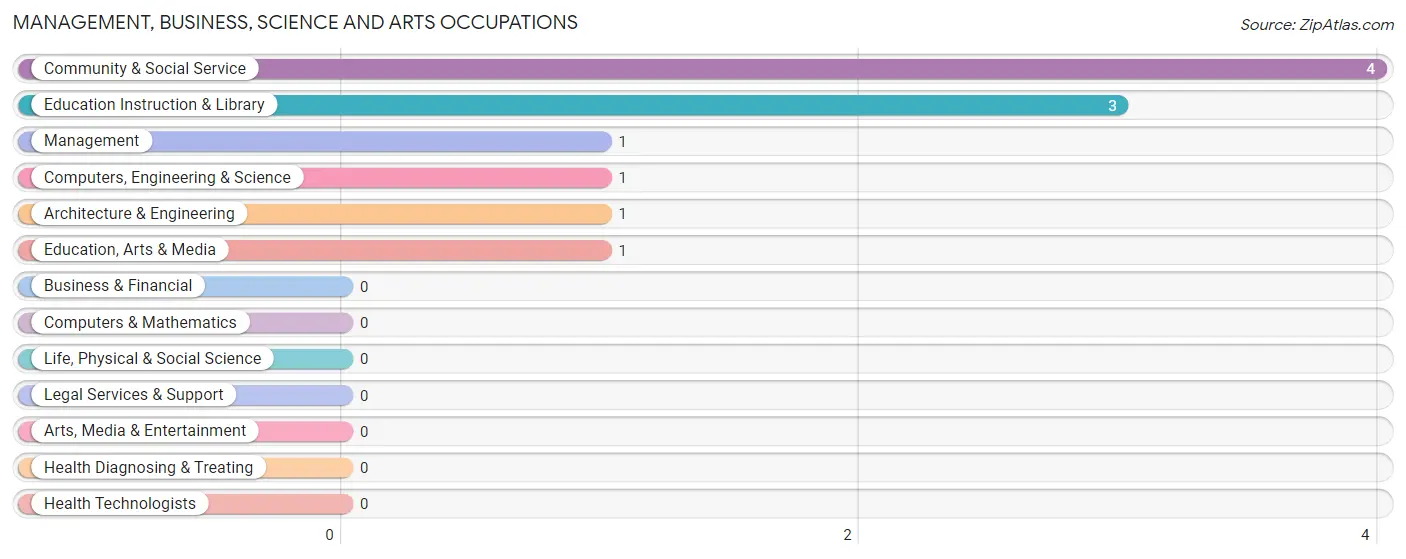
Management, Business, Science and Arts Occupations
The most common Management, Business, Science and Arts occupations in Northway are Community & Social Service (4 | 10.5%), Education Instruction & Library (3 | 7.9%), Management (1 | 2.6%), Computers, Engineering & Science (1 | 2.6%), and Architecture & Engineering (1 | 2.6%).
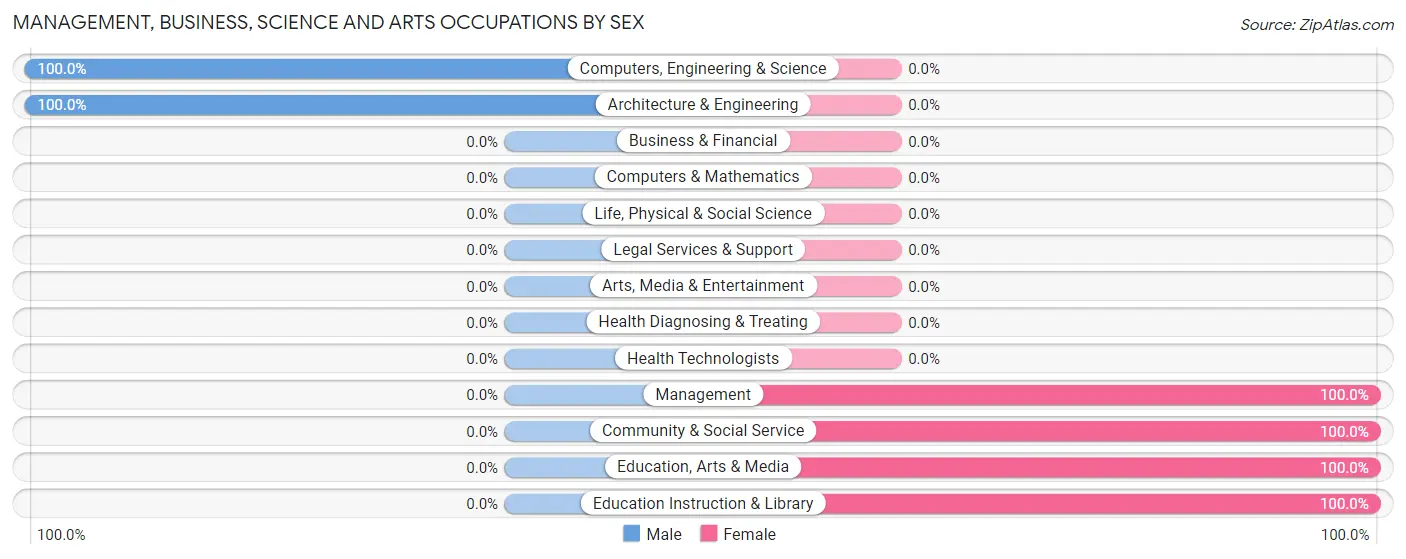
Management, Business, Science and Arts Occupations by Sex
Within the Management, Business, Science and Arts occupations in Northway, the most male-oriented occupations are Computers, Engineering & Science (100.0%), and Architecture & Engineering (100.0%), while the most female-oriented occupations are Management (100.0%), Community & Social Service (100.0%), and Education, Arts & Media (100.0%).
| Occupation | Male | Female |
| Management | 0 (0.0%) | 1 (100.0%) |
| Business & Financial | 0 (0.0%) | 0 (0.0%) |
| Computers, Engineering & Science | 1 (100.0%) | 0 (0.0%) |
| Computers & Mathematics | 0 (0.0%) | 0 (0.0%) |
| Architecture & Engineering | 1 (100.0%) | 0 (0.0%) |
| Life, Physical & Social Science | 0 (0.0%) | 0 (0.0%) |
| Community & Social Service | 0 (0.0%) | 4 (100.0%) |
| Education, Arts & Media | 0 (0.0%) | 1 (100.0%) |
| Legal Services & Support | 0 (0.0%) | 0 (0.0%) |
| Education Instruction & Library | 0 (0.0%) | 3 (100.0%) |
| Arts, Media & Entertainment | 0 (0.0%) | 0 (0.0%) |
| Health Diagnosing & Treating | 0 (0.0%) | 0 (0.0%) |
| Health Technologists | 0 (0.0%) | 0 (0.0%) |
| Total (Category) | 1 (16.7%) | 5 (83.3%) |
| Total (Overall) | 28 (73.7%) | 10 (26.3%) |
Services Occupations
The most common Services occupations in Northway are , and Personal Care & Service (1 | 2.6%).
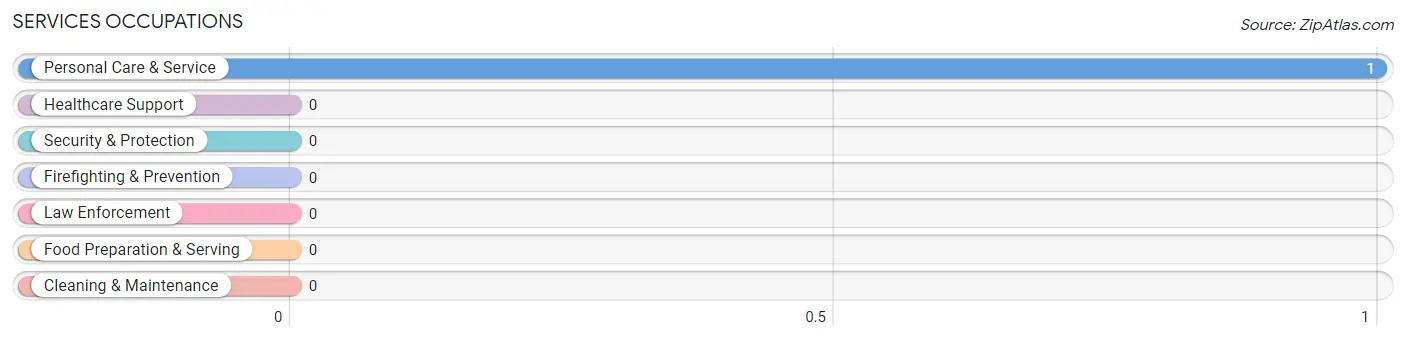
Services Occupations by Sex
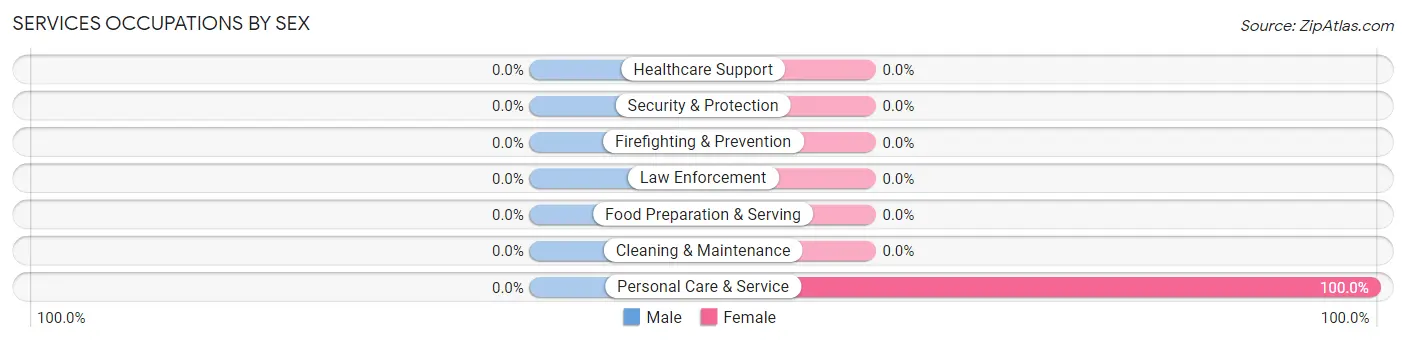
| Occupation | Male | Female |
| Healthcare Support | 0 (0.0%) | 0 (0.0%) |
| Security & Protection | 0 (0.0%) | 0 (0.0%) |
| Firefighting & Prevention | 0 (0.0%) | 0 (0.0%) |
| Law Enforcement | 0 (0.0%) | 0 (0.0%) |
| Food Preparation & Serving | 0 (0.0%) | 0 (0.0%) |
| Cleaning & Maintenance | 0 (0.0%) | 0 (0.0%) |
| Personal Care & Service | 0 (0.0%) | 1 (100.0%) |
| Total (Category) | 0 (0.0%) | 1 (100.0%) |
| Total (Overall) | 28 (73.7%) | 10 (26.3%) |
Sales and Office Occupations
The most common Sales and Office occupations in Northway are , and Sales & Related (2 | 5.3%).
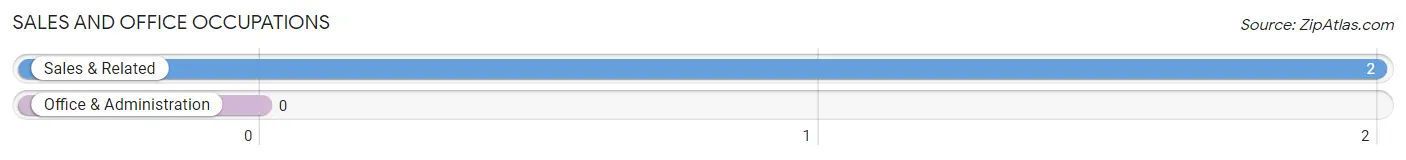
Sales and Office Occupations by Sex
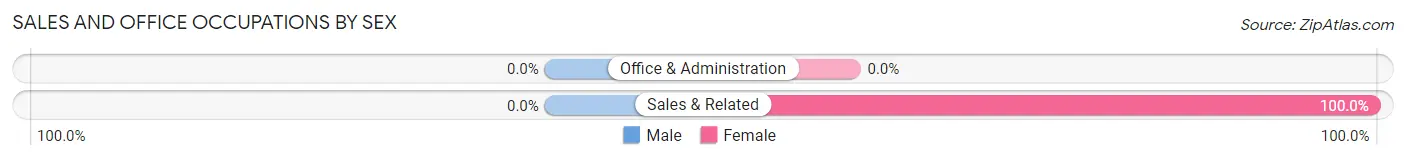
| Occupation | Male | Female |
| Sales & Related | 0 (0.0%) | 2 (100.0%) |
| Office & Administration | 0 (0.0%) | 0 (0.0%) |
| Total (Category) | 0 (0.0%) | 2 (100.0%) |
| Total (Overall) | 28 (73.7%) | 10 (26.3%) |
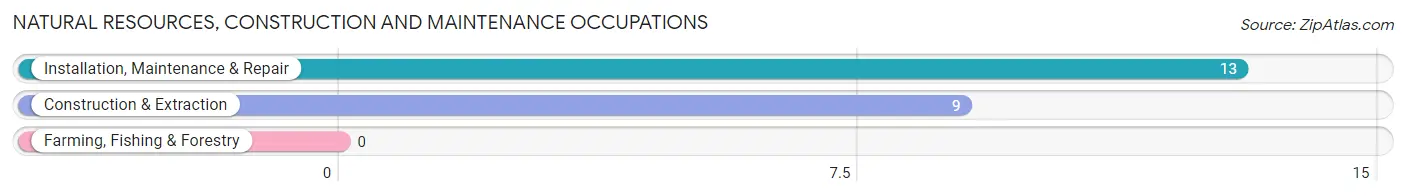
Natural Resources, Construction and Maintenance Occupations
The most common Natural Resources, Construction and Maintenance occupations in Northway are Installation, Maintenance & Repair (13 | 34.2%), and Construction & Extraction (9 | 23.7%).
Natural Resources, Construction and Maintenance Occupations by Sex
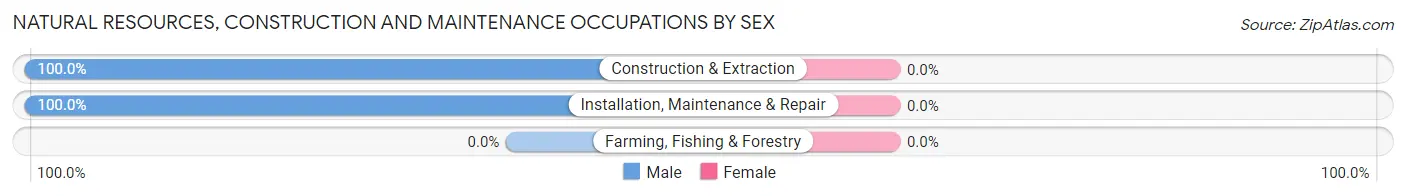
| Occupation | Male | Female |
| Farming, Fishing & Forestry | 0 (0.0%) | 0 (0.0%) |
| Construction & Extraction | 9 (100.0%) | 0 (0.0%) |
| Installation, Maintenance & Repair | 13 (100.0%) | 0 (0.0%) |
| Total (Category) | 22 (100.0%) | 0 (0.0%) |
| Total (Overall) | 28 (73.7%) | 10 (26.3%) |
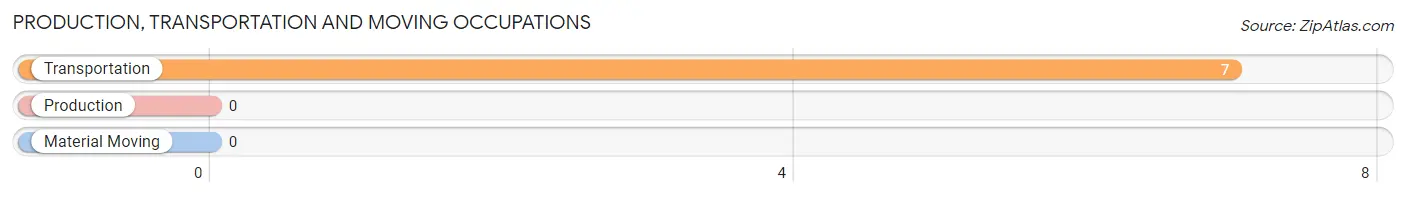
Production, Transportation and Moving Occupations
The most common Production, Transportation and Moving occupations in Northway are , and Transportation (7 | 18.4%).
Production, Transportation and Moving Occupations by Sex
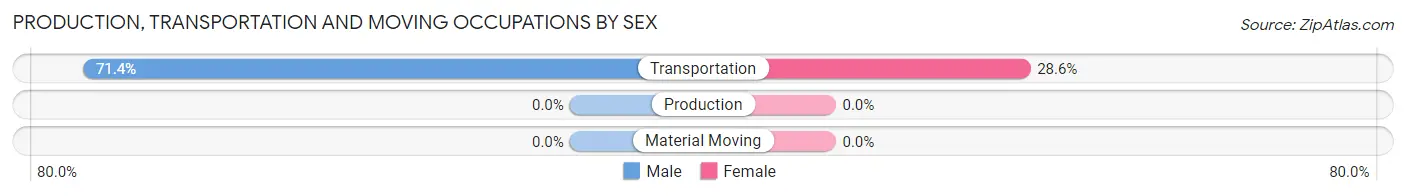
| Occupation | Male | Female |
| Production | 0 (0.0%) | 0 (0.0%) |
| Transportation | 5 (71.4%) | 2 (28.6%) |
| Material Moving | 0 (0.0%) | 0 (0.0%) |
| Total (Category) | 5 (71.4%) | 2 (28.6%) |
| Total (Overall) | 28 (73.7%) | 10 (26.3%) |
Employment Industries by Sex in Northway
Employment Industries in Northway
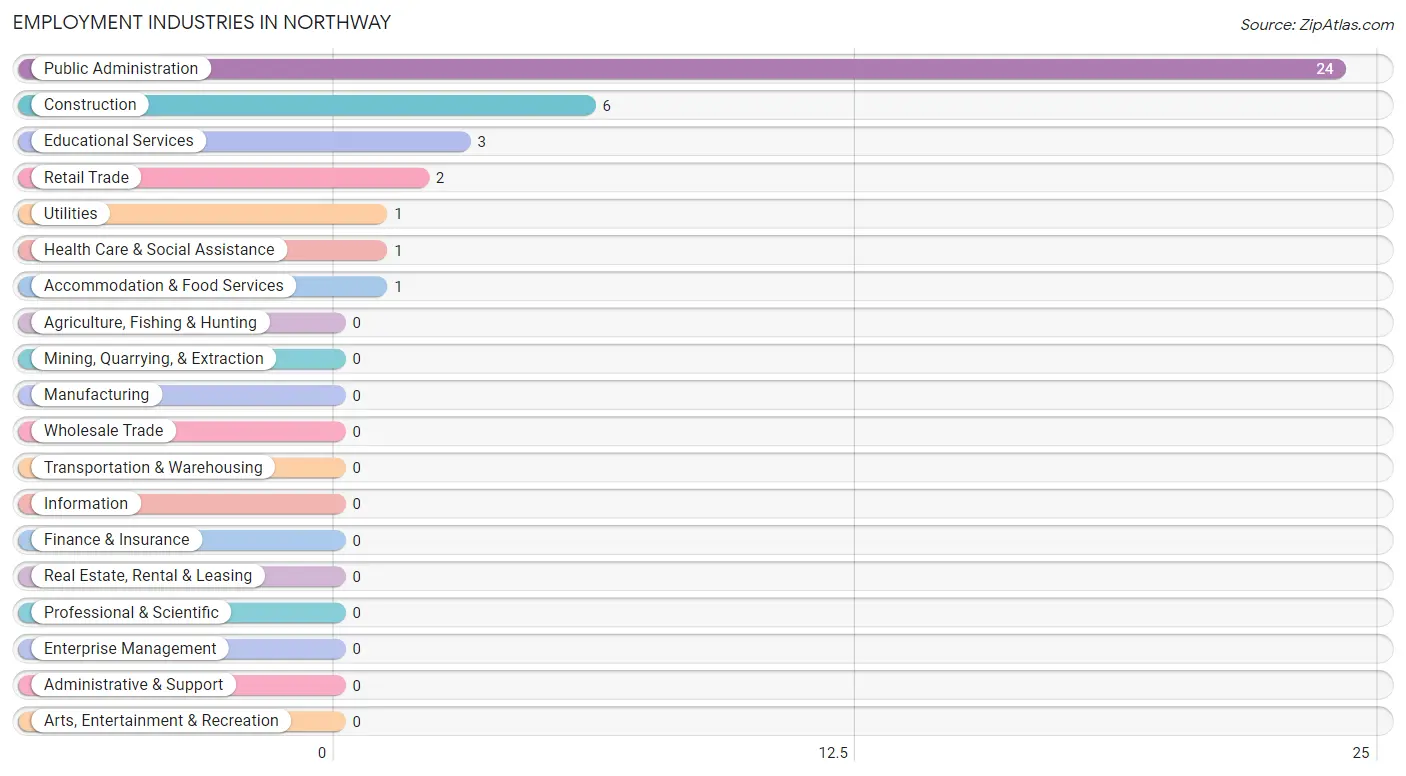
The major employment industries in Northway include Public Administration (24 | 63.2%), Construction (6 | 15.8%), Educational Services (3 | 7.9%), Retail Trade (2 | 5.3%), and Utilities (1 | 2.6%).
Employment Industries by Sex in Northway
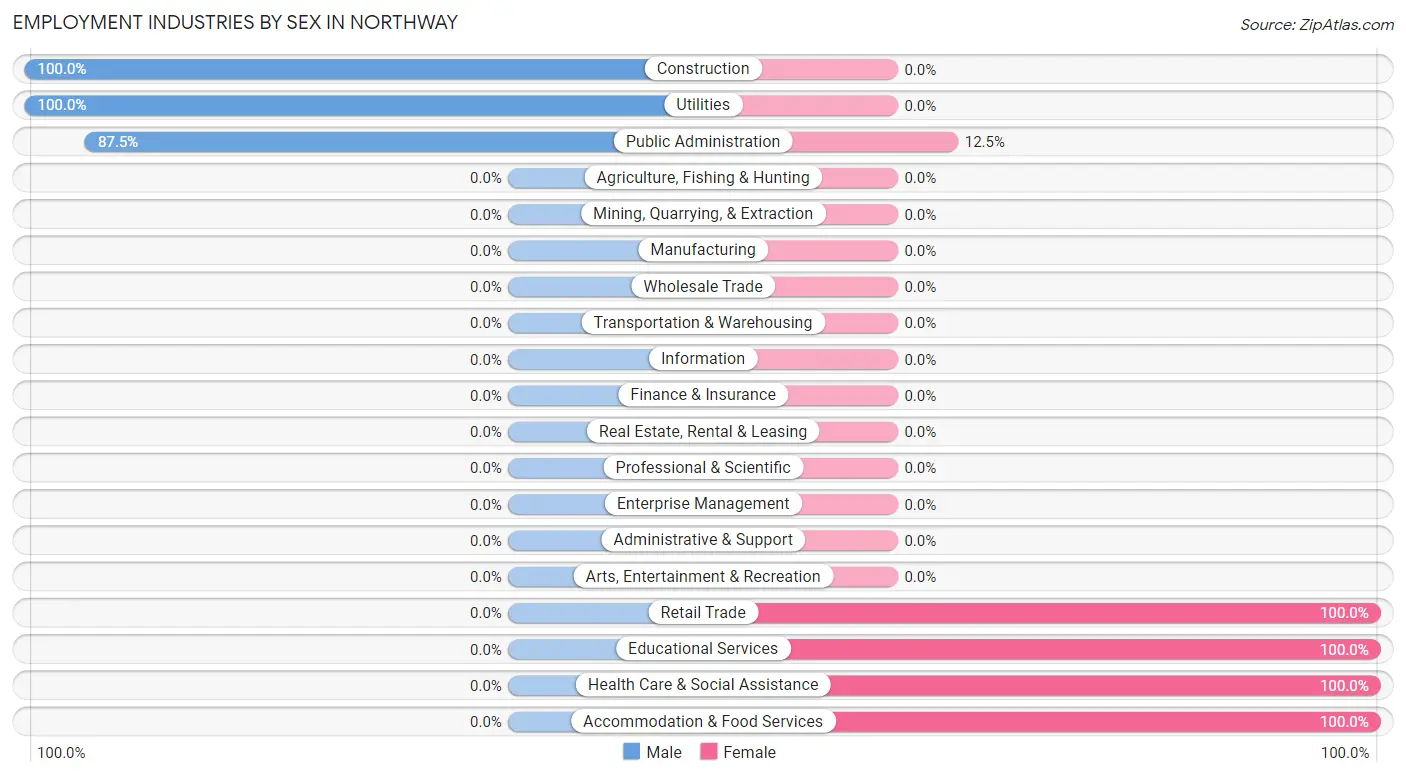
The Northway industries that see more men than women are Construction (100.0%), Utilities (100.0%), and Public Administration (87.5%), whereas the industries that tend to have a higher number of women are Retail Trade (100.0%), Educational Services (100.0%), and Health Care & Social Assistance (100.0%).
| Industry | Male | Female |
| Agriculture, Fishing & Hunting | 0 (0.0%) | 0 (0.0%) |
| Mining, Quarrying, & Extraction | 0 (0.0%) | 0 (0.0%) |
| Construction | 6 (100.0%) | 0 (0.0%) |
| Manufacturing | 0 (0.0%) | 0 (0.0%) |
| Wholesale Trade | 0 (0.0%) | 0 (0.0%) |
| Retail Trade | 0 (0.0%) | 2 (100.0%) |
| Transportation & Warehousing | 0 (0.0%) | 0 (0.0%) |
| Utilities | 1 (100.0%) | 0 (0.0%) |
| Information | 0 (0.0%) | 0 (0.0%) |
| Finance & Insurance | 0 (0.0%) | 0 (0.0%) |
| Real Estate, Rental & Leasing | 0 (0.0%) | 0 (0.0%) |
| Professional & Scientific | 0 (0.0%) | 0 (0.0%) |
| Enterprise Management | 0 (0.0%) | 0 (0.0%) |
| Administrative & Support | 0 (0.0%) | 0 (0.0%) |
| Educational Services | 0 (0.0%) | 3 (100.0%) |
| Health Care & Social Assistance | 0 (0.0%) | 1 (100.0%) |
| Arts, Entertainment & Recreation | 0 (0.0%) | 0 (0.0%) |
| Accommodation & Food Services | 0 (0.0%) | 1 (100.0%) |
| Public Administration | 21 (87.5%) | 3 (12.5%) |
| Total | 28 (73.7%) | 10 (26.3%) |
Education in Northway
School Enrollment in Northway
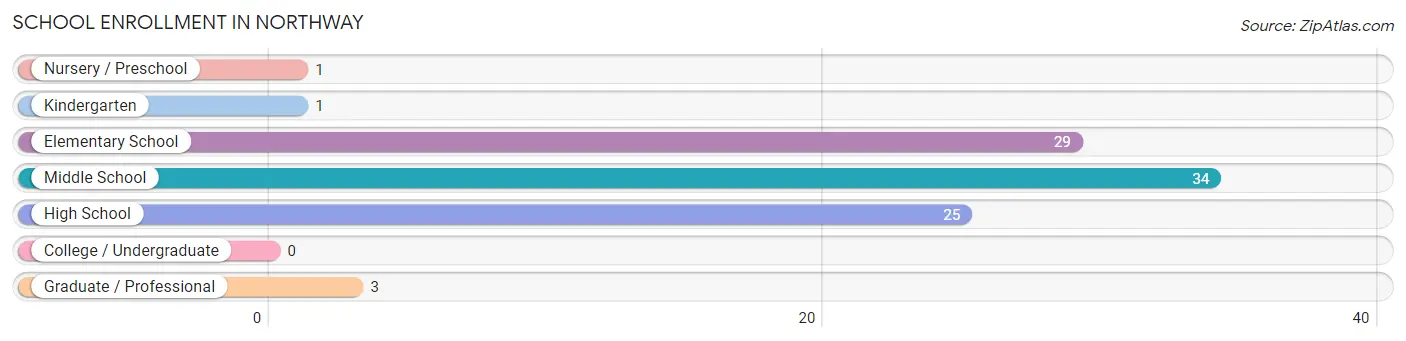
The most common levels of schooling among the 93 students in Northway are middle school (34 | 36.6%), elementary school (29 | 31.2%), and high school (25 | 26.9%).
| School Level | # Students | % Students |
| Nursery / Preschool | 1 | 1.1% |
| Kindergarten | 1 | 1.1% |
| Elementary School | 29 | 31.2% |
| Middle School | 34 | 36.6% |
| High School | 25 | 26.9% |
| College / Undergraduate | 0 | 0.0% |
| Graduate / Professional | 3 | 3.2% |
| Total | 93 | 100.0% |
School Enrollment by Age by Funding Source in Northway
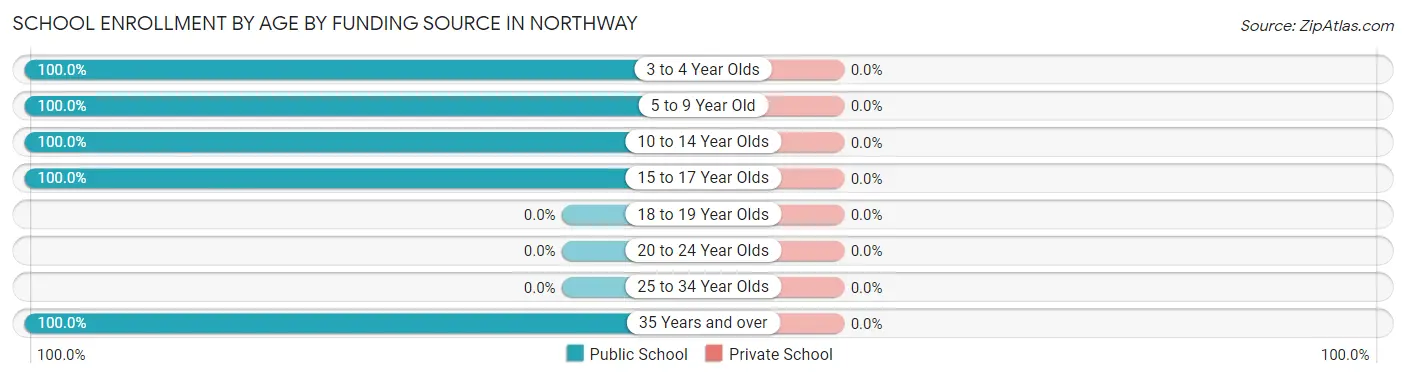
| Age Bracket | Public School | Private School |
| 3 to 4 Year Olds | 1 (100.0%) | 0 (0.0%) |
| 5 to 9 Year Old | 30 (100.0%) | 0 (0.0%) |
| 10 to 14 Year Olds | 43 (100.0%) | 0 (0.0%) |
| 15 to 17 Year Olds | 16 (100.0%) | 0 (0.0%) |
| 18 to 19 Year Olds | 0 (0.0%) | 0 (0.0%) |
| 20 to 24 Year Olds | 0 (0.0%) | 0 (0.0%) |
| 25 to 34 Year Olds | 0 (0.0%) | 0 (0.0%) |
| 35 Years and over | 3 (100.0%) | 0 (0.0%) |
| Total | 93 (100.0%) | 0 (0.0%) |
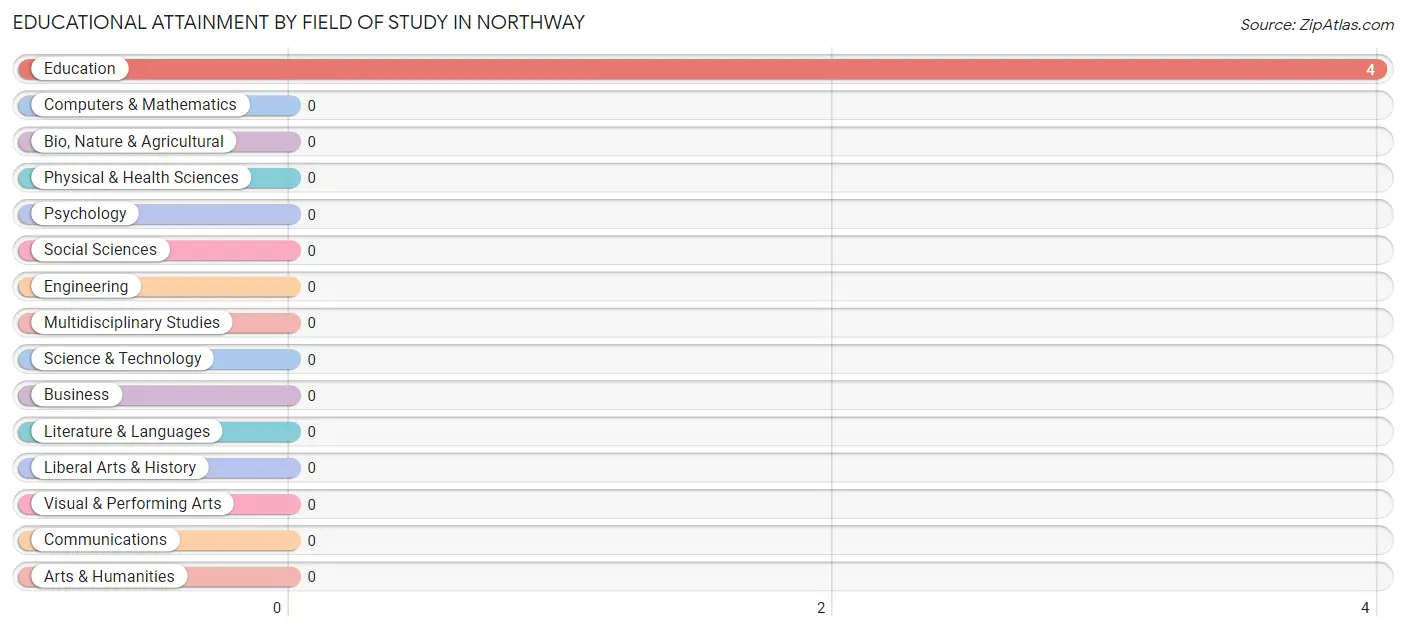
Educational Attainment by Field of Study in Northway
, and education (4 | 100.0%) are the most common fields of study among 4 individuals in Northway who have obtained a bachelor's degree or higher.
| Field of Study | # Graduates | % Graduates |
| Computers & Mathematics | 0 | 0.0% |
| Bio, Nature & Agricultural | 0 | 0.0% |
| Physical & Health Sciences | 0 | 0.0% |
| Psychology | 0 | 0.0% |
| Social Sciences | 0 | 0.0% |
| Engineering | 0 | 0.0% |
| Multidisciplinary Studies | 0 | 0.0% |
| Science & Technology | 0 | 0.0% |
| Business | 0 | 0.0% |
| Education | 4 | 100.0% |
| Literature & Languages | 0 | 0.0% |
| Liberal Arts & History | 0 | 0.0% |
| Visual & Performing Arts | 0 | 0.0% |
| Communications | 0 | 0.0% |
| Arts & Humanities | 0 | 0.0% |
| Total | 4 | 100.0% |
Transportation & Commute in Northway
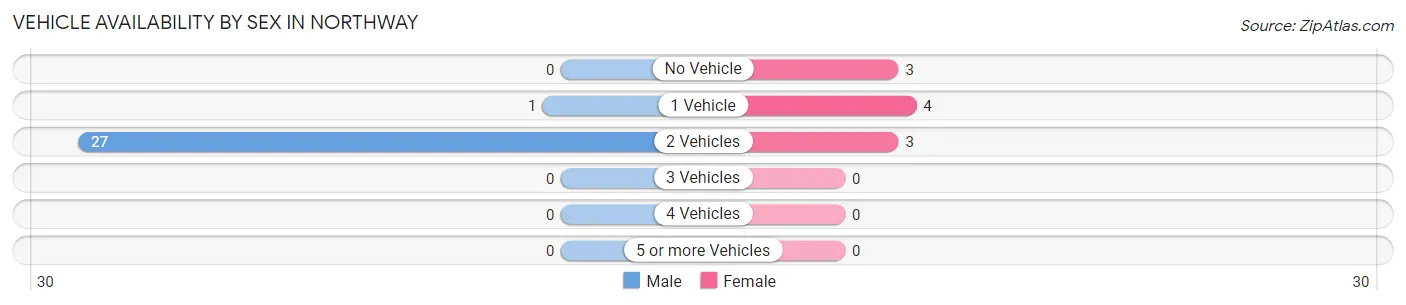
Vehicle Availability by Sex in Northway
The most prevalent vehicle ownership categories in Northway are males with 2 vehicles (27, accounting for 96.4%) and females with 2 vehicles (3, making up 270.0%).
| Vehicles Available | Male | Female |
| No Vehicle | 0 (0.0%) | 3 (30.0%) |
| 1 Vehicle | 1 (3.6%) | 4 (40.0%) |
| 2 Vehicles | 27 (96.4%) | 3 (30.0%) |
| 3 Vehicles | 0 (0.0%) | 0 (0.0%) |
| 4 Vehicles | 0 (0.0%) | 0 (0.0%) |
| 5 or more Vehicles | 0 (0.0%) | 0 (0.0%) |
| Total | 28 (100.0%) | 10 (100.0%) |
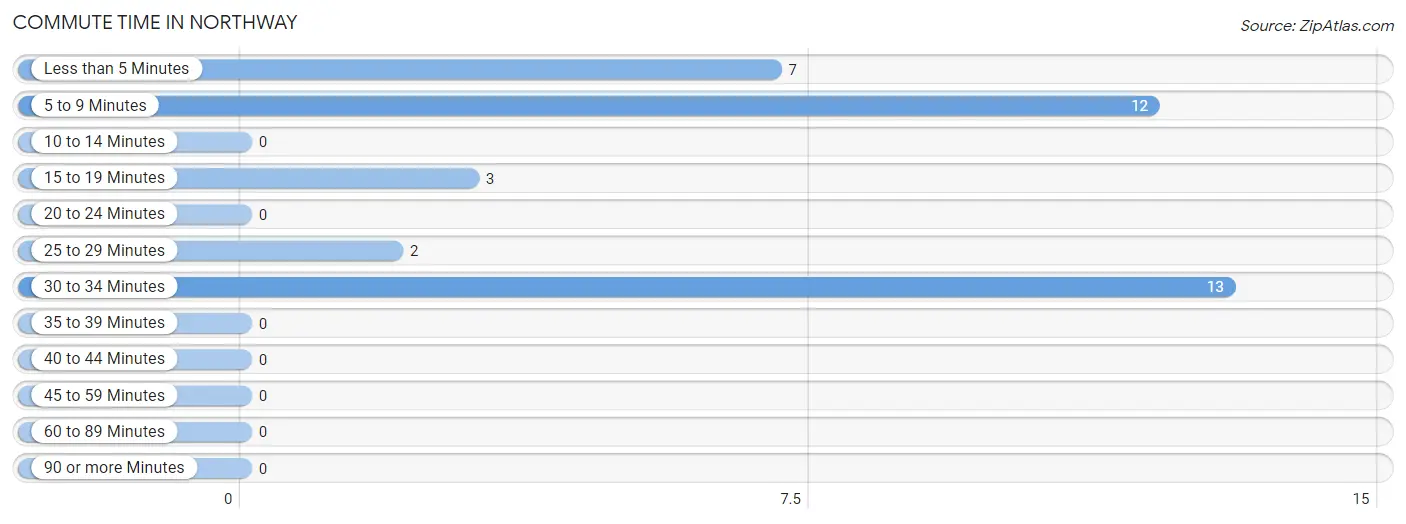
Commute Time in Northway
The most frequently occuring commute durations in Northway are 30 to 34 minutes (13 commuters, 35.1%), 5 to 9 minutes (12 commuters, 32.4%), and less than 5 minutes (7 commuters, 18.9%).
| Commute Time | # Commuters | % Commuters |
| Less than 5 Minutes | 7 | 18.9% |
| 5 to 9 Minutes | 12 | 32.4% |
| 10 to 14 Minutes | 0 | 0.0% |
| 15 to 19 Minutes | 3 | 8.1% |
| 20 to 24 Minutes | 0 | 0.0% |
| 25 to 29 Minutes | 2 | 5.4% |
| 30 to 34 Minutes | 13 | 35.1% |
| 35 to 39 Minutes | 0 | 0.0% |
| 40 to 44 Minutes | 0 | 0.0% |
| 45 to 59 Minutes | 0 | 0.0% |
| 60 to 89 Minutes | 0 | 0.0% |
| 90 or more Minutes | 0 | 0.0% |
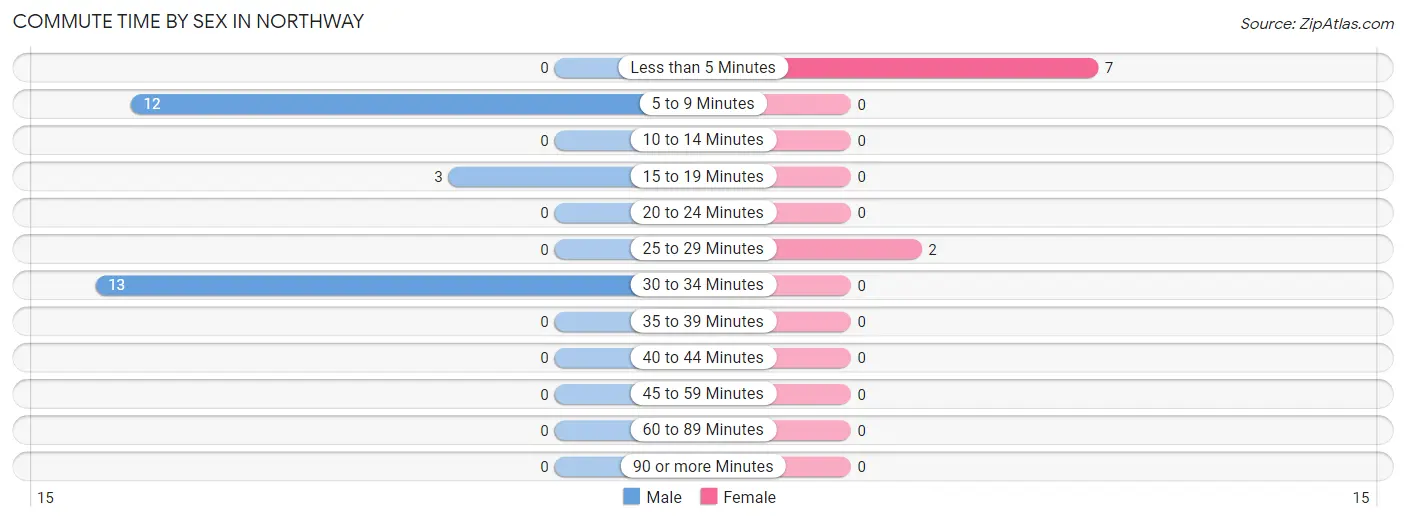
Commute Time by Sex in Northway
The most common commute times in Northway are 30 to 34 minutes (13 commuters, 46.4%) for males and less than 5 minutes (7 commuters, 77.8%) for females.
| Commute Time | Male | Female |
| Less than 5 Minutes | 0 (0.0%) | 7 (77.8%) |
| 5 to 9 Minutes | 12 (42.9%) | 0 (0.0%) |
| 10 to 14 Minutes | 0 (0.0%) | 0 (0.0%) |
| 15 to 19 Minutes | 3 (10.7%) | 0 (0.0%) |
| 20 to 24 Minutes | 0 (0.0%) | 0 (0.0%) |
| 25 to 29 Minutes | 0 (0.0%) | 2 (22.2%) |
| 30 to 34 Minutes | 13 (46.4%) | 0 (0.0%) |
| 35 to 39 Minutes | 0 (0.0%) | 0 (0.0%) |
| 40 to 44 Minutes | 0 (0.0%) | 0 (0.0%) |
| 45 to 59 Minutes | 0 (0.0%) | 0 (0.0%) |
| 60 to 89 Minutes | 0 (0.0%) | 0 (0.0%) |
| 90 or more Minutes | 0 (0.0%) | 0 (0.0%) |
Time of Departure to Work by Sex in Northway
The most frequent times of departure to work in Northway are 9:00 AM to 9:59 AM (13, 46.4%) for males and 6:30 AM to 6:59 AM (3, 33.3%) for females.
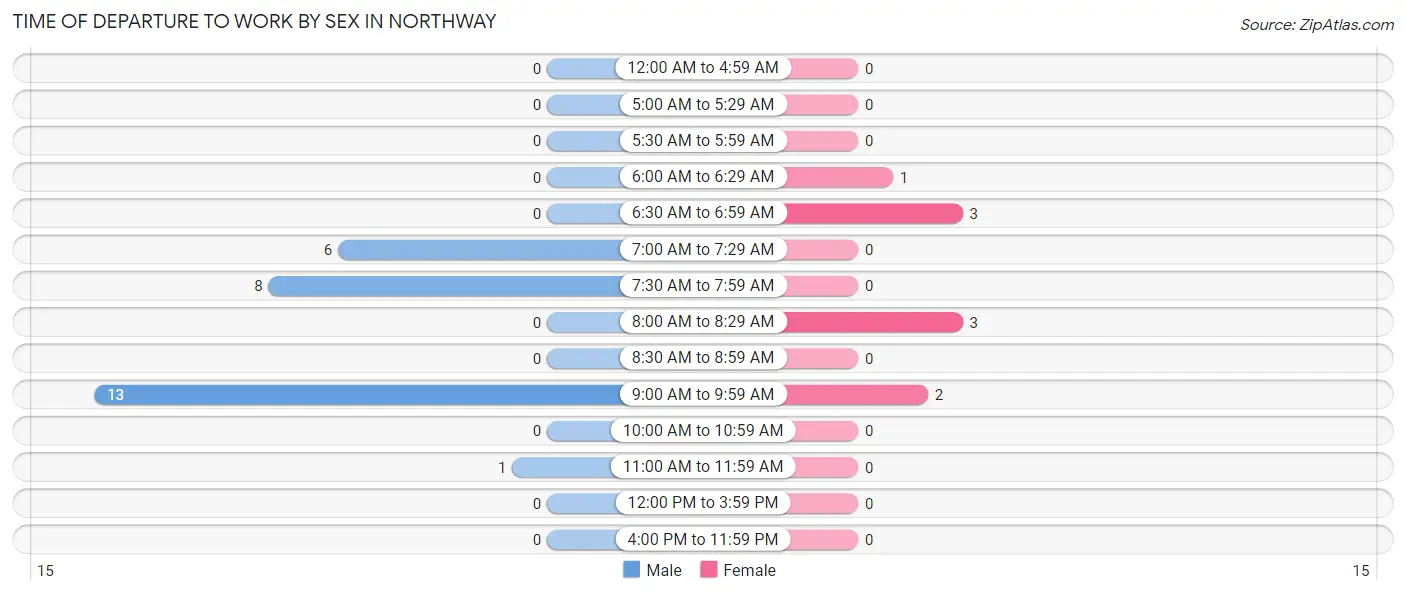
| Time of Departure | Male | Female |
| 12:00 AM to 4:59 AM | 0 (0.0%) | 0 (0.0%) |
| 5:00 AM to 5:29 AM | 0 (0.0%) | 0 (0.0%) |
| 5:30 AM to 5:59 AM | 0 (0.0%) | 0 (0.0%) |
| 6:00 AM to 6:29 AM | 0 (0.0%) | 1 (11.1%) |
| 6:30 AM to 6:59 AM | 0 (0.0%) | 3 (33.3%) |
| 7:00 AM to 7:29 AM | 6 (21.4%) | 0 (0.0%) |
| 7:30 AM to 7:59 AM | 8 (28.6%) | 0 (0.0%) |
| 8:00 AM to 8:29 AM | 0 (0.0%) | 3 (33.3%) |
| 8:30 AM to 8:59 AM | 0 (0.0%) | 0 (0.0%) |
| 9:00 AM to 9:59 AM | 13 (46.4%) | 2 (22.2%) |
| 10:00 AM to 10:59 AM | 0 (0.0%) | 0 (0.0%) |
| 11:00 AM to 11:59 AM | 1 (3.6%) | 0 (0.0%) |
| 12:00 PM to 3:59 PM | 0 (0.0%) | 0 (0.0%) |
| 4:00 PM to 11:59 PM | 0 (0.0%) | 0 (0.0%) |
| Total | 28 (100.0%) | 9 (100.0%) |
Housing Occupancy in Northway
Occupancy by Ownership in Northway
Of the total 53 dwellings in Northway, owner-occupied units account for 41 (77.4%), while renter-occupied units make up 12 (22.6%).
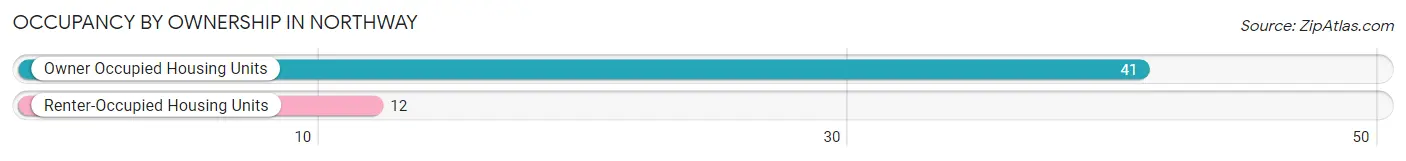
| Occupancy | # Housing Units | % Housing Units |
| Owner Occupied Housing Units | 41 | 77.4% |
| Renter-Occupied Housing Units | 12 | 22.6% |
| Total Occupied Housing Units | 53 | 100.0% |
Occupancy by Household Size in Northway
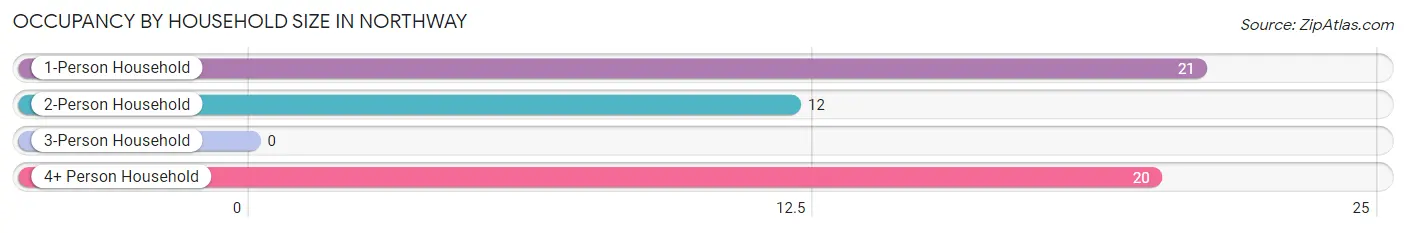
| Household Size | # Housing Units | % Housing Units |
| 1-Person Household | 21 | 39.6% |
| 2-Person Household | 12 | 22.6% |
| 3-Person Household | 0 | 0.0% |
| 4+ Person Household | 20 | 37.7% |
| Total Housing Units | 53 | 100.0% |
Occupancy by Ownership by Household Size in Northway
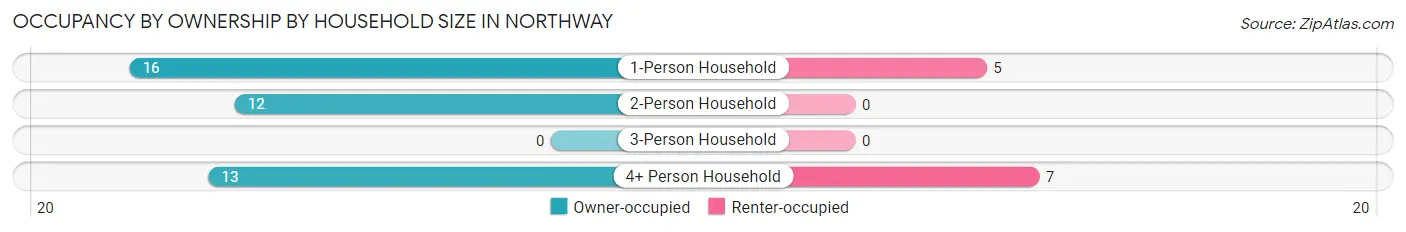
| Household Size | Owner-occupied | Renter-occupied |
| 1-Person Household | 16 (76.2%) | 5 (23.8%) |
| 2-Person Household | 12 (100.0%) | 0 (0.0%) |
| 3-Person Household | 0 (0.0%) | 0 (0.0%) |
| 4+ Person Household | 13 (65.0%) | 7 (35.0%) |
| Total Housing Units | 41 (77.4%) | 12 (22.6%) |
Occupancy by Educational Attainment in Northway
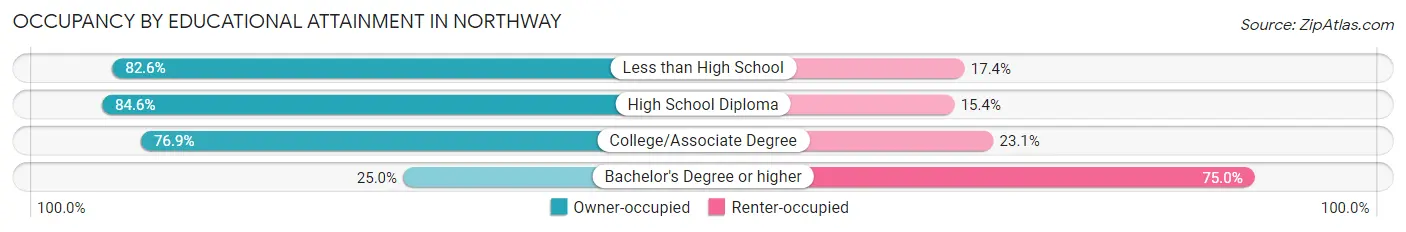
| Household Size | Owner-occupied | Renter-occupied |
| Less than High School | 19 (82.6%) | 4 (17.4%) |
| High School Diploma | 11 (84.6%) | 2 (15.4%) |
| College/Associate Degree | 10 (76.9%) | 3 (23.1%) |
| Bachelor's Degree or higher | 1 (25.0%) | 3 (75.0%) |
Occupancy by Age of Householder in Northway
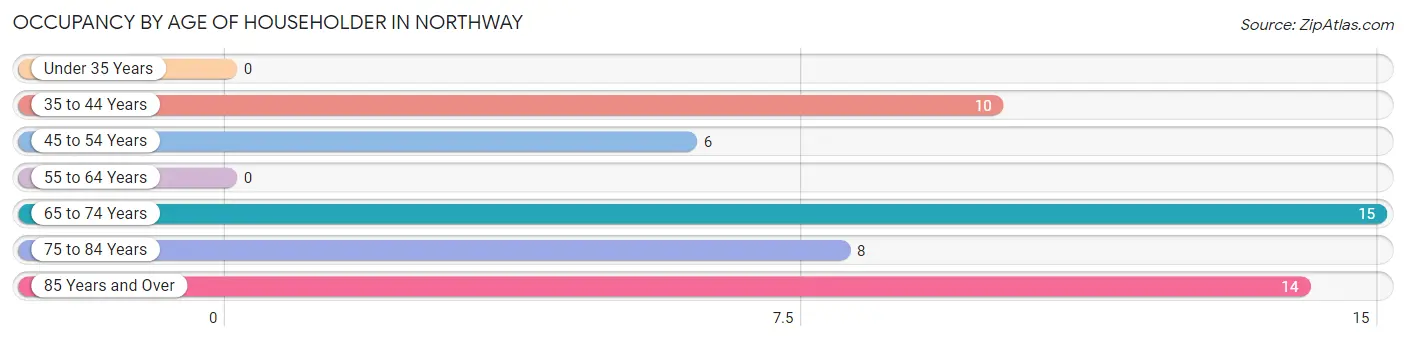
| Age Bracket | # Households | % Households |
| Under 35 Years | 0 | 0.0% |
| 35 to 44 Years | 10 | 18.9% |
| 45 to 54 Years | 6 | 11.3% |
| 55 to 64 Years | 0 | 0.0% |
| 65 to 74 Years | 15 | 28.3% |
| 75 to 84 Years | 8 | 15.1% |
| 85 Years and Over | 14 | 26.4% |
| Total | 53 | 100.0% |
Housing Finances in Northway
Median Income by Occupancy in Northway
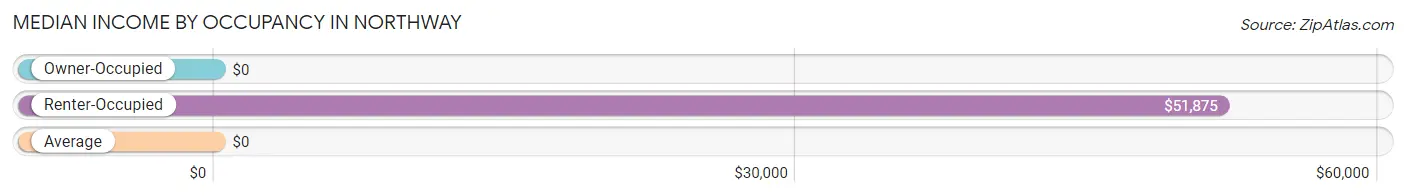
| Occupancy Type | # Households | Median Income |
| Owner-Occupied | 41 (77.4%) | $0 |
| Renter-Occupied | 12 (22.6%) | $51,875 |
| Average | 53 (100.0%) | $0 |
Occupancy by Householder Income Bracket in Northway
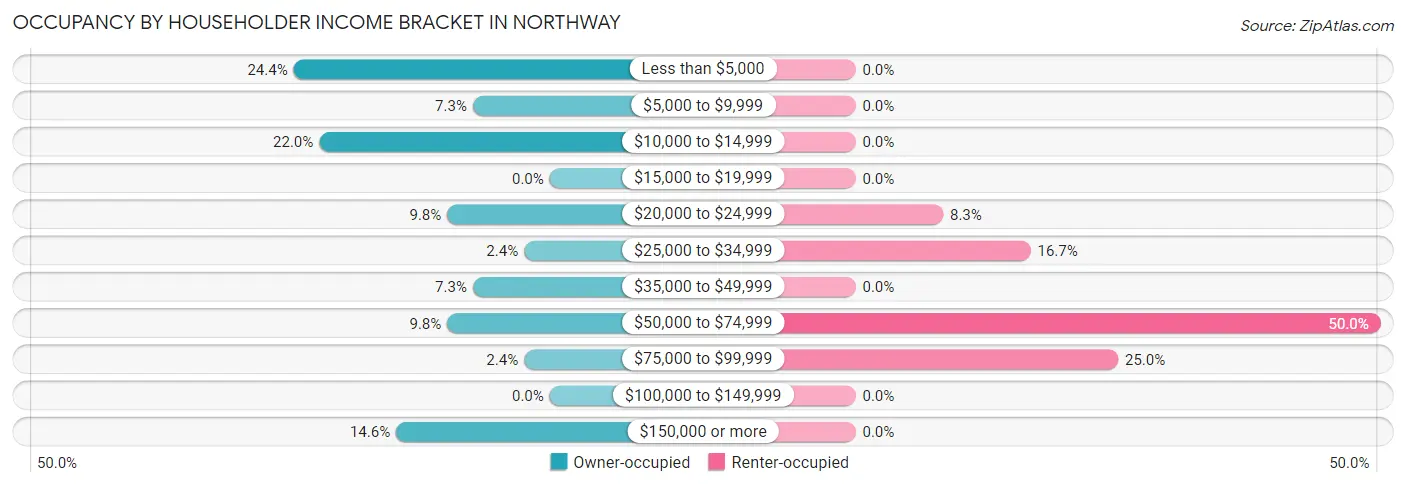
| Income Bracket | Owner-occupied | Renter-occupied |
| Less than $5,000 | 10 (24.4%) | 0 (0.0%) |
| $5,000 to $9,999 | 3 (7.3%) | 0 (0.0%) |
| $10,000 to $14,999 | 9 (22.0%) | 0 (0.0%) |
| $15,000 to $19,999 | 0 (0.0%) | 0 (0.0%) |
| $20,000 to $24,999 | 4 (9.8%) | 1 (8.3%) |
| $25,000 to $34,999 | 1 (2.4%) | 2 (16.7%) |
| $35,000 to $49,999 | 3 (7.3%) | 0 (0.0%) |
| $50,000 to $74,999 | 4 (9.8%) | 6 (50.0%) |
| $75,000 to $99,999 | 1 (2.4%) | 3 (25.0%) |
| $100,000 to $149,999 | 0 (0.0%) | 0 (0.0%) |
| $150,000 or more | 6 (14.6%) | 0 (0.0%) |
| Total | 41 (100.0%) | 12 (100.0%) |
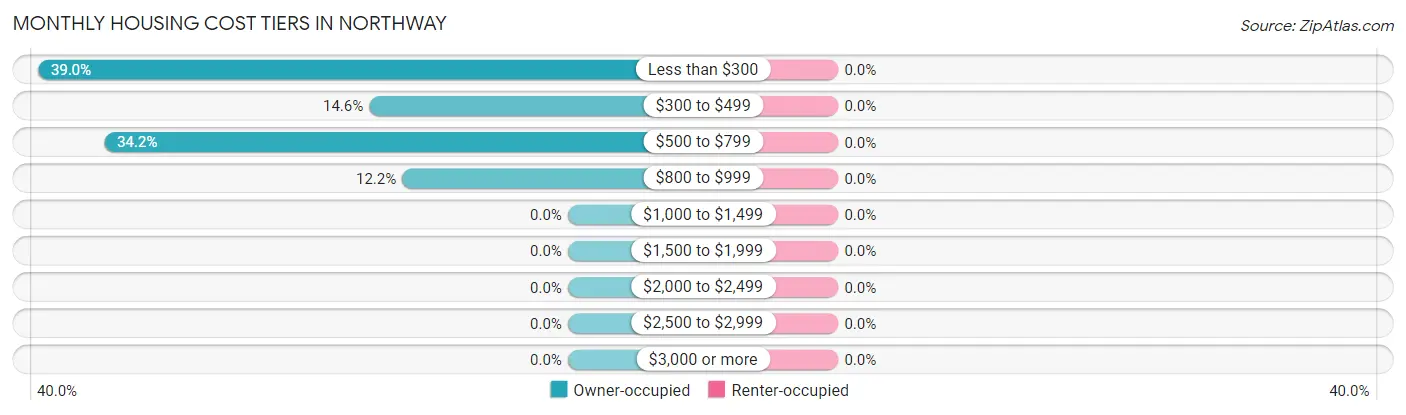
Monthly Housing Cost Tiers in Northway
| Monthly Cost | Owner-occupied | Renter-occupied |
| Less than $300 | 16 (39.0%) | 0 (0.0%) |
| $300 to $499 | 6 (14.6%) | 0 (0.0%) |
| $500 to $799 | 14 (34.2%) | 0 (0.0%) |
| $800 to $999 | 5 (12.2%) | 0 (0.0%) |
| $1,000 to $1,499 | 0 (0.0%) | 0 (0.0%) |
| $1,500 to $1,999 | 0 (0.0%) | 0 (0.0%) |
| $2,000 to $2,499 | 0 (0.0%) | 0 (0.0%) |
| $2,500 to $2,999 | 0 (0.0%) | 0 (0.0%) |
| $3,000 or more | 0 (0.0%) | 0 (0.0%) |
| Total | 41 (100.0%) | 12 (100.0%) |
Physical Housing Characteristics in Northway
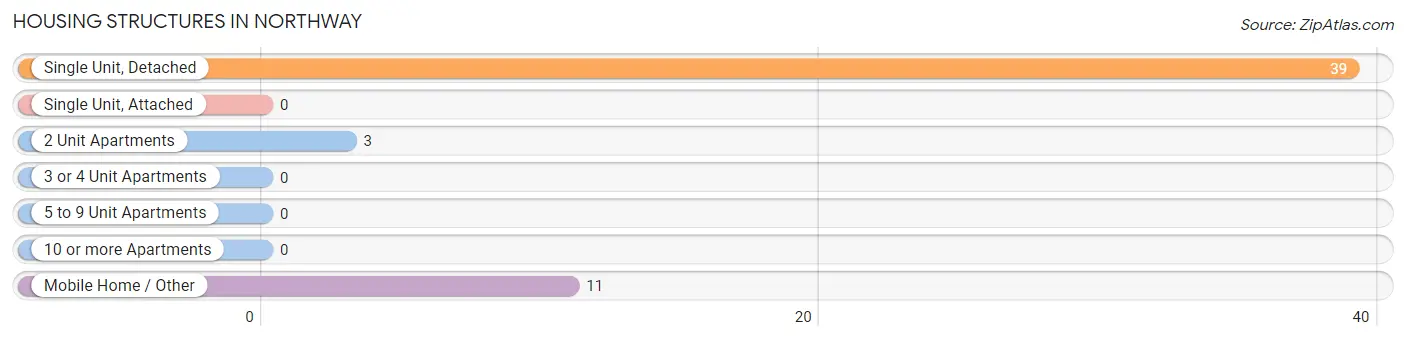
Housing Structures in Northway
| Structure Type | # Housing Units | % Housing Units |
| Single Unit, Detached | 39 | 73.6% |
| Single Unit, Attached | 0 | 0.0% |
| 2 Unit Apartments | 3 | 5.7% |
| 3 or 4 Unit Apartments | 0 | 0.0% |
| 5 to 9 Unit Apartments | 0 | 0.0% |
| 10 or more Apartments | 0 | 0.0% |
| Mobile Home / Other | 11 | 20.7% |
| Total | 53 | 100.0% |
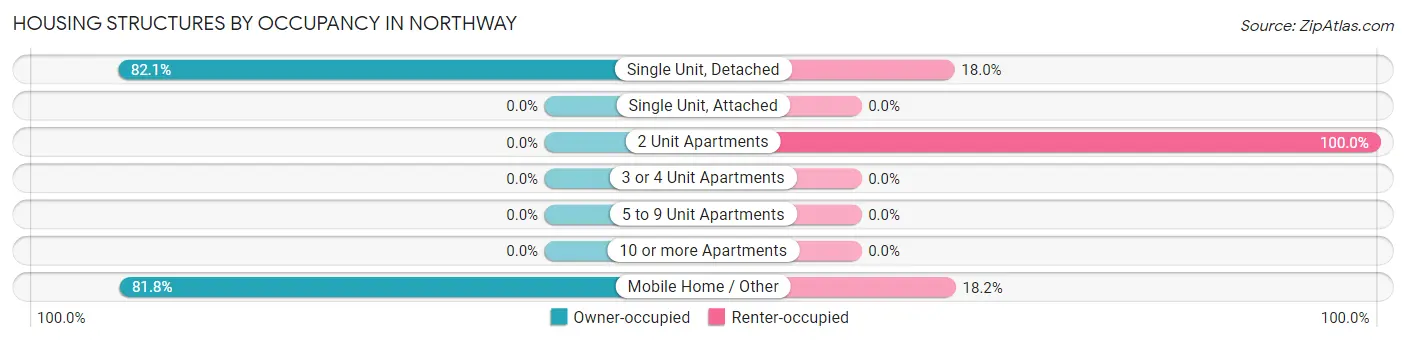
Housing Structures by Occupancy in Northway
| Structure Type | Owner-occupied | Renter-occupied |
| Single Unit, Detached | 32 (82.1%) | 7 (17.9%) |
| Single Unit, Attached | 0 (0.0%) | 0 (0.0%) |
| 2 Unit Apartments | 0 (0.0%) | 3 (100.0%) |
| 3 or 4 Unit Apartments | 0 (0.0%) | 0 (0.0%) |
| 5 to 9 Unit Apartments | 0 (0.0%) | 0 (0.0%) |
| 10 or more Apartments | 0 (0.0%) | 0 (0.0%) |
| Mobile Home / Other | 9 (81.8%) | 2 (18.2%) |
| Total | 41 (77.4%) | 12 (22.6%) |
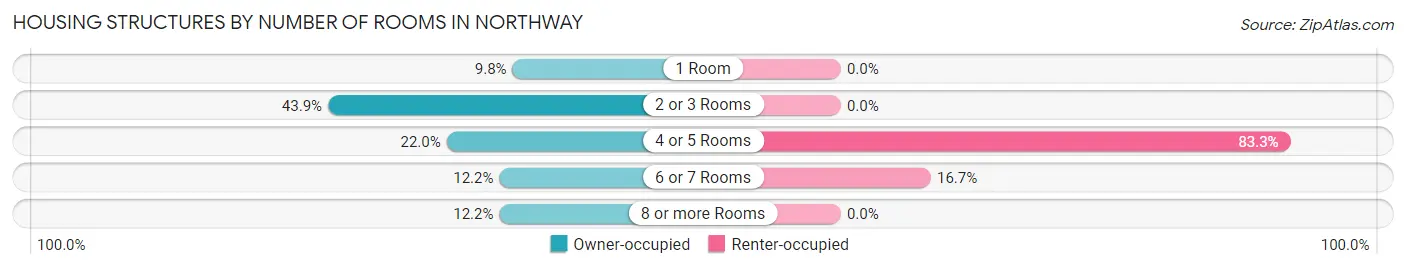
Housing Structures by Number of Rooms in Northway
| Number of Rooms | Owner-occupied | Renter-occupied |
| 1 Room | 4 (9.8%) | 0 (0.0%) |
| 2 or 3 Rooms | 18 (43.9%) | 0 (0.0%) |
| 4 or 5 Rooms | 9 (22.0%) | 10 (83.3%) |
| 6 or 7 Rooms | 5 (12.2%) | 2 (16.7%) |
| 8 or more Rooms | 5 (12.2%) | 0 (0.0%) |
| Total | 41 (100.0%) | 12 (100.0%) |
Housing Structure by Heating Type in Northway
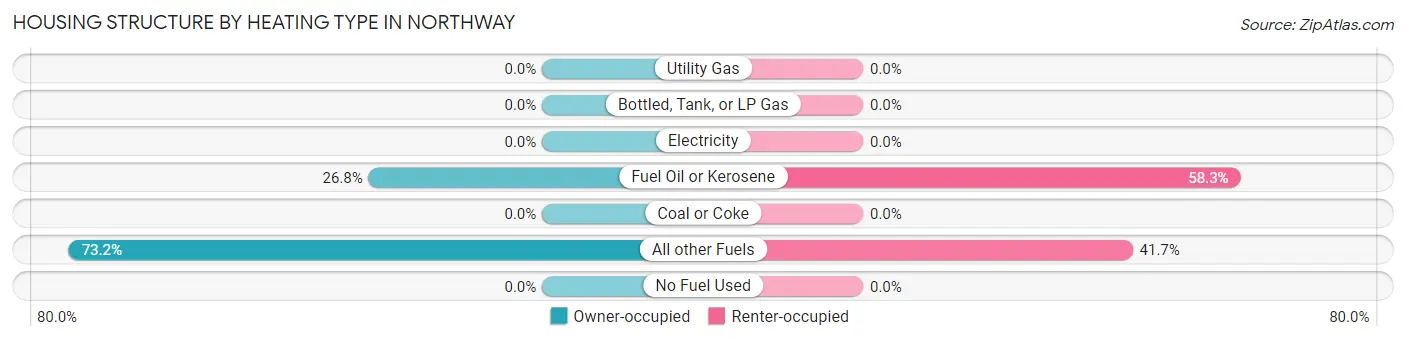
| Heating Type | Owner-occupied | Renter-occupied |
| Utility Gas | 0 (0.0%) | 0 (0.0%) |
| Bottled, Tank, or LP Gas | 0 (0.0%) | 0 (0.0%) |
| Electricity | 0 (0.0%) | 0 (0.0%) |
| Fuel Oil or Kerosene | 11 (26.8%) | 7 (58.3%) |
| Coal or Coke | 0 (0.0%) | 0 (0.0%) |
| All other Fuels | 30 (73.2%) | 5 (41.7%) |
| No Fuel Used | 0 (0.0%) | 0 (0.0%) |
| Total | 41 (100.0%) | 12 (100.0%) |
Household Vehicle Usage in Northway
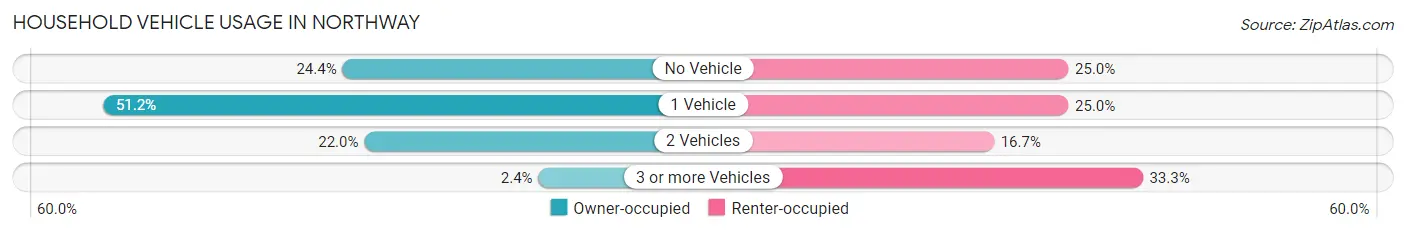
| Vehicles per Household | Owner-occupied | Renter-occupied |
| No Vehicle | 10 (24.4%) | 3 (25.0%) |
| 1 Vehicle | 21 (51.2%) | 3 (25.0%) |
| 2 Vehicles | 9 (22.0%) | 2 (16.7%) |
| 3 or more Vehicles | 1 (2.4%) | 4 (33.3%) |
| Total | 41 (100.0%) | 12 (100.0%) |
Real Estate & Mortgages in Northway
Real Estate and Mortgage Overview in Northway
| Characteristic | Without Mortgage | With Mortgage |
| Housing Units | 40 | 1 |
| Median Property Value | - | - |
| Median Household Income | - | - |
| Monthly Housing Costs | $506 | $0 |
| Real Estate Taxes | - | - |
Property Value by Mortgage Status in Northway
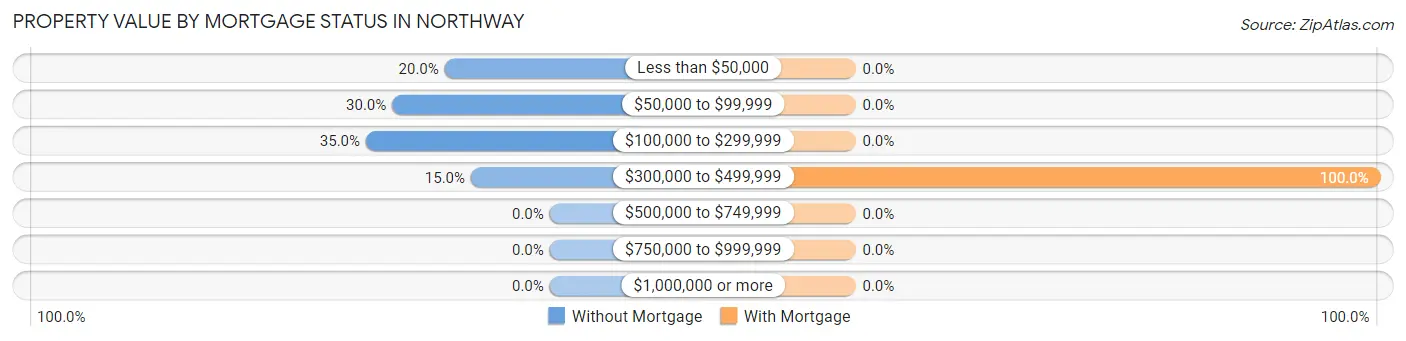
| Property Value | Without Mortgage | With Mortgage |
| Less than $50,000 | 8 (20.0%) | 0 (0.0%) |
| $50,000 to $99,999 | 12 (30.0%) | 0 (0.0%) |
| $100,000 to $299,999 | 14 (35.0%) | 0 (0.0%) |
| $300,000 to $499,999 | 6 (15.0%) | 1 (100.0%) |
| $500,000 to $749,999 | 0 (0.0%) | 0 (0.0%) |
| $750,000 to $999,999 | 0 (0.0%) | 0 (0.0%) |
| $1,000,000 or more | 0 (0.0%) | 0 (0.0%) |
| Total | 40 (100.0%) | 1 (100.0%) |
Household Income by Mortgage Status in Northway
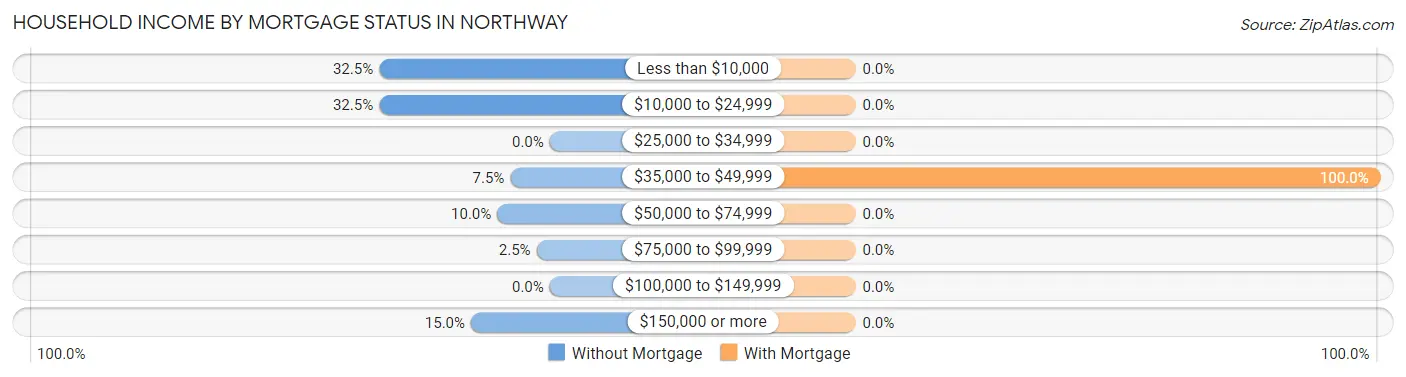
| Household Income | Without Mortgage | With Mortgage |
| Less than $10,000 | 13 (32.5%) | 0 (0.0%) |
| $10,000 to $24,999 | 13 (32.5%) | 0 (0.0%) |
| $25,000 to $34,999 | 0 (0.0%) | 0 (0.0%) |
| $35,000 to $49,999 | 3 (7.5%) | 1 (100.0%) |
| $50,000 to $74,999 | 4 (10.0%) | 0 (0.0%) |
| $75,000 to $99,999 | 1 (2.5%) | 0 (0.0%) |
| $100,000 to $149,999 | 0 (0.0%) | 0 (0.0%) |
| $150,000 or more | 6 (15.0%) | 0 (0.0%) |
| Total | 40 (100.0%) | 1 (100.0%) |
Property Value to Household Income Ratio in Northway
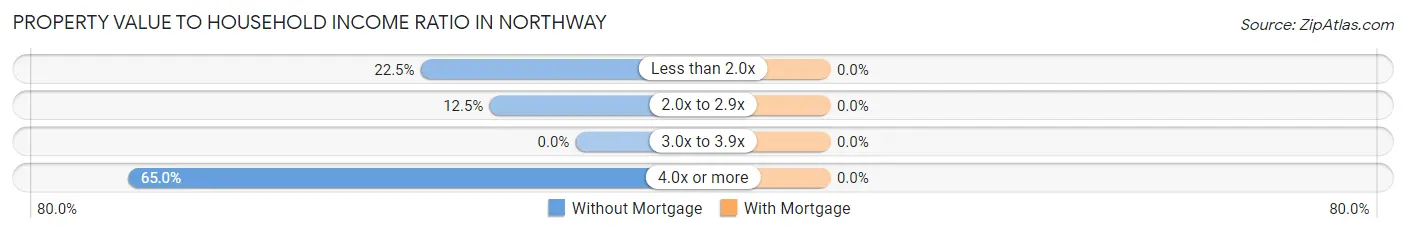
| Value-to-Income Ratio | Without Mortgage | With Mortgage |
| Less than 2.0x | 9 (22.5%) | 0 (0.0%) |
| 2.0x to 2.9x | 5 (12.5%) | 0 (0.0%) |
| 3.0x to 3.9x | 0 (0.0%) | 0 (0.0%) |
| 4.0x or more | 26 (65.0%) | 0 (0.0%) |
| Total | 40 (100.0%) | 1 (100.0%) |
Real Estate Taxes by Mortgage Status in Northway
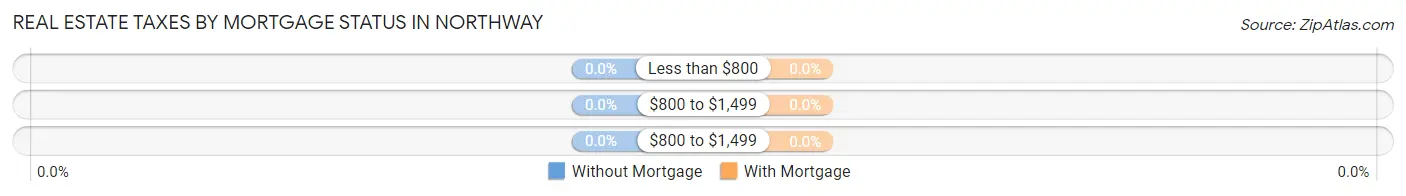
| Property Taxes | Without Mortgage | With Mortgage |
| Less than $800 | 0 (0.0%) | 0 (0.0%) |
| $800 to $1,499 | 0 (0.0%) | 0 (0.0%) |
| $800 to $1,499 | 0 (0.0%) | 0 (0.0%) |
| Total | 40 (100.0%) | 1 (100.0%) |
Health & Disability in Northway
Health Insurance Coverage by Age in Northway
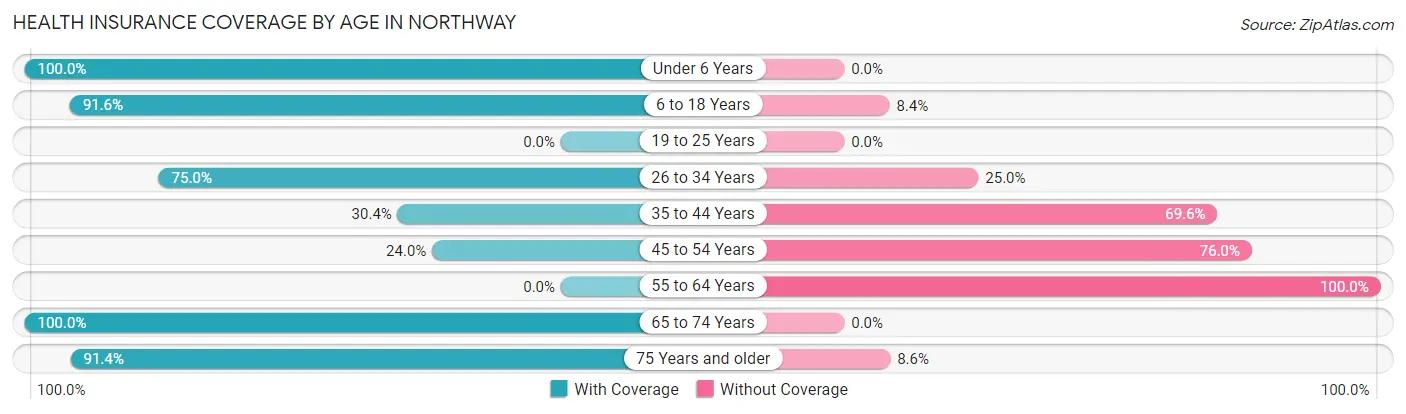
| Age Bracket | With Coverage | Without Coverage |
| Under 6 Years | 36 (100.0%) | 0 (0.0%) |
| 6 to 18 Years | 76 (91.6%) | 7 (8.4%) |
| 19 to 25 Years | 0 (0.0%) | 0 (0.0%) |
| 26 to 34 Years | 3 (75.0%) | 1 (25.0%) |
| 35 to 44 Years | 7 (30.4%) | 16 (69.6%) |
| 45 to 54 Years | 6 (24.0%) | 19 (76.0%) |
| 55 to 64 Years | 0 (0.0%) | 6 (100.0%) |
| 65 to 74 Years | 40 (100.0%) | 0 (0.0%) |
| 75 Years and older | 32 (91.4%) | 3 (8.6%) |
| Total | 200 (79.4%) | 52 (20.6%) |
Health Insurance Coverage by Citizenship Status in Northway
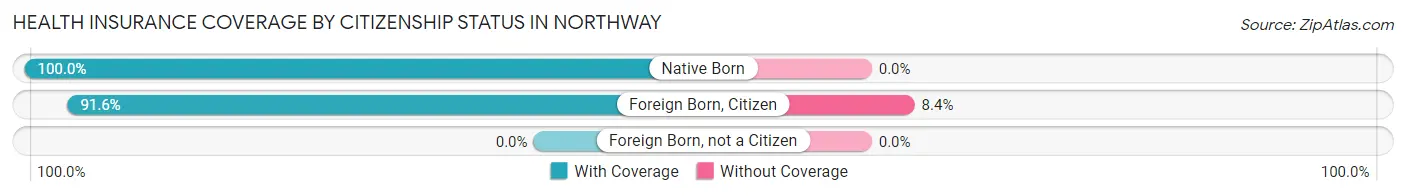
| Citizenship Status | With Coverage | Without Coverage |
| Native Born | 36 (100.0%) | 0 (0.0%) |
| Foreign Born, Citizen | 76 (91.6%) | 7 (8.4%) |
| Foreign Born, not a Citizen | 0 (0.0%) | 0 (0.0%) |
Health Insurance Coverage by Household Income in Northway
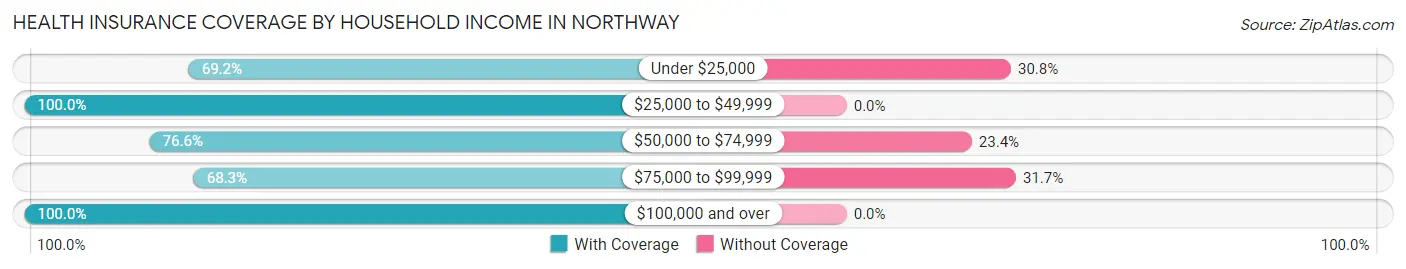
| Household Income | With Coverage | Without Coverage |
| Under $25,000 | 54 (69.2%) | 24 (30.8%) |
| $25,000 to $49,999 | 20 (100.0%) | 0 (0.0%) |
| $50,000 to $74,999 | 49 (76.6%) | 15 (23.4%) |
| $75,000 to $99,999 | 28 (68.3%) | 13 (31.7%) |
| $100,000 and over | 49 (100.0%) | 0 (0.0%) |
Public vs Private Health Insurance Coverage by Age in Northway
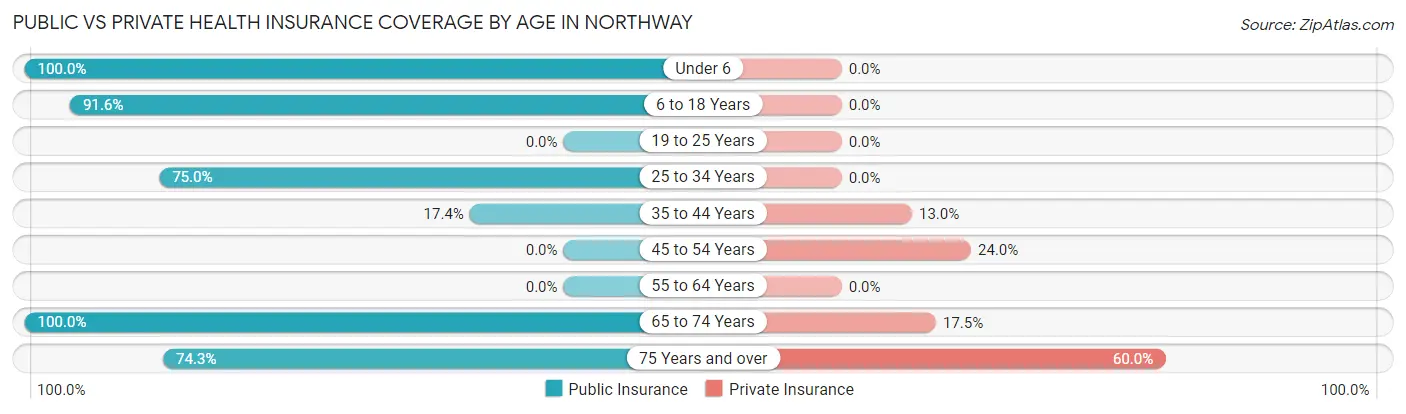
| Age Bracket | Public Insurance | Private Insurance |
| Under 6 | 36 (100.0%) | 0 (0.0%) |
| 6 to 18 Years | 76 (91.6%) | 0 (0.0%) |
| 19 to 25 Years | 0 (0.0%) | 0 (0.0%) |
| 25 to 34 Years | 3 (75.0%) | 0 (0.0%) |
| 35 to 44 Years | 4 (17.4%) | 3 (13.0%) |
| 45 to 54 Years | 0 (0.0%) | 6 (24.0%) |
| 55 to 64 Years | 0 (0.0%) | 0 (0.0%) |
| 65 to 74 Years | 40 (100.0%) | 7 (17.5%) |
| 75 Years and over | 26 (74.3%) | 21 (60.0%) |
| Total | 185 (73.4%) | 37 (14.7%) |
Disability Status by Sex by Age in Northway
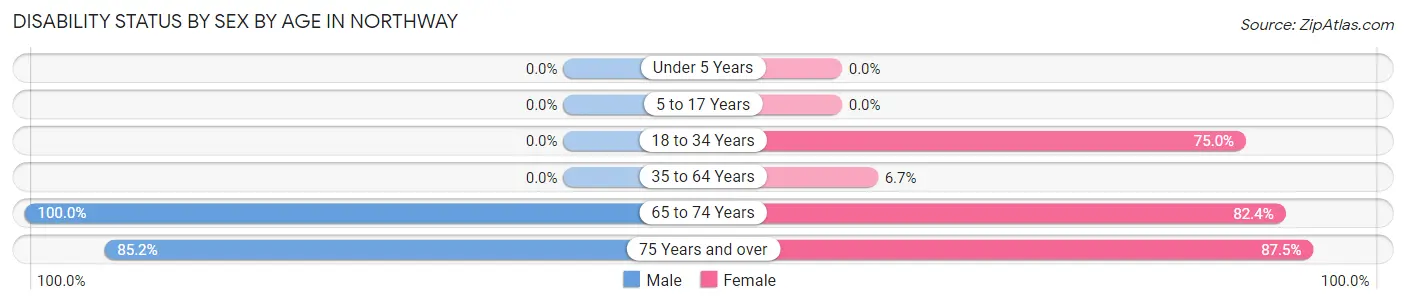
| Age Bracket | Male | Female |
| Under 5 Years | 0 (0.0%) | 0 (0.0%) |
| 5 to 17 Years | 0 (0.0%) | 0 (0.0%) |
| 18 to 34 Years | 0 (0.0%) | 3 (75.0%) |
| 35 to 64 Years | 0 (0.0%) | 1 (6.7%) |
| 65 to 74 Years | 23 (100.0%) | 14 (82.4%) |
| 75 Years and over | 23 (85.2%) | 7 (87.5%) |
Disability Class by Sex by Age in Northway
Disability Class: Hearing Difficulty
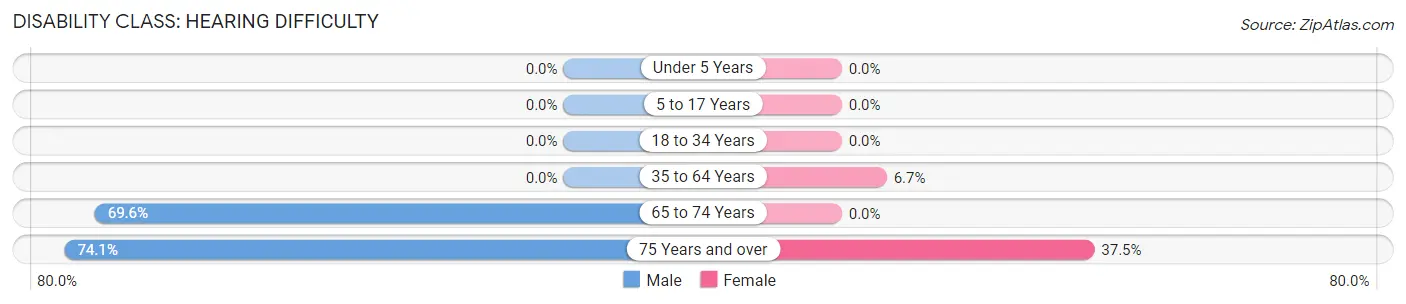
| Age Bracket | Male | Female |
| Under 5 Years | 0 (0.0%) | 0 (0.0%) |
| 5 to 17 Years | 0 (0.0%) | 0 (0.0%) |
| 18 to 34 Years | 0 (0.0%) | 0 (0.0%) |
| 35 to 64 Years | 0 (0.0%) | 1 (6.7%) |
| 65 to 74 Years | 16 (69.6%) | 0 (0.0%) |
| 75 Years and over | 20 (74.1%) | 3 (37.5%) |
Disability Class: Vision Difficulty
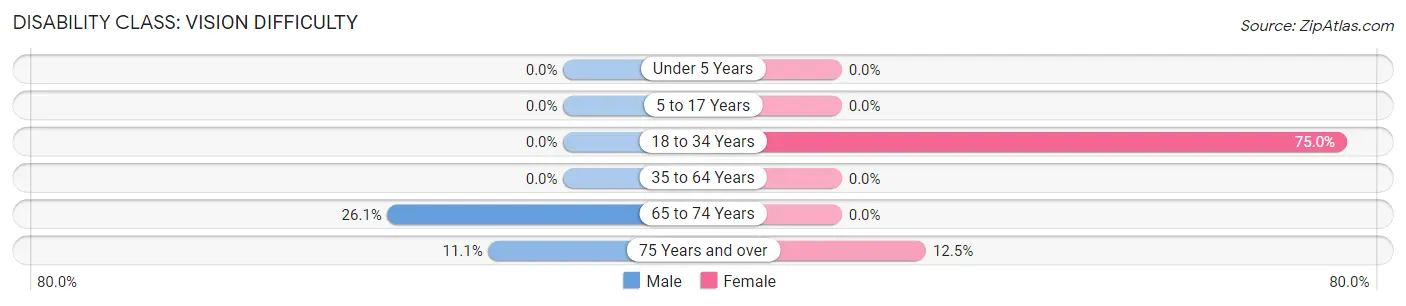
| Age Bracket | Male | Female |
| Under 5 Years | 0 (0.0%) | 0 (0.0%) |
| 5 to 17 Years | 0 (0.0%) | 0 (0.0%) |
| 18 to 34 Years | 0 (0.0%) | 3 (75.0%) |
| 35 to 64 Years | 0 (0.0%) | 0 (0.0%) |
| 65 to 74 Years | 6 (26.1%) | 0 (0.0%) |
| 75 Years and over | 3 (11.1%) | 1 (12.5%) |
Disability Class: Cognitive Difficulty
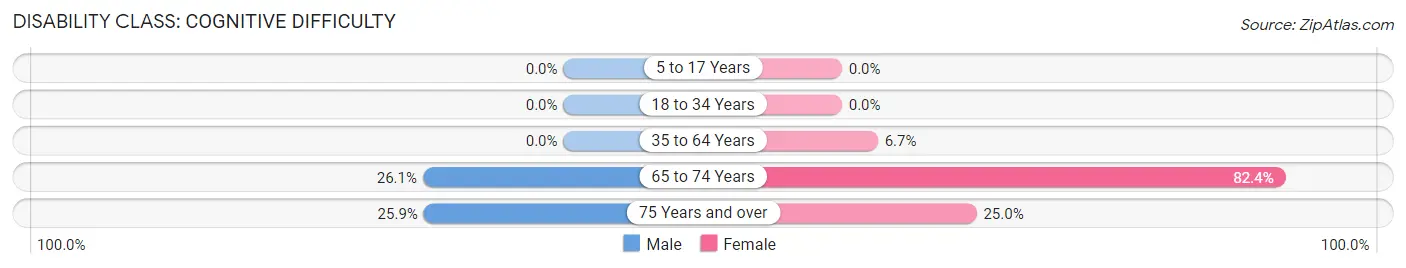
| Age Bracket | Male | Female |
| 5 to 17 Years | 0 (0.0%) | 0 (0.0%) |
| 18 to 34 Years | 0 (0.0%) | 0 (0.0%) |
| 35 to 64 Years | 0 (0.0%) | 1 (6.7%) |
| 65 to 74 Years | 6 (26.1%) | 14 (82.4%) |
| 75 Years and over | 7 (25.9%) | 2 (25.0%) |
Disability Class: Ambulatory Difficulty
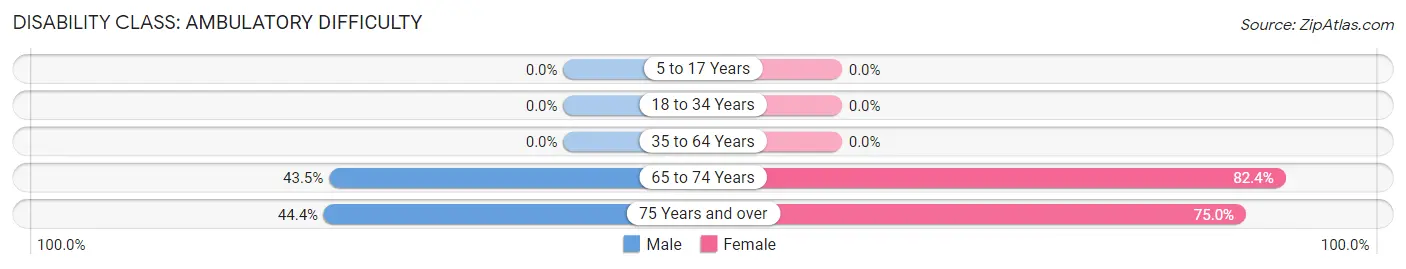
| Age Bracket | Male | Female |
| 5 to 17 Years | 0 (0.0%) | 0 (0.0%) |
| 18 to 34 Years | 0 (0.0%) | 0 (0.0%) |
| 35 to 64 Years | 0 (0.0%) | 0 (0.0%) |
| 65 to 74 Years | 10 (43.5%) | 14 (82.4%) |
| 75 Years and over | 12 (44.4%) | 6 (75.0%) |
Disability Class: Self-Care Difficulty
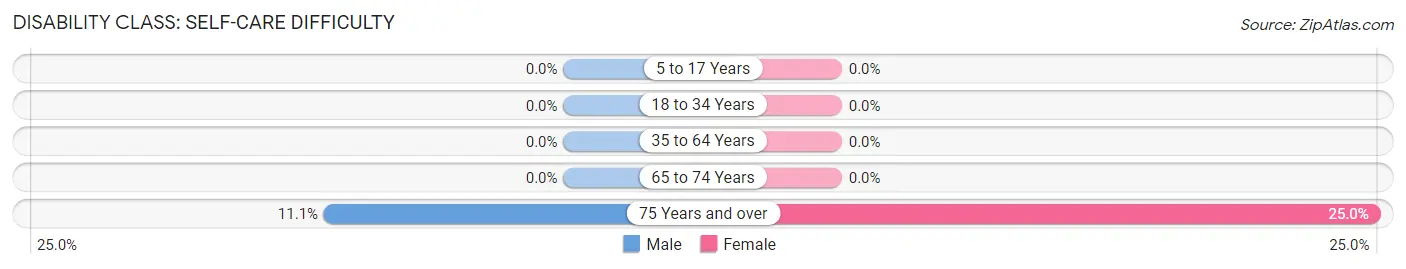
| Age Bracket | Male | Female |
| 5 to 17 Years | 0 (0.0%) | 0 (0.0%) |
| 18 to 34 Years | 0 (0.0%) | 0 (0.0%) |
| 35 to 64 Years | 0 (0.0%) | 0 (0.0%) |
| 65 to 74 Years | 0 (0.0%) | 0 (0.0%) |
| 75 Years and over | 3 (11.1%) | 2 (25.0%) |
Technology Access in Northway
Computing Device Access in Northway
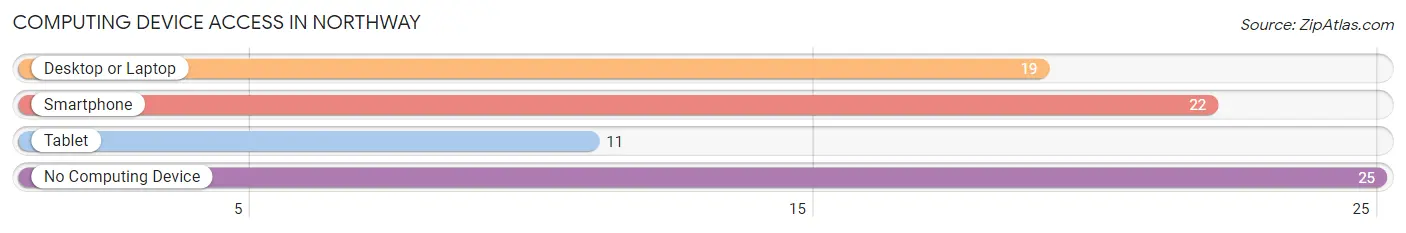
| Device Type | # Households | % Households |
| Desktop or Laptop | 19 | 35.8% |
| Smartphone | 22 | 41.5% |
| Tablet | 11 | 20.7% |
| No Computing Device | 25 | 47.2% |
| Total | 53 | 100.0% |
Internet Access in Northway
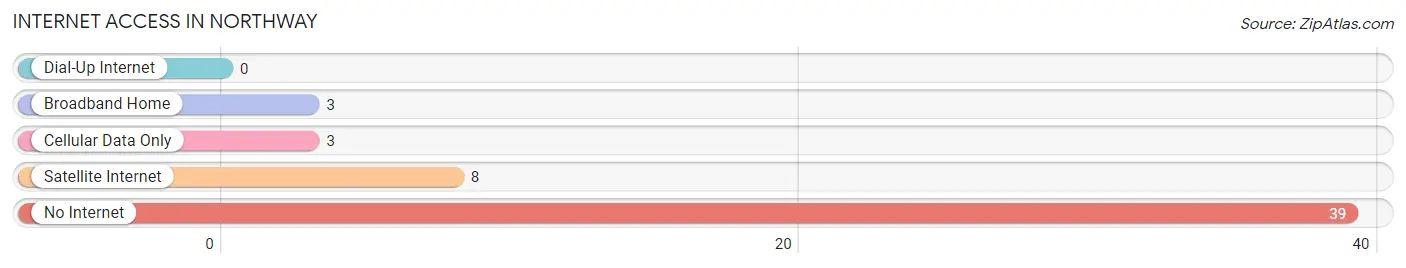
| Internet Type | # Households | % Households |
| Dial-Up Internet | 0 | 0.0% |
| Broadband Home | 3 | 5.7% |
| Cellular Data Only | 3 | 5.7% |
| Satellite Internet | 8 | 15.1% |
| No Internet | 39 | 73.6% |
| Total | 53 | 100.0% |
Northway Summary
Northway, Alaska is a small unincorporated community located in the southeast corner of the state, near the Canadian border. It is the northernmost settlement in the United States and is home to a population of approximately 200 people. The town is located in the Yukon-Koyukuk Census Area and is part of the Alaska Gateway School District.
History
Northway was established in the early 1920s as a trading post for the local Native American population. The town was named after the Northway River, which runs through the area. In the 1930s, the Alaska Road Commission built a road from Northway to Fairbanks, making it easier for people to travel to and from the area.
In the 1940s, the United States Army built an airfield in Northway, which was used as a refueling stop for military aircraft during World War II. After the war, the airfield was used as a civilian airport and is still in use today.
In the 1950s, the Alaska Highway was built, connecting Northway to the rest of the state. This allowed for increased trade and commerce in the area, as well as increased tourism.
Geography
Northway is located in the southeast corner of Alaska, near the Canadian border. It is situated in the Yukon-Koyukuk Census Area and is part of the Alaska Gateway School District. The town is located on the Northway River, which flows into the Tanana River.
The area is mostly flat, with some rolling hills and mountains in the distance. The climate is cold and dry, with temperatures ranging from -20°F in the winter to 70°F in the summer.
Economy
The economy of Northway is largely based on tourism and subsistence activities. The town is a popular destination for hunters, fishermen, and other outdoor enthusiasts. There are several lodges and cabins in the area that cater to tourists.
The town also has a small airport, which is used for both commercial and private flights. There are also several small businesses in the area, including a general store, a gas station, and a post office.
Demographics
As of the 2010 census, the population of Northway was 197. The racial makeup of the town was 95.4% White, 0.5% Native American, 0.5% Asian, 0.5% from other races, and 3.1% from two or more races.
The median household income in Northway was $45,000, and the median family income was $50,000. The per capita income was $20,000. About 10.5% of the population was below the poverty line.
Conclusion
Northway, Alaska is a small unincorporated community located in the southeast corner of the state, near the Canadian border. It is the northernmost settlement in the United States and is home to a population of approximately 200 people. The town is located in the Yukon-Koyukuk Census Area and is part of the Alaska Gateway School District. The economy of Northway is largely based on tourism and subsistence activities, and the town is a popular destination for hunters, fishermen, and other outdoor enthusiasts. The racial makeup of the town is mostly White, with a small percentage of Native American, Asian, and other races. The median household income in Northway was $45,000, and the per capita income was $20,000.
Common Questions
What is Per Capita Income in Northway?
Per Capita income in Northway is $13,238.
What is the Median Family Income in Northway?
Median Family Income in Northway is $47,250.
What is Inequality or Gini Index in Northway?
Inequality or Gini Index in Northway is 0.56.
What is the Total Population of Northway?
Total Population of Northway is 252.
What is the Total Male Population of Northway?
Total Male Population of Northway is 136.
What is the Total Female Population of Northway?
Total Female Population of Northway is 116.
What is the Ratio of Males per 100 Females in Northway?
There are 117.24 Males per 100 Females in Northway.
What is the Ratio of Females per 100 Males in Northway?
There are 85.29 Females per 100 Males in Northway.
What is the Median Population Age in Northway?
Median Population Age in Northway is 37.0 Years.
What is the Average Family Size in Northway
Average Family Size in Northway is 6.8 People.
What is the Average Household Size in Northway
Average Household Size in Northway is 4.8 People.
How Large is the Labor Force in Northway?
There are 38 People in the Labor Forcein in Northway.
What is the Percentage of People in the Labor Force in Northway?
27.1% of People are in the Labor Force in Northway.