Ninilchik, AK Map & Demographics
Ninilchik Map
Ninilchik Overview
$31,434
PER CAPITA INCOME
$65,893
AVG FAMILY INCOME
$55,357
AVG HOUSEHOLD INCOME
50.4%
WAGE / INCOME GAP [ % ]
49.6¢/ $1
WAGE / INCOME GAP [ $ ]
0.51
INEQUALITY / GINI INDEX
964
TOTAL POPULATION
545
MALE POPULATION
419
FEMALE POPULATION
130.07
MALES / 100 FEMALES
76.88
FEMALES / 100 MALES
51.3
MEDIAN AGE
3.0
AVG FAMILY SIZE
2.4
AVG HOUSEHOLD SIZE
352
LABOR FORCE [ PEOPLE ]
46.9%
PERCENT IN LABOR FORCE
6.0%
UNEMPLOYMENT RATE
Ninilchik Zip Codes
Ninilchik Area Codes
Income in Ninilchik
Income Overview in Ninilchik
Per Capita Income in Ninilchik is $31,434, while median incomes of families and households are $65,893 and $55,357 respectively.
| Characteristic | Number | Measure |
| Per Capita Income | 964 | $31,434 |
| Median Family Income | 255 | $65,893 |
| Mean Family Income | 255 | $100,242 |
| Median Household Income | 408 | $55,357 |
| Mean Household Income | 408 | $75,147 |
| Income Deficit | 255 | $0 |
| Wage / Income Gap (%) | 964 | 50.41% |
| Wage / Income Gap ($) | 964 | 49.59¢ per $1 |
| Gini / Inequality Index | 964 | 0.51 |
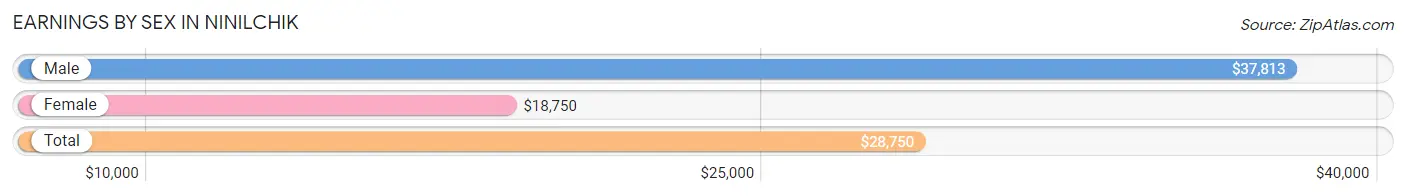
Earnings by Sex in Ninilchik
Average Earnings in Ninilchik are $28,750, $37,813 for men and $18,750 for women, a difference of 50.4%.
| Sex | Number | Average Earnings |
| Male | 267 (64.0%) | $37,813 |
| Female | 150 (36.0%) | $18,750 |
| Total | 417 (100.0%) | $28,750 |
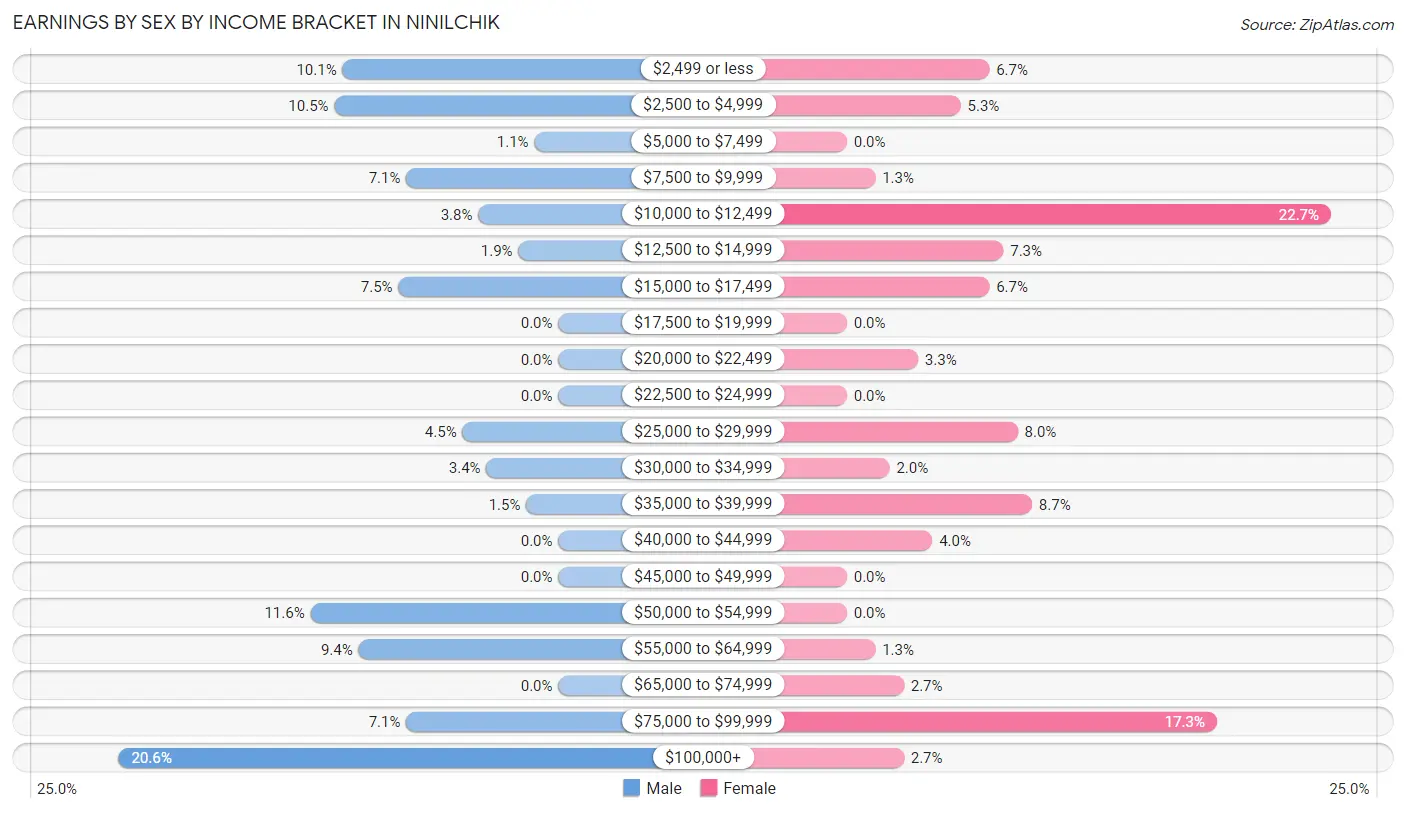
Earnings by Sex by Income Bracket in Ninilchik
The most common earnings brackets in Ninilchik are $100,000+ for men (55 | 20.6%) and $10,000 to $12,499 for women (34 | 22.7%).
| Income | Male | Female |
| $2,499 or less | 27 (10.1%) | 10 (6.7%) |
| $2,500 to $4,999 | 28 (10.5%) | 8 (5.3%) |
| $5,000 to $7,499 | 3 (1.1%) | 0 (0.0%) |
| $7,500 to $9,999 | 19 (7.1%) | 2 (1.3%) |
| $10,000 to $12,499 | 10 (3.7%) | 34 (22.7%) |
| $12,500 to $14,999 | 5 (1.9%) | 11 (7.3%) |
| $15,000 to $17,499 | 20 (7.5%) | 10 (6.7%) |
| $17,500 to $19,999 | 0 (0.0%) | 0 (0.0%) |
| $20,000 to $22,499 | 0 (0.0%) | 5 (3.3%) |
| $22,500 to $24,999 | 0 (0.0%) | 0 (0.0%) |
| $25,000 to $29,999 | 12 (4.5%) | 12 (8.0%) |
| $30,000 to $34,999 | 9 (3.4%) | 3 (2.0%) |
| $35,000 to $39,999 | 4 (1.5%) | 13 (8.7%) |
| $40,000 to $44,999 | 0 (0.0%) | 6 (4.0%) |
| $45,000 to $49,999 | 0 (0.0%) | 0 (0.0%) |
| $50,000 to $54,999 | 31 (11.6%) | 0 (0.0%) |
| $55,000 to $64,999 | 25 (9.4%) | 2 (1.3%) |
| $65,000 to $74,999 | 0 (0.0%) | 4 (2.7%) |
| $75,000 to $99,999 | 19 (7.1%) | 26 (17.3%) |
| $100,000+ | 55 (20.6%) | 4 (2.7%) |
| Total | 267 (100.0%) | 150 (100.0%) |
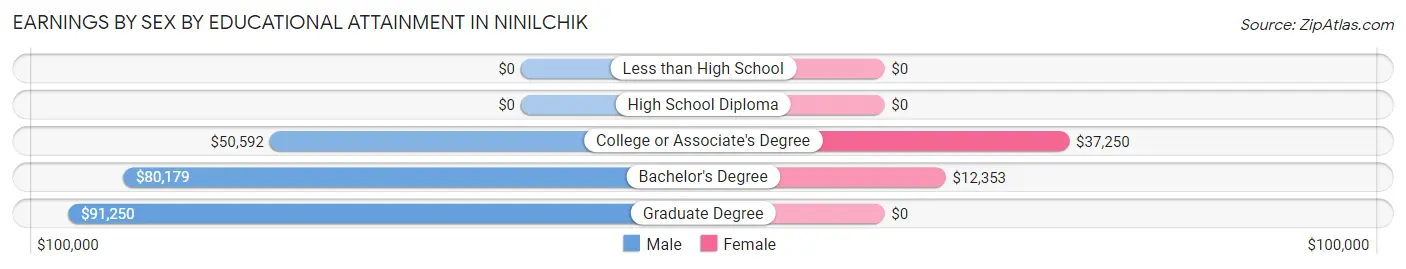
Earnings by Sex by Educational Attainment in Ninilchik
Average earnings in Ninilchik are $52,434 for men and $21,750 for women, a difference of 58.5%. Men with an educational attainment of graduate degree enjoy the highest average annual earnings of $91,250, while those with college or associate's degree education earn the least with $50,592. Women with an educational attainment of college or associate's degree earn the most with the average annual earnings of $37,250, while those with bachelor's degree education have the smallest earnings of $12,353.
| Educational Attainment | Male Income | Female Income |
| Less than High School | - | - |
| High School Diploma | - | - |
| College or Associate's Degree | $50,592 | $37,250 |
| Bachelor's Degree | $80,179 | $12,353 |
| Graduate Degree | $91,250 | $0 |
| Total | $52,434 | $21,750 |
Family Income in Ninilchik
Family Income Brackets in Ninilchik
According to the Ninilchik family income data, there are 61 families falling into the $50,000 to $74,999 income range, which is the most common income bracket and makes up 23.9% of all families. Conversely, the $10,000 to $14,999 income bracket is the least frequent group with only 3 families (1.2%) belonging to this category.
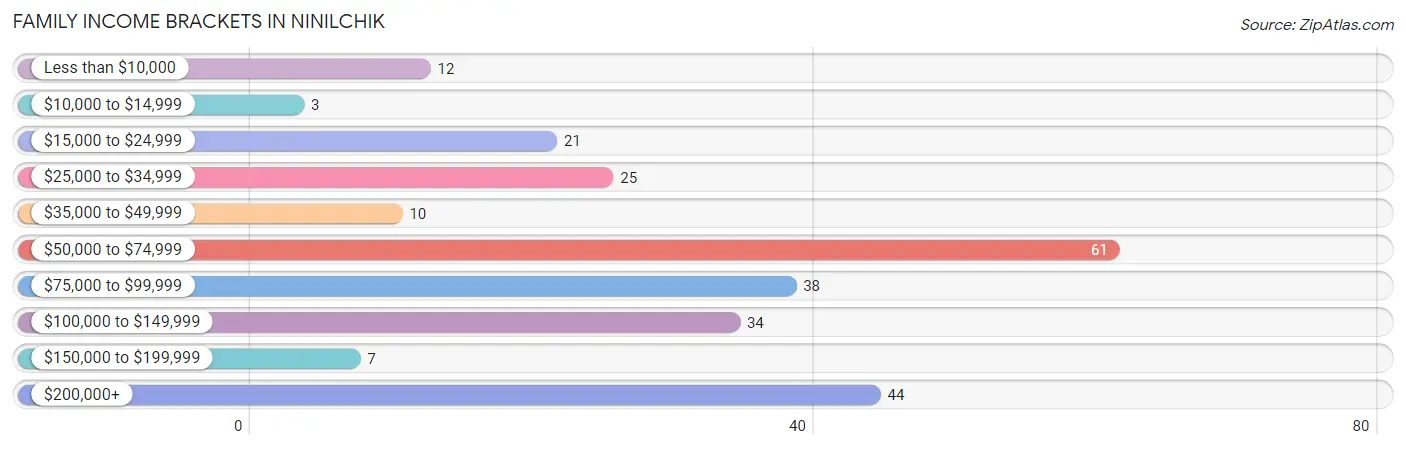
| Income Bracket | # Families | % Families |
| Less than $10,000 | 12 | 4.7% |
| $10,000 to $14,999 | 3 | 1.2% |
| $15,000 to $24,999 | 21 | 8.2% |
| $25,000 to $34,999 | 25 | 9.8% |
| $35,000 to $49,999 | 10 | 3.9% |
| $50,000 to $74,999 | 61 | 23.9% |
| $75,000 to $99,999 | 38 | 14.9% |
| $100,000 to $149,999 | 34 | 13.3% |
| $150,000 to $199,999 | 7 | 2.7% |
| $200,000+ | 44 | 17.3% |
Family Income by Famaliy Size in Ninilchik
5-person families (14 | 5.5%) account for the highest median family income in Ninilchik with $197,000 per family, while 5-person families (14 | 5.5%) have the highest median income of $39,400 per family member.
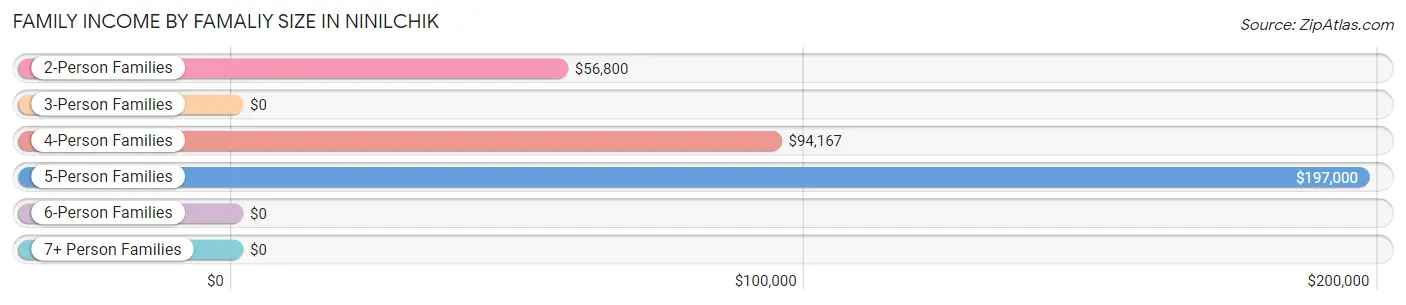
| Income Bracket | # Families | Median Income |
| 2-Person Families | 146 (57.3%) | $56,800 |
| 3-Person Families | 53 (20.8%) | $0 |
| 4-Person Families | 42 (16.5%) | $94,167 |
| 5-Person Families | 14 (5.5%) | $197,000 |
| 6-Person Families | 0 (0.0%) | $0 |
| 7+ Person Families | 0 (0.0%) | $0 |
| Total | 255 (100.0%) | $65,893 |
Family Income by Number of Earners in Ninilchik
The median family income in Ninilchik is $65,893, with families comprising 3+ earners (39) having the highest median family income of $250,001, while families with no earners (88) have the lowest median family income of $55,000, accounting for 15.3% and 34.5% of families, respectively.
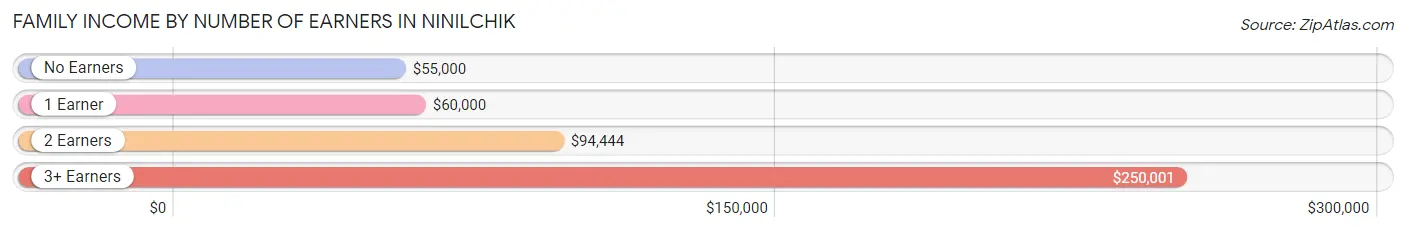
| Number of Earners | # Families | Median Income |
| No Earners | 88 (34.5%) | $55,000 |
| 1 Earner | 62 (24.3%) | $60,000 |
| 2 Earners | 66 (25.9%) | $94,444 |
| 3+ Earners | 39 (15.3%) | $250,001 |
| Total | 255 (100.0%) | $65,893 |
Household Income in Ninilchik
Household Income Brackets in Ninilchik
With 85 households falling in the category, the $50,000 to $74,999 income range is the most frequent in Ninilchik, accounting for 20.8% of all households. In contrast, only 7 households (1.7%) fall into the $150,000 to $199,999 income bracket, making it the least populous group.
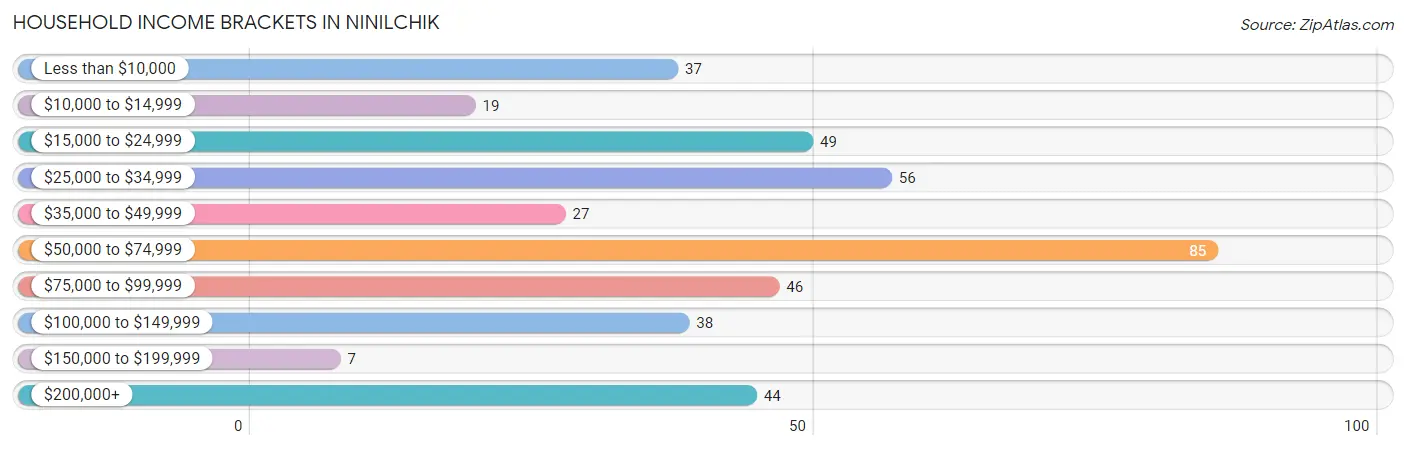
| Income Bracket | # Households | % Households |
| Less than $10,000 | 37 | 9.1% |
| $10,000 to $14,999 | 19 | 4.7% |
| $15,000 to $24,999 | 49 | 12.0% |
| $25,000 to $34,999 | 56 | 13.7% |
| $35,000 to $49,999 | 27 | 6.6% |
| $50,000 to $74,999 | 85 | 20.8% |
| $75,000 to $99,999 | 46 | 11.3% |
| $100,000 to $149,999 | 38 | 9.3% |
| $150,000 to $199,999 | 7 | 1.7% |
| $200,000+ | 44 | 10.8% |
Household Income by Householder Age in Ninilchik
The median household income in Ninilchik is $55,357, with the highest median household income of $66,691 found in the 25 to 44 years age bracket for the primary householder. A total of 73 households (17.9%) fall into this category. Meanwhile, the 15 to 24 years age bracket for the primary householder has the lowest median household income of $0, with 3 households (0.7%) in this group.
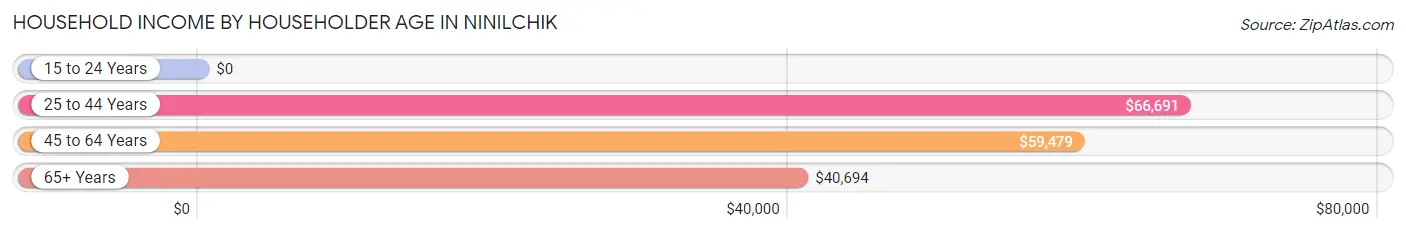
| Income Bracket | # Households | Median Income |
| 15 to 24 Years | 3 (0.7%) | $0 |
| 25 to 44 Years | 73 (17.9%) | $66,691 |
| 45 to 64 Years | 167 (40.9%) | $59,479 |
| 65+ Years | 165 (40.4%) | $40,694 |
| Total | 408 (100.0%) | $55,357 |
Poverty in Ninilchik
Income Below Poverty by Sex and Age in Ninilchik
With 14.8% poverty level for males and 20.1% for females among the residents of Ninilchik, 12 to 14 year old males and 18 to 24 year old females are the most vulnerable to poverty, with 14 males (60.9%) and 3 females (42.9%) in their respective age groups living below the poverty level.
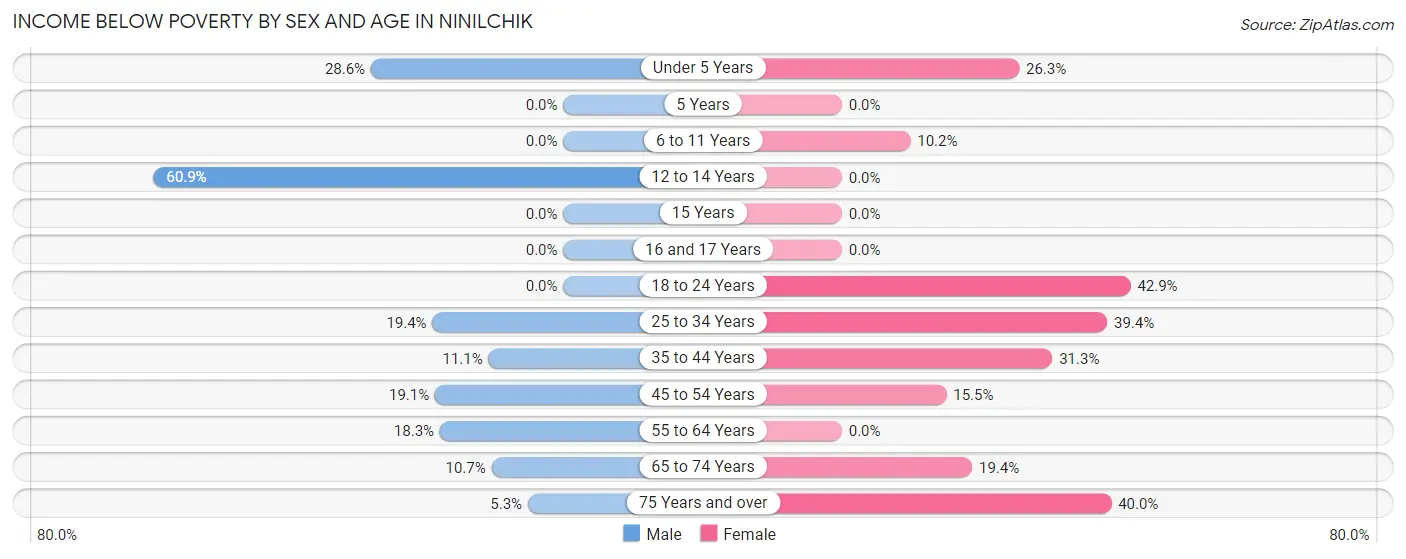
| Age Bracket | Male | Female |
| Under 5 Years | 12 (28.6%) | 10 (26.3%) |
| 5 Years | 0 (0.0%) | 0 (0.0%) |
| 6 to 11 Years | 0 (0.0%) | 6 (10.2%) |
| 12 to 14 Years | 14 (60.9%) | 0 (0.0%) |
| 15 Years | 0 (0.0%) | 0 (0.0%) |
| 16 and 17 Years | 0 (0.0%) | 0 (0.0%) |
| 18 to 24 Years | 0 (0.0%) | 3 (42.9%) |
| 25 to 34 Years | 7 (19.4%) | 26 (39.4%) |
| 35 to 44 Years | 4 (11.1%) | 10 (31.2%) |
| 45 to 54 Years | 4 (19.1%) | 9 (15.5%) |
| 55 to 64 Years | 22 (18.3%) | 0 (0.0%) |
| 65 to 74 Years | 13 (10.7%) | 6 (19.4%) |
| 75 Years and over | 2 (5.3%) | 14 (40.0%) |
| Total | 78 (14.8%) | 84 (20.1%) |
Income Above Poverty by Sex and Age in Ninilchik
According to the poverty statistics in Ninilchik, males aged 6 to 11 years and females aged 15 years are the age groups that are most secure financially, with 100.0% of males and 100.0% of females in these age groups living above the poverty line.
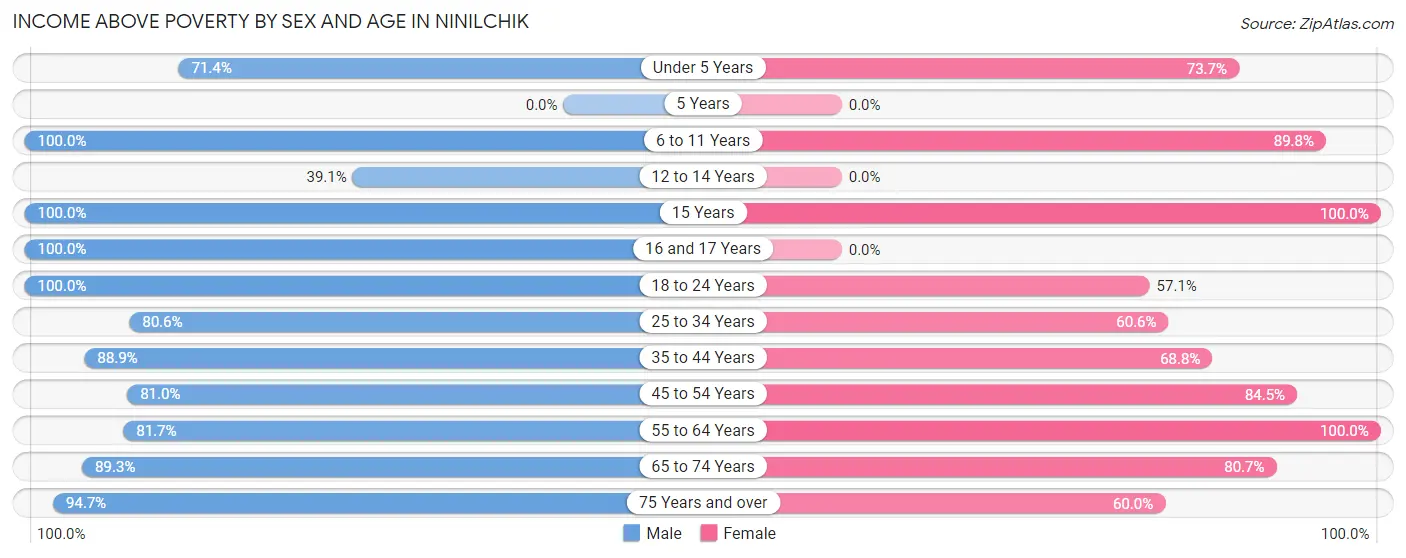
| Age Bracket | Male | Female |
| Under 5 Years | 30 (71.4%) | 28 (73.7%) |
| 5 Years | 0 (0.0%) | 0 (0.0%) |
| 6 to 11 Years | 15 (100.0%) | 53 (89.8%) |
| 12 to 14 Years | 9 (39.1%) | 0 (0.0%) |
| 15 Years | 9 (100.0%) | 9 (100.0%) |
| 16 and 17 Years | 5 (100.0%) | 0 (0.0%) |
| 18 to 24 Years | 60 (100.0%) | 4 (57.1%) |
| 25 to 34 Years | 29 (80.6%) | 40 (60.6%) |
| 35 to 44 Years | 32 (88.9%) | 22 (68.8%) |
| 45 to 54 Years | 17 (80.9%) | 49 (84.5%) |
| 55 to 64 Years | 98 (81.7%) | 84 (100.0%) |
| 65 to 74 Years | 109 (89.3%) | 25 (80.6%) |
| 75 Years and over | 36 (94.7%) | 21 (60.0%) |
| Total | 449 (85.2%) | 335 (79.9%) |
Income Below Poverty Among Married-Couple Families in Ninilchik
The poverty statistics for married-couple families in Ninilchik show that 7.0% or 15 of the total 214 families live below the poverty line. Families with 1 or 2 children have the highest poverty rate of 11.6%, comprising of 5 families. On the other hand, families with 3 or 4 children have the lowest poverty rate of 0.0%, which includes 0 families.
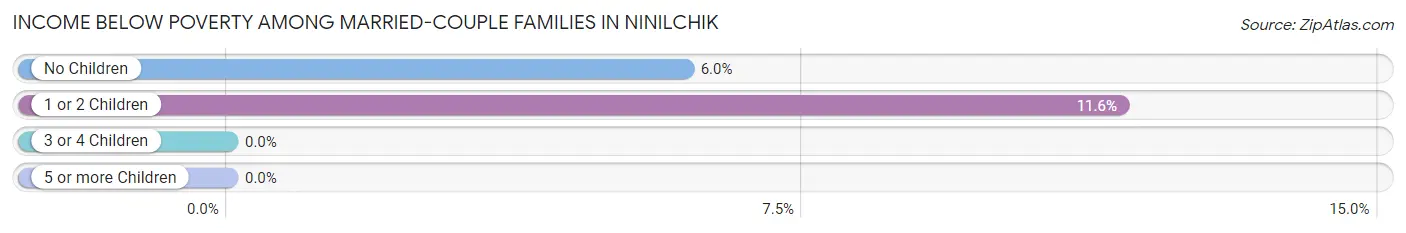
| Children | Above Poverty | Below Poverty |
| No Children | 158 (94.1%) | 10 (5.9%) |
| 1 or 2 Children | 38 (88.4%) | 5 (11.6%) |
| 3 or 4 Children | 3 (100.0%) | 0 (0.0%) |
| 5 or more Children | 0 (0.0%) | 0 (0.0%) |
| Total | 199 (93.0%) | 15 (7.0%) |
Income Below Poverty Among Single-Parent Households in Ninilchik
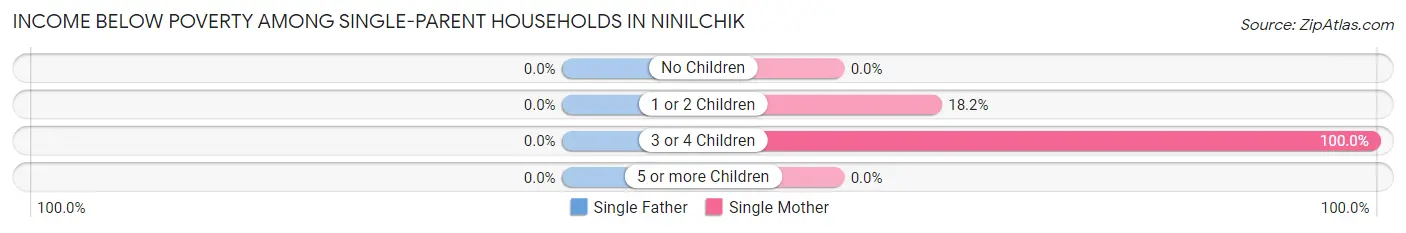
| Children | Single Father | Single Mother |
| No Children | 0 (0.0%) | 0 (0.0%) |
| 1 or 2 Children | 0 (0.0%) | 4 (18.2%) |
| 3 or 4 Children | 0 (0.0%) | 5 (100.0%) |
| 5 or more Children | 0 (0.0%) | 0 (0.0%) |
| Total | 0 (0.0%) | 9 (28.1%) |
Income Below Poverty Among Married-Couple vs Single-Parent Households in Ninilchik
The poverty data for Ninilchik shows that 15 of the married-couple family households (7.0%) and 9 of the single-parent households (22.0%) are living below the poverty level. Within the married-couple family households, those with 1 or 2 children have the highest poverty rate, with 5 households (11.6%) falling below the poverty line. Among the single-parent households, those with 3 or 4 children have the highest poverty rate, with 5 household (100.0%) living below poverty.
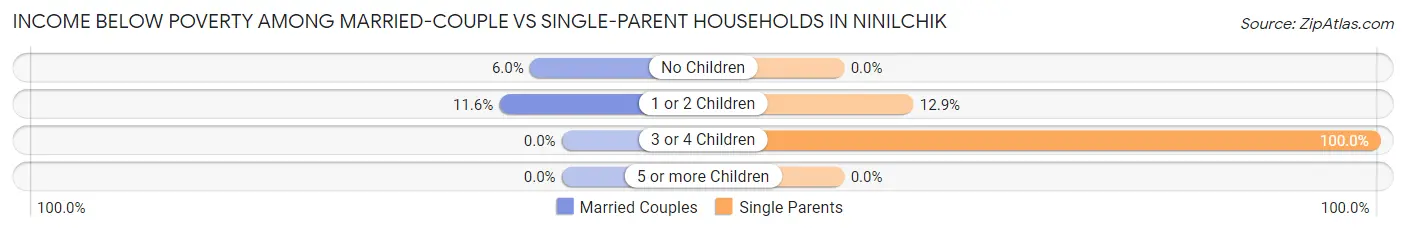
| Children | Married-Couple Families | Single-Parent Households |
| No Children | 10 (5.9%) | 0 (0.0%) |
| 1 or 2 Children | 5 (11.6%) | 4 (12.9%) |
| 3 or 4 Children | 0 (0.0%) | 5 (100.0%) |
| 5 or more Children | 0 (0.0%) | 0 (0.0%) |
| Total | 15 (7.0%) | 9 (22.0%) |
Race in Ninilchik
The most populous races in Ninilchik are White / Caucasian (750 | 77.8%), Two or more Races (98 | 10.2%), and Native / Alaskan (97 | 10.1%).
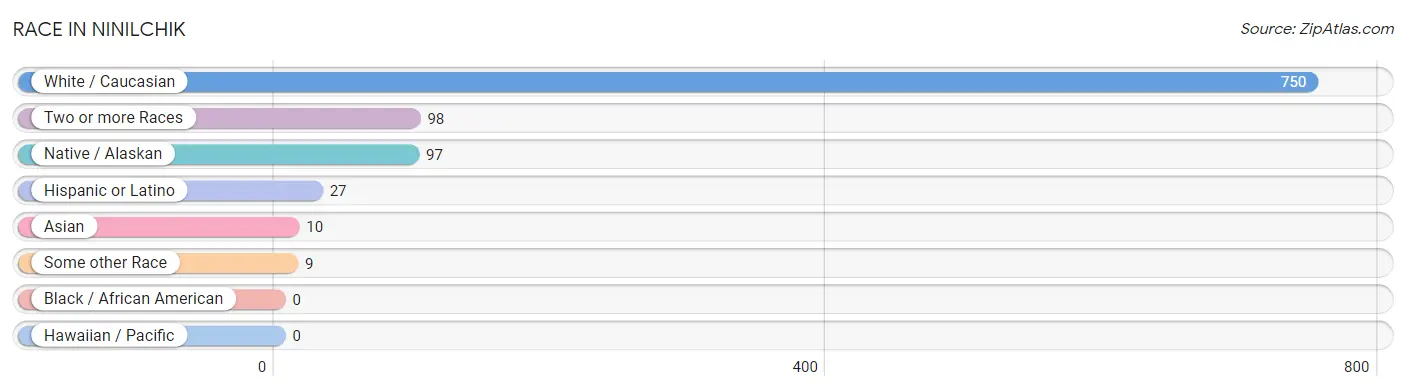
| Race | # Population | % Population |
| Asian | 10 | 1.0% |
| Black / African American | 0 | 0.0% |
| Hawaiian / Pacific | 0 | 0.0% |
| Hispanic or Latino | 27 | 2.8% |
| Native / Alaskan | 97 | 10.1% |
| White / Caucasian | 750 | 77.8% |
| Two or more Races | 98 | 10.2% |
| Some other Race | 9 | 0.9% |
| Total | 964 | 100.0% |
Ancestry in Ninilchik
The most populous ancestries reported in Ninilchik are Irish (165 | 17.1%), German (164 | 17.0%), Alaskan Athabascan (88 | 9.1%), Norwegian (71 | 7.4%), and Aleut (61 | 6.3%), together accounting for 57.0% of all Ninilchik residents.
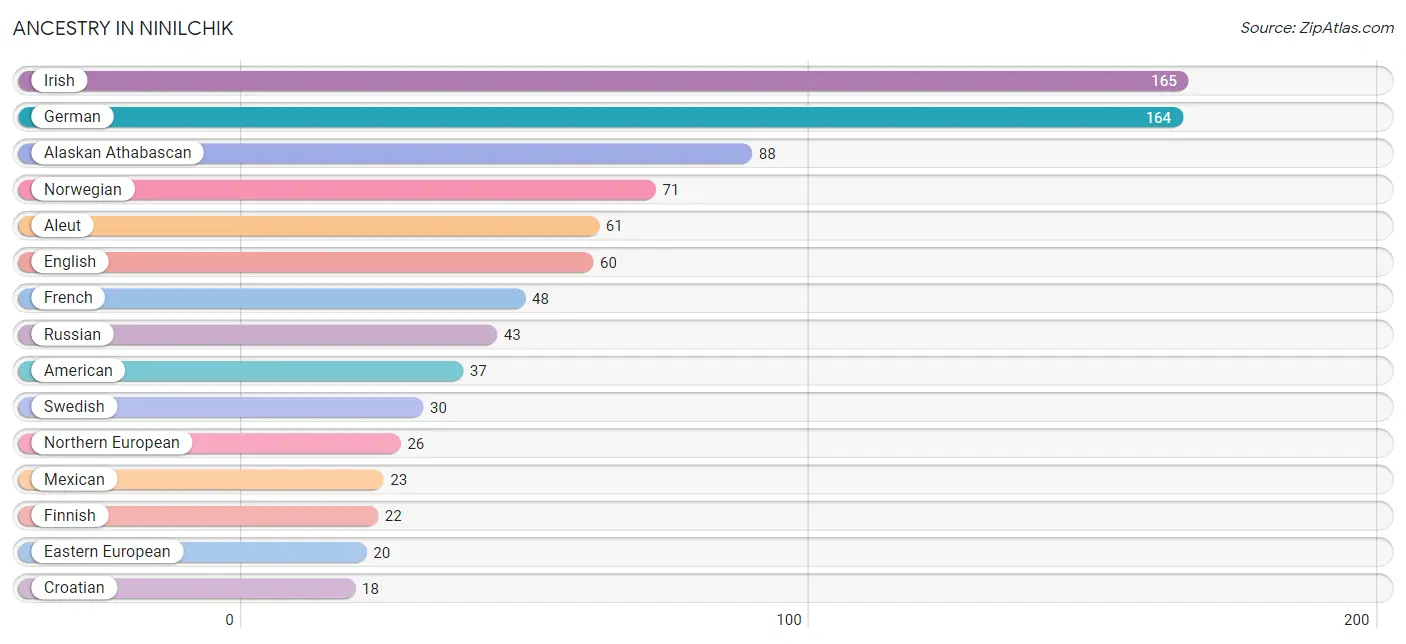
| Ancestry | # Population | % Population |
| Alaska Native | 6 | 0.6% |
| Alaskan Athabascan | 88 | 9.1% |
| Aleut | 61 | 6.3% |
| American | 37 | 3.8% |
| Canadian | 5 | 0.5% |
| Cherokee | 8 | 0.8% |
| Chippewa | 4 | 0.4% |
| Croatian | 18 | 1.9% |
| Czech | 4 | 0.4% |
| Danish | 11 | 1.1% |
| Dutch | 12 | 1.2% |
| Eastern European | 20 | 2.1% |
| English | 60 | 6.2% |
| European | 8 | 0.8% |
| Finnish | 22 | 2.3% |
| French | 48 | 5.0% |
| French Canadian | 4 | 0.4% |
| German | 164 | 17.0% |
| Inupiat | 18 | 1.9% |
| Irish | 165 | 17.1% |
| Italian | 12 | 1.2% |
| Korean | 6 | 0.6% |
| Mexican | 23 | 2.4% |
| Northern European | 26 | 2.7% |
| Norwegian | 71 | 7.4% |
| Pakistani | 4 | 0.4% |
| Polish | 10 | 1.0% |
| Portuguese | 5 | 0.5% |
| Puerto Rican | 2 | 0.2% |
| Russian | 43 | 4.5% |
| Scandinavian | 4 | 0.4% |
| Shoshone | 5 | 0.5% |
| Slavic | 1 | 0.1% |
| Slovak | 5 | 0.5% |
| Spaniard | 2 | 0.2% |
| Swedish | 30 | 3.1% |
| Ukrainian | 4 | 0.4% | View All 37 Rows |
Immigrants in Ninilchik
The most numerous immigrant groups reported in Ninilchik came from Europe (17 | 1.8%), England (12 | 1.2%), Northern Europe (12 | 1.2%), Canada (5 | 0.5%), and Czechoslovakia (5 | 0.5%), together accounting for 5.3% of all Ninilchik residents.
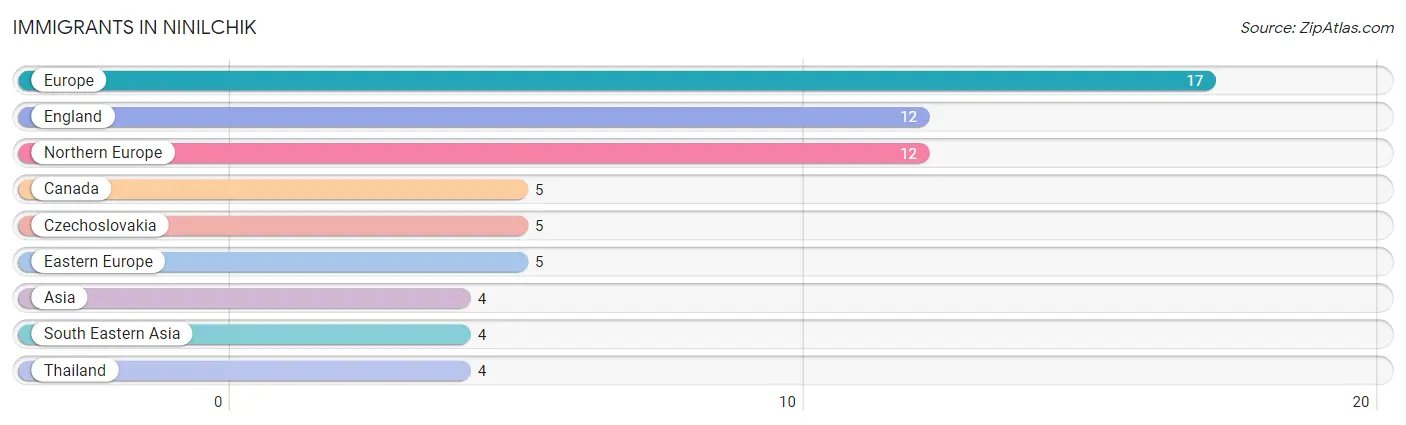
| Immigration Origin | # Population | % Population |
| Asia | 4 | 0.4% |
| Canada | 5 | 0.5% |
| Czechoslovakia | 5 | 0.5% |
| Eastern Europe | 5 | 0.5% |
| England | 12 | 1.2% |
| Europe | 17 | 1.8% |
| Northern Europe | 12 | 1.2% |
| South Eastern Asia | 4 | 0.4% |
| Thailand | 4 | 0.4% | View All 9 Rows |
Sex and Age in Ninilchik
Sex and Age in Ninilchik
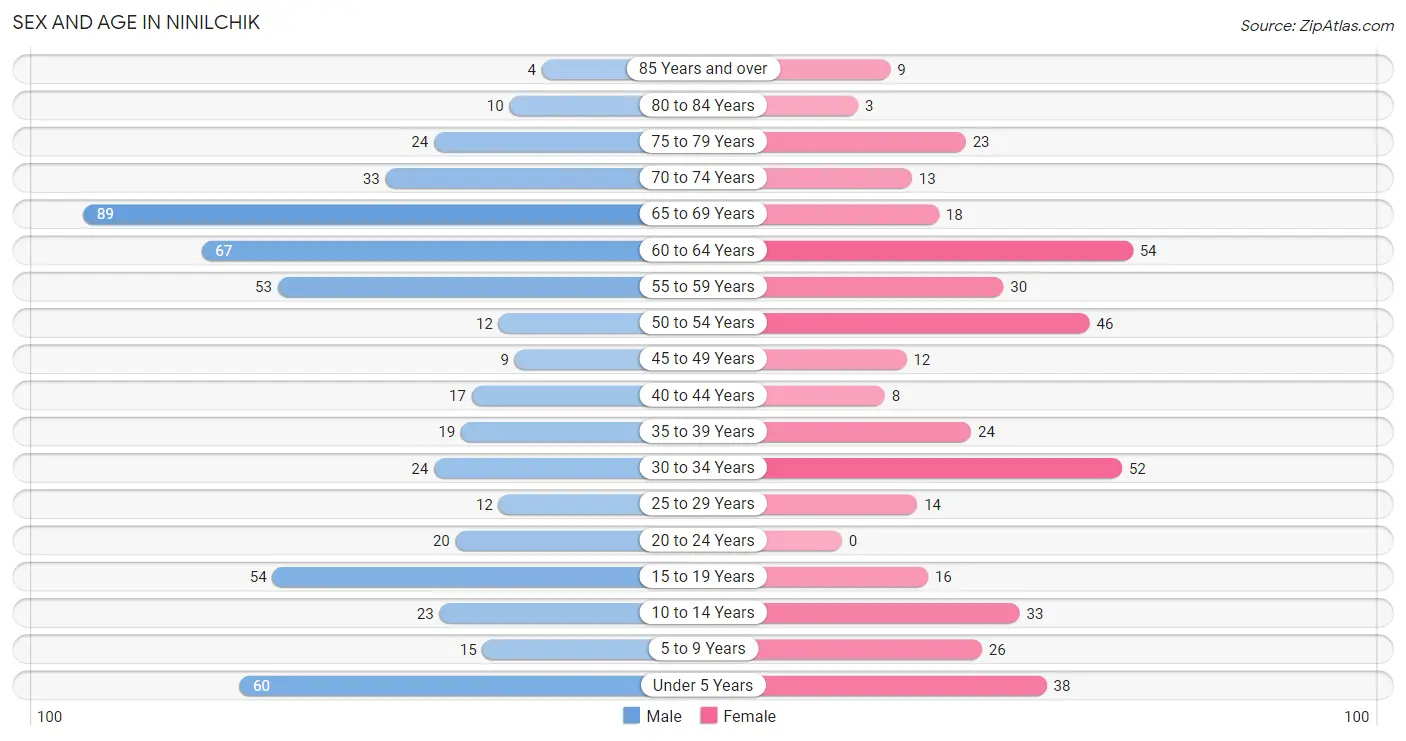
The most populous age groups in Ninilchik are 65 to 69 Years (89 | 16.3%) for men and 60 to 64 Years (54 | 12.9%) for women.
| Age Bracket | Male | Female |
| Under 5 Years | 60 (11.0%) | 38 (9.1%) |
| 5 to 9 Years | 15 (2.8%) | 26 (6.2%) |
| 10 to 14 Years | 23 (4.2%) | 33 (7.9%) |
| 15 to 19 Years | 54 (9.9%) | 16 (3.8%) |
| 20 to 24 Years | 20 (3.7%) | 0 (0.0%) |
| 25 to 29 Years | 12 (2.2%) | 14 (3.3%) |
| 30 to 34 Years | 24 (4.4%) | 52 (12.4%) |
| 35 to 39 Years | 19 (3.5%) | 24 (5.7%) |
| 40 to 44 Years | 17 (3.1%) | 8 (1.9%) |
| 45 to 49 Years | 9 (1.7%) | 12 (2.9%) |
| 50 to 54 Years | 12 (2.2%) | 46 (11.0%) |
| 55 to 59 Years | 53 (9.7%) | 30 (7.2%) |
| 60 to 64 Years | 67 (12.3%) | 54 (12.9%) |
| 65 to 69 Years | 89 (16.3%) | 18 (4.3%) |
| 70 to 74 Years | 33 (6.1%) | 13 (3.1%) |
| 75 to 79 Years | 24 (4.4%) | 23 (5.5%) |
| 80 to 84 Years | 10 (1.8%) | 3 (0.7%) |
| 85 Years and over | 4 (0.7%) | 9 (2.1%) |
| Total | 545 (100.0%) | 419 (100.0%) |
Families and Households in Ninilchik
Median Family Size in Ninilchik
The median family size in Ninilchik is 2.95 persons per family, with single female/mother families (32 | 12.6%) accounting for the largest median family size of 3.97 persons per family. On the other hand, married-couple families (214 | 83.9%) represent the smallest median family size with 2.79 persons per family.
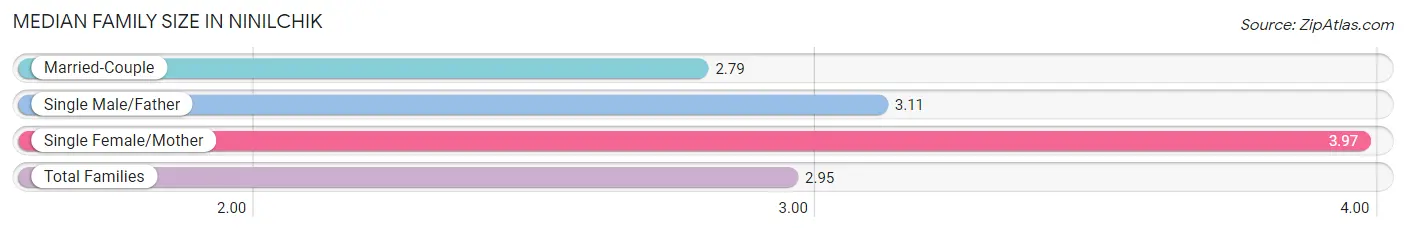
| Family Type | # Families | Family Size |
| Married-Couple | 214 (83.9%) | 2.79 |
| Single Male/Father | 9 (3.5%) | 3.11 |
| Single Female/Mother | 32 (12.6%) | 3.97 |
| Total Families | 255 (100.0%) | 2.95 |
Median Household Size in Ninilchik
The median household size in Ninilchik is 2.36 persons per household, with single female/mother households (32 | 7.8%) accounting for the largest median household size of 3.97 persons per household. non-family households (153 | 37.5%) represent the smallest median household size with 1.18 persons per household.
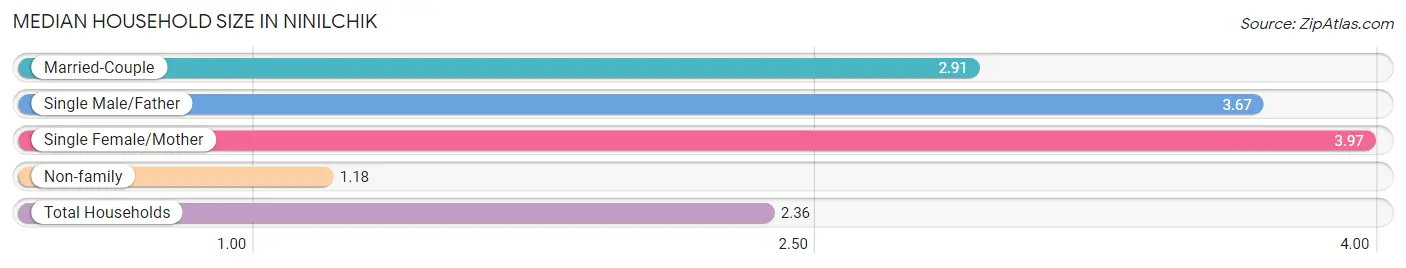
| Household Type | # Households | Household Size |
| Married-Couple | 214 (52.4%) | 2.91 |
| Single Male/Father | 9 (2.2%) | 3.67 |
| Single Female/Mother | 32 (7.8%) | 3.97 |
| Non-family | 153 (37.5%) | 1.18 |
| Total Households | 408 (100.0%) | 2.36 |
Household Size by Marriage Status in Ninilchik
Out of a total of 408 households in Ninilchik, 255 (62.5%) are family households, while 153 (37.5%) are nonfamily households. The most numerous type of family households are 2-person households, comprising 138, and the most common type of nonfamily households are 1-person households, comprising 120.
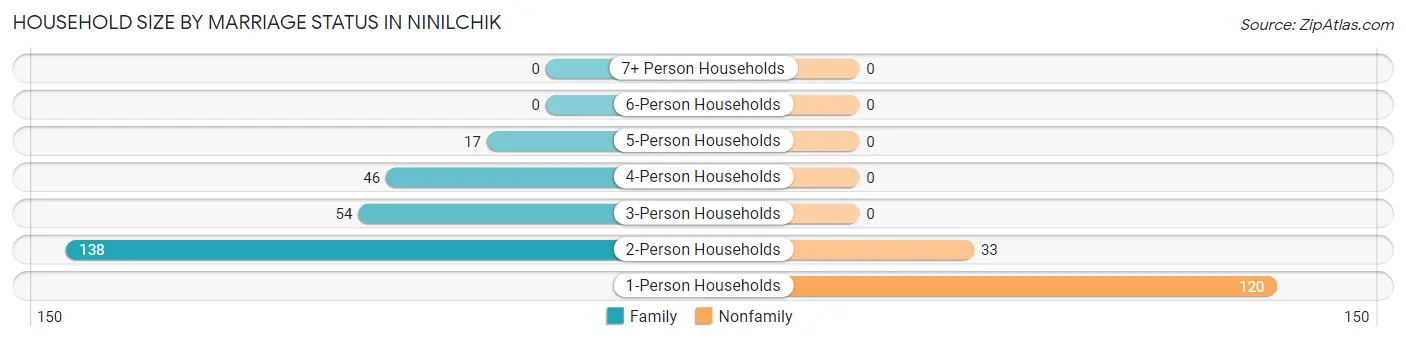
| Household Size | Family Households | Nonfamily Households |
| 1-Person Households | - | 120 (29.4%) |
| 2-Person Households | 138 (33.8%) | 33 (8.1%) |
| 3-Person Households | 54 (13.2%) | 0 (0.0%) |
| 4-Person Households | 46 (11.3%) | 0 (0.0%) |
| 5-Person Households | 17 (4.2%) | 0 (0.0%) |
| 6-Person Households | 0 (0.0%) | 0 (0.0%) |
| 7+ Person Households | 0 (0.0%) | 0 (0.0%) |
| Total | 255 (62.5%) | 153 (37.5%) |
Female Fertility in Ninilchik
Fertility by Age in Ninilchik
Average fertility rate in Ninilchik is 46.0 births per 1,000 women. Women in the age bracket of 20 to 34 years have the highest fertility rate with 91.0 births per 1,000 women. Women in the age bracket of 20 to 34 years acount for 100.0% of all women with births.
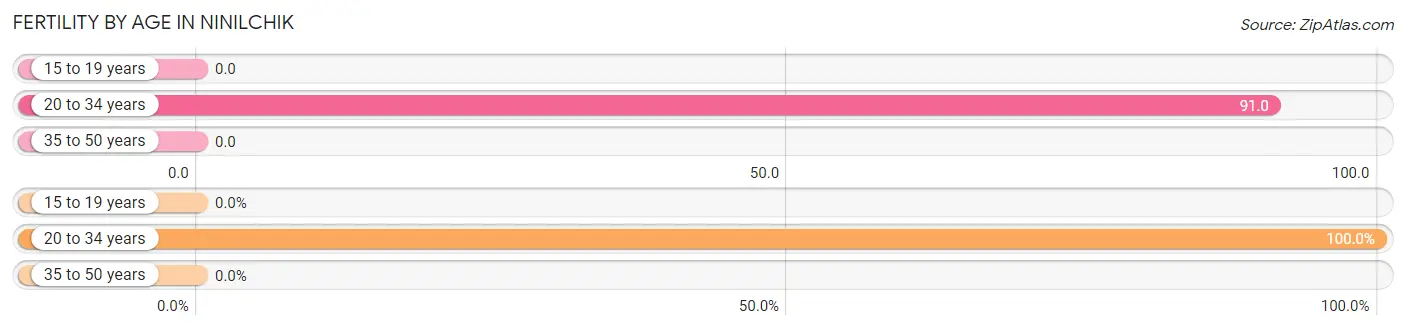
| Age Bracket | Women with Births | Births / 1,000 Women |
| 15 to 19 years | 0 (0.0%) | 0.0 |
| 20 to 34 years | 6 (100.0%) | 91.0 |
| 35 to 50 years | 0 (0.0%) | 0.0 |
| Total | 6 (100.0%) | 46.0 |
Fertility by Age by Marriage Status in Ninilchik
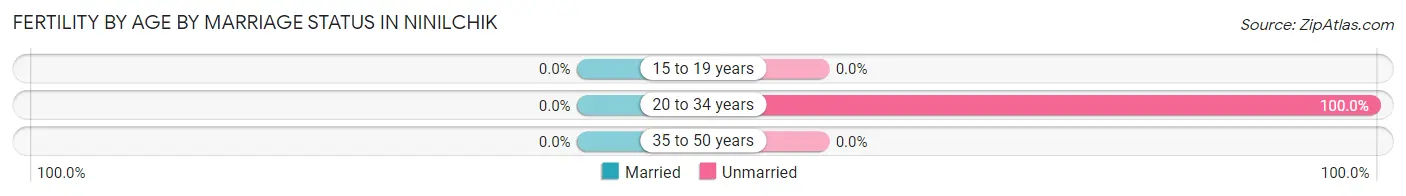
| Age Bracket | Married | Unmarried |
| 15 to 19 years | 0 (0.0%) | 0 (0.0%) |
| 20 to 34 years | 0 (0.0%) | 6 (100.0%) |
| 35 to 50 years | 0 (0.0%) | 0 (0.0%) |
| Total | 0 (0.0%) | 6 (100.0%) |
Fertility by Education in Ninilchik
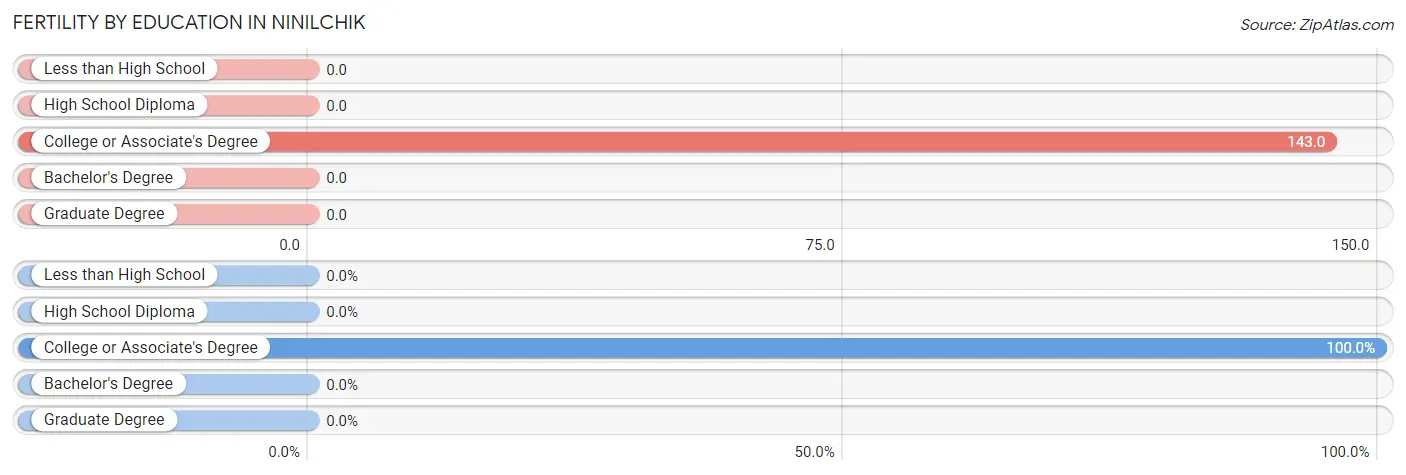
| Educational Attainment | Women with Births | Births / 1,000 Women |
| Less than High School | 0 (0.0%) | 0.0 |
| High School Diploma | 0 (0.0%) | 0.0 |
| College or Associate's Degree | 6 (100.0%) | 143.0 |
| Bachelor's Degree | 0 (0.0%) | 0.0 |
| Graduate Degree | 0 (0.0%) | 0.0 |
| Total | 6 (100.0%) | 46.0 |
Fertility by Education by Marriage Status in Ninilchik
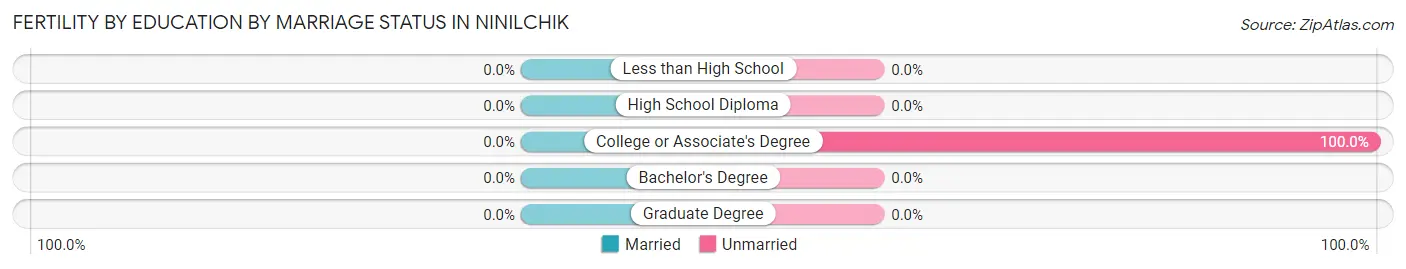
| Educational Attainment | Married | Unmarried |
| Less than High School | 0 (0.0%) | 0 (0.0%) |
| High School Diploma | 0 (0.0%) | 0 (0.0%) |
| College or Associate's Degree | 0 (0.0%) | 6 (100.0%) |
| Bachelor's Degree | 0 (0.0%) | 0 (0.0%) |
| Graduate Degree | 0 (0.0%) | 0 (0.0%) |
| Total | 0 (0.0%) | 6 (100.0%) |
Employment Characteristics in Ninilchik
Employment by Class of Employer in Ninilchik
Among the 313 employed individuals in Ninilchik, private company employees (144 | 46.0%), self-employed (not incorporated) (82 | 26.2%), and not-for-profit organizations (36 | 11.5%) make up the most common classes of employment.
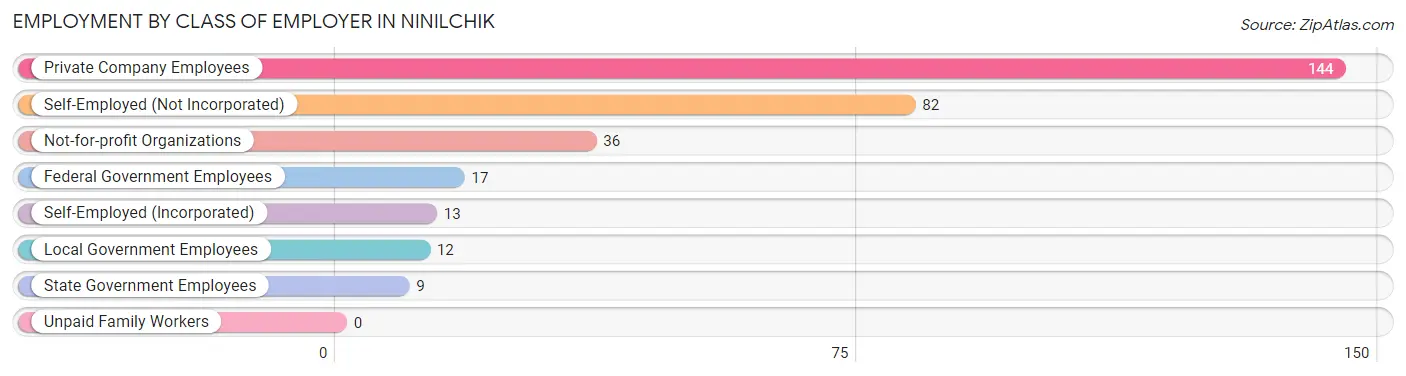
| Employer Class | # Employees | % Employees |
| Private Company Employees | 144 | 46.0% |
| Self-Employed (Incorporated) | 13 | 4.2% |
| Self-Employed (Not Incorporated) | 82 | 26.2% |
| Not-for-profit Organizations | 36 | 11.5% |
| Local Government Employees | 12 | 3.8% |
| State Government Employees | 9 | 2.9% |
| Federal Government Employees | 17 | 5.4% |
| Unpaid Family Workers | 0 | 0.0% |
| Total | 313 | 100.0% |
Employment Status by Age in Ninilchik
According to the labor force statistics for Ninilchik, out of the total population over 16 years of age (751), 46.9% or 352 individuals are in the labor force, with 6.0% or 21 of them unemployed. The age group with the highest labor force participation rate is 20 to 24 years, with 100.0% or 20 individuals in the labor force. Within the labor force, the 25 to 29 years age range has the highest percentage of unemployed individuals, with 21.1% or 4 of them being unemployed.
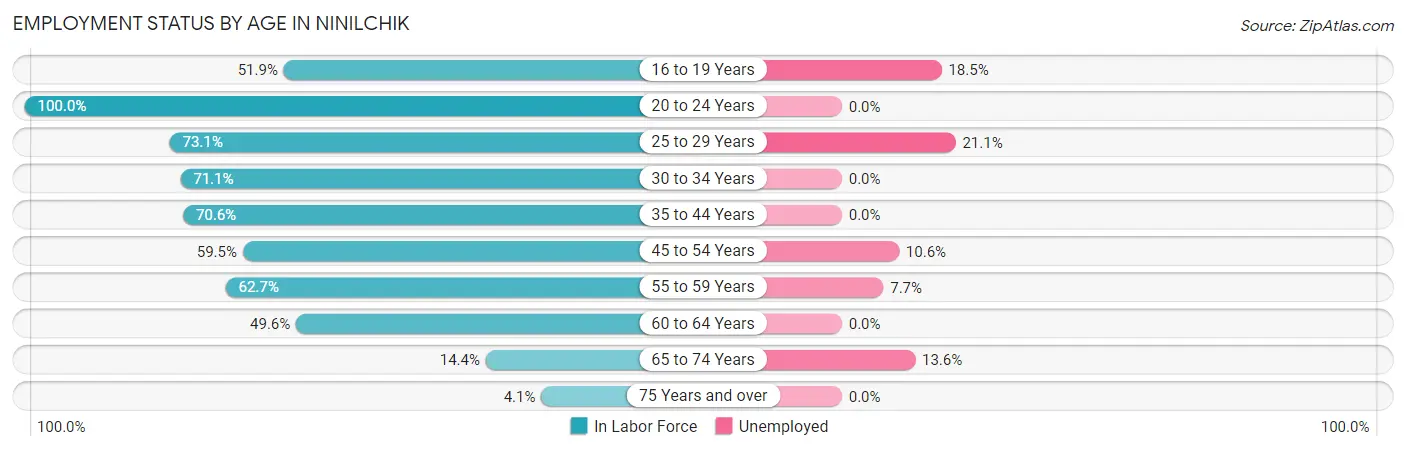
| Age Bracket | In Labor Force | Unemployed |
| 16 to 19 Years | 27 (51.9%) | 5 (18.5%) |
| 20 to 24 Years | 20 (100.0%) | 0 (0.0%) |
| 25 to 29 Years | 19 (73.1%) | 4 (21.1%) |
| 30 to 34 Years | 54 (71.1%) | 0 (0.0%) |
| 35 to 44 Years | 48 (70.6%) | 0 (0.0%) |
| 45 to 54 Years | 47 (59.5%) | 5 (10.6%) |
| 55 to 59 Years | 52 (62.7%) | 4 (7.7%) |
| 60 to 64 Years | 60 (49.6%) | 0 (0.0%) |
| 65 to 74 Years | 22 (14.4%) | 3 (13.6%) |
| 75 Years and over | 3 (4.1%) | 0 (0.0%) |
| Total | 352 (46.9%) | 21 (6.0%) |
Employment Status by Educational Attainment in Ninilchik
According to labor force statistics for Ninilchik, 61.8% of individuals (280) out of the total population between 25 and 64 years of age (453) are in the labor force, with 4.6% or 13 of them being unemployed. The group with the highest labor force participation rate are those with the educational attainment of college / associate degree, with 67.8% or 118 individuals in the labor force. Within the labor force, individuals with less than high school education have the highest percentage of unemployment, with 55.6% or 5 of them being unemployed.
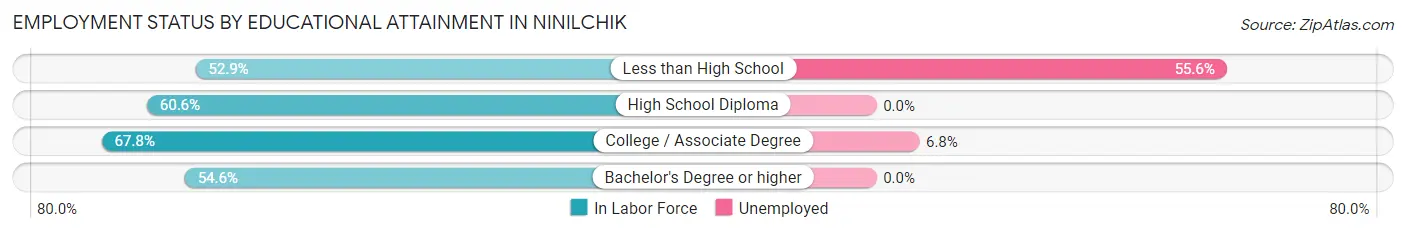
| Educational Attainment | In Labor Force | Unemployed |
| Less than High School | 9 (52.9%) | 9 (55.6%) |
| High School Diploma | 100 (60.6%) | 0 (0.0%) |
| College / Associate Degree | 118 (67.8%) | 12 (6.8%) |
| Bachelor's Degree or higher | 53 (54.6%) | 0 (0.0%) |
| Total | 280 (61.8%) | 21 (4.6%) |
Employment Occupations by Sex in Ninilchik
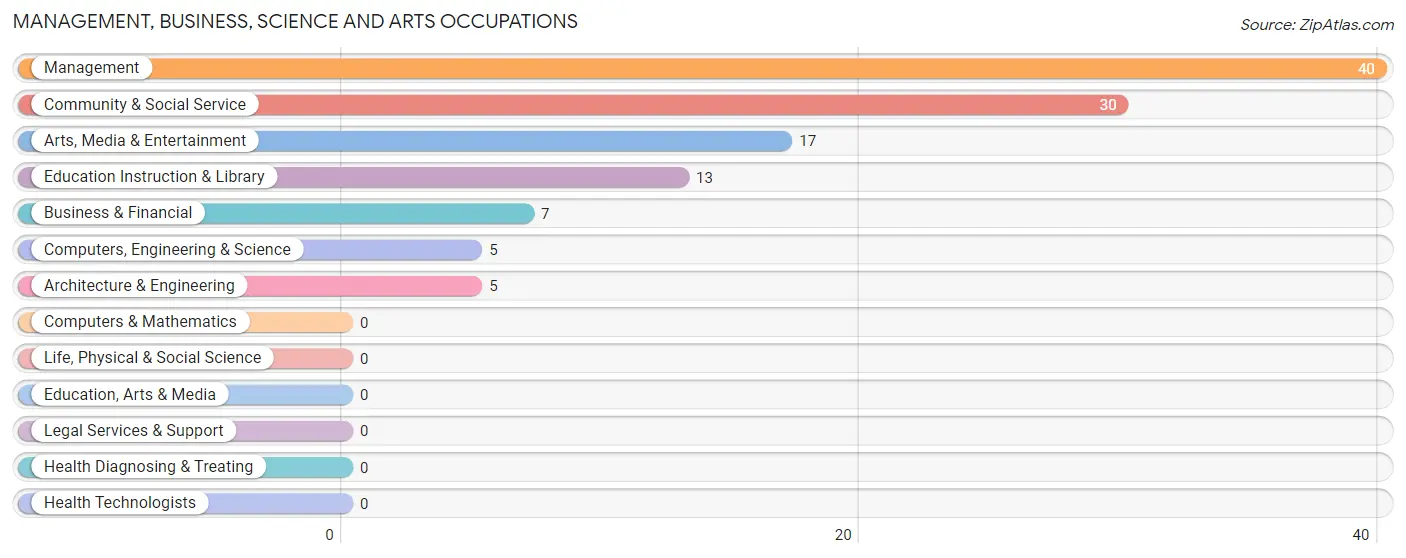
Management, Business, Science and Arts Occupations
The most common Management, Business, Science and Arts occupations in Ninilchik are Management (40 | 12.1%), Community & Social Service (30 | 9.1%), Arts, Media & Entertainment (17 | 5.1%), Education Instruction & Library (13 | 3.9%), and Business & Financial (7 | 2.1%).
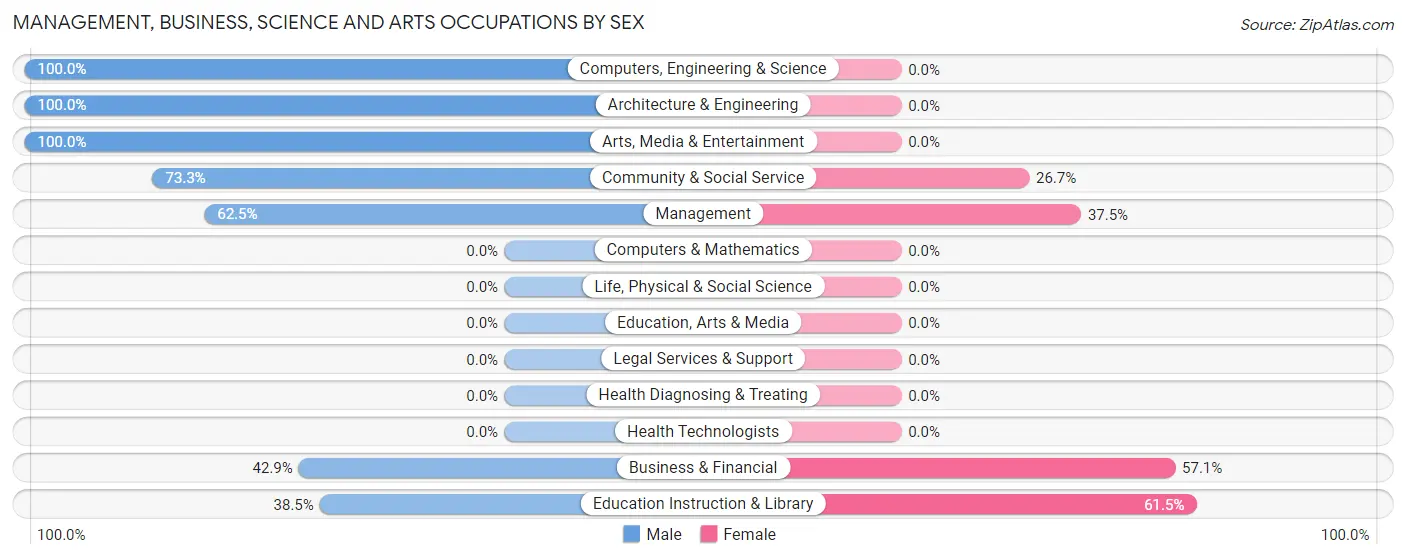
Management, Business, Science and Arts Occupations by Sex
Within the Management, Business, Science and Arts occupations in Ninilchik, the most male-oriented occupations are Computers, Engineering & Science (100.0%), Architecture & Engineering (100.0%), and Arts, Media & Entertainment (100.0%), while the most female-oriented occupations are Education Instruction & Library (61.5%), Business & Financial (57.1%), and Management (37.5%).
| Occupation | Male | Female |
| Management | 25 (62.5%) | 15 (37.5%) |
| Business & Financial | 3 (42.9%) | 4 (57.1%) |
| Computers, Engineering & Science | 5 (100.0%) | 0 (0.0%) |
| Computers & Mathematics | 0 (0.0%) | 0 (0.0%) |
| Architecture & Engineering | 5 (100.0%) | 0 (0.0%) |
| Life, Physical & Social Science | 0 (0.0%) | 0 (0.0%) |
| Community & Social Service | 22 (73.3%) | 8 (26.7%) |
| Education, Arts & Media | 0 (0.0%) | 0 (0.0%) |
| Legal Services & Support | 0 (0.0%) | 0 (0.0%) |
| Education Instruction & Library | 5 (38.5%) | 8 (61.5%) |
| Arts, Media & Entertainment | 17 (100.0%) | 0 (0.0%) |
| Health Diagnosing & Treating | 0 (0.0%) | 0 (0.0%) |
| Health Technologists | 0 (0.0%) | 0 (0.0%) |
| Total (Category) | 55 (67.1%) | 27 (32.9%) |
| Total (Overall) | 205 (61.9%) | 126 (38.1%) |
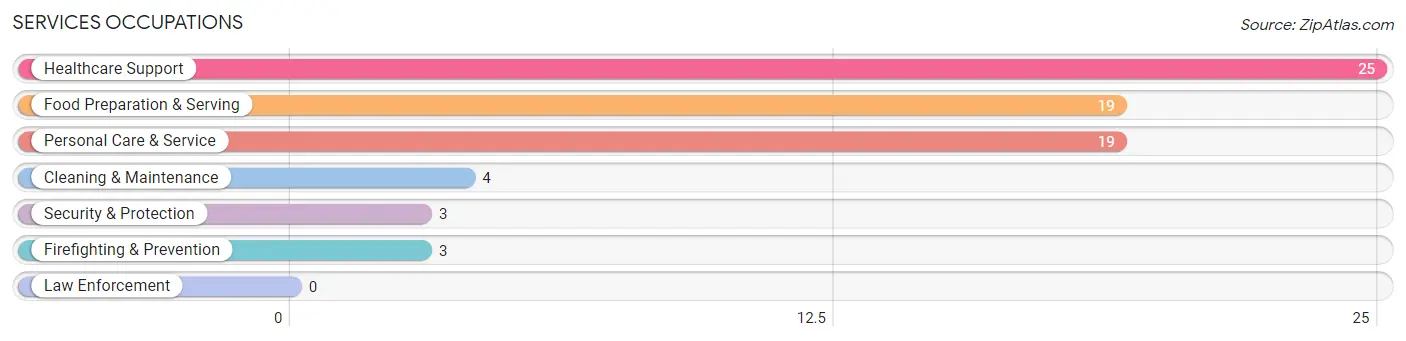
Services Occupations
The most common Services occupations in Ninilchik are Healthcare Support (25 | 7.5%), Food Preparation & Serving (19 | 5.7%), Personal Care & Service (19 | 5.7%), Cleaning & Maintenance (4 | 1.2%), and Security & Protection (3 | 0.9%).
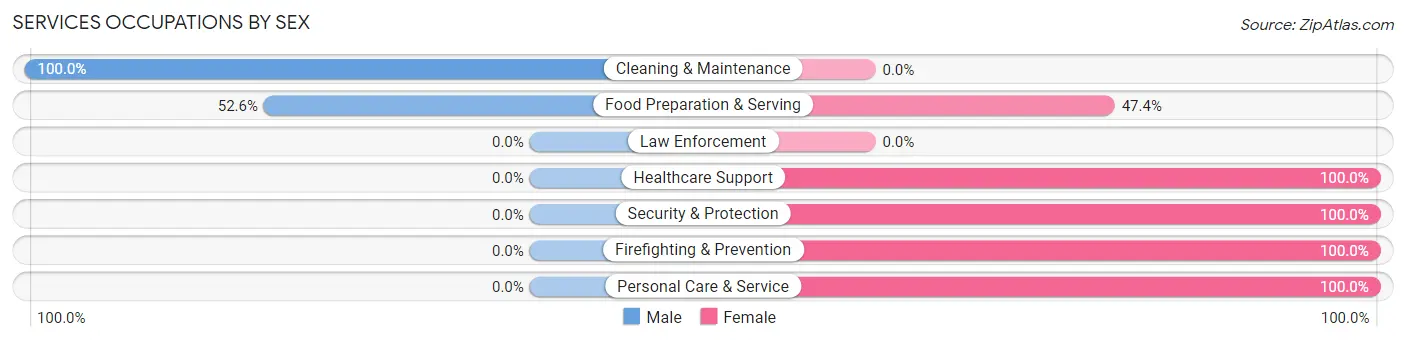
Services Occupations by Sex
Within the Services occupations in Ninilchik, the most male-oriented occupations are Cleaning & Maintenance (100.0%), and Food Preparation & Serving (52.6%), while the most female-oriented occupations are Healthcare Support (100.0%), Security & Protection (100.0%), and Firefighting & Prevention (100.0%).
| Occupation | Male | Female |
| Healthcare Support | 0 (0.0%) | 25 (100.0%) |
| Security & Protection | 0 (0.0%) | 3 (100.0%) |
| Firefighting & Prevention | 0 (0.0%) | 3 (100.0%) |
| Law Enforcement | 0 (0.0%) | 0 (0.0%) |
| Food Preparation & Serving | 10 (52.6%) | 9 (47.4%) |
| Cleaning & Maintenance | 4 (100.0%) | 0 (0.0%) |
| Personal Care & Service | 0 (0.0%) | 19 (100.0%) |
| Total (Category) | 14 (20.0%) | 56 (80.0%) |
| Total (Overall) | 205 (61.9%) | 126 (38.1%) |
Sales and Office Occupations
The most common Sales and Office occupations in Ninilchik are Office & Administration (30 | 9.1%), and Sales & Related (18 | 5.4%).
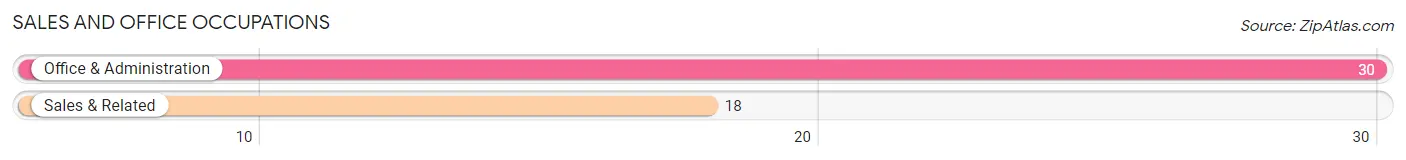
Sales and Office Occupations by Sex
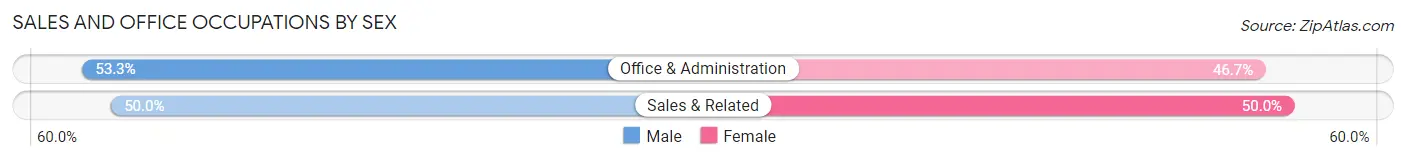
| Occupation | Male | Female |
| Sales & Related | 9 (50.0%) | 9 (50.0%) |
| Office & Administration | 16 (53.3%) | 14 (46.7%) |
| Total (Category) | 25 (52.1%) | 23 (47.9%) |
| Total (Overall) | 205 (61.9%) | 126 (38.1%) |
Natural Resources, Construction and Maintenance Occupations
The most common Natural Resources, Construction and Maintenance occupations in Ninilchik are Construction & Extraction (56 | 16.9%), Farming, Fishing & Forestry (42 | 12.7%), and Installation, Maintenance & Repair (4 | 1.2%).
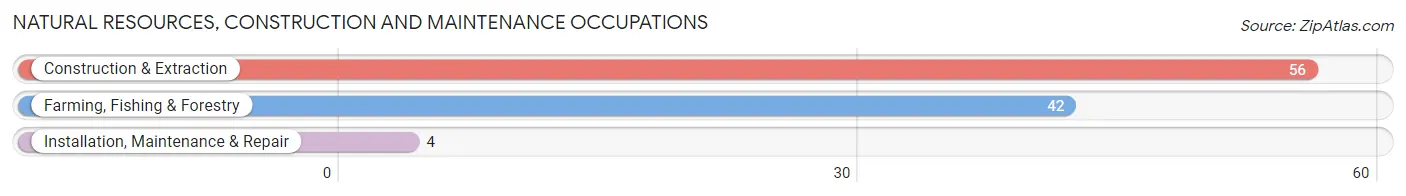
Natural Resources, Construction and Maintenance Occupations by Sex
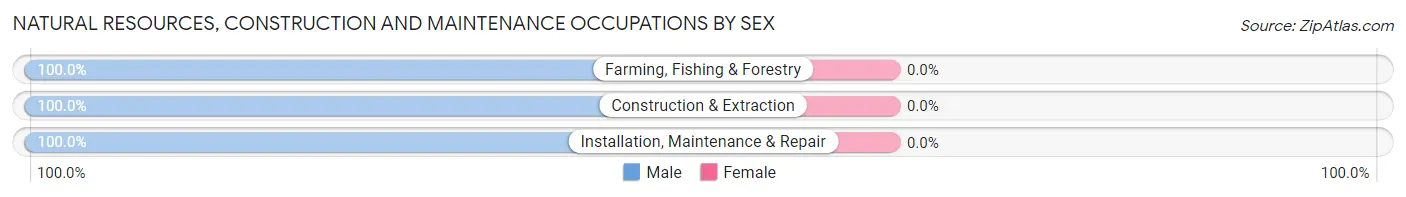
| Occupation | Male | Female |
| Farming, Fishing & Forestry | 42 (100.0%) | 0 (0.0%) |
| Construction & Extraction | 56 (100.0%) | 0 (0.0%) |
| Installation, Maintenance & Repair | 4 (100.0%) | 0 (0.0%) |
| Total (Category) | 102 (100.0%) | 0 (0.0%) |
| Total (Overall) | 205 (61.9%) | 126 (38.1%) |
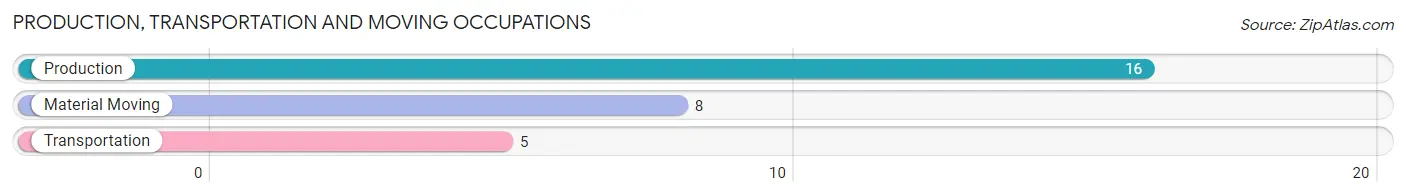
Production, Transportation and Moving Occupations
The most common Production, Transportation and Moving occupations in Ninilchik are Production (16 | 4.8%), Material Moving (8 | 2.4%), and Transportation (5 | 1.5%).
Production, Transportation and Moving Occupations by Sex
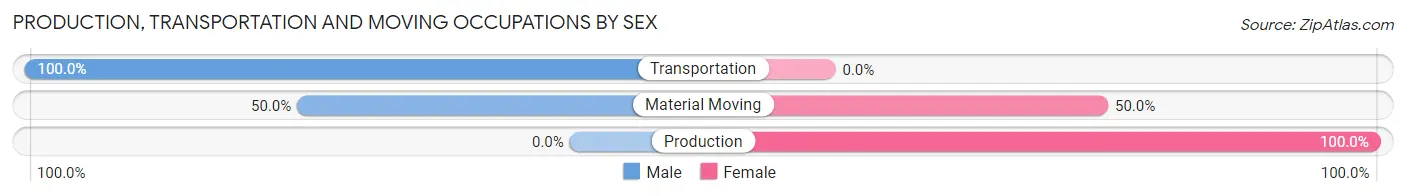
| Occupation | Male | Female |
| Production | 0 (0.0%) | 16 (100.0%) |
| Transportation | 5 (100.0%) | 0 (0.0%) |
| Material Moving | 4 (50.0%) | 4 (50.0%) |
| Total (Category) | 9 (31.0%) | 20 (69.0%) |
| Total (Overall) | 205 (61.9%) | 126 (38.1%) |
Employment Industries by Sex in Ninilchik
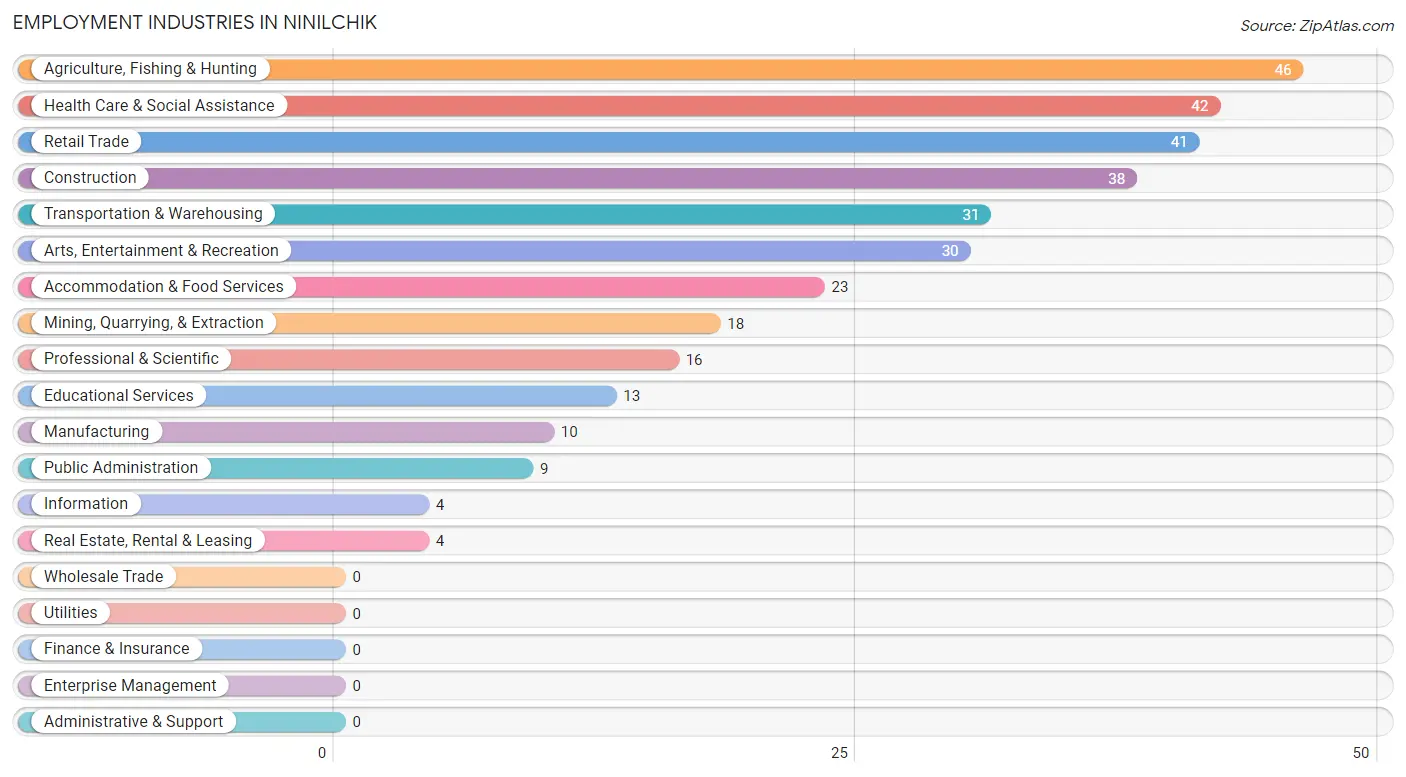
Employment Industries in Ninilchik
The major employment industries in Ninilchik include Agriculture, Fishing & Hunting (46 | 13.9%), Health Care & Social Assistance (42 | 12.7%), Retail Trade (41 | 12.4%), Construction (38 | 11.5%), and Transportation & Warehousing (31 | 9.4%).
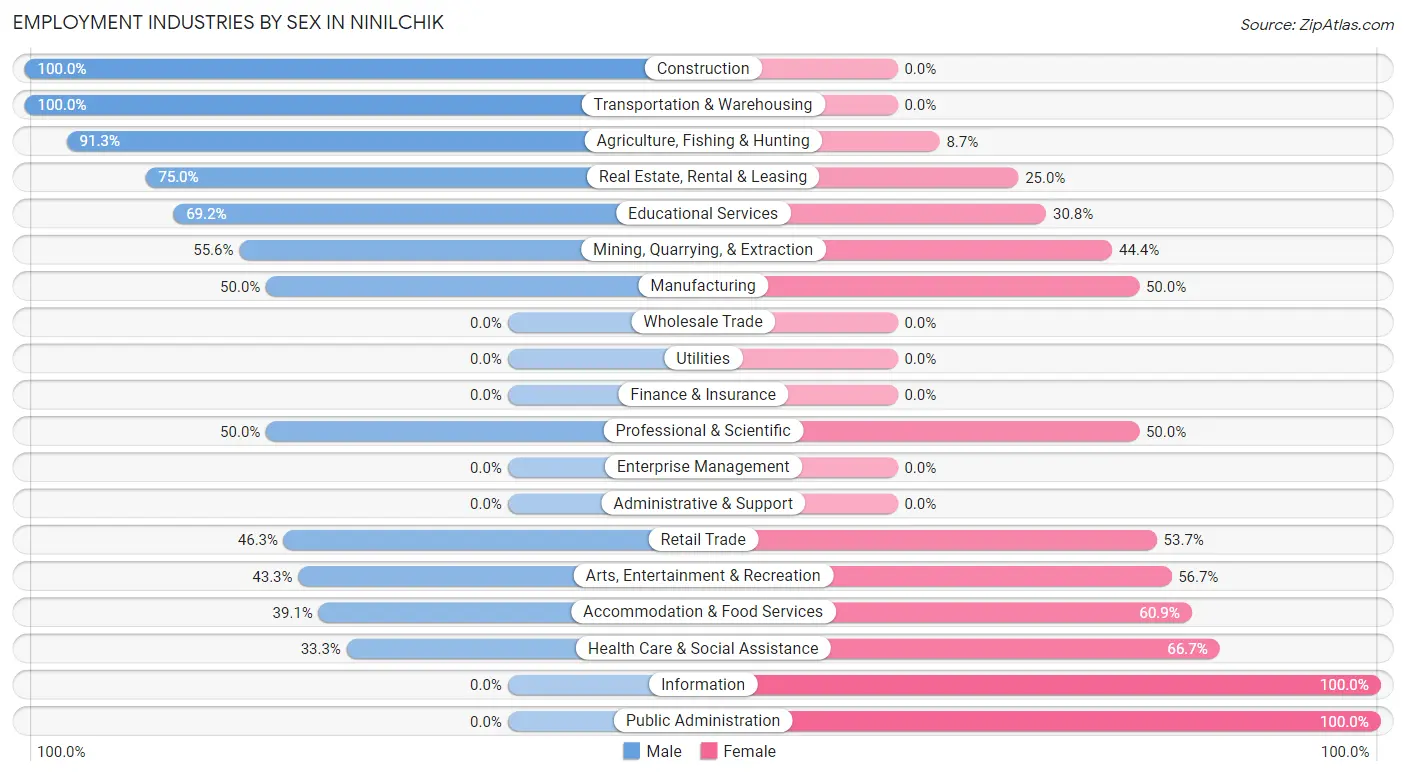
Employment Industries by Sex in Ninilchik
The Ninilchik industries that see more men than women are Construction (100.0%), Transportation & Warehousing (100.0%), and Agriculture, Fishing & Hunting (91.3%), whereas the industries that tend to have a higher number of women are Information (100.0%), Public Administration (100.0%), and Health Care & Social Assistance (66.7%).
| Industry | Male | Female |
| Agriculture, Fishing & Hunting | 42 (91.3%) | 4 (8.7%) |
| Mining, Quarrying, & Extraction | 10 (55.6%) | 8 (44.4%) |
| Construction | 38 (100.0%) | 0 (0.0%) |
| Manufacturing | 5 (50.0%) | 5 (50.0%) |
| Wholesale Trade | 0 (0.0%) | 0 (0.0%) |
| Retail Trade | 19 (46.3%) | 22 (53.7%) |
| Transportation & Warehousing | 31 (100.0%) | 0 (0.0%) |
| Utilities | 0 (0.0%) | 0 (0.0%) |
| Information | 0 (0.0%) | 4 (100.0%) |
| Finance & Insurance | 0 (0.0%) | 0 (0.0%) |
| Real Estate, Rental & Leasing | 3 (75.0%) | 1 (25.0%) |
| Professional & Scientific | 8 (50.0%) | 8 (50.0%) |
| Enterprise Management | 0 (0.0%) | 0 (0.0%) |
| Administrative & Support | 0 (0.0%) | 0 (0.0%) |
| Educational Services | 9 (69.2%) | 4 (30.8%) |
| Health Care & Social Assistance | 14 (33.3%) | 28 (66.7%) |
| Arts, Entertainment & Recreation | 13 (43.3%) | 17 (56.7%) |
| Accommodation & Food Services | 9 (39.1%) | 14 (60.9%) |
| Public Administration | 0 (0.0%) | 9 (100.0%) |
| Total | 205 (61.9%) | 126 (38.1%) |
Education in Ninilchik
School Enrollment in Ninilchik
The most common levels of schooling among the 189 students in Ninilchik are elementary school (60 | 31.8%), high school (44 | 23.3%), and middle school (32 | 16.9%).
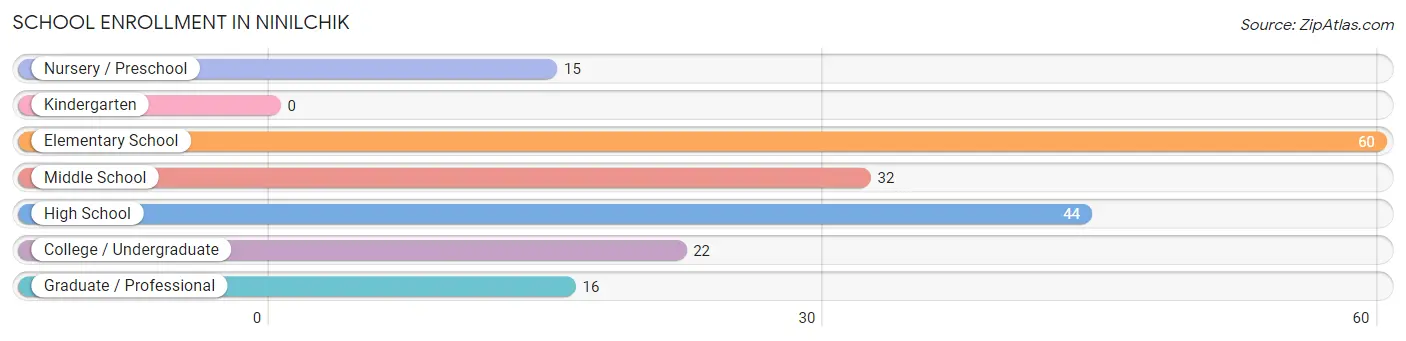
| School Level | # Students | % Students |
| Nursery / Preschool | 15 | 7.9% |
| Kindergarten | 0 | 0.0% |
| Elementary School | 60 | 31.8% |
| Middle School | 32 | 16.9% |
| High School | 44 | 23.3% |
| College / Undergraduate | 22 | 11.6% |
| Graduate / Professional | 16 | 8.5% |
| Total | 189 | 100.0% |
School Enrollment by Age by Funding Source in Ninilchik
Out of a total of 189 students who are enrolled in schools in Ninilchik, 85 (45.0%) attend a private institution, while the remaining 104 (55.0%) are enrolled in public schools. The age group of 15 to 17 year olds has the highest likelihood of being enrolled in private schools, with 17 (73.9% in the age bracket) enrolled. Conversely, the age group of 3 to 4 year olds has the lowest likelihood of being enrolled in a private school, with 15 (100.0% in the age bracket) attending a public institution.
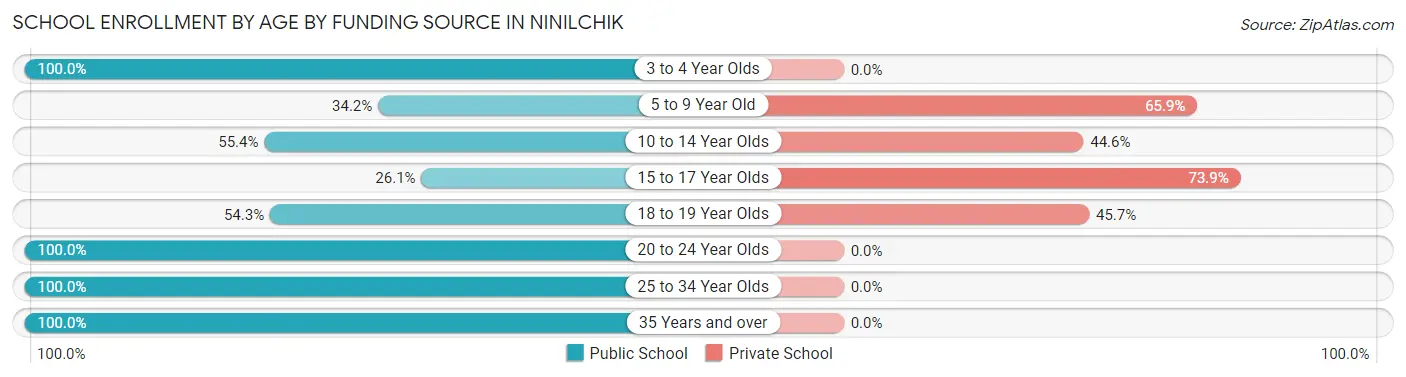
| Age Bracket | Public School | Private School |
| 3 to 4 Year Olds | 15 (100.0%) | 0 (0.0%) |
| 5 to 9 Year Old | 14 (34.2%) | 27 (65.8%) |
| 10 to 14 Year Olds | 31 (55.4%) | 25 (44.6%) |
| 15 to 17 Year Olds | 6 (26.1%) | 17 (73.9%) |
| 18 to 19 Year Olds | 19 (54.3%) | 16 (45.7%) |
| 20 to 24 Year Olds | 12 (100.0%) | 0 (0.0%) |
| 25 to 34 Year Olds | 3 (100.0%) | 0 (0.0%) |
| 35 Years and over | 4 (100.0%) | 0 (0.0%) |
| Total | 104 (55.0%) | 85 (45.0%) |
Educational Attainment by Field of Study in Ninilchik
Physical & health sciences (36 | 21.3%), communications (29 | 17.2%), business (23 | 13.6%), education (19 | 11.2%), and visual & performing arts (18 | 10.6%) are the most common fields of study among 169 individuals in Ninilchik who have obtained a bachelor's degree or higher.
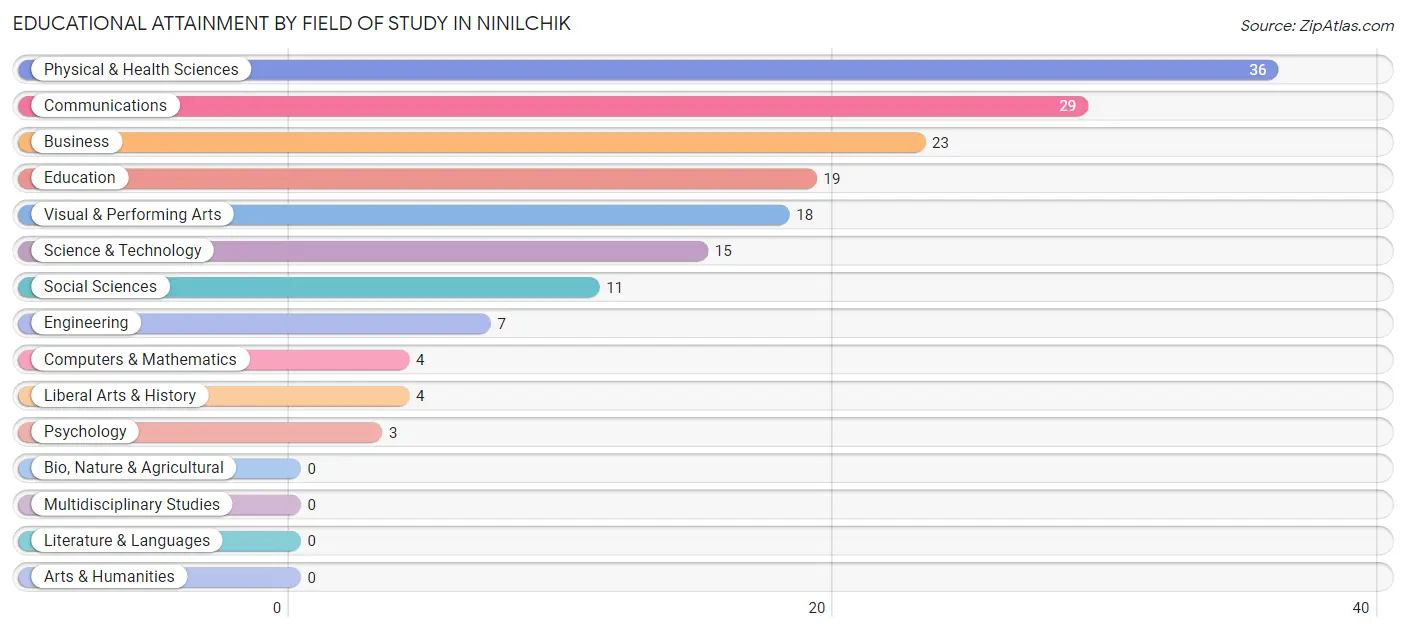
| Field of Study | # Graduates | % Graduates |
| Computers & Mathematics | 4 | 2.4% |
| Bio, Nature & Agricultural | 0 | 0.0% |
| Physical & Health Sciences | 36 | 21.3% |
| Psychology | 3 | 1.8% |
| Social Sciences | 11 | 6.5% |
| Engineering | 7 | 4.1% |
| Multidisciplinary Studies | 0 | 0.0% |
| Science & Technology | 15 | 8.9% |
| Business | 23 | 13.6% |
| Education | 19 | 11.2% |
| Literature & Languages | 0 | 0.0% |
| Liberal Arts & History | 4 | 2.4% |
| Visual & Performing Arts | 18 | 10.6% |
| Communications | 29 | 17.2% |
| Arts & Humanities | 0 | 0.0% |
| Total | 169 | 100.0% |
Transportation & Commute in Ninilchik
Vehicle Availability by Sex in Ninilchik
The most prevalent vehicle ownership categories in Ninilchik are males with 2 vehicles (78, accounting for 40.0%) and females with 2 vehicles (25, making up 66.1%).
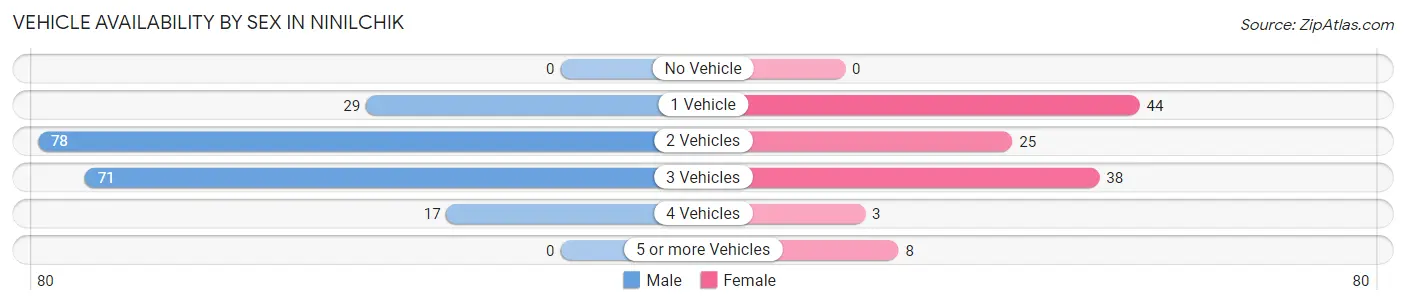
| Vehicles Available | Male | Female |
| No Vehicle | 0 (0.0%) | 0 (0.0%) |
| 1 Vehicle | 29 (14.9%) | 44 (37.3%) |
| 2 Vehicles | 78 (40.0%) | 25 (21.2%) |
| 3 Vehicles | 71 (36.4%) | 38 (32.2%) |
| 4 Vehicles | 17 (8.7%) | 3 (2.5%) |
| 5 or more Vehicles | 0 (0.0%) | 8 (6.8%) |
| Total | 195 (100.0%) | 118 (100.0%) |
Commute Time in Ninilchik
The most frequently occuring commute durations in Ninilchik are 5 to 9 minutes (64 commuters, 22.0%), 45 to 59 minutes (56 commuters, 19.2%), and 10 to 14 minutes (35 commuters, 12.0%).
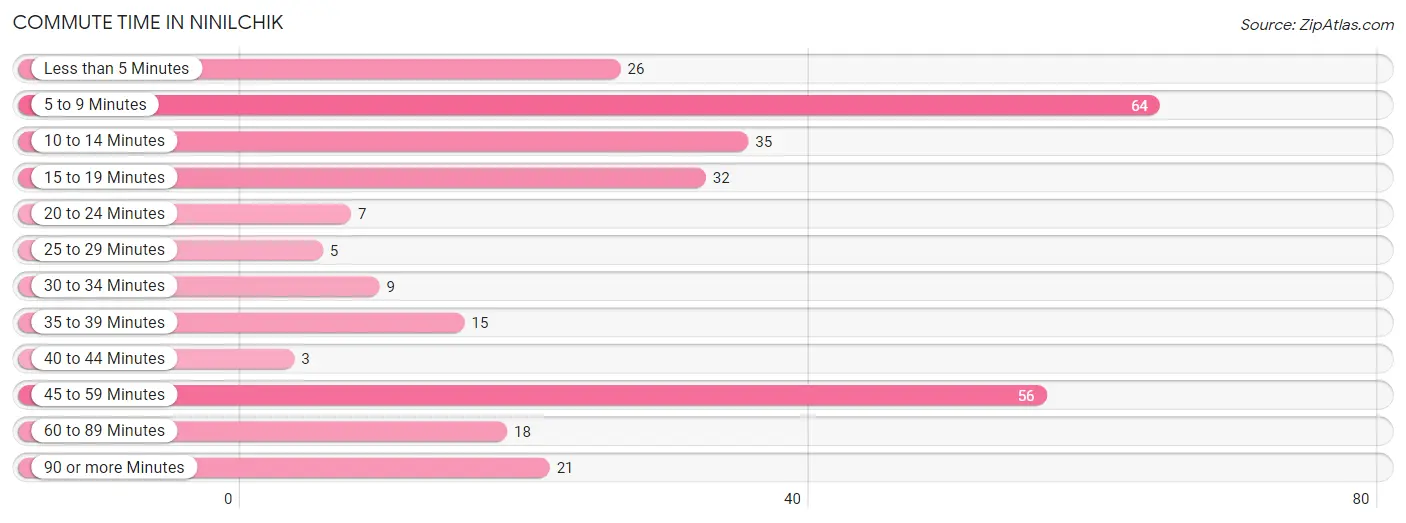
| Commute Time | # Commuters | % Commuters |
| Less than 5 Minutes | 26 | 8.9% |
| 5 to 9 Minutes | 64 | 22.0% |
| 10 to 14 Minutes | 35 | 12.0% |
| 15 to 19 Minutes | 32 | 11.0% |
| 20 to 24 Minutes | 7 | 2.4% |
| 25 to 29 Minutes | 5 | 1.7% |
| 30 to 34 Minutes | 9 | 3.1% |
| 35 to 39 Minutes | 15 | 5.1% |
| 40 to 44 Minutes | 3 | 1.0% |
| 45 to 59 Minutes | 56 | 19.2% |
| 60 to 89 Minutes | 18 | 6.2% |
| 90 or more Minutes | 21 | 7.2% |
Commute Time by Sex in Ninilchik
The most common commute times in Ninilchik are 5 to 9 minutes (45 commuters, 24.5%) for males and 15 to 19 minutes (27 commuters, 25.2%) for females.
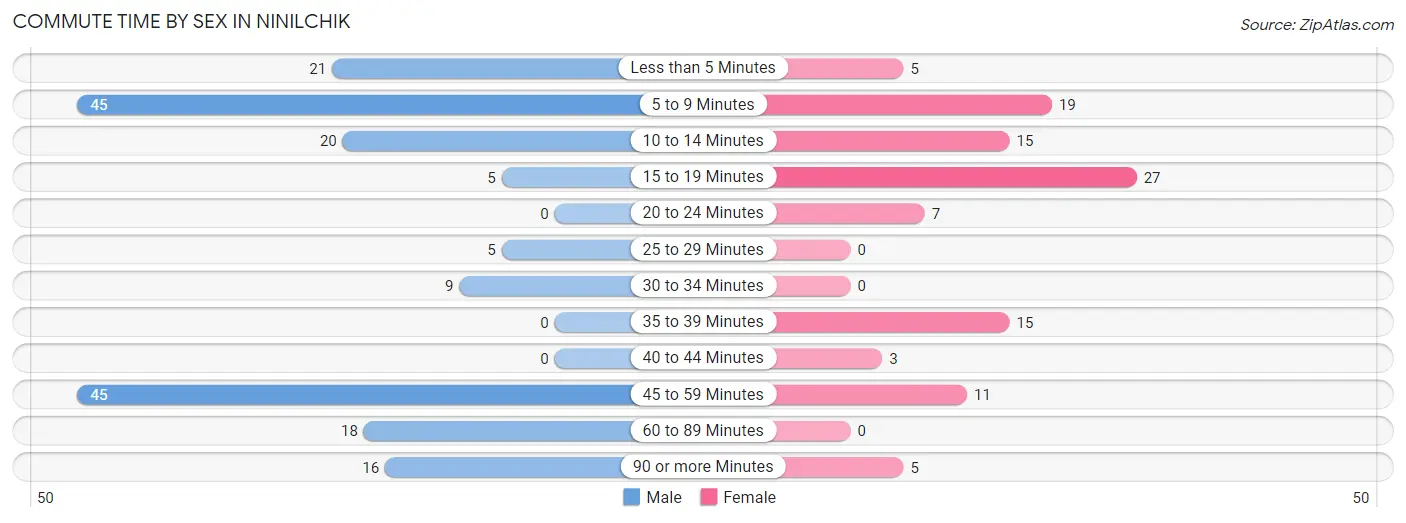
| Commute Time | Male | Female |
| Less than 5 Minutes | 21 (11.4%) | 5 (4.7%) |
| 5 to 9 Minutes | 45 (24.5%) | 19 (17.8%) |
| 10 to 14 Minutes | 20 (10.9%) | 15 (14.0%) |
| 15 to 19 Minutes | 5 (2.7%) | 27 (25.2%) |
| 20 to 24 Minutes | 0 (0.0%) | 7 (6.5%) |
| 25 to 29 Minutes | 5 (2.7%) | 0 (0.0%) |
| 30 to 34 Minutes | 9 (4.9%) | 0 (0.0%) |
| 35 to 39 Minutes | 0 (0.0%) | 15 (14.0%) |
| 40 to 44 Minutes | 0 (0.0%) | 3 (2.8%) |
| 45 to 59 Minutes | 45 (24.5%) | 11 (10.3%) |
| 60 to 89 Minutes | 18 (9.8%) | 0 (0.0%) |
| 90 or more Minutes | 16 (8.7%) | 5 (4.7%) |
Time of Departure to Work by Sex in Ninilchik
The most frequent times of departure to work in Ninilchik are 9:00 AM to 9:59 AM (38, 20.6%) for males and 8:00 AM to 8:29 AM (30, 28.0%) for females.
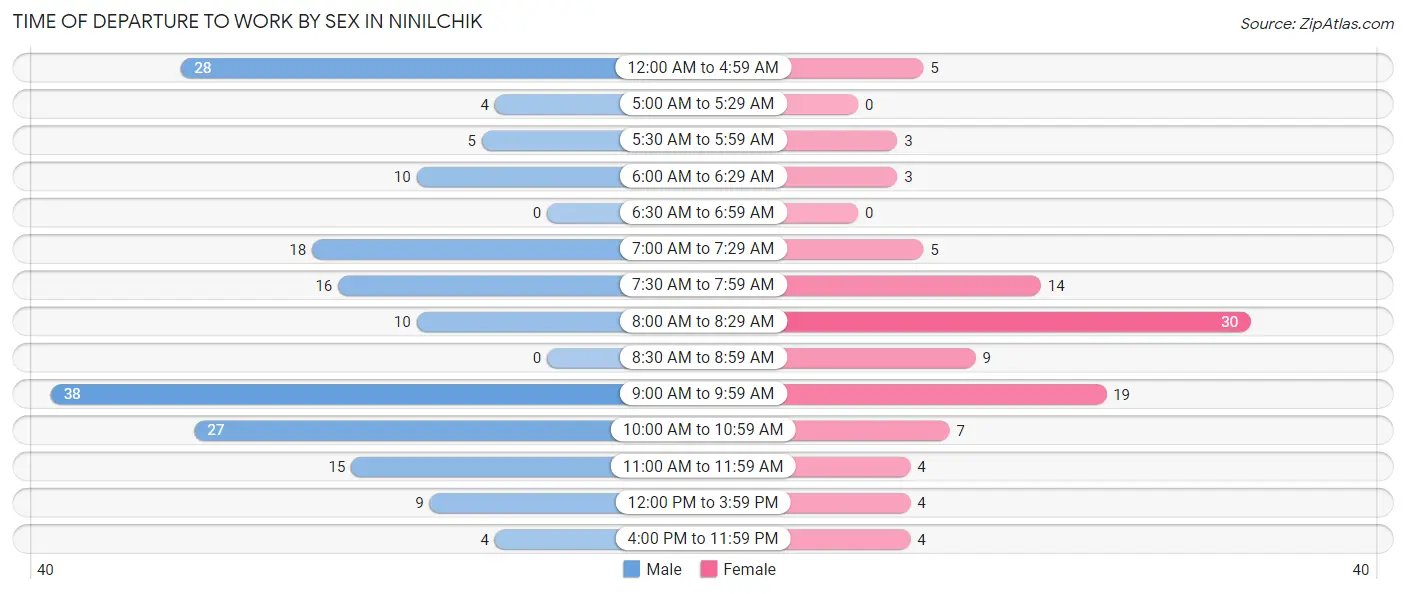
| Time of Departure | Male | Female |
| 12:00 AM to 4:59 AM | 28 (15.2%) | 5 (4.7%) |
| 5:00 AM to 5:29 AM | 4 (2.2%) | 0 (0.0%) |
| 5:30 AM to 5:59 AM | 5 (2.7%) | 3 (2.8%) |
| 6:00 AM to 6:29 AM | 10 (5.4%) | 3 (2.8%) |
| 6:30 AM to 6:59 AM | 0 (0.0%) | 0 (0.0%) |
| 7:00 AM to 7:29 AM | 18 (9.8%) | 5 (4.7%) |
| 7:30 AM to 7:59 AM | 16 (8.7%) | 14 (13.1%) |
| 8:00 AM to 8:29 AM | 10 (5.4%) | 30 (28.0%) |
| 8:30 AM to 8:59 AM | 0 (0.0%) | 9 (8.4%) |
| 9:00 AM to 9:59 AM | 38 (20.6%) | 19 (17.8%) |
| 10:00 AM to 10:59 AM | 27 (14.7%) | 7 (6.5%) |
| 11:00 AM to 11:59 AM | 15 (8.2%) | 4 (3.7%) |
| 12:00 PM to 3:59 PM | 9 (4.9%) | 4 (3.7%) |
| 4:00 PM to 11:59 PM | 4 (2.2%) | 4 (3.7%) |
| Total | 184 (100.0%) | 107 (100.0%) |
Housing Occupancy in Ninilchik
Occupancy by Ownership in Ninilchik
Of the total 408 dwellings in Ninilchik, owner-occupied units account for 361 (88.5%), while renter-occupied units make up 47 (11.5%).
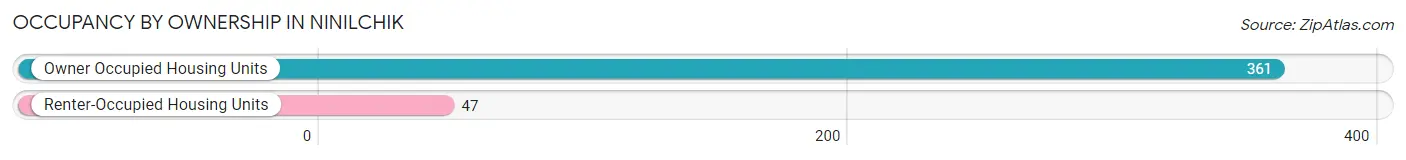
| Occupancy | # Housing Units | % Housing Units |
| Owner Occupied Housing Units | 361 | 88.5% |
| Renter-Occupied Housing Units | 47 | 11.5% |
| Total Occupied Housing Units | 408 | 100.0% |
Occupancy by Household Size in Ninilchik
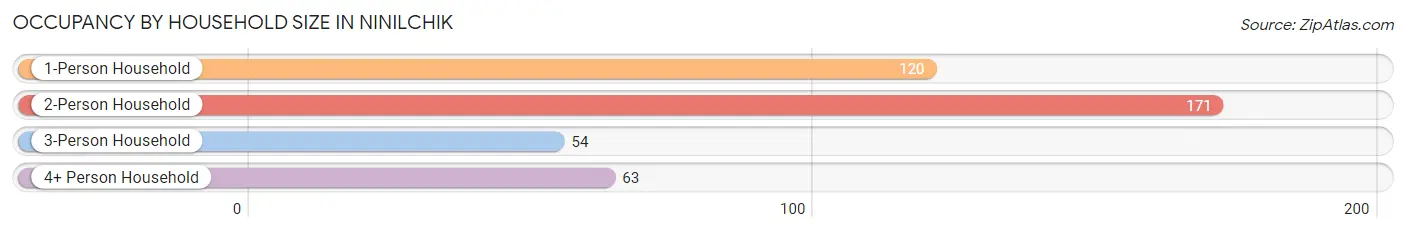
| Household Size | # Housing Units | % Housing Units |
| 1-Person Household | 120 | 29.4% |
| 2-Person Household | 171 | 41.9% |
| 3-Person Household | 54 | 13.2% |
| 4+ Person Household | 63 | 15.4% |
| Total Housing Units | 408 | 100.0% |
Occupancy by Ownership by Household Size in Ninilchik
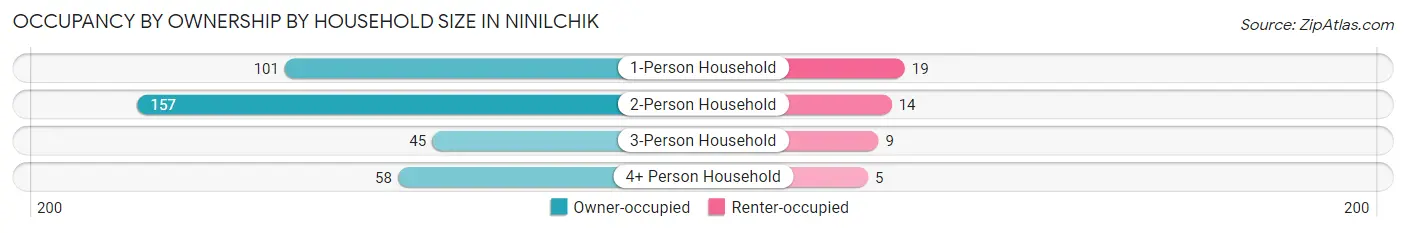
| Household Size | Owner-occupied | Renter-occupied |
| 1-Person Household | 101 (84.2%) | 19 (15.8%) |
| 2-Person Household | 157 (91.8%) | 14 (8.2%) |
| 3-Person Household | 45 (83.3%) | 9 (16.7%) |
| 4+ Person Household | 58 (92.1%) | 5 (7.9%) |
| Total Housing Units | 361 (88.5%) | 47 (11.5%) |
Occupancy by Educational Attainment in Ninilchik
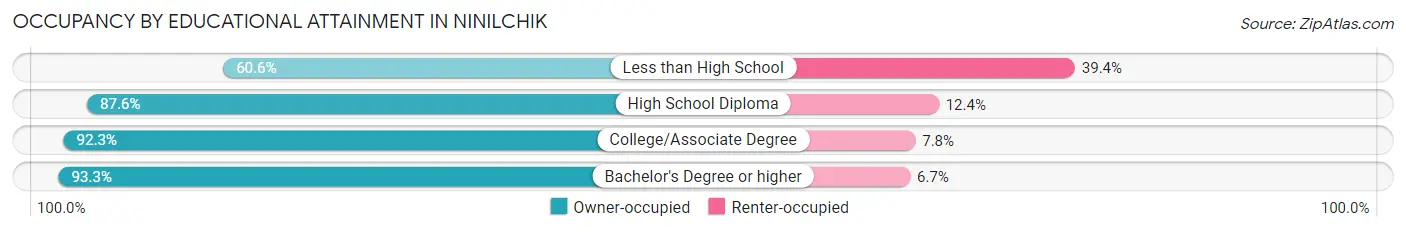
| Household Size | Owner-occupied | Renter-occupied |
| Less than High School | 20 (60.6%) | 13 (39.4%) |
| High School Diploma | 113 (87.6%) | 16 (12.4%) |
| College/Associate Degree | 131 (92.2%) | 11 (7.7%) |
| Bachelor's Degree or higher | 97 (93.3%) | 7 (6.7%) |
Occupancy by Age of Householder in Ninilchik
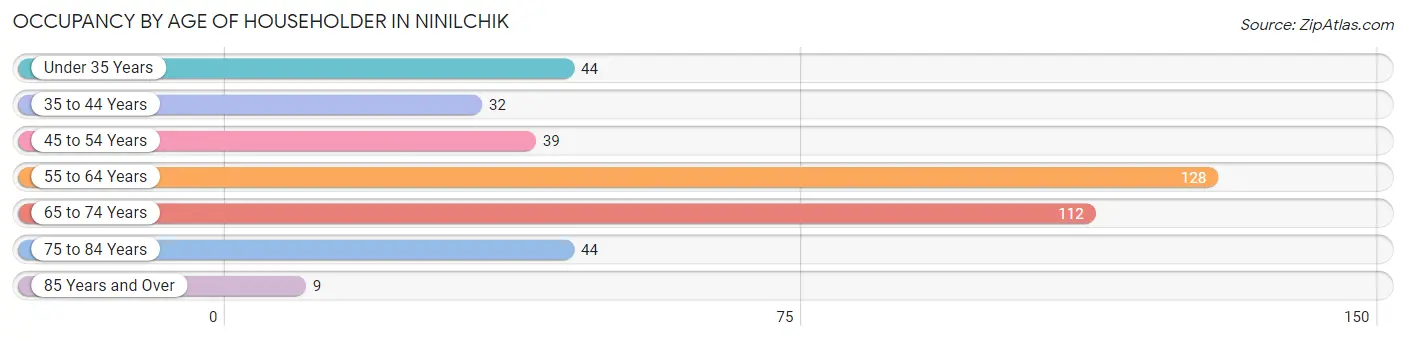
| Age Bracket | # Households | % Households |
| Under 35 Years | 44 | 10.8% |
| 35 to 44 Years | 32 | 7.8% |
| 45 to 54 Years | 39 | 9.6% |
| 55 to 64 Years | 128 | 31.4% |
| 65 to 74 Years | 112 | 27.5% |
| 75 to 84 Years | 44 | 10.8% |
| 85 Years and Over | 9 | 2.2% |
| Total | 408 | 100.0% |
Housing Finances in Ninilchik
Median Income by Occupancy in Ninilchik
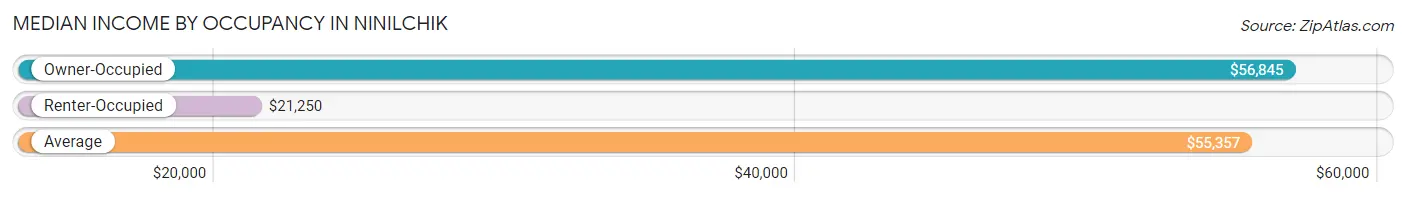
| Occupancy Type | # Households | Median Income |
| Owner-Occupied | 361 (88.5%) | $56,845 |
| Renter-Occupied | 47 (11.5%) | $21,250 |
| Average | 408 (100.0%) | $55,357 |
Occupancy by Householder Income Bracket in Ninilchik
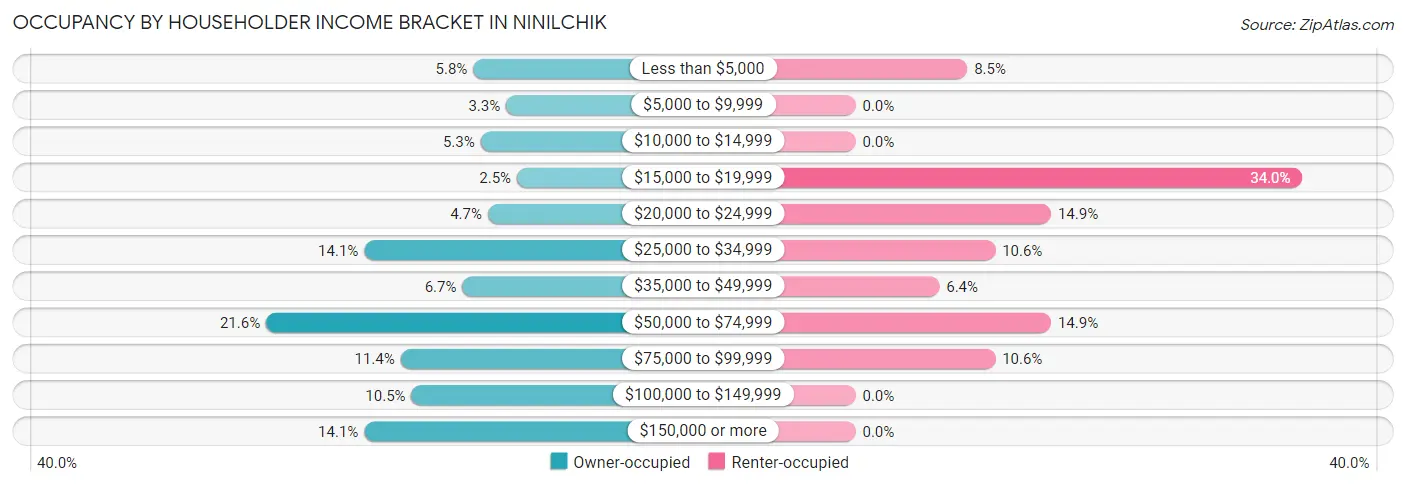
| Income Bracket | Owner-occupied | Renter-occupied |
| Less than $5,000 | 21 (5.8%) | 4 (8.5%) |
| $5,000 to $9,999 | 12 (3.3%) | 0 (0.0%) |
| $10,000 to $14,999 | 19 (5.3%) | 0 (0.0%) |
| $15,000 to $19,999 | 9 (2.5%) | 16 (34.0%) |
| $20,000 to $24,999 | 17 (4.7%) | 7 (14.9%) |
| $25,000 to $34,999 | 51 (14.1%) | 5 (10.6%) |
| $35,000 to $49,999 | 24 (6.7%) | 3 (6.4%) |
| $50,000 to $74,999 | 78 (21.6%) | 7 (14.9%) |
| $75,000 to $99,999 | 41 (11.4%) | 5 (10.6%) |
| $100,000 to $149,999 | 38 (10.5%) | 0 (0.0%) |
| $150,000 or more | 51 (14.1%) | 0 (0.0%) |
| Total | 361 (100.0%) | 47 (100.0%) |
Monthly Housing Cost Tiers in Ninilchik
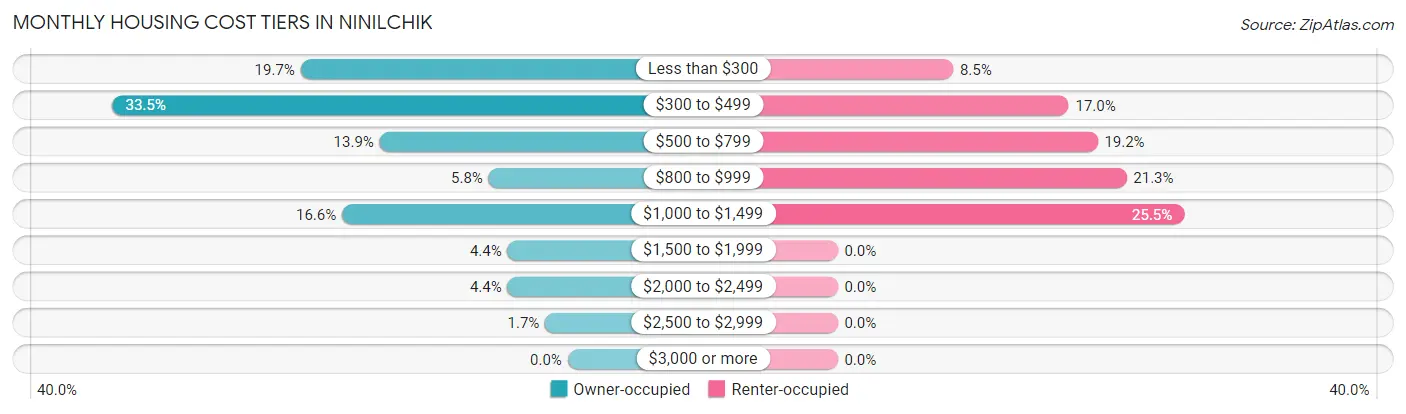
| Monthly Cost | Owner-occupied | Renter-occupied |
| Less than $300 | 71 (19.7%) | 4 (8.5%) |
| $300 to $499 | 121 (33.5%) | 8 (17.0%) |
| $500 to $799 | 50 (13.9%) | 9 (19.2%) |
| $800 to $999 | 21 (5.8%) | 10 (21.3%) |
| $1,000 to $1,499 | 60 (16.6%) | 12 (25.5%) |
| $1,500 to $1,999 | 16 (4.4%) | 0 (0.0%) |
| $2,000 to $2,499 | 16 (4.4%) | 0 (0.0%) |
| $2,500 to $2,999 | 6 (1.7%) | 0 (0.0%) |
| $3,000 or more | 0 (0.0%) | 0 (0.0%) |
| Total | 361 (100.0%) | 47 (100.0%) |
Physical Housing Characteristics in Ninilchik
Housing Structures in Ninilchik
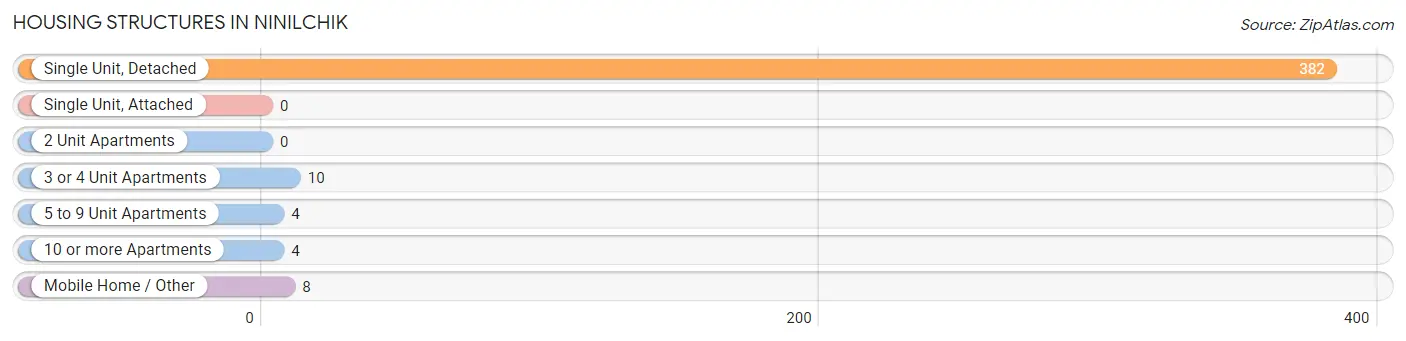
| Structure Type | # Housing Units | % Housing Units |
| Single Unit, Detached | 382 | 93.6% |
| Single Unit, Attached | 0 | 0.0% |
| 2 Unit Apartments | 0 | 0.0% |
| 3 or 4 Unit Apartments | 10 | 2.5% |
| 5 to 9 Unit Apartments | 4 | 1.0% |
| 10 or more Apartments | 4 | 1.0% |
| Mobile Home / Other | 8 | 2.0% |
| Total | 408 | 100.0% |
Housing Structures by Occupancy in Ninilchik
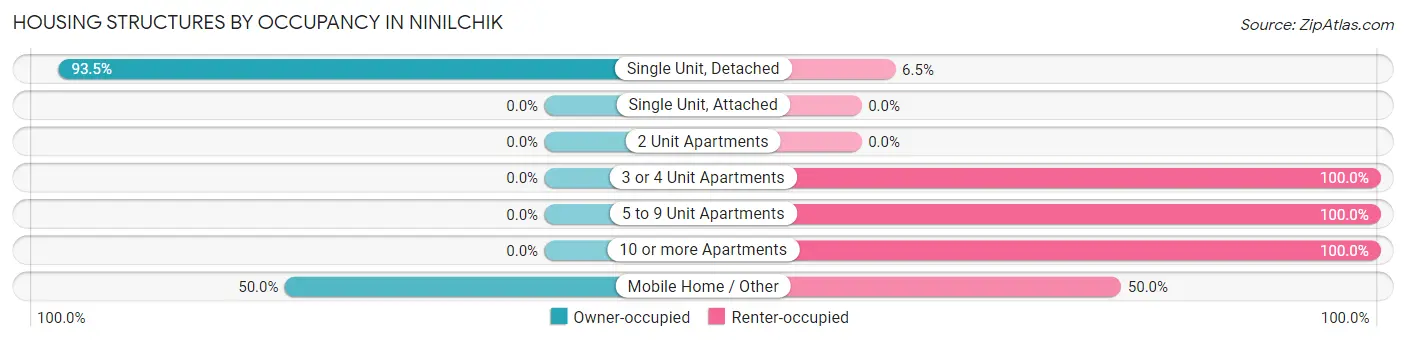
| Structure Type | Owner-occupied | Renter-occupied |
| Single Unit, Detached | 357 (93.5%) | 25 (6.5%) |
| Single Unit, Attached | 0 (0.0%) | 0 (0.0%) |
| 2 Unit Apartments | 0 (0.0%) | 0 (0.0%) |
| 3 or 4 Unit Apartments | 0 (0.0%) | 10 (100.0%) |
| 5 to 9 Unit Apartments | 0 (0.0%) | 4 (100.0%) |
| 10 or more Apartments | 0 (0.0%) | 4 (100.0%) |
| Mobile Home / Other | 4 (50.0%) | 4 (50.0%) |
| Total | 361 (88.5%) | 47 (11.5%) |
Housing Structures by Number of Rooms in Ninilchik
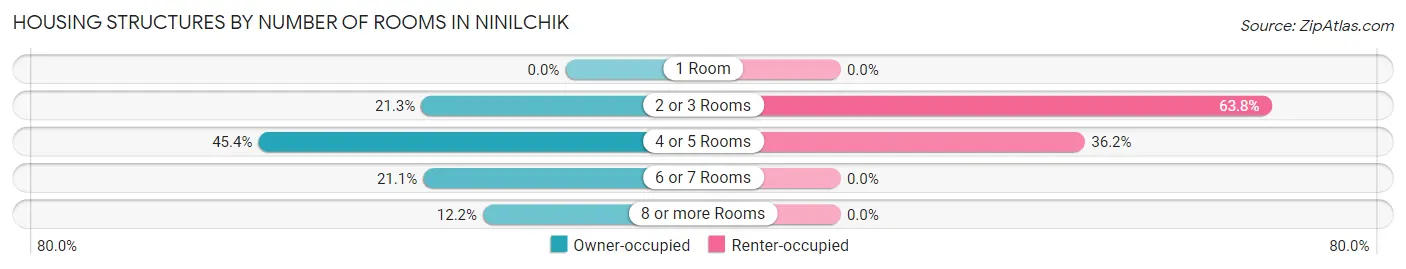
| Number of Rooms | Owner-occupied | Renter-occupied |
| 1 Room | 0 (0.0%) | 0 (0.0%) |
| 2 or 3 Rooms | 77 (21.3%) | 30 (63.8%) |
| 4 or 5 Rooms | 164 (45.4%) | 17 (36.2%) |
| 6 or 7 Rooms | 76 (21.0%) | 0 (0.0%) |
| 8 or more Rooms | 44 (12.2%) | 0 (0.0%) |
| Total | 361 (100.0%) | 47 (100.0%) |
Housing Structure by Heating Type in Ninilchik
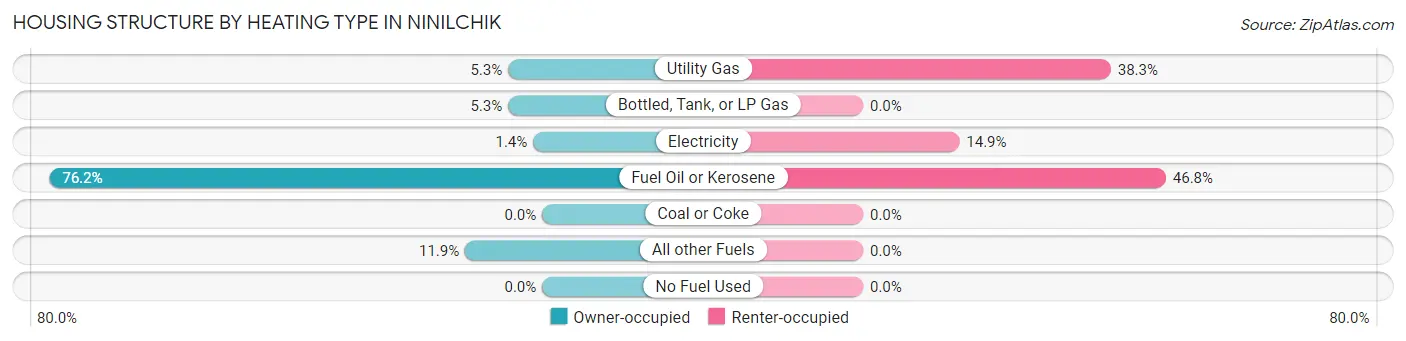
| Heating Type | Owner-occupied | Renter-occupied |
| Utility Gas | 19 (5.3%) | 18 (38.3%) |
| Bottled, Tank, or LP Gas | 19 (5.3%) | 0 (0.0%) |
| Electricity | 5 (1.4%) | 7 (14.9%) |
| Fuel Oil or Kerosene | 275 (76.2%) | 22 (46.8%) |
| Coal or Coke | 0 (0.0%) | 0 (0.0%) |
| All other Fuels | 43 (11.9%) | 0 (0.0%) |
| No Fuel Used | 0 (0.0%) | 0 (0.0%) |
| Total | 361 (100.0%) | 47 (100.0%) |
Household Vehicle Usage in Ninilchik
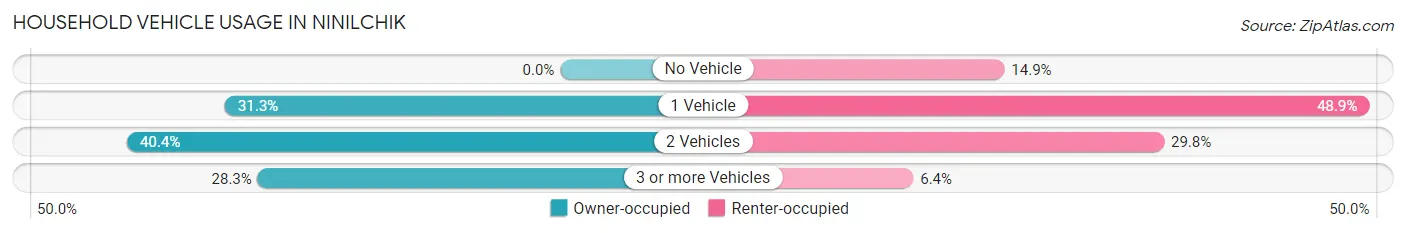
| Vehicles per Household | Owner-occupied | Renter-occupied |
| No Vehicle | 0 (0.0%) | 7 (14.9%) |
| 1 Vehicle | 113 (31.3%) | 23 (48.9%) |
| 2 Vehicles | 146 (40.4%) | 14 (29.8%) |
| 3 or more Vehicles | 102 (28.2%) | 3 (6.4%) |
| Total | 361 (100.0%) | 47 (100.0%) |
Real Estate & Mortgages in Ninilchik
Real Estate and Mortgage Overview in Ninilchik
| Characteristic | Without Mortgage | With Mortgage |
| Housing Units | 251 | 110 |
| Median Property Value | $229,100 | $248,400 |
| Median Household Income | $56,607 | $18 |
| Monthly Housing Costs | $380 | $0 |
| Real Estate Taxes | $1,394 | $24 |
Property Value by Mortgage Status in Ninilchik
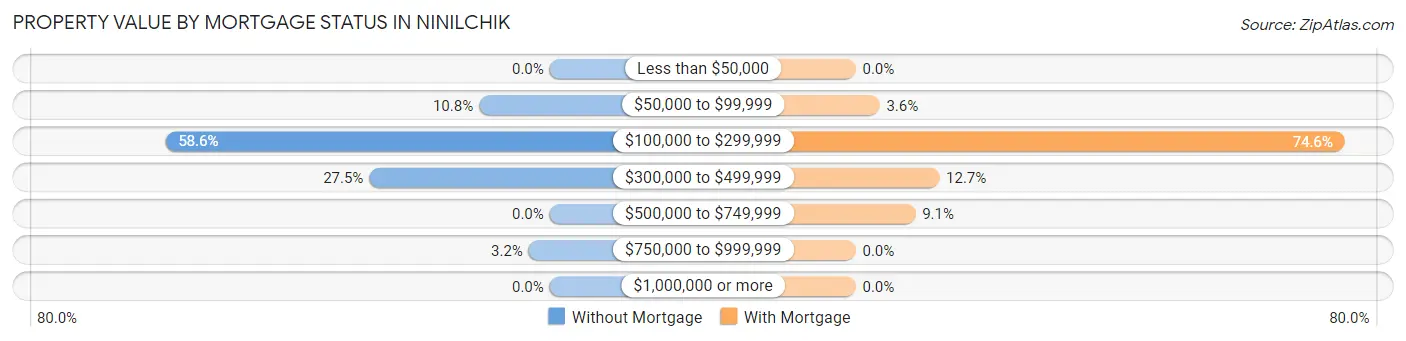
| Property Value | Without Mortgage | With Mortgage |
| Less than $50,000 | 0 (0.0%) | 0 (0.0%) |
| $50,000 to $99,999 | 27 (10.8%) | 4 (3.6%) |
| $100,000 to $299,999 | 147 (58.6%) | 82 (74.6%) |
| $300,000 to $499,999 | 69 (27.5%) | 14 (12.7%) |
| $500,000 to $749,999 | 0 (0.0%) | 10 (9.1%) |
| $750,000 to $999,999 | 8 (3.2%) | 0 (0.0%) |
| $1,000,000 or more | 0 (0.0%) | 0 (0.0%) |
| Total | 251 (100.0%) | 110 (100.0%) |
Household Income by Mortgage Status in Ninilchik
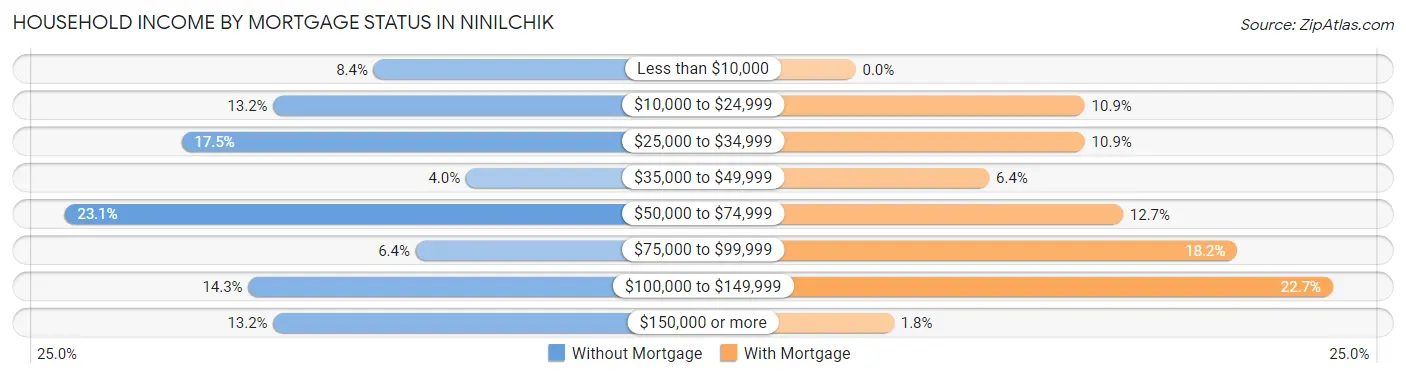
| Household Income | Without Mortgage | With Mortgage |
| Less than $10,000 | 21 (8.4%) | 0 (0.0%) |
| $10,000 to $24,999 | 33 (13.2%) | 12 (10.9%) |
| $25,000 to $34,999 | 44 (17.5%) | 12 (10.9%) |
| $35,000 to $49,999 | 10 (4.0%) | 7 (6.4%) |
| $50,000 to $74,999 | 58 (23.1%) | 14 (12.7%) |
| $75,000 to $99,999 | 16 (6.4%) | 20 (18.2%) |
| $100,000 to $149,999 | 36 (14.3%) | 25 (22.7%) |
| $150,000 or more | 33 (13.2%) | 2 (1.8%) |
| Total | 251 (100.0%) | 110 (100.0%) |
Property Value to Household Income Ratio in Ninilchik
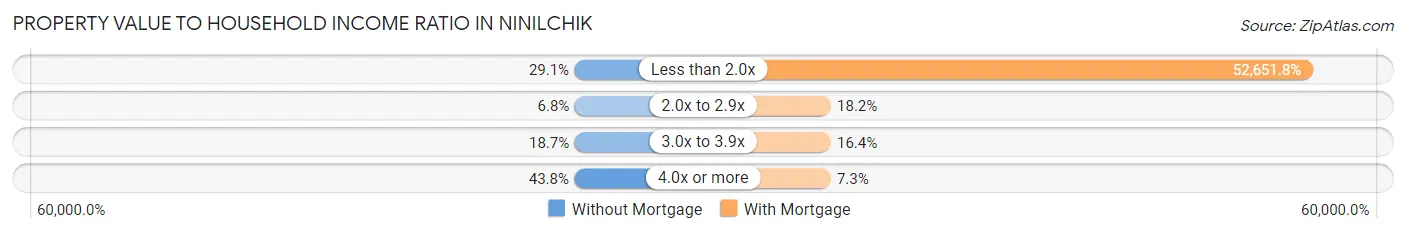
| Value-to-Income Ratio | Without Mortgage | With Mortgage |
| Less than 2.0x | 73 (29.1%) | 57,917 (52,651.8%) |
| 2.0x to 2.9x | 17 (6.8%) | 20 (18.2%) |
| 3.0x to 3.9x | 47 (18.7%) | 18 (16.4%) |
| 4.0x or more | 110 (43.8%) | 8 (7.3%) |
| Total | 251 (100.0%) | 110 (100.0%) |
Real Estate Taxes by Mortgage Status in Ninilchik
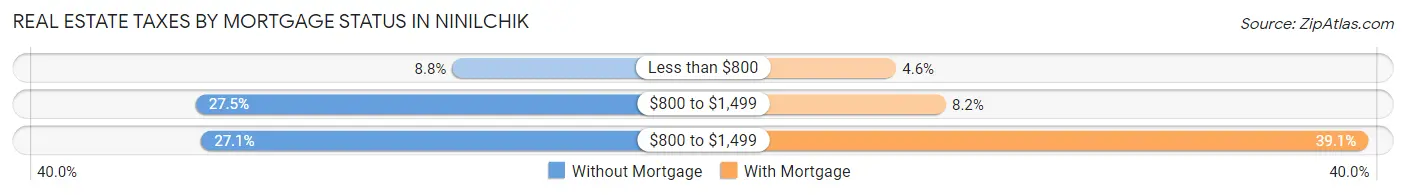
| Property Taxes | Without Mortgage | With Mortgage |
| Less than $800 | 22 (8.8%) | 5 (4.5%) |
| $800 to $1,499 | 69 (27.5%) | 9 (8.2%) |
| $800 to $1,499 | 68 (27.1%) | 43 (39.1%) |
| Total | 251 (100.0%) | 110 (100.0%) |
Health & Disability in Ninilchik
Health Insurance Coverage by Age in Ninilchik
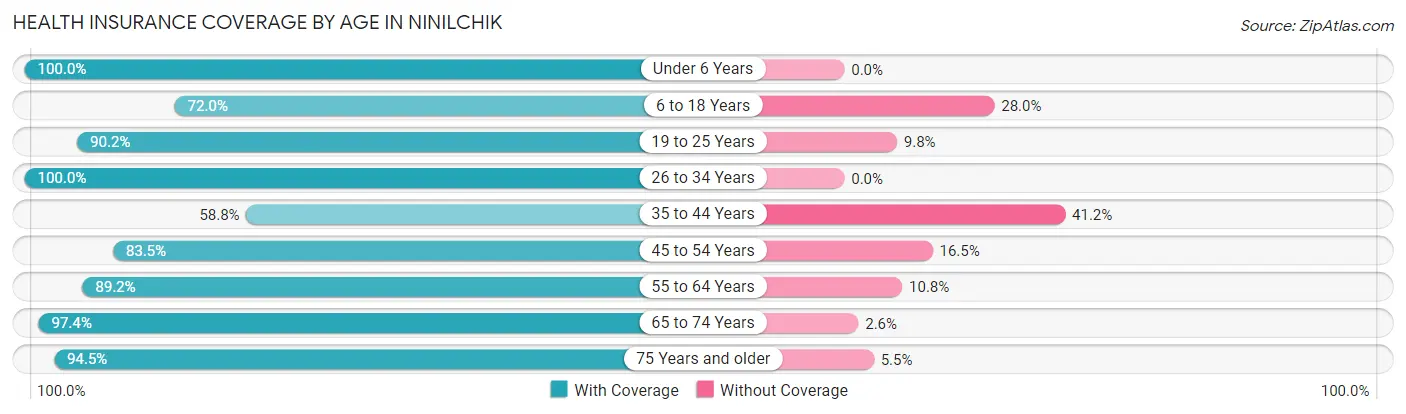
| Age Bracket | With Coverage | Without Coverage |
| Under 6 Years | 98 (100.0%) | 0 (0.0%) |
| 6 to 18 Years | 103 (72.0%) | 40 (28.0%) |
| 19 to 25 Years | 46 (90.2%) | 5 (9.8%) |
| 26 to 34 Years | 95 (100.0%) | 0 (0.0%) |
| 35 to 44 Years | 40 (58.8%) | 28 (41.2%) |
| 45 to 54 Years | 66 (83.5%) | 13 (16.5%) |
| 55 to 64 Years | 182 (89.2%) | 22 (10.8%) |
| 65 to 74 Years | 149 (97.4%) | 4 (2.6%) |
| 75 Years and older | 69 (94.5%) | 4 (5.5%) |
| Total | 848 (88.0%) | 116 (12.0%) |
Health Insurance Coverage by Citizenship Status in Ninilchik
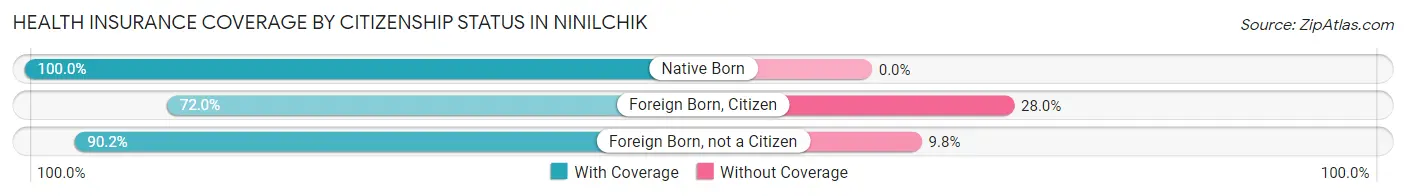
| Citizenship Status | With Coverage | Without Coverage |
| Native Born | 98 (100.0%) | 0 (0.0%) |
| Foreign Born, Citizen | 103 (72.0%) | 40 (28.0%) |
| Foreign Born, not a Citizen | 46 (90.2%) | 5 (9.8%) |
Health Insurance Coverage by Household Income in Ninilchik
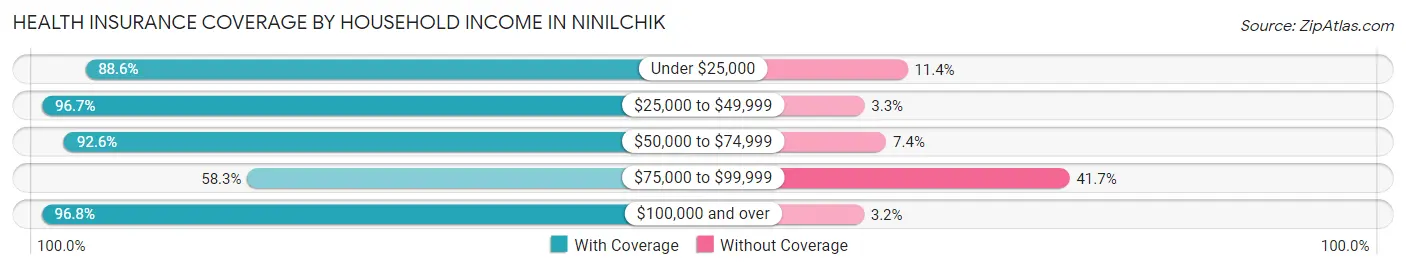
| Household Income | With Coverage | Without Coverage |
| Under $25,000 | 156 (88.6%) | 20 (11.4%) |
| $25,000 to $49,999 | 147 (96.7%) | 5 (3.3%) |
| $50,000 to $74,999 | 176 (92.6%) | 14 (7.4%) |
| $75,000 to $99,999 | 95 (58.3%) | 68 (41.7%) |
| $100,000 and over | 274 (96.8%) | 9 (3.2%) |
Public vs Private Health Insurance Coverage by Age in Ninilchik
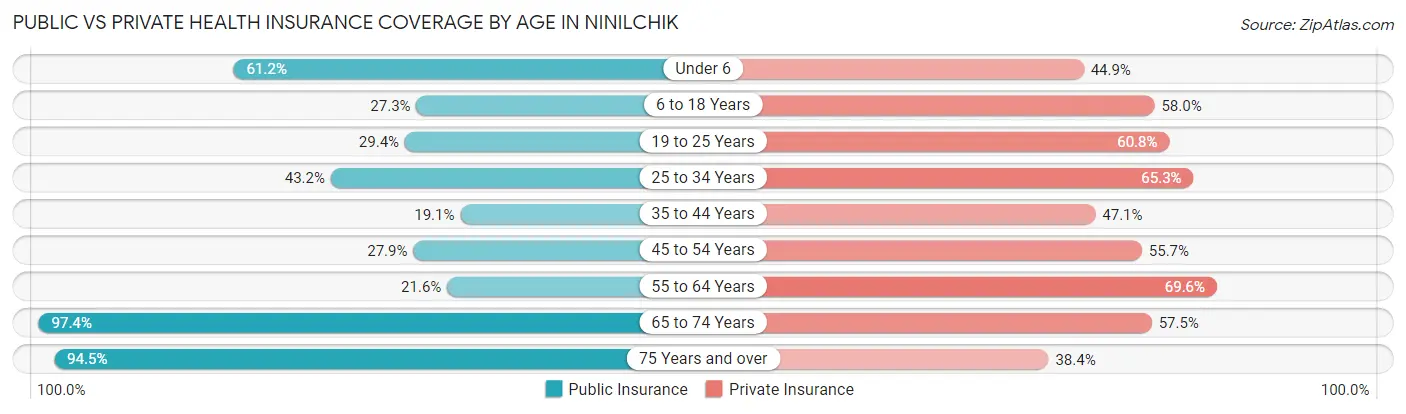
| Age Bracket | Public Insurance | Private Insurance |
| Under 6 | 60 (61.2%) | 44 (44.9%) |
| 6 to 18 Years | 39 (27.3%) | 83 (58.0%) |
| 19 to 25 Years | 15 (29.4%) | 31 (60.8%) |
| 25 to 34 Years | 41 (43.2%) | 62 (65.3%) |
| 35 to 44 Years | 13 (19.1%) | 32 (47.1%) |
| 45 to 54 Years | 22 (27.9%) | 44 (55.7%) |
| 55 to 64 Years | 44 (21.6%) | 142 (69.6%) |
| 65 to 74 Years | 149 (97.4%) | 88 (57.5%) |
| 75 Years and over | 69 (94.5%) | 28 (38.4%) |
| Total | 452 (46.9%) | 554 (57.5%) |
Disability Status by Sex by Age in Ninilchik
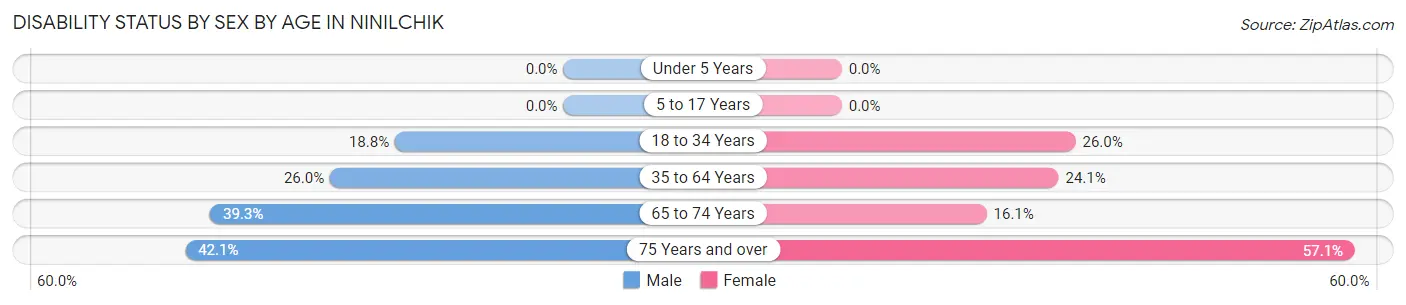
| Age Bracket | Male | Female |
| Under 5 Years | 0 (0.0%) | 0 (0.0%) |
| 5 to 17 Years | 0 (0.0%) | 0 (0.0%) |
| 18 to 34 Years | 18 (18.8%) | 19 (26.0%) |
| 35 to 64 Years | 46 (26.0%) | 42 (24.1%) |
| 65 to 74 Years | 48 (39.3%) | 5 (16.1%) |
| 75 Years and over | 16 (42.1%) | 20 (57.1%) |
Disability Class by Sex by Age in Ninilchik
Disability Class: Hearing Difficulty
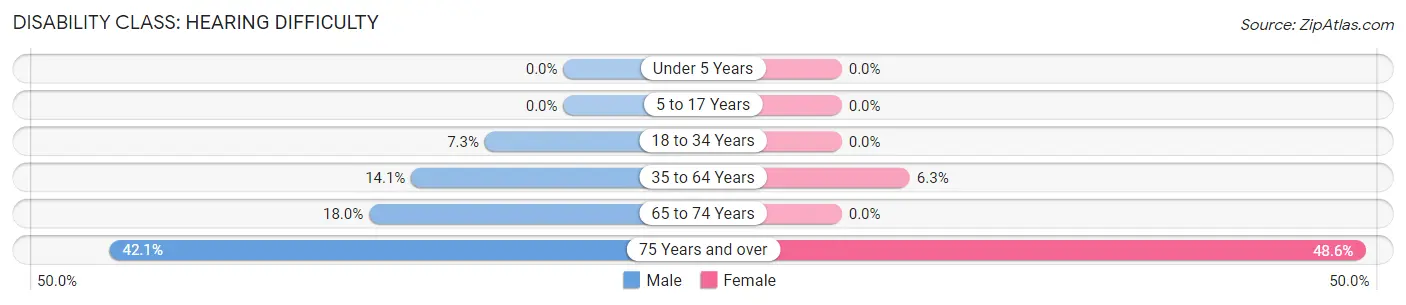
| Age Bracket | Male | Female |
| Under 5 Years | 0 (0.0%) | 0 (0.0%) |
| 5 to 17 Years | 0 (0.0%) | 0 (0.0%) |
| 18 to 34 Years | 7 (7.3%) | 0 (0.0%) |
| 35 to 64 Years | 25 (14.1%) | 11 (6.3%) |
| 65 to 74 Years | 22 (18.0%) | 0 (0.0%) |
| 75 Years and over | 16 (42.1%) | 17 (48.6%) |
Disability Class: Vision Difficulty
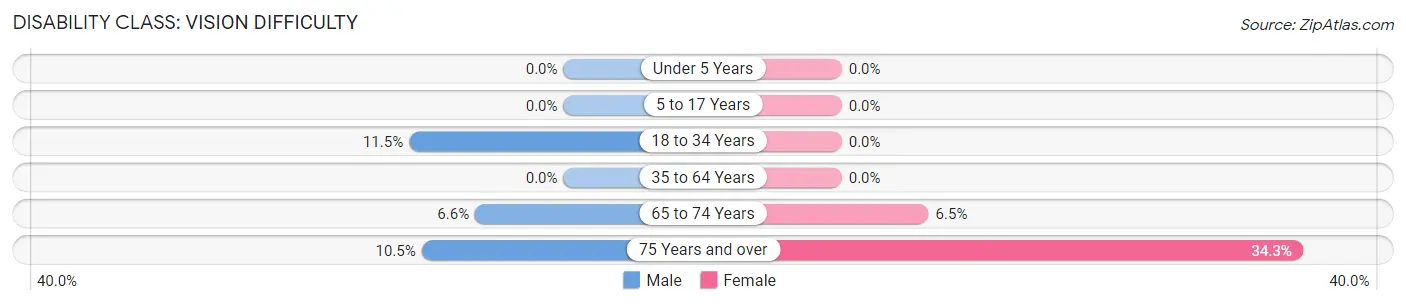
| Age Bracket | Male | Female |
| Under 5 Years | 0 (0.0%) | 0 (0.0%) |
| 5 to 17 Years | 0 (0.0%) | 0 (0.0%) |
| 18 to 34 Years | 11 (11.5%) | 0 (0.0%) |
| 35 to 64 Years | 0 (0.0%) | 0 (0.0%) |
| 65 to 74 Years | 8 (6.6%) | 2 (6.5%) |
| 75 Years and over | 4 (10.5%) | 12 (34.3%) |
Disability Class: Cognitive Difficulty
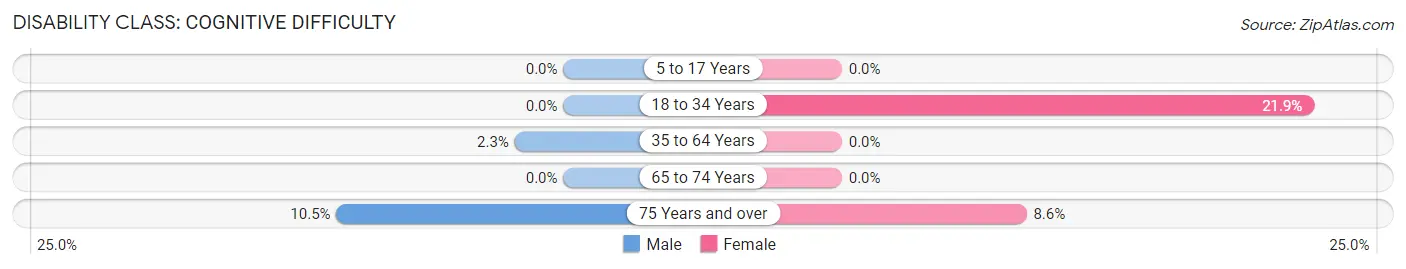
| Age Bracket | Male | Female |
| 5 to 17 Years | 0 (0.0%) | 0 (0.0%) |
| 18 to 34 Years | 0 (0.0%) | 16 (21.9%) |
| 35 to 64 Years | 4 (2.3%) | 0 (0.0%) |
| 65 to 74 Years | 0 (0.0%) | 0 (0.0%) |
| 75 Years and over | 4 (10.5%) | 3 (8.6%) |
Disability Class: Ambulatory Difficulty
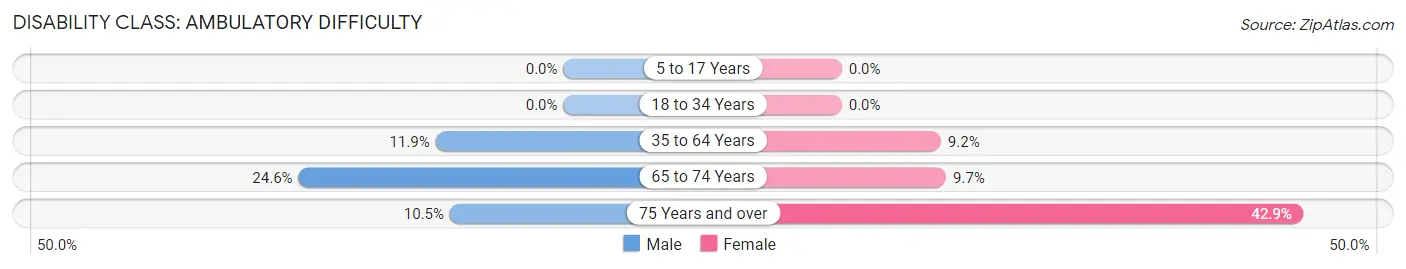
| Age Bracket | Male | Female |
| 5 to 17 Years | 0 (0.0%) | 0 (0.0%) |
| 18 to 34 Years | 0 (0.0%) | 0 (0.0%) |
| 35 to 64 Years | 21 (11.9%) | 16 (9.2%) |
| 65 to 74 Years | 30 (24.6%) | 3 (9.7%) |
| 75 Years and over | 4 (10.5%) | 15 (42.9%) |
Disability Class: Self-Care Difficulty
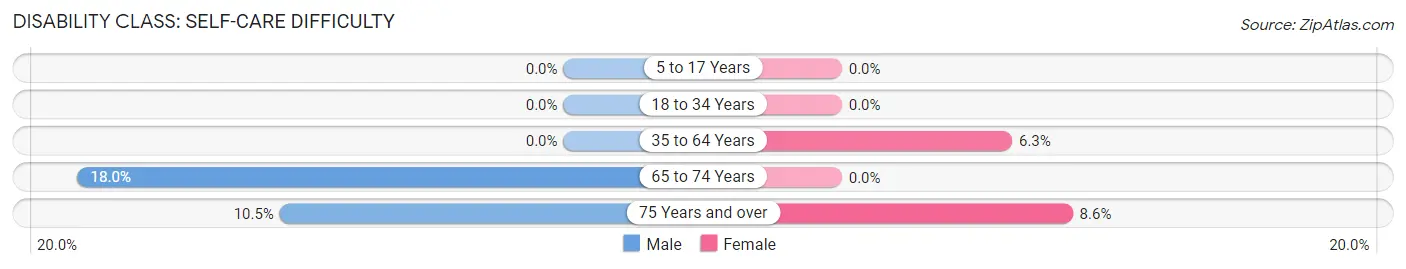
| Age Bracket | Male | Female |
| 5 to 17 Years | 0 (0.0%) | 0 (0.0%) |
| 18 to 34 Years | 0 (0.0%) | 0 (0.0%) |
| 35 to 64 Years | 0 (0.0%) | 11 (6.3%) |
| 65 to 74 Years | 22 (18.0%) | 0 (0.0%) |
| 75 Years and over | 4 (10.5%) | 3 (8.6%) |
Technology Access in Ninilchik
Computing Device Access in Ninilchik
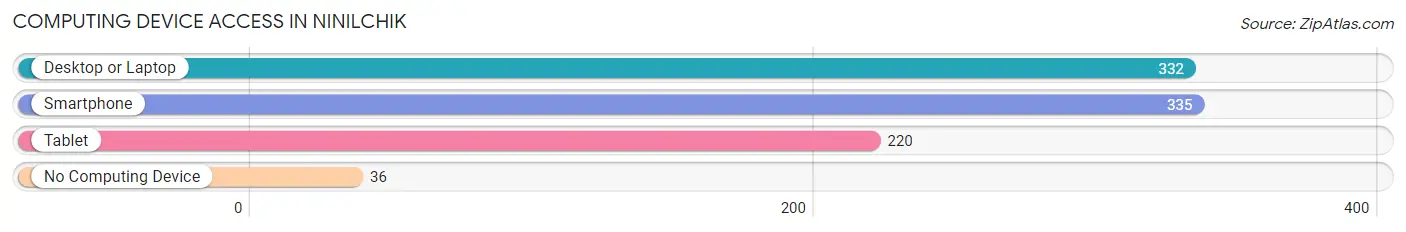
| Device Type | # Households | % Households |
| Desktop or Laptop | 332 | 81.4% |
| Smartphone | 335 | 82.1% |
| Tablet | 220 | 53.9% |
| No Computing Device | 36 | 8.8% |
| Total | 408 | 100.0% |
Internet Access in Ninilchik
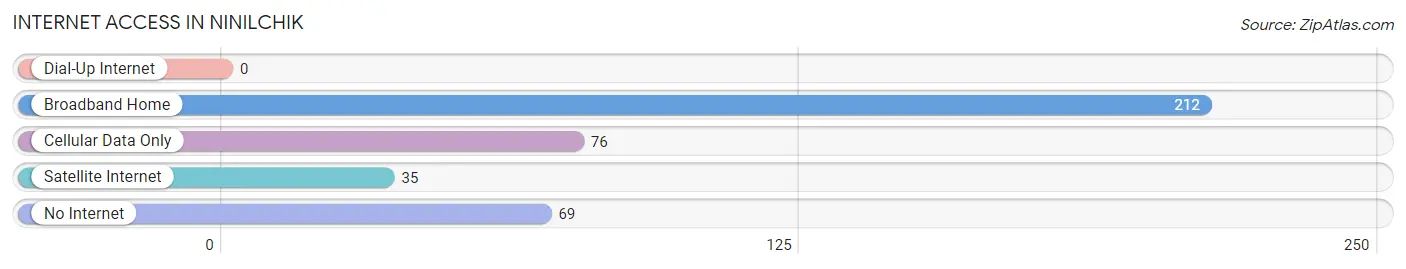
| Internet Type | # Households | % Households |
| Dial-Up Internet | 0 | 0.0% |
| Broadband Home | 212 | 52.0% |
| Cellular Data Only | 76 | 18.6% |
| Satellite Internet | 35 | 8.6% |
| No Internet | 69 | 16.9% |
| Total | 408 | 100.0% |
Ninilchik Summary
Ninilchik, Alaska is a small unincorporated community located on the Kenai Peninsula in the southcentral region of the state. It is situated on the west side of Cook Inlet, approximately 80 miles southwest of Anchorage. The community is part of the Kenai Peninsula Borough and is home to approximately 600 people.
History
The area now known as Ninilchik has been inhabited by the Dena’ina Athabascan people for thousands of years. The name Ninilchik is derived from the Dena’ina word “Nen’altshik” which means “peaceful settlement”. The first non-Native settlers arrived in the area in the late 1800s, and the community was officially established in 1895. The first post office was established in 1898, and the first school was built in 1900.
In the early 1900s, Ninilchik was a thriving fishing and farming community. The area was known for its salmon, halibut, and herring fisheries, as well as its dairy and vegetable farms. The community also had a cannery, a sawmill, and a general store.
In the 1950s, the construction of the Sterling Highway brought an influx of tourists to the area. This led to the development of a number of tourist-related businesses, including a motel, a restaurant, and a gas station.
Geography
Ninilchik is located on the west side of Cook Inlet, approximately 80 miles southwest of Anchorage. The community is situated on a flat coastal plain, with the Ninilchik River running through the center of town. The surrounding area is mostly forested, with some areas of tundra. The climate is mild, with temperatures ranging from the mid-30s in the winter to the mid-60s in the summer.
Economy
The economy of Ninilchik is largely based on tourism and fishing. The area is known for its salmon, halibut, and herring fisheries, as well as its dairy and vegetable farms. The community also has a number of tourist-related businesses, including a motel, a restaurant, and a gas station.
Demographics
As of the 2010 census, Ninilchik had a population of 602 people. The racial makeup of the community was 95.2% White, 0.7% Native American, 0.2% Asian, 0.2% Pacific Islander, 0.2% from other races, and 3.7% from two or more races. The median household income was $45,000, and the median family income was $50,000. The per capita income was $20,000.
Common Questions
What is Per Capita Income in Ninilchik?
Per Capita income in Ninilchik is $31,434.
What is the Median Family Income in Ninilchik?
Median Family Income in Ninilchik is $65,893.
What is the Median Household income in Ninilchik?
Median Household Income in Ninilchik is $55,357.
What is Income or Wage Gap in Ninilchik?
Income or Wage Gap in Ninilchik is 50.4%.
Women in Ninilchik earn 49.6 cents for every dollar earned by a man.
What is Inequality or Gini Index in Ninilchik?
Inequality or Gini Index in Ninilchik is 0.51.
What is the Total Population of Ninilchik?
Total Population of Ninilchik is 964.
What is the Total Male Population of Ninilchik?
Total Male Population of Ninilchik is 545.
What is the Total Female Population of Ninilchik?
Total Female Population of Ninilchik is 419.
What is the Ratio of Males per 100 Females in Ninilchik?
There are 130.07 Males per 100 Females in Ninilchik.
What is the Ratio of Females per 100 Males in Ninilchik?
There are 76.88 Females per 100 Males in Ninilchik.
What is the Median Population Age in Ninilchik?
Median Population Age in Ninilchik is 51.3 Years.
What is the Average Family Size in Ninilchik
Average Family Size in Ninilchik is 3.0 People.
What is the Average Household Size in Ninilchik
Average Household Size in Ninilchik is 2.4 People.
How Large is the Labor Force in Ninilchik?
There are 352 People in the Labor Forcein in Ninilchik.
What is the Percentage of People in the Labor Force in Ninilchik?
46.9% of People are in the Labor Force in Ninilchik.
What is the Unemployment Rate in Ninilchik?
Unemployment Rate in Ninilchik is 6.0%.