Nightmute, AK Map & Demographics
Nightmute Map
Nightmute Overview
$14,097
PER CAPITA INCOME
$58,333
AVG FAMILY INCOME
$58,750
AVG HOUSEHOLD INCOME
0.25
INEQUALITY / GINI INDEX
70
TOTAL POPULATION
41
MALE POPULATION
29
FEMALE POPULATION
141.38
MALES / 100 FEMALES
70.73
FEMALES / 100 MALES
33.7
MEDIAN AGE
4.6
AVG FAMILY SIZE
4.4
AVG HOUSEHOLD SIZE
32
LABOR FORCE [ PEOPLE ]
52.5%
PERCENT IN LABOR FORCE
25.0%
UNEMPLOYMENT RATE
Nightmute Zip Codes
Nightmute Area Codes
Income in Nightmute
Income Overview in Nightmute
Per Capita Income in Nightmute is $14,097, while median incomes of families and households are $58,333 and $58,750 respectively.
| Characteristic | Number | Measure |
| Per Capita Income | 70 | $14,097 |
| Median Family Income | 14 | $58,333 |
| Mean Family Income | 14 | $61,393 |
| Median Household Income | 16 | $58,750 |
| Mean Household Income | 16 | $55,956 |
| Income Deficit | 14 | $0 |
| Wage / Income Gap (%) | 70 | 0.00% |
| Wage / Income Gap ($) | 70 | 100.00¢ per $1 |
| Gini / Inequality Index | 70 | 0.25 |
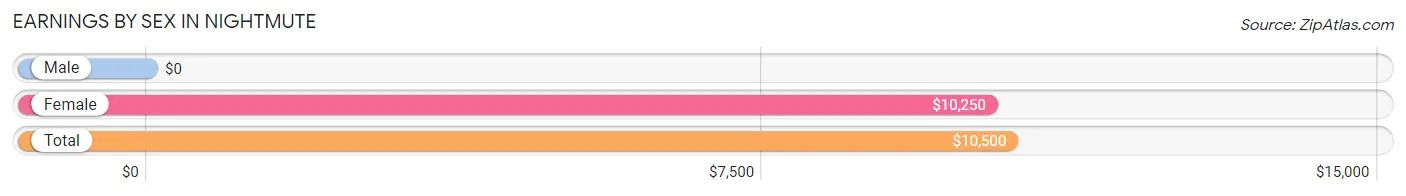
Earnings by Sex in Nightmute
| Sex | Number | Average Earnings |
| Male | 25 (62.5%) | $0 |
| Female | 15 (37.5%) | $10,250 |
| Total | 40 (100.0%) | $10,500 |
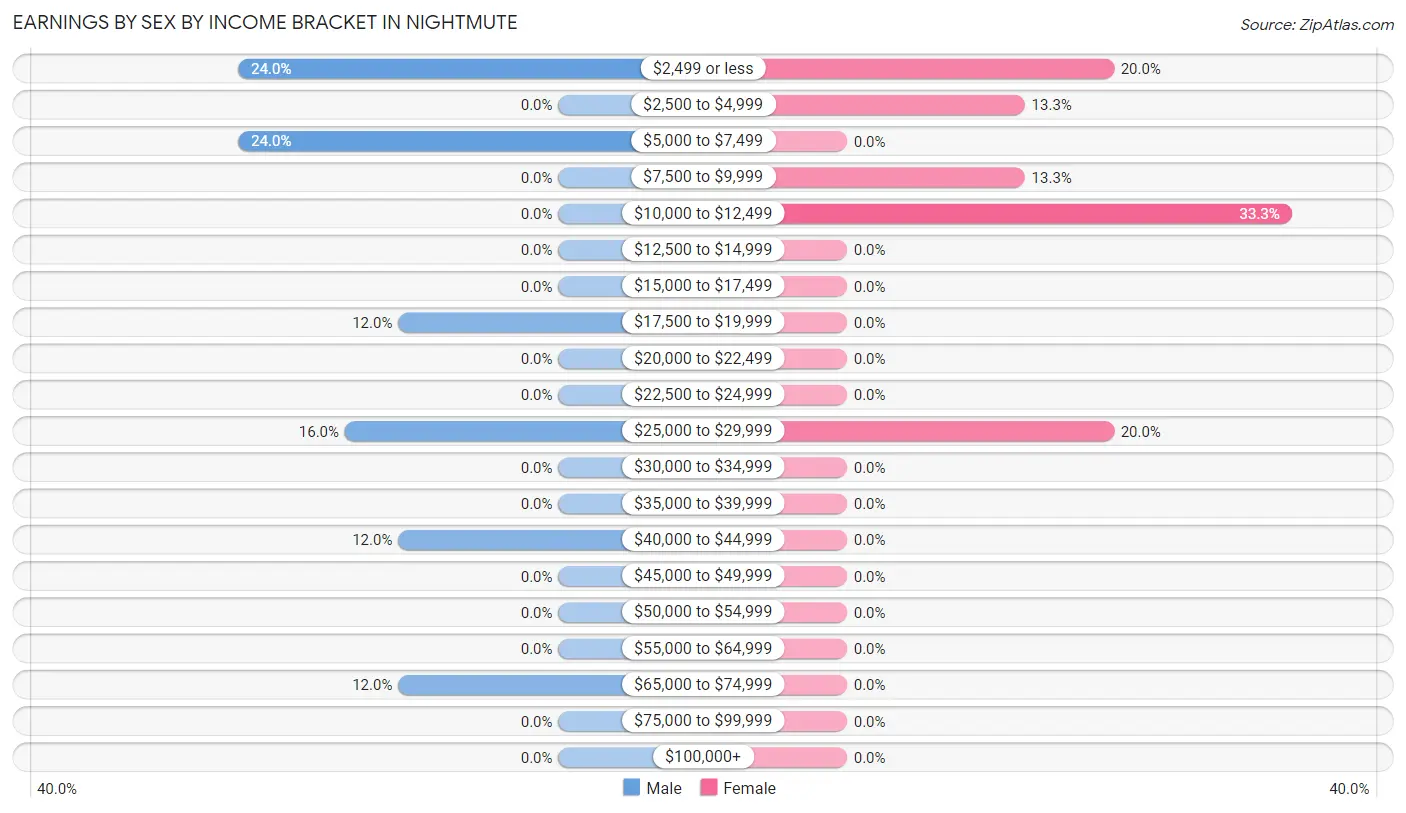
Earnings by Sex by Income Bracket in Nightmute
The most common earnings brackets in Nightmute are $2,499 or less for men (6 | 24.0%) and $10,000 to $12,499 for women (5 | 33.3%).
| Income | Male | Female |
| $2,499 or less | 6 (24.0%) | 3 (20.0%) |
| $2,500 to $4,999 | 0 (0.0%) | 2 (13.3%) |
| $5,000 to $7,499 | 6 (24.0%) | 0 (0.0%) |
| $7,500 to $9,999 | 0 (0.0%) | 2 (13.3%) |
| $10,000 to $12,499 | 0 (0.0%) | 5 (33.3%) |
| $12,500 to $14,999 | 0 (0.0%) | 0 (0.0%) |
| $15,000 to $17,499 | 0 (0.0%) | 0 (0.0%) |
| $17,500 to $19,999 | 3 (12.0%) | 0 (0.0%) |
| $20,000 to $22,499 | 0 (0.0%) | 0 (0.0%) |
| $22,500 to $24,999 | 0 (0.0%) | 0 (0.0%) |
| $25,000 to $29,999 | 4 (16.0%) | 3 (20.0%) |
| $30,000 to $34,999 | 0 (0.0%) | 0 (0.0%) |
| $35,000 to $39,999 | 0 (0.0%) | 0 (0.0%) |
| $40,000 to $44,999 | 3 (12.0%) | 0 (0.0%) |
| $45,000 to $49,999 | 0 (0.0%) | 0 (0.0%) |
| $50,000 to $54,999 | 0 (0.0%) | 0 (0.0%) |
| $55,000 to $64,999 | 0 (0.0%) | 0 (0.0%) |
| $65,000 to $74,999 | 3 (12.0%) | 0 (0.0%) |
| $75,000 to $99,999 | 0 (0.0%) | 0 (0.0%) |
| $100,000+ | 0 (0.0%) | 0 (0.0%) |
| Total | 25 (100.0%) | 15 (100.0%) |
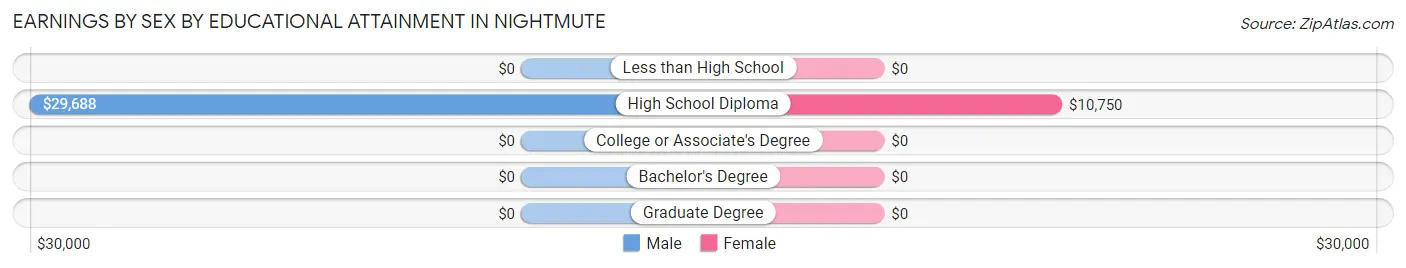
Earnings by Sex by Educational Attainment in Nightmute
Average earnings in Nightmute are $27,813 for men and $11,000 for women, a difference of 60.5%. Men with an educational attainment of high school diploma enjoy the highest average annual earnings of $29,688, while those with high school diploma education earn the least with $29,688. Women with an educational attainment of high school diploma earn the most with the average annual earnings of $10,750, while those with high school diploma education have the smallest earnings of $10,750.
| Educational Attainment | Male Income | Female Income |
| Less than High School | - | - |
| High School Diploma | $29,688 | $10,750 |
| College or Associate's Degree | - | - |
| Bachelor's Degree | - | - |
| Graduate Degree | - | - |
| Total | $27,813 | $11,000 |
Family Income in Nightmute
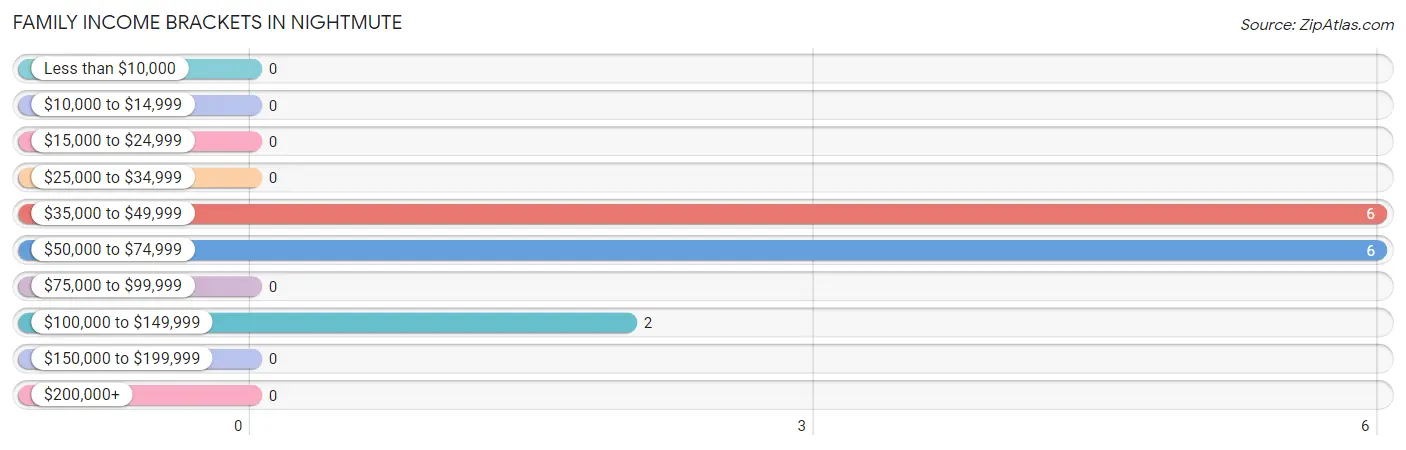
Family Income Brackets in Nightmute
According to the Nightmute family income data, there are 6 families falling into the $35,000 to $49,999 income range, which is the most common income bracket and makes up 42.9% of all families.
| Income Bracket | # Families | % Families |
| Less than $10,000 | 0 | 0.0% |
| $10,000 to $14,999 | 0 | 0.0% |
| $15,000 to $24,999 | 0 | 0.0% |
| $25,000 to $34,999 | 0 | 0.0% |
| $35,000 to $49,999 | 6 | 42.9% |
| $50,000 to $74,999 | 6 | 42.9% |
| $75,000 to $99,999 | 0 | 0.0% |
| $100,000 to $149,999 | 2 | 14.3% |
| $150,000 to $199,999 | 0 | 0.0% |
| $200,000+ | 0 | 0.0% |
Family Income by Famaliy Size in Nightmute
| Income Bracket | # Families | Median Income |
| 2-Person Families | 0 (0.0%) | $0 |
| 3-Person Families | 0 (0.0%) | $0 |
| 4-Person Families | 8 (57.1%) | $0 |
| 5-Person Families | 3 (21.4%) | $0 |
| 6-Person Families | 3 (21.4%) | $0 |
| 7+ Person Families | 0 (0.0%) | $0 |
| Total | 14 (100.0%) | $58,333 |
Family Income by Number of Earners in Nightmute
| Number of Earners | # Families | Median Income |
| No Earners | 0 (0.0%) | $0 |
| 1 Earner | 3 (21.4%) | $0 |
| 2 Earners | 5 (35.7%) | $0 |
| 3+ Earners | 6 (42.9%) | $0 |
| Total | 14 (100.0%) | $58,333 |
Household Income in Nightmute
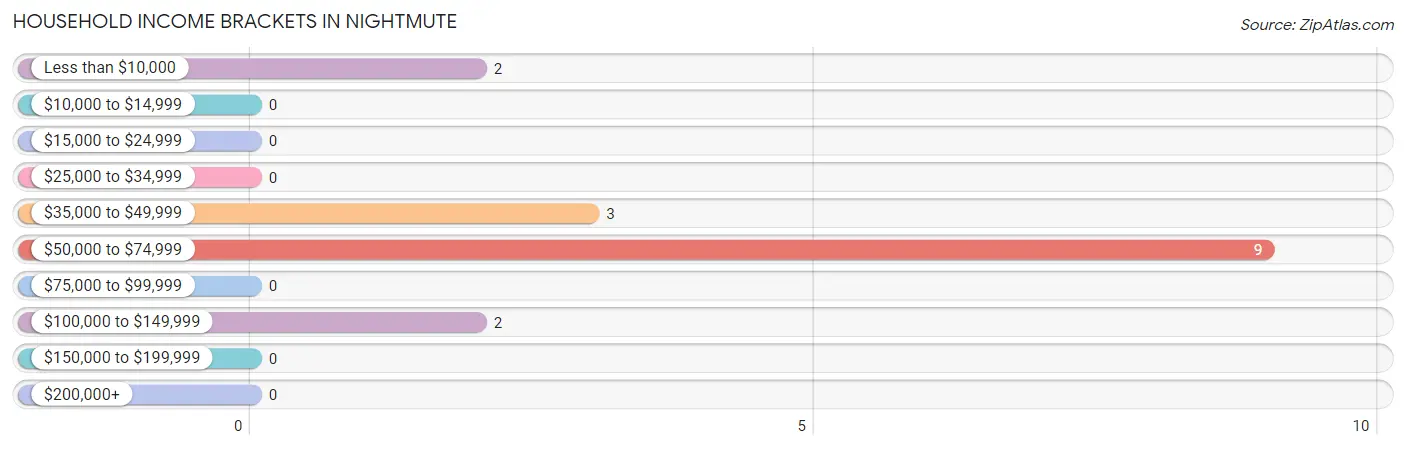
Household Income Brackets in Nightmute
With 9 households falling in the category, the $50,000 to $74,999 income range is the most frequent in Nightmute, accounting for 56.2% of all households.
| Income Bracket | # Households | % Households |
| Less than $10,000 | 2 | 12.5% |
| $10,000 to $14,999 | 0 | 0.0% |
| $15,000 to $24,999 | 0 | 0.0% |
| $25,000 to $34,999 | 0 | 0.0% |
| $35,000 to $49,999 | 3 | 18.8% |
| $50,000 to $74,999 | 9 | 56.3% |
| $75,000 to $99,999 | 0 | 0.0% |
| $100,000 to $149,999 | 2 | 12.5% |
| $150,000 to $199,999 | 0 | 0.0% |
| $200,000+ | 0 | 0.0% |
Household Income by Householder Age in Nightmute
The median household income in Nightmute is $58,750, with the highest median household income of $57,917 found in the 45 to 64 years age bracket for the primary householder. A total of 11 households (68.8%) fall into this category.
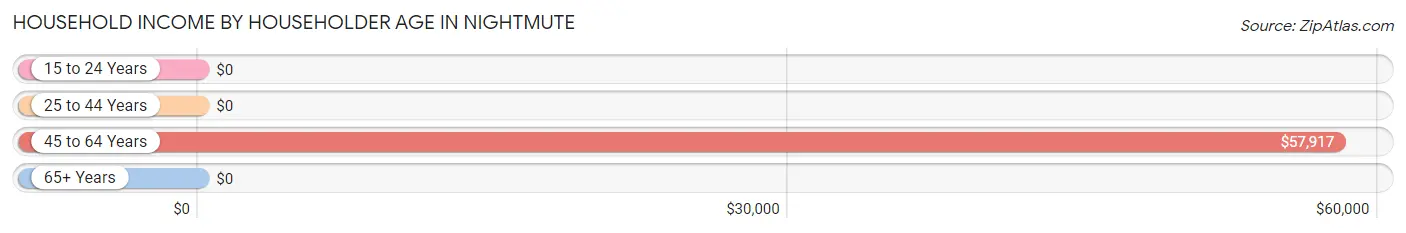
| Income Bracket | # Households | Median Income |
| 15 to 24 Years | 0 (0.0%) | $0 |
| 25 to 44 Years | 3 (18.8%) | $0 |
| 45 to 64 Years | 11 (68.8%) | $57,917 |
| 65+ Years | 2 (12.5%) | $0 |
| Total | 16 (100.0%) | $58,750 |
Poverty in Nightmute
Income Below Poverty by Sex and Age in Nightmute
With 7.3% poverty level for males and 6.9% for females among the residents of Nightmute, 25 to 34 year old males and 45 to 54 year old females are the most vulnerable to poverty, with 3 males (33.3%) and 2 females (20.0%) in their respective age groups living below the poverty level.
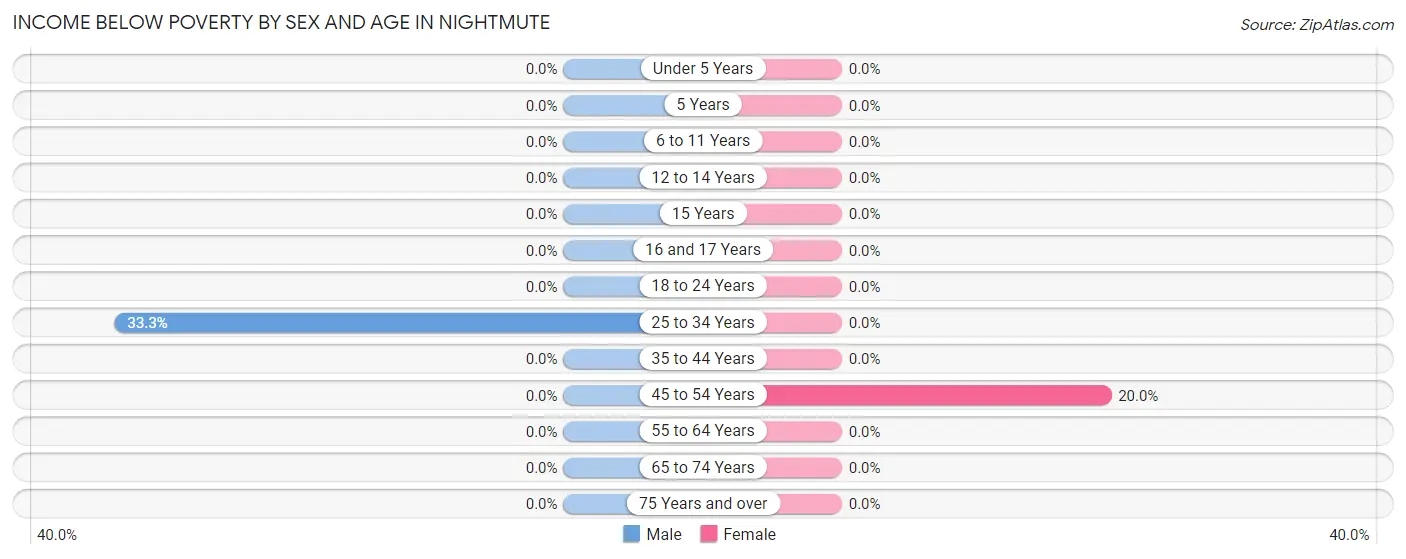
| Age Bracket | Male | Female |
| Under 5 Years | 0 (0.0%) | 0 (0.0%) |
| 5 Years | 0 (0.0%) | 0 (0.0%) |
| 6 to 11 Years | 0 (0.0%) | 0 (0.0%) |
| 12 to 14 Years | 0 (0.0%) | 0 (0.0%) |
| 15 Years | 0 (0.0%) | 0 (0.0%) |
| 16 and 17 Years | 0 (0.0%) | 0 (0.0%) |
| 18 to 24 Years | 0 (0.0%) | 0 (0.0%) |
| 25 to 34 Years | 3 (33.3%) | 0 (0.0%) |
| 35 to 44 Years | 0 (0.0%) | 0 (0.0%) |
| 45 to 54 Years | 0 (0.0%) | 2 (20.0%) |
| 55 to 64 Years | 0 (0.0%) | 0 (0.0%) |
| 65 to 74 Years | 0 (0.0%) | 0 (0.0%) |
| 75 Years and over | 0 (0.0%) | 0 (0.0%) |
| Total | 3 (7.3%) | 2 (6.9%) |
Income Above Poverty by Sex and Age in Nightmute
According to the poverty statistics in Nightmute, males aged 6 to 11 years and females aged 12 to 14 years are the age groups that are most secure financially, with 100.0% of males and 100.0% of females in these age groups living above the poverty line.
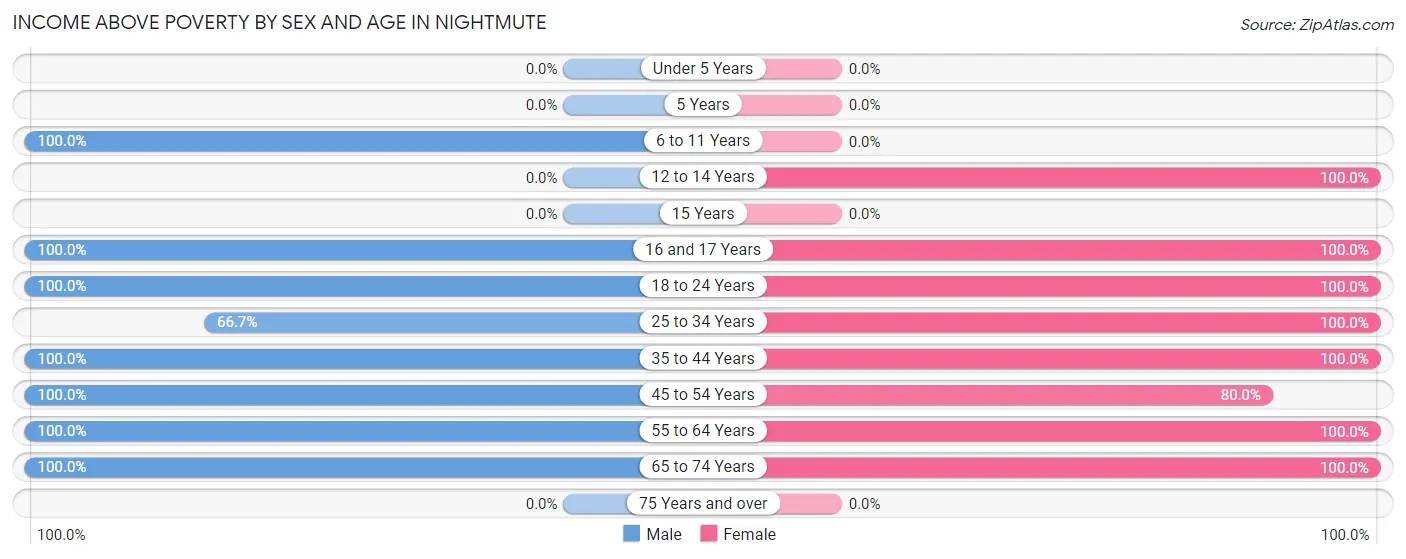
| Age Bracket | Male | Female |
| Under 5 Years | 0 (0.0%) | 0 (0.0%) |
| 5 Years | 0 (0.0%) | 0 (0.0%) |
| 6 to 11 Years | 6 (100.0%) | 0 (0.0%) |
| 12 to 14 Years | 0 (0.0%) | 3 (100.0%) |
| 15 Years | 0 (0.0%) | 0 (0.0%) |
| 16 and 17 Years | 3 (100.0%) | 3 (100.0%) |
| 18 to 24 Years | 6 (100.0%) | 4 (100.0%) |
| 25 to 34 Years | 6 (66.7%) | 2 (100.0%) |
| 35 to 44 Years | 3 (100.0%) | 3 (100.0%) |
| 45 to 54 Years | 7 (100.0%) | 8 (80.0%) |
| 55 to 64 Years | 3 (100.0%) | 2 (100.0%) |
| 65 to 74 Years | 4 (100.0%) | 2 (100.0%) |
| 75 Years and over | 0 (0.0%) | 0 (0.0%) |
| Total | 38 (92.7%) | 27 (93.1%) |
Income Below Poverty Among Married-Couple Families in Nightmute
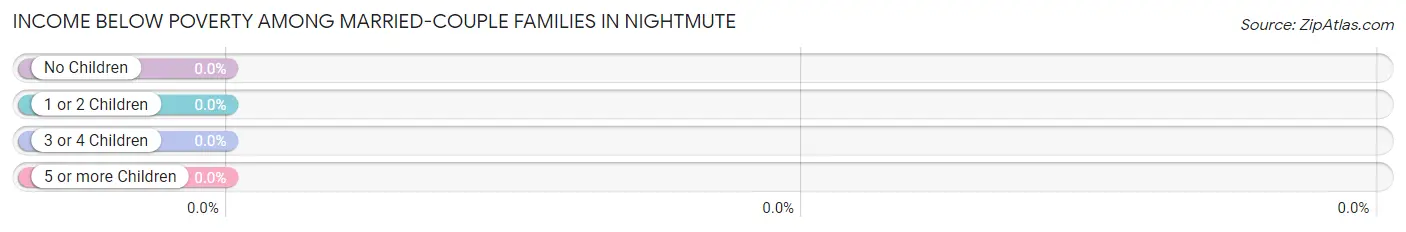
| Children | Above Poverty | Below Poverty |
| No Children | 2 (100.0%) | 0 (0.0%) |
| 1 or 2 Children | 9 (100.0%) | 0 (0.0%) |
| 3 or 4 Children | 0 (0.0%) | 0 (0.0%) |
| 5 or more Children | 0 (0.0%) | 0 (0.0%) |
| Total | 11 (100.0%) | 0 (0.0%) |
Income Below Poverty Among Single-Parent Households in Nightmute
| Children | Single Father | Single Mother |
| No Children | 0 (0.0%) | 0 (0.0%) |
| 1 or 2 Children | 0 (0.0%) | 0 (0.0%) |
| 3 or 4 Children | 0 (0.0%) | 0 (0.0%) |
| 5 or more Children | 0 (0.0%) | 0 (0.0%) |
| Total | 0 (0.0%) | 0 (0.0%) |
Income Below Poverty Among Married-Couple vs Single-Parent Households in Nightmute
| Children | Married-Couple Families | Single-Parent Households |
| No Children | 0 (0.0%) | 0 (0.0%) |
| 1 or 2 Children | 0 (0.0%) | 0 (0.0%) |
| 3 or 4 Children | 0 (0.0%) | 0 (0.0%) |
| 5 or more Children | 0 (0.0%) | 0 (0.0%) |
| Total | 0 (0.0%) | 0 (0.0%) |
Race in Nightmute
The most populous races in Nightmute are Native / Alaskan (54 | 77.1%), and Two or more Races (16 | 22.9%).
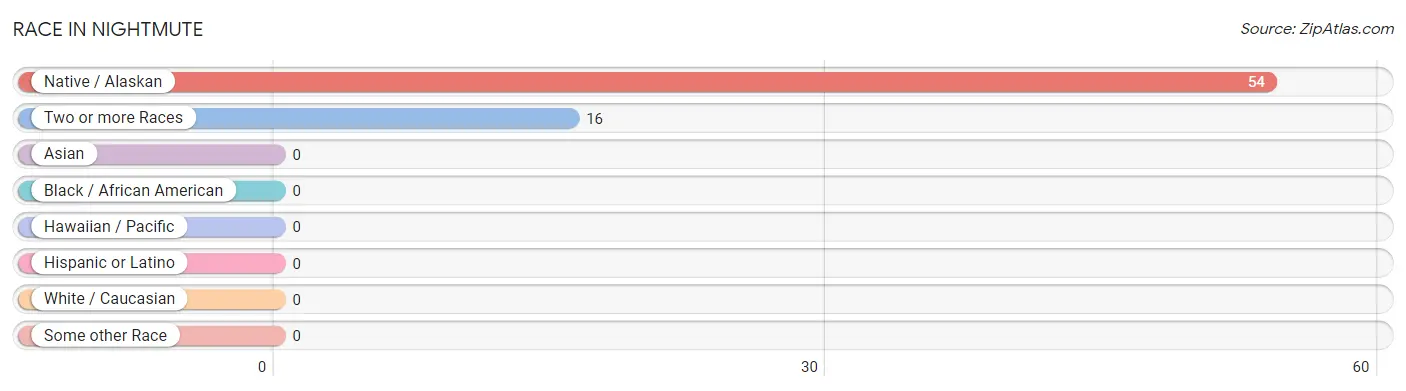
| Race | # Population | % Population |
| Asian | 0 | 0.0% |
| Black / African American | 0 | 0.0% |
| Hawaiian / Pacific | 0 | 0.0% |
| Hispanic or Latino | 0 | 0.0% |
| Native / Alaskan | 54 | 77.1% |
| White / Caucasian | 0 | 0.0% |
| Two or more Races | 16 | 22.9% |
| Some other Race | 0 | 0.0% |
| Total | 70 | 100.0% |
Ancestry in Nightmute
The most populous ancestries reported in Nightmute are Alaska Native (47 | 67.1%), Ute (18 | 25.7%), Polish (16 | 22.9%), Inupiat (4 | 5.7%), and Yup'ik (3 | 4.3%), together accounting for 125.7% of all Nightmute residents.
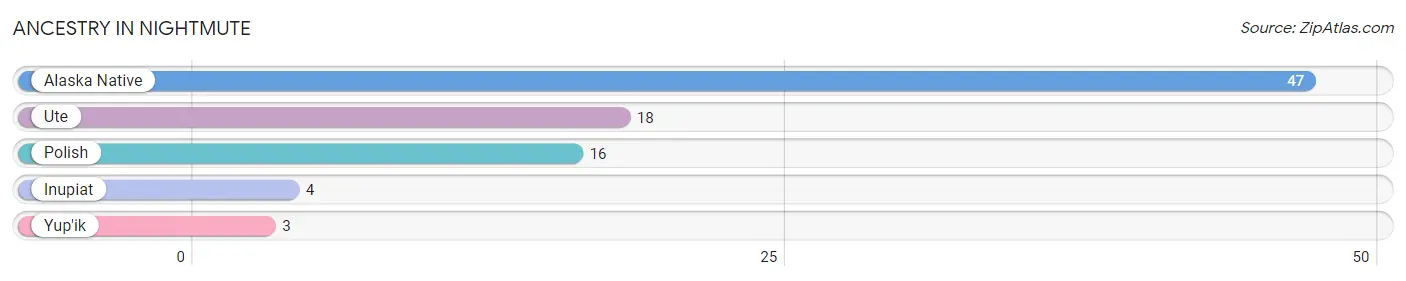
| Ancestry | # Population | % Population |
| Alaska Native | 47 | 67.1% |
| Inupiat | 4 | 5.7% |
| Polish | 16 | 22.9% |
| Ute | 18 | 25.7% |
| Yup'ik | 3 | 4.3% | View All 5 Rows |
Immigrants in Nightmute

| Immigration Origin | # Population | % Population | View All 0 Rows |
Sex and Age in Nightmute
Sex and Age in Nightmute
The most populous age groups in Nightmute are 50 to 54 Years (7 | 17.1%) for men and 50 to 54 Years (6 | 20.7%) for women.
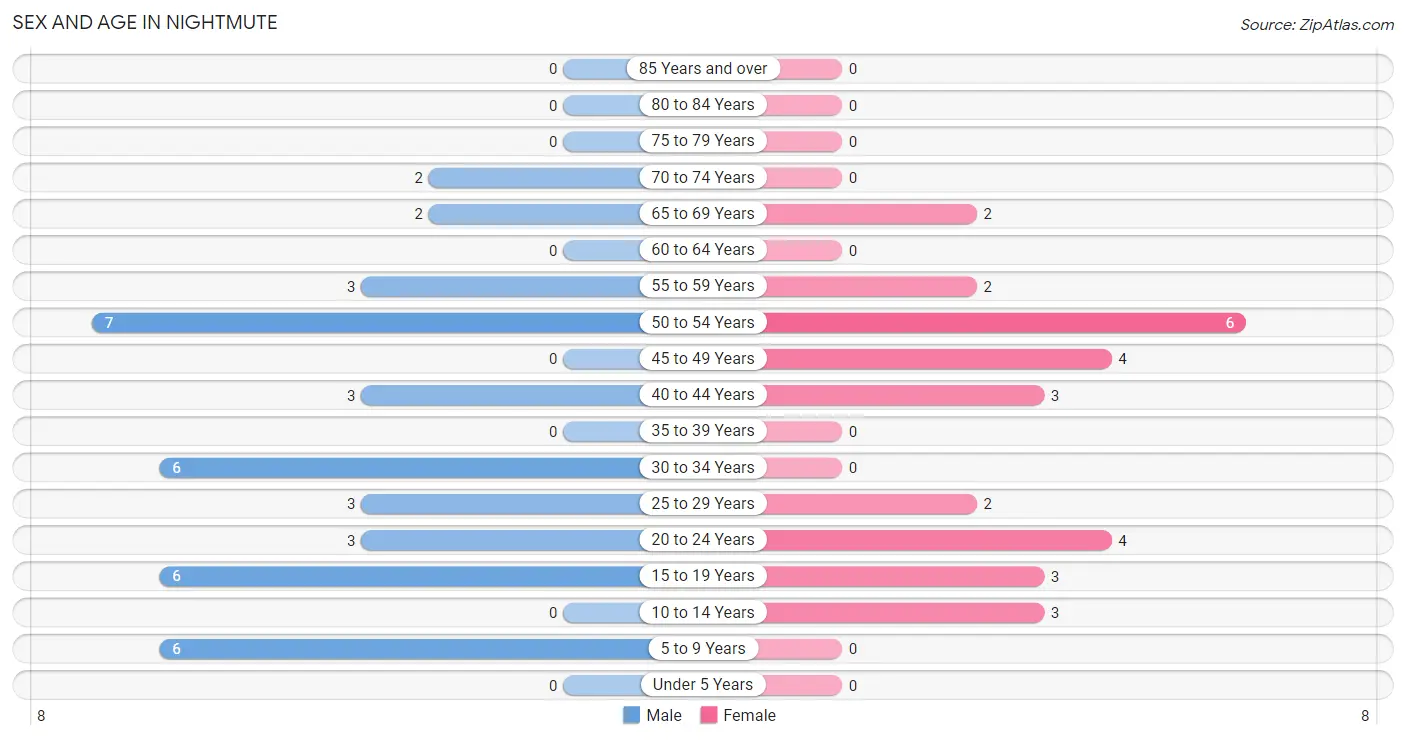
| Age Bracket | Male | Female |
| Under 5 Years | 0 (0.0%) | 0 (0.0%) |
| 5 to 9 Years | 6 (14.6%) | 0 (0.0%) |
| 10 to 14 Years | 0 (0.0%) | 3 (10.3%) |
| 15 to 19 Years | 6 (14.6%) | 3 (10.3%) |
| 20 to 24 Years | 3 (7.3%) | 4 (13.8%) |
| 25 to 29 Years | 3 (7.3%) | 2 (6.9%) |
| 30 to 34 Years | 6 (14.6%) | 0 (0.0%) |
| 35 to 39 Years | 0 (0.0%) | 0 (0.0%) |
| 40 to 44 Years | 3 (7.3%) | 3 (10.3%) |
| 45 to 49 Years | 0 (0.0%) | 4 (13.8%) |
| 50 to 54 Years | 7 (17.1%) | 6 (20.7%) |
| 55 to 59 Years | 3 (7.3%) | 2 (6.9%) |
| 60 to 64 Years | 0 (0.0%) | 0 (0.0%) |
| 65 to 69 Years | 2 (4.9%) | 2 (6.9%) |
| 70 to 74 Years | 2 (4.9%) | 0 (0.0%) |
| 75 to 79 Years | 0 (0.0%) | 0 (0.0%) |
| 80 to 84 Years | 0 (0.0%) | 0 (0.0%) |
| 85 Years and over | 0 (0.0%) | 0 (0.0%) |
| Total | 41 (100.0%) | 29 (100.0%) |
Families and Households in Nightmute
Median Family Size in Nightmute
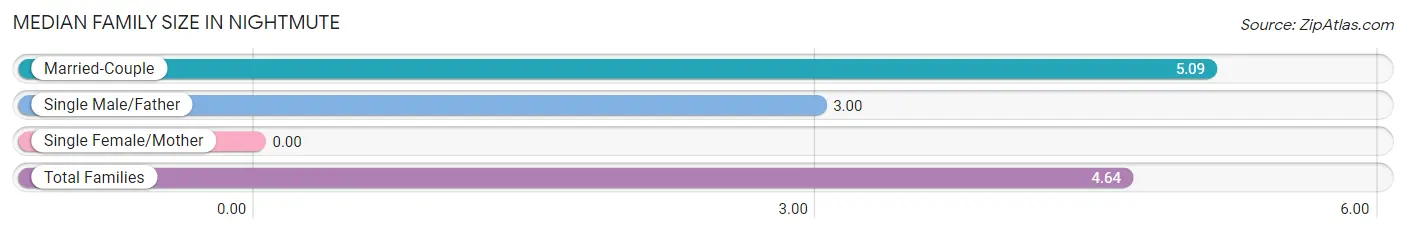
| Family Type | # Families | Family Size |
| Married-Couple | 11 (78.6%) | 5.09 |
| Single Male/Father | 3 (21.4%) | 3.00 |
| Single Female/Mother | 0 (0.0%) | - |
| Total Families | 14 (100.0%) | 4.64 |
Median Household Size in Nightmute
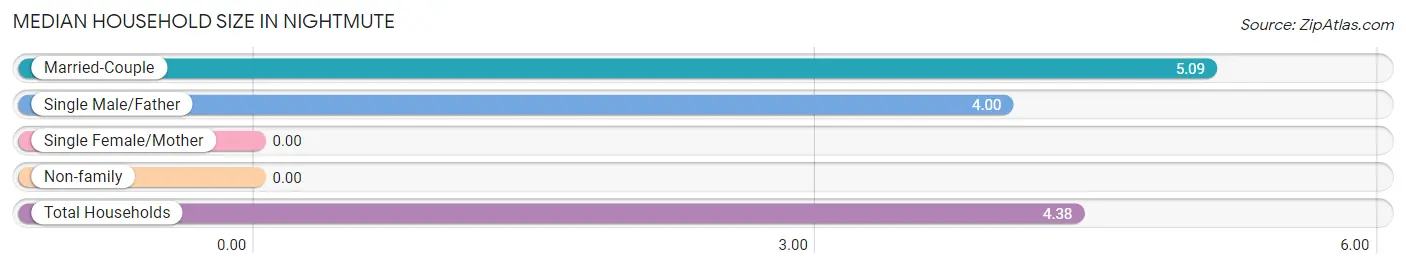
| Household Type | # Households | Household Size |
| Married-Couple | 11 (68.8%) | 5.09 |
| Single Male/Father | 3 (18.8%) | 4.00 |
| Single Female/Mother | 0 (0.0%) | - |
| Non-family | 2 (12.5%) | - |
| Total Households | 16 (100.0%) | 4.38 |
Household Size by Marriage Status in Nightmute
Out of a total of 16 households in Nightmute, 14 (87.5%) are family households, while 2 (12.5%) are nonfamily households. The most numerous type of family households are 5-person households, comprising 6, and the most common type of nonfamily households are 1-person households, comprising 2.
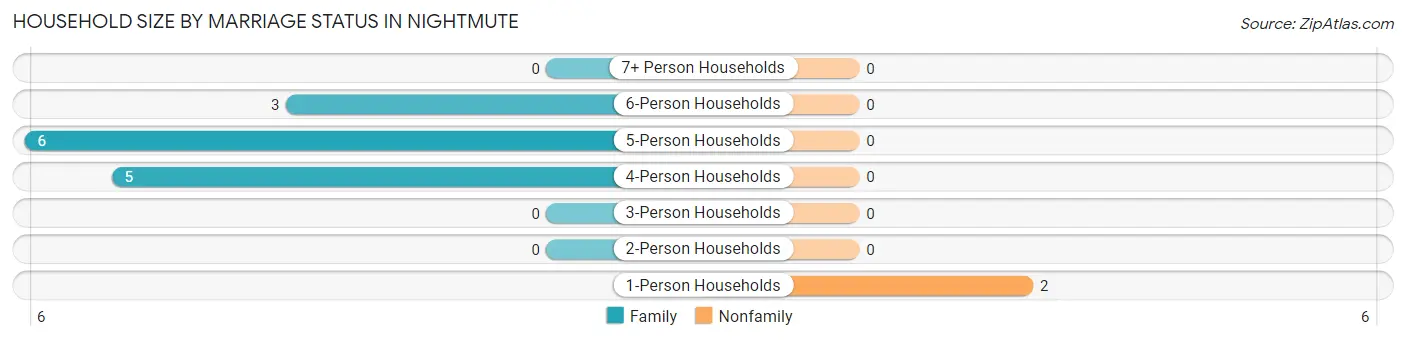
| Household Size | Family Households | Nonfamily Households |
| 1-Person Households | - | 2 (12.5%) |
| 2-Person Households | 0 (0.0%) | 0 (0.0%) |
| 3-Person Households | 0 (0.0%) | 0 (0.0%) |
| 4-Person Households | 5 (31.2%) | 0 (0.0%) |
| 5-Person Households | 6 (37.5%) | 0 (0.0%) |
| 6-Person Households | 3 (18.8%) | 0 (0.0%) |
| 7+ Person Households | 0 (0.0%) | 0 (0.0%) |
| Total | 14 (87.5%) | 2 (12.5%) |
Female Fertility in Nightmute
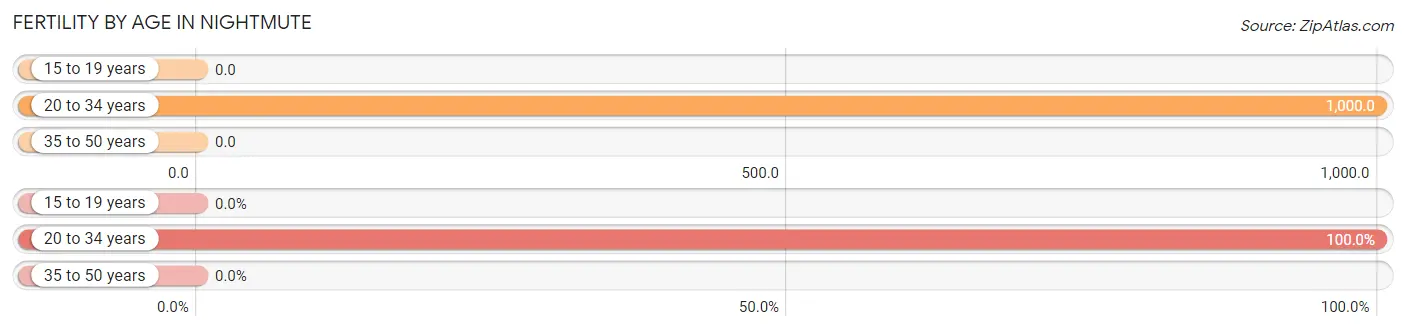
Fertility by Age in Nightmute
Average fertility rate in Nightmute is 375.0 births per 1,000 women. Women in the age bracket of 20 to 34 years have the highest fertility rate with 1,000.0 births per 1,000 women. Women in the age bracket of 20 to 34 years acount for 100.0% of all women with births.
| Age Bracket | Women with Births | Births / 1,000 Women |
| 15 to 19 years | 0 (0.0%) | 0.0 |
| 20 to 34 years | 6 (100.0%) | 1,000.0 |
| 35 to 50 years | 0 (0.0%) | 0.0 |
| Total | 6 (100.0%) | 375.0 |
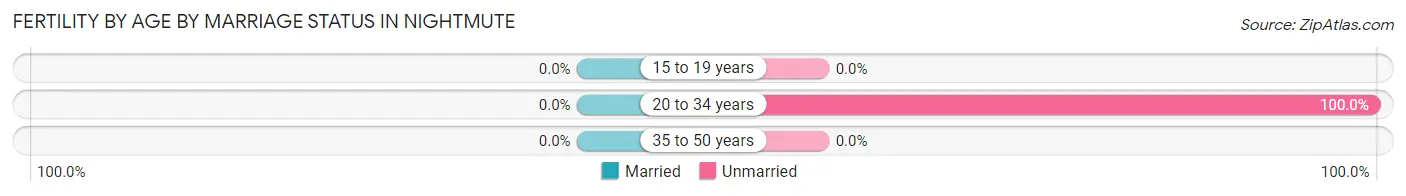
Fertility by Age by Marriage Status in Nightmute
| Age Bracket | Married | Unmarried |
| 15 to 19 years | 0 (0.0%) | 0 (0.0%) |
| 20 to 34 years | 0 (0.0%) | 6 (100.0%) |
| 35 to 50 years | 0 (0.0%) | 0 (0.0%) |
| Total | 0 (0.0%) | 6 (100.0%) |
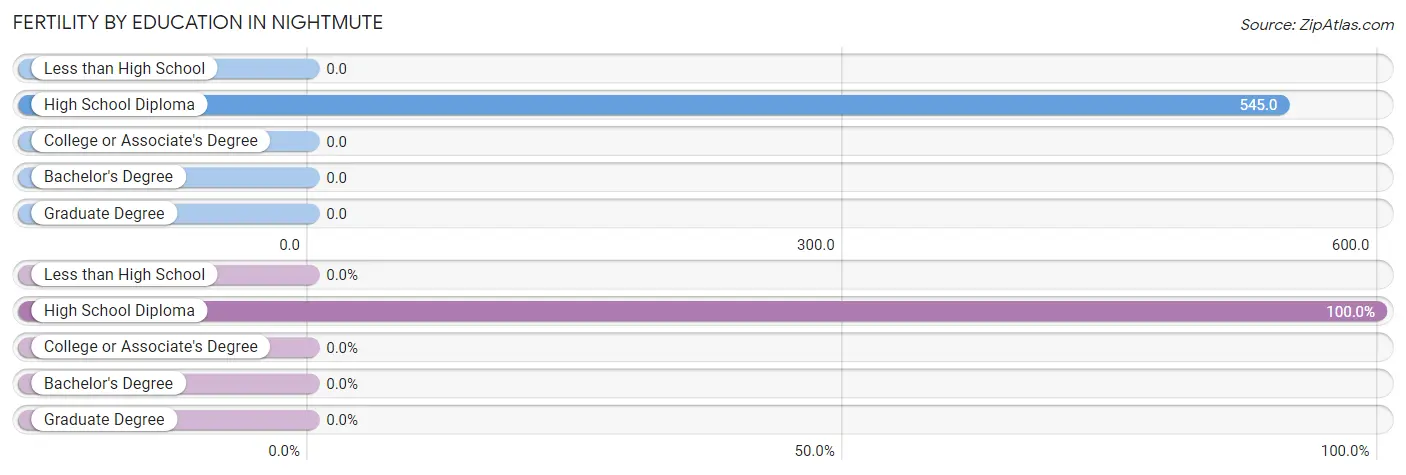
Fertility by Education in Nightmute
| Educational Attainment | Women with Births | Births / 1,000 Women |
| Less than High School | 0 (0.0%) | 0.0 |
| High School Diploma | 6 (100.0%) | 545.0 |
| College or Associate's Degree | 0 (0.0%) | 0.0 |
| Bachelor's Degree | 0 (0.0%) | 0.0 |
| Graduate Degree | 0 (0.0%) | 0.0 |
| Total | 6 (100.0%) | 375.0 |
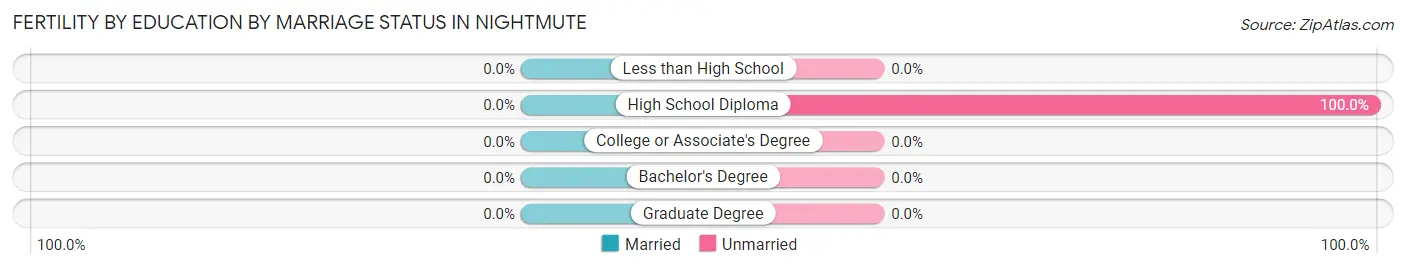
Fertility by Education by Marriage Status in Nightmute
| Educational Attainment | Married | Unmarried |
| Less than High School | 0 (0.0%) | 0 (0.0%) |
| High School Diploma | 0 (0.0%) | 6 (100.0%) |
| College or Associate's Degree | 0 (0.0%) | 0 (0.0%) |
| Bachelor's Degree | 0 (0.0%) | 0 (0.0%) |
| Graduate Degree | 0 (0.0%) | 0 (0.0%) |
| Total | 0 (0.0%) | 6 (100.0%) |
Employment Characteristics in Nightmute
Employment by Class of Employer in Nightmute
Among the 24 employed individuals in Nightmute, private company employees (14 | 58.3%), state government employees (7 | 29.2%), and local government employees (3 | 12.5%) make up the most common classes of employment.
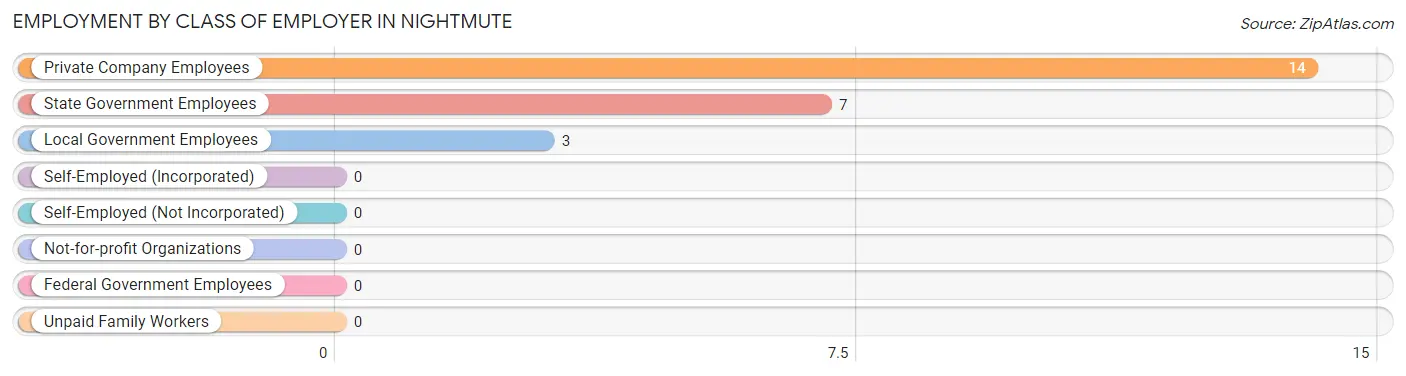
| Employer Class | # Employees | % Employees |
| Private Company Employees | 14 | 58.3% |
| Self-Employed (Incorporated) | 0 | 0.0% |
| Self-Employed (Not Incorporated) | 0 | 0.0% |
| Not-for-profit Organizations | 0 | 0.0% |
| Local Government Employees | 3 | 12.5% |
| State Government Employees | 7 | 29.2% |
| Federal Government Employees | 0 | 0.0% |
| Unpaid Family Workers | 0 | 0.0% |
| Total | 24 | 100.0% |
Employment Status by Age in Nightmute
According to the labor force statistics for Nightmute, out of the total population over 16 years of age (61), 52.5% or 32 individuals are in the labor force, with 25.0% or 8 of them unemployed. The age group with the highest labor force participation rate is 25 to 29 years, with 100.0% or 5 individuals in the labor force. Within the labor force, the 20 to 24 years age range has the highest percentage of unemployed individuals, with 100.0% or 3 of them being unemployed.
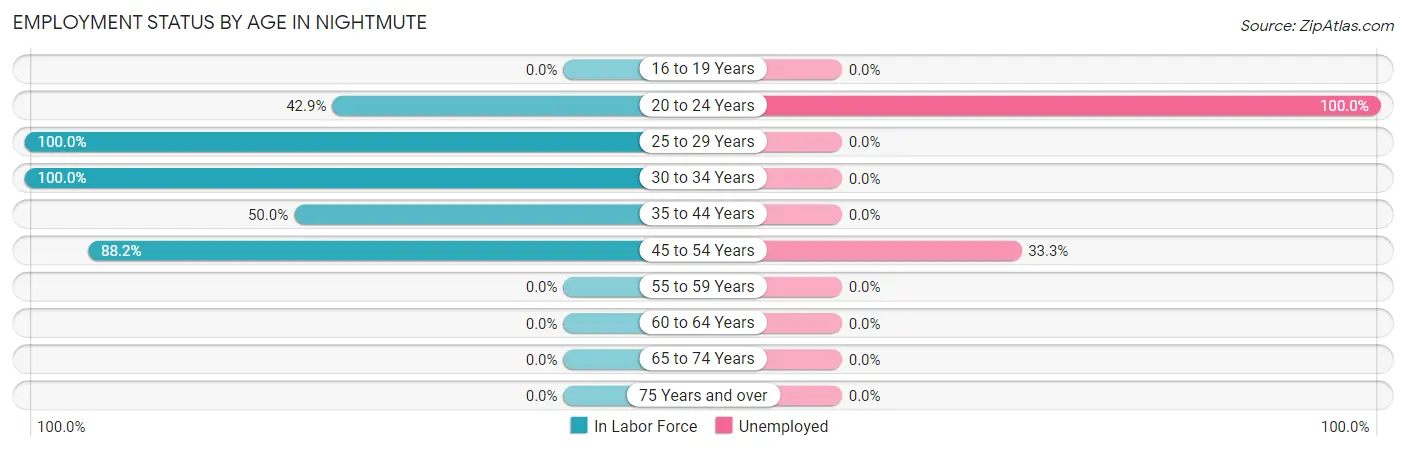
| Age Bracket | In Labor Force | Unemployed |
| 16 to 19 Years | 0 (0.0%) | 0 (0.0%) |
| 20 to 24 Years | 3 (42.9%) | 3 (100.0%) |
| 25 to 29 Years | 5 (100.0%) | 0 (0.0%) |
| 30 to 34 Years | 6 (100.0%) | 0 (0.0%) |
| 35 to 44 Years | 3 (50.0%) | 0 (0.0%) |
| 45 to 54 Years | 15 (88.2%) | 5 (33.3%) |
| 55 to 59 Years | 0 (0.0%) | 0 (0.0%) |
| 60 to 64 Years | 0 (0.0%) | 0 (0.0%) |
| 65 to 74 Years | 0 (0.0%) | 0 (0.0%) |
| 75 Years and over | 0 (0.0%) | 0 (0.0%) |
| Total | 32 (52.5%) | 8 (25.0%) |
Employment Status by Educational Attainment in Nightmute
According to labor force statistics for Nightmute, 74.4% of individuals (29) out of the total population between 25 and 64 years of age (39) are in the labor force, with 17.2% or 5 of them being unemployed. The group with the highest labor force participation rate are those with the educational attainment of less than high school, with 100.0% or 3 individuals in the labor force. Within the labor force, individuals with college / associate degree education have the highest percentage of unemployment, with 25.0% or 2 of them being unemployed.
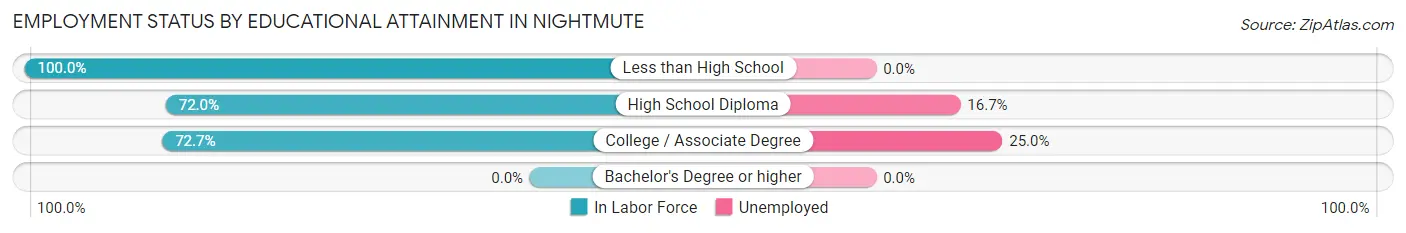
| Educational Attainment | In Labor Force | Unemployed |
| Less than High School | 3 (100.0%) | 0 (0.0%) |
| High School Diploma | 18 (72.0%) | 4 (16.7%) |
| College / Associate Degree | 8 (72.7%) | 3 (25.0%) |
| Bachelor's Degree or higher | 0 (0.0%) | 0 (0.0%) |
| Total | 29 (74.4%) | 7 (17.2%) |
Employment Occupations by Sex in Nightmute
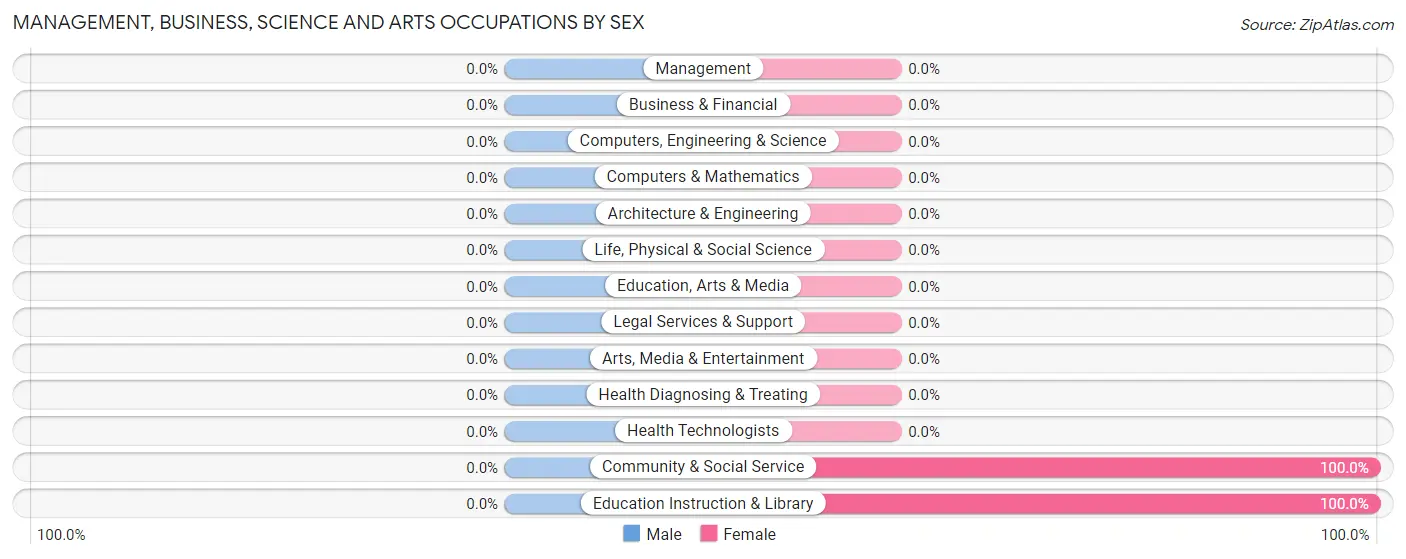
Management, Business, Science and Arts Occupations
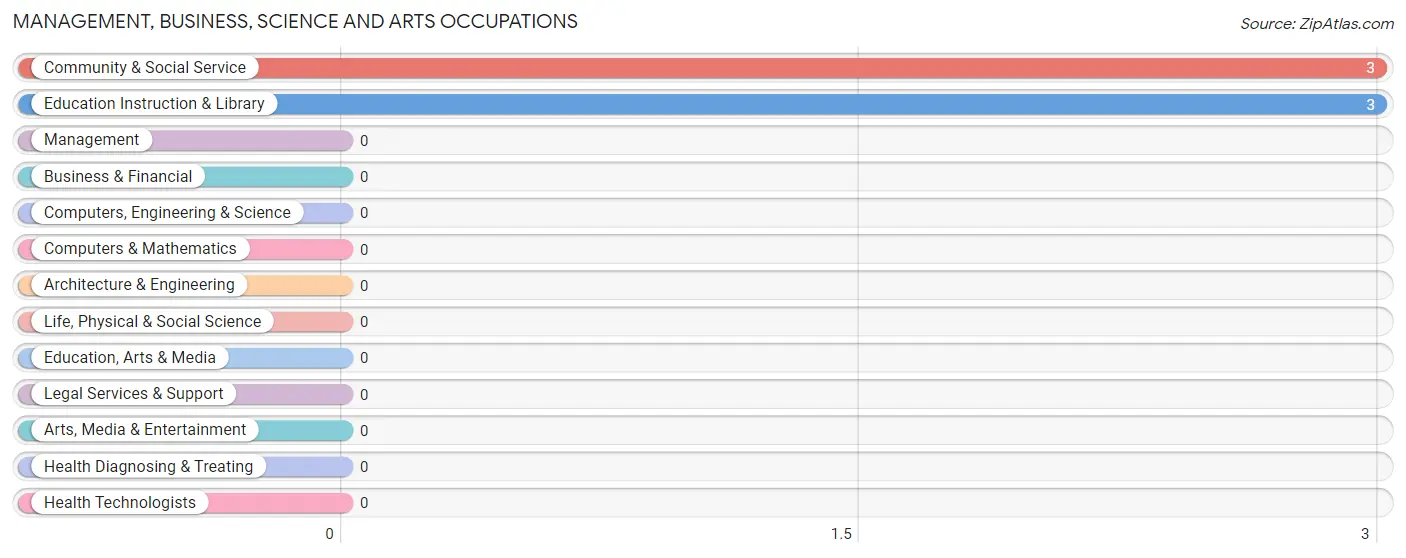
The most common Management, Business, Science and Arts occupations in Nightmute are Community & Social Service (3 | 12.5%), and Education Instruction & Library (3 | 12.5%).
Management, Business, Science and Arts Occupations by Sex
| Occupation | Male | Female |
| Management | 0 (0.0%) | 0 (0.0%) |
| Business & Financial | 0 (0.0%) | 0 (0.0%) |
| Computers, Engineering & Science | 0 (0.0%) | 0 (0.0%) |
| Computers & Mathematics | 0 (0.0%) | 0 (0.0%) |
| Architecture & Engineering | 0 (0.0%) | 0 (0.0%) |
| Life, Physical & Social Science | 0 (0.0%) | 0 (0.0%) |
| Community & Social Service | 0 (0.0%) | 3 (100.0%) |
| Education, Arts & Media | 0 (0.0%) | 0 (0.0%) |
| Legal Services & Support | 0 (0.0%) | 0 (0.0%) |
| Education Instruction & Library | 0 (0.0%) | 3 (100.0%) |
| Arts, Media & Entertainment | 0 (0.0%) | 0 (0.0%) |
| Health Diagnosing & Treating | 0 (0.0%) | 0 (0.0%) |
| Health Technologists | 0 (0.0%) | 0 (0.0%) |
| Total (Category) | 0 (0.0%) | 3 (100.0%) |
| Total (Overall) | 19 (79.2%) | 5 (20.8%) |
Services Occupations
The most common Services occupations in Nightmute are , and Cleaning & Maintenance (4 | 16.7%).
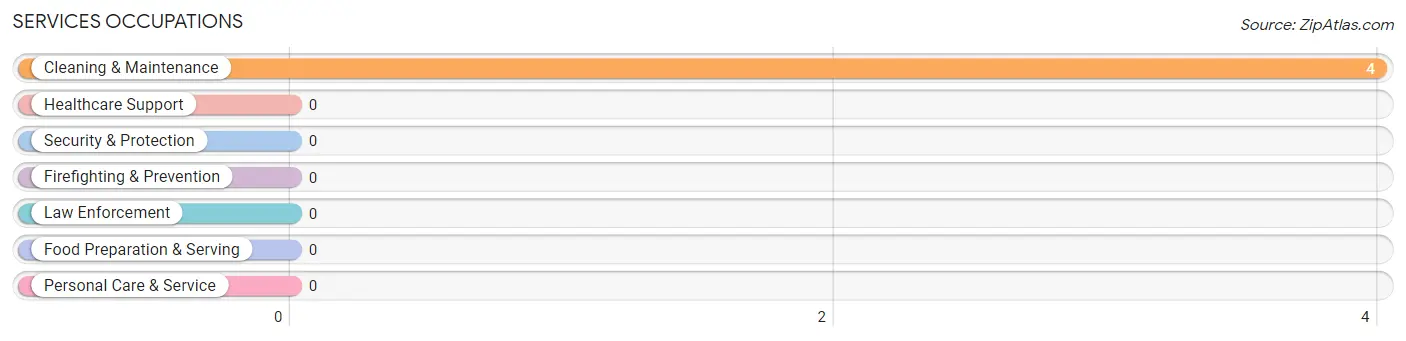
Services Occupations by Sex
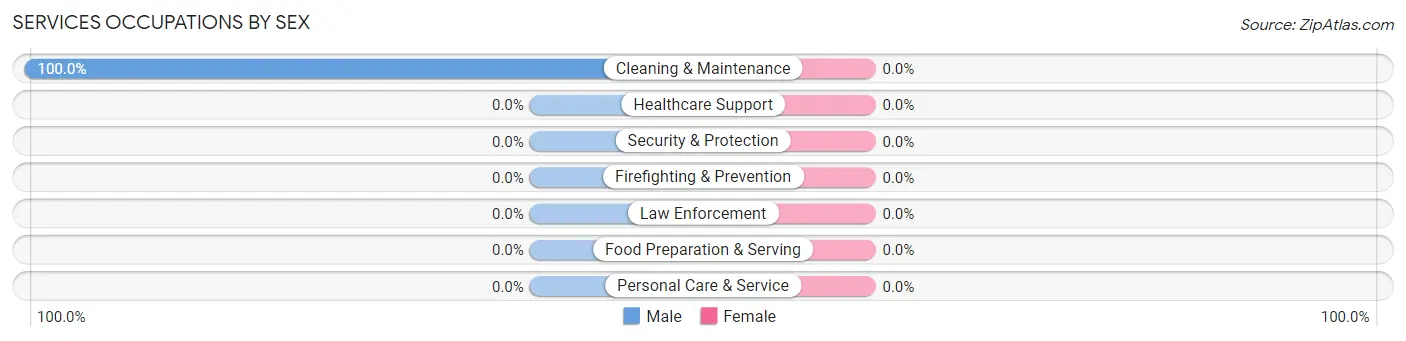
| Occupation | Male | Female |
| Healthcare Support | 0 (0.0%) | 0 (0.0%) |
| Security & Protection | 0 (0.0%) | 0 (0.0%) |
| Firefighting & Prevention | 0 (0.0%) | 0 (0.0%) |
| Law Enforcement | 0 (0.0%) | 0 (0.0%) |
| Food Preparation & Serving | 0 (0.0%) | 0 (0.0%) |
| Cleaning & Maintenance | 4 (100.0%) | 0 (0.0%) |
| Personal Care & Service | 0 (0.0%) | 0 (0.0%) |
| Total (Category) | 4 (100.0%) | 0 (0.0%) |
| Total (Overall) | 19 (79.2%) | 5 (20.8%) |
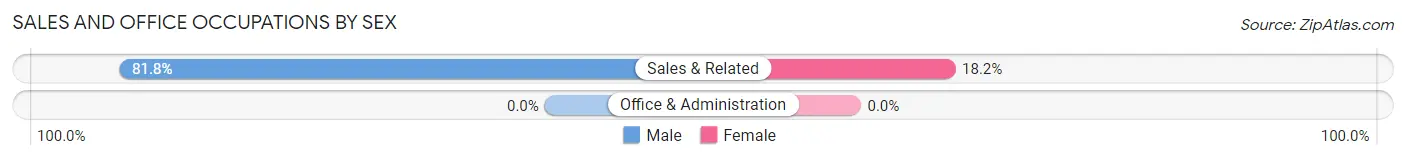
Sales and Office Occupations
The most common Sales and Office occupations in Nightmute are , and Sales & Related (11 | 45.8%).
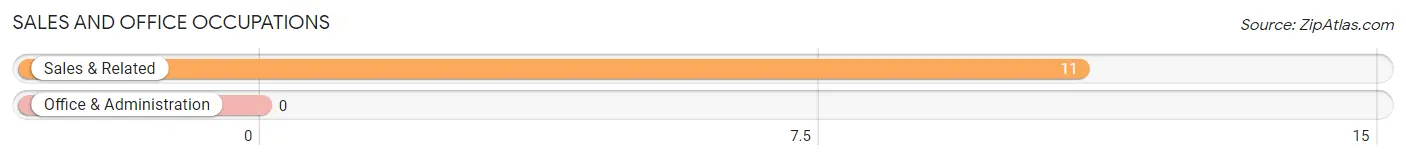
Sales and Office Occupations by Sex
| Occupation | Male | Female |
| Sales & Related | 9 (81.8%) | 2 (18.2%) |
| Office & Administration | 0 (0.0%) | 0 (0.0%) |
| Total (Category) | 9 (81.8%) | 2 (18.2%) |
| Total (Overall) | 19 (79.2%) | 5 (20.8%) |
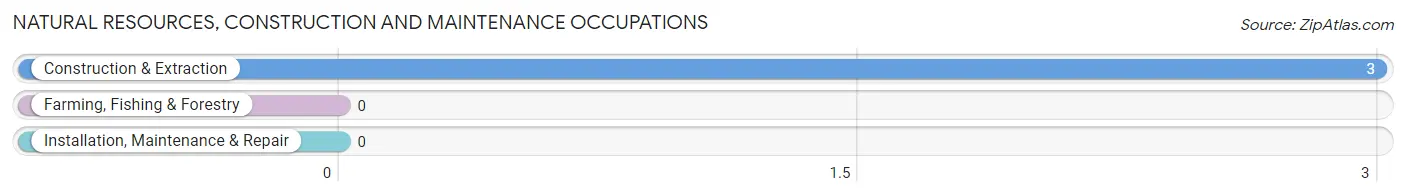
Natural Resources, Construction and Maintenance Occupations
The most common Natural Resources, Construction and Maintenance occupations in Nightmute are , and Construction & Extraction (3 | 12.5%).
Natural Resources, Construction and Maintenance Occupations by Sex
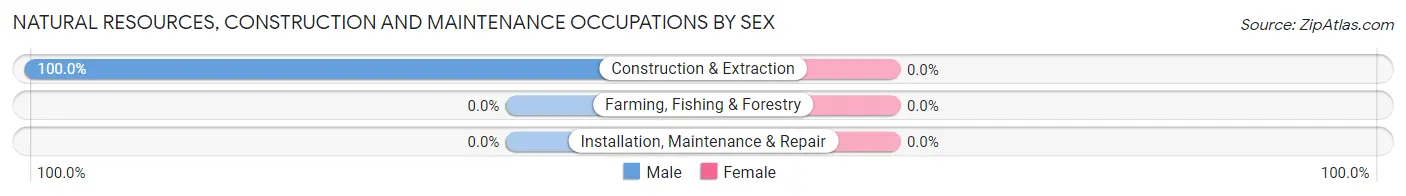
| Occupation | Male | Female |
| Farming, Fishing & Forestry | 0 (0.0%) | 0 (0.0%) |
| Construction & Extraction | 3 (100.0%) | 0 (0.0%) |
| Installation, Maintenance & Repair | 0 (0.0%) | 0 (0.0%) |
| Total (Category) | 3 (100.0%) | 0 (0.0%) |
| Total (Overall) | 19 (79.2%) | 5 (20.8%) |
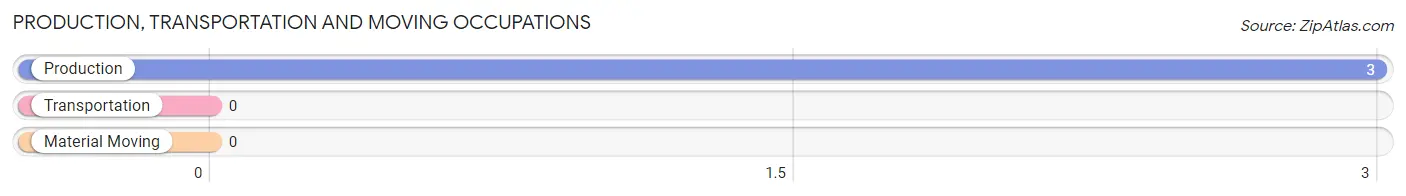
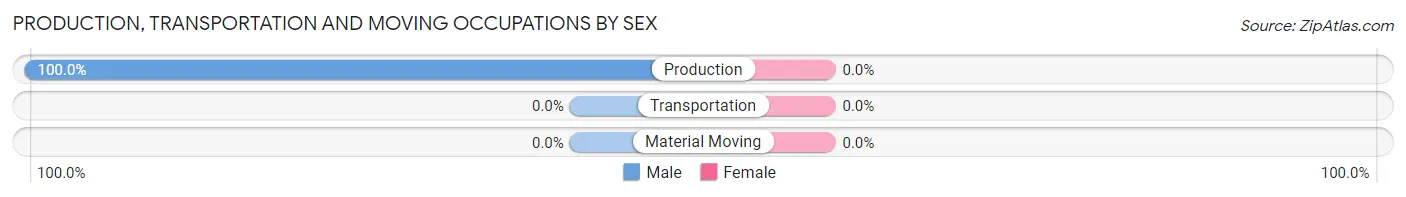
Production, Transportation and Moving Occupations
The most common Production, Transportation and Moving occupations in Nightmute are , and Production (3 | 12.5%).
Production, Transportation and Moving Occupations by Sex
| Occupation | Male | Female |
| Production | 3 (100.0%) | 0 (0.0%) |
| Transportation | 0 (0.0%) | 0 (0.0%) |
| Material Moving | 0 (0.0%) | 0 (0.0%) |
| Total (Category) | 3 (100.0%) | 0 (0.0%) |
| Total (Overall) | 19 (79.2%) | 5 (20.8%) |
Employment Industries by Sex in Nightmute
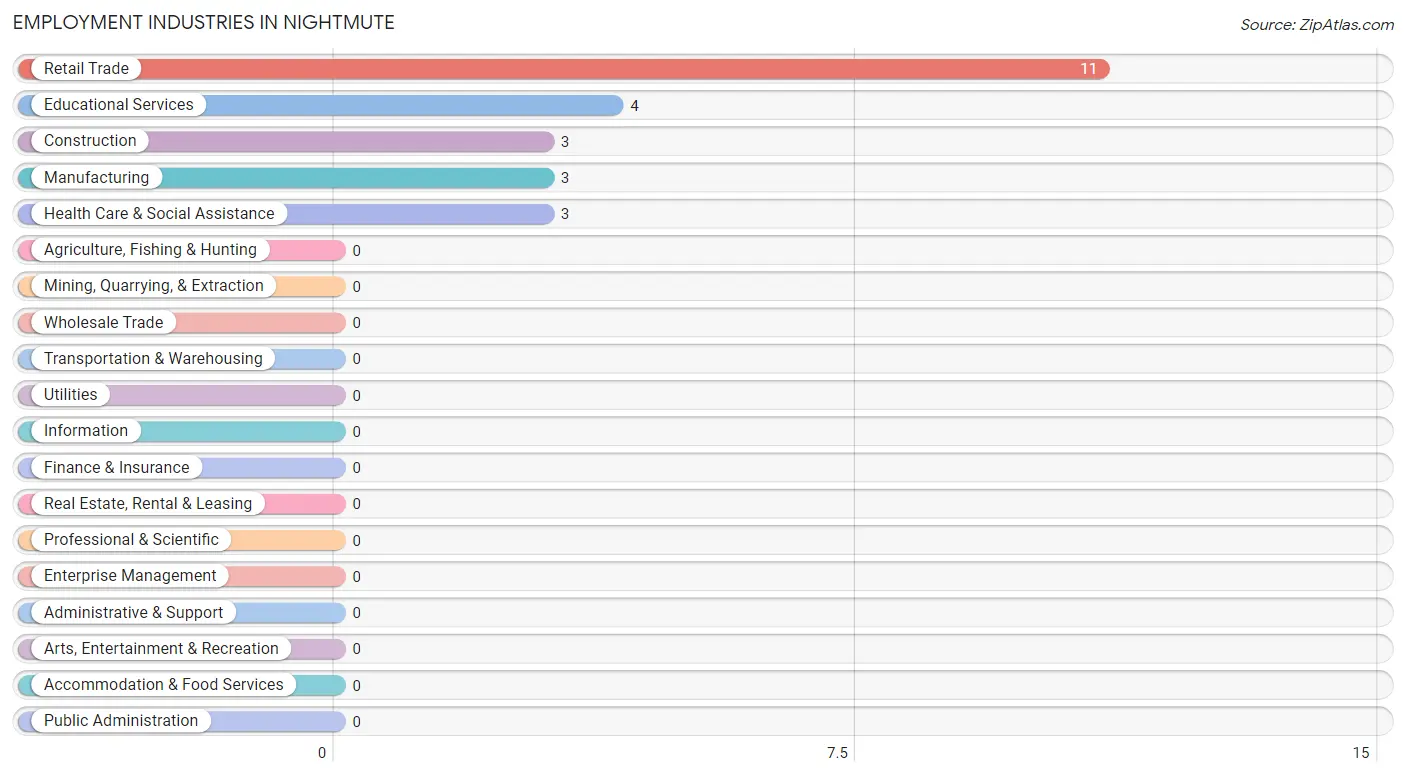
Employment Industries in Nightmute
The major employment industries in Nightmute include Retail Trade (11 | 45.8%), Educational Services (4 | 16.7%), Construction (3 | 12.5%), Manufacturing (3 | 12.5%), and Health Care & Social Assistance (3 | 12.5%).
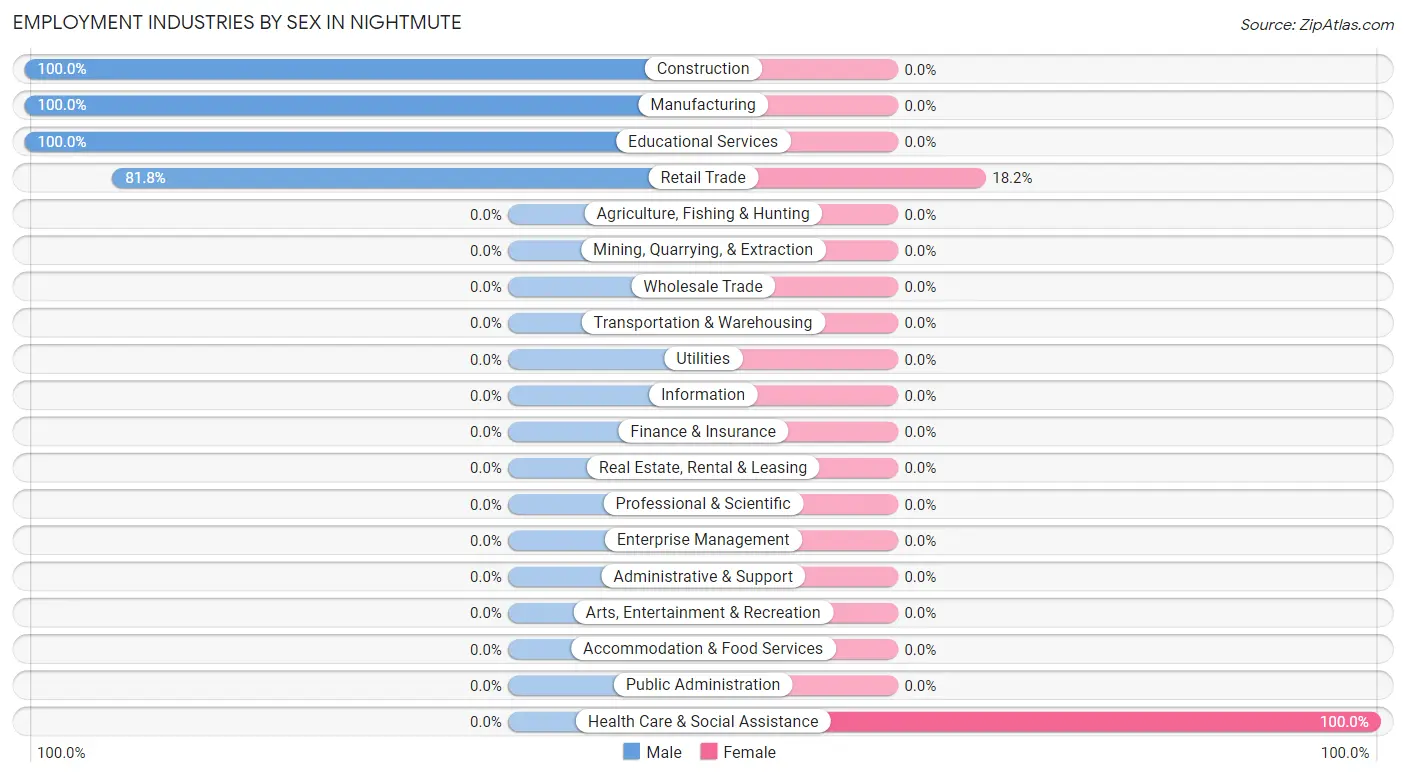
Employment Industries by Sex in Nightmute
The Nightmute industries that see more men than women are Construction (100.0%), Manufacturing (100.0%), and Educational Services (100.0%), whereas the industries that tend to have a higher number of women are Health Care & Social Assistance (100.0%), and Retail Trade (18.2%).
| Industry | Male | Female |
| Agriculture, Fishing & Hunting | 0 (0.0%) | 0 (0.0%) |
| Mining, Quarrying, & Extraction | 0 (0.0%) | 0 (0.0%) |
| Construction | 3 (100.0%) | 0 (0.0%) |
| Manufacturing | 3 (100.0%) | 0 (0.0%) |
| Wholesale Trade | 0 (0.0%) | 0 (0.0%) |
| Retail Trade | 9 (81.8%) | 2 (18.2%) |
| Transportation & Warehousing | 0 (0.0%) | 0 (0.0%) |
| Utilities | 0 (0.0%) | 0 (0.0%) |
| Information | 0 (0.0%) | 0 (0.0%) |
| Finance & Insurance | 0 (0.0%) | 0 (0.0%) |
| Real Estate, Rental & Leasing | 0 (0.0%) | 0 (0.0%) |
| Professional & Scientific | 0 (0.0%) | 0 (0.0%) |
| Enterprise Management | 0 (0.0%) | 0 (0.0%) |
| Administrative & Support | 0 (0.0%) | 0 (0.0%) |
| Educational Services | 4 (100.0%) | 0 (0.0%) |
| Health Care & Social Assistance | 0 (0.0%) | 3 (100.0%) |
| Arts, Entertainment & Recreation | 0 (0.0%) | 0 (0.0%) |
| Accommodation & Food Services | 0 (0.0%) | 0 (0.0%) |
| Public Administration | 0 (0.0%) | 0 (0.0%) |
| Total | 19 (79.2%) | 5 (20.8%) |
Education in Nightmute
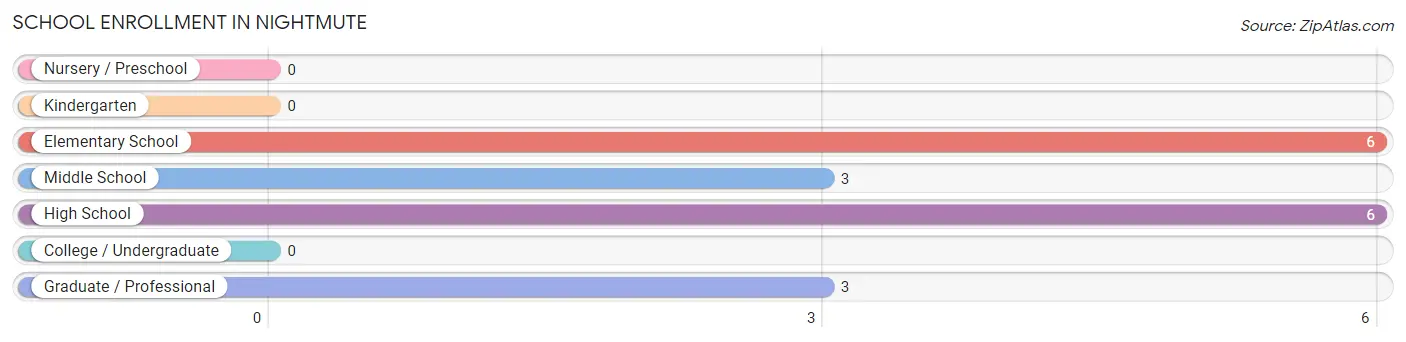
School Enrollment in Nightmute
The most common levels of schooling among the 18 students in Nightmute are elementary school (6 | 33.3%), high school (6 | 33.3%), and middle school (3 | 16.7%).
| School Level | # Students | % Students |
| Nursery / Preschool | 0 | 0.0% |
| Kindergarten | 0 | 0.0% |
| Elementary School | 6 | 33.3% |
| Middle School | 3 | 16.7% |
| High School | 6 | 33.3% |
| College / Undergraduate | 0 | 0.0% |
| Graduate / Professional | 3 | 16.7% |
| Total | 18 | 100.0% |
School Enrollment by Age by Funding Source in Nightmute
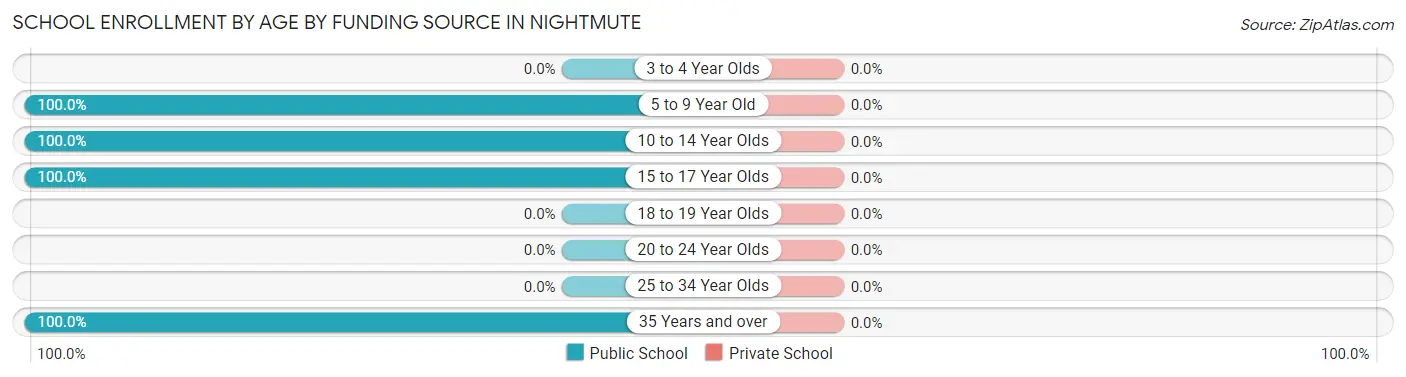
| Age Bracket | Public School | Private School |
| 3 to 4 Year Olds | 0 (0.0%) | 0 (0.0%) |
| 5 to 9 Year Old | 6 (100.0%) | 0 (0.0%) |
| 10 to 14 Year Olds | 3 (100.0%) | 0 (0.0%) |
| 15 to 17 Year Olds | 6 (100.0%) | 0 (0.0%) |
| 18 to 19 Year Olds | 0 (0.0%) | 0 (0.0%) |
| 20 to 24 Year Olds | 0 (0.0%) | 0 (0.0%) |
| 25 to 34 Year Olds | 0 (0.0%) | 0 (0.0%) |
| 35 Years and over | 3 (100.0%) | 0 (0.0%) |
| Total | 18 (100.0%) | 0 (0.0%) |
Educational Attainment by Field of Study in Nightmute
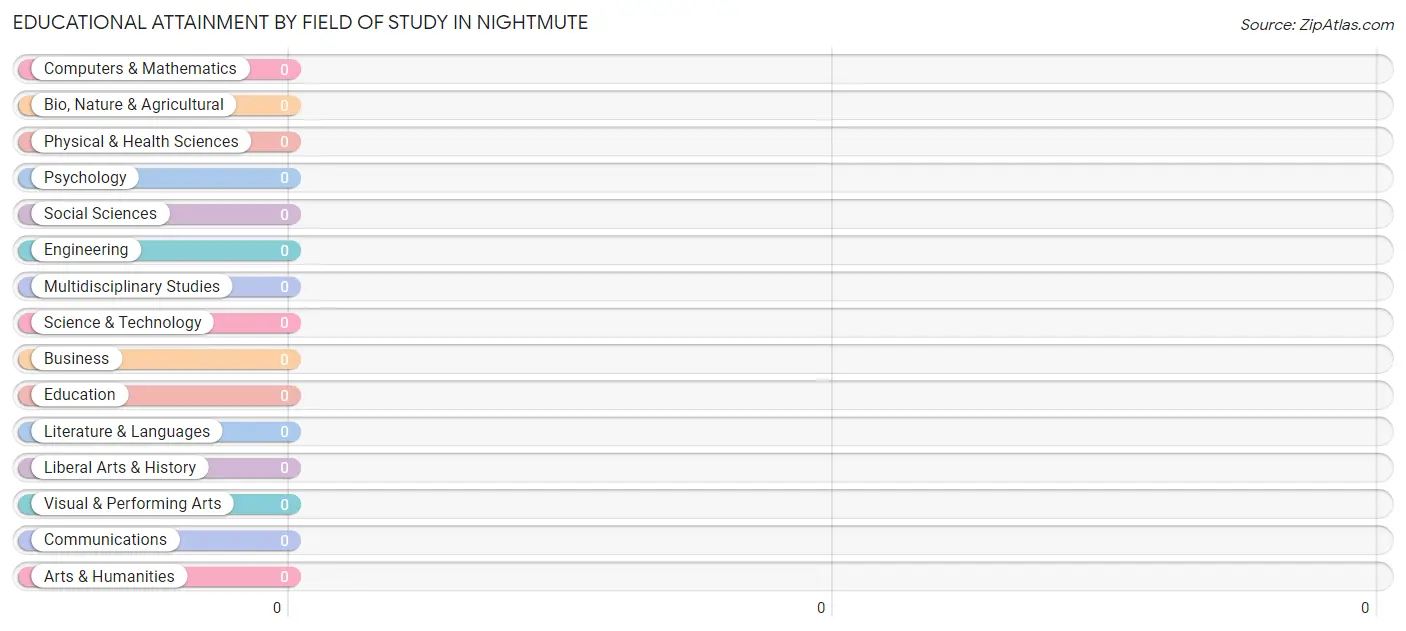
| Field of Study | # Graduates | % Graduates |
| Computers & Mathematics | 0 | 0.0% |
| Bio, Nature & Agricultural | 0 | 0.0% |
| Physical & Health Sciences | 0 | 0.0% |
| Psychology | 0 | 0.0% |
| Social Sciences | 0 | 0.0% |
| Engineering | 0 | 0.0% |
| Multidisciplinary Studies | 0 | 0.0% |
| Science & Technology | 0 | 0.0% |
| Business | 0 | 0.0% |
| Education | 0 | 0.0% |
| Literature & Languages | 0 | 0.0% |
| Liberal Arts & History | 0 | 0.0% |
| Visual & Performing Arts | 0 | 0.0% |
| Communications | 0 | 0.0% |
| Arts & Humanities | 0 | 0.0% |
| Total | 0 | 0.0% |
Transportation & Commute in Nightmute
Vehicle Availability by Sex in Nightmute
The most prevalent vehicle ownership categories in Nightmute are males with no vehicle (19, accounting for 100.0%) and females with no vehicle (5, making up 380.0%).
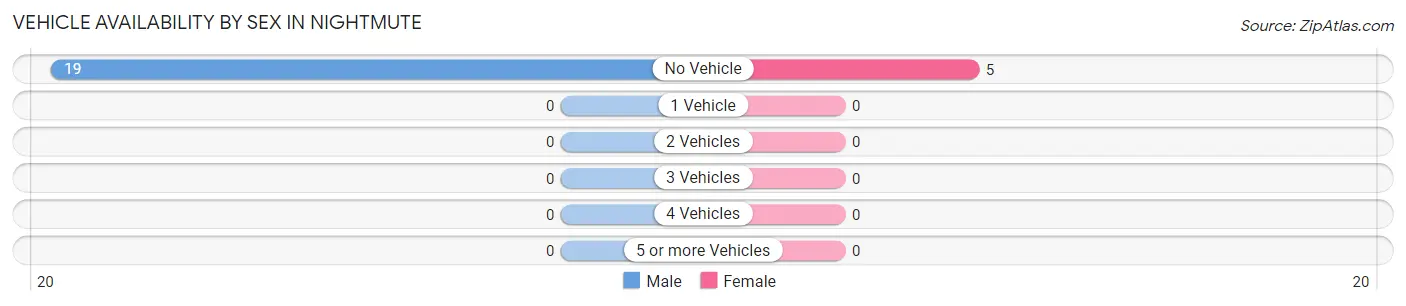
| Vehicles Available | Male | Female |
| No Vehicle | 19 (100.0%) | 5 (100.0%) |
| 1 Vehicle | 0 (0.0%) | 0 (0.0%) |
| 2 Vehicles | 0 (0.0%) | 0 (0.0%) |
| 3 Vehicles | 0 (0.0%) | 0 (0.0%) |
| 4 Vehicles | 0 (0.0%) | 0 (0.0%) |
| 5 or more Vehicles | 0 (0.0%) | 0 (0.0%) |
| Total | 19 (100.0%) | 5 (100.0%) |
Commute Time in Nightmute
The most frequently occuring commute durations in Nightmute are 5 to 9 minutes (21 commuters, 87.5%), less than 5 minutes (3 commuters, 12.5%), and 10 to 14 minutes (0 commuters, 0.0%).
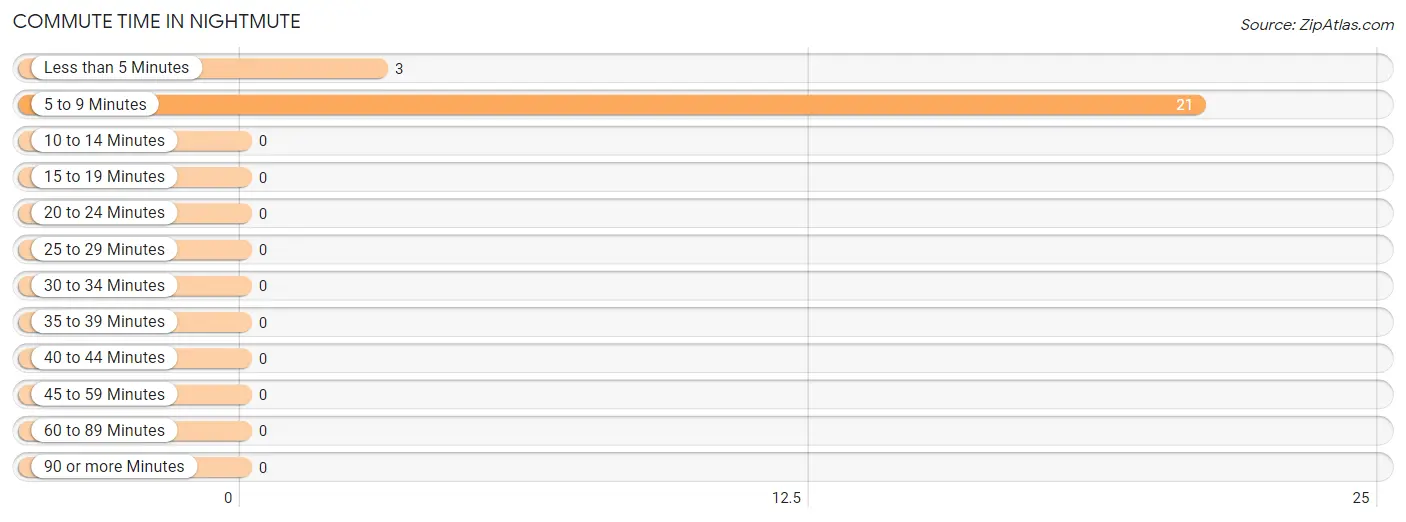
| Commute Time | # Commuters | % Commuters |
| Less than 5 Minutes | 3 | 12.5% |
| 5 to 9 Minutes | 21 | 87.5% |
| 10 to 14 Minutes | 0 | 0.0% |
| 15 to 19 Minutes | 0 | 0.0% |
| 20 to 24 Minutes | 0 | 0.0% |
| 25 to 29 Minutes | 0 | 0.0% |
| 30 to 34 Minutes | 0 | 0.0% |
| 35 to 39 Minutes | 0 | 0.0% |
| 40 to 44 Minutes | 0 | 0.0% |
| 45 to 59 Minutes | 0 | 0.0% |
| 60 to 89 Minutes | 0 | 0.0% |
| 90 or more Minutes | 0 | 0.0% |
Commute Time by Sex in Nightmute
The most common commute times in Nightmute are 5 to 9 minutes (16 commuters, 84.2%) for males and 5 to 9 minutes (5 commuters, 100.0%) for females.
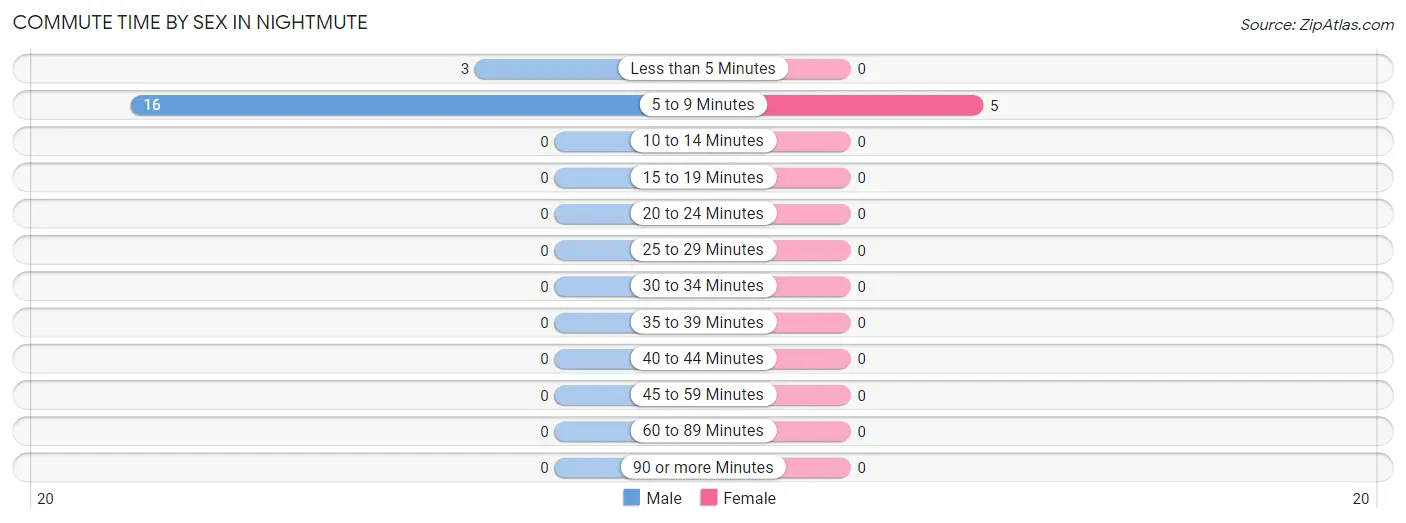
| Commute Time | Male | Female |
| Less than 5 Minutes | 3 (15.8%) | 0 (0.0%) |
| 5 to 9 Minutes | 16 (84.2%) | 5 (100.0%) |
| 10 to 14 Minutes | 0 (0.0%) | 0 (0.0%) |
| 15 to 19 Minutes | 0 (0.0%) | 0 (0.0%) |
| 20 to 24 Minutes | 0 (0.0%) | 0 (0.0%) |
| 25 to 29 Minutes | 0 (0.0%) | 0 (0.0%) |
| 30 to 34 Minutes | 0 (0.0%) | 0 (0.0%) |
| 35 to 39 Minutes | 0 (0.0%) | 0 (0.0%) |
| 40 to 44 Minutes | 0 (0.0%) | 0 (0.0%) |
| 45 to 59 Minutes | 0 (0.0%) | 0 (0.0%) |
| 60 to 89 Minutes | 0 (0.0%) | 0 (0.0%) |
| 90 or more Minutes | 0 (0.0%) | 0 (0.0%) |
Time of Departure to Work by Sex in Nightmute
The most frequent times of departure to work in Nightmute are 8:00 AM to 8:29 AM (6, 31.6%) for males and 8:00 AM to 8:29 AM (3, 60.0%) for females.
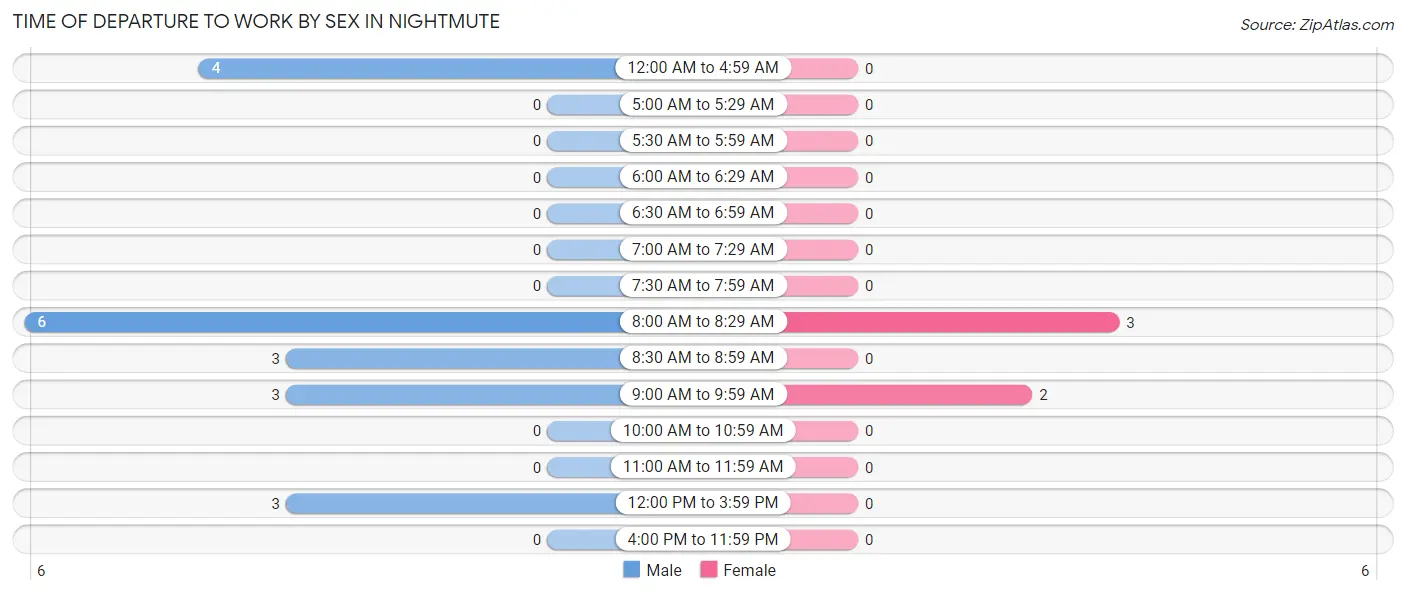
| Time of Departure | Male | Female |
| 12:00 AM to 4:59 AM | 4 (21.0%) | 0 (0.0%) |
| 5:00 AM to 5:29 AM | 0 (0.0%) | 0 (0.0%) |
| 5:30 AM to 5:59 AM | 0 (0.0%) | 0 (0.0%) |
| 6:00 AM to 6:29 AM | 0 (0.0%) | 0 (0.0%) |
| 6:30 AM to 6:59 AM | 0 (0.0%) | 0 (0.0%) |
| 7:00 AM to 7:29 AM | 0 (0.0%) | 0 (0.0%) |
| 7:30 AM to 7:59 AM | 0 (0.0%) | 0 (0.0%) |
| 8:00 AM to 8:29 AM | 6 (31.6%) | 3 (60.0%) |
| 8:30 AM to 8:59 AM | 3 (15.8%) | 0 (0.0%) |
| 9:00 AM to 9:59 AM | 3 (15.8%) | 2 (40.0%) |
| 10:00 AM to 10:59 AM | 0 (0.0%) | 0 (0.0%) |
| 11:00 AM to 11:59 AM | 0 (0.0%) | 0 (0.0%) |
| 12:00 PM to 3:59 PM | 3 (15.8%) | 0 (0.0%) |
| 4:00 PM to 11:59 PM | 0 (0.0%) | 0 (0.0%) |
| Total | 19 (100.0%) | 5 (100.0%) |
Housing Occupancy in Nightmute
Occupancy by Ownership in Nightmute
Of the total 16 dwellings in Nightmute, owner-occupied units account for 16 (100.0%), while renter-occupied units make up 0 (0.0%).
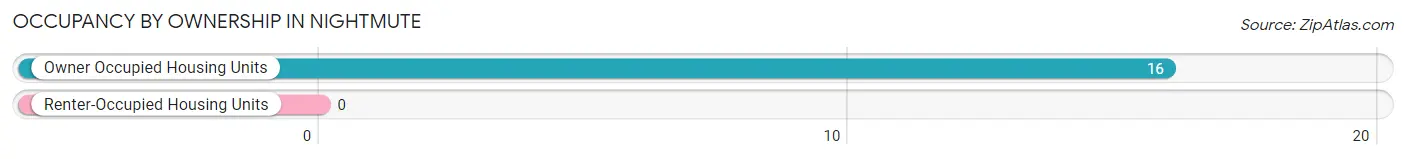
| Occupancy | # Housing Units | % Housing Units |
| Owner Occupied Housing Units | 16 | 100.0% |
| Renter-Occupied Housing Units | 0 | 0.0% |
| Total Occupied Housing Units | 16 | 100.0% |
Occupancy by Household Size in Nightmute
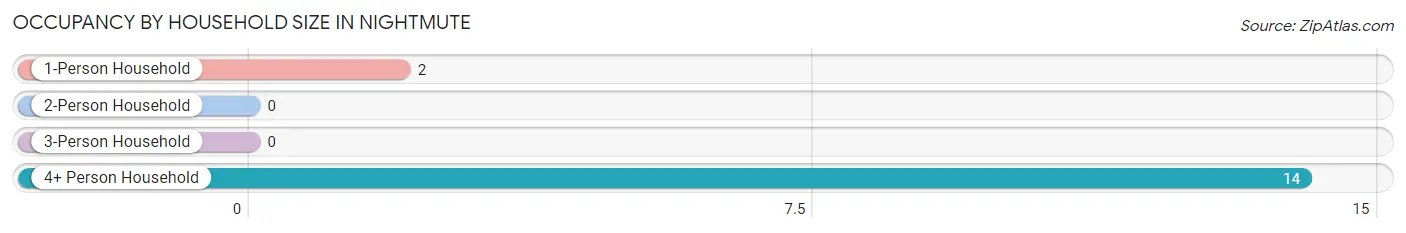
| Household Size | # Housing Units | % Housing Units |
| 1-Person Household | 2 | 12.5% |
| 2-Person Household | 0 | 0.0% |
| 3-Person Household | 0 | 0.0% |
| 4+ Person Household | 14 | 87.5% |
| Total Housing Units | 16 | 100.0% |
Occupancy by Ownership by Household Size in Nightmute
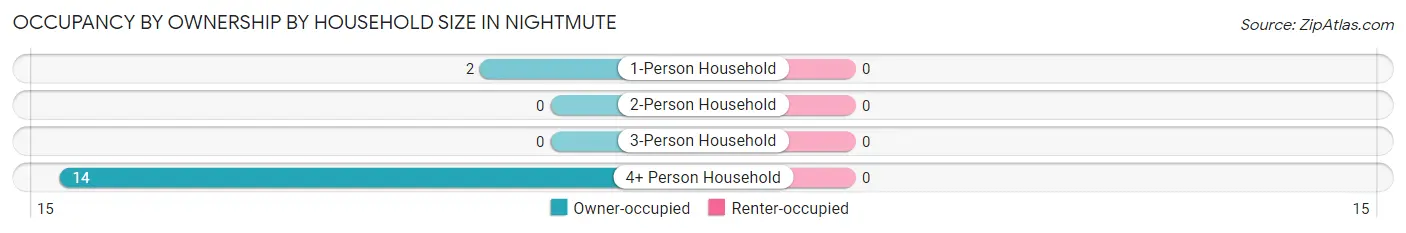
| Household Size | Owner-occupied | Renter-occupied |
| 1-Person Household | 2 (100.0%) | 0 (0.0%) |
| 2-Person Household | 0 (0.0%) | 0 (0.0%) |
| 3-Person Household | 0 (0.0%) | 0 (0.0%) |
| 4+ Person Household | 14 (100.0%) | 0 (0.0%) |
| Total Housing Units | 16 (100.0%) | 0 (0.0%) |
Occupancy by Educational Attainment in Nightmute
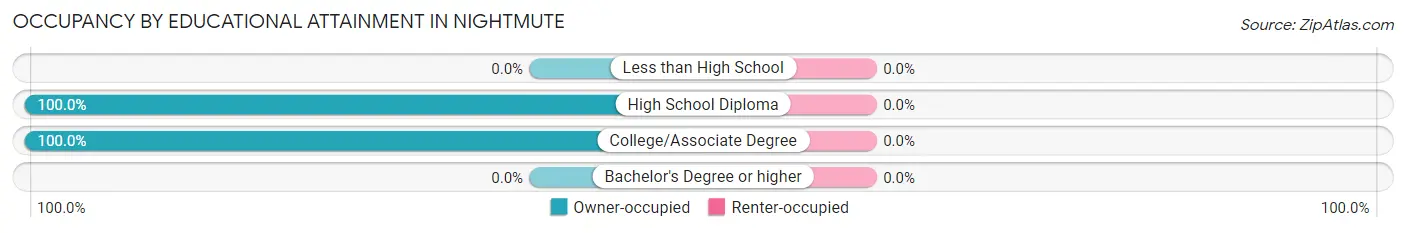
| Household Size | Owner-occupied | Renter-occupied |
| Less than High School | 0 (0.0%) | 0 (0.0%) |
| High School Diploma | 8 (100.0%) | 0 (0.0%) |
| College/Associate Degree | 8 (100.0%) | 0 (0.0%) |
| Bachelor's Degree or higher | 0 (0.0%) | 0 (0.0%) |
Occupancy by Age of Householder in Nightmute
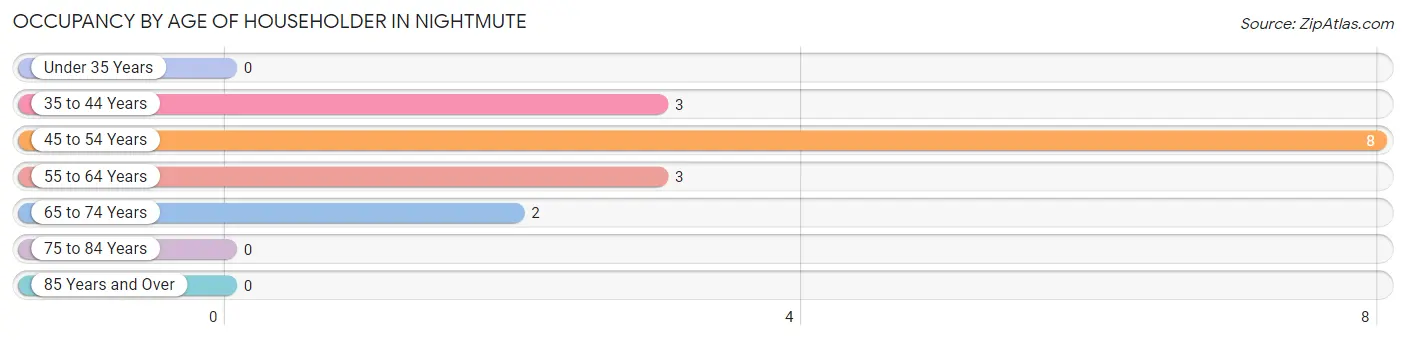
| Age Bracket | # Households | % Households |
| Under 35 Years | 0 | 0.0% |
| 35 to 44 Years | 3 | 18.8% |
| 45 to 54 Years | 8 | 50.0% |
| 55 to 64 Years | 3 | 18.8% |
| 65 to 74 Years | 2 | 12.5% |
| 75 to 84 Years | 0 | 0.0% |
| 85 Years and Over | 0 | 0.0% |
| Total | 16 | 100.0% |
Housing Finances in Nightmute
Median Income by Occupancy in Nightmute
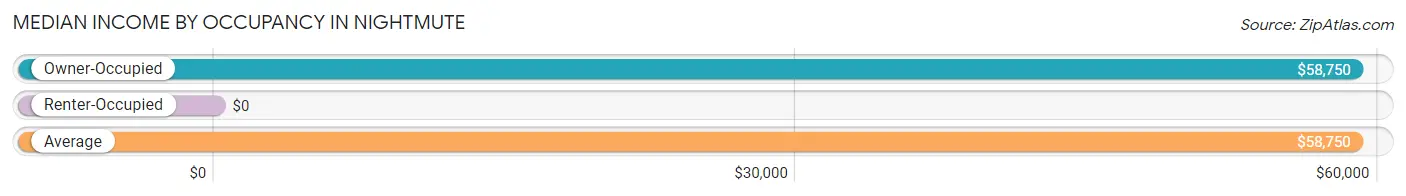
| Occupancy Type | # Households | Median Income |
| Owner-Occupied | 16 (100.0%) | $58,750 |
| Renter-Occupied | 0 (0.0%) | $0 |
| Average | 16 (100.0%) | $58,750 |
Occupancy by Householder Income Bracket in Nightmute
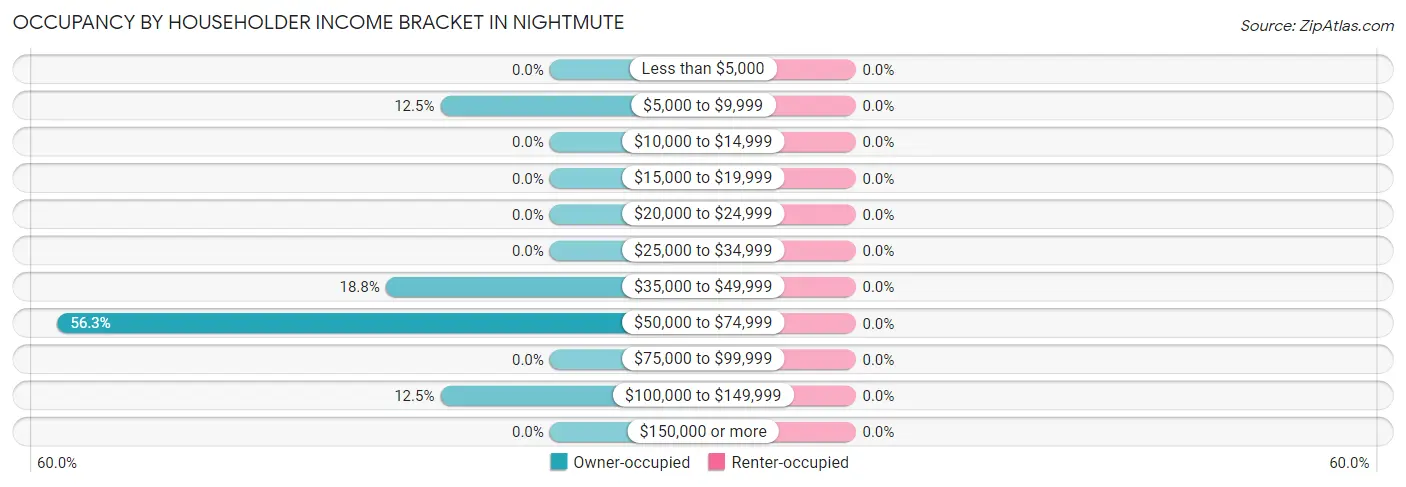
| Income Bracket | Owner-occupied | Renter-occupied |
| Less than $5,000 | 0 (0.0%) | 0 (0.0%) |
| $5,000 to $9,999 | 2 (12.5%) | 0 (0.0%) |
| $10,000 to $14,999 | 0 (0.0%) | 0 (0.0%) |
| $15,000 to $19,999 | 0 (0.0%) | 0 (0.0%) |
| $20,000 to $24,999 | 0 (0.0%) | 0 (0.0%) |
| $25,000 to $34,999 | 0 (0.0%) | 0 (0.0%) |
| $35,000 to $49,999 | 3 (18.8%) | 0 (0.0%) |
| $50,000 to $74,999 | 9 (56.2%) | 0 (0.0%) |
| $75,000 to $99,999 | 0 (0.0%) | 0 (0.0%) |
| $100,000 to $149,999 | 2 (12.5%) | 0 (0.0%) |
| $150,000 or more | 0 (0.0%) | 0 (0.0%) |
| Total | 16 (100.0%) | 0 (0.0%) |
Monthly Housing Cost Tiers in Nightmute
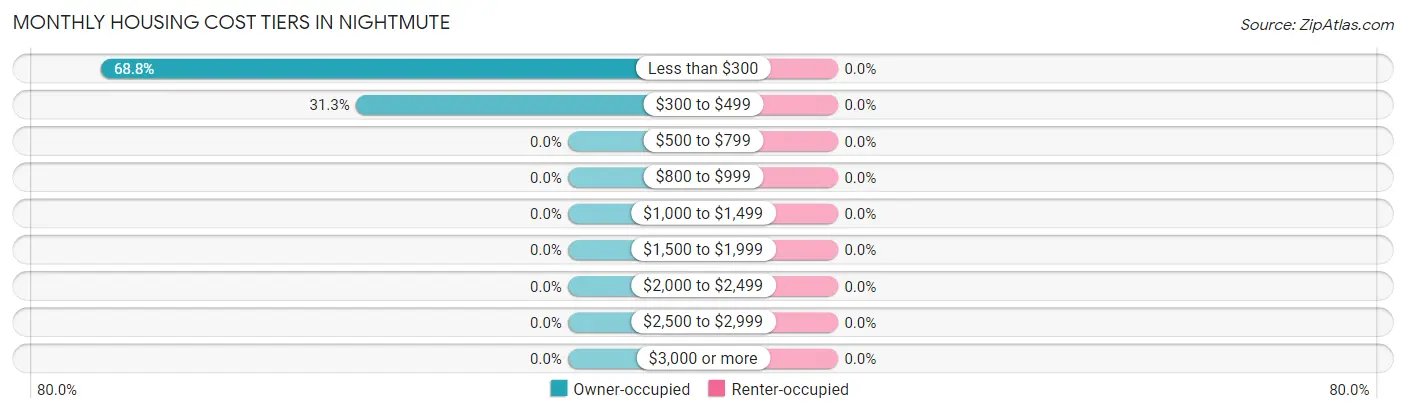
| Monthly Cost | Owner-occupied | Renter-occupied |
| Less than $300 | 11 (68.8%) | 0 (0.0%) |
| $300 to $499 | 5 (31.2%) | 0 (0.0%) |
| $500 to $799 | 0 (0.0%) | 0 (0.0%) |
| $800 to $999 | 0 (0.0%) | 0 (0.0%) |
| $1,000 to $1,499 | 0 (0.0%) | 0 (0.0%) |
| $1,500 to $1,999 | 0 (0.0%) | 0 (0.0%) |
| $2,000 to $2,499 | 0 (0.0%) | 0 (0.0%) |
| $2,500 to $2,999 | 0 (0.0%) | 0 (0.0%) |
| $3,000 or more | 0 (0.0%) | 0 (0.0%) |
| Total | 16 (100.0%) | 0 (0.0%) |
Physical Housing Characteristics in Nightmute
Housing Structures in Nightmute
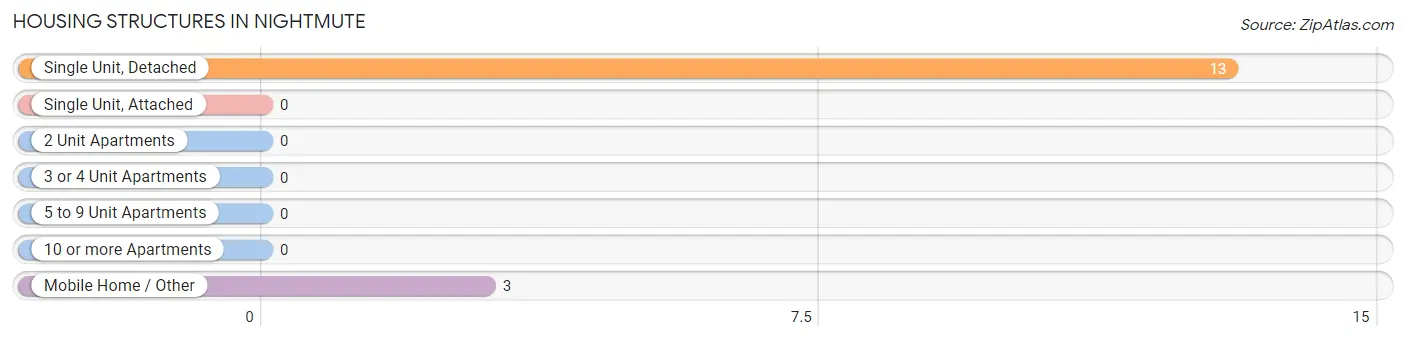
| Structure Type | # Housing Units | % Housing Units |
| Single Unit, Detached | 13 | 81.2% |
| Single Unit, Attached | 0 | 0.0% |
| 2 Unit Apartments | 0 | 0.0% |
| 3 or 4 Unit Apartments | 0 | 0.0% |
| 5 to 9 Unit Apartments | 0 | 0.0% |
| 10 or more Apartments | 0 | 0.0% |
| Mobile Home / Other | 3 | 18.8% |
| Total | 16 | 100.0% |
Housing Structures by Occupancy in Nightmute
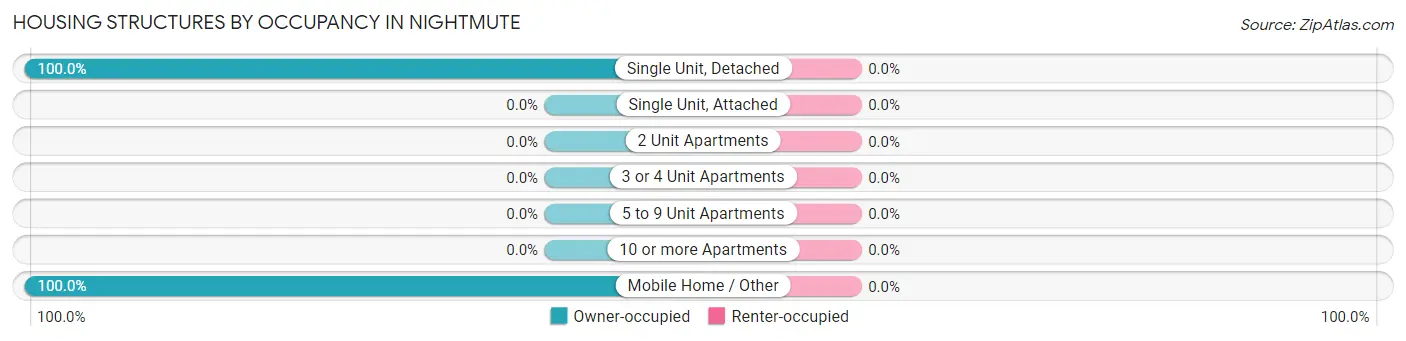
| Structure Type | Owner-occupied | Renter-occupied |
| Single Unit, Detached | 13 (100.0%) | 0 (0.0%) |
| Single Unit, Attached | 0 (0.0%) | 0 (0.0%) |
| 2 Unit Apartments | 0 (0.0%) | 0 (0.0%) |
| 3 or 4 Unit Apartments | 0 (0.0%) | 0 (0.0%) |
| 5 to 9 Unit Apartments | 0 (0.0%) | 0 (0.0%) |
| 10 or more Apartments | 0 (0.0%) | 0 (0.0%) |
| Mobile Home / Other | 3 (100.0%) | 0 (0.0%) |
| Total | 16 (100.0%) | 0 (0.0%) |
Housing Structures by Number of Rooms in Nightmute
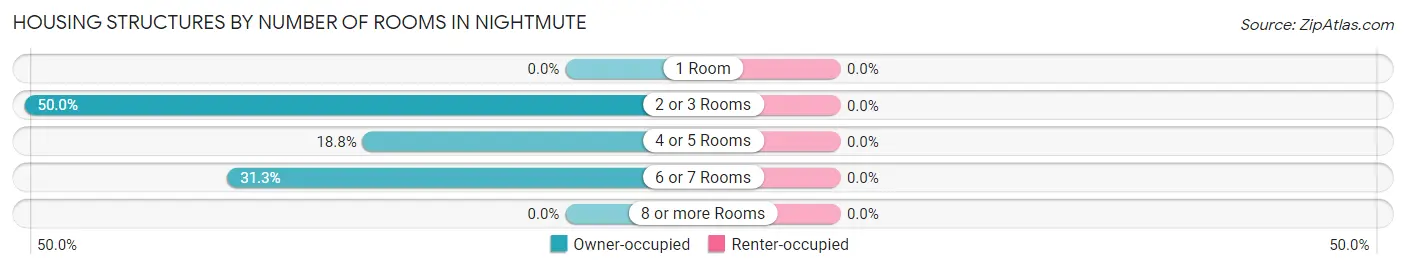
| Number of Rooms | Owner-occupied | Renter-occupied |
| 1 Room | 0 (0.0%) | 0 (0.0%) |
| 2 or 3 Rooms | 8 (50.0%) | 0 (0.0%) |
| 4 or 5 Rooms | 3 (18.8%) | 0 (0.0%) |
| 6 or 7 Rooms | 5 (31.2%) | 0 (0.0%) |
| 8 or more Rooms | 0 (0.0%) | 0 (0.0%) |
| Total | 16 (100.0%) | 0 (0.0%) |
Housing Structure by Heating Type in Nightmute
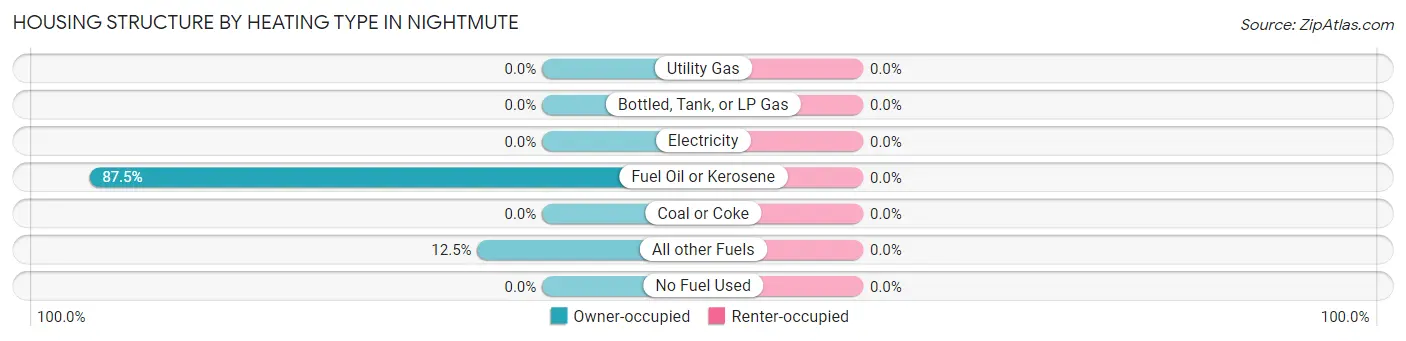
| Heating Type | Owner-occupied | Renter-occupied |
| Utility Gas | 0 (0.0%) | 0 (0.0%) |
| Bottled, Tank, or LP Gas | 0 (0.0%) | 0 (0.0%) |
| Electricity | 0 (0.0%) | 0 (0.0%) |
| Fuel Oil or Kerosene | 14 (87.5%) | 0 (0.0%) |
| Coal or Coke | 0 (0.0%) | 0 (0.0%) |
| All other Fuels | 2 (12.5%) | 0 (0.0%) |
| No Fuel Used | 0 (0.0%) | 0 (0.0%) |
| Total | 16 (100.0%) | 0 (0.0%) |
Household Vehicle Usage in Nightmute
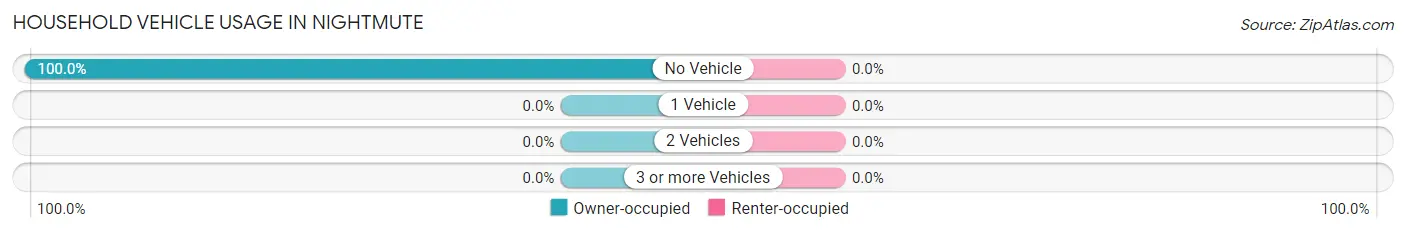
| Vehicles per Household | Owner-occupied | Renter-occupied |
| No Vehicle | 16 (100.0%) | 0 (0.0%) |
| 1 Vehicle | 0 (0.0%) | 0 (0.0%) |
| 2 Vehicles | 0 (0.0%) | 0 (0.0%) |
| 3 or more Vehicles | 0 (0.0%) | 0 (0.0%) |
| Total | 16 (100.0%) | 0 (0.0%) |
Real Estate & Mortgages in Nightmute
Real Estate and Mortgage Overview in Nightmute
| Characteristic | Without Mortgage | With Mortgage |
| Housing Units | 14 | 2 |
| Median Property Value | $9,999 | $0 |
| Median Household Income | $58,333 | $0 |
| Monthly Housing Costs | $250 | $0 |
| Real Estate Taxes | - | - |
Property Value by Mortgage Status in Nightmute
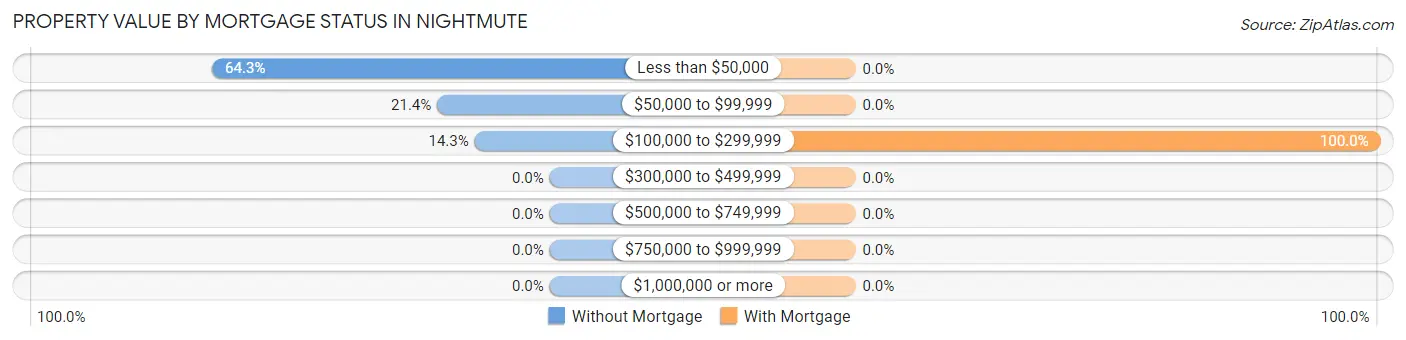
| Property Value | Without Mortgage | With Mortgage |
| Less than $50,000 | 9 (64.3%) | 0 (0.0%) |
| $50,000 to $99,999 | 3 (21.4%) | 0 (0.0%) |
| $100,000 to $299,999 | 2 (14.3%) | 2 (100.0%) |
| $300,000 to $499,999 | 0 (0.0%) | 0 (0.0%) |
| $500,000 to $749,999 | 0 (0.0%) | 0 (0.0%) |
| $750,000 to $999,999 | 0 (0.0%) | 0 (0.0%) |
| $1,000,000 or more | 0 (0.0%) | 0 (0.0%) |
| Total | 14 (100.0%) | 2 (100.0%) |
Household Income by Mortgage Status in Nightmute
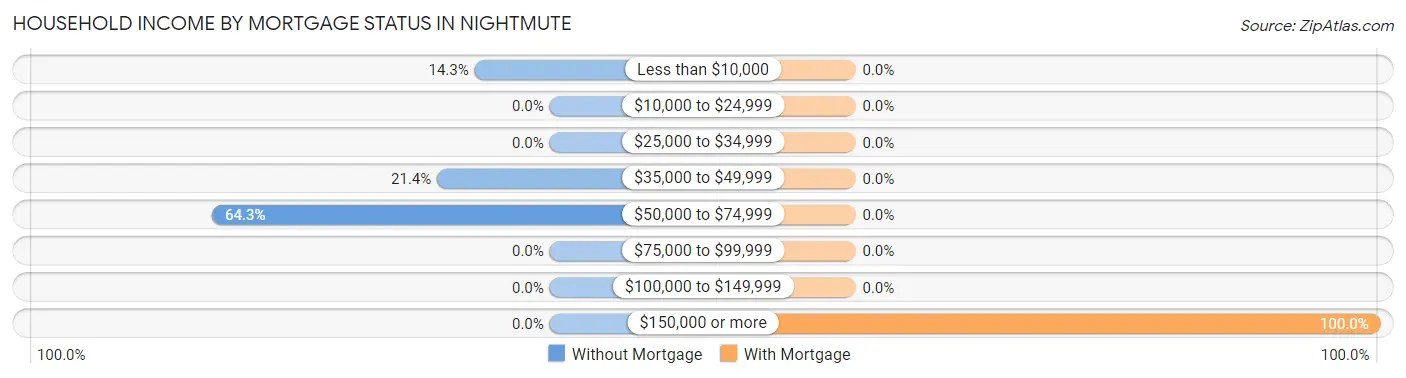
| Household Income | Without Mortgage | With Mortgage |
| Less than $10,000 | 2 (14.3%) | 0 (0.0%) |
| $10,000 to $24,999 | 0 (0.0%) | 0 (0.0%) |
| $25,000 to $34,999 | 0 (0.0%) | 0 (0.0%) |
| $35,000 to $49,999 | 3 (21.4%) | 0 (0.0%) |
| $50,000 to $74,999 | 9 (64.3%) | 0 (0.0%) |
| $75,000 to $99,999 | 0 (0.0%) | 0 (0.0%) |
| $100,000 to $149,999 | 0 (0.0%) | 0 (0.0%) |
| $150,000 or more | 0 (0.0%) | 2 (100.0%) |
| Total | 14 (100.0%) | 2 (100.0%) |
Property Value to Household Income Ratio in Nightmute
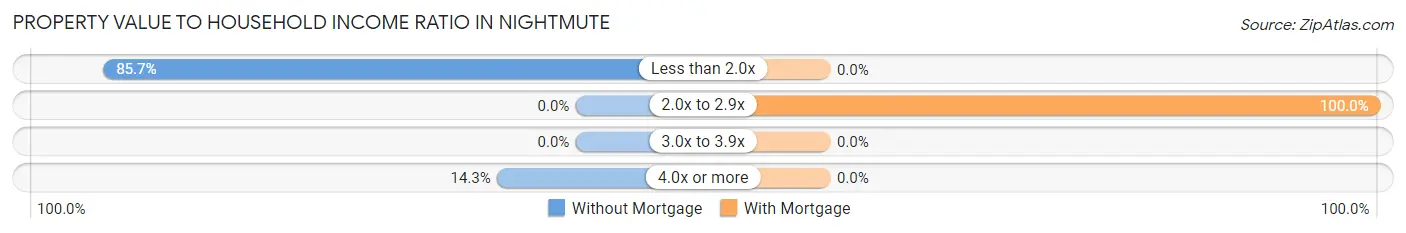
| Value-to-Income Ratio | Without Mortgage | With Mortgage |
| Less than 2.0x | 12 (85.7%) | 0 (0.0%) |
| 2.0x to 2.9x | 0 (0.0%) | 2 (100.0%) |
| 3.0x to 3.9x | 0 (0.0%) | 0 (0.0%) |
| 4.0x or more | 2 (14.3%) | 0 (0.0%) |
| Total | 14 (100.0%) | 2 (100.0%) |
Real Estate Taxes by Mortgage Status in Nightmute
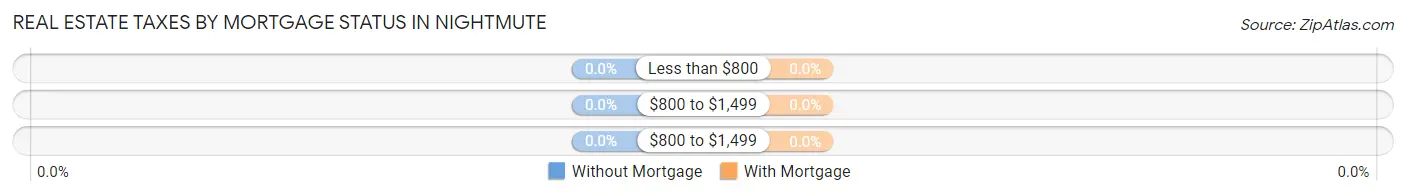
| Property Taxes | Without Mortgage | With Mortgage |
| Less than $800 | 0 (0.0%) | 0 (0.0%) |
| $800 to $1,499 | 0 (0.0%) | 0 (0.0%) |
| $800 to $1,499 | 0 (0.0%) | 0 (0.0%) |
| Total | 14 (100.0%) | 2 (100.0%) |
Health & Disability in Nightmute
Health Insurance Coverage by Age in Nightmute
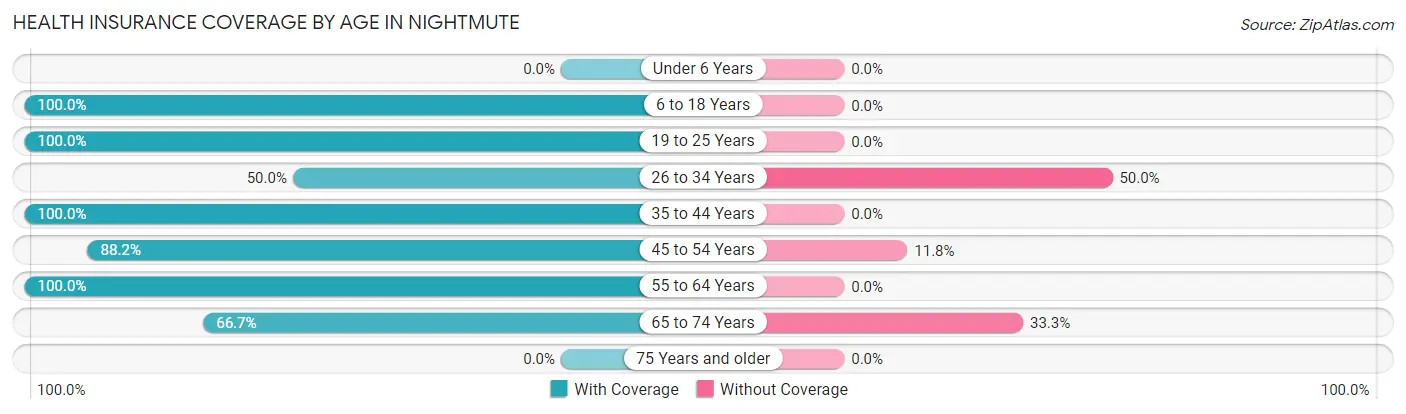
| Age Bracket | With Coverage | Without Coverage |
| Under 6 Years | 0 (0.0%) | 0 (0.0%) |
| 6 to 18 Years | 18 (100.0%) | 0 (0.0%) |
| 19 to 25 Years | 12 (100.0%) | 0 (0.0%) |
| 26 to 34 Years | 3 (50.0%) | 3 (50.0%) |
| 35 to 44 Years | 6 (100.0%) | 0 (0.0%) |
| 45 to 54 Years | 15 (88.2%) | 2 (11.8%) |
| 55 to 64 Years | 5 (100.0%) | 0 (0.0%) |
| 65 to 74 Years | 4 (66.7%) | 2 (33.3%) |
| 75 Years and older | 0 (0.0%) | 0 (0.0%) |
| Total | 63 (90.0%) | 7 (10.0%) |
Health Insurance Coverage by Citizenship Status in Nightmute
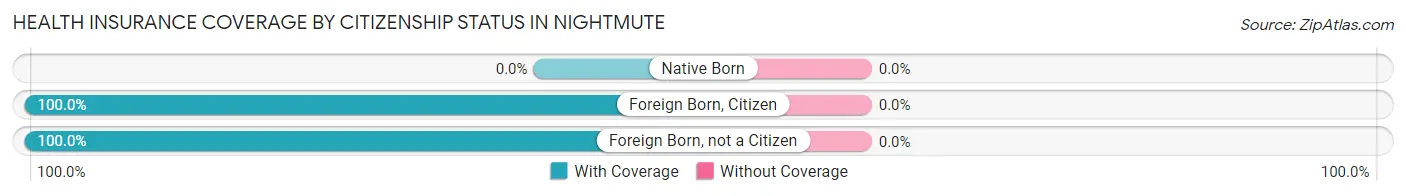
| Citizenship Status | With Coverage | Without Coverage |
| Native Born | 0 (0.0%) | 0 (0.0%) |
| Foreign Born, Citizen | 18 (100.0%) | 0 (0.0%) |
| Foreign Born, not a Citizen | 12 (100.0%) | 0 (0.0%) |
Health Insurance Coverage by Household Income in Nightmute
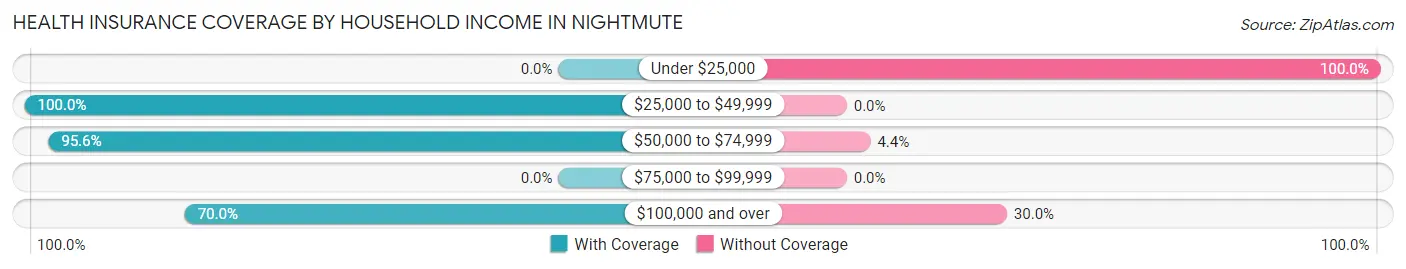
| Household Income | With Coverage | Without Coverage |
| Under $25,000 | 0 (0.0%) | 2 (100.0%) |
| $25,000 to $49,999 | 13 (100.0%) | 0 (0.0%) |
| $50,000 to $74,999 | 43 (95.6%) | 2 (4.4%) |
| $75,000 to $99,999 | 0 (0.0%) | 0 (0.0%) |
| $100,000 and over | 7 (70.0%) | 3 (30.0%) |
Public vs Private Health Insurance Coverage by Age in Nightmute
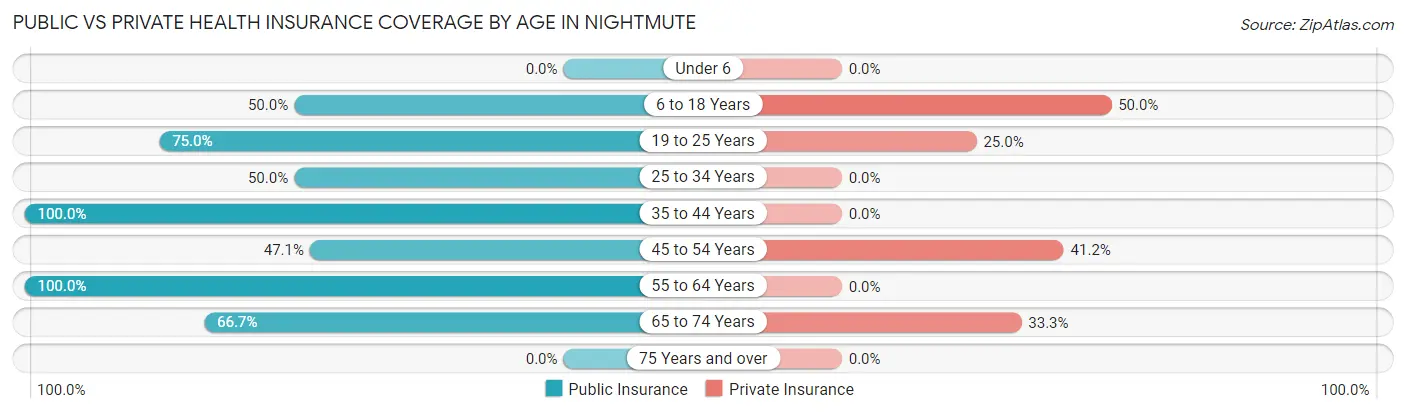
| Age Bracket | Public Insurance | Private Insurance |
| Under 6 | 0 (0.0%) | 0 (0.0%) |
| 6 to 18 Years | 9 (50.0%) | 9 (50.0%) |
| 19 to 25 Years | 9 (75.0%) | 3 (25.0%) |
| 25 to 34 Years | 3 (50.0%) | 0 (0.0%) |
| 35 to 44 Years | 6 (100.0%) | 0 (0.0%) |
| 45 to 54 Years | 8 (47.1%) | 7 (41.2%) |
| 55 to 64 Years | 5 (100.0%) | 0 (0.0%) |
| 65 to 74 Years | 4 (66.7%) | 2 (33.3%) |
| 75 Years and over | 0 (0.0%) | 0 (0.0%) |
| Total | 44 (62.9%) | 21 (30.0%) |
Disability Status by Sex by Age in Nightmute
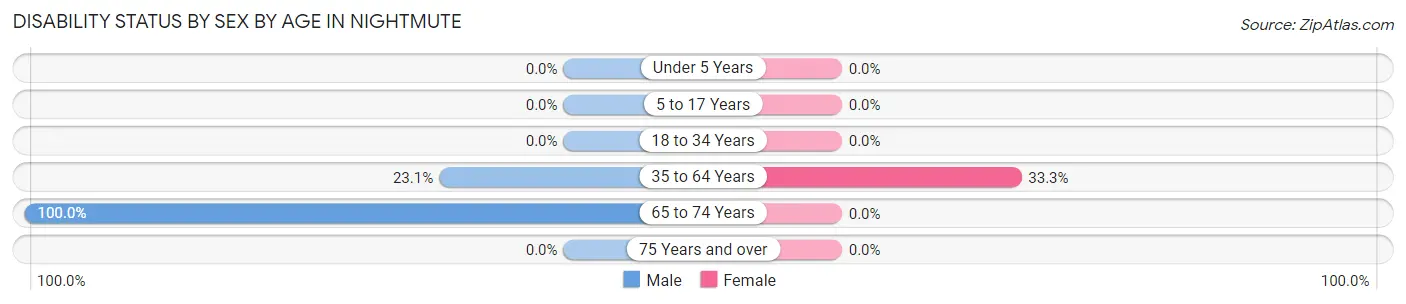
| Age Bracket | Male | Female |
| Under 5 Years | 0 (0.0%) | 0 (0.0%) |
| 5 to 17 Years | 0 (0.0%) | 0 (0.0%) |
| 18 to 34 Years | 0 (0.0%) | 0 (0.0%) |
| 35 to 64 Years | 3 (23.1%) | 5 (33.3%) |
| 65 to 74 Years | 4 (100.0%) | 0 (0.0%) |
| 75 Years and over | 0 (0.0%) | 0 (0.0%) |
Disability Class by Sex by Age in Nightmute
Disability Class: Hearing Difficulty
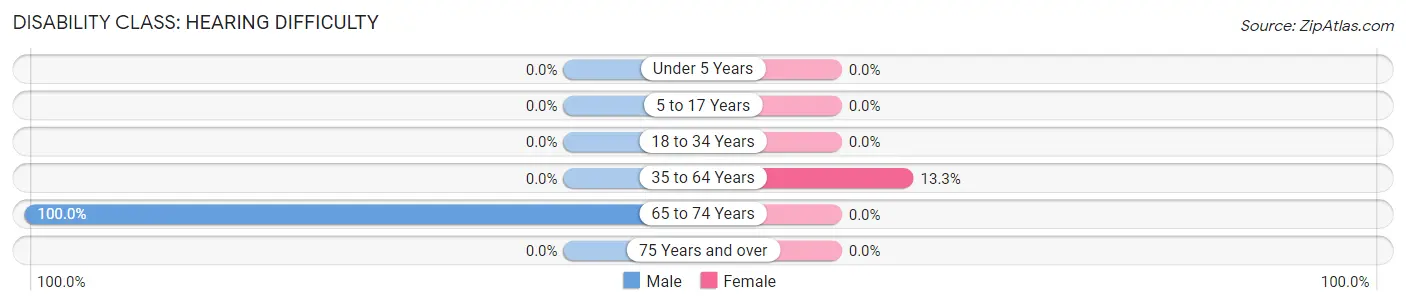
| Age Bracket | Male | Female |
| Under 5 Years | 0 (0.0%) | 0 (0.0%) |
| 5 to 17 Years | 0 (0.0%) | 0 (0.0%) |
| 18 to 34 Years | 0 (0.0%) | 0 (0.0%) |
| 35 to 64 Years | 0 (0.0%) | 2 (13.3%) |
| 65 to 74 Years | 4 (100.0%) | 0 (0.0%) |
| 75 Years and over | 0 (0.0%) | 0 (0.0%) |
Disability Class: Vision Difficulty
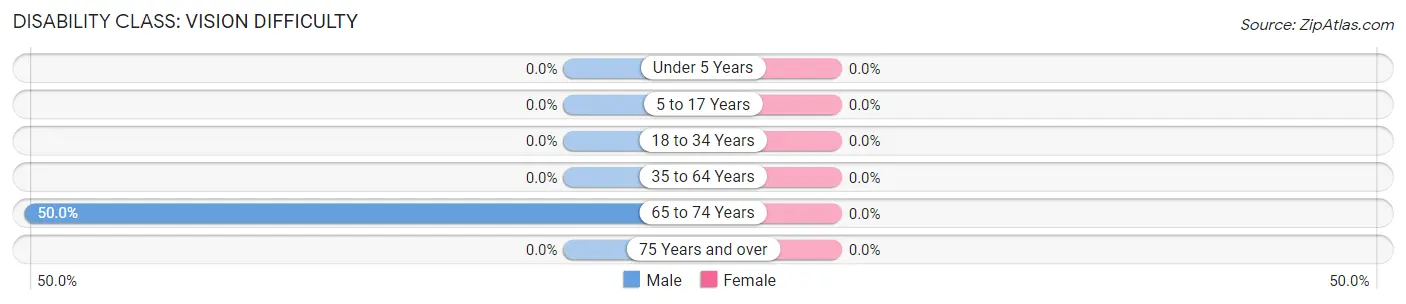
| Age Bracket | Male | Female |
| Under 5 Years | 0 (0.0%) | 0 (0.0%) |
| 5 to 17 Years | 0 (0.0%) | 0 (0.0%) |
| 18 to 34 Years | 0 (0.0%) | 0 (0.0%) |
| 35 to 64 Years | 0 (0.0%) | 0 (0.0%) |
| 65 to 74 Years | 2 (50.0%) | 0 (0.0%) |
| 75 Years and over | 0 (0.0%) | 0 (0.0%) |
Disability Class: Cognitive Difficulty
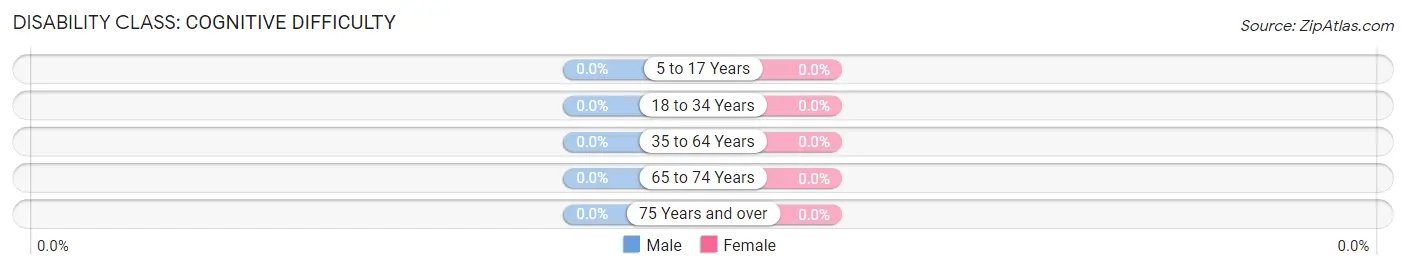
| Age Bracket | Male | Female |
| 5 to 17 Years | 0 (0.0%) | 0 (0.0%) |
| 18 to 34 Years | 0 (0.0%) | 0 (0.0%) |
| 35 to 64 Years | 0 (0.0%) | 0 (0.0%) |
| 65 to 74 Years | 0 (0.0%) | 0 (0.0%) |
| 75 Years and over | 0 (0.0%) | 0 (0.0%) |
Disability Class: Ambulatory Difficulty
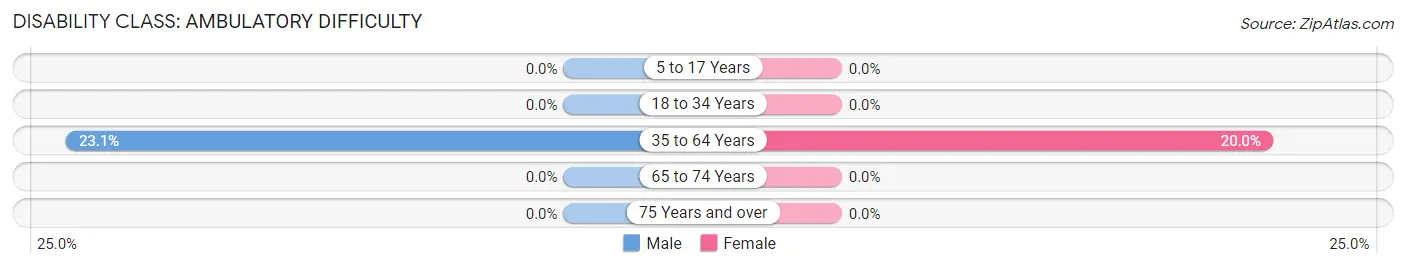
| Age Bracket | Male | Female |
| 5 to 17 Years | 0 (0.0%) | 0 (0.0%) |
| 18 to 34 Years | 0 (0.0%) | 0 (0.0%) |
| 35 to 64 Years | 3 (23.1%) | 3 (20.0%) |
| 65 to 74 Years | 0 (0.0%) | 0 (0.0%) |
| 75 Years and over | 0 (0.0%) | 0 (0.0%) |
Disability Class: Self-Care Difficulty
| Age Bracket | Male | Female |
| 5 to 17 Years | 0 (0.0%) | 0 (0.0%) |
| 18 to 34 Years | 0 (0.0%) | 0 (0.0%) |
| 35 to 64 Years | 0 (0.0%) | 0 (0.0%) |
| 65 to 74 Years | 0 (0.0%) | 0 (0.0%) |
| 75 Years and over | 0 (0.0%) | 0 (0.0%) |
Technology Access in Nightmute
Computing Device Access in Nightmute
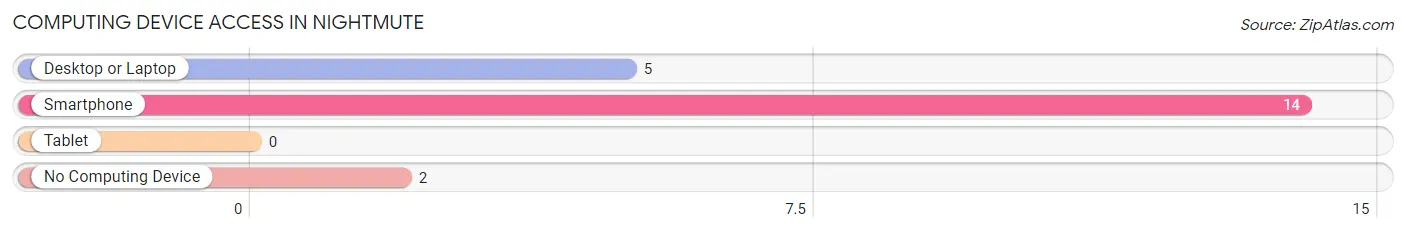
| Device Type | # Households | % Households |
| Desktop or Laptop | 5 | 31.2% |
| Smartphone | 14 | 87.5% |
| Tablet | 0 | 0.0% |
| No Computing Device | 2 | 12.5% |
| Total | 16 | 100.0% |
Internet Access in Nightmute
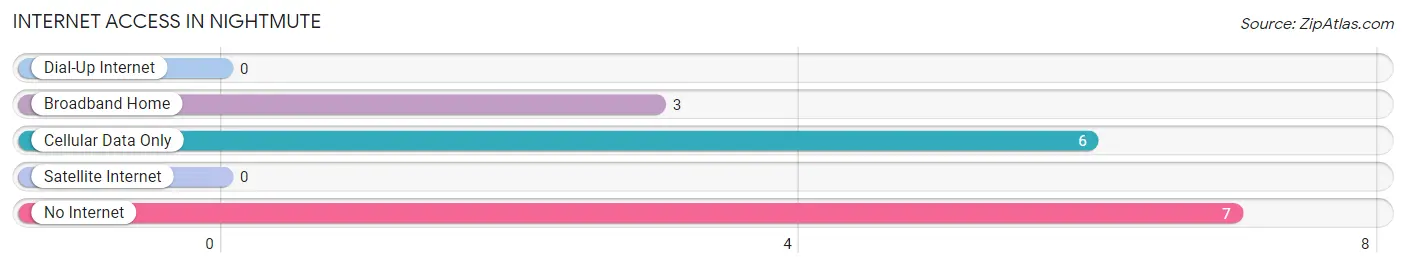
| Internet Type | # Households | % Households |
| Dial-Up Internet | 0 | 0.0% |
| Broadband Home | 3 | 18.8% |
| Cellular Data Only | 6 | 37.5% |
| Satellite Internet | 0 | 0.0% |
| No Internet | 7 | 43.8% |
| Total | 16 | 100.0% |
Nightmute Summary
Nightmute is a city located in the Bethel Census Area of Alaska, United States. It is located on the north bank of the Kuskokwim River, about 25 miles (40 km) east of Bethel. The population was 517 at the 2010 census, down from 545 in 2000.
History
Nightmute was originally inhabited by the Nuniwarmiut, a Yup'ik Eskimo people. The village was first reported in 1837 by the Russian explorer, Ivan Petroff. The name "Nightmute" is derived from the Yup'ik word "Nuniwarmiut," which means "people of the night."
In the late 19th century, the village was a trading post for fur traders and trappers. In the early 20th century, the village was a center for commercial fishing. In the 1950s, the village was connected to the outside world by a road and a school was built.
Geography
Nightmute is located at 60°51'N 161°45'W (60.851, -161.75). It is located on the north bank of the Kuskokwim River, about 25 miles (40 km) east of Bethel.
The city has a total area of 1 2 square miles 3 2 km2 all of it land
Economy
The economy of Nightmute is based primarily on subsistence fishing and hunting. The city also has a small commercial fishing industry.
Demographics
As of the census of 2000, there were 545 people, 145 households, and 118 families residing in the city. The population density was 454.3 people per square mile (175.7/km2). There were 166 housing units at an average density of 137.9 per square mile (53.2/km2). The racial makeup of the city was 8.45% White, 0.18% Black or African American, 88.45% Native American, 0.18% Asian, 0.18% Pacific Islander, 0.18% from other races, and 2.54% from two or more races.
The median income for a household in the city was $25,000, and the median income for a family was $27,500. Males had a median income of $25,000 versus $20,000 for females. The per capita income for the city was $9,845. About 24.3% of families and 28.2% of the population were below the poverty line, including 33.3% of those under age 18 and none of those age 65 or over.
Common Questions
What is Per Capita Income in Nightmute?
Per Capita income in Nightmute is $14,097.
What is the Median Family Income in Nightmute?
Median Family Income in Nightmute is $58,333.
What is the Median Household income in Nightmute?
Median Household Income in Nightmute is $58,750.
What is Inequality or Gini Index in Nightmute?
Inequality or Gini Index in Nightmute is 0.25.
What is the Total Population of Nightmute?
Total Population of Nightmute is 70.
What is the Total Male Population of Nightmute?
Total Male Population of Nightmute is 41.
What is the Total Female Population of Nightmute?
Total Female Population of Nightmute is 29.
What is the Ratio of Males per 100 Females in Nightmute?
There are 141.38 Males per 100 Females in Nightmute.
What is the Ratio of Females per 100 Males in Nightmute?
There are 70.73 Females per 100 Males in Nightmute.
What is the Median Population Age in Nightmute?
Median Population Age in Nightmute is 33.7 Years.
What is the Average Family Size in Nightmute
Average Family Size in Nightmute is 4.6 People.
What is the Average Household Size in Nightmute
Average Household Size in Nightmute is 4.4 People.
How Large is the Labor Force in Nightmute?
There are 32 People in the Labor Forcein in Nightmute.
What is the Percentage of People in the Labor Force in Nightmute?
52.5% of People are in the Labor Force in Nightmute.
What is the Unemployment Rate in Nightmute?
Unemployment Rate in Nightmute is 25.0%.