Manokotak, AK Map & Demographics
Manokotak Map
Manokotak Overview
$20,928
PER CAPITA INCOME
$48,750
AVG FAMILY INCOME
$51,875
AVG HOUSEHOLD INCOME
29.8%
WAGE / INCOME GAP [ % ]
70.2¢/ $1
WAGE / INCOME GAP [ $ ]
$13,542
FAMILY INCOME DEFICIT
0.42
INEQUALITY / GINI INDEX
629
TOTAL POPULATION
307
MALE POPULATION
322
FEMALE POPULATION
95.34
MALES / 100 FEMALES
104.89
FEMALES / 100 MALES
28.5
MEDIAN AGE
4.3
AVG FAMILY SIZE
4.2
AVG HOUSEHOLD SIZE
232
LABOR FORCE [ PEOPLE ]
51.8%
PERCENT IN LABOR FORCE
15.9%
UNEMPLOYMENT RATE
Manokotak Zip Codes
Manokotak Area Codes
Income in Manokotak
Income Overview in Manokotak
Per Capita Income in Manokotak is $20,928, while median incomes of families and households are $48,750 and $51,875 respectively.
| Characteristic | Number | Measure |
| Per Capita Income | 629 | $20,928 |
| Median Family Income | 126 | $48,750 |
| Mean Family Income | 126 | $59,883 |
| Median Household Income | 141 | $51,875 |
| Mean Household Income | 141 | $61,586 |
| Income Deficit | 126 | $13,542 |
| Wage / Income Gap (%) | 629 | 29.81% |
| Wage / Income Gap ($) | 629 | 70.19¢ per $1 |
| Gini / Inequality Index | 629 | 0.42 |
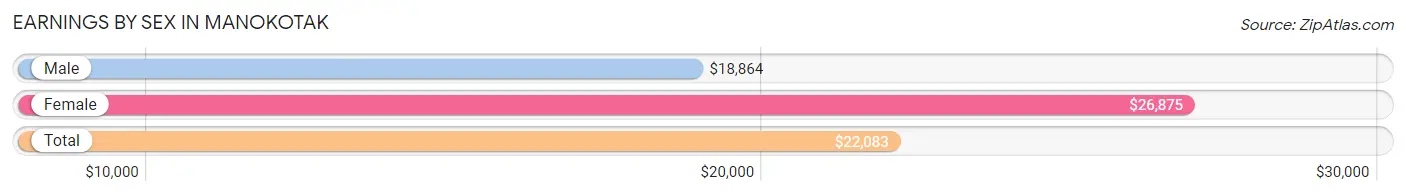
Earnings by Sex in Manokotak
Average Earnings in Manokotak are $22,083, $18,864 for men and $26,875 for women, a difference of 29.8%.
| Sex | Number | Average Earnings |
| Male | 136 (45.8%) | $18,864 |
| Female | 161 (54.2%) | $26,875 |
| Total | 297 (100.0%) | $22,083 |
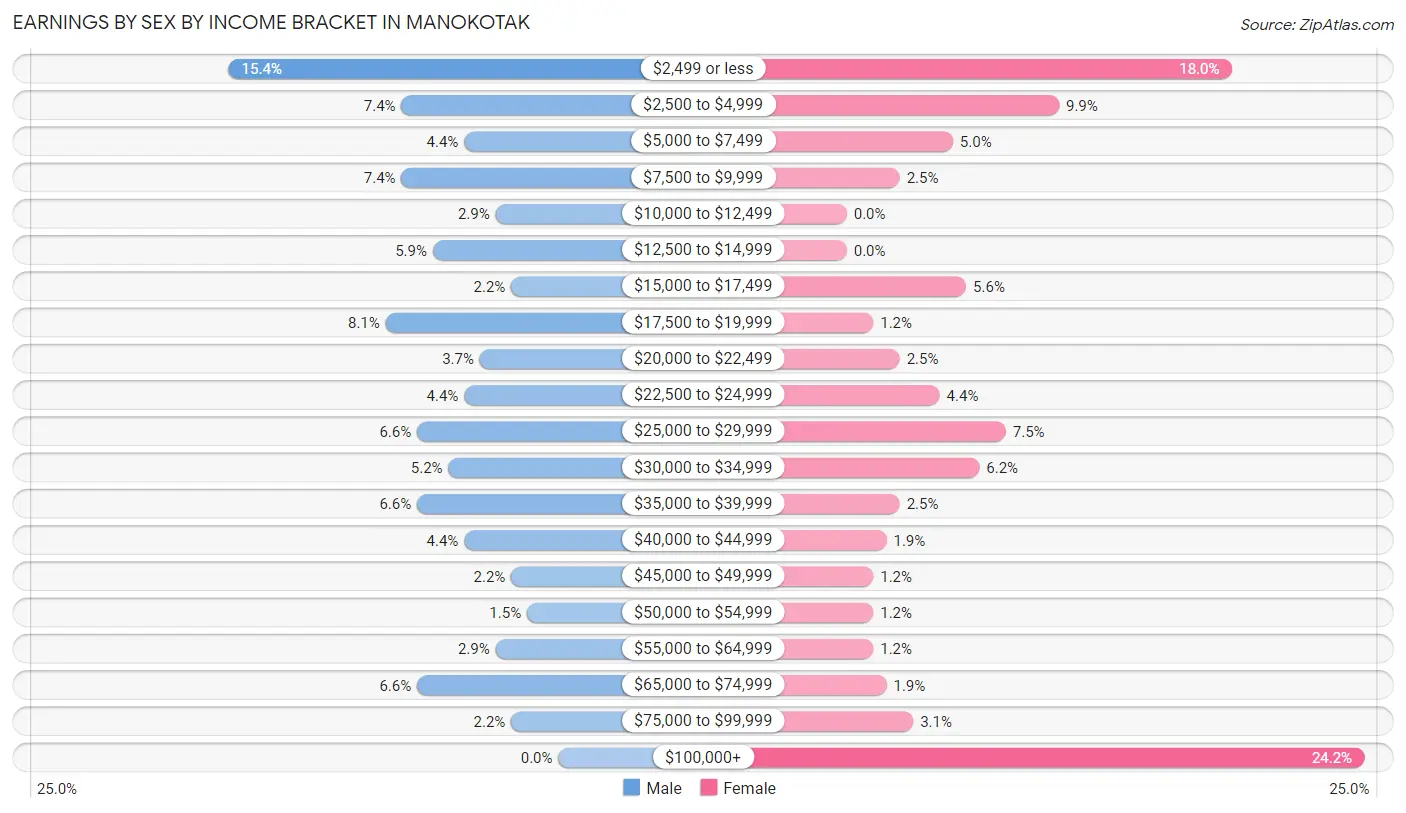
Earnings by Sex by Income Bracket in Manokotak
The most common earnings brackets in Manokotak are $2,499 or less for men (21 | 15.4%) and $100,000+ for women (39 | 24.2%).
| Income | Male | Female |
| $2,499 or less | 21 (15.4%) | 29 (18.0%) |
| $2,500 to $4,999 | 10 (7.3%) | 16 (9.9%) |
| $5,000 to $7,499 | 6 (4.4%) | 8 (5.0%) |
| $7,500 to $9,999 | 10 (7.3%) | 4 (2.5%) |
| $10,000 to $12,499 | 4 (2.9%) | 0 (0.0%) |
| $12,500 to $14,999 | 8 (5.9%) | 0 (0.0%) |
| $15,000 to $17,499 | 3 (2.2%) | 9 (5.6%) |
| $17,500 to $19,999 | 11 (8.1%) | 2 (1.2%) |
| $20,000 to $22,499 | 5 (3.7%) | 4 (2.5%) |
| $22,500 to $24,999 | 6 (4.4%) | 7 (4.3%) |
| $25,000 to $29,999 | 9 (6.6%) | 12 (7.4%) |
| $30,000 to $34,999 | 7 (5.1%) | 10 (6.2%) |
| $35,000 to $39,999 | 9 (6.6%) | 4 (2.5%) |
| $40,000 to $44,999 | 6 (4.4%) | 3 (1.9%) |
| $45,000 to $49,999 | 3 (2.2%) | 2 (1.2%) |
| $50,000 to $54,999 | 2 (1.5%) | 2 (1.2%) |
| $55,000 to $64,999 | 4 (2.9%) | 2 (1.2%) |
| $65,000 to $74,999 | 9 (6.6%) | 3 (1.9%) |
| $75,000 to $99,999 | 3 (2.2%) | 5 (3.1%) |
| $100,000+ | 0 (0.0%) | 39 (24.2%) |
| Total | 136 (100.0%) | 161 (100.0%) |
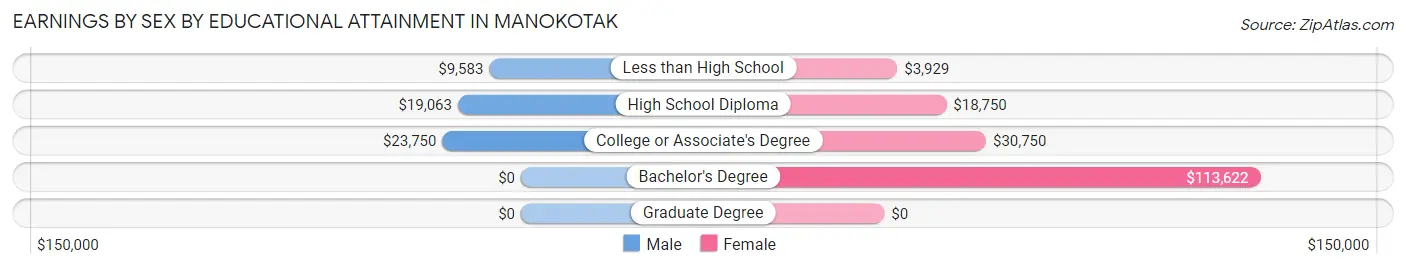
Earnings by Sex by Educational Attainment in Manokotak
| Educational Attainment | Male Income | Female Income |
| Less than High School | $9,583 | $3,929 |
| High School Diploma | $19,063 | $18,750 |
| College or Associate's Degree | $23,750 | $30,750 |
| Bachelor's Degree | - | - |
| Graduate Degree | - | - |
| Total | $19,659 | $0 |
Family Income in Manokotak
Family Income Brackets in Manokotak
According to the Manokotak family income data, there are 22 families falling into the $50,000 to $74,999 income range, which is the most common income bracket and makes up 17.5% of all families. Conversely, the $200,000+ income bracket is the least frequent group with only 2 families (1.6%) belonging to this category.
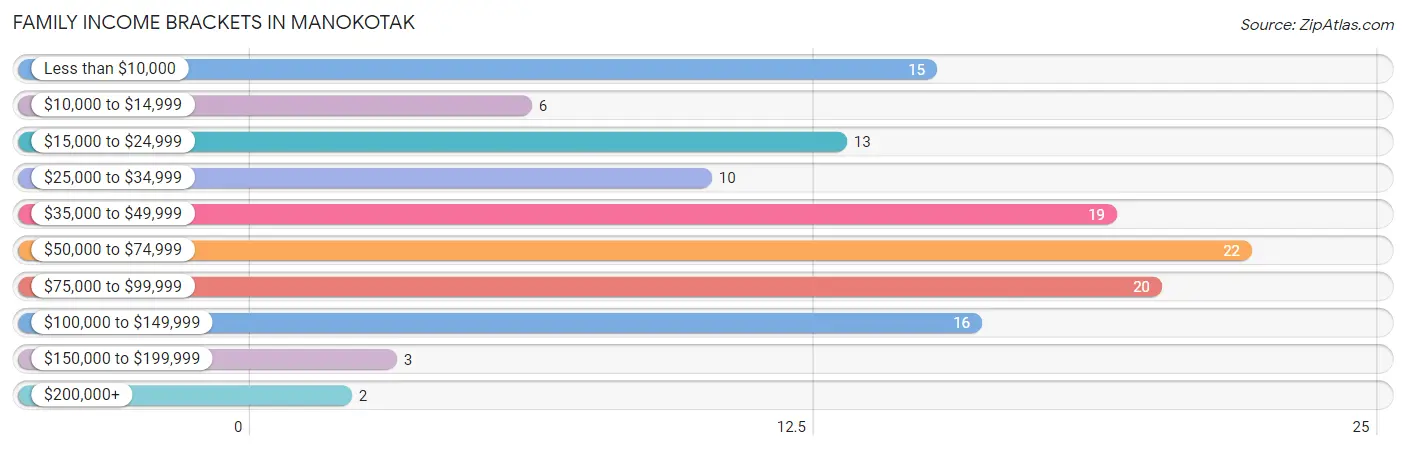
| Income Bracket | # Families | % Families |
| Less than $10,000 | 15 | 11.9% |
| $10,000 to $14,999 | 6 | 4.8% |
| $15,000 to $24,999 | 13 | 10.3% |
| $25,000 to $34,999 | 10 | 7.9% |
| $35,000 to $49,999 | 19 | 15.1% |
| $50,000 to $74,999 | 22 | 17.5% |
| $75,000 to $99,999 | 20 | 15.9% |
| $100,000 to $149,999 | 16 | 12.7% |
| $150,000 to $199,999 | 3 | 2.4% |
| $200,000+ | 2 | 1.6% |
Family Income by Famaliy Size in Manokotak
6-person families (15 | 11.9%) account for the highest median family income in Manokotak with $78,125 per family, while 6-person families (15 | 11.9%) have the highest median income of $13,021 per family member.
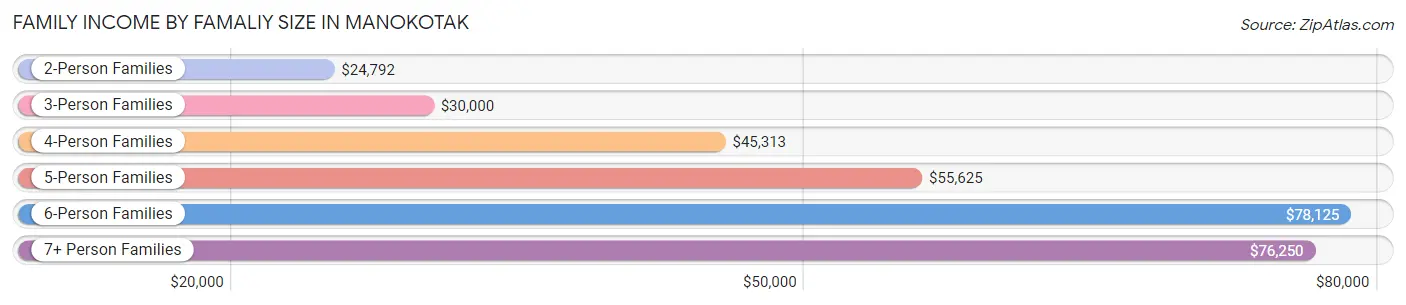
| Income Bracket | # Families | Median Income |
| 2-Person Families | 27 (21.4%) | $24,792 |
| 3-Person Families | 26 (20.6%) | $30,000 |
| 4-Person Families | 17 (13.5%) | $45,313 |
| 5-Person Families | 15 (11.9%) | $55,625 |
| 6-Person Families | 15 (11.9%) | $78,125 |
| 7+ Person Families | 26 (20.6%) | $76,250 |
| Total | 126 (100.0%) | $48,750 |
Family Income by Number of Earners in Manokotak
The median family income in Manokotak is $48,750, with families comprising 3+ earners (32) having the highest median family income of $82,500, while families with no earners (15) have the lowest median family income of $23,125, accounting for 25.4% and 11.9% of families, respectively.
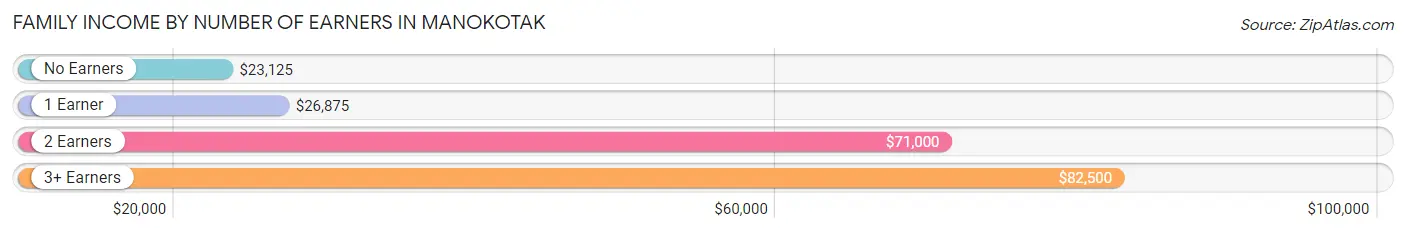
| Number of Earners | # Families | Median Income |
| No Earners | 15 (11.9%) | $23,125 |
| 1 Earner | 49 (38.9%) | $26,875 |
| 2 Earners | 30 (23.8%) | $71,000 |
| 3+ Earners | 32 (25.4%) | $82,500 |
| Total | 126 (100.0%) | $48,750 |
Household Income in Manokotak
Household Income Brackets in Manokotak
With 29 households falling in the category, the $50,000 to $74,999 income range is the most frequent in Manokotak, accounting for 20.6% of all households. In contrast, only 2 households (1.4%) fall into the $200,000+ income bracket, making it the least populous group.
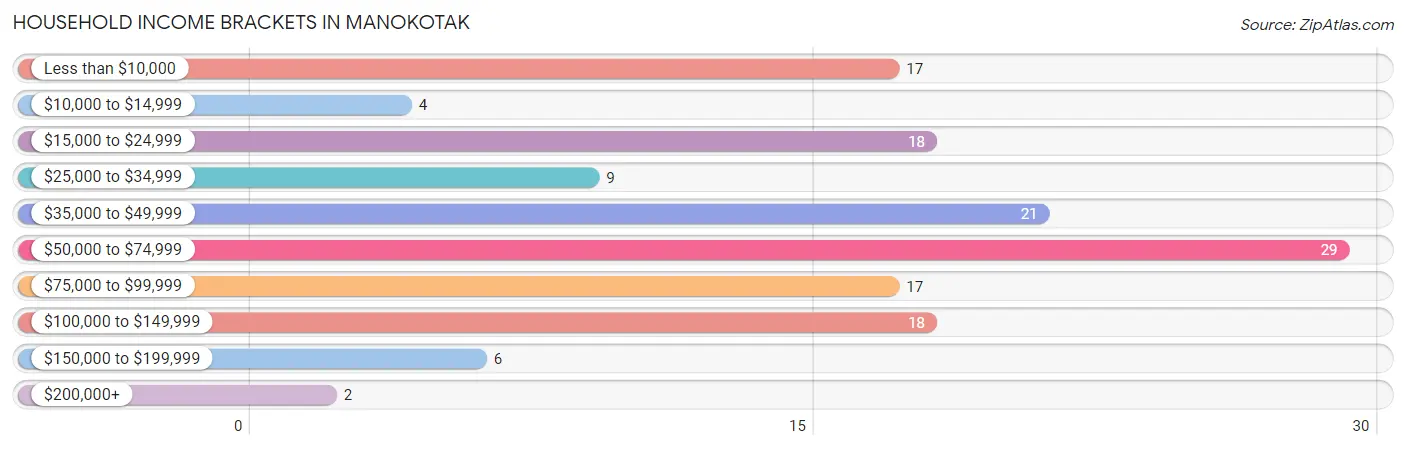
| Income Bracket | # Households | % Households |
| Less than $10,000 | 17 | 12.1% |
| $10,000 to $14,999 | 4 | 2.8% |
| $15,000 to $24,999 | 18 | 12.8% |
| $25,000 to $34,999 | 9 | 6.4% |
| $35,000 to $49,999 | 21 | 14.9% |
| $50,000 to $74,999 | 29 | 20.6% |
| $75,000 to $99,999 | 17 | 12.1% |
| $100,000 to $149,999 | 18 | 12.8% |
| $150,000 to $199,999 | 6 | 4.3% |
| $200,000+ | 2 | 1.4% |
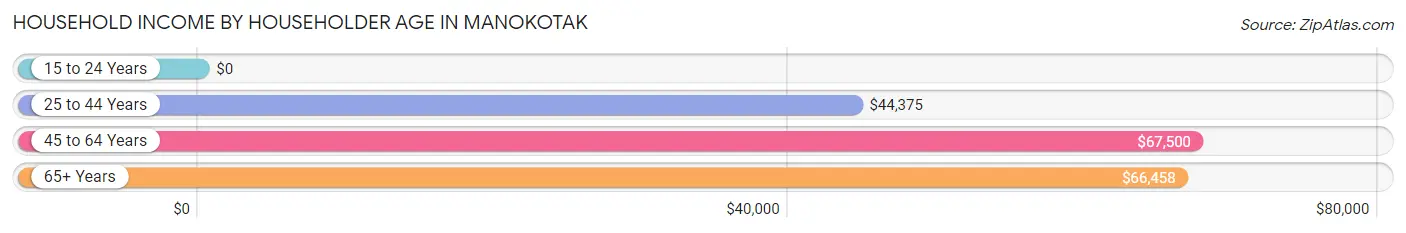
Household Income by Householder Age in Manokotak
The median household income in Manokotak is $51,875, with the highest median household income of $67,500 found in the 45 to 64 years age bracket for the primary householder. A total of 58 households (41.1%) fall into this category. Meanwhile, the 15 to 24 years age bracket for the primary householder has the lowest median household income of $0, with 1 households (0.7%) in this group.
| Income Bracket | # Households | Median Income |
| 15 to 24 Years | 1 (0.7%) | $0 |
| 25 to 44 Years | 53 (37.6%) | $44,375 |
| 45 to 64 Years | 58 (41.1%) | $67,500 |
| 65+ Years | 29 (20.6%) | $66,458 |
| Total | 141 (100.0%) | $51,875 |
Poverty in Manokotak
Income Below Poverty by Sex and Age in Manokotak
With 22.8% poverty level for males and 23.3% for females among the residents of Manokotak, under 5 year old males and 5 year old females are the most vulnerable to poverty, with 15 males (55.6%) and 8 females (80.0%) in their respective age groups living below the poverty level.
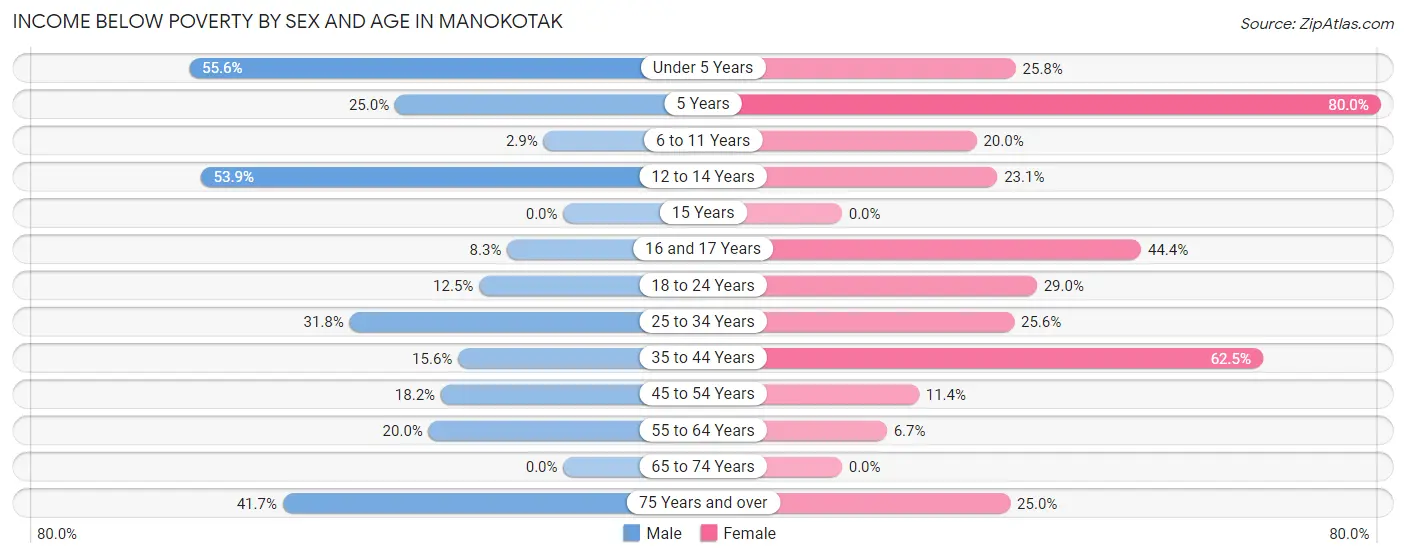
| Age Bracket | Male | Female |
| Under 5 Years | 15 (55.6%) | 8 (25.8%) |
| 5 Years | 1 (25.0%) | 8 (80.0%) |
| 6 to 11 Years | 1 (2.9%) | 7 (20.0%) |
| 12 to 14 Years | 7 (53.8%) | 3 (23.1%) |
| 15 Years | 0 (0.0%) | 0 (0.0%) |
| 16 and 17 Years | 1 (8.3%) | 4 (44.4%) |
| 18 to 24 Years | 4 (12.5%) | 11 (28.9%) |
| 25 to 34 Years | 20 (31.8%) | 11 (25.6%) |
| 35 to 44 Years | 5 (15.6%) | 15 (62.5%) |
| 45 to 54 Years | 4 (18.2%) | 4 (11.4%) |
| 55 to 64 Years | 7 (20.0%) | 1 (6.7%) |
| 65 to 74 Years | 0 (0.0%) | 0 (0.0%) |
| 75 Years and over | 5 (41.7%) | 3 (25.0%) |
| Total | 70 (22.8%) | 75 (23.3%) |
Income Above Poverty by Sex and Age in Manokotak
According to the poverty statistics in Manokotak, males aged 15 years and females aged 15 years are the age groups that are most secure financially, with 100.0% of males and 100.0% of females in these age groups living above the poverty line.
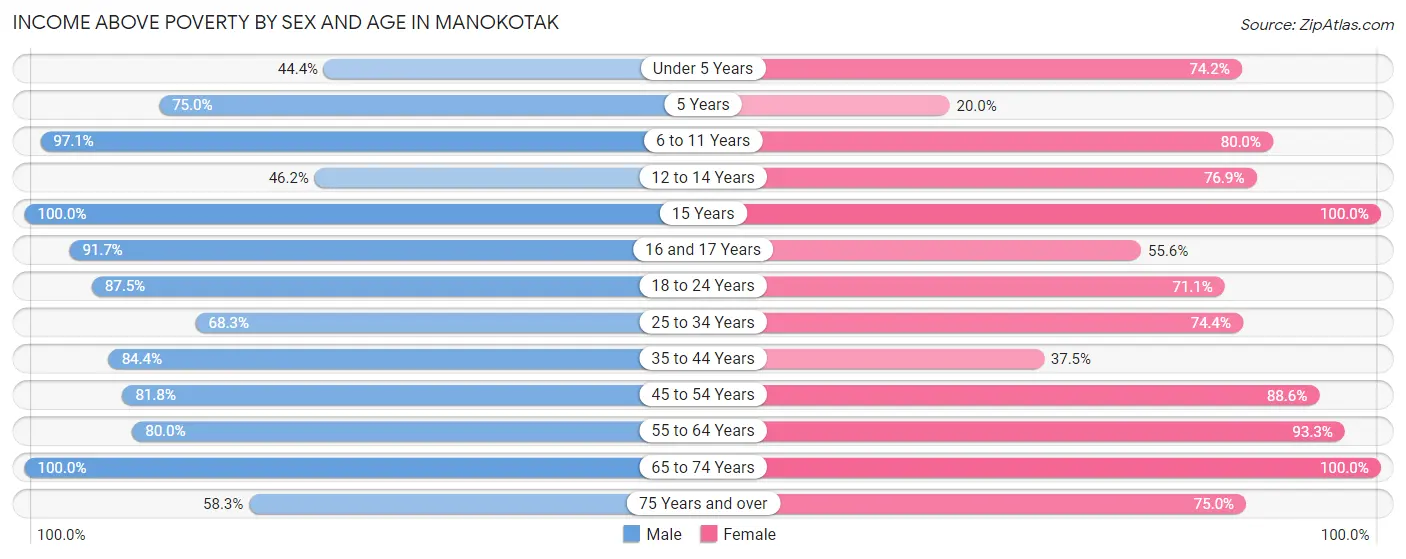
| Age Bracket | Male | Female |
| Under 5 Years | 12 (44.4%) | 23 (74.2%) |
| 5 Years | 3 (75.0%) | 2 (20.0%) |
| 6 to 11 Years | 33 (97.1%) | 28 (80.0%) |
| 12 to 14 Years | 6 (46.2%) | 10 (76.9%) |
| 15 Years | 7 (100.0%) | 7 (100.0%) |
| 16 and 17 Years | 11 (91.7%) | 5 (55.6%) |
| 18 to 24 Years | 28 (87.5%) | 27 (71.1%) |
| 25 to 34 Years | 43 (68.2%) | 32 (74.4%) |
| 35 to 44 Years | 27 (84.4%) | 9 (37.5%) |
| 45 to 54 Years | 18 (81.8%) | 31 (88.6%) |
| 55 to 64 Years | 28 (80.0%) | 14 (93.3%) |
| 65 to 74 Years | 14 (100.0%) | 50 (100.0%) |
| 75 Years and over | 7 (58.3%) | 9 (75.0%) |
| Total | 237 (77.2%) | 247 (76.7%) |
Income Below Poverty Among Married-Couple Families in Manokotak
The poverty statistics for married-couple families in Manokotak show that 19.1% or 12 of the total 63 families live below the poverty line. Families with 5 or more children have the highest poverty rate of 66.7%, comprising of 2 families. On the other hand, families with no children have the lowest poverty rate of 0.0%, which includes 0 families.
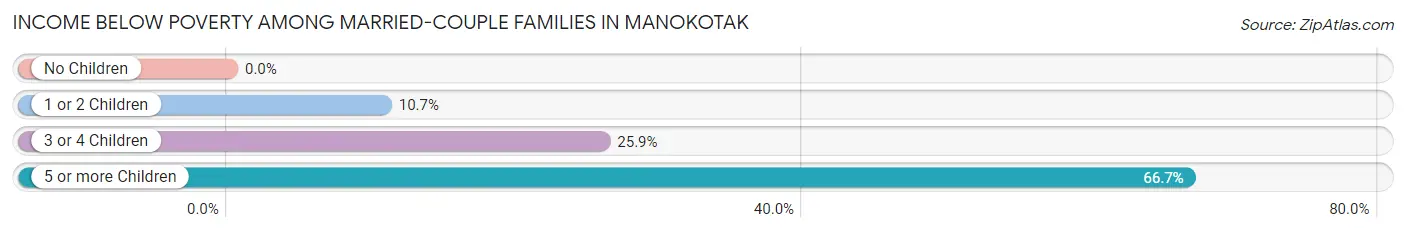
| Children | Above Poverty | Below Poverty |
| No Children | 5 (100.0%) | 0 (0.0%) |
| 1 or 2 Children | 25 (89.3%) | 3 (10.7%) |
| 3 or 4 Children | 20 (74.1%) | 7 (25.9%) |
| 5 or more Children | 1 (33.3%) | 2 (66.7%) |
| Total | 51 (80.9%) | 12 (19.1%) |
Income Below Poverty Among Single-Parent Households in Manokotak
According to the poverty data in Manokotak, 40.7% or 11 single-father households and 27.8% or 10 single-mother households are living below the poverty line. Among single-father households, those with 3 or 4 children have the highest poverty rate, with 3 households (100.0%) experiencing poverty. Likewise, among single-mother households, those with 1 or 2 children have the highest poverty rate, with 9 households (36.0%) falling below the poverty line.
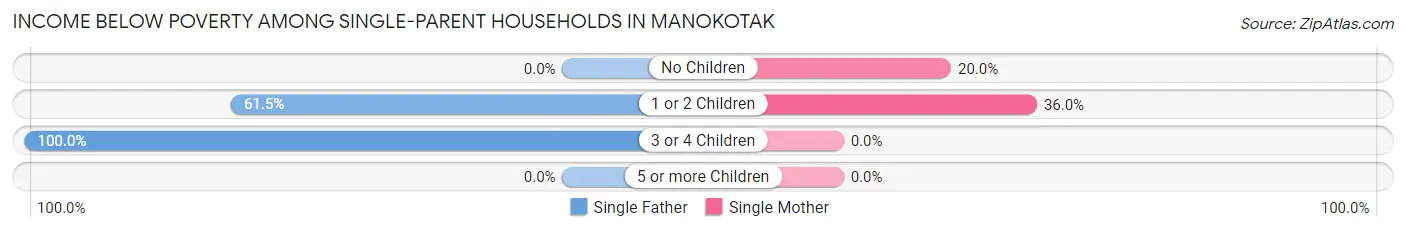
| Children | Single Father | Single Mother |
| No Children | 0 (0.0%) | 1 (20.0%) |
| 1 or 2 Children | 8 (61.5%) | 9 (36.0%) |
| 3 or 4 Children | 3 (100.0%) | 0 (0.0%) |
| 5 or more Children | 0 (0.0%) | 0 (0.0%) |
| Total | 11 (40.7%) | 10 (27.8%) |
Income Below Poverty Among Married-Couple vs Single-Parent Households in Manokotak
The poverty data for Manokotak shows that 12 of the married-couple family households (19.1%) and 21 of the single-parent households (33.3%) are living below the poverty level. Within the married-couple family households, those with 5 or more children have the highest poverty rate, with 2 households (66.7%) falling below the poverty line. Among the single-parent households, those with 1 or 2 children have the highest poverty rate, with 17 household (44.7%) living below poverty.
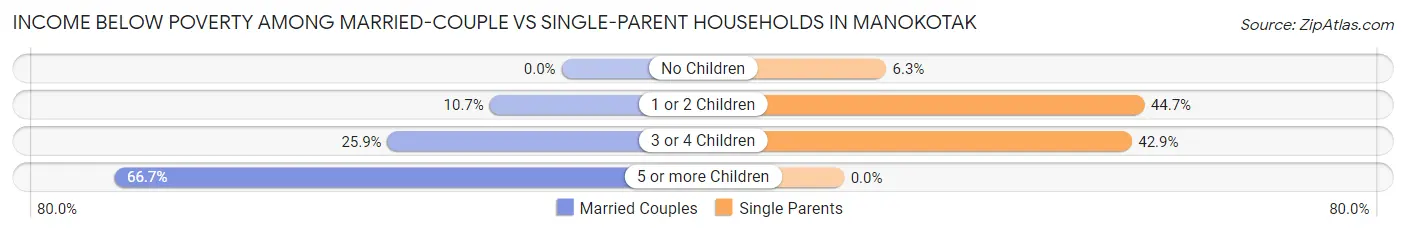
| Children | Married-Couple Families | Single-Parent Households |
| No Children | 0 (0.0%) | 1 (6.2%) |
| 1 or 2 Children | 3 (10.7%) | 17 (44.7%) |
| 3 or 4 Children | 7 (25.9%) | 3 (42.9%) |
| 5 or more Children | 2 (66.7%) | 0 (0.0%) |
| Total | 12 (19.1%) | 21 (33.3%) |
Race in Manokotak
The most populous races in Manokotak are Native / Alaskan (562 | 89.3%), White / Caucasian (45 | 7.1%), and Two or more Races (22 | 3.5%).
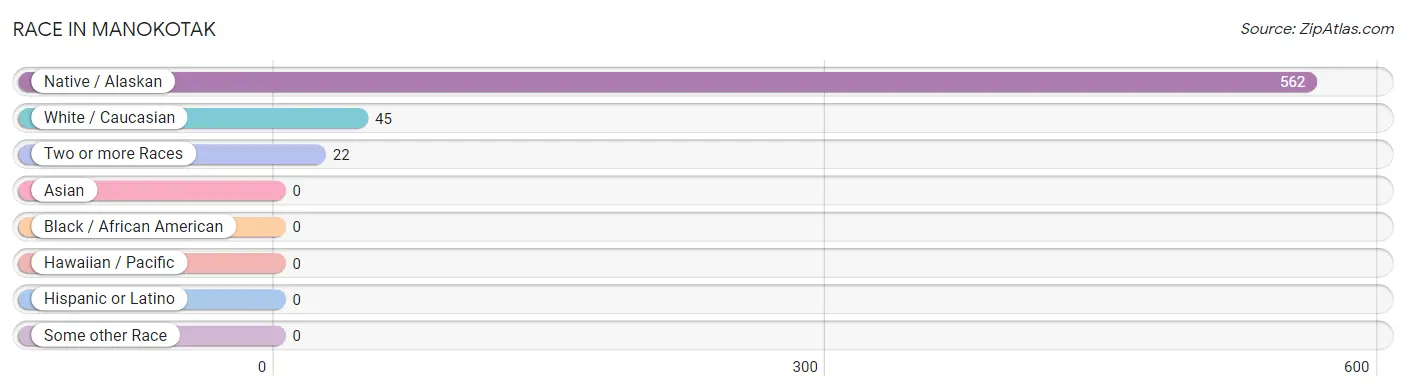
| Race | # Population | % Population |
| Asian | 0 | 0.0% |
| Black / African American | 0 | 0.0% |
| Hawaiian / Pacific | 0 | 0.0% |
| Hispanic or Latino | 0 | 0.0% |
| Native / Alaskan | 562 | 89.3% |
| White / Caucasian | 45 | 7.1% |
| Two or more Races | 22 | 3.5% |
| Some other Race | 0 | 0.0% |
| Total | 629 | 100.0% |
Ancestry in Manokotak
The most populous ancestries reported in Manokotak are Yup'ik (582 | 92.5%), Polish (39 | 6.2%), Inupiat (7 | 1.1%), Alaskan Athabascan (6 | 0.9%), and Ukrainian (5 | 0.8%), together accounting for 101.6% of all Manokotak residents.
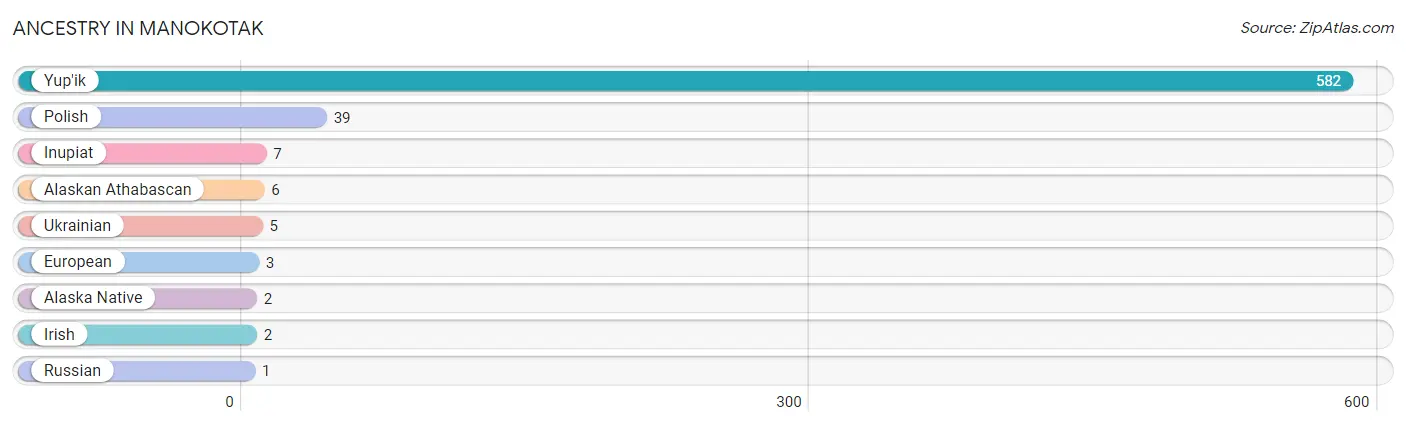
| Ancestry | # Population | % Population |
| Alaska Native | 2 | 0.3% |
| Alaskan Athabascan | 6 | 0.9% |
| European | 3 | 0.5% |
| Inupiat | 7 | 1.1% |
| Irish | 2 | 0.3% |
| Polish | 39 | 6.2% |
| Russian | 1 | 0.2% |
| Ukrainian | 5 | 0.8% |
| Yup'ik | 582 | 92.5% | View All 9 Rows |
Immigrants in Manokotak
The most numerous immigrant groups reported in Manokotak came from Eastern Europe (5 | 0.8%), Europe (5 | 0.8%), Ukraine (5 | 0.8%), Brazil (1 | 0.2%), and Latin America (1 | 0.2%), together accounting for 2.7% of all Manokotak residents.
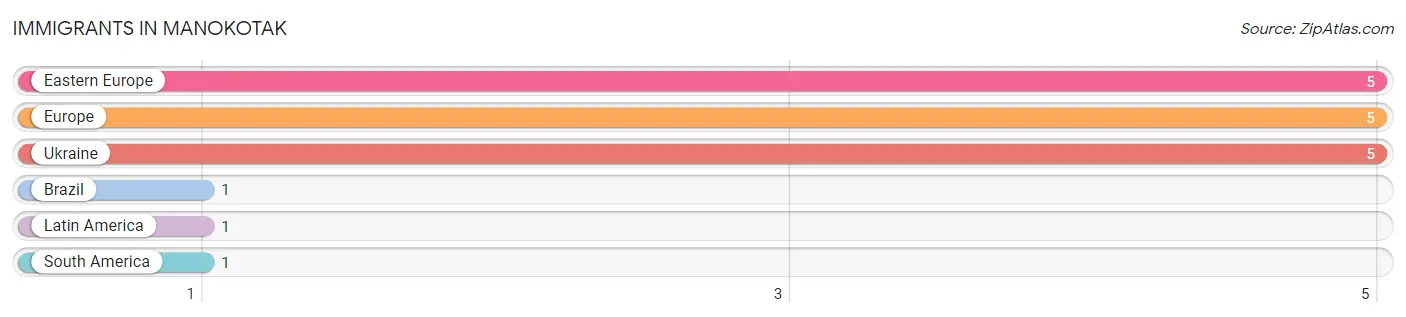
| Immigration Origin | # Population | % Population |
| Brazil | 1 | 0.2% |
| Eastern Europe | 5 | 0.8% |
| Europe | 5 | 0.8% |
| Latin America | 1 | 0.2% |
| South America | 1 | 0.2% |
| Ukraine | 5 | 0.8% | View All 6 Rows |
Sex and Age in Manokotak
Sex and Age in Manokotak
The most populous age groups in Manokotak are 5 to 9 Years (35 | 11.4%) for men and 65 to 69 Years (45 | 14.0%) for women.
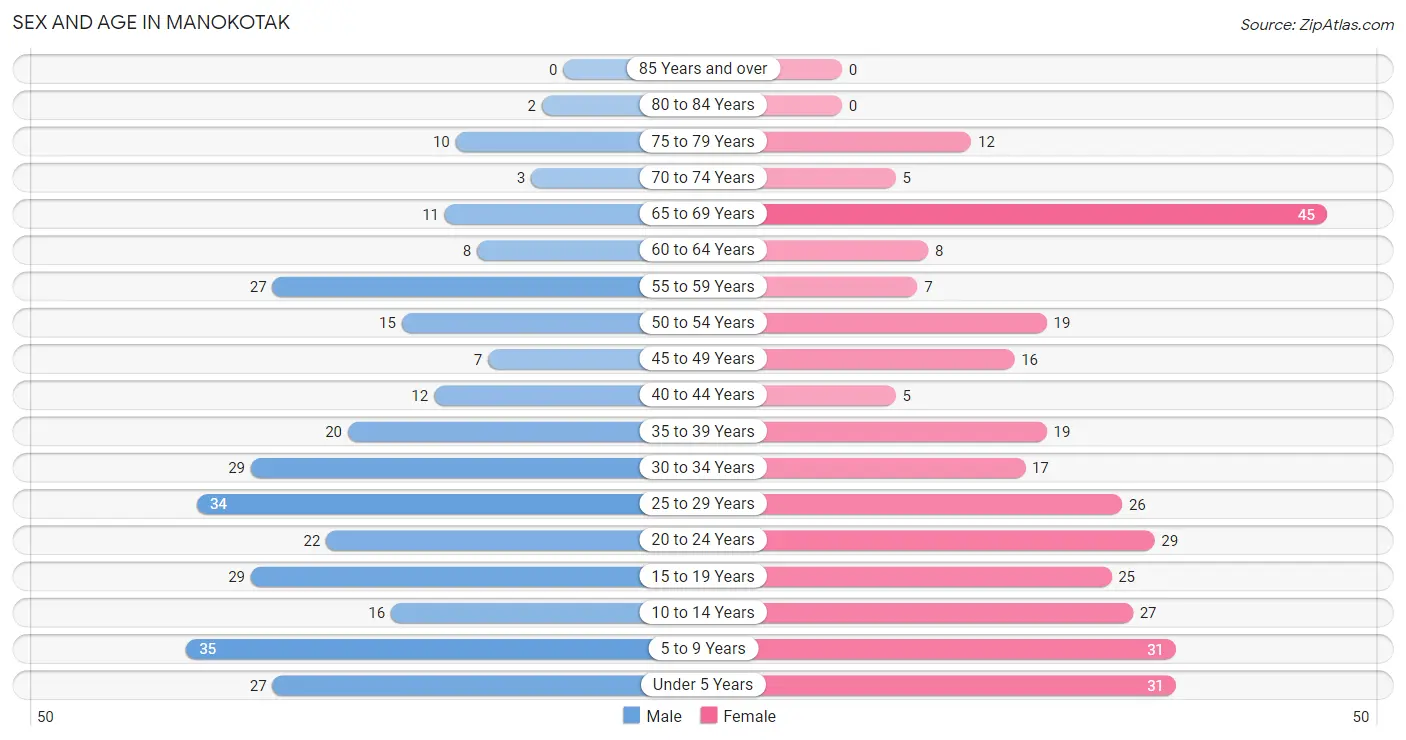
| Age Bracket | Male | Female |
| Under 5 Years | 27 (8.8%) | 31 (9.6%) |
| 5 to 9 Years | 35 (11.4%) | 31 (9.6%) |
| 10 to 14 Years | 16 (5.2%) | 27 (8.4%) |
| 15 to 19 Years | 29 (9.5%) | 25 (7.8%) |
| 20 to 24 Years | 22 (7.2%) | 29 (9.0%) |
| 25 to 29 Years | 34 (11.1%) | 26 (8.1%) |
| 30 to 34 Years | 29 (9.5%) | 17 (5.3%) |
| 35 to 39 Years | 20 (6.5%) | 19 (5.9%) |
| 40 to 44 Years | 12 (3.9%) | 5 (1.5%) |
| 45 to 49 Years | 7 (2.3%) | 16 (5.0%) |
| 50 to 54 Years | 15 (4.9%) | 19 (5.9%) |
| 55 to 59 Years | 27 (8.8%) | 7 (2.2%) |
| 60 to 64 Years | 8 (2.6%) | 8 (2.5%) |
| 65 to 69 Years | 11 (3.6%) | 45 (14.0%) |
| 70 to 74 Years | 3 (1.0%) | 5 (1.5%) |
| 75 to 79 Years | 10 (3.3%) | 12 (3.7%) |
| 80 to 84 Years | 2 (0.6%) | 0 (0.0%) |
| 85 Years and over | 0 (0.0%) | 0 (0.0%) |
| Total | 307 (100.0%) | 322 (100.0%) |
Families and Households in Manokotak
Median Family Size in Manokotak
The median family size in Manokotak is 4.29 persons per family, with married-couple families (63 | 50.0%) accounting for the largest median family size of 5.43 persons per family. On the other hand, single male/father families (27 | 21.4%) represent the smallest median family size with 2.04 persons per family.
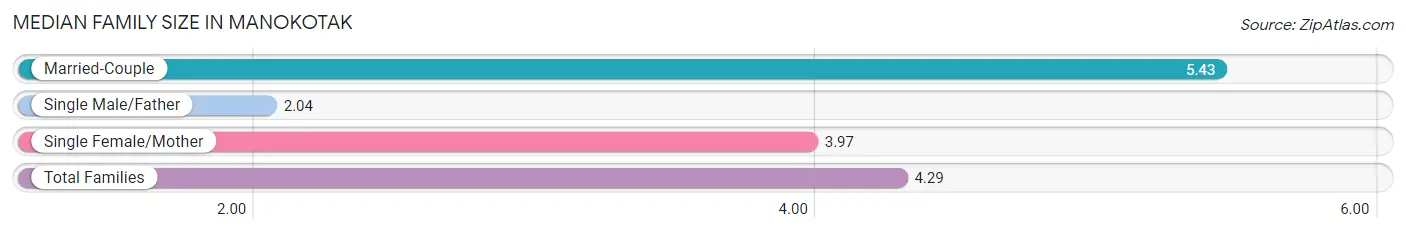
| Family Type | # Families | Family Size |
| Married-Couple | 63 (50.0%) | 5.43 |
| Single Male/Father | 27 (21.4%) | 2.04 |
| Single Female/Mother | 36 (28.6%) | 3.97 |
| Total Families | 126 (100.0%) | 4.29 |
Median Household Size in Manokotak
The median household size in Manokotak is 4.15 persons per household, with married-couple households (63 | 44.7%) accounting for the largest median household size of 5.43 persons per household. non-family households (15 | 10.6%) represent the smallest median household size with 1.33 persons per household.
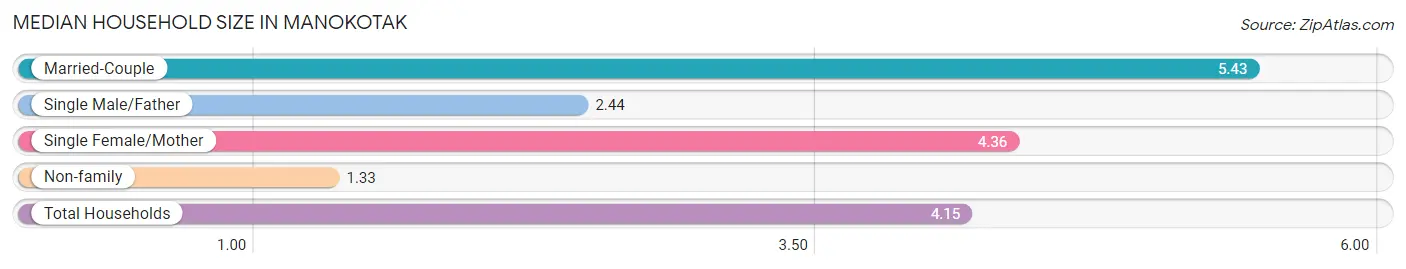
| Household Type | # Households | Household Size |
| Married-Couple | 63 (44.7%) | 5.43 |
| Single Male/Father | 27 (19.2%) | 2.44 |
| Single Female/Mother | 36 (25.5%) | 4.36 |
| Non-family | 15 (10.6%) | 1.33 |
| Total Households | 141 (100.0%) | 4.15 |
Household Size by Marriage Status in Manokotak
Out of a total of 141 households in Manokotak, 126 (89.4%) are family households, while 15 (10.6%) are nonfamily households. The most numerous type of family households are 3-person households, comprising 33, and the most common type of nonfamily households are 1-person households, comprising 12.
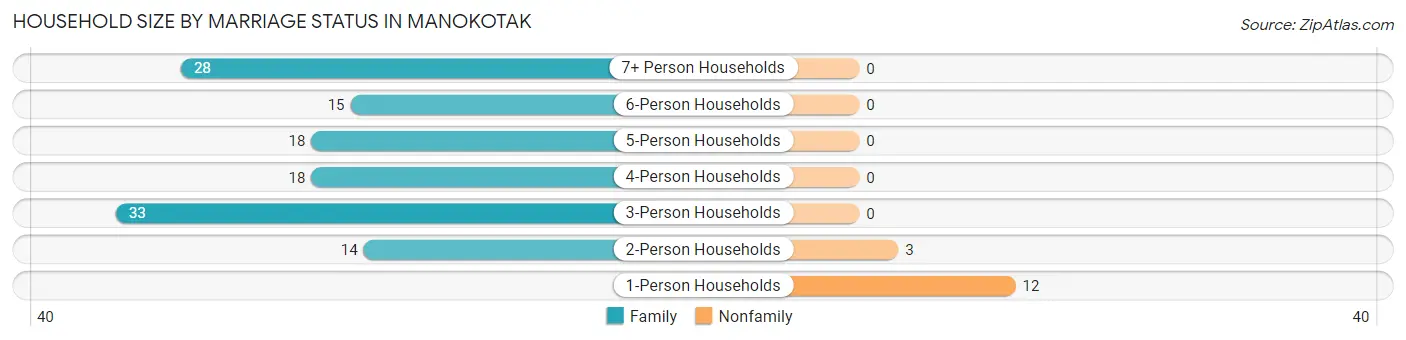
| Household Size | Family Households | Nonfamily Households |
| 1-Person Households | - | 12 (8.5%) |
| 2-Person Households | 14 (9.9%) | 3 (2.1%) |
| 3-Person Households | 33 (23.4%) | 0 (0.0%) |
| 4-Person Households | 18 (12.8%) | 0 (0.0%) |
| 5-Person Households | 18 (12.8%) | 0 (0.0%) |
| 6-Person Households | 15 (10.6%) | 0 (0.0%) |
| 7+ Person Households | 28 (19.9%) | 0 (0.0%) |
| Total | 126 (89.4%) | 15 (10.6%) |
Female Fertility in Manokotak
Fertility by Age in Manokotak
Average fertility rate in Manokotak is 63.0 births per 1,000 women. Women in the age bracket of 20 to 34 years have the highest fertility rate with 125.0 births per 1,000 women. Women in the age bracket of 20 to 34 years acount for 100.0% of all women with births.
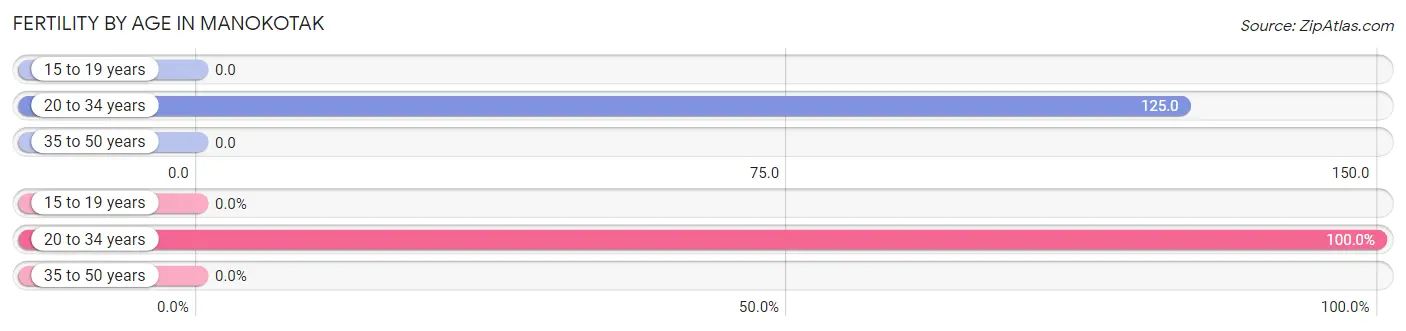
| Age Bracket | Women with Births | Births / 1,000 Women |
| 15 to 19 years | 0 (0.0%) | 0.0 |
| 20 to 34 years | 9 (100.0%) | 125.0 |
| 35 to 50 years | 0 (0.0%) | 0.0 |
| Total | 9 (100.0%) | 63.0 |
Fertility by Age by Marriage Status in Manokotak
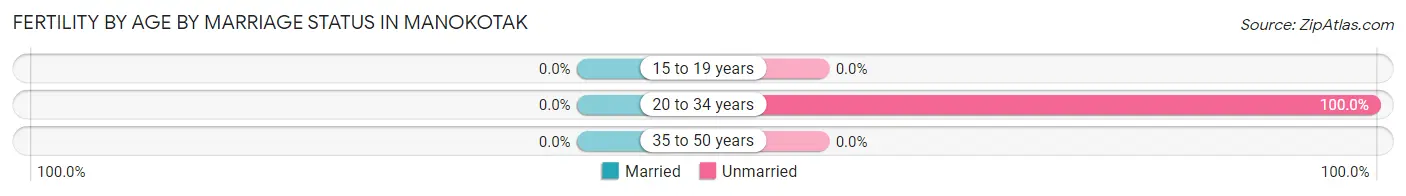
| Age Bracket | Married | Unmarried |
| 15 to 19 years | 0 (0.0%) | 0 (0.0%) |
| 20 to 34 years | 0 (0.0%) | 9 (100.0%) |
| 35 to 50 years | 0 (0.0%) | 0 (0.0%) |
| Total | 0 (0.0%) | 9 (100.0%) |
Fertility by Education in Manokotak
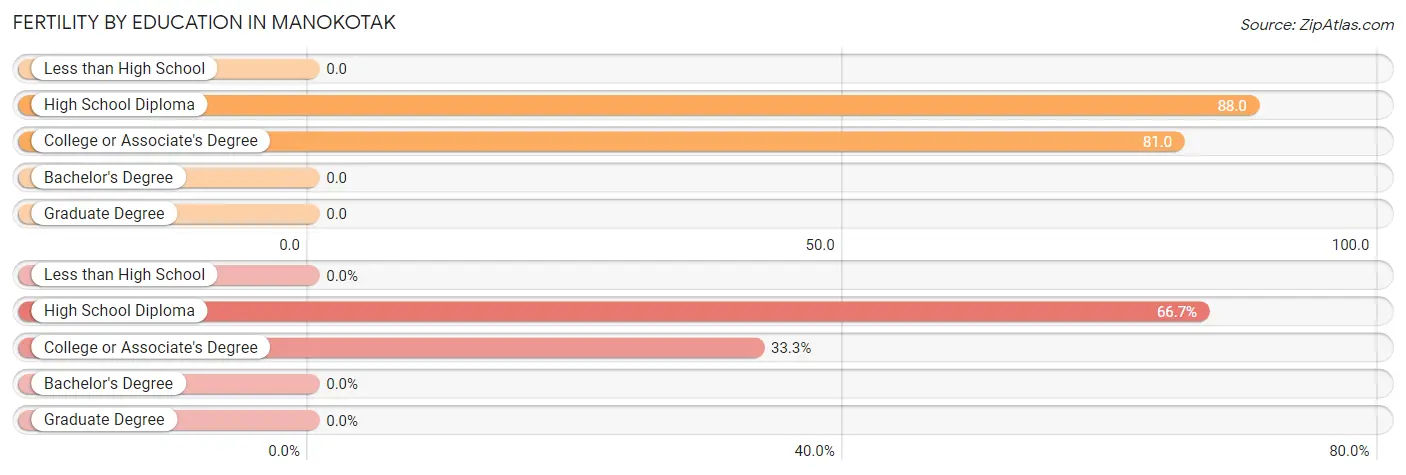
| Educational Attainment | Women with Births | Births / 1,000 Women |
| Less than High School | 0 (0.0%) | 0.0 |
| High School Diploma | 6 (66.7%) | 88.0 |
| College or Associate's Degree | 3 (33.3%) | 81.0 |
| Bachelor's Degree | 0 (0.0%) | 0.0 |
| Graduate Degree | 0 (0.0%) | 0.0 |
| Total | 9 (100.0%) | 63.0 |
Fertility by Education by Marriage Status in Manokotak
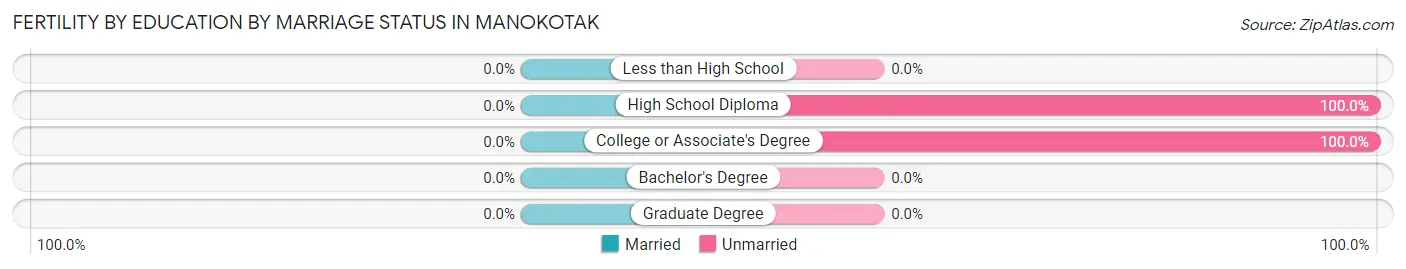
| Educational Attainment | Married | Unmarried |
| Less than High School | 0 (0.0%) | 0 (0.0%) |
| High School Diploma | 0 (0.0%) | 6 (100.0%) |
| College or Associate's Degree | 0 (0.0%) | 3 (100.0%) |
| Bachelor's Degree | 0 (0.0%) | 0 (0.0%) |
| Graduate Degree | 0 (0.0%) | 0 (0.0%) |
| Total | 0 (0.0%) | 9 (100.0%) |
Employment Characteristics in Manokotak
Employment by Class of Employer in Manokotak
Among the 195 employed individuals in Manokotak, local government employees (58 | 29.7%), federal government employees (54 | 27.7%), and not-for-profit organizations (35 | 17.9%) make up the most common classes of employment.
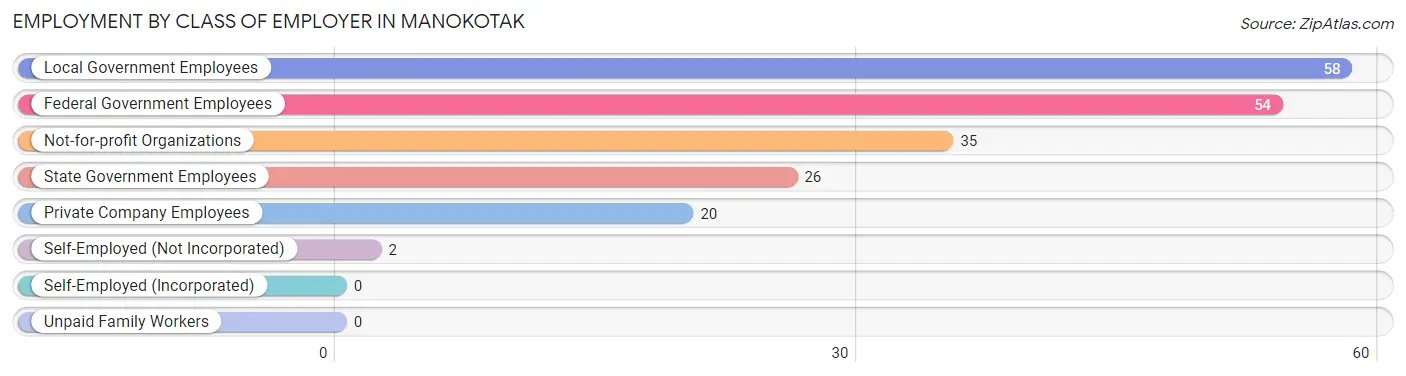
| Employer Class | # Employees | % Employees |
| Private Company Employees | 20 | 10.3% |
| Self-Employed (Incorporated) | 0 | 0.0% |
| Self-Employed (Not Incorporated) | 2 | 1.0% |
| Not-for-profit Organizations | 35 | 17.9% |
| Local Government Employees | 58 | 29.7% |
| State Government Employees | 26 | 13.3% |
| Federal Government Employees | 54 | 27.7% |
| Unpaid Family Workers | 0 | 0.0% |
| Total | 195 | 100.0% |
Employment Status by Age in Manokotak
According to the labor force statistics for Manokotak, out of the total population over 16 years of age (448), 51.8% or 232 individuals are in the labor force, with 15.9% or 37 of them unemployed. The age group with the highest labor force participation rate is 60 to 64 years, with 75.0% or 12 individuals in the labor force. Within the labor force, the 60 to 64 years age range has the highest percentage of unemployed individuals, with 33.3% or 4 of them being unemployed.
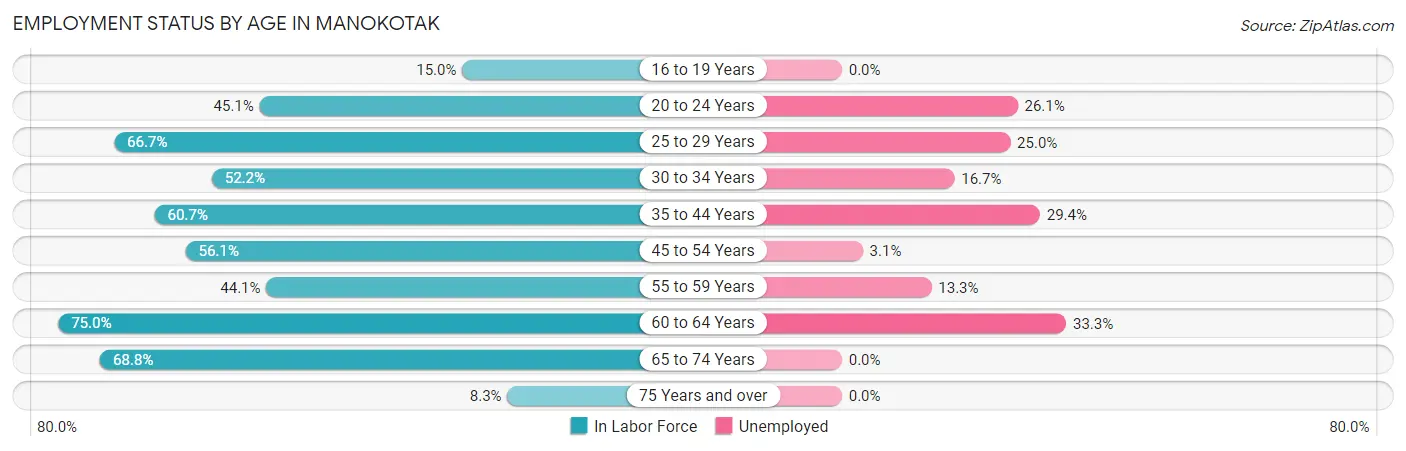
| Age Bracket | In Labor Force | Unemployed |
| 16 to 19 Years | 6 (15.0%) | 0 (0.0%) |
| 20 to 24 Years | 23 (45.1%) | 6 (26.1%) |
| 25 to 29 Years | 40 (66.7%) | 10 (25.0%) |
| 30 to 34 Years | 24 (52.2%) | 4 (16.7%) |
| 35 to 44 Years | 34 (60.7%) | 10 (29.4%) |
| 45 to 54 Years | 32 (56.1%) | 1 (3.1%) |
| 55 to 59 Years | 15 (44.1%) | 2 (13.3%) |
| 60 to 64 Years | 12 (75.0%) | 4 (33.3%) |
| 65 to 74 Years | 44 (68.8%) | 0 (0.0%) |
| 75 Years and over | 2 (8.3%) | 0 (0.0%) |
| Total | 232 (51.8%) | 37 (15.9%) |
Employment Status by Educational Attainment in Manokotak
According to labor force statistics for Manokotak, 58.4% of individuals (157) out of the total population between 25 and 64 years of age (269) are in the labor force, with 19.7% or 31 of them being unemployed. The group with the highest labor force participation rate are those with the educational attainment of college / associate degree, with 79.1% or 53 individuals in the labor force. Within the labor force, individuals with less than high school education have the highest percentage of unemployment, with 26.7% or 4 of them being unemployed.
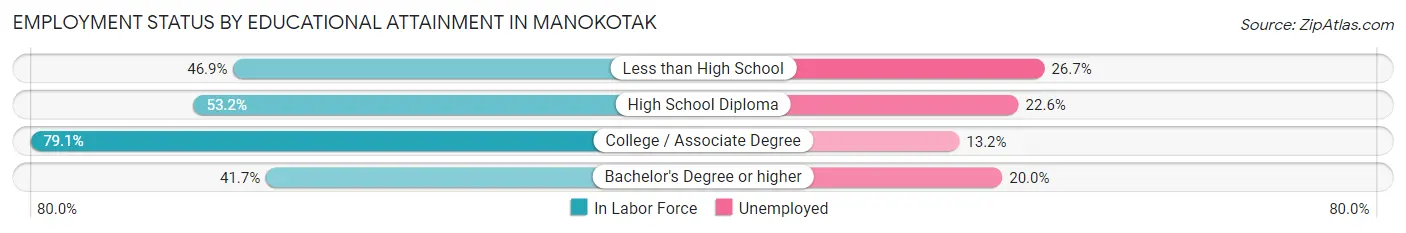
| Educational Attainment | In Labor Force | Unemployed |
| Less than High School | 15 (46.9%) | 9 (26.7%) |
| High School Diploma | 84 (53.2%) | 36 (22.6%) |
| College / Associate Degree | 53 (79.1%) | 9 (13.2%) |
| Bachelor's Degree or higher | 5 (41.7%) | 2 (20.0%) |
| Total | 157 (58.4%) | 53 (19.7%) |
Employment Occupations by Sex in Manokotak
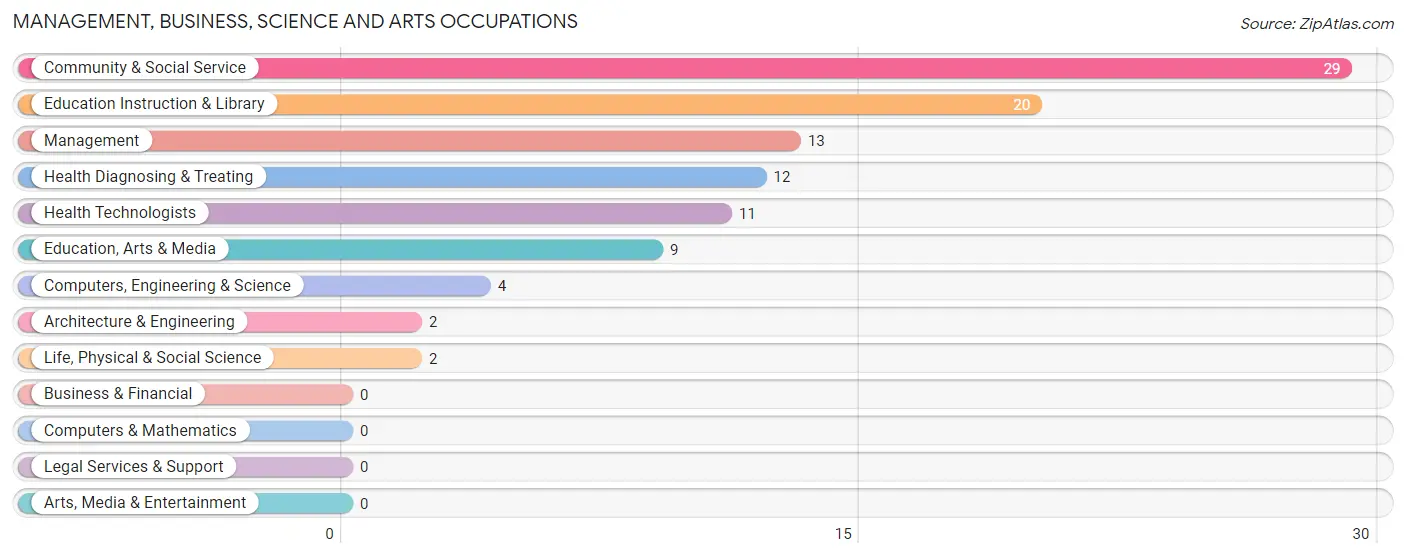
Management, Business, Science and Arts Occupations
The most common Management, Business, Science and Arts occupations in Manokotak are Community & Social Service (29 | 14.9%), Education Instruction & Library (20 | 10.3%), Management (13 | 6.7%), Health Diagnosing & Treating (12 | 6.1%), and Health Technologists (11 | 5.6%).
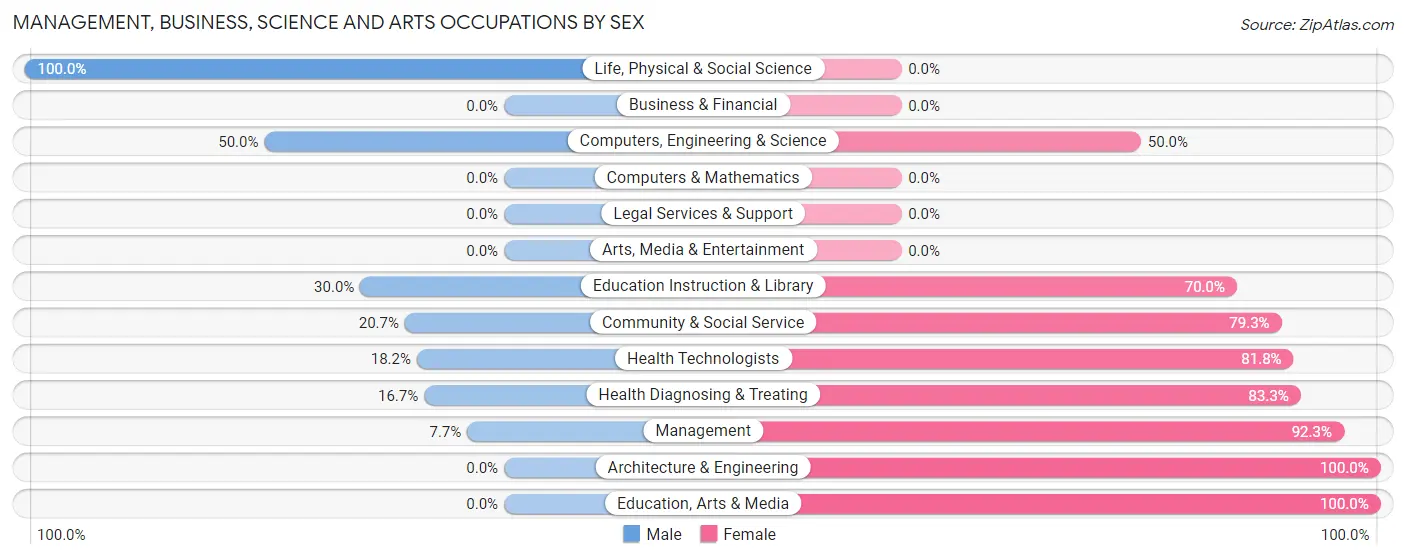
Management, Business, Science and Arts Occupations by Sex
Within the Management, Business, Science and Arts occupations in Manokotak, the most male-oriented occupations are Life, Physical & Social Science (100.0%), Computers, Engineering & Science (50.0%), and Education Instruction & Library (30.0%), while the most female-oriented occupations are Architecture & Engineering (100.0%), Education, Arts & Media (100.0%), and Management (92.3%).
| Occupation | Male | Female |
| Management | 1 (7.7%) | 12 (92.3%) |
| Business & Financial | 0 (0.0%) | 0 (0.0%) |
| Computers, Engineering & Science | 2 (50.0%) | 2 (50.0%) |
| Computers & Mathematics | 0 (0.0%) | 0 (0.0%) |
| Architecture & Engineering | 0 (0.0%) | 2 (100.0%) |
| Life, Physical & Social Science | 2 (100.0%) | 0 (0.0%) |
| Community & Social Service | 6 (20.7%) | 23 (79.3%) |
| Education, Arts & Media | 0 (0.0%) | 9 (100.0%) |
| Legal Services & Support | 0 (0.0%) | 0 (0.0%) |
| Education Instruction & Library | 6 (30.0%) | 14 (70.0%) |
| Arts, Media & Entertainment | 0 (0.0%) | 0 (0.0%) |
| Health Diagnosing & Treating | 2 (16.7%) | 10 (83.3%) |
| Health Technologists | 2 (18.2%) | 9 (81.8%) |
| Total (Category) | 11 (19.0%) | 47 (81.0%) |
| Total (Overall) | 70 (35.9%) | 125 (64.1%) |
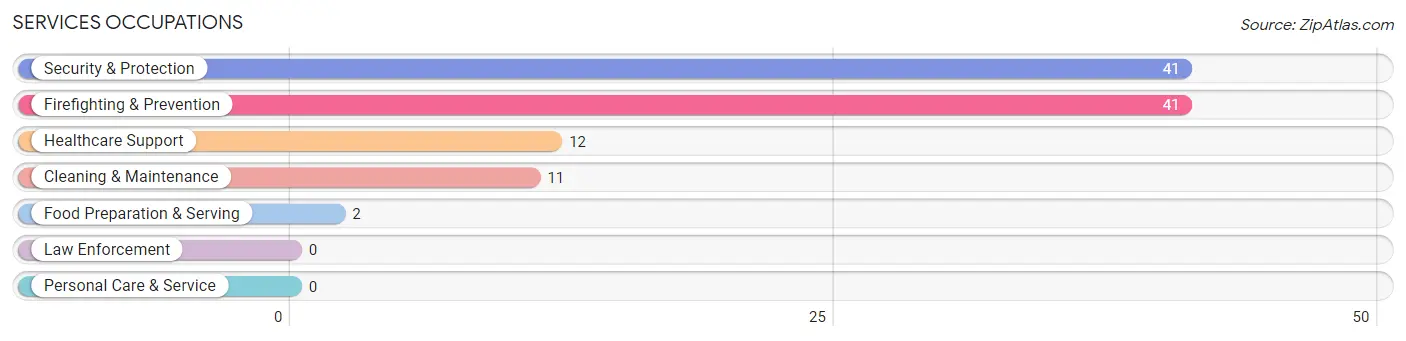
Services Occupations
The most common Services occupations in Manokotak are Security & Protection (41 | 21.0%), Firefighting & Prevention (41 | 21.0%), Healthcare Support (12 | 6.1%), Cleaning & Maintenance (11 | 5.6%), and Food Preparation & Serving (2 | 1.0%).
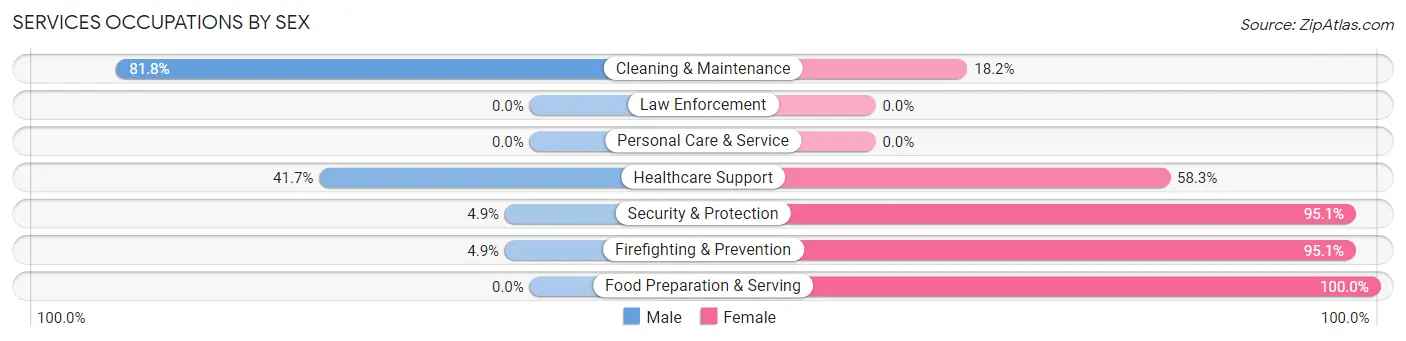
Services Occupations by Sex
Within the Services occupations in Manokotak, the most male-oriented occupations are Cleaning & Maintenance (81.8%), Healthcare Support (41.7%), and Security & Protection (4.9%), while the most female-oriented occupations are Food Preparation & Serving (100.0%), Security & Protection (95.1%), and Firefighting & Prevention (95.1%).
| Occupation | Male | Female |
| Healthcare Support | 5 (41.7%) | 7 (58.3%) |
| Security & Protection | 2 (4.9%) | 39 (95.1%) |
| Firefighting & Prevention | 2 (4.9%) | 39 (95.1%) |
| Law Enforcement | 0 (0.0%) | 0 (0.0%) |
| Food Preparation & Serving | 0 (0.0%) | 2 (100.0%) |
| Cleaning & Maintenance | 9 (81.8%) | 2 (18.2%) |
| Personal Care & Service | 0 (0.0%) | 0 (0.0%) |
| Total (Category) | 16 (24.2%) | 50 (75.8%) |
| Total (Overall) | 70 (35.9%) | 125 (64.1%) |
Sales and Office Occupations
The most common Sales and Office occupations in Manokotak are Office & Administration (19 | 9.7%), and Sales & Related (7 | 3.6%).
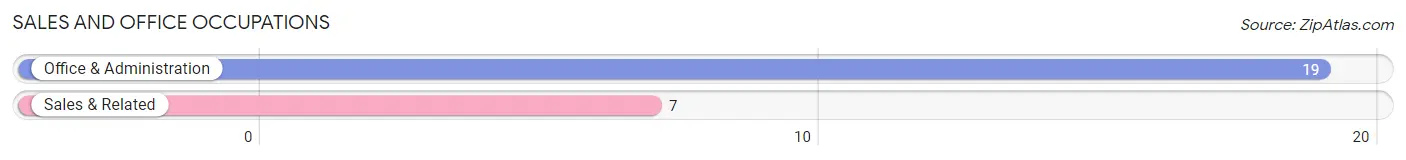
Sales and Office Occupations by Sex
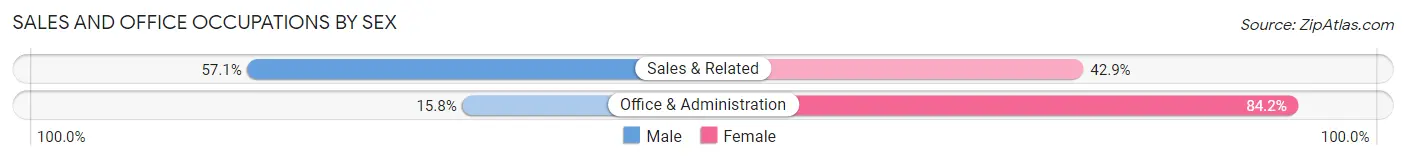
| Occupation | Male | Female |
| Sales & Related | 4 (57.1%) | 3 (42.9%) |
| Office & Administration | 3 (15.8%) | 16 (84.2%) |
| Total (Category) | 7 (26.9%) | 19 (73.1%) |
| Total (Overall) | 70 (35.9%) | 125 (64.1%) |
Natural Resources, Construction and Maintenance Occupations
The most common Natural Resources, Construction and Maintenance occupations in Manokotak are Construction & Extraction (9 | 4.6%), and Installation, Maintenance & Repair (6 | 3.1%).
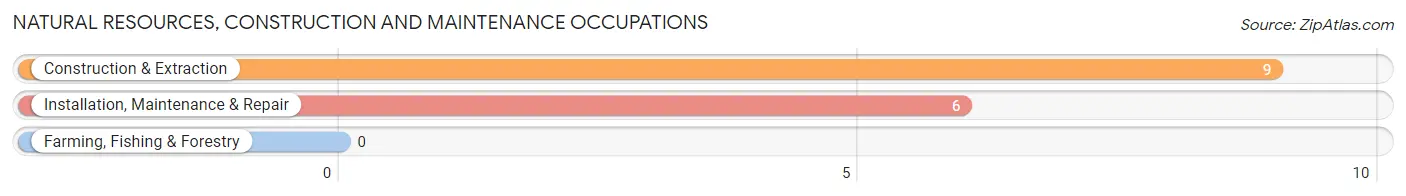
Natural Resources, Construction and Maintenance Occupations by Sex
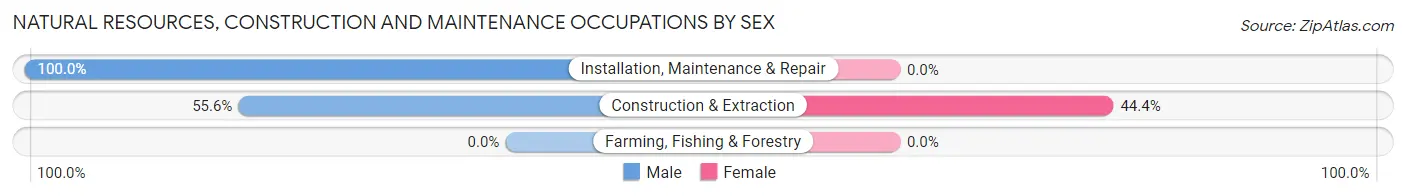
| Occupation | Male | Female |
| Farming, Fishing & Forestry | 0 (0.0%) | 0 (0.0%) |
| Construction & Extraction | 5 (55.6%) | 4 (44.4%) |
| Installation, Maintenance & Repair | 6 (100.0%) | 0 (0.0%) |
| Total (Category) | 11 (73.3%) | 4 (26.7%) |
| Total (Overall) | 70 (35.9%) | 125 (64.1%) |
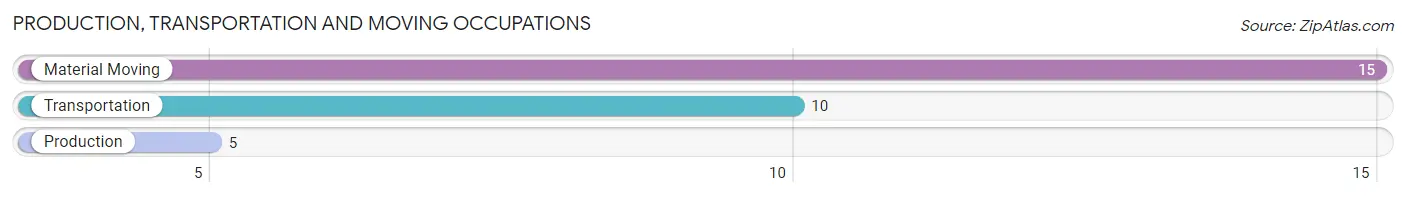
Production, Transportation and Moving Occupations
The most common Production, Transportation and Moving occupations in Manokotak are Material Moving (15 | 7.7%), Transportation (10 | 5.1%), and Production (5 | 2.6%).
Production, Transportation and Moving Occupations by Sex
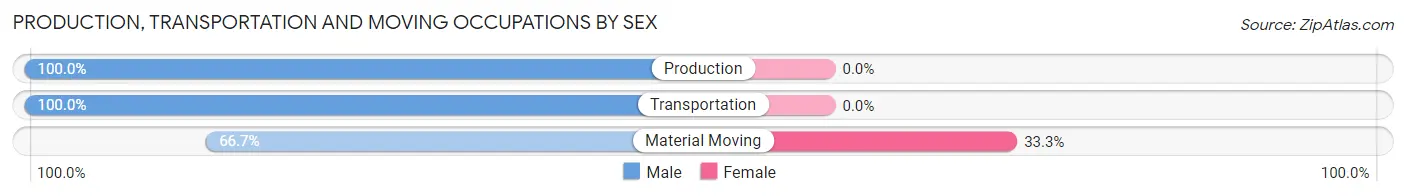
| Occupation | Male | Female |
| Production | 5 (100.0%) | 0 (0.0%) |
| Transportation | 10 (100.0%) | 0 (0.0%) |
| Material Moving | 10 (66.7%) | 5 (33.3%) |
| Total (Category) | 25 (83.3%) | 5 (16.7%) |
| Total (Overall) | 70 (35.9%) | 125 (64.1%) |
Employment Industries by Sex in Manokotak
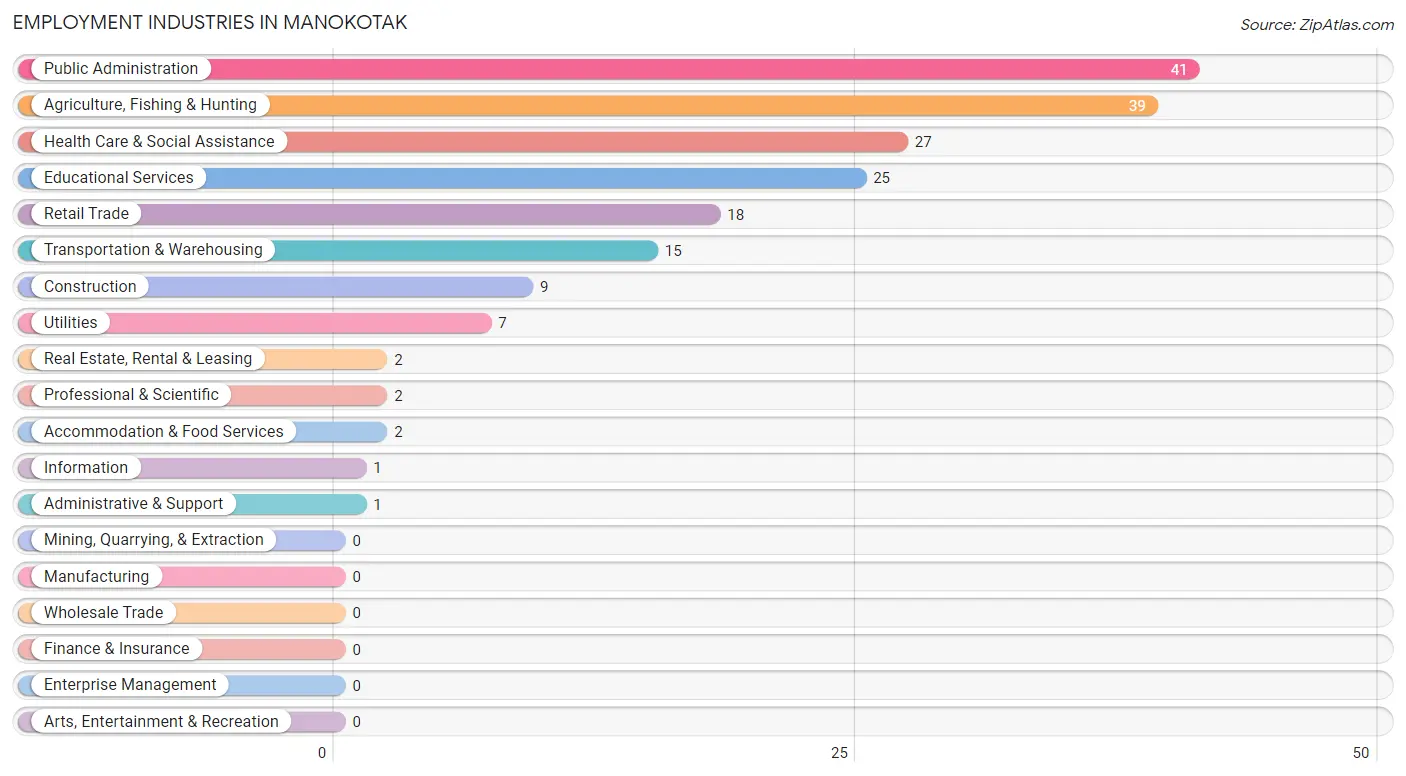
Employment Industries in Manokotak
The major employment industries in Manokotak include Public Administration (41 | 21.0%), Agriculture, Fishing & Hunting (39 | 20.0%), Health Care & Social Assistance (27 | 13.9%), Educational Services (25 | 12.8%), and Retail Trade (18 | 9.2%).
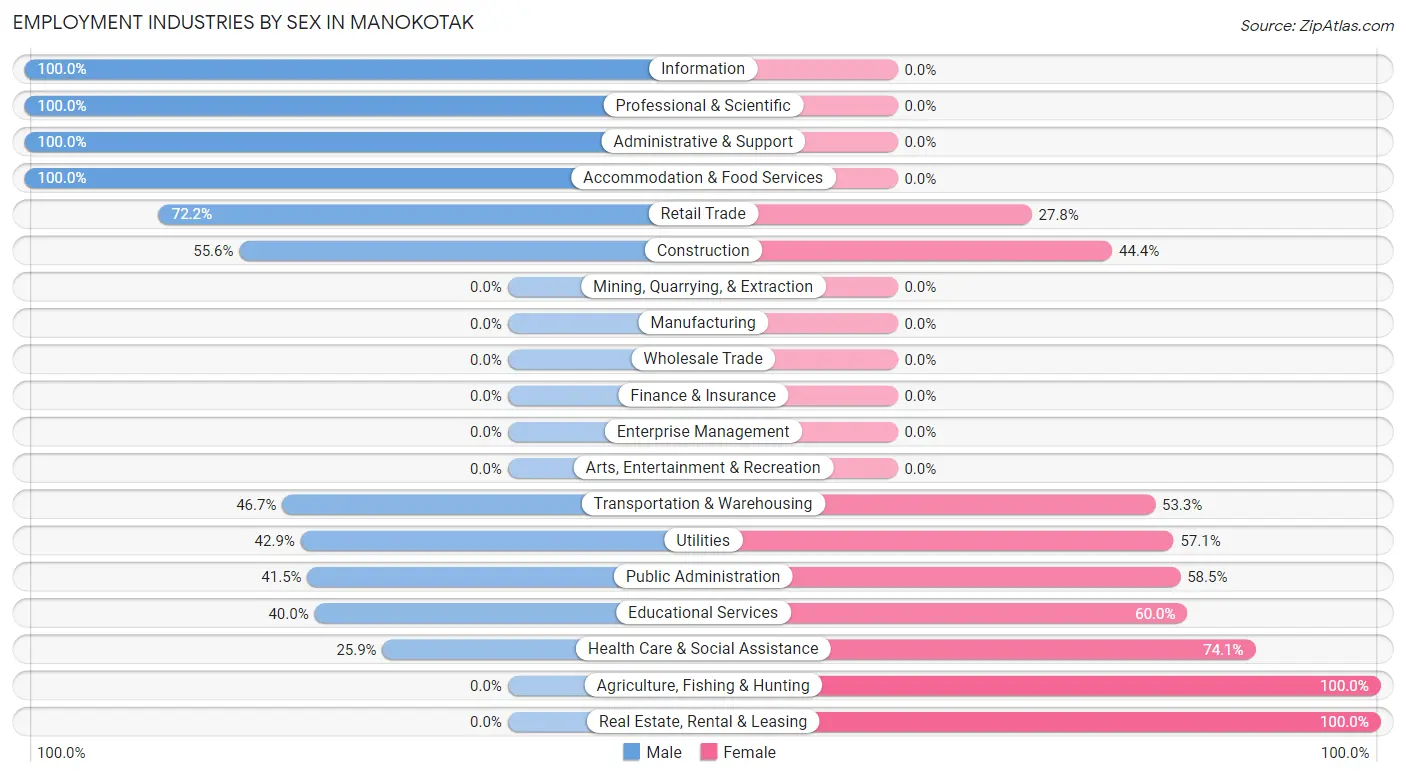
Employment Industries by Sex in Manokotak
The Manokotak industries that see more men than women are Information (100.0%), Professional & Scientific (100.0%), and Administrative & Support (100.0%), whereas the industries that tend to have a higher number of women are Agriculture, Fishing & Hunting (100.0%), Real Estate, Rental & Leasing (100.0%), and Health Care & Social Assistance (74.1%).
| Industry | Male | Female |
| Agriculture, Fishing & Hunting | 0 (0.0%) | 39 (100.0%) |
| Mining, Quarrying, & Extraction | 0 (0.0%) | 0 (0.0%) |
| Construction | 5 (55.6%) | 4 (44.4%) |
| Manufacturing | 0 (0.0%) | 0 (0.0%) |
| Wholesale Trade | 0 (0.0%) | 0 (0.0%) |
| Retail Trade | 13 (72.2%) | 5 (27.8%) |
| Transportation & Warehousing | 7 (46.7%) | 8 (53.3%) |
| Utilities | 3 (42.9%) | 4 (57.1%) |
| Information | 1 (100.0%) | 0 (0.0%) |
| Finance & Insurance | 0 (0.0%) | 0 (0.0%) |
| Real Estate, Rental & Leasing | 0 (0.0%) | 2 (100.0%) |
| Professional & Scientific | 2 (100.0%) | 0 (0.0%) |
| Enterprise Management | 0 (0.0%) | 0 (0.0%) |
| Administrative & Support | 1 (100.0%) | 0 (0.0%) |
| Educational Services | 10 (40.0%) | 15 (60.0%) |
| Health Care & Social Assistance | 7 (25.9%) | 20 (74.1%) |
| Arts, Entertainment & Recreation | 0 (0.0%) | 0 (0.0%) |
| Accommodation & Food Services | 2 (100.0%) | 0 (0.0%) |
| Public Administration | 17 (41.5%) | 24 (58.5%) |
| Total | 70 (35.9%) | 125 (64.1%) |
Education in Manokotak
School Enrollment in Manokotak
The most common levels of schooling among the 169 students in Manokotak are elementary school (48 | 28.4%), high school (48 | 28.4%), and middle school (37 | 21.9%).
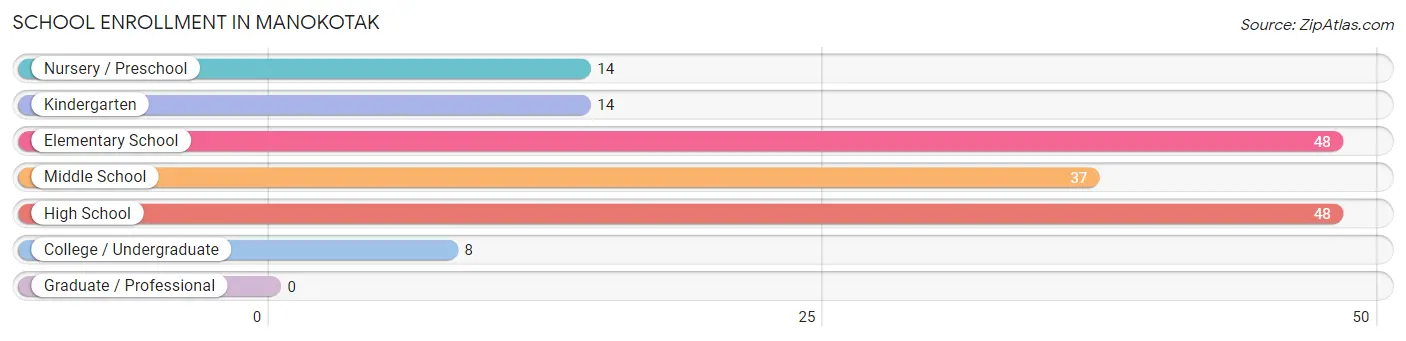
| School Level | # Students | % Students |
| Nursery / Preschool | 14 | 8.3% |
| Kindergarten | 14 | 8.3% |
| Elementary School | 48 | 28.4% |
| Middle School | 37 | 21.9% |
| High School | 48 | 28.4% |
| College / Undergraduate | 8 | 4.7% |
| Graduate / Professional | 0 | 0.0% |
| Total | 169 | 100.0% |
School Enrollment by Age by Funding Source in Manokotak
Out of a total of 169 students who are enrolled in schools in Manokotak, 2 (1.2%) attend a private institution, while the remaining 167 (98.8%) are enrolled in public schools. The age group of 10 to 14 year olds has the highest likelihood of being enrolled in private schools, with 2 (4.9% in the age bracket) enrolled. Conversely, the age group of 3 to 4 year olds has the lowest likelihood of being enrolled in a private school, with 6 (100.0% in the age bracket) attending a public institution.
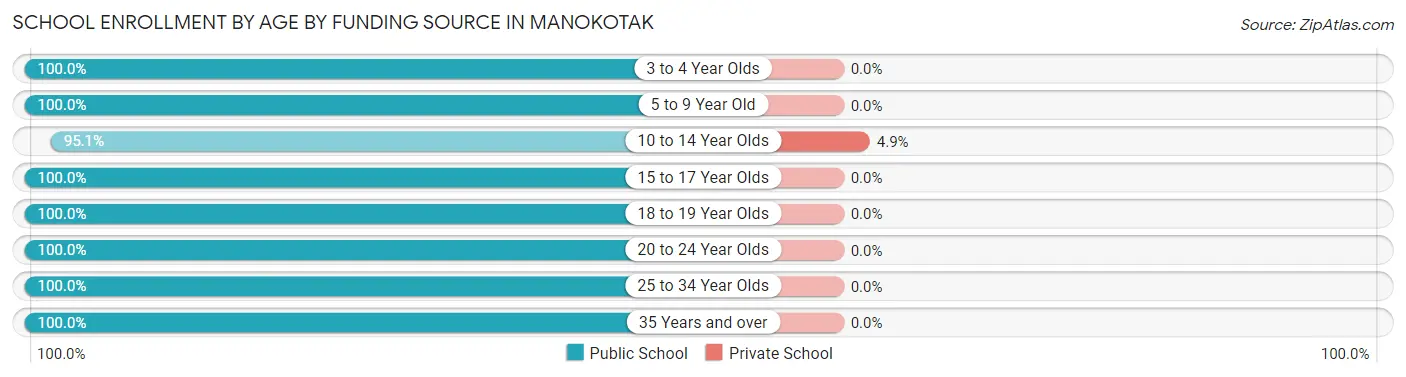
| Age Bracket | Public School | Private School |
| 3 to 4 Year Olds | 6 (100.0%) | 0 (0.0%) |
| 5 to 9 Year Old | 66 (100.0%) | 0 (0.0%) |
| 10 to 14 Year Olds | 39 (95.1%) | 2 (4.9%) |
| 15 to 17 Year Olds | 35 (100.0%) | 0 (0.0%) |
| 18 to 19 Year Olds | 15 (100.0%) | 0 (0.0%) |
| 20 to 24 Year Olds | 2 (100.0%) | 0 (0.0%) |
| 25 to 34 Year Olds | 2 (100.0%) | 0 (0.0%) |
| 35 Years and over | 2 (100.0%) | 0 (0.0%) |
| Total | 167 (98.8%) | 2 (1.2%) |
Educational Attainment by Field of Study in Manokotak
Bio, nature & agricultural (39 | 76.5%), social sciences (6 | 11.8%), science & technology (3 | 5.9%), and education (3 | 5.9%) are the most common fields of study among 51 individuals in Manokotak who have obtained a bachelor's degree or higher.
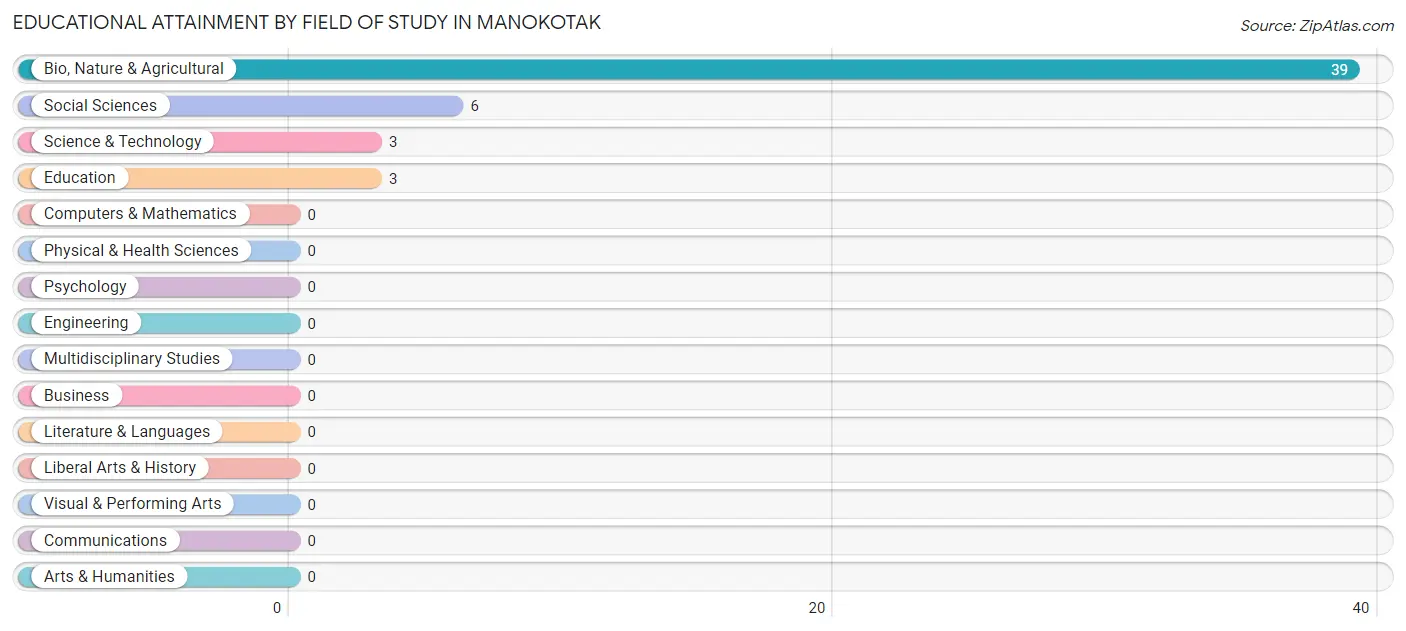
| Field of Study | # Graduates | % Graduates |
| Computers & Mathematics | 0 | 0.0% |
| Bio, Nature & Agricultural | 39 | 76.5% |
| Physical & Health Sciences | 0 | 0.0% |
| Psychology | 0 | 0.0% |
| Social Sciences | 6 | 11.8% |
| Engineering | 0 | 0.0% |
| Multidisciplinary Studies | 0 | 0.0% |
| Science & Technology | 3 | 5.9% |
| Business | 0 | 0.0% |
| Education | 3 | 5.9% |
| Literature & Languages | 0 | 0.0% |
| Liberal Arts & History | 0 | 0.0% |
| Visual & Performing Arts | 0 | 0.0% |
| Communications | 0 | 0.0% |
| Arts & Humanities | 0 | 0.0% |
| Total | 51 | 100.0% |
Transportation & Commute in Manokotak
Vehicle Availability by Sex in Manokotak
The most prevalent vehicle ownership categories in Manokotak are males with 1 vehicle (36, accounting for 51.4%) and females with 1 vehicle (30, making up 41.9%).
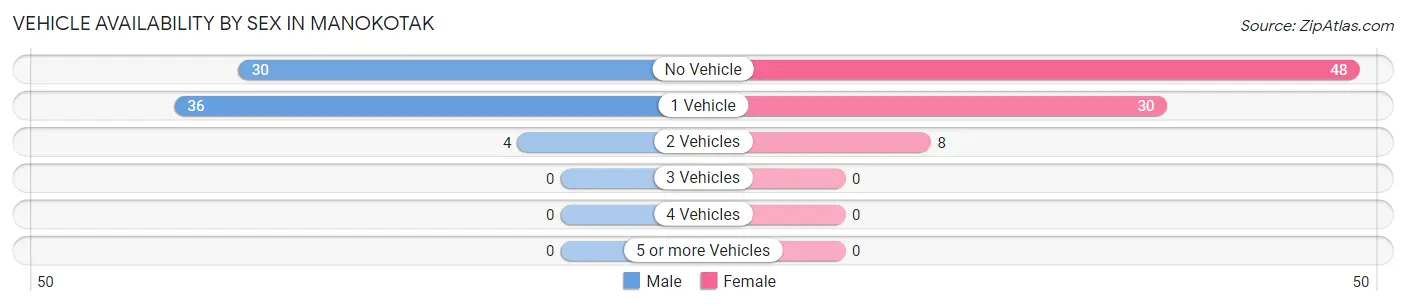
| Vehicles Available | Male | Female |
| No Vehicle | 30 (42.9%) | 48 (55.8%) |
| 1 Vehicle | 36 (51.4%) | 30 (34.9%) |
| 2 Vehicles | 4 (5.7%) | 8 (9.3%) |
| 3 Vehicles | 0 (0.0%) | 0 (0.0%) |
| 4 Vehicles | 0 (0.0%) | 0 (0.0%) |
| 5 or more Vehicles | 0 (0.0%) | 0 (0.0%) |
| Total | 70 (100.0%) | 86 (100.0%) |
Commute Time in Manokotak
The most frequently occuring commute durations in Manokotak are 5 to 9 minutes (83 commuters, 43.5%), less than 5 minutes (51 commuters, 26.7%), and 10 to 14 minutes (35 commuters, 18.3%).
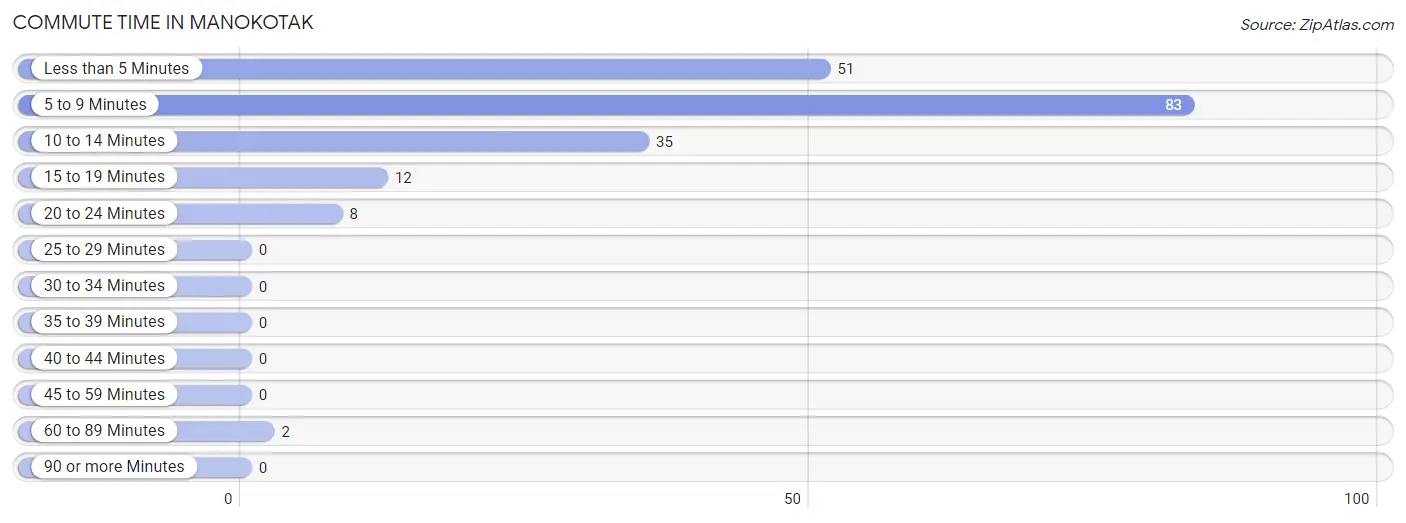
| Commute Time | # Commuters | % Commuters |
| Less than 5 Minutes | 51 | 26.7% |
| 5 to 9 Minutes | 83 | 43.5% |
| 10 to 14 Minutes | 35 | 18.3% |
| 15 to 19 Minutes | 12 | 6.3% |
| 20 to 24 Minutes | 8 | 4.2% |
| 25 to 29 Minutes | 0 | 0.0% |
| 30 to 34 Minutes | 0 | 0.0% |
| 35 to 39 Minutes | 0 | 0.0% |
| 40 to 44 Minutes | 0 | 0.0% |
| 45 to 59 Minutes | 0 | 0.0% |
| 60 to 89 Minutes | 2 | 1.1% |
| 90 or more Minutes | 0 | 0.0% |
Commute Time by Sex in Manokotak
The most common commute times in Manokotak are less than 5 minutes (24 commuters, 35.3%) for males and 5 to 9 minutes (64 commuters, 52.0%) for females.
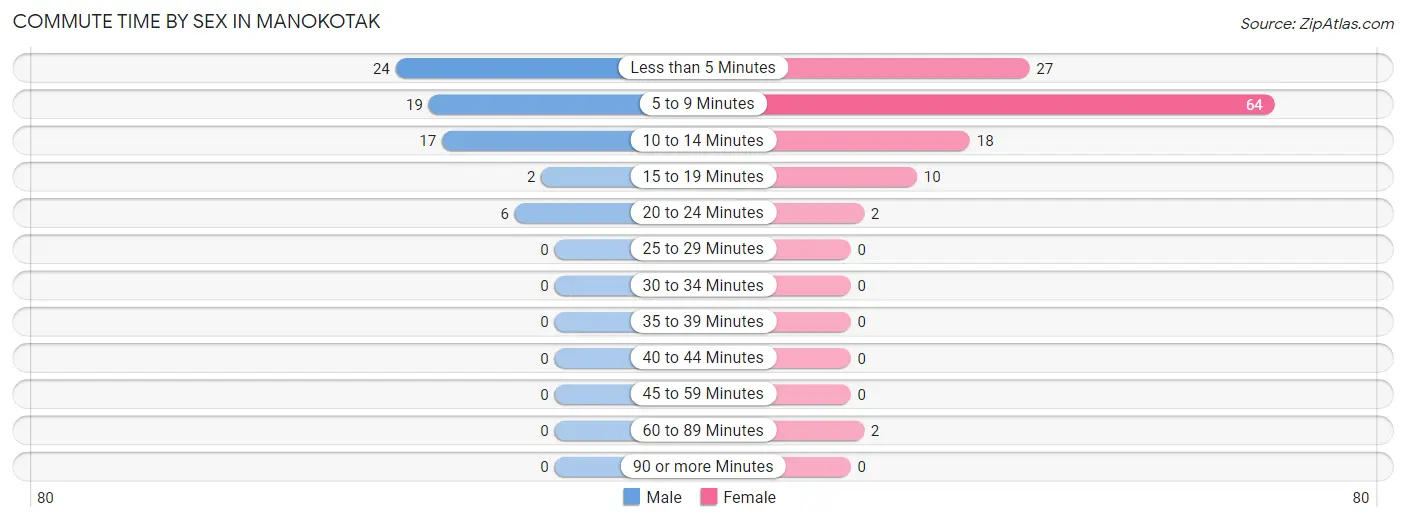
| Commute Time | Male | Female |
| Less than 5 Minutes | 24 (35.3%) | 27 (22.0%) |
| 5 to 9 Minutes | 19 (27.9%) | 64 (52.0%) |
| 10 to 14 Minutes | 17 (25.0%) | 18 (14.6%) |
| 15 to 19 Minutes | 2 (2.9%) | 10 (8.1%) |
| 20 to 24 Minutes | 6 (8.8%) | 2 (1.6%) |
| 25 to 29 Minutes | 0 (0.0%) | 0 (0.0%) |
| 30 to 34 Minutes | 0 (0.0%) | 0 (0.0%) |
| 35 to 39 Minutes | 0 (0.0%) | 0 (0.0%) |
| 40 to 44 Minutes | 0 (0.0%) | 0 (0.0%) |
| 45 to 59 Minutes | 0 (0.0%) | 0 (0.0%) |
| 60 to 89 Minutes | 0 (0.0%) | 2 (1.6%) |
| 90 or more Minutes | 0 (0.0%) | 0 (0.0%) |
Time of Departure to Work by Sex in Manokotak
The most frequent times of departure to work in Manokotak are 8:30 AM to 8:59 AM (18, 26.5%) for males and 7:30 AM to 7:59 AM (46, 37.4%) for females.
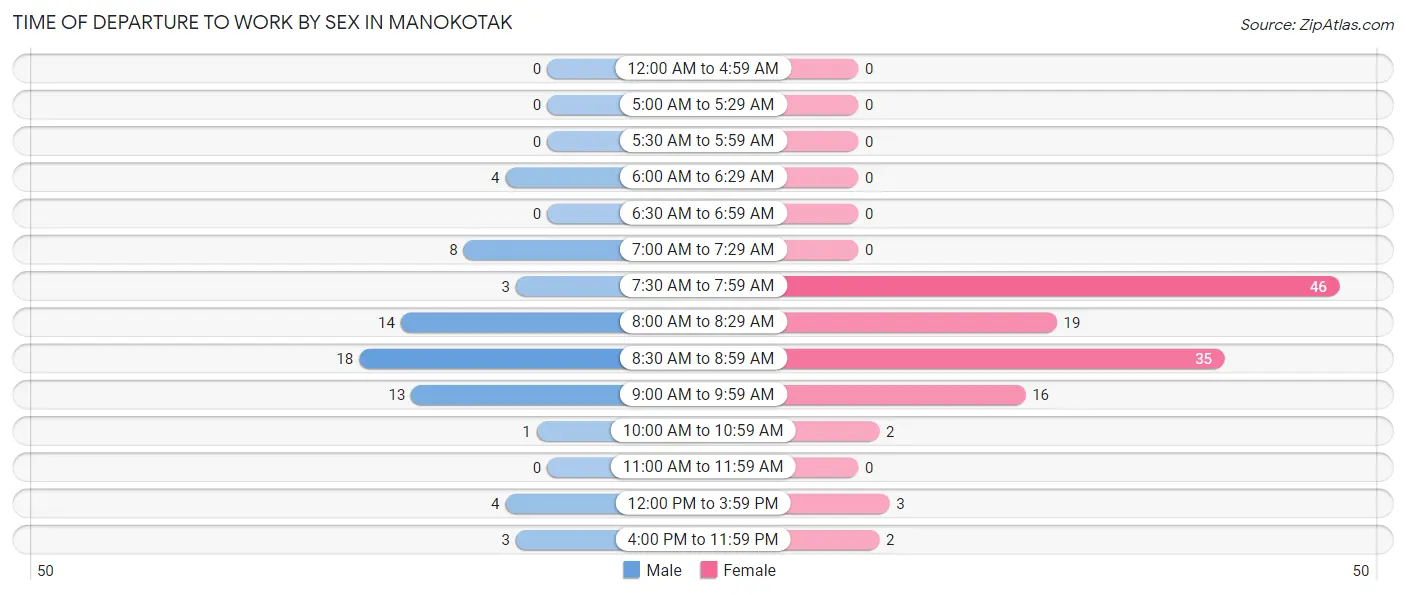
| Time of Departure | Male | Female |
| 12:00 AM to 4:59 AM | 0 (0.0%) | 0 (0.0%) |
| 5:00 AM to 5:29 AM | 0 (0.0%) | 0 (0.0%) |
| 5:30 AM to 5:59 AM | 0 (0.0%) | 0 (0.0%) |
| 6:00 AM to 6:29 AM | 4 (5.9%) | 0 (0.0%) |
| 6:30 AM to 6:59 AM | 0 (0.0%) | 0 (0.0%) |
| 7:00 AM to 7:29 AM | 8 (11.8%) | 0 (0.0%) |
| 7:30 AM to 7:59 AM | 3 (4.4%) | 46 (37.4%) |
| 8:00 AM to 8:29 AM | 14 (20.6%) | 19 (15.4%) |
| 8:30 AM to 8:59 AM | 18 (26.5%) | 35 (28.5%) |
| 9:00 AM to 9:59 AM | 13 (19.1%) | 16 (13.0%) |
| 10:00 AM to 10:59 AM | 1 (1.5%) | 2 (1.6%) |
| 11:00 AM to 11:59 AM | 0 (0.0%) | 0 (0.0%) |
| 12:00 PM to 3:59 PM | 4 (5.9%) | 3 (2.4%) |
| 4:00 PM to 11:59 PM | 3 (4.4%) | 2 (1.6%) |
| Total | 68 (100.0%) | 123 (100.0%) |
Housing Occupancy in Manokotak
Occupancy by Ownership in Manokotak
Of the total 141 dwellings in Manokotak, owner-occupied units account for 108 (76.6%), while renter-occupied units make up 33 (23.4%).
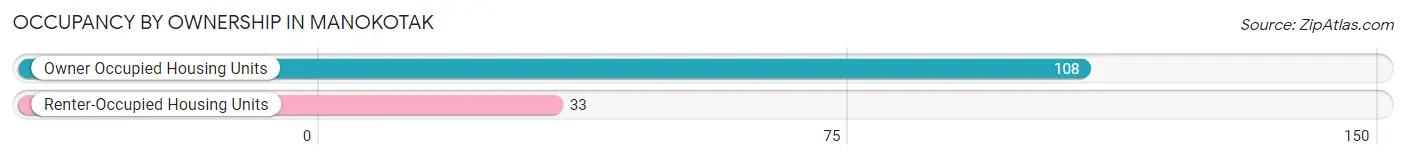
| Occupancy | # Housing Units | % Housing Units |
| Owner Occupied Housing Units | 108 | 76.6% |
| Renter-Occupied Housing Units | 33 | 23.4% |
| Total Occupied Housing Units | 141 | 100.0% |
Occupancy by Household Size in Manokotak
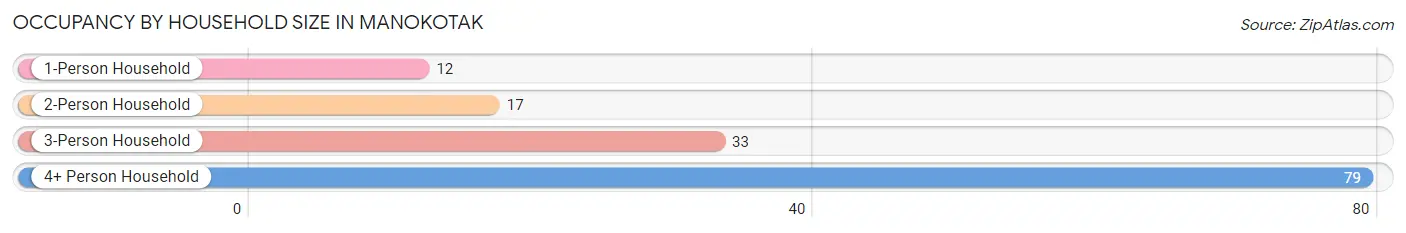
| Household Size | # Housing Units | % Housing Units |
| 1-Person Household | 12 | 8.5% |
| 2-Person Household | 17 | 12.1% |
| 3-Person Household | 33 | 23.4% |
| 4+ Person Household | 79 | 56.0% |
| Total Housing Units | 141 | 100.0% |
Occupancy by Ownership by Household Size in Manokotak
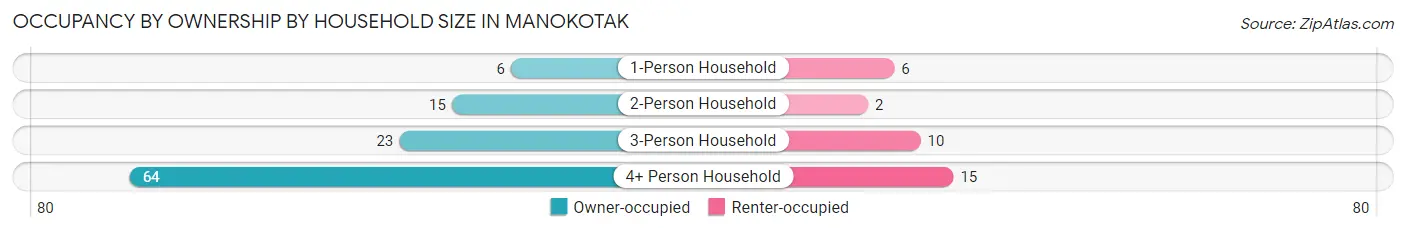
| Household Size | Owner-occupied | Renter-occupied |
| 1-Person Household | 6 (50.0%) | 6 (50.0%) |
| 2-Person Household | 15 (88.2%) | 2 (11.8%) |
| 3-Person Household | 23 (69.7%) | 10 (30.3%) |
| 4+ Person Household | 64 (81.0%) | 15 (19.0%) |
| Total Housing Units | 108 (76.6%) | 33 (23.4%) |
Occupancy by Educational Attainment in Manokotak
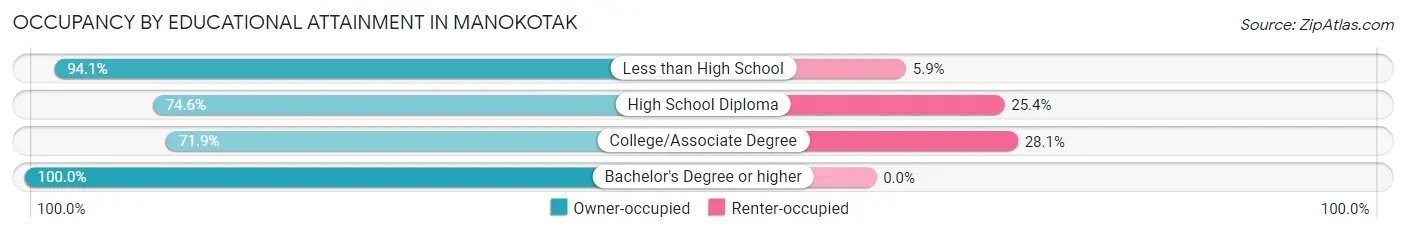
| Household Size | Owner-occupied | Renter-occupied |
| Less than High School | 16 (94.1%) | 1 (5.9%) |
| High School Diploma | 47 (74.6%) | 16 (25.4%) |
| College/Associate Degree | 41 (71.9%) | 16 (28.1%) |
| Bachelor's Degree or higher | 4 (100.0%) | 0 (0.0%) |
Occupancy by Age of Householder in Manokotak
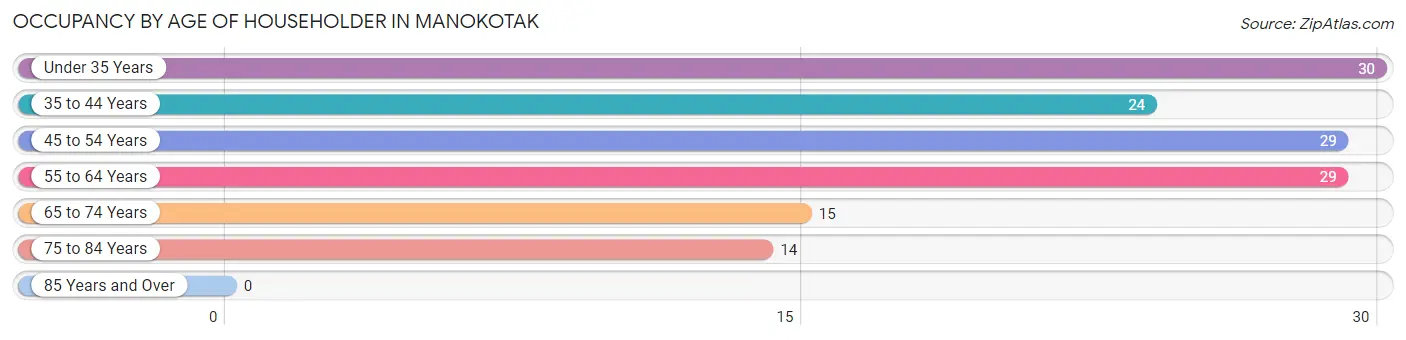
| Age Bracket | # Households | % Households |
| Under 35 Years | 30 | 21.3% |
| 35 to 44 Years | 24 | 17.0% |
| 45 to 54 Years | 29 | 20.6% |
| 55 to 64 Years | 29 | 20.6% |
| 65 to 74 Years | 15 | 10.6% |
| 75 to 84 Years | 14 | 9.9% |
| 85 Years and Over | 0 | 0.0% |
| Total | 141 | 100.0% |
Housing Finances in Manokotak
Median Income by Occupancy in Manokotak
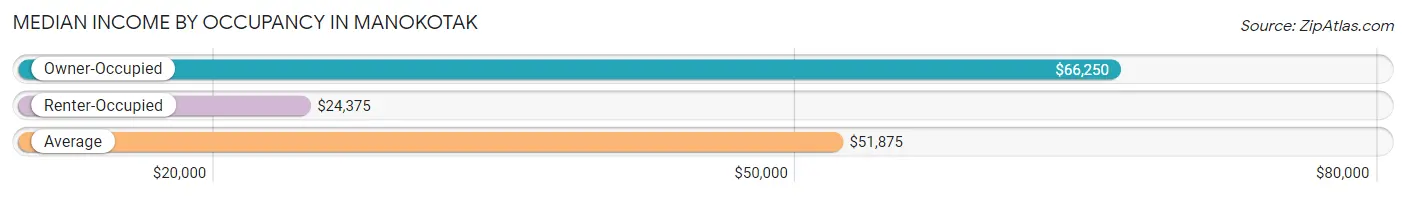
| Occupancy Type | # Households | Median Income |
| Owner-Occupied | 108 (76.6%) | $66,250 |
| Renter-Occupied | 33 (23.4%) | $24,375 |
| Average | 141 (100.0%) | $51,875 |
Occupancy by Householder Income Bracket in Manokotak
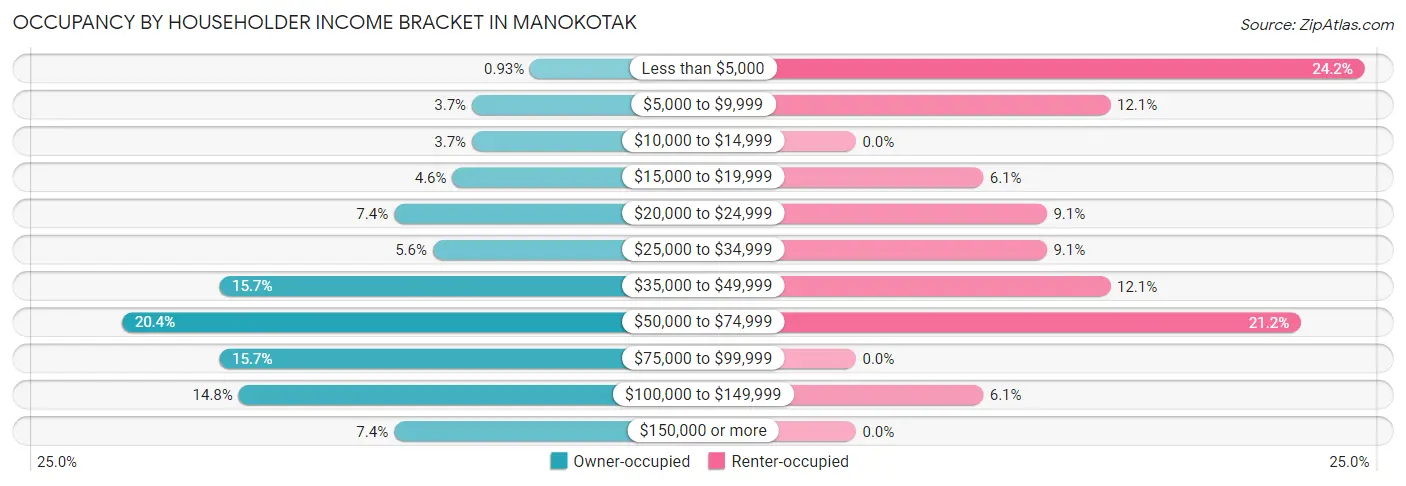
| Income Bracket | Owner-occupied | Renter-occupied |
| Less than $5,000 | 1 (0.9%) | 8 (24.2%) |
| $5,000 to $9,999 | 4 (3.7%) | 4 (12.1%) |
| $10,000 to $14,999 | 4 (3.7%) | 0 (0.0%) |
| $15,000 to $19,999 | 5 (4.6%) | 2 (6.1%) |
| $20,000 to $24,999 | 8 (7.4%) | 3 (9.1%) |
| $25,000 to $34,999 | 6 (5.6%) | 3 (9.1%) |
| $35,000 to $49,999 | 17 (15.7%) | 4 (12.1%) |
| $50,000 to $74,999 | 22 (20.4%) | 7 (21.2%) |
| $75,000 to $99,999 | 17 (15.7%) | 0 (0.0%) |
| $100,000 to $149,999 | 16 (14.8%) | 2 (6.1%) |
| $150,000 or more | 8 (7.4%) | 0 (0.0%) |
| Total | 108 (100.0%) | 33 (100.0%) |
Monthly Housing Cost Tiers in Manokotak
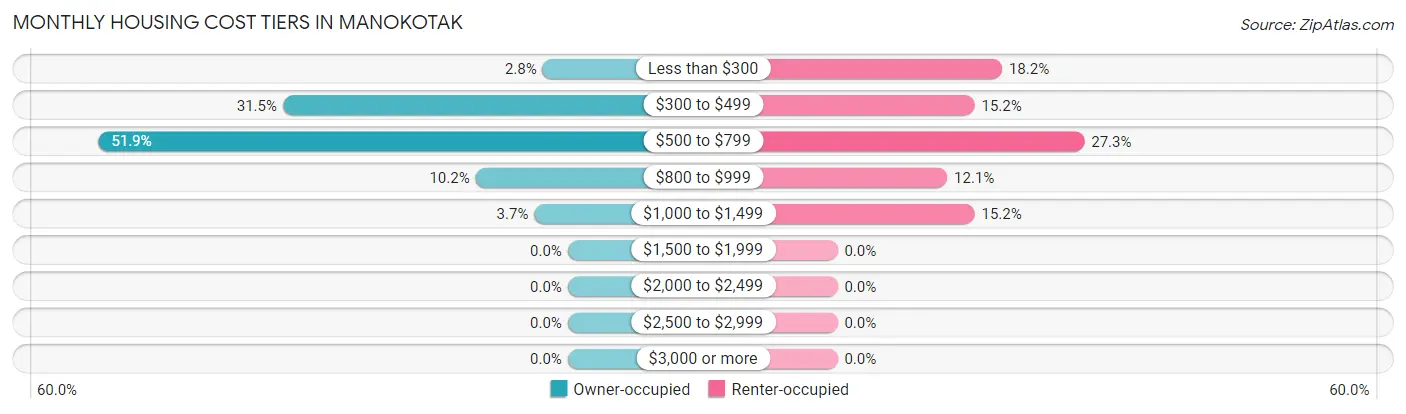
| Monthly Cost | Owner-occupied | Renter-occupied |
| Less than $300 | 3 (2.8%) | 6 (18.2%) |
| $300 to $499 | 34 (31.5%) | 5 (15.1%) |
| $500 to $799 | 56 (51.8%) | 9 (27.3%) |
| $800 to $999 | 11 (10.2%) | 4 (12.1%) |
| $1,000 to $1,499 | 4 (3.7%) | 5 (15.1%) |
| $1,500 to $1,999 | 0 (0.0%) | 0 (0.0%) |
| $2,000 to $2,499 | 0 (0.0%) | 0 (0.0%) |
| $2,500 to $2,999 | 0 (0.0%) | 0 (0.0%) |
| $3,000 or more | 0 (0.0%) | 0 (0.0%) |
| Total | 108 (100.0%) | 33 (100.0%) |
Physical Housing Characteristics in Manokotak
Housing Structures in Manokotak
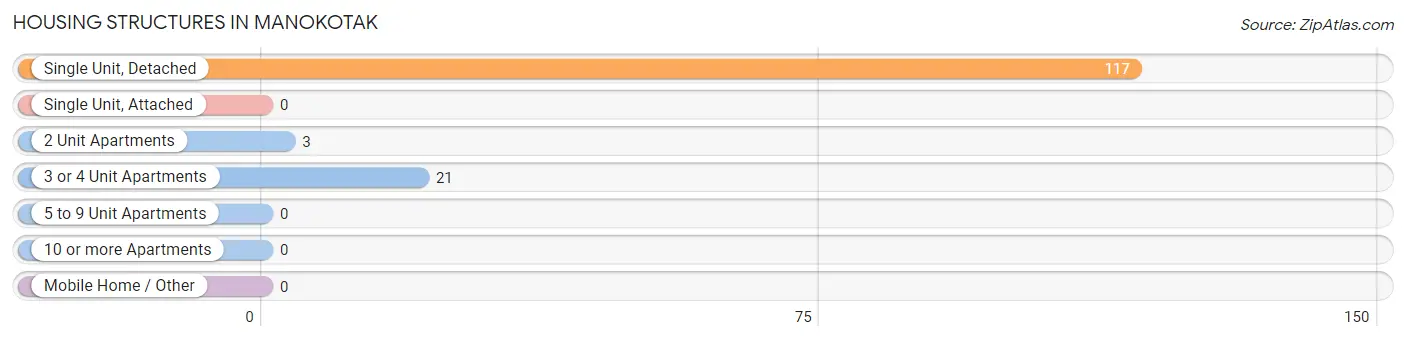
| Structure Type | # Housing Units | % Housing Units |
| Single Unit, Detached | 117 | 83.0% |
| Single Unit, Attached | 0 | 0.0% |
| 2 Unit Apartments | 3 | 2.1% |
| 3 or 4 Unit Apartments | 21 | 14.9% |
| 5 to 9 Unit Apartments | 0 | 0.0% |
| 10 or more Apartments | 0 | 0.0% |
| Mobile Home / Other | 0 | 0.0% |
| Total | 141 | 100.0% |
Housing Structures by Occupancy in Manokotak
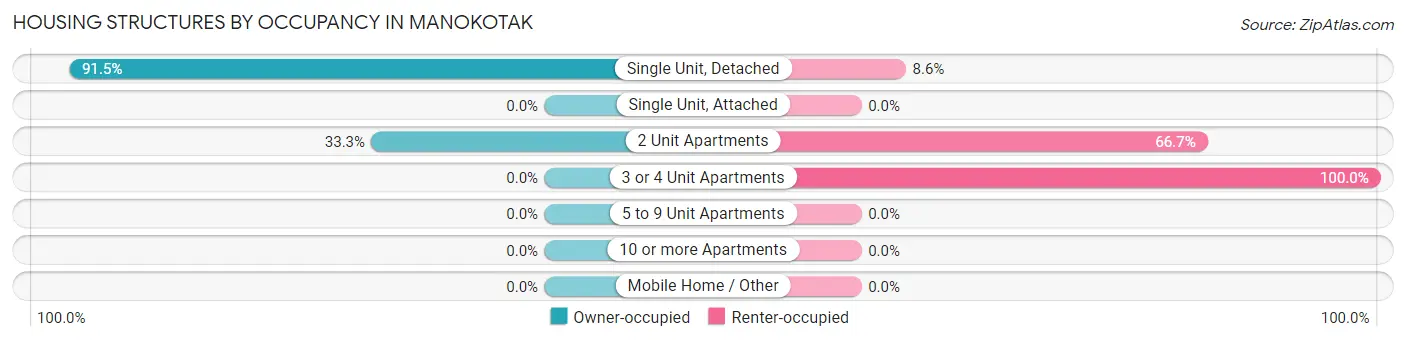
| Structure Type | Owner-occupied | Renter-occupied |
| Single Unit, Detached | 107 (91.4%) | 10 (8.6%) |
| Single Unit, Attached | 0 (0.0%) | 0 (0.0%) |
| 2 Unit Apartments | 1 (33.3%) | 2 (66.7%) |
| 3 or 4 Unit Apartments | 0 (0.0%) | 21 (100.0%) |
| 5 to 9 Unit Apartments | 0 (0.0%) | 0 (0.0%) |
| 10 or more Apartments | 0 (0.0%) | 0 (0.0%) |
| Mobile Home / Other | 0 (0.0%) | 0 (0.0%) |
| Total | 108 (76.6%) | 33 (23.4%) |
Housing Structures by Number of Rooms in Manokotak
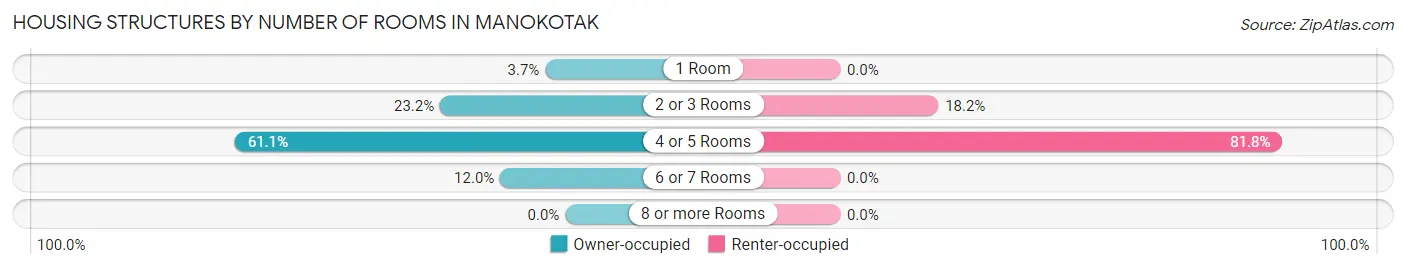
| Number of Rooms | Owner-occupied | Renter-occupied |
| 1 Room | 4 (3.7%) | 0 (0.0%) |
| 2 or 3 Rooms | 25 (23.2%) | 6 (18.2%) |
| 4 or 5 Rooms | 66 (61.1%) | 27 (81.8%) |
| 6 or 7 Rooms | 13 (12.0%) | 0 (0.0%) |
| 8 or more Rooms | 0 (0.0%) | 0 (0.0%) |
| Total | 108 (100.0%) | 33 (100.0%) |
Housing Structure by Heating Type in Manokotak
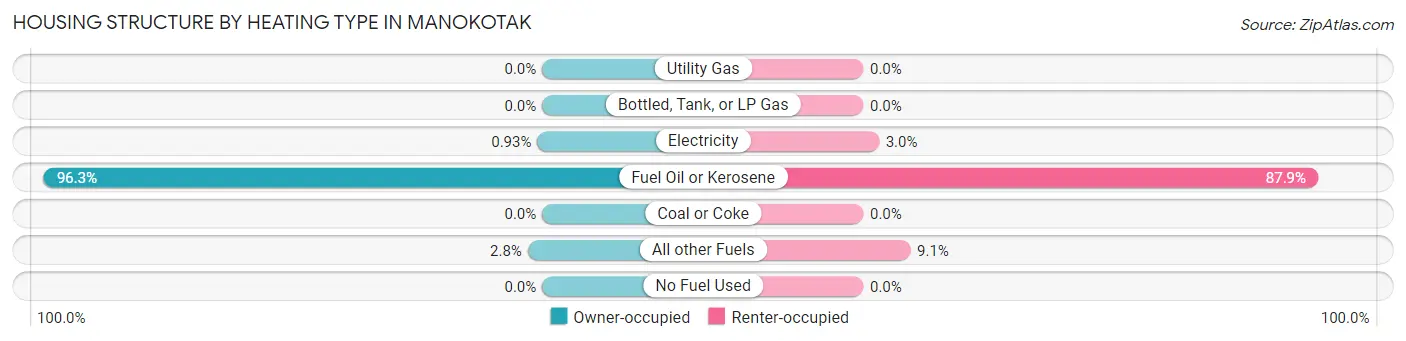
| Heating Type | Owner-occupied | Renter-occupied |
| Utility Gas | 0 (0.0%) | 0 (0.0%) |
| Bottled, Tank, or LP Gas | 0 (0.0%) | 0 (0.0%) |
| Electricity | 1 (0.9%) | 1 (3.0%) |
| Fuel Oil or Kerosene | 104 (96.3%) | 29 (87.9%) |
| Coal or Coke | 0 (0.0%) | 0 (0.0%) |
| All other Fuels | 3 (2.8%) | 3 (9.1%) |
| No Fuel Used | 0 (0.0%) | 0 (0.0%) |
| Total | 108 (100.0%) | 33 (100.0%) |
Household Vehicle Usage in Manokotak
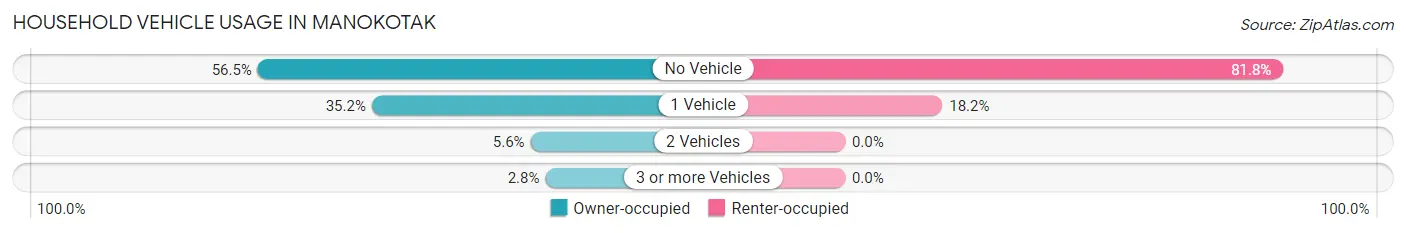
| Vehicles per Household | Owner-occupied | Renter-occupied |
| No Vehicle | 61 (56.5%) | 27 (81.8%) |
| 1 Vehicle | 38 (35.2%) | 6 (18.2%) |
| 2 Vehicles | 6 (5.6%) | 0 (0.0%) |
| 3 or more Vehicles | 3 (2.8%) | 0 (0.0%) |
| Total | 108 (100.0%) | 33 (100.0%) |
Real Estate & Mortgages in Manokotak
Real Estate and Mortgage Overview in Manokotak
| Characteristic | Without Mortgage | With Mortgage |
| Housing Units | 108 | 0 |
| Median Property Value | $85,600 | $0 |
| Median Household Income | $66,250 | $0 |
| Monthly Housing Costs | $577 | $0 |
| Real Estate Taxes | - | - |
Property Value by Mortgage Status in Manokotak
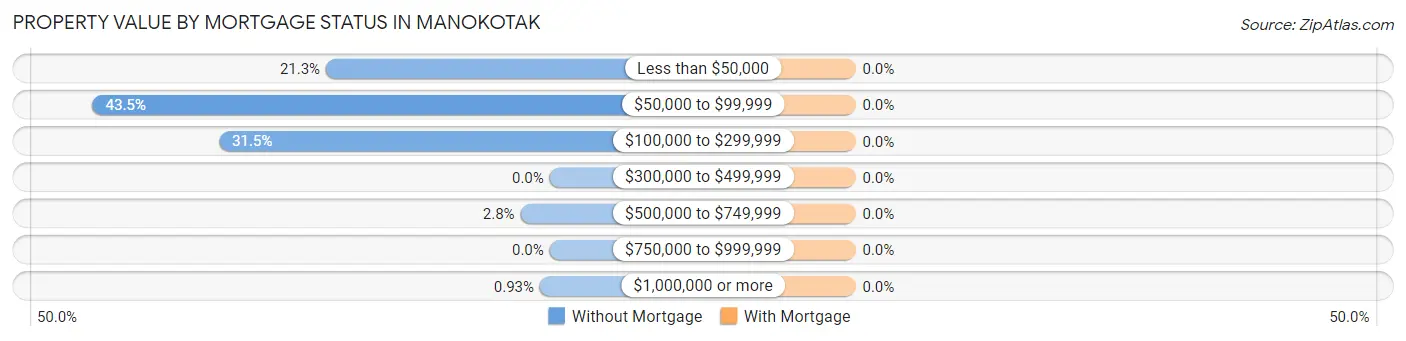
| Property Value | Without Mortgage | With Mortgage |
| Less than $50,000 | 23 (21.3%) | 0 (0.0%) |
| $50,000 to $99,999 | 47 (43.5%) | 0 (0.0%) |
| $100,000 to $299,999 | 34 (31.5%) | 0 (0.0%) |
| $300,000 to $499,999 | 0 (0.0%) | 0 (0.0%) |
| $500,000 to $749,999 | 3 (2.8%) | 0 (0.0%) |
| $750,000 to $999,999 | 0 (0.0%) | 0 (0.0%) |
| $1,000,000 or more | 1 (0.9%) | 0 (0.0%) |
| Total | 108 (100.0%) | 0 (0.0%) |
Household Income by Mortgage Status in Manokotak
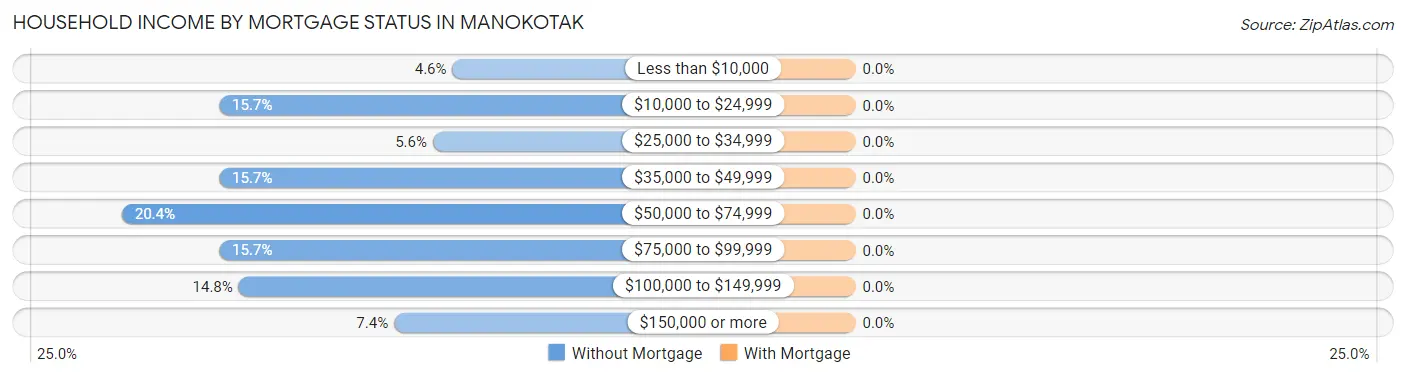
| Household Income | Without Mortgage | With Mortgage |
| Less than $10,000 | 5 (4.6%) | 0 (0.0%) |
| $10,000 to $24,999 | 17 (15.7%) | 0 (0.0%) |
| $25,000 to $34,999 | 6 (5.6%) | 0 (0.0%) |
| $35,000 to $49,999 | 17 (15.7%) | 0 (0.0%) |
| $50,000 to $74,999 | 22 (20.4%) | 0 (0.0%) |
| $75,000 to $99,999 | 17 (15.7%) | 0 (0.0%) |
| $100,000 to $149,999 | 16 (14.8%) | 0 (0.0%) |
| $150,000 or more | 8 (7.4%) | 0 (0.0%) |
| Total | 108 (100.0%) | 0 (0.0%) |
Property Value to Household Income Ratio in Manokotak
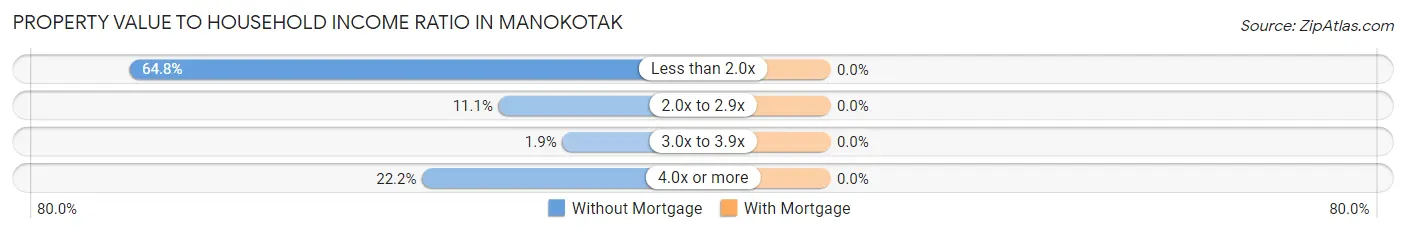
| Value-to-Income Ratio | Without Mortgage | With Mortgage |
| Less than 2.0x | 70 (64.8%) | 0 (0.0%) |
| 2.0x to 2.9x | 12 (11.1%) | 0 (0.0%) |
| 3.0x to 3.9x | 2 (1.8%) | 0 (0.0%) |
| 4.0x or more | 24 (22.2%) | 0 (0.0%) |
| Total | 108 (100.0%) | 0 (0.0%) |
Real Estate Taxes by Mortgage Status in Manokotak
| Property Taxes | Without Mortgage | With Mortgage |
| Less than $800 | 0 (0.0%) | 0 (0.0%) |
| $800 to $1,499 | 0 (0.0%) | 0 (0.0%) |
| $800 to $1,499 | 0 (0.0%) | 0 (0.0%) |
| Total | 108 (100.0%) | 0 (0.0%) |
Health & Disability in Manokotak
Health Insurance Coverage by Age in Manokotak
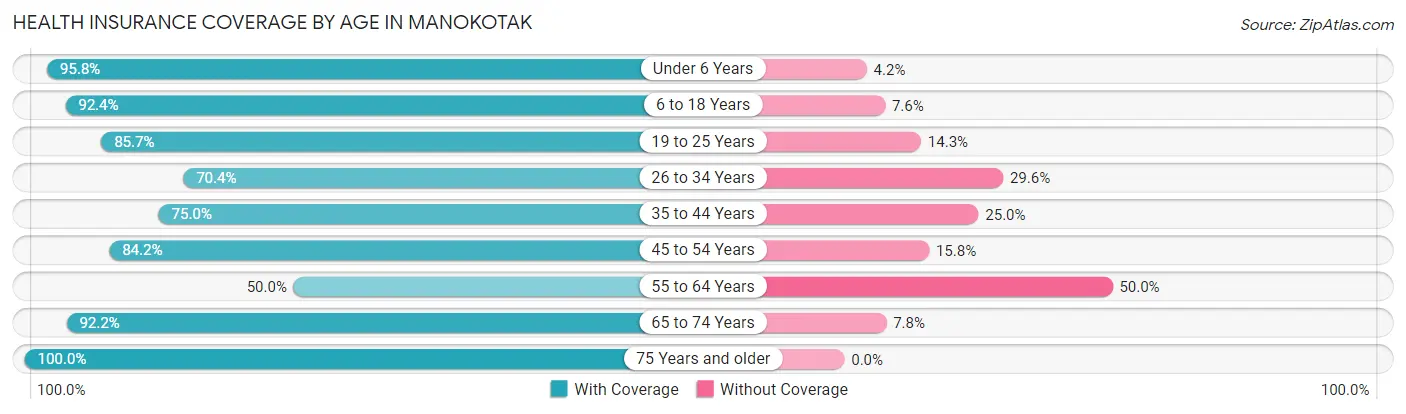
| Age Bracket | With Coverage | Without Coverage |
| Under 6 Years | 69 (95.8%) | 3 (4.2%) |
| 6 to 18 Years | 134 (92.4%) | 11 (7.6%) |
| 19 to 25 Years | 54 (85.7%) | 9 (14.3%) |
| 26 to 34 Years | 69 (70.4%) | 29 (29.6%) |
| 35 to 44 Years | 42 (75.0%) | 14 (25.0%) |
| 45 to 54 Years | 48 (84.2%) | 9 (15.8%) |
| 55 to 64 Years | 25 (50.0%) | 25 (50.0%) |
| 65 to 74 Years | 59 (92.2%) | 5 (7.8%) |
| 75 Years and older | 24 (100.0%) | 0 (0.0%) |
| Total | 524 (83.3%) | 105 (16.7%) |
Health Insurance Coverage by Citizenship Status in Manokotak
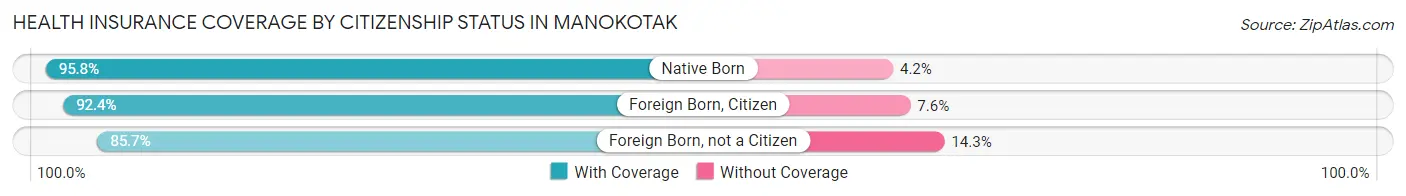
| Citizenship Status | With Coverage | Without Coverage |
| Native Born | 69 (95.8%) | 3 (4.2%) |
| Foreign Born, Citizen | 134 (92.4%) | 11 (7.6%) |
| Foreign Born, not a Citizen | 54 (85.7%) | 9 (14.3%) |
Health Insurance Coverage by Household Income in Manokotak
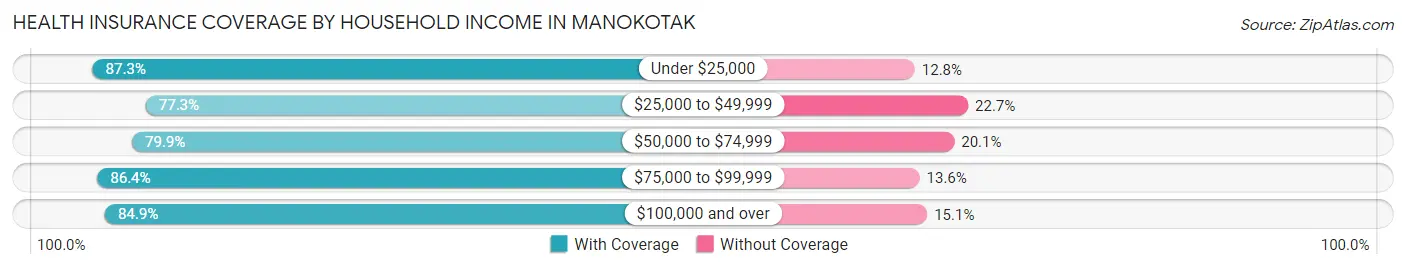
| Household Income | With Coverage | Without Coverage |
| Under $25,000 | 89 (87.3%) | 13 (12.8%) |
| $25,000 to $49,999 | 85 (77.3%) | 25 (22.7%) |
| $50,000 to $74,999 | 111 (79.9%) | 28 (20.1%) |
| $75,000 to $99,999 | 76 (86.4%) | 12 (13.6%) |
| $100,000 and over | 124 (84.9%) | 22 (15.1%) |
Public vs Private Health Insurance Coverage by Age in Manokotak
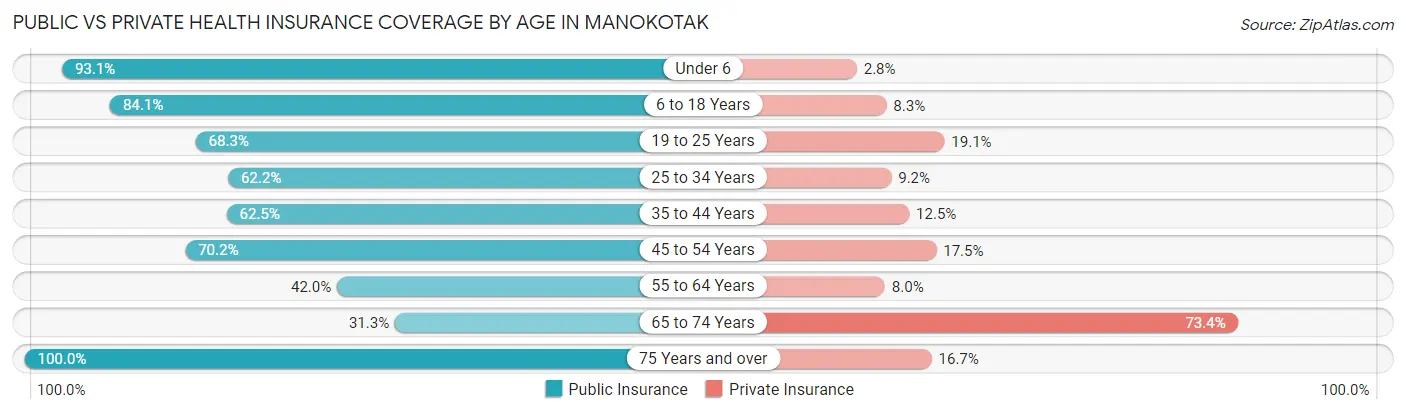
| Age Bracket | Public Insurance | Private Insurance |
| Under 6 | 67 (93.1%) | 2 (2.8%) |
| 6 to 18 Years | 122 (84.1%) | 12 (8.3%) |
| 19 to 25 Years | 43 (68.2%) | 12 (19.1%) |
| 25 to 34 Years | 61 (62.2%) | 9 (9.2%) |
| 35 to 44 Years | 35 (62.5%) | 7 (12.5%) |
| 45 to 54 Years | 40 (70.2%) | 10 (17.5%) |
| 55 to 64 Years | 21 (42.0%) | 4 (8.0%) |
| 65 to 74 Years | 20 (31.2%) | 47 (73.4%) |
| 75 Years and over | 24 (100.0%) | 4 (16.7%) |
| Total | 433 (68.8%) | 107 (17.0%) |
Disability Status by Sex by Age in Manokotak
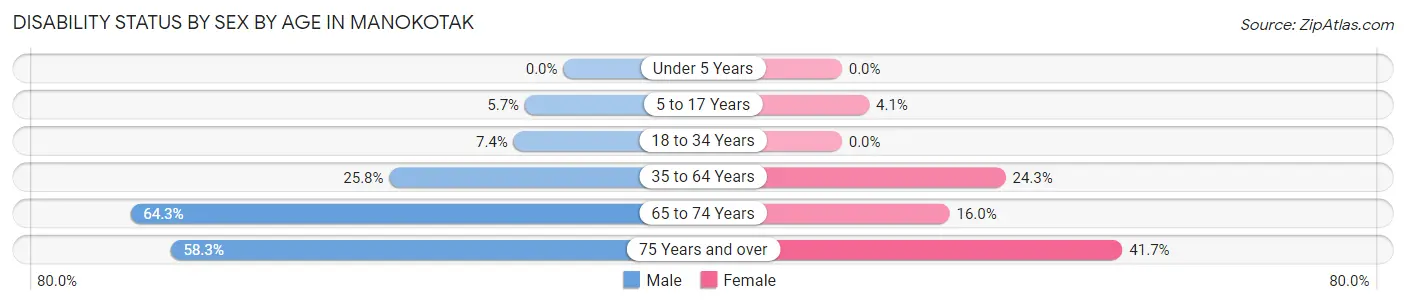
| Age Bracket | Male | Female |
| Under 5 Years | 0 (0.0%) | 0 (0.0%) |
| 5 to 17 Years | 4 (5.7%) | 3 (4.1%) |
| 18 to 34 Years | 7 (7.4%) | 0 (0.0%) |
| 35 to 64 Years | 23 (25.8%) | 18 (24.3%) |
| 65 to 74 Years | 9 (64.3%) | 8 (16.0%) |
| 75 Years and over | 7 (58.3%) | 5 (41.7%) |
Disability Class by Sex by Age in Manokotak
Disability Class: Hearing Difficulty
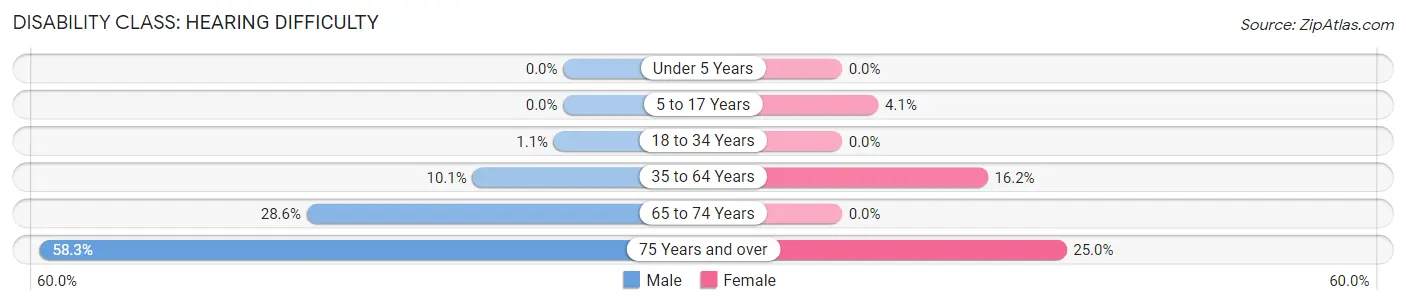
| Age Bracket | Male | Female |
| Under 5 Years | 0 (0.0%) | 0 (0.0%) |
| 5 to 17 Years | 0 (0.0%) | 3 (4.1%) |
| 18 to 34 Years | 1 (1.1%) | 0 (0.0%) |
| 35 to 64 Years | 9 (10.1%) | 12 (16.2%) |
| 65 to 74 Years | 4 (28.6%) | 0 (0.0%) |
| 75 Years and over | 7 (58.3%) | 3 (25.0%) |
Disability Class: Vision Difficulty
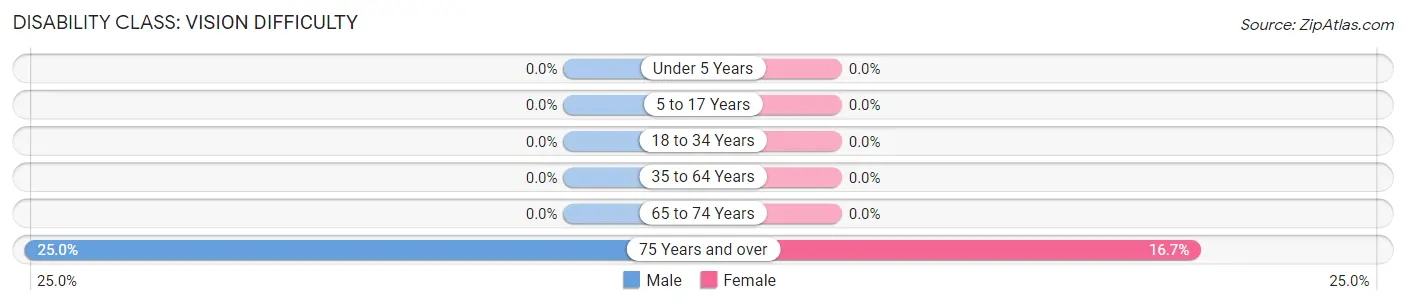
| Age Bracket | Male | Female |
| Under 5 Years | 0 (0.0%) | 0 (0.0%) |
| 5 to 17 Years | 0 (0.0%) | 0 (0.0%) |
| 18 to 34 Years | 0 (0.0%) | 0 (0.0%) |
| 35 to 64 Years | 0 (0.0%) | 0 (0.0%) |
| 65 to 74 Years | 0 (0.0%) | 0 (0.0%) |
| 75 Years and over | 3 (25.0%) | 2 (16.7%) |
Disability Class: Cognitive Difficulty
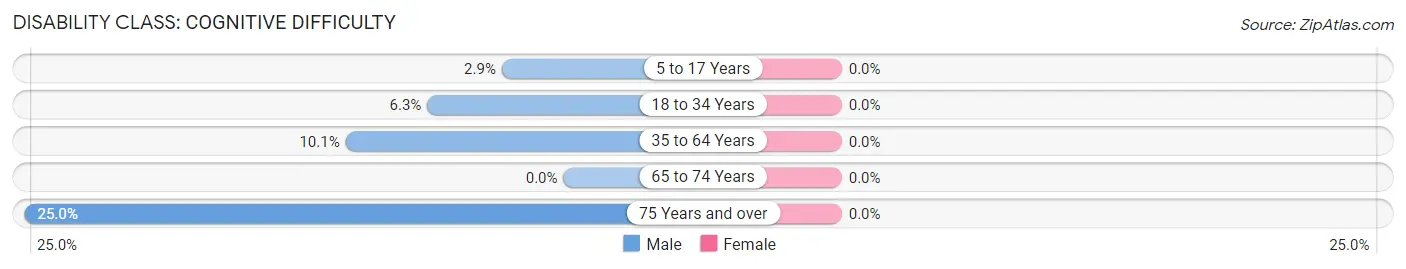
| Age Bracket | Male | Female |
| 5 to 17 Years | 2 (2.9%) | 0 (0.0%) |
| 18 to 34 Years | 6 (6.3%) | 0 (0.0%) |
| 35 to 64 Years | 9 (10.1%) | 0 (0.0%) |
| 65 to 74 Years | 0 (0.0%) | 0 (0.0%) |
| 75 Years and over | 3 (25.0%) | 0 (0.0%) |
Disability Class: Ambulatory Difficulty
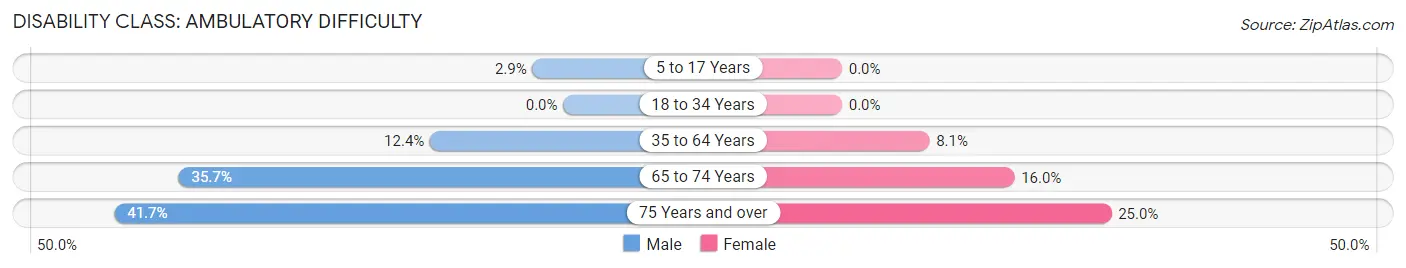
| Age Bracket | Male | Female |
| 5 to 17 Years | 2 (2.9%) | 0 (0.0%) |
| 18 to 34 Years | 0 (0.0%) | 0 (0.0%) |
| 35 to 64 Years | 11 (12.4%) | 6 (8.1%) |
| 65 to 74 Years | 5 (35.7%) | 8 (16.0%) |
| 75 Years and over | 5 (41.7%) | 3 (25.0%) |
Disability Class: Self-Care Difficulty
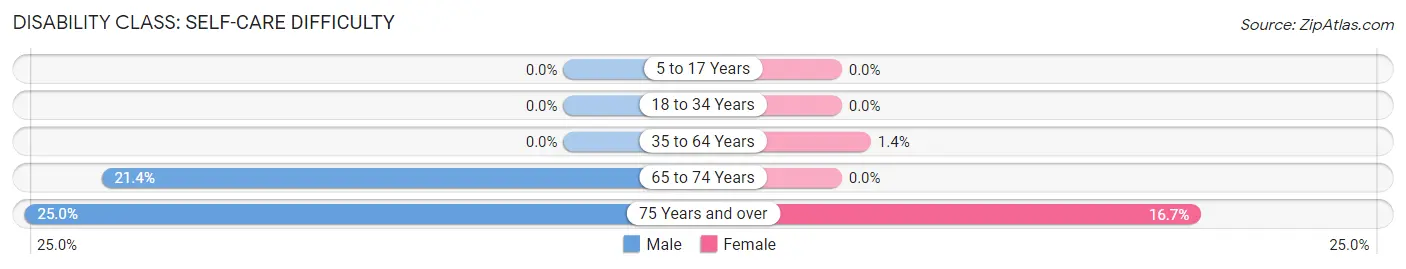
| Age Bracket | Male | Female |
| 5 to 17 Years | 0 (0.0%) | 0 (0.0%) |
| 18 to 34 Years | 0 (0.0%) | 0 (0.0%) |
| 35 to 64 Years | 0 (0.0%) | 1 (1.3%) |
| 65 to 74 Years | 3 (21.4%) | 0 (0.0%) |
| 75 Years and over | 3 (25.0%) | 2 (16.7%) |
Technology Access in Manokotak
Computing Device Access in Manokotak
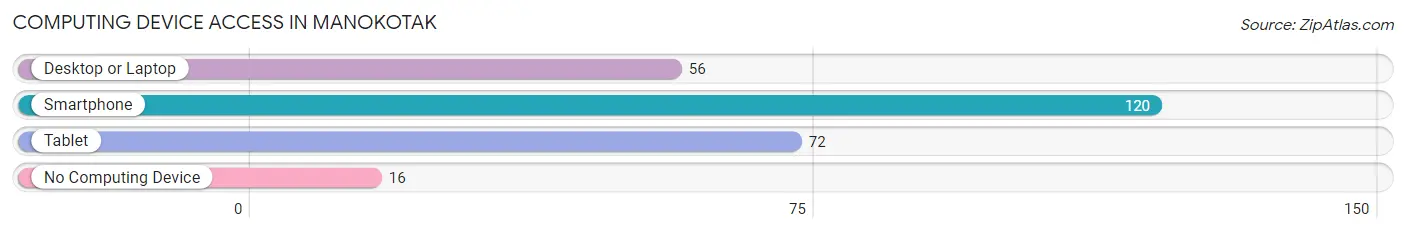
| Device Type | # Households | % Households |
| Desktop or Laptop | 56 | 39.7% |
| Smartphone | 120 | 85.1% |
| Tablet | 72 | 51.1% |
| No Computing Device | 16 | 11.4% |
| Total | 141 | 100.0% |
Internet Access in Manokotak
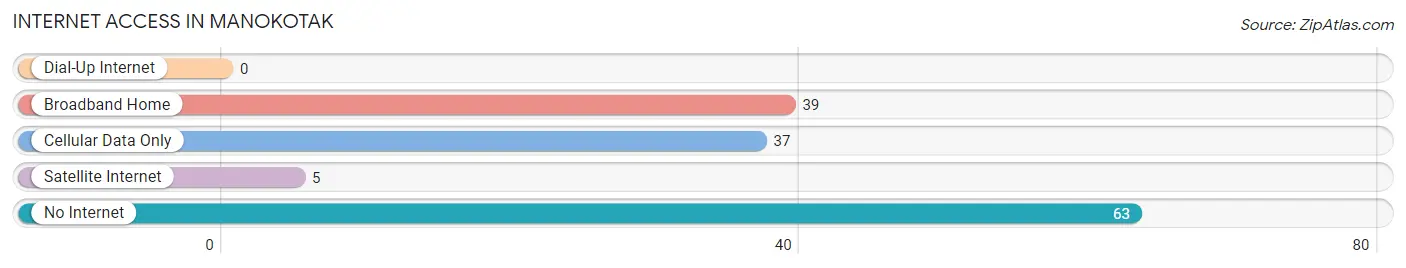
| Internet Type | # Households | % Households |
| Dial-Up Internet | 0 | 0.0% |
| Broadband Home | 39 | 27.7% |
| Cellular Data Only | 37 | 26.2% |
| Satellite Internet | 5 | 3.5% |
| No Internet | 63 | 44.7% |
| Total | 141 | 100.0% |
Manokotak Summary
Manokotak is a small village located in the Dillingham Census Area of Alaska. It is situated on the north shore of the Nushagak Bay, approximately 40 miles southwest of Dillingham. The village is home to the Alutiiq people, who have lived in the area for thousands of years.
History
The Alutiiq people have lived in the Manokotak area for thousands of years. They were semi-nomadic, living off the land and sea. They hunted and fished for salmon, halibut, and other fish, and gathered berries and other plants. They also hunted caribou, moose, and other animals.
The first Europeans to visit the area were Russian fur traders in the late 1700s. They established a trading post at nearby Nushagak, and the Alutiiq people began trading with them. In the early 1900s, the U.S. government began to establish schools and other services in the area.
In the 1950s, the Alaska Native Claims Settlement Act (ANCSA) was passed, which allowed Alaska Natives to claim land and receive compensation for it. The Manokotak area was included in the claims, and the village was officially incorporated in 1971.
Geography
Manokotak is located on the north shore of the Nushagak Bay, approximately 40 miles southwest of Dillingham. The village is surrounded by mountains and forests, and is located on a small river. The climate is mild, with temperatures ranging from the mid-30s in the winter to the mid-60s in the summer.
Economy
The economy of Manokotak is largely based on fishing and subsistence activities. The village is home to several commercial fishing operations, and many residents also fish for subsistence. The village also has a small store, a post office, and a few other businesses.
Demographics
As of the 2010 census, the population of Manokotak was 545. The majority of the population is Alaska Native, with the largest ethnic group being Alutiiq. The median age is 28.7, and the median household income is $37,500. The village has a high rate of poverty, with nearly 40% of the population living below the poverty line.
Common Questions
What is Per Capita Income in Manokotak?
Per Capita income in Manokotak is $20,928.
What is the Median Family Income in Manokotak?
Median Family Income in Manokotak is $48,750.
What is the Median Household income in Manokotak?
Median Household Income in Manokotak is $51,875.
What is Income or Wage Gap in Manokotak?
Income or Wage Gap in Manokotak is 29.8%.
Women in Manokotak earn 70.2 cents for every dollar earned by a man.
What is Family Income Deficit in Manokotak?
Family Income Deficit in Manokotak is $13,542.
Families that are below poverty line in Manokotak earn $13,542 less on average than the poverty threshold level.
What is Inequality or Gini Index in Manokotak?
Inequality or Gini Index in Manokotak is 0.42.
What is the Total Population of Manokotak?
Total Population of Manokotak is 629.
What is the Total Male Population of Manokotak?
Total Male Population of Manokotak is 307.
What is the Total Female Population of Manokotak?
Total Female Population of Manokotak is 322.
What is the Ratio of Males per 100 Females in Manokotak?
There are 95.34 Males per 100 Females in Manokotak.
What is the Ratio of Females per 100 Males in Manokotak?
There are 104.89 Females per 100 Males in Manokotak.
What is the Median Population Age in Manokotak?
Median Population Age in Manokotak is 28.5 Years.
What is the Average Family Size in Manokotak
Average Family Size in Manokotak is 4.3 People.
What is the Average Household Size in Manokotak
Average Household Size in Manokotak is 4.2 People.
How Large is the Labor Force in Manokotak?
There are 232 People in the Labor Forcein in Manokotak.
What is the Percentage of People in the Labor Force in Manokotak?
51.8% of People are in the Labor Force in Manokotak.
What is the Unemployment Rate in Manokotak?
Unemployment Rate in Manokotak is 15.9%.